TIBCO Messaging - Apache Kafka Distribution - …...About this Product TIBCO® is proud to announce...
31
TIBCO ® Messaging - Apache Kafka Distribution - Bridge Kafka Monitoring Software Release 2.0 November 2018 Two-Second Advantage ®
Transcript of TIBCO Messaging - Apache Kafka Distribution - …...About this Product TIBCO® is proud to announce...

TIBCO® Messaging - Apache Kafka Distribution- BridgeKafka MonitoringSoftware Release 2.0November 2018
Two-Second Advantage®

Important Information
SOME TIBCO SOFTWARE EMBEDS OR BUNDLES OTHER TIBCO SOFTWARE. USE OF SUCHEMBEDDED OR BUNDLED TIBCO SOFTWARE IS SOLELY TO ENABLE THE FUNCTIONALITY (ORPROVIDE LIMITED ADD-ON FUNCTIONALITY) OF THE LICENSED TIBCO SOFTWARE. THEEMBEDDED OR BUNDLED SOFTWARE IS NOT LICENSED TO BE USED OR ACCESSED BY ANYOTHER TIBCO SOFTWARE OR FOR ANY OTHER PURPOSE.
USE OF TIBCO SOFTWARE AND THIS DOCUMENT IS SUBJECT TO THE TERMS ANDCONDITIONS OF A LICENSE AGREEMENT FOUND IN EITHER A SEPARATELY EXECUTEDSOFTWARE LICENSE AGREEMENT, OR, IF THERE IS NO SUCH SEPARATE AGREEMENT, THECLICKWRAP END USER LICENSE AGREEMENT WHICH IS DISPLAYED DURING DOWNLOADOR INSTALLATION OF THE SOFTWARE (AND WHICH IS DUPLICATED IN THE LICENSE FILE)OR IF THERE IS NO SUCH SOFTWARE LICENSE AGREEMENT OR CLICKWRAP END USERLICENSE AGREEMENT, THE LICENSE(S) LOCATED IN THE “LICENSE” FILE(S) OF THESOFTWARE. USE OF THIS DOCUMENT IS SUBJECT TO THOSE TERMS AND CONDITIONS, ANDYOUR USE HEREOF SHALL CONSTITUTE ACCEPTANCE OF AND AN AGREEMENT TO BEBOUND BY THE SAME.
ANY SOFTWARE ITEM IDENTIFIED AS THIRD PARTY LIBRARY IS AVAILABLE UNDERSEPARATE SOFTWARE LICENSE TERMS AND IS NOT PART OF A TIBCO PRODUCT. AS SUCH,THESE SOFTWARE ITEMS ARE NOT COVERED BY THE TERMS OF YOUR AGREEMENT WITHTIBCO, INCLUDING ANY TERMS CONCERNING SUPPORT, MAINTENANCE, WARRANTIES,AND INDEMNITIES. DOWNLOAD AND USE OF THESE ITEMS IS SOLELY AT YOUR OWNDISCRETION AND SUBJECT TO THE LICENSE TERMS APPLICABLE TO THEM. BY PROCEEDINGTO DOWNLOAD, INSTALL OR USE ANY OF THESE ITEMS, YOU ACKNOWLEDGE THEFOREGOING DISTINCTIONS BETWEEN THESE ITEMS AND TIBCO PRODUCTS.
This document contains confidential information that is subject to U.S. and international copyright lawsand treaties. No part of this document may be reproduced in any form without the writtenauthorization of TIBCO Software Inc.
TIBCO, the TIBCO logo, Two-Second Advantage, TIB, Information Bus, TIBCO Messaging, FTL, andeFTL are either registered trademarks or trademarks of TIBCO Software Inc. in the United States and/orother countries.
Enterprise Java Beans (EJB), Java Platform Enterprise Edition (Java EE), Java 2 Platform EnterpriseEdition (J2EE), and all Java-based trademarks and logos are trademarks or registered trademarks ofOracle Corporation in the U.S. and other countries.
All other product and company names and marks mentioned in this document are the property of theirrespective owners and are mentioned for identification purposes only.
THIS SOFTWARE MAY BE AVAILABLE ON MULTIPLE OPERATING SYSTEMS. HOWEVER, NOTALL OPERATING SYSTEM PLATFORMS FOR A SPECIFIC SOFTWARE VERSION ARE RELEASEDAT THE SAME TIME. SEE THE README FILE FOR THE AVAILABILITY OF THIS SOFTWAREVERSION ON A SPECIFIC OPERATING SYSTEM PLATFORM.
THIS DOCUMENT IS PROVIDED “AS IS” WITHOUT WARRANTY OF ANY KIND, EITHER EXPRESSOR IMPLIED, INCLUDING, BUT NOT LIMITED TO, THE IMPLIED WARRANTIES OFMERCHANTABILITY, FITNESS FOR A PARTICULAR PURPOSE, OR NON-INFRINGEMENT.
THIS DOCUMENT COULD INCLUDE TECHNICAL INACCURACIES OR TYPOGRAPHICALERRORS. CHANGES ARE PERIODICALLY ADDED TO THE INFORMATION HEREIN; THESECHANGES WILL BE INCORPORATED IN NEW EDITIONS OF THIS DOCUMENT. TIBCOSOFTWARE INC. MAY MAKE IMPROVEMENTS AND/OR CHANGES IN THE PRODUCT(S)AND/OR THE PROGRAM(S) DESCRIBED IN THIS DOCUMENT AT ANY TIME.
THE CONTENTS OF THIS DOCUMENT MAY BE MODIFIED AND/OR QUALIFIED, DIRECTLY ORINDIRECTLY, BY OTHER DOCUMENTATION WHICH ACCOMPANIES THIS SOFTWARE,INCLUDING BUT NOT LIMITED TO ANY RELEASE NOTES AND "READ ME" FILES.
2
TIBCO® Messaging - Apache Kafka Distribution - Bridge Kafka Monitoring

Copyright © 2018 TIBCO Software Inc. ALL RIGHTS RESERVED.
TIBCO Software Inc. Confidential Information
3
TIBCO® Messaging - Apache Kafka Distribution - Bridge Kafka Monitoring

Contents
About this Product . . . . . . . . . . . . . . . . . . . . . . . . . . . . . . . . . . . . . . . . . . . . . . . . . . . . . . . . . . . . . . . . . . . . . . . . . . . . . . . . . 5
TIBCO Documentation and Support Services . . . . . . . . . . . . . . . . . . . . . . . . . . . . . . . . . . . . . . . . . . . . . . . . . . . . . . . . 6
Apache Kafka Monitoring . . . . . . . . . . . . . . . . . . . . . . . . . . . . . . . . . . . . . . . . . . . . . . . . . . . . . . . . . . . . . . . . . . . . . . . . . . . 7
Data Flow of Monitoring Data and Log Messages . . . . . . . . . . . . . . . . . . . . . . . . . . . . . . . . . . . . . . . . . . . . . . . . . . . . . 8
Apache Kafka Monitoring Gateway . . . . . . . . . . . . . . . . . . . . . . . . . . . . . . . . . . . . . . . . . . . . . . . . . . . . . . . . . . . . . . . . . . 9
Configuring the Apache Kafka Monitoring Gateway . . . . . . . . . . . . . . . . . . . . . . . . . . . . . . . . . . . . . . . . . . . . . . . . . . . . . . . . . . . . . . . . . . . . . 9
Using the Configuration File . . . . . . . . . . . . . . . . . . . . . . . . . . . . . . . . . . . . . . . . . . . . . . . . . . . . . . . . . . . . . . . . . . . . . . . . . . . . . . . . . . . . . . . . . . 10
Monitoring Gateway Command Line Reference (monitor-start.py) . . . . . . . . . . . . . . . . . . . . . . . . . . . . . . . . . . . . . . . . . . . . . . . . . . . . . .10
Catalogs of Metrics . . . . . . . . . . . . . . . . . . . . . . . . . . . . . . . . . . . . . . . . . . . . . . . . . . . . . . . . . . . . . . . . . . . . . . . . . . . . . . . .12
Database and Visualization . . . . . . . . . . . . . . . . . . . . . . . . . . . . . . . . . . . . . . . . . . . . . . . . . . . . . . . . . . . . . . . . . . . . . . . . 28
InfluxDB . . . . . . . . . . . . . . . . . . . . . . . . . . . . . . . . . . . . . . . . . . . . . . . . . . . . . . . . . . . . . . . . . . . . . . . . . . . . . . . . . . . . . . . . . . . . . . . . . . . . . . . . . . . . . .28
Grafana and Dashboard Examples . . . . . . . . . . . . . . . . . . . . . . . . . . . . . . . . . . . . . . . . . . . . . . . . . . . . . . . . . . . . . . . . . . . . . . . . . . . . . . . . . . . .28
Security of Monitoring Data . . . . . . . . . . . . . . . . . . . . . . . . . . . . . . . . . . . . . . . . . . . . . . . . . . . . . . . . . . . . . . . . . . . . . . . . 31
4
TIBCO® Messaging - Apache Kafka Distribution - Bridge Kafka Monitoring

About this Product
TIBCO® is proud to announce TIBCO® Messaging - Apache Kafka Distribution - Bridge.
This release is the latest in a long history of TIBCO products that leverage the power of InformationBus® technology to enable truly event-driven IT environments. To find out more about how TIBCO®
Messaging software and other TIBCO products are powered by TIB® technology, please visit us at www.tibco.com.
TIBCO Messaging - Apache Kafka Distribution - Bridge is part of TIBCO® Messaging software.
Product Editions
TIBCO Messaging software is available in a community edition and an enterprise edition.
TIBCO Messaging - Community Edition is ideal for getting started with TIBCO Messaging, forimplementing application projects (including proof of concept efforts), for testing, and for deployingapplications in a production environment. Although the community license limits the number ofproduction processes, you can easily upgrade to the enterprise edition as your use of TIBCO Messagingexpands.
The community edition is available free of charge, with the following limitations and exclusions:
● Users may run up to 100 application instances or 1000 web/mobile instances in a productionenvironment.
● Users do not have access to TIBCO Support, but you can use TIBCO Community as a resource(https://community.tibco.com).
● Users do not have access to the FTL Monitoring component of TIBCO Messaging - Apache KafkaDistribution - Bridge .
TIBCO Messaging - Enterprise Edition is ideal for all application development projects, and fordeploying and managing applications in an enterprise production environment. It includes all featurespresented in this documentation set, as well as access to TIBCO Support.
Bundling
The enterprise edition of TIBCO ActiveSpaces® uses the enterprise edition of TIBCO Messaging andincludes a license for it. The community edition of that related product is compatible with both theenterprise and community editions of TIBCO Messaging.
5
TIBCO® Messaging - Apache Kafka Distribution - Bridge Kafka Monitoring

TIBCO Documentation and Support Services
How to Access TIBCO Documentation
Documentation for TIBCO products is available on the TIBCO Product Documentation website, mainlyin HTML and PDF formats.
The TIBCO Product Documentation website is updated frequently and is more current than any otherdocumentation included with the product. To access the latest documentation, visit https://docs.tibco.com.
Product-Specific Documentation
Documentation for TIBCO products is not bundled with the software. Instead, it is available on theTIBCO Documentation site. To access the documentation web page for this product from a localsoftware installation, open the following file:
TIBCO_HOME/akd/bridge/2.0/product_info/TIB_msg-akd-bridge_2.0.0_docinfo.html
TIBCO_HOME is the top-level directory in which TIBCO products are installed.
● On Windows platforms, the default TIBCO_HOME is C:\tibco.
● On UNIX platforms, the default TIBCO_HOME is /opt/tibco.
The User's Guide in this documentation set is shared with the following products:● TIBCO® Messaging - Apache Kafka Distribution
● TIBCO® Messaging - Apache Kafka Distribution - Bridge
● TIBCO® Messaging - Apache Kafka Distribution - Core
How to Contact TIBCO Support
You can contact TIBCO Support in the following ways:
● For an overview of TIBCO Support, visit http://www.tibco.com/services/support.
● For accessing the Support Knowledge Base and getting personalized content about products you areinterested in, visit the TIBCO Support portal at https://support.tibco.com.
● For creating a Support case, you must have a valid maintenance or support contract with TIBCO.You also need a user name and password to log in to https://support.tibco.com. If you do not have auser name, you can request one by clicking Register on the website.
How to Join TIBCO Community
TIBCO Community is the official channel for TIBCO customers, partners, and employee subject matterexperts to share and access their collective experience. TIBCO Community offers access to Q&A forums,product wikis, and best practices. It also offers access to extensions, adapters, solution accelerators, andtools that extend and enable customers to gain full value from TIBCO products. In addition, users cansubmit and vote on feature requests from within the TIBCO Ideas Portal. For a free registration, go to https://community.tibco.com.
6
TIBCO® Messaging - Apache Kafka Distribution - Bridge Kafka Monitoring

Apache Kafka Monitoring
The tibkmongateway process polls a configured set of Apache Kafka Brokers and saves the polledinformation using InfluxDB for display and analysis using customizable Grafana-based dashboards.
For ease of configuration, a .csv (comma-separated value) file is used to configure the monitoringbehavior allowing easy configuration for each Apache Kafka Broker including host and port, securitysettings, and other broker-specific settings.
Scope
The TIBCO FTL library gathers monitoring data for the following entities:
● Apache Kafka Brokers
● Apache Kafka Clients
● Kafka-related Apache ZooKeeper information
Sampling Rate
Data is sampled from each configured Apache Kafka Broker every 60 seconds.
7
TIBCO® Messaging - Apache Kafka Distribution - Bridge Kafka Monitoring

Data Flow of Monitoring Data and Log Messages
The following diagram illustrates the flow of Apache Kafka monitoring data and log messages.
Explanation of the Diagram
● All monitoring data begins in the Kafka Brokers. The tibkmongateway process collects the full set ofavailable statistics from the Apache Kafka Brokers. It posts the collected statistics to an InfluxDBdatabase.
● InfluxDB is an open-source database. You can access the data directly from InfluxDB, or using othertools that manipulate and display the data, for example, Grafana.
Key to Shapes and Colors in the Diagram
EllipseFTL client process
RectangleOther executable program process
Rounded RectangleAPI, GUI, or HTTP request
BlueComponent of TIBCO software
RedYour Apache Kafka Brokers
GreenThird-party tool
8
TIBCO® Messaging - Apache Kafka Distribution - Bridge Kafka Monitoring

Apache Kafka Monitoring Gateway
The monitoring gateway polls all configured Kafka Brokers and retrieves all of the available statisticsevery 60 seconds.
Configuring the Apache Kafka Monitoring GatewayThe tibkmongateway is configured using a JSON file which is specified as part of the command lineparameters to the monitor-start.py script.
This file contains all of the information needed to access Apache Kafka statistics including:
● Broker addresses and ports
● Broker user names and passwords for access
● Specific Kafka statistics to collect
● InfluxDB database access statistic storage information
The JSON file itself is quite complex and repetitive so to simplify the configuration of tibkmongateway,a .csv (comma separated value) spreadsheet template is provided which can be used toprogrammatically generate the corresponding JSON configuration file.
As an administrator you edit this file directly (using any available spreadsheet applications or directlyusing a text editor if you are familiar with the CSV format), set key configuration parameters, save thefile (as a .csv), and specify this file on the command line of monitor-start.py. This will generate thecomplete JSON file using the information provided in the .csv.
The sample .csv file is named tibkmon_config.csv and is located in the monitoring/tibkmon_JSON_Generator directory.
The .csv file has several columns each representing a specific configuration setting which will be set inthe JSON file as needed in every location it is required:
ConfigurationSetting Description
Kafka BrokerJMX Host &Port
The network address and host from where a specific broker's statistics can beaccessed via JMX. This access must also be enabled using the Kafka Broker'sconfiguration.
Kafka BrokerJMX Username& Password
User authentication information for connecting to the Kafka Brokers.
Kafka ClusterID
A text string which will be added to all statistics collected from this specific KafkaBroker to uniquely identify the Kafka broker cluster that this Kafka Broker is partof in the InfluxDB database.
It is recommended that this ID be unique across all your Kafka clusters.
Kafka Broker ID A text string which will be added to all statistics collected from this specific KafkaBroker to uniquely identify information from it in the InfluxDB database.
It is recommended that this ID be unique across all your Kafka Brokers.
9
TIBCO® Messaging - Apache Kafka Distribution - Bridge Kafka Monitoring

ConfigurationSetting Description
Enable SSL Flag Use SSL to secure the communications between the Kafka Broker andtibkmongateway.
Valid values are TRUE or FALSE.
MonitoringGatewayNumber ofThread
The number of threads that tibkmongateway should use when accessing aspecific broker.
The default value is 2.
Increasing this value will reduce the amount of time needed to retrieve statisticsfrom a specific Kafka Broker and make those statistics more closely aligned interms of access time. Increasing this number places a higher load on the KafkaBroker while decreasing it forces statistics to be gathered serially rather thanconcurrently.
InfluxDBAccess URL,DatabaseName, UserName, &Password
The configuration settings for accessing the appropriate Influx DB instance anddatabase to store the statistics collected from the Kafka Brokers.
Using the Configuration File
The configuration file should have one line per Kafka broker that you want to monitor. Once all of thesettings have been specified, save the file with a .csv file extension. When running monitor_start.pythe configuration file will be processed to generate the corresponding JSON configuration, and starttibkmongatway process using the newly generated JSON configuration.
The JSON file may be manually modified without having to modify the corresponding (.csv based)configuration file. In that case, any subsequent invocations of monitor_start.py should reference themodified JSON file instead of the corresponding configuration file to avoid overwriting the previouslycreated JSON file.
Monitoring Gateway Command Line Reference (monitor-start.py)The monitoring gateway service (tibkmongateway) stores monitoring data and log messages in anInfluxDB database.
Location
The monitor-start.py file is located in the bin directory of the product installation tree.
It is started using the monitor-start Python script. The script can be started using one of the followingways:
● monitor-start.py
● python monitor-start.py
10
TIBCO® Messaging - Apache Kafka Distribution - Bridge Kafka Monitoring

Help
Parameter Description
--help
-h
Show the help message, listing all parameters.
-e
--exit-on-error
Exit on any broker polling error.
-p POLLINGINTERVAL
--polling-interval
Polling interval in seconds, default is 60.
-f CSVFILE
--config-file CSVFILE
The configuration (.csv) file with broker access informationfor all Kafka brokers. Brokers are polled sequentially.
You are required to use either this or the -j option.
--generateonly Specified in conjunction with -f, the script will use the .csvfile to generate a JSON configuration file in the outputdirectory, and then exit.
-o DIRECTORY
--output DIRECTORY
Specify a directory to place the output files in. The defaultdirectory is /var/tmp/ on Unix and c:\tmp on Windows.
-j JSONFILE
--json JSONFILE
Use a previously generated JSON file to load configurationinformation.
Either specify -j or -f, but not both.
11
TIBCO® Messaging - Apache Kafka Distribution - Bridge Kafka Monitoring

Catalogs of Metrics
The following statistics are automatically included in the generated JSON configuration file and arecollected from each Kafka Broker. For more details on any specific statistic, refer to the Apache Kafkadocumentation.
Metric Name Attributes InfluxDB Alias Notes
kafka.server.MessagesIn
PerSec
Count
MeanRate
OneMinuteRate
FiveMinuteRate
FifteenMinuteR
ate
MessagesInPerSec
kafka.server.BytesInPer
SecCount
MeanRate
OneMinuteRate
FiveMinuteRate
FifteenMinuteR
ate
BytesInPerSec
kafka.server.BytesOutPe
rSecCount
MeanRate
OneMinuteRate
FiveMinuteRate
FifteenMinuteR
ate
BytesOutPerSec
kafka.server.Replicatio
nBytesInPerSecCount
MeanRate
OneMinuteRate
FiveMinuteRate
FifteenMinuteR
ate
ReplicationBytesInPerSec
kafka.network.RequestsP
erSecCount
MeanRate
OneMinuteRate
FiveMinuteRate
FifteenMinuteR
ate
RequestsPerSec
12
TIBCO® Messaging - Apache Kafka Distribution - Bridge Kafka Monitoring

Metric Name Attributes InfluxDB Alias Notes
kafka.network.ErrorsPer
SecCount
MeanRate
OneMinuteRate
FiveMinuteRate
FifteenMinuteR
ate
ErrorsPerSec
kafka.network.RequestBy
tesCount
Min
Max
Mean
StdDev
50thPercentile
75thPercentile
95thPercentile
98thPercentile
99thPercentile
999thPercentil
e
RequestBytes request=*
kafka.network.Temporary
MemoryBytesCount
Min
Max
Mean
StdDev
50thPercentile
75thPercentile
95thPercentile
98thPercentile
99thPercentile
999thPercentil
e
TemporaryMemoryBytesProduce request=Pr
oduce
13
TIBCO® Messaging - Apache Kafka Distribution - Bridge Kafka Monitoring

Metric Name Attributes InfluxDB Alias Notes
kafka.network.Temporary
MemoryBytesCount
Min
Max
Mean
StdDev
50thPercentile
75thPercentile
95thPercentile
98thPercentile
99thPercentile
999thPercentil
e
TemporaryMemoryBytesFetch request=Fe
tch
kafka.network.MessageCo
nversionsTimeMsCount
Min
Max
Mean
StdDev
50thPercentile
75thPercentile
95thPercentile
98thPercentile
99thPercentile
999thPercentil
e
MessageConversionsTimeMsFet
ch
request=Fe
tch
14
TIBCO® Messaging - Apache Kafka Distribution - Bridge Kafka Monitoring

Metric Name Attributes InfluxDB Alias Notes
kafka.network.MessageCo
nversionsTimeMsCount
Min
Max
Mean
StdDev
50thPercentile
75thPercentile
95thPercentile
98thPercentile
99thPercentile
999thPercentil
e
MessageConversionsTimeMsPro
duce
request=Pr
oduce
kafka.server.ProduceMes
sageConversionsPerSecCount
MeanRate
OneMinuteRate
FiveMinuteRate
FifteenMinuteR
ate
ProduceMessageConversionsPe
rSec
kafka.server.FetchMessa
geConversionsPerSecCount
MeanRate
OneMinuteRate
FiveMinuteRate
FifteenMinuteR
ate
FetchMessageConversionsPerS
ec
kafka.server.Replicatio
nBytesOutPerSecCount
MeanRate
OneMinuteRate
FiveMinuteRate
FifteenMinuteR
ate
ReplicationBytesOutPerSec
kafka.server.UnderRepli
catedPartitions
Value UnderReplicatedPartitions
kafka.server.
UnderMinIsrPartitionCou
nt
Value UnderMinIsrPartitionCount
15
TIBCO® Messaging - Apache Kafka Distribution - Bridge Kafka Monitoring

Metric Name Attributes InfluxDB Alias Notes
kafka.server.
OfflineLogDirectoryCoun
t
Value OfflineLogDirectoryCount
kafka.controller.Active
ControllerCount
Value ActiveControllerCount
kafka.controller.Leader
ElectionRateAndTimeMsCount
MeanRate
OneMinuteRate
FiveMinuteRate
FifteenMinuteR
ate
Min
Max
Mean
StdDev
50thPercentile
75thPercentile
95thPercentile
98thPercentile
99thPercentile
999thPercentil
e
LeaderElectionRateAndTimeMs
kafka.controller.Unclea
nLeaderElectionsPerSecCount
MeanRate
OneMinuteRate
FiveMinuteRate
FifteenMinuteR
ate
UncleanLeaderElectionsPerSe
c
kafka.server.kafka.serv
er.PartitionCount
Value PartitionCount
kafka.server.LeaderCoun
t
Value LeaderCount
16
TIBCO® Messaging - Apache Kafka Distribution - Bridge Kafka Monitoring

Metric Name Attributes InfluxDB Alias Notes
kafka.server.IsrShrinks
PerSecCount
MeanRate
OneMinuteRate
FiveMinuteRate
FifteenMinuteR
ate
IsrShrinksPerSec
kafka.server.IsrExpands
PerSecCount
MeanRate
OneMinuteRate
FiveMinuteRate
FifteenMinuteR
ate
IsrExpandsPerSec
kafka.server.MaxLag Value MaxLag clientId=R
eplica
kafka.server.PurgatoryS
ize
Value FetchPurgatorySize delayedOpe
ration=Fet
ch
kafka.server.PurgatoryS
ize
Value ProducePurgatorySize delayedOpe
ration=Pro
duce
kafka.network.TotalTime
MsCount
Min
Max
Mean
StdDev
50thPercentile
75thPercentile
95thPercentile
98thPercentile
99thPercentile
999thPercentil
e
ProduceTotalTimeMS request=Pr
oduce
17
TIBCO® Messaging - Apache Kafka Distribution - Bridge Kafka Monitoring
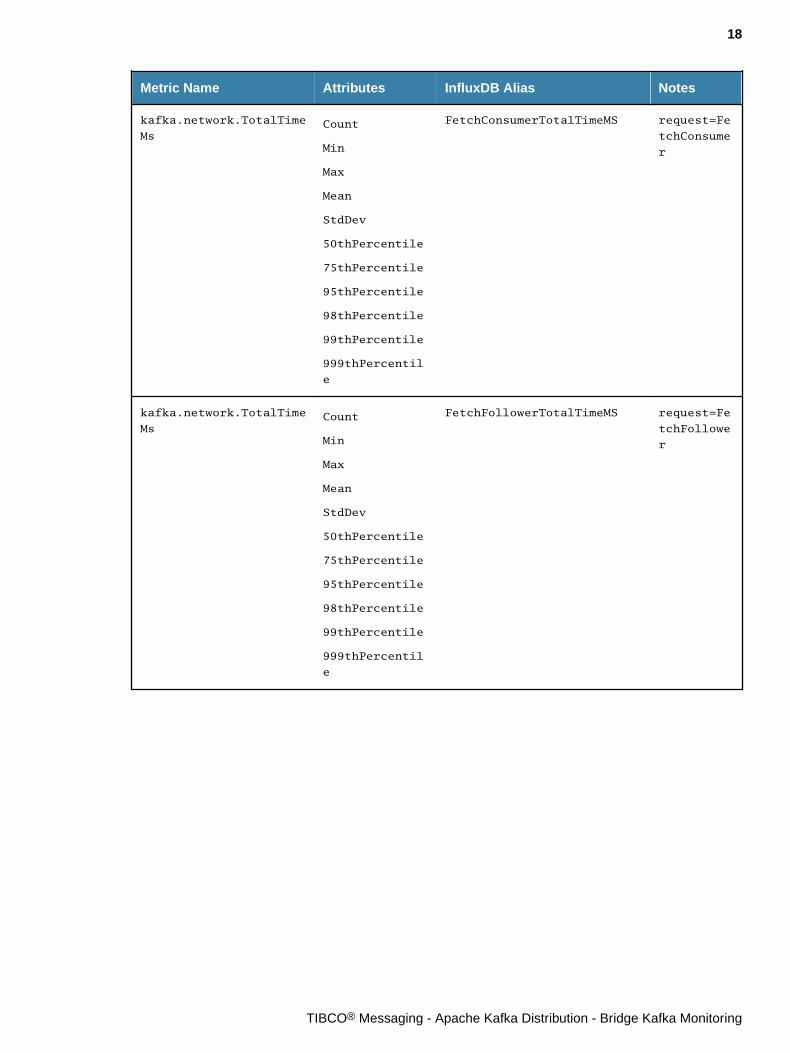
Metric Name Attributes InfluxDB Alias Notes
kafka.network.TotalTime
MsCount
Min
Max
Mean
StdDev
50thPercentile
75thPercentile
95thPercentile
98thPercentile
99thPercentile
999thPercentil
e
FetchConsumerTotalTimeMS request=Fe
tchConsume
r
kafka.network.TotalTime
MsCount
Min
Max
Mean
StdDev
50thPercentile
75thPercentile
95thPercentile
98thPercentile
99thPercentile
999thPercentil
e
FetchFollowerTotalTimeMS request=Fe
tchFollowe
r
18
TIBCO® Messaging - Apache Kafka Distribution - Bridge Kafka Monitoring

Metric Name Attributes InfluxDB Alias Notes
kafka.network.RequestQu
eueTimeMsCount
Min
Max
Mean
StdDev
50thPercentile
75thPercentile
95thPercentile
98thPercentile
99thPercentile
999thPercentil
e
FetchFollowerRequestQueueTi
meMs
request=Fe
tchFollowe
r
kafka.network.RequestQu
eueTimeMsCount
Min
Max
Mean
StdDev
50thPercentile
75thPercentile
95thPercentile
98thPercentile
99thPercentile
999thPercentil
e
FetchConsumerRequestQueueTi
meMS
request=Fe
tchConsume
r
19
TIBCO® Messaging - Apache Kafka Distribution - Bridge Kafka Monitoring

Metric Name Attributes InfluxDB Alias Notes
kafka.network.RequestQu
eueTimeMsCount
Min
Max
Mean
StdDev
50thPercentile
75thPercentile
95thPercentile
98thPercentile
99thPercentile
999thPercentil
e
ProduceRequestQueueTimeMS request=Pr
oduce
kafka.log.LogFlushRateA
ndTimeMsMeanRate
OneMinuteRate
FiveMinuteRate
FifteenMinuteR
ate
Min
Max
Mean
StdDev
50thPercentile
75thPercentile
95thPercentile
98thPercentile
99thPercentile
999thPercentil
e
LogFlush
20
TIBCO® Messaging - Apache Kafka Distribution - Bridge Kafka Monitoring

Metric Name Attributes InfluxDB Alias Notes
kafka.network.LocalTime
MsCount
Min
Max
Mean
StdDev
50thPercentile
75thPercentile
95thPercentile
98thPercentile
99thPercentile
999thPercentil
e
ProduceLocalTimeMs request=Pr
oduce
kafka.network.LocalTime
MsCount
Min
Max
Mean
StdDev
50thPercentile
75thPercentile
95thPercentile
98thPercentile
99thPercentile
999thPercentil
e
FetchConsumerLocalTimeMs request=Fe
tchConsume
r
21
TIBCO® Messaging - Apache Kafka Distribution - Bridge Kafka Monitoring

Metric Name Attributes InfluxDB Alias Notes
kafka.network.LocalTime
MsCount
Min
Max
Mean
StdDev
50thPercentile
75thPercentile
95thPercentile
98thPercentile
99thPercentile
999thPercentil
e
FetchFollowerLocalTimeMs request=Fe
tchFollowe
r
kafka.network.RemoteTim
eMsCount
Min
Max
Mean
StdDev
50thPercentile
75thPercentile
95thPercentile
98thPercentile
99thPercentile
999thPercentil
e
ProduceRemoteTimeMs request=Pr
oduce
22
TIBCO® Messaging - Apache Kafka Distribution - Bridge Kafka Monitoring

Metric Name Attributes InfluxDB Alias Notes
kafka.network.RemoteTim
eMsCount
Min
Max
Mean
StdDev
50thPercentile
75thPercentile
95thPercentile
98thPercentile
99thPercentile
999thPercentil
e
FetchConsumerRemoteTimeMs request=Fe
tchConsume
r
kafka.network.RemoteTim
eMsCount
Min
Max
Mean
StdDev
50thPercentile
75thPercentile
95thPercentile
98thPercentile
99thPercentile
999thPercentil
e
FetchFollowerRemoteTimeMs request=Fe
tchFollowe
r
23
TIBCO® Messaging - Apache Kafka Distribution - Bridge Kafka Monitoring

Metric Name Attributes InfluxDB Alias Notes
kafka.network.ResponseS
endTimeMsCount
Min
Max
Mean
StdDev
50thPercentile
75thPercentile
95thPercentile
98thPercentile
99thPercentile
999thPercentil
e
FetchConsumerResponseSendTi
meMs
request=Fe
tchConsume
r
kafka.network.ResponseS
endTimeMsCount
Min
Max
Mean
StdDev
50thPercentile
75thPercentile
95thPercentile
98thPercentile
99thPercentile
999thPercentil
e
FetchFollowerResponseSendTi
meMs
request=Fe
tchFollowe
r
24
TIBCO® Messaging - Apache Kafka Distribution - Bridge Kafka Monitoring

Metric Name Attributes InfluxDB Alias Notes
kafka.network.ResponseQ
ueueTimeMsCount
Min
Max
Mean
StdDev
50thPercentile
75thPercentile
95thPercentile
98thPercentile
99thPercentile
999thPercentil
e
ProduceResponseQueueTimeMs request=Pr
oduce
kafka.network.ResponseQ
ueueTimeMsCount
Min
Max
Mean
StdDev
50thPercentile
75thPercentile
95thPercentile
98thPercentile
99thPercentile
999thPercentil
e
FetchConsumerResponseQueueT
imeMs
request=Fe
tchConsume
r
25
TIBCO® Messaging - Apache Kafka Distribution - Bridge Kafka Monitoring

Metric Name Attributes InfluxDB Alias Notes
kafka.network.ResponseQ
ueueTimeMsCount
Min
Max
Mean
StdDev
50thPercentile
75thPercentile
95thPercentile
98thPercentile
99thPercentile
999thPercentil
e
FetchFollowerResponseQueueT
imeMs
request=Fe
tchFollowe
r
kafka.network.NetworkPr
ocessorAvgIdlePercent
Value NetworkProcessorAvgIdlePerc
ent
kafka.server.RequestHan
dlerAvgIdlePercent
Count
MeanRate
OneMinuteRate
FiveMinuteRate
FifteenMinuteR
ate
RequestHandlerAvgIdlePercen
t
kafka.server.ProduceBWQ
uota
queue-size ProduceBWQuota type=Produ
ce
kafka.server.FetchBWQuo
ta
queue-size FetchBWQuota type=Fetch
kafka.server.RequestQuo
ta
queue-size RequestQuota
26
TIBCO® Messaging - Apache Kafka Distribution - Bridge Kafka Monitoring

Metric Name Attributes InfluxDB Alias Notes
kafka.server.ZooKeeperR
equestLatencyMsCount
Min
Max
Mean
StdDev
50thPercentile
75thPercentile
95thPercentile
98thPercentile
99thPercentile
999thPercentil
e
ZooKeeperRequestLatencyMs
java.lang.OperatingSyst
emProcessCpuTime
ProcessCpuLoad
SystemCpuLoad
SystemLoadAver
age
CommittedVirtu
alMemorySize
FreePhysicalMe
morySize
OS
java.lang.Memory HeapMemoryUsag
e
NonHeapMemoryU
sage
MemoryUsage
27
TIBCO® Messaging - Apache Kafka Distribution - Bridge Kafka Monitoring

Database and Visualization
You can use a variety of other third-party tools, such as InfluxDB and Grafana, to store, analyze, andvisualize monitoring data.
InfluxDBInfluxDB is an open source time series database.
InfluxDB and Docker
You can run InfluxDB processes in Docker containers.
For convenience, you can start the InfluxDB server using a utility script, which also starts themonitoring gateway and other monitoring components in the correct order.
Grafana and Dashboard ExamplesGrafana is an open source application to visualize large-scale measurement data. You can use Grafanato display monitoring data stored in a database.
Grafana can display dashboards, such as the following examples, in a web browser.
The installer adds the Apache Kafka monitoring dashboards as part of the installation procedure. Thedashboards include a top-level dashboard which displays statistics common to many massagingsystems as well as a set of Kafka-specific dashboards.
The messaging independent topmost level dashboard displays information from both Apache Kafkaand TIBCO FTL allowing high-level messaging statistics from both messaging systems to be monitoredfrom a single dashboard.
Grafana dashboards in the sample are tailored to display monitoring data grouped by similar ApacheKafka functionality.
When the monitoring start script starts the Grafana server, it automatically loads the Apache Kafkadashboards from monitoring/config/influxdb/dashboards.
You can also define your own dashboards. For more information, refer to the Grafana documentation.
Following are some sample dashboard images.
28
TIBCO® Messaging - Apache Kafka Distribution - Bridge Kafka Monitoring

29
TIBCO® Messaging - Apache Kafka Distribution - Bridge Kafka Monitoring

30
TIBCO® Messaging - Apache Kafka Distribution - Bridge Kafka Monitoring

Security of Monitoring Data
If your enterprise uses secure Apache Kafka brokers, then data is secure as it travels from client toApache Kafka broker, and on to other clients.
If your Apache Kafka brokers are configured to secure JMX access, any statistics-relatedcommunications will be secured as well.
However, TIBCO makes no assertions about the security of third-party components, such as InfluxDBor Grafana.
Monitoring Gateway
The monitoring gateway (tibkmongateway) supports SSL to secure its connection to each ApacheKafka broker. Administrators must supply appropriate security information when configuring thegateway.
InfluxDB
The monitoring gateway can secure its connection InfluxDB.
Grafana
Grafana can use a secure connection to query InfluxDB. Grafana can secure client connections frombrowsers using HTTPS.
31
TIBCO® Messaging - Apache Kafka Distribution - Bridge Kafka Monitoring


![Chapter 1: Introduction to Messaging System - Packt · Chapter 1: Introduction to Messaging System. Graphics Bundle [ 2 ] Graphics Bundle [ 3 ] ... Using Kafka Streams. Graphics Bundle](https://static.fdocuments.in/doc/165x107/5aed5cf87f8b9a3b2e9073e8/chapter-1-introduction-to-messaging-system-packt-1-introduction-to-messaging.jpg)