TI1~~ W WAVE INFORMATION STUDIES OF US COASTLINES · 2011-05-15 · TI1~~ W ~ WAVE INFORMATION...
88
TI1~~ W ~ WAVE INFORMATION STUDIES OF US COASTLINES US Arm Corp WIS REPORT 19 AD-A207 849 HURRICANE HINDCAST METHODOLOGY AND WAVE STATISTICS FOR ATLANTIC AND GULF HURRICANES FROM 1956-1975 by 7 Charles E. Abel, Barbara A. Tracy C. Linwood Vincent, Robert E. Jens Coastal Engineering Research Center DEPARTMENT OF THE ARMY Waterways Experiment Station, Corps of Engineers P0 Box 631, Vicksburg, Mississippi 39181-0631 l b 0. 0 t 16 T b b b b. April 1989 fd4 A& &I . . Final Report Approved For Public Release; Distribution Unlimited OTIC ELECTE MAY 16 19893 r V F.Nui mm~~~L USAmDop f S Prepared lor DEPARTMENT OF THE-ARMY US Amy orp ofEngineers Washington, DC 20314-1000 89 45 166 1
Transcript of TI1~~ W WAVE INFORMATION STUDIES OF US COASTLINES · 2011-05-15 · TI1~~ W ~ WAVE INFORMATION...

TI1~~ W ~ WAVE INFORMATION STUDIESOF US COASTLINES
US Arm Corp WIS REPORT 19
AD-A207 849 HURRICANE HINDCAST METHODOLOGY ANDWAVE STATISTICS FOR ATLANTIC AND
GULF HURRICANES FROM 1956-1975by
7 Charles E. Abel, Barbara A. TracyC. Linwood Vincent, Robert E. Jens
Coastal Engineering Research Center
DEPARTMENT OF THE ARMYWaterways Experiment Station, Corps of Engineers
P0 Box 631, Vicksburg, Mississippi 39181-0631
l b
0. 0 t 16 T b b b b.
April 1989fd4 A& &I . . Final Report
Approved For Public Release; Distribution Unlimited
OTICELECTEMAY 16 19893
r V F.Nui
mm~~~L USAmDop f SPrepared lor DEPARTMENT OF THE-ARMY
US Amy orp ofEngineersWashington, DC 20314-1000
89 45 166 1

Destroy this report when no longer needed. Do not returnit to the originator.
The findings in this report are not to be construed as an officialDepartment of the Army position unless so designated
by other authorized documents.
The contents of this report are not to be used foradvertising, publication, or promotional purposes.Citation of trade names does not constitute anofficial endorsement or approval of the use of
such commercial products.

UnclassifiedSECURITY CLASSIFICATION OF T- S PAGE
Form ApprovedREPORT DOCUMENTATION PAGE OMB No. 0704-0188
Ia REPORT SECURITY C.ASS.F CATiON lb RESTRICTIVE MARKINGSUnclassified
2a SECURITY CLASSIFICATON AUTHORITY' 3 DISTRIBUTION , AVAILABILITY OF REPORT
Approved for public release; distribution2b DECLASSIFICATION, DOWNGRADING SCHEDULE unlimited
4 PERFORMING ORGANIZATION REPORT NUMBER(S) S mONITORING ORGANIZATION REPORT NUMBER(S)
WIS Report 19
6a NAME OF PERFORMING ORGANIZATION 6b OFFICE SYMBOL 7a. NAME OF MONITORING ORGANIZATIONUSAEWES, Coastal Engineering (if applicable)
Research Ce,.cer
6c. ADDRESS (City, State, and ZIP Code) 7b. ADDRESS (City, State, and ZIP Code)
PO Box 631
Vicksburg, MS 39181-0631
8a. NAME OF FUNDING, SPONSORING Bb OFFICE SYMBOL 9 PROCUREMENT INSTRUMENT IDENTIFICATION NUMBERORGANIZATION (if appcable)US Army Corps of Engineers
8c. ADDRESS (City, State, and ZIP Code) 10. SOURCE OF FUNDING NUMBERSPROGRAM PROJECT TAK VWORK UNIT
Washington, DC 20314-i000 ELEMENT NO. NO NO ACCESSION NO.
11 TITLE (InCluSe Tcurrty Cla(rification)
Hurricane Hcndcast Methodology and Wave Statistics for Atlan d Gulf Hurricanes from1956-1i 7t
12 PERSONAL AUTHOR(S)
Abel Charles E.i Trac Barbara A. Vincents C. Lnwood; Jensen Robert E.13a. TYPE OF REPORT 13b TIME COVERED 14 DATE OF REPORT (Year Month, Day) aS PAGE COUNT
Final report vRO TO April 1989 8516. SUPPLEMENTARY NOTATIONAvailable from National Technical information Service, 5285 Port Royal Road, Springfield,VA 22161.
17 COSATI CODES 18 SUBJECT TERMS (Continue on reverse of necessary and ident,'fy by block number)
FIEFLID GROUP SUB-GROUP Atlantic Ocean HurricanesGulf of Mexico Ocean waves
19. ABSTRACT (Continue on reverse if necessary and identify by block number)
D Ave Jonditions at locations along the US Atlantic and Gulf of Mexico coastlines arehindcasU during hurricanes occurring between 1956 and 1975. A total of 68 hurricanesoccurred in the period, 43 affecting the Atlantic coast and 25 the vlf coast. The hindeastmethodology Is discussed and verification presented for storms where observations are avail-able, Results are presented as the highest wave occurring at each location and significantwave height versus return period for each location.t
20 DISTRIBUTION /AVAILABILITY OF ABSTRACT 21 ABSTRACT SECURITY CLASSIFICATION
rM U NCLASSIFIE D/UNLI MITE D C3 SAME AS RPT " DT'- " SIERS Unclass ified'" -',- OF RF< 0r1,PA I F,-K)IV:%.A;L I22b TELEPHONE (itnclude Area Codle) I22c OFFICE S"YMBOL
DO Form 1473, JUN 86 Previous editions are obsolete. SECURITY CLASSIFICATION OF THIS PAGE
Unclassified

SECURITY CLASSIFICATION OF THIS PAGE
SECURITY CLASSIFICATION OF THIS PAGE

Preface
A study to produce a wave climate for US coastal waters was initiated at
the US Army Engineer Waterways Experiment Station (WES). The Wave Information
Study (WIS) was authorized by Headquarters, US Army Corps of Engineers
(HQUSACE), as part of the Coastal Field Data Collection Program, which is
managed by the WES Coastal Engineering Research Center (CERC). Mr. John
Lockhart, Jr., HQUSACE, is the Technical Monitor for the Coastal Field Data
Collection Program. Mr. J. Michael Hemsley, CERC, is Program Manager, and Dr.
Jon M. Hubertz, Coastal Oceanography Branch (COB), CERC, is WIS Project
Manager.
This report, the nineteenth in a series, presents hurricane hindcast
methodology and summary wave statistics for the Atlantic and Gulf of Mexico
coasts for the period 1956-1975. This report and the information it sum-
marizes were prepared by Dr. Charles E. Abel (deceased), Ms. Barbara A. Tracy,
Dr. C. Linwood Vincent, and Dr. Robert E. Jensen, COB, CERC, with technical
editorial assistance from Dr. Hubertz and general assistance from the members
of the WIS staff.
The study was conducted under the direct supervision of Dr. Edward F.
Thompson, Chief, COB, CERC, and Mr. H. Lee Butler, Chief, Research Division,
CERC; and under the general supervision of Dr. James R. Houston and
Mr. Charles C. Calhoun, Jr., Chief and Assistant Chief, CERC, respectively.
The word processing of this report was accomplished by Ms. Victoria L.
Edwards, COB. This report was edited by Ms. Lee T. Byrne, Information
Technology Laboratory, WES.
COL Dwayne G. Lee, EN, is the Commander and Director of WES.
Dr. Robert W. Whalin is Technical Director.
LAccession For
NTI F.%TI
\I--
EJ
P~~c, L H ' .. . . . . . . .
By ....
1) ,t tb,1-

Contents
Page
Preface ................................................................ . .
Conversion Factors, Non-SI to SI (Metric) Units of Measurement ......... 3
Introduction ........................................................... 4
Storm Selection ........................................................ 6
Wind Hindcast Method ................................................... 8
Wave Hindcast Method ................................................... 18
Hindcast products ................................................ 21Track analysis ................................................... 23Statistical analysis ............................................. 24Interpretation of results ........................................ 28
Summary ................................................................ 28
References ............................................................. 32
Tables 1-4
Appendix A: Atlantic Hurricane Extremal Statistics .................... Al
Appendix B: Gulf of Mexico Hurricane Extremal Statistics .............. BI
Appendix C: Station Locations and Depths .............................. C1
Appendix D: Wave Model Verification ................................... D1
2

Conversion Factors, Non-SI to SI (Metric)Units of Measurement
Non-SI units of measurement used in this report can be converted to SI
(metric) units as follows:
Multiply By To Obtain
feet 0.3048 metres
knots (international) 0.5144444 metres per second
miles (US statute) 1.609347 kilometres
3

HURRICANE HINDCAST METHODOLOGY AND WAVE STATISTICS FOR ATLANTIC
AND GULF HURRICANES FROM 1956-1975
Introduction
1. Hurricanes are defined as tropical cyclones with winds of 74 mph* or
greater. These storms occur in the warmwater areas of the Atlantic and Paci-
fic Oceans and the Gulf of Mexico and often cross onto populated land along
the Atlantic and gulf coasts of the United States. More rarely, they have
affected southern California and Hawaii. The winds, waves, and water levels
at the coast associated with these storms have resulted in loss of lives and
large property losses. The large waves produced by hurricanes at sea are a
threat to navigation and to the coastline. Swell wave propagation from a
hurricane impacts the coast even if the hurricane never makes landfall. The
presence of swell at the coast typically begins before the fully developed
hurricane wind waves reach the coast. The design wave statistics for the gulf
and southern Atlantic coast are generally derived from hurricane events.
These waves are also a significant component of the wave climate in the Middle
Atlantic and New England States. Those involved in coastal engineering in
these areas need to consider hurricane wave information at the site of inter-
est. The wave height and period information from historic storms is a cri-
tical element in structural designs that need to withstand these storms and in
determining flood protection.
2. Measured data would be the most logical source of hurricane wave
information, but most measuring devices are damaged or destroyed by the storms
making field data scarce. An alternative method of providing wave information
is use of a numerical wave hindcast model. Spectral and wave height compari-
sons between available field measurements and hindcast data show this method
agrees to within ±10 percent for wave height and ±15 percent for wave period.
The hindcast values can be used to compile extremal statistics for extreme
wave conditions at all specified coastal locations. The numerical wave hind-
cast model uses wind as input and calculates the waves created by the physical
interaction of the wind with the water. Wind-generated surge is not included,
and computations are done on the mean-low-water datum.
* A table of factors for converting non-SI units of measurement to SI(metric) units is presented on page 3.
4

3. The Wave Information Study (WIS) was established to create a data
base of wave information for the coasts of the United States. Twenty years of
continuous wave data are available at coastal locations for the period from
1956-1975. The wave information excluded tropical storm generated waves. The
hurricane weather systems with their large pressure gradients and changes in
wind direction over relatively small areas create special problems when a wave
hindcast model is being used. It was decided to hindcast hurricanes sepa-
rately and use a model that could represent the dynamics of these complex wind
systems. This report discusses how the hurricane wave information and wave
statistics were compiled for the hindcast period. The Atlantic and gulf
coasts were completed first because most hurricanes occur there. A study is
underway to add the Pacific hurricanes to the same data base. Data were saved
for the same stations used in the WIS Atlantic Phase II hindcast and in the
WIS gulf hindcast. Figure 1 shows the Atlantic grid that was used. Figure 2
so75 '0 65 60 5s so
45 45
kWA$HNGTON 0 C BOTSTTN
40 40
HURRICANE
TRACK L /Ul
35 3
JACK$OIIVILLE
30 0
25 25
2o0 SCALE2
SO0 31 _ - -
30 "0 65 60 S5 0
Figure 1. Numerical grid on which the Atlantic hurricaneswere hindcast. Locations at which data are available are
indicated by numbers along the coastline
5

'' A -m 8 N
32 N
I ' jl MOBILE|
. ---- GALVESTON- . . . ORLEANS . .... ....... 30N
'S~_ *.-$Z -*-49. *3 #3
.... I 6 ...... .....
26 N72
-- - 4 -3O -2
25 s 12 2 33 #3
wehncs. Loain atOU which data are avail-8
so teu. . Appendix C lists the latitude, longit. ,1- 4n 4epts o
KEY. . . .. . .. . . . . . . . . . . . . . . .4 7- ;,^ WEST-
15. .... : -Ob- . - COMPUTATIONAL • * * * 24:
BOUNDAR
IO0"W10 1520 0 350 N
Figure 2. Numerical grid on which gulf hurricaneswere hindcast. Locations at which data are avail-able are indicated by numbers along the coastline
shows the gulf grid. Appendix C lists the latitude, longitude, and depths of
the Atlantic and gulf stations where data have been saved.
Storm Selection
4. The period from 1956-1975 was selected to correspond to the hindcafc
period used in the previous WIS Atlantic and gulf hindcasts. Figure 3 shows a
histogram of all the hurricanes for the North Atlantic from 1900-1975. An
analysis of the number of storms per year shows that the 75-year data set
averages 4.7 storms per year and the 1956-1975 subset averages 5.3 storms per
year. In both the full data set and the 20-year subset, the mode of the
6

24 -
22 -
20 -
18 -
16 -
z
) 14 -
D 12 -I
10
0 8
6
4
2
0
1900 1910 1920 1930 1940 1950 1960 1970 1980 1990
YEARS
Figure 3. Occurrence of hurricanes (shaded) and tropical
storms (unshaded) for the period 1900-1976
number of storms per year falls between four and five. The average of lowest
pressures for the storms listed in "NWS Climatology for the Atlantic and
Pacific Coasts of the United States" (National Weather Service (NWS) 1987) for
the period 1900-1974 is 964 mb. The average for the period from 1956-1974 is
965 mb. These two values indicate that the severity of the storms in the
smaller data set corresponds to the severity of the storms in the whole data
base.
5. Storm selection was limited to storms that met two criteria. The
storm was required to reach hurricane strength and have a track in the follow-
ing specified areas. The gulf storms were required to have their tracks in
the Gulf of Mexico and to have some effect on the US gulf coast. The Atlantic
storms were required to have a track crossing into the WIS Atlantic Phase II
hindcast grid (Figure 1). Atlantic storms outside this area were not
considered since they did not strongly influence the coast of the United
States. One tropical storm was included in the Atlantic hindcast because of
its unusual looped track and possible influence on the coastline. Figure 4
shows the superimposed tracks of the hurricanes that were included in the
hindcast in the Atlantic and gulf. Some gulf coast areas have not had a
7

HINOCASTED -
NORTH ATLANTIC ~ - -
HURRICANE PATHS 55'N1956 - 197S
1956- 1975 _ -
40
35'
30o
, ,-. 20'
IV-
goW 95 800 750 65' 60 550 500
Figure 4. Tracks of hurricanes hindcast in theAtlantic and Gulf of Mexico
direct hit during the 1956-1975 period. The Florida peninsula is vulnerable
for both Atlantic or gulf storms and has many storms that move from the
Atlantic to the gulf and vice versa. A storm that existed in both the Atlan-
tic an the gulf will have the Atlantic portion of its track hindcast with the
Atlantic storm and the gulf portion of its track hindcast separately as gulf
storm. Tables 1 and 2 list information on all the hurricanes hindcast for the
Atlantic and gulf respectively. Hurricanes are listed by number, name, and a
year-month identifier. Many times the severity of a hurricane is measured by
the damage it produces. Table 3 gives a list of the top-ranking storms in
relation to damage caused. The monthly Weather Review provides storm tracks
and details associated with individual storms.
Wind Hindcast Method
6. The primary input for an ocean wave hindcast involving hurricane
waves is an accurate representation of the hurricane wind field. A model was
8

developed that uses the meteorological storm parameters available from past
hurricanes to calculate the surface stress and the wind vectors in the plane-
tary boundary layer (PBL) of a tropical cyclone. Storm parameters consist of
information about the storm's speed and direction of movement, the pressure in
the storm's eye and at the edge of the storm, the size of the storm, the dis-
tance from the eye's center to where the maximum winds occur, and any informa-
tion on atmospheric steering currents. This report will not deal with the
mechanisms for the inception and growth of a hurricane; Ooyama (1969) provides
background material on that subject. Models that create a hurricane wind
field need to account for the complex flow patterns in the atmosphere close to
the Earth's surface that are associated with these storms. One of these is
discussed next.
7. The hurricane wind model used in this study is a modification by
Cardone of Chow's (1971) vortex model. Chow's model gave a good qualitative
description of the PBL's wind field, but some modification was needed to pro-
duce good agreement between numerically created wind and actual hurricane wind
data. The Cardone model contains an efficient numerical scheme to solve the
equation of horizontal motion vertically averaged through the depth of the
PBL. Chow's model is capable of providing a solution for the high-resolution
grid needed for a hurricane's wind field and gives emphasis to the physical
boundary layer flow mechanisms that contribute to hurricane development. The
equations of motion are solved for a moving tropical cyclone using a fixed
pressure field in the boundary layer. A nested grid system (Figure 5) with
spacings on the order of 5 km in the central grid near the hurricane center is
used. It is assumed that vertical advection of momentum can be neglected
because it is small compared with horizontal advection, and shearing stress is
assumed to vanish at the top of the PBL. Pressure is defined as the sum of
the large-scale pressure field representing a constant geostrophic flow and a
pressure field represerting the tropical cyclone. The storm pressure field is
not necessarily axisymmetric and moves at a specified speed. The equations of
motion are solved, and the wind-field solution is completed by specifying
values for the drag coefficient, the horizontal eddy viscosity coefficient,
and the boundary conditions at the outermost grid boundary. The outermost
boundary is assumed to be a balance betwecn the Coriolis force, the pressure
gradient force, and the surface frictional force. The solution uses a finite
difference formulation. The computational scheme is discussed in Chow (1971).
9

3
3*LL~ . . . .•. .•
Figure 5. Schematic of' the variable spacing, moving grid systemof the wind model. Only the intermost three meshes are shown
Diagonal and ordinary upstream differencing was used for the spatial deriva-
tives, and the computational grid consisted of a series of nested rectangular
grids, each with constant grid spacing. If the innermost grid has a spacing
of 5 kmn, the others are 10, 20, 40, and 80 kin, and the grid covers 1,600 by
1,600 km using a 21 by 21 grid. The computation scheme begins with a set of
wind components computed from the storm's pressure field. The time-related
components are integrated forward in time at each grid point until the accel-
eration is small. Chow concluded that friction and storm motion seem to com-
bine nonlinearly to produce a strongly asymmetric inflow pattern. Storm
motion seems to be responsible for the front-back asymmetry in wind speed, and
the asymmetric pressure field is responsible for the left-right asymmetry in
wind speed. Myers and Malkin (1961) deduced these same characteristics from
their work using similar vector equations of motion.
10

8. Cardone's initial modification of Chow's scheme allowed more spe-
-ific information on each storm as input. The previous input variables were
pressure change, radius of maximum winds, storm velocity, and the ambient
geostrophic pressure gradient (steering flow). The angle between the storm
track and the steering flow was added, as was an option to specify the pres-
sure change and radius of maximum winds by storm quadrant that allows up to
11 input parameters. Storm track latitude and longitude along with the pre-
viously mentioned parameters and a PBL depth of 650 m provide the model's
numerical description of the hurricane. Aircraft measurements reported by
Moss and Rosenthal (1975) support a PBL depth of 650 m rather than the 1 or
2 km used previously.
9. Two shortcomings of Chow's formulation were his assumption that the
height of the boundary layer was 1 or 2 km and his use of a drag coefficient
that depended linearly on the wind speed. Research and field observations on
hurricanes have led to the conclusion that the PBL is on the order of 500 m
and has a variable height at any given time; this height is dependent on the
stage of the storm's development. Deardoff (1972) developed the PBL fluxes of
momentum, heat, and moisture as functions of layer-averaged mean PBL proper-
ties. Cardone adopted Arya's (1977) updated parameterization of Deardoff's
work. Equations are solved for the horizontal wind components in the direc-
tion of surface shear and perpendicular to it. Input values to solve for
these components included the mean layer virtual potential temperature, the
specific humidity, a roughness parameter that has been normalized by the PBL
height, and a potential temperature scale function expressed in terms of heat
flux. The PBL height is used as an independent variable, and various similar-
ity constants are calculated (Arya 1977) for stable and unstable conditions
using wind speed and the potential temperature input values as stability indi-
cators. When a hurricane exists in near-neutral conditions, the constants are
determined by linear interpolation between the stable and unstable value. The
drag coefficient was computed using the PBL height, roughness parameter, and
the potential temperature variable and was computed differently depending on
the land or water roughness conditions. To avoid using an iterative scheme to
solve for the roughness parameter, boundary height, and wind speed, the tem-
perature difference over water and the boundary layer height were considered
to be invariant over the storm area. These assumptions seem valid even near
11
the coast. Values can be calculated once for a given storm state and saved in
tabular form.
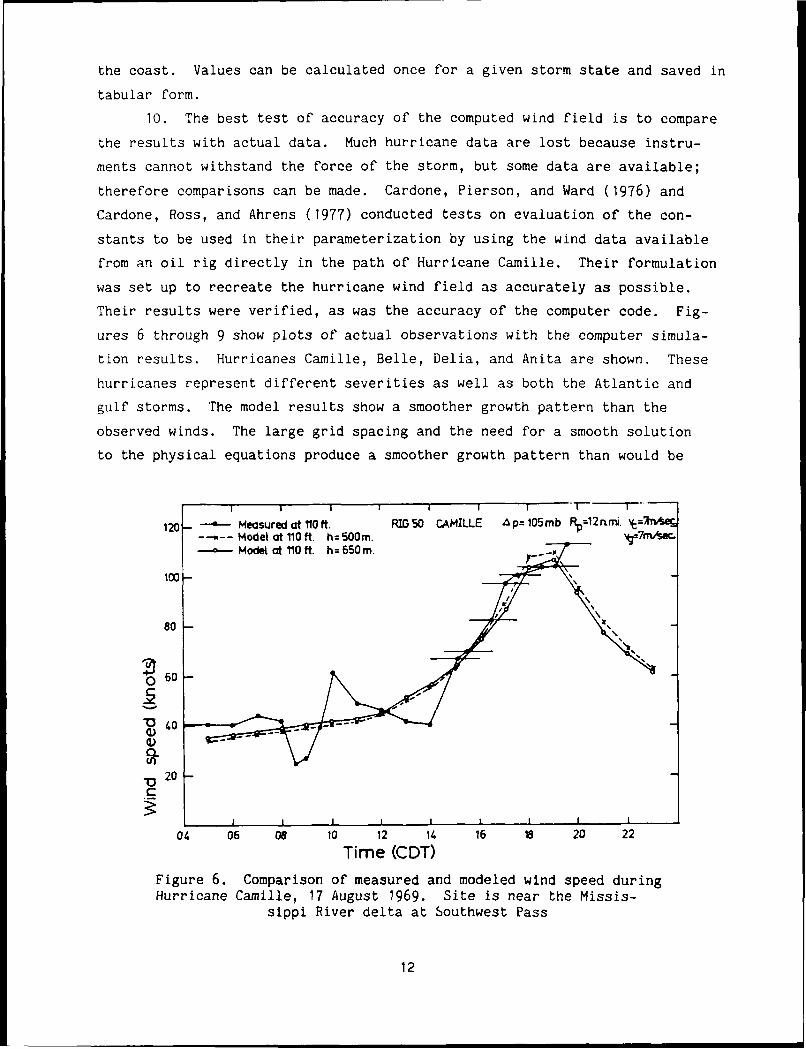
10. The best test of accuracy of the computed wind field is to compare
the results with actual data. Much hurricane data are lost because instru-
ments cannot withstand the force of the storm, but some data are available;
therefore comparisons can be made. Cardone, Pierson, and Ward (1976) and
Cardone, Ross, and Ahrens (1977) conducted tests on evaluation of the con-
stants to be used in their parameterization by using the wind data available
from an oil rig directly in the path of Hurricane Camille. Their formulation
was set up to recreate the hurricane wind field as accurately as possible.
Their results were verified, as was the accuracy of the computer code. Fig-
ures 6 through 9 show plots of actual observations with the computer simula-
tion results. Hurricanes Camille, Belle, Delia, and Anita are shown. These
hurricanes represent different severities as well as both the Atlantic and
gulf storms. The model results show a smoother growth pattern than the
observed winds. The large grid spacing and the need for a smooth solution
to the physical equations produce a smoother growth pattern than would be
I I I I I I I T I
120 --- Measured at 110ft. RIG 50 CAMILLE 4pz105mb Rp=12nm. f=Xhec---- Model at 0 ft. h= 500m. V7Tmec.- Mode at 0.ft h= 650m.
100-
80
0 60
1J 40
20
I I I I I
04 06 08 10 12 14 16 Is 20 22
Time (CDT)Figure 6. Comparison of measured and modeled wind speed duringHurricane Camille, 17 August 1969. Site is near the Missis-
sippi River delta at Southwest Pass
12

I1 I T i
70 - BELLE, 1976
0 60 *
C I ~40 "I N
30 .
P20 .
1o ES 15Measured at 10m
0 • Model ait 10m. h 6SOm
360
c 300
4) 150 I
120C160 s
18 20 22 00 02 04 06 05 AU 091 14AUG 06 AUG 09
Time (GMT)
70 - BELLE. 1976
60 -
4' 50 -o / \
*0
'l 20 - ,. . "
0 EB 41
Measured at Sm.
360 Mod*( at 5m, h. 65m
C 60a, .... .. -- A... --- '
-t
16 1 20 22 00 02 04 06AUG 09 AL.JG 10Time (GMT)
Figure 7. Comparison of measured and modeled wind speedand direction during Hurricane Belle, August 1976. Mea-surements are from buoys EB15 and EB41 offshore of South
Carolina and New Jersey respectively
13

S I I I I I
so • Meoasrd at 65 ft. Buccaneer Tower 30mi average DELIASModel at 65 ft. h-500m.
o / \
46 0 i, a
30
20-
\ o\ 0
\ I
10
0J
I I I I I I I I I I
00 02 o4 06 05 10 12 1 4 16 1SEP 3 Time (CD') SEP 4
Measured at 65 ft Buccaneer Tower 30 min avvge DELIA-- ,-Mode at 65 ft. h= 500m.
00
200 0 0+0
8/%
0/= Jr.0
o •]
1. ... /..
0o 02 0 06 05 1 12 14 16
SEP 3 Time (CDT) SEP 4
Figure 8. Comparison of measured and modeled wind speedand direction during Hurricane Delia, September 1973.
Site is south of Texas-Louisiana border
14
p. I I I I v ! ! I !
ANITAui 24 -
20 0
0 16 , -
12 . S-0
- 8 - EB 04C Measured lOre
--n-ModeL 10 m
07
- 70
110 0S
r 150 "
o0 -
I.230 -
73 00 02 04. 06 08 10 12 14 16 18 20 22 00 0 o 0 06 08 00 02AUG 30. '77 AUG. 31. '77
Time (GMT)
I II I I I I I F I I
E 32- ANITA:s ~/ .*.,
E 28-
0 2420, -0/ " 0 .,.
16 -
C. 12 • .r' ") .- * EB 71
S Measured lom -
-- Model 10 n
0 -S340 0 .
20 6 "
C 60-• -' 100 •
•
"0L 140
180 I t i t , t t I I I I
S 6 08 10 12 14 16 1 20 22 00 02 020 06 08 10 12 141 6 15AUG 31'77 SEP 1.'77
Time (GMT)
Figure 9. Comparison of measured and modeled wind speedand direction during Hurricane Anita, August-September1977. Measurements are from ocean data buoys EB04 andEB71 in the northwest Gulf of Mexico and off the central
Texas coast respectively
15

measured. The computer simulation will not allow for small local changes be-
tween grid points and cannot reproduce surface features that may vary between
grid points. The computer results seem to be quite representative of the
actual measured conditions in that products are within ±5 knots of the ob-
served wind. Figure 10 shows a vector plot of an output wind field. The size
of the arrow is related to the speed at that point, and the size convention is
defined by a set of arrows on the plot. Direction is shown by the orientation
of the arrow in polar coordinates. The grid intersections in Figure 10 corre-
spond to the grid shown in Figure 2. Many of the physical interactions in the
boundary layer cannot be totally defined by an analytical scheme, and many of
the assumptions made about the storm cause slight inaccuracies. Models will
continue to be developed that can describe these complexities with an effi-
cient scheme, and future work will attempt to use new formulations that model
conditions more realistically.
11. Hurricane winds are generated using two main computer programs:
SNAP and HIST. Blending and analysis programs were added to the system after
the major calculations were made to provide diagnostic evaluation. SNAP
09/07/1974 1200Z
MAX - 75.0Kt.
30K
CUT-OFF - 15.0 K
. . . . . . . . . .
. .. . . . . . . . . . . . ... . Ik44 . . . . . . .lb
.... ................... %... 4 4
b4 44bb.. . . .
........................... a &............vf E d d & & 4 4 b
.. . . . . .......... ...................
Figure 10. Schematic illustration of winds duringHurricane Carmen. Maximum speed is 75 knots, and
no vectors are shown for speeds below 15 knots
16
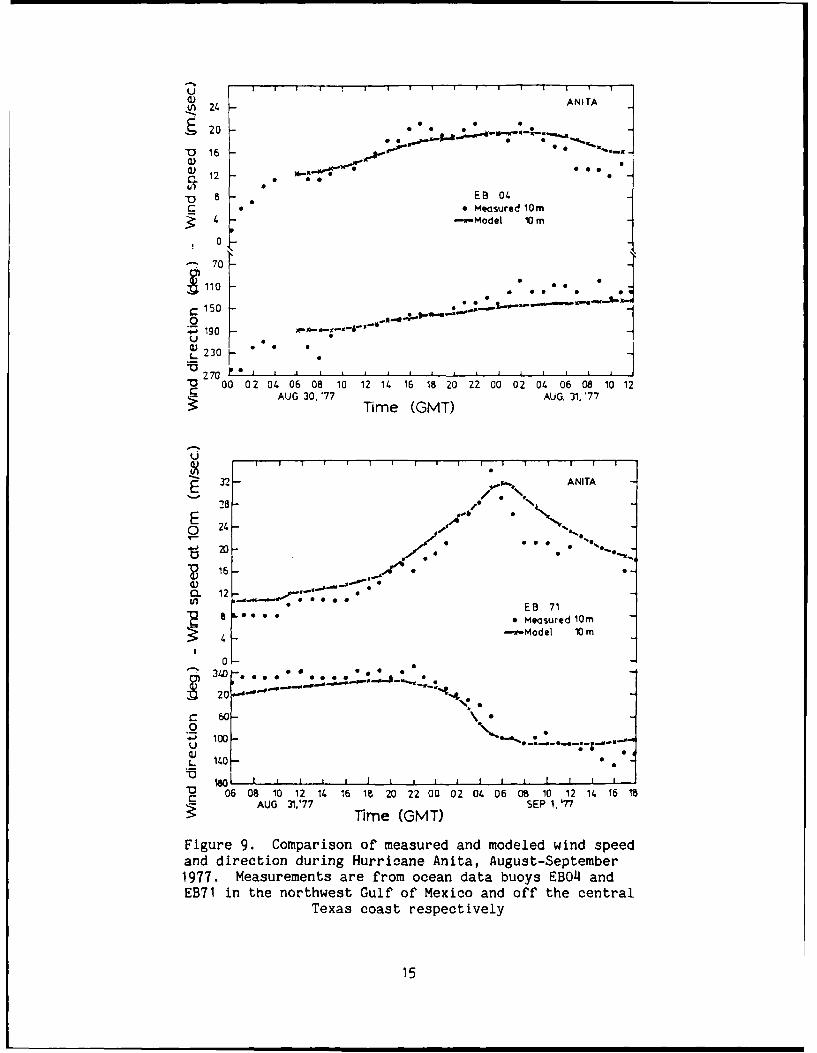
produces wind snapshots from preliminary information on the hurricane. A
system of nested grids is set up to provide finer resolution along the path of
the hurricane. Input to this program includes hurricane parameters at various
times during the simulation of the storm. The input data set for hurricane
5910 is given as an example in Figure 11, which shows four separate readings
of surface geostrophic wind (SGW), direction of SGW, latitude of the eye,
direction of the track, forward speed of the storm, pressure at the eye of the
storm, exponential pressure profile scale radius in four quadrants, far-field
pressure, and the grid spacing of the innermost nest. Each data set
corresponds to a specific time in the storm's development. The PBL equations
are solved using these input values for each snapshot. Various constants per-
tinent to boundary layer calculations are set in the program with the boundary
layer height over water normally 500 m. The origin of the coordinate system
is at the storm center of the first snapshot. A fine grid is set up as shown
in Figure 5. This grid actually represents the first of four quadrants of the
storm. This can be thought of as the section of the storm from 0 to 90 deg in
polar coordinates. If the storm is considered to be symmetric, this quad-
rant's information can be used to produce the symmetric cyclonic wind vectors
INAME1 3=0 , NZ:4 FND
INAME2 HH= 500. SENDINAME2 NAME='5310' , DX= 10., INUAD: 0,
FYFIAI= 27., EYPRES= 1000., DIRECz 80., SPEED: 30.,RADIUS: 85.,PFAR= 1007.,SGW= 12., AN1 220. IFHD
&NAME3 NAME:5910' , DX= 10., IOUAD= 0,EYFI.AT= 38., EYPRES= 1000., OIREC7 Mo., SPEED= 20.,
RADIUS= 85.,PFAR: 1007..SGW= 12., ANI= 220. !END
OHAME3 HAME='5910' DX: 1O., IGUAD= 0,FYELAT= 10., FYPRES: 991., DIREC' 70., SPEED: 30.,RADIUS= 85.,PFAR= 1013.,SGW= II., ANI= 220. IFND
1HAME3 NAME'"?10' , fIX: O., ICUAD: 0,
FYELAT= 31., EYPRES= 988., DIREC: 80., SPEED: 25..RADIUS= 85.,PFAR= 101W.,5GW= 10., ANI= 220. END
Figure 11. Example of data input to the wind program thatprovides a snapshot of wind conditions
17

in the other three quadrants. Five nests are used in the SNAP program with
grid spacing of 10, 20, 40, 80, and 160 km for each 21 by 21 grid. Ten km was
typically used as the finest grid spacing. Some storms that needed a finer
mesh in the interior used a grid spacing of 5 km. After the storm solutions
are available as a set of snapshots, program HIST does spatial and temporal
interpolation to transfer the PBL winds to arbitrary points on an earth-bound
coordinate system. Input to this program is shown in Figure 12. A latitude
and longitude for each hour of the storm simulation is given in this data file
and related to the proper snapshot in the first data set. The final output
consists of a wind vector field over the entire grid used in the wave hindcast
model.
12. Storm parameters for the above set of computer programs are not
readily available. Selection of the input data required examination of the
surface pressure charts along with reports of maximum wind speeds to determine
a set of representative stages in the storm's evolution. The pressure fields
were also analyzed to determine peripheral pressure and steering flow. Storm
tracks were analyzed to determine track heading and forward speed at each
snapshot position. All available data sources were used to obtain the sea
surface temperatures in the vicinity of the storm center. The boundary layer
depth is considered to be 500 to 650 m, corresponding to maximum intensity
storms. The HIST data require analysis of the storm tracks to determine the
track position for each hour of storm simulation and a determination of the
direction of the forward motion relative to the snapshot orientation.
Wave Hindcast Method
13. The WIS used a shallow-water spectral hindcast model (Jensen,
Vincent, and Abel 1987) for a 20-year wave hindcast in the Gulf of Mexico.
This model uses a discrete matrix consisting of frequency and direction com-
ponents of the energy at each water point of the grid. It models the sources
and sinks in the energy balance equation with several of the functions being
represented in a parametric sense. It was modified for this study to account
for the rapidly turning winds present in a hurricane. Appendix D provides
results compared with actual data for the storms that were used for
verification.
14. Input to the wave hindcast model consists of a land-sea grid. A
18

.r'ME4 4BAHEE 910 . 13ART 70S6' ,ICN'.',T_' . !0:-0 iEND
':,,,ES LAME=E 1EMP
3' 7 80 7 1 ).0000 ' ,:7 0 3) 4 1 ).0000 1)7 0 30 1A I I ,.000 0 ,' ') 02 Z. I 0.0000 0"" 0 80 74 0 0.00C0 0 0
.7 0 ;2, 24 C0 0.0000 0 027 0 80 . 1 0 0.0000 0 02' 0 80 74 1 ) 0.0000 0 6):1 0 80 24 1 0 0.0000 0 0"7 0 P 24 ) 0 0.0000 0 02'7 -) 80 4 1 0 0.0000 -) 0"" 0 aO 24 1 0 0.0000 0 0'7 0 80 24 1 0 0.0000 0 027 3 79 5C 1 2 0.0823 ' 027 79 30 1 0.1667 0 027 9 78 A8 1 20.2500 0 1)27 12 "q 16 1 2 0.3C33 0 027 IS " 4 1 2 0.4167 0 027 18 77 12 1 2 0.5000 0 027 73 76 7& 2 0.5833 0 0
2 78 6 0 1 2 0.6667 ,-7 8 75 4 1 0.7500 0 07'S -8*4 48 1 0.8313 0
28 8 74 12 1 0.2.167 0 028 18 "I 6 2 ) .0000 0 08 29 73 7- 2 0.0833 3 0:8 '0 '2 24 ? 0.1667 ' 028 41 71 '8 2 7-0.500 0 029 2 71 12 i 0.333 0 0.9 13 70 16 7- 7 167 0 0"9 ?4 70 0 ,- 1.5000 0:9 33 69 24 2 0.5823 0 029 2 68 '. 7 .6667 0 0.95168 12' 2 0.7)0 0 020 0 6726 3 0.33 0,0 q 0 7 0.?167 0 030 I8 66 .;4 0 0.0000 0 '720 74 65 49 7 4 0.0833 -3 0;0 7-0 65 11 3 .1667 0 0'0 '6 64 39 , 4 0..500 0 030 42 64 4 7- 0. Z3333 0 020 48 63 27 3 4 0.4167 0 040 S4 62 S, 3 4 0.00 0 00 54 62 31 3 4 0.5833 0 0
20 54 62 3 3 4 0.6667 0 030 34 61 'S 2 41.70 0 030 4 61 22 ' 4 0.233 0 020 54 60 59 3 4 0.9167 0 00 'A 60 76 4 0 ).0000 0 0
Figure 12. Example of data input to the windprogram that provides the time-history of
wind fields along the track of the storm
19

section of the grid east of the Florida peninsula was considered land to pro-
vide sheltering that the Bahama Islands provide for the eastern Florida coast-
line. The gulf grid contains only the Gulf of Mexico. The section south of
Florida and Cuba was not modeled. The gulf was considered as a closed body of
water. The model requires depths for all grid-point intersections since the
equations used are dependent on the depth and refraction is simulated. Six-
teen direction bands, each consisting of 22.5 deg, were used for computations.
The discrete spectrum was composed of 15 equally spaced frequency bands from
0.04 to 0.18 Hz. The region above 0.18 Hz was considered a parametric region.
In this region, the spectrum is represented by a Joint North Sea Wave Program
(JONSWAP) type spectrum. The five JONSWAP parameters are retained and can be
used to reconstruct the shape of the spectrum. The time-step was set at
1,800 sec. Wind input was available every hour and was interpolated to pro-
vide winds for every time-step. Model output consists of a spectral matrix
and a sea parameter record for each output station for each hour of the simu-
lation. The sea parameter record consists of a significant wave height;
period and direction; a height, period, and direction for both the sea and
swell components of the spectrum; values for alpha (the Phillips equilibrium
constant); and the energy in the parametric region. Wind speed and direction
are also saved. The sea parameter information is available in the WIS data
base, "Sea-State Engineering Analysis System (SEAS)" (McAneny 1986) for all
the Atlantic and gulf hurricanes that have been hindcast. Spectral data have
been archived and are available but cannot be accessed using SEAS.
15. Information on the individual storms usually became available when
the storm became a full-fledged hurricane. Many times, especially in the
Atlantic, the storm had a long life as a tropical storm and had generated wave
energy as observed in arrival of swell. In these cases, a "spin-up" period
was added to the hindcast. This was less costly than developing a separate
approach to modeling the more erratic prehurricane conditions. Many times the
hurricane was allowed to remain at the starting point for 12 hr to set up a
suitable chaotic sea situation before the storm was moved forward on its
track. Several gulf storms with long tropical storm histories were treated to
several hours of "spin-up" time.
16. The gulf and Atlantic hurricane hindcasting procedures were essen-
tially the same. The gulf wind fields included the synoptic winds outside the
region of influence of the hurricane, which were available from the gulf
20
20-year hindcast. The Atlantic wind fields did not include the synoptic winds
since the hurricane study covered a different region from the Phase II
Atlantic 20-year hindcast.
17. Available data for several storms were used to verify the accuracy
of the full hindcast procedure. Appendix D provides comparisons of wave
height and peak period for a number of storms. Based on these comparisons, it
is concluded that the maximum heights predicted in the storms are typically
within 10 percent and periods within 15 percent of measured values. The time-
history of these parameters during passage of the eye of the storm appear to
be equally good. However, at large distances from the storm, agreement should
be less accurate because the influence of the hurricane wind field is less and
the degree to which the vortex model represents the winds is more variable.
Hindcast products
18. Many displays using the data produced by the hindcast are available,
and the data from each storm are also available. The sea parameters discussed
previously are available in the SEAS data base at the US Army Engineer Water-
ways Experiment Station. Tables of hurricane information as shown previously
in Tables 1 and 2 are available through the data base. Tables similar to
Table 4 for Atlantic storm 7409 (Hurricane Carmen) have been created and are
available for all storms through the SEAS data base. These tables describe
the maximum wave height in metres and the corresponding period in seconds that
occurred at each station during the represented storm. One table is available
for each Atlantic or Gulf storm that has been hindcast. Storm names are in a
four-digit numerical form as described in the information on Tables 1 and 2.
SEAS requires an Atlantic or gulf prefix to access the data.
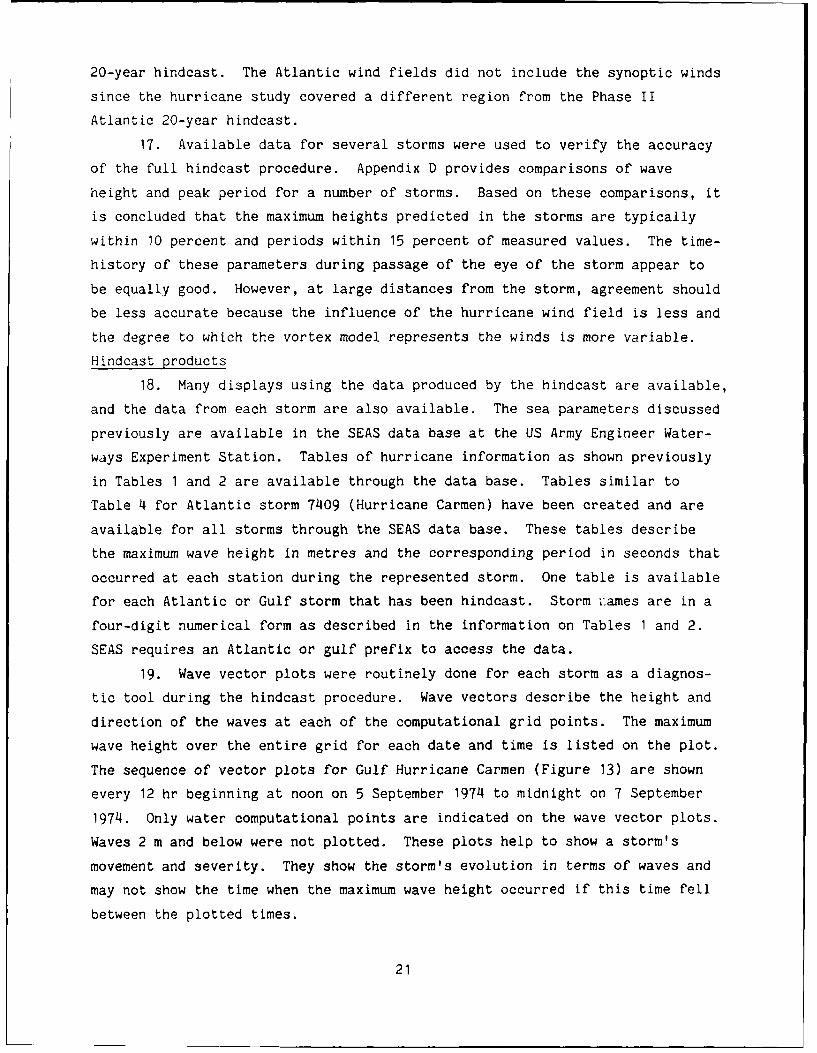
19. Wave vector plots were routinely done for each storm as a diagnos-
tic tool during the hindcast procedure. Wave vectors describe the height and
direction of the waves at each of the computational grid points. The maximum
wave height over the entire grid for each date and time is listed on the plot.
The sequence of vector plots for Gulf Hurricane Carmen (Figure 13) are shown
every 12 hr beginning at noon on 5 September 1974 to midnight on 7 September
1974. Only water computational points are indicated on the wave vector plots.
Waves 2 m and below were not plotted. These plots help to show a storm's
movement and severity. They show the storm's evolution in terms of waves and
may not show the time when the maximum wave height occurred if this time fell
between the plotted times.
21

MAX = 43m 1200Z 1 MAX =58m 0000Z 2
09/05/1974 09/06/1974
-'.
MAX= 7.4m 1200Z 3
09/06/1974
,. ........-. .
KMAX =9.Om OOOOZ 4
09/07/1974
* -
: :. ..... .. ...
MAX= 9.3m OOOOZ 6 MAX 11.9m 1200Z 5
09!08/1974 09/07/1974 . ........ ........
.. . . ... ...___ _
.. ...- . : , : . : .......... .........
Figure 13. Schematic illustration of wave heights and directionsfor Hurricane Carmen. Wave heights below 2.0 m are not plotted
20. The maximum wave condition that occurred during the storm was saved.
This information was retrieved from an archived file that output the signifi-
cant wave height and period for all points of the grid for every time-step
of the storm simulation. Figure 14 shows a contoured maximum wave height
plot for Carmen. This contour plot has been placed on the grid that was used
22

jt V .r S .1 o2 .X •g S r • . R .9 .3: .1'00.
a. -32'. 32*N
CAL ESTONL S3 30N
CORPUS 4 -N
CH AIST
24N
liii
.~( T MPA_ ---
I?'N1 -- I "N
00 I 2 ,30 35 40
Figure 14. Contours of the maximum wave height presentduring passage of Hurricane Carmen
for the hindcast, and the output stations are shown. Note that Figure 1~4
represents maximum conditions for the entire storm at each of the computa-
tional points and is not indicative of a storm state at a given hour.
21. The lowest pressure that a hurricane attains and the maximum wave
height produced by the storm provide an indication of the severity of the
storm. These data are shown in Figure 15. All the storms included in the
hindcast have been plotted. Gulf and Atlantic storms are noted separately.
One regression line was calculated using the Atlantic storms, and a second
regression line was calculated using the gulf data. The lines are so close
that it is possible that all the data could have been treated as coming from
the same population. These regression lines give an indication of the maximum
wave height one could expect if a storm of known pressure was approaching a
coastline.
Track analysis
22. A 20-year hindcast gives an idea now vulnerable a section of coast
23

20
U ATLANTIC AND GULF HURRICANES IN
lb N U TERMS OF MAXIMUM WAVE HEIGHT,, AND LOWEST EYE PRESSURE
16 - IN
U 0
14 -
12 - 0 we
1 10
8
6 N
4LEGEND
GULF HURRICANES2 ATLANTIC HURRICANES
900 910 920 930 940 950 960 970 980 990 1000
LOWEST EYE PRESSURE, mb
Figure 15. Maximum hindcast wave height versus lowestmeasured atmospheric pressure for all Gulf of Mexico
and Atlantic hurricanes in this study
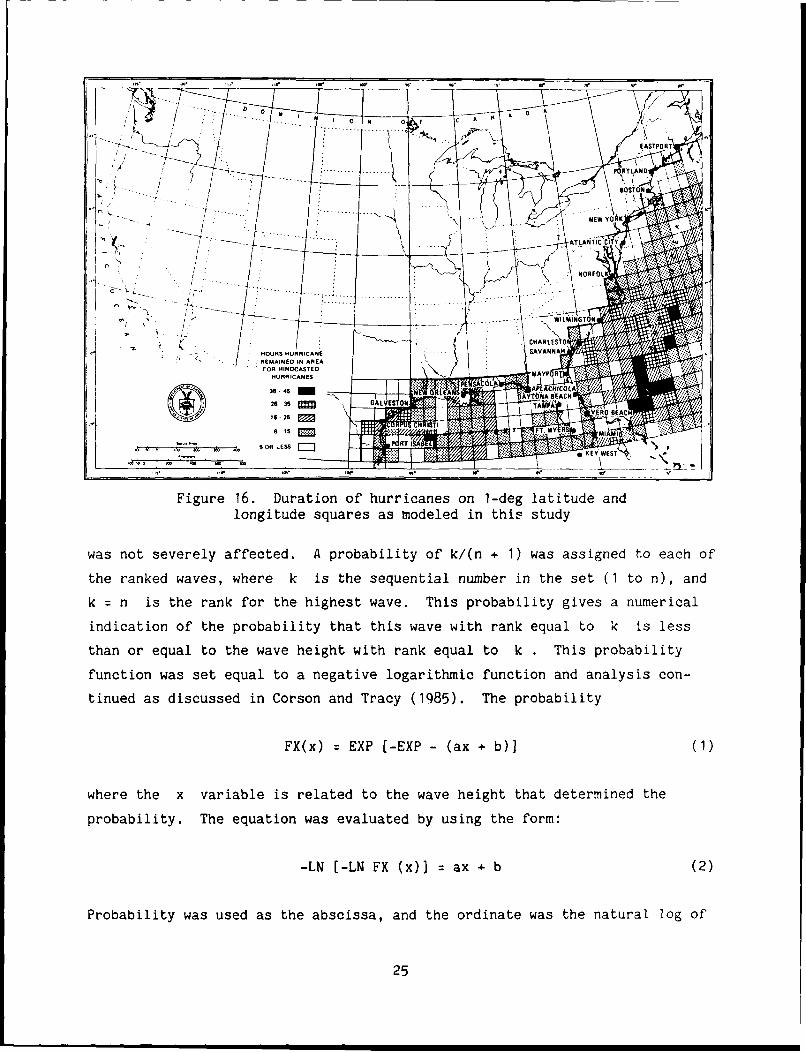
or open ocean can be by the amount of time a hurricane was actually present in
the vicinity. This information is shown in Figure 16. Each grid cell is
shaded to correspond to the actual number of hours a hurricane remained in the
grid cell. Spin-up time was not included in determination of the number of
hours. Only the hurricanes used in the hindcast were included in this figure.
This represents a historical analysis of 1956-1975 and does not imply that
grid cells devoid of hurricanes are immune from a major storm.
Statistical analysis
23. The 20-year data base of hurricane waves for the Atlantic and gulf
provides a data set to analyze using extremal statistical techniques. The WIS
Report 15 describes an approach used to create extremal statistics for the
regular hindcast of the Atlantic Phase II data. This approach has been used
to create extremal statistics for both the Pacific and gulf hindcasts. Storm
history or track was not important to the extremal analysis. Only information
on the maximum wave height that occurred at each station for each storm was
needed. The statistical analysis began by ranking the maximum wave heights
produced at each station for each storm. Wave heights under 3 m were dis-
carded since it was assumed that this wave height indicated that this station
24
F-. .tigure 16 i... huricne.o..de laitd and
longitude.squ...a ........ t
.... ~ ~ ~ ..-..- .........
Z Vv L -. G O 6/. ... l. ...W..L ...0..
- HOURS HURRICANE S AL. VANNi ,
' " • '..2FOR HINDCASTED -
HURRICANES 1 MA.::" -: Y PA E
2 6.3 5 G A LV ES o O N A" :
Figure 16. Duration of hurricanes on 1-deg latitude andlongitude squares as modeled in this study
was not severely affected. A probability of k/(n + 1) was assigned to each of
the ranked waves, where k is the sequential number in the set (1 to n), andk = n is the rank for the highest wave. This probability gives a numerical
indication of the probability that this wave with rank equal to k is lessthan or equal to the wave height with rank equal to k . This probability
function was set equal to a negative logarithmic function and analysis con-
tinued as discussed in Corson and Tracy (1985). The probability
FX(x) = EXP [-EXP - (ax + b)] (I)
where the x variable is related to the wave height that determined the
probability. The equation was evaluated by using the form:
-LN [-LN FX (x)] = ax + b (2)
Probability was used as the abscissa, and the ordinate was the natural log of
25
the wave height. The extremal waves were analyzed for each station using the
method of least squares to determine the linear relationship between the
probability and the function of the wave height. This linear relationship can
be extrapolated to determine a wave height associated with a higher prob-
ability. Assuming that the extreme wave heights make up a sequence of random
variables, Xmax is the maximum of the sequence, and all the random variables
have the same distribution function; the probability of the maximum wave of
the sequence is equal to [Fx (x)] to the nth power where n is the number
of extreme waves at that station. In order to extrapolate to an event beyond
the 20-year data base, there should be 2.5 times the number of extreme waves
in the 50-year data base. Solving for the probability fractile for the median
50-year wave height,
(0.5)**(1/2.5 n) z FX(x) (3)
The median value of 0.5 has replaced the probability of the maximum wave of
the sequence (n is the number of extreme waves in the 20-year hindcast at the
station being considered). Using the linear relationship between the prob-
ability and the wave height function, it is possible to pick a wave height to
represent the median 50-year wave. Using the same development, a wave height
can be associated with the 0.25 and the 0.75 fractiles to give a range of wave
heights around the median. Fifty percent of all the 50-year extreme waves
should fall within this range. The 20-, 10-, and 5-year waves and their
respective interquartile ranges are developed using this same approach.
Details of the statistical analysis can be found in Corson and Tracy (1985),
and Borgman and Resio (1977). The 20-year data base allows extrapolation to
an extremal wave statistic that gives an indication of what the expected 50-
year wave might be. An interquartile range of wave heights is also given to
show the range of this extremal wave. The 20-, 10-, and 5-year extremal waves
and their respective interquartile ranges are given in Appendix A for the
Atlantic waves and in Appendix B for the gulf waves. Wave heights were
limited to 0.6 times the depth at that station, and when a wave extreme
occurred that was larger than this limit, the limiting value was used and is
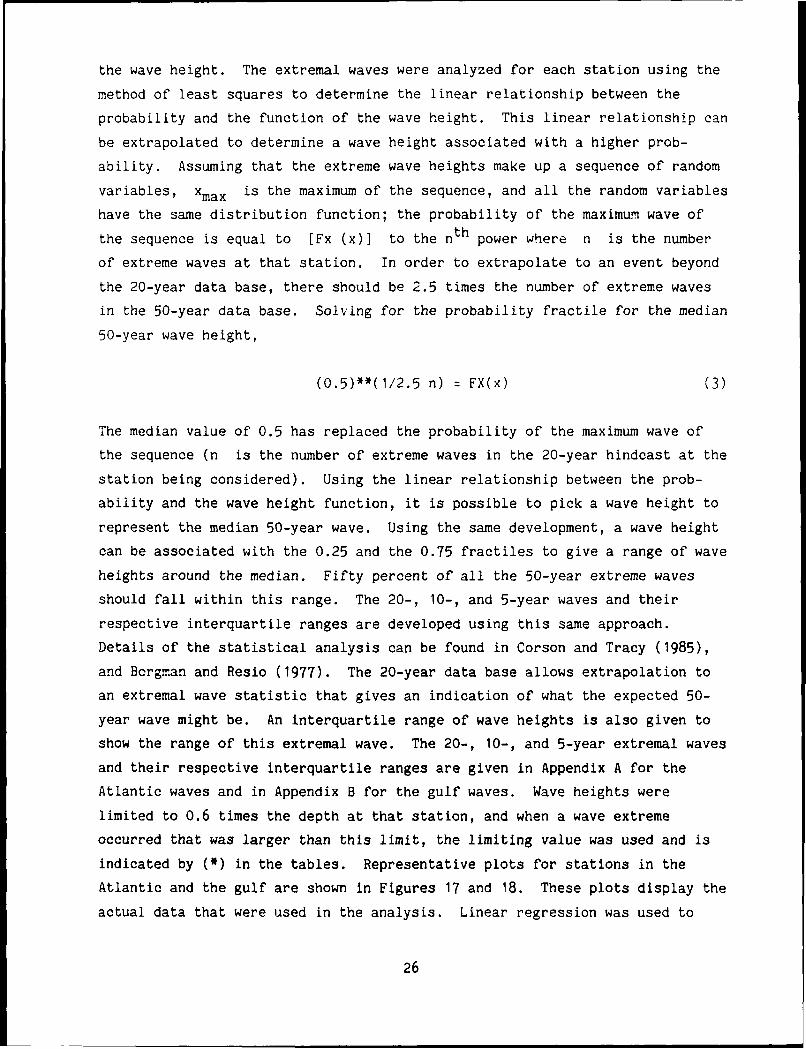
indicated by (*) in the tables. Representative plots for stations in the
Atlantic and the gulf are shown in Figures 17 and 18. These plots display the
actual data that were used in the analysis. Linear regression was used to
26
T2 14
7. RE UR.ERO ,jR12 E
5 10 20 so0
height6.4slgnllcantwave
versus return period for63ALNICPAE1Atlantic~~ ~ ~ ~11 Stto )4Y62(HRIA
6.6GURIE AGOF 20-R WAV
Atlantic-I Itatin 24 0 TAIO 2
5. OF 20- Y" AV
7..9
73. 14 F.4 1
7.2 2 2
U 7.1
S7.017,
4 .
2 6.
76.1
0
"' 6.7
6.3
,36.2 GUL HUTRGURICANEGufSain2
6.1 INTEROU ARTILE RANGEL.JOF 50-YR WAVE
60
5.6
L___-10 0 1 0 2.0 30
REDUCED PROBABILITY FUNCTION-In I -In F, (,)I
27

plot the straight line through the data. Interquartile ranges are shown using
shading to indicate the range of each of the extreme waves. Stations that did
not include enough waves over 3 m for analysis were not included in the extre-
mal analysis. These stations usually represent areas where hurricane condi-
tions are rare and hurricane extremal statistics do not make up the design
wave for the area. Figure 19 contains a histogram of the extremal waves for
the Atlantic stations. Figure 20 contains a similar histogram for the gulf
stations.
Interpretation of results
24. The hindcast wave values and their extrapolation to extremes should
be used with the following understanding of possible limitations:
a. The simulations were made on an approximately half-degree gridthat is sufficient to define the broad details of the stormcharacteristics along the coast. Hence, the data should beused as an indication of the approximate order of magnitude ofthe storm for preliminary planning purposes.
b. The grid representation is not fine enough to resolve any de-tails of the bathymetry or peculiarities of some sites (nearcapes for example). However, the data may be used to studysites using finer resolution grids. This is particularly im-portant for land-falling storms. The increased resolution willaccount for effects of bathymetry on wave propagation andbetter resolve the regions of peak winds and waves.
c. The computations were made at a mean-iow-water depth. Hurri-canes almost always have surges associated with them that sig-nificantly alter the water levels nearshore. Nearshore calcu-lations of the storm-surge levels for the individual stormshould be made along with any further wave calculations near-shore. As an approximation, the wave conditions calculatedhere may be considered valid for the mean-low-water depth plussurge (that is if the water depth on which the calculationswere made was 10 m and the storm surge was 2 m, the results maybe interpreted at what would normally be the 8-m depth). Thisassumption is not valid if there is any significant curvatureof topography or presence of a shoal or if the slope is veryflat.
Summary
25. This report describes the procedures for production of hurricane
wave information and statistics for the Atlantic and gulf over the 20-year
hindcast period. Both the wind and wave models represent state-of-the-art
methods to hindcast winds and waves. The extremal statistics that were cal-
culated from this data base represent the design wave statistics for the
28

SIGNIFICANT WAVE HEIGHT, m
0 5 10 15 20 25 30
2
34
6
78 4Art-~r
89
10
12
13
1415
16
17
18
19
20
u 21
22
ATLANTIC HURRICANE EXTREMAL WAVES0 24 STATIONS 1 THROUGH 4525
F- 26(nO
27
2829 LEGEND30
31 20 YEAR WAVE32 50 YEAR WAVE ADDITION
TO 20 YEAR WAVE34
35 20 YEAR AND 50 YEAR WAVE
36
3738
39
4041
4243
44
45
Figure 19. The 20- and 50-year significant wave heights forall Atlantic stations (Continued)
29

SIGNIFICANT WAVE HEIGHT, m
0 5 10 i5 20 25 30
46
4748
49
505152
53545556
m 57m 58J 59zz 60- 61I-
< 62'-
63
64
65 ATLANTIC HURRICANE EXTREMAL WAVES66 STATIONS 46 THROUGH 7366
67
6869
70
71
7273
LEGEND...
C77 20 YEAR WAVE
50 YEAR WAVE ADDITIONj TO 20 YEAR WAVE
M 20YEAR AD50 YERWAVE
Figure 19. (Concluded)
30

S I (N IFICA NT V'yAVE HEIQ'HT, r
10 15 20 25 30 35
00
1 2
14
15
21
20
232425
z 22 267
< 2829
30 GULF HURRICANE EXTREMAL WAVES3;
32
3334 LGN
3536 2 ERWV
41 50 YEAR WAVE ADDITION
4445 111 111A20 YEAR AND 50 YEAR WPAVE
4647 ///7-48
49
50
Figur'e 20. The 20- and 50-year wave heights for all gulf stations
31

Atlantic and gulf stations. This hindcast procedure and the data extracted
from it provide a data base for the engineer who faces coastal design
problems.
References
Arya, S. P. S. 1977. "Suggested Revisions to Certain Boundary LayerParameterization Schemes Used in Atmosphere Circulation Models," MonthlyWeather Review, Vol 105, No. 2, pp 215-227.
Borgman, L. E., and Resio, D. T. 1977 (Mar). "Extremal Prediction in WaveClimatology, Ports '77," 4th Annual Symposium of ASCE, Vol 1, pp 394-412; TheWaterway, Port, Coastal and Ocean Division of ASCE, Vol 1, pp 394-412.
Bouws, E., Gunther, H., Rosenthal, W., and Vincent, C. L. 1985. "Similarityof the Wind Wave Spectrum in Finite Depth Water 1 Spectral Form," Journal ofGeophysical Research, Vol 90, No. C1, pp 975-986.
Bouws, E., et al. 1987. "Similarity of the Wind Wave Spectrum in FiniteDepth Water, Part 2: Statistical Relations Between Shape and Growth Stage,"Deutsche Hydrographische Zeitschift, Vol 40, pp 1-24.
Cardone, V. J., Pierson, W. J., and Ward, E. G. 1976. "Hindcasting theDirectional Spectra of Hurricane Generated Waves," Journal of PetroleumTechnology, Vol 28, pp 385-394.
Cardone, V. J., Ross, D. B., and Ahrens, M. R. 1977. "An Experiment inForecasting Hurricane Generated Sea States," 11th Technical Conference onHurricanes and Tropical Meteorology, Dec 13-16, Miami Beach, FL.
Chow, S. 1971. "A Study of the Wind Field in the Planetary Boundary Layer ofa Moving Tropical Cyclone," M.S. Thesis, Department of Meteorology andOceanography, New York University, p 58.
Corson, W. D., and Tracy, B. A. 1985 (May). "Atlantic Coast Hindcast,Phase II Wave Information: Additional Extremal Estimates," WIS Report 15, USArmy Engineer Waterways Experiment Station, Vicksburg, MS.
Deardoff, J. W. 1972. "Parameterization of the Planetary Boundary Layer forUse in General Circulation Models," Monthly Weather Review, Vol 100,pp 93-106.
Forristall, G. Z., Ward, E. G., and Cardone, V. J. 1980. "Directional WaveSpectra and Wave Kinematics--Hurricanes Carmen and Elouise, Proceedings of the17th Coastal Engineering Conference, p 567, Sydney, Australia.
Hubertz, J. M., Abel, C. E., and Jensen, R. E. 1988. "A Hindcast of Winds,Waves, Water Levels and Currents During Hurricane Gloria," Proceedings of theInternational Symposium on Natural and Man-Made Hazards 3-9 Aug 1986, M. I.EL-Sabh and T. S. Murty, eds., D. Reidel Publishing Co., pp 411-426.
Hughes, S. A., and Jensen, R. E. 1986. "A Users Guide to SHALWV, NumericalModel for Simulations of Shallow Water Wave Growth, Propagation and Decay,"Instruction Report CERC-86-2, US Army Engineer Waterways Experiment Station,Vicksburg, MS.
Jensen, R. E., Vincent, C. L., and Abel, C. E. 1987 (Jun). "A User's Guide
32

to SHALWV: Numerical Model for Simulation of Shallow-Water Wave Growth,Propagation, and Decay, Report 2, SHALWV - Hurricane Wave Modeling andVerification," Instruction Report CERC-86-2, US Army Engineer WaterwaysExperiment Station, Vicksburg, MS.
McAneny, D. S. 1986 (Nov). "Sea-State Engineering Analysis System (SEAS),Revised Edition 1," WIS Report 10, US Army Engineer Waterways ExperimentStation, Vicksburg, MS.
Moss, M., and Rosenthal, S. L. 1975. "On the Estimation of PlanetaryBoundary Layer Variables in Mature Hurricanes," Monthly Weather Review,Vol 103, pp 980-988.
Myers, V. A., and Malkin, W. 1961. "Some Properties of Hurricane Wind Fieldsas Deduced from Trajectories," National Hurricane Research Project Report,No. 49, US Weather Bureau.
National Weather Service. 1987. "NWS Hurricane Climatology for the Atlanticand Gulf Coasts of the United States," National Oceanic and AtmosphericAdministration, Silver Spring, MD.
Ooyama, K. 1969. "Numerical Simulation of the Life Cycle of TropicalCyclones," Journal of Atmospheric Sciences, Vol 26, pp 3-40.
Pierson, W. J., and Moskowitz, L. 1964. "A Proposed Spectral Form for FullyDeveloped Wind Seas Based on the Similarity Theory of S. A., Kitaigorodskii,"Journal of Geophysical Research, Vol 69, No. 24, pp 5181-5190.
Resio, D. T. 1982. "Wave Prediction in Shallow Water," Paper OTC 4242, 14thOffshore Technology Conference, Houston, TX.
Swamp Group, The. 1985. Ocean Wave Modeling, Plenum Press, New York.
33

Table 1
Hurricane Information File--Atlantic Phase 11*
Storm Storm Beginning Total Central LargestNumber Name Date Hours Pressure HS, m Unaffected Stations Name
1 5608 56081312 121 951 12 73 Betsy2 5808 58082412 133 935 15 0 Daisy3 5809 58092312 145 934 16 0 Helene4 5810 58100612 109 968 10 0 Janice5 5907 59070612 73 991 5 1-35,59,60,63-73 Cindy6 5909 59092212 181 950 12 0 Gracie7 5929 59092900 145 959 11 0 Hannah8 5910 59101806 49 988 7 0 Judith9 6008 60081712 79 982 8 0 Cleo
10 6009 60090900 103 932 12 0 Donna11 6109 61091612 241 927 17 0 Esther12 6110 61100400 133 948 11 60,65,69,71-73 Frances13 6208 62082700 85 986 6 59-60,65-67,70-71 Alma14 6210 62100312 109 965 14 0 Daisy15 6220 62101512 157 960 13 0 Ella16 6308 63080712 73 969 8 8,50,57,59-67,70-71,73 Arlene17 6310 63101906 253 948 10 0 Ginny18 6408 64082600 217 967 6 4-5,8,13,23-24,27-32 Cleo19 6409 64090500 145 942 15 0 Dora20 6429 64090712 157 970 9 0 Ethel21 6439 64091612 187 951 11 0 Gladys22 6410 64101412 61 980 7 0 Isbell23 6509 65090206 157 946 15 0 Betsy24 6606 66061000 109 993 8 0 Alma25 6607 66071918 49 997 5 1-17 Celia
(Continued)
* This file contains basic information about the 43 hurricanes included in the1956-1975 Atlantic hurricane hindcasts. The previous Atlantic Phase II WISgrid was not used for the Atlantic hurricanes; a larger grid using the samespacing and same output stations was used (see Figure 1). Stations 1 through 73are the same locations as referenced throughout Sea-State Engineering AnalysisSystem (SEAS) for Atlantic Phase II. The first column contains the SEAS stormnumber of the hurricane. The second column contains the four-digit numeric "name"of the storm. The third column contains the beginning date of the storm; theyear, month, day, and hour are each indicated by two digits. Time is referencedto Greenwich Mean Time. The fourth column indicates how many hours were includedin the hurricane hindcast. The fifth column gives the lowest central pressure inmillibars for the storm. The sixth column shows the highest significant waveheight (in metres) that occurred over the entire grid during the storm. Columnseven indicates those stations which were not affected by the storm, e.g.,sta:ions whose maximum wave heights during the selected storm were 1 m or less.The last column lists the hurricanes by name, as identified by the NWS.

Table 1 (Concluded)
Storm Storm Beginning Total Central LargestNumber Name Date Hours Pressure HS, m Unaffected Stations Name
26 6608 66082712 157 954 15 0 Faith27 6610 66100212 61 985 5 0 Inez28 6709 67090912 181 975 10 0 Doria29 6710 67102100 73 994 6 0 Heidi30 6806 68062012 97 990 7 0 Brenda31 6810 68101812 73 965 10 0 Gladys32 6908 69081100 43 992 7 0 Blanche33 6909 69090800 55 977 7 0 Gerda34 6929 69092400 49 985 7 0 T.S. #1035 6910 69101112 151 978 8 0 Kara36 7108 71081400 73 977 11 46-73 Beth37 7109 71092212 217 969 13 0 Ginger38 7209 72090612 133 997 5 0 Dawn39 7307 73070212 85 986 10 0 Alice40 7408 74082712 61 979 9 8,41-44,46-72 Becky41 7507 75072606 55 980 10 0 Blanche
42 7509 75092600 61 979 11 0 Faye43 7529 75092900 103 939 12 0 Gladys

Table 2
Hurricane Information File--Gulf of Mexico Phase I*
Storm Storm Beginning Total Central Largest
Number Name Date Hours Pressure HS, m Unaffected Stations Name
1 5609 56092212 73 979 9 0 Flossy2 5706 57062512 61 946 11 43-46,48 Audrey3 5907 59072300 73 984 6 31-32,38-47 Debra4 5910 59101712 31 399 4 0 Judith
5 6009 60091400 85 972 12 0 Ethel6 6109 61090700 133 931 18 0 Carla7 6309 63091612 49 996 6 1,39-51,55 Cindy8 6409 64093000 115 942 14 0 Hilda9 6410 64101312 43 964 7 0 Isbell
10 6509 65090800 61 941 15 0 Betsy11 6606 66060806 49 970 7 8-12,15-17,54 Alma12 6610 66100500 139 948 14 0 Inez
13 6709 67091700 109 923 19 30-31,36-45 Beulah14 6710 67100200 61 987 9 31-32,40 Fern15 6810 68101612 73 965 7 0 Gladys16 6908 69081600 67 908 16 0 Camille17 6910 69101818 145 973 10 0 Laurie18 7008 70080112 67 945 7 31,35-40,43,47 Celia19 7009 70091018 55 967 9 24-44,46-48,50 Ella20 7109 71090712 121 985 7 40,43-46 Fern21 7129 71091412 55 977 11 0 Edith22 7206 72061700 73 978 10 0 Agnes23 7409 74090400 121 937 12 0 Carmen24 7508 75082900 73 963 8 30-33,35-36,39-51 Caroline25 7509 75092112 55 955 11 0 Eloise
* This file contains basic information about the 25 hurricanes included in the
1956-1975 Gulf of Mexico hurricane hindcasts. The Gulf Phase I WIS grid was usedfor the hindcast. Stations 1 through 56 are the same locations as referencedthroughout SEAS for the Gulf of Mexico. The first column contains the SEAS stormnumber of the hurricane. The second column contains the four-digit numeric "name"
of the storm. The third column contains the beginning date of the storm; the
year, month, day, and hour are each indicated by two digits. Time is referencedto Greenwich Mean Time. The fourth column indicates how many --ours were includedin the hurricane hindcast. The fifth column gives the lowest central pressure inmillibars for the storm. The sixth column shows the highest significant waveheight (in metres) that occurred over the entire grid during the storm. Columnseven indicates those stations which were not affected by the storm, e.g., sta-tions whose maximum wave heights during the selected storm were 1 m or less. Thelast column lists the hurricanes by name, as identified by the NWS.

Table 3
Top Hurricane Damage Estimates (through 1975)
Storm, year Estimate, Billion Dollars
Agnes - 1972 $3.1
Camille - 1969 1.4
Betsy - 1965 1.4
*Diane - 1955 0.8
*Carol - 1954 0.4
Celia - 1970 0.4
Donna - 1960 0.4
*Not included in hindcast
Table 4
Hurricane 7409
Max Wave Ht Period of Max Max Wave Ht Period of MaxStation m Wave, sec Station m Wave, sec
1 3.7 10.0 29 4.0 10.02 4.1 12.5 30 3.5 10.03 3.6 12.5 31 2.7 10.04 3.4 12.5 32 3.2 10.05 3.5 14.3 33 3.2 9.16 3.7 12.5 34 2.7 8.37 3.1 12.5 35 2.5 7.78 3.3 14.3 36 2.0 9.19 3.0 12.5 37 1.8 9.110 3.5 12.5 38 1.5 5.911 2.9 12.5 39 1.4 6.212 3.1 12.5 40 1.3 5.913 2.3 6.2 41 1.5 6.214 2.8 6.7 42 1.7 6.715 4.1 7.7 43 1.2 4.716 4.6 8.3 44 1.3 4.817 7.4 9.1 45 1.2 5.918 4.7 8.3 46 1.7 6.219 8.1 10.0 47 1.8 6.720 10.0 10.0 48 1.6 6.221 10.7 12.5 49 1.6 5.922 8.7 12.5 50 1.7 5.923 7.5 12.5 51 1.6 5.724 6.3 11.1 52 3.4 9.125 5.5 11.1 53 8.3 11.126 4.8 12.5 54 5.8 12.527 4.5 11.1 55 4.3 11.128 4.3 11.1 56 5.7 11.1

Appendix A: Atlantic Hurricane Extremal Statistics
ATLANTIC PHASE 2 STATION 1 (44.24N, 67.71W)HURRICANE WAVE ONLY
UPPER LIMIT HS(M) LOWER LIMIT HS(M)ASSOCIATED ASSOCIATED
RETURN PERIOD (YRS) HS(M) WITH .75 FRACTILE WITH .25 FRACTILE
50 11.6 14.5 9.720 8.3 11.4 7.710 6.9 9.6 6.45 5.7 8.0 5.4
ATLANTIC PHASE 2 STATION 2 (44.28N, 67.02W)HURRICANE WAVES ONLY
UPPER LIMIT HS(M) LOWER LIMIT HS(M)ASSOCIATED ASSOCIATED
RETURN PERIOD (YR,) HS(M) WITH .75 FRACTILE WITH .25 FRACTILE
50 12.2 15.3 10.220 8.7 12.1 8.110 7.3 10.1 6.85 6.0 8.5 5.7
ATLANTIC PHASE 2 STATION 3 (44.32N, 66.32W)HURRICANE WAVES ONLY
UPPER LIMIT HS(M) LOWER LIMIT HS(M)ASSOCIATED ASSOCIATED
RETURN PERIOD (YRS) HS(M) WITH .75 FRACTILE WITH .25 FRACTILE
50 12.1 15.2 10.120 8.6 12.0 8.010 7.1 10.0 6.75 5.9 8.4 5.6
ATLANTIC PHASE 2 STATION 4 (43.64N, 69.02W)HURRICANE WAVES ONLY
UPPER LIMIT HS(M) LOWER LIMIT HS(M)ASSOCIATED ASSOCIATED
RETURN PERIOD (YRS) HS(M) WITH .75 FRACTILE WITH .25 FRACTILE
50 9.8 10.2* 8.120 6.8 9.7 6.310 5.5 8.0 5.25 4.5 6.6 4.3
* Waveheight limited to 0.6 times water depth.
Al

ATLANTIC PHASE 2 STATION 5 (43.69N, 68.33W)HURRICANE WAVES ONLY
UPPER LIMIT HS(M) LOWER LIMIT HS(M)ASSOCIATED ASSOCIATED
RETURN PERIOD (YRS) HS(M) WITH .75 FRACTILE WITH .25 FRACTILE
50 12.1 15.6 9.920 8.3 12.0 7.610 6.7 9.8 6.35 5.4 8.1 5.1
ATLANTIC PHASE 2 STATION 6 (43.74N, 67.65W)HURRICANE WAVES ONLY
UPPER LIMIT HS(M) LOWER LIMIT HS(M)ASSOCIATED ASSOCIATED
RETURN PERIOD (YRS) HS(M) WITH .75 FRACTILE WITH .25 FRACTILE
50 13.4 17.1 11.020 9.3 13.2 8.510 7.6 10.9 7.05 6.2 9.0 5.8
ATLANTIC PHASE 2 STATION 7 (43.79N, 66.96W)HURRICANE WAVES ONLY
UPPER LIMIT HS(M) LOWER LIMIT HS(M)ASSOCIATED ASSOCIATED
RETURN PERIOD (YRS) HS(M) WITH .75 FRACTILE WITH .25 FRACTILE
50 13.4 17.1 11.120 9.4 13.3 8.610 7.7 11.0 7.15 6.3 9.1 5.9
ATLANTIC PHASE 2 STATION 8 (43.03N, 70.31W)HURRICANE WAVES ONLY
UPPER LIMIT HS(M) LOWER LIMIT HS(M)ASSOCIATED ASSOCIATED
RETURN PERIOD (YRS) HS(M) WITH .75 FRACTILE WITH .25 FRACTILE
50 11.3 14.6 9.220 7.5 11.1 7.010 6.0 9.1 5.75 4.8 7.4 4.7
ATLANTIC PHASE 2 STATION 9 (43.09N, 69.63W)HURRICANE WAVES ONLY
UPPER LIMIT HS(M) LOWER LIMIT HS(M)ASSOCIATED ASSOCIATED
RETURN PERIOD (YRS) HS(M) WITH .75 FRACTILE WITH .25 FRACTILE
50 13.3 17.3 10.820 8.9 13.1 8.210 7.1 10.6 6.65 5.7 8.6 5.4
A2

ATLANTIC PHASE 2 STATION 10 (43.15N, 68.95W)
HURRICANE WAVES ONLY
UPPER LIMIT HS(M) LOWER LIMIT 1S(M)ASSOCIATED ASSOCIATED
RETURN PERIOD (YRS) HS(M) WITH .75 FRACTILE WITH .25 FRACTILE
50 12.2 15.7 10.120 8.4 12.1 7.810 6.9 10.0 6.45 5.5 8.2 5.3
ATLANTIC PHASE 2 STATION 11 (43.29N, 66.90W)HURRICANE WAVES ONLY
UPPER LIMIT HS(M) LOWER LIMIT HS(M)ASSOCIATED ASSOCIATED
RETURN PERIOD (YRS) HS(M) WITH .75 FRACTILE WITH .25 FRACTILE
50 14.5 18.5 11.920 10.1 14.3 9.310 8.3 11.8 7.65 6.7 9.8 6.3
ATLANTIC PHASE 2 STATION 12 (43.33N, 66.21W)HURRICANE WAVES ONLY
UPPER LIMIT HS(M) LOWER LIMIT HS(M)ASSOCIATED ASSOCIATED
RETURN PERIOD (YRS) HS(M) WITH .75 FRACTILE WITH .25 FRACTILE
50 15.2 19.8 12.320 10.3 15.0 9.410 8.3 12.2 7.65 6.6 9.9 6.2
ATLANTIC PHASE 2 STATION 13 (42.54N, 70.23W)HURRICANE WAVES ONLY
UPPER LIMIT HS(M) LOWER LIMIT HS(M)ASSOCIATED ASSOCIATED
RETURN PERIOD (YRS) HS(M) WITH .75 FRACTILE WITH .25 FRACTILE
50 11.7 15.1 9.620 7.9 11.6 7.410 6.4 9.5 6.05 5.1 7.8 5.0
ATLANTIC PHASE 2 STATION 14 (42.60N, 69.55W)HURRICANE WAVES ONLY
UPPER LIMIT HS(M) LOWER LIMIT HS(M)ASSOCIATED ASSOCIATED
RETURN PERIOD (YRS) 11S(M) WITH .75 FRACTILE WITH .25 FRACTILE
50 14.0 18.2 11.320 9.4 13.8 8.610 7.5 11.2 7.05 6.0 9.1 5.6
A3

ATLANTIC PHASE 2 STATION 15 (42.83N, 66.16W)HURRICANE WAVES ONLY
UPPER LIMIT HS(M) LOWER LIMIT HS(M)ASSOCIATED ASSOCIATED
RETURN PERIOD (YRS) HS(M) WITH .75 FRACTILE WITH .25 FRACTILE
50 15.5 20.0 12.720 10.6 15.3 9.710 8.6 12.5 -.95 6.9 10.2 6.5
ATLANTIC PHASE 2 STATION 16 (42.11N, 69.48W)HURRICANE WAVES ONLY
UPPER LIMIT HS(M) LOWER LIMIT HS(M)
ASSOCIATED ASSOCIATEDRETURN PERIOD (YRS) HS(M) WITH .75 FRACTILE WITH .25 FRACTILE
50 15.6 20.6 12.520 10.3 15.4 9.410 8.2 12.4 7.65 6.5 10.0 6.1
ATLAN'TIC PHASE 2 STATION 17 (41.61N, 69.40W)HURRICANE WAVES ONLY
UPPER LIMIT HS(M) LOWER LIMIT HS(M)
ASSOCIATED ASSOCIATEDRETURN PERIOD (YRS) HS(M) WITH .75 FRACTILE WITH .25 FRACTILE
50 15.2 20.2 12.220 10.1 15.1 9.110 8.0 12.1 7.3
5 6.3 9.7 5.9
ATLANTIC PHASE 2 STATION 18 (40.88N, 71.96W)HURRICANE WAVES ONLY
UPPER LIMIT HS(M) LOWER LIMIT HS(M)ASSOCIATED ASSOCIATED
RETURN PERIOD (YRS) HS(M) WITH .75 FRACTILE WITH .25 FRACTILE
50 13.1 13.2* 10.420 9.0 13.0 7.710 7.1 10.3 6.1
5 5.5 8.2 4.8
A4

ATLANTIC PHASE 2 STATION 19 (40.94N, 71.30W)HURRICANE WAVES ONLY
UPPER LIMIT HS(M) LOWER LIMIT HS(M)ASSOCIATED ASSOCIATED
RETURN PERIOD (YRS) HS(M) WITH .75 FRACTILE WITH .25 FRACTILE
50 12.9 16.7 10.520 8.7 12.7 8.010 7.0 10.4 6.55 5.6 8.4 5.3
ATLANTIC PHASE 2 STATION 20 (41.01N, 70.65W)HURRICANE WAVES ONLY
UPPER LIMIT HS(M) LOWER LIMIT HS(M)ASSOCIATED ASSOCIATED
RETURN PERIOD (YRS) HS(M) WITH .75 FRACTILE WITH .25 FRACTILE
50 14.1 18.5 11.520 9.5 14.0 8.710 7.7 11.3 7.05 6.1 9.2 5.7
ATLANTIC PHASE 2 STATION 21 (41.06N, 69.99W)HURRICANE WAVES ONLY
UPPER LIMIT HS(M) LOWER LIMIT HS(M)ASSOCIATED ASSOCIATED
RETURN PERIOD (YRS) HS(M) WITH .75 FRACTILE WITH .25 FRACTILE
50 15.2 19.9 12.420 10.3 15.1 9.410 8.3 12.2 7.65 6.6 9.9 6.2
ATLANTIC PHASE 2 STATION 22 (41.12N, 69.33W)HURRICANE WAVES ONLY
UPPER LIMIT HS(M) LOWER LIMIT HS(M)ASSOCIATED ASSOCIATED
RETURN PERIOD (YRS) HS(M) WITH .75 FRACTILE WITH .25 FRACTILE
50 15.0 19.3 12.320 10.4 14.9 9.510 8.5 12.2 7.85 6.9 10.0 6.4
ATLANTIC PHASE 2 STATION 23 (40.17N, 73.82W)HURRICANE WAVES ONLY
UPPER LIMIT HS(M) LOWER LIMIT HS(M)ASSOCIATED ASSOCIATED
RETURN PERIOD (YRS) HS(M) WITH .75 FRACTILE WITH .25 FRACTILE
50 8.1 10.0 6.920 6.3 8.1 5.610 5.3 6.9 4.85 4.4 5.9 4.1
A5
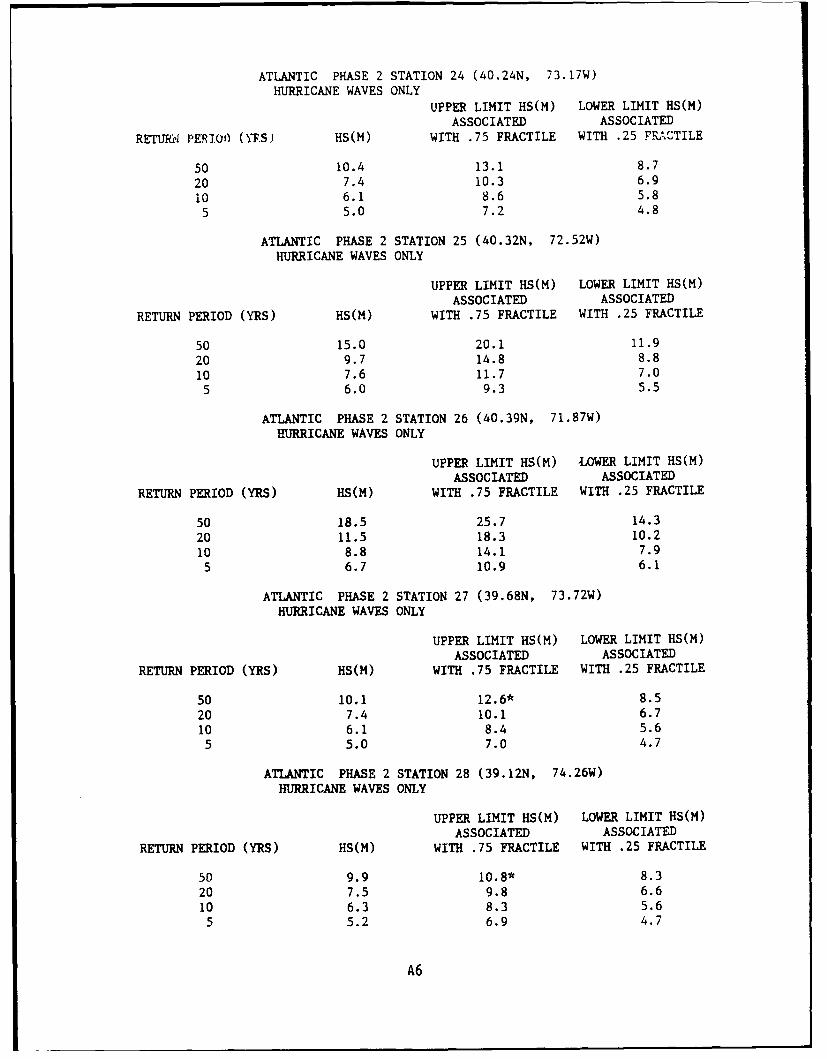
ATLANTIC PHASE 2 STATION 24 (40.24N, 73.17W)
HURRICANE WAVES ONLY
UPPER LIMIT HS(M) LOWER LIMIT HS(M)
ASSOCIATED ASSOCIATED
RETURN PERIOT (YT.S) HS(M) WITH .75 FRACTILE WITH .25 FIRCTILE
50 10.4 13.1 8.7
20 7.4 10.3 6.9
10 6.1 8.6 5.85 5.0 7.2 4.8
ATLANTIC PHASE 2 STATION 25 (40.32N, 72.52W)
HURRICANE WAVES ONLY
UPPER LIMIT HS(M) LOWER LIMIT HS(M)
ASSOCIATED ASSOCIATED
RETURN PERIOD (YRS) HS(M) WITH .75 FRACTILE WITH .25 FRACTILE
50 15.0 20.1 11.9
20 9.7 14.8 8.8
10 7.6 11.7 7.05 6.0 9.3 5.5
ATLANTIC PHASE 2 STATION 26 (40.39N, 71.87W)HURRICANE WAVES ONLY
UPPER LIMIT HS(M) LOWER LIMIT HS(M)
ASSOCIATED ASSOCIATEDRETURN PERIOD (YRS) HS(M) WITH .75 FRACTILE WITH .25 FRACTILE
50 18.5 25.7 14.320 11.5 18.3 10.210 8.8 14.1 7.95 6.7 10.9 6.1
ATLANTIC PHASE 2 STATION 27 (39.68N, 73.72W)HURRICANE WAVES ONLY
UPPER LIMIT HS(M) LOWER LIMIT HS(M)ASSOCIATED ASSOCIATED
RETURN PERIOD (YRS) HS(M) WITH .75 FRACTILE WITH .25 FRACTILE
50 10.1 12.6* 8.5
20 7.4 10.1 6.710 6.1 8.4 5.65 5.0 7.0 4.7
ATLANTIC PHASE 2 STATION 28 (39.12N, 74.26W)HURRICANE WAVES ONLY
UPPER LIMIT HS(M) LOWER LIMIT HS(M)ASSOCIATED ASSOCIATED
RETURN PERIOD (YRS) HS(M) WITH .75 FRACTILE WITH .25 FRACTILE
50 9.9 10.8* 8.320 7.5 9.8 6.610 6.3 8.3 5.65 5.2 6.9 4.7
A6
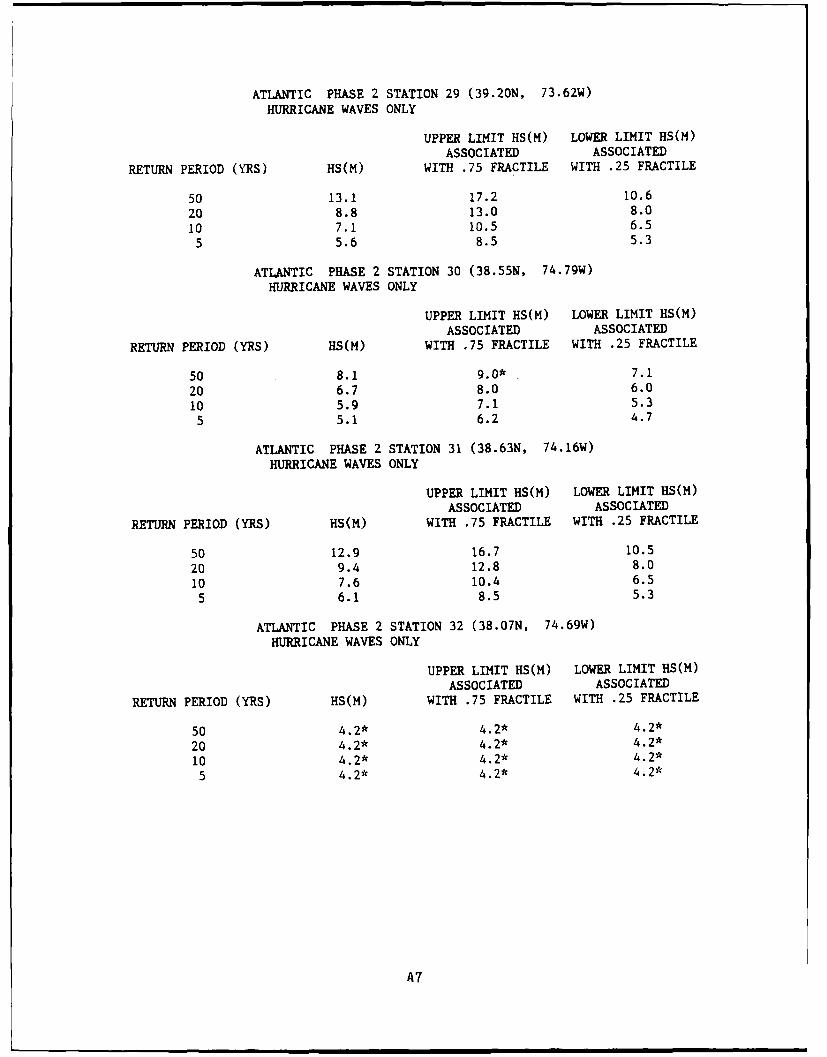
ATLANTIC PHASE 2 STATION 29 (39.20N, 73.62W)HURRICANE WAVES ONLY
UPPER LIMIT HS(M) LOWER LIMIT HS(M)ASSOCIATED ASSOCIATED
RETURN PERIOD (YRS) HS(M) WITH .75 FRACTILE WITH .25 FRACTILE
50 13.1 17.2 10.6
20 8.8 13.0 8.0
10 7.1 10.5 6.5
5 5.6 8.5 5.3
ATLANTIC PHASE 2 STATION 30 (38.55N, 74.79W)HURRICANE WAVES ONLY
UPPER LIMIT HS(M) LOWER LIMIT HS(M)ASSOCIATED ASSOCIATED
RETURN PERIOD (YRS) HS(M) WITH .75 FRACTILE WITH .25 FRACTILE
50 8.1 9.0* 7.120 6.7 8.0 6.010 5.9 7.1 5.3
5 5.1 6.2 4.7
ATLANTIC PHASE 2 STATION 31 (38.63N, 74.16W)HURRICANE WAVES ONLY
UPPER LIMIT HS(M) LOWER LIMIT HS(M)ASSOCIATED ASSOCIATED
RETURN PERIOD (YRS) HS(M) WITH .75 FRACTILE WITH .25 FRACTILE
50 12.9 16.7 10.5
20 9.4 12.8 8.0
10 7.6 10.4 6.55 6.1 8.5 5.3
ATLANTIC PHASE 2 STATION 32 (38.07N, 74.69W)HURRICANE WAVES ONLY
UPPER LIMIT HS(M) LOWER LIMIT HS(M)ASSOCIATED ASSOCIATED
RETURN PERIOD (YRS) HS(M) WITH .75 FRACTILE WITH .25 FRACTILE
50 4.2* 4.2* 4.2*
20 4.2* 4.2* 4.2*
10 4.2* 4.2* 4.2*
5 4.2* 4.2* 4.2*
A7
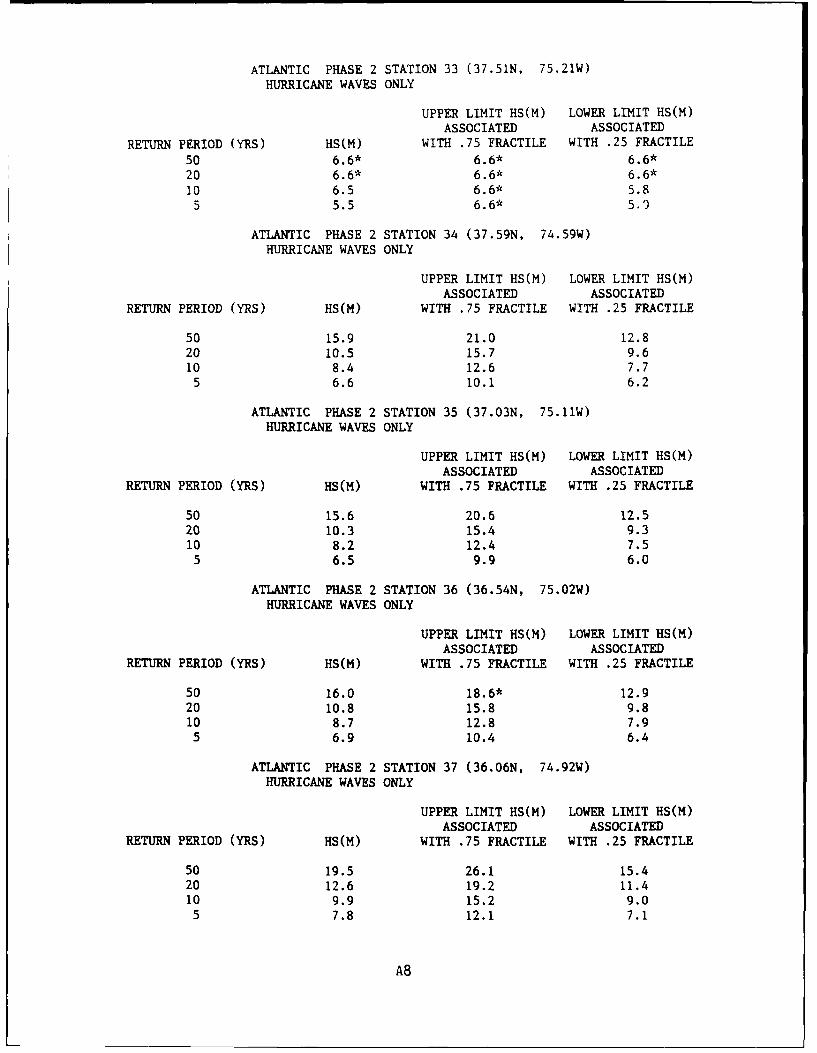
ATLANTIC PHASE 2 STATION 33 (37.51N, 75.21W)HURRICANE WAVES ONLY
UPPER LIMIT HS(M) LOWER LIMIT HS(M)ASSOCIATED ASSOCIATED
RETURN PERIOD (YRS) HS(M) WITH .75 FRACTILE WITH .25 FRACTILE
50 6.6* 6.6* 6.6*20 6.6* 6.6* 6.6*10 6.5 6.6* 5.8
5 5.5 6.6* 5,'
ATLANTIC PHASE 2 STATION 34 (37.59N, 74.59W)HURRICANE WAVES ONLY
UPPER LIMIT HS(M) LOWER LIMIT HS(M)ASSOCIATED ASSOCIATED
RETURN PERIOD (YRS) HS(M) WITH .75 FRACTILE WITH .25 FRACTILE
50 15.9 21.0 12.820 10.5 15.7 9.610 8.4 12.6 7.75 6.6 10.1 6.2
ATLANTIC PHASE 2 STATION 35 (37.03N, 75.11W)HURRICANE WAVES ONLY
UPPER LIMIT HS(M) LOWER LIMIT HS(M)ASSOCIATED ASSOCIATED
RETURN PERIOD (YRS) HS(M) WITH .75 FRACTILE WITH .25 FRACTILE
50 15.6 20.6 12.520 10.3 15.4 9.310 8.2 12.4 7.55 6.5 9.9 6.0
ATLANTIC PHASE 2 STATION 36 (36.54N, 75.02W)HURRICANE WAVES ONLY
UPPER LIMIT HS(M) LOWER LIMIT HS(M)ASSOCIATED ASSOCIATED
RETURN PERIOD (YRS) HS(M) WITH .75 FRACTILE WITH .25 FRACTILE
50 16.0 18.6* 12.920 10.8 15.8 9.810 8.7 12.8 7.95 6.9 10.4 6.4
ATLANTIC PHASE 2 STATION 37 (36.06N, 74.92W)HURRICANE WAVES ONLY
UPPER LIMIT HS(M) LOWER LIMIT HS(M)ASSOCIATED ASSOCIATED
RETURN PERIOD (YRS) HS(M) WITH .75 FRACTILE WITH .25 FRACTILE
50 19.5 26.1 15.420 12.6 19.2 11.410 9.9 15.2 9.05 7.8 12.1 7.1
A8
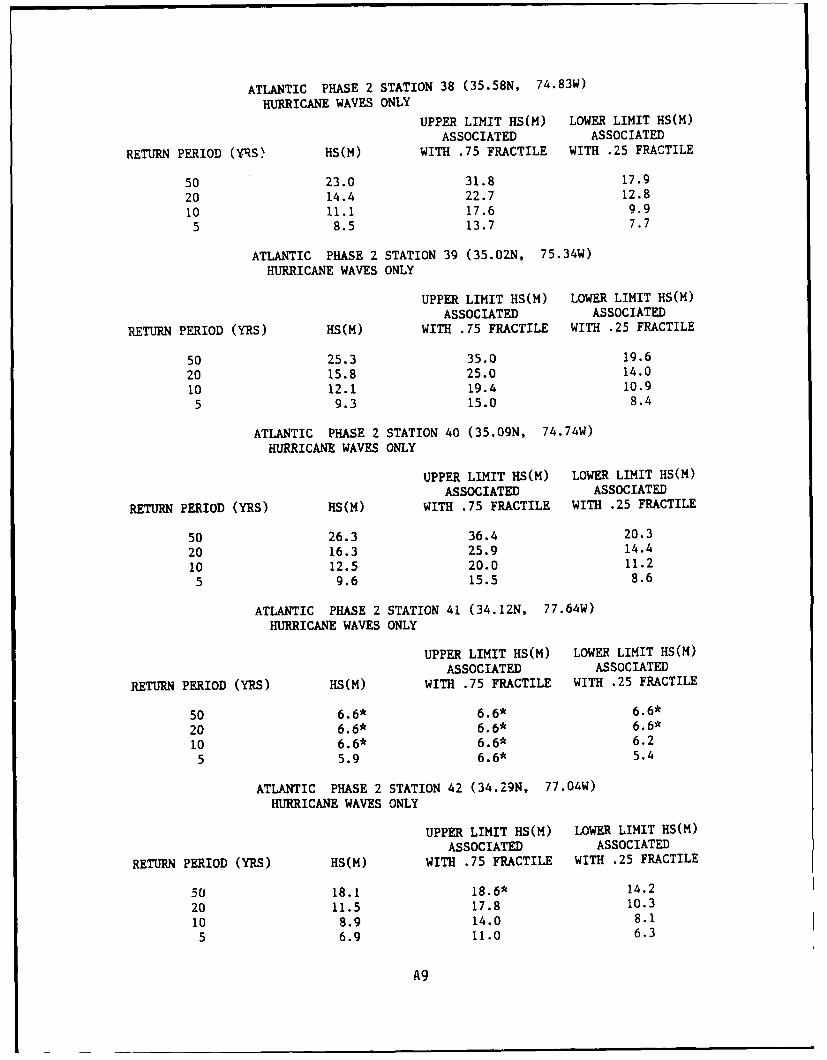
ATLANTIC PHASE 2 STATION 38 (35.58N, 74.83W)
HURRICANE WAVES ONLY
UPPER LIMIT HS(M) LOWER LIMIT HS(M)
ASSOCIATED ASSOCIATED
RETURN PERIOD (YRS) HS(M) WITH .75 FRACTILE WITH .25 FRACTILE
50 23.0 31.8 17.9
20 14.4 22.7 12.8
10 11.1 17.6 9.9
5 8.5 13.7 7.7
ATLANTIC PHASE 2 STATION 39 (35.02N, 75.34W)
HURRICANE WAVES ONLY
UPPER LIMIT HS(M) LOWER LIMIT HS(M)
ASSOCIATED ASSOCIATED
RETURN PERIOD (YRS) HS(M) WITH .75 FRACTILE WITH .25 FRACTILE
50 25.3 35.0 19.6
20 15.8 25.0 14.0
10 12.1 19.4 10.9
5 9.3 15.0 8.4
ATLANTIC PHASE 2 STATION 40 (35.09N, 74.74W)
HURRICANE WAVES ONLY
UPPER LIMIT HS(M) LOWER LIMIT HS(M)
ASSOCIATED ASSOCIATED
RETURN PERIOD (YRS) HS(M) WITH .75 FRACTILE WITH .25 FRACTILE
50 26.3 36.4 20.3
20 16.3 25.9 14.4
10 12.5 20.0 11.2
5 9.6 15.5 8.6
ATLANTIC PHASE 2 STATION 41 (34.12N, 77.64W)HURRICANE WAVES ONLY
UPPER LIMIT HS(M) LOWER LIMIT HS(M)
ASSOCIATED ASSOCIATED
RETURN PERIOD (YRS) HS(M) WITH .75 FRACTILE WITH .25 FRACTILE
50 6.6* 6.6* 6.6*
20 6.6* 6.6* 6.6*
10 6.6* 6.6* 6.2
5 5.9 6.6* 5.4
ATLANTIC PHASE 2 STATION 42 (34.29N, 77.04W)HURRICANE WAVES ONLY
UPPER LIMIT HS(M) LOWER LIMIT HS(M)
ASSOCIATED ASSOCIATED
RETURN PERIOD (YRS) HS(M) WITH .75 FRACTILE WITH .25 FRACTILE
50 18.1 18.6* 14.2
20 11.5 17.8 10.3
10 8.9 14.0 8.1
5 6.9 11.0 6.3
A9

ATLANTIC PHASE 2 STATION 43 (34.38N, 76.45W)HURRICANE WAVES ONLY
UPPER LIMIT HS(M) LOWER LIMIT HS(M)ASSOCIATED ASSOCIATEDI
RETURN PERIOD (YRS) HS(M) WITH .75 FRACTILE WITH .25 FRACTILE
50 19.2 24.0* 15.220 12.3 19.0 11.110 9.6 15.0 8.75 7.5 11.8 6.9
ATLANTIC PHASE 2 STATION 44 (34.46N, 75.85W)HURRICANE WAVES ONLY
UPPER LIMIT HS(M) LOWER LIMIT HS(M)ASSOCIATED ASSOCIATEDRETURN PERIOD (YRS) HS(M) WITH .75 FRACTILE WITH .25 FRACTILE
50 24.9 34.2 19.420 15.6 24.6 13.910 12.1 19.1 10.85 9.3 14.9 8.4
ATLANTIC PHASE 2 STATION 45 (34.54N, 75.25W)HURRICANE WAVES ONLY
UPPER LIMIT HS(M) LOWER LIMIT HS(M)ASSOCIATED ASSOCIATEDRETURN PERIOD (YRS) iS(M) WITH .75 FRACTILE WITH .25 FRACTILE
50 23.6 31.9 18.720 15.2 23.4 13.710 12.0 18.4 10.85 9.3 14.6 8.5
ATLANTIC PHASE 2 STATION 46 (33.55N, 78.72W)HURRICANE WAVES ONLY
UPPER LIMIT HS(M) LOWER LIMIT HS(M)ASSOCIATED ASSOCIATED
RETURN PERIOD (YRS) HS(M) WITH .75 FRACTILE WITH .25 FRACTILE
50 5.4* 5.4* 5.4*20 5.4* 5.4* 5.4*10 5.4* 5.4* 5.35 5.1 5.4* 4.6
A1O

ATLANTIC PHASE 2 STATION 47 (33.64N, 78.13W)
HURRICANE WAVES ONLY
UPPER LIMIT HS(M) LOWER LIMIT HS(M)
ASSOCIATED ASSOCIATED
RETURN PERIOD (YRS) HS(M) WITH .75 FRACTILE WITH .25 FRACTILE
50 15.6* 15.6* 13.0
20 11.4 15.6* 9.5
10 8.9 12.8 7.5
5 6.9 10.1 5.9
ATLANTIC PHASE 2 STATION 48 (33.73N, 77.54W)
HURRICANE WAVES ONLY
UPPER LIMIT HS(M) LOWER LIMIT HS(M)ASSOCIATED ASSOCIATED
RETURN PERIOD (YRS) HS(M) WITH .75 FRACTILE WITH .25 FRACTILE
50 21.1 29.3 16.3
20 13.0 20.8 11.6
10 10.0 16.1 9.0
5 7.6 12.4 6.9
ATLANTIC PHASE 2 STATION 49 (33.08N, 78.62W)HURRICANE WAVES ONLY
UPPER LIMIT HS(M) LOWER LIMIT HS(M)ASSOCIATED ASSOCIATED
RETURN PERIOD (YRS) HS(M) WITH .75 FRACTILE WITH .25 FRACTILE
50 13.2* 13.2* 13.2*
20 12.6 13.2* 9.8
10 9.7 13.2* 7.6
5 7.4 10.5 5.9
ATLANTIC PHASE 2 STATION 50 (32.33N, 80.26W)
HURRICANE WAVES ONLY
UPPER LIMIT HS(M) LOWER LIMIT HS(M)
ASSOCIATED ASSOCIATED
RETURN PERIOD (YRS) HS(M) WITH .75 FRACTILE WITH .25 FRACTILE
50 5.4* 5.4* 5.4*
20 5.4* 5.4* 5.4*
10 5.4* 5.4* 5.3
5 5.4 5.4* 4.6
ATLANTIC PHASE 2 STATION 51 (32.42N, 79.68W)HURRICANE WAVES ONLY
UPPER LIMIT HS(M) LOWER LIMIT HS(M)
ASSOCIATED ASSOCIATED
RETURN PERIOD (YRS) HS(M) WITH .75 FRACTILE WITH .25 FRACTILE
50 12.4 12.6* 10.2
20 9.5 12.2 7.9
10 7.8 10.1 6.5
5 6.4 8.3 5.4
All

ATLANTIC PHASE 2 STATION 52 (32.51N, 79.10W)HURRICANE WAVES ONLY
UPPER LIMIT HS(M) LOWER LIMIT HS(M)ASSOCIATED ASSOCIATED
RETURN PZRIOD (YRS) HS(M) WITH .75 FRACTILE WITH .25 FRACTILE
50 21.5 29.6 16.720 13.3 21.2 11.910 10.2 16.4 9.35 7.8 12.8 7.2
ATLANTIC PHASE 2 STATION 53 (32.60N, 78.51W)HURRICANE WAVES ONLY
UPPER LIMIT HS(M) LOWER LIMIT HS(M)
ASSOCIATED ASSOCIATEDRETURN PERIOD (YRS) HS(M) WITH .75 FRACTILE WITH .25 FRACTILE
50 26.2 37.5 19.720 15.4 25.8 13.510 11.5 19.4 10.25 8.5 14.6 7.7
ATLANTIC PHASE 2 STATION 54 (31.86N, 80.15W)HURRICANE WAVES ONLY
UPPER LIMIT HS(M) LOWER LIMIT HS(M)
ASSOCIATED ASSOCIATEDRETURN PERIOD (YRS) HS(M) WITH .75 FRACTILE WITH .25 FRACTILE
50 13.2* 13.2* 12.420 11.4 13.2* 9.210 9.0 12.3 7.35 7.0 9.8 5.8
ATLANTIC PHASE 2 STATION 55 (31.29N, 80.62W)HURRICANE WAVES ONLY
UPPER LIMIT HS(M) LOWER LIMIT HS(M)
ASSOCIATED ASSOCIATEDRETURN PERIOD (YRS) HS(M) WITH .75 FRACTILE WITH .25 FRACTILE
50 14.4* 14.4* 13.320 12.1 14.4* 9.410 9.2 13.1. 7.25 6.9 10.1 5.6
ATLANTIC PHASE 2 STATION 56 (31.39N, 80.01W)HURRICANE WAVES ONLY
UPPER LIMIT HS(M) LOWER LIMIT HS(M)
ASSOCIATED ASSOCIATEDRETURN PERIOD (YRS) HS(M) WITH .75 FRACTILE WITH .25 FRACTILE
50 21.1 22.2* 16.120 14.6 20.8 11.310 11.0 15.9 8.65 8.3 12.1 6.6
A12

ATLANTIC PHASE 2 STATION 57 (30.73N, 81.08W)HURRICANE WAVES ONLY
UPPER LIMIT HS(M) LOWER LIMIT HS(M)ASSOCIATED ASSOCIATED
RETURN PERIOD (YRS) HS(M) WITH .75 FRACTILE WITH .25 FRACTILE
50 4.2* 4.2* 4.2*20 4.2* 4.2* 4.2*10 4.2* 4.2* 4.2*
5 4.2* 4.2* 4.2*
ATLANTIC PHASE 2 STATION 58 (30.82N, 80.51W)HURRICANE WAVES ONLY
UPPER LIMIT HS(M) LOWER LIMIT HS(M)ASSOCIATED ASSOCIATED
RETURN PERIOD (YRS) HS(M) WITH .75 FRACTILE WITH .25 FRACTILE
50 13.2* 13.2* 13.2*
20 13.0 13.2* 10.1
10 9.9 13.2* 7.75 7.5 10.8 6.0
ATLANTIC PHASE 2 STATION 59 (30.26N, 80.98W)HURRICANE WAVES ONLY
UPPER LIMIT HS(M) LOWER LIMIT HS(M)ASSOCIATED ASSOCIATED
RETURN PERIOD (YRS) HS(M) WITH .75 FRACTILE WITH .25 FRACTILE
50 16.8* 16.8* 14.220 12.7 16.8* 9.810 9.5 13.9 7.45 7.0 10.6 5.6
ATLANTIC PHASE 2 STATION 60 (29.79N, 80.88W)
HURRICANE WAVES ONLY
UPPER LIMIT HS(M) LOWER LIMIT HS(M)ASSOCIATED ASSOCIATED
RETURN PERIOD (YRS) HS(M) WITH .75 FRACTILE WITH .25 FRACTILE
50 18.5 18.6* 14.420 13.2 18.3 i0.410 10.2 14.2 8.1
5 7.8 11.1 6.3
A13

ATLANTIC PHASE 2 STATION 61 (29.89N, 80.31W)HURRICANE WAVES ONLY
UPPER LIMIT HS(M) LOWER LIMIT HS(M)ASSOCIATED ASSOCIATED
RETURN PERIOD (YRS) HS(M) WITH .75 FRACTILE WITH .25 FRACTILE
50 25.4 27.6* 19.220 15.6 25.0 13.210 11.7 18.9 10.05 8.6 14.3 7.5
ATLANTIC PHASE 2 STATION 62 (29.42N, 80.21W)HURRICANE WAVES ONLY
UPPER LIMIT HS(M) LOWER LIMIT HS(M)ASSOCIATED ASSOCIATED
RETURN PERIOD (YRS) HS(M) WITH .75 FRACTILE WITH .25 FRACTILE
50 18.6* 18.6* 15.020 13.5 18.6* 10.310 10.0 14.7 7.75 7.4 11.1 5.8
ATLANTIC PHASE 2 STATION 63 (28.95N, 80.11W)HURRICANE WAVES ONLY
UPPER LIMIT HS(M) LOWER LIMIT HS(M)ASSOCIATED ASSOCIATED
RETURN PERIOD (YRS) HS(M) WITH .75 FRACTILE WITH .25 FRACTILE
50 5.4* 5.4* 5.4*20 5.4* 5.4* 5.4*10 5.4* 5.4* 5.35 5.1 5.4* 4.4
ATLANTIC PHASE 2 STATION 64 (28.48N, 80.02W)HURRICANE WAVES ONLY
UPPER LIMIT HS(M) LOWER LIMIT HS(M)ASSOCIATED ASSOCIATED
RETURN PERIOD (YRS) HS(M) WITH .75 FRACTILE WITH .25 FRACTILE
50 7.2* 7.2* 7.2*20 7.2* 7.2* 7.210 7.1 7.2* 6.05 5.9 7.2* 5.0
ATLANTIC PHASE 2 STATION 65 (28.01N, 79.93W)HURRICANE WAVES ONLY
UPPER LIMIT HS(M) LOWER LIMIT HS(M)ASSOCIATED ASSOCIATED
RETURN PERIOD (YRS) HS(M) WITH .75 FRACTILE WITH .25 FRACTILE
50 2.4* 2.4* 2.4*20 2.4* 2.4* 2.4*10 2.4* 2.4* 2.4*5 2.4* 2.4* 2.4*
A14

ATLANTIC PHASE 2 STATION 66 (27.54N, 79.84W)HURRICANE WAVES ONLY
UPPER LIMIT HS(M) LOWER LIMIT HS(M)ASSOCIATED ASSOCIATED
RETIFAN PERIOD (YRS) HS(M) WITH .75 FRACTILE WITH .25 FRACTILE
50 4.2* 4.2* 4.2*
20 4.2* 4.2* 4.2*
10 4.2* 4.2* 4.2*
5 4.2* 4.2* 4.1
ATLANTIC PHASE 2 STATION 67 (27.07N, 79.75W)HURRICANE WAVES ONLY
UPPER LIMIT HS(M) LOWER LIMIT HS(M)
ASSOCIATED ASSOCIATED
RETURN PERIOD (YRS) HS(M) WITH .75 FRACTILE WITH .25 FRACTILE
50 6.0* 6.0* 6.0*
20 6.0* 6.0* 6.0*
10 6.0* 6.0* 5.1
5 5.1 6.0* 4.3
ATLANTIC PHASE 2 STATION 68 (27.15N, 79.20W)HURRICANE WAVES ONLY
UPPER LIMIT HS(M) LOWER LIMIT HS(M)
ASSOCIATED ASSOCIATED
RETURN PERIOD (YRS) HS(M) WITH .75 FRACTILE WITH .25 FRACTILE
50 18.2 26.2 13.6
20 12.1 17.9 9.3
10 8.9 13.4 7.0
5 6.5 10.0 5.2
ATLANTIC PHASE 2 STATION 69 (27.23N, 78.64W)HURRICANE WAVES ONLY
UPPER LIMIT HS(M) LOWER LIMIT HS(M)
ASSOCIATED ASSOCIATED
RETURN PERIOD (YRS) HS(M) WITH .75 FRACTILE WITH .25 FRACTILE
50 21.1 31.6 15.3
20 12.8 20.7 10.1
10 9.1 15.1 7.3
5 6.3 11.0 5.3
ATLANTIC PHASE 2 STATION 70 (26.60N, 79.67W)HURRICANE WAVES ONLY
UPPER LIMIT HS(M) LOWER LIMIT HS(M)
ASSOCIATED ASSOCIATED
RETURN PERIOD (YRS) HS(M) WITH .75 FRACTILE WITH .25 FRACTILE
50 13.3 17.7 10.7
20 9.7 13.2 7.9
10 7.7 10.5 6.3
5 6.0 8.4 5.1
A15

ATLANTIC PHASE 2 STATION 71 (26.13N, 79.58W)HURRICANE WAVES ONLY
UPPER LIMIT HS(M) LOWER LIMIT HS(M)ASSOCIATED ASSOCIATED
RETURN PERIOD (YRS) HS(M) WITH .75 FRACTILE WITH .25 FRACTILE
50 14.2 19.0 11.220 10.2 14.0 8.3iC 7.9 11.1 6.65 6.1 8.8 5.2
ATLANTIC PHASE 2 STATION 72 (26.20N, 79.03W)HURRICANE WAVES ONLY
UPPER LIMIT HS(M) LOWER LIMIT HS(M)ASSOCIATED ASSOCIATED
RETURN PERIOD (YRS) HS(M) WITH .75 FRACTILE WITH .25 FRACTILE
50 13.1 18.6 9.920 10.7 12.9 6.910 8.0 9.8 5.25 5.9 7.4 4.0
ATLANTIC PHASE 2 STATION 73 (25.66N, 79.50W)
HURRICANE WAVES ONLY
UPPER LIMIT HS(M) LOWER LIMIT HS(M)ASSOCIATED ASSOCIATED
RETURN PERIOD (YRS) HS(M) WITH .75 FRACTILE WITH .25 FRACTILE
50 17.4 25.7 12.720 13.7 17.1 8.510 9.9 12.5 6.25 7.1 9.2 4.6
A16

Appendix B: Gulf of Mexico Hurricane Extremal Statistics
GULF STATION 1 (22.0 N, 96.0 W)
UPPER LIMIT HS(M) LOWER LIMIT HS(M)ASSOCIATED ASSOCIATED
RETURN PERIOD (YRS) HS(M) WITH .75 FRACTILE WITH .25 FRACTILE
50 19.7 28.7 14.620 12.6 19.3 9.8
10 9.2 14.4 7.3
5 6.7 10.7 5.4
GULF STATION 2 (26.0 N, 97.0 W)
UPPER LIMIT HS(M) LOWER LIMIT HS(M)ASSOCIATED ASSOCIATED
RETURN PERIOD (YRS) HS(M) WITH .75 FRACTILE WITH .25 FRACTILE
50 15.6* 15.6* 13.5
20 10.7 15.6* 9.5
10 8.1 13.4 7.2
5 6.0 10.2 5.5
GULF STATION 3 (26.5 N, 97.0 W)
UPPER LIMIT HS(M) LOWER LIMIT HS(M)ASSOCIATED ASSOCIATED
RETURN PERIOD (YRS) HS(M) WITH .75 FRACTILE WITH .25 FRACTILE
50 16.0 21.0* 12.3
20 9.9 15.8 8.7
10 7.5 12.2 6.75 5.6 9.4 5.2
GULF STATION 4 (27.0 N, 97.0 W)
UPPER LIMIT HS(M) LOWER LIMIT HS(M)ASSOCIATED ASSOCIATED
RETURN PERIOD (YRS) HS(M) WITH .75 FRACTILE WITH .25 FRkCTILE
50 14.6 20.2 11.3
20 9.1 14.4 8.1
10 6.9 11.2 6.3
5 5.2 8.6 4.8
* Waveheight limited to 0.6 times water depth.
BI

GULF STATION 5 (27.5 N, 97.0 W)
UPPER LIMIT HS(M) LOWER LIMIT HS(M)ASSOCIATED ASSOCIATED
RETURN PERIOD (YRS) HS(M) WITH .75 FRACTILE WITH .25 FRACTILE50 12.7 15.6* 10.120 8.3 12.5 7.510 6.5 10.0 6.05 5.0 8.0 4.7
GULF STATION 6 (27.5 N, 96.5 W)
UPPER LIMIT HS(M) LOWER LIMIT HS(M)ASSOCIATED ASSOCIATED
RETURN PERIOD (YRS) HS(M) WITH .75 FRACTILE WITH .25 FRACTILE
50 18.9 27.3 14.220 11.0 18.7 9.710 8.1 14.0 7.25 5.8 10.5 5.4
GULF STATION 7 (28.0 N, 96.5 W)
UPPER LIMIT HS(M) LOWER LIMIT HS(M)ASSOCIATED ASSOCIATED
RETURN PERIOD (YRS) HS(M) WITH .75 FRACTILE WITH .25 FRACTILE
50 14.4 15.6* 11.120 8.9 14.2 7.810 6.7 10.9 6.05 4.9 8.4 4.6
GULF STATION 8 (28.0 N, 96.0 W)
UPPER LIMIT HS(M) LOWER LIMIT HS(M)ASSOCIATED ASSOCIATED
RETURN PERIOD (YRS) HS(M) WITH .75 FRACTILE WITH .25 FRACTILE
50 20.8 26.4* 15.220 11.8 20.5 10.110 8.5 15.0 7.45 5.9 11.0 5.4
GULF STATION 9 (28.5 N, 95.5 W)
UPPER LIMIT HS(M) LOWER LIMIT HS(M)ASSOCIATED ASSOCIATEDRETURN PERIOD (YRS) HS(M) WITH .75 FRACTILE WITH .25 FRACTILE
50 14.7 15.6* 11.320 9.1 14.3 8.010 6.9 11.1 6.15 5.1 8.6 4.7
B2

GULF STATION 10 ( 28.5 N, 95.0 W)UPPER LIMIT HS(M) LOWER LIMIT HS(M)
ASSOCIATED ASSOCIATED
RETURN PERIOD (YRS) HS(M) WITH .75 FRACTILE WITH .25 FRACTILE
50 17.2 19.8* 13.2
20 10.7 16.9 9.4
10 8.1 13.1 7.25 6.0 10.1 5.6
GULF STATION 11 ( 29.0 N, 94.5 W)
UPPER LIMIT HS(M) LOWER LIMIT HS(M)ASSOCIATED ASSOCIATED
RETURN PERIOD (YRS) HS(M) WITH .75 FRACTILE WITH .25 FRACTILE
50 10.8* 10.8* 9.2
20 8.2 10.8* 7.2
10 6.8 9.1 6.0
5 5.5 7.6 5.0
GULF STATION 12 ( 29.0 N, 94.0 W)
UPPER LIMIT HS(M) LOWER LIMIT HS(M)ASSOCIATED ASSOCIATED
RETURN PERIOD (YRS) HS(M) WITH .75 FRACTILE WITH .25 FRACTILE
50 12.0* 12.0* 12.0
20 9.7 12.0* 8.6
10 7.4 11.8 6.75 5.5 9.2 5.2
GULF STATION 13 ( 29.5 N, 93.5 W)
UPPER LIMIT HS(M) LOWER LIMIT HS(M)ASSOCIATED ASSOCIATED
RETURN PERIOD (YRS) HS(M) WITH .75 FRACTILE WITH .25 FRACTILE
50 5.4* 5.4* 5.4*
20 5.4* 5.4* 5.4*
10 5.2 5.4* 4.7
5 4.1 5.4* 3.9
GULF STATION 14 (29.5 N, 93.0 W)
UPPER LIMIT HS(M) LOWER LIMIT HS(M)
ASSOCIATED ASSOCIATED
RETURN PERIOD (YRS) HS(M) WITH .75 FRACTILE WITH .25 FRACTILE
50 7.8* 7.8* 7.8*
20 6.9 7.8* 5.9
10 5.2 7.8* 4.6
5 3.8 6.3 3.6
B3

GULF STATION 15 ( 29.0 N, 92.5 W)
UPPER LIMIT HS(M) LOWER LIMIT HS(M)
ASSOCIATED ASSOCIATED
RETURN PERIOD (YRS) HS(M) WITH .75 FRACTILE WITH .25 FRACTILE
50 13.5 14.4* 10.6
20 8.6 13.3 7.7
10 6.7 10.5 6.0
5 5.0 8.2 4.7
GULF STATION 16 (29.0 N, 92.0 W)
UPPER LIMIT HS(M) LOWER LIMIT HS(M)ASSOCIATED ASSOCIATED
RETURN PERIOD (YRS) HS(M) WITH .75 FRACTILE WITH .25 FRACTILE
50 8.4 9.6* 7.3
20 6.4 8.3 6.1
10 5.6 7.3 5.3
5 4.7 6.3 4.6
GULF STATION 17 (29.0 N, 91.5 W)
UPPER LIMIT HS(M) LOWER LIMIT HS(M)ASSOCIATED ASSOCIATED
RETURN PERIOD (YRS) HS(M) WITH .75 FRACTILE WITH .25 FRACTILE
50 5.4* 5.4* 5.4*
20 5.4* 5.4* 5.4*
10 5.4* 5.4* 5-4*
5 5.4* 5.4* 5.4*
GULF STATION 18 (28.5 N, 91.5 W)
UPPER LIMIT HS(M) LOWER LIMIT HS(M)ASSOCIATED ASSOCIATED
RETURN PERIOD (YRS) HS(M) WITH .75 FRACTILE WITH .25 FRACTILE
50 6.5 7.3 5.9
20 5.3 6.4 5.1
10 4.7 5.8 4.7
5 4.2 5.3 4.2
B4

GULF STATION 19 (28.5 N, 91.0 W)
UPPER LIMIT HS(M) LOWER LIMIT HS(M)ASSOCIATED ASSOCIATED
RETURN PERIOD (YRS) HS(M) WITH .75 FRACTILE WITH .25 FRACTILE50 15.5 19.8* 12.420 10.0 15.3 9.210 7.9 12.3 7.45 6.1 9.8 sc.
GULF STATION 20 (28.5 N, 90.5 W)
UPPER LIMIT HS(M) LOWER LIMIT HS(M)ASSOCIATED ASSOCIATED
RETURN PERIOD (YRS) HS(M) WITH .75 FRACTILE WITIT .25 FRACTILE
50 14.5 18.6 11.820 9.8 14.3 9.110 7.9 11.7 7.45 6.3 9.6 6.1
GULF STATION 21 (28.5 N, 90.0 W)
UPPER LIMIT HS(M) LOWER LIMIT HS(M)ASSOCIATED ASSOCIATED
RETURN PERIOD (YRS) HS(M) WITH .75 FRACTILE WITH .25 FRACTILE
50 15.4 19.6 12.720 10.5 15.2 9.810 8.6 12.5 8.15 6.9 10.3 6.7
GULF STATION 22 (28.5 N, 89.5 W)
UPPER LIMIT HS(M) LOWER LIMIT HS(M)ASSOCIATED ASSOCIATED
RETURN PERIOD (YRS) HS(M) WITH .75 FRACTILE WITH .25 FRACTILE
50 18.5 24.6 14.820 11.9 18.3 11.010 9.4 14.6 8.75 7.3 11.6 7.0
GULF STATION 23 (28.5 N, 89.0 W)
UPPER LIMIT HS(M) LOWER LIMIT HS(M)ASSOCIATED ASSOCIATED
RETURN PERIOD (YRS) HS(M) WITH .75 FRACTILE WITH .25 FRACTILE
50 29.1 42.3 21.620 16.4 28.6 14.610 12.0 21.3 10.85 8.6 15.8 8.1
B5

GULF STATION 24 (29.0 N, 88.5 W)UPPER LIMIT HS(M) LOWER LIMIT HS(M)
ASSOCIATED ASSOCIATEDRETURN PERIOD (YRS) HS(M) WITH .75 FRACTILE WITH .25 FRACTILE
50 32.0 48.1 23.220 17.1 31.4 15.110 12.2 22.8 11.05 8.5 16.5 7.9
GULF STATION 25 (29.5 N, 88.5 W)
UPPER LIMIT HS(M) LOWER LIMIT HS(M)ASSOCIATED ASSOCIATED
RETURN PERIOD (YRS) HS(M) WITH .75 FRACTILE WITH .25 FRACTILE
50 23.5 30.6* 17.720 13.4 23.2 12.110 9.8 17.4 9.15 7.1 13.0 6.8
GULF STATION 26 (30.0 N, 88.5 W)
UPPER LIMIT HS(M) LOWER LIMIT HS(M)ASSOCIATED ASSOCIATED
RETURN PERIOD (YRS) HS(M) WITH .75 FRACTILE WITH .25 FRACTILE
50 15.6* 15.6* 12.420 9.8 15.6 9.010 7.5 12.2 7.05 5.7 9.6 5.5
GULF STATION 27 (30.0 N, 88.0 W)
UPPER LIMIT HS(M) LOWER LIMIT HS(M)ASSOCIATED ASSOCIATED
RETURN PERIOD (YRS) HS(M) WITH .75 FRACTILE WITH .25 FRACTILE
50 14.1 15.6* 11.320 9.1 13.9 8.410 7.2 11.2 6.75 5.6 8.9 5.4
GULF STATION 28 (30.0 N, 87.5 W)
UPPER LIMIT HS(M) LOWER LIMIT HS(M)ASSOCIATED ASSOCIATED
RETURN PERIOD (YRS) HS(M) WITH .75 FRACTILE WITH .25 FRACTILE
50 13.3 14.4* 10.720 8.8 13.1 8.110 7.0 10.6 6.65 5.5 8.6 5.3
B6

GULF STATION 29 (30.0 N, 87.0 W)
UPPER LIMIT HS(M) LOWER LIMIT HS(M)ASSOCIATED ASSOCIATED
RETURN PERIOD (YRS) HS(M) WITH .75 FRACTILE WITH .25 FRACTILE
50 15.7 21.5 12.320 9.7 15.5 8.910 7.4 12.1 6.95 5.6 9.5 5.4
GULF STATION 30 (30.0 N, 86.5 W)
UPPER LIMIT HS(M) LOWER LIMIT HS(M)ASSOCIATED ASSOCIATED
RETURN PERIOD (YRS) HS(M) WITH .75 FRACTILE WITH .25 FRACTILE
50 16.1 22.5 12.320 9.5 15.9 8.710 7.1 12.2 6.75 5.3 9.3 5.1
GULF STATION 31 (30.0 N, 86.0 W)
UPPER LIMIT HS(M) LOWER LIMIT HS(M)ASSOCIATED ASSOCIATED
RETURN PERIOD (YRS) HS(M) WITH .75 FRACTILE WITH .25 FRACTILE
50 14.7 18.6* 10.920 7.8 14.5 7.310 5.5 10.7 5.45 3.7 7.9 4.0
GULF STATION 32 (29.5 N, 86.0 W)
UPPER LIMIT HS(M) LOWER LIMIT HS(M)ASSOCIATED ASSOCIATED
RETURN PERIOD (YRS) HS(M) WITH .75 FRACTILE WITH .25 FRACTILE
50 14.3 19.5 11.220 8.8 14.1 8.110 6.7 11.0 6.35 5.1 8.6 4.9
B7

GULF STATION 33 (29.0 N, 85.5 W)
UPPER LIMIT HS(M) LOWER LIMIT HS(M)ASSOCIATED ASSOCIATED
RETURN PERIOD (YRS) HS(M) WITH .75 FRACTILE WITH .25 FRACTILE50 13.1 17.3 10.620 8.6 13.0 8.010 6.9 10.5 6.45 5.4 8.5 5.2
GULF STATION 34 (29.0 N, 85.0 W)
UPPER LIMIT HS(M) LOWER LIMIT HS(M)ASSOCIATED ASSOCIATED
RETURN PERIOD (YRS) HS(M) WITH .75 FRACTILE WITH .25 FRACTILE
50 10.5 12.7 9.020 7.7 10.4 7.310 6.5 8.9 6.25 5.4 7.6 5.3
GULF STATION 35 (29.5 N, 84.5 W)
UPPER LIMIT HS(M) LOWER LIMIT HS(M)ASSOCIATED ASSOCIATED
RETURN PERIOD (YRS) HS(M) WITH .75 FRACTILE WITH .25 FRACTILE
50 7.6 8.8 6.820 6.0 7.6 5.810 5.3 6.8 5.25 4.6 6.0 4.6
GULF STATION 36 (29.5 N, 84.0 W)
UPPER LIMIT HS(M) LOWER LIMIT HS(M)ASSOCIATED ASSOCIATED
RETURN PERIOD (YRS) HS(M) WITH .75 FRACTILE WITH .25 FRACTILE
50 9.5 10.8* 7.620 5.7 9.4 5.610 4.3 7.5 4.55 3.0 6.0 3.6
GULF STATION 37 (29.0 N, 83.5 W)
UPPER LIMIT HS(M) LOWER LIMIT HS(M)ASSOCIATED ASSOCIATED
RETURN PERIOD (YRS) HS(M) WITH .75 FRACTILE WITH .25 FRACTILE
50 6.2 7.4 5.420 4.6 6.2 4.513 3.9 5.3 3.95 3.2 4.6 3.4
B8

GULF STATION 41 (27.0 N, 83.0 W)UPPER LIMIT HS(M) LOWER LIMIT HS(M)
ASSOCIATED ASSOCIATED
RETURN PERIOD (YRS) HS(M) WITH .75 FRACTILE WITH .25 FRACTILE
50 7.9 9.4 7.0
20 6.1 7.9 5.9
10 5.3 6.9 5.2
5 4.4 6.1 4.5
GULF STATION 44 (25.5 N, 82.0 W)
UPPER LIMIT HS(M) LOWER LIMIT HS(M)ASSOCIATED ASSOCIATED
RETURN PERIOD (YRS) HS(M) WITH .75 FRACTILE WITH .25 FRACTILE
50 9.6* 9.6* 8.3
20 8.9 9.6* 6.1
10 6.9 8.2 4.8
5 5.2 6.5 3.7
GULF STATION 45 (25.0 N, 82.0 W)
UPPER LIMIT HS(M) LOWER LIMIT HS(M)
ASSOCIATED ASSOCIATED
RETURN PERIOD (YRS) HS(M) WITH .75 FRACTILE WITH .25 FRACTILE
50 12.0* 12.0* 9.9
20 10.7 12.0* 6.9
10 8.0 9.8 5.2
5 5.8 7.4 4.0
GULF STATION 46 (25.0 N, 83.0 W)
UPPER LIMIT HS(M) LOWER LIMIT HS(M)
ASSOCIATED ASSOCIATED
RETURN PERIOD (YRS) HS(M) WITH .75 FRACTILE WITH .25 FRACTILE
50 15.1 21.0 11.6
20 11.5 14.8 8.2
10 8.7 11.4 6.3
5 6.4 8.8 4.8
GULF STATION 47 (24.5 N, 83.0 W)
UPPER LIMIT HS(M) LOWER LIMIT HS(M)
ASSOCIATED ASSOCIATED
RETURN PERIOD (YRS) HS(M) WITH .75 FRACTILE WITH .25 FRACTILE
50 12.8 16.2* 10.1
20 9.8 12.6 7.3
10 7.7 9.9 5.8
5 5.9 7.8 4.6
B9
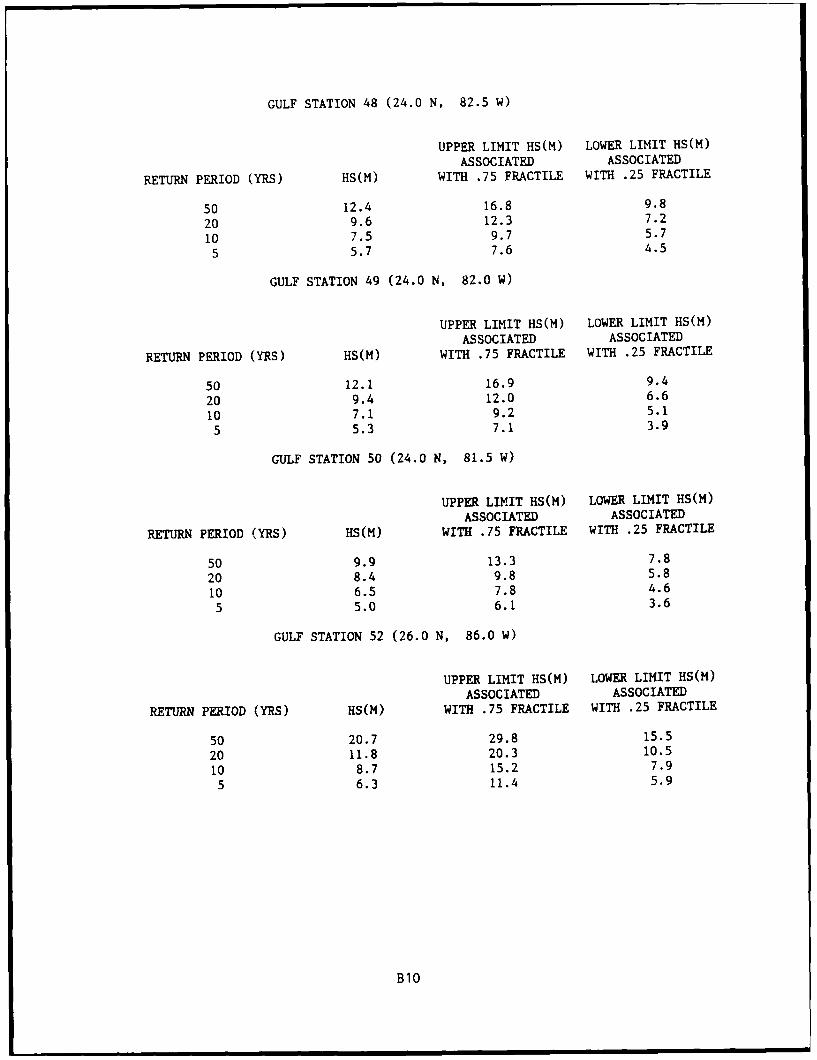
GULF STATION 48 (24.0 N, 82.5 W)
UPPER LIMIT HS(M) LOWER LIMIT HS(M)
ASSOCIATED ASSOCIATED
RETURN PERIOD (YRS) HS(M) WITH .75 FRACTILE WITH .25 FRACTILE
50 12.4 16.8 9.8
20 9.6 12.3 7.2
10 7.5 9.7 5.7
5 5.7 7.6 4.5
GULF STATION 49 (24.0 N, 82.0 W)
UPPER LIMIT HS(M) LOWER LIMIT HS(M)
ASSOCIATED ASSOCIATED
RETURN PERIOD (YRS) HS(M) WITH .75 FRACTILE WITH .25 FRACTILE
50 12.1 16.9 9.4
20 9.4 12.0 6.6
10 7.1 9.2 5.1
5 5.3 7.1 3.9
GULF STATION 50 (24.0 N, 81.5 W)
UPPER LIMIT HS(M) LOWER LIMIT HS(M)
ASSOCIATED ASSOCIATED
RETURN PERIOD (YRS) HS(M) WITH .75 FRACTILE WITH .25 FRACTILE
50 9.9 13.3 7.8
20 8.4 9.8 5.8
10 6.5 7.8 4.6
5 5.0 6.1 3.6
GULF STATION 52 (26.0 N, 86.0 W)
UPPER LIMIT HS(M) LOWER LIMIT HS(M)
ASSOCIATED ASSOCIATED
RETURN PERIOD (YRS) HS(M) WITH .75 FRACTILE WITH .25 FRACTILE
50 20.7 29.8 15.5
20 11.8 20.3 10.5
10 8.7 15.2 7.9
5 6.3 11.4 5.9
B10

GULF STATION 53 (26.0 N, 89.5 W)
UPPER LIMIT HS(M) LOWER LIMIT HS(M)ASSOCIATED ASSOCIATED
RETURN PERIOD (YRS) HS(M) WITH .75 FRACTILE WITH .25 FRACTILE50 20.1 27.7 15.620 12.3 19.8 11.110 9.5 15.3 8.65 7.2 11.9 6.7
GULF STATION 54 (26.0 N, 93.5 W)
UPPER LIMIT HS(M) LOWER LIMIT HS(M)ASSOCIATED ASSOCIATED
RETURN PERIOD (YRS) HS(M) WITH .75 FRACTILE WITH .25 FRACTILE
50 26.1 38.9 19.120 14.4 25.7 12.610 10.4 18.8 9.25 7.4 13.7 6.7
GULF STATION 55 (22.0 N, 92.0 W)
UPPER LIMIT HS(M) LOWER LIMIT HS(M)ASSOCIATED ASSOCIATED
RETURN PERIOD (YRS) HS(M) WITH .75 FRACTILE WITH .25 FRACTILE
50 20.4 30.2 15.020 12.6 20.1 9.910 9.1 14.7 7.35 6.4 10.8 5.3
GULF STATION 56 (27.5 N, 88.0 W)
UPPER LIMIT HS(M) LOWER LIMIT HS(M)ASSOCIATED ASSOCIATED
RETURN PERIOD (YRS) HS(M) WITH .75 FRACTILE WITH .25 FRACTILE
50 30.5 46.1 22.120 16.4 30.0 14.410 11.6 21.7 10.4
5 8.1 15.7 7.5
Bi1

Appendix C: Station Locations and Depths
Station, No. Latitude/Longitude Water Depth,m
Atlantic Phase II Hurricane Stations
1 ~ 44.24N/67.71W 82.02 44.28N/67.02W 110.03 44.32N/66.32W 117.04 43.64N/69.02W 17.05 '43.69N/68.33W 220.06 43.7LN/67.65W 92.07 43.79N/66.96W 55.08 43.03N/70.31W 92.09 43.09N/69.63W 110.0
10 ~ 43.15N/68.95W 128.011 43.29N/66.90W 137.012 43.33N/66.21W 60.013 42.54N/70.23W 128.014 42.60N/69.55W 73.015 42.83N/66.16W 92.016 ~ 42.11N/69.148W 220.017 41.61N/69.40W 37.018 40.88N/71.96W 22.019 ~ 40.94N/71.30W 37.020 41.01N/70.65W 53.021 41.06N/69.99W 55.022 41.12N/69.33W 73.023 40.17N/73.82W 19.02~4 40.24N/73.17W 51.025 ~ 40-32N/72.52W 73.026 LiO.39N/71.87W 112.027 39.68N/73.72W 21.028 39.12N/714.26w 18.029 39.20N/73.62W 33.030 38.55N/714.79W 15.031 38.63N/74.16W 31.032 38.07N/74.69w 7.0
33 37.51N/75.21W 11.0314 37.59N/74L59W 55.035 37.03N/75.11W 37.036 36.514N/75.02W 31.037 36.06N/74.92W 46.038 35.58N/714.83W 55.039 35.02N/75.314W 999.040 35.09N/74.7Wt 999.0141 34.12N/77.64W 11.0~42 34.29N/77.314W 31.043 34.38N/76,45W 40.0
1414 34.46N/75.85W 999.045 314.54N/75.25W 999.0
(Continued)
Cl

Station, No. Latitude/Longtitude Water Depth,m
Atlantic Phase II Hurricane Stations (Concluded)
'46 33.55N/78.72W 9.047 33.6'4N/78.13W 26.048 33.73N/77.S)4W 68.049 33.08fJ/78.62W 22.050 32.33N/80.26w 9.051 32.42N/79.68W 21.052 32.51N/79.1OW 55.053 32.60N/78.51W 419.054 31.86N/80.15W 22.055 31.29N/80.62W 24.056 31-39N/80.olw 37.057 30.73N/81.08W 7.058 30.82N/80.51w 22.059 30.26N/80.98W 28.060 29.79N/80.88W 31.061 29.89N/80.31W 46.062 29.'42N/80.21W 31.063 28.95N/80.11W 9.06'4 28.'48N/80.02W 12.065 28.O1N/79.93W 4.066 27.5'4N/79.8'4W 7.067 27.07N/79.75W 10.068 27.15N/79.20W 424.069 27.23N/78.6'4W 458.070 26.60N/79.67W 439.071 26.13N/79.58W 100.072 26.20N/79.03W 494.073 25.66N/79.50W 970.0
Gulf of Mexico Stations
I22.OON/96.OOW 2,762.02 26.OON/97.OOW 26.03 26.50N/97.OOW 35.0'4 27.OON/97.OOW 40.05 27-50N/97.OOW 26.06 27.50N/96.50W 73.07 28.OON/96.50W 26.08 28.OON/96.OOW 44.09 28.50N/95.50W 26.0
10 28-50N/95.OOW 33.011 29.OON/914.50W 18.012 29.OON/9'4.OOW 20.013 29.50N/93.50W 9.0014 29.50N/93.OOW 13.015 29.OON/92.50W 24.016 29.OON/92.OOW 16.017 29.OON/91.50W 9.0
(Continued)
C2

Station, No. LaLitude/Longtitude Water Depth,m
Gulf of Mexico Stations (Concluded)
18 28.50N/91.50W 46.019 28-50N/91.OOW 33.020 28.50N'/90.50W 38.021 28.50N/ 90.OOW 91.022 28.50N/89.50W 457.023 28.5011/89.00W 860.024 29.OON/88.50W 622.025 29.50N/88.50W 51.026 30.OON/88.SOW 26.027 30.0011/88.00W 26.028 30.0011/87.50W 214.029 30.OON/87.OOW 71.030 30.0011/86.50W 57.031 30.0011/86.00W 31.032 29.5011/86.00W 59.033 29.OON/85.50W 68.0314 29.0011/85.00W 40.035 29.50N/84.50W 214.036 29.5011/84.00W 18.037 29.0011/83.50W 15.038 28.5011/83.00W 7.039 28.0011/83.00W 11.040 27.5011/83.00W 16.041 27.0011/83.00W 33.042 26.5011/82.50W 20.0
4326.OON/82.OOW 13.0414 25.5011/82.00W 16.045 25.0011/82.00W 20.046 25.0011/83.00W 48.047 24.5011/83.00W 27.048 24.001/82.50W 869.049 24.OON/82.OOW 988.050 24.0011/81.50W 1,024.051 24.0011/81.00W 1,061.052 26.0011/86.00W 3,237.053 26.0011/89.50W 3,200.054 26.0011/93.50W 2,377.055 22.0011/92.00W 79.056 27.5011/88.00W 2,615.0
C3

Appendix D: Wave Model Verification
1. The shallow-water spectral hindcast model used in the hurricane sim-
ulation is a variation on a model originally developed by Resio (1982 )* and
subsequently modified. The model is described in Hughes and Jensen (1986) and
in Jensen, Vincent, and Abel (1987). Examples of where it has been applied
are Hubertz, Abel, and Jensen (1988) and Jensen, Vincent, and Abel (1987).
The model contains the following source terms: wind input, nonlinear trans-
fer, wave dissipation, bottom friction, percolation, and shallow-water break-
ing. The model includes refraction and shoaling. The model is termed pseudo-
discrete in that the directional spectrum is represented explicitly in the
model as a matrix of values. However, the source term balance for the ac-
tively growing wind sea is handled parametrically. For deepwater fetch-
limited conditions, the model will produce the Joint North Sea Wave Program
(JONSWAP) wave-growth curves and spectral shape. At full development, it will
produce the Pierson-Moskowitz spectrum (Pierson and Moskowitz 1964). For
finite depth conditions with a flat bottom, it will produce the TMA spectrum
(Bouws et al. 1985, 1987) for a wind sea. It must be understood, however,
that the spectral shape, in both frequency and direction space, is not con-
strained to a particular form. The model will produce directionally sheared
and multiple peak spectra. The model is not constrained to have a particular
directional spread; indeed, the directional spreads can be very narrow or
quite broad depending upon the nature of the wind field and the presence of
swell.
2. Since there is little scientific concensus on the physics to be
incorporated into a hurricane model, a significant effort was made to verify
the model for hurricane wave conditions. The principal adjustable coeffi-
cients in the model were set to make the model reproduce the growth rate
curves in the Sea Wave Modeling Project (SWAMP) (SWAMP Group 1985) (Figure D1)
and spectral shapes of the JONSWAP/TMA/Pierson-Moskowitz type. The wind model
was run, the results input to the wave model and the results compared with
wave observations. Hurricanes simulated included Camille, Frederic, Carmen,
Edith, Gloria, Belle, and tropical storm Delia. Wave observations from depths
of 100 m or more to as little as 6.5 m were used for comparison. Figure D2
* See References at the end of the main text.
D1
indicates the comparison of the maximum predicted and observed significant
wave heights, and Figure D3 indicates the corresponding periods. Typically,
the maximum values occurred within an hour of the measured values. For the
maximum conditions, the differences were within about 10 percent for height
and 15 percent for period. Given the broadness of some of the wave spectra,
the wider difference in period may simply be due to the statistical uncer-
tainties in the spectral values. Hurricane Camille is the best-documented
extreme hurricane to strike the United States. The Ocean Data Gathering
Program (ODGP) collected data from three oil platforms that experienced sig-
nificant wave heights from 7 to almost 14 m. The site at 290 N, 88.750 W was
very close and to the right of eye passage. The other stations were to the
left of eye passage. Simulations of the storm (Figure D4) show that the model
matches the general pattern of wave height, growth, and maximum recorded con-
ditions. The cross bars in Figure D4 indicate the range of wave heights
reported by different analysis of the same gage data. For the 290 N, 880 W
site, the hindcasts run slightly higher than the observations, but it should
be noted that the gage broke and it is not clear what the actual maximum was.
Figure D5 provides examples of observed and simulated frequency spectra.
3. Hurricane Carmen was a severe hurricane that struck the south coast
of Louisiana. The hindcasts replicated the general trend of the storm at gage
sites east and west of eye passage, with the exception that the model at the
site nearest eye passage underpredicted waves after the eye of the storm had
passed onto land. The hindcast wind field at the site had a distinct decrease
in wind velocities associated with the decay of the eye over land, and the
model reacted acco.-dingly. The wind instrument at the platform did not work
so there is no information on whether the winds actually decreased. As the
storm passes over land, it may well be possible that the portion remaining
over water may not decay as rapidly as the region near the eye. This should
be an area for future research. A comparison of the directional spectrum
reported by Forristall, Ward, and Cardone (1980) is given in Figure D6.
4. Hurricane Frederic crossed the coast near Mobile Bay. Hindcasts
(Figure D7) of the storm indicate that points surrounding the gage site
bracket both the height and wave direction curves at the gage. Plots of hind-
cast data are made only up to the point that the gage malfunctioned.
5. Hurricane Belle was a moderately strong hurricane on the Atlantic
coast. Plots of the wave height history (Figure D8) and frequency spectra,
D2

(Figure D9) indicate that the model represented the general pattern of the
storm.
6. Hurricane Gloria was the strongest storm passing close to the US
Atlantic coastline in the 1980's. Simulations of the storm were made,
Hubertz, Abel, and Jensen (1988) and Jensen, Vincent, and Abel (1987)
including a higher resolution nearshore grid. The wave height histories at
18-m depth (Figure D1O) were computed with the time dependent model, the 6-m
depth time-histories of height and direction. Figures D11 and D12 were made
with a steady-state transformation of the hindcast data. The general
magnitude of the storm wave heights were well predicted. Wave direction was
within 10 deg. The hindcasts slightly lagged the storm observations, and
there was a slight tendency for overprediction after the eye passed. Since
this represents a case where a substantial portion of the storm was overland,
but not the eye region, it may be indicative of an inability to correctly
specify the hurricane wind field in cases where the storm has a significant
interaction with land.
7. Hurricane Edith moved northeastward along the Texas coast and
crossed land in southwest Louisiana. Figure D13 provides a comparison of the
hindcast and observed waves at gage sites nearest eye crossing. Comparison of
predicted and observed winds indicates that the winds were underpredicted at
the peak of the storm, which may account for the 1-m underprediction by the
model.
8. The conclusion reached was that the model reproduced the general
magnitude and characteristics of the storms observed without site-specific
tuning. Although in individual cases improvements in the verifications can be
obtained by tuning the wind or slightly altering the track of the storm,
within the known variability of these parameters, it was decided to accept the
verifications as a sufficient indication of the quality of the model, recog-
nizing that in many historical storms sufficient information would not be
available to allow more specific tuning.
D3

FETCH, X. M FETCH. X. M
104 2 5 105 2 5 106 2 10 5 2 105 2 5 106 2 510' - I I I I 1 5
-E" - g'E/u 4 f, - UJf/g
X" - gx/U. 2 2 2X . . gx/u. 2 2
2 101 02
--5
-- 2
9 10.1102 -8 9
LEGEND 8 95 E7 8
e SHALWV RESULTS 2 7EXACT NONLINEAR
UJ 2 / 5% JONSWAPrff RANGE OF MODELS 101 u 5
5~ 107 -.- 6 I 107I Il0 102 5 1052 50 2 5 104 ,,, CC 10' 2 5 106 2 5102 10
NONDIMENSIONAL FETCH. X* NONDIMENSIONAL FETCH. X°
-J3
z LW .0 z
TIME. SEC ' TIME. SECz -Zu1 103 2 5 104 2 5 10 2 S 1o < t0 2 5 10' 2 5 10' 2 5
10' 0--" -- Z I I
z .4Wf fU.Igo 5 E" - g 2E/u* ' "'
Z t ° . gt/u. 2 25 2 - V - gt/u.z
2 0 2
103 5 4 -
5
5
5
2
2 - 100 102 -
09 10.5 a - 9
- 7 82 6 7
21101 6
10' I I I f f I f
10' 2 5 105 2 5 106 2 5 101 10' 2 5 10' 2 5 10' 2 5 107
NONDIMENSIONAL TIME. V NONDIMENSIONAL TIME. t
Figure D1. Nondimensional wave growth versus nondimensional
fetch and time for different models
D4

1413 - - - -
1211 ,
10
8
w 7
5 - -4--
2-
0 2 4 6 8 10 12 14
HINDCAST HMO, M
Figure D2. Hidcast wave height versus measured waveheight for the tropical storms discussed in Jensen,
Vincent, and Abel (1987)
18 -
16--
12 :,"lo a
0
2 - -
0 2 4 6 8 10 12 14 20
HINDCAST Tp, SEC
Figure D3. Hindcast wave period versus measured wave period forthe tropical storms discussed in Jensen, Vincent, and Abel (1987)
D5

HURRICANE CAMILLE COMPARISON
ODGP ST (29.OON 88.75W)
18
16a t
I t
14
12 -*
0A
E 10 -
8
7
4
2
0 I I I I , I I
0 6 12 16 24 30 36 42 48
HOUR BEGINNING AT 0000 HR 17 AUG 1960
HURRICANE CAMILLE COMPARISONODGP ST (28.10N 89.70W)
10 1i uI I i I i
9
/I
0 I I I I I I Io 6 12 18 24= 30 36 42 48
HOUR BEGINNING AT 0000 HR 17 AUG 1969
Figure Dli. Comparison of measured (solid lines) and
modeled (broken lines) wave height during HurricaneCamille at two different sites
D6

ARICAINE CAIlLE SPECTRAL CO0MPARMC4S $1 I (29.08M <OW)
St 11O. 0 its.0 R t S111.1
lWSA
I
t A
KAMANEC CUIE SPECTRAL COLVAIRISCMWW ST 2 (21LMM 97,70W)
ST_ ry.S S9 I
0-0.1l it *1 .
SI ,
I
rVM
M /too
. U2 QM to o 4: &a LU LI to am I
KAIAECMLESECTRAL COI#PARISO
sa. etST 3 (28.521 90.37)
nt
S, Ik f 41*0 SI
L I
/ \~.... I \\\
S.M 0A2 0.04 0.05 0.M 01 LU * 0 +1L1 L OI .O
rr qmy (W)
061 a ON 0 a . Q.% a 's U
Figure D5. Comparison of measured and modeled wavespectra for maximum wave conditions during Hurri-
cane Camille at three different sites
D7

CARMEN SPECTRAL COMPARISON
360
HINDCAST
,
a 240
0I .- MEASURED0Lu 120
0 0.05 0.10 0.15 0.20
F, HZ
6oo
e- HINDCAST
400
MEASURED-*z
a
zLu0
0 0.06 0.10 0.15 0.20
f,HZ
Figure D6. Comparison of measured and modeled wavespectra and direction for Hurricane Carmen
D8

40
x
30-
200
-0
0
80
90
80
-90
-18010 1S
DAYS OF MONTH SEPTEMBER 19 79
WAVE STAFF TAGLINEBROKEN
9/ 12/79 to 9/23/79
LEGEND
x AT 28.5 N. 88.5fWa AT 29.00N. 89.0"W
HURRICANE FREDERIC
COGNAC LOCATED AT
28B471 27" N.
89"3' 22' W
Figure D7. Comparison of measured andmodeled wave height and direction
during Hurricane Frederic
D9

HURRICANE BELLE
SIGNIFICANT WAVE HEIGHT COMPARISON10 LEGEND
* MEASURED9 HINDCAST
8
7
666 - A
E A
4 -
3 -
2
1 MAX WIND LAND FALL
1500 2000 0 0500
AUG 9 AUG 10TIME, GMT
Figure D8. Comparison of measured and modeledwave height during Hurricane Belle at ocean
data buoy EB 41 off the coast of New Jersey
D1O

BELLE SPECTRAL COMPARISON
100 - LEGEND5-4 OBSERVED MAXIMUMS
90 HINOCAST
so i i
.50
040
so I
20
10 XN
00 I Io0.06 0.10 0.15 0.2
f. HZ
BELLE SPECTRAL COMPARISON
140LEGEND
-- 4 OBSERVED MAXIMUMS120 0 HINDCAST
100
sao
to'
"i-/
0 I0.06 0.10 0.15
f. HZ
Figure D9. Comparison of measured and modeled wavespectra for Hurricane Belle at ocean data buoyEB 41 off the coast of New Jersey and ocean data
buoy EB 15 off the coast of South Carolina
D11

HURRICANE GIORIA COMPARISONWatr Oopth 18 m
6 km Iro.. lwe
T I (4) ST 2 (4.2)
7.0ST (5,J) ST4(U) /
to CAGE DATA
E
. /
tO
0.0-
0 2 24 30 42
Hour BegfvAg at 0000 W4 26 Sep. 1985
Figure D1O. Comparison of measured and modeledwave height during Hurricane Gloria offshore of
North Carolina
D12

HURRICANE GLORIA COMPARISONWATER DEPTH 6.5 M
4.5
4.0
3.5
3.0
2.5
1.5LEGEND
1.0 - - INPUT (5.8)
INPUT (4.9)0.5 - PUV
S SXY
0 I I
0 6 12 18 24
HOUR BEGINNING AT 1000 HR 28 SEP 1985
Figure D11. Comparison of measured andmodeled wave height during Hurricane
Gloria at Duck, North Carolina
180I
160
140
Lii
0120
. 100LU
6O LEGEND
40 INPUT (5.8)-INPUT (4.9)
PUV20 SXY-
0I I I0 6 12 18 24
HOUR BEGINNING AT 1000 HR 26 SEP 1965
Figure D12. Comparison of measured andmodeled wave direction during Hurricane
Gloria at Duck, North Carolina
D13
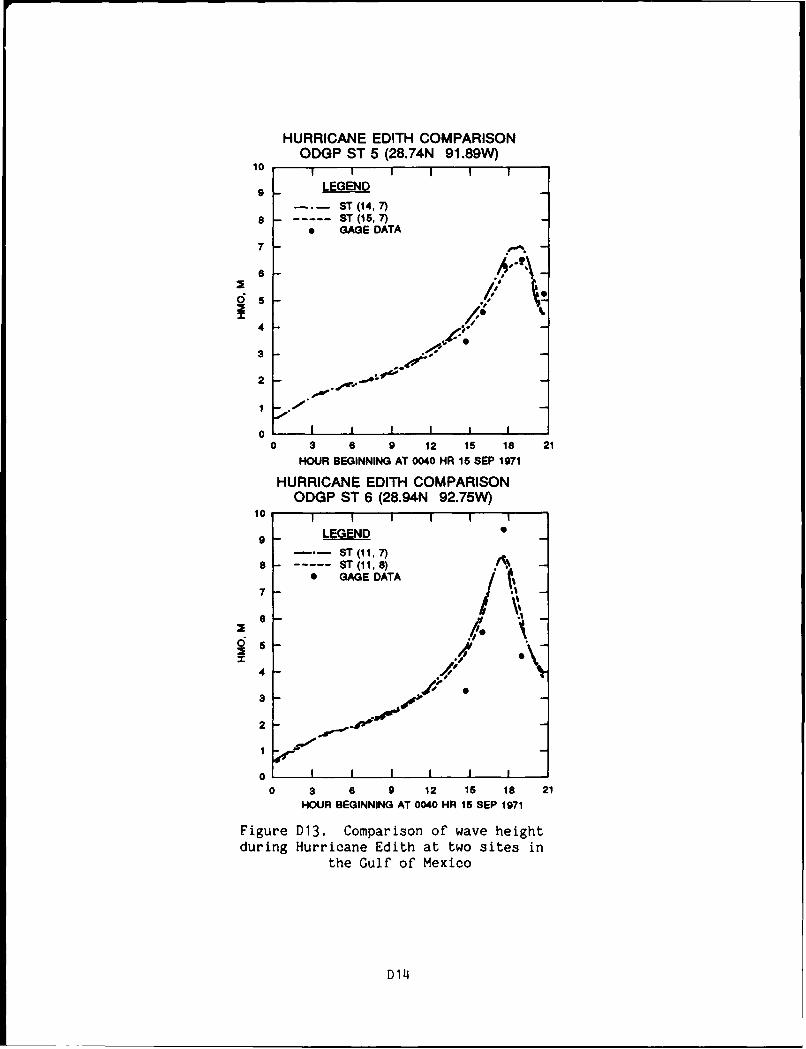
HURRICANE EDITH COMPARISONODGP ST 5 (28.74N 91.89W)
10 1
9 LEGENDST (14, 7)
8 ST (is, 7)* GAGE DATA
7
6
3
3 11,_4 V
2
1
0 I I I I I I
0 3 6 9 12 15 18 21
HOUR BEGINNING AT 0040 HR 15 SEP 1971
HURRICANE EDITH COMPARISONODGP ST 6 (28.94N 92.75W)
10 1I I I
9 LEGEND--.- ST (11, 7)
e ST (11, 8)7 GAGE DATA
6
00 3 6 9 12 15 18 21
HOUR BEGINNING AT 0040 HR 16 SEP 1971
Figure D13. Comparison of wave heightduring Hurricane Edith at two sites in
the Gulf of Mexico
D14

SUPPLEMENTARY
INFORMATION

DEPARTMENT OF THE ARMYWATERWAYS EXPERIMENT STATION, CORPS OF ENGINEERS
3909 HALLS FERRY ROADVICKSBURG. MISSISSIPPI 39180-6199
REPLY TOATTENTION OF
9
Errata Sheet
WIS Report 19
The attached table of wave heights at various return periods for locationsalong the Atlantic and Gulf of Mexico coastlines is provided as an addendum toAppendices A and B of:
S Abel, C. E., B. A. Tracy, C. L. Vincent, and R. E. Jensen. 1989. "HurricaneHindcast Methodology and Wave Statistics for Atlantic and Gulf Hurricanes from1956-1975," USAE Waterways Experiment Station, 3909 Halls Ferry Rd.,Vicksburg, MS 39180-6199.
The values in the attached table were calculated using the latest CoastalEngineering Research Center (CERC) procedure which is the Extremal Significant
<l. Wave Height Analysis module in the Automated Coastal Engineering System (ACES)package. This module is available in version 1.05 of the ACES package which
Qcan be obtained from:US Army Engineer Waterways Experiment Station
ATTN: CEWES-IM-MI-S3909 Halls Ferry Road
Vicksburg, MS 39180-6199(601-634-2571)
It is believed that this procedure gives more realistic values, especially atsome locations where the previous procedure gave very large values.
Note that the section on Statistical Analysis in WIS Report 19 and resultsin Figures 19 and 20 are not consistent with the new procedure for calculatingconfidence intervals as described on pages 1-3-4,5 of the ACES TechnicalReference Manual Version 1.05.
HYDRAULICS GEOTECHNICAL STRUCTURES ENVIRONMENTAL COASTAL ENGI1EERING INFORMATIONLABORATORY LABORATORY LABORATORY LABORATORY RESEARCH CENTER TECHNOLOGY LABORATORY

Wave Information Studies (WIS) - Addendum to WIS Report 19:"Hurricane Hindcast Methodology and Wave Statistics for Atlantic and Gulf Hurricanes from 1956 - 1975"
Return Period Significant Wave Heights (m) for WIS Stations Using Fisher-Tippett Type 1 Distribution
Atlantic Gulf of Mexico
Return Period (years): 5 10 20 50 Return Period (years): 5 10 20 50
StationStation1 5.6 6.5 7.3 8.4 1 6.0 8.3 11.2 13.32 6.0 6.8 7.7 8.7 2 5.5 7.7 10.5 12.6
3 5.9 7.0 8.0 9.3 3 5.2 7.6 10.6 12.9
4 4.5 5.4 6.3 7.4 4 5.2 7.2 9.8 11.75 5.5 6.5 7.5 8.9 5 5.8 6.7 7.9 8.76 6.2 7.2 8.1 9.4 6 6.2 8.2 10.7 12.67 6.3 7.3 8.2 9.5 7 4.8 6.5 8.6 10,1
8 4.8 5.9 7.0 8.4 8 4.6 8.0 12.3 15.69 5.7 6.8 7.9 9.3 9 3.3 6.1 9.6 12.210 5.6 6.6 7.7 9.0 10 5.9 7.7 10.0 11.711 6.7 7.7 8.7 10.1 11 5.6 6.3 7.3 8.012 6.6 7.7 8.7 10.1 12 6.2 7.1 8.3 9.113 5.1 6.2 7.2 8.6 13 4.5 5.2 (5.4) (5.4)14 6.0 7.1 8.2 9.7 14 4.9 5.5 6.2 6.815 6.9 8.0 9.0 10.4 15 6.2 7.1 8.2 9.016 6.5 7.7 8.8 10.2 16 5.2 5.6 6.1 6.417 6.3 7.3 8.3 9.6 17 (5.4) (5.4) (5.4) (5.4)18 5.1 6.3 7.6 9.1 18* - -
19 5.7 6.8 7.9 9.3 19 5.9 7.8 10.2 12.020 6.1 7.2 8.2 9.5 20 6.2 7.7 9.5 10.821 6.6 7.6 8.7 10.0 21 6.9 8.2 9.9 11.122 6.7 7.8 8.8 10.2 22 7.5 8.6 10.1 11.123 4.1 4.9 5.7 6.7 23 8.9 11.1 13.9 16.024 5.0 5.9 6.8 7.9 24 8.9 11.4 14.7 17.225 6.0 7.0 8.0 9.3 25 7.3 9.5 12.4 14.526 6.7 7.9 9.0 10.5 26 6.8 7.8 9.0 9.927 4.8 5.7 6.6 7.7 27 6.3 7.2 8.2 9.028 4.8 5.6 6.4 7.5 28 6.2 7.0 8.0 8.729 5.6 6.6 7.5 8.7 29 6.1 7.4 9.0 10.230 4.7 5.3 5.8 6.5 30 5.2 7.1 9.5 11.231 5.6 6.6 7.6 8.9 31 7.5 7.7 8.0 8.232 (4.2) (4.2) (4.2) (4.2) 32 5.1 6.7 8.7 10.233 5.1 5.8 6.5 (6.6) 33 5.8 6.7 7.9 8.734 6.5 7.7 8.8 10.2 34 5.4 6.3 7.4 8.235 6.4 7.5 8.5 9.9 35* - - -36 6.8 7.9 9.0 10.4 36 * -37 7.6 9.0 10.3 11.9 37 * 38 8.3 9.8 11.3 13.2 38 * -
39 9.2 10.9 12.5 14.8 39 * -40 9.3 11.0 12.7 14.9 40 * - -41 5.5 6.3 (6.6) (6.6) 41 4.4 5.2 6.1 6.742 7.0 8.2 9.5 11.1 42 * - - - -
43 7.6 9.0 10.3 12.1 43 * - - - -
44 9.2 10.9 12.6 14.8 44 3.3 4.7 6.5 7.845 9.1 10.8 12.4 14.5 45 4.0 5.4 7.2 8.546 4.6 5.3 (5.4) (5.4) 46 4.0 6.3 9.1 11.347 6.5 7.9 9.2 10.9 47 3.9 5.7 7.9 9.648 7.7 9.2 10.7 12.6 48 7.0 7.0 7.1 7.149 6.5 7.8 9.1 10.8 49 4.0 5.4 7.2 8.650 4.6 5.3 (5.4) (5.4) 50 4.5 5.3 6.2 6.851 5.6 6.6 7.5 8.7 51 - - - -52 7.8 9.3 10.8 12.6 52 6.1 8.8 12.2 14.853 8.5 10.3 12.0 14.1 53 7.7 8.8 10.1 11.154 6.1 7.4 8.6 10.2 54 7.2 10.3 14.1 17.055 6.0 7.4 8.7 10.5 55 6.0 8.1 10.8 12.856 7.0 8.7 10.3 12.4 56 8.4 11.3 15.0 17.757 (4.2) (4.2) (4.2) (4.2)58 8.5 7.9 0.3 11.059 6.0 7.7 9.3 11.460 8.7 8.4 9.9 12.061 8.3 10.3 12.1 14.562 8.3 8.0 9.6 11.6 * Stations that did not include enough waves over63 4.5 5.4 (5.4) (5.4) 3 meters were not analyzed.64 5.2 6.1 6.9 (7.2)85 (2.4) (2.4) (2.4) (2.4) () Wave height limited to 0.6 times water depth.66 4.2 (4.2) (4.2) (4.2)67 4.3 5.3 (6.0) (6.0)6 5.6 7.5 9.3 11.769 5.5 7.8 10.0 12.870 5.3 8.9 8.4 10.371 5.4 7.1 S.8 11.072 4.2 5.8 7.4 9.473 4.6 6.8 8.9 11.6