thyssenkrupp Meet Management · Capital Market Day 2016 – Meet Management Components Technology...
89
Capital Market Day 2016 Meet Management
Transcript of thyssenkrupp Meet Management · Capital Market Day 2016 – Meet Management Components Technology...

Capital Market Day 2016 Meet Management
Capital Market Day 2016 – Meet Management
Components Technology
Essen, December 9th, 2016 Karsten Kroos (CEO) | Carsten Evers (CFO)
2 | December 9th, 2016 | Capital Market Day 2016 – Meet Management | Components Technology
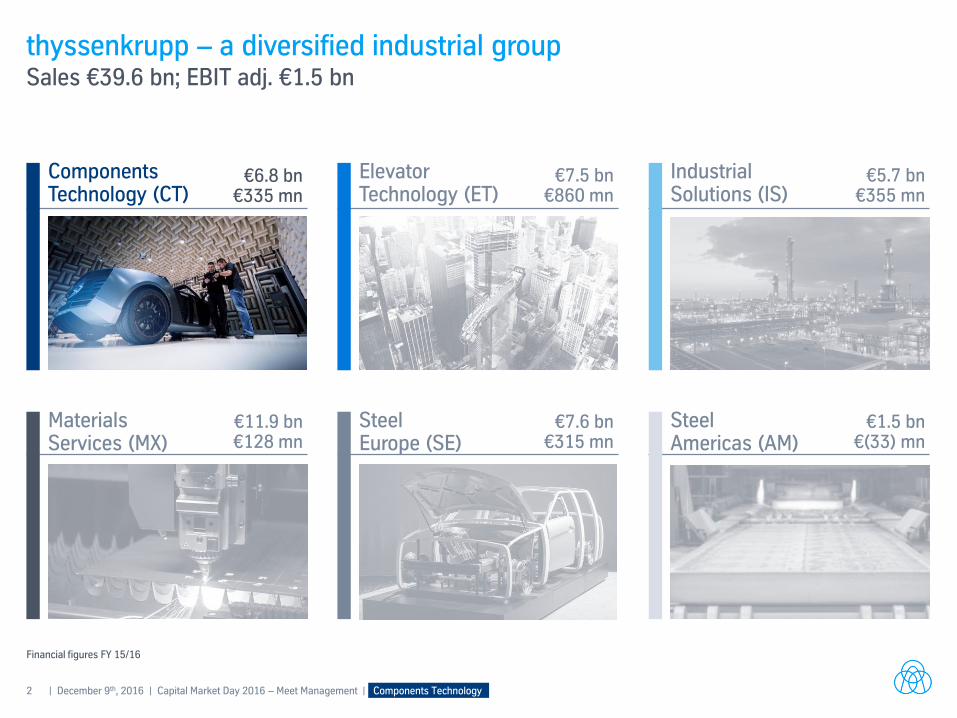
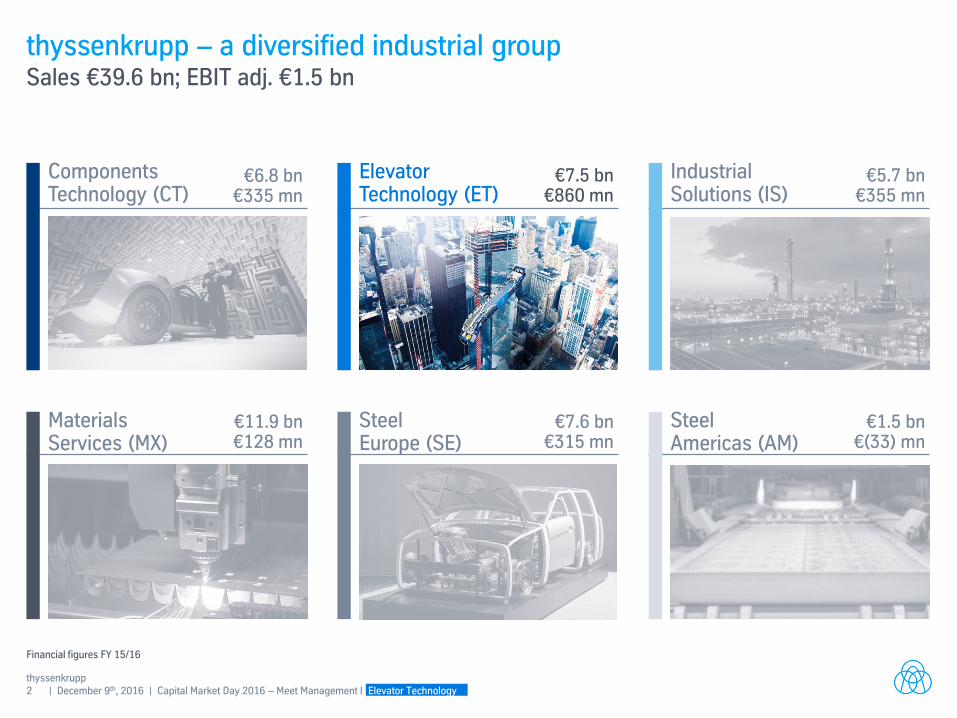
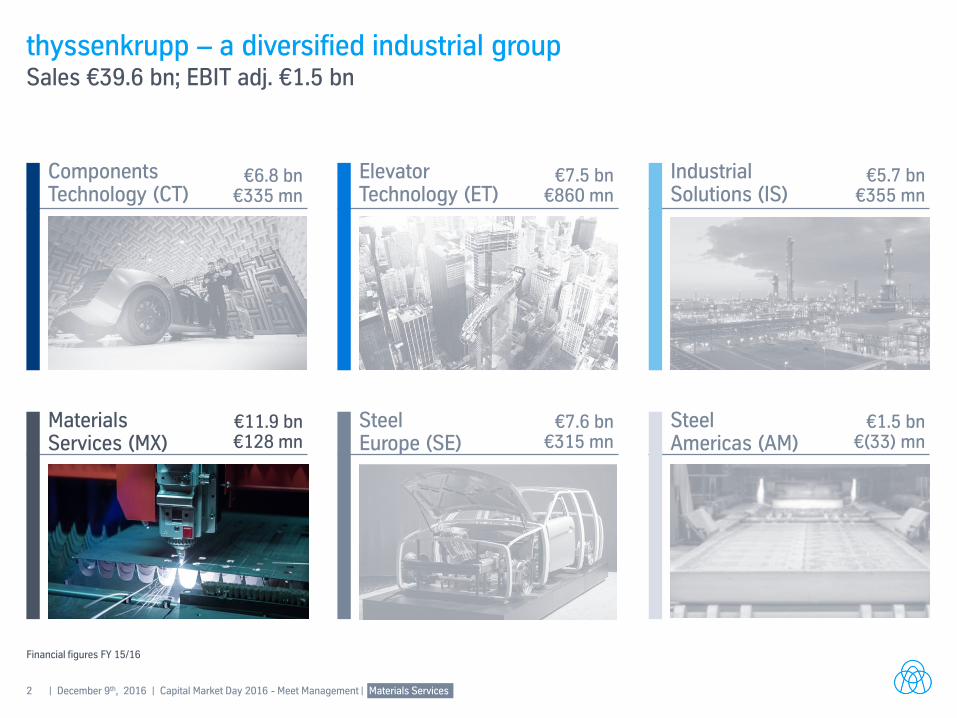
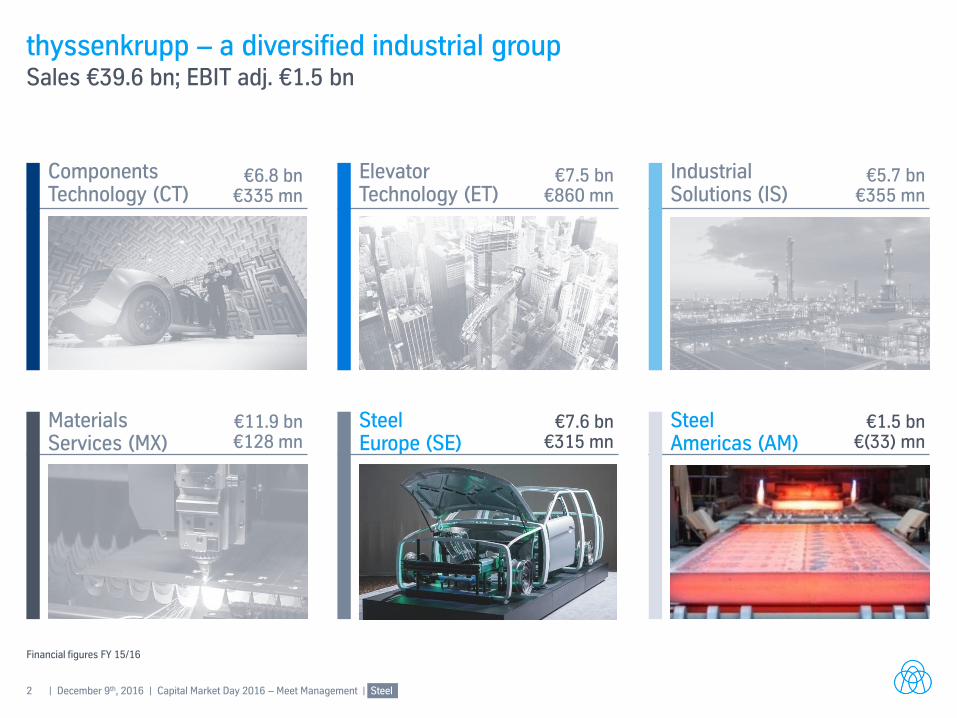
thyssenkrupp – a diversified industrial group Sales €39.6 bn; EBIT adj. €1.5 bn
Components Technology (CT)
Materials Services (MX)
Financial figures FY 15/16
Steel Americas (AM)
€1.5 bn €(33) mn
Steel Europe (SE)
€7.6 bn €315 mn
€11.9 bn €128 mn
Elevator Technology (ET)
€7.5 bn €860 mn
€6.8 bn €335 mn
Industrial Solutions (IS)
€5.7 bn €355 mn
3 | December 9th, 2016 | Capital Market Day 2016 – Meet Management | Components Technology
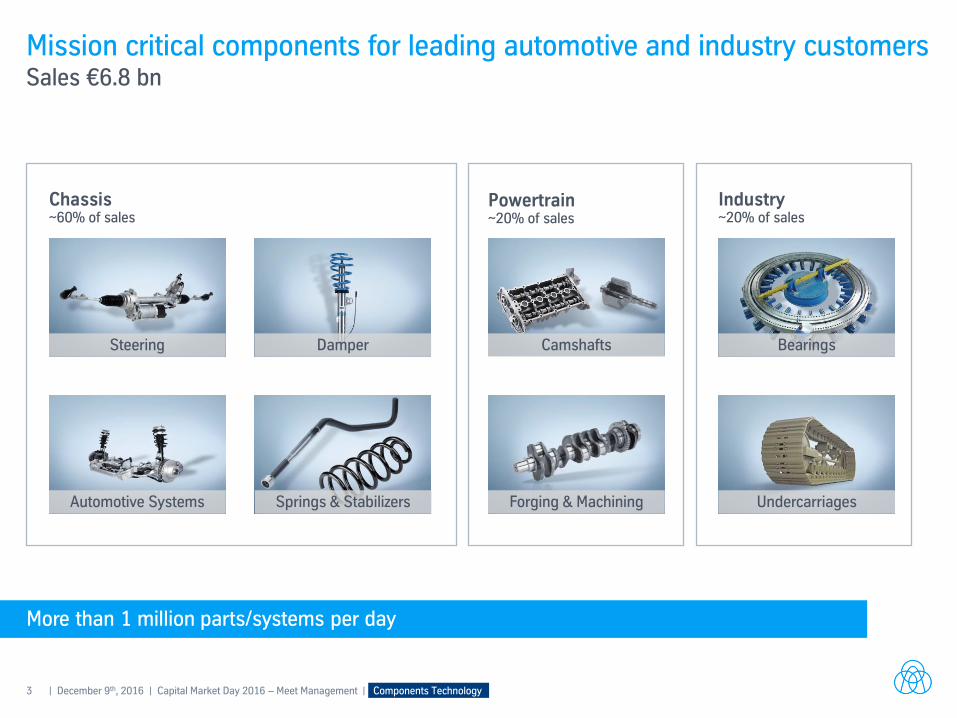
Mission critical components for leading automotive and industry customers Sales €6.8 bn
Powertrain ~20% of sales
Industry ~20% of sales
Chassis ~60% of sales
Springs & Stabilizers
Camshafts
Forging & Machining
Bearings
Undercarriages
Steering Damper
Automotive Systems
More than 1 million parts/systems per day
4 | December 9th, 2016 | Capital Market Day 2016 – Meet Management | Components Technology
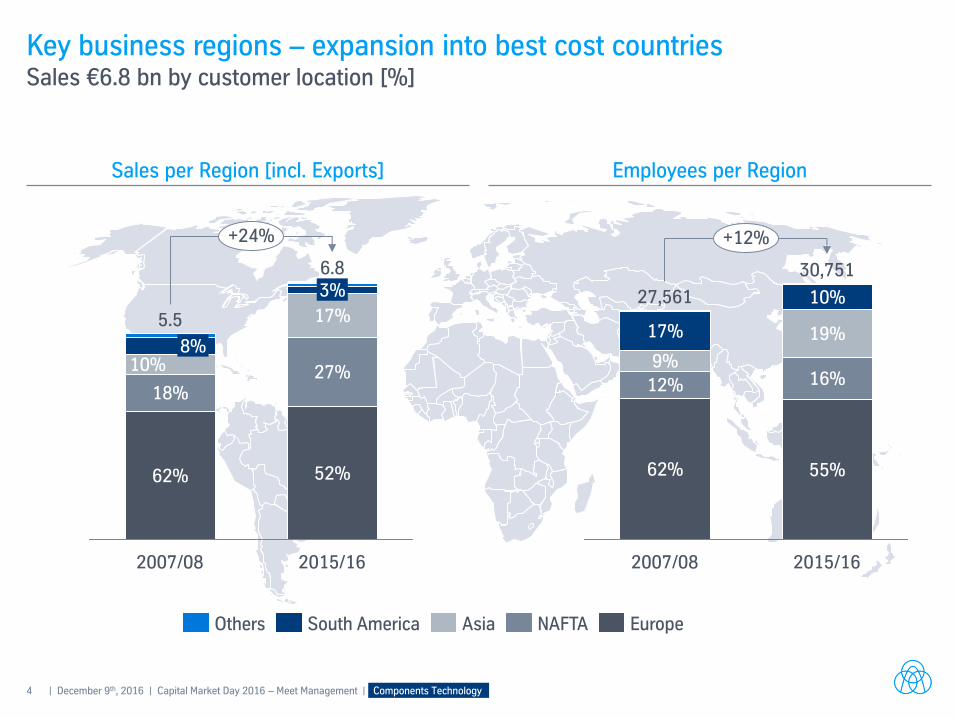
Key business regions – expansion into best cost countries Sales €6.8 bn by customer location [%]
Sales per Region [incl. Exports] Employees per Region
+24%
2015/16
6.8
52%
27%
17%
3%
2007/08
5.5
62%
18%
10% 8%
Europe NAFTA Asia South America Others
9%
17%
+12%
2015/16
30,751
55%
16%
19%
10%
2007/08
27,561
62%
12%
5 | December 9th, 2016 | Capital Market Day 2016 – Meet Management | Components Technology
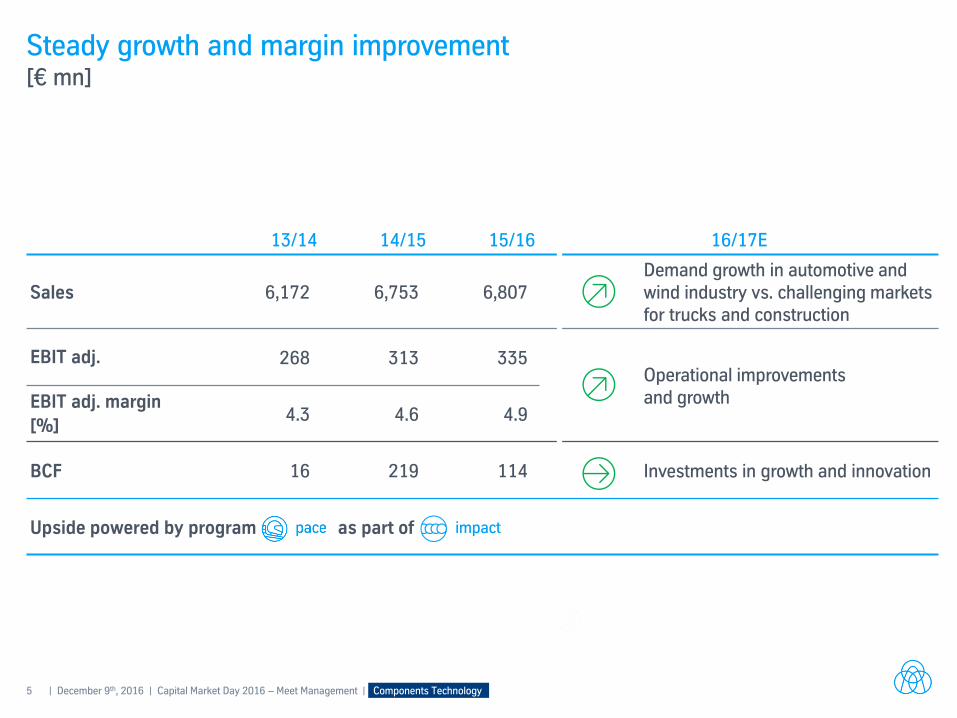
Steady growth and margin improvement [€ mn]
13/14 14/15 15/16 16/17E
Sales
6,172 6,753 6,807 Demand growth in automotive and wind industry vs. challenging markets for trucks and construction
EBIT adj. 268 313 335 Operational improvements and growth EBIT adj. margin
[%] 4.3 4.6 4.9
BCF 16 219 114 Investments in growth and innovation
Upside powered by program as part of
6 | December 9th, 2016 | Capital Market Day 2016 – Meet Management | Components Technology
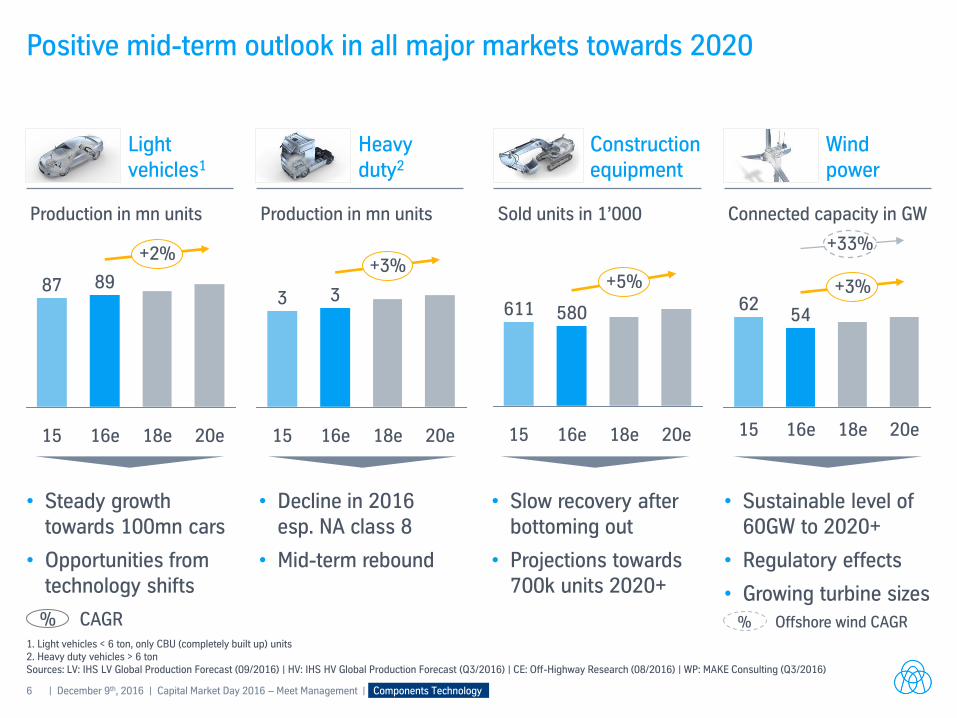
Positive mid-term outlook in all major markets towards 2020
1. Light vehicles < 6 ton, only CBU (completely built up) units 2. Heavy duty vehicles > 6 ton Sources: LV: IHS LV Global Production Forecast (09/2016) | HV: IHS HV Global Production Forecast (Q3/2016) | CE: Off-Highway Research (08/2016) | WP: MAKE Consulting (Q3/2016)
15 20e
+3%
3
18e 16e
3
16e
580
18e 20e
611
15
+5%
16e
+3%
54
15 18e 20e
62
% CAGR
Light vehicles1
Production in mn units
Heavy duty2
Production in mn units
Construction equipment
Sold units in 1’000
Wind power
Connected capacity in GW
• Steady growth towards 100mn cars
• Opportunities from technology shifts
• Decline in 2016 esp. NA class 8
• Mid-term rebound
• Slow recovery after bottoming out
• Projections towards 700k units 2020+
• Sustainable level of 60GW to 2020+
• Regulatory effects
• Growing turbine sizes
89
15
87
16e
+2%
20e 18e
+33%
% Offshore wind CAGR
7 | December 9th, 2016 | Capital Market Day 2016 – Meet Management | Components Technology
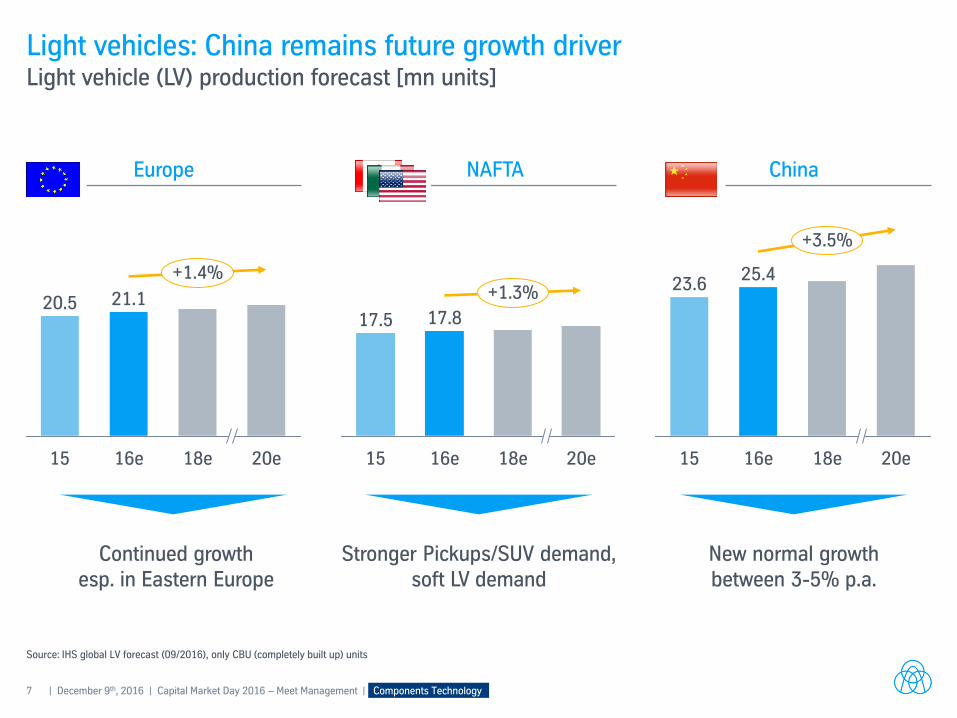
Light vehicles: China remains future growth driver Light vehicle (LV) production forecast [mn units]
China
Source: IHS global LV forecast (09/2016), only CBU (completely built up) units
Europe
Continued growth esp. in Eastern Europe
Stronger Pickups/SUV demand, soft LV demand
New normal growth between 3-5% p.a.
20.5
+1.4%
20e 18e 16e
21.1
15 18e 16e
17.8
15
17.5
20e
+1.3%
20e
+3.5%
18e 16e
25.4
15
23.6
NAFTA
8 | December 9th, 2016 | Capital Market Day 2016 – Meet Management | Components Technology
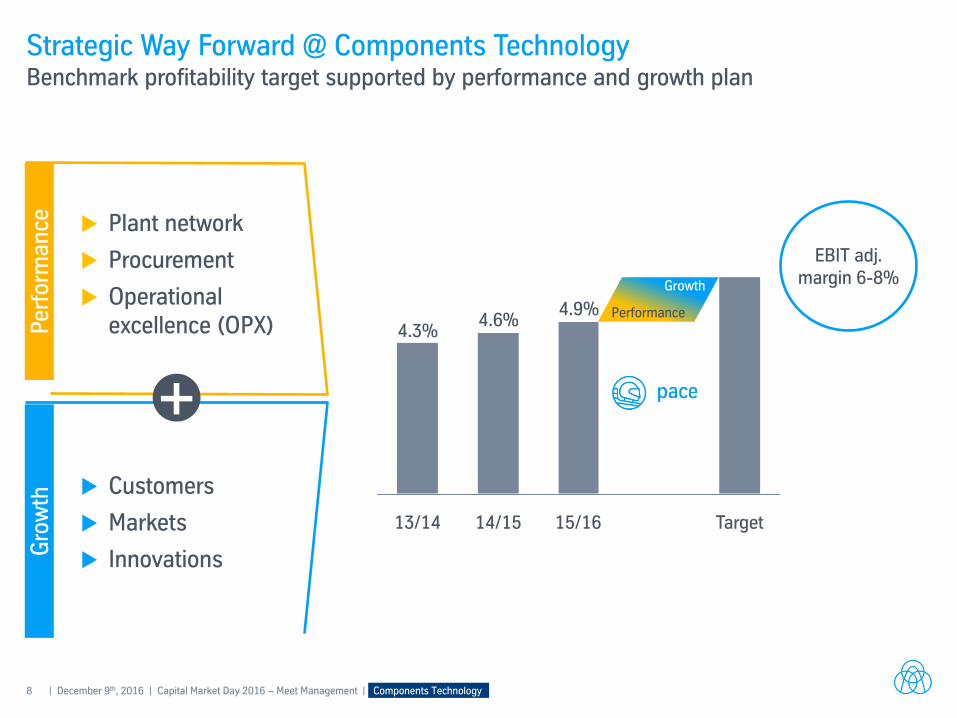
Customers
Markets
Innovations
Plant network
Procurement
Operational excellence (OPX)
Strategic Way Forward @ Components Technology Benchmark profitability target supported by performance and growth plan
Target 15/16
4.9%
14/15
4.6% 4.3%
13/14
Per
form
an
ce
Gro
wth
+
Growth
Performance
EBIT adj. margin 6-8%
9 | December 9th, 2016 | Capital Market Day 2016 – Meet Management | Components Technology
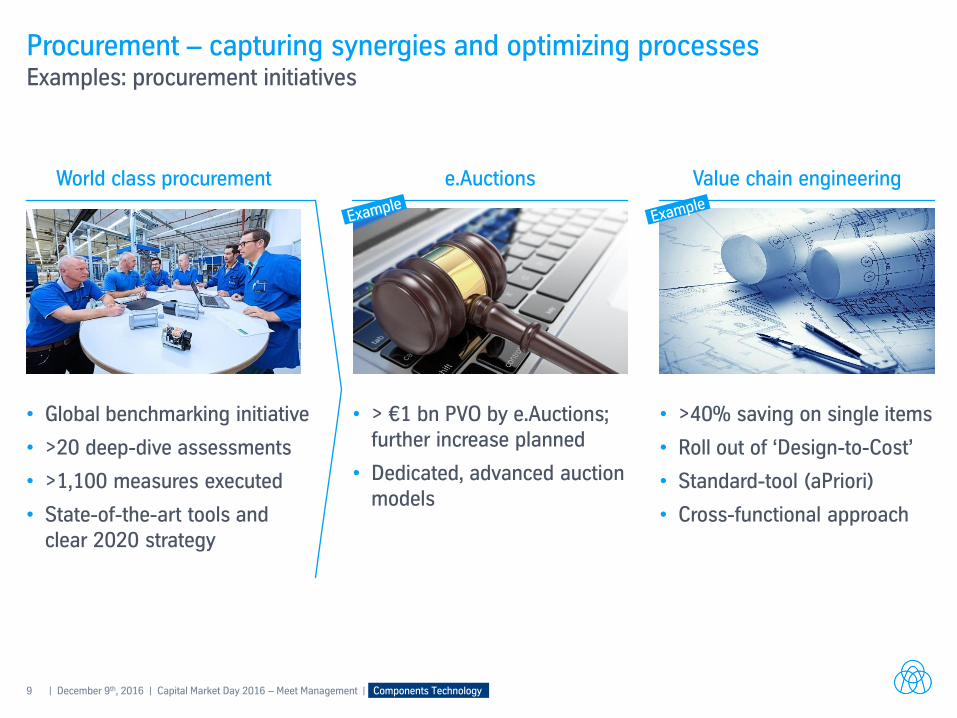
Procurement – capturing synergies and optimizing processes Examples: procurement initiatives
World class procurement
• Global benchmarking initiative
• >20 deep-dive assessments
• >1,100 measures executed
• State-of-the-art tools and clear 2020 strategy
Value chain engineering
• >40% saving on single items
• Roll out of ‘Design-to-Cost’
• Standard-tool (aPriori)
• Cross-functional approach
e.Auctions
• > €1 bn PVO by e.Auctions; further increase planned
• Dedicated, advanced auction models
10 | December 9th, 2016 | Capital Market Day 2016 – Meet Management | Components Technology
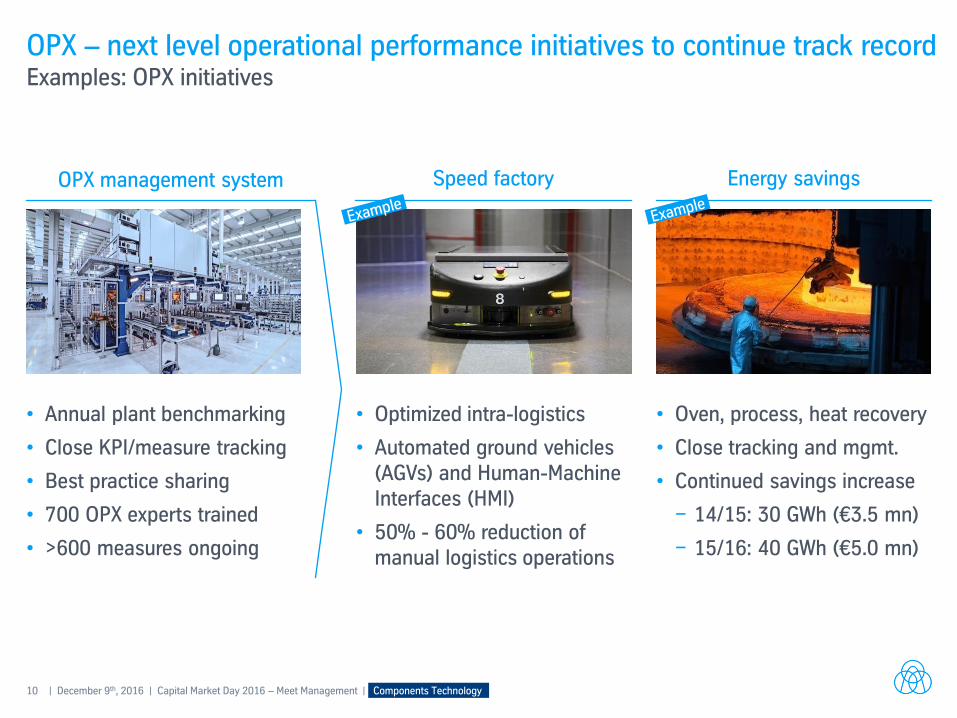
OPX – next level operational performance initiatives to continue track record Examples: OPX initiatives
Energy savings
• Oven, process, heat recovery
• Close tracking and mgmt.
• Continued savings increase
− 14/15: 30 GWh (€3.5 mn)
− 15/16: 40 GWh (€5.0 mn)
OPX management system Speed factory
• Optimized intra-logistics
• Automated ground vehicles (AGVs) and Human-Machine Interfaces (HMI)
• 50% - 60% reduction of manual logistics operations
• Annual plant benchmarking
• Close KPI/measure tracking
• Best practice sharing
• 700 OPX experts trained
• >600 measures ongoing
11 | December 9th, 2016 | Capital Market Day 2016 – Meet Management | Components Technology
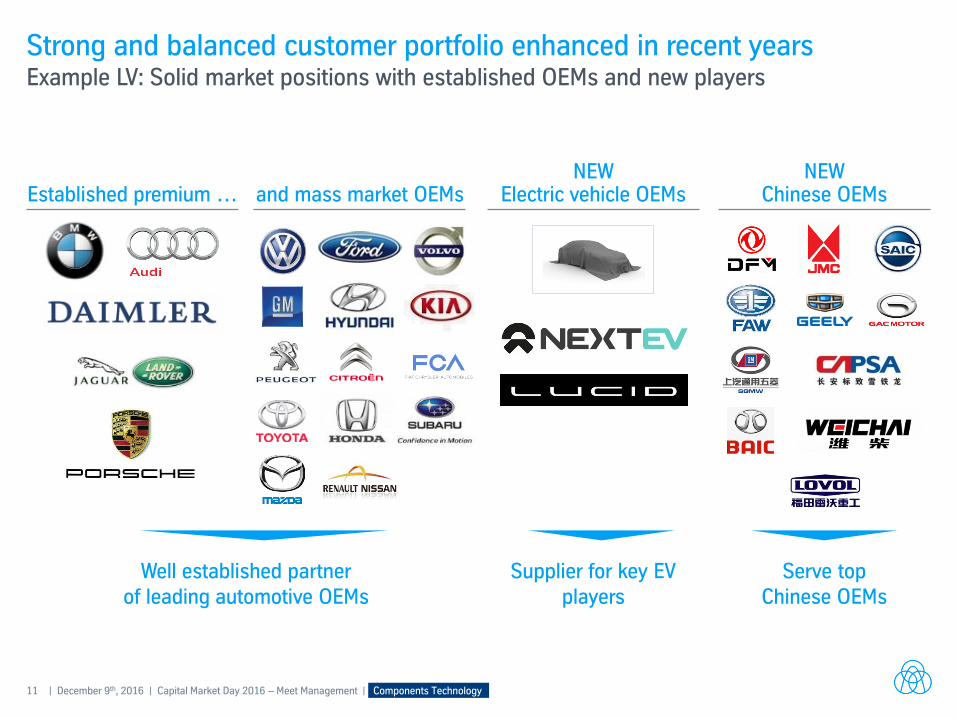
Strong and balanced customer portfolio enhanced in recent years Example LV: Solid market positions with established OEMs and new players
Established premium …
Well established partner of leading automotive OEMs
NEW Electric vehicle OEMs
Supplier for key EV players
NEW Chinese OEMs
Serve top Chinese OEMs
and mass market OEMs
12 | December 9th, 2016 | Capital Market Day 2016 – Meet Management | Components Technology
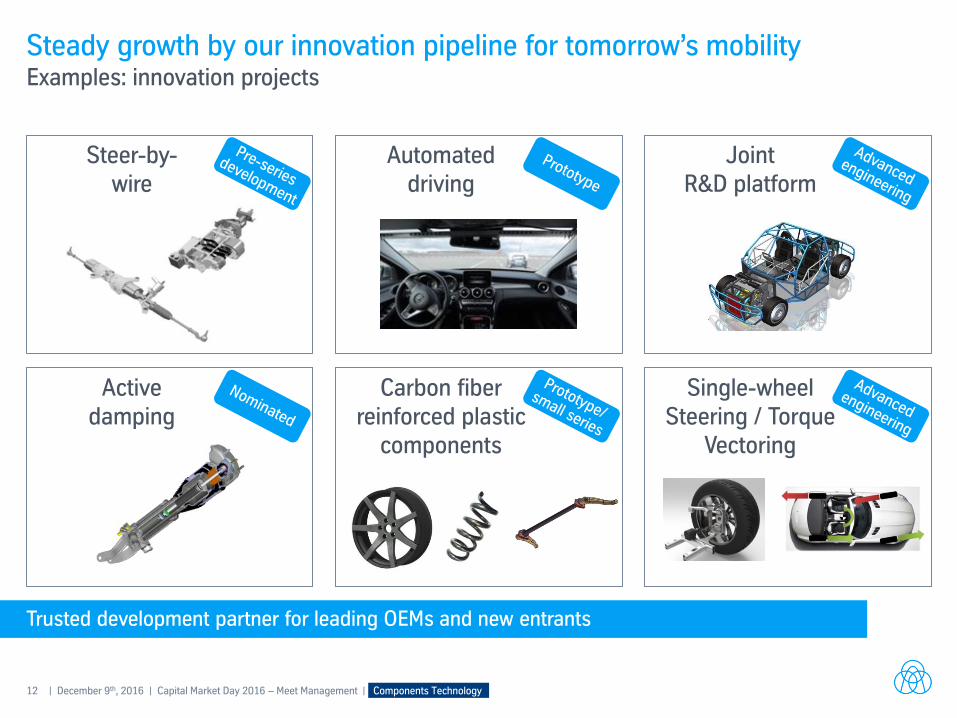
Steady growth by our innovation pipeline for tomorrow’s mobility Examples: innovation projects
Trusted development partner for leading OEMs and new entrants
Automated driving
Active damping
Carbon fiber reinforced plastic
components
Single-wheel Steering / Torque
Vectoring
Joint R&D platform
Steer-by- wire
13 | December 9th, 2016 | Capital Market Day 2016 – Meet Management | Components Technology
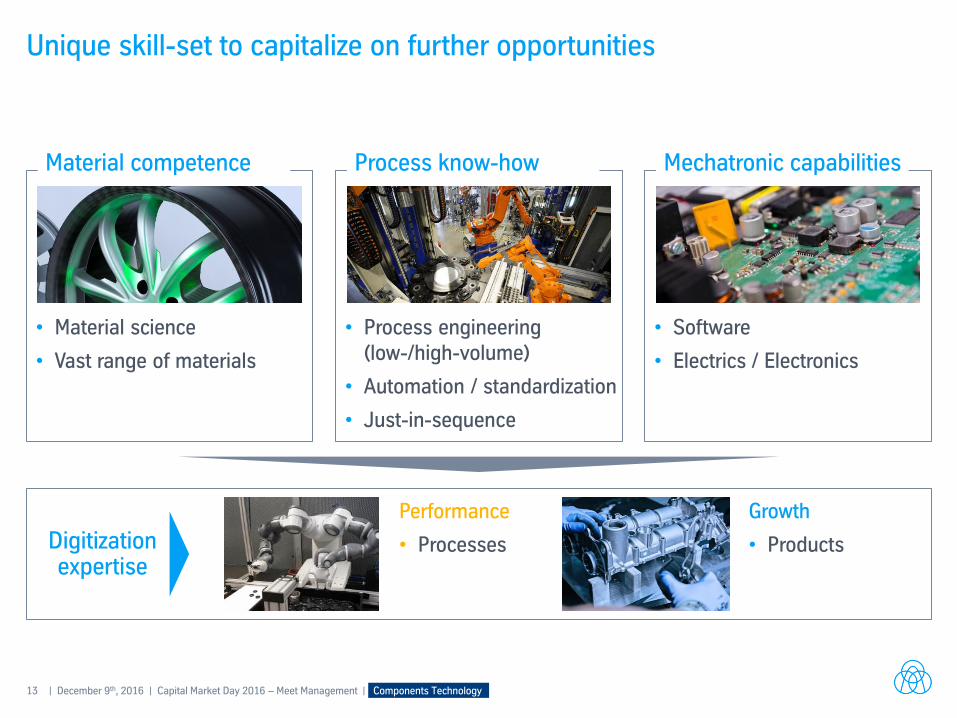
Unique skill-set to capitalize on further opportunities
Material competence Process know-how Mechatronic capabilities
Digitization expertise
• Material science
• Vast range of materials
• Process engineering (low-/high-volume)
• Automation / standardization
• Just-in-sequence
• Software
• Electrics / Electronics
Performance
• Processes
Growth
• Products
14 | December 9th, 2016 | Capital Market Day 2016 – Meet Management | Components Technology
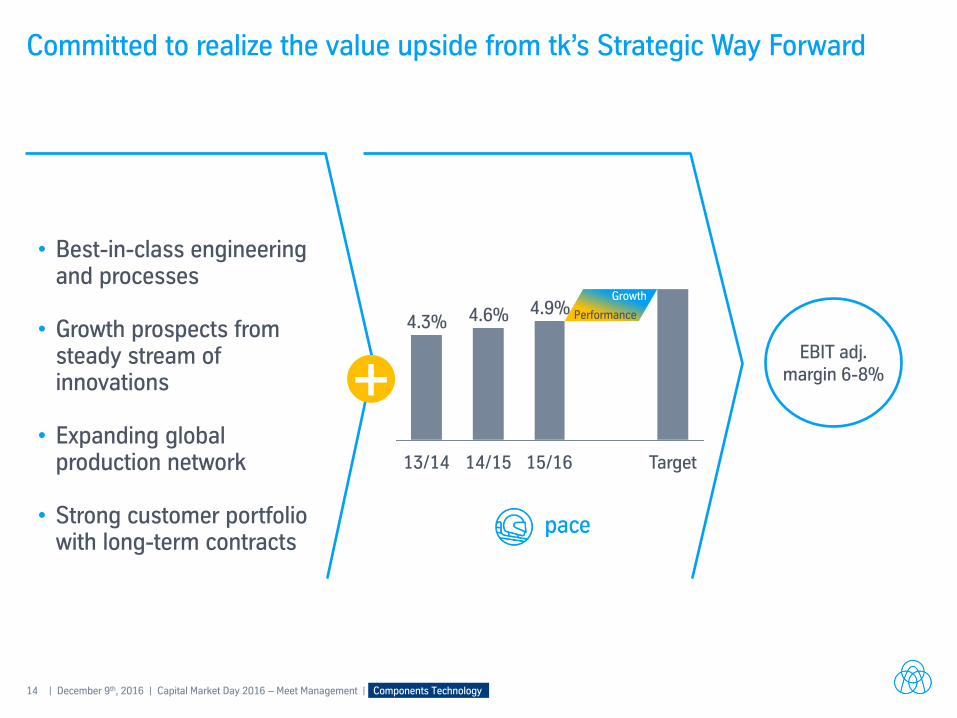
Committed to realize the value upside from tk’s Strategic Way Forward
• Best-in-class engineering and processes
• Growth prospects from
steady stream of innovations
• Expanding global
production network • Strong customer portfolio
with long-term contracts
+ Target 15/16
4.9%
14/15
4.6%
13/14
4.3%
Growth
Performance
EBIT adj. margin 6-8%
Capital Market Day 2016 Meet Management
Capital Market Day 2016 – Meet Management
Elevator Technology
Essen, December 9th, 2016 Andreas Schierenbeck (CEO) I Ercan Keles (CFO)
2 | December 9th, 2016 | Capital Market Day 2016 – Meet Management I Elevator Technology thyssenkrupp
thyssenkrupp – a diversified industrial group Sales €39.6 bn; EBIT adj. €1.5 bn
Components Technology (CT)
Materials Services (MX)
Financial figures FY 15/16
Steel Americas (AM)
€1.5 bn €(33) mn
Steel Europe (SE)
€7.6 bn €315 mn
€11.9 bn €128 mn
Elevator Technology (ET)
€7.5 bn €860 mn
€6.8 bn €335 mn
Industrial Solutions (IS)
€5.7 bn €355 mn
3 | December 9th, 2016 | Capital Market Day 2016 – Meet Management I Elevator Technology thyssenkrupp
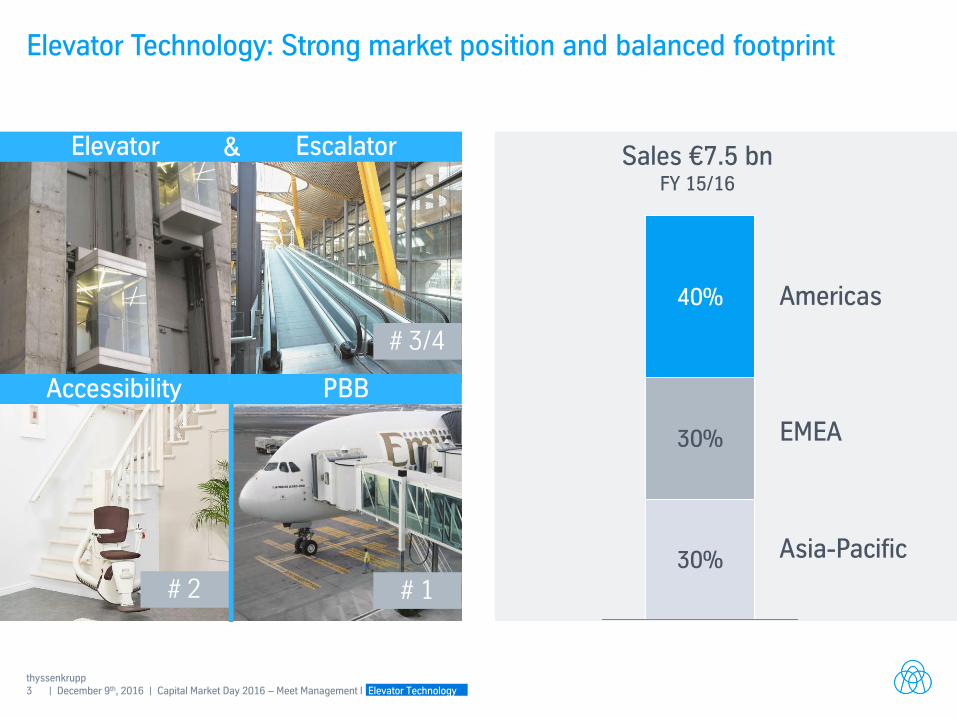
Elevator Technology: Strong market position and balanced footprint
13%
Escalator
Accessibility PBB
# 1
# 3/4
Elevator & Sales €7.5 bn FY 15/16
Americas
# 2
30%
30%
40%
EMEA
Asia-Pacific
4 | December 9th, 2016 | Capital Market Day 2016 – Meet Management I Elevator Technology thyssenkrupp
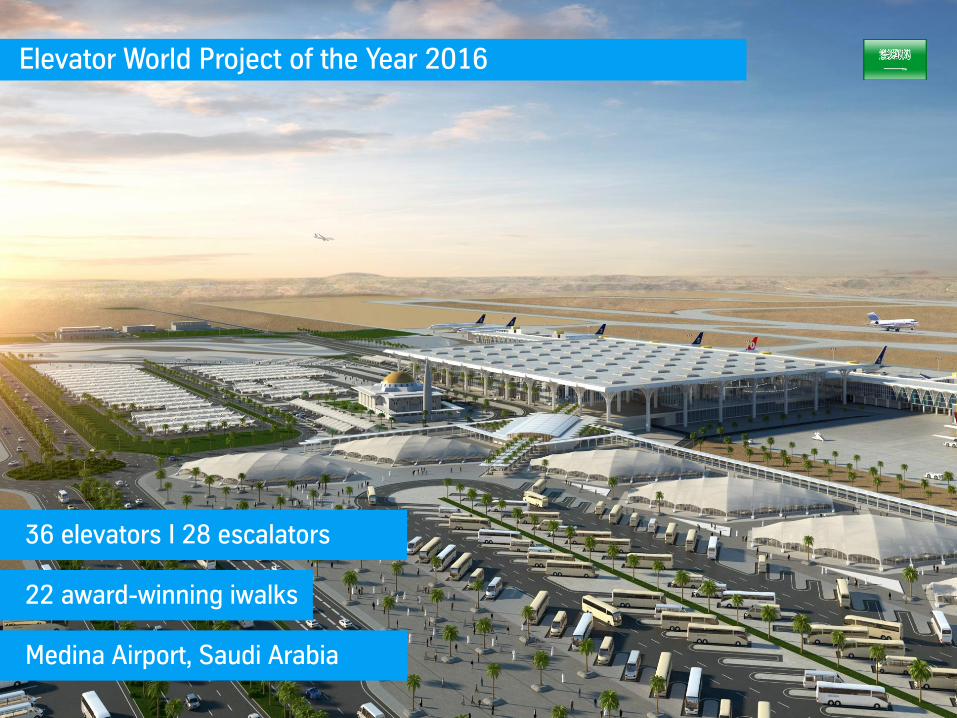
Elevator World Project of the Year 2016
36 elevators I 28 escalators
22 award-winning iwalks
Medina Airport, Saudi Arabia
5 | December 9th, 2016 | Capital Market Day 2016 – Meet Management I Elevator Technology thyssenkrupp
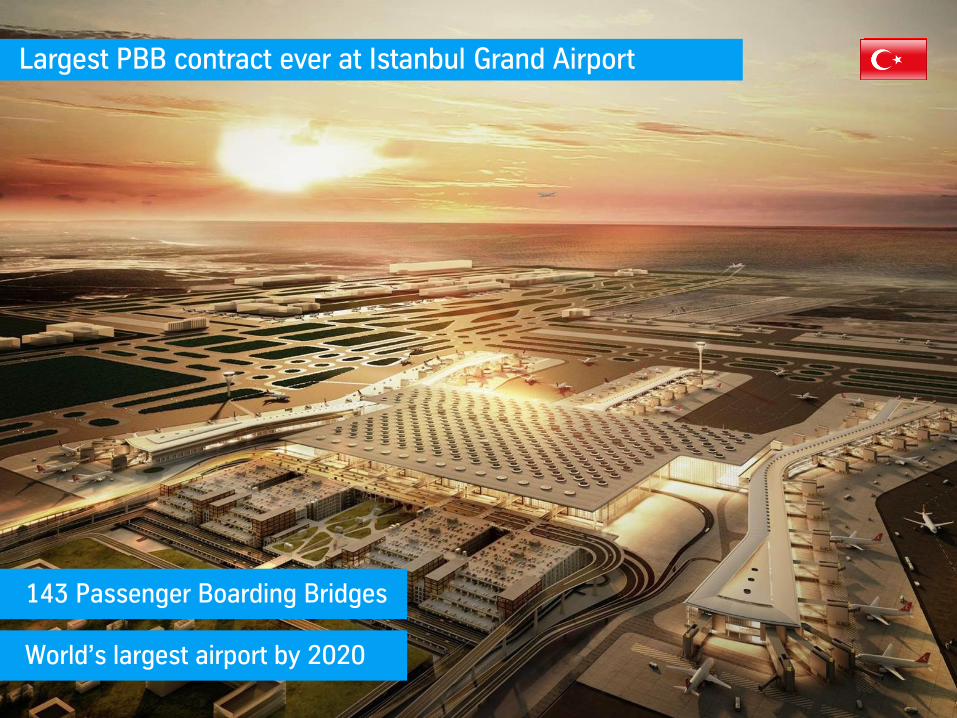
Largest PBB contract ever at Istanbul Grand Airport
143 Passenger Boarding Bridges
World’s largest airport by 2020
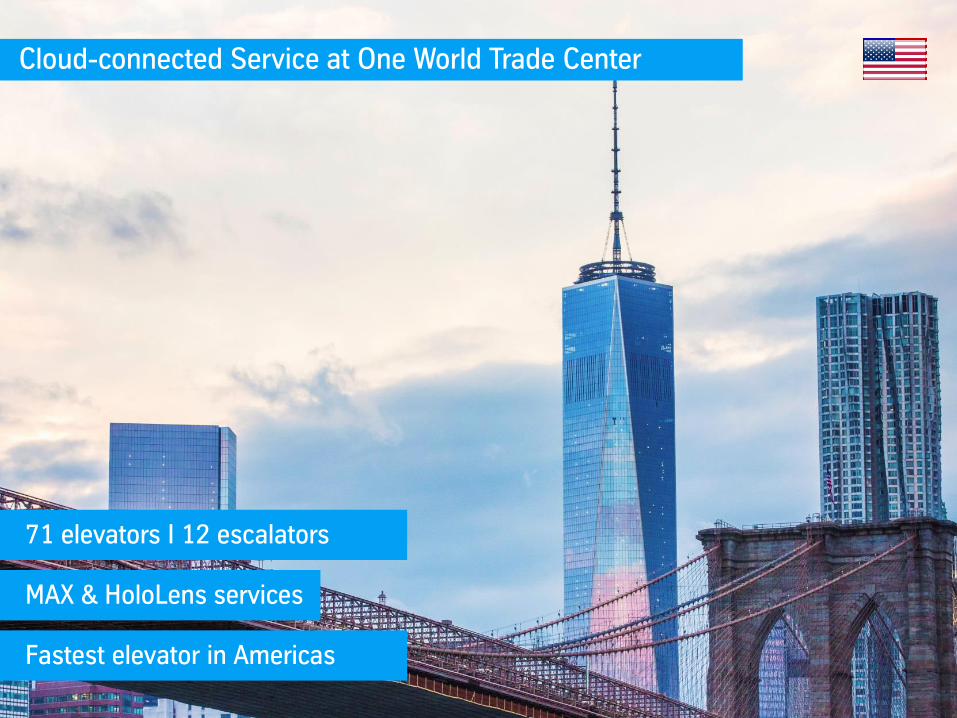
Cloud-connected Service at One World Trade Center
71 elevators I 12 escalators
MAX & HoloLens services
Fastest elevator in Americas
7 | December 9th, 2016 | Capital Market Day 2016 – Meet Management I Elevator Technology thyssenkrupp
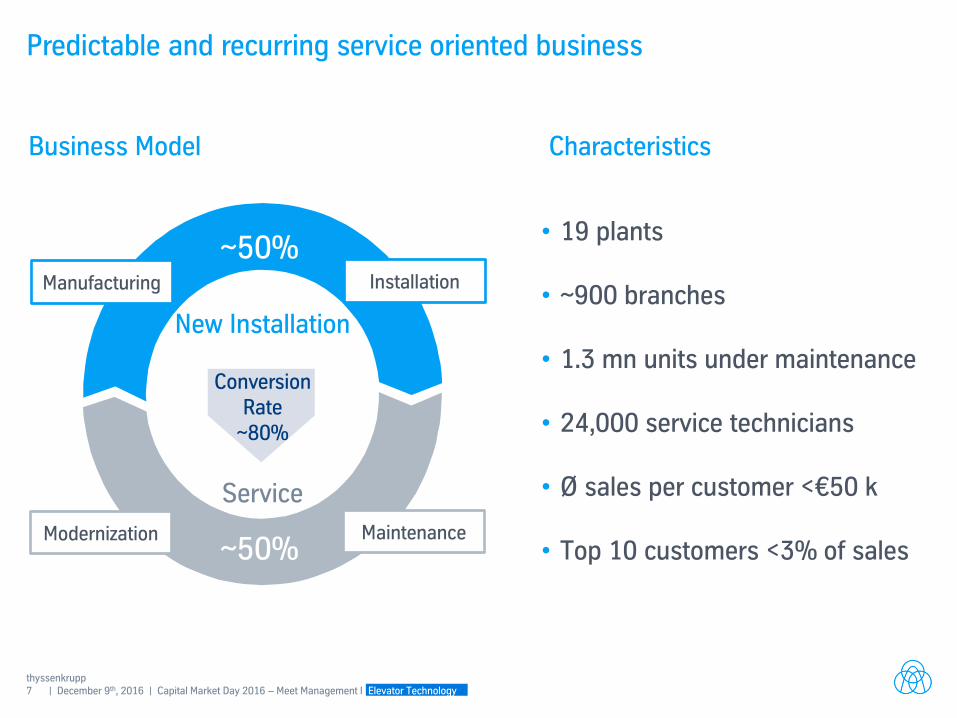
Predictable and recurring service oriented business
• 19 plants
• ~900 branches
• 1.3 mn units under maintenance
• 24,000 service technicians • Ø sales per customer <€50 k
• Top 10 customers <3% of sales
Service
New Installation
Conversion Rate
~80%
~50%
~50% Manufacturing Installation
Modernization Maintenance
Business Model Characteristics
8 | December 9th, 2016 | Capital Market Day 2016 – Meet Management I Elevator Technology thyssenkrupp
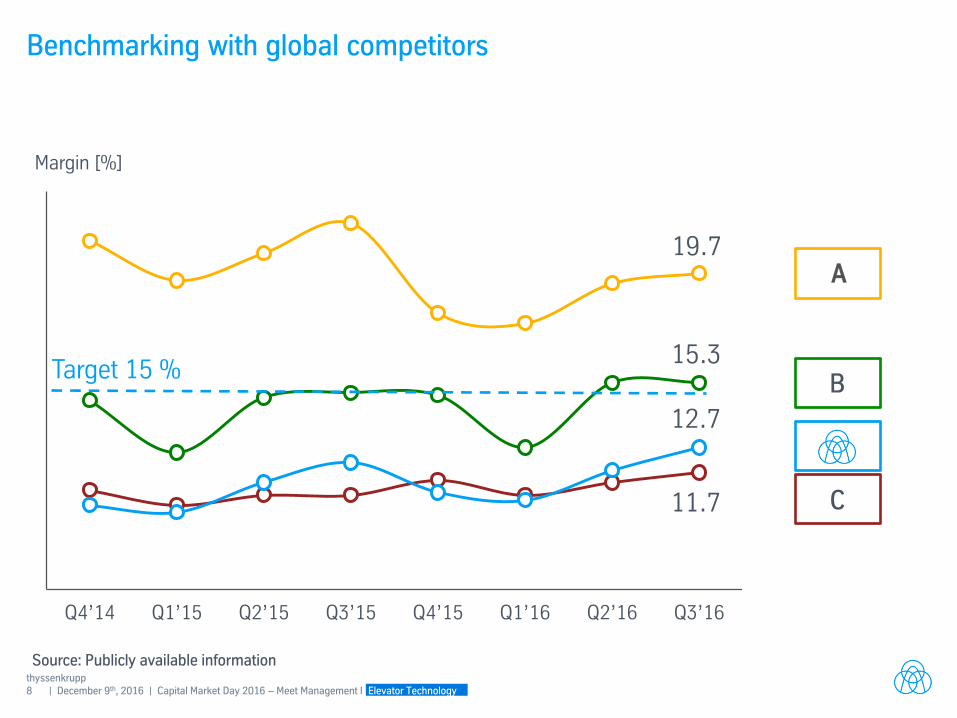
Benchmarking with global competitors
Q4’14 Q1’15 Q2’15 Q3’15 Q4’15 Q1’16 Q2’16 Q3’16
19.7
15.3
12.7
11.7
Target 15 %
Source: Publicly available information
A
B
C
Margin [%]
9 | December 9th, 2016 | Capital Market Day 2016 – Meet Management I Elevator Technology thyssenkrupp
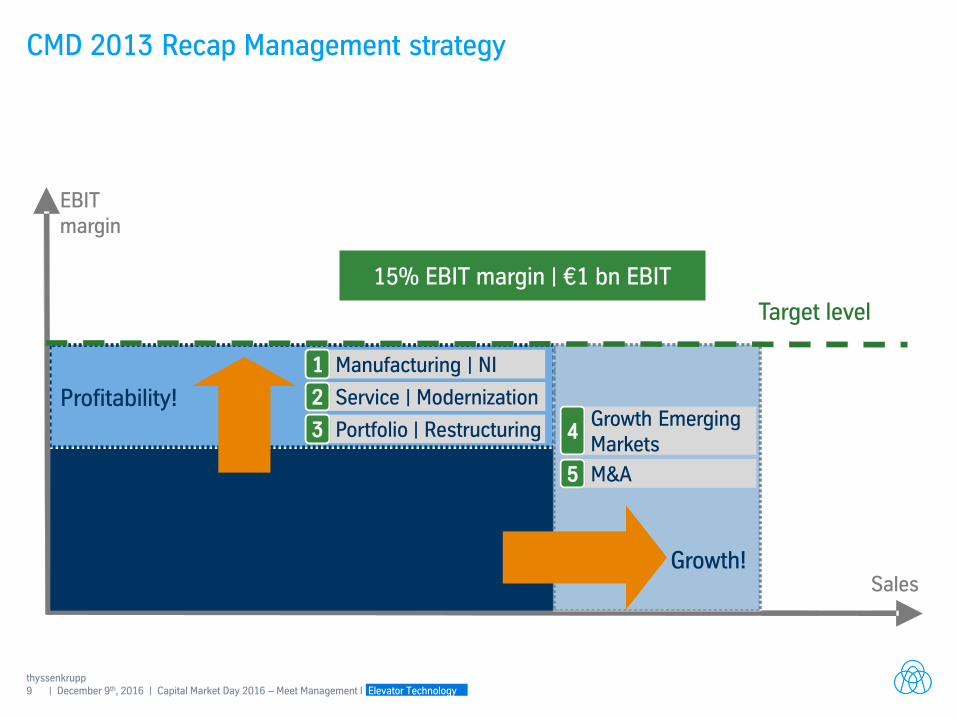
CMD 2013 Recap Management strategy
EBIT margin
Sales
Target level
Profitability!
Growth!
Growth Emerging Markets
2
M&A 5
Portfolio | Restructuring 3
Manufacturing | NI 1 Service | Modernization 2
Manufacturing | NI 1
15% EBIT margin | €1 bn EBIT
1
2
3 4
5
10 | December 9th, 2016 | Capital Market Day 2016 – Meet Management I Elevator Technology thyssenkrupp
Growth Markets
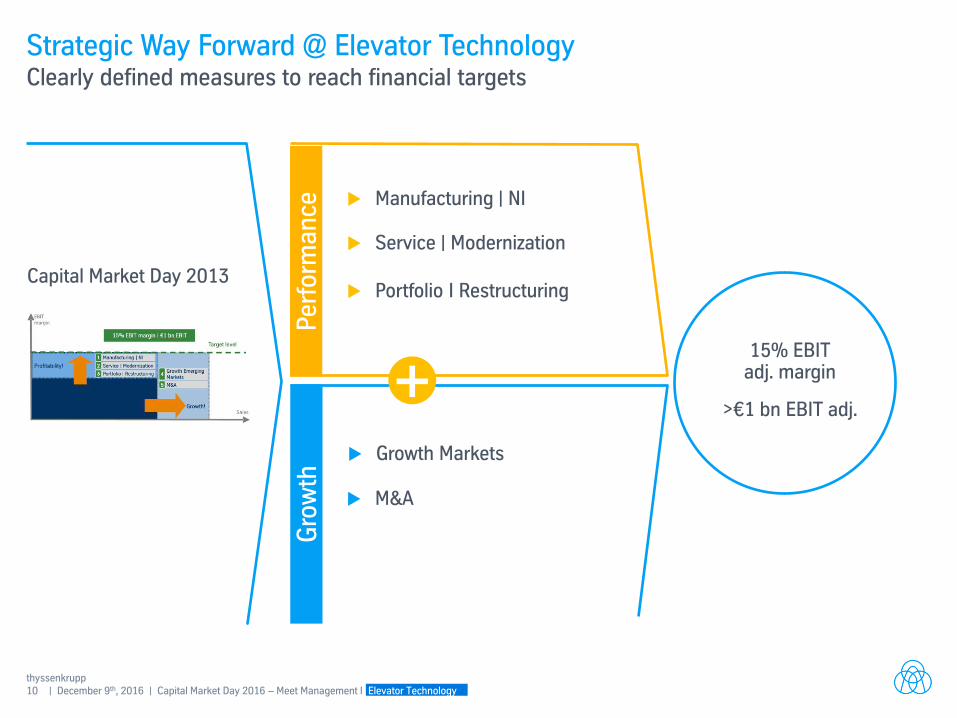
Strategic Way Forward @ Elevator Technology Clearly defined measures to reach financial targets
Manufacturing | NI
+
Per
form
an
ce
Gro
wth
15% EBIT adj. margin
>€1 bn EBIT adj.
Service | Modernization
Portfolio I Restructuring
M&A
Capital Market Day 2013
11 | December 9th, 2016 | Capital Market Day 2016 – Meet Management I Elevator Technology thyssenkrupp
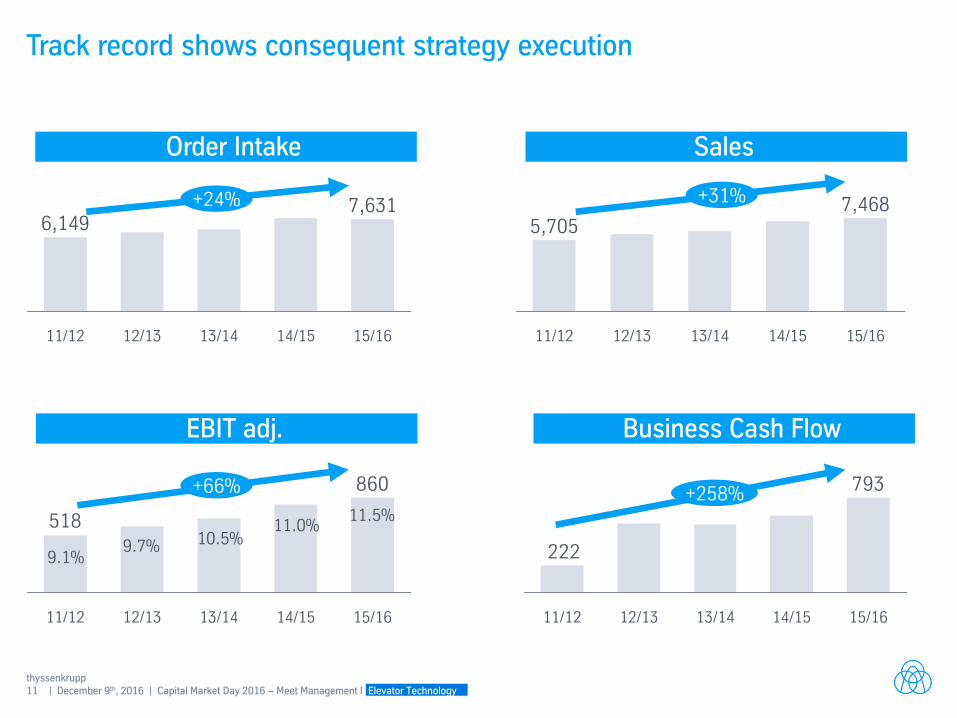
Track record shows consequent strategy execution
Order Intake
15/16
7,631
14/15 13/14 12/13 11/12
6,149 +24%
Sales
14/15 13/14 12/13 11/12
5,705
15/16
7,468 +31%
EBIT adj.
860
518
12/13 11/12 13/14 15/16 14/15
+66%
Business Cash Flow
793
222
15/16 13/14 14/15 12/13 11/12
+258% 11.5%
11.0% 10.5%
9.1% 9.7%
12 | December 9th, 2016 | Capital Market Day 2016 – Meet Management I Elevator Technology thyssenkrupp
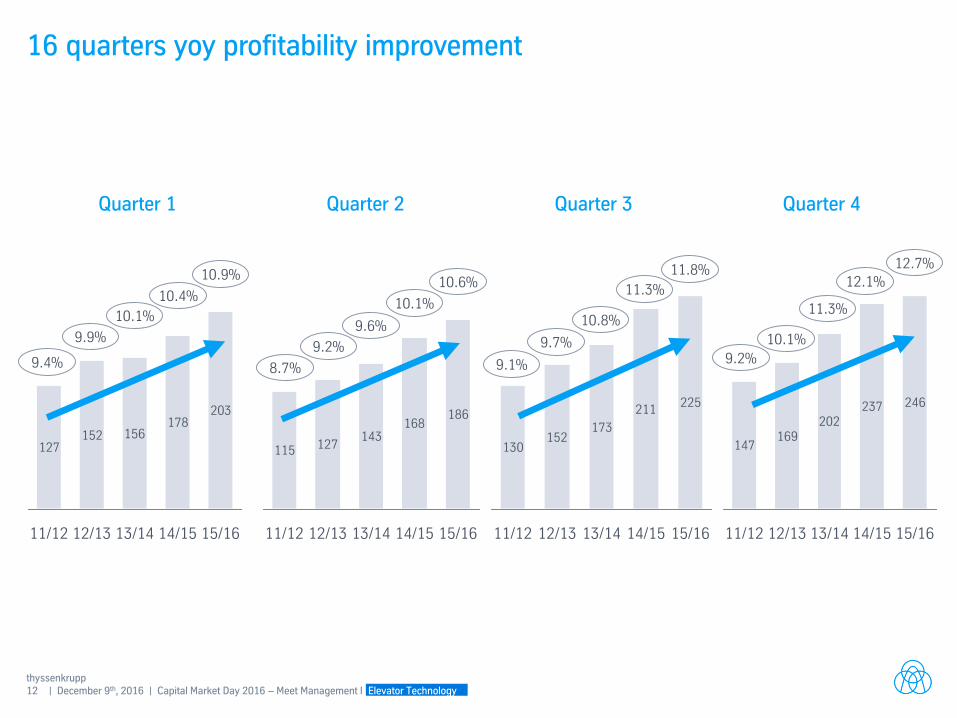
Quarter 1 Quarter 2
127152
178203
15/16 14/15 13/14
156
12/13 11/12
115 127143
168186
13/14 12/13 11/12 15/16 14/15
10.1%
9.9%
9.4%
Quarter 3
130152
173
211225
15/16 14/15 13/14 12/13 11/12
9.6%
9.2%
8.7%
Quarter 4
147169
202237 246
14/15 13/14 12/13 11/12 15/16
10.4% 10.1%
10.9% 10.6%
10.8%
9.7%
9.1%
10.1%
9.2%
11.3%
11.3% 12.1%
11.8%
16 quarters yoy profitability improvement
12.7%
13 | December 9th, 2016 | Capital Market Day 2016 – Meet Management I Elevator Technology thyssenkrupp
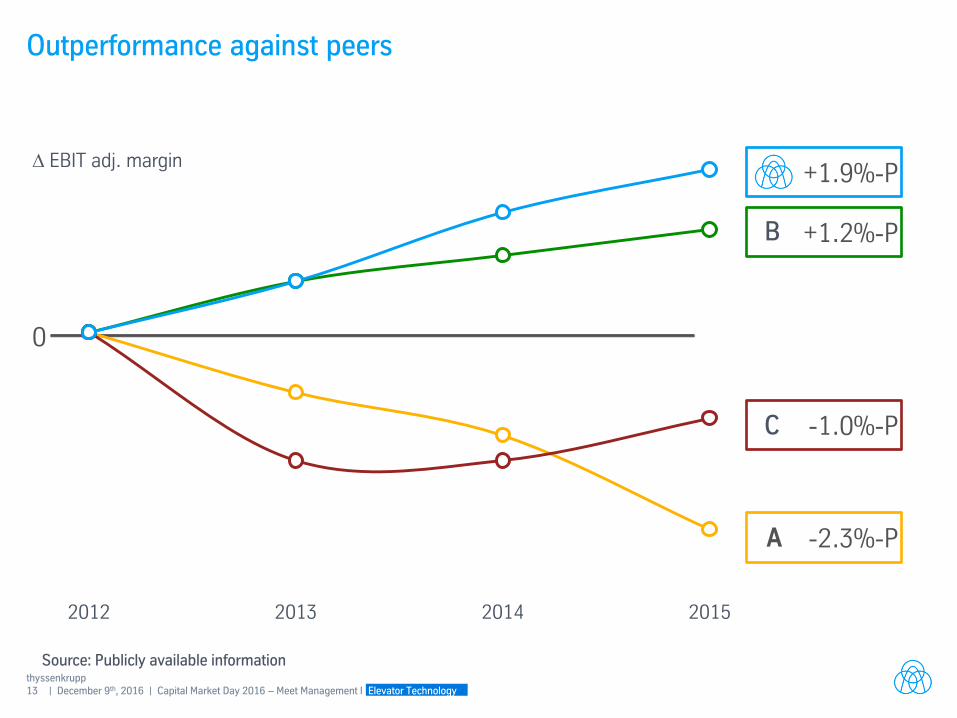
Outperformance against peers
Source: Publicly available information
-2.3%-P
+1.2%-P
+1.9%-P
-1.0%-P
0
2012 2013 2014 2015
A
B
C
∆ EBIT adj. margin
14 | December 9th, 2016 | Capital Market Day 2016 – Meet Management I Elevator Technology thyssenkrupp
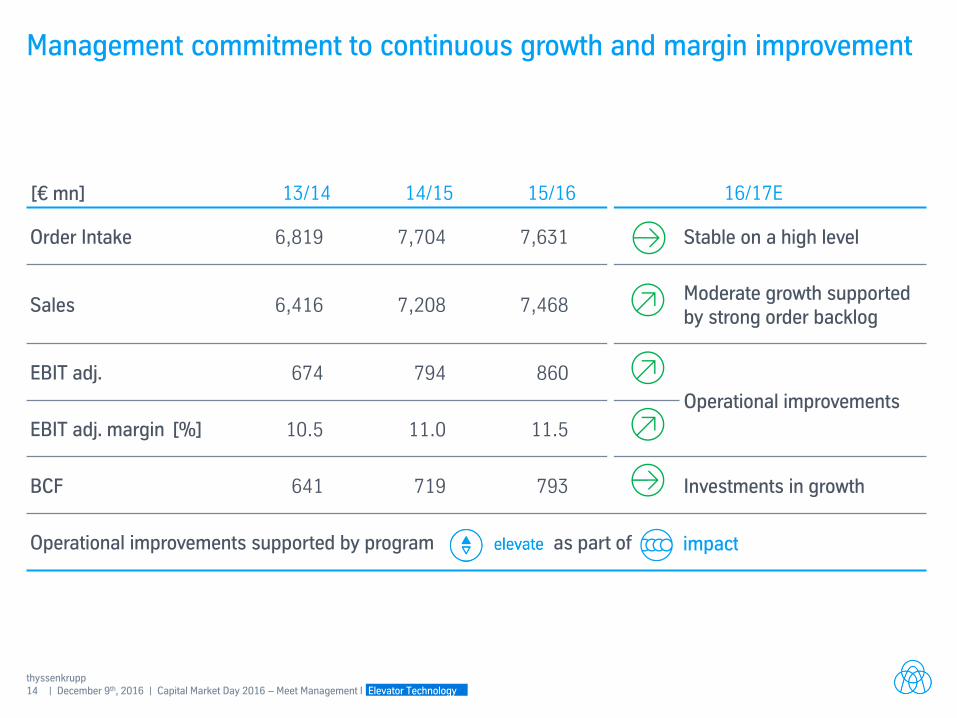
Management commitment to continuous growth and margin improvement
13/14 14/15 15/16 16/17E
Order Intake 6,819 7,704 7,631 Stable on a high level
Sales
6,416 7,208 7,468 Moderate growth supported by strong order backlog
EBIT adj. 674 794 860
Operational improvements
EBIT adj. margin [%] 10.5 11.0 11.5
BCF 641 719 793 Investments in growth
Operational improvements supported by program as part of
[€ mn]
15 | December 9th, 2016 | Capital Market Day 2016 – Meet Management I Elevator Technology thyssenkrupp
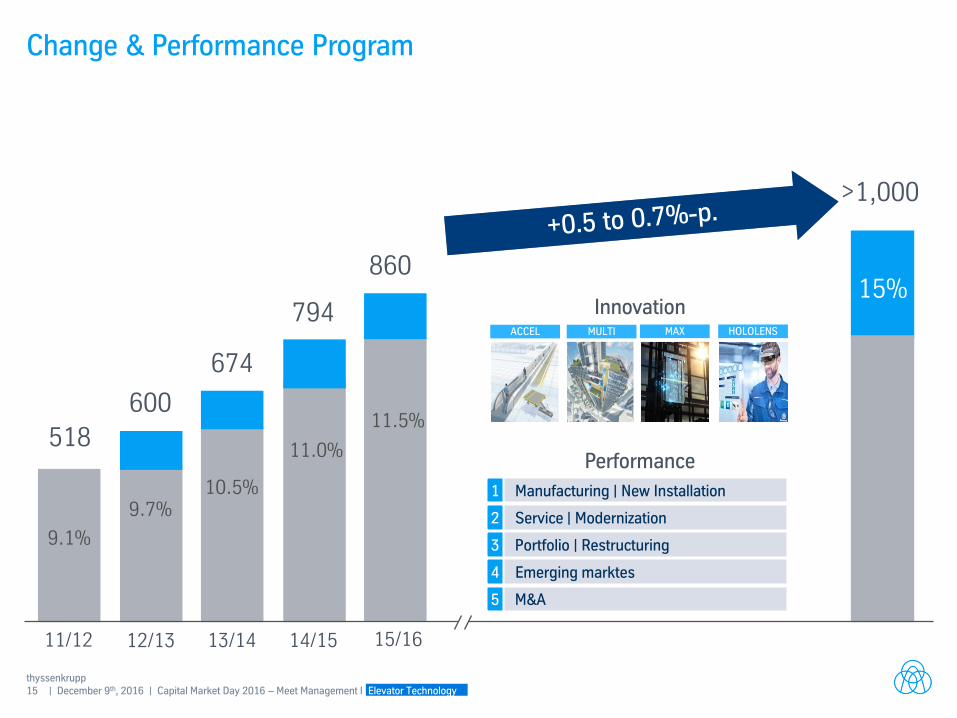
>1,000
15% 860
11.5% 518
9.1%
11/12
600
9.7%
12/13
674
10.5%
13/14
794
11.0%
14/15 15/16
Innovation
Manufacturing | New Installation
Service | Modernization
Portfolio | Restructuring
Emerging marktes
M&A
1
2
3
4
5
MAX HOLOLENS ACCEL MULTI
Performance
Change & Performance Program
16 | December 9th, 2016 | Capital Market Day 2016 – Meet Management I Elevator Technology thyssenkrupp
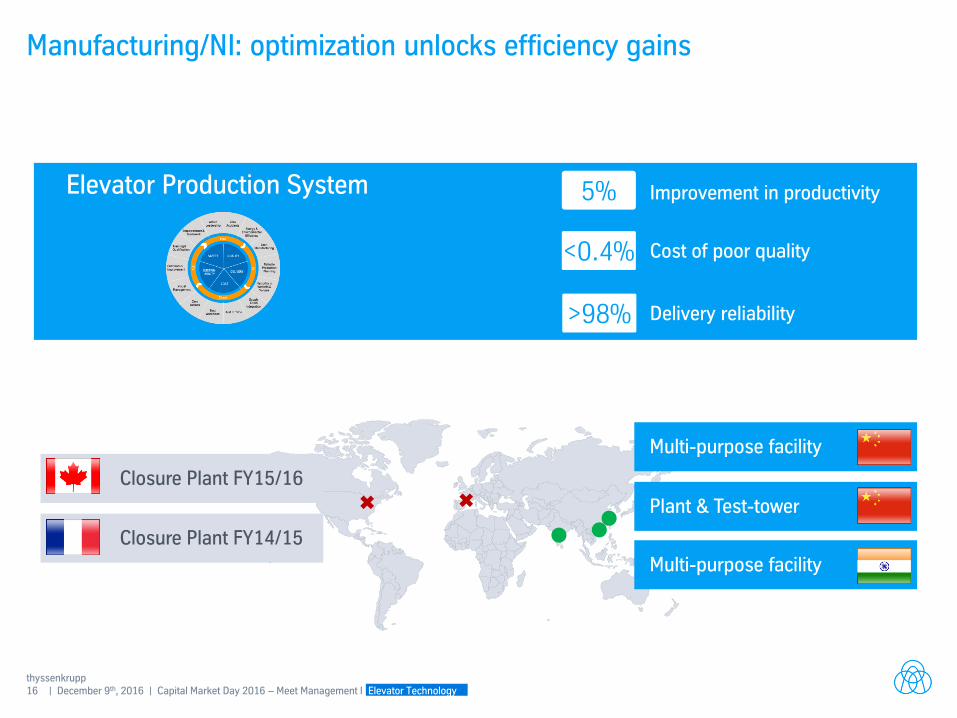
Improvement in productivity
Delivery reliability >98%
5%
Manufacturing/NI: optimization unlocks efficiency gains
Multi-purpose facility
Multi-purpose facility
Plant & Test-tower
Closure Plant FY15/16
Closure Plant FY14/15
Elevator Production System
Cost of poor quality <0.4%
17 | December 9th, 2016 | Capital Market Day 2016 – Meet Management I Elevator Technology thyssenkrupp
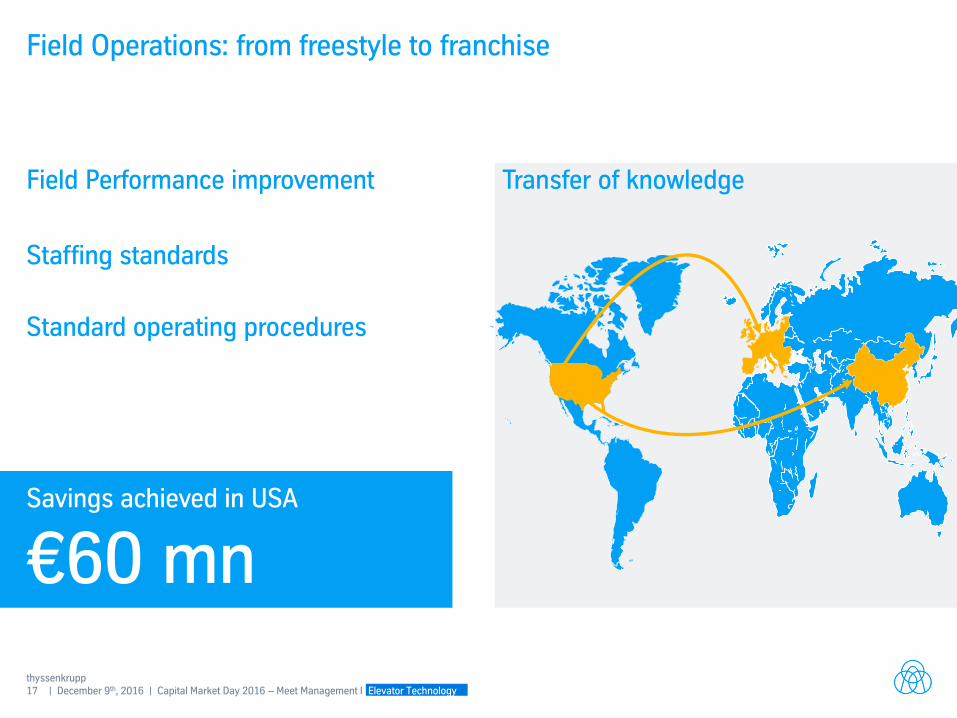
Field Operations: from freestyle to franchise
Field Performance improvement
Staffing standards
Standard operating procedures
Transfer of knowledge
Savings achieved in USA
€60 mn
18 | December 9th, 2016 | Capital Market Day 2016 – Meet Management I Elevator Technology thyssenkrupp
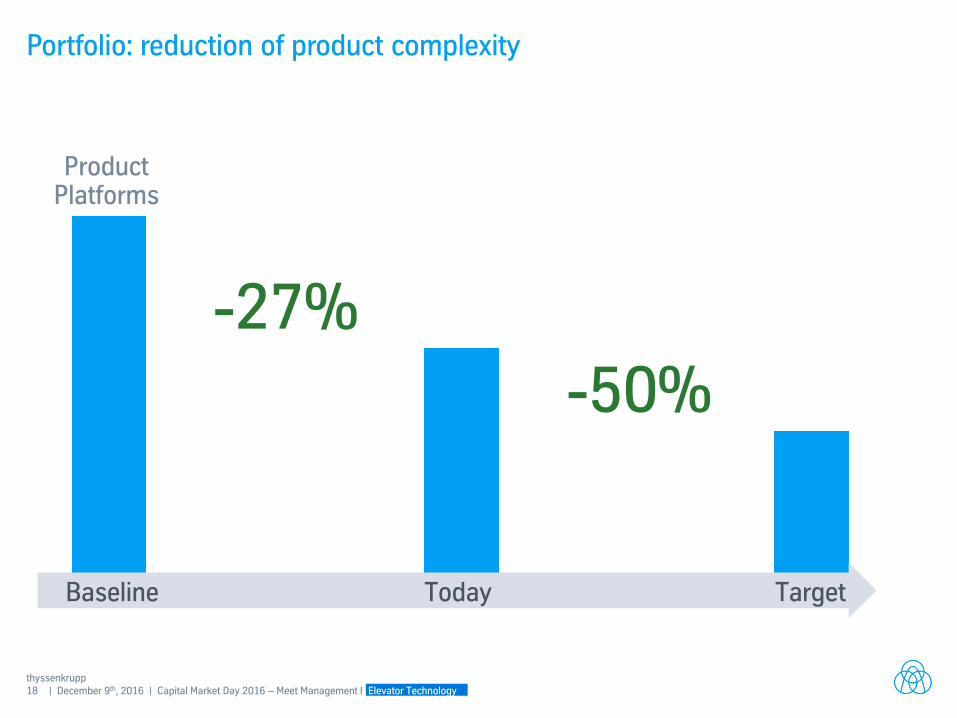
Portfolio: reduction of product complexity
Baseline
-27%
-50%
Product Platforms
Today Target
19 | December 9th, 2016 | Capital Market Day 2016 – Meet Management I Elevator Technology thyssenkrupp
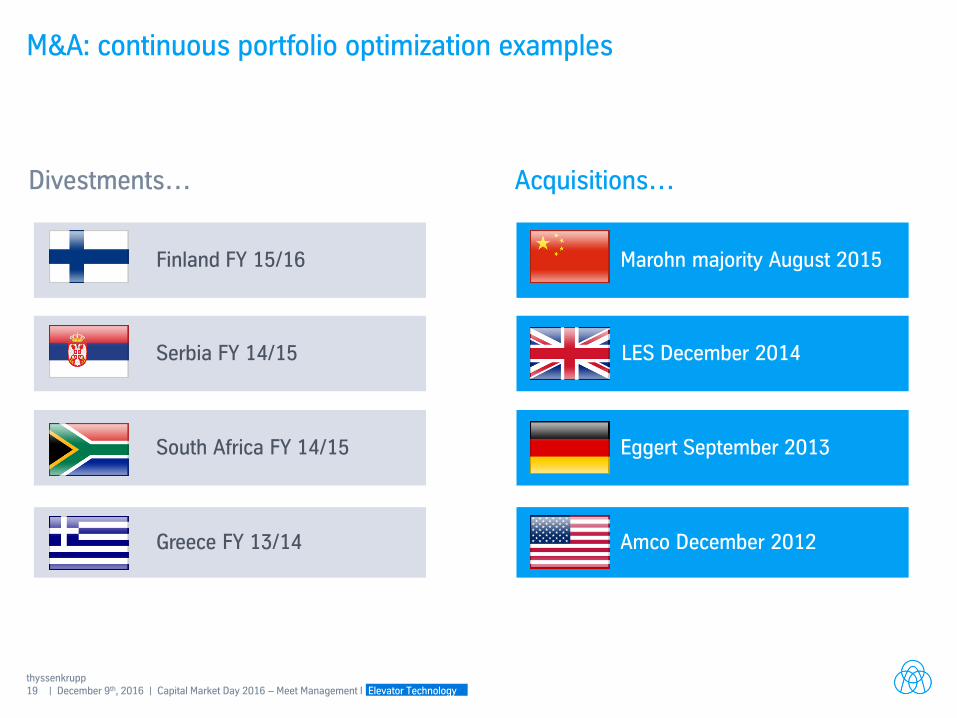
Eggert September 2013
Marohn majority August 2015
LES December 2014
South Africa FY 14/15
Greece FY 13/14
Serbia FY 14/15
Finland FY 15/16
M&A: continuous portfolio optimization examples
Divestments… Acquisitions…
Amco December 2012
20 | December 9th, 2016 | Capital Market Day 2016 – Meet Management I Elevator Technology thyssenkrupp
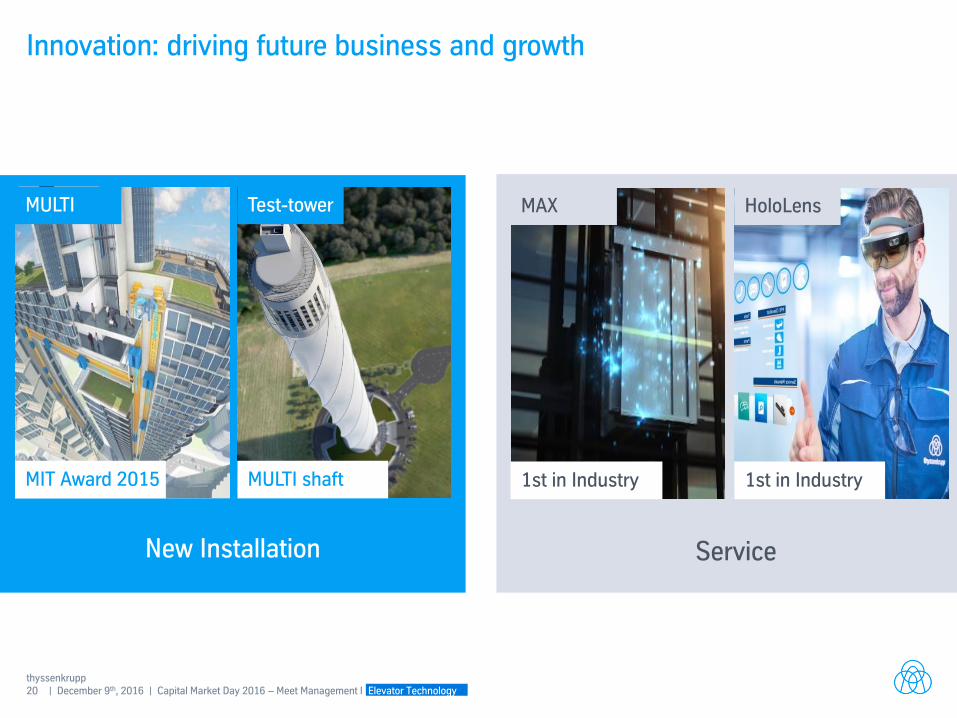
Service
New Installation
Innovation: driving future business and growth
Test-tower MAX HoloLens
MULTI shaft 1st in Industry 1st in Industry
MULTI
MIT Award 2015
21 | December 9th, 2016 | Capital Market Day 2016 – Meet Management I Elevator Technology thyssenkrupp
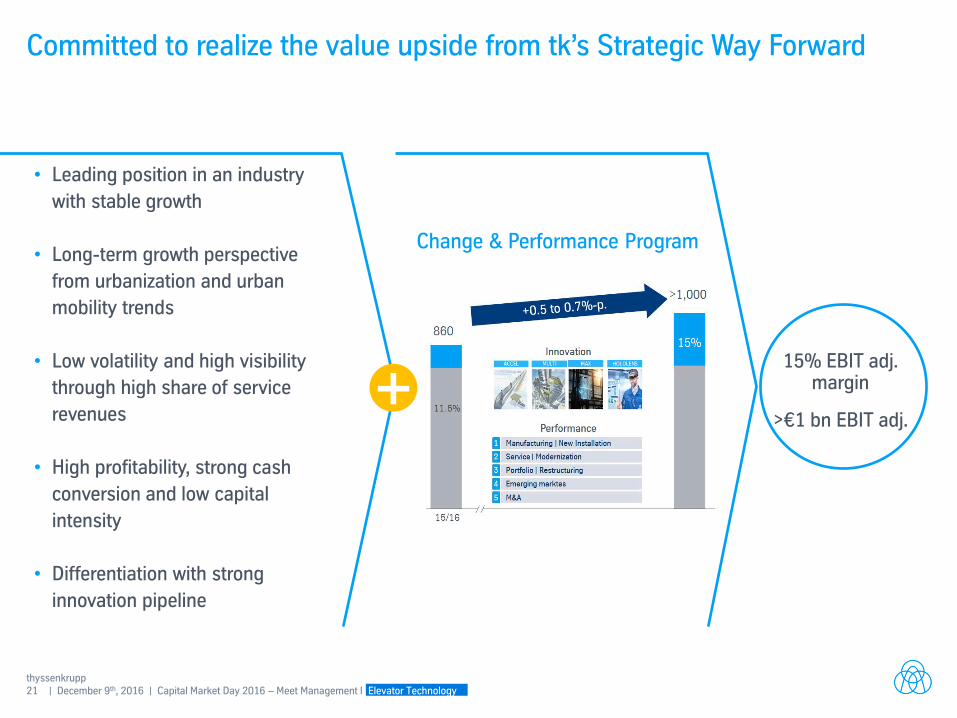
Committed to realize the value upside from tk’s Strategic Way Forward
• Leading position in an industry
with stable growth
• Long-term growth perspective
from urbanization and urban
mobility trends
• Low volatility and high visibility
through high share of service
revenues
• High profitability, strong cash
conversion and low capital
intensity
• Differentiation with strong
innovation pipeline
15% EBIT adj. margin
>€1 bn EBIT adj. +
Change & Performance Program
22 | December 9th, 2016 | Capital Market Day 2016 – Meet Management I Elevator Technology thyssenkrupp
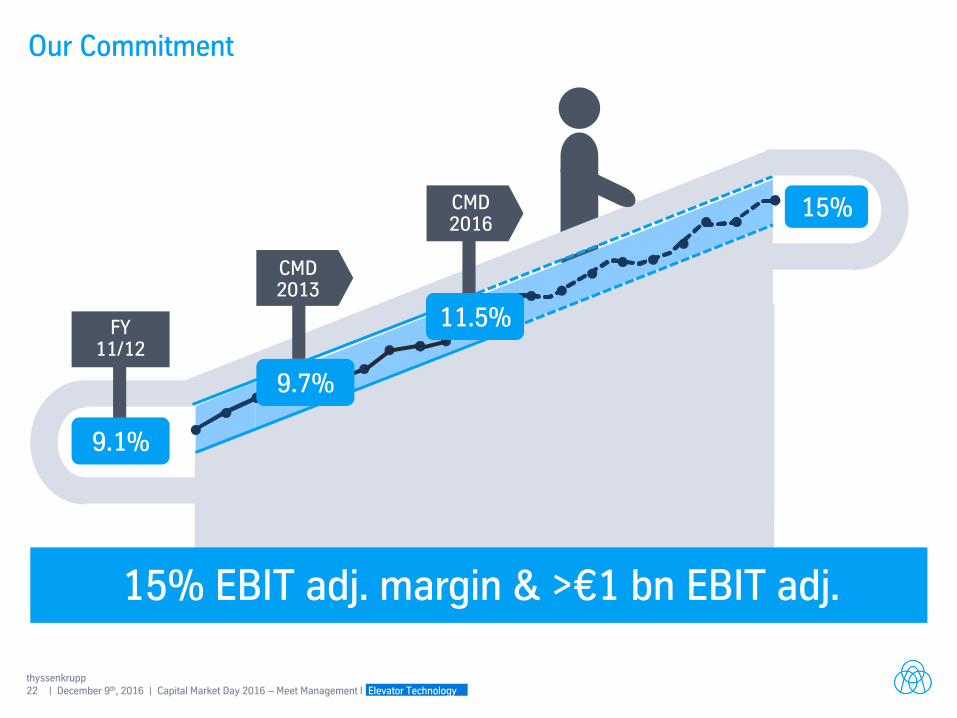
Our Commitment
15% EBIT adj. margin & >€1 bn EBIT adj.
FY 11/12
CMD 2016
9.1%
9.7%
15%
11.5%
CMD 2013

Capital Market Day 2016 Meet Management
Capital Market Day 2016 – Meet Management
Industrial Solutions
Essen, December 9th, 2016 Stefan Gesing (CEO/CFO) | Johan P. Cnossen (COO)
2 December 9th, 2016 | Capital Market Day 2016 – Meet Management | Industrial Solutions
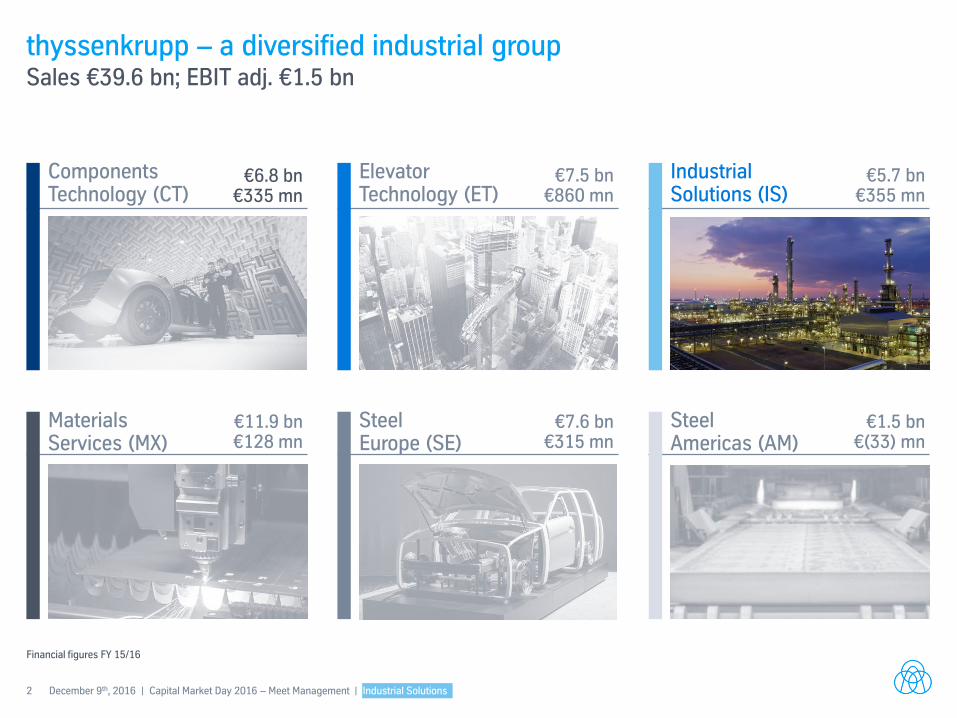
thyssenkrupp – a diversified industrial group Sales €39.6 bn; EBIT adj. €1.5 bn
Components Technology (CT)
Materials Services (MX)
Financial figures FY 15/16
Steel Americas (AM)
€1.5 bn €(33) mn
Steel Europe (SE)
€7.6 bn €315 mn
€11.9 bn €128 mn
Elevator Technology (ET)
€7.5 bn €860 mn
€6.8 bn €335 mn
Industrial Solutions (IS)
€5.7 bn €355 mn
3 December 9th, 2016 | Capital Market Day 2016 – Meet Management | Industrial Solutions
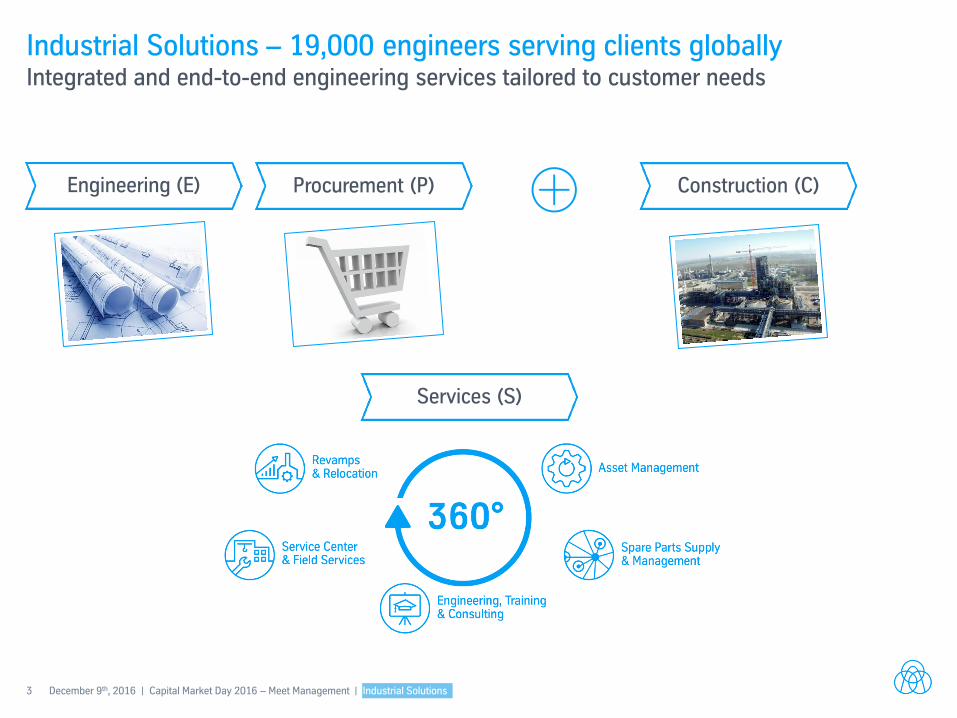
Industrial Solutions – 19,000 engineers serving clients globally Integrated and end-to-end engineering services tailored to customer needs
Construction (C) Engineering (E) Procurement (P)
Services (S)
4 December 9th, 2016 | Capital Market Day 2016 – Meet Management | Industrial Solutions
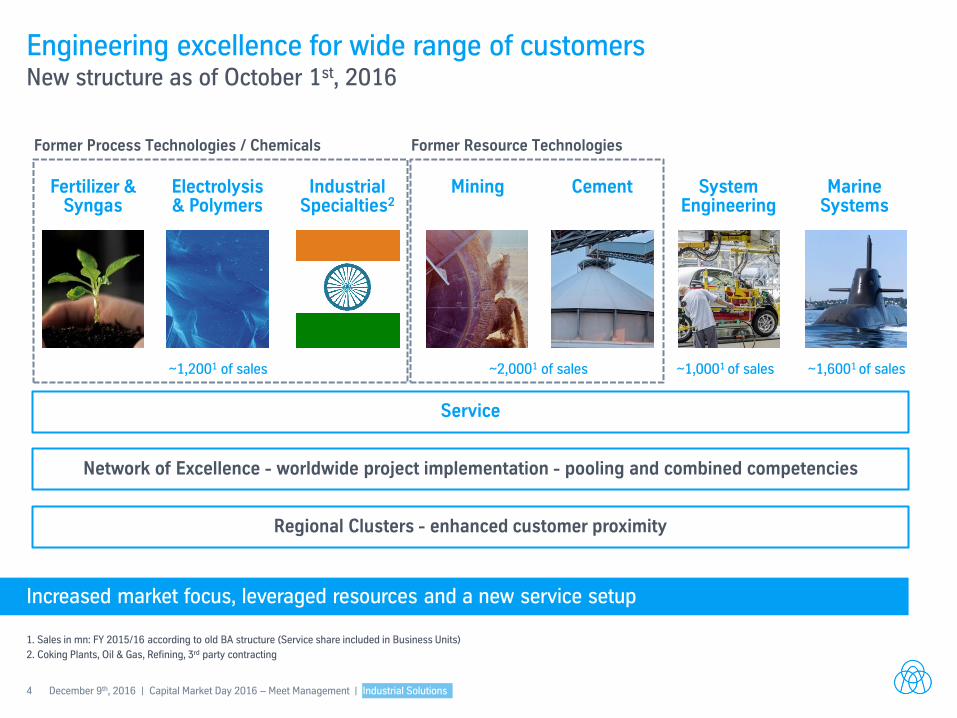
Engineering excellence for wide range of customers New structure as of October 1st, 2016
Fertilizer & Syngas
Electrolysis & Polymers
Cement Mining System Engineering
Industrial Specialties2
Marine Systems
2. Coking Plants, Oil & Gas, Refining, 3rd party contracting
Former Process Technologies / Chemicals Former Resource Technologies
1. Sales in mn: FY 2015/16 according to old BA structure (Service share included in Business Units)
~1,2001 of sales ~2,0001 of sales ~1,0001 of sales ~1,6001 of sales
Network of Excellence - worldwide project implementation - pooling and combined competencies
Regional Clusters - enhanced customer proximity
Service
Increased market focus, leveraged resources and a new service setup
5 December 9th, 2016 | Capital Market Day 2016 – Meet Management | Industrial Solutions
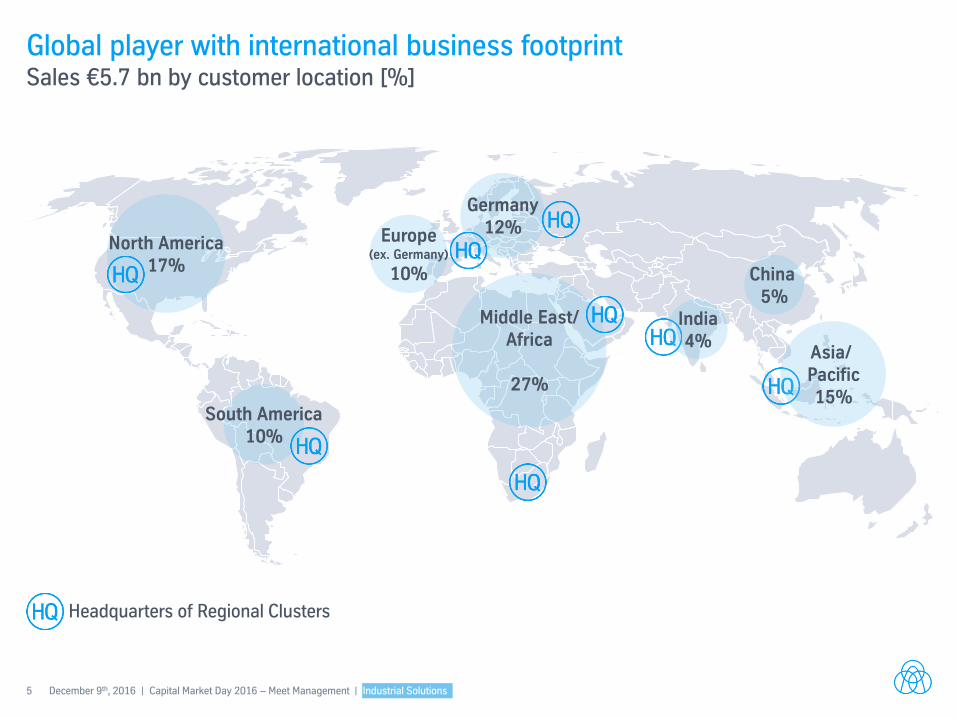
Global player with international business footprint Sales €5.7 bn by customer location [%]
North America 17%
South America 10%
Middle East/ Africa
27%
Germany 12% Europe
(ex. Germany)
10%
Headquarters of Regional Clusters
India 4%
China 5%
Asia/ Pacific 15%
6 December 9th, 2016 | Capital Market Day 2016 – Meet Management | Industrial Solutions
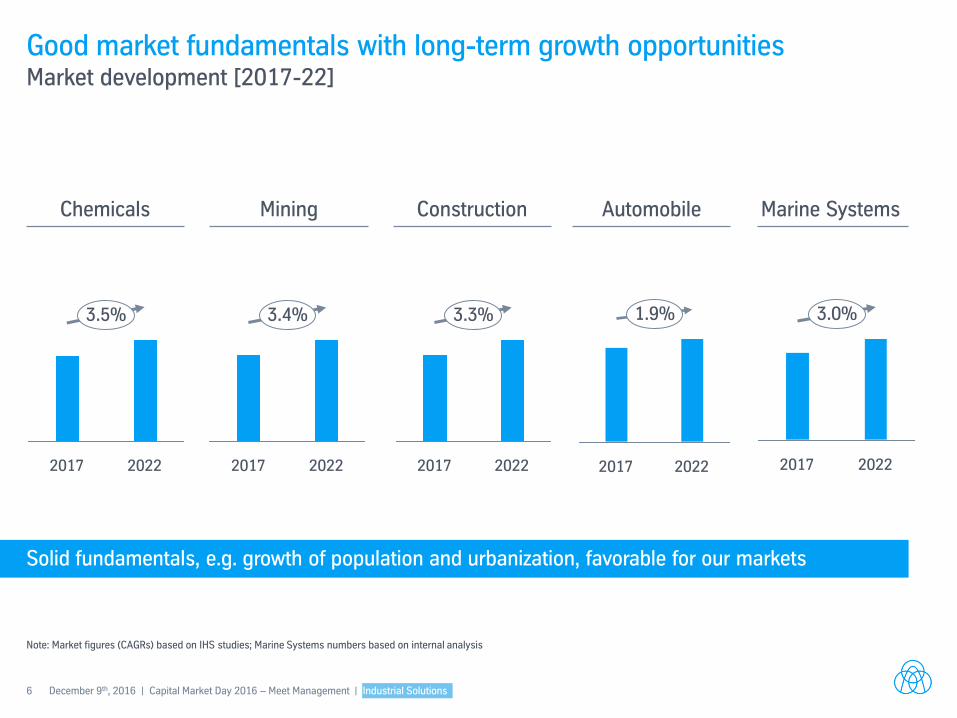
Good market fundamentals with long-term growth opportunities Market development [2017-22]
Note: Market figures (CAGRs) based on IHS studies; Marine Systems numbers based on internal analysis
Mining Automobile Marine Systems Chemicals Construction
3.5%
2022 2017
3.4%
2022 2017
3.3%
2022 2017 2022 2017
1.9% 3.0%
2022 2017
Solid fundamentals, e.g. growth of population and urbanization, favorable for our markets
7 December 9th, 2016 | Capital Market Day 2016 – Meet Management | Industrial Solutions
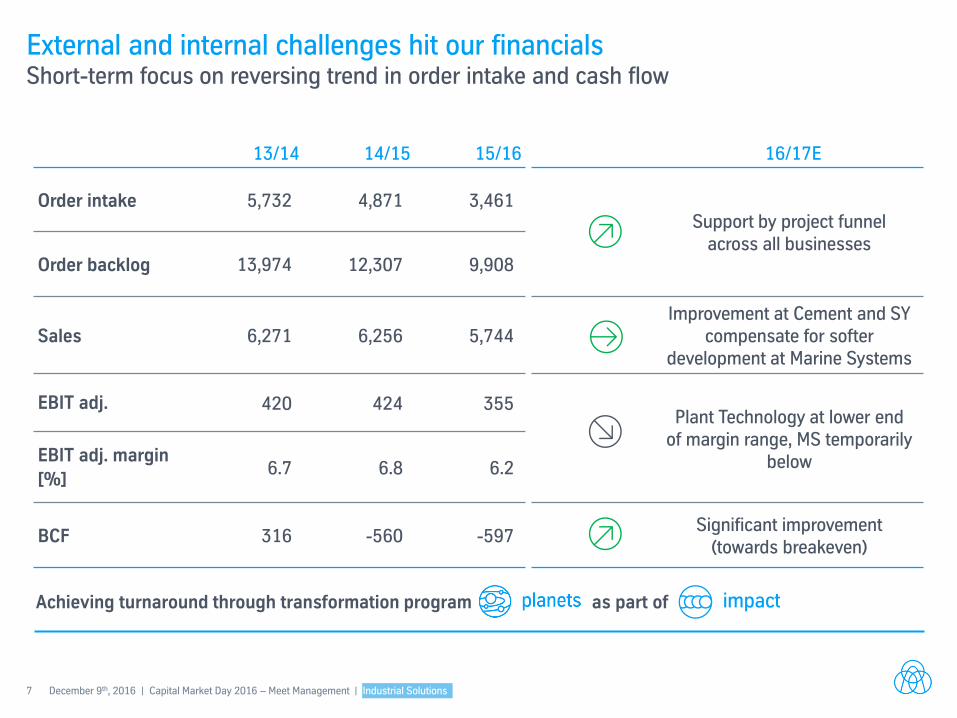
External and internal challenges hit our financials
13/14 14/15 15/16
Order intake 5,732 4,871 3,461
Order backlog 13,974 12,307 9,908
Sales 6,271 6,256 5,744
EBIT adj. 420 424 355
EBIT adj. margin
[%] 6.7 6.8 6.2
BCF 316 -560 -597
16/17E
Support by project funnel across all businesses
Improvement at Cement and SY compensate for softer
development at Marine Systems
Plant Technology at lower end of margin range, MS temporarily
below
Significant improvement (towards breakeven)
Achieving turnaround through transformation program as part of
Short-term focus on reversing trend in order intake and cash flow
8 December 9th, 2016 | Capital Market Day 2016 – Meet Management | Industrial Solutions
Service
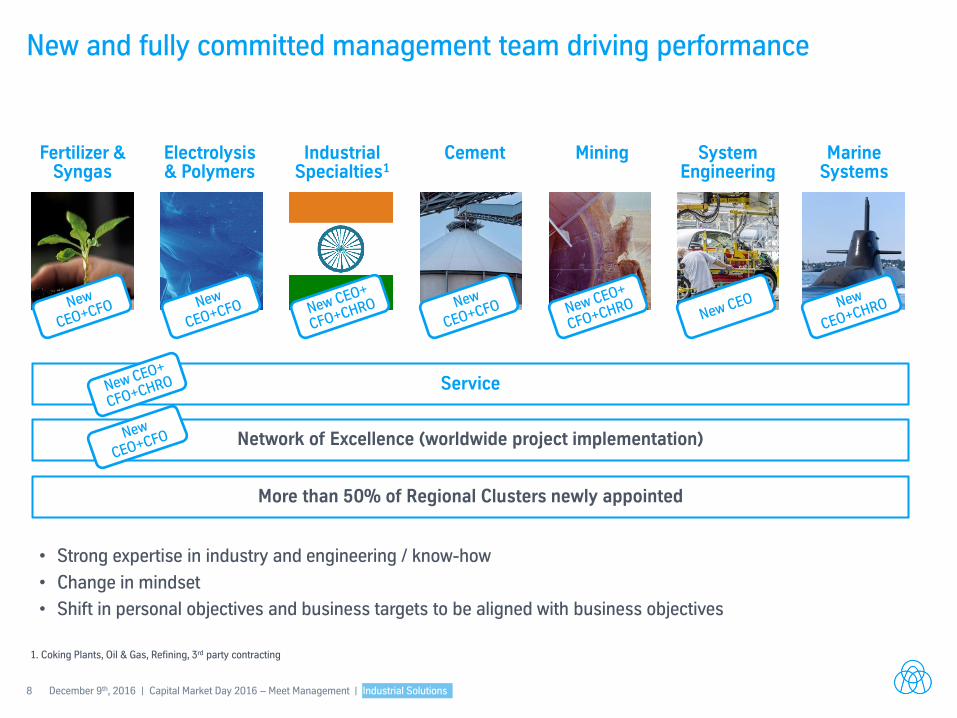
New and fully committed management team driving performance
Cement Industrial Specialties1
Fertilizer & Syngas
Electrolysis & Polymers
Marine Systems
System Engineering
Mining
1. Coking Plants, Oil & Gas, Refining, 3rd party contracting
• Strong expertise in industry and engineering / know-how
• Change in mindset
• Shift in personal objectives and business targets to be aligned with business objectives
Network of Excellence (worldwide project implementation)
More than 50% of Regional Clusters newly appointed
9 December 9th, 2016 | Capital Market Day 2016 – Meet Management | Industrial Solutions
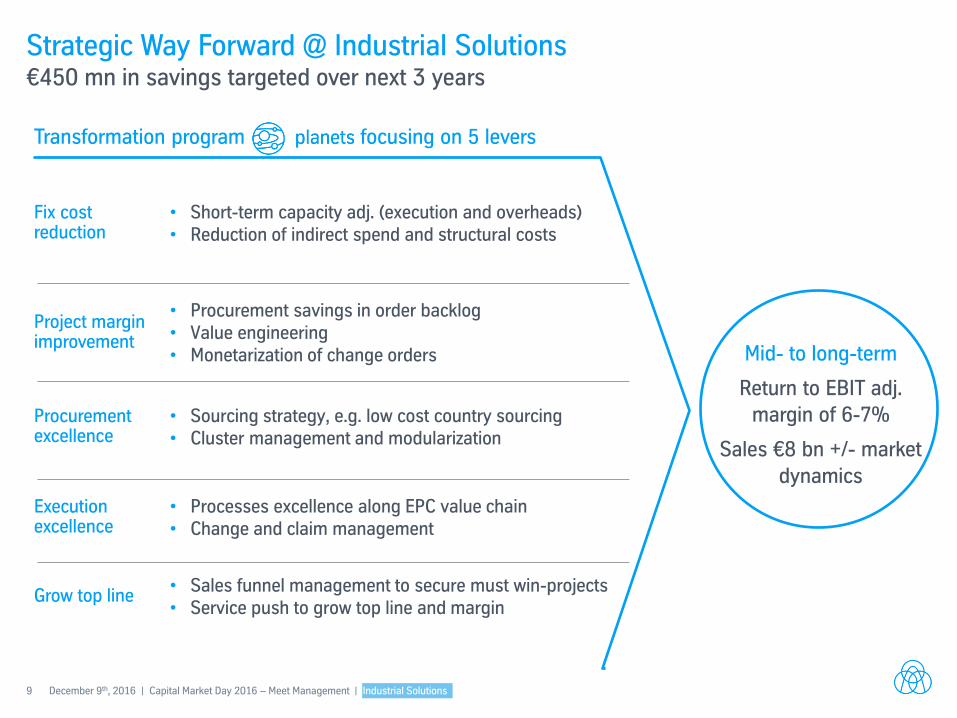
Strategic Way Forward @ Industrial Solutions €450 mn in savings targeted over next 3 years Transformation program focusing on 5 levers
• Sales funnel management to secure must win-projects • Service push to grow top line and margin
Grow top line
• Procurement savings in order backlog • Value engineering • Monetarization of change orders
Project margin improvement
• Sourcing strategy, e.g. low cost country sourcing • Cluster management and modularization
Procurement excellence
• Processes excellence along EPC value chain • Change and claim management
Execution excellence
• Short-term capacity adj. (execution and overheads) • Reduction of indirect spend and structural costs
Fix cost reduction
Mid- to long-term
Return to EBIT adj. margin of 6-7%
Sales €8 bn +/- market
dynamics
10 December 9th, 2016 | Capital Market Day 2016 – Meet Management | Industrial Solutions
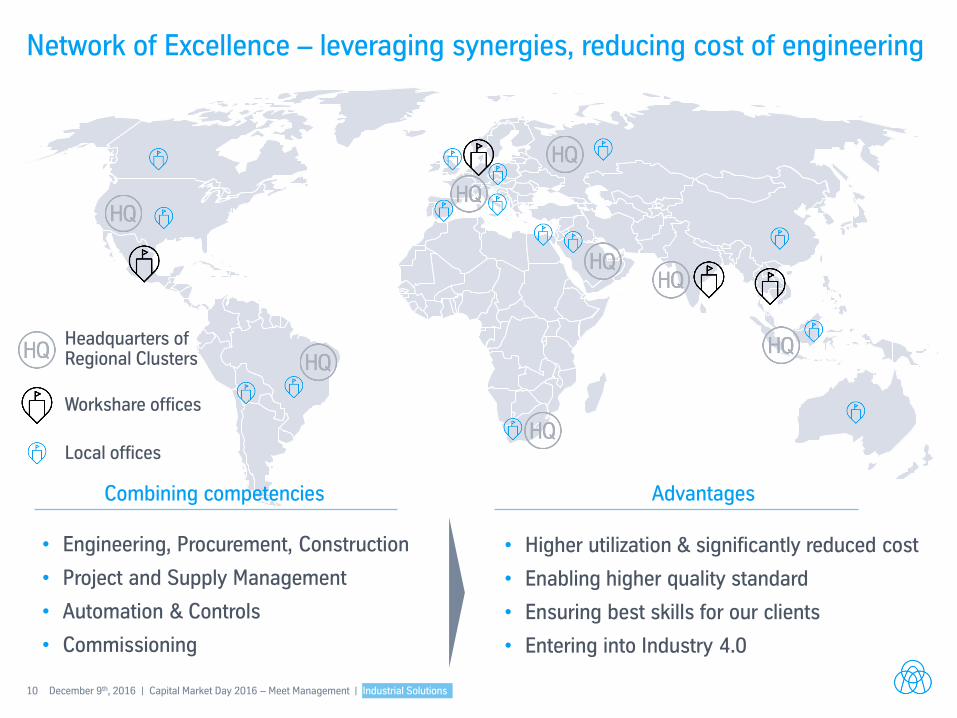
Network of Excellence – leveraging synergies, reducing cost of engineering
• Higher utilization & significantly reduced cost
• Enabling higher quality standard
• Ensuring best skills for our clients
• Entering into Industry 4.0
• Engineering, Procurement, Construction
• Project and Supply Management
• Automation & Controls
• Commissioning
Advantages Combining competencies
Workshare offices
Local offices
Headquarters of Regional Clusters
11 December 9th, 2016 | Capital Market Day 2016 – Meet Management | Industrial Solutions
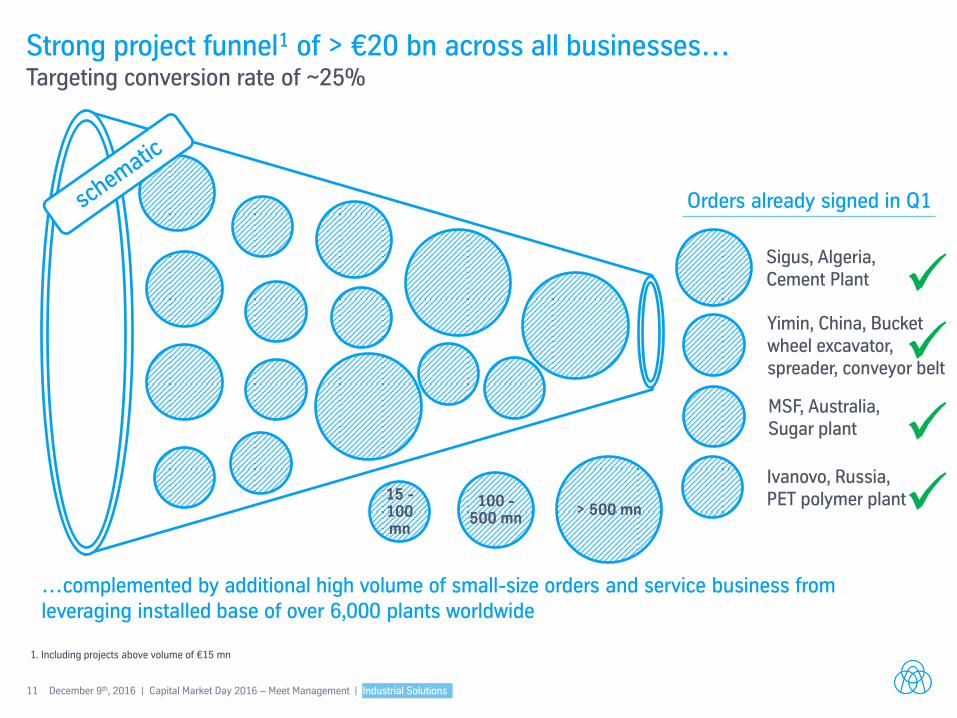
Strong project funnel1 of > €20 bn across all businesses… Targeting conversion rate of ~25%
Orders already signed in Q1
…complemented by additional high volume of small-size orders and service business from leveraging installed base of over 6,000 plants worldwide
1. Including projects above volume of €15 mn
15 -100 mn
100 - 500 mn
> 500 mn
Sigus, Algeria, Cement Plant
Yimin, China, Bucket wheel excavator, spreader, conveyor belt
MSF, Australia, Sugar plant
Ivanovo, Russia, PET polymer plant
12 December 9th, 2016 | Capital Market Day 2016 – Meet Management | Industrial Solutions
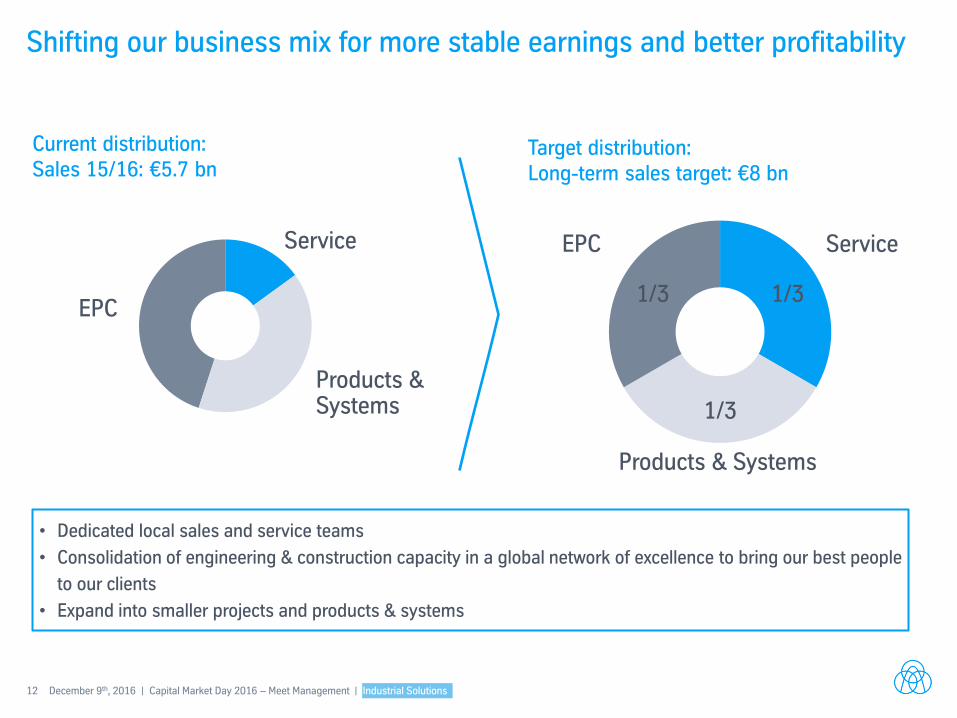
Shifting our business mix for more stable earnings and better profitability
• Dedicated local sales and service teams
• Consolidation of engineering & construction capacity in a global network of excellence to bring our best people
to our clients
• Expand into smaller projects and products & systems
Current distribution: Sales 15/16: €5.7 bn
Target distribution: Long-term sales target: €8 bn
Service
EPC
Products & Systems
1/3
1/3
1/3
EPC
Products & Systems
Service
13 December 9th, 2016 | Capital Market Day 2016 – Meet Management | Industrial Solutions
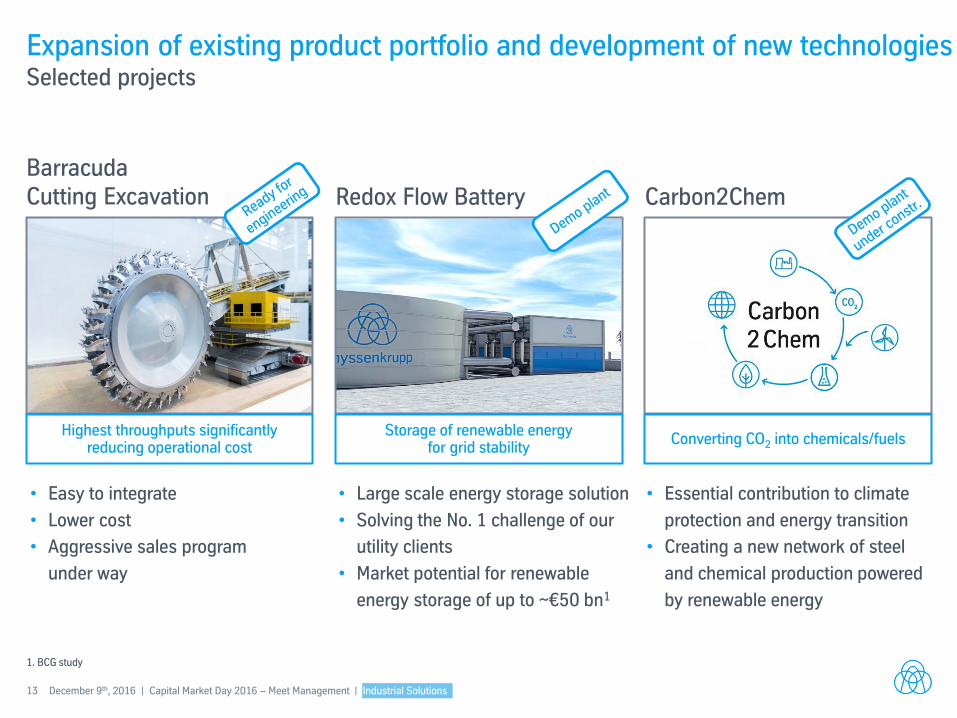
Expansion of existing product portfolio and development of new technologies Selected projects
• Easy to integrate
• Lower cost
• Aggressive sales program
under way
• Large scale energy storage solution
• Solving the No. 1 challenge of our
utility clients
• Market potential for renewable
energy storage of up to ~€50 bn1
• Essential contribution to climate
protection and energy transition
• Creating a new network of steel
and chemical production powered
by renewable energy
Storage of renewable energy for grid stability
Converting CO2 into chemicals/fuels Highest throughputs significantly
reducing operational cost
Barracuda Cutting Excavation Redox Flow Battery Carbon2Chem
1. BCG study
14 December 9th, 2016 | Capital Market Day 2016 – Meet Management | Industrial Solutions
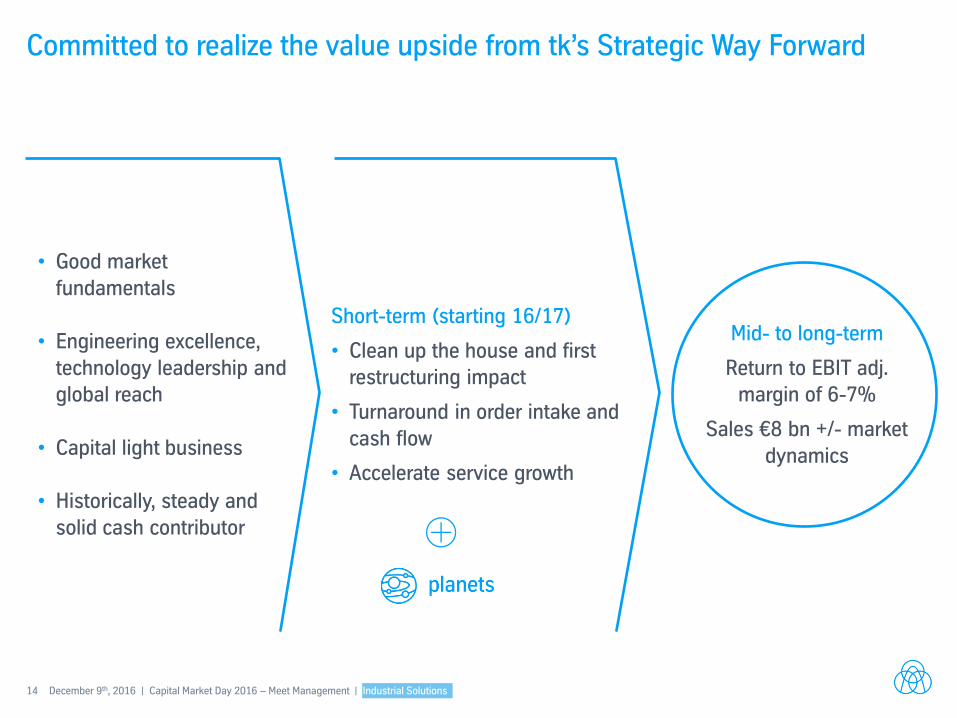
Committed to realize the value upside from tk’s Strategic Way Forward
• Good market
fundamentals
• Engineering excellence,
technology leadership and global reach
• Capital light business
• Historically, steady and
solid cash contributor
Short-term (starting 16/17)
• Clean up the house and first restructuring impact
• Turnaround in order intake and
cash flow
• Accelerate service growth
Mid- to long-term
Return to EBIT adj. margin of 6-7%
Sales €8 bn +/- market
dynamics

Capital Market Day 2016 Meet Management
Capital Market Day 2016 - Meet Management
Materials Services
Essen, December 9th, 2016 Joachim Limberg (CEO) | Klaus Keysberg (CFO)
2 | December 9th, 2016 | Capital Market Day 2016 - Meet Management | Materials Services
thyssenkrupp – a diversified industrial group Sales €39.6 bn; EBIT adj. €1.5 bn
Components Technology (CT)
Materials Services (MX)
Elevator Technology (ET)
Industrial Solutions (IS)
Steel Europe (SE)
Steel Americas (AM)
Financial figures FY 15/16
€7.5 bn €860 mn
€5.7 bn €355 mn
€1.5 bn €(33) mn
€7.6 bn €315 mn
€11.9 bn €128 mn
€6.8 bn €335 mn
3 | December 9th, 2016 | Capital Market Day 2016 - Meet Management | Materials Services
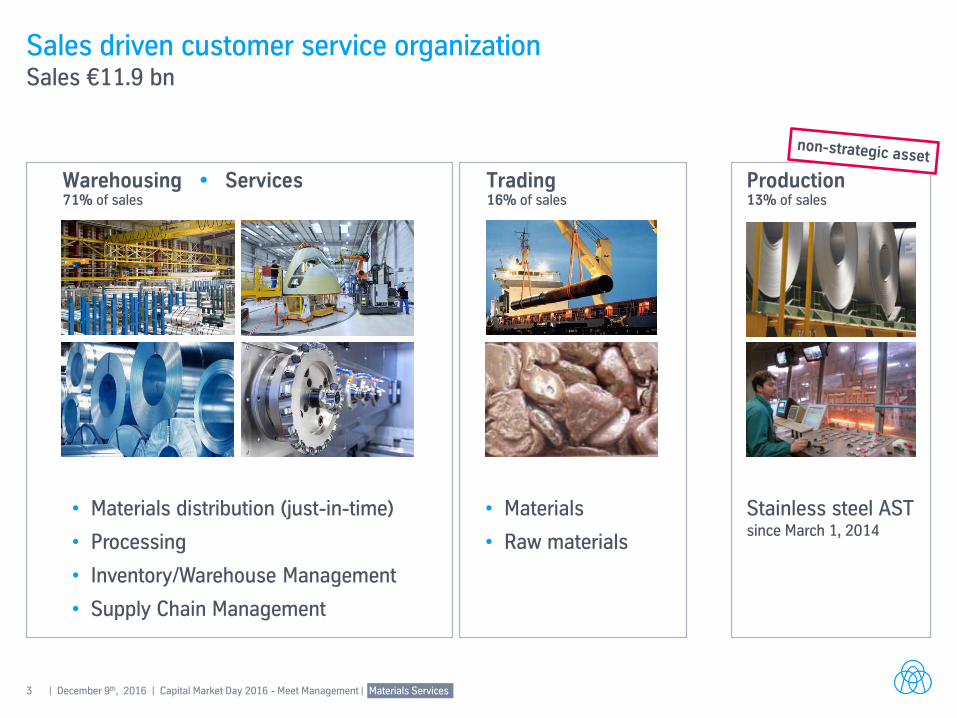
Sales driven customer service organization Sales €11.9 bn
• Materials distribution (just-in-time)
• Processing
• Inventory/Warehouse Management
• Supply Chain Management
• Materials
• Raw materials
Stainless steel AST since March 1, 2014
Warehousing Services 71% of sales
Trading 16% of sales
Production 13% of sales
4 | December 9th, 2016 | Capital Market Day 2016 - Meet Management | Materials Services
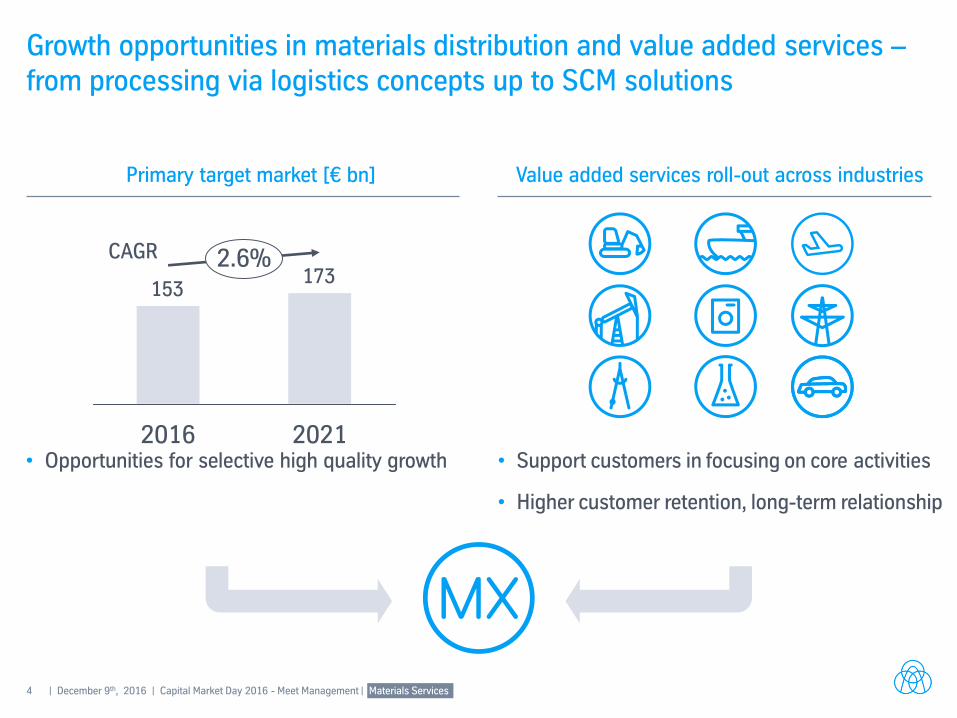
Growth opportunities in materials distribution and value added services – from processing via logistics concepts up to SCM solutions
173153
2.6%
2021 2016 • Opportunities for selective high quality growth • Support customers in focusing on core activities
• Higher customer retention, long-term relationship
Primary target market [€ bn] Value added services roll-out across industries
CAGR
5 | December 9th, 2016 | Capital Market Day 2016 - Meet Management | Materials Services
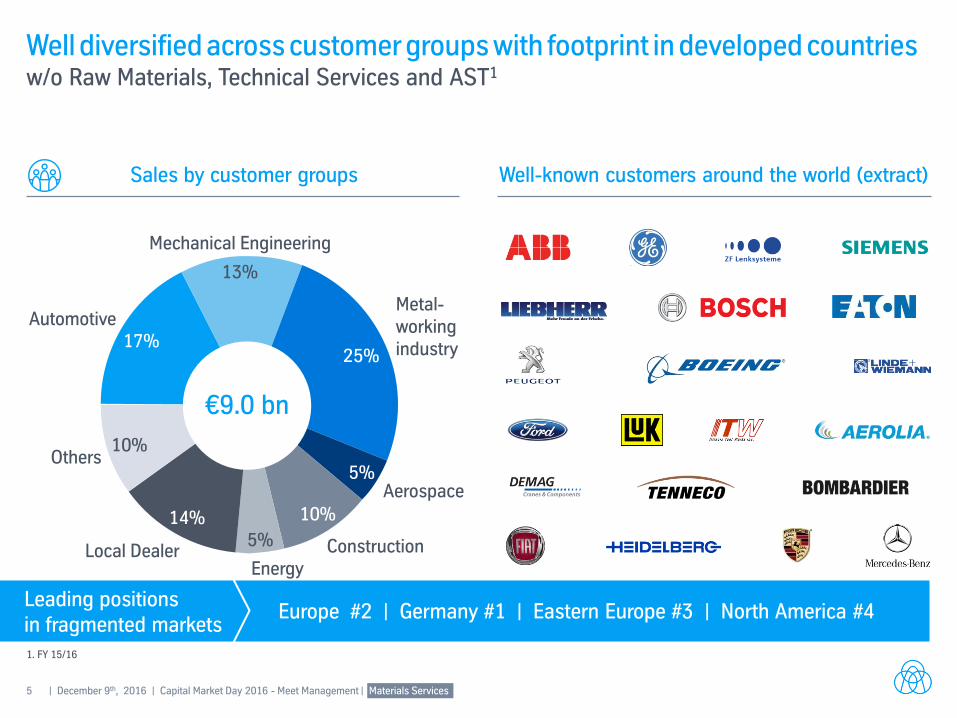
Well diversified across customer groups with footprint in developed countries w/o Raw Materials, Technical Services and AST1
Sales by customer groups Well-known customers around the world (extract)
14%
5%
Metal- working industry
Energy
Others
Construction
Aerospace 10%
Local Dealer
10%
5%
13%
Mechanical Engineering
25%
Automotive 17%
€9.0 bn
1. FY 15/16
Europe #2 | Germany #1 | Eastern Europe #3 | North America #4 Leading positions in fragmented markets
6 | December 9th, 2016 | Capital Market Day 2016 - Meet Management | Materials Services
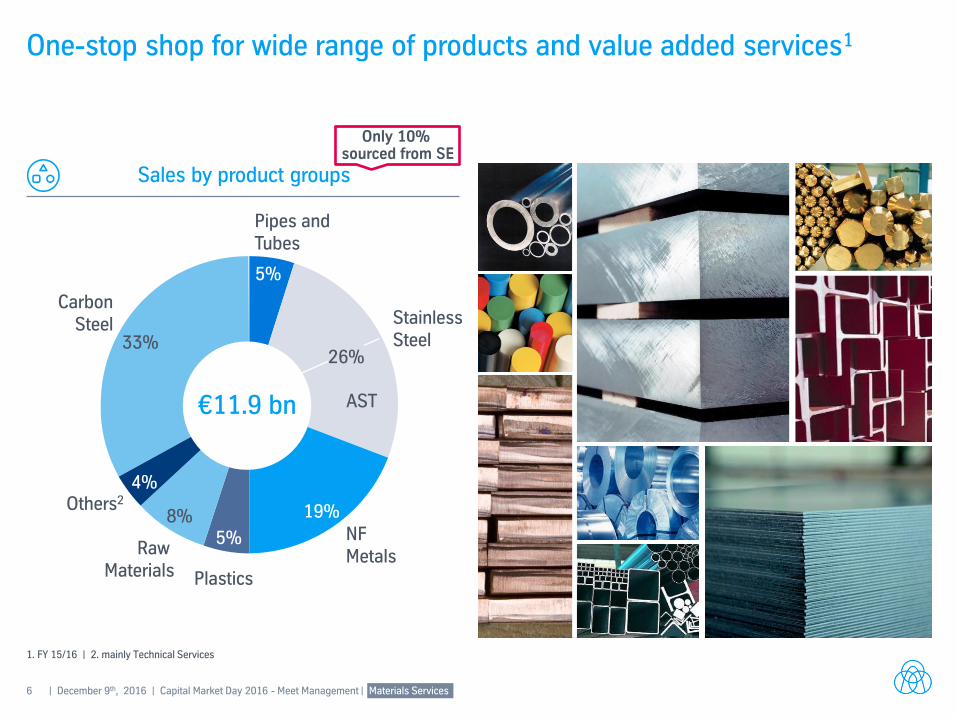
One-stop shop for wide range of products and value added services1
Sales by product groups
1. FY 15/16 | 2. mainly Technical Services
Only 10% sourced from SE
5%
Others2
5%
19%
4%
Pipes and Tubes
Raw Materials
8% NF Metals
Stainless Steel 33%
Carbon Steel
Plastics
€11.9 bn AST
26%
7 | December 9th, 2016 | Capital Market Day 2016 - Meet Management | Materials Services
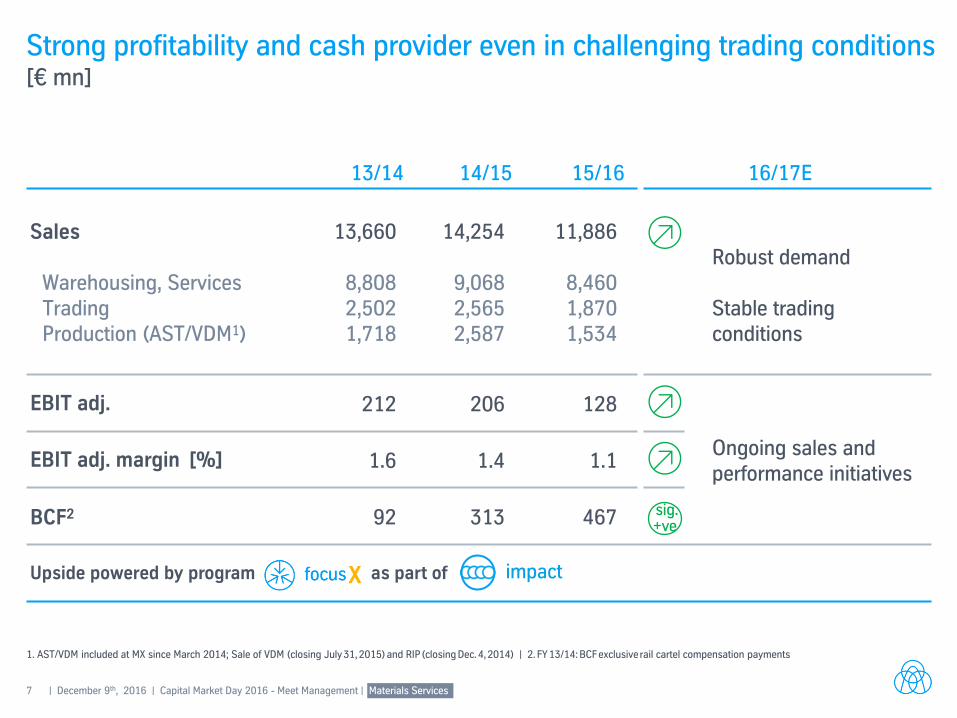
13/14 14/15 15/16 16/17E
Sales
Warehousing, Services Trading Production (AST/VDM1)
13,660
8,808 2,502 1,718
14,254
9,068 2,565 2,587
11,886
8,460 1,870 1,534
Robust demand Stable trading conditions
EBIT adj. 212 206 128
Ongoing sales and performance initiatives
EBIT adj. margin [%] 1.6 1.4 1.1
BCF2 92 313 467
Upside powered by program as part of
Strong profitability and cash provider even in challenging trading conditions [€ mn]
1. AST/VDM included at MX since March 2014; Sale of VDM (closing July 31, 2015) and RIP (closing Dec. 4, 2014) | 2. FY 13/14: BCF exclusive rail cartel compensation payments
sig. +ve
X
8 | December 9th, 2016 | Capital Market Day 2016 - Meet Management | Materials Services
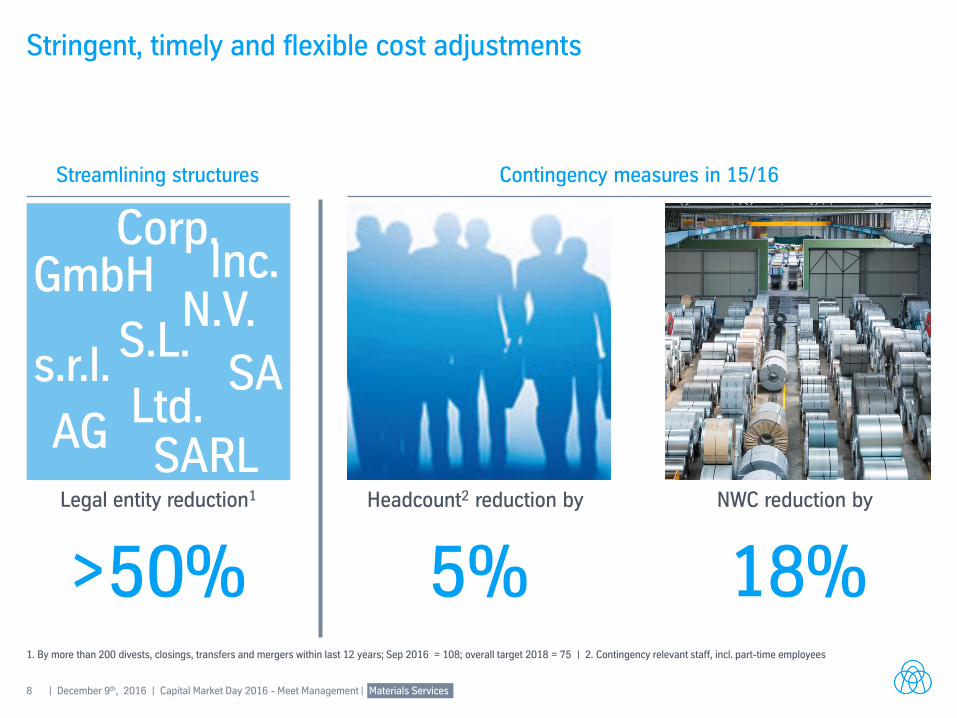
>50% Legal entity reduction1
GmbH
AG Ltd.
S.L.
SARL
s.r.l. SA
Inc. Corp.
N.V.
Stringent, timely and flexible cost adjustments
1. By more than 200 divests, closings, transfers and mergers within last 12 years; Sep 2016 = 108; overall target 2018 = 75 | 2. Contingency relevant staff, incl. part-time employees
5% 18% Headcount2 reduction by NWC reduction by
Contingency measures in 15/16 Streamlining structures
9 | December 9th, 2016 | Capital Market Day 2016 - Meet Management | Materials Services
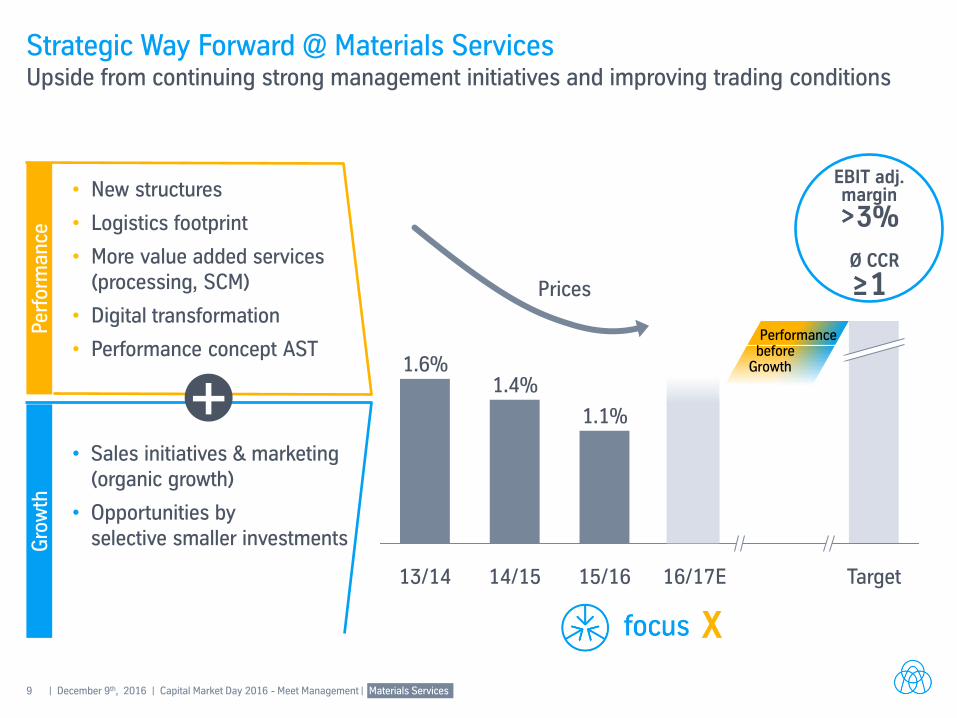
Strategic Way Forward @ Materials Services Upside from continuing strong management initiatives and improving trading conditions
Per
form
an
ce
Gro
wth
+
Prices
1.6% 1.4%
Target 15/16
1.1%
16/17E 14/15 13/14
• New structures
• Logistics footprint
• More value added services (processing, SCM)
• Digital transformation
• Performance concept AST
• Sales initiatives & marketing (organic growth)
• Opportunities by selective smaller investments
EBIT adj. margin
>3%
Ø CCR
≥1
X
Performance before Growth
10 | December 9th, 2016 | Capital Market Day 2016 - Meet Management | Materials Services
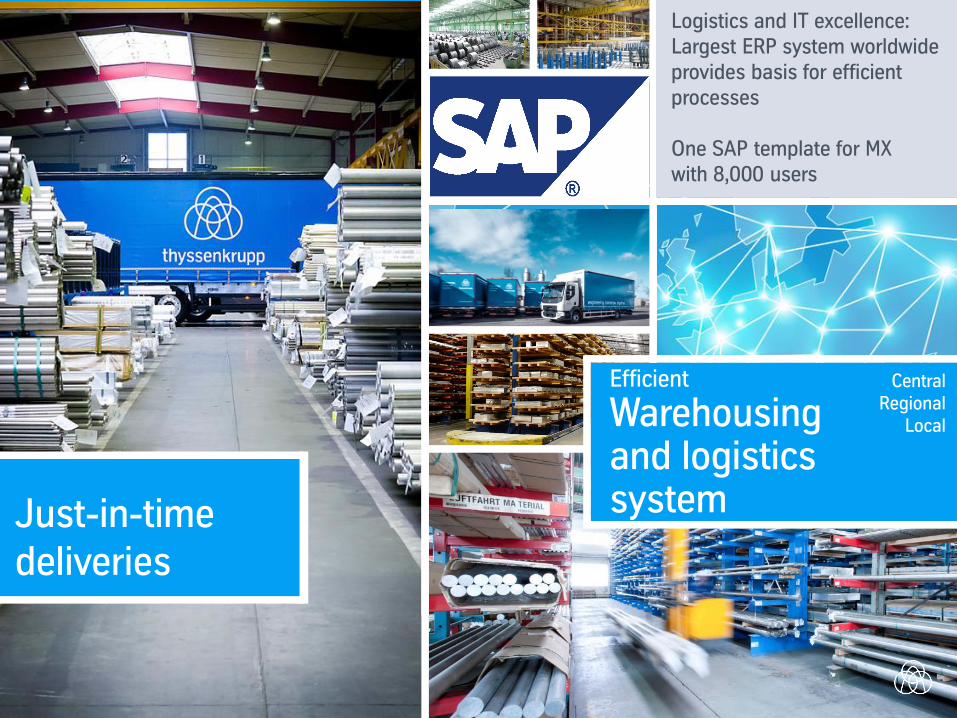
Just-in-time deliveries
Efficient
Warehousing and logistics system
Central Regional
Local
Logistics and IT excellence: Largest ERP system worldwide provides basis for efficient processes One SAP template for MX with 8,000 users
11 | December 9th, 2016 | Capital Market Day 2016 - Meet Management | Materials Services
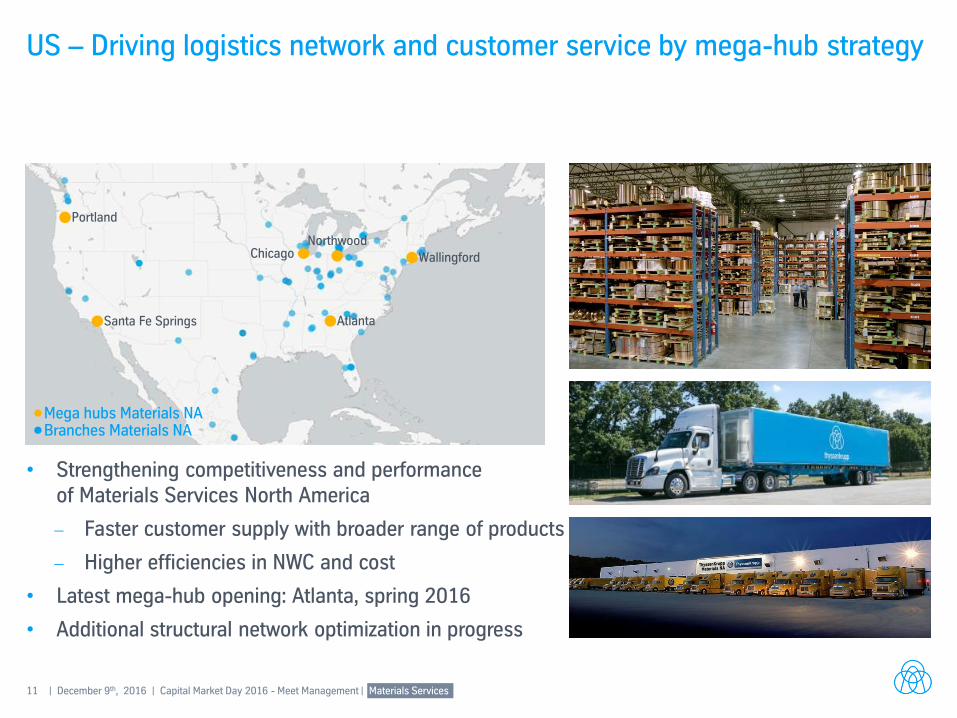
US – Driving logistics network and customer service by mega-hub strategy
• Strengthening competitiveness and performance of Materials Services North America
Faster customer supply with broader range of products
Higher efficiencies in NWC and cost
• Latest mega-hub opening: Atlanta, spring 2016
• Additional structural network optimization in progress
Wallingford
Northwood
Chicago
Portland
Santa Fe Springs Atlanta
Branches Materials NA Mega hubs Materials NA
12 | December 9th, 2016 | Capital Market Day 2016 - Meet Management | Materials Services
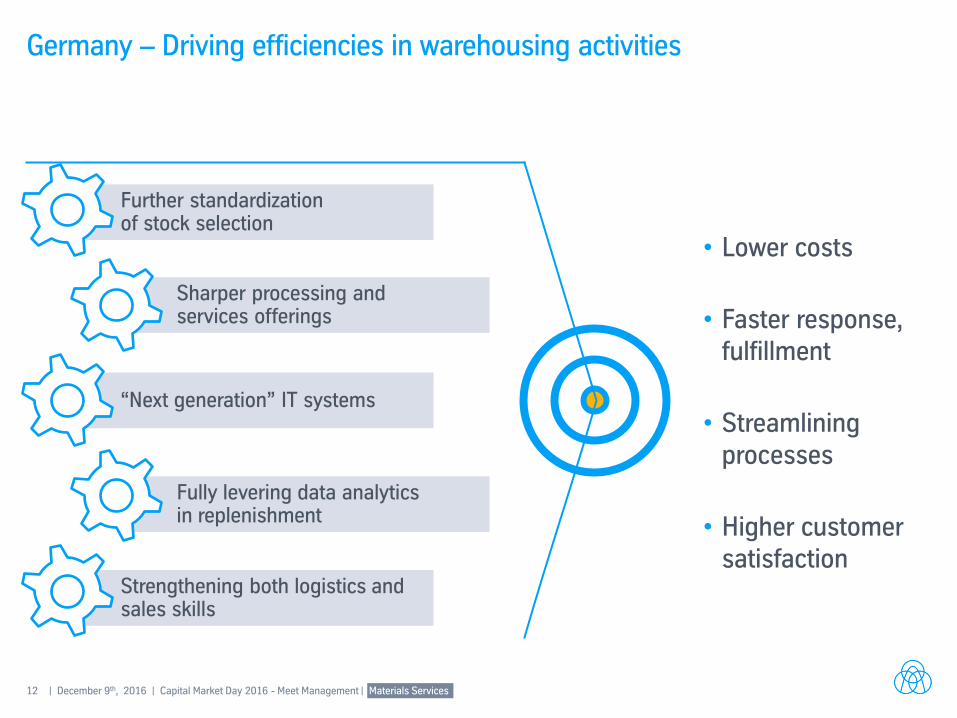
Further standardization of stock selection
Strengthening both logistics and sales skills
Germany – Driving efficiencies in warehousing activities
Sharper processing and services offerings
“Next generation” IT systems
Fully levering data analytics in replenishment
• Lower costs
• Faster response, fulfillment
• Streamlining processes
• Higher customer satisfaction
13 | December 9th, 2016 | Capital Market Day 2016 - Meet Management | Materials Services
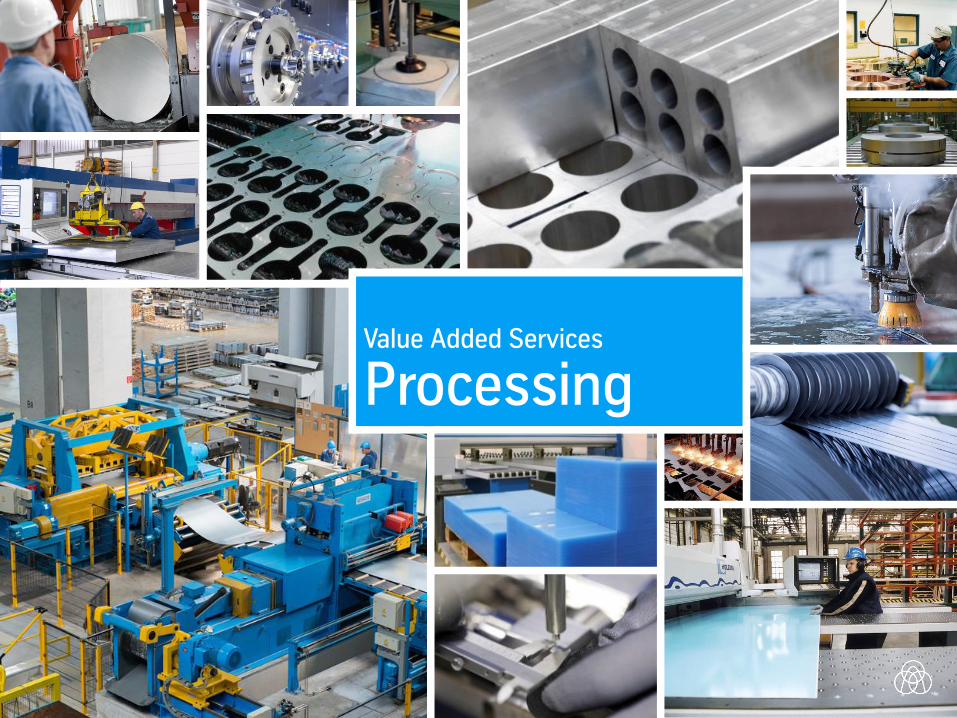
Value Added Services
Processing
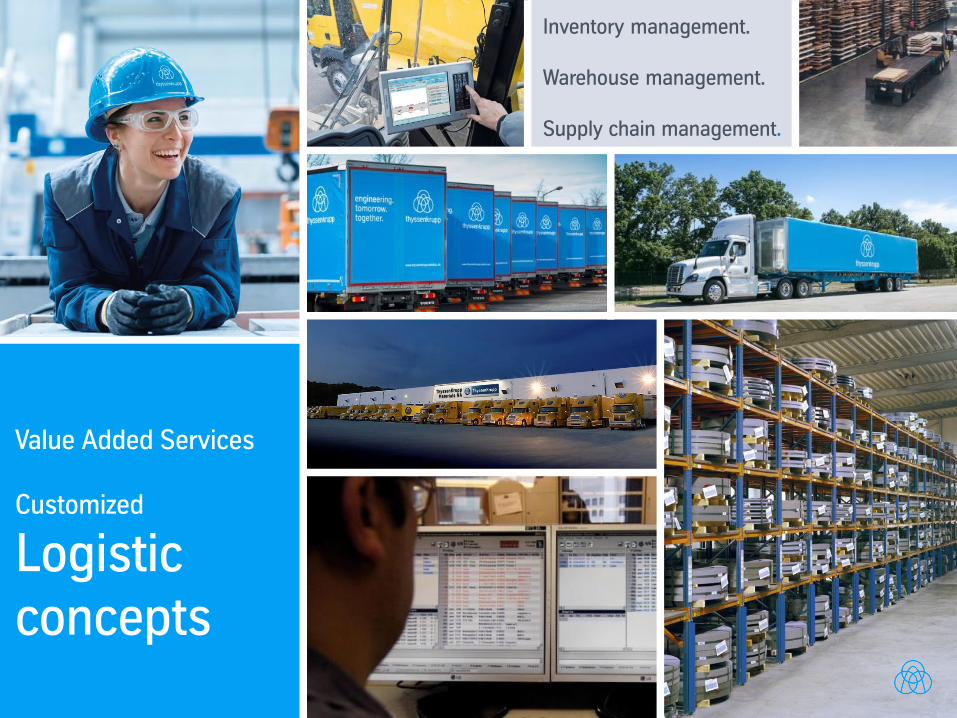
14 | December 9th, 2016 | Capital Market Day 2016 - Meet Management | Materials Services
Value Added Services Customized
Logistic concepts
Inventory management. Warehouse management. Supply chain management.
15 | December 9th, 2016 | Capital Market Day 2016 - Meet Management | Materials Services
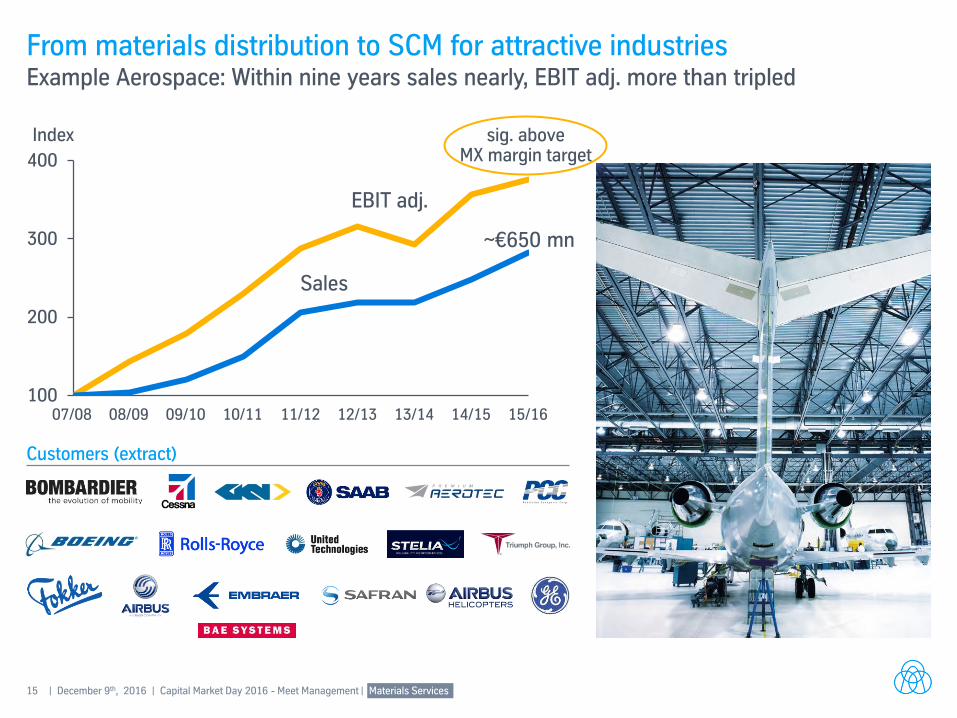
From materials distribution to SCM for attractive industries Example Aerospace: Within nine years sales nearly, EBIT adj. more than tripled
Customers (extract)
100
200
300
400
09/10 10/11 07/08 08/09 11/12 12/13 14/15 13/14 15/16
Index
Sales
EBIT adj.
~€650 mn
sig. above MX margin target
16 | December 9th, 2016 | Capital Market Day 2016 - Meet Management | Materials Services
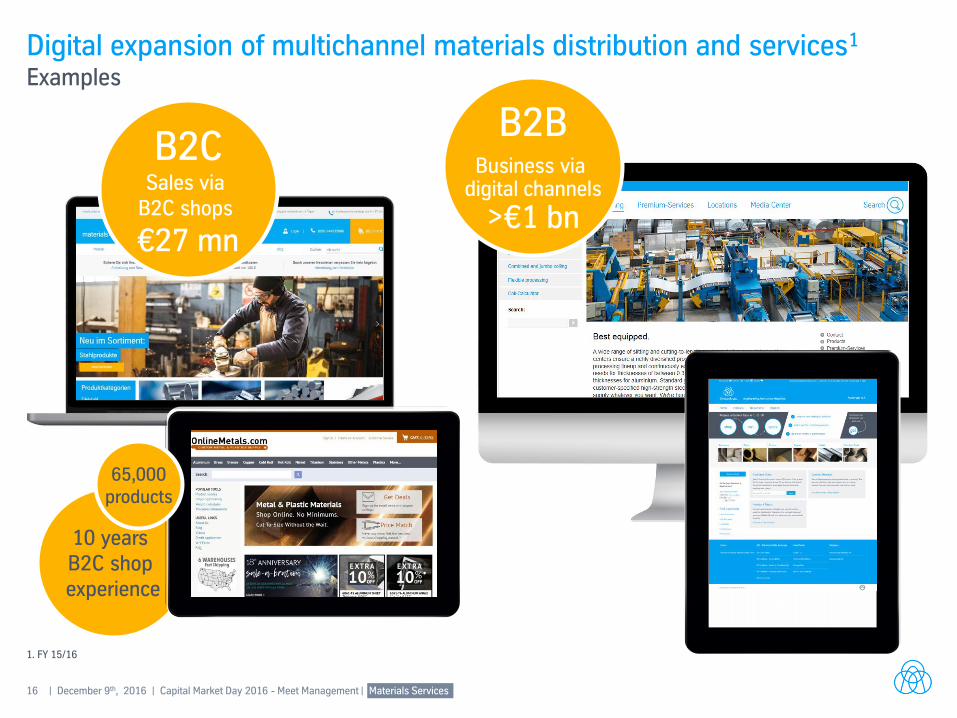
10 years B2C shop experience
Digital expansion of multichannel materials distribution and services1 Examples
B2B
Business via digital channels
>€1 bn
1. FY 15/16
B2C Sales via
B2C shops
€27 mn
65,000 products
17 | December 9th, 2016 | Capital Market Day 2016 - Meet Management | Materials Services
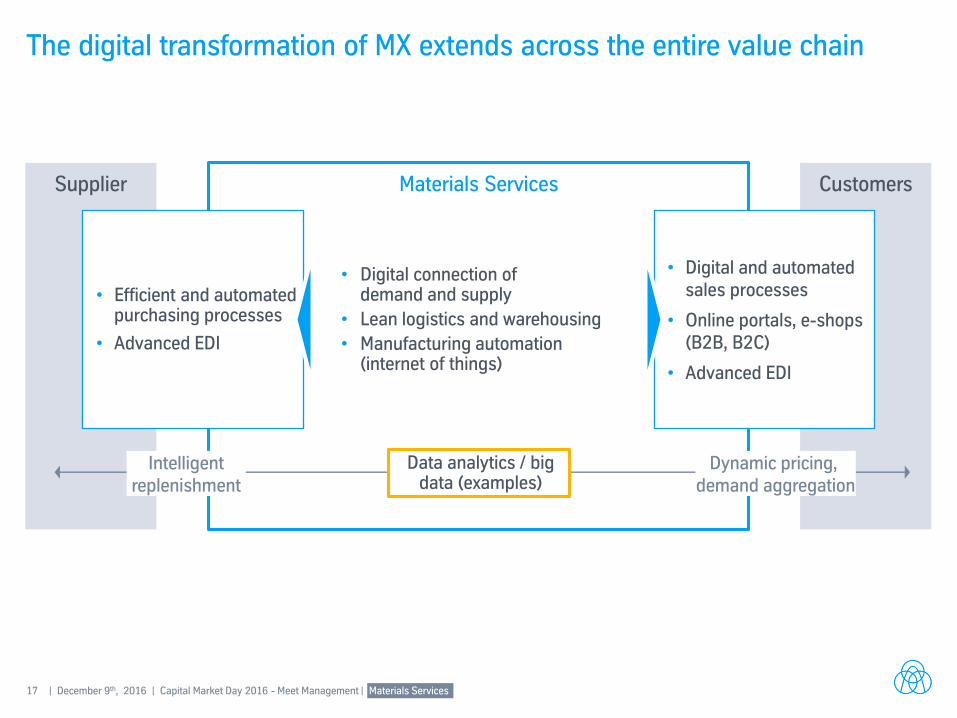
Materials Services
The digital transformation of MX extends across the entire value chain
• Digital connection of demand and supply
• Lean logistics and warehousing
• Manufacturing automation (internet of things)
Supplier Customers
Intelligent replenishment
Dynamic pricing, demand aggregation
Data analytics / big data (examples)
• Digital and automated sales processes
• Online portals, e-shops (B2B, B2C)
• Advanced EDI
• Efficient and automated purchasing processes
• Advanced EDI
18 | December 9th, 2016 | Capital Market Day 2016 - Meet Management | Materials Services
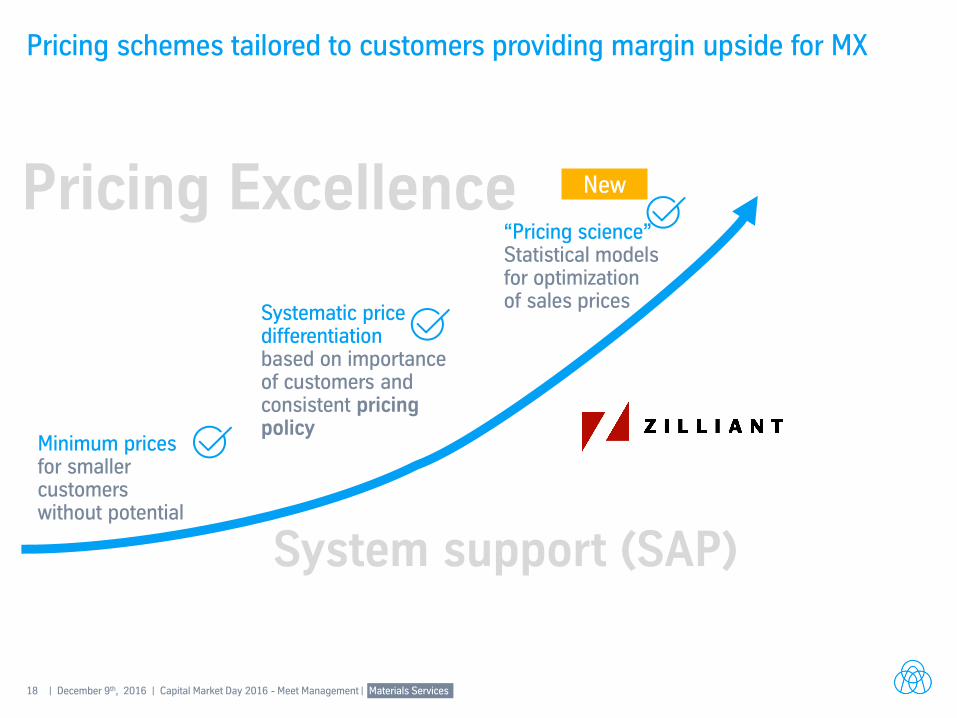
Pricing schemes tailored to customers providing margin upside for MX
New
Minimum prices for smaller customers without potential
Pricing Excellence “Pricing science” Statistical models for optimization of sales prices
System support (SAP)
Systematic price differentiation based on importance of customers and consistent pricing policy
19 | December 9th, 2016 | Capital Market Day 2016 - Meet Management | Materials Services
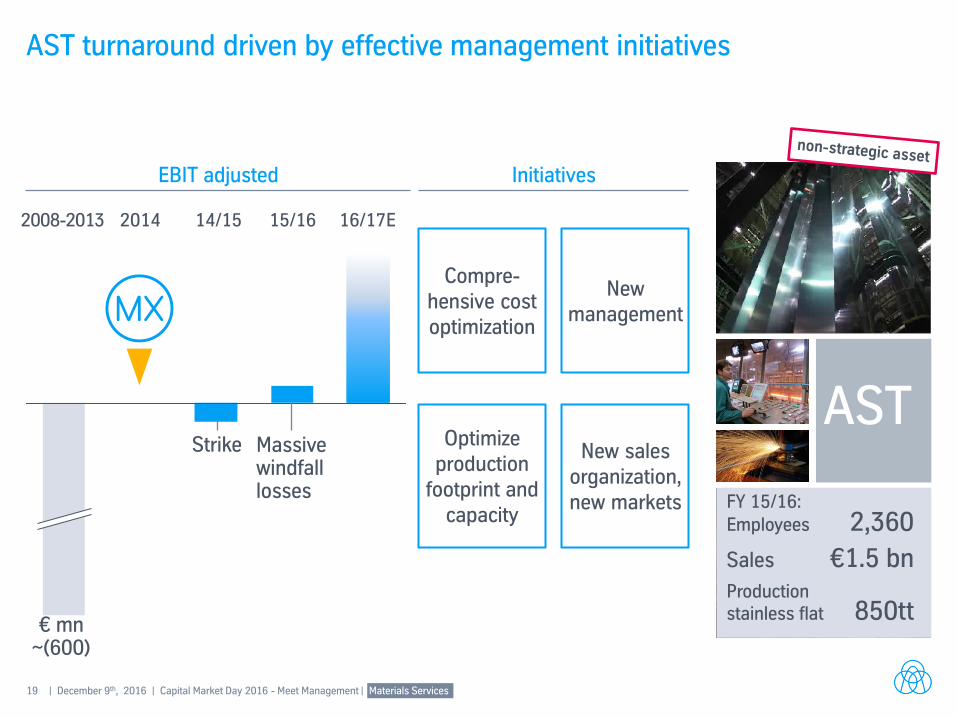
AST turnaround driven by effective management initiatives
2014 2008-2013 14/15 15/16 16/17E
Strike Massive windfall losses
€ mn ~(600)
Initiatives
Optimize production
footprint and capacity
New sales organization, new markets
Compre-hensive cost optimization
New management
AST
FY 15/16: Employees 2,360
Sales €1.5 bn Production stainless flat 850tt
EBIT adjusted
20 | December 9th, 2016 | Capital Market Day 2016 - Meet Management | Materials Services
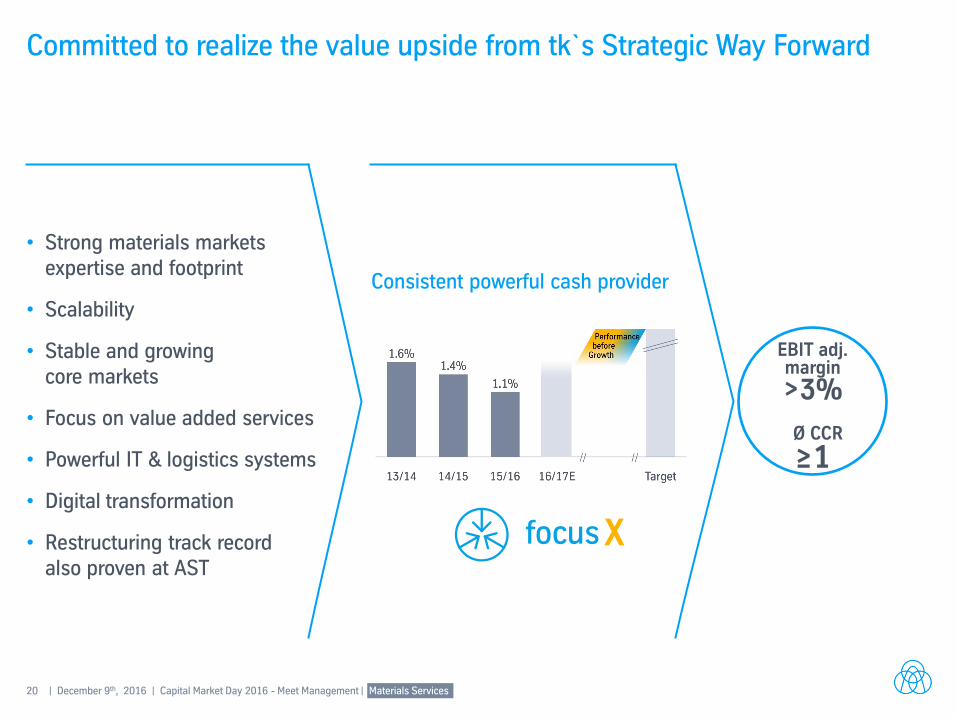
Committed to realize the value upside from tk`s Strategic Way Forward
• Strong materials markets expertise and footprint
• Scalability
• Stable and growing core markets
• Focus on value added services
• Powerful IT & logistics systems
• Digital transformation
• Restructuring track record also proven at AST
X
Consistent powerful cash provider
EBIT adj. margin
>3%
Ø CCR
≥1

Capital Market Day 2016 Meet Management
Capital Market Day 2016 – Meet Management
Steel Europe & Steel Americas Essen, December 9th, 2016 Andreas J. Goss (CEO) | Premal A. Desai (CFO)
2 | December 9th, 2016 | Capital Market Day 2016 – Meet Management | Steel
thyssenkrupp – a diversified industrial group Sales €39.6 bn; EBIT adj. €1.5 bn
Components Technology (CT)
Materials Services (MX)
Financial figures FY 15/16
Steel Americas (AM)
€1.5 bn €(33) mn
Steel Europe (SE)
€7.6 bn €315 mn
€11.9 bn €128 mn
Elevator Technology (ET)
€7.5 bn €860 mn
€6.8 bn €335 mn
Industrial Solutions (IS)
€5.7 bn €355 mn
3 | December 9th, 2016 | Capital Market Day 2016 – Meet Management | Steel
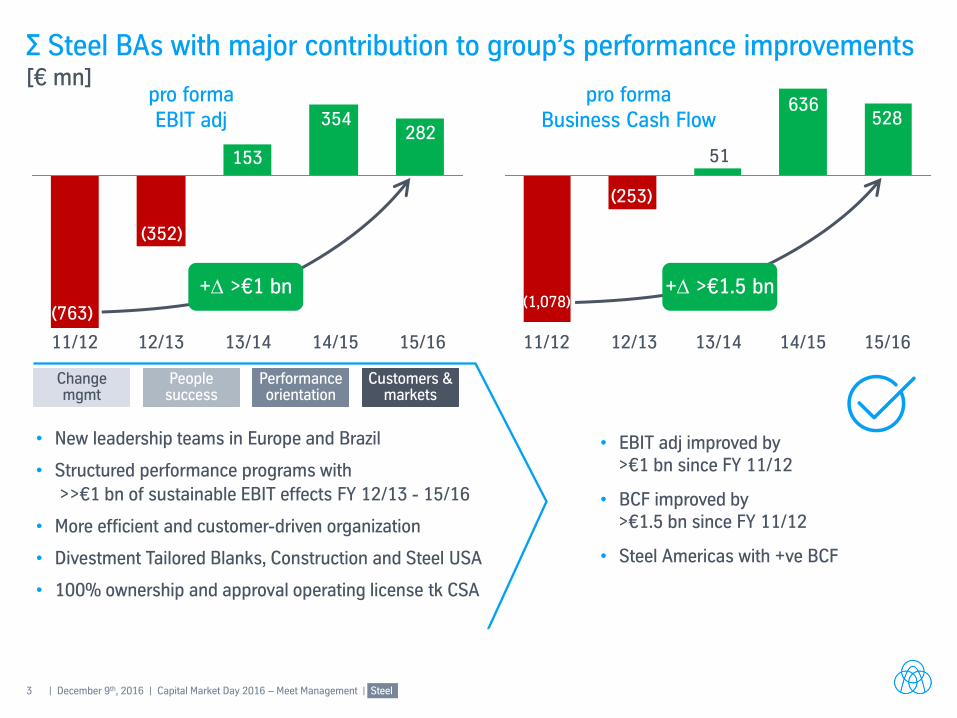
∑ Steel BAs with major contribution to group’s performance improvements [€ mn]
11/12 12/13 13/14 14/15
(763)
(352)
153
(1,078)
(253)
51
pro forma EBIT adj
pro forma Business Cash Flow 354
+ >€1 bn
636
Performance orientation
Customers & markets
People success
Change mgmt
• New leadership teams in Europe and Brazil
• Structured performance programs with
>>€1 bn of sustainable EBIT effects FY 12/13 - 15/16
• More efficient and customer-driven organization
• Divestment Tailored Blanks, Construction and Steel USA
• 100% ownership and approval operating license tk CSA
• EBIT adj improved by >€1 bn since FY 11/12
• BCF improved by >€1.5 bn since FY 11/12
• Steel Americas with +ve BCF
+ >€1.5 bn
15/16 11/12 12/13 13/14 14/15 15/16
282 528
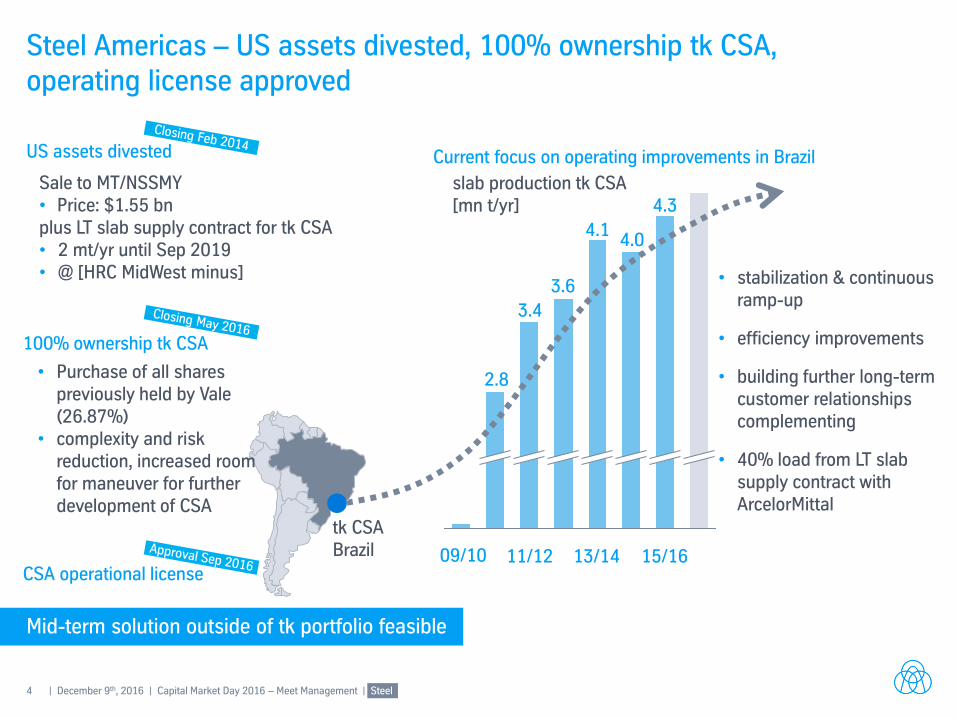
4 | December 9th, 2016 | Capital Market Day 2016 – Meet Management | Steel
Current focus on operating improvements in Brazil
Steel Americas – US assets divested, 100% ownership tk CSA, operating license approved
US assets divested
tk CSA Brazil 13/14
3.6
11/12
3.4
2.8
slab production tk CSA [mn t/yr]
Sale to MT/NSSMY • Price: $1.55 bn plus LT slab supply contract for tk CSA • 2 mt/yr until Sep 2019 • @ [HRC MidWest minus] • stabilization & continuous
ramp-up
• efficiency improvements
• building further long-term customer relationships complementing
• 40% load from LT slab supply contract with ArcelorMittal
4.1
09/10
4.0
100% ownership tk CSA
• Purchase of all shares previously held by Vale (26.87%)
• complexity and risk reduction, increased room for maneuver for further development of CSA
15/16
4.3
Mid-term solution outside of tk portfolio feasible
CSA operational license
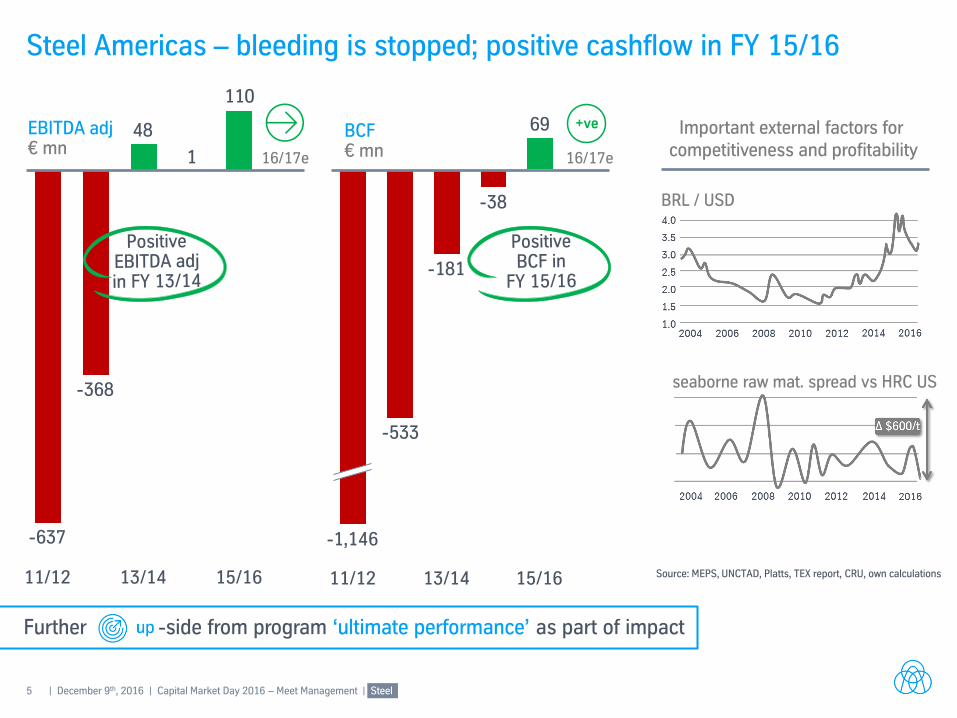
5 | December 9th, 2016 | Capital Market Day 2016 – Meet Management | Steel
Further -side from program ‘ultimate performance’ as part of impact
69
-38
-181
-533
15/16 13/14 11/12
-1,146
Steel Americas – bleeding is stopped; positive cashflow in FY 15/16
110
1
48
-368
-637
15/16 13/14 11/12
BCF
€ mn
BRL / USD
seaborne raw mat. spread vs HRC US
Important external factors for competitiveness and profitability
Source: MEPS, UNCTAD, Platts, TEX report, CRU, own calculations
EBITDA adj € mn
16/17e 16/17e
+ve
6 | December 9th, 2016 | Capital Market Day 2016 – Meet Management | Steel
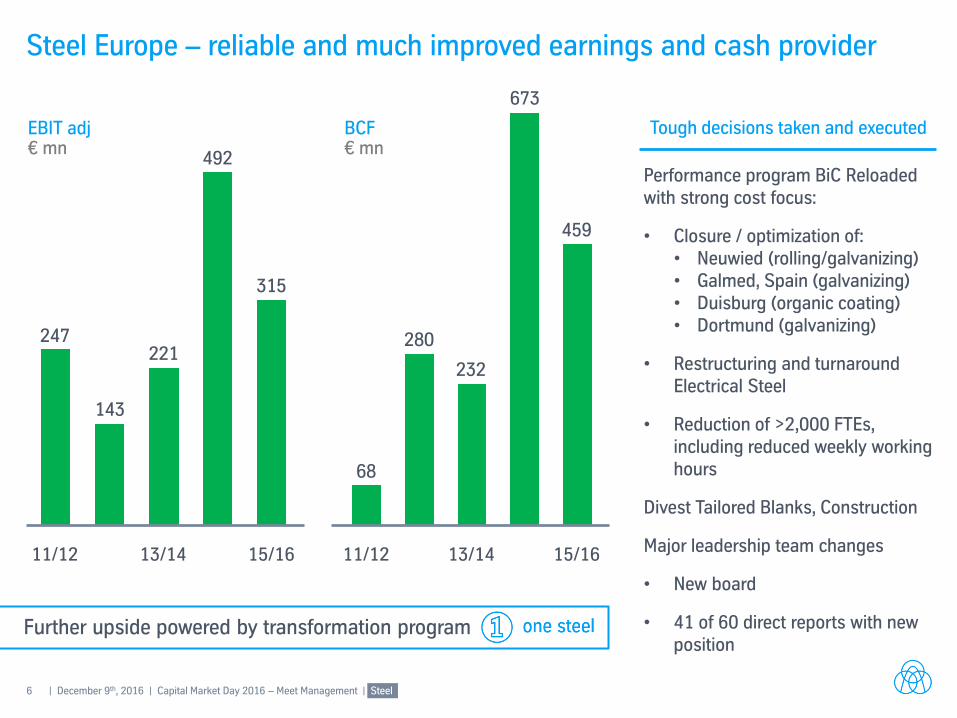
Steel Europe – reliable and much improved earnings and cash provider
315
492
221
143
247
13/14 11/12 15/16
459
673
232
280
68
11/12 13/14 15/16
Further upside powered by transformation program
Performance program BiC Reloaded with strong cost focus:
• Closure / optimization of: • Neuwied (rolling/galvanizing) • Galmed, Spain (galvanizing) • Duisburg (organic coating) • Dortmund (galvanizing)
• Restructuring and turnaround Electrical Steel
• Reduction of >2,000 FTEs, including reduced weekly working hours
Divest Tailored Blanks, Construction
Major leadership team changes
• New board
• 41 of 60 direct reports with new position
Tough decisions taken and executed BCF € mn
EBIT adj € mn
7 | December 9th, 2016 | Capital Market Day 2016 – Meet Management | Steel
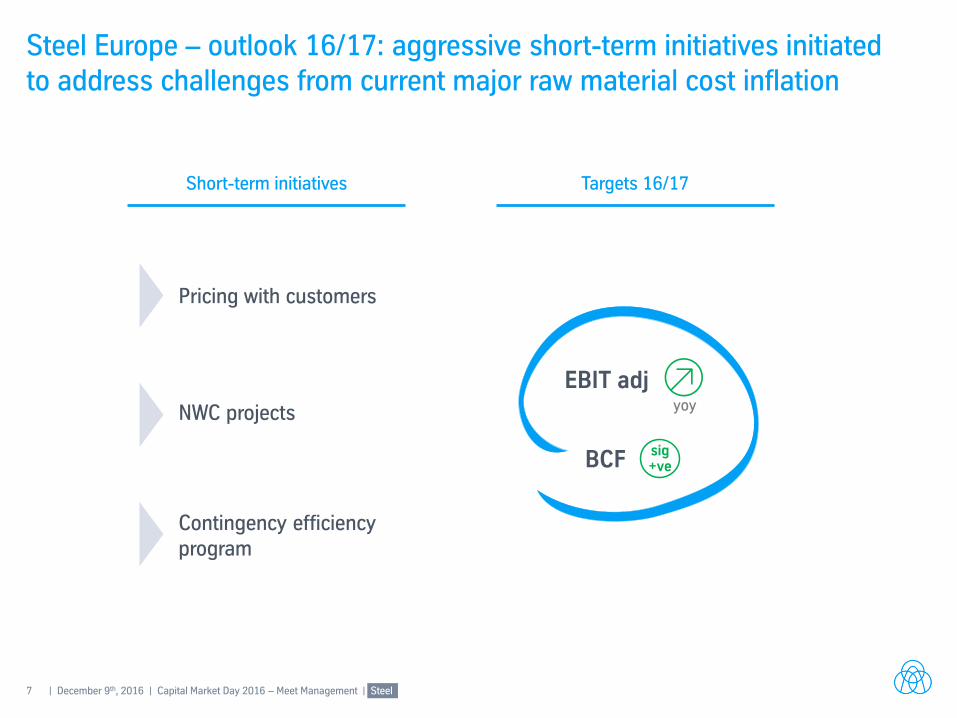
Steel Europe – outlook 16/17: aggressive short-term initiatives initiated to address challenges from current major raw material cost inflation
BCF
yoy
sig+ve
EBIT adj
Short-term initiatives Targets 16/17
Contingency efficiency program
NWC projects
Pricing with customers
8 | December 9th, 2016 | Capital Market Day 2016 – Meet Management | Steel
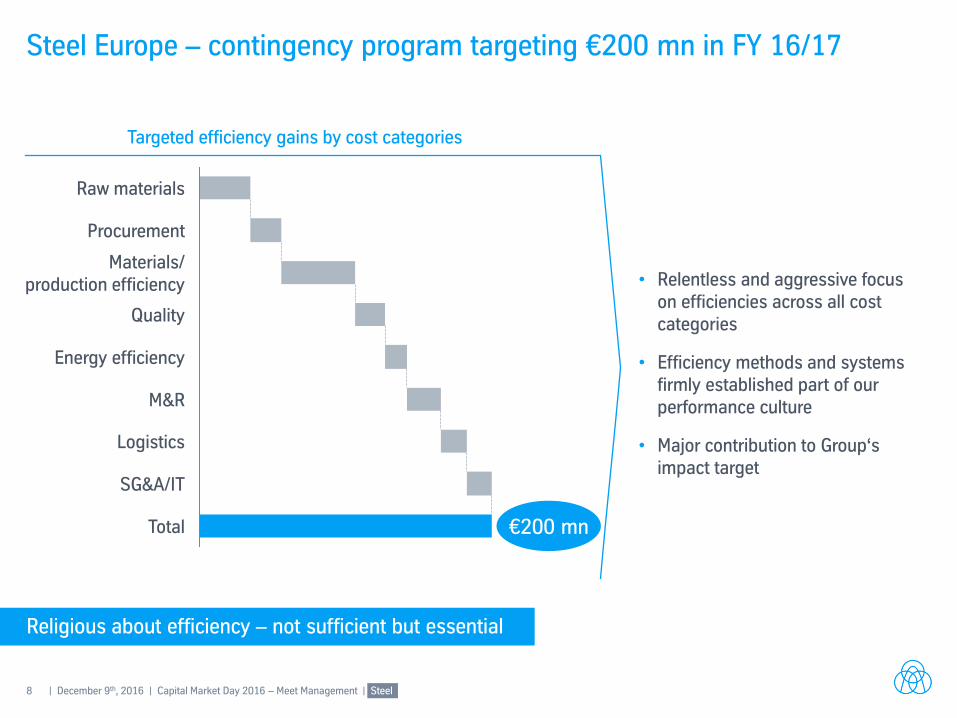
Religious about efficiency – not sufficient but essential
Steel Europe – contingency program targeting €200 mn in FY 16/17
Quality
Energy efficiency
Materials/ production efficiency
Procurement
Raw materials
M&R
Logistics
Total
SG&A/IT
€200 mn
• Relentless and aggressive focus on efficiencies across all cost categories
• Efficiency methods and systems firmly established part of our performance culture
• Major contribution to Group‘s impact target
Targeted efficiency gains by cost categories
9 | December 9th, 2016 | Capital Market Day 2016 – Meet Management | Steel
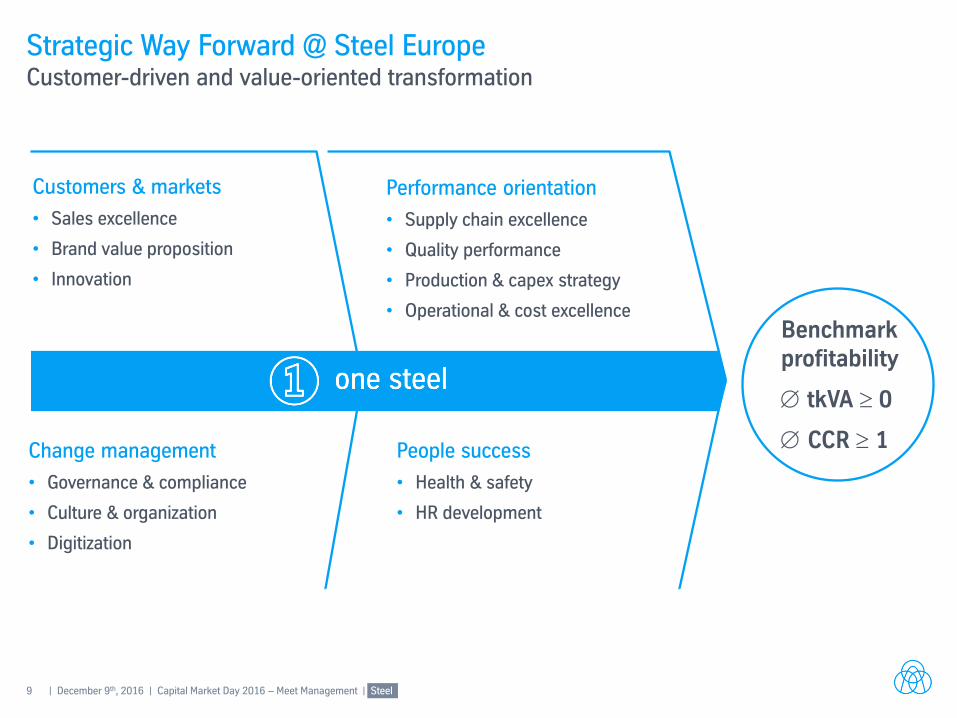
Strategic Way Forward @ Steel Europe Customer-driven and value-oriented transformation
Performance orientation
• Supply chain excellence
• Quality performance
• Production & capex strategy
• Operational & cost excellence
People success
• Health & safety
• HR development
Change management
• Governance & compliance
• Culture & organization
• Digitization
Customers & markets
• Sales excellence
• Brand value proposition
• Innovation
Benchmark profitability
tkVA 0
CCR 1
10 | December 9th, 2016 | Capital Market Day 2016 – Meet Management | Steel
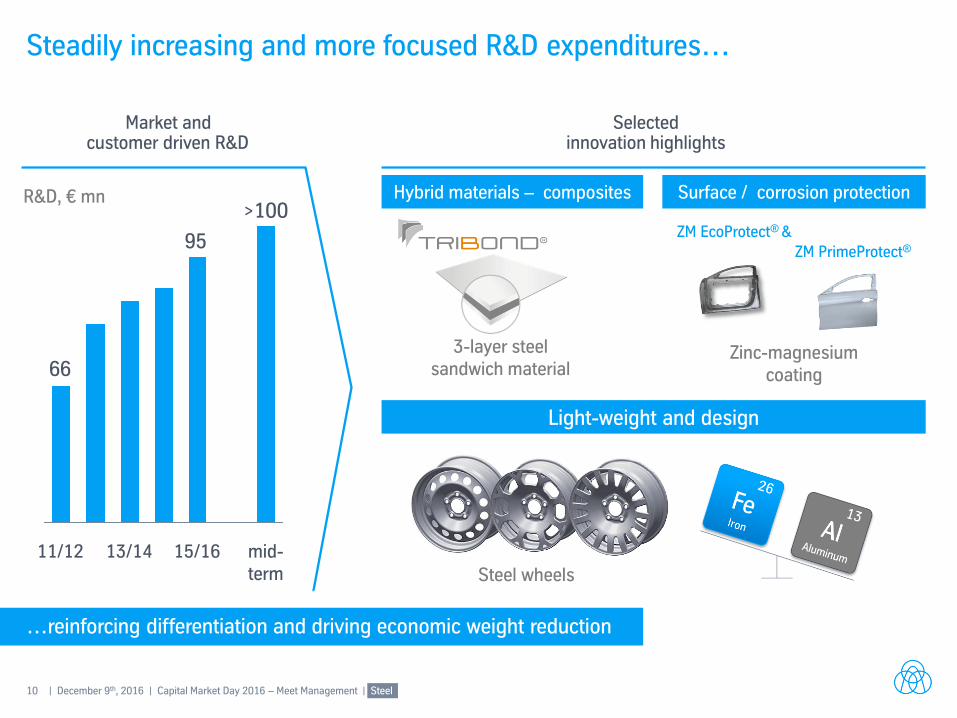
…reinforcing differentiation and driving economic weight reduction
Steadily increasing and more focused R&D expenditures…
Market and customer driven R&D
Selected innovation highlights
95
66
15/16 mid- term
>100
13/14 11/12
R&D, € mn Hybrid materials – composites
3-layer steel sandwich material
Surface / corrosion protection
ZM EcoProtect® &
Zinc-magnesium coating
ZM PrimeProtect®
Light-weight and design
Steel wheels
11 | December 9th, 2016 | Capital Market Day 2016 – Meet Management | Steel
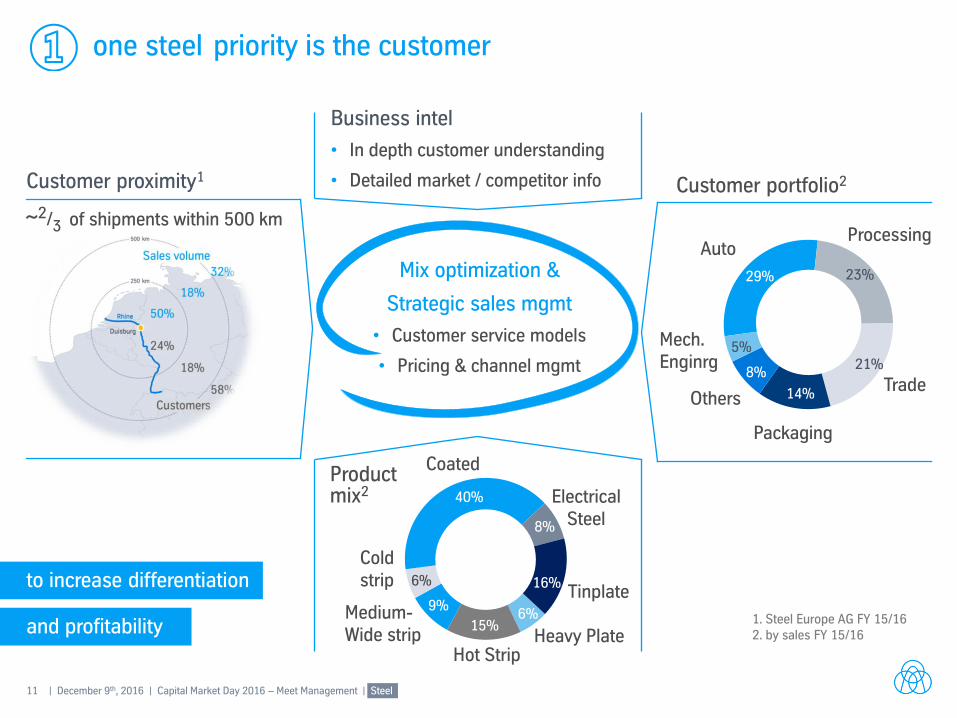
priority is the customer
Customer portfolio2 Customer proximity1
Product mix2
Business intel
• In depth customer understanding
• Detailed market / competitor info
Packaging
14% Others
8%
Mech. Enginrg
5%
Trade 21%
Processing
23%
Auto
29%
6%
8%
Heavy Plate Hot Strip
15%
Coated
40% Electrical Steel
16% Tinplate
Medium- Wide strip
Cold strip
9%
6%
Mix optimization &
Strategic sales mgmt
• Customer service models
• Pricing & channel mgmt
and profitability
to increase differentiation
1. Steel Europe AG FY 15/16 2. by sales FY 15/16
~2/3 of shipments within 500 km
12 | December 9th, 2016 | Capital Market Day 2016 – Meet Management | Steel
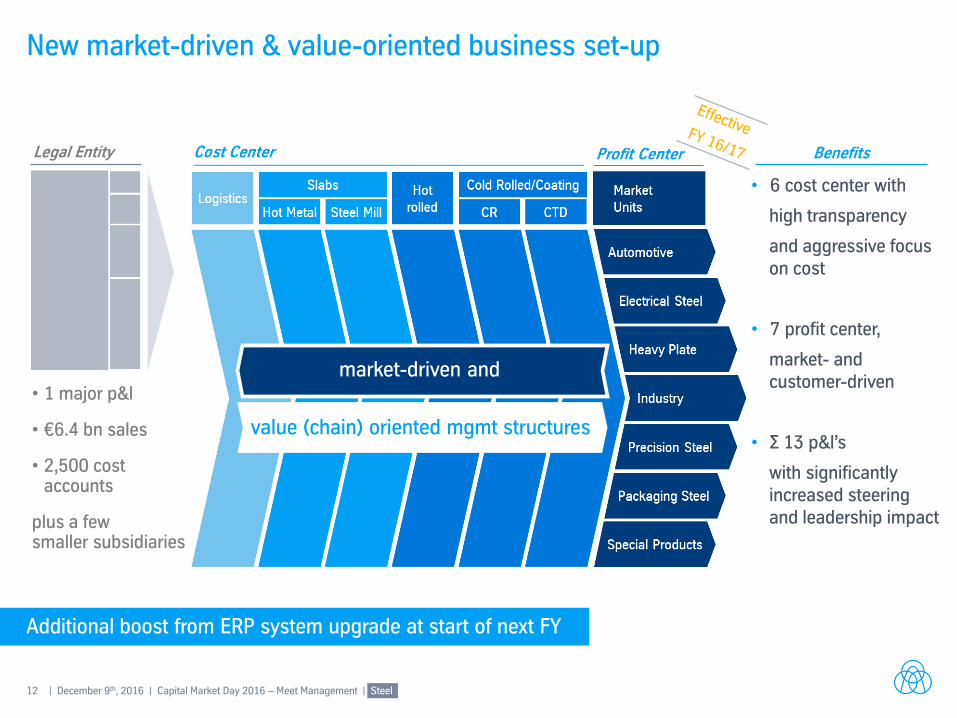
Additional boost from ERP system upgrade at start of next FY
New market-driven & value-oriented business set-up
• 1 major p&l
• €6.4 bn sales
• 2,500 cost accounts
plus a few smaller subsidiaries
Legal Entity
value (chain) oriented mgmt structures
market-driven and
• 6 cost center with
high transparency
and aggressive focus on cost
• 7 profit center,
market- and customer-driven
• ∑ 13 p&l’s
with significantly increased steering and leadership impact
Benefits
13 | December 9th, 2016 | Capital Market Day 2016 – Meet Management | Steel
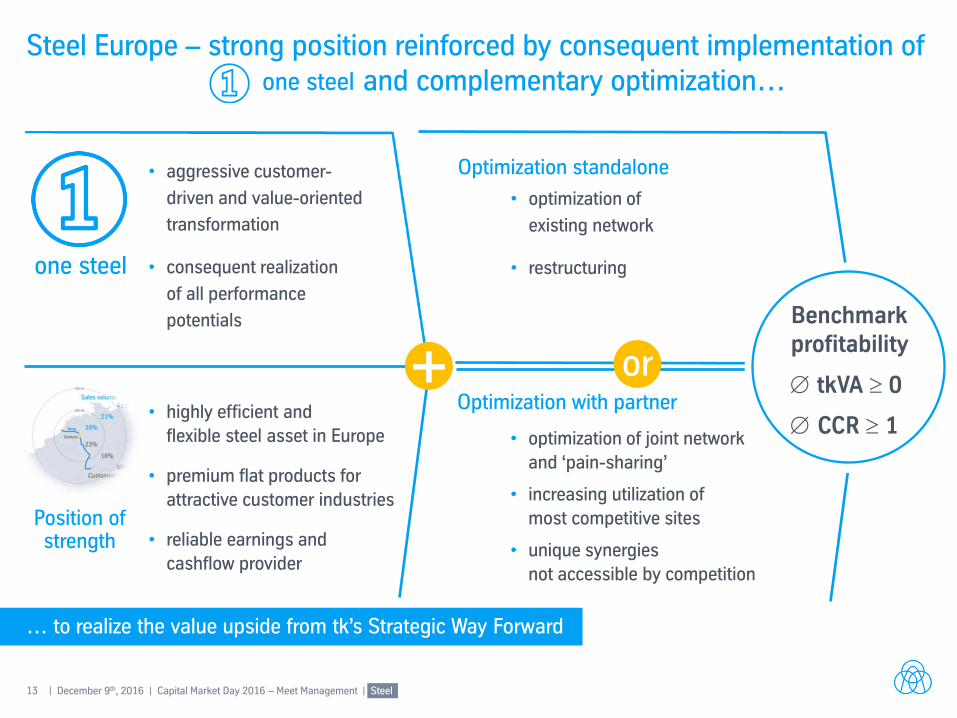
• aggressive customer-
driven and value-oriented
transformation
• consequent realization
of all performance
potentials
Steel Europe – strong position reinforced by consequent implementation of and complementary optimization…
• highly efficient and
flexible steel asset in Europe
• premium flat products for
attractive customer industries
• reliable earnings and
cashflow provider
Position of strength
Optimization standalone
• optimization of
existing network
• restructuring
+ Optimization with partner
or
• optimization of joint network
and ‘pain-sharing’
• increasing utilization of
most competitive sites
• unique synergies
not accessible by competition
… to realize the value upside from tk’s Strategic Way Forward
Benchmark profitability
tkVA 0
CCR 1
15 | December 9th, 2016 | Capital Market Day 2016 – Meet Management
Disclaimer thyssenkrupp AG
“The information set forth and included in this presentation is not provided in connection with an offer or solicitation for the purchase or sale of a security and is intended for informational purposes only.
This presentation contains forward-looking statements that are subject to risks and uncertainties. Statements contained herein that are not statements of historical fact may be deemed to be forward-looking information. When we use words such as “plan,” “believe,” “expect,” “anticipate,” “intend,” “estimate,” “may” or similar expressions, we are making forward-looking statements. You should not rely on forward-looking statements because they are subject to a number of assumptions concerning future events, and are subject to a number of uncertainties and other factors, many of which are outside of our control, that could cause actual results to differ materially from those indicated. These factors include, but are not limited to, the following:
(i) market risks: principally economic price and volume developments,
(ii) dependence on performance of major customers and industries,
(iii) our level of debt, management of interest rate risk and hedging against commodity price risks;
(iv) costs associated with, and regulation relating to, our pension liabilities and healthcare measures,
(v) environmental protection and remediation of real estate and associated with rising standards for real estate environmental protection,
(vi) volatility of steel prices and dependence on the automotive industry,
(vii) availability of raw materials;
(viii) inflation, interest rate levels and fluctuations in exchange rates;
(ix) general economic, political and business conditions and existing and future governmental regulation; and
(x) the effects of competition.
Please note that we disclaim any intention or obligation to update or revise any forward-looking statements whether as a result of new information, future events or otherwise.”