Thursday, 04 August 2011 Asian Daily (Asia Edition)img.jrjimg.cn/2011/08/20110805133437402.pdf ·...
34
DISCLOSURE APPENDIX CONTAINS ANALYST CERTIFICATIONS AND THE STATUS OF NON-US ANALYSTS. FOR OTHER IMPORTANT DISCLOSURES, visit www.credit-suisse.com/ researchdisclosures or call +1 (877) 291-2683. U.S. Disclosure: Credit Suisse does and seeks to do business with companies covered in its research reports. As a result, investors should be aware that the Firm may have a conflict of interest that could affect the objectivity of this report. Investors should consider this report as only a single factor in making their investment decision. Thursday, 04 August 2011 Asian Daily (Asia Edition) EPS, TP and Rating changes EPS TP (% change) T+1 T+2 Chg Up/Dn Rating Microport 4 (8) (24) 67 O (O) Fauji Fertilizer Company Limited 4 2 2 4 N (N) Great Eastern (2) (3) 0 34 O (O) Hutchison Port Holdings Trust (4) (7) (10) (2) U (U) Singapore Exchange (3) (3) (3) 2 N (N) Cheil Industries Inc (17) (7) (3) 23 O (O) Daelim Industrial (22) (7) 23 26 O (O) Hyundai Development (21) (9) (3) 10 N (N) Samsung Engineering Co Ltd 0 (2) (10) 13 O (O) Woongjin Coway Co Ltd (8) (8) 7 17 O (O) Formosa Chemical & Fibre (2) 1 (10) 26 O (O) Formosa Plastics 5 (8) (4) 7 N (N) Nan Ya Plastics (23) (9) (11) 21 O (O) UMC (20) (25) 0 19 N (N) C 3 : Connecting clients to corporates Hong Kong Shenzhen Dongjiang Enviorenmental Co Ltd (2976.HK) Post result Date 04 August, Hong Kong Coverage Analyst Kenny Lau Hang Seng Bank (0011.HK) Post results Date 05 August, Hong Kong Coverage Analyst Franco Lam Orient Overseas International (0316.HK) Post results Date 09-10 August, Hong Kong Coverage Analyst Sam Lee Tencent Holdings (0700.HK) Post results Date 11 August, Hong Kong Coverage Analyst Wallace Cheung MTR Corporation (0066.HK) Post result Date 12 August, Hong Kong Coverage Analyst Cusson Leung China Vanke Co Ltd-B (200002.SZ) Date 12 August, Hong Kong Coverage Analyst Jinsong Du Renren Inc. (RENN.N) Post result Date 15-16 August, Hong Kong Coverage Analyst Wallace Cheung Shenzhou International (2313.HK) Post result Date 16 August, Hong Kong Coverage Analyst Eva Wang Shandong Weigao Group Medical (1066.HK) Post results Date 16 August, Hong Kong Coverage Analyst Jinsong Du Others Maruti Suzuki India Ltd (MRTI.BO) Date 10-11 August, Mumbai Coverage Analyst Neelkanth Mishra ASEAN + India Conference Date 18-19 August, Singapore Asian Technology Conference Date 14-16 September, Taiwan Contact [email protected] or Your usual sales representative. Top of the pack ... Cheung Kong Holdings (1 HK) – Maintain O Focus list stock Cusson Leung, CFA (3) Investors' feedback on value extraction Taiwan Petrochemicals Sector Sidney Yeh (4) New report: Industry outlook decent, but fire accident takes its toll on Formosa Group profit in 2H11 Microport (853 HK) – Maintain O Jinsong Du (5) New report: Price cuts should be less than market's expectation; 1H11 results upside Global Fixed Income Strategy Credit Suisse Fixed Income Strategy Teams (6) Too much to bear ... and the whole pack Fixed Income, FX and Commodities Global Fixed Income Strategy Credit Suisse Fixed Income Strategy Team (6) Too much to bear Regional Non Japan Asia Focus List Jahanzeb Naseer (7) New report: Changes in Hong Kong China China Basic Materials Sector Trina Chen (8) MIIT reports 1H11 sector trend — the good and the bad Microport (853 HK) – Maintain O Jinsong Du (5) New report: Price cuts should be less than market's expectation; 1H11 results upside Hong Kong Cheung Kong Holdings (1 HK) – Maintain O Focus list stock Cusson Leung, CFA (3) Investors' feedback on value extraction Standard Chartered (2888 HK) – Maintain U Sanjay Jain (9) 1H11 results — Consumer compensates for Wholesale; overall in line Indonesia Astra International (ASII IJ) – Maintain N Teddy Oetomo (10) All time high July 2011 industry car sales volume looks priced in Pakistan Fauji Fertilizer Company Limited (FFC PA) – Maintain N Farhan Rizvi, CFA (11) Earnings and target price raised on higher dividend income from FFBL Singapore City Developments (CIT SP) – Maintain O Tricia Song (12) Strong M&C 2Q11 results, Singapore RevPAR +22.5% in July Great Eastern (GE SP) – Maintain O Frances Feng (13) 2Q11 result: Good business momentum Hutchison Port Holdings Trust (HPHT SP) – Maintain U Ingrid Wei (14) 1H11 earnings slightly beat on better cost savings, but more cautious on demand outlook Overseas Union Enterprise (OUE SP) – Maintain O Tricia Song (15) 2Q11 results seemingly below estimates, but expect profits to be backloaded Singapore Exchange (388 HK) – Maintain N Arjan van Veen (16) New report: Downgrading earnings for weaker start to FY12 South Korea Cheil Industries Inc (001300 KS) – Maintain O A-Hyung Cho (17) 2Q disappoints; should benefit with the improvement in IT industry going forward Daelim Industrial (000210 KS) – Maintain O Minseok Sinn (18) Return of the conventional strong name in the Middle East plant market
-
Upload
vuongthuan -
Category
Documents
-
view
212 -
download
0
Transcript of Thursday, 04 August 2011 Asian Daily (Asia Edition)img.jrjimg.cn/2011/08/20110805133437402.pdf ·...
DISCLOSURE APPENDIX CONTAINS ANALYST CERTIFICATIONS AND THE STATUS OF NON-US ANALYSTS. FOR OTHER IMPORTANT DISCLOSURES, visit www.credit-suisse.com/ researchdisclosures or call +1 (877) 291-2683. U.S. Disclosure: Credit Suisse does and seeks to do business with companies covered in its research reports. As a result, investors should be aware that the Firm may have a conflict of interest that could affect the objectivity of this report. Investors should consider this report as only a single factor in making their investment decision.
Thursday, 04 August 2011
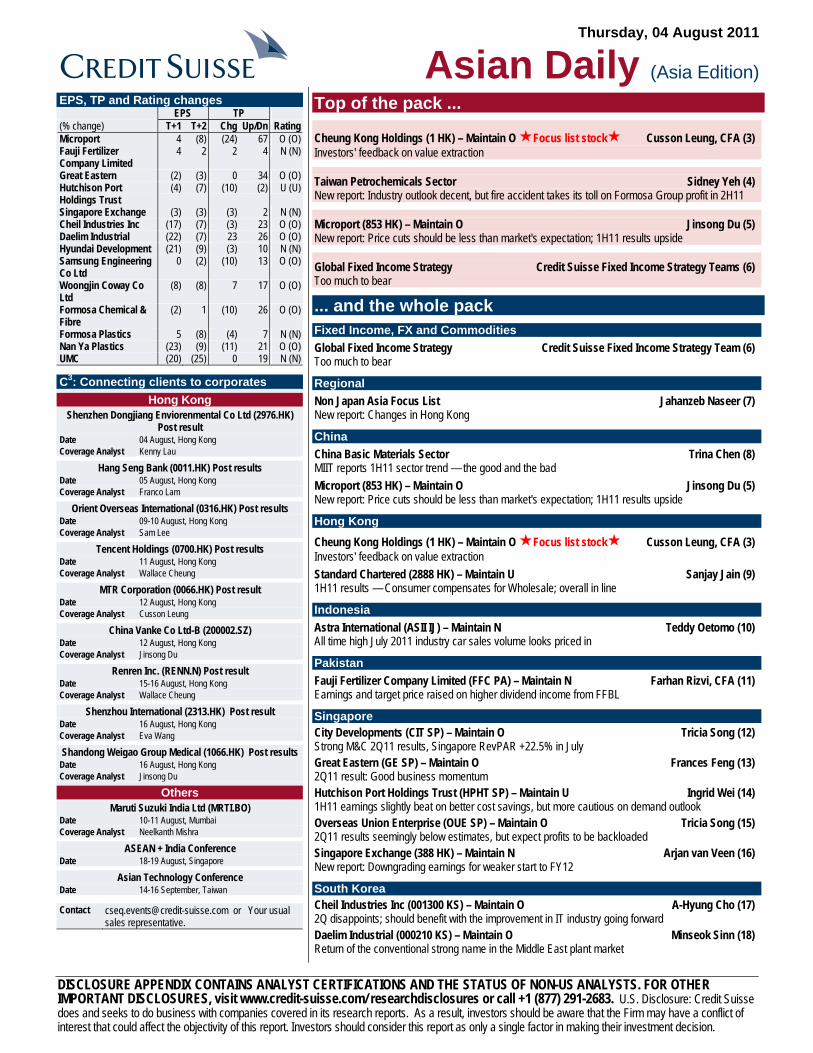
Asian Daily (Asia Edition)EPS, TP and Rating changes EPS TP (% change) T+1 T+2 Chg Up/Dn Rating Microport 4 (8) (24) 67 O (O) Fauji Fertilizer Company Limited
4 2 2 4 N (N)
Great Eastern (2) (3) 0 34 O (O) Hutchison Port Holdings Trust
(4) (7) (10) (2) U (U)
Singapore Exchange (3) (3) (3) 2 N (N) Cheil Industries Inc (17) (7) (3) 23 O (O) Daelim Industrial (22) (7) 23 26 O (O) Hyundai Development (21) (9) (3) 10 N (N) Samsung Engineering Co Ltd
0 (2) (10) 13 O (O)
Woongjin Coway Co Ltd
(8) (8) 7 17 O (O)
Formosa Chemical & Fibre
(2) 1 (10) 26 O (O)
Formosa Plastics 5 (8) (4) 7 N (N) Nan Ya Plastics (23) (9) (11) 21 O (O) UMC (20) (25) 0 19 N (N)
C3: Connecting clients to corporates
Hong Kong Shenzhen Dongjiang Enviorenmental Co Ltd (2976.HK)
Post result Date 04 August, Hong Kong Coverage Analyst Kenny Lau
Hang Seng Bank (0011.HK) Post results Date 05 August, Hong Kong Coverage Analyst Franco Lam
Orient Overseas International (0316.HK) Post results Date 09-10 August, Hong Kong Coverage Analyst Sam Lee
Tencent Holdings (0700.HK) Post results Date 11 August, Hong Kong Coverage Analyst Wallace Cheung
MTR Corporation (0066.HK) Post result Date 12 August, Hong Kong Coverage Analyst Cusson Leung
China Vanke Co Ltd-B (200002.SZ) Date 12 August, Hong Kong Coverage Analyst Jinsong Du
Renren Inc. (RENN.N) Post result Date 15-16 August, Hong Kong Coverage Analyst Wallace Cheung
Shenzhou International (2313.HK) Post result Date 16 August, Hong Kong Coverage Analyst Eva Wang
Shandong Weigao Group Medical (1066.HK) Post results Date 16 August, Hong Kong Coverage Analyst Jinsong Du
Others Maruti Suzuki India Ltd (MRTI.BO)
Date 10-11 August, Mumbai Coverage Analyst Neelkanth Mishra
ASEAN + India Conference Date 18-19 August, Singapore
Asian Technology Conference Date 14-16 September, Taiwan
Contact [email protected] or Your usual sales representative.
Top of the pack ...
Cheung Kong Holdings (1 HK) – Maintain O Focus list stock Cusson Leung, CFA (3) Investors' feedback on value extraction
Taiwan Petrochemicals Sector Sidney Yeh (4) New report: Industry outlook decent, but fire accident takes its toll on Formosa Group profit in 2H11
Microport (853 HK) – Maintain O Jinsong Du (5) New report: Price cuts should be less than market's expectation; 1H11 results upside
Global Fixed Income Strategy Credit Suisse Fixed Income Strategy Teams (6) Too much to bear
... and the whole pack Fixed Income, FX and Commodities Global Fixed Income Strategy Credit Suisse Fixed Income Strategy Team (6) Too much to bear
Regional Non Japan Asia Focus List Jahanzeb Naseer (7) New report: Changes in Hong Kong
China China Basic Materials Sector Trina Chen (8) MIIT reports 1H11 sector trend — the good and the bad Microport (853 HK) – Maintain O Jinsong Du (5) New report: Price cuts should be less than market's expectation; 1H11 results upside
Hong Kong
Cheung Kong Holdings (1 HK) – Maintain O Focus list stock Cusson Leung, CFA (3) Investors' feedback on value extraction Standard Chartered (2888 HK) – Maintain U Sanjay Jain (9) 1H11 results — Consumer compensates for Wholesale; overall in line
Indonesia Astra International (ASII IJ) – Maintain N Teddy Oetomo (10) All time high July 2011 industry car sales volume looks priced in
Pakistan Fauji Fertilizer Company Limited (FFC PA) – Maintain N Farhan Rizvi, CFA (11) Earnings and target price raised on higher dividend income from FFBL
Singapore City Developments (CIT SP) – Maintain O Tricia Song (12) Strong M&C 2Q11 results, Singapore RevPAR +22.5% in July Great Eastern (GE SP) – Maintain O Frances Feng (13) 2Q11 result: Good business momentum Hutchison Port Holdings Trust (HPHT SP) – Maintain U Ingrid Wei (14) 1H11 earnings slightly beat on better cost savings, but more cautious on demand outlook Overseas Union Enterprise (OUE SP) – Maintain O Tricia Song (15) 2Q11 results seemingly below estimates, but expect profits to be backloaded Singapore Exchange (388 HK) – Maintain N Arjan van Veen (16) New report: Downgrading earnings for weaker start to FY12
South Korea Cheil Industries Inc (001300 KS) – Maintain O A-Hyung Cho (17) 2Q disappoints; should benefit with the improvement in IT industry going forward Daelim Industrial (000210 KS) – Maintain O Minseok Sinn (18) Return of the conventional strong name in the Middle East plant market
Thursday, 04 August 2011
Asian Daily
- 2 of 34 -
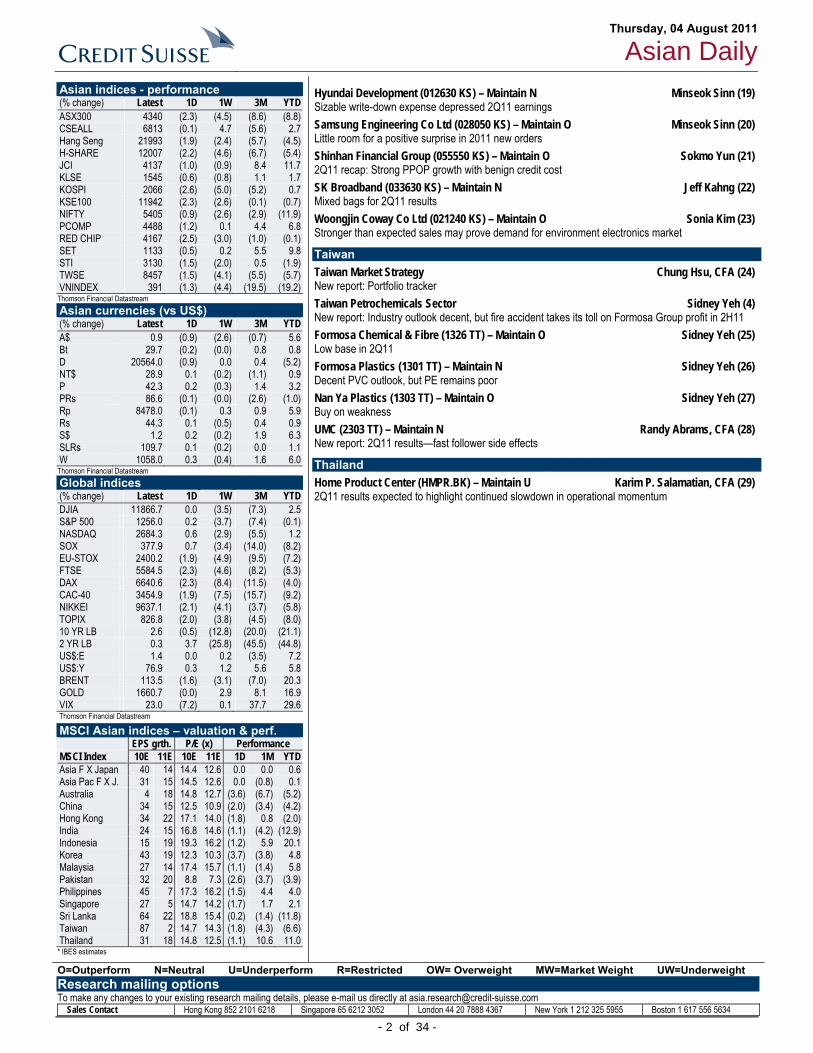
Asian indices - performance (% change) Latest 1D 1W 3M YTD ASX300 4340 (2.3) (4.5) (8.6) (8.8) CSEALL 6813 (0.1) 4.7 (5.6) 2.7 Hang Seng 21993 (1.9) (2.4) (5.7) (4.5) H-SHARE 12007 (2.2) (4.6) (6.7) (5.4) JCI 4137 (1.0) (0.9) 8.4 11.7 KLSE 1545 (0.6) (0.8) 1.1 1.7 KOSPI 2066 (2.6) (5.0) (5.2) 0.7 KSE100 11942 (2.3) (2.6) (0.1) (0.7) NIFTY 5405 (0.9) (2.6) (2.9) (11.9) PCOMP 4488 (1.2) 0.1 4.4 6.8 RED CHIP 4167 (2.5) (3.0) (1.0) (0.1) SET 1133 (0.5) 0.2 5.5 9.8 STI 3130 (1.5) (2.0) 0.5 (1.9) TWSE 8457 (1.5) (4.1) (5.5) (5.7) VNINDEX 391 (1.3) (4.4) (19.5) (19.2)
Thomson Financial Datastream Asian currencies (vs US$) (% change) Latest 1D 1W 3M YTD A$ 0.9 (0.9) (2.6) (0.7) 5.6 Bt 29.7 (0.2) (0.0) 0.8 0.8 D 20564.0 (0.9) 0.0 0.4 (5.2) NT$ 28.9 0.1 (0.2) (1.1) 0.9 P 42.3 0.2 (0.3) 1.4 3.2 PRs 86.6 (0.1) (0.0) (2.6) (1.0) Rp 8478.0 (0.1) 0.3 0.9 5.9 Rs 44.3 0.1 (0.5) 0.4 0.9 S$ 1.2 0.2 (0.2) 1.9 6.3 SLRs 109.7 0.1 (0.2) 0.0 1.1 W 1058.0 0.3 (0.4) 1.6 6.0
Thomson Financial Datastream Global indices (% change) Latest 1D 1W 3M YTD DJIA 11866.7 0.0 (3.5) (7.3) 2.5 S&P 500 1256.0 0.2 (3.7) (7.4) (0.1) NASDAQ 2684.3 0.6 (2.9) (5.5) 1.2 SOX 377.9 0.7 (3.4) (14.0) (8.2) EU-STOX 2400.2 (1.9) (4.9) (9.5) (7.2) FTSE 5584.5 (2.3) (4.6) (8.2) (5.3) DAX 6640.6 (2.3) (8.4) (11.5) (4.0) CAC-40 3454.9 (1.9) (7.5) (15.7) (9.2) NIKKEI 9637.1 (2.1) (4.1) (3.7) (5.8) TOPIX 826.8 (2.0) (3.8) (4.5) (8.0) 10 YR LB 2.6 (0.5) (12.8) (20.0) (21.1) 2 YR LB 0.3 3.7 (25.8) (45.5) (44.8) US$:E 1.4 0.0 0.2 (3.5) 7.2 US$:Y 76.9 0.3 1.2 5.6 5.8 BRENT 113.5 (1.6) (3.1) (7.0) 20.3 GOLD 1660.7 (0.0) 2.9 8.1 16.9 VIX 23.0 (7.2) 0.1 37.7 29.6
Thomson Financial Datastream
MSCI Asian indices – valuation & perf. EPS grth. P/E (x) Performance MSCI Index 10E 11E 10E 11E 1D 1M YTD Asia F X Japan 40 14 14.4 12.6 0.0 0.0 0.6 Asia Pac F X J. 31 15 14.5 12.6 0.0 (0.8) 0.1 Australia 4 18 14.8 12.7 (3.6) (6.7) (5.2) China 34 15 12.5 10.9 (2.0) (3.4) (4.2) Hong Kong 34 22 17.1 14.0 (1.8) 0.8 (2.0) India 24 15 16.8 14.6 (1.1) (4.2) (12.9) Indonesia 15 19 19.3 16.2 (1.2) 5.9 20.1 Korea 43 19 12.3 10.3 (3.7) (3.8) 4.8 Malaysia 27 14 17.4 15.7 (1.1) (1.4) 5.8 Pakistan 32 20 8.8 7.3 (2.6) (3.7) (3.9) Philippines 45 7 17.3 16.2 (1.5) 4.4 4.0 Singapore 27 5 14.7 14.2 (1.7) 1.7 2.1 Sri Lanka 64 22 18.8 15.4 (0.2) (1.4) (11.8) Taiwan 87 2 14.7 14.3 (1.8) (4.3) (6.6) Thailand 31 18 14.8 12.5 (1.1) 10.6 11.0
* IBES estimates
Hyundai Development (012630 KS) – Maintain N Minseok Sinn (19) Sizable write-down expense depressed 2Q11 earnings Samsung Engineering Co Ltd (028050 KS) – Maintain O Minseok Sinn (20) Little room for a positive surprise in 2011 new orders Shinhan Financial Group (055550 KS) – Maintain O Sokmo Yun (21) 2Q11 recap: Strong PPOP growth with benign credit cost SK Broadband (033630 KS) – Maintain N Jeff Kahng (22) Mixed bags for 2Q11 results Woongjin Coway Co Ltd (021240 KS) – Maintain O Sonia Kim (23) Stronger than expected sales may prove demand for environment electronics market
Taiwan Taiwan Market Strategy Chung Hsu, CFA (24) New report: Portfolio tracker Taiwan Petrochemicals Sector Sidney Yeh (4) New report: Industry outlook decent, but fire accident takes its toll on Formosa Group profit in 2H11 Formosa Chemical & Fibre (1326 TT) – Maintain O Sidney Yeh (25) Low base in 2Q11 Formosa Plastics (1301 TT) – Maintain N Sidney Yeh (26) Decent PVC outlook, but PE remains poor Nan Ya Plastics (1303 TT) – Maintain O Sidney Yeh (27) Buy on weakness UMC (2303 TT) – Maintain N Randy Abrams, CFA (28) New report: 2Q11 results—fast follower side effects
Thailand Home Product Center (HMPR.BK) – Maintain U Karim P. Salamatian, CFA (29) 2Q11 results expected to highlight continued slowdown in operational momentum
O=Outperform N=Neutral U=Underperform R=Restricted OW= Overweight MW=Market Weight UW=Underweight Research mailing options To make any changes to your existing research mailing details, please e-mail us directly at [email protected]
Sales Contact Hong Kong 852 2101 6218 Singapore 65 6212 3052 London 44 20 7888 4367 New York 1 212 325 5955 Boston 1 617 556 5634

Thursday, 04 August 2011
Asian Daily
- 3 of 34 -
Top of the pack ... Cheung Kong Holdings ---------------------------------------------------- Maintain OUTPERFORM Investors' feedback on value extraction EPS: ◄► TP: ◄► Cusson Leung, CFA / Research Analyst / 852 2101 6621 / [email protected] Joyce Kwock / Research Analyst / 852 2101 7496 / [email protected]
● Most investors believe our CK restructuring is interesting but there are also some push-backs, with the property sector risk being the key one. However, we believe CK’s willingness to sell help it generate constant cashflow even in a difficult market.
● The rise in the accounting gearing may not be a real issue if Cheung Kong does not want further acquisitions or capex spends for expansion. The rise in accounting gearing is an inconvenient hurdle for its expansion in the future, in our view.
● The restructuring exercise is our logical deduction to help extract the hidden value within the group. While timing appears far fetched, we believe CK’s deep discount and the ‘possibility’ of it happening will already be enough to narrow the discount.
● Specifically for the idea of distributing Hutch In Specie, how to tackle the dilution in KS Li’s stake in Hutch? Buy back from the market is one way. CK can sell assets to Hutch for new stock but we believe Husky Energy could also be sold by KS Li to Hutch for new stock, which will likely help boost his stake immediately.
● Cheung Kong Holdings is a Credit Suisse NJA Focus List stock.
General feedback on our Cheung Kong call
Following the issuance of our note on Cheung Kong, Value transformer dated 2 August 2011, and our day-long discussion with investors, we are summarising some key feedback. Although most clients are positive on either Cheung Kong or Hutch, the major push-backs are summarised below: Macro risks is rising, not the right time to long beta A major concern about our positive call on Cheung Kong is from the general lack of risk appetite. Cheung Kong, being partially a Hong Kong property company, is also facing the potential downside risks of the local property market.
CS view: While there is concern about the property market, Cheung Kong is the one name always willing to move its inventory whether it is in an up/down market largely due to its landbank size and the relatively low development costs. The fact that the company has already made HK$14 bn of sales revenue so far demonstrates its ability to generate cashflow in a difficult property market. Potential rise in consolidated gearing is not a major issue An argument we highlight in the report as a catalyst for restructuring is the potential rise in Cheung Kong’s gearing due to the change in accounting rules. However, most clients believe the gearing increase would not impact Cheung Kong at all as these are mainly Hutch borrowings.
CS view: The rise in the proforma gearing is not an issue to Cheung Kong if the company does not want to spend capex on expanding itself in the future. Once the company start spending capex or making acquisitions, the proforma gearing will not be at our projected level. The acquisition of the water business in the UK was a case in point. To avoid this, we believe the overall direction of the group is to first deleverage as mush as it can. The idea is speculative and the timing is highly uncertain The restructuring exercise has not been confirmed by the company and the timing of this happening can actually be very sketchy. Why should the discount narrow now?
CS view: The restructuring exercise is our logical deduction with the assumed objectives of removing the holding company discount and potential excessive gearing. The most important point of the call is that the valuation of Cheung Kong is cheap to an extent that it warrants this sort of restructuring exercise to extract hidden value. With this valuation backdrop, followed by the market starting to realise there are actually ways to extract this value, the discounts will unwind faster than the market can expect. The major shareholder will not likely want to do this Specifically referring to the scenario of distributing Hutch In Specie to Cheung Kong shareholders, some investors believe the heavy dilution of KS Li’s stake in Hutch to only 24% will make the distribution near impossible.
CS view: The distribution will not happen on its own but together with the potential purchase of shares from KS Li or from the market in both companies. Besides this, to alleviate the pressure of buy from the market, Cheung Kong can sell assets to Hutch for a stake. KS Li can also sell some assets to Hutch in exchange for shares. For example, KS Li holds a 34% share in Husky Energy while Hutch holds 32%. We believe there could be a possibility of KS Li selling his stake in Husky Energy to Hutch for shares that result in an immediate boost to his holdings in Hutch.
Price (03 Aug 11, HK$) 119.70TP (prev. TP HK$) 151.90 (151.90) Est. pot. % chg. to TP 2752-wk range (HK$) 135.4 - 96.6Mkt cap (HK$/US$ bn) 277.2/ 35.6
Bbg/RIC 1 HK / 0001.HK Rating (prev. rating) O (O) Shares outstanding (mn) 2,316.16 Daily trad vol - 6m avg (mn) 4.2 Daily trad val - 6m avg (US$ mn) 64.9 Free float (%) — Major shareholders
Performance 1M 3M 12MAbsolute (%) 3.2 0.7 23.8Relative (%) 6.6 6.1 21.4
Year 12/09A 12/10A 12/11E 12/12E 12/13EEBITDA (HK$ mn) 19,553 23,119 48,263 34,842 33,153Net profit (HK$ mn) 19,886 26,478 45,898 29,445 28,204EPS (HK$) 8.6 11.4 19.8 12.7 12.2- Change from prev. EPS (%) n.a. n.a. 0 0 0- Consensus EPS (HK$) n.a. n.a. 17.9 10.1 12.2EPS growth (%) 28.1 33.1 73.3 (35.8) (4.2)P/E (x) 13.9 10.5 6.0 9.4 9.8Dividend yield (%) 2.3 2.5 2.5 2.5 2.5EV/EBITDA (x) 15.4 12.5 6.0 8.1 8.3ROE (%) 8.5 10.4 16.1 9.3 8.3Net debt(cash)/equity (%) 9.3 4.5 3.3 1.7 (0.2)NAV per share (HK$) — — 164 — —Disc./prem. to NAV (%) — — (27.0) — — Note 1: ORD/ADR=1.00. Note 2: Cheung Kong (Holdings) Limited is a Hong Kong-based company engaged in investment holding and project management activities. The company’s subsidiaries are engaged in property development and investment, hotel and serviced suite operation, property and project management and investment in securities.
Thursday, 04 August 2011
Asian Daily
- 4 of 34 -
Taiwan Petrochemicals Sector ----------------------------------------------------------------------------- New report: Industry outlook decent, but fire accident takes its toll on Formosa Group profit in 2H11 Sidney Yeh / Research Analyst / 886 2 2715 6368 / [email protected] David Liao / Research Analyst / 8862 2715 6342 / [email protected] Grace Li / Research Analyst / 886 2 2715 6353 / [email protected]
● Formosa Group is required to shut down refinery immediately and, in turn, other chemical plants for safety checks. Although there is no serious damage to equipment, assuming a 60-day suspension of the refinery and lower utilisation at olefins, we estimate FPCC will see a 72% profit decline QoQ in 3Q11, leading to 4-6% income shortfall for the other three parent companies.
● Aside from FPCC, we think chemical entities should see less production disruption given: (1) a less complex production process and (2) it can procure external feedstock to produce.
● For the petrochemical industry, we believe demand in China is stabilising as we are in the late stage of a serious credit tightening. We expect the petrochemical sector to see a mild recovery in 2H11 given the light industrial inventory and the high season.
● We trim our 2011 EPS forecast for FPCC, Nan Ya and FCFC by 2-23%, assuming a two-month production shutdown at FPCC and a one-month shutdown at three chemical companies. In tandem, we revise down our target price by 1-11% due to lower valuation multiples. Following the sharp share price corrections over the past few days, valuation and risk-reward appear decent at FCFC and Nan Ya. High dividend yield should also serve as downside support.
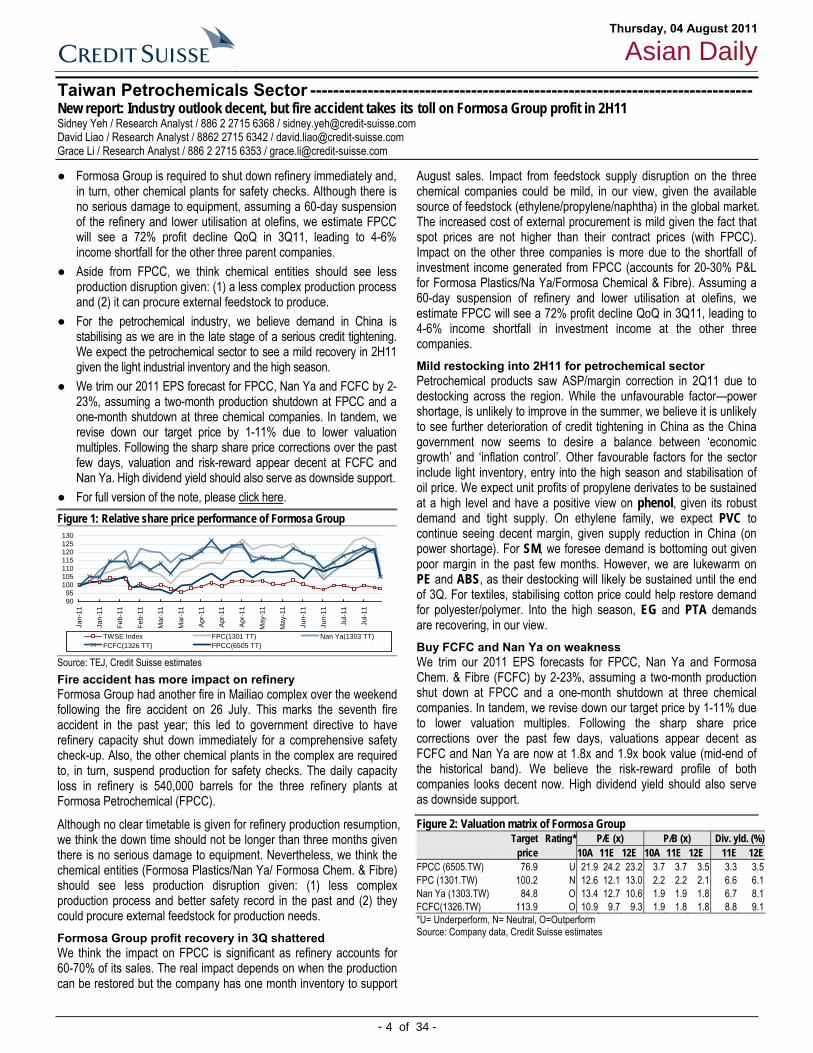
● For full version of the note, please click here. Figure 1: Relative share price performance of Formosa Group
9095
100105110115120125130
Jan-
11
Jan-
11
Feb-
11
Feb-
11
Mar
-11
Mar
-11
Apr-1
1
Apr-1
1
Apr-1
1
May
-11
May
-11
Jun-
11
Jun-
11
Jul-1
1
Jul-1
1
TWSE Index FPC(1301 TT) Nan Ya(1303 TT)FCFC(1326 TT) FPCC(6505 TT)
Source: TEJ, Credit Suisse estimates Fire accident has more impact on refinery Formosa Group had another fire in Mailiao complex over the weekend following the fire accident on 26 July. This marks the seventh fire accident in the past year; this led to government directive to have refinery capacity shut down immediately for a comprehensive safety check-up. Also, the other chemical plants in the complex are required to, in turn, suspend production for safety checks. The daily capacity loss in refinery is 540,000 barrels for the three refinery plants at Formosa Petrochemical (FPCC).
Although no clear timetable is given for refinery production resumption, we think the down time should not be longer than three months given there is no serious damage to equipment. Nevertheless, we think the chemical entities (Formosa Plastics/Nan Ya/ Formosa Chem. & Fibre) should see less production disruption given: (1) less complex production process and better safety record in the past and (2) they could procure external feedstock for production needs. Formosa Group profit recovery in 3Q shattered We think the impact on FPCC is significant as refinery accounts for 60-70% of its sales. The real impact depends on when the production can be restored but the company has one month inventory to support
August sales. Impact from feedstock supply disruption on the three chemical companies could be mild, in our view, given the available source of feedstock (ethylene/propylene/naphtha) in the global market. The increased cost of external procurement is mild given the fact that spot prices are not higher than their contract prices (with FPCC). Impact on the other three companies is more due to the shortfall of investment income generated from FPCC (accounts for 20-30% P&L for Formosa Plastics/Na Ya/Formosa Chemical & Fibre). Assuming a 60-day suspension of refinery and lower utilisation at olefins, we estimate FPCC will see a 72% profit decline QoQ in 3Q11, leading to 4-6% income shortfall in investment income at the other three companies. Mild restocking into 2H11 for petrochemical sector Petrochemical products saw ASP/margin correction in 2Q11 due to destocking across the region. While the unfavourable factor—power shortage, is unlikely to improve in the summer, we believe it is unlikely to see further deterioration of credit tightening in China as the China government now seems to desire a balance between ‘economic growth’ and ‘inflation control’. Other favourable factors for the sector include light inventory, entry into the high season and stabilisation of oil price. We expect unit profits of propylene derivates to be sustained at a high level and have a positive view on phenol, given its robust demand and tight supply. On ethylene family, we expect PVC to continue seeing decent margin, given supply reduction in China (on power shortage). For SM, we foresee demand is bottoming out given poor margin in the past few months. However, we are lukewarm on PE and ABS, as their destocking will likely be sustained until the end of 3Q. For textiles, stabilising cotton price could help restore demand for polyester/polymer. Into the high season, EG and PTA demands are recovering, in our view. Buy FCFC and Nan Ya on weakness We trim our 2011 EPS forecasts for FPCC, Nan Ya and Formosa Chem. & Fibre (FCFC) by 2-23%, assuming a two-month production shut down at FPCC and a one-month shutdown at three chemical companies. In tandem, we revise down our target price by 1-11% due to lower valuation multiples. Following the sharp share price corrections over the past few days, valuations appear decent as FCFC and Nan Ya are now at 1.8x and 1.9x book value (mid-end of the historical band). We believe the risk-reward profile of both companies looks decent now. High dividend yield should also serve as downside support.
Figure 2: Valuation matrix of Formosa Group Target Rating* P/E (x) P/B (x) Div. yld. (%) price 10A 11E 12E 10A 11E 12E 11E 12EFPCC (6505.TW) 76.9 U 21.9 24.2 23.2 3.7 3.7 3.5 3.3 3.5FPC (1301.TW) 100.2 N 12.6 12.1 13.0 2.2 2.2 2.1 6.6 6.1Nan Ya (1303.TW) 84.8 O 13.4 12.7 10.6 1.9 1.9 1.8 6.7 8.1FCFC(1326.TW) 113.9 O 10.9 9.7 9.3 1.9 1.8 1.8 8.8 9.1*U= Underperform, N= Neutral, O=Outperform Source: Company data, Credit Suisse estimates

Thursday, 04 August 2011
Asian Daily
- 5 of 34 -
Microport------------------------------------------------------------------------ Maintain OUTPERFORM New report: Price cuts should be less than market's expectation; 1H11 results upside EPS: ▼ TP: ▼ Jinsong Du / Research Analyst / 852 2101 6589 / [email protected] Lefei Sun / Research Analyst / 852 2101 7658 / [email protected] Duo Chen / Research Analyst / 852 2101 7350 / [email protected]
● Microport’s share price has fallen 46% YTD, underperforming the MSCI China and Healthcare indices by 44% and 26%, respectively, due to concerns about the potential price cut in drug eluting stents. Click here for our full report.
● Talks with government officials and industry experts suggest that Beijing may announce a price cut of 15-20% in the next few months, much less than the 30-40% being discussed in the market. Although this is higher than our original assumption of a 10% cut, we expect Microport to reduce the impact by negotiating with distributors and bundling the sale of PCI surgery accessories under government’s pilot for disease-related-group initiatives.
● Moreover, Microport recently made a breakthrough in product diversification by receiving a major order of US$3 mn from Turkey for its in-house orthopaedics products in July 2011.
● We increase our 2011E EPS by 4%, but reduce our 2012E and 2013E EPS due to the delayed but more significant price cut. We continue to expect Microport’s 1H11 results to beat consensus. We maintain OUTPERFORM.
What’s the price-cut level for upcoming tendering?
The last centralised drug eluting stent procurement was in 2008, and usually the industry expectation for annual ASP erosion from the tendering price-cut is about 5-8%. Given the three-year compounded impact, the market fears that price cut in the upcoming tendering will be relatively significant, at 30-40%, while we consider 15-20% as a more reasonable range given the three-year compounded impact. Even if the tendering kicks off in 2H 2011, the real impact would most likely be booked in 2012, and not in 2011. We believe Microport’s 2011 results could outperform expectations, but may be under pressure in 2012.
Scenario analysis for price cut impact on Microport ● Base case scenario: Since volume growth for the industry is over
25% across different players, we conservatively assume that volume growth is 25% and that ASP erosion will be shared by both the manufacturer and distributor by best efforts negotiations. Further, the company could offer longer credit terms for distributors in exchange for sharing the price-cut impact.
● Worst case scenario: Even if we assume that the company takes no action for price-cut and bears the whole 20% ASP erosion, since the volume growth would be over 25% and the company has more room to improve operating margin, the bottom line could still grow slightly in 2012.
● Best case scenario: The company is working on other ways to digest the potential price-cut impact. For example, it is considering to offer bundled sale with PCI surgery accessories by partnering with overseas strategic players. Since the government is also encouraging disease-related-group reimbursement schemes in developed regions such as Beijing and Shanghai, hospitals would increasingly encourage suppliers for one-stop shop offerings targeting certain disease procedures such as PCI surgery. Limited qualified local players can supply PCI surgery accessories in China and as the market leader, Microport can bundle purchase accessories with strategic overseas partners at higher discount and sell to distributors and hospitals in exchange for better DES prices, leveraging its No.1 market share position and high turnover volume. In this scenario, the overall growth volume can also get a boost, given the higher potential market share gain and limited price-cut impact as distributors will share more burden.
Figure 1: Scenario analysis for price cut impact on Microport 2012 Worst case Base case Best case DES price cut -20% -15% -10% DES volume growth 25% 25% 30% DES sales growth 0% 6% 17% Total sales growth ~5% ~10% ~20% Total profit growth >5% >10% >20% Comments Company takes no
actions and fully absorbs price-cut impact
Negotiates with distributors to split the impact
Bundles sale of PCI surgery accessories with strategic partners to digest price-cut impact
Source: Company data, Credit Suisse estimates Potential upside from business diversification Microport is also actively looking for opportunities to diversify its business to derisk the concentration of drug eluting stents. It has increasingly been making progress: in July 2011, it confirmed the first overseas order (US$3 mn) from Turkey for its in-house developed orthopaedics products, which successfully got CE marks at end of last year. Although this is still marginal contribution, the company is moving towards more diversifications. More in-house products are also being developed, covering orthopaedics, electrophysiology and interventional cardiovascular devices markets. It is also actively looking for merger and acquisition opportunities in high potential areas such as orthopaedics. Potential upside could arise in 2H 2011 or 2012 if the diversification strategy progresses smoothly.
Price (03 Aug 11 , HK$) 4.01TP (prev. TP HK$) 6.70 (8.80) Est. pot. % chg. to TP 6752-wk range (HK$) 8.86 - 4.01Mkt cap (HK$/US$ mn) 5,784.7/ 741.9
Bbg/RIC 853 HK / 0853.HK Rating (prev. rating) O (O) [V] Shares outstanding (mn) 1,442.57 Daily trad vol - 6m avg (mn) 2.2 Daily trad val - 6m avg (US$ mn) 1.6 Free float (%) — Major shareholders
Performance 1M 3M 12MAbsolute (%) (23.2) (28.5) —Relative (%) (17.8) (23.4) —
Year 12/09A 12/10A 12/11E 12/12E 12/13ERevenue (Rmb mn) 561 728 865 947 1,129EBITDA (Rmb mn) 286.6 312.9 401.4 467.9 565.8Net profit (Rmb mn) 186.4 240.1 309.4 354.0 431.6EPS (Rmb) 0.16 0.20 0.21 0.25 0.30- Change from prev. EPS (%) n.a. n.a. 4 (8) (6)- Consensus EPS (Rmb) n.a. n.a. 0.21 0.26 0.32EPS growth (%) 3.2 20.3 9.2 14.4 21.9P/E (x) 20.3 16.9 15.4 13.5 11.1Dividend yield (%) 0 0 0 0 0EV/EBITDA (x) 16.4 12.5 8.8 7.2 5.1P/B (x) 9.7 2.0 — — —ROE (%) 46.9 20.4 14.1 13.6 14.2Net debt(cash)/equity (%) (22.1) (44.3) (50.8) (49.7) (57.4) Note 1: MicroPort Scientific Corporation, along with its subsidiaries, is engaged in the manufacturing and distribution of medical devices in the People’s Republic of China (the PRC). It is a developer, manufacturer and marketer of medical devices, focusing primarily on minimally invasive interventional products for the treatment of vascular diseases and disorder.

Thursday, 04 August 2011
Asian Daily
- 6 of 34 -
Global Fixed Income Strategy Too much to bear Credit Suisse Fixed Income Strategy Teams
● This week’s intensification of doubts about European and global growth was the straw to break the camel’s back: while a short and temporary period in which Italian yields trade above 6% is not necessarily fatal, interest costs would spiral unsustainably if that lasts for long.
● This is Europe’s Minsky moment: the point where problems in funding the ‘sub-prime’ sovereigns and their banks have finally infected the ability to fund prime borrowers. Unless this vicious circle dynamic can be broken, we stand on the brink of another Lehmans like shock – and ultimately not just to European growth but to global growth too.
● All of a sudden, therefore, global equity markets have started to trade like 2008 again. And global risk appetite has lurched down into panic.
● Panic episodes can be very short or quite extended, but most of the time global equity markets are much nearer the end of their sell-off than the beginning. The clear exception to that rule came after the failure of Lehmans! click here for the full report.
Figure 1: Global risk appetite panic episodes—entry to trough
Source: Credit Suisse, the BLOOMBERG PROFESSIONAL™ service, Thomson Reuters Datastream
Ultimately, market pressures are likely to force an overwhelming policy response. But while we are waiting, the likelihood is that we will see different varieties of bullish flattening in the US, Germany and Japan, downward pressure on growth sensitive commodities and most global equity markets, combined with upward pressure on gold and perhaps the dollar more generally. Emerging markets: All about growth – and the lack of it While most of the negative headline news on growth in recent months has focused on the US, the EM economies have not been immune to the downdraft in global growth. Sequential industrial output growth in the EM world fell abruptly in 2Q of the current year. It seems now to have stabilized in China but the PMI data point to additional weakness in most of the rest of the EM world.
EM asset prices have been helped by the resilience of global commodity prices. But this resilience will be tested over the coming month. Commodity prices are drawing support primarily from signs of a moderate growth rebound in China (a key commodities importer) and the possibility that the Fed may respond to the growth weakness
with a new round of quantitative easing. But there is probably predominantly downside risk to commodity prices in the coming weeks and months if the global growth data are representative of the commodities demand trends.
Figure 2: EM outperformance in recent weeks more clearly evident in theequity markets than in the credit markets
Source: The BLOOMBERG PROFESSIONAL™ service, Credit Suisse
The weakening of the global growth data would probably – as long as it does not lead to a complete meltdown of credit in the European periphery and attendant blind asset dumping – support strength (against the dollar) of currencies in EM countries with low sovereign credit spreads. It would also, in part because of the currency strength and because of the weakening of the EM growth outlook, support a decline in EM local currency yields in the same countries. The main underlying investor theme would be one of ‘wanting to shed dollar holdings’ (on account of weak growth and the possibility of further Fed monetary policy loosening) and not wanting to be exposed to the euro zone given that zone’s sovereign liquidity/solvency problems. On the rates side, EM five-year swaps rates have in most cases fallen much less significantly in recent months than have five-year US swaps rates, and it is not clear to us why EM rates should outperform US rates in the coming months.
(This is an extract from the Strategy Snapshot report, Too Much To Bear, published on 3 August 2011. For details, please see the CS Research & Analytics website.) THE FOLLOWING REPORT(S) HAVE BEEN PREPARED BY THE FIXED INCOME DIVISION OF CREDIT SUISSE. ANALYST CERTIFICATIONS AND IMPORTANT DISCLOSURES ARE IN THE DISCLOSURE APPENDIX. FOR OTHER IMPORTANT DISCLOSURES, PLEASE REFER TO https://firesearchdisclosure.credit-suisse.com.
Thursday, 04 August 2011
Asian Daily
- 7 of 34 -
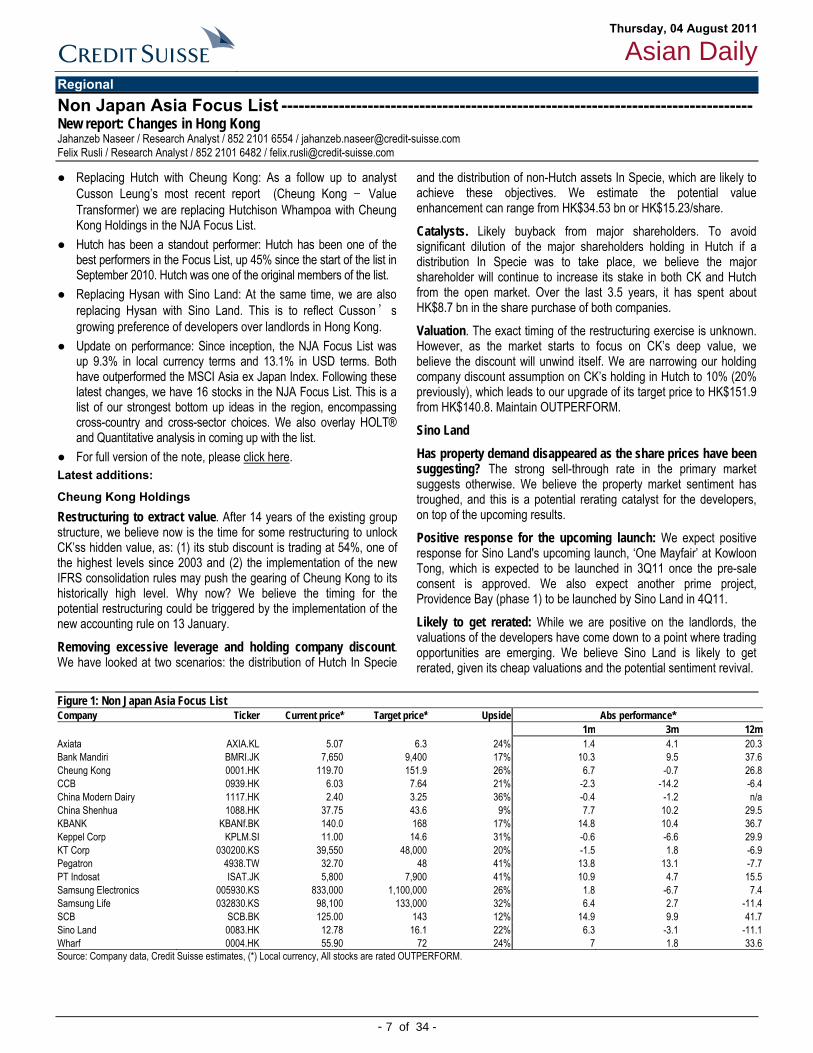
Regional Non Japan Asia Focus List ---------------------------------------------------------------------------------- New report: Changes in Hong Kong Jahanzeb Naseer / Research Analyst / 852 2101 6554 / [email protected] Felix Rusli / Research Analyst / 852 2101 6482 / [email protected]
● Replacing Hutch with Cheung Kong: As a follow up to analyst Cusson Leung’s most recent report (Cheung Kong – Value Transformer) we are replacing Hutchison Whampoa with Cheung Kong Holdings in the NJA Focus List.
● Hutch has been a standout performer: Hutch has been one of the best performers in the Focus List, up 45% since the start of the list in September 2010. Hutch was one of the original members of the list.
● Replacing Hysan with Sino Land: At the same time, we are also replacing Hysan with Sino Land. This is to reflect Cusson’s growing preference of developers over landlords in Hong Kong.
● Update on performance: Since inception, the NJA Focus List was up 9.3% in local currency terms and 13.1% in USD terms. Both have outperformed the MSCI Asia ex Japan Index. Following these latest changes, we have 16 stocks in the NJA Focus List. This is a list of our strongest bottom up ideas in the region, encompassing cross-country and cross-sector choices. We also overlay HOLT® and Quantitative analysis in coming up with the list.
● For full version of the note, please click here. Latest additions:
Cheung Kong Holdings Restructuring to extract value. After 14 years of the existing group structure, we believe now is the time for some restructuring to unlock CK’ss hidden value, as: (1) its stub discount is trading at 54%, one of the highest levels since 2003 and (2) the implementation of the new IFRS consolidation rules may push the gearing of Cheung Kong to its historically high level. Why now? We believe the timing for the potential restructuring could be triggered by the implementation of the new accounting rule on 13 January.
Removing excessive leverage and holding company discount. We have looked at two scenarios: the distribution of Hutch In Specie
and the distribution of non-Hutch assets In Specie, which are likely to achieve these objectives. We estimate the potential value enhancement can range from HK$34.53 bn or HK$15.23/share.
Catalysts. Likely buyback from major shareholders. To avoid significant dilution of the major shareholders holding in Hutch if a distribution In Specie was to take place, we believe the major shareholder will continue to increase its stake in both CK and Hutch from the open market. Over the last 3.5 years, it has spent about HK$8.7 bn in the share purchase of both companies.
Valuation. The exact timing of the restructuring exercise is unknown. However, as the market starts to focus on CK’s deep value, we believe the discount will unwind itself. We are narrowing our holding company discount assumption on CK’s holding in Hutch to 10% (20% previously), which leads to our upgrade of its target price to HK$151.9 from HK$140.8. Maintain OUTPERFORM.
Sino Land Has property demand disappeared as the share prices have been suggesting? The strong sell-through rate in the primary market suggests otherwise. We believe the property market sentiment has troughed, and this is a potential rerating catalyst for the developers, on top of the upcoming results.
Positive response for the upcoming launch: We expect positive response for Sino Land's upcoming launch, ‘One Mayfair’ at Kowloon Tong, which is expected to be launched in 3Q11 once the pre-sale consent is approved. We also expect another prime project, Providence Bay (phase 1) to be launched by Sino Land in 4Q11.
Likely to get rerated: While we are positive on the landlords, the valuations of the developers have come down to a point where trading opportunities are emerging. We believe Sino Land is likely to get rerated, given its cheap valuations and the potential sentiment revival.
Figure 1: Non Japan Asia Focus List Company Ticker Current price* Target price* Upside Abs performance* 1m 3m 12mAxiata AXIA.KL 5.07 6.3 24% 1.4 4.1 20.3Bank Mandiri BMRI.JK 7,650 9,400 17% 10.3 9.5 37.6Cheung Kong 0001.HK 119.70 151.9 26% 6.7 -0.7 26.8CCB 0939.HK 6.03 7.64 21% -2.3 -14.2 -6.4China Modern Dairy 1117.HK 2.40 3.25 36% -0.4 -1.2 n/aChina Shenhua 1088.HK 37.75 43.6 9% 7.7 10.2 29.5KBANK KBANf.BK 140.0 168 17% 14.8 10.4 36.7Keppel Corp KPLM.SI 11.00 14.6 31% -0.6 -6.6 29.9KT Corp 030200.KS 39,550 48,000 20% -1.5 1.8 -6.9Pegatron 4938.TW 32.70 48 41% 13.8 13.1 -7.7PT Indosat ISAT.JK 5,800 7,900 41% 10.9 4.7 15.5Samsung Electronics 005930.KS 833,000 1,100,000 26% 1.8 -6.7 7.4Samsung Life 032830.KS 98,100 133,000 32% 6.4 2.7 -11.4SCB SCB.BK 125.00 143 12% 14.9 9.9 41.7Sino Land 0083.HK 12.78 16.1 22% 6.3 -3.1 -11.1Wharf 0004.HK 55.90 72 24% 7 1.8 33.6Source: Company data, Credit Suisse estimates, (*) Local currency, All stocks are rated OUTPERFORM.

Thursday, 04 August 2011
Asian Daily
- 8 of 34 -
China China Basic Materials Sector ------------------------------------------------------------------------------- MIIT reports 1H11 sector trend — the good and the bad Trina Chen / Research Analyst / 852 2101 7031 / [email protected] Frankie Zhu / Research Analyst / 852 2101 7426 / [email protected]
● MIIT issued 1H11 sector operations for cement, aluminium and steel sectors, including sector profit and investment capex trend.
● The report suggests industry profit surged 170% in cement, declined by 24% for Al and 1% for steel, mostly in line with our expectation. The numbers suggest (1) implied profit of cement is at Rmb47/t, about Rmb30/t higher YoY, (2) stagnant margin in Al at US$0.02/lb as cost pressure couples with higher aluminium price and (3) depressed unit EBITDA of US$40-50/t in steel.
● For 2H11, MIIT highlighted (1) supply pressure emerging for cement sector in western China, (2) potentially improving pricing and margin for 2H11 in Al as a result of government constrain on new lines and (3) persistent low margin to stay for steel sector. While industry capex declined by 15% for cement and picked up for Al and steel, we believe implied new capacity remains high for cement and Al, when taking the base in 2010 into consideration.
● We maintain our view that soften demand may lead to extended trough for steel and Al in 2H, and increasing in favor of cement names with strong M&A story such as CR cement and Shanshui. given the stable margin outlook in 2012E.
Figure 1: Summary of valuation peers – China basic materials Company Ticker Ratings Target Upside Price Mkt cap P/E (x) P/B (x) EV/EBITDA(updated on 8/3/11) % Tccy US$ bn 11E 12E 11E 12E 11E 12EShenhua 1088.HK O 43.6 15% 37.8 96.3 13 11 2.7 2.3 6.9 5.2Chinacoal 1898.HK O 12.7 19% 10.6 18.1 12 9 1.4 1.3 6.9 5.8Yanzhou 1171.HK N 30.0 3% 29.2 18.4 12 11 2.7 2.3 6.9 6.1Baosteel 600019.SS N 6.8 19% 5.7 15.4 11 6 0.8 0.8 4.1 2.8Angang 0347.HK U 7.1 -12% 8.0 7.4 83 17 0.9 0.9 8.4 5.9Maanshan 0323.HK N 3.5 5% 3.3 3.3 46 16 0.8 0.7 5.3 4.3Conch 0914.HK N 37.0 -1% 37.6 25.5 13 10 3.6 2.8 8.2 6.6CNBM 3323.HK O 23.3 56% 14.9 10.3 9 8 2.5 2.0 5.6 5.1CRC 1313.HK O 8.7 17% 7.5 6.2 12 10 2.6 2.1 8.5 6.6Shanshui 0691.HK O 10.4 10% 9.5 3.4 9 7 2.9 2.1 5.9 4.5CNM 1893.HK N 5.9 14% 5.2 2.4 9 8 1.4 1.2 3.0 1.9TCCI 1136.HK N 4.0 -21% 5.1 2.1 10 9 1.4 1.2 7.2 5.9BBMG 2009.HK O 15.2 38% 11.0 6.1 9 7 1.7 1.4 5.8 4.1Chalco 2600.HK U 4.8 -25% 6.4 11.1 32 29 1.3 1.3 11.5 10.0UC Rusal 0486.HK O 13.8 32% 10.4 20.3 7 9 1.4 1.2 5.7 6.2Jiangxi Cu 0358.HK N 26.0 -2% 26.5 11.8 9 9 1.8 1.6 7.1 6.6Zijin 2899.HK N 4.8 14% 4.2 11.8 13 12 2.9 2.5 6.9 6.0
Source: Company data, Credit Suisse estimates Cement sector 2H11 – supply pressure in selected regions MIIT report reiterated the closure target of 150 mn tonnes for 2011 (higher than 130 mn announced before). Nevertheless, the target can become more challenging given profitability of the sector. MIIT noted new supply pressure, especially in western China. MIIT estimated 150 new lines or 186 mn tonnes (likely in clinker, thus 241 mn tonnes in equivalent cement capacity) will come online in 2011E, including 70% for 2H11. The net supply number is 44 or 2% higher than our ests.
Figure 2: Summary of 1H11 sector operations Cement Aluminum Steel1H11 output mn tonnes 950 8.7 350YoY % +20% +4% 10%App demand mn tonnes 944 8.5 333YoY % +20% +4% +9%Profit* Rmb bn 35.2 5.2** 64.0YoY % +170% -24% -1%Implied unit profit Rmb/t 47 300 182Capex Rmb bn 65.4 16.5 118.9YoY % -15% +52% +7%Implied new capacity mn tonnes 164 1.6 2***% of 1H11 demand % 8% 9% 1%*5M11 number ** for both aluminum and alumina, implied unit profit assumes half of the profit goes to aluminium. ***we assumed Rmb300/t in unit maintenance cost and Rmb4,000/t for new line expansions. Source: MIIT, Credit-Suisse estimates Al sector 2H11 – improving 2H MIIT estimated aluminium output to reach 18 mn tonnes (implies 7% HoH increase in output), driven by new line expansions and seasonality. Cost pressure remains high, due to higher power tariff and carbon costs. Nevertheless, MIIT believes price and margin should improve in 2H, due to government control on new capacity and seasonality. In addition, MIIT encourages the completion of direct power purchase for the designated 15 smelters. Steel sector 2H11 – persistent low margin On the back of decelerating industrial demand, power restriction, elimination of old obsolete capacity and tightened capital, MIIT believes steel output to soften in 2H, with FY11 reaching 690-700 mn tonnes (implies 2H output flat or 3% lower HoH). Apparent demand would be 660-670 mn tonnes. MIIT expects stagnant steel prices and low profit to stay. 1H11 profitability and capex trend The report suggests industry profit has surged 170% in cement, but declined by 24% for aluminium and 1% for steel, mostly in line with our expectations. Implied profit of cement is estimated at Rmb47/t, about Rmb30/t higher YoY. Implied unit profit of aluminium is estimated at US$0.02/lb, about US¢5/lb lower than a year ago, suggests stagnant margin as cost pressure combines with higher aluminium price. Unit profit of steel suggests an average of unit EBITDA of US$40-50/t, trough of the sector.
The 1H11 capex for cement declined 15% from the peak, but was still able to support 160 mn tonnes of new line addition, 8% of 1H11 output run rate. Capax for aluminium and steel, through showing some rebound, is due to low base in our view and remains as depressed.

Thursday, 04 August 2011
Asian Daily
- 9 of 34 -
Hong Kong Standard Chartered ----------------------------------------------------- Maintain UNDERPERFORM 1H11 results — Consumer compensates for Wholesale; overall in line EPS: ◄► TP: ◄► Sanjay Jain / Research Analyst / 65 6212 3017 / [email protected] Anand Swaminathan / Research Analyst / 65 6212 3012 / [email protected] Vineet Thodge / Research Analyst / 852 2101 7466 / [email protected]
● STAN’s 1H11 reported PBT of US$3.6 bn was 2.5% ahead of CS est while underlying earnings and total income (US$8.8 bn) were in line. Overall cost-income jaws in the 1H were flat (incl bank levy) (+2.9% excl bank levy). Guidance remains for ‘broadly flat’ jaws for FY excl bank levy implying a negative progression in H2.
● Consumer banking showed strong performance on the back of volume growth, which more than offset asset margin pressures. Wholesale banking was below expectations on account of weaker global markets performance.
● Geographically, Hong Kong and Singapore were particularly strong while the company highlighted that it is facing challenges in India (increasing rates, competition and regulations) and Korea (high costs and inefficient balance sheet).
● In the medium term, we believe cost inflationary pressures remain, revenues (especially in wholesale banking) will be under pressure and overall returns remain low. Trading on c1.7x PTNAV for 15% RoTE, we retain our UNDERPERFORM rating.
Figure 1: STAN – geographical revenue and pre-tax profit breakdown Revenue (1H11) Pre-tax profit (1H11) US$ mn Share HoH YoY US$ mn Share HoH YoYHong Kong 1,531 17% 17.0 28.5 790 16% 33.4 54.6Singapore 1,094 12% 32.6 19.8 465 13% 55.5 11.0Korea 840 10% -6.9 5.5 193 5% -19.2 29.5India 893 10% -12.2 -11.7 378 20% -34.0 -39.4Other APac 1,748 20% 7.6 13.4 846 19% 67.9 46.1Amer+Eur,Gp 862 10% 14.9 11.9 244 4% 121.8 98.4MESA 1,118 13% 0.6 5.9 429 13% -2.7 7.3Africa 678 8% 13.0 5.0 291 10% 17.3 -6.4Total 8,764 100% 7.7 10.6 3,636 100% 21.0 16.7Source: Company data, Credit Suisse estimates
Loan growth driven by Singapore, India and Hong Kong Figure 2: STAN – geographical loan growth 1H11 US$ bn Share '09
YoY'10
YoY 1H11 YoY
2H09HoH
1H10HoH
2H10HoH
1H11HoH
Hong Kong 47.1 18% 7.0 45.1 29.6 2.6 21.0 19.9 8.1Singapore 45.5 17% 54.2 25.2 29.9 19.4 11.5 12.3 15.6Korea 43.2 16% 15.9 8.9 19.1 16.7 -1.8 10.8 7.5India 12.5 5% 12.9 26.7 21.9 7.9 14.3 10.9 9.9Other APac 51.9 19% 9.3 14.2 19.8 11.2 2.7 11.1 7.8Amer+Eur 44.0 16% -2.7 36.9 21.7 0.2 19.6 14.4 6.3MESA+Africa 24.2 9% 7.7 0.9 6.8 3.7 -0.7 1.6 5.1Gross loans 268.5 100% 13.1 21.9 22.0 9.1 8.6 12.3 8.6Source: Company data, Credit Suisse estimates CB stronger than expected, WB weaker Consumer Banking was significantly higher than expected, driven by lower costs and lower provisions. Wholesale banking PBT was 8% weaker than expected despite a gain on structured notes.
Figure 3: STAN – consumer and wholesale banking highlights (1H11) Consumer (incl. SME) Wholesale (%) US$ bn Share HoH% YoY% US$ bn Share HoH% YoY%Loans 125.8 47% 7.4 22.3 142.7 53% 9.8 21.7Revenue 3.34 38% 5.4 14.6 5.43 62% 9.3 8.3Optg exp 2.11 45% -4.6 7.3 2.57 55% 3.4 9.0Optg profit 1.23 30% 28.3 29.8 2.86 70% 15.1 7.7Provisions 0.22 44% -25.1 -29.0 0.27 56% 45.4 46.2Pre-tax profit 1.01 28% 51.2 57.5 2.59 72% 12.7 4.8Source: Company data, Credit Suisse estimates. Funding and capital remain comfortable Core Tier 1 capital slightly improved further to 11.9% (11.8% as of Dec-10). RWA’s grew 7% HoH, in line with estimates.
Figure 4: STAN – financial snapshot (US$ mn) 2009 2010 YoY% 1H10 2H10 1H11 HoH% YoY%Net interest income 7,623 8,470 11.1 4,155 4,315 4,941 14.5 18.9Non interest income 7,561 7,592 0.4 3,769 3,823 3,823 0.0 1.4 Fee income 3,370 4,238 25.8 2,148 2,090 2,179 4.3 1.4 Trading income 2,890 2,577 -10.8 1,351 1,226 1,366 11.4 1.1Operating expenses -7,952 -9,023 13.5 -4,344 -4,679 -4,677 0.0 7.7Pre-prov optg profit 7,232 7,039 -2.7 3,580 3,459 4,087 18.2 14.2Provisions -2,102 -959 -54.4 -487 -472 -484 2.5 -0.6Pre-tax profit 5,151 6,122 18.9 3,116 3,006 3,636 21.0 16.7Net profit 3,380 4,332 28.2 2,148 2,184 2,566 17.5 19.5ROE (%) 13.7 13.2 -0.4 15.1 12.9 13.0 0.1 -2.2ROA (%) 0.78 0.91 0.13 0.94 0.88 0.95 0.07 0.01Loans (US$ bn) 202.7 247.2 21.9 220.1 247.2 268.5 8.6 22.0Deposits (US$ bn) 251.2 307.0 22.2 279.1 307.0 333.5 8.6 19.5Loan-dep ratio (%) 78.9 78.3 -0.6 77.0 78.3 78.6 0.3 1.6Net interest margin 2.32 2.21 -0.11 2.28 2.14 2.27 0.13 -0.01Cost-inc ratio (%) 52.4 56.2 3.8 54.8 57.5 53.4 -4.1 -1.5Non II / revenue (%) 49.8 47.3 -2.5 47.6 47.0 43.6 -3.4 -3.9NPL to loans (%) 2.0 1.9 -0.1 2.0 1.9 1.7 -0.2 -0.3Provisions (bp of loans) 110 43 -67 bp 46 40 38 -3 bp -9 bpLoan loss cover (%) 71 58 -13.5 63 58 61 3 -3Equity Tier 1 CAR (%) 8.9 11.8 2.9 9.0 11.8 11.9 0.1 2.9Source: Company data, Credit Suisse estimates
Price (03 Aug 11, HK$) 201.40TP (prev. TP HK$) 190.79 (190.79) Est. pot. % chg. to TP (5)52-wk range (HK$) 244.0 - 190.6Mkt cap (HK$/US$ bn) 469.0/ 60.2
Bbg/RIC 2888 HK / 2888.HK Rating (prev. rating) U (U) Shares outstanding (mn) 2,379.12 Daily trad vol - 6m avg (mn) 4.8 Daily trad val - 6m avg (US$ mn) 125.9 Free float (%) 100 Major shareholders
Performance 1M 3M 12MAbsolute (%) (2.8) (2.3) (8.6)Relative (%) 0.6 3.1 (11.1)
Year 12/09A 12/10A 12/11E 12/12E 12/13EPre-prov Op profit (US$ mn) 6,968.0 7,039.0 7,730.5 8,578.7 9,460.4Net profit (US$ mn) 3,478 4,247 4,486 5,054 5,633EPS (CS adj. US$) 1.75 1.94 1.88 2.10 2.33- Change from prev. EPS (%) n.a. n.a. 0 0 0- Consensus EPS (US$) n.a. n.a. 2.05 2.35 2.59EPS growth (%) (7.5) 10.5 (3.2) 12.1 10.8P/E (x) 14.7 13.3 13.8 12.3 11.1Dividend yield (%) 3.9 3.8 4.2 4.6 5.1BVPS (CS adj. US$) 13.5 16.3 17.1 18.6 20.2P/B (x) 1.91 1.59 1.51 1.39 1.28ROE (%) 14.1 14.1 11.4 12.0 12.2ROA (%) 0.8 0.9 0.8 0.9 1.0Tier 1 Ratio (%) 11.5 14.0 13.5 13.0 12.7 Note 1: Standard Chartered PLC is a holding company. Through its subsidiaries, the company is engaged in the business of retail and commercial banking, and the provision of other financial services.
Thursday, 04 August 2011
Asian Daily
- 10 of 34 -
Indonesia Astra International ------------------------------------------------------------------ Maintain NEUTRAL All time high July 2011 industry car sales volume looks priced in EPS: ◄► TP: ◄► Teddy Oetomo / Research Analyst / 6221 2553 7911 / [email protected] Dian Haryokusumo / Research Analyst / 62 21 255 37974 / [email protected]
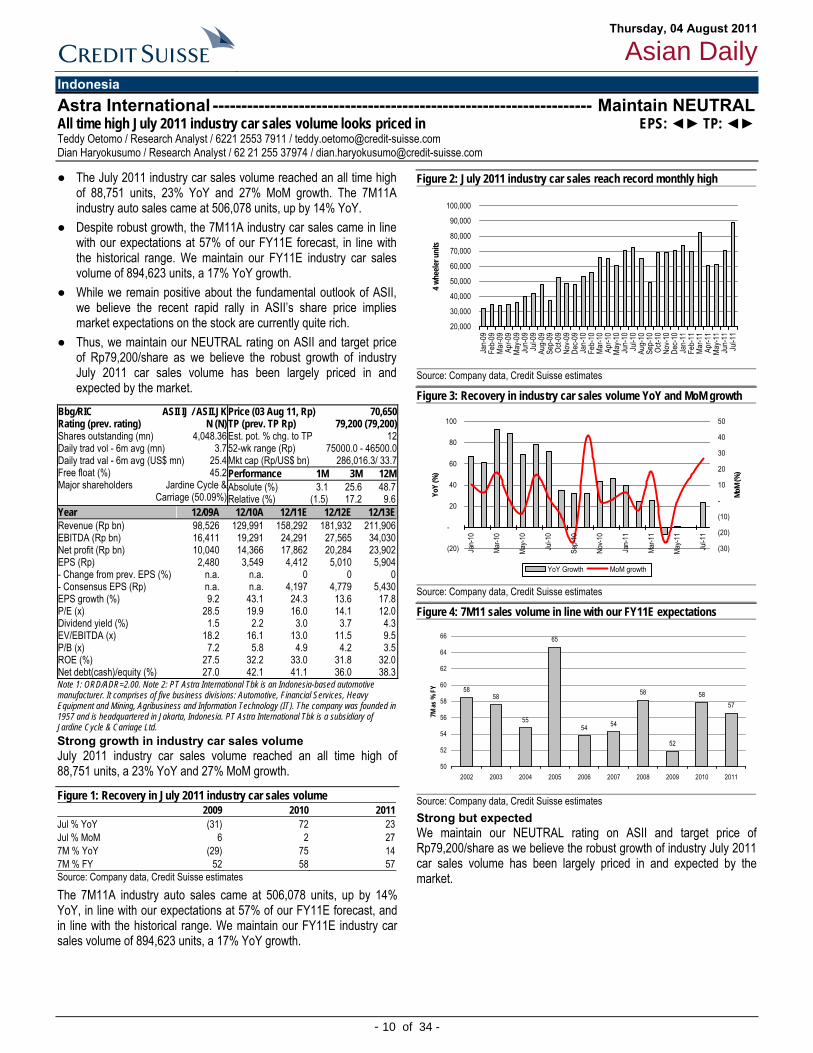
● The July 2011 industry car sales volume reached an all time high of 88,751 units, 23% YoY and 27% MoM growth. The 7M11A industry auto sales came at 506,078 units, up by 14% YoY.
● Despite robust growth, the 7M11A industry car sales came in line with our expectations at 57% of our FY11E forecast, in line with the historical range. We maintain our FY11E industry car sales volume of 894,623 units, a 17% YoY growth.
● While we remain positive about the fundamental outlook of ASII, we believe the recent rapid rally in ASII’s share price implies market expectations on the stock are currently quite rich.
● Thus, we maintain our NEUTRAL rating on ASII and target price of Rp79,200/share as we believe the robust growth of industry July 2011 car sales volume has been largely priced in and expected by the market.
Strong growth in industry car sales volume July 2011 industry car sales volume reached an all time high of 88,751 units, a 23% YoY and 27% MoM growth.
Figure 1: Recovery in July 2011 industry car sales volume 2009 2010 2011Jul % YoY (31) 72 23 Jul % MoM 6 2 27 7M % YoY (29) 75 14 7M % FY 52 58 57 Source: Company data, Credit Suisse estimates
The 7M11A industry auto sales came at 506,078 units, up by 14% YoY, in line with our expectations at 57% of our FY11E forecast, and in line with the historical range. We maintain our FY11E industry car sales volume of 894,623 units, a 17% YoY growth.
Figure 2: July 2011 industry car sales reach record monthly high
20,000
30,000
40,000
50,000
60,000
70,000
80,000
90,000
100,000
Jan-
09Fe
b-09
Mar-0
9Ap
r-09
May-0
9Ju
n-09
Jul-0
9Au
g-09
Sep-
09Oc
t-09
Nov-0
9De
c-09
Jan-
10Fe
b-10
Mar-1
0Ap
r-10
May-1
0Ju
n-10
Jul-1
0Au
g-10
Sep-
10Oc
t-10
Nov-1
0De
c-10
Jan-
11Fe
b-11
Mar-1
1Ap
r-11
May-1
1Ju
n-11
Jul-1
1
4 whe
eler u
nits
Source: Company data, Credit Suisse estimates
Figure 3: Recovery in industry car sales volume YoY and MoM growth
(20)
-
20
40
60
80
100
Jan-
10
Mar-1
0
May-1
0
Jul-1
0
Sep-
10
Nov-1
0
Jan-
11
Mar-1
1
May-1
1
Jul-1
1
YoY
(%)
(30)
(20)
(10)
-
10
20
30
40
50
MoM
(%)
YoY Growth MoM growth
Source: Company data, Credit Suisse estimates
Figure 4: 7M11 sales volume in line with our FY11E expectations
5858
55
65
54 54
58
52
5857
50
52
54
56
58
60
62
64
66
2002 2003 2004 2005 2006 2007 2008 2009 2010 2011
7M as
% F
Y
Source: Company data, Credit Suisse estimates Strong but expected We maintain our NEUTRAL rating on ASII and target price of Rp79,200/share as we believe the robust growth of industry July 2011 car sales volume has been largely priced in and expected by the market.
Price (03 Aug 11, Rp) 70,650TP (prev. TP Rp) 79,200 (79,200) Est. pot. % chg. to TP 1252-wk range (Rp) 75000.0 - 46500.0Mkt cap (Rp/US$ bn) 286,016.3/ 33.7
Bbg/RIC ASII IJ / ASII.JK Rating (prev. rating) N (N) Shares outstanding (mn) 4,048.36 Daily trad vol - 6m avg (mn) 3.7 Daily trad val - 6m avg (US$ mn) 25.4 Free float (%) 45.2 Major shareholders Jardine Cycle &
Carriage (50.09%)
Performance 1M 3M 12MAbsolute (%) 3.1 25.6 48.7Relative (%) (1.5) 17.2 9.6
Year 12/09A 12/10A 12/11E 12/12E 12/13ERevenue (Rp bn) 98,526 129,991 158,292 181,932 211,906EBITDA (Rp bn) 16,411 19,291 24,291 27,565 34,030Net profit (Rp bn) 10,040 14,366 17,862 20,284 23,902EPS (Rp) 2,480 3,549 4,412 5,010 5,904- Change from prev. EPS (%) n.a. n.a. 0 0 0- Consensus EPS (Rp) n.a. n.a. 4,197 4,779 5,430EPS growth (%) 9.2 43.1 24.3 13.6 17.8P/E (x) 28.5 19.9 16.0 14.1 12.0Dividend yield (%) 1.5 2.2 3.0 3.7 4.3EV/EBITDA (x) 18.2 16.1 13.0 11.5 9.5P/B (x) 7.2 5.8 4.9 4.2 3.5ROE (%) 27.5 32.2 33.0 31.8 32.0Net debt(cash)/equity (%) 27.0 42.1 41.1 36.0 38.3 Note 1: ORD/ADR=2.00. Note 2: PT Astra International Tbk is an Indonesia-based automotive manufacturer. It comprises of five business divisions: Automotive, Financial Services, Heavy Equipment and Mining, Agribusiness and Information Technology (IT). The company was founded in 1957 and is headquartered in Jakarta, Indonesia. PT Astra International Tbk is a subsidiary of Jardine Cycle & Carriage Ltd.

Thursday, 04 August 2011
Asian Daily
- 11 of 34 -
Pakistan Fauji Fertilizer Company Limited ---------------------------------------------- Maintain NEUTRAL Earnings and target price raised on higher dividend income from FFBL EPS: ▲ TP: ▲ Farhan Rizvi, CFA / Research Analyst / 65 6212 3036 / [email protected]
● We increase our EPS estimates for FFC by 1-4% over 2011-13 and target price by 2% to PRs170 to account for higher dividend income from FFBL, lower finance cost and sharp rise in other expenses.
● While 2Q11 earnings (+72% YoY, flat QoQ) were 2% below expectation, significant variance was observed in finance cost (30% behind estimates) and other expense (+105%). Though margins surprised on the upside (59% in 2Q), we maintain our full-year forecast of 54%. We expect increase in gas prices and DAP sales in 4Q to exert downward pressure on margins in 2H11.
● In order to curtail spending on expensive urea imports, government has in principle agreed to ensure 80% gas supply to plants on the Sui network including Engro’s new plant. This move along with agri commodity meltdown should reduce potential for steeper price hikes in the future and limit price driven growth enjoyed by FFC.
● We maintain our NEUTRAL rating for FFC with a revised target price of PRs170. The stock appears fairly valued trading at a 2011E EV/EBITDA of 4.5x (8% discount to historical multiples).
2Q11 results in line but margins surprised on the upside
FFC 2Q11 earnings of PRs4.1bn (EPS PRs4.8) was 2% behind ours and consensus EPS estimate of PRs4.9, with gross margins of 59% surprising on the upside (+7.4%QoQ). Higher urea price (+5% QoQ) was the major reason behind the sharp rise in margins, though we ruled out margins to be sustainable at these levels in 2H11 due to expected increase in gas prices and lower margin DAP sales in 4Q11. The agri commodity price meltdown particularly cotton (down 60% from peak) has significantly altered the farm economics, making it difficult for steeper price hikes in the future. Though margins surprised on the upside, other expenses (+97% YoY, 21% QoQ) negatively impacted earnings in 2Q11.
Figure 1: 2Q11 results snapshot PRs mn 2Q 11A 2Q CS est. +/-(%) 1Q11A 2Q 10A QoQ % YoY % Net sales 13,120 13,433 -2.3 11,100 10,448 18.2 25.6 Cost of sales 5,337 5,937 -10.1 5,190 5,658 2.8 -5.7 Gross profit 7,783 7,495 3.8 5,910 4,789 31.7 62.5 Distribution cost 1,148 1,050 9.3 1,018 967 12.8 18.8 Operating profit 6,635 6,445 2.9 4,892 3,823 35.6 73.6 Finance cost 242 350 -30.9 229 230 5.6 5.1 Other expenses 615 300 105.0 507 311 21.2 97.6 Other income 919 950 -3.2 1,963 263 -53.2 249.9 Profit after tax 4,080 4,182 -2.4 4,109 2,372 -0.7 72.0 EPS (PRs) 4.81 4.93 4.84 2.80Urea sales (k tons) 627 630 -0.5 546 678 14.9 -7.5Price/ton (US$) 242 246 -1.6 230 175 5.2 38.3GP margin 59% 56% 3.5 53% 46% 7.4 13.5ROE (annualised) 84% 86% -1.9 101% 71% 30.0 13.6Source: Company data, Credit Suisse estimates Increase 2011-13E EPS by 1-4%; target price raised to PRs170 We raise our earnings forecast for FFC by 1-4% over 2011-13 and target price by 2% to PRs170 to account for higher dividend income from its subsidiary FFBL, lower financial charges and sharp rise in other expenses in 1H11. FFBL announced a surprisingly high payout of PRs2.25/share in 2Q11 (cumulative dividend of PRs7/share YTD), leading us to increase our 2011E dividend income by 31% to PRs4 bn (PRs8.5/share) from PRs3.1 bn (PRs6.5/share) earlier. Moreover, we have lowered our financial cost estimates by 12-34% due to lower debt levels and increased other expenses estimates by 8-9%.
Figure 2: Summary of estimate revisions 2011E 2012E 2013EDividend income (PRs mn) NEW 4,039 3,089 2,756OLD 3,089 2,851 2,424Change (%) 30.8% 8.3% 13.7%Finance cost (PRs mn) NEW 1,463 927 680OLD 1,667 1,277 1,027Change (%) -12.2% -27.3% -29.7%Other expenses (PRs mn) NEW 2,131 2,321 2,398OLD 1,962 2,139 2,211Change (%) 8.6% 8.5% 8.4%EPS (PRs) NEW 20.0 21.6 21.8OLD 19.2 21.1 21.5Change (%) 4.3% 2.2% 1.3%Source: Credit Suisse estimates Maintain NEUTRAL; positives appear priced in Despite impressive 2Q11 results, we remain NEUTRAL on FFC as we believe positives have been largely priced in (YTD return of 62%). Moreover, meltdown in agri commodity prices and government plans to resolve gas supply issues for plants on the Sui network such as Engro’s new plant would also reduce potential for significant price hikes in the future. We, however, do not rule out 8-10% price hike in 2H11, which would be in response to the likely increase in feed gas prices by 96%. FFC trades at a 2011E EV/EBITDA of 4.6x (a 7% discount to historical multiples).
Price (02 Aug 11 ) 162.85TP (prev. TP) 170.00 (166.00) Est. pot. % chg. to TP 452-wk range 172.0 - 82.4Mkt cap (bn) 138.1/ 1.6
Bbg/RIC FFC PA / FAUF.KA Rating (prev. rating) N (N) Shares outstanding (mn) 848.16 Daily trad vol - 6m avg (mn) 2.0 Daily trad val - 6m avg (mn) 3.2 Free float (%) — Major shareholders
Performance 1M 3M 12MAbsolute (%) 7.0 17.1 81.3Relative (%) 9.7 14.5 63.7
Year 12/09A 12/10A 12/11E 12/12E 12/13ERevenue (mn) 36,163 44,874 53,968 58,100 60,768EBITDA (mn) 16,041 19,591 29,998 31,535 31,724Net profit (mn) 8,823 11,029 16,977 18,323 18,475EPS 10.4 13.0 20.0 21.6 21.8- Change from prev. EPS (%) n.a. n.a. 4 2 1- Consensus EPS n.a. n.a. 19.4 20.5 16.3EPS growth (%) 35.2 25.0 53.9 7.9 0.8P/E (x) 15.7 12.5 8.1 7.5 7.5Dividend yield (%) 5.8 5.9 11.1 11.9 12.7EV/EBITDA (x) 9.1 7.6 4.5 4.2 4.2P/B (x) 8.4 7.2 8.1 7.3 6.9ROE (%) 69.6 77.3 104.2 101.4 95.0Net debt(cash)/equity (%) 65.9 64.9 (21.2) (28.2) (30.8) Note1:Fauji Fertilizer Company Limited is a Pakistan-based company. The principal activity of the Company is manufacturing, purchasing and marketing of fertilizers and chemicals, including investment in other fertilizer, chemical and other manufacturing operations..

Thursday, 04 August 2011
Asian Daily
- 12 of 34 -
Singapore City Developments ---------------------------------------------------------- Maintain OUTPERFORM Strong M&C 2Q11 results, Singapore RevPAR +22.5% in July EPS: ◄► TP: ◄► Tricia Song / Research Analyst / 65 6212 3141 / [email protected]
● CDL's 54% subsidiary M&C reported strong 2Q11 results with headline pre-tax profit up 11% and EPS up 90% YoY, in line with our above-street forecasts. Performance was variable but gateway cities (London, NY, SG) saw accelerating RevPAR growth; excl. refurbishments, hotel EBIT would have risen 25% YoY (from 12%). Click here for report.
● We expect less disruptive impact in 2H and forecast 19% 2H11 EBIT growth, supported by strong current trading trends. For the first 24 days of July, M&C's group RevPAR posted 12.6% YoY rise, with Singapore rising 22.5%, London 14.9% and New York, 12.5%. We retain forecasts and M&C’s TP at 635p.
● CDL will announce its 2Q11 results on 12 Aug. We expect profits to be robust on strong M&C contributions (partially mitigated by 2% QoQ and 6% YoY SGD appreciation against GBP), some divestment gains, and progressive residential profit recognition.
● CDL is trading at unwarranted 27% below its historical average P/B of 2x, and at a 32% discount to its RNAV vs historical average of parity. We like this as a value play on Singapore property which is expected to be resilient on strong fundamentals.
Figure 1: M&C operating statistics £ mn
2Q11
2Q10
Reported Curr chg (%)
Constant curr chg (%)
RevPAR 66.37 63.47 4.6 6.3Revenue - total 196.1 190 3.2 4.5Revenue - hotel 193.8 186.9 3.7 5.1Headline operating profit 43.7 39.1 11.8 10.7Pre-tax profit 60.6 31.6 91.8 89.2Headline pre-tax profit 40 36.1 10.8 9.4EPS per share (p) 15.2 8 90 Source: Company data.
Strong operating trends, Singapore RevPAR +22.5% in July. M&C has reported in-line 2Q hotel EBIT of £40.7 mn (CS: £39.6 mn, +12% YoY) driven by constant currency RevPAR growth of 6.3% or 7.5% on a like-for-like (LFL) basis (CS: 7.6%). The trading performance is variable with gateway cities (London, New York and Singapore make up 59% of 2011E hotel EBIT) all seeing accelerating RevPAR growth
into 2Q (London 16%, Singapore 12.5% and New York 8.3%), while UK and US regional performance is softer and one-off impacts of refurbishment and asset management hit 1H profit by £6.8 mn, without which hotel EBIT would have risen 25% YoY. We expect less disruptive impact in 2H and forecast 19% 2H11 EBIT growth, supported by strong current trading trends. For the first 24 days of July, M&C's group RevPAR posted year-on-year increase of 12.6%, with Singapore rising 22.5%, London 14.9% and New York, 12.5%. On a like-for-like basis, group RevPAR rose by 11.3% and Singapore by 14.6%. The interim dividend of 2.08 p is maintained.
Figure 2: Group RevPAR +6.3%, driven by London, NY and Singapore RevPAR (£) 2Q11 Reported Curr 2Q10 Const Curr chg (%)New York 138.67 128.04 8.3Regional US 41.14 38.54 6.7Total US 65.3 60.07 8.7London 105.91 91.28 16.0Rest of Europe 52.98 53.21 -0.4Total Europe 76.35 70.07 9.0Singapore 97.76 86.91 12.5Rest of Asia 57.15 60.46 -5.5Total Asia 72.86 72.55 0.4Autstralasia 26.14 30.37 -13.9Total Group 66.37 62.45 6.3Source: Company data, Credit Suisse estimates.
Divestment gains and further asset management progress in 1H: Including M&C’s reported 2Q11 PATMI jumped 92% YoY to £47.9 mn on a £17.4 mn gain from the sale and leaseback of Studio M hotel in Singapore to CDL Hospitality Trusts (CDLHT). The company confirms: 1) the disposal of land beside its Grand Millennium Kuala Lumpur on 1 Aug, and expects to book pre-tax profit of £35.4 mn in 3Q11; 2) the near completion of the Millennium Seoul refurbishment; 3) the Tokyo hotel construction site acquisition and 4) the next stages of the FSCL Chengdu project (larger hotel, sale of commercial units).
At CDL, continued sales of new launches. CDL has sold 150 units of its 602-unit Executive Condo, Blossoms Residences, at Bukit Panjang at S$685/sq ft within the first weekend of launch in early July. It has also sold 18 units of its high-end 64-unit Buckley Classique at S$2,050/sq ft as of 30 June. Its mass market H2O Residences at Sengkang, has sold 351 of its 521 units, at S$950/sq ft, since its launch in March 2011. Its 1/3-owned mass market Hedges Park, has sold 309 of total 501 units, at S$875/sq ft since launch in April.
Completions in 2Q11 to provide some boost to earnings. CDL would announce its 2Q11 results on 12 August. We expect it to recognise more residential profits in 2Q11 given three projects, Cliveden (110 units, 88 sold), Shelford Suites (77 units, 76 sold) and The Residences@ W (228 units, 21 units sold). We expect part of these projects (c.20%) to be sold on deferred payment scheme, which would mean lumpier recognition on FRS115 where it recognises units sold on DPS only upon completion. Its China acquisitions in Suzhou (S$16 7mn land price, Rmb3,000/sq m) and Chongqing (S$45 mn) are still small relative to its asset base of S$14.5 bn.
Price (02 Aug 11 , S$) 10.65TP (prev. TP S$) 15.74 (15.74) Est. pot. % chg. to TP 4852-wk range (S$) 13.7 - 10.0Mkt cap (S$/US$ mn) 9,684.1/ 8,033.2
Bbg/RIC CIT SP / CTDM.SI Rating (prev. rating) O (O) Shares outstanding (mn) 909.30 Daily trad vol - 6m avg (mn) 1.5 Daily trad val - 6m avg (US$ mn) 13.8 Free float (%) 51.4 Major shareholders Hong Leong Group
48%
Performance 1M 3M 12MAbsolute (%) 0.7 (3.2) (15.5)Relative (%) (0.1) (5.3) (20.9)
Year 12/09A 12/10A 12/11E 12/12E 12/13EEBITDA (S$ mn) 1,036 1,242 1,268 1,216 1,397Net profit (S$ mn) 580.5 736.1 731.2 638.3 777.2EPS (S$) 0.61 0.77 0.77 0.67 0.81- Change from prev. EPS (%) n.a. n.a. 0 0 0- Consensus EPS (S$) n.a. n.a. 0.76 0.78 0.84EPS growth (%) 2.2 26.8 (0.7) (12.7) 21.7P/E (x) 17.5 13.8 13.9 15.9 13.1Dividend yield (%) 0.8 1.7 0.9 0.9 0.9EV/EBITDA (x) 12.3 9.7 9.0 8.9 7.1ROE (%) 10.2 11.9 10.8 8.6 9.6Net debt(cash)/equity (%) 39.6 28.7 19.7 12.4 2.6NAV per share (S$) — — 15.7 — —Disc./prem. to NAV (%) — — (32.3) — — Note1:ORD/ADR=1.00.Note2:City Developments Limited (CDL) is a Singapore-based company engaged in property development, ownership and investment holding..

Thursday, 04 August 2011
Asian Daily
- 13 of 34 -
Great Eastern------------------------------------------------------------------ Maintain OUTPERFORM 2Q11 result: Good business momentum EPS: ▼ TP: ◄► Frances Feng / Research Analyst / 852 2101 6693 / [email protected] Arjan van Veen / Research Analyst / 852 2101 7508 / [email protected]
● Great Eastern (GE) reported a 2Q11 NPAT of S$117.7 mn, up strongly by 58% YoY owing to strong insurance underwriting profit. An interim dividend of S$10 cents was declared. We have lowered our forecast by 2–3% on lower-than-expected 1H11 profit.
● New business momentum was robust, with Singapore up 45% YoY, but Malaysia down 11% YoY (but with better product profitability) and other markets (China/Indonesia) down 4% YoY.
● Value metric growth was strong, with VNB (value of new business) up 21% YoY aided by strong new business growth in Singapore (+37%) and margin expansion in Malaysia (now at 53%, 10 p.p. improvement compared with 2Q11). Capital position remains strong with solvency ratio at above 200%.
● Great Eastern is now trading at only 0.9x P/EV (embedded value), 11.5x P/E and 1.5x P/BV, which we believe is very attractive given its strong market position and growth profile. We maintain our OUTPERFORM rating and S$20 target price (16x P/E, 1.4x P/EV).
Great Eastern (GE) reported a strong 2Q11 NPAT of S$117.7 mn, up 58% YoY owing to strong insurance underwriting profit in traditional product (142% YoY) and participating product (27% YoY). New business value grew by 21% in 2Q11 underpinned by strong Singapore new business volume thanks to the success in its premier customer segment in OCBC cooperation. Malaysia new business value slowed to just 9% on lower business volume (-11%) but with strong margin improvement (+10 p.p.).
Figure 1: Strong 2Q11 NPAT due to good underwriting results S$ mn 2Q10 1Q11 2Q11 YoY %Gross written premium 1,367.3 1,461.9 1,587.2 16% Life insurance profit 69.1 149.8 105.9 53%- Participating fund 23.7 30.7 30.2 27%- Non-participating fund 19.4 92.0 46.9 142%- Investment-linked fund 26.0 27.1 28.8 11%General insurance profit 5.9 5.9 7.6 29%Profit from insurance ops 75.0 155.7 113.5 51% Profit from investments 14.9 25.6 36.6 146%Fees and other income 18.4 17.1 24.7 34%Expenses 15.0 19.8 33.5 123% Pre-tax profit 91.3 179.3 140.2 54%Tax 14.3 18.1 20.1 41%NPAT 77.0 161.2 120.1 56%Minorities -2.6 -2.5 -2.4 -8%NPAT attributable 74.4 158.7 117.7 58% EPS 0.16 0.34 0.25 58%Source: Company data, Credit Suisse estimates
Figure 2: Singapore showed strength while Malaysia weak in 2Q11 NB APE growth, VNB growth and VNB margin by markets (%) 1Q10 2Q10 3Q10 4Q10 1Q11 2Q11Singapore NB APE growth (%pa) 61% 28% -12% 20% 33% 45%VNB growth (%pa) 62% 12% 13% 35% 18% 37%VNB margin (% APE) 41% 43% 38% 47% 37% 40%Malaysia NB APE growth (%pa) -23% 20% 48% 15% 24% -11%VNB growth (%pa) 4% 41% 43% 16% 44% 9%VNB margin (% APE) 50% 43% 47% 41% 57% 53%Total NB APE growth (%pa) 19% 30% 11% 26% 33% 14%VNB growth (%pa) 35% 29% 29% 31% 30% 21%VNB margin (% APE) 43% 42% 40% 43% 42% 44%Source: Company data, Credit Suisse estimates
Figure 3: VNB up 21% YoY in 2Q11 Value of one-year new business (VNB -S$ per share) and VNB growth (%)
0
20
40
60
80
100
120
1Q09 2Q09 3Q09 4Q09 1Q10 2Q10 3Q10 4Q10 1Q11 2Q11 3Q11F 4Q11F-30%
-20%
-10%
0%
10%
20%
30%
40%
Singapore Malaysia Other Growth (%pa)
F'casts
+25%
Source: Company data, Credit Suisse estimates
Price (02 Aug 11, S$) 14.89TP (prev. TP S$) 20.00 (20.00) Est. pot. % chg. to TP 3452-wk range (S$) 15.8–14.1Mkt cap (S$/US$ mn) 7,047.7/ 5,846.3
Bbg/RIC GE SP / GELA.SI Rating (prev. rating) O (O) Shares outstanding (mn) 473.32 Daily trad vol - 6m avg (mn) 0.0 Daily trad val - 6m avg (US$ mn) 0.3 Free float (%) — Major shareholders OCBC - 85%
Performance 1M 3M 12MAbsolute (%) 1.3 2.4 (5.7)Relative (%) 2.8 6.0 (10.2)
Year 12/09A 12/10A 12/11E 12/12E 12/13ELife premiums (S$ mn) 5,834 6,156 7,176 8,105 8,769P&C GWP (S$ mn) 162.7 171.7 108.1 217.3 244.5Net profit (S$ mn) 516.7 507.2 583.4 630.4 691.8EPS (S$) 1.09 1.07 1.23 1.33 1.46- Change from prev. EPS (%) n.a. n.a. (2) (3) (3)- Consensus EPS (S$) n.a. n.a. 1.15 1.23 1.33EPS growth (%) 89.7 (1.8) 15.0 8.1 9.7P/E (x) 13.6 13.9 12.1 11.2 10.2NAV per share (S$) 7.5 7.7 8.8 10.2 11.6Emb.val.PS (S$) 13.2 14.2 15.5 16.6 17.9Dividend yield (%) 2.7 5.8 4.1 4.5 4.9EV/EBITDA (x) 6.1 7.0 1.8 (0.1) (1.6)P/B (x) 2.0 1.9 1.7 1.5 1.3ROE (%) 15.7 14.0 14.8 14.0 13.4Combined ratio (%) — — — — — Note 1: Great Eastern is the oldest and most established life insurance group in Singapore and Malaysia. With $55 bn in assets and 3.8 mn policyholders, it has two successful distribution channels - the tied agency force and bancassurance. The company also operates in China, Indonesia, Vietnam and Brunei.

Thursday, 04 August 2011
Asian Daily
- 14 of 34 -
Hutchison Port Holdings Trust-------------------------------------- Maintain UNDERPERFORM 1H11 earnings slightly beat on better cost savings, but more cautious on demand outlook EPS: ▼ TP: ▼ Ingrid Wei / Research Analyst / 86 21 3856 0379 / [email protected] Sam Lee / Research Analyst / 852 2101 7186 / [email protected]
● HPHT reported 1H11 net earnings of HK$1 bn, 9.7% ahead of its own IPO target of US$916 mn on better cost savings, despite both volume and earnings missing its target. Interim dividends of HK$0.13/share were declared, which were better than its forecast.
● Nevertheless, what worries us is the volume growth in 2H11. Both its HIT and Yantian terminals reported lower-than-expected volume growth in 1H11, mainly on softer demand from the US and Europe.
● Although we are in the high season, management mentioned no sign of sequential strong volume pick-up and said that demand was weaker than normal seasonality. HPHT’s pure exposure to the PRD means a high probability of weaker volume growth in 2H11. We, therefore, lower our 2011-12 volume growth forecasts.
● Thus, we lower our 2011, 2012 and 2013 EPS estimates by 4%, 7% and 9%, respectively. We also lower our DCF-based target price to US$0.72. Trading at 22.3x and 21.5x 2011-12E P/E, the stock doesn’t look cheap despite a long time weakness. Forecast 2011-12 dividend yields of 6.4% and 8.2% may provide support, but poor demand and earnings outlook will be key overhangs, in our view. We maintain our UNDERPERFORM rating.
Volume and revenue missed IPO target HIT and Yantian terminals only achieved 4.6% and 2.1% YoY volume growth in the period of 16 March to 30 June 2011—2.1% and 2.6% below HPHT’s own forecasts, respectively. Also, HIT missed its ASP target due to a higher proportion of transshipment volume, while Yantian’s ASP was up roughly 1-2%, beating the target due to lower empty share of boxes. As a consequence, revenue was 2.6% lower than its own forecast. Earnings and dividends beat slightly on better cost savings Nevertheless, earnings and dividends were slightly better than forecasts on better cost control. Cost savings mainly came from effective control on staff cost, and savings on trust and interest expenses.
Figure 1: HPHT – 1H11 earnings beat its own forecast on cost savings 16 Mar-30 Jun 2011 (HK$ mn) Actual Forecast Actual vs forecastRevenue 3,400 3,492 -2.6%Cost of services rendered (1,131) (1,173) -3.6%Staff costs (71) (80) -11.6%Depreciation & amort (785) (837) -6.2%Other op exp (191) (194) -1.3%Other op income 25 25 0.0%Mgt fees (6) (6) 0.0%Trust exp (35) (42) -17.9%Total op expenses (2,193) (2,307) -4.9%Op profit 1,207 1,186 1.8%Interest & other finance costs (151) (199) -24.2%Other op income 26 Association income 59 36 64.5%PBT 1,141 1,022 11.6%Tax (136) (106) 28.3%Net profit 1,004 916 9.7% EBITDA margin 58.6% 57.9% 0.7%Op margin 35.5% 33.9% 1.5%Source: Company data Cautious on 2H11 volume growth When we asked about recent volume update, management mentioned no sign of sequential strong volume pick-up recently although we are entering into the high season and said that demand was weaker than normal seasonality. Softening latest leading indicators, such global PMI, US consumer spending and China PMI new export order, also imply weak volume demand over the next few months. Further, HPHT’s pure exposure to the PRD means high chance of weak volume growth in 2H11. We, therefore, lower our 2011-12 volume growth forecasts for HIT and Yantian from mid-to-high single digits to low-to-mid single digits. Downward revisions to earnings estimates and target price Although management highlighted measures to meet its full-year earnings forecast through ASP improvement (such as settlement currency conversion to Rmb from HK$) and further cost savings in 2H11, we are concerned about any further improvement in 2H11 when its customer are in tough operational/financial situation and inflation is still on an upward trend.
While we factor in better-than-expected cost control and interest expense savings in 1H11, we lower our 2011, 2012 and 2013 earnings estimates by 4%, 7% and 9% respectively, to reflect our weaker volume growth forecast. We also lower our DCF-based target price to US$0.72.
Trading at a 2011-12 P/E of 22.3x and 21.5x compared to an EPS CAGR of 4.5%, the stock doesn’t look cheap. HPHT offers an annualised 6.4% and 8.2% 2011-12 dividend yield, still slightly below the average yield of 9.0% to 9.6% of Singapore-listed REITs or Singapore-listed shipping trusts.
Price (03 Aug 11, US$) 0.74TP (prev. TP US$) 0.72 (0.80) Est. pot. % chg. to TP (2)52-wk range (US$) 1.01 - 0.74Mkt cap (US$ mn) 6,401.0
Bbg/RIC HPHT SP / HPHT.SI Rating (prev. rating) U (U) [V] Shares outstanding (mn) 8,708.89 Daily trad vol - 6m avg (mn) 52.6 Daily trad val - 6m avg (US$ mn) 49.1 Free float (%) — Major shareholders
Performance 1M 3M 12MAbsolute (%) (14.0) (17.9) —Relative (%) (13.3) (18.5) —
Year 12/09A 12/10A 12/11E 12/12E 12/13ERevenue (HK$ mn) — 11,339 11,868 12,539 13,216EBITDRAF (HK$ mn) — 6,777 7,076 7,415 7,818Net profit (HK$ mn) — 2,131 2,236 2,316 2,386EPS (HK$) 0.24 0.26 0.27 0.27- Change from prev. EPS (%) n.a. n.a. (4) (7) (9)- Consensus EPS (HK$) n.a. n.a. 0.25 0.30 0.33EPS growth (%) n.a. n.a. 4.9 3.6 3.0P/E (x) — 23.4 22.3 21.5 20.9Dividend yield (%) 0 6.4 8.2 8.5EV/EBITDRAF (x) — 14.0 13.4 12.8 12.1P/B (x) — 0.7 0.7 0.7 0.7ROE (%) — 2.9 3.1 3.3 3.5Net debt(cash)/equity (%) — 26.2 26.2 27.7 29.1 Note 1: Hutchison Port Holdings Trust (HPH Trust) is a container port business trust and provides unitholders with an opportunity to invest in the trading hub by throughput, the Pearl River Delta. HPH Trust is engaged in the portfolio container terminals and portfolio ancillary services.

Thursday, 04 August 2011
Asian Daily
- 15 of 34 -
Overseas Union Enterprise----------------------------------------------- Maintain OUTPERFORM 2Q11 results seemingly below estimates, but expect profits to be backloaded EPS: ◄► TP: ◄► Tricia Song / Research Analyst / 65 6212 3141 / [email protected]
● 2Q11 net profit of S$20.1 mn (+20% YoY, -3% QoQ) brings 1H11 core profit to S$41 mn—35% of our estimate of S$116 mn and 32% of the street’s estimate of S$130 mn for FY11. We expect earnings to be backloaded with OUE Bayfront completed in 1Q11 and tenants to progressively move in by 2H11. We also expect some contribution from the just-completed Crowne Plaza Changi Airport acquisition.
● Revenues grew 40% YoY mainly on: (1) a 7% jump in hotel revenues to S$45 mn as RevPAR for its Mandarin Orchard rose 3.6% to S$233 from S$225; (2) three-fold jump in rental income to S$26 mn, mainly due to contribution from DBS Towers (acquired in 4Q10).
● OUE completed the acquisition of Crowne Plaza Changi Airport for S$299.5 mn on 25 July. We estimate net gearing on revalued book at c.35.7% as of June 11 to rise to c.43%.
● With the recent slowdown in office leasing momentum, OUE has underperformed the STI by 4-6% over the past 1-3 months, and trades at a steep 39% discount to our S$4.67 RNAV. We remain constructive on the prime office and hotel sectors it has 77% exposure to. Catalysts include potential spin-off the assets into REITs.
Sales at its sole residential project ‘Twin Peaks’ improved slightly—sold 9 units in 2Q11, vs 3 in 1Q11, at a median price of S$2,700/sq ft vs S$2,945/sq ft in 1Q11, and brought take-up to 10% of its 462 units.
Updates on OUE Bayfront. OUE Bayfront, which TOPed in 1Q11, has recently signed on new tenants—international law firm Hogan Lovells International and a Swiss bank subsidiary Union Bancaire Privee (Singapore)—bringing the commitment rate to 77% from 60%. We understand that OUE Bayfront is achieving S$13/sq ft per month rent, while the average passing rent for 68.6% of commitments was S$9.82/sq ft. OUE has also completed the refurbishment of the former Change Alley Aerial Plaza Tower and Change Alley Link
Bridge, renaming them OUE Tower and OUE Link, respectively. Total NLA of 14,654 sq ft has been fully leased to retail and F&B tenants.
Figure 1: Summary of results (S$ mn) 2Q11 2Q10 YoY % 1Q11 QoQ %Revenue 72.3 51.7 40 68.2 6EBIT 32.5 15.4 111 28.3 15Finance expenses -12.8 -0.1 n.m -7.7 65Share of associates 4.8 5.3 -10 4.5 5Profit before tax 24.5 20.6 19 274.3 -91Attributable profit 20.1 16.7 20 227.6 -91Core profit 20.1 16.8 20 20.7 -3Source: Company data, Credit Suisse estimates
Figure 2: Summary of results (S$ mn) 1H11 1H10 YoY % CS FY11E % of CS estRevenue 140.5 99.7 41 329.3 43EBIT 60.7 29.4 107 148.2 41Finance expenses -20.5 -0.5 n.m -34.9 59Share of associates 9.3 13.0 -29 20.4 46Profit before tax 298.7 232.6 28 244.9 122Attributable profit 247.7 202.2 22 226.9 109Core profit 40.8 35.7 14 115.7 35Source: Company data, Credit Suisse estimates
Figure 3: Revenue breakdown (S$ mn) 2Q11 % 2Q10 % % YoYHospitality 44.6 62 41.6 80 7Property Investment 25.6 36 8.9 17 188Property Development 1.0 1 0.7 1 41Dividend income 0.9 1 0.9 2 -Others 0.1 n.m 0.3 n.m -75Total 72.3 100 51.7 100 40Source: Company data
Figure 4: Breakdown of RNAV by business segment
Retail8%
Residential11%
Others4%
Hospitality19%
Commercial58%
Source: Company data, Credit Suisse estimates
Price (02 Aug 11, S$) 2.87TP (prev. TP S$) 4.20 (4.20) Est. pot. % chg. to TP 4652-wk range (S$) 3.60 - 2.61Mkt cap (S$/US$ mn) 2,817.2/ 2,337.0
Bbg/RIC OUE SP / OVES.SI Rating (prev. rating) O (O) Shares outstanding (mn) 981.60 Daily trad vol - 6m avg (mn) 1.7 Daily trad val - 6m avg (US$ mn) 4.2 Free float (%) 21.0 Major shareholders Lippo Group
(79.35%)
Performance 1M 3M 12MAbsolute (%) (3.0) (3.7) 4.4Relative (%) (3.8) (5.9) (1.0)
Year 12/09A 12/10A 12/11E 12/12E 12/13EEBITDA (S$ mn) 40.1 103.8 165.2 230.7 264.0Net profit (S$ mn) 44.5 84.3 115.7 178.1 208.6EPS (S$) 0.05 0.09 0.12 0.18 0.21- Change from prev. EPS (%) n.a. n.a. 0 0 0- Consensus EPS (S$) n.a. n.a. 0.12 0.19 0.22EPS growth (%) (20.8) 89.2 37.3 54.0 17.1P/E (x) 63.3 33.4 24.4 15.8 13.5Dividend yield (%) 0 1.4 2.1 3.2 3.7EV/EBITDA (x) 79.7 40.3 25.3 17.3 13.9ROE (%) 2.1 3.5 4.0 5.8 6.6Net debt(cash)/equity (%) 18.5 48.9 45.6 38.0 26.8NAV per share (S$) — — 4.67 — —Disc./prem. to NAV (%) — — (38.5) — — Note 1: OUE has achieved consistent growth over the past 40 years by developing and managing landmark properties at prime locations in Singapore and across the region. We are shaping our future by diversifying into retail, commercial and residential developments, in addition to our hospitality excellence.

Thursday, 04 August 2011
Asian Daily
- 16 of 34 -
Singapore Exchange--------------------------------------------------------------- Maintain NEUTRAL New report: Downgrading earnings for weaker start to FY12 EPS: ▼ TP: ▼ Arjan van Veen / Research Analyst / 852 2101 7508 / [email protected]
● We have downgraded our SGX forecasts by ~3.5% following a weaker start to the year. Key July 2011 trends were as follows:
● Equity markets (45% of revenues): July 2011 turnover (by value) was down 2.6% YoY, driven by continued weak velocity (markets up 6.7% YoY). Average daily turnover was S$1.4 mn relative to our (reduced) FY12 forecast of S$1.8 mn.
● Derivatives markets (20%): Derivative volumes have held up better, with volumes up 10% YoY, but down 15% on June 2011. Depositary services (15%): these fees are more based on equity volumes rather than value, with volumes in July 2011 up 2% YoY. Listings (10%): there were three new (small) listings in the month, with new raisings still mainly bond market related (SGX stated pipeline was strong).
● Valuation reduced to S$7.50 (from S$7.75), implying 22x 12-month forward earnings, equivalent to its eight-year average. SGX often trades below these levels in periods of market weakness.
● Please click here for full report.
Although the FY11 results commentary reinforces our view of the solid longer-term growth profile of the SGX as a regional hub (with its IT lead a key competitive advantage), the nearer term fortunes of the stock are more market-volume related.
We highlight that market activity has continued to remain subdued in July 2011, with securities market velocity continuing to be the main culprit while derivative markets are more robust.
While the Straits Times index is up 6.7% YoY, equities market turnover (in value terms) was down 2.6%. As fees are based on value; the fall is due to a reduction in trading velocity, which is tracking at its lower point since 2Q06 on a quarterly basis.
Figure 1: Avg daily turnover in July $1.4mn (vs FY12E $1.8mn) SGX average daily turnover (S$ mn)
-
0.5
1.0
1.5
2.0
2.5
3.0
3.5
Dec-06
Mar-07
Jun-07
Sep-07
Dec-07
Mar-08
Jun-08
Sep-08
Dec-08
Mar-09
Jun-09
Sep-09
Dec-09
Mar-10
Jun-10
Sep-10
Dec-10
Mar-11
Jun-11
Avg
Daily
Tur
nove
r (S$
mn)
Annual average
CS FY12E= S$1.8mn
Source: Reuters, company data, Credit Suisse estimates
Average daily turnover was S$1.4 mn relative to our (reduced) FY12 forecast of S$1.8 mn. We highlight sensitivity to valuation/earnings to average daily turnover (ADT) in Figure 2 below.
Derivative market volumes have held up better, with volumes up 10% YoY, but down 15% on June 2011. Structured warrants volumes remain subdued, but did pick up somewhat (up 17% YoY).
While some downside risk exist to the SGX stock price should current weaker market conditions persist, we highlight that the stock is trading in line with it longer term averages on most key financial metrics. This applies to both absolute and relative metrics compared to both the Singapore overall market as well as regional peers.
In particular, we highlight the following: (1) price highly correlated to market trading volumes and appears to have at least partly adjusted for weaker volumes; (2) P/E relative to STI is trading slightly above historical average; and (3) SGX is roughly trading in line relative to other Asian exchanges.
Figure 2: Valuation sensitivity to trading volumes Valuation sensitivity to average daily trading volume
Daily average equity turnover (S$bn) - 2012EPE (x) 1.2 1.4 1.6 Base=1.8 2 2.2 2.4
14x 3.37 3.79 4.21 4.57 4.92 5.27 5.6216x 3.85 4.33 4.82 5.22 5.62 6.03 6.4318x 4.33 4.87 5.42 5.87 6.33 6.78 7.2320x 4.81 5.42 6.02 6.52 7.03 7.53 8.0322x 5.29 5.96 6.62 7.18 7.73 8.28 8.8424x 5.77 6.50 7.22 7.83 8.43 9.04 9.6426x 6.26 7.04 7.83 8.48 9.14 9.79 10.4528x 6.74 7.58 8.43 9.13 9.84 10.54 11.2530x 7.22 8.12 9.03 9.79 10.54 11.30 12.0532x 7.70 8.67 9.63 10.44 11.24 12.05 12.86
Source: Reuters, IBES consensus 12-month forward forecasts
Price (02 Aug 11 , S$) 7.35TP (prev. TP S$) 7.50 (7.75) Est. pot. % chg. to TP 252-wk range (S$) 10.12 - 7.09Mkt cap (S$/US$ mn) 7,876.0/ 6,508.0
Bbg/RIC SGX SP / SGXL.SI Rating (prev. rating) N (N) Shares outstanding (mn) 1,071.57 Daily trad vol - 6m avg (mn) 3.3 Daily trad val - 6m avg (US$ mn) 21.0 Free float (%) 92.4 Major shareholders SEL Holdings (23%)
Performance 1M 3M 12MAbsolute (%) (3.7) (2.3) (6.0)Relative (%) 2.7 3.8 (17.9)
Year 06/10A 06/11A 06/12E 06/13E 06/14ERevenue (S$ mn) 640 661 751 876 1,006EBITDA (S$ mn) 405.3 408.4 468.5 565.5 670.3Net profit (S$ mn) 317.8 311.8 353.7 428.5 509.2EPS (S$) 0.29 0.29 0.32 0.39 0.45- Change from prev. EPS (%) n.a. n.a. -3 -3 -4- Consensus EPS (S$) n.a. n.a. 0.34 0.39 0.42EPS growth (%) 3.0 (2.8) 12.4 20.0 17.8P/E (x) 25.0 25.7 22.9 19.1 16.2Dividend yield (%) 3.7 3.7 4.1 4.9 5.9EV/EBITDA (x) 17.8 17.6 15.3 12.6 10.5P/B (x) 9.6 9.5 9.0 8.3 7.5ROE (%) 39.9 38.0 41.7 47.0 51.2Net debt(cash)/equity (%) (82.4) (84.1) (82.9) (80.2) (77.5) Note1:Singapore Exchange Limited (SGX) is a Singapore-based investment holding company. The Company is principally engaged in the provision of management and administrative services, treasury management and provision of contracts processing services. SGX operates in three segments: securities market, derivatives market and other operations..

Thursday, 04 August 2011
Asian Daily
- 17 of 34 -
South Korea Cheil Industries Inc---------------------------------------------------------- Maintain OUTPERFORM 2Q disappoints; should benefit with the improvement in IT industry going forward EPS: ▼ TP: ▼ A-Hyung Cho / Research Analyst / 822 3707 3735 / [email protected] Jihong Choi / Research Analyst / 82 2 3707 3796 / [email protected]
● 2Q earnings were weaker than CS and consensus estimates; this was widely expected after LG Chemical and some IT companies’ 2Q results, which were affected by softer end-demand.
● Chemical margin was down due to a spike in feedstock (BD, AN) prices, especially given the weak end-demand, mostly in the IT sector. The IT business, despite volume and market share expansion, was weak due to a sluggish LCD industry. Increasing marketing cost was a burden on the fashion business.
● Management has guided that, although uncertainties exist, overall IT demand could start showing some improvement from September. OLED materials should start contributing to the top line from October.
● We lower our EPS estimates by 17%/7% for FY11/12, reflecting softer-than-expected operations YTD and EPS dilution from the acquisition and merger with Ace Digitech. Based on our new estimates and shifting our earnings base to 2012, we lower our target price to W138,000 from W143,000. We maintain our OUTPERFORM rating.
Earnings disappointed Cheil on 3 August released its 2Q results after market hours. Cheil’s results were disappointing, although previously released IT sector’s earnings results were a hint of what was coming.
Chemical: Earnings and margins fell due to ineffective cost pass-through, given the sluggish demand in the IT business and a spike in feedstock costs (BD and AN).
IT: The polarizers business disappointed on ASP pressure from a weak LCD industry, despite Cheil’s product mix improvement, i.e., started supplying polarizers for TVs.
Fashion: Top line was supported by an improving domestic consumption but was affected by aggressive spending on domestic marketing. Outlook Management has guided that, despite uncertainties in the macro environment, IT-related demand may start improving around September, which should help both the IT and chemical business turn around. The polarizers business should sequentially improve in 2H, after the merger with Ace Digitech; product mix should continue to improve with further expansion in the polarizers for TVs and the improved yield rate of 95% as of the end of 2Q vs 50% in 1Q.
The recent fall in butadiene prices could benefit its chemical business. We note, however, that butadiene prices are lower due to a shutdown/maintenance turnaround at the downstream makers. OLED business starts kicking in this October During the conference call, management guided that the company’s first sales of OLED materials and the market’s excitement about the company would be recognised this October. Our recent discussion with management suggests around W100 bn revenue target in 2012. EPS adjusted down We lower our estimates to reflect the weaker-than-expected 2Q and a milder-than-previously-thought recovery. We also revise down our target price to W138,000, based on our sum-of-the-parts valuation. We have applied the same multiples of 10x EV/EBITDA on IT, 7x on chemicals and 6x on fashion businesses based on FY12E EBITDA and reflected the dilution from share issue after the merger with Ace Degitech.
Figure 1: Cheil Industries – 2Q11 earnings 2Q11 Previous results 2011E (W bn) Actual Cons 1Q11 QoQ% 2Q10 YoY% CS ConsSales 1,480.7 1,450.0 1,399.6 5.8 1,327.4 11.5 6,184.7 5,898.1 Chem 650.3 621.0 4.7 591.0 10.0 2,546.3 ECM 406.5 383.7 5.9 368.1 10.4 2,050.0 Fashion 396.6 376.6 5.3 343.2 15.6 1,588.5 Others 27.3 18.3 49.2 25.1 8.8Op. profit 62.8 101.2 102.7 -38.9 102.7 -38.9 374.3 422.3 Chem 23.0 35.5 -35.2 69.0 -66.7 121.2 ECM 26.9 36.4 -26.1 22.5 19.6 155.4 Fashion 11.1 28.7 -61.3 10.5 5.7 97.6 Others 1.8 2.1 -14.3 0.7 157.1OP margin 4.2% 7.0% 7.3% 7.7% 6.1% 7.2% Chem 3.5% 5.7% 11.7% 4.8% ECM 6.6% 9.5% 6.1% 7.6% Fashion 2.8% 7.6% 3.1% 6.1% Others 6.6% 11.5% 2.8%Non-op. items -7.3 -1.8 -4.9 -4.2 33.4 -3.5RP 55.5 99.4 97.8 -43.3 98.5 -43.7 407.8 418.9Net profit 54.5 79.5 80.7 -32.5 78.7 -30.7 342.5 346.5Source: Company data, Bloomberg, Credit Suisse estimates 001300 KS Old rating New rating Old TP (W) New TP (W)3-Aug-2011 Outperform Outperform 143,000 138,000
Price (03 Aug 11, W) 112,500TP (prev. TP W) 138,000 (143,000) Est. pot. % chg. to TP 2352-wk range (W) 138000.0 - 88200.0Mkt cap (W/US$ bn) 5,625.0/ 5.3
Bbg/RIC 001300 KS / 001300.KS Rating (prev. rating) O (O) Shares outstanding (mn) 50.00 Daily trad vol - 6m avg (mn) 0.5 Daily trad val - 6m avg (US$ mn) 58.5 Free float (%) 95.1 Major shareholders Samsung Card
(4.9%)
Performance 1M 3M 12MAbsolute (%) (15.4) (8.5) 20.1Relative (%) (11.7) (3.3) 4.7
Year 12/09A 12/10A 12/11E 12/12E 12/13ERevenue (W bn) 4,261 5,019 6,185 7,308 7,716EBITDA (W bn) 394.7 468.0 547.3 727.7 833.7Net profit (W bn) 127.0 258.7 342.5 440.5 517.8EPS (W) 2,540 5,174 6,687 8,401 9,874- Change from prev. EPS (%) n.a. n.a. (17) (7) - Consensus EPS (W) n.a. n.a. 6,936 8,748 10,459EPS growth (%) (19.4) 103.7 29.2 25.6 17.5P/E (x) 44.3 21.7 16.8 13.4 11.4Dividend yield (%) 0.7 0.7 0.7 0.7 0.7EV/EBITDA (x) 15.2 12.6 11.0 8.3 6.9P/B (x) 2.9 2.0 1.7 1.6 1.4ROE (%) 7.1 10.9 11.2 12.4 13.0Net debt(cash)/equity (%) 18.5 9.9 12.3 10.2 2.7 Note 1: Cheil Industries Inc. is a Korea-based company primarily involved in the provision of chemicals, electronic materials and garments. The company's chemical products include acrylonitrile butadiene styrene (ABS), polystyrene (PS) and engineering plastic (EP) products applied in electronic devices.

Thursday, 04 August 2011
Asian Daily
- 18 of 34 -
Daelim Industrial ------------------------------------------------------------- Maintain OUTPERFORM Return of the conventional strong name in the Middle East plant market EPS: ▼ TP: ▲ Minseok Sinn / Research Analyst / 822 3707 8898 / [email protected] Hayoung Chung / Research Analyst / 822 3707 3795 / [email protected]
● Daelim Ind is reportedly very close to being awarded the P2-5 of Jubail integrated petrochemicals complex project in Saudi Arabia (worth about US$1.0 bn), following its recent official order award of US$920 mn from P1 of the same project.
● Sweep in this meaningful bid represents the conventional strong name’s return in the ME plant market. We raise 2011E new orders from W9.8 tn (overseas: W5.0 tn) to W10.3 tn (overseas: W6.0 tn) given strong overseas new orders of c.U$4.5 bn YTD (incl effectively secured ones) vs W7.7 tn in 2010 (overseas: W2.7 tn).
● We revise our 2011-12 EBITDA estimates by -3% and +27%, respectively. While discount sale of unsold apartments depresses 2011E EBITDA, we anticipate strong overseas new orders in 2011 and one-off gain of W37 bn from sale of its stake in GK Causeway to boost Daelim Ind’s 2012E EBITDA.
● Reiterate OUTPERFORM. Daelim Ind is our top pick in the Korea E&C universe. Increase SOTP TP to W160,000.
Seems to sweep P1-5 of Jubail integrated petrochemicals complex project in Saudi Arabia, worth about US$1.9 bn
According to MEED’s report on 2 August, Daelim Ind is very close to being awarded P2-5 of Jubail integrated petrochemicals complex project in Saudi Arabia (worth c.US$1.0 bn), on top of its recent official order award of US$920 mn from P1 of the same project. While its domestic peers delivered strong overseas new order growth in recent years, Daelim Ind’s overseas new orders remained stagnant at around W2.2-2.7 tn in 2007-10, which seemed to be mainly responsible for management’s conservative stance, in our view. However, Daelim Ind’s sweep in this meaningful bid presents strong evidence of the conventional strong name’s return in the ME plant market, considering the Jubail project is among the biggest plant works in the ME in 2011 and several global leading EPC names were bidders. We raise 2011E new orders from W9.8 tn (overseas: W5.0 tn) to W10.3 tn (overseas: W6.0 tn), versus W7.7 tn in 2010 (overseas: W2.7 tn).
Figure 1: Daelim Industrial – major overseas bids in 2011 Project Country Size (US$ bn, E)Refinery revaming (engineering work)* Philippines 0.3Arabian Chlor Vinyl (P/C part)* Saudi Arabia 0.5Jubail petrochem complex (P1)* Saudi Arabia 0.9Jubail petrochem complex (P2-5)** Saudi Arabia 1.0Refinery revaming (P/C part)** Philippines 0.82 power plant works** Vietnam 1.0Riyadh power plant Saudi Arabia 1.5Shoaiba power plant Saudi Arabia 1.2*Officially secured. **Effectively/almost secured already, according to management. Source: Company data Revise 2011-12E EBITDA by -3% and +27%
We revise 2011-12 EBITDA ests by -3% and +27%, resp. With discount sale of unsold apartments depressing 2011E EBITDA, we expect strong overseas new orders in 2011 and one-off gain of W37 bn from its stake sale in GK Causeway to boost 2012E EBITDA. But we reduce 2011-12E net profit by 22% and 7%, resp, due to downward revision in our equity method gain projections, rise in net interest cost estimates and full implementation impact of IFRS consolidated accounting (i.e. increase in income tax rate etc.). We expect revenues of ~W1.7 tn (consol) and operating profit of about W160 bn for 2Q11. Sizable one-off gain of W96 bn from sale of its stake in Seoul Beltway seemed to boost 2Q11 operating profit, despite impact of discount sale of unsold apartments on the 2Q11 gross profit. Our top pick in Korea E&C sector
Reiterate OUTPERFORM rating with raised SOTP TP of W160,000 (from prev W130,000). While upward revision in 2012E EBITDA is a key positive to increase our NAV estimates for its core operation, we also raise target 2012E EBITDA multiple for core operation from prev 8.0x to 8.5x considering company's current strong overseas new order momentum. Daelim Ind is our top pick in the Korea E&C universe.
Figure 2: Daelim Ind – changes in target SOTP valuation (W bn) New Old Rationales on new NAV (old)Core business 4,540 3,758 8.5x 2012E EBITDA (8.0x)YNCC 1,364 1,364 2.0x Dec 2011E BVOther investment assets 443 490 CS estimates referring BVLandbank 400 481 Dec 2010A BVPotential write-downs -239 -170 On guarantees and loans to subsidiaries Net cash -380 -866 Dec. 2011E (the old was an adjusted one)Total 6,129 5,057 Number of shares (mn) 38.6 38.6 Includes 3.8m perf sharesNAV/ share (W) 160,000 130,000 Source: Company data, Credit Suisse estimates 000210.KS Old rating New rating Old TP New TPMay 12, 2011 OUTPERFORM OUTPERFORM W150,000 W130,000August 3, 2011 OUTPERFORM OUTPERFORM W130,000 W160,000As of close of business 2 August 2011, Credit Suisse Securities (Europe) Limited, Seoul Branch performs the role of liquidity provider on the warrants of which underlying assets are Daelim Ind and holds 6,668,750 of warrants concerned. These may be covered warrants that constitute part of a hedged position.
Price (03 Aug 11, W) 127,000TP (prev. TP W) 160,000 (130,000) Est. pot. % chg. to TP 2652-wk range (W) 142000.0 - 62500.0Mkt cap (W/US$ bn) 4,419.6/ 4.2
Bbg/RIC 000210 KS / 000210.KS Rating (prev. rating) O (O) Shares outstanding (mn) 34.80 Daily trad vol - 6m avg (mn) 0.5 Daily trad val - 6m avg (US$ mn) 57.9 Free float (%) 76.0 Major shareholders Daelim Corp &
related parties 24.0%
Performance 1M 3M 12MAbsolute (%) (1.9) 5.0 91.3Relative (%) 1.8 10.2 75.9
Year 12/09A 12/10A 12/11E 12/12E 12/13ERevenue (W bn) 6,275 6,198 7,668 9,118 9,906EBITDA (W bn) 455.1 367.2 535.2 570.8 564.0Net profit (W bn) 343.2 353.9 437.2 542.0 558.7EPS (W) 8,891 9,168 11,327 14,042 14,474- Change from prev. EPS (%) n.a. n.a. (22) (7) (14)- Consensus EPS (W) n.a. n.a. 12,112 14,591 16,412EPS growth (%) 238.2 3.1 23.5 24.0 3.1P/E (x) 14.3 13.9 11.2 9.0 8.8Dividend yield (%) 0.1 0.2 0.6 0.6 0.6EV/EBITDA (x) 11.0 13.3 9.0 7.8 7.6P/B (x) 1.3 1.2 1.1 1.0 0.9ROE (%) 9.9 9.0 10.4 11.9 11.0Net debt(cash)/equity (%) 15.8 11.5 8.8 0.7 (2.2) Note 1: Daelim Industrial Co., Ltd. is a Korea-based company mainly engaged in the engineering and construction business. The company operates its business through two segments: construction segment and petrochemical segment.

Thursday, 04 August 2011
Asian Daily
- 19 of 34 -
Hyundai Development ------------------------------------------------------------- Maintain NEUTRAL Sizable write-down expense depressed 2Q11 earnings EPS: ▼ TP: ▼ Minseok Sinn / Research Analyst / 822 3707 8898 / [email protected] Hayoung Chung / Research Analyst / 822 3707 3795 / [email protected]
● Hyundai Development’s (HDC) 2Q11 operating profit of W53 bn was significantly below expectations on the sizeable write-down expense of W70 bn, which was related to the takeover of a housing project from a developer. Management insists there will be no further sizable write-down expenses in the future.
● HDC has added two new landbanks YTD. While management expects revenues of W310 bn and W390 bn from the new landbanks, we estimate operating margins of 15% and 14% from the new landbanks, respectively.
● We revise down our 2011 and 2012 net profit estimates by 21% and 9%, respectively. While we revise 2011E and 12E operating profit by -16% and +5% considering the write-down expense of W70 bn and the new landbank build-ups, we have also reflected bigger-than-expected net interest cost in 1H11 and the impact of the full implementation of IFRS separated accounting in the estimates.
● Accordingly, we also reduce our SOTP-based target price from W34,000 to W33,000. We reiterate our NEUTRAL rating on HDC.
Housing-related write-downs depressed 2Q11 earnings
Hyundai Development Company (HDC) on 3 August morning released its 2Q11 preliminary headline numbers. Revenue of W827 bn (separated, +46% QoQ) and gross profit of W155 bn (+33% QoQ) were largely in line with expectations. However, an unexpected write-down expense of W70 bn (following W75 bn in 4Q10) related to the takeover of a housing project in Daegu city from a developer inflated its 2Q11 SG&A expense to W103 bn (versus W38 bn in 1Q11) and resulted in weak operating profit of W53 bn (-38% QoQ). With the cost of the sizable write-down expense, HDC could reduce its PF loan guarantees from W580 bn as at March 2011 to W378 bn as at June 2011. Meanwhile, management insists there will be no further sizable write-down expenses in the future.
Figure 1: HDC – CS forecast versus consensus forecast 2Q10 2Q11 2011E 2012E (W bn) Act’l* Act’l* Cons.
** CS – New*
CS – Old*
Cons.**
CS -New*
CS -Old*
Cons.**
New orders 499 346 n/a 2,887 3,241 n/a 3,487 3,103 n/aRevenues 664 827 843 3,093 3,253 3,335 2,755 2,687 3,220Operating profit 49 53 110 421 503 469 268 255 376Net profit 19 30 76 257 325 307 151 165 261Op margin (%) 7.4 6.4 13.0 13.6 15.5 14.1 9.7 9.5 11.7*K-IFRS (separated); **K-GAAP (parent); Source: Company data, Bloomberg, CS estimates Recently added two new landbanks HDC has added two new landbanks YTD. While management expects revenues of W310 bn and W390 bn from the new landbanks, we estimate operating margin of 15% and 14% from the new landbanks, respectively. The company plans kick-off of presale of the two new in-house projects in 4Q11 and 2013, respectively.
Figure 2: HDC – net cash flow and NPV of land bank Project (W bn) 2012E 2013E 2014E 2015E 2016E TotalSuwon (phase 2) 382 382Suwon (phase 3) 59 86 88 233Suwon (phase 4) -23 41 99 113 230Suwon (land sale) 118 118 236Goyang 125 125Gimpo -32 75 97 139 278Goyang 2* -12 52 66 96 202Daejeon* -1 63 67 129Paju (land sale) 85 85 171Others -39 76 115 147 299Total 627 418 564 433 243 2,285NPV(WACC: 9.1%) 627 383 474 333 172 1,989*Newly built-up landbanks in 1H11. Note: We expect net cash flow of W524 bn from Busan and Suwon (phase 1-2) projects in 2011E; Source: Credit Suisse estimates Reduce our SOTP TP from W34,000 to W33,000 We cut our 2011E and 2012E net profit by 21% and 9%, respectively. While we revise 2011-12E operating profit by -16% and +5% on write-down expense of W70 bn and new landbank build-ups, we have also reflected bigger-than-expected net interest cost in 1H11 and the impact of full implementation of IFRS separated accounting (exclusion of equity method gains, etc.) in our non-operating income/expense estimates. We also reduce our SOTP-based target price from W34,000 to W33,000.
Figure 3: HDC – SOTP valuation (W bn) New Old Rationales on NAVNPV of land bank 1,989 1,789 DCF for in-house projectsOther businesses 921 839 7.5x 2012E EBITDAInvestment assets 434 453 CS estimates ref. MV/BVOther land banks 343 343 0.7x Dec. 2010 BVDisposable property assets 129 129 0.7x Dec. 2010 BVPotential further write-downs -38 -58 10% of PF loan guaranteesNet cash* -1,317 -967 December 2011ESum of the parts 2,462 2,529 No. of outstanding shares (mn) 73.6 73.6 Ex- 1.8 mn shares in treasuryNAV per share (W) 33,000 34,000 Source: Company data, Credit Suisse estimates Ratings history (012630.KS) Date Old rating New rating Old TP New TP4 May 2011 NEUTRAL NEUTRAL W36,000 W34,0003 August 2011 NEUTRAL NEUTRAL W34,000 W33,000
Price (03 Aug 11, W) 29,950TP (prev. TP W) 33,000 (34,000) Est. pot. % chg. to TP 1052-wk range (W) 40200.0 - 24800.0Mkt cap (W/US$ bn) 2,257.8/ 2.1
Bbg/RIC 012630 KS / 012630.KS Rating (prev. rating) N (N) Shares outstanding (mn) 75.38 Daily trad vol - 6m avg (mn) 0.5 Daily trad val - 6m avg (US$ mn) 15.8 Free float (%) 56.6 Major shareholders MG Chung 13.3%
Performance 1M 3M 12MAbsolute (%) (5.5) (10.5) 10.1Relative (%) (1.8) (5.2) (5.3)
Year 12/09A 12/10A 12/11E 12/12E 12/13ERevenue (W bn) 2,163 2,674 3,093 2,755 2,655EBITDA (W bn) 158.3 243.7 428.0 276.0 198.7Net profit (W bn) 49.2 106.8 256.8 150.6 110.2EPS (W) 668 1,452 3,490 2,047 1,498- Change from prev. EPS (%) n.a. n.a. (21) (9) (8)- Consensus EPS (W) n.a. n.a. 4,112 3,340 3,309EPS growth (%) (78.4) 117.2 140.4 (41.4) (26.8)P/E (x) 44.8 20.6 8.6 14.6 20.0Dividend yield (%) 1.3 1.4 1.2 0.7 1.4EV/EBITDA (x) 21.1 14.3 8.4 10.9 13.5P/B (x) 1.0 0.9 0.9 0.8 0.8ROE (%) 2.1 4.6 10.2 5.6 3.9Net debt (cash)/equity (%) 47.5 51.5 50.1 26.8 15.2 Note 1: The company established in 1976. It has operations in various business areas like civil works, architectural works and plants. It is a full service engineering and construction company.

Thursday, 04 August 2011
Asian Daily
- 20 of 34 -
Samsung Engineering Co Ltd ------------------------------------------- Maintain OUTPERFORM Little room for a positive surprise in 2011 new orders EPS: ▼ TP: ▼ Minseok Sinn / Research Analyst / 822 3707 8898 / [email protected] Hayoung Chung / Research Analyst / 822 3707 3795 / [email protected]
● Whereas we anticipated Samsung Engineering to secure at least one of the three bids in the Jubail petrochem complex project (P1, P2/3 and P4/5), Daelim Industrial is reportedly very close to sweeping all the three bids (worth c.US$1.9 bn on aggregate).
● We completely understand that no company can win every bid (no matter how good it is), while the management’s 2011 new order guidance of W14.0 tn still seems reasonable.
● However, the disappointing bidding result of the Jubail project now leaves only a little room for a positive surprise in the company’s 2011 new orders, in our view. We reduce our 2011 new order estimates from W14.5 tn to W14.0 tn and revise down our 2011-12 net profit estimates by 0.4% and 2%, respectively.
● We reduce TP to W270,000 by lowering target 2012E EV/EBITDA multiple from 12x to 11x. While anticipation of positive surprise in new orders was a key justification for the prior target multiple with higher valuation premiums, we partly withdraw valuation premiums as we now see little room for a positive surprise.
Both P2/3 and P4/5 of Jubail integrated petrochemicals complex project seem to have gone to Daelim Industrial
According to MEED’s report on 2 August, Daelim Ind is very close to being awarded both P2/3 and P4/5 of the Jubail integrated petrochemical complex project in Saudi Arabia (worth c.US$1.0 bn on aggregate), one of the biggest plant works in the ME in 2011, on top of the company’s recent official order award of US$920 mn from P1 of the same project. While we previously anticipated Samsung Engineering securing at least one of the three bids (P1, P2/3 and P4/5) given its strong track record with Saudi Aramco (one of the owners of the 50:50 JV project) in recent years, the news report is obviously disappointing (although bidding result remains to be officially finalised). Meanwhile, Samsung Eng was also recently defeated in the Yanbu III sea water desalination plant project bid by an Italian contractor, according to MEED.
The disappointing defeat now leaves only little room for a positive surprise in 2011 new orders, in our view
While we previously expected 2011E new orders of W14.5 tn (versus W9.0 tn in 2010), which was slightly higher than management’s 2011 new order guidance of W14.0 tn, expectations for orders from the Jubail project have constituted a considerable part for the anticipation for the positive surprise. We completely understand that no company can win every bid (no matter how good it is) and the management’s 2011 new order guidance still seems reasonable, while it estimates aggregated bid value of about US$33 bn in 2H11 currently, in which the company currently bids for US$13 bn or plans to bid for US$20 bn before the end of 2011. However, the disappointing result of the Jubail project bids now leaves only little room for a positive surprise in the company’s 2011 new orders, in our view. We reduce 2011E new orders from W14.5 tn to W14.0 tn.
Figure 1: Samsung Eng – major overseas bids in 2011 SizeProject Country Project owner (US$ bn, E)Shaybah NGL plant* Saudi Arabia Saudi Aramco 2.7Ras Az Zawr aluminium complex* Saudi Arabia Madden/Alcor 1.0Wasit gas plant* Saudi Arabia Saudi Aramco 0.6West Qurna GOSP** Iraq n.a 0.8Gas field development** Uzbekistan n.a 0.8Balkhasg power plant** Kazakhstan Samruk-Energo 2.2Musafa steel plate plant UAE Emirate Steel Inc. 1.0Wara pressure maintenance Kuwait KOC 1.5Alexandria ethylene cracker Egypt Echem 0.7GOSP Indonesia n.a 0.4Fertilizer plant India n.a n.a*Official, **Effectively/almost secured already, according to management. Source: Company data, Credit Suisse estimates Reduce target price to W270,000 from W300,000 We revise down our 2011-12 net profit estimates by 0.4% and 2%, reflecting the reduction in the new order projections, and also reduce our target price from W300,000 to W270,000 by lowering our target 2012E EV/EBITDA multiple from 12x to 11x. While anticipation for a positive surprise in new orders has been a key justification for the previous target multiple with higher valuation premiums, we withdraw part of the valuation premiums as we now see only little room for a positive surprise in 2011E new orders. However, we maintain our OUTPERFORM rating, as the reduced target price still suggests an implied upside of 13% after the stock's recent correction.
Rating history (028050.KS) Date Old rating New rating Old TP New TPJul 25, 2011 OUTPERFORM OUTPERFORM W250,000 W300,000Aug 3, 2011 OUTPERFORM OUTPERFORM W300,000 W270,000As of close of business 2 August 2011, Credit Suisse Securities (Europe) Limited, Seoul Branch performs the role of liquidity provider on the warrants of which underlying assets are Daelim Ind/ Samsung Eng and holds 6,668,750/ 6,278,320 of warrants concerned. These may be covered warrants that constitute part of a hedged position.
Price (03 Aug 11, W) 238,500TP (prev. TP W) 270,000 (300,000) Est. pot. % chg. to TP 1352-wk range (W) 280500.0 -
125000.0Mkt cap (W/US$ bn) 9,540.0/ 9.0
Bbg/RIC 028050 KS / 028050.KS Rating (prev. rating) O (O) Shares outstanding (mn) 40.00 Daily trad vol - 6m avg (mn) 0.2 Daily trad val - 6m avg (US$ mn) 46.4 Free float (%) 78.8 Major shareholders Cheil Industries
13.1% Performance 1M 3M 12MAbsolute (%) (7.4) 9.4 83.5Relative (%) (3.0) 13.2 68.0
Year 12/09A 12/10A 12/11E 12/12E 12/13ERevenue (W bn) 3,471 4,799 8,390 10,422 12,463EBITDA (W bn) 333 454 698 852 1,043Net profit (W bn) 258.9 369.6 492.0 608.7 767.9EPS (W) 6,828 9,998 13,307 16,466 20,772- Change from prev. EPS (%) n.a. n.a. 0 (2) 0- Consensus EPS (W) n.a. n.a. 13,122 16,804 19,972EPS growth (%) 37.4 46.4 33.1 23.7 26.2P/E (x) 34.9 23.9 17.9 14.5 11.5Dividend yield (%) 0.8 1.4 1.8 2.2 2.8EV/EBITDA (x) 25.5 19.2 12.8 10.2 7.9P/B (x) 12.3 9.5 7.3 5.3 3.9ROE (%) 38.7 41.6 42.7 39.2 36.2Net debt(cash)/equity (%) (134.4) (83.2) (45.8) (46.3) (52.3) Note 1: Samsung Engineering Co., Ltd. is a Korea-based construction company. The company operates its business under three segments: petrochemical plant, industrial plant and environment.

Thursday, 04 August 2011
Asian Daily
- 21 of 34 -
Shinhan Financial Group-------------------------------------------------- Maintain OUTPERFORM 2Q11 recap: Strong PPOP growth with benign credit cost EPS: ◄► TP: ◄► Sokmo Yun / Research Analyst / 822 3707 3763 / [email protected] Hyewon Cho / Research Analyst / 82 2 3707 3737 / [email protected]
● On 3 August (after market close), SFG released stronger-than-expected 2Q results with its net profit at W964.8 bn, which was stronger than consensus estimate of W905 bn.
● SFG’s PPOP increased by 8.4% QoQ, driven by stronger-than-peer loan growth (3.7% QoQ) and 2 bp NIM increase. For 2H, since SFG already achieved 4.7% YTD loan growth during 1H11 (versus management target of 6.3% for 2011), it will likely enjoy more leisure in managing both LDR and NIM, in our view.
● As expected, the group’s credit cost normalised back from the lower base of 1Q11 (61 bp for 2Q11 vs 39 bp for 1Q), but overall asset quality continues to be benign with a 21.8% QoQ fall in banks’ new NPL formation (net of write-back) as well as improved NPL and coverage ratio.
● We expect growth in SFG’s PPOP given the resilient loan growth and as margin stands out among Korea banks. We maintain OUTPERFORM on the stock with target price of W66,000.
SFG’s PPOP up 8.4% QoQ on strong loan growth, resilient margin SFG’s PPOP increased by 8.4% QoQ. The group’s and bank’s net interest incomes increased by 3.8% and 2.5% QoQ, respectively. Shinhan bank’s loan growth was stronger-than-peers at 3.7% QoQ and 4.7% YTD (Household 3.3% QoQ and 3.8% YTD, and Corp 4.0% QoQ and 5.5% YTD). Since the bank’s deposit growth was flat QoQ, bank’s LDR increased to 101.8% from 97% a quarter ago. However, according to management, LDR came down to 100% in July. SFG’s NIM edged up by 2 bp QoQ to 3.65%, but the bank’s NIM remained at 2.27%. In terms of loan growth and margin outlook, since Shinhan bank achieved (stronger-than-peer) 4.7% YTD loan growth during 1H11 (vs official loan growth target of 6.3% for 2011), the bank will likely slow loan growth, presumably resulting in less pressure on liquidity and margin outlook relative to peer group. In terms of non-interest income, excluding one-off items (W352.3 bn of pre-tax gain
from the sale of Hyundai E&C stake in 2Q11), SFG’s non-interest income was rather disappointing with a 15.9% QoQ fall amid sluggish market. The group’s cost-income remained at 38.8% (vs 38.7% in 1Q). SFG’s credit cost normalised back to 61 bp vs 39 bp for 1Q with benign asset quality As expected, the group’s credit cost normalised back from the lower base of 1Q11 from the one-off write-back during 1Q11. Group credit cost rebounded to around 61 bp for 2Q 2011 vs 39 bp for 1Q, but it came in slightly higher than management guidance of 50-55 bp for 2Q. However, group and bank NPL ratio fell to 1.42% and 1.28%, down 20 and 25 bp QoQ, respectively. Group and bank NPL coverage ratio also improved to 147% and 141%, up 16 p.p. and 19 p.p. QoQ, respectively. We believe this is largely due to the increased write-off and sale (W615 bn in 2Q11 vs W240 bn in 1Q11) and the aforementioned NPL write-back during the quarter. In terms of underlying asset quality, bank's delinquency ratio remained similar to 1Q (0.77% vs 0.76% a quarter ago), but credit card delinquency ratio edged up slightly to 1.89% vs 1.84% a quarter ago.
Figure 1: SFG - 2Q11 results summary Consolidated
K-GAAP K-IFRS K-GAAP (W bn) 2Q10 1Q11 2Q11 2010A 2011ENet interest income 2,009.0 1,714.1 1,779.8 8,086.5 8,372.0Non interest income 16.5 679.1 761.0 484.0 464.8SG&A costs 835.9 903.9 996.4 3,594.8 3,873.4Pre-provision profit 1,189.6 1,489.2 1,544.3 4,975.7 4,963.4Loan-loss provision 303.4 232.0 271.8 1,117.5 1,271.7Operating income 886.1 1,257.2 1,272.6 3,858.2 3,691.8Non-operating income -0.2 12.8 8.9 -146.4 191.7Tax and others 297.5 345.7 316.6 1,327.8 796.2Net profit after tax 588.5 924.3 964.8 2,383.9 3,087.3Gross loans 172,271 183,232 187,853 178,484 178,339Net interest margin 3.47% 3.63% 3.65% 3.43% 3.57%Equity-to-asset 5.5% 9.0% 9.5% 6.1% 6.1%Tier 1 capital ratio 8.6% 8.7% 8.9% 8.9% 9.4%ROA 0.89% 1.36% 1.37% 0.90% 1.15%ROE 11.0% 16.1% 16.0% 11.0% 13.0%Asset quality 1) NPL ratio 1.35% 1.54% 1.30% 1.13% 0.82%Precautionary loan ratio 1.77% 1.36% 1.28% 1.62% 1.30%New NPLs 580.0 545.1 426.2 497.6 1,249.9New precautionary loans 917.3 424.3 341.9 775.0 818.3LLP / avg. credit 0.89% 0.42% 0.49% 0.68% 0.68%LLR / NPLs 133.8% 121.6% 139.1% 152.9% 198.5%SME delinquency ratio 2) 0.81% 1.49% 1.20% 0.86% n.a.1) Shinhan Bank + Jeju Bank. 2) Shinhan Bank only. Source: Company data, Credit Suisse estimates. Source: Company data, Credit Suisse estimates. Ratings history (055550 KS) Date Old rating New rating Old TP New TPJan. 4, 2011 OUTPERFORM OUTPERFORM W62,000 W66,000As of close of business 2 August 2011, Credit Suisse Securities (Europe) Limited, Seoul Branch performs the role of liquidity provider on the warrants of which underlying asset is SFG and holds 13,126,880 of warrants concerned. These may be covered warrants that constitute part of a hedged position. Credit Suisse is acting as financial advisor to the Share Management Council on the potential sale of their collective stake in Hynix Semiconductor. The Share Management Council is composed of the following companies: Korea Exchange Bank; Woori Bank; Korea Development Bank; Shinhan Bank; Resolution & Finance Corp; National Agricultural Cooperative Federation; SH Asset Management; Daewoo Securities; and, Woori Investment and Securities.
Price (03 Aug 11 , W) 49,000TP (prev. TP W) 66,000 (66,000) Est. pot. % chg. to TP 3552-wk range (W) 53800.0 - 41950.0Mkt cap (W/US$ bn) 23,235.8/ 21.9
Bbg/RIC 055550 KS / 055550.KS Rating (prev. rating) O (O) Shares outstanding (mn) 474.20 Daily trad vol - 6m avg (mn) 1.8 Daily trad val - 6m avg (US$ mn) 83.4 Free float (%) 73.5 Major shareholders Aggregated Korean-
Japanese; 15.1%, BNP Paribas; 6.35%
Performance 1M 3M 12MAbsolute (%) (5.6) (6.1) 0.8Relative (%) (1.9) (0.9) (14.6)
Year 12/08A 12/09A 12/10E 12/11E 12/12EPre-prov Op profit (W bn) 4,533.0 4,205.6 4,885.1 4,968.4 5,211.0Net profit (W bn) 2,645 1,918 3,218 2,861 2,963EPS (CS adj. W) 6,677 4,046 6,787 6,033 6,249- Change from prev. EPS (%) n.a. n.a. 0 0 0- Consensus EPS (W) n.a. n.a. 4,451 6,329 6,607EPS growth (%) (12.6) (39.4) 67.8 (11.1) 3.6P/E (x) 7.3 12.1 7.2 8.1 7.8Dividend yield (%) 0 0.8 1.4 2.2 3.1BVPS (CS adj. W) 35,847 36,534 39,934 45,968 52,217P/B (x) 1.37 1.34 1.23 1.07 0.94ROE (%) 14.6 9.8 14.7 11.9 11.0ROA (%) 1.1 0.7 1.2 1.1 1.1Tier 1 Ratio (%) 9.3 11.6 13.6 14.8 16.0 Note 1: ORD/ADR=2.00. Note 2: Shinhan Financial Group Co., Ltd. is a Korea-based financial holding company engaged in the management of subsidiaries. The company, through its subsidiaries and affiliated companies, is involved in banking, credit card, securities, asset management, insurance and leasing businesses.

Thursday, 04 August 2011
Asian Daily
- 22 of 34 -
SK Broadband------------------------------------------------------------------------ Maintain NEUTRAL Mixed bags for 2Q11 results EPS: ◄► TP: ◄► Jeff Kahng / Research Analyst / 822 3707 3738 / [email protected] Jihong Choi / Research Analyst / 82 2 3707 3796 / [email protected]
● SKBB reported 2Q11 results that are generally in line with our expectations. For 2Q11, the company reported revenue of W557 bn with OP of W18.8 bn and net loss of W1.2 bn.
● Although there was positive revenue growth from corporate data business, its core broadband and telephony revenue remained flattish due to large discounts provided to bundling subscribers. The company, however, believes large bundling subscribers lower its churn rate and, hence, reduce marketing costs to improve its mid-to-longer term profitability.
● Although the company insists that it is turning net profit positive on parent basis, it is unlikely for SKBB to turn net profit positive on a consolidated basis in 2011 unless there is further restructuring of its money-losing media affiliates.
● We maintain our NEUTRAL rating on the counter with target price of W4,800 based on target 2011E EV/EBITDA of 4.0x.
Key highlights from 2Q11 results Positive surprise on top-line growth: SKBB posted rather strong revenue growth of 8.4% YoY and 7.1% QoQ. This was driven by strong growth of corporate data revenue that was up 33.1% YoY and 28.2% QoQ to W118 bn (21% of total revenue). The company has focused on offering diverse corporate data services as well as signing up large corporate accounts including Sejong City and Korea Financial Clearing Institutes. It was also believed large internal demand from SK Group helped generate higher revenue in corporate data services.
ARPU trend: However, the company’s ARPU for broadband and telephony remained weak. This is driven by large discounts provided to bundling subscribers as mobile/ fixed-line bundling (SKT/SKBB) subs reached 1.51 mn (29.4% of total bb sub) in 2Q11, up from 1.44 mn in 1Q11.
Margin trend: The company’s margin stayed flattish with EBITDA margin of 24.3% and OP margin of 3.4%. The marketing cost was up
19.0% QoQ, but down 3.2% YoY as SKBB focused on cross-selling with SKT as well as adding additional corporate client base. However, all other OPEX items remained stable. Earnings outlook The company insists that it is on track to show continuous improvement in its earnings with positive net profit for 2011 on a K-IFRS parent-only basis. In terms of consolidated, it may look slightly more difficult for SKBB to hit net profit positive for 2011 due to larger losses from affiliates such as Broad & Media (IPTV content aggregator). However, depending on upcoming restructuring of media operations among SK group companies, SKBB could see its money losing operations merge with different entities in the SK group that would help turn around its consolidated net earnings.
Figure 1: SK Broadband 2Q11 earnings results (K-IFRS consolidated) 2Q11 results Previous results 2011E (W bn) Actual CS Cons. 1Q11 QoQ 2Q10 YoY CS Cons.Sales 557.3 523.4 549.8 520.2 7.1% 514.4 8.3% 2,139 2,232 Broadband 244.0 244.5 -0.2% 249.3 -2.1% 997 IPTV 36.5 33.7 8.3% 30.1 21.3% 68 Voice 148.8 143.1 4.0% 140.3 6.1% 592 Leased line 77.5 71.6 8.2% 63.9 21.3% 298 IDC & Solutions 40.3 20.3 98.5% 24.6 63.8% 155 Others 10.2 7.0 45.7% 6.2 64.5% 30Operating profit 18.8 20.0 23.9 15.1 24.5% 7.3 158% 96 105EBITDA 135.5 136.0 140.5 132.2 2.5% 126.9 6.8% 580 569Net profit -1.2 0.0 1.8 -5.5 nm -17.1 nm 15 16EBITDA margin 24.3% 26.0% 25.6% 25.4% 24.7% 27.1% 25.5%Mkting cost/ ev 14.7% 15.2% 12.4% 15.4% 13.0%Source: Company data, FNguide, Credit Suisse estimates
Figure 2: SK Broadband quarterly operating trend 1Q10 2Q10 3Q10 4Q10 1Q11 2Q11 2011EBroadband Total subs (000) 3,879 3,909 3,926 4,002 4,053 4,111 4,397 Net adds (000) 31 31 16 76 51 58 188 Blended ARPU (W) 21,209 21,340 20,932 20,713 20,186 19,902 19,307 Voice telephony Total subs (000) 3,315 3,521 3,660 3,846 3,964 4,084 4,437 Net adds (000) 292 206 139 186 118 120 643 Blended ARPU (W) 15,064 13,683 13,063 13,483 12,158 12,269 12,297 IPTV Total subs (000) 883 893 885 948 912 911 950 Net adds (000) 27 9 (8) 63 (36) (1) 2 Blended ARPU (W) 10,714 12,039 12,834 14,642 12,573 13,835 12,500 Source: Company data, Credit Suisse estimates
Rating history (033630.KQ) Date Old rating New rating Old TP New TP2 May 2011 Underperform NEUTRAL W5,200 W4,800As of close of business on 2 Aug 2011, Credit Suisse Securities (Europe) Limited, Seoul Branch performs the role of liquidity provider on the warrants of which underlying asset is SKT and holds 12,680,170 of warrants concerned. These may be warrants that constitute part of a hedged position.
Price (02 Aug 11, W) 4,510.00TP (prev. TP W) 4,800 (4,800) Est. pot. % chg. to TP 652-wk range (W) 5890.0 - 3960.0Mkt cap (W/US$ bn) 1,334.8/ 1.3
Bbg/RIC 033630 KS / 033630.KQ Rating (prev. rating) N (N) Shares outstanding (mn) 295.96 Daily trad vol - 6m avg (mn) 1.0 Daily trad val - 6m avg (US$ mn) 4.1 Free float (%) 49.4 Major shareholders SK Telecom, 50.56%
Performance 1M 3M 12MAbsolute (%) 9.3 3.0 (15.5)Relative (%) (0.6) (2.4) (27.2)
Year 12/09A 12/10A 12/11E 12/12E 12/13ERevenue (W bn) 1,894 2,138 2,139 2,164 2,238EBITDA (W bn) 299.4 452.5 579.5 629.1 675.0Net profit (W bn) (191.2) (119.4) 14.7 56.2 77.6EPS (W) (732) (403) 50 190 262- Change from prev. EPS (%) n.a. n.a. 0 0 0- Consensus EPS (W) n.a. n.a. 169 348 480EPS growth (%) n.m. n.m. n.m. 283.1 38.2P/E (x) n.m n.m 91.0 23.8 17.2Dividend yield (%) 0 0 0 0 5.5EV/EBITDA (x) 8.0 5.3 4.0 3.6 3.3P/B (x) 0.8 1.0 1.0 1.0 1.0ROE (%) (13.6) (8.6) 1.1 4.1 5.6Net debt(cash)/equity (%) 76.3 76.7 71.5 66.2 63.8 Note 1: SK Broadband Co., Ltd. is a Korea-based company engaged in the provision of telecommunications services. The company operates in two business segments: phone and enterprise data service segment and high speed Internet service segment.

Thursday, 04 August 2011
Asian Daily
- 23 of 34 -
Woongjin Coway Co Ltd --------------------------------------------------- Maintain OUTPERFORM Stronger than expected sales may prove demand for environment electronics market EPS: ▼ TP: ▲ Sonia Kim / Research Analyst / 822 3707 3764 / [email protected]
● Our general impression of 2Q11 was positive. Sales exceeded expectation from higher-than-expected net adds of subscriptions. The OP margins weakened due to labour costs, accounting change in sales commissions and marketing for cosmetics.
● We lower FY11 and FY12 EPS by 8%, respectively. We raise our sales estimates and increase the commission rates and potential marketing costs that are likely to remain high till 2012. We raise TP to W46,000 (from W43,000) as we roll over earnings basis to 2012 end.
● Catalysts: (1) net adds of subscriptions trend is the leading indicator of its future cashflow; (2) sustainability in China cosmetics business; (3) its domestic cosmetics business increase market share and profitability; and (4) inflection in the environment electronics margins as it digests the accounting change overhang.
● We reiterate our OUTPERFORM rating. We believe Woongjin poses an attractive combination of solid cash flows and growth. It holds strong execution in the environment electronics business, which appears to post solid growth as consumers become increasingly conscious of the environment and health.
Strong demand proven again in 2Q11 Woongjin’s 2Q11 sales were better than expected. Sales increased 19% YoY from strong rental and one-time sales of environment electronics. The water purifier market grew strongly in 2Q. This was led partly by low-end product introductions by competitors that sold largely via homeshopping channels. Nevertheless, Woongjin surpassed market growth by rolling out higher-functionality water purifiers, reducing cancellation ratios and increasing product per customer numbers. We also believe the general consumers’ concern for health and environment are leading to strong sales of this market.
The margins fell short of CS expectations. We note the major business model of Woongjin is to collect the rental over five years. The newly-added subscription breaks even in about one year. Hence, when there are higher net adds, the margins weaken in the year. On the flip side, the margins improve largely in the following years. Other reasons for weak margins were: (1) The new IFRS accounting
shortens the amortisation period of the sales commissions to the codies. This has fallen to 24 months from the previous 60 months. (2) High marketing costs as it is still in the early stage of its cosmetics business. Management stressed the marketing costs will be rationalised in 2H and onwards. (3) Labour costs rose from new hires for the new businesses, and as a surge in net adds led to higher sales commissions.
Figure 1: 2Q11 results (W bn) K-IFRS 2Q11 QoQ YoY gr 1H11 YoY grTotal sales 435.9 9.0% 19.3% 835.7 14.4% Rental related 339.6 3.8% 9.9% 666.7 9.2% One-time 38.8 22.0% 57.1% 70.6 37.4% Cosmetics 17.9 2.9% n.a. 35.3 n.a. Exports 22.9 25.1% 33.1% 41.2 19.4%Gross profit 294.5 8.5% 19.8% 566.0 16.1% Rental related 244.8 5.5% 9.0% 476.9 8.3% One-time 25.4 17.6% 62.8% 47.0 35.8% Cosmetics 14.5 0.0% n.a. 29.0 n.a. Exports 5.1 41.7% 30.8% 8.7 14.5%Operating profit 61.8 9.4% -18.7% 118.2 65.8%Recurring profit 55.1 9.2% -27.5% 105.5 38.9%Net profit 42.1 8.5% -28.9% 80.8 36.6%Margins and changes GP margin 67.6% -0.3pp 0.2pp 67.7% 1pp Rental related 56.2% -1.9pp -5.3pp 57.1% -3.2pp One-time 5.8% 0.4pp 1.6pp 5.6% 0.9pp Cosmetics 3.3% -0.3pp n.a. 3.5% n.a. Exports 1.2% 0.3pp 0.1pp 1.0% 0ppOP margin 14.2% 0pp -5.3pp 14.1% 4.4ppRecurring margin 12.6% 0pp -8.2pp 12.6% 2.2ppNet margin 9.7% 0pp -6.5pp 9.7% 1.6ppSource: Company data Lower EPS but increase target price We lowered our FY11 and FY12 EPS by 8%. This is largely to reflect the higher sales commissions from accounting changes and marketing in cosmetics that may sustain till next year. However, we raise our TP to W46,000 as we roll over our earnings basis to end FY12 (16x P/E).
Figure 2: Earnings revision summary (W bn) 2011E 2012E Before After change (%) Before After change (%)Total sales 1,664.4 1,690.4 1.6% 1,806.3 1,822.6 0.9%Operating profit 243.9 237.7 -2.5% 290.4 270.0 -7.0%EBITDA 412.5 407.3 -1.3% 466.0 444.3 -4.7%Net profit 200.1 183.9 -8.1% 237.5 219.3 -7.6%Source: Credit Suisse estimates
Rating history (021240 KS) Date Old rating New rating Old TP New TP21-Feb-2011 - OUTPERFORM - W43,000
Price (03 Aug 11, W) 39,200TP (prev. TP W) 46,000 (43,000) Est. pot. % chg. to TP 1752-wk range (W) 45850.0 - 31700.0Mkt cap (W/US$ bn) 3,023.3/ 2.9
Bbg/RIC 021240 KS / 021240.KS Rating (prev. rating) O (O) Shares outstanding (mn) 77.12 Daily trad vol - 6m avg (mn) 0.2 Daily trad val - 6m avg (US$ mn) 8.4 Free float (%) 70.3 Major shareholders Woongjin Holdings,
28.4%
Performance 1M 3M 12MAbsolute (%) 3.2 3.0 (6.4)Relative (%) 6.8 8.3 (21.8)
Year 12/09A 12/10A 12/11E 12/12E 12/13ERevenue (W bn) 1,412 1,519 1,690 1,823 1,974EBITDA (W bn) 352.4 384.9 407.3 444.3 491.4Net profit (W bn) 153.3 179.4 183.9 219.3 256.1EPS (W) 2,015 2,359 2,417 2,883 3,367- Change from prev. EPS (%) n.a. n.a. (8) (8) (5)- Consensus EPS (W) n.a. n.a. 2,493 2,901 3,275EPS growth (%) 16.2 17.0 2.5 19.3 16.8P/E (x) 19.5 16.6 16.2 13.6 11.6Dividend yield (%) 2.6 2.8 3.5 4.5 4.8EV/EBITDA (x) 9.1 8.5 8.5 7.8 7.0P/B (x) 4.4 3.9 4.5 4.0 3.5ROE (%) 24.0 24.8 25.6 30.8 31.6Net debt(cash)/equity (%) 29.5 34.5 64.5 57.3 48.7 Note 1: Coway has promoted a healthy and comfortable life for consumers as its meaning suggest; always together. Coway products include air purifiers, water filtration devices, digital bidets, megasonic cleaning devices and other well-being home appliances.

Thursday, 04 August 2011
Asian Daily
- 24 of 34 -
Taiwan Taiwan Market Strategy--------------------------------------------------------------------------------------- New report: Portfolio tracker Chung Hsu, CFA / Research Analyst / 8862 2715 6362 / [email protected] Randy Abrams, CFA / Research Analyst / 886 2 2715 6366 / [email protected] Michelle Chou, CFA / Research Analyst / 886 2 2715 6363 / [email protected] Josette Chang / Research Analyst / 886 2 2715 6367 / [email protected]
● We are publishing monthly portfolio tracker to track the relative portfolio weightings of qualified foreign institutions (QFIIs) and domestic investment trusts (ITCs). We aim to identify sectors that are extreme overweight and/or underweight versus their historical weighting. The tracker this month supports our Taiwan positioning to add weighting in under-owned PCs and handsets following a pullback, and reduce from the crowded consumer space.
● Retail sector is the largest overweight by both QFIIs and ITC, with its relative weighting at more than 2 sd above the historical average. Expectation for the sector appears to be very high, with valuations also at high levels.
● PC/NB sector is still one of the most under-owned by QFIIs, with its absolute holding near the historical low and even relative holding (versus MSCI) at below the mid-cycle average. ITCs have continued to raise their holding in the sector. Valuations on both P/E and P/B are 1 sd below the mid-cycle average.
● Handsets sector (i.e. HTC) is now much less crowded, with weak share price performance (-23%) and very pronounced institutional net selling in the last three months. When we published the first tracker in early May, the handset sector was by far the largest overweight by QFII at 2.5 sd above the historical average. Now QFII’s relative weighting is back down to 1.0 sd, a level that is far less crowded.
● Taiwan portfolio. The lower ownership of PCs provides a tailwind for our recent higher weighting in the beaten down sector, with top picks Asustek and Wistron. We recently upgraded HTC, and continue to see market sentiment getting too negative. In non-tech, we downgraded President Chain Store and see the risk of ownership coming off with any deceleration of earnings growth into 2012, and would still prefer banks and select developers where ownership is also not stretched.
● For the full version of this note, click here. Figure 1: Historical QFII and ITC weightings in the overall tech sector
35%
45%
55%
65%
75%
85%
Jan-01 Jan-02 Jan-03 Jan-04 Jan-05 Jan -06 Jan -07 Jan-08 Jan-09 Jan-10 Jan -11
QFII - Overa ll Tech ITC - Overall Tech
Source: TEJ, Credit Suisse
Figure 2: The retail sector is now the largest overweight with the relative weightings of both QFII and ITC hitting 2 sd above the historical average
-0.2%
0.1%
0.4%
0.7%
1.0%
Jul-01 Jul-03 Jul-05 Jul-07 Jul-09 Jul-11
Retail Average +1 std-1 std +2 std -2 std
QFII relative weighting in Retail
-1.2%
-1.0%
-0.8%
-0.6%
-0.4%
-0.2%
0.0%
Jul-01 Jul-03 Jul-05 Jul-07 Jul-09 Jul-11
Retail Average +1 std-1 std +2 std -2 std
ITC relative weighting in Retail
Source: TEJ, Credit Suisse Research
Figure 3: QFII absolute weighting in PC/NB remains one of the most underweighted while local ITCs have been adding exposure
7%9%
11%13%15%17%19%21%23%
Jul-01 Jul-03 Jul-05 Jul-07 Jul-09 Jul-11
PC / NB / MB / EMS Average+1 std -1 std+2 std -2 std
QFII absolute weighting in PC / NB
0%
4%
8%
12%
16%
20%
Jul-01 Jul-03 Jul-05 Jul-07 Jul-09 Jul-11
PC / NB / MB / EMS Average+1 std -1 std+2 std -2 std
ITC absolute weighting in PC / NB
Source: TEJ, Credit Suisse Research
Figure 4: QFII’s weighting at handset sector has seen noticeable decline with QFII’s relative weighting now at 1 sd above average
-2%
-1%
0%
1%
2%
Jul-05 Jul-07 Jul-09 Jul-11
Handset Average +1 std-1 std +2 std -2 std
QFII relative weighting in Handset
-2%
0%2%
4%6%
8%10%
12%
Jul-05 Jul-07 Jul-09 Jul-11
Handset Average +1 std-1 std +2 std -2 std
ITC relative weighting in Handset
Source: TEJ, Credit Suisse Research

Thursday, 04 August 2011
Asian Daily
- 25 of 34 -
Formosa Chemical & Fibre ----------------------------------------------- Maintain OUTPERFORM Low base in 2Q11 EPS: ▼ TP: ▼ Sidney Yeh / Research Analyst / 886 2 2715 6368 / [email protected] David Liao / Research Analyst / 8862 2715 6342 / [email protected] Grace Li / Research Analyst / 886 2 2715 6353 / [email protected]
● After light demand for polyester/polymer, we see sentiment improving in the sector. In the textile food chain, demand for PTA is increasing as we move into the high season in late 3Q. The recent regional disruptions in Chinese PX factories are expected to provide a solid base for PX price.
● Formosa Chemical & Fibre (FCFC) reported its preliminary results, with a 41% QoQ decline in operating profit due to a high base and weakening ABS/PTA/SM profitability, in our view. As the price of PTA/SM bottoms out, we expect its earnings momentum to accumulate on higher seasonality. Robust margin spread in phenol should also serve as a solid support for its earning.
● We reduce our 2011 EPS forecast for FCFC to NT$9.4 to reflect weak profitability from FPCC and factor in one-month production suspension in 2H11 at its Mailiao facility. We lower our target multiple to address the uncertainties and derive our target price at NT$113.9.
● Profit expectations on its key products are relatively low (PTA/SM). Following the share price correction, we believe the risk-reward looks attractive now with a 9% dividend yield for 2011E/2012E (accrual basis).
Solid margin on PTA After light demand for polyester/polymer, we see sentiment improving in the sector. In the textile food chain, demand for PTA (purified terephthalic acid) is increasing as we move into the high season in late 3Q. The recent regional disruptions in Chinese Para-Xylene (PX) factories are expected to provide a solid base for PX price. With stabilised feedstock prices and better demand, we hold our positive outlook on PTA price in 2H11. Effects from PTA supply additions should reduce due to the tight/insufficient supply of feedstock PX supply, in our view.
Figure 1: PTA cash spread recovering Breakdown of PTA Costs and Margin
0
200
400
600
800
1,000
1,200
1,400
1,600
Feb-
01
Aug-
01
Feb-
02
Aug-
02
Feb-
03
Aug-
03
Feb-
04
Aug-
04
Feb-
05
Aug-
05
Feb-
06
Aug-
06
Feb-
07
Aug-
07
Feb-
08
Aug-
08
Feb-
09
Aug-
09
Feb-
10
Aug-
10
Feb-
11
(US$/ton)
Purified Terephthalic Acid(PTA) Costs: Acetic Acid Purified Terephthalic Acid(PTA) Costs: Para-Xylene(PX)PTA Spread Purified Terephthalic Acid(PTA) Price
Source: TEJ, Bloomberg, Credit Suisse estimates Phenol profit stays strong We remain positive on the strong profitability of propylene derivates (phenol) due to robust demand riding on the lucrative margin of caprolactam (CPL) and light downstream inventories. However, after holding a bullish view on acrylonitrile-butadiene-styrene (ABS) for the first quarter, we now hold a conservative view on ABS as the destocking will likely be sustained until end-3Q. Margin spread of ABS has been softening since April, given the price rallies of feedstock, including butadiene and AN. We believe weakness in margin will remain in 3Q11E before destocking ends. 2Q11 should be the trough Formosa Chemical & Fibre reported its preliminary results with a 41% QoQ decline in operating profit due to the high base and weakening ABS/PTA/styrene (SM) profitability, in our view. As the price of PTA/SM bottoms out, we expect its earnings momentum to accumulate on higher seasonality. Robust margin spread in phenol should also serve as a solid support to its earnings. Market expectations are relative low Following the significant share price correction in the past few days, valuation appears decent as FCFC now trades at 1.8x book value (mid-end of the historical band). We reduce our 2011 EPS forecast for FCFC to NT$9.4 to reflect weak profitability from FPCC and factor in a one-month production suspension in 2H11 at its Mailiao facility. We lower our target multiple to 2.3x to address the uncertainties and derive our new target price at NT$113.9. Profit expectations on its key products are relatively low (PTA/SM), in our view. Following the share price correction, we believe the risk-reward looks attractive now with a 9% dividend yield for 2011E/2012E (accrual basis). Figure 2: Formosa Chemical & Fibre—historical P/B band
020406080
100120140
Jan-
05Ap
r-05
Jul-0
5O
ct-0
5Ja
n-06
Apr-
06Ju
l-06
Oct
-06
Jan-
07Ap
r-07
Jul-0
7O
ct-0
7Ja
n-08
Apr-
08Ju
l-08
Oct
-08
Jan-
09Ap
r-09
Jul-0
9O
ct-0
9Ja
n-10
Apr-
10Ju
l-10
Oct
-10
Jan-
11Ap
r-11
Jul-1
1
(NT$/share) Share price 1 x 1.5 x 2 x 2.5 x2.5X
2.0X
1.5X
1.0X
Source: TEJ, Credit Suisse estimates
Price (02 Aug 11, NT$) 90.40TP (prev. TP NT$) 113.90 (126.20) Est. pot. % chg. to TP 2652-wk range (NT$) 119.0 - 70.0Mkt cap (NT$/US$ bn) 514.4/ 17.8
Bbg/RIC 1326 TT / 1326.TW Rating (prev. rating) O (O) Shares outstanding (mn) 5,690.47 Daily trad vol - 6m avg (mn) 10.2 Daily trad val - 6m avg (US$ mn) 37.8 Free float (%) 75.0 Major shareholders Wang Family and
associates (about 22%)
Performance 1M 3M 12MAbsolute (%) (13.9) (17.4) 27.9Relative (%) (12.1) (13.4) 19.4
Year 12/09A 12/10A 12/11E 12/12E 12/13ERevenue (NT$ mn) 219,729 283,121 286,102 306,271 307,898EBITDA (NT$ mn) 24,196 37,204 41,402 43,761 40,688Net profit (NT$ mn) 29,440 47,275 53,215 55,202 54,046EPS (NT$) 5.2 8.3 9.4 9.7 9.5- Change from prev. EPS (%) n.a. n.a. (2) 1 - Consensus EPS (NT$) n.a. n.a. 9.6 10.1 10.7EPS growth (%) 368.7 60.6 12.6 3.7 (2.1)P/E (x) 17.5 10.9 9.7 9.3 9.5Dividend yield (%) 5.0 8.3 8.8 9.1 8.9EV/EBITDA (x) 22.3 13.5 12.0 11.2 11.8P/B (x) 2.2 1.9 1.8 1.8 1.7ROE (%) 14.4 18.8 19.2 19.3 18.3Net debt(cash)/equity (%) 10.6 (4.5) (6.2) (9.0) (12.0) Note 1: Formosa Chemicals & Fibre Corporation is principally engaged in the manufacture and sale of chemical products, plastic materials, textile products and fiber products.

Thursday, 04 August 2011
Asian Daily
- 26 of 34 -
Formosa Plastics-------------------------------------------------------------------- Maintain NEUTRAL Decent PVC outlook, but PE remains poor EPS: ▲ TP: ▼ Sidney Yeh / Research Analyst / 886 2 2715 6368 / [email protected] David Liao / Research Analyst / 8862 2715 6342 / [email protected] Grace Li / Research Analyst / 886 2 2715 6353 / [email protected]
● Following the fire accidents at Formosa’s Mailiao complex, we believe the impact will be on shortfall of investment income from FPCC (about 30% profit contribution to FPC in 1H11E). Also, FPC is required to shut down all its Mailiao chemical plants, in turn, to have safety checks in the future.
● We believe the overhang on FPC chemical plants could be for a shorter period given its better safety record in the past.
● Given sequential ethylene/propylene production suspension in Asia in 3Q11, we expect margins to recover from here. On ethylene by-products, we expect decent margin in PVC given the supply reduction in China (on power shortage). As for the PE family, we are conservative on HDPE and LLDPE as the destocking will be sustained until the end of 3Q, in our view.
● Despite FPC’s strength in 1H11, we are conservative on further mandated inspections. We assume a one-month suspension in 2H11 and revise our 2011E EPS to NT$7.8. With uncertainty on production suspension, we revise down our target P/B from 2.5x to 2.3x and target price to NT$100.2. We stay NEUTRAL on FPC.
Fire incidents affect investment income Following the fire accidents at Formosa’s Mailiao complex, we believe the impact will be on shortfall of investment income from Formosa Petrochemical (FPCC, about 30% profit contribution to Formosa Plastics in 1H11E). Also, Formosa Plastics (FPC) is required to shut down all its Mailiao chemical plants, in turn, to have safety checks in the future. We believe the overhang on FPC chemical plants could last for a shorter period this time, given its better safety record in the past. PVC margin appears favourable For ethylene by-products, we expect decent margin in PVC given the supply reduction in China (on power shortage). As for the PE family, we are lukewarm on HDPE and LLDPE as end-demand is still slow, although mild restocking is taking place on light inventory and
stabilised oil and ethylene prices. On propylene derivates, AN experienced consolidation in price on weak ABS demand in June/July. On the other hand, PP could remain weak in terms of profits, given the unchanged over-supply issue.
Figure 1: PVC margin spread improves on lower supply in China PVC Price and Margin Spread
0200400600800
1,0001,2001,400
Feb-
01M
ay-0
1A
ug-0
1N
ov-0
1Fe
b-02
May
-02
Aug
-02
Nov
-02
Feb-
03M
ay-0
3A
ug-0
3N
ov-0
3Fe
b-04
May
-04
Aug
-04
Nov
-04
Feb-
05M
ay-0
5A
ug-0
5N
ov-0
5Fe
b-06
May
-06
Aug
-06
Nov
-06
Feb-
07M
ay-0
7A
ug-0
7N
ov-0
7Fe
b-08
May
-08
Aug
-08
Nov
-08
Feb-
09M
ay-0
9A
ug-0
9N
ov-0
9Fe
b-10
May
-10
Aug
-10
Nov
-10
Feb-
11M
ay-1
1
(US$/ton)
PVC Production Costs: VCM Average PVC Margin Spread PVC Price
Source: Bloomberg, TEJ, Credit Suisse estimates Revise our 2011E EPS to NT$7.8 Formosa Group released its preliminary 2Q11 results in early July. As anticipated, the companies experienced a large sequential profit decline (down 25-51% QoQ) in 2Q11, off a very high base in 1Q11 results. Among the four companies, FPC had the least profit decline given decent core profits, especially from PVC and AN segments, in our view. Despite its strong strength in 1H11, to be conservative on further mandated inspections, we assume a month of suspension in 2H11 and we revise our 2011E EPS to NT$7.8.
Figure 2: Preliminary 2Q11E results of Formosa Plastics Unit (NT$mn) 1Q11 2Q11 YoY (%) QoQ (%) 1H/2011Sales 52,132 48,853 -3.0 -6.3 51.4%Operating profits 8,120 7,364 -6.4 -9.3 63.2%Pre-tax profits 16,883 12,627 -6.6 -25.2 55.0%Pre-tax EPS 2.76 2.06Operating margin 16% 15% Source: Company data Retain NEUTRAL with a new target price of NT$100.2 Stock price of Formosa Plastics closed with limit down over the past two days due to the fire incidents over the weekend. With uncertainty on the government’s mandatory requirement to cap its share price momentum, we revise down our target P/B from 2.5x to 2.3x and target price to NT$100.2. We maintain our NEUTRAL on FPC.
Figure 3: Formosa Plastics (1301 TT) – historical P/B band
020406080
100120140
Jan-
05Ap
r-05
Jul-0
5O
ct-0
5Ja
n-06
Apr-
06Ju
l-06
Oct
-06
Jan-
07Ap
r-07
Jul-0
7O
ct-0
7Ja
n-08
Apr-
08Ju
l-08
Oct
-08
Jan-
09Ap
r-09
Jul-0
9O
ct-0
9Ja
n-10
Apr-
10Ju
l-10
Oct
-10
Jan-
11Ap
r-11
Jul-1
1
(NT$/share) Share price 1.3 x 1.8 x 2.3 x 2.8 x
2.8x2.3x1.8x1.3x
Source: TEJ, Credit Suisse estimates
Price (02 Aug 11, NT$) 94.00TP (prev. TP NT$) 100.20 (104.20) Est. pot. % chg. to TP 752-wk range (NT$) 117.0 - 67.8Mkt cap (NT$/US$ bn) 575.4/ 19.9
Bbg/RIC 1301 TT / 1301.TW Rating (prev. rating) N (N) Shares outstanding (mn) 6,120.90 Daily trad vol - 6m avg (mn) 11.2 Daily trad val - 6m avg (US$ mn) 40.8 Free float (%) 75.0 Major shareholders Wang Family and
associates (about 20%)
Performance 1M 3M 12MAbsolute (%) (11.3) (17.2) 38.6Relative (%) (9.5) (13.1) 30.1
Year 12/09A 12/10A 12/11E 12/12E 12/13ERevenue (NT$ mn) 156,970 194,446 196,656 218,108 219,271EBITDA (NT$ mn) 21,577 36,835 34,036 30,281 30,563Net profit (NT$ mn) 27,533 45,546 47,511 44,154 46,777EPS (NT$) 4.50 7.44 7.76 7.21 7.64- Change from prev. EPS (%) n.a. n.a. 5 (8) - Consensus EPS (NT$) n.a. n.a. 8.5 9.3 10.0EPS growth (%) 30.6 65.4 4.3 (7.1) 5.9P/E (x) 20.9 12.6 12.1 13.0 12.3Dividend yield (%) 4.3 7.2 6.6 6.1 6.5EV/EBITDA (x) 26.5 14.7 16.0 17.7 17.2P/B (x) 2.6 2.2 2.2 2.1 2.0ROE (%) 13.6 18.7 18.0 16.4 16.8Net debt(cash)/equity (%) (1.5) (12.7) (11.8) (14.5) (17.1) Note 1: Formosa Plastics Corporation is primarily engaged in the manufacture and distribution of plastic products. The company operates its businesses through plastics; polyolefin; polypropylene; tairylan; chemicals; calcium carbide; and engineering and construction divisions.

Thursday, 04 August 2011
Asian Daily
- 27 of 34 -
Nan Ya Plastics --------------------------------------------------------------- Maintain OUTPERFORM Buy on weakness EPS: ▼ TP: ▼ Sidney Yeh / Research Analyst / 886 2 2715 6368 / [email protected] David Liao / Research Analyst / 8862 2715 6342 / [email protected] Grace Li / Research Analyst / 886 2 2715 6353 / [email protected]
● Affected by the fire incident in May, Nan Ya Plastics was mandated to shut down its EG facility for around a month beginning 15 June. Fewer shipments in the region have been translating into firm ASP/margin since then. With stabilising crude oil prices and robust EG demand on higher seasonality, we expect the EG margin spread to carry on its momentum into 3Q11E..
● Cotton price has been consolidating since April, with concerns over increase in new plantation area and lukewarm end demand from Chinese small textile companies. The collapse in cotton price brought down the incentives of downstream to reload before bottoming/destocking. Despite softened cotton prices, we believe limited supply in EG will sustain a favourable margin spread.
● As the refinery operation of FPCC has been shut down, our conservative assumption (two month inspections on refinery) brings down FPCC’s profit contribution to Nan Ya. As a result of recent fire accidents, we cut our 11E EPS to NT$5.5 from NT$7.2. We reduce our target multiple to 2.3x to capture uncertainties from further production reduction and reduce our target price to NT$84.8. We believe its valuation is attractive and reiterate OUTPERFORM.
Carrying the profitability momentum of EG Affected by the fire incident in May, Nan Ya Plastics was mandated to shut down its Ethylene Glycol (EG) facility for around a month beginning 15 June. Fewer shipments in the region have been translating into firm ASP/margin since then. With stabilising crude oil prices and robust EG demand on higher seasonality, we expect the EG margin spread to carry on its momentum into 3Q11E. Higher seasonality from textile demand in 3Q is also likely to support our positive view on EG. Limited impact on EG from falling cotton price Cotton price has been consolidating since April with concerns over increase in new plantation area and lukewarm end demand from Chinese small textile companies (by the cooling down measures). The
collapse in cotton price has resulted in high cost inventories for textile makers and brought down the incentives on reloading before bottoming/destocking. Despite softened cotton prices, we believe limited supply in EG will sustain a favourable margin spread. Improving profit from PCB arm alleviates weak profits from DRAM For its electronic arm, we hold a conservative view on its DRAM angle, Nan Ya Tech, and expect its losses to widen this year. However, strong profit growth (60–70% YoY) in 2011E from Nan Ya PCB due to (1) better product mixture leveraging on the high-end segment and (2) margin/yield improvements will alleviate the impact, in our view. Figure 1: Major investment income of Nan Ya Plastics NT$ mn Holding % 2010 2011E 2012E 2013ENanya Technology 33.5 (5,225) (8,383) (1,341) 671 Formosa Petrochemical 23.8 9,756 8,835 9,412 10,466 Nan Ya Printed Circuit Board 67.3 1,377 2,442 3,931 4,049 Mai-Liao Power 24.9 1,798 1,617 2,313 2,873 Nan Ya Plastics, USA 100.0 3,272 4,744 4,981 5,130 Nan Ya Plastics (HK) 100.0 6,286 6,474 7,121 7,834 PFG Fiber Glass 50.0 388 399 411 424 Hong Kong Pfg Fiber Glass 50.0 422 464 510 536 Others 1,435 1,534 1,598 1,646 Dividend income 2,018 3,150 3,050 2,798 Total 21,527 21,276 31,987 36,426 Source: Company data, Credit Suisse estimates Enter into higher season; retain OUTPERFORM Share price of Nan Ya slumped this week on the fire issue that happened in Formosa’s Mailiao complex in late July. As the refinery operation of Formosa Petrochemical (FPCC) has been shut down, our conservative assumption (two month inspections on refinery) brings down FPCC’s profit contribution to Nan Ya. As a result of fire accidents, we cut our 2011E EPS to NT$5.5 from NT$7.2. We reduce our target multiple (from 2.5x to 2.3x) to capture uncertainties from further production reduction required by the government. Reduce our target price to NT$84.8 implying 21% potential upside. Trading at 1.9x P/B (middle end level), its risk reward looks attractive now. Reiterate OUTPERFORM on Nan Ya. Figure 2: Nan Ya Plastics – historical P/B band
0
20
40
60
80
100
Jan-
05A
pr-0
5Ju
l-05
Oct
-05
Jan-
06A
pr-0
6Ju
l-06
Oct
-06
Jan-
07A
pr-0
7Ju
l-07
Oct
-07
Jan-
08A
pr-0
8Ju
l-08
Oct
-08
Jan-
09A
pr-0
9Ju
l-09
Oct
-09
Jan-
10A
pr-1
0Ju
l-10
Oct
-10
Jan-
11A
pr-1
1Ju
l-11
(NT$/share)
Share price 1 x 1.5 x 2 x 2.5 x
2.5X
2.0X
1.5X
1.0X
Source: TEJ, Credit Suisse estimates
Price (02 Aug 11 , NT$) 70.00TP (prev. TP NT$) 84.80 (94.80) Est. pot. % chg. to TP 2152-wk range (NT$) 88.4 - 57.9Mkt cap (NT$/US$ bn) 549.7/ 19.1
Bbg/RIC 1303 TT / 1303.TW Rating (prev. rating) O (O) Shares outstanding (mn) 7,852.30 Daily trad vol - 6m avg (mn) 12.9 Daily trad val - 6m avg (US$ mn) 36.6 Free float (%) 70.0 Major shareholders Wang Family and
associates (about 17%)
Performance 1M 3M 12MAbsolute (%) (10.6) (17.6) 20.9Relative (%) (8.4) (12.8) 13.0
Year 12/09A 12/10A 12/11E 12/12E 12/13ERevenue (NT$ mn) 160,964 212,249 209,097 233,907 227,590EBITDA (NT$ mn) 17,312 35,055 36,715 35,206 30,510Net profit (NT$ mn) 16,404 40,974 43,332 52,091 51,148EPS (NT$) 2.09 5.22 5.52 6.63 6.51- Change from prev. EPS (%) n.a. n.a. (23) (9) - Consensus EPS (NT$) n.a. n.a. 6.47 7.81 7.81EPS growth (%) 69.7 149.8 5.8 20.2 (1.8)P/E (x) 33.5 13.4 12.7 10.6 10.7Dividend yield (%) 2.7 6.7 6.7 8.1 7.9EV/EBITDA (x) 35.1 16.5 16.0 16.8 19.0P/B (x) 2.2 1.9 1.9 1.8 1.8ROE (%) 6.9 15.4 15.1 17.5 16.6Net debt(cash)/equity (%) 23.0 10.0 12.9 14.0 9.9 Note1:Nan Ya Plastics Corporation is principally engaged in the manufacture and sale of plastic products, fiber products, electronic materials and petrochemical products. The Company also provides electromechanical engineering services..
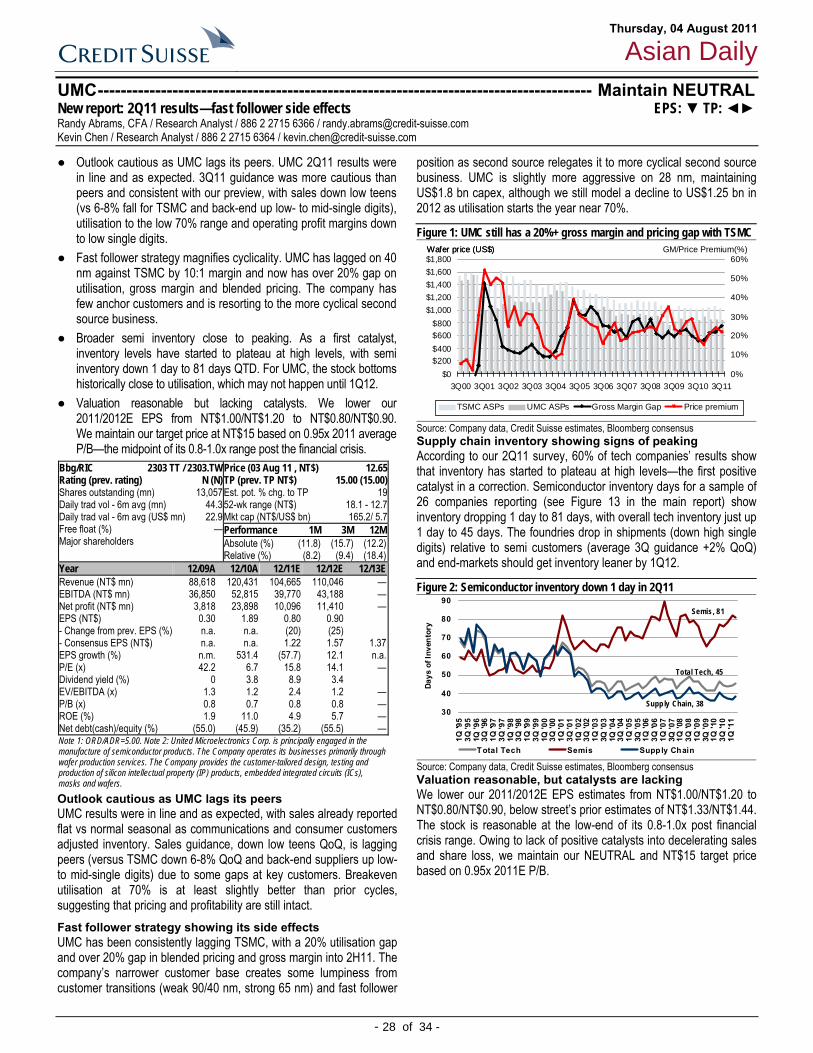
Thursday, 04 August 2011
Asian Daily
- 28 of 34 -
UMC-------------------------------------------------------------------------------------- Maintain NEUTRAL New report: 2Q11 results—fast follower side effects EPS: ▼ TP: ◄► Randy Abrams, CFA / Research Analyst / 886 2 2715 6366 / [email protected] Kevin Chen / Research Analyst / 886 2 2715 6364 / [email protected]
● Outlook cautious as UMC lags its peers. UMC 2Q11 results were in line and as expected. 3Q11 guidance was more cautious than peers and consistent with our preview, with sales down low teens (vs 6-8% fall for TSMC and back-end up low- to mid-single digits), utilisation to the low 70% range and operating profit margins down to low single digits.
● Fast follower strategy magnifies cyclicality. UMC has lagged on 40 nm against TSMC by 10:1 margin and now has over 20% gap on utilisation, gross margin and blended pricing. The company has few anchor customers and is resorting to the more cyclical second source business.
● Broader semi inventory close to peaking. As a first catalyst, inventory levels have started to plateau at high levels, with semi inventory down 1 day to 81 days QTD. For UMC, the stock bottoms historically close to utilisation, which may not happen until 1Q12.
● Valuation reasonable but lacking catalysts. We lower our 2011/2012E EPS from NT$1.00/NT$1.20 to NT$0.80/NT$0.90. We maintain our target price at NT$15 based on 0.95x 2011 average P/B—the midpoint of its 0.8-1.0x range post the financial crisis.
Outlook cautious as UMC lags its peers
UMC results were in line and as expected, with sales already reported flat vs normal seasonal as communications and consumer customers adjusted inventory. Sales guidance, down low teens QoQ, is lagging peers (versus TSMC down 6-8% QoQ and back-end suppliers up low- to mid-single digits) due to some gaps at key customers. Breakeven utilisation at 70% is at least slightly better than prior cycles, suggesting that pricing and profitability are still intact. Fast follower strategy showing its side effects UMC has been consistently lagging TSMC, with a 20% utilisation gap and over 20% gap in blended pricing and gross margin into 2H11. The company’s narrower customer base creates some lumpiness from customer transitions (weak 90/40 nm, strong 65 nm) and fast follower
position as second source relegates it to more cyclical second source business. UMC is slightly more aggressive on 28 nm, maintaining US$1.8 bn capex, although we still model a decline to US$1.25 bn in 2012 as utilisation starts the year near 70%.
Figure 1: UMC still has a 20%+ gross margin and pricing gap with TSMC
$0$200$400$600$800
$1,000$1,200$1,400$1,600$1,800
3Q00 3Q01 3Q02 3Q03 3Q04 3Q05 3Q06 3Q07 3Q08 3Q09 3Q10 3Q110%
10%
20%
30%
40%
50%
60%
TSMC ASPs UMC ASPs Gross Margin Gap Price premium
Wafer price (US$)Wafer price (US$) GM/Price Premium(%)
Source: Company data, Credit Suisse estimates, Bloomberg consensus Supply chain inventory showing signs of peaking According to our 2Q11 survey, 60% of tech companies’ results show that inventory has started to plateau at high levels—the first positive catalyst in a correction. Semiconductor inventory days for a sample of 26 companies reporting (see Figure 13 in the main report) show inventory dropping 1 day to 81 days, with overall tech inventory just up 1 day to 45 days. The foundries drop in shipments (down high single digits) relative to semi customers (average 3Q guidance +2% QoQ) and end-markets should get inventory leaner by 1Q12.
Figure 2: Semiconductor inventory down 1 day in 2Q11
Total Tech, 45
Semis, 81
Supp ly Chain, 3830
40
50
60
70
80
90
1Q '9
53Q
'95
1Q '9
63Q
'96
1Q '9
73Q
'97
1Q '9
83Q
'98
1Q '9
93Q
'99
1Q '0
03Q
'00
1Q '0
13Q
'01
1Q '0
23Q
'02
1Q '0
33Q
'03
1Q '0
43Q
'04
1Q '0
53Q
'05
1Q '0
63Q
'06
1Q '0
73Q
'07
1Q '0
83Q
'08
1Q '0
93Q
'09
1Q '1
03Q
'10
1Q '1
1
Days
of I
nven
tory
Total Tech Semis Supply Chain
Source: Company data, Credit Suisse estimates, Bloomberg consensus Valuation reasonable, but catalysts are lacking We lower our 2011/2012E EPS estimates from NT$1.00/NT$1.20 to NT$0.80/NT$0.90, below street’s prior estimates of NT$1.33/NT$1.44. The stock is reasonable at the low-end of its 0.8-1.0x post financial crisis range. Owing to lack of positive catalysts into decelerating sales and share loss, we maintain our NEUTRAL and NT$15 target price based on 0.95x 2011E P/B.
Price (03 Aug 11 , NT$) 12.65TP (prev. TP NT$) 15.00 (15.00) Est. pot. % chg. to TP 1952-wk range (NT$) 18.1 - 12.7Mkt cap (NT$/US$ bn) 165.2/ 5.7
Bbg/RIC 2303 TT / 2303.TW Rating (prev. rating) N (N) Shares outstanding (mn) 13,057 Daily trad vol - 6m avg (mn) 44.3 Daily trad val - 6m avg (US$ mn) 22.9 Free float (%) — Major shareholders
Performance 1M 3M 12MAbsolute (%) (11.8) (15.7) (12.2)Relative (%) (8.2) (9.4) (18.4)
Year 12/09A 12/10A 12/11E 12/12E 12/13ERevenue (NT$ mn) 88,618 120,431 104,665 110,046 —EBITDA (NT$ mn) 36,850 52,815 39,770 43,188 —Net profit (NT$ mn) 3,818 23,898 10,096 11,410 —EPS (NT$) 0.30 1.89 0.80 0.90 - Change from prev. EPS (%) n.a. n.a. (20) (25) - Consensus EPS (NT$) n.a. n.a. 1.22 1.57 1.37EPS growth (%) n.m. 531.4 (57.7) 12.1 n.a.P/E (x) 42.2 6.7 15.8 14.1 —Dividend yield (%) 0 3.8 8.9 3.4 EV/EBITDA (x) 1.3 1.2 2.4 1.2 —P/B (x) 0.8 0.7 0.8 0.8 —ROE (%) 1.9 11.0 4.9 5.7 —Net debt(cash)/equity (%) (55.0) (45.9) (35.2) (55.5) — Note 1: ORD/ADR=5.00. Note 2: United Microelectronics Corp. is principally engaged in the manufacture of semiconductor products. The Company operates its businesses primarily through wafer production services. The Company provides the customer-tailored design, testing and production of silicon intellectual property (IP) products, embedded integrated circuits (ICs), masks and wafers.
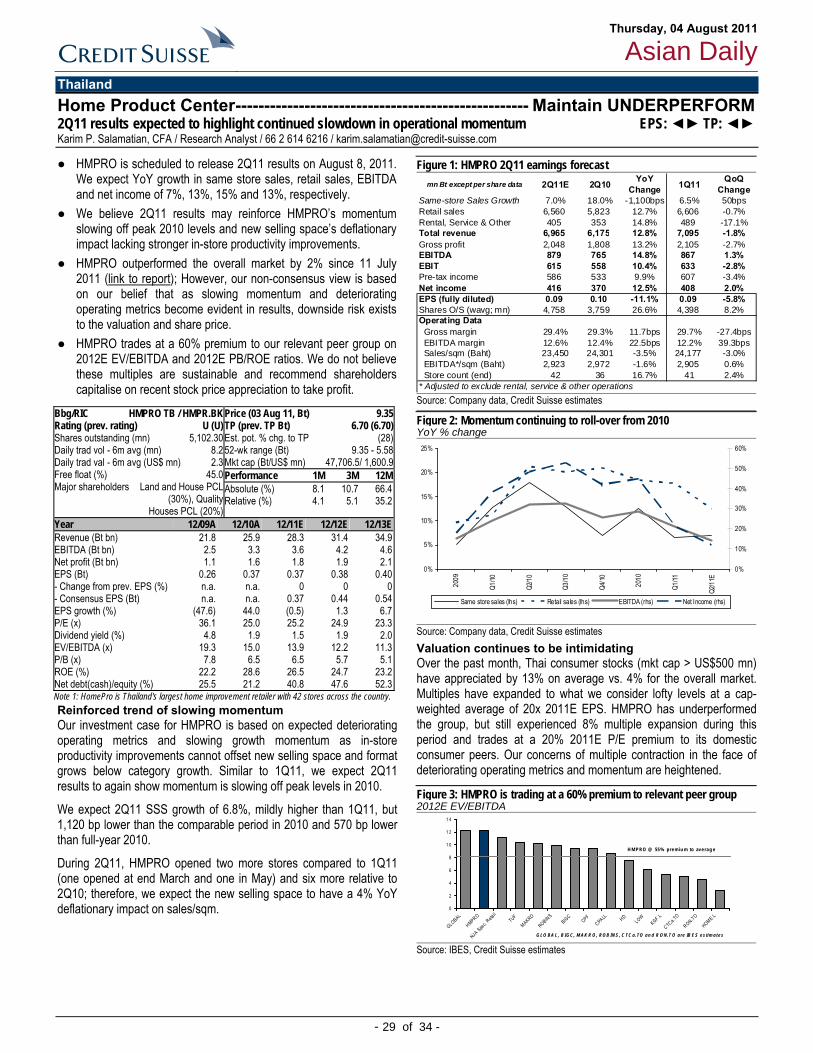
Thursday, 04 August 2011
Asian Daily
- 29 of 34 -
Thailand Home Product Center--------------------------------------------------- Maintain UNDERPERFORM 2Q11 results expected to highlight continued slowdown in operational momentum EPS: ◄► TP: ◄► Karim P. Salamatian, CFA / Research Analyst / 66 2 614 6216 / [email protected]
● HMPRO is scheduled to release 2Q11 results on August 8, 2011. We expect YoY growth in same store sales, retail sales, EBITDA and net income of 7%, 13%, 15% and 13%, respectively.
● We believe 2Q11 results may reinforce HMPRO’s momentum slowing off peak 2010 levels and new selling space’s deflationary impact lacking stronger in-store productivity improvements.
● HMPRO outperformed the overall market by 2% since 11 July 2011 (link to report); However, our non-consensus view is based on our belief that as slowing momentum and deteriorating operating metrics become evident in results, downside risk exists to the valuation and share price.
● HMPRO trades at a 60% premium to our relevant peer group on 2012E EV/EBITDA and 2012E PB/ROE ratios. We do not believe these multiples are sustainable and recommend shareholders capitalise on recent stock price appreciation to take profit.
Reinforced trend of slowing momentum Our investment case for HMPRO is based on expected deteriorating operating metrics and slowing growth momentum as in-store productivity improvements cannot offset new selling space and format grows below category growth. Similar to 1Q11, we expect 2Q11 results to again show momentum is slowing off peak levels in 2010.
We expect 2Q11 SSS growth of 6.8%, mildly higher than 1Q11, but 1,120 bp lower than the comparable period in 2010 and 570 bp lower than full-year 2010.
During 2Q11, HMPRO opened two more stores compared to 1Q11 (one opened at end March and one in May) and six more relative to 2Q10; therefore, we expect the new selling space to have a 4% YoY deflationary impact on sales/sqm.
Figure 1: HMPRO 2Q11 earnings forecast 2Q11E 2Q10 YoY
Change 1Q11 QoQ Change
Same-store Sales Growth 7.0% 18.0% -1,100bps 6.5% 50bpsRetail sales 6,560 5,823 12.7% 6,606 -0.7%Rental, Service & Other 405 353 14.8% 489 -17.1%Total revenue 6,965 6,175 12.8% 7,095 -1.8%Gross profit 2,048 1,808 13.2% 2,105 -2.7%EBITDA 879 765 14.8% 867 1.3%EBIT 615 558 10.4% 633 -2.8%Pre-tax income 586 533 9.9% 607 -3.4%Net income 416 370 12.5% 408 2.0%EPS (fully diluted) 0.09 0.10 -11.1% 0.09 -5.8%Shares O/S (wavg; mn) 4,758 3,759 26.6% 4,398 8.2%Operating Data Gross margin 29.4% 29.3% 11.7bps 29.7% -27.4bps EBITDA margin 12.6% 12.4% 22.5bps 12.2% 39.3bps Sales/sqm (Baht) 23,450 24,301 -3.5% 24,177 -3.0% EBITDA*/sqm (Baht) 2,923 2,972 -1.6% 2,905 0.6% Store count (end) 42 36 16.7% 41 2.4%* Adjusted to exclude rental, service & other operations
mn Bt except per share data
Source: Company data, Credit Suisse estimates
Figure 2: Momentum continuing to roll-over from 2010 YoY % change
0%
5%
10%
15%
20%
25%20
09
Q1/10
Q2/10
Q3/1
0
Q4/10 2010
Q1/11
Q2/11
E
0%
10%
20%
30%
40%
50%
60%
Same store sales (lhs) Retail sales (lhs) EBITDA (rhs) Net Income (rhs)
Source: Company data, Credit Suisse estimates Valuation continues to be intimidating Over the past month, Thai consumer stocks (mkt cap > US$500 mn) have appreciated by 13% on average vs. 4% for the overall market. Multiples have expanded to what we consider lofty levels at a cap-weighted average of 20x 2011E EPS. HMPRO has underperformed the group, but still experienced 8% multiple expansion during this period and trades at a 20% 2011E P/E premium to its domestic consumer peers. Our concerns of multiple contraction in the face of deteriorating operating metrics and momentum are heightened.
Figure 3: HMPRO is trading at a 60% premium to relevant peer group 2012E EV/EBITDA
0
2
4
6
8
1 0
1 2
1 4
GLOBAL
HMPRO
NJA Spec. Retai l
TUF
MAKRO
ROBINSBIGC
CPFCPALL HD
LOWKGF.L
CTCa.TO
RON.TO
HOME.L
H M P RO @ 55 % pre m iu m to av e ra g e
G LO BA L, B IG C, M AK R O , RO B IN S , C TC a .TO a n d R O N.T O a re IB E S e s tim a te s Source: IBES, Credit Suisse estimates
Price (03 Aug 11, Bt) 9.35TP (prev. TP Bt) 6.70 (6.70) Est. pot. % chg. to TP (28)52-wk range (Bt) 9.35 - 5.58Mkt cap (Bt/US$ mn) 47,706.5/ 1,600.9
Bbg/RIC HMPRO TB / HMPR.BK Rating (prev. rating) U (U) Shares outstanding (mn) 5,102.30 Daily trad vol - 6m avg (mn) 8.2 Daily trad val - 6m avg (US$ mn) 2.3 Free float (%) 45.0 Major shareholders Land and House PCL
(30%), Quality Houses PCL (20%)
Performance 1M 3M 12MAbsolute (%) 8.1 10.7 66.4Relative (%) 4.1 5.1 35.2
Year 12/09A 12/10A 12/11E 12/12E 12/13ERevenue (Bt bn) 21.8 25.9 28.3 31.4 34.9EBITDA (Bt bn) 2.5 3.3 3.6 4.2 4.6Net profit (Bt bn) 1.1 1.6 1.8 1.9 2.1EPS (Bt) 0.26 0.37 0.37 0.38 0.40- Change from prev. EPS (%) n.a. n.a. 0 0 0- Consensus EPS (Bt) n.a. n.a. 0.37 0.44 0.54EPS growth (%) (47.6) 44.0 (0.5) 1.3 6.7P/E (x) 36.1 25.0 25.2 24.9 23.3Dividend yield (%) 4.8 1.9 1.5 1.9 2.0EV/EBITDA (x) 19.3 15.0 13.9 12.2 11.3P/B (x) 7.8 6.5 6.5 5.7 5.1ROE (%) 22.2 28.6 26.5 24.7 23.2Net debt(cash)/equity (%) 25.5 21.2 40.8 47.6 52.3 Note 1: HomePro is Thailand's largest home improvement retailer with 42 stores across the country.

Thursday, 04 August 2011
Asian Daily
- 30 of 34 -
Recently Published Research
Date Title Author(s) Tel. E-mail Wed 3 Aug China Internet Sector Wallace Cheung 852 2101 7090 [email protected] Wed 3 Aug China Manufacturing Purchasing
Managers’ Index Dong Tao 852 2101 7469 [email protected]
Wed 3 Aug GEM Equity Strategy Sakthi Siva Kin Nang Chik
65 6212 3027 852 2101 7482
[email protected] [email protected]
Wed 3 Aug Microport Jinsong Du Lefei Sun Duo Chen
852 2101 6589 852 2101 7658 852 2101 7350
[email protected] [email protected] [email protected]
Wed 3 Aug NJA Insurance Weekly Arjan van Veen 852 2101 7508 [email protected] Wed 3 Aug Non Japan Asia Focus List Jahanzeb Naseer
Felix Rusli 852 2101 6554 852 2101 6482
[email protected] [email protected]
Wed 3 Aug Singapore Exchange Arjan van Veen 852 2101 7508 [email protected] Wed 3 Aug Taiwan Market Strategy Chung Hsu
Randy Abrams Michelle Chou Josette Chang
8862 2715 6362 886 2 2715 6366 886 2 2715 6363 886 2 2715 6367
[email protected] [email protected] [email protected] [email protected]
Wed 3 Aug Taiwan Petrochemicals Sector Sidney Yeh David Liao Grace Li
886 2 2715 6368 8862 2715 6342 886 2 2715 6353
[email protected] [email protected] [email protected]
Tue 2 Aug Cheung Kong Holdings Cusson Leung, CFA Joyce Kwock
852 2101 6621 852 2101 7496
[email protected] [email protected]
Tue 2 Aug China Banks Sector Sanjay Jain 65 6212 3017 [email protected] Tue 2 Aug China Internet Sector Wallace Cheung, CFA 852 2101 7090 [email protected] Tue 2 Aug Hang Seng Bank Franco Lam 852 2101 7642 [email protected] Tue 2 Aug Singapore Exchange Arjan van Veen 852 2101 7508 [email protected] Mon 1 Aug Asia Equity Strategy Sakthi Siva
Kin Nang Chik 65 6212 3027 852 2101 7482
[email protected] [email protected]
Mon 1 Aug China PMI Analysis Dong Tao Vincent Chan
852 2101 7469 852 2101 6568
[email protected] [email protected]
Mon 1 Aug Chinese Whispers – Monthly Survey Series on China
Vincent Chan 852 2101 6568 [email protected]
Mon 1 Aug GEM Equity Strategy Sakthi Siva Kin Nang Chik
65 6212 3027 852 2101 7482
[email protected] [email protected]
Mon 1 Aug Hong Kong Banks Franco Lam 852 2101 7642 [email protected] Mon 1 Aug Samsung Electronics MS Hwang 852 2101 7501 [email protected] Mon 1 Aug Singapore Equity Strategy Sakthi Siva
Kin Nang Chik 65 6212 3027 852 2101 7482
[email protected] [email protected]
Mon 1 Aug Taiwan Petrochemicals Sector Sidney Yeh David Liao Grace Li
886 2 2715 6368 8862 2715 6342 886 2 2715 6353
[email protected] [email protected] [email protected]
Mon 1 Aug Taiwan Telecoms Sector Chate Benchavitvilai 852 2101 7040 [email protected] Mon 1 Aug Thai Union Frozen Products PCL Karim P. Salamatian 66 2 614 6216 [email protected] Mon 1 Aug The Asian Refiner Sanjay Mookim
Saurabh Mishra 9122 6777 3806 91 22 6777 3894
[email protected] [email protected]
Mon 1 Aug United Bank Limited Farhan Rizvi 65 6212 3036 [email protected]

Thursday, 04 August 2011
Asian Daily
- 31 of 34 -
Companies mentioned Ace Digitech (036550.KQ, W16,450, NOT RATED) Aluminum Corporation of China (2600.HK, HK$6.39, UNDERPERFORM, TP HK$4.80) Angang Steel Company Ltd (0347.HK, HK$8.03, NEUTRAL, TP HK$11.10) Anhui Conch Cement Co. Ltd. (0914.HK, HK$37.55, NEUTRAL, TP HK$32.00) Astra International (ASII.JK, Rp70,650.00, NEUTRAL, TP Rp79,200.00) Asustek (2357.TW, NT$255.50, OUTPERFORM, TP NT$270.49) Axiata Group Berhad (AXIA.KL, RM5.07, OUTPERFORM, TP RM6.30) Bank Mandiri (Persero) (BMRI.JK, Rp7,650.00, OUTPERFORM, TP Rp9,400.00) Baoshan Iron & Steel (600019.SS, Rmb5.68, OUTPERFORM, TP Rmb9.80) BBMG Corporation (2009.HK, HK$11.04, OUTPERFORM, TP HK$15.90) Big C Supercenter Public Co (BIGC.BK, Bt125.00) C.P. All PCL (CPALL.BK, Bt49.75, OUTPERFORM, TP Bt49.00) Canadian Tire Corp Ltd (NVS) (CTCa.TO, C$56.80) Charoen Pokphand Foods Public (CPF.BK, Bt33.00, OUTPERFORM, TP Bt36.50) Cheil Industries Inc (001300.KS, W112,500, NEUTRAL, TP W138,000) Cheung Kong Holdings (0001.HK, HK$119.70, OUTPERFORM, TP HK$151.90) China Coal Energy Co. (1898.HK, HK$10.64, OUTPERFORM, TP HK$12.00) China Construction Bank (0939.HK, HK$6.03, OUTPERFORM, TP HK$7.64) China Modern Dairy Holdings Ltd (1117.HK, HK$2.40, OUTPERFORM [V], TP HK$3.25) China National Building Material Co (3323.HK, HK$14.90, OUTPERFORM [V], TP HK$18.00) China National Materials Company Limited (1893.HK, HK$5.18, OUTPERFORM, TP HK$9.00) China Resources Cement Holdings Ltd (1313.HK, HK$7.46, OUTPERFORM, TP HK$7.90) China Shanshui Cement Group Ltd. (0691.HK, HK$9.47, OUTPERFORM [V], TP HK$8.80) China Shenhua Energy Company Limited (1088.HK, HK$37.75, OUTPERFORM, TP HK$43.60) City Developments (CTDM.SI, S$10.65, OUTPERFORM, TP S$15.74) Daelim Industrial (000210.KS, W127,000, OUTPERFORM, TP W160,000) Engro Corporation Ltd (EGCH.KA, PRs141.78, OUTPERFORM, TP PRs220.83) Fauji Fertilizer Bin Qasim Limited (JORD.KA, PRs46.81) Fauji Fertilizer Company Limited (FAUF.KA, PRs162.85, NEUTRAL, TP PRs170) Formosa Chemical & Fiber (1326.TW, NT$90.4, OUTPERFORM, TP NT$113.9) Formosa Petrochemical (6505.TW, NT$94.0, UNDERPERFORM, TP NT$76.85) Formosa Plastics (1301.TW, NT$94.0, NEUTRAL, TP NT$100.2) Great Eastern Holdings (GELA.SI, S$14.89, OUTPERFORM, TP S$20.00) Home Depot (HD, $32.82, OUTPERFORM, TP $43.00) Home Products Center PCL (HMPR.BK, Bt9.35, UNDERPERFORM, TP Bt6.70) Home Retail Group (HOME.L, 124 p, UNDERPERFORM, TP 1.33 p) HTC Corp (2498.TW, NT$871.00, OUTPERFORM, TP NT$1,070.00) Husky Energy Inc. (HSE.TO, C$26.29, NEUTRAL, TP C$32.00) Hutchison Port Holdings Trust (HPHT.SI, $0.74, UNDERPERFORM [V], TP $0.72) Hutchison Whampoa (0013.HK, HK$91.15, OUTPERFORM, TP HK$111.50) Hysan Development Co. (0014.HK, HK$36.40, OUTPERFORM, TP HK$46.20) Hyundai Development (012630.KS, W29,950, NEUTRAL, TP W33,000) Jiangxi Copper Company Ltd (0358.HK, HK$26.50, NEUTRAL, TP HK$27.00) Kasikornbank (KBANf.BK, Bt140.00, OUTPERFORM, TP Bt168.00) Keppel Corporation (KPLM.SI, S$11.00, OUTPERFORM, TP S$14.60, UNDERWEIGHT) Kingfisher (KGF.L, 239 p, OUTPERFORM, TP 2.95 p) KT Corp (030200.KS, W39,550, OUTPERFORM, TP W48,000) Lowe's (LOW, $20.46, OUTPERFORM, TP $30.00) Maanshan Iron & Steel Co Ltd (0323.HK, HK$3.32, OUTPERFORM, TP HK$5.50) Microport (0853.HK, HK$4.01, OUTPERFORM [V], TP HK$6.7) Millennium & Copthorne (MLC.L, 515 p, OUTPERFORM, TP 6.35 p) Nan Ya Plastics (1303.TW, NT$70.0, OUTPERFORM, TP NT$84.8) Nan Ya Printed Circuit Board (8046.TW, NT$98.0, NEUTRAL, TP NT$97.09) Nanya Technology (2408.TW, NT$6.40, UNDERPERFORM [V], TP NT$10.00) Overseas Union Enterprise (OVES.SI, S$2.87, OUTPERFORM, TP S$4.20) Pegatron (4938.TW, NT$32.70, OUTPERFORM, TP NT$48.00) President Chain Store (2912.TW, NT$180.00, NEUTRAL, TP NT$140.40) PT Indosat Tbk (ISAT.JK, Rp5,800.00, OUTPERFORM, TP Rp7,900.00) Rona Inc. (RON.TO, C$10.97) Samsung Electronics (005930.KS, W833,000, OUTPERFORM, TP W1,100,000) Samsung Engineering Co Ltd (028050.KS, W238,500, OUTPERFORM, TP W270,000) Samsung Life Insurance (032830.KS, W98,100, OUTPERFORM, TP W133,000) Shinhan Financial Group (055550.KS, W49,000, OUTPERFORM, TP W66,000) Siam Commercial Bank (SCB.BK, Bt125.00, OUTPERFORM, TP Bt143.00) Siam Global House (GLOBAL.BK, Bt9) Siam Makro Public Co. Ltd (MAKR.BK, Bt243.00) Singapore Exchange Limited (SGXL.SI, S$7.35, NEUTRAL, TP S$7.50)

Thursday, 04 August 2011
Asian Daily
- 32 of 34 -
Sino Land (0083.HK, HK$12.78, OUTPERFORM, TP HK$16.10) SK Broadband Co Ltd (033630.KQ, W4,510, NEUTRAL, TP W4,800) SK Telecom (017670.KS, W144,000, RESTRICTED) Standard Chartered Plc (2888.HK, HK$201.40, UNDERPERFORM, TP HK$190.79) Taiwan Semiconductor Manufacturing (2330.TW, NT$70.10, OUTPERFORM, TP NT$83.00) TCC International Holdings Limited (1136.HK, HK$5.06, OUTPERFORM [V], TP HK$3.50) United Company Rusal Ltd. (0486.HK, HK$10.44) United Microelectronics (2303.TW, NT$12.65, NEUTRAL, TP NT$15.00) Wharf Holdings (0004.HK, HK$55.90, OUTPERFORM, TP HK$72.00) Wistron (3231.TW, NT$48.70, OUTPERFORM, TP NT$57.00) Woongjin Coway Co Ltd (021240.KS, W39,200, OUTPERFORM, TP W46,000) Yanzhou Coal Mining Co. (1171.HK, HK$29.20, NEUTRAL [V], TP HK$34.70) Zijin Mining Group Co., Ltd (2899.HK, HK$4.22, OUTPERFORM [V], TP HK$6.40)
Disclosure Appendix Important Global Disclosures The analysts identified in this report each certify, with respect to the companies or securities that the individual analyzes, that (1) the views expressed in this report accurately reflect his or her personal views about all of the subject companies and securities and (2) no part of his or her compensation was, is or will be directly or indirectly related to the specific recommendations or views expressed in this report. The analyst(s) responsible for preparing this research report received compensation that is based upon various factors including Credit Suisse's total revenues, a portion of which are generated by Credit Suisse's investment banking activities. Analysts’ stock ratings are defined as follows: Outperform (O): The stock’s total return is expected to outperform the relevant benchmark* by at least 10-15% (or more, depending on perceived risk) over the next 12 months. Neutral (N): The stock’s total return is expected to be in line with the relevant benchmark* (range of ±10-15%) over the next 12 months. Underperform (U): The stock’s total return is expected to underperform the relevant benchmark* by 10-15% or more over the next 12 months. *Relevant benchmark by region: As of 29th May 2009, Australia, New Zealand, U.S. and Canadian ratings are based on (1) a stock’s absolute total return potential to its current share price and (2) the relative attractiveness of a stock’s total return potential within an analyst’s coverage universe**, with Outperforms representing the most attractive, Neutrals the less attractive, and Underperforms the least attractive investment opportunities. Some U.S. and Canadian ratings may fall outside the absolute total return ranges defined above, depending on market conditions and industry factors. For Latin American, Japanese, and non-Japan Asia stocks, ratings are based on a stock’s total return relative to the average total return of the relevant country or regional benchmark; for European stocks, ratings are based on a stock’s total return relative to the analyst's coverage universe**. For Australian and New Zealand stocks, 12-month rolling yield is incorporated in the absolute total return calculation and a 15% and a 7.5% threshold replace the 10-15% level in the Outperform and Underperform stock rating definitions, respectively. The 15% and 7.5% thresholds replace the +10-15% and -10-15% levels in the Neutral stock rating definition, respectively. **An analyst's coverage universe consists of all companies covered by the analyst within the relevant sector. Restricted (R): In certain circumstances, Credit Suisse policy and/or applicable law and regulations preclude certain types of communications, including an investment recommendation, during the course of Credit Suisse's engagement in an investment banking transaction and in certain other circumstances. Volatility Indicator [V]: A stock is defined as volatile if the stock price has moved up or down by 20% or more in a month in at least 8 of the past 24 months or the analyst expects significant volatility going forward.
Analysts’ coverage universe weightings are distinct from analysts’ stock ratings and are based on the expected performance of an analyst’s coverage universe* versus the relevant broad market benchmark**: Overweight: Industry expected to outperform the relevant broad market benchmark over the next 12 months. Market Weight: Industry expected to perform in-line with the relevant broad market benchmark over the next 12 months. Underweight: Industry expected to underperform the relevant broad market benchmark over the next 12 months. *An analyst’s coverage universe consists of all companies covered by the analyst within the relevant sector. **The broad market benchmark is based on the expected return of the local market index (e.g., the S&P 500 in the U.S.) over the next 12 months. Credit Suisse’s distribution of stock ratings (and banking clients) is:
Global Ratings Distribution Outperform/Buy* 48% (61% banking clients) Neutral/Hold* 40% (57% banking clients) Underperform/Sell* 10% (50% banking clients) Restricted 2%
*For purposes of the NYSE and NASD ratings distribution disclosure requirements, our stock ratings of Outperform, Neutral, and Underperform most closely correspond to Buy, Hold, and Sell, respectively; however, the meanings are not the same, as our stock ratings are determined on a relative basis. (Please refer to definitions above.) An investor's decision to buy or sell a security should be based on investment objectives, current holdings, and other individual factors.
Thursday, 04 August 2011
Asian Daily
- 33 of 34 -
Credit Suisse’s policy is to update research reports as it deems appropriate, based on developments with the subject company, the sector or the market that may have a material impact on the research views or opinions stated herein. Credit Suisse's policy is only to publish investment research that is impartial, independent, clear, fair and not misleading. For more detail please refer to Credit Suisse's Policies for Managing Conflicts of Interest in connection with Investment Research: http://www.csfb.com/research-and-analytics/disclaimer/managing_conflicts_disclaimer.html Credit Suisse does not provide any tax advice. Any statement herein regarding any US federal tax is not intended or written to be used, and cannot be used, by any taxpayer for the purposes of avoiding any penalties. Important Regional Disclosures Singapore recipients should contact a Singapore financial adviser for any matters arising from this research report. Restrictions on certain Canadian securities are indicated by the following abbreviations: NVS--Non-Voting shares; RVS--Restricted Voting Shares; SVS--Subordinate Voting Shares. Individuals receiving this report from a Canadian investment dealer that is not affiliated with Credit Suisse should be advised that this report may not contain regulatory disclosures the non-affiliated Canadian investment dealer would be required to make if this were its own report. For Credit Suisse Securities (Canada), Inc.'s policies and procedures regarding the dissemination of equity research, please visit http://www.csfb.com/legal_terms/canada_research_policy.shtml. As of the date of this report, Credit Suisse acts as a market maker or liquidity provider in the equities securities that are the subject of this report. Principal is not guaranteed in the case of equities because equity prices are variable. Commission is the commission rate or the amount agreed with a customer when setting up an account or at anytime after that. Taiwanese Disclosures: Reports written by Taiwan-based analysts on non-Taiwan listed companies are not considered recommendations to buy or sell securities under Taiwan Stock Exchange Operational Regulations Governing Securities Firms Recommending Trades in Securities to Customers. Please find the full reports, including disclosure information, on Credit Suisse's Research and Analytics Website (http://www.researchandanalytics.com) Important Credit Suisse HOLT Disclosures With respect to the analysis in this report based on the Credit Suisse HOLT methodology, Credit Suisse certifies that (1) the views expressed in this report accurately reflect the Credit Suisse HOLT methodology and (2) no part of the Firm’s compensation was, is, or will be directly related to the specific views disclosed in this report. The Credit Suisse HOLT methodology does not assign ratings to a security. It is an analytical tool that involves use of a set of proprietary quantitative algorithms and warranted value calculations, collectively called the Credit Suisse HOLT valuation model, that are consistently applied to all the companies included in its database. Third-party data (including consensus earnings estimates) are systematically translated into a number of default variables and incorporated into the algorithms available in the Credit Suisse HOLT valuation model. The source financial statement, pricing, and earnings data provided by outside data vendors are subject to quality control and may also be adjusted to more closely measure the underlying economics of firm performance. These adjustments provide consistency when analyzing a single company across time, or analyzing multiple companies across industries or national borders. The default scenario that is produced by the Credit Suisse HOLT valuation model establishes the baseline valuation for a security, and a user then may adjust the default variables to produce alternative scenarios, any of which could occur. Additional information about the Credit Suisse HOLT methodology is available on request. The Credit Suisse HOLT methodology does not assign a price target to a security. The default scenario that is produced by the Credit Suisse HOLT valuation model establishes a warranted price for a security, and as the third-party data are updated, the warranted price may also change. The default variables may also be adjusted to produce alternative warranted prices, any of which could occur. CFROI®, HOLT, HOLTfolio, HOLTSelect, ValueSearch, AggreGator, Signal Flag and “Powered by HOLT” are trademarks or service marks or registered trademarks or registered service marks of Credit Suisse or its affiliates in the United States and other countries. HOLT is a corporate performance and valuation advisory service of Credit Suisse. Additional information about the Credit Suisse HOLT methodology is available on request. Important MSCI Disclosures The MSCI sourced information is the exclusive property of Morgan Stanley Capital International Inc. (MSCI). Without prior written permission of MSCI, this information and any other MSCI intellectual property may not be reproduced, re-disseminated or used to create any financial products, including any indices. This information is provided on an “as is” basis. The user assumes the entire risk of any use made of this information. MSCI, its affiliates and any third party involved in, or related to, computing or compiling the information hereby expressly disclaim all warranties of originality, accuracy, completeness, merchantability or fitness for a particular purpose with respect to any of this information. Without limiting any of the foregoing, in no event shall MSCI, any of its affiliates or any third party involved in, or related to, computing or compiling the information have any liability for any damages of any kind. MSCI, Morgan Stanley Capital International and the MSCI indexes are services marks of MSCI and its affiliates. The Global Industry Classification Standard (GICS) was developed by and is the exclusive property of Morgan Stanley Capital International Inc. and Standard & Poor’s. GICS is a service mark of MSCI and S&P and has been licensed for use by Credit Suisse. For Credit Suisse disclosure information on other companies mentioned in this report, please visit the website at www.credit-suisse.com/researchdisclosures or call +1 (877) 291-2683. Disclaimers continue on next page.

Thursday, 04 August 2011
Asian Daily
- 34 of 34 -
Disclaimers This report is not directed to, or intended for distribution to or use by, any person or entity who is a citizen or resident of or located in any locality, state, country or other jurisdiction where such distribution, publication, availability or use would be contrary to law or regulation or which would subject Credit Suisse AG, the Swiss bank, or its subsidiaries or its affiliates (“CS”) to any registration or licensing requirement within such jurisdiction. All material presented in this report, unless specifically indicated otherwise, is under copyright to CS. None of the material, nor its content, nor any copy of it, may be altered in any way, transmitted to, copied or distributed to any other party, without the prior express written permission of CS. All trademarks, service marks and logos used in this report are trademarks or service marks or registered trademarks or service marks of CS or its affiliates. The information, tools and material presented in this report are provided to you for information purposes only and are not to be used or considered as an offer or the solicitation of an offer to sell or to buy or subscribe for securities or other financial instruments. CS may not have taken any steps to ensure that the securities referred to in this report are suitable for any particular investor. CS will not treat recipients as its customers by virtue of their receiving the report. The investments or services contained or referred to in this report may not be suitable for you and it is recommended that you consult an independent investment advisor if you are in doubt about such investments or investment services. Nothing in this report constitutes investment, legal, accounting or tax advice or a representation that any investment or strategy is suitable or appropriate to your individual circumstances or otherwise constitutes a personal recommendation to you. CS does not offer advice on the tax consequences of investment and you are advised to contact an independent tax adviser. Please note in particular that the bases and levels of taxation may change. CS believes the information and opinions in the Disclosure Appendix of this report are accurate and complete. Information and opinions presented in the other sections of the report were obtained or derived from sources CS believes are reliable, but CS makes no representations as to their accuracy or completeness. Additional information is available upon request. CS accepts no liability for loss arising from the use of the material presented in this report, except that this exclusion of liability does not apply to the extent that liability arises under specific statutes or regulations applicable to CS. This report is not to be relied upon in substitution for the exercise of independent judgment. CS may have issued, and may in the future issue, a trading call regarding this security. Trading calls are short term trading opportunities based on market events and catalysts, while stock ratings reflect investment recommendations based on expected total return over a 12-month period as defined in the disclosure section. Because trading calls and stock ratings reflect different assumptions and analytical methods, trading calls may differ directionally from the stock rating. In addition, CS may have issued, and may in the future issue, other reports that are inconsistent with, and reach different conclusions from, the information presented in this report. Those reports reflect the different assumptions, views and analytical methods of the analysts who prepared them and CS is under no obligation to ensure that such other reports are brought to the attention of any recipient of this report. CS is involved in many businesses that relate to companies mentioned in this report. These businesses include specialized trading, risk arbitrage, market making, and other proprietary trading. Past performance should not be taken as an indication or guarantee of future performance, and no representation or warranty, express or implied, is made regarding future performance. Information, opinions and estimates contained in this report reflect a judgement at its original date of publication by CS and are subject to change without notice. The price, value of and income from any of the securities or financial instruments mentioned in this report can fall as well as rise. The value of securities and financial instruments is subject to exchange rate fluctuation that may have a positive or adverse effect on the price or income of such securities or financial instruments. Investors in securities such as ADR’s, the values of which are influenced by currency volatility, effectively assume this risk. Structured securities are complex instruments, typically involve a high degree of risk and are intended for sale only to sophisticated investors who are capable of understanding and assuming the risks involved. The market value of any structured security may be affected by changes in economic, financial and political factors (including, but not limited to, spot and forward interest and exchange rates), time to maturity, market conditions and volatility, and the credit quality of any issuer or reference issuer. Any investor interested in purchasing a structured product should conduct their own investigation and analysis of the product and consult with their own professional advisers as to the risks involved in making such a purchase. Some investments discussed in this report have a high level of volatility. High volatility investments may experience sudden and large falls in their value causing losses when that investment is realised. Those losses may equal your original investment. Indeed, in the case of some investments the potential losses may exceed the amount of initial investment, in such circumstances you may be required to pay more money to support those losses. Income yields from investments may fluctuate and, in consequence, initial capital paid to make the investment may be used as part of that income yield. Some investments may not be readily realisable and it may be difficult to sell or realise those investments, similarly it may prove difficult for you to obtain reliable information about the value, or risks, to which such an investment is exposed. This report may provide the addresses of, or contain hyperlinks to, websites. Except to the extent to which the report refers to website material of CS, CS has not reviewed the linked site and takes no responsibility for the content contained therein. Such address or hyperlink (including addresses or hyperlinks to CS’s own website material) is provided solely for your convenience and information and the content of the linked site does not in any way form part of this document. Accessing such website or following such link through this report or CS’s website shall be at your own risk. This report is issued and distributed in Europe (except Switzerland) by Credit Suisse Securities (Europe) Limited, One Cabot Square, London E14 4QJ, England, which is regulated in the United Kingdom by The Financial Services Authority (“FSA”). This report is being distributed in Germany by Credit Suisse Securities (Europe) Limited Niederlassung Frankfurt am Main regulated by the Bundesanstalt fuer Finanzdienstleistungsaufsicht ("BaFin"). This report is being distributed in the United States by Credit Suisse Securities (USA) LLC ; in Switzerland by Credit Suisse AG; in Canada by Credit Suisse Securities (Canada), Inc..; in Brazil by Banco de Investimentos Credit Suisse (Brasil) S.A.; in Japan by Credit Suisse Securities (Japan) Limited, Financial Instrument Firm, Director-General of Kanto Local Finance Bureau (Kinsho) No. 66, a member of Japan Securities Dealers Association, The Financial Futures Association of Japan, Japan Securities Investment Advisers Association, Type II Financial Instruments Firms Association; elsewhere in Asia/Pacific by whichever of the following is the appropriately authorised entity in the relevant jurisdiction: Credit Suisse (Hong Kong) Limited, Credit Suisse Equities (Australia) Limited , Credit Suisse Securities (Thailand) Limited, Credit Suisse Securities (Malaysia) Sdn Bhd, Credit Suisse AG, Singapore Branch, Credit Suisse Securities (India) Private Limited, Credit Suisse Securities (Europe) Limited, Seoul Branch, Credit Suisse AG, Taipei Securities Branch, PT Credit Suisse Securities Indonesia, Credit Suisse Securities (Philippines ) Inc., and elsewhere in the world by the relevant authorised affiliate of the above. Research on Taiwanese securities produced by Credit Suisse AG, Taipei Securities Branch has been prepared by a registered Senior Business Person. Research provided to residents of Malaysia is authorised by the Head of Research for Credit Suisse Securities (Malaysia) Sdn. Bhd., to whom they should direct any queries on +603 2723 2020. In jurisdictions where CS is not already registered or licensed to trade in securities, transactions will only be effected in accordance with applicable securities legislation, which will vary from jurisdiction to jurisdiction and may require that the trade be made in accordance with applicable exemptions from registration or licensing requirements. Non-U.S. customers wishing to effect a transaction should contact a CS entity in their local jurisdiction unless governing law permits otherwise. U.S. customers wishing to effect a transaction should do so only by contacting a representative at Credit Suisse Securities (USA) LLC in the U.S. Please note that this report was originally prepared and issued by CS for distribution to their market professional and institutional investor customers. Recipients who are not market professional or institutional investor customers of CS should seek the advice of their independent financial advisor prior to taking any investment decision based on this report or for any necessary explanation of its contents. This research may relate to investments or services of a person outside of the UK or to other matters which are not regulated by the FSA or in respect of which the protections of the FSA for private customers and/or the UK compensation scheme may not be available, and further details as to where this may be the case are available upon request in respect of this report. Any Nielsen Media Research material contained in this report represents Nielsen Media Research's estimates and does not represent facts. NMR has neither reviewed nor approved this report and/or any of the statements made herein. If this report is being distributed by a financial institution other than Credit Suisse AG, or its affiliates, that financial institution is solely responsible for distribution. Clients of that institution should contact that institution to effect a transaction in the securities mentioned in this report or require further information. This report does not constitute investment advice by Credit Suisse to the clients of the distributing financial institution, and neither Credit Suisse AG, its affiliates, and their respective officers, directors and employees accept any liability whatsoever for any direct or consequential loss arising from their use of this report or its content. Copyright 2011 CREDIT SUISSE AG and/or its affiliates. All rights reserved. ASIA/PACIFIC: +852 2101-6000 EUROPE: +44 (20) 7888-8888 UNITED STATES OF AMERICA: +1 (212) 325-2000