Thulin bernstein conference
32
1 © 2015 3M. All Rights Reserved. Bernstein Strategic Decisions Conference 2015 Inge Thulin Chairman of the Board, President & Chief Executive Officer May 29, 2015
-
Upload
investors3m -
Category
Investor Relations
-
view
445 -
download
0
Transcript of Thulin bernstein conference
1© 2015 3M. All Rights Reserved.Bernstein Strategic Decisions Conference 2015
Inge ThulinChairman of the Board, President & Chief Executive Officer
May 29, 2015
2© 2015 3M. All Rights Reserved.Bernstein Strategic Decisions Conference 2015
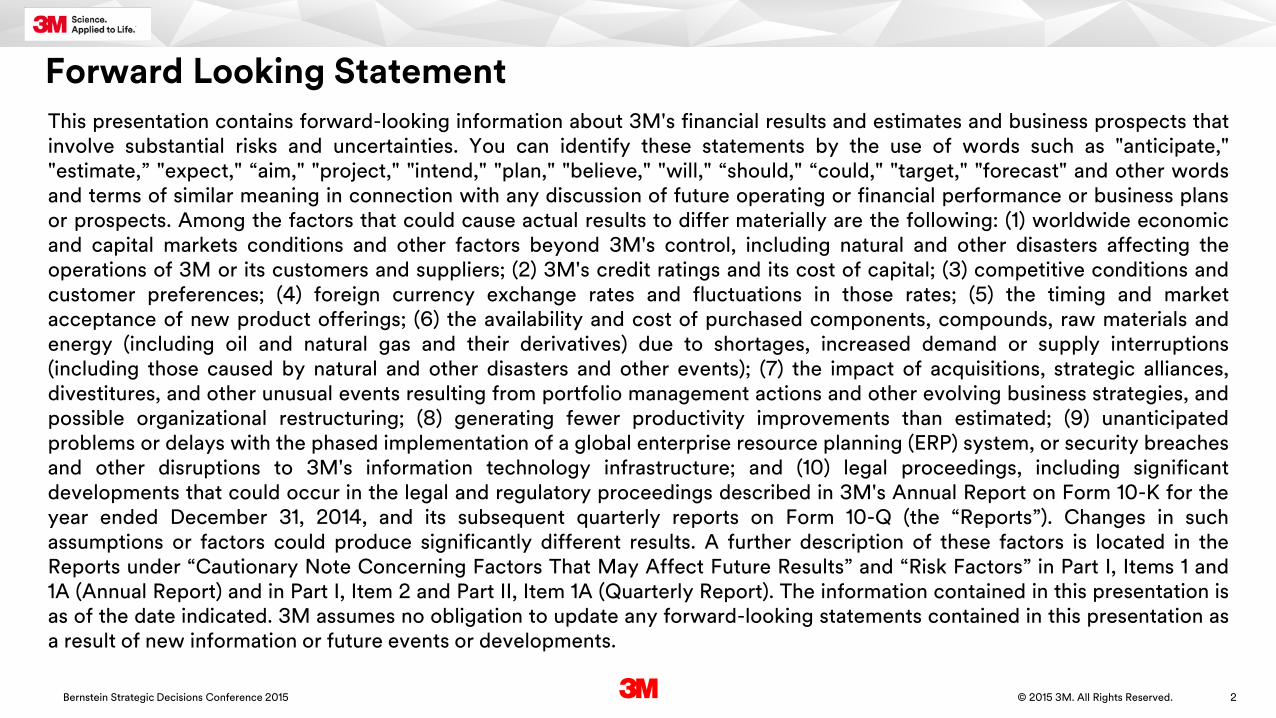
Forward Looking StatementThis presentation contains forward-looking information about 3M's financial results and estimates and business prospects thatinvolve substantial risks and uncertainties. You can identify these statements by the use of words such as "anticipate,""estimate,” "expect," “aim," "project," "intend," "plan," "believe," "will," “should," “could," "target," "forecast" and other wordsand terms of similar meaning in connection with any discussion of future operating or financial performance or business plansor prospects. Among the factors that could cause actual results to differ materially are the following: (1) worldwide economicand capital markets conditions and other factors beyond 3M's control, including natural and other disasters affecting theoperations of 3M or its customers and suppliers; (2) 3M's credit ratings and its cost of capital; (3) competitive conditions andcustomer preferences; (4) foreign currency exchange rates and fluctuations in those rates; (5) the timing and marketacceptance of new product offerings; (6) the availability and cost of purchased components, compounds, raw materials andenergy (including oil and natural gas and their derivatives) due to shortages, increased demand or supply interruptions(including those caused by natural and other disasters and other events); (7) the impact of acquisitions, strategic alliances,divestitures, and other unusual events resulting from portfolio management actions and other evolving business strategies, andpossible organizational restructuring; (8) generating fewer productivity improvements than estimated; (9) unanticipatedproblems or delays with the phased implementation of a global enterprise resource planning (ERP) system, or security breachesand other disruptions to 3M's information technology infrastructure; and (10) legal proceedings, including significantdevelopments that could occur in the legal and regulatory proceedings described in 3M's Annual Report on Form 10-K for theyear ended December 31, 2014, and its subsequent quarterly reports on Form 10-Q (the “Reports”). Changes in suchassumptions or factors could produce significantly different results. A further description of these factors is located in theReports under “Cautionary Note Concerning Factors That May Affect Future Results” and “Risk Factors” in Part I, Items 1 and1A (Annual Report) and in Part I, Item 2 and Part II, Item 1A (Quarterly Report). The information contained in this presentation isas of the date indicated. 3M assumes no obligation to update any forward-looking statements contained in this presentation asa result of new information or future events or developments.
3© 2015 3M. All Rights Reserved.Bernstein Strategic Decisions Conference 2015
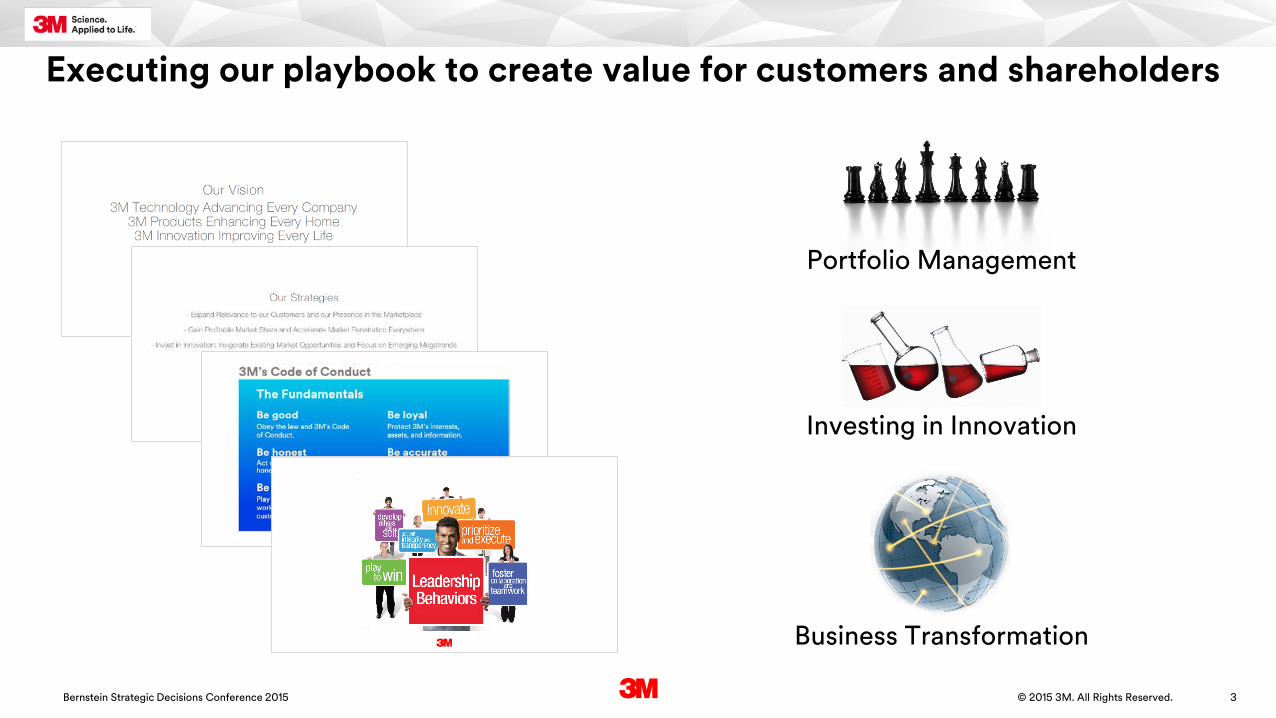
Investing in Innovation
Portfolio Management
Business Transformation
Executing our playbook to create value for customers and shareholders
4© 2015 3M. All Rights Reserved.Bernstein Strategic Decisions Conference 2015
Our Vision
3M Technology Advancing Every Company3M Products Enhancing Every Home3M Innovation Improving Every Life
Our Strategies- Expand Relevance to our Customers and our Presence in the Marketplace
- Gain Profitable Market Share and Accelerate Market Penetration Everywhere
- Invest in Innovation: Invigorate Existing Market Opportunities and Focus on Emerging Megatrends
- Intensify Capabilities to Achieve Regional Self-Sufficiency
- Build High Performing and Diverse Global Talent
- Drive Consistent Superior Levels of Operational Excellence
5© 2015 3M. All Rights Reserved.Bernstein Strategic Decisions Conference 2015
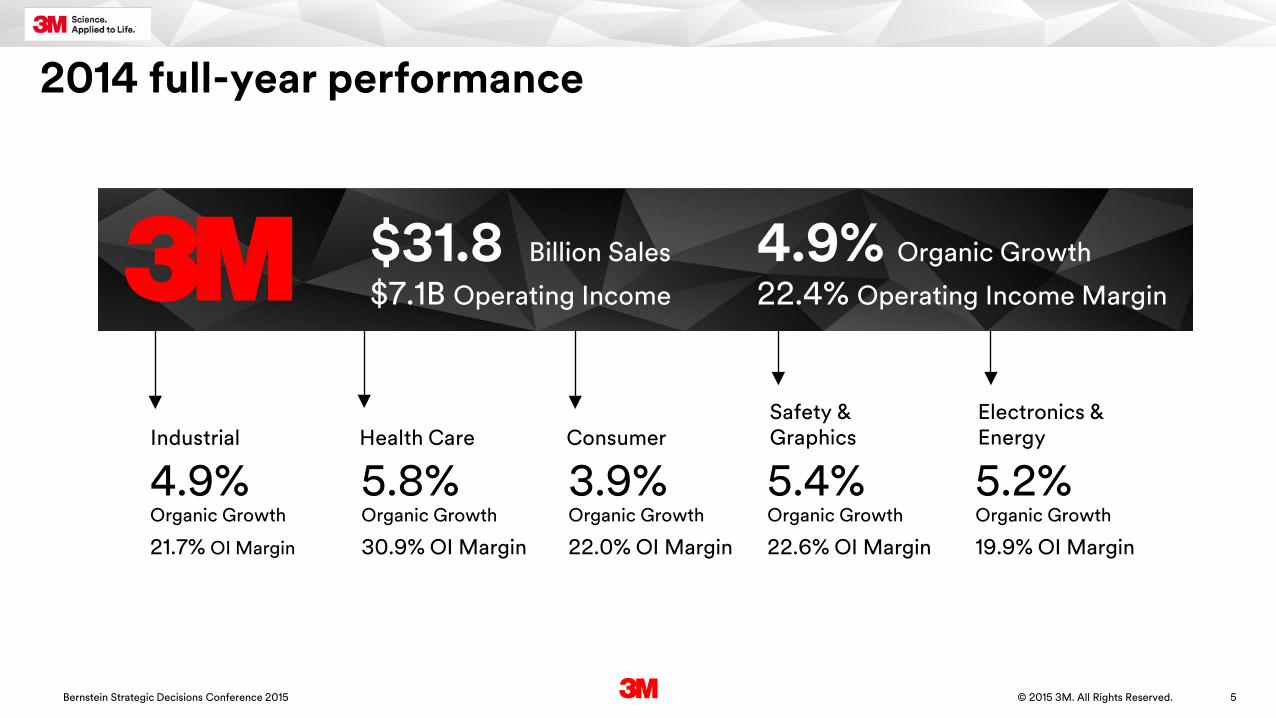
Industrial
4.9% Organic Growth
21.7% OI Margin
Health Care
5.8% Organic Growth
30.9% OI Margin
Consumer
3.9% Organic Growth
22.0% OI Margin
Safety & Graphics
5.4% Organic Growth
22.6% OI Margin
Electronics & Energy
5.2% Organic Growth
19.9% OI Margin
4.9% Organic Growth
22.4% Operating Income Margin
$31.8 Billion Sales
$7.1B Operating Income
2014 full-year performance
6Bernstein Strategic Decisions Conference 2015 © 2015 3M. All Rights Reserved.
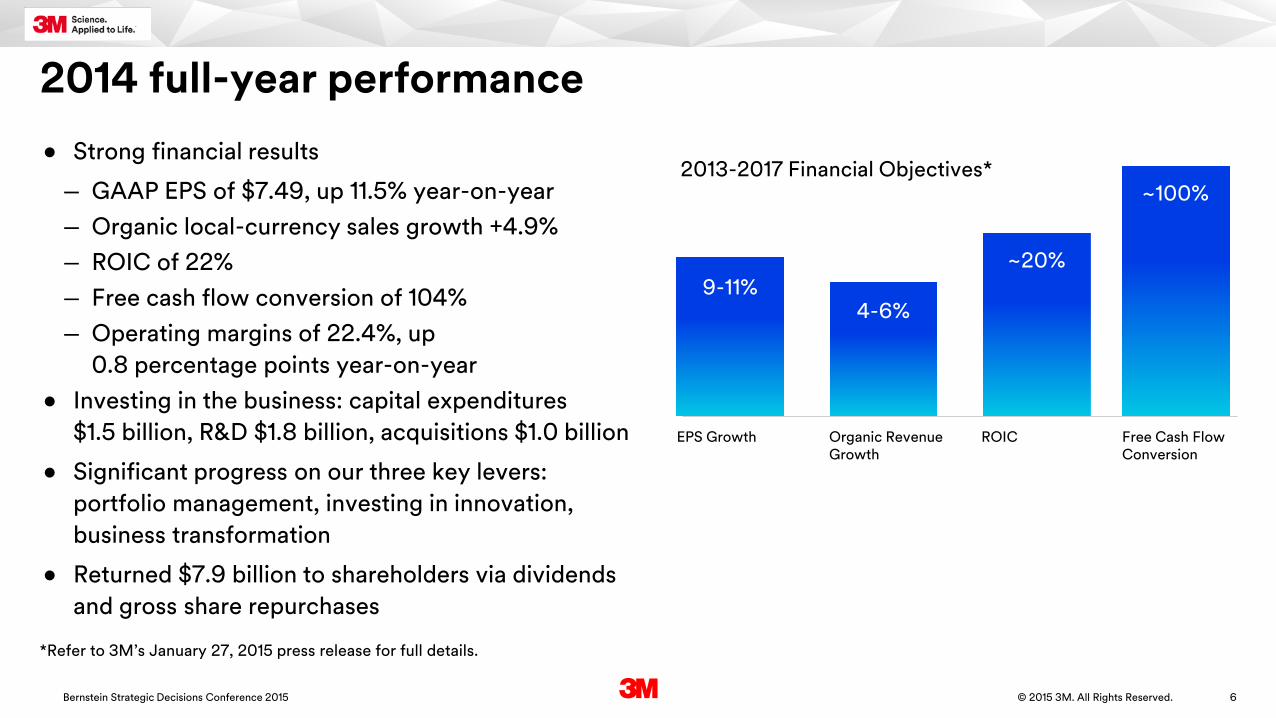
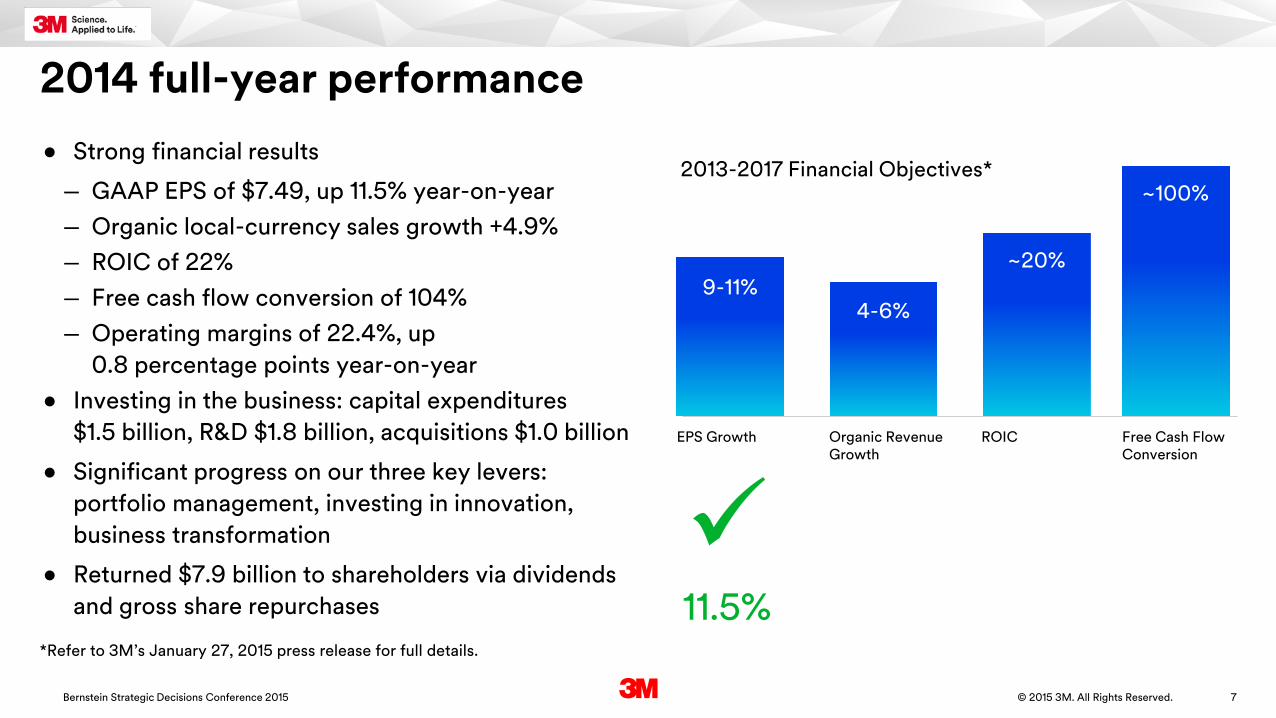
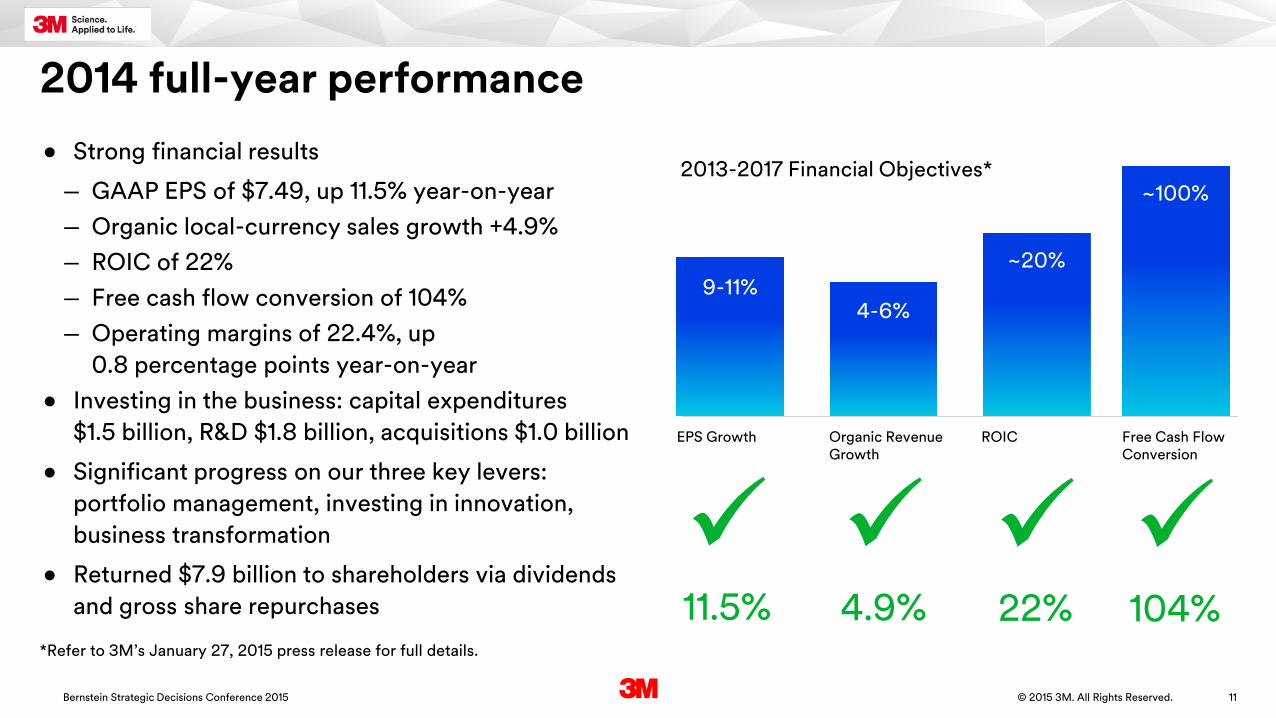
2014 full-year performance
*Refer to 3M’s January 27, 2015 press release for full details.
2013-2017 Financial Objectives*
Free Cash Flow Conversion
ROICOrganic Revenue Growth
EPS Growth
~100%
~20%
4-6%9-11%
• Strong financial results
― GAAP EPS of $7.49, up 11.5% year-on-year― Organic local-currency sales growth +4.9%― ROIC of 22%― Free cash flow conversion of 104%― Operating margins of 22.4%, up
0.8 percentage points year-on-year• Investing in the business: capital expenditures
$1.5 billion, R&D $1.8 billion, acquisitions $1.0 billion
• Significant progress on our three key levers: portfolio management, investing in innovation, business transformation
• Returned $7.9 billion to shareholders via dividends and gross share repurchases
7Bernstein Strategic Decisions Conference 2015 © 2015 3M. All Rights Reserved.
*Refer to 3M’s January 27, 2015 press release for full details.
2013-2017 Financial Objectives*
Free Cash Flow Conversion
ROICOrganic Revenue Growth
EPS Growth
~100%
~20%
4-6%9-11%
11.5%
• Strong financial results
― GAAP EPS of $7.49, up 11.5% year-on-year― Organic local-currency sales growth +4.9%― ROIC of 22%― Free cash flow conversion of 104%― Operating margins of 22.4%, up
0.8 percentage points year-on-year• Investing in the business: capital expenditures
$1.5 billion, R&D $1.8 billion, acquisitions $1.0 billion
• Significant progress on our three key levers: portfolio management, investing in innovation, business transformation
• Returned $7.9 billion to shareholders via dividends and gross share repurchases
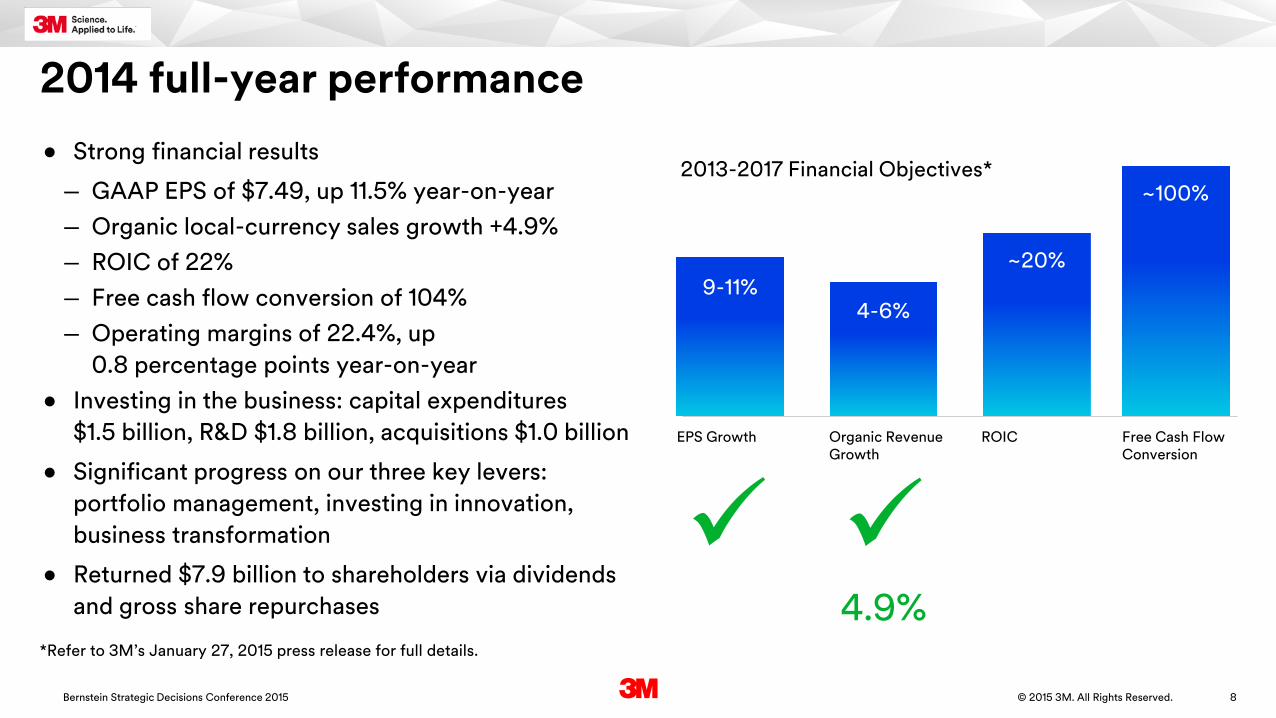
2014 full-year performance
8Bernstein Strategic Decisions Conference 2015 © 2015 3M. All Rights Reserved.
*Refer to 3M’s January 27, 2015 press release for full details.
2013-2017 Financial Objectives*
Free Cash Flow Conversion
ROICOrganic Revenue Growth
EPS Growth
~100%
~20%
4-6%9-11%
4.9%
• Strong financial results
― GAAP EPS of $7.49, up 11.5% year-on-year― Organic local-currency sales growth +4.9%― ROIC of 22%― Free cash flow conversion of 104%― Operating margins of 22.4%, up
0.8 percentage points year-on-year• Investing in the business: capital expenditures
$1.5 billion, R&D $1.8 billion, acquisitions $1.0 billion
• Significant progress on our three key levers: portfolio management, investing in innovation, business transformation
• Returned $7.9 billion to shareholders via dividends and gross share repurchases
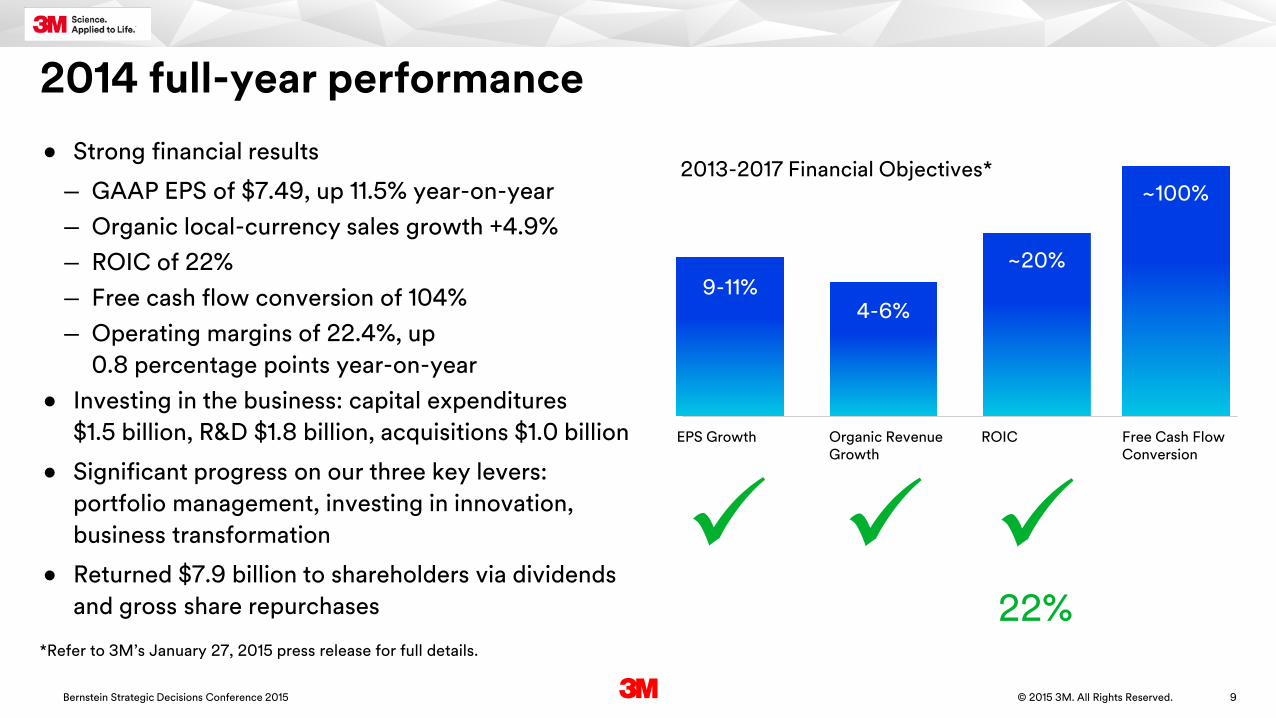
2014 full-year performance
9Bernstein Strategic Decisions Conference 2015 © 2015 3M. All Rights Reserved.
*Refer to 3M’s January 27, 2015 press release for full details.
2013-2017 Financial Objectives*
Free Cash Flow Conversion
ROICOrganic Revenue Growth
EPS Growth
~100%
~20%
4-6%9-11%
22%
• Strong financial results
― GAAP EPS of $7.49, up 11.5% year-on-year― Organic local-currency sales growth +4.9%― ROIC of 22%― Free cash flow conversion of 104%― Operating margins of 22.4%, up
0.8 percentage points year-on-year• Investing in the business: capital expenditures
$1.5 billion, R&D $1.8 billion, acquisitions $1.0 billion
• Significant progress on our three key levers: portfolio management, investing in innovation, business transformation
• Returned $7.9 billion to shareholders via dividends and gross share repurchases
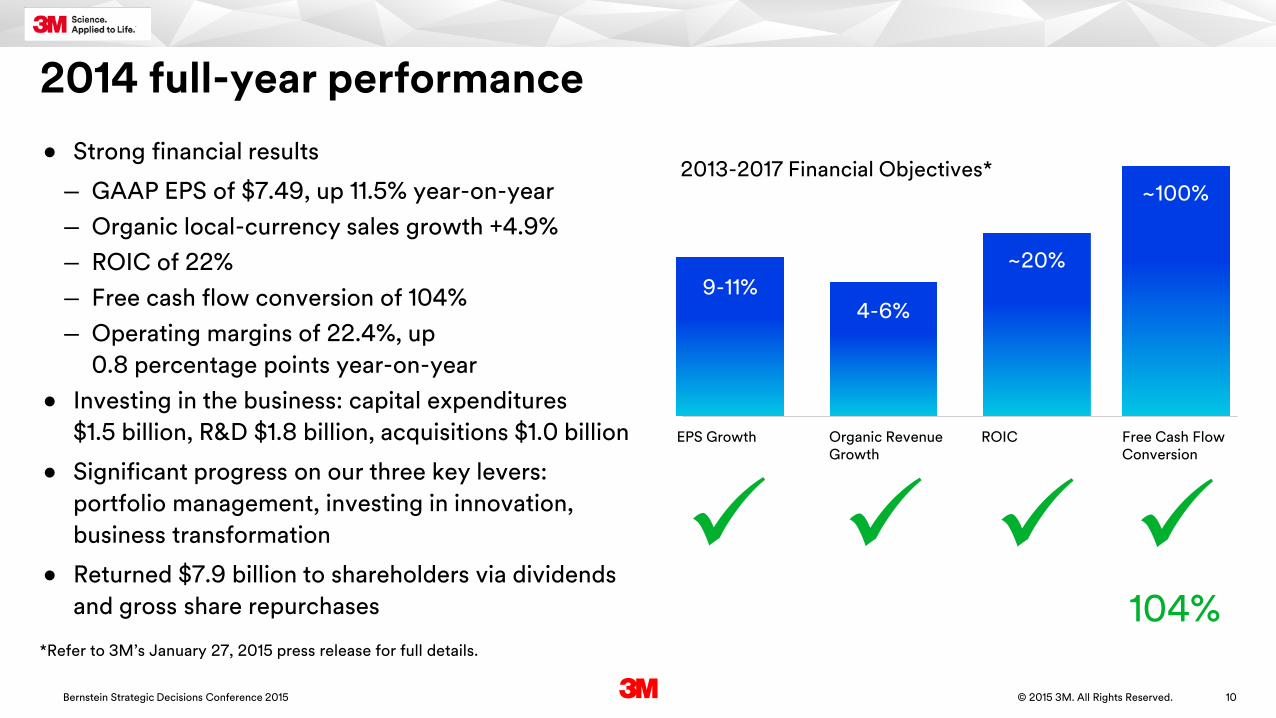
2014 full-year performance
10Bernstein Strategic Decisions Conference 2015 © 2015 3M. All Rights Reserved.
*Refer to 3M’s January 27, 2015 press release for full details.
2013-2017 Financial Objectives*
Free Cash Flow Conversion
ROICOrganic Revenue Growth
EPS Growth
~100%
~20%
4-6%9-11%
104%
• Strong financial results
― GAAP EPS of $7.49, up 11.5% year-on-year― Organic local-currency sales growth +4.9%― ROIC of 22%― Free cash flow conversion of 104%― Operating margins of 22.4%, up
0.8 percentage points year-on-year• Investing in the business: capital expenditures
$1.5 billion, R&D $1.8 billion, acquisitions $1.0 billion
• Significant progress on our three key levers: portfolio management, investing in innovation, business transformation
• Returned $7.9 billion to shareholders via dividends and gross share repurchases
2014 full-year performance
11Bernstein Strategic Decisions Conference 2015 © 2015 3M. All Rights Reserved.
*Refer to 3M’s January 27, 2015 press release for full details.
2013-2017 Financial Objectives*
Free Cash Flow Conversion
ROICOrganic Revenue Growth
EPS Growth
~100%
~20%
4-6%9-11%
104%
11.5%
4.9%
22%
• Strong financial results
― GAAP EPS of $7.49, up 11.5% year-on-year― Organic local-currency sales growth +4.9%― ROIC of 22%― Free cash flow conversion of 104%― Operating margins of 22.4%, up
0.8 percentage points year-on-year• Investing in the business: capital expenditures
$1.5 billion, R&D $1.8 billion, acquisitions $1.0 billion
• Significant progress on our three key levers: portfolio management, investing in innovation, business transformation
• Returned $7.9 billion to shareholders via dividends and gross share repurchases
2014 full-year performance
12Bernstein Strategic Decisions Conference 2015 © 2015 3M. All Rights Reserved.
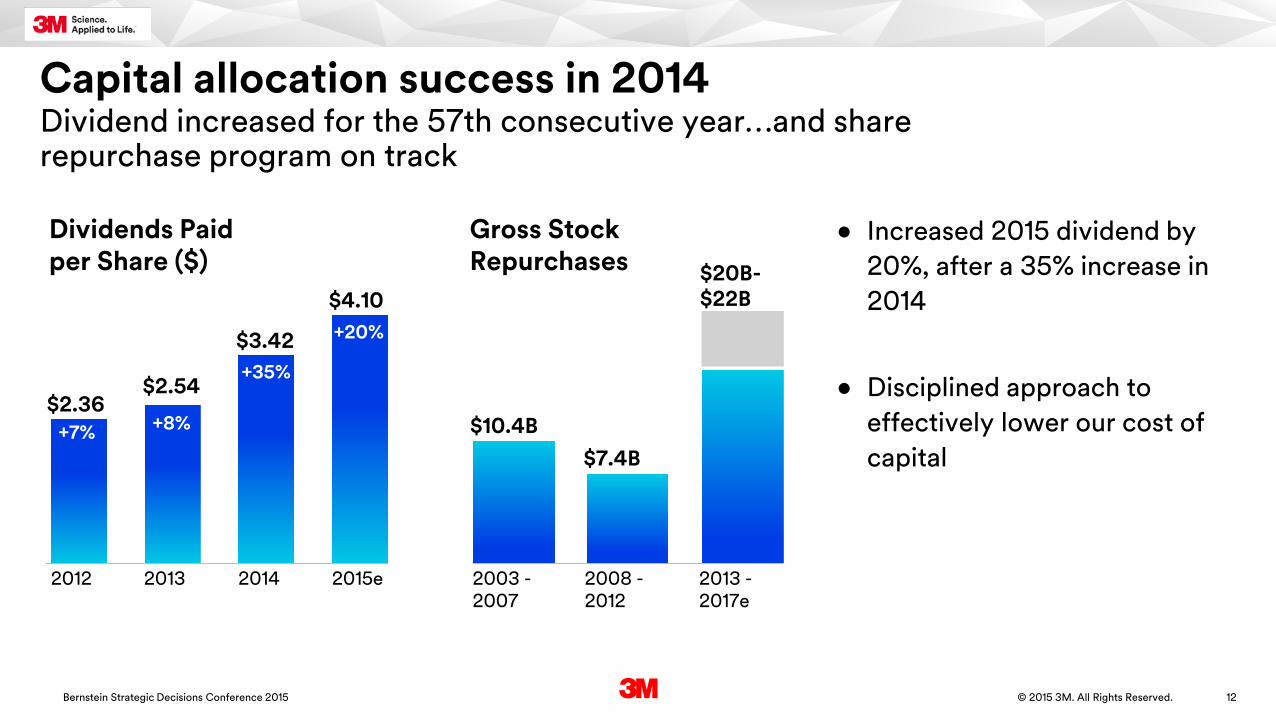
Capital allocation success in 2014Dividend increased for the 57th consecutive year…and share repurchase program on track
2015e20142012 2013
Dividends Paid per Share ($)
• Increased 2015 dividend by 20%, after a 35% increase in 2014
• Disciplined approach to effectively lower our cost of capital
+7%
+35%
+20%
+8%$2.36
$2.54
$3.42
$4.10
2013 -2017e
2003 -2007
2008 -2012
Gross Stock Repurchases $20B-
$22B
$7.4B$10.4B
13© 2015 3M. All Rights Reserved.Bernstein Strategic Decisions Conference 2015
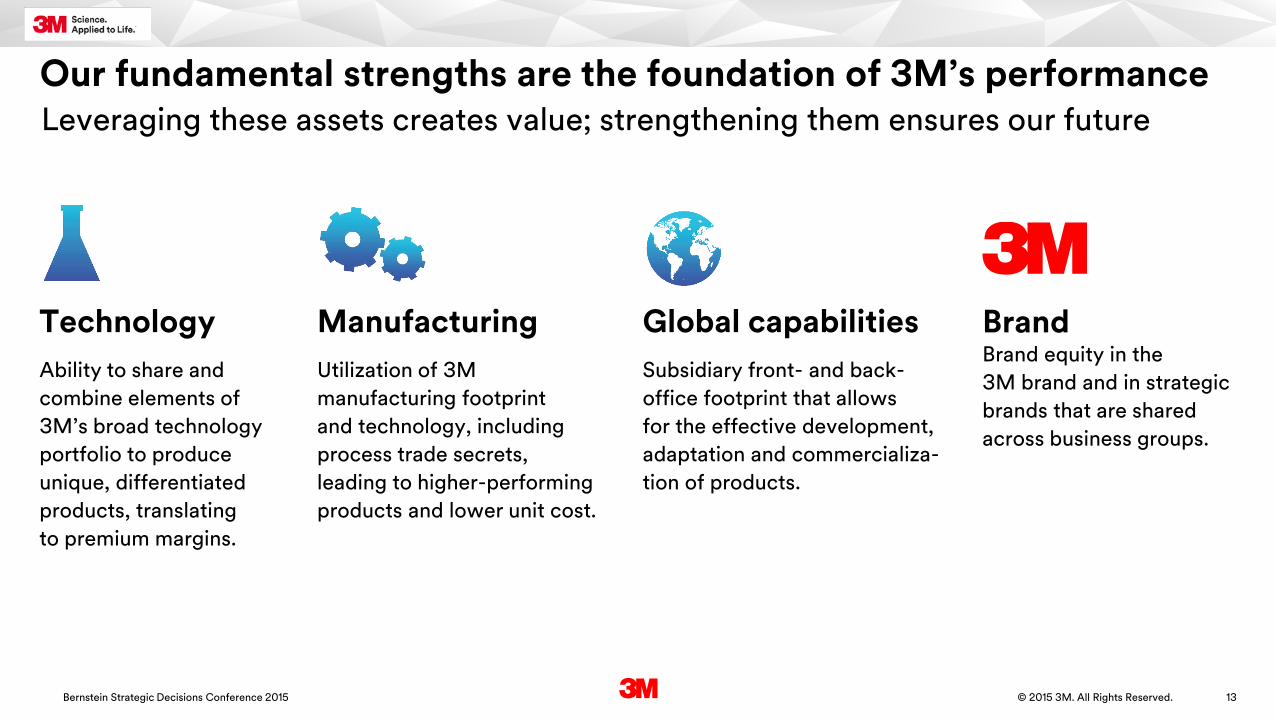
Our fundamental strengths are the foundation of 3M’s performanceLeveraging these assets creates value; strengthening them ensures our future
BrandBrand equity in the 3M brand and in strategic brands that are shared across business groups.
Global capabilitiesSubsidiary front- and back-office footprint that allows for the effective development, adaptation and commercializa-tion of products.
ManufacturingUtilization of 3M manufacturing footprint and technology, including process trade secrets, leading to higher-performing products and lower unit cost.
TechnologyAbility to share and combine elements of 3M’s broad technology portfolio to produce unique, differentiated products, translating to premium margins.
14© 2015 3M. All Rights Reserved.Bernstein Strategic Decisions Conference 2015
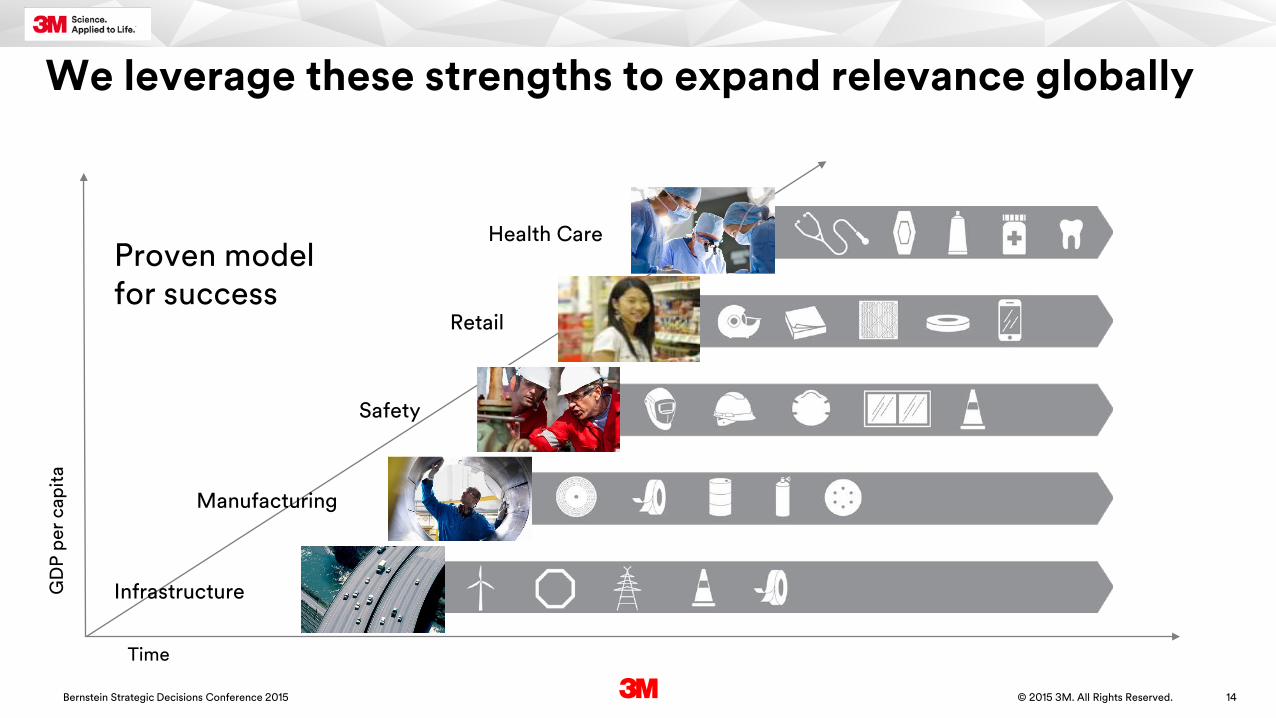
We leverage these strengths to expand relevance globally
Proven modelfor success
Infrastructure
Manufacturing
Safety
Retail
Health Care
GD
P pe
r cap
ita
Time
15© 2015 3M. All Rights Reserved.Bernstein Strategic Decisions Conference 2015
Three key levers
Investing in Innovation Business TransformationPortfolio Management

16© 2015 3M. All Rights Reserved.Bernstein Strategic Decisions Conference 2015
Roadmap• Continue portfolio management deployment
across the corporation
• Reallocate resources to 3M’s best opportunities
• Augment organic growth through M&A playbook
Portfolio actions continue to create value
Portfolio Management
17© 2015 3M. All Rights Reserved.Bernstein Strategic Decisions Conference 2015
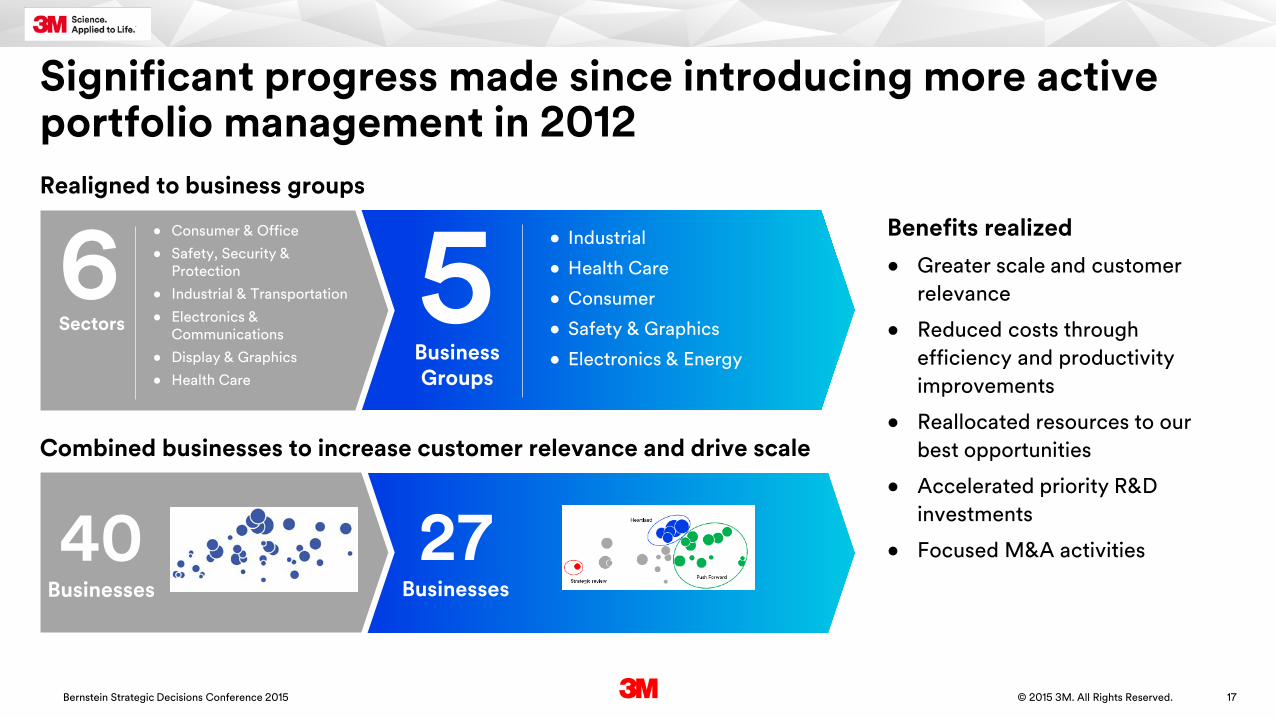
Significant progress made since introducing more active portfolio management in 2012
Benefits realized• Greater scale and customer
relevance
• Reduced costs through efficiency and productivity improvements
• Reallocated resources to our best opportunities
• Accelerated priority R&D investments
• Focused M&A activities
Combined businesses to increase customer relevance and drive scale
• Consumer & Office• Safety, Security &
Protection• Industrial & Transportation• Electronics &
Communications• Display & Graphics• Health Care
• Industrial
• Health Care
• Consumer
• Safety & Graphics
• Electronics & EnergyBusiness Groups
5Realigned to business groups
6Sectors
27Businesses
40Businesses
18© 2015 3M. All Rights Reserved.Bernstein Strategic Decisions Conference 2015
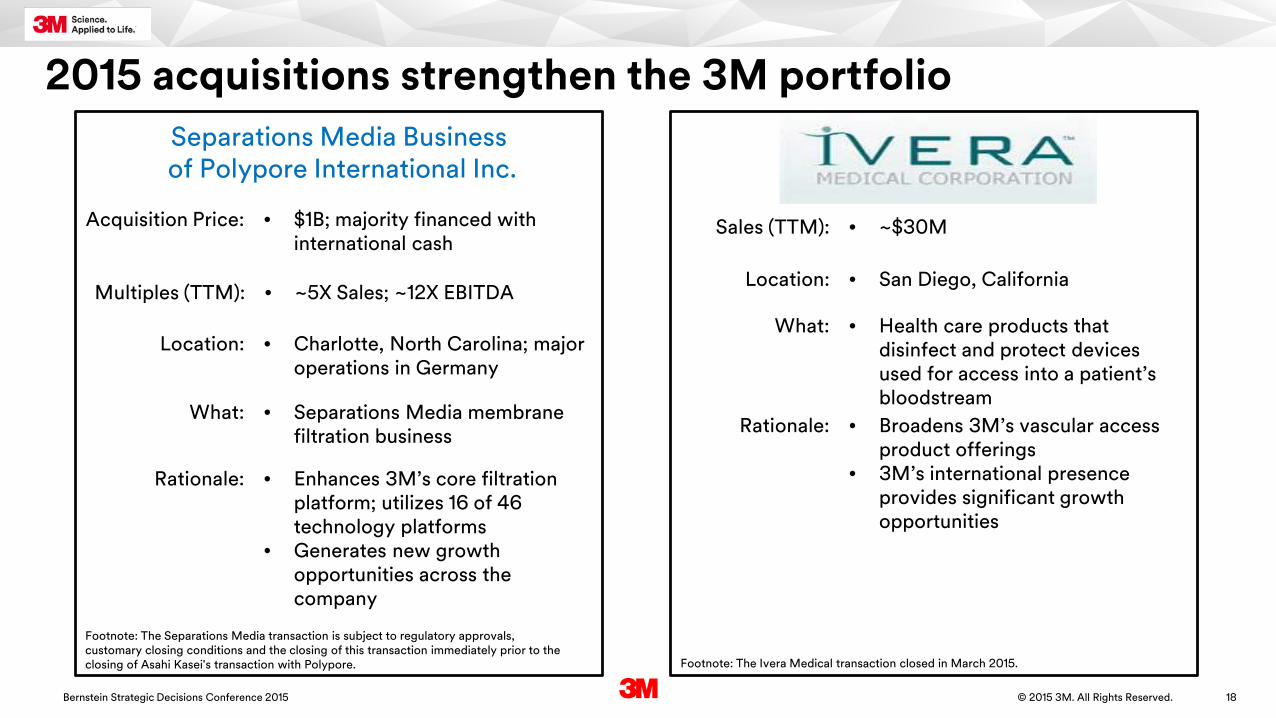
2015 acquisitions strengthen the 3M portfolio
• Charlotte, North Carolina; major operations in Germany
Location:
• Separations Media membrane filtration business
What:
• $1B; majority financed with international cash
Acquisition Price:
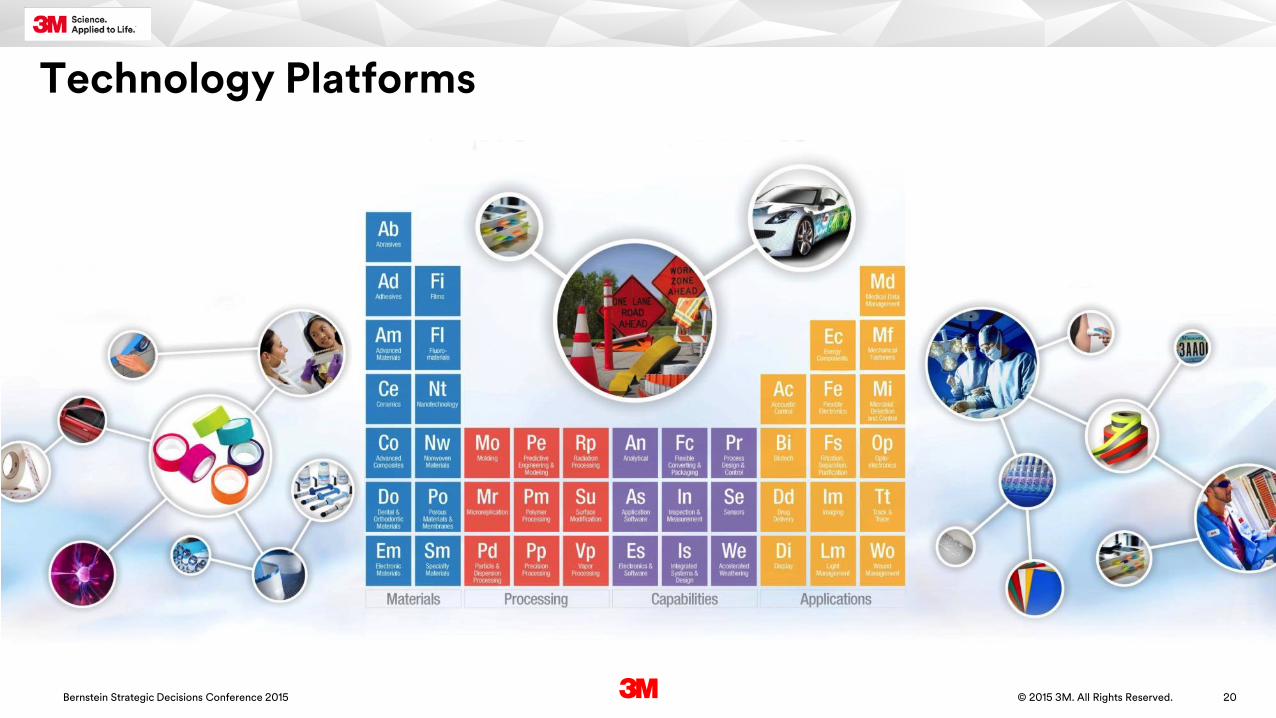
• Enhances 3M’s core filtration platform; utilizes 16 of 46 technology platforms
• Generates new growth opportunities across the company
Rationale:
• San Diego, CaliforniaLocation:
• Health care products that disinfect and protect devices used for access into a patient’s bloodstream
What:
• Broadens 3M’s vascular access product offerings
• 3M’s international presence provides significant growth opportunities
Rationale:
• ~5X Sales; ~12X EBITDAMultiples (TTM):
• ~$30MSales (TTM):
Separations Media Businessof Polypore International Inc.
Footnote: The Separations Media transaction is subject to regulatory approvals, customary closing conditions and the closing of this transaction immediately prior to the closing of Asahi Kasei's transaction with Polypore. Footnote: The Ivera Medical transaction closed in March 2015.
19© 2015 3M. All Rights Reserved.Bernstein Strategic Decisions Conference 2015
Roadmap• Enhance commercialization effectiveness through
customer insights
• Increase R&D investment and productivity
• Build new platforms for growth by extending the core and investing in disruptive technologies
Increasing customer relevance through innovation
Investing in Innovation
20© 2015 3M. All Rights Reserved.Bernstein Strategic Decisions Conference 2015
Technology Platforms
21© 2015 3M. All Rights Reserved.Bernstein Strategic Decisions Conference 2015
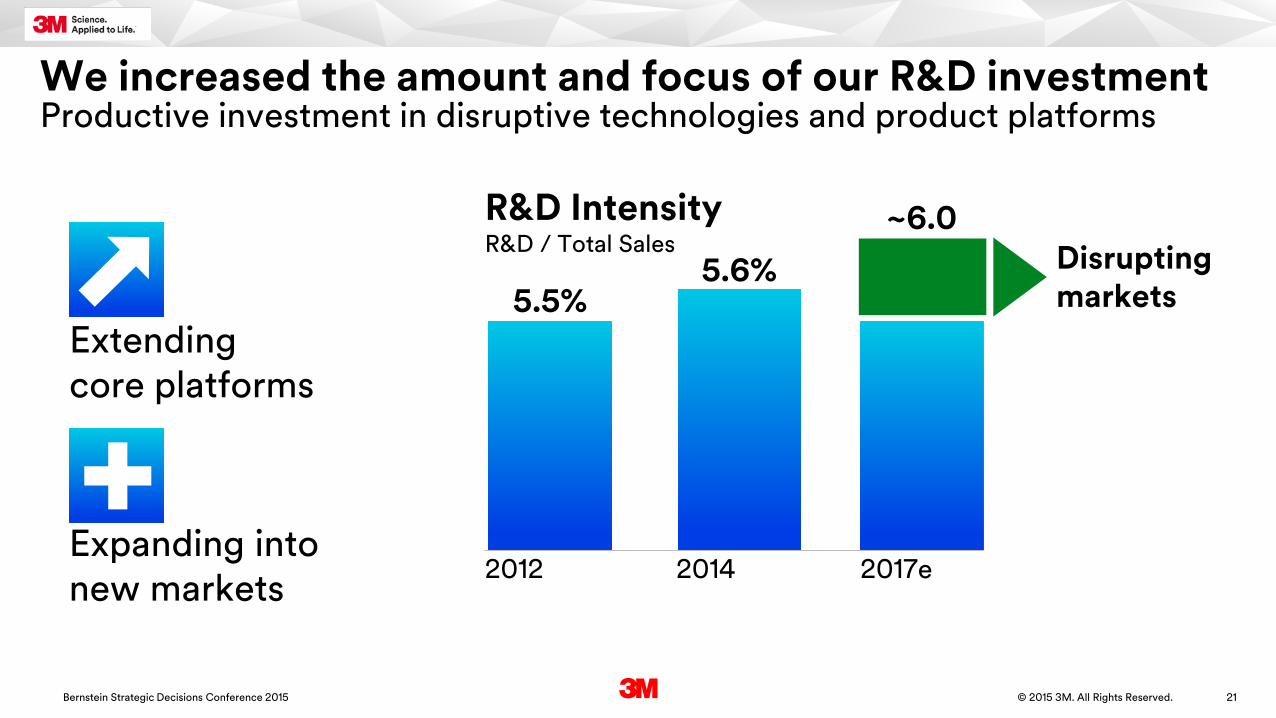
We increased the amount and focus of our R&D investment
R&D IntensityR&D / Total Sales
2014 2017e2012
Productive investment in disruptive technologies and product platforms
Extending core platforms
Expanding into new markets
Disrupting markets5.5%
~6.0%5.6%
22© 2015 3M. All Rights Reserved.Bernstein Strategic Decisions Conference 2015
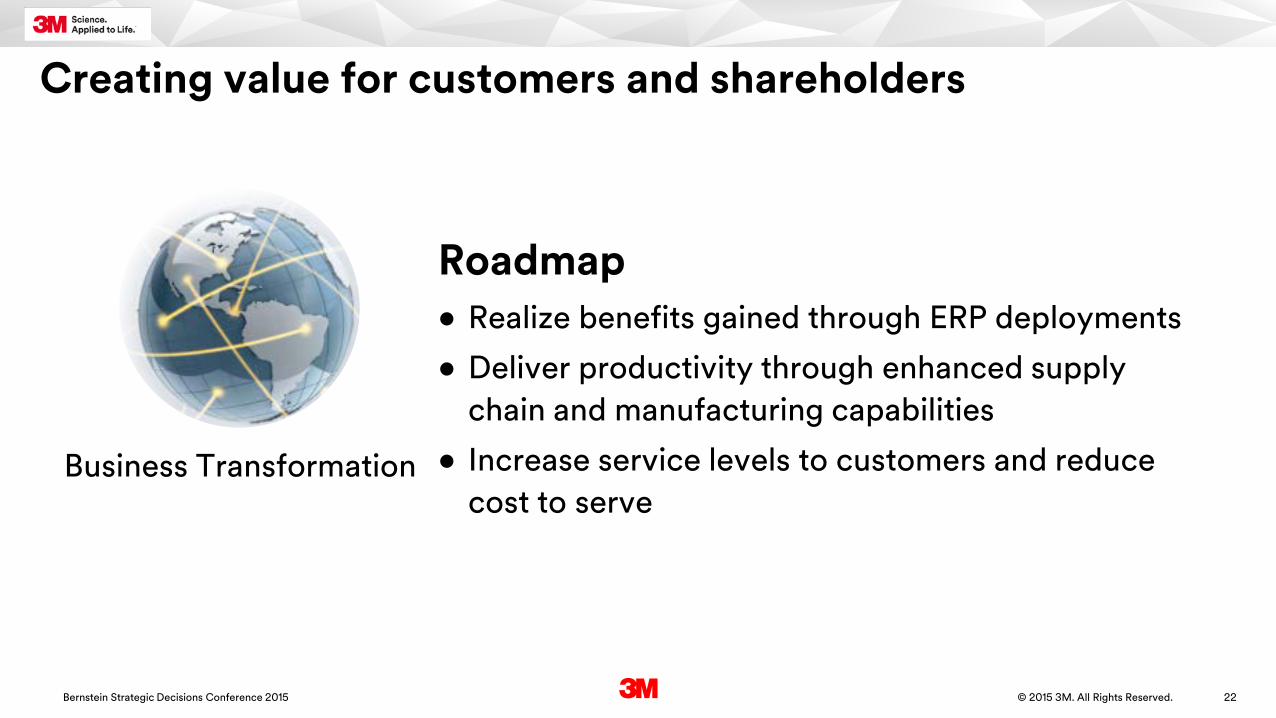
Roadmap• Realize benefits gained through ERP deployments
• Deliver productivity through enhanced supply chain and manufacturing capabilities
• Increase service levels to customers and reduce cost to serve
Creating value for customers and shareholders
Business Transformation
23© 2015 3M. All Rights Reserved.Bernstein Strategic Decisions Conference 2015
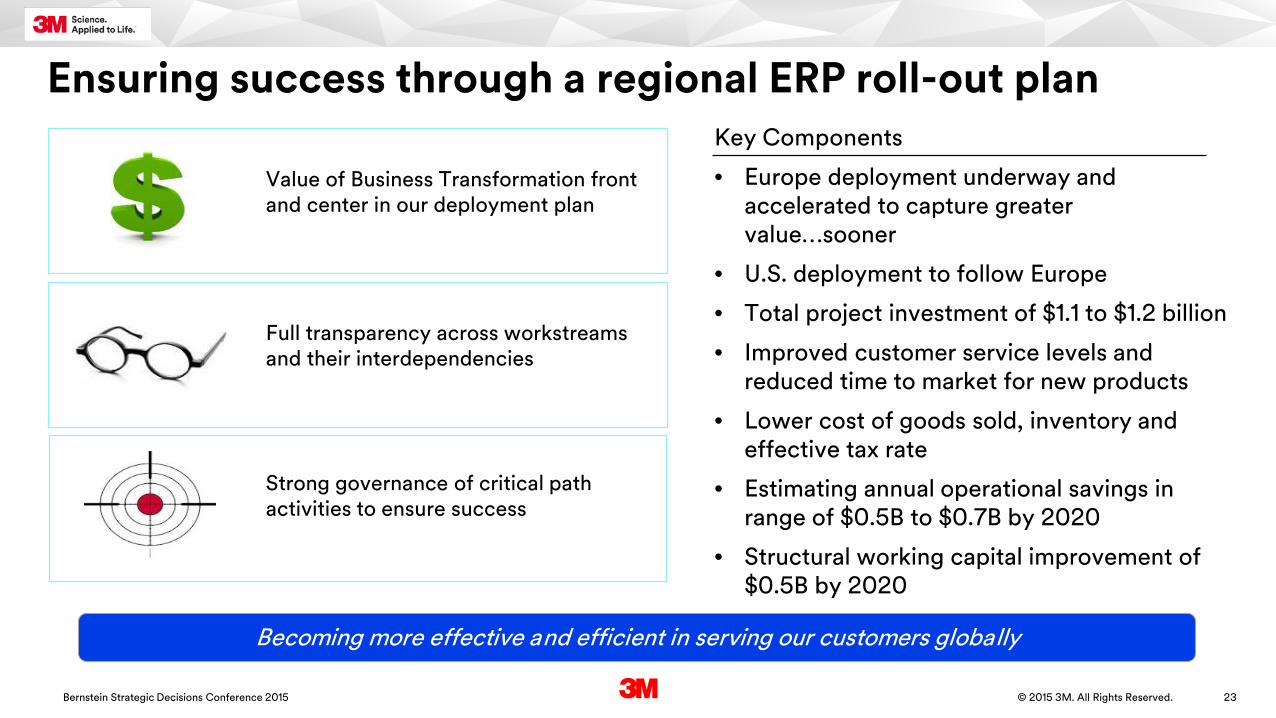
Ensuring success through a regional ERP roll-out planKey Components
• Europe deployment underway and accelerated to capture greater value…sooner
• U.S. deployment to follow Europe
• Total project investment of $1.1 to $1.2 billion
• Improved customer service levels and reduced time to market for new products
• Lower cost of goods sold, inventory and effective tax rate
• Estimating annual operational savings in range of $0.5B to $0.7B by 2020
• Structural working capital improvement of $0.5B by 2020
Full transparency across workstreams and their interdependencies
Strong governance of critical path activities to ensure success
Value of Business Transformation front and center in our deployment plan
Becoming more effective and efficient in serving our customers globally
24© 2015 3M. All Rights Reserved.Bernstein Strategic Decisions Conference 2015
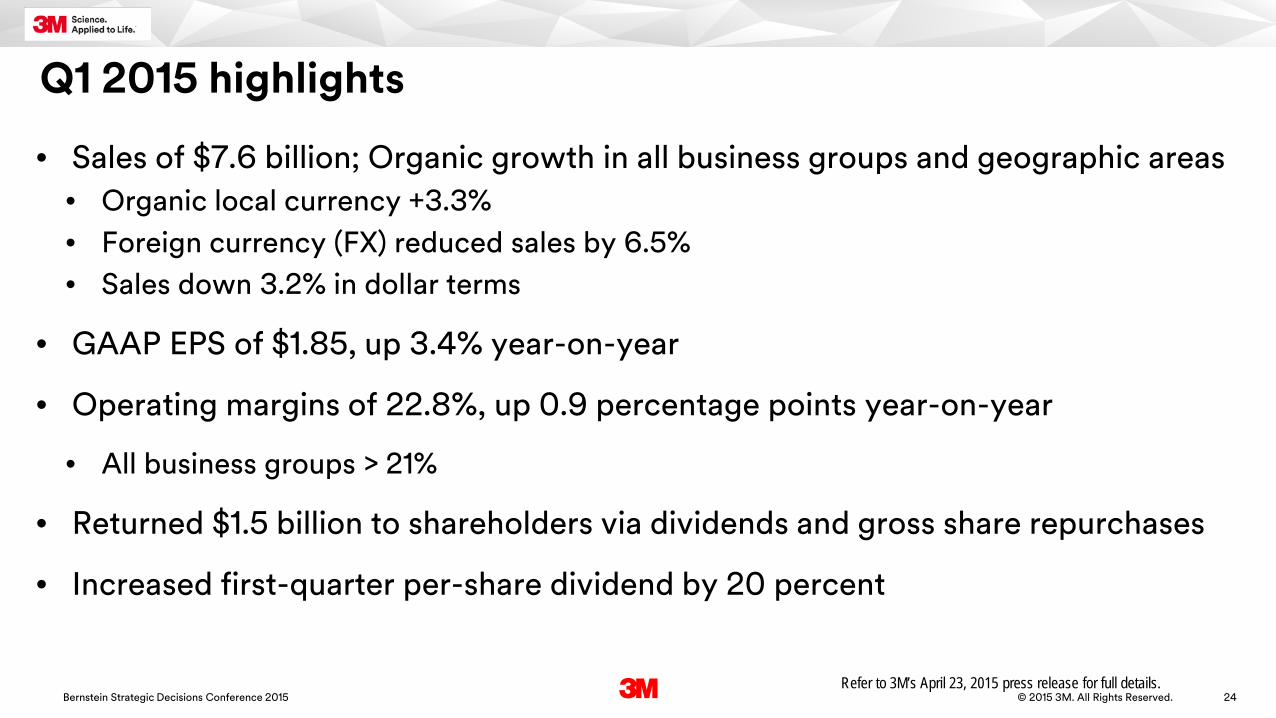
• Sales of $7.6 billion; Organic growth in all business groups and geographic areas• Organic local currency +3.3%• Foreign currency (FX) reduced sales by 6.5%• Sales down 3.2% in dollar terms
• GAAP EPS of $1.85, up 3.4% year-on-year
• Operating margins of 22.8%, up 0.9 percentage points year-on-year
• All business groups > 21%
• Returned $1.5 billion to shareholders via dividends and gross share repurchases
• Increased first-quarter per-share dividend by 20 percent
Q1 2015 highlights
Refer to 3M’s April 23, 2015 press release for full details.

25© 2015 3M. All Rights Reserved.Bernstein Strategic Decisions Conference 2015

26© 2015 3M. All Rights Reserved.Bernstein Strategic Decisions Conference 2015
Appendix
27© 2015 3M. All Rights Reserved.Bernstein Strategic Decisions Conference 2015
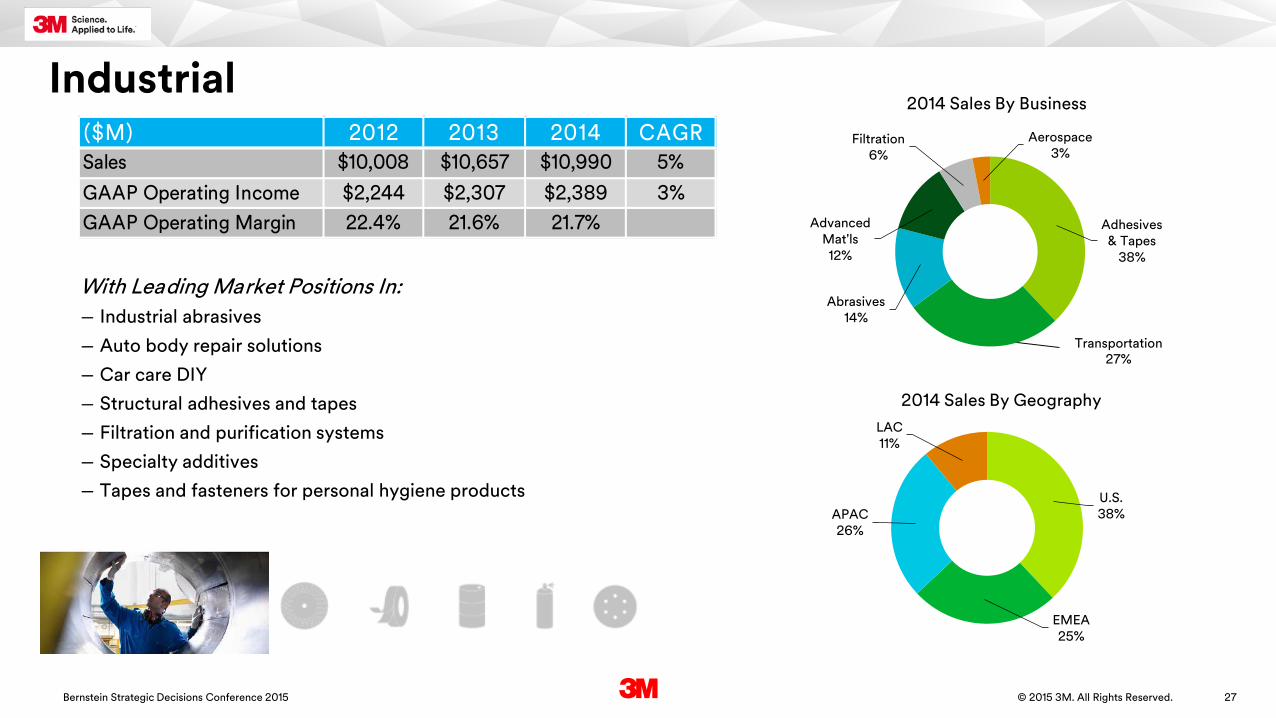
Industrial
With Leading Market Positions In:― Industrial abrasives― Auto body repair solutions― Car care DIY― Structural adhesives and tapes― Filtration and purification systems― Specialty additives― Tapes and fasteners for personal hygiene products
Adhesives & Tapes
38%
Abrasives14%
Advanced Mat'ls12%
Filtration6%
Aerospace3%
Transportation 27%
U.S.38%
EMEA25%
APAC26%
LAC11%
2014 Sales By Business
2014 Sales By Geography
($M) 2012 2013 2014 CAGR Sales $10,008 $10,657 $10,990 5%GAAP Operating Income $2,244 $2,307 $2,389 3%GAAP Operating Margin 22.4% 21.6% 21.7%
28© 2015 3M. All Rights Reserved.Bernstein Strategic Decisions Conference 2015
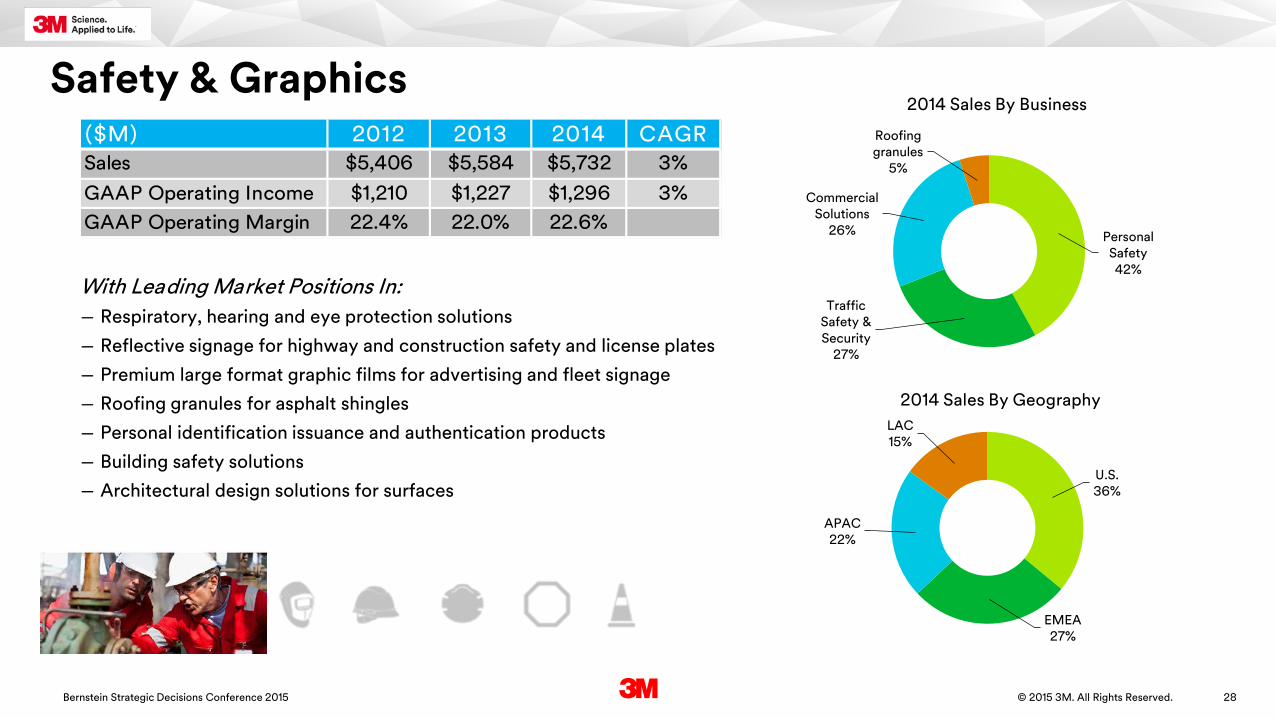
Safety & Graphics
Personal Safety42%
Traffic Safety & Security
27%
Commercial Solutions
26%
Roofing granules
5%
U.S.36%
EMEA27%
APAC22%
LAC15%
2014 Sales By Business
2014 Sales By Geography
With Leading Market Positions In:― Respiratory, hearing and eye protection solutions― Reflective signage for highway and construction safety and license plates― Premium large format graphic films for advertising and fleet signage― Roofing granules for asphalt shingles― Personal identification issuance and authentication products― Building safety solutions― Architectural design solutions for surfaces
($M) 2012 2013 2014 CAGR Sales $5,406 $5,584 $5,732 3%GAAP Operating Income $1,210 $1,227 $1,296 3%GAAP Operating Margin 22.4% 22.0% 22.6%
29© 2015 3M. All Rights Reserved.Bernstein Strategic Decisions Conference 2015
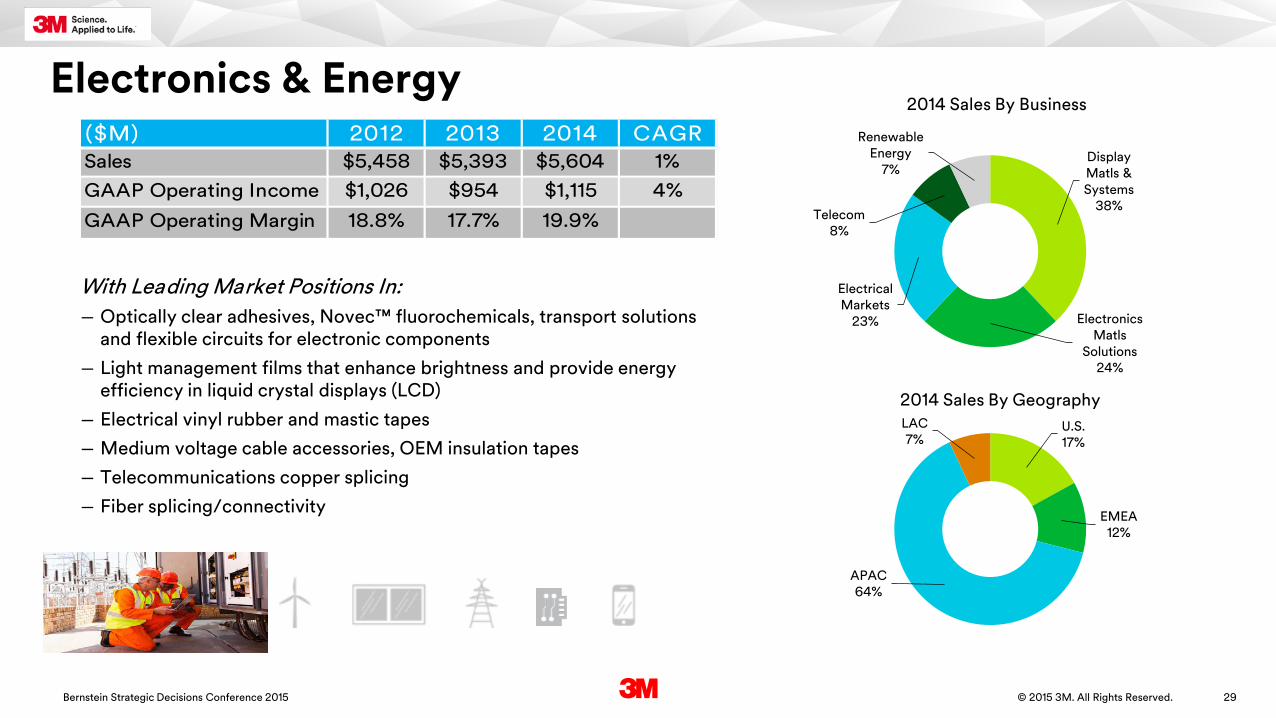
U.S.17%
EMEA12%
APAC64%
LAC7%
2014 Sales By Business
2014 Sales By Geography
Display Matls & Systems
38%
Electronics Matls
Solutions24%
Electrical Markets
23%
Telecom8%
Renewable Energy
7%
Electronics & Energy
With Leading Market Positions In:― Optically clear adhesives, Novec™ fluorochemicals, transport solutions
and flexible circuits for electronic components― Light management films that enhance brightness and provide energy
efficiency in liquid crystal displays (LCD)― Electrical vinyl rubber and mastic tapes― Medium voltage cable accessories, OEM insulation tapes― Telecommunications copper splicing ― Fiber splicing/connectivity
($M) 2012 2013 2014 CAGR Sales $5,458 $5,393 $5,604 1%GAAP Operating Income $1,026 $954 $1,115 4%
GAAP Operating Margin 18.8% 17.7% 19.9%
30© 2015 3M. All Rights Reserved.Bernstein Strategic Decisions Conference 2015
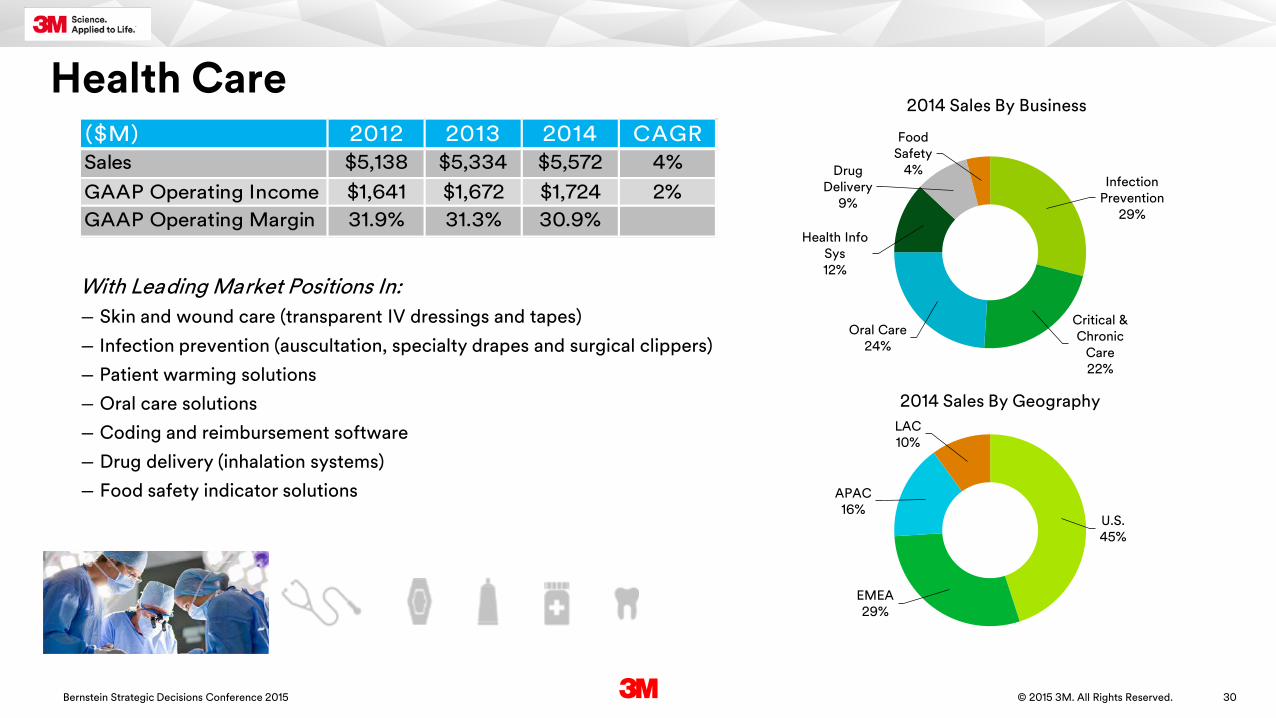
Health Care
Infection Prevention
29%
Critical & Chronic
Care22%
Oral Care24%
Health Info Sys12%
Drug Delivery
9%
Food Safety
4%
U.S.45%
EMEA29%
APAC16%
LAC10%
2014 Sales By Business
2014 Sales By Geography
With Leading Market Positions In:― Skin and wound care (transparent IV dressings and tapes)― Infection prevention (auscultation, specialty drapes and surgical clippers)― Patient warming solutions― Oral care solutions― Coding and reimbursement software― Drug delivery (inhalation systems)― Food safety indicator solutions
($M) 2012 2013 2014 CAGR Sales $5,138 $5,334 $5,572 4%GAAP Operating Income $1,641 $1,672 $1,724 2%GAAP Operating Margin 31.9% 31.3% 30.9%
31© 2015 3M. All Rights Reserved.Bernstein Strategic Decisions Conference 2015
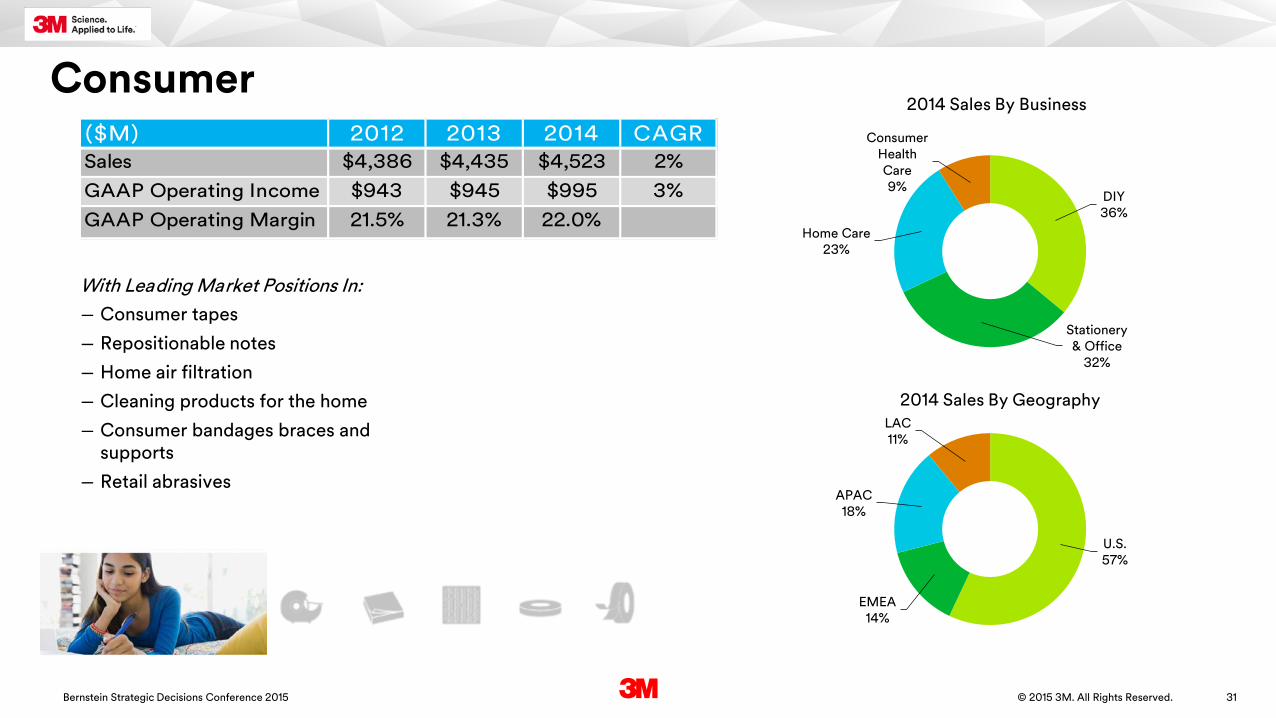
Consumer
U.S.57%
EMEA14%
APAC18%
LAC11%
2014 Sales By Business
2014 Sales By Geography
DIY36%
Stationery & Office
32%
Home Care23%
Consumer Health Care9%
With Leading Market Positions In:― Consumer tapes― Repositionable notes― Home air filtration― Cleaning products for the home― Consumer bandages braces and
supports― Retail abrasives
($M) 2012 2013 2014 CAGR Sales $4,386 $4,435 $4,523 2%GAAP Operating Income $943 $945 $995 3%GAAP Operating Margin 21.5% 21.3% 22.0%

32© 2015 3M. All Rights Reserved.Bernstein Strategic Decisions Conference 2015