Thrombodynamics Analyzer System T2 (T2 F and T2 T models) … · 2019-04-09 · Thrombodynamics...
86
Thrombodynamics Analyzer System T2 (T2-F and T2-T models) US USER MANUAL Version 1.3 released 25.03.2019
Transcript of Thrombodynamics Analyzer System T2 (T2 F and T2 T models) … · 2019-04-09 · Thrombodynamics...

Thrombodynamics Analyzer System T2 (T2-F and T2-T models)
US USER MANUAL
Version 1.3 released 25.03.2019

Thrombodynamics Analyzer System T2 US User Manual
version 1.3
2

Thrombodynamics Analyzer System T2 US User Manual
version 1.3
3
Copyright © 2010-2019 HemaCore, HemaCore Labs.
All rights reserved. No part of this manual may be reproduced or transmitted in any form or by any means without the written permission of HemaCore Labs.
SUPPORT:
Company headquarters:
HemaCore Russia, Moscow, Nauchnyi proezd, 20, building 2 Phone: +7-495-258-2538 Fax: +7-495-258-2538 Web: www.hemacore.com E-mail: [email protected]
Authorized representative in European Community:
HemaCore SA 15, rue du Cendrier, CH-1211 Geneva 1, Switzerland Tel: +41 22 732 1220 E-mail: [email protected] Find local representative in your country by visiting www.hemacore.com
INTENDED USE:
Thrombodynamics Analyzer System T2 is intended for basic research use to provide qualitative and quantitative evaluation of the coagulation state of a blood plasma sample. For this, the Thrombodynamics Analyzer System T2 records and analyses spatiotemporal dynamics of the formation/lysis of a fibrin clot (T2-F and T2-T models) and spatiotemporal dynamics of thrombin generation (only T2-T model). Clotting starts from the localized coagulation activator and propagates in a thin layer of non-stirred blood plasma sample. The T2 system analyses spatiotemporal dynamics of fibrin clot formation (T2-F and T2-T models) and thrombin generation (only T2-T model) and calculates numerical parameters describing the coagulation process.
Thrombodynamics Analyzer System T2 provides specific reagents intended to be used with the system, as additives to the blood plasma sample: Thrombodynamics TDX kit, Thrombodynamics-4D PLS kit and Thrombodynamics Control kit.
Thrombodynamics TDX Kit is an in vitro kit used to perform measurements of spatiotemporal dynamics of fibrin clot formation in blood plasma samples. The kit is intended for professional use in the laboratory with Thrombodynamics Analyzer System T2 only.
Thrombodynamics-4D PLS Kit is an in vitro kit used to perform measurements of spatiotemporal dynamics of fibrin clot formation and thrombin generation in blood plasma samples. The kit is intended for professional use in the laboratory with Thrombodynamics Analyzer System T2 only.
Thrombodynamics Control Kit is an in vitro kit used for quality control procedures. The kit is intended for professional use in the laboratory with Thrombodynamics Analyzer System T2 only.
Results from the Thrombodynamics Analyzer System T2 should not be the basis for a patient diagnosis. The Thrombodynamics Analyzer System T2 is for Professional Use Only.
Thrombodynamics Analyzer System and Kits are intended for Research Use Only in EU, USA and Canada.

Thrombodynamics Analyzer System T2 US User Manual
version 1.3
4
Revision History:
User Manual Version
Software version
Date Changes
0.5 4.0.0 31/08/2016 First beta version
0.7 4.0.0.33 16/11/2016 Sections 5.1.3 and 9 updated, Sections 5.2.7 and 11 added
0.8 4.0.0.3905 08/09/2017 User manual revised to fit all models (T2-T, T2-F) of Thrombodynamics Analyzer System T2
0.9 4.0.0.4010 04/11/2017 Some broken links fixed
1.0 4.0.0.4010 03/04/2018 Section 6.6.3 updated
1.1 4.0.6.4650 15/10/2018 Authorized representative address changed
1.2 4.0.7.4838 22/02/2019 Screenshots update, section 6.4 updated, minor text corrections
1.3 4.0.7.4838 25/03/2019 Minor text corrections.

Thrombodynamics Analyzer System T2 US User Manual
version 1.3
5
Table of Content
1 Introduction ........................................................................................................................................... 9
1.1 Intended use ................................................................................................................................. 9
1.2 Subject to change ........................................................................................................................ 10
1.3 Depository ................................................................................................................................... 10
1.4 Used abbreviations ..................................................................................................................... 10
1.5 Warning concept ......................................................................................................................... 10
1.6 Other applicable documents....................................................................................................... 11
1.7 Target group................................................................................................................................ 11
2 T2 Analyzer: the basic principles of operation .................................................................................... 12
2.1 Measuring principle .................................................................................................................... 12
2.2 Performance characteristics ....................................................................................................... 13
2.3 Thrombodynamics and Thrombodynamics-4D parameters ....................................................... 13
2.3.1 Parameters of fibrin dynamics: ............................................................................................... 13
2.3.2 Parameters of thrombin dynamics (Thrombodynamics-4D, T2-T model only) ...................... 16
2.4 Reference ranges ........................................................................................................................ 18
2.5 Blood sample types ..................................................................................................................... 18
2.5.1 Citrated fresh platelet free plasma samples (fresh PFP) ........................................................ 18
2.5.2 Citrated frozen platelet free plasma samples (frozen PFP) .................................................... 19
2.5.3 Control plasma samples .......................................................................................................... 19
2.6 Data analysis ............................................................................................................................... 20
3 System description and installation .................................................................................................... 21
3.1 Thrombodynamics Analyzer System T2 ...................................................................................... 21
3.1.1 Thrombodynamics Analyzer T2 ............................................................................................... 21
3.1.2 Software .................................................................................................................................. 22
3.1.3 Thrombodynamics Kits ............................................................................................................ 23
3.1.3.1 Thrombodynamics TDX Kit .............................................................................................. 23
3.1.3.2 Thrombodynamics-4D PLS Kit ......................................................................................... 23
3.1.3.3 Thrombodynamics Control Kit ........................................................................................ 24
3.1.4 Service kit ................................................................................................................................ 24
3.2 Thrombodynamics Analyzer System T2 installation ................................................................... 25
3.2.1 Site installation requirements ................................................................................................. 25
3.2.2 Preparing for operation .......................................................................................................... 25
4 Safety ................................................................................................................................................... 26
4.1 General safety requirements ...................................................................................................... 26
4.2 Environmental conditions ........................................................................................................... 26

Thrombodynamics Analyzer System T2 US User Manual
version 1.3
6
4.3 Personal safety ............................................................................................................................ 26
4.3.1 Electrical hazards .................................................................................................................... 26
4.3.2 Biohazard ................................................................................................................................ 26
5 Running measurements ....................................................................................................................... 27
5.1 Sample preparation .................................................................................................................... 27
5.1.1 Working on fresh plasma samples .......................................................................................... 27
5.1.1.1 Blood collection .............................................................................................................. 27
5.1.1.2 Platelet free plasma preparation. ................................................................................... 28
5.1.2 Working on frozen plasma samples ........................................................................................ 29
5.1.3 Working on control plasma samples ....................................................................................... 29
5.1.3.1 Preparation of Thrombodynamics Control kit ................................................................ 29
5.1.3.2 Preparation of fresh PFP Control Material pool ............................................................. 29
5.1.3.3 Preparation of frozen PFP Control Material pool ........................................................... 29
5.2 Running samples ......................................................................................................................... 30
5.2.1 Starting the T2 Analyzer and the Software ............................................................................. 30
5.2.2 Samples registration ............................................................................................................... 30
5.2.3 Preparation of the Reagent PLS .............................................................................................. 31
5.2.4 Samples and reagents handling .............................................................................................. 31
5.2.5 Samples incubation ................................................................................................................. 32
5.2.6 Starting the measurement ...................................................................................................... 33
5.2.7 Additional calibration of fluorescence channel brightness (if needed) .................................. 34
5.2.8 Finishing the measurement .................................................................................................... 35
5.2.9 Switching off ........................................................................................................................... 39
6 Maintenance ........................................................................................................................................ 40
6.1 Daily maintenance ...................................................................................................................... 40
6.1.1 Water level check .................................................................................................................... 40
6.1.2 Cleaning the T2 Analyzer surfaces .......................................................................................... 40
6.2 Weekly maintenance .................................................................................................................. 40
6.2.1 Thermostat water change ....................................................................................................... 40
6.3 Monthly maintenance ................................................................................................................. 41
6.3.1 Thermostat cleaning ............................................................................................................... 41
6.4 «As needed» maintenance ......................................................................................................... 42
6.4.1 Brightness calibration of the fluorescence channel................................................................ 42
6.5 Extended service maintenance ................................................................................................... 43
6.5.1 Cleaning the outer surface of the thermostat window .......................................................... 43
6.5.2 Technical service ..................................................................................................................... 43
6.6 Placing out of operation, transport and disposal ....................................................................... 43
6.6.1 Placing out of operation .......................................................................................................... 43
Thrombodynamics Analyzer System T2 US User Manual
version 1.3
7
6.6.2 Transport ................................................................................................................................. 44
6.6.3 Disposal ................................................................................................................................... 44
7 Troubleshooting................................................................................................................................... 45
8 Working with the program .................................................................................................................. 48
8.1 Access Control ............................................................................................................................. 48
8.2 User roles .................................................................................................................................... 48
8.3 Authentication ............................................................................................................................ 48
8.4 Description of the main window ................................................................................................. 49
8.5 Device configuration ................................................................................................................... 50
8.5.1 Checking the brightness of the image .................................................................................... 52
8.6 Print settings ............................................................................................................................... 53
8.7 Performing a new research ......................................................................................................... 54
8.7.1 Sample preparation ................................................................................................................ 54
8.7.2 Selecting/changing the test parameters ................................................................................. 54
8.7.3 Registration of samples by cuvette channels ......................................................................... 56
8.7.4 Starting the test ...................................................................................................................... 57
8.7.4.1 Incubation ....................................................................................................................... 57
8.7.4.2 Running the test .............................................................................................................. 58
8.7.4.3 Completing the test ........................................................................................................ 59
8.7.4.4 Early termination of the test ........................................................................................... 59
8.7.4.5 Viewing previous images during the test ........................................................................ 59
8.7.4.6 Individual calibration for the measurement ................................................................... 60
8.7.4.7 Device errors during the research .................................................................................. 61
8.8 Working with the list of performed tests ................................................................................... 61
8.8.1 Search results .......................................................................................................................... 63
8.8.1.1 Quick search .................................................................................................................... 63
8.8.1.2 Creating and using search filters ..................................................................................... 64
8.8.2 Working with tags ................................................................................................................... 64
8.8.2.1 Creating a new tag (and adding it to the test) ................................................................ 64
8.8.2.2 Adding an existing tag to the tests .................................................................................. 65
8.8.2.3 Removing tag from tests ................................................................................................. 65
8.8.2.4 Removing the tag ............................................................................................................ 65
8.8.3 Calculation .............................................................................................................................. 65
8.8.4 Export results .......................................................................................................................... 66
8.8.5 Export of tests ......................................................................................................................... 67
8.8.6 Import of tests ........................................................................................................................ 68
8.8.7 Print results ............................................................................................................................. 69
8.8.8 Viewing sample results ........................................................................................................... 69

Thrombodynamics Analyzer System T2 US User Manual
version 1.3
8
8.8.8.1 Editing measurement title .............................................................................................. 70
8.8.8.2 Correcting images when viewing .................................................................................... 71
8.8.8.3 Creating a results report ................................................................................................. 71
8.8.8.4 Saving the clot growth video .......................................................................................... 71
8.8.8.5 Saving the selected frame ............................................................................................... 72
8.8.8.6 Result calculation/recalculation...................................................................................... 73
8.9 Device software update .............................................................................................................. 74
8.10 Sending an error file to the manufacturer .................................................................................. 75
8.11 Shutting down the program ........................................................................................................ 76
8.12 Backup ......................................................................................................................................... 76
8.13 Explanation of automatic algorithm error codes ........................................................................ 76
8.14 Changing the reference ranges ................................................................................................... 76
9 Quality control ..................................................................................................................................... 78
9.1 General information ................................................................................................................... 78
9.2 Potential reasons when QC is out of range ................................................................................ 78
9.3 Registration of the control sample batch ................................................................................... 78
9.4 Control Material pretreatment ................................................................................................... 80
9.5 Running the measurement with Control Material ..................................................................... 80
9.6 Quality control results................................................................................................................. 81
9.7 Working with the list of performed control tests ....................................................................... 82
10 Appendix 1. Performance characteristics ........................................................................................ 83
10.1 Technical data ............................................................................................................................. 83
11 Appendix 2. Frozen Control Material pool preparation, characterization and storage .................. 84
12 Appendix 3. Manufacturer’s warranty ............................................................................................. 85

Thrombodynamics Analyzer System T2 US User Manual
version 1.3
9
1 Introduction
This user manual applies to the Thrombodynamics Analyzer System T2 with the respective Thrombodynamics Analytical Software and specific reagents (kits). This document describes the intended use and safe exposure during the whole life cycle.
There are two models of Thrombodynamics Analyzer System:
Model T2-F, where «F» stands for «Fibrin generation registration»
Model T2-T, where «T» stands for «Thrombin generation registration» (in addition to fibrin generation registration)
Some options described in this User Manual that relates to thrombin generation measurements that are not available in T2-F model
Typographical conventions used in this document:
The terms «T2» or «T2 System» always refer to Thrombodynamics Analyzer System T2
The term «T2 Analyzer» always refers to Thrombodynamics Analyzer T2
The terms «SW» and «Software» always refer to Thrombodynamics Analytical Software
1.1 Intended use
Thrombodynamics Analyzer System T2 is intended for basic research use to provide qualitative and quantitative evaluation of the coagulation state of a blood plasma sample. The Thrombodynamics Analyzer System T2 records and analyses spatiotemporal dynamics of formation/lysis of a fibrin clot (T2-F and T2-T models) and spatiotemporal dynamics of thrombin generation (only T2-T model). Clotting starts from the localized coagulation activator and propagates in a thin layer of non-stirred blood plasma sample. The T2 system analyses spatiotemporal dynamics of fibrin clot formation (T2-F and T2-T models) and thrombin generation (only T2-T model) and calculates numerical parameters describing the coagulation process.
Thrombodynamics Analyzer System T2 provides specific reagents intended to be used with the system, as additive to the blood plasma sample: Thrombodynamics TDX kit, Thrombodynamics-4D PLS kit and Thrombodynamics Control kit.
Thrombodynamics TDX Kit is an in vitro kit used to perform measurements of spatiotemporal dynamics of fibrin clot formation in blood plasma samples. The kit is intended for professional use in the laboratory with Thrombodynamics Analyzer System T2 only.
Thrombodynamics-4D PLS Kit is an in vitro kit used to perform measurements of spatiotemporal dynamics of fibrin clot formation and thrombin generation in blood plasma samples. The kit is intended for professional use in the laboratory with Thrombodynamics Analyzer System T2 only.
Thrombodynamics Control Kit is an in vitro kit used for quality control procedures. The kit is intended for professional use in the laboratory with Thrombodynamics Analyzer System T2 only.
Results from the Thrombodynamics Analyzer System T2 should not be the basis for a patient diagnosis. The Thrombodynamics Analyzer System T2 is for Professional Use Only.
Thrombodynamics Analyzer System T2 and Kits are intended for Research Use Only in EU, USA and Canada.

Thrombodynamics Analyzer System T2 US User Manual
version 1.3
10
1.2 Subject to change
The information in this user manual concerns the approved technical specifications at the time of printing. Significant changes and modifications will be provided in a new edition of the user manual. Any datasheets accompanying this user manual contain the most up-to-date information regarding the product. You can always read, save and print an actual version of the User Manual in Software.
1.3 Depository
It is highly recommended to keep this user manual within reach and always accessible near by the Thrombodynamics Analyzer System T2.
1.4 Used abbreviations
Abbreviations used in user manual:
Abbreviation Signification Abbreviation Signification
Ast Stationary amplitude of a thrombin peak
TD Thrombodynamics
Cmax_ATG Maximum concentration of activator thrombin generation
TD4D Thrombodynamics-4D
CS Clot size TF Tissue factor
D Clot density Tlag Lag-time
ETP_ATG Thrombin potential of activator thrombin generation
Tmax_ATG
Time to thrombin peak in activator thrombin generation
Lag_ATG Lag time of activator thrombin generation
Tsp Time of spontaneous clots formation
PFP Platelet free plasma V Rate of clot growth
PPP Platelet poor plasma Vi Initial rate of clot growth
QC Quality control Vst Stationary rate of clot growth
Vt Rate of thrombin propagation
1.5 Warning concept
Warning messages in this document are constructed as follows:
Danger
Consequences
Precautions
In a matter of biohazard the following pictogram is shown:
Danger
Consequences
Precautions

Thrombodynamics Analyzer System T2 US User Manual
version 1.3
11
1.6 Other applicable documents
A range of reagents and consumables (so-called kits) are necessary for performing tests on the Thrombodynamics Analyzer System T2. Please refer to the instructions for use for these kits regarding specific sample requirements and execution of the test.
Please refer to the legal regulations of national law for prevention of accidents.
1.7 Target group
This document is addressed to qualified laboratory specialist, working in the field of hemostasis.

Thrombodynamics Analyzer System T2 US User Manual
version 1.3
12
2 T2 Analyzer: the basic principles of operation
2.1 Measuring principle
Thrombodynamics Analyzer System T2 is a research laboratory instrument designed to measure spatiotemporal characteristics of fibrin clot formation process (thrombodynamics measurement) and thrombin generation process (thrombodynacmis-4D measurement) in a thin layer of unstirred blood plasma. The coagulation process starts from a localized surface which has immobilized tissue factor mimicking blood vessel wall damage. Unlike other routine coagulation assays the fibrin clot growth process in thrombodynamics assay develops in space and time rather than only in time. The fibrin clot starts to form, growing from the tissue factor bearing surface, but then propagates into the bulk of the plasma sample without interaction with the tissue factor bearing surface.
Pre-prepared blood plasma samples are placed into the channels of the special measurement cuvette. Then a special activating insert is immersed into the cuvette. The end-faces of the activating insert are covered with the special coating that contains tissue factor (TF) – the main physiological activator of coagulation. The end face of the activating insert mimics the damaged surface of a blood vessel (Figure 2.1).
Figure 2.1. Principle of Thrombodynamics measurement
As soon as the blood plasma sample comes into a contact with TF, the coagulation process initiates and fibrin clot starts growing from the end face of the activating insert into the bulk of the plasma sample. The process of fibrin clot formation is recorded by Thrombodynamics Analyzer T2 in a time-lapse video microscopy mode by means of dark-field light scattering method. The digital camera of the T2 Analyzer takes a series of photos of the light scattering from the cuvette.
The obtained series of photos shows how the form, size, and density of fibrin clot changes over time. On the basis of the recorded photos the Thrombodynamics Analytical Software calculates the numerical parameters of spatiotemporal dynamics of fibrin clot formation (thrombodynamics parameters).

Thrombodynamics Analyzer System T2 US User Manual
version 1.3
13
Thrombodynamics-4D assay is a new generation of thrombodynamics assay that is enabled only by the T2-T model of Thrombodynamics Analyzer System. In addition to registering fibrin clot growth from the immobilized coagulation activator, Thrombodynamics-4D simultaneously allows registering spatiotemporal dynamics of thrombin, the main enzyme of the coagulation cascade. Registration of thrombin formation is based on fluorescent microscopy principle. Fluorogenic substrate for thrombin is added to plasma sample. The fluorogenic substrate is 7-amino-4-methylcoumarin (AMC) bound to a short amino acid sequence, which is required for recognition of substrate by thrombin. When bound to the substrate, AMC does not have an effect on plasma optical properties. As a result of substrate cleavage by thrombin, free AMC appears in plasma and fluoresces. The rate of AMC formation in each point is proportional to local thrombin concentration. On the basis of the recorded photos of AMC fluorescence the Thrombodynamics Analytical Software calculates the numerical parameters of spatiotemporal dynamics of thrombin generation (thrombodynamics-4D parameters)
2.2 Performance characteristics
Performance characteristics and specifications for the T2 Analyzer are presented in Appendix 1.
2.3 Thrombodynamics and Thrombodynamics-4D parameters
2.3.1 Parameters of fibrin dynamics:
Using special mathematical techniques the T2 Software analyzes the series of images and identifies the clot size, shape and presence of spontaneous clots for each time moment (Figure 2.2a). As a result of a measurement the T2 System generates a clot size over time curve (Figure 2.2b).
a b Figure 2.2. a – image analysis for measurement parameters calculations ; b – clot size over time curve
(see description of all thrombodynamics parameters below)
By mathematical analysis of collected curve data three main numerical parameters of fibrin formation are calculated:

Thrombodynamics Analyzer System T2 US User Manual
version 1.3
14
Tlag, [min], Lag-time
Definition Tlag is the time from the beginning of the measurement (contact of activator with plasma sample) until the beginning of the clot growth when the first significant levels of fibrin can be detected (when the light scattering value from the growing fibrin clot reaches half of the maximum light scattering value from the formed clot at the end of the measurement).
Description Tlag describes the initiation stage of coagulation process. It is analogous to clotting time (prothrombin time) in a routine laboratory coagulation assays.
Influencing factors This parameter is sensitive to the initial stage of blood coagulation and reactions of the extrinsic pathway.
Prolongation of this parameter is caused by hypocoagulation of differing nature: deficiency of factors VII and X, (direct thrombin or factor Xa inhibitors, vitamin K antagonists).
Shortening of this parameter is rarely observed, and can be due to different causes of hypercoagulation.
V, [um/min], Rate of clot growth
Definition V is the average rate of clot growth. If there is no strong spontaneous clotting, V is calculated on the interval 15-25 minutes after the beginning of clot growth [Tlag+15 min; Tlag+25 min]. If V cannot be calculated on this interval because of the presence of spontaneous clots, it is calculated on the 5-minute interval preceding spontaneous clots appearance– [Tsp-5 min, Tsp];
Description The V parameter characterizes the propagation stage of blood coagulation.
Influencing factors V is sensitive to all coagulation cascade reactions, including the contact pathway and excluding the initiation reactions of the extrinsic pathway.
V is the major parameter of the Thrombodynamics assay highly sensitive to a variety of stimuli:
Decreased V value indicates various hypocoagulation states (factors V, VIII, IX, X, XI or thrombin deficiency; anticoagulant agents – vitamin K antagonists, UFH and LMWH).
Increased V value indicates various hypercoagulation states.
Tsp [min], Spontaneous clots formation time
Definition Tsp is the time that spontaneous clots appear in the sample volume which had no initial contact with the activating insert. It is defined as the time from the beginning of the measurement until the average area of spontaneous clots reaches 5% of overall area of the measurement region.
Description The parameter characterizes clotting independent of the activator surface. Under normal condition, no spontaneous clotting is observed.
Influencing factors Spontaneous clotting is induced by circulating activators, active coagulation factors, and microparticles.
Indicates a hypercoagulation state of plasma sample
Thrombodynamics Analyzer System T2 US User Manual
version 1.3
15
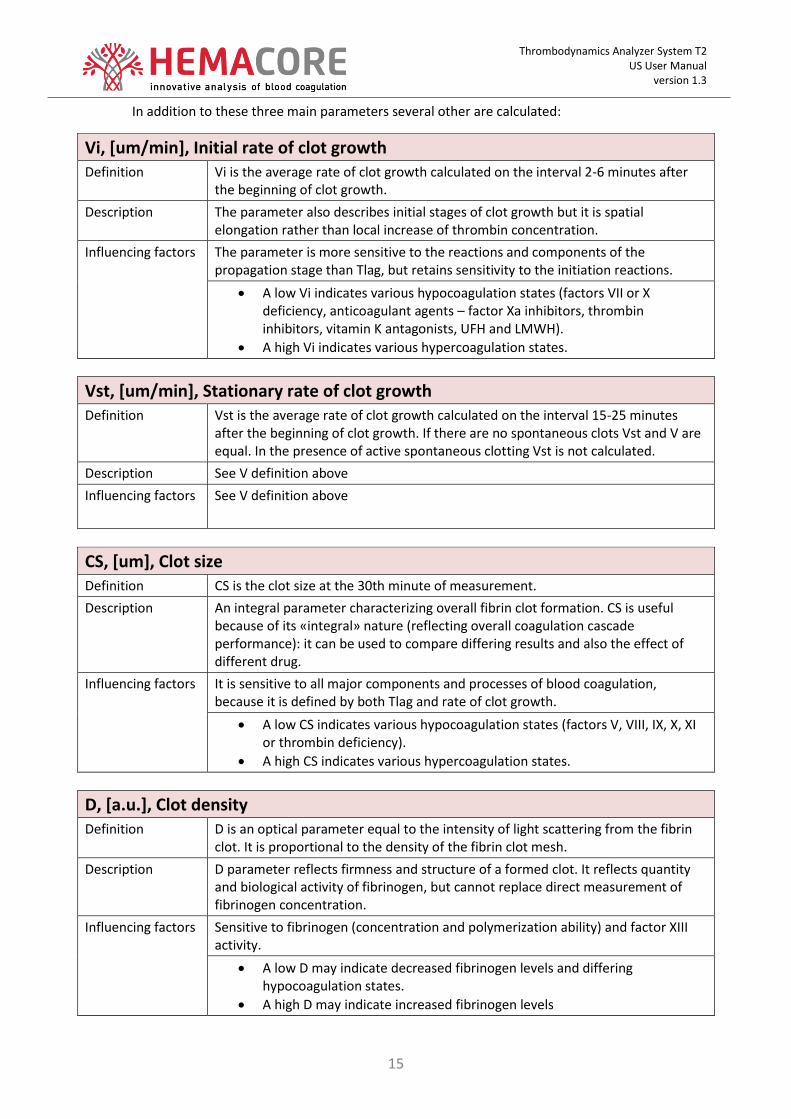
In addition to these three main parameters several other are calculated:
Vi, [um/min], Initial rate of clot growth
Definition Vi is the average rate of clot growth calculated on the interval 2-6 minutes after the beginning of clot growth.
Description The parameter also describes initial stages of clot growth but it is spatial elongation rather than local increase of thrombin concentration.
Influencing factors The parameter is more sensitive to the reactions and components of the propagation stage than Tlag, but retains sensitivity to the initiation reactions.
A low Vi indicates various hypocoagulation states (factors VII or X deficiency, anticoagulant agents – factor Xa inhibitors, thrombin inhibitors, vitamin K antagonists, UFH and LMWH).
A high Vi indicates various hypercoagulation states.
Vst, [um/min], Stationary rate of clot growth
Definition Vst is the average rate of clot growth calculated on the interval 15-25 minutes after the beginning of clot growth. If there are no spontaneous clots Vst and V are equal. In the presence of active spontaneous clotting Vst is not calculated.
Description See V definition above
Influencing factors See V definition above
CS, [um], Clot size
Definition CS is the clot size at the 30th minute of measurement.
Description An integral parameter characterizing overall fibrin clot formation. CS is useful because of its «integral» nature (reflecting overall coagulation cascade performance): it can be used to compare differing results and also the effect of different drug.
Influencing factors It is sensitive to all major components and processes of blood coagulation, because it is defined by both Tlag and rate of clot growth.
A low CS indicates various hypocoagulation states (factors V, VIII, IX, X, XI or thrombin deficiency).
A high CS indicates various hypercoagulation states.
D, [a.u.], Clot density
Definition D is an optical parameter equal to the intensity of light scattering from the fibrin clot. It is proportional to the density of the fibrin clot mesh.
Description D parameter reflects firmness and structure of a formed clot. It reflects quantity and biological activity of fibrinogen, but cannot replace direct measurement of fibrinogen concentration.
Influencing factors Sensitive to fibrinogen (concentration and polymerization ability) and factor XIII activity.
A low D may indicate decreased fibrinogen levels and differing hypocoagulation states.
A high D may indicate increased fibrinogen levels

Thrombodynamics Analyzer System T2 US User Manual
version 1.3
16
2.3.2 Parameters of thrombin dynamics (Thrombodynamics-4D, T2-T model only)
By mathematical analysis of collected AMC fluorescence images two main numerical parameters of thrombin generation are calculated
(A) (B)
(C)
Figure 2.3. (A) Time-lapse images of AMC spatial distribution (B) Parameters of thrombin distribution, (C) Parameters of activator thrombin generation
Ast, [Activity Unit/L], Stationary amplitude of thrombin peak
Definition Stationary amplitude of moving peak of thrombin concentration. As thrombin generation propagates in space as a moving peak (Dashkevich et al, Biophys J 2012), height of this peak is calculated as a maximal activity of thrombin in the fibrin formation zone which moves from the activator while clot grows (it is calculated on the last-registered thrombin distribution plot).
Description The parameter characterizes the propagation stage of blood coagulation.
Influencing factors Ast is sensitive to all components and processes of blood coagulation.
Increased Ast value indicates hypercoagulation states of various nature.
Decreased Ast value indicates hypocoagulation states of various nature (factors V, VIII, IX, X, XI or thrombin deficiency; anticoagulant agents – vitamin K antagonists, UFH and LMWH, factor Xa and thrombin inhibitors).

Thrombodynamics Analyzer System T2 US User Manual
version 1.3
17
Vt, [um/min], Rate of thrombin peak propagation
Definition Spatial rate of thrombin peak propagation. Vt is calculated as an slope of linear approximation of thrombin edge position vs time on the interval 45-55 min after the beginning of clot growth.
Description The parameter characterizes the propagation stage of blood coagulation.
Influencing factors Vt is sensitive to changes in intrinsic pathway of blood coagulation; factors VIII, IX, XI, V, X and thrombin concentration. This parameter is also sensitive to phospholipid vesicles concentration in plasma.
Increased Vt value indicates hypercoagulation states of various nature.
Decreased Vt value indicates hypocoagulation states of various nature (factors V, VIII, IX, X, XI or thrombin deficiency; anticoagulant therapy – vitamin K antagonists, UFH and LMWH, factor Xa and thrombin inhibitors).
In addition several other parameters similar to homogeneous Thrombin Generation Test parameters are calculated on the activating surface. AMC concentration is averaged in the area 0.05-0.2 mm from the activator and then is transformed into a thrombin generation curve.
ETP_ATG, [AU*min/L], Thrombin potential of activator thrombin generation Definition The area under the curve of activator thrombin generation.
Description The parameter characterizes initial stage of blood coagulation.
Influencing factors ETP_ATG is sensitive to changes both in the intrinsic and extrinsic pathway of blood coagulation.
Increased ETP_ATG value indicates hypercoagulation states of various nature.
Decreased ETP_ATG value indicates hypocoagulation states of various nature including factor X, thrombin deficiency; anticoagulant agents – vitamin K antagonists, factor Xa and thrombin inhibitors.
Cmax_ATG, [AU/L], Maximum concentration of activator thrombin generation Definition Maximum concentration of thrombin generation at the near-activator area.
Description The parameter characterizes initial stage of blood coagulation.
Influencing factors Cmax_ATG is sensitive to changes both in the intrinsic and extrinsic pathway of blood coagulation.
Increased Cmax_ATG value indicates hypercoagulation states of various nature.
Decreased Cmax_ATG value indicates hypocoagulation states of various nature including factor X, thrombin deficiency; anticoagulant agents – vitamin K antagonists, factor Xa and thrombin inhibitors.

Thrombodynamics Analyzer System T2 US User Manual
version 1.3
18
Lag_ATG, [min], Lag time of activator thrombin generation Definition Lag time of thrombin generation in the activator area. Lag_ATG is calculated as
time when thrombin activity reaches 20 AU/L.
Description The parameter characterizes initial stage of blood coagulation.
Influencing factors Lag_ATG is sensitive to the extrinsic pathway of blood coagulation.
Increased Lag_ATG value indicates hypocoagulation states of various nature (factors V, VII, X and prothrombin deficiency; anticoagulant agents – vitamin K antagonists, factor Xa and thrombin inhibitors, except heparins).
Tmax_ATG, [min], Time to thrombin peak in activator thrombin generation Definition Time to thrombin peak in thrombin generation at the near-activator area.
Description The parameter characterizes initial stage of blood coagulation.
Influencing factors The parameter is sensitive to changes both in the intrinsic and extrinsic pathway of blood coagulation.
Increased Tmax_ATG value indicates hypocoagulation states of various nature (factors V, VII, X and prothrombin deficiency; anticoagulant agents – vitamin K antagonists, factor Xa and thrombin inhibitors, except heparins).
Decreased Tmax_ATG value indicates hypercoagulation states of various nature.
2.4 Reference ranges
Each laboratory should determine its own reference ranges using samples from healthy persons that are typical for the local study population. The users should take into account that individual pre-analytical factors in a given laboratory may influence the results. HemaCore provides a reference range representing a heterogeneous group of apparently healthy individuals for illustrative purposes only. The up to date normal reference ranges are provided in the T2 Software.
2.5 Blood sample types
The TD and TD4D measurements can be performed on the following samples:
2.5.1 Citrated fresh platelet free plasma samples (fresh PFP)
Citrated fresh PFP samples are the main material for the TD and TD4D measurements. Reference ranges provided in this document concerns this sample type. Sample requirements:
Platelet count: no more than 103/µl
Sample storage conditions: room temperature
Measurements must be performed within 3 hours after plasma preparation
Native citrated blood sample for plasma preparation must be kept at room temperature no more than 1 hour after collection

Thrombodynamics Analyzer System T2 US User Manual
version 1.3
19
2.5.2 Citrated frozen platelet free plasma samples (frozen PFP)
TD and TD4D measurements can be performed on citrated fresh frozen PFP samples, and reference ranges should be determined according to general requirements. The following information should be kept in mind when working with frozen plasma samples:
The main factors that have an impact on TD and TD4D parameters are the method of freezing (-20C or liquid nitrogen) and the degree of plasma purification from cells (centrifugation protocol);
Freezing in liquid nitrogen is preferred but freezing at -20C can also be used. Direct comparison of the results obtained with different freezing protocols is not possible;
When working with frozen plasma, sample preparation and freezing/thawing protocols should be strictly followed. Change of centrifugation and freezing conditions may result in systematic shift of obtained values. Individual range of normal values should be used for each protocol of centrifugation and freezing, if the absence of statistically significant difference was not showed. Change of sample volume when using freezing at -20°C can also result in systematic shift of values due to cold activation;
2.5.3 Control plasma samples
For quality control procedures user should use Control Material.
For quality control of TD measurements users may use Thrombodynamics Control Kit from HemaCore or prepare their own Control Material.
For quality control of TD4D measurements users should prepare and use their own Control Material.
Each Control Material sample should be treated in the same manner as the specimens, with all the appropriate limitations for fresh and frozen plasma.
Fresh Control Material Samples
See section 5.1.3.2 for instructions on preparation of fresh Control Material pool
Results of TD and TD4D measurements performed on fresh Control Material pool must fall into the normal reference range, which was determined in the current laboratory according to section 2.4 instructions.
Frozen Control Material Samples
See section 5.1.3.3 for instructions on preparation of frozen Control Material pool
Results of TD and TD4D measurements performed on frozen Control Material pool must fall into the pool’s reference range, which was determined during its characterization.

Thrombodynamics Analyzer System T2 US User Manual
version 1.3
20
2.6 Data analysis
One of the main features of Thrombodynamics method is the possibility to provide user with the real-time photos of a growing fibrin clot. These photos can be analyzed qualitatively and quantitatively. The photos themselves can provide information about the state of coagulation system – hypo-, hyper-, normal coagulation (Figure 2.4). The degree of abnormality can be estimated comparing calculated numerical parameters with normal reference ranges.
Hypocoagulation Normal Hypercoagulation Severe hypercoagulation
Tlag = prolonged
V = decreased Tsp > 30 min
Tlag = normal
V = normal Tsp > 30 min
Tlag = shortened
V = increased Tsp > 30 min
Tlag = shortened
V = increased Tsp < 30 min
Figure 2.4. Examples of different coagulation system states (photos taken at 30th minute of measurement)

Thrombodynamics Analyzer System T2 US User Manual
version 1.3
21
3 System description and installation
3.1 Thrombodynamics Analyzer System T2
The T2 System is an integrated system that consists of the following components:
Thrombodynamics Analyzer T2 device
Computer with Thrombodynamics Analytical Software
Thrombodynamics Kits
Service kit
Interface cables (1 x USB and 1 x Ethernet)
Power cable
User manual
3.1.1 Thrombodynamics Analyzer T2
Figure 3.1 shows the Thrombodynamics Analyzer T2. See Table 3.1 for the description.
Figure 3.1. The Thrombodynamics Analyzer T2

Thrombodynamics Analyzer System T2 US User Manual
version 1.3
22
Table 3.1 Components of T2 Analyzer
Position Description
1 T2 Analyzer housing.
2 Thermostat cap. The cap seals cuvette compartment in order to maintain excessive pressure during the measurement. Small excessive pressure prevents bubbles formation in plasma samples during the measurement.
3 Preheating places for incubation of tubes with reagents.
4
Status LEDs. Left to right:
Power on
Pressure mode on – turns green when pressure maintenance mode is active
Thermostat ready – turns on when thermostat temperature reaches set temperature (± 1C°)
5
Thermostat with cuvette compartment. The thermostat is filled with clean distilled water that is heated to set temperature. Placing the measurement cuvette into water thermostat allows fast and uniform sample heating. The inner transparent window in the thermostat allows taking photos of light scattering from samples.
6
Multicolor status light ring. The ring is intended for indication of System status and measurement progress:
Fast green cyclic ring filling – self test and starting operation.
Ring is green – T2 System is ready for the measurement.
Sequential green segments lighting up – reflects incubation timer progress.
Ring is green, flashing – incubation is over.
Sequential red segments lighting up – reflects measurement timer progress.
Ring is red, flashing – error.
7
Proximity sensor. The proximity sensor is used when more than one T2 Analyzers are connected to a computer. Bringing user’s hand closer than 5 mm to the labeled area causes Software to switch focus on this Analyzer. That means that Software will show the working screen for the selected T2 Analyzer. Focus switch doesn’t affect the measurement process on other T2 Analyzers connected to the computer.
8 Start button. Starts incubation mode or measurement mode (depending on current measurement progress step in Software). Mirrors relevant action buttons in Software.
The T2 System control is performed by the T2 Software and the buttons on the front panel of the T2 Analyzer («start» button and the proximity sensor). The T2 System status and measurement progress are indicated in the Software and by means of light indication (LEDs and light ring).
Main power switch, power socket and interface sockets for computer connection are separated on the rear side of the T2 Analyzer.
3.1.2 Software
The T2 Software is shipped with a computer, properly installed and configured. If required the Software installation and setup is performed by HemaCore service staff or its authorized representatives. The Software upgrades may be performed by users via Software functionality (internet connection required). Full Software functionality will be described in details in further chapters.

Thrombodynamics Analyzer System T2 US User Manual
version 1.3
23
3.1.3 Thrombodynamics Kits
Thrombodynamics Analyzer System T2 utilizes specific reagents intended to be used with the system, as additives to the blood plasma sample.
3.1.3.1 Thrombodynamics TDX Kit
Thrombodynamics TDX Kit is an in vitro kit used to perform measurements of spatiotemporal dynamics of fibrin clot formation in blood plasma samples. The kit consists of measurement cuvettes, activating inserts, and reagents for samples treatment (Reagent I, Reagent II). The kit is intended for professional use in the laboratory on Thrombodynamics Analyzer System T2 only.
Please refer to the instructions for use of the Thrombodynamics TDX Kit for the detailed information regarding specific sample requirements, limitations and execution of the test.
Brief description of the components is following:
Measurement cuvette
Measurement cuvette is an optically transparent vial with two thin channels for plasma samples placement. It is made from low procoagulant material and allows registration of light scattering from the growing fibrin clot in each channel. Measurement cuvette is a single-use disposable product.
Activating Insert
Activating insert is intended for activation of coagulation after its placement into the cuvette with plasma samples. The end faces of activating insert are covered with immobilized tissue factor protein.
Reagent I
Reagent I is intended for inhibition of reactions of the contact pathway of coagulation. Reagent I is a lyophilized solution of a contact pathway inhibitor.
Reagent II
Regent II is intended for citrated plasma samples recalcification. Reagent II is a lyophilized solution of calcium salt.
3.1.3.2 Thrombodynamics-4D PLS Kit
Thrombodynamics-4D PLS Kit is an in vitro kit used to perform measurements of spatiotemporal dynamics of fibrin clot formation and thrombin generation in blood plasma samples. The kit consists of measurement cuvettes, activating inserts, and reagents for samples treatment (Reagent I, Reagent II, Reagent PLS). The kit is intended for professional use in the laboratory with Thrombodynamics Analyzer System T2 only.
Please refer to the instructions for use of the Thrombodynamics-4D PLS Kit for the detailed information regarding specific sample requirements, limitations and execution of the test.
Brief description of the components is following:
Measurement cuvette
Measurement cuvette is an optically transparent vial with two thin channels for plasma samples placement. It is made from low procoagulant material and allows registration of light scattering from the growing fibrin clot in each channel. Measurement cuvette is a single-use disposable product.

Thrombodynamics Analyzer System T2 US User Manual
version 1.3
24
Activating Insert
Activating insert is intended for activation of coagulation after its placement into the cuvette with plasma samples. The end faces of activating insert are covered with immobilized tissue factor protein.
Reagent I
Reagent I is a lyophilized solution of protein-inhibitor intended for inhibition of reactions of the contact pathway of coagulation. I. It also contains a fluorogenic substrate for thrombin activity.
Reagent II
Regent II is intended for citrated plasma samples recalcification. Reagent II is a lyophilized solution of calcium salt.
Reagent PLS
Reagent PLS is a lyophilized suspension of phospholipid vesicles of a specific make-up.
3.1.3.3 Thrombodynamics Control Kit
Thrombodynamics Control Kit is an in vitro kit used for thrombodynamics quality control procedures. The kit is intended for professional use in the laboratory on the Thrombodynamics Analyzer T2 only. The kit consists of lyophilized animal citrated platelet free plasma.
Please refer to the instructions for use of the Thrombodynamics Control Kit for the detailed information regarding specific sample requirements, limitations, and execution of the test.
Control measurement should be included in each analytical run. Each control sample should be used in the same way as a regular sample in accordance with the User Manual. Duplicate measurements are recommended.
3.1.4 Service kit
Service kit is intended for routine and service maintenance procedures. Service kit consists of:
Calibrator – used for brightness calibration.
Plastic syringe with flexible tube nozzle – used for filling or draining thermostat with water.
Several spare parts: cuvette holder, fuses, O-rings and screws.

Thrombodynamics Analyzer System T2 US User Manual
version 1.3
25
3.2 Thrombodynamics Analyzer System T2 installation
3.2.1 Site installation requirements
The T2 System must be placed on flat, clean and robust surface.
Ensure that the on/off switch is always reachable and the power cable can be easily disconnected from the power socket.
Ensure absence of temperature fluctuations and vibrations. Avoid placing the T2 System near the sources of strong vibration, heat or cold.
Avoid placing the T2 System near the high-frequency electromagnetic sources.
Protect the T2 System from the direct sunlight, moisture and dust.
Caution
Inappropriate installation and operation of the T2 System may lead to measurement errors, loss of data or equipment damage.
Follow the above mentioned site installation requirements
3.2.2 Preparing for operation
1. Before using the T2 System please read this manual thoroughly.
2. Check the completeness of the System in accordance with contract specification.
3. In case of transportation of the T2 System at low temperatures below 0° C, the T2 System should be kept in its shipping container under normal (room) environmental conditions for at least 12 hours before use.
4. Place the T2 System on a flat working surface.
5. Fill the thermostat of the T2 Analyzer with 60 ml of clean distilled water through the cuvette compartment using the syringe with flexible tube nozzle (part of service kit).
6. Connect USB and Ethernet (RJ-45) interface cables to the rear side of the T2 Analyzer and directly to the computer (not via hub).
7. Connect power cable to the rear side of the T2 Analyzer and to the AC power socket (220V or 110V). Use only properly earthed power sockets.
8. After turning on computer for the first time, check Windows system time zone (usually displayed at lower right corner of the screen) and change it if necessary by using standard Windows functionality.

Thrombodynamics Analyzer System T2 US User Manual
version 1.3
26
4 Safety
4.1 General safety requirements
The equipment of the Thrombodynamics Analyzer System T2 fulfills the requirements of Directive 98/79/EC of the European Parliament and of the Council.
This manual contains important information about safe installation, operation and maintenance of the Thrombodynamics Analyzer System T2. Please read this manual thoroughly before using the T2 System.
Do not use any peripheral devices or computer with the T2 system without appropriate safety certificates in accordance with the applicable regulatory standards.
4.2 Environmental conditions
Indoor use
Operating temperature: +10° C to +30° C
Maximum relative humidity: 80%
Storage or transport temperature: -30° C to +50° C
4.3 Personal safety
4.3.1 Electrical hazards
Electrical shock
Risk of death or electrical trauma
Always unplug the T2 Analyzer power cable from the power socket before carrying out any adjustments, service, or maintenance procedures.
Connect the T2 System equipment only to grounded power sockets. Use only original grounded power cable.
Do not work with the T2 Analyzer with its housing open or any parts removed.
Do not switch on the T2 System equipment if it is damaged or if power cable is damaged. Contact qualified service personal.
Do not spill liquids over or into the T2 System equipment. Unplug equipment before touching in case it is wet. Contact qualified service personal.
4.3.2 Biohazard
Biological contamination
Risk of infection
Always use personal protective equipment (gloves, coat, goggles, etc.) when working with the T2 System equipment or handling samples.
Regularly clean and disinfect the T2 Analyzer surfaces according to laboratory rules.

Thrombodynamics Analyzer System T2 US User Manual
version 1.3
27
5 Running measurements
5.1 Sample preparation
Following sample types may be used for running Thrombodynamics measurements (see section 2.5 for additional information regarding sample requirements):
Citrated fresh PFP (PFP)
Citrated frozen PFP (frozen PFP)
Lyophilized plasma from HemaCore Control kit
User fresh Control Material
User frozen Control Material
Measurement type Kit type Sample type Quality Control consumables
Thrombodynamics
TDX kit PFP TDX kit + HemaCore Control kit
or TDX kit + user Control Material frozen PFP
PLS kit PFP
PLS kit + user Control Material frozen PFP
Thrombodynamics-4D PLS kit PFP
PLS kit + user Control Material frozen PFP
5.1.1 Working on fresh plasma samples
5.1.1.1 Blood collection
It is recommended that blood specimens for Thrombodynamics measurements be collected by venipuncture using 5 ml volume evacuated tubes intended for coagulation analysis.
For blood samples acquisition follow the recommendations given at the following reference:
Collection, Transport, and Processing of Blood Specimens for Testing Plasma-Based Coagulation Assays and Molecular Hemostasis Assays; Approved Guideline – Fifth Edition by Clinical and Laboratory Standards Institute (CLCI) H21-A5 Vol.28 No.5
Measurement errors
Some kind of blood collection tubes may cause measurement errors
Evacuated tubes for coagulation analysis from different manufacturers may significantly effect on measurement results. Users should perform additional studies and get their own normal reference ranges with a utilized blood collection system. HemaCore does not guarantee a quantitative comparability between the results of the measurements performed on samples from different blood collection tubes.

Thrombodynamics Analyzer System T2 US User Manual
version 1.3
28
Do not use glass or siliconized glass collection tubes for thrombodynamics measurements.
Performed studies (Dashkevich et al; Effect of Pre-Analytical Conditions on the Thrombodynamics Assay, Thrombosis Research 133 (2014) 472–476) have shown that the following blood collection tubes have minor effect on thrombodynamics measurement results on the samples from healthy controls:
o Monovette plastic 4.5 ml 3.2% citrate (Sarstedt, Germany) o Vacutainer plastic 2.7 ml 3.2% citrate (Becton Dickinson, UK) o Vacuette plastic 4.5 ml 3.2%, 3.8% citrate and CTAD (Greiner Bio-One,
Austria) o Vanosafe plastic 4.5 ml 3.2% and 3.8% citrate (Terumo Europe N.V.,
Belgium)
In other cases use tubes that have nonactivating surfaces with anticoagulant additive – dihydrate form of trisodium citrate 3.8% (129 mmol/L). The proportion of blood to the liquid sodium citrate dihydrate anticoagulant volume is 9:1. In addition, 3.2% (109 mmol/L) of dehydrate form of trisodium citrate may also be used. Laboratories should standardize to one concentration of sodium citrate, as variation of parameter ranges may occur between these two concentrations (3.2% vs 3.8%). For more detailed information please refer to the H21-A5 (item 5.3.1.3) Approved guideline.
1. Draw first portion of blood after venipuncture to a discard tube.
2. Draw second portion of blood to the tube with citrate anticoagulant in proportion blood to anticoagulant volume 9:1 (blood volume must be no less than 2.5 ml).
3. Immediately, gently mix the collection tube by three to six complete end-over-end inversions to ensure thorough mixing of the specimen with anticoagulant. Keep the tube with blood specimen at room temperature. Blood specimen should be used within one hour after collection.
Measurement errors
Inappropriate sample handling may cause measurement errors
Avoid incorrect blood/sodium citrate ratio
Avoid sufficient hematocrit variations from normal ranges. In case of hematocrit values above 55% or below 30% citrate concentration correction is required. For more detailed information please refer to the H21-A5 (item 5.3.1.5) Approved guideline.
Do no use hemolyzed, lipemic, or icteric samples
Do not expose blood samples to cold
Do not store blood samples more than 1 hour
5.1.1.2 Platelet free plasma preparation.
1. Centrifuge the capped blood specimen tube at 1600 g for 15 minutes.
2. Transfer ¾ of the upper plasma layer to a new tube using a pipette with disposable tips.
3. Centrifuge the plasma specimen tube at 10000 g for 5 minutes or at 1600 g for 20 minutes to get the PFP specimen.
4. Transfer 90% of the specimen liquid volume from the upper PFP layer to a new tube using a pipette with disposable tips.
5. PFP specimen should be used within 3 hours after preparation.

Thrombodynamics Analyzer System T2 US User Manual
version 1.3
29
5.1.2 Working on frozen plasma samples
Fresh frozen PFP samples may be used for Thrombodynamics analysis. See par. 2.5 for additional information regarding sample requirements.
1. Thaw PFP sample tube in 37°C water bath for 5 minutes. 2. Gently mix the tube by three to six complete end-over-end inversions.
5.1.3 Working on control plasma samples
5.1.3.1 Preparation of Thrombodynamics Control kit
1. Add 1 ml of distilled water into the control plasma bottle from Thrombodynamics Control Kit for its reconstitution.
2. Dissolve the bottle contents by gentle regular swirling during 5 minutes. 3. Incubate for 30 minutes at room temperature before measurement.
5.1.3.2 Preparation of fresh PFP Control Material pool
Fresh PFP Control Material pool is prepared from plasma samples from at least 3 healthy donors (without hemostasis disorders revealed by anamnesis, clinical presentation, and routine coagulation assays; without anticoagulant therapy).
Fresh plasma from healthy donors collected and prepared according to section 5.1.1.1 and section 5.1.1.2 requirements should be mixed in a plastic tube. Use the sample requirements according to section 2.5.1.
Normal reference range, which was determined in the current laboratory, should be used as a reference range for Fresh PFP Control Material pool.
5.1.3.3 Preparation of frozen PFP Control Material pool
It is recommended to prepare sufficient volume of Control Material in a form of a frozen pool. The pool can be divided into 0.5-1ml aliquots and then stored frozen.
Frozen pool must be characterized – see section 11 for instructions.
Special reference range, which was determined in the current laboratory during pool characterization procedure, should be used as a reference range for Frozen PFP Control Material pool. Use sample requirements according to section 2.5.2

Thrombodynamics Analyzer System T2 US User Manual
version 1.3
30
5.2 Running samples
5.2.1 Starting the T2 Analyzer and the Software
1. Turn on the T2 Analyzer with the main switch on the back of the device 15 minutes prior the measurement (it may take up to 10 minutes to warm the thermostat of the T2 Analyzer).
2. Turn on the computer and run the T2 Software. 3. Login into the Software with your credentials (default login and password: admin).
5.2.2 Samples registration
1. The T2 System allows simultaneous analysis of two samples in separate channels: channel 1 (or left channel when looking at the front of the T2 Analyzer) and channel 2 (or right channel). The channel names are marked on cuvettes and thermostat. Proper cuvette placement and orientation in thermostat is shown on Figure 5.1.
Figure 5.1. The T2 System channels, cuvette placement.
Measurement errors
Inappropriate cuvette orientation may cause measurement errors – the results of the samples measurements may be confused
Ensure proper cuvette orientation as shown on Figure 5.1.
2. Prepare samples and package with activating insert from the Thrombodynamics Kit. 3. After logging in you will see the Software main screen (Figure 5.2). 4. Take the package with the activating insert. 5. Enter the bar code from the activating insert package or scan it with bar scanner in to the upper
field on the main screen. 6. Enter sample data for each channel. Channel 1 data is entered in the left fields; channel 2 data is
entered in the right fields. «Sample code», «Measurement title» and «Plasma type» fields are necessary for filling.
7. Select kit and test type (thrombodynamics or thrombodynamics-4D) for each channel. 8. User may also select or configure measurement mode parameters. For additional details see
chapters regarding Software.

Thrombodynamics Analyzer System T2 US User Manual
version 1.3
31
Figure 5.2. T2 Software main screen
5.2.3 Preparation of the Reagent PLS
Add 300 µL of distilled water into the vial with the Reagent PLS. Dissolve the content of the vial during 5 min, shake gently. Reconstituted Reagent PLS can be stored at +4C for 14 days.
Caution: do not allow freezing of the liquid Reagent PLS during storage.
5.2.4 Samples and reagents handling
1. Prepare the cuvette, activating insert, and the reagents (I and II) from the Thrombodynamics TDX Kit or Thrombodynamics-4D PLS Kit.
2. Remove the thermostat cap. 3. Place reagent tubes into the preheated places on the thermostat (Figure 5.3)
Channel 1 data fields
Bar code field
Channel 2 data fields

Thrombodynamics Analyzer System T2 US User Manual
version 1.3
32
Figure 5.3. Cuvette and reagent tubes placement
4. Withdraw the cuvette from the protection package and place it into the thermostat as shown at Figure 5.1.
5. Take the Reagent I tube relating to channel 1, open it and place 120 ul of PFP sample #1 into it using pipette with single use tips. Close the tube and gently knock it with a finger several times to dissolve the dry substance inside the tube. Ensure that the dry substance has dissolved. Place the tube back to preheated place in the thermostat.
Only if working with Thrombodynamics-4D PLS Kit Add 5 ul of the Reagent PLS to the tube with Reagent I mixed with plasma. Close the tube and gently mix the tube by tapping it with a finger. Place the tube back to the preheated place in the thermostat.
6. Repeat previous step for sample #2 using Reagent I relating to channel 2.
5.2.5 Samples incubation
1. Press the «Start» button in the T2 Software or at the T2 Analyzer front panel. The incubation process is started. The default incubation time is 3 minutes. User can skip the incubation process by pressing «Stop» button in Software or by holding start button on T2 Analyzer front panel more than 4 seconds.
Measurement errors
Skipping or canceling incubation process may cause measurements errors
Do not skip or cancel incubation process during normal operation.
2. The incubation progress is shown in the Software and by means of the T2 Analyzer status light ring. Segments of the status light ring are turning green clockwise as the incubation progresses. Digital timer in the Software is counting down. When the incubation is over the light ring starts to flash green.

Thrombodynamics Analyzer System T2 US User Manual
version 1.3
33
5.2.6 Starting the measurement
1. Transfer the contents of the Reagent I tube relating to channel 1 (sample #1 and Reagent I mixture) into the Reagent II tube relating to channel 1.
2. Quickly mix the contents several times via pipetting. Avoid foaming. Ensure that the dry substance has dissolved.
3. Immediately transfer 120 ul of the resulting mixture into the channel 1 of the measurement cuvette.
4. Repeat previous step for sample #2 using Reagent II relating to channel 2. 5. Withdraw the activating insert from protection package and gently place it into the cuvette all
the way in. 6. Quickly close the cuvette compartment with the thermostat cap. 7. Press the «Start» button in the T2 Software or at the T2 Analyzer front panel immediately.
Measurement errors
Delays in measurement procedure after sample mixing with Reagent II may cause measurements errors
Avoid delays in procedure after sample and Reagent II mixing.
The Software starts countdown and shows the real-time photos of clot growth for each channel (Figure 5.4). Segments of the status light ring are turning red clockwise as the measurement progresses.
Figure 5.4. Measurement progress
The process of samples handling can be schematically represented as shown at Figure 5.5.

Thrombodynamics Analyzer System T2 US User Manual
version 1.3
34
Figure 5.5. Running the measurement – short schematic representation
5.2.7 Additional calibration of fluorescence channel brightness (if needed)
If optical properties of plasma are changed, e.g. by increased plasma turbidity due to lipemia or presence of platelets, presence of hemoglobin or bilirubin etc., it may have a significant effect on AMC fluorescence intensity in the sample. When working with these samples, use of the standard device calibration may lead to incorrect measurement of the thrombin propagation parameters.
When working with plasma with modified optical properties, such as lipemic, hemolytic, or icteric samples, Thrombodynamics Software allows performing an additional brightness calibration for the particular sample without changing the default device settings. If individual calibration is required for the measurement, check the Calibr checkbox during sample registration. Calibration dialog will appear after the end of the measurement and individual calibration may be performed.
Preparation of the calibration sample is described in section 6.4.1. Mix 10 µl of 5.2 mM AMC solution in DMSO with 30 µl of distilled water, mix thoroughly. Take a new tube and mix 120 µl of the sample plasma with 5µl of AMC solution. Transfer 120 µl of plasma mixed with AMC to the corresponding cuvette channel. Follow the instructions of the Software window.
3 3

Thrombodynamics Analyzer System T2 US User Manual
version 1.3
35
5.2.8 Finishing the measurement
A measurement can be stopped manually by pressing «stop» button in the Software or it will be stopped automatically when the determined measurement time is reached. After the measurement is finished the pressure mode will automatically turn off.
1. Open the thermostat cap and take out the cuvette with activating insert. 2. Dispose the cuvette, the activating insert and the reagent tubes according to the effective
regulations for biohazard materials.
After the measurement is finished the results of the analysis will be calculated automatically.
3. After the calculation is finished switch to «Results» tab in the Software and click «Update» button. You will see the list of measurements performed this day and the results of their numerical analysis (Figure 5.6).
Figure 5.6. Results tab
4. Double click the measurement title to get the detailed measurement data or to add text comments to the results (Figure 5.7). You can switch between fibrin clot and thrombin dynamics by pressing “Fibrin” and “Thrombin” buttons on the top of the window.

Thrombodynamics Analyzer System T2 US User Manual
version 1.3
36
Figure 5.7. Detailed measurement results view. (Results both for thrombin and fibrin dynamics are shown)
5. You can print the results (Figure 5.8) by pressing the button in the lower right corner of the detailed results screen or by checking the desired measurements and pressing «Reports» button in the results tab (Figure 5.6).

Thrombodynamics Analyzer System T2 US User Manual
version 1.3
37

Thrombodynamics Analyzer System T2 US User Manual
version 1.3
38
Figure 5.8. Results for printing

Thrombodynamics Analyzer System T2 US User Manual
version 1.3
39
5.2.9 Switching off
Normally the T2 System is on and ready for use. In case daily operation is finished following steps should be performed:
1. Finish running Software before switching off T2 Analyzer. Press X button in the upper right
corner of the main screen or press button and select «Shut Down». 2. Turn off the T2 Analyzer and the computer. 3. Clean and disinfect outer thermostat and thermostat cap surfaces.

Thrombodynamics Analyzer System T2 US User Manual
version 1.3
40
6 Maintenance
Periodical maintenance procedures guarantee reliable performance of the T2 System. The T2 System requires only minor maintenance according to the schedule outlined below.
Biological contamination
Risk of infection
Always use personal protective equipment (gloves, coat, goggles, etc.) when performing maintenance procedures or cleaning the T2 System equipment.
Regularly clean and disinfect the T2 Analyzer surfaces according to local laboratory rules.
6.1 Daily maintenance
6.1.1 Water level check
Before starting the measurement check if water level in the thermostat covers the camera field of view entirely. This can be easily done on the main screen after switching on the T2 Analyzer and logging in the Software. Add clean distilled water via syringe with flexible tube nozzle (part of service kit) if needed until the water level come out of the camera field of view. Before starting the measurement, wait until working temperature is reached.
6.1.2 Cleaning the T2 Analyzer surfaces
Switch off the T2 System before cleaning. Use lint-free cloth wetted with disinfectant to clean the outer surfaces of the T2 Analyzer including thermostat and cuvette compartment. Ensure no liquids are getting inside the T2 System equipment.
6.2 Weekly maintenance
6.2.1 Thermostat water change
It is recommended to change the water in the thermostat every week or when bright floatable points (usually dust particles and fibers) appear in the camera field of view.
1. Switch off the T2 Analyzer. 2. Drain out water from the T2 Analyzer thermostat by the syringe with attached flexible tube (part
of service kit). 3. Fill the thermostat with 55-60 ml of clean distilled water through the cuvette compartment
using the syringe with flexible tube nozzle.

Thrombodynamics Analyzer System T2 US User Manual
version 1.3
41
6.3 Monthly maintenance
6.3.1 Thermostat cleaning
Once a month or in case of any visible contamination appears in the camera field of view (bright dots, flares, nonuniform brightness background) inner surface of thermostat must be cleaned.
Figure 6.1. The T2 Analyzer thermostat and its components
1 – four thermostat flange fixing screws, 2 – thermostat flange, 3 – sealing O-ring, 4 – two thermostat fixing screws, 5 – cuvette holder, 6 – two cuvette holder fixing screws
1. Switch off the T2 Analyzer. 2. Drain out water from the T2 Analyzer thermostat by the syringe with attached flexible tube (part
of the service kit). 3. Unscrew the four thermostat flange fixing screws by means of hex wrench from the service kit
(Figure 6.1). 4. Take off the back flange and the sealing O-ring. In case the back flange happens to be stuck to
the thermostat body use blade screwdriver as a lever to force it out – there is a small pocket at the bottom of the thermostat flange to insert the screwdriver blade.
5. Use lint-free cloth soaked with lens cleaning solvent (usually isopropyl alcohol) to clean the inner cone surface of the thermostat body, cone surface of the thermostat flange and surface of the thermostat window.
6. Place the O-ring and the thermostat flange back and fasten it with the four screws. 7. Fill the thermostat with 55-60 ml of clean distilled water through the cuvette compartment
using the syringe with flexible tube nozzle.

Thrombodynamics Analyzer System T2 US User Manual
version 1.3
42
6.4 «As needed» maintenance
6.4.1 Brightness calibration of the fluorescence channel
Brightness calibration of the fluorescence (blue) channel is required if plasma with modified optical properties, such as lipemic, hemolytic, or icteric samples or after change of the device settings. The following materials can be used for additional calibration: 7-Amino-4-methylcoumarin (Sigma Aldrich cat no A9891), DMSO, distilled water.
Prepare 5.2 mM solution of AMC in DMSO. Dissolve 10 mg of AMC in 11 ml of DMSO in polypropylene or glass tube. AMC solution can be stored frozen; repeated freezing-thawing cycles are not allowed. It is recommended to freeze the solution in 50-200 µl aliquots for further use. Then mix 10 µl of 5.2 mM AMC solution with 30 µl of distilled water. Take a new tube and mix 240 µl of plasma with 10 µl of the prepared AMC solution in water, mix thoroughly, do not vortex. Take a new measuring cuvette and place it into the thermostat of the T2 Analyzer. Transfer 120 µl of plasma mixed with AMC to each cuvette channel. Close the thermostat lid. If calibration is used only for one channel, take 120 µl of sample plasma and mix it with 5µl of AMC solution.
For the device calibration open the Settings menu (see par. 8.5 for more details), press the button with corresponding plasma type in the field (Fluorescence brightness calibration), and enter the concentration (50 µM), press “Save” (Fig. 6.2). The new calibration will be used for all subsequent measurements.
Fig. 6.2. Service window of brightness calibration.
If another calibration was been done previously, the warning dialog will be shown (Fig. 6.3)

Thrombodynamics Analyzer System T2 US User Manual
version 1.3
43
Fig. 6.3. Warning window appears of calibration is going to be changed
6.5 Extended service maintenance
Extended service maintenance is recommended to be performed once a year by authorized service personal.
6.5.1 Cleaning the outer surface of the thermostat window
It is recommended to clean the outer surface of the thermostat window in case of visible contaminations that cannot be removed during the routine thermostat cleaning procedure:
Follow the steps 1-4 in thermostat cleaning procedure description.
1. Unscrew two thermostat fixing screws (Figure 6.1). 2. Gently pull on the thermostat to disconnect it from the T2 Analyzer. 3. Use lint-free microfiber cloth soaked with lens cleaning solvent (usually isopropyl alcohol) to
clean the outer surface of the thermostat window. 4. Set back the thermostat in T2 Analyzer until full stop, aligning the cylindrical heaters and
temperature sensors with the coincident thermostat holes. 5. Screw back the thermostat fixing screws. It is important to tighten the screws by turns, quarter
turn at a time. Start from the right screw. Avoid thermostat skewing. 6. Place the O-ring and the thermostat flange back and fasten it with the four screws. 7. Fill the thermostat with 60 ml of clean distilled water through the cuvette compartment using
the syringe with flexible tube nozzle.
6.5.2 Technical service
It is recommended to perform a full technical service of the Analyzer at least once a year. The technical service is performed by and authorized service representative. Please contact the representative of the supplier or the manufacturer to find out more about the full technical service.
6.6 Placing out of operation, transport and disposal
6.6.1 Placing out of operation
Before placing the T2 Analyzer out of operation:
1. Drain the water from the thermostat and clean it as described in thermostat cleaning paragraph. Do not fill it with water after cleaning.
2. Clean and disinfect the T2 Analyzer surfaces. 3. Protect the T2 Analyzer from dust (it is recommended to keep the T2 Analyzer original package
to be able to pack the T2 Analyzer into it for longtime storage).

Thrombodynamics Analyzer System T2 US User Manual
version 1.3
44
6.6.2 Transport
Lift the T2 Analyzer only by holding the lower side.
Transport the T2 System equipment only in the original package.
6.6.3 Disposal
The life cycle of the T2 Analyzer is at least seven years. After seven years contact manufacturer’s representative for life cycle extension possibility or for sending your T2 Analyzer back to manufacturer for proper disposal. The T2 Analyzer can be also disposed or recycled according to local regulations for IVD devices with the expired life cycle.

Thrombodynamics Analyzer System T2 US User Manual
version 1.3
45
7 Troubleshooting
If an error occurs during T2 System operation the light ring of the T2 Analyzer starts to flash red and the corresponding error code is displayed on the Software main screen. Table 7.1 lists possible errors when using the T2 System.
Table 7.1.
Temperature errors
Error code Description Possible cause Remedy
E1 No heat up of the thermostat or low heating rate (more than 15 minutes to reach 37 °C).
Heaters failure Contact local service rep.
Power failures Ensure the stability of power supply
Incorrect temperature settings
Set correct settings
Thermostat water change during T2 Analyzer operation
Wait several minutes until the temperature reaches the set value
E2 No data from temperature sensor
Temperature sensor failure Contact local service rep.
E3 Data error from temperature sensor
Incorrect CRC Contact local service rep.
Pressure mode errors
Error code Description Possible cause Remedy
E1 Pressure doesn’t reach set value Significant air leaks (air pump switches on more than 1 time per minute during the measurement)
Air leaks in pressure line
Ensure that the thermostat cap is tightly closed Ensure that the four thermostat flange fixing screws are tightened securely Contact local service rep.
Air pump failure Contact local service rep.

Thrombodynamics Analyzer System T2 US User Manual
version 1.3
46
Optical system errors
Description Possible cause Remedy
Bright dots and flares in the camera field of view
Non uniform background brightness
High background brightness level
Contamination of water in the thermostat
Contaminations on the thermostat window and back flange
Insufficient water level
Clean the thermostat
Fully fill the thermostat with clean water
Contact local service rep.
Common errors
Description Possible cause Remedy
«NC» error code is displayed on the Software main screen
The thermostat is poorly fastened to T2 Analyzer
Ensure that two thermostat fixing screws are tightened securely.
The cuvette image is shifted or skewed The cuvette is not installed all the way in
Place the cuvette all the way in
The cuvette holder is poorly fastened
Fasten the cuvette holder tightly
The cuvette holder is damaged or worn out
Replace the cuvette holder
No «power on» light on the front panel of the T2 Analyzer
Power cable is not connected Check the power cable connection
Fuse blowing Contact local technical support
Software errors
Description Possible cause Remedy
Software does not start, message “Software is already running”
Previous instance of the Software has not yet completed work
Wait for the previous instance of the Software to shut down
Software remains in computer memory due to an emergency shutdown
Force the application to shut down through “Task Manager”
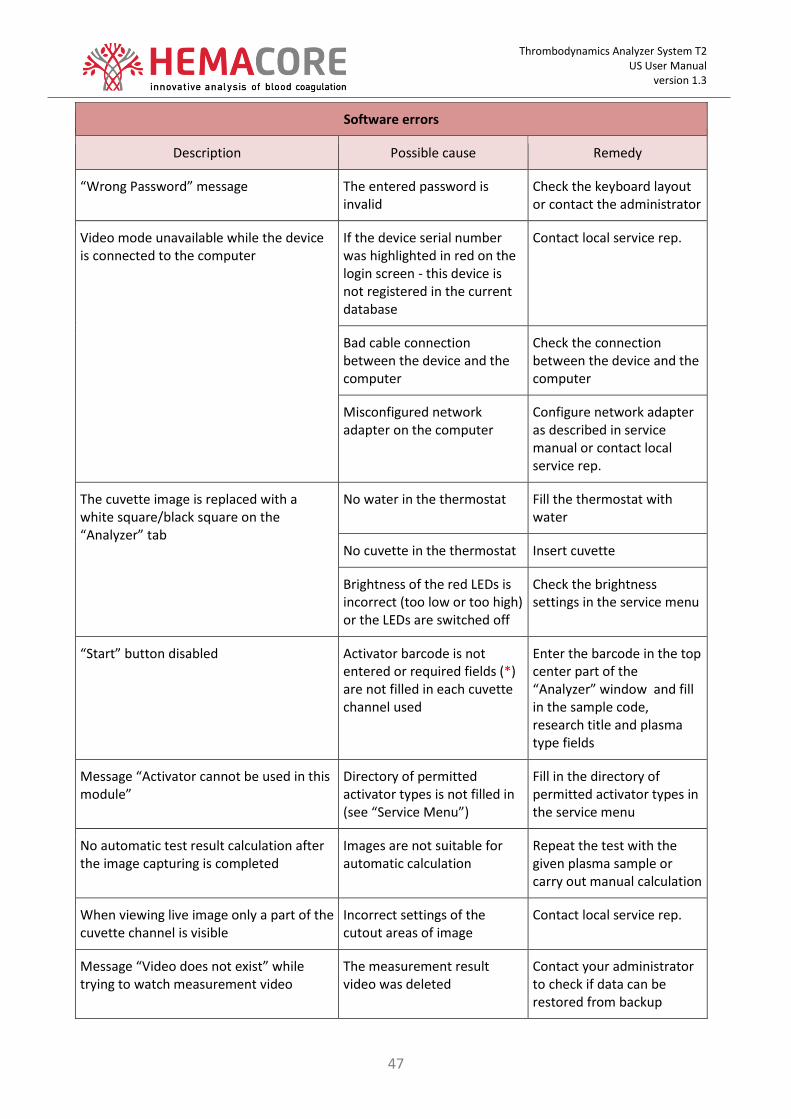
Thrombodynamics Analyzer System T2 US User Manual
version 1.3
47
Software errors
Description Possible cause Remedy
“Wrong Password” message The entered password is invalid
Check the keyboard layout or contact the administrator
Video mode unavailable while the device is connected to the computer
If the device serial number was highlighted in red on the login screen - this device is not registered in the current database
Contact local service rep.
Bad cable connection between the device and the computer
Check the connection between the device and the computer
Misconfigured network adapter on the computer
Configure network adapter as described in service manual or contact local service rep.
The cuvette image is replaced with a white square/black square on the “Analyzer” tab
No water in the thermostat Fill the thermostat with water
No cuvette in the thermostat Insert cuvette
Brightness of the red LEDs is incorrect (too low or too high) or the LEDs are switched off
Check the brightness settings in the service menu
“Start” button disabled Activator barcode is not entered or required fields (*) are not filled in each cuvette channel used
Enter the barcode in the top center part of the “Analyzer” window and fill in the sample code, research title and plasma type fields
Message “Activator cannot be used in this module”
Directory of permitted activator types is not filled in (see “Service Menu”)
Fill in the directory of permitted activator types in the service menu
No automatic test result calculation after the image capturing is completed
Images are not suitable for automatic calculation
Repeat the test with the given plasma sample or carry out manual calculation
When viewing live image only a part of the cuvette channel is visible
Incorrect settings of the cutout areas of image
Contact local service rep.
Message “Video does not exist” while trying to watch measurement video
The measurement result video was deleted
Contact your administrator to check if data can be restored from backup

Thrombodynamics Analyzer System T2 US User Manual
version 1.3
48
8 Working with the program
8.1 Access Control
To control the device and access rights the program provides user registration. New users must be registered by the Admin and receive personal “User Name” and “Password.” To change the password users should also contact the Admin.
User management functions are available to the Admin in the “User Management” menu.
8.2 User roles
Access to the software functions is defined by user roles. The program defines the following user roles:
Admin: registers the device users, edits the reference ranges of test parameters, performs new tests, prints out results;
Lab Technician: performs new tests, prints out results.
8.3 Authentication
After starting the program, in the “Authentication” window select the name you were assigned by the Admin from the “User” list and enter “Password”. To enable the mode of viewing the thrombodynamics test result database check the “Database mode” box. If there is no connection to the device this box will be checked automatically.
Figure 8-1. Authentication when one device is connected to the computer

Thrombodynamics Analyzer System T2 US User Manual
version 1.3
49
Figure 8-2. Authentication without connecting to the Analyzer
If you are planning to perform a new test, make sure the necessary devices are switched on and connected to the computer before you start the program. If only one device is connected, you will find its serial number in the “Device” field in the Authentication window
Next, click on the “Login” button or press Enter. In case of an incorrect password an error message will be displayed (Figure 8-3), otherwise – the program main window (Figure 8-4).
Figure 8-3. Authentication error message
8.4 Description of the main window
The top part of the main window has two tabs: “Analyzer” and “Results" that allow choosing the program work mode (Figure 8-4 and Figure 8-18). By default, the main window opens the “Analyzer” tab (device measurement mode) and when the device is switched on the user sees the real time image of its cuvette compartment.

Thrombodynamics Analyzer System T2 US User Manual
version 1.3
50
Figure 8-4. Main program window when one device is connected
A star (green, red or yellow) at the top center of the main window displays the success of result of the device quality control test. For more information about the device quality control please refer to section 9.
Items of the main menu:
Analyzer: tab in the main window for starting a new test on the device;
Results: tab in the main window for working with the list of samples and results;
User : menu of options to manage the list of users and shut down the program.
Settings : menu of options for configuring the device and the test results printed form settings, registering plasma samples for quality control and editing directories.
Information : viewing of the user manual (its electronic copy in PDF format), information about the current version of the program, checking for a new version to update.
8.5 Device configuration
The Analyzer is fully configured and is ready to use.
All necessary settings configurations are already performed by the manufacturer. If it is necessary to change the settings please contact the authorized service center or the supplier of the instrument of the manufacturer,
The user can change the following settings:
Change the position and size of the areas of images of each cuvette channel
To configure the device or restore its settings from the firmware, go to Settings window (Figure 8-5) by selecting “Settings/Service menu” in the menu.

Thrombodynamics Analyzer System T2 US User Manual
version 1.3
51
Figure 8-5. Device settings
Serial number of the device is shown in the heading of the settings window.
Left part of the window shows the real-time image of the cuvette in the thermostat with areas of image acquisition for each channel (green rectangles). The user can change the area of image by setting X and Y coordinates of the left upper corner of the rectangle area, height (H) and width (W) of the area. The coordinates can be set manually using keyboard of using left button of a mouse (stretching and moving of the rectangle).
NB: To restore the factory settings areas of image acquisition press “Reset” button
You can save the changed settings or close the window without saving
In the upper right corner of the window there is button. It is used to enter the Service Menu of the instrument. Detailed description can be found in the Service Manual (available for service engineers)
Right part of the window shows the table of the main parameters of the Analyzer.
Parameter Description
Resolution Spatial resolution of the camera (image scale), pix/mm. This parameter is set individually for each instrument by the manufacturer of by a service engineer using the Calibrator supplied with the instrument.
Red LEDs Red LEDs brightness. The value is set by a manufacturer during device calibration. On/off check-box is used for switching on and off the LEDs.
Blue LEDs Blue LEDs brightness. The value is set by a manufacturer during device calibration. On/off check-box is used for switching on and off the LEDs.

Thrombodynamics Analyzer System T2 US User Manual
version 1.3
52
Parameter Description
“Brightness” button See section 8.5.1 for more details
Temperature
t, 0C
Temperature in the cuvette compartment in 0C. Default value is 37.
Thermostat is turning on immediately after turning on the instrument to reach the preset temperature. Current temperature is shown in the field according to the internal instrument sensor. On/Off marker indicates the activation of the heating elements.
Pressure
Р, atm
Pressure in the cuvette compartment in atmospheres. Default value is 0.5. Pressure maintaining system is turning on immediately after starting the measurement and is turning off at the end of the measurement. Current pressure is shown in the field according to the internal instrument sensor. On/Off marker indicates the activation of the pressure system.
8.5.1 Checking the brightness of the image
Brightness check-up is used after the request from a service engineer
To check the brightness of the image:
1) Take the Calibrator supplied with the Analyzer and place it into the thermostat instead of a cuvette. The print on the Calibrator should face the instrument. Close the thermostat cap and click bullet in front of «P, atm» text.
2) Press “Intensity” button. 3) Using the mouse move the blue rectangles and change its size. The average intensity of
light scattering in the chosen areas is shown in «Channel 1» and «Channel 2» fields. 4) To exit the brightness mode press “Intensity” button once again. 5) Click bullet in front of «P, atm» to switch off pressure mode.
Figure 8-6. Device resolution and brightness settings

Thrombodynamics Analyzer System T2 US User Manual
version 1.3
53
8.6 Print settings
The report on test results can be modified by including and excluding separate sections. To do this, select “Settings/Report settings” in the main menu (Figure 8-7). A window schematically displaying the report will appear (Figure 8-8).
Figure 8-7. “Settings” menu
In this window it is necessary to check sections and elements that need to be displayed on the report form. For automatic image processing (cut, rotate, auto-contrast), it is necessary to tick “Process images” box. To add a logo to the form upload an image in one of the following formats: bmp, jpg, png, gif, tiff. Image size must not exceed 120x80 pixels (width and height, respectively).

Thrombodynamics Analyzer System T2 US User Manual
version 1.3
54
Figure 8-8. Customizing the report form
8.7 Performing a new research
8.7.1 Sample preparation
Prepare plasma samples according to the protocol of the thrombodynamics research.
8.7.2 Selecting/changing the test parameters
The “Presets” list of possible test modes and the current mode are displayed in the lower left corner of the bottom bar of the “Analyzer” tab. The name of selected mode (in this example –
“Standard”) is displayed on the button (Figure 8-9)

Thrombodynamics Analyzer System T2 US User Manual
version 1.3
55
Figure 8-9. Selecting test preset
Parameters of the selected mode: duration of image capturing, capturing interval, temperature and pressure - are located to the right on the bottom bar of the “Analyzer” window. Users can select from a list of existing test modes, create and select a new capture mode, change the duration or other parameters of the current test. If you need to edit parameters of the current test (duration of capturing
, capturing interval , temperature , pressure ), click the corresponding button (Figure 8-10).
Figure 8-10. Editing test parameters
Two presets (“Standard” and “Quality Control”) are protected from modification. To change the
names of other presets open the list, select the name you want to edit, click the button in the upper

Thrombodynamics Analyzer System T2 US User Manual
version 1.3
56
right corner of the “Presets” window. After changing the name click on one of two buttons – “Save”
or “Cancel” .
To create a new preset: define the values of all parameters (duration, interval, temperature, pressure), open the list of presets, click “Save current settings as...” Enter the name of the new preset
and click “Save” (Figure 8-11).
Figure 8-11. Creating a new preset
8.7.3 Registration of samples by cuvette channels
Registration of samples by cuvette channels is possible after entering the activator barcode in the field located at the top center of the “Analyzer” window of this device. It is necessary to enter the required information to at least one cuvette channel (see the list of required fields below). This will enable the “Start” button on the device and in the software (Figure 8-12).
Figure 8-12. Entering the new research data

Thrombodynamics Analyzer System T2 US User Manual
version 1.3
57
List of required fields for completing sample registration:
Name Description
Activator barcode
A field without a text name in the top center of the screen. Filled in with the packaging barcode of the activator to be used during the current research. The value can be typed in or scanned with a barcode scanner. After this field is filled in properly, other required fields become available: “Sample code,” “Title” and “Plasma type.”
Sample code
Unique sample code, except when samples are from the same source and are taken at the same time (aliquots). The value can be typed in or scanned with a barcode scanner. If the lab does not have its own unique sample numbering, use any artificial numbering that ensures uniqueness, for example: “24051377” (sample from May 24, 2013, sequential number “77”). If the code is added to only one of the channels, clicking the “Start” will cause the software to display a warning about incomplete use of cuvette channels.
Test type Choose Thrombodynamics to measure fibrin dynamics only or Thrombodynamics-4D to measure both fibrin and thrombin dynamics
Kit For Thrombodynamics TDX and PLS Kit is available. For Thrombodynamics-4D PLS and ADP kits are available.
Plasma type Several types available in the list: “Fresh,” “Frozen,” “Lyophilized”. Impacts the list of thrombodynamics parameters controlled in this research and limits of the reference range of their values.
Measurement title A unique name of a measurement
Calibration is required
This box can be checked if the measurement requires individual brightness calibration, for example if lipemic, hemolytic or icteric plasma is used. This box can be checked during the measurement. Calibration process is described in section 6.5.2.
8.7.4 Starting the test
8.7.4.1 Incubation
Mode of plasma incubation with reagent “1” in microtubes is preceding the thrombodynamics test. Upon the completion of sample registration, clicking on the “Start” button located at the bottom center of the main window automatically starts the incubation mode (default incubation period is 3 min) (Figure 8-13).

Thrombodynamics Analyzer System T2 US User Manual
version 1.3
58
Figure 8-13. Sample incubation
Upon the completion of incubation (or after its termination with the “Stop” button) the ring on the device and in the program flashes green, in this mode the “Start” button starts the test. After the final preparation of cuvette with the samples the test can be started.
8.7.4.2 Running the test
To run the test click on the “Start” button in the program or on the device, the ring around it should flash green. The program will start the countdown to the end of the test and will continuously display the current picture with the clot growth in the cuvette channels (Figure 8-14). The ring on the device and in the program will be filled with red in proportion to the test progress.
To the right of the “Start” button the timer displays time remaining until the end of the test. The test completion time is displayed in the lower right corner of the window.

Thrombodynamics Analyzer System T2 US User Manual
version 1.3
59
Figure 8-14. Monitoring of the of clot growth after starting the test
8.7.4.3 Completing the test
Results of the test will be automatically calculated after its completion (Figure 8-15).
Figure 8-15. Automatic calculation of test results
8.7.4.4 Early termination of the test
To force stop the test prior to its scheduled end time, click on the “Stop” button (Figure 8-14).
8.7.4.5 Viewing previous images during the test
All previous images can be viewed during the test by clicking the “Review” button. To do this in the popup window that opens drag the time slider to the left (Figure 8-16).

Thrombodynamics Analyzer System T2 US User Manual
version 1.3
60
Figure 8-16. Viewing images captured earlier during the test
8.7.4.6 Individual calibration for the measurement
If individual calibration is required for the measurement and the «Calibration is required» checkbox is checked, the following dialog will appear after the end of measurement to make the calibration for the channel 1.
Press “Yes” and follow the instructions in the dialog window. Place a cuvette with the calibration plasma (see section 6.2.5) in the corresponding channel Repeat the procedure for the sample in the channel 2.
The individual calibration will be used for the image processing.

Thrombodynamics Analyzer System T2 US User Manual
version 1.3
61
8.7.4.7 Device errors during the research
In case of device errors during its operation (interruption of the pressure regulation mode “P” and/or temperature regulation mode “T”) the ring on the device and in the program starts to flash red and the triangular “Error” button to the right of the central ring turns red (Figure 8-17). The error window opens and displays a record of the error type, code and duration. Error codes and their meanings are listed in section 7, “Troubleshooting”. The information about all device errors within a session will be stored in the error window. To close the error window click on the “Acknowledged”
button. To reopen error window click button. Depending on the error type and duration, the user may decide on early termination of the research.
Figure 8-17. Error of the pressure regulation system (P) during the research
8.8 Working with the list of performed tests
To view the results of thrombodynamics tests go to the “Results” tab of the main window (Figure 8-18). The window contains a list of the tests performed within the current day by default.

Thrombodynamics Analyzer System T2 US User Manual
version 1.3
62
Figure 8-18. List of results
The list can be sorted by any column (in ascending or descending order) by clicking on the column title. Some activities in the list can be performed on several results simultaneously. To select all of the results that are displayed in the table at the moment, it is necessary to put a mark in the title of the first column. To select multiple individual results – put a check mark next to the corresponding results. When working with the list the user is able to perform the following actions using the appropriate buttons at the top of the window:
“Details” button: displays detailed information on the selected results in a separate window. When two or more of the results are selected then it is possible to switch between them by using arrow buttons in the title bar of the detailed view (section 8.8.8, “Viewing sample results”)
“Calculate” button: opens a window for calculating results of the selected entries (if the version of the current automatic calculation algorithm is newer than the one used for calculation earlier or if non-standard calculation parameters were chosen), see section 8.8.3, “Calculation”.
“Tags” button: o Tag filter: opens the list of tags to select (general and individual for a given user). You
can select multiple tags at a time. General (public) tags are in bold type.
o Change tags: adds and deletes selected entries, you can add new tags and delete
existing ones. For more information on working with tags, please refer to section 8.8.2,
“Working with tags“
Reports” button:
o Results report: Viewing and printing out the results of selected researches. o Activator report: Generates report to verify the lots of activators in the selected
researches.
“Refresh” button (icon to the right of the quick search field): updates the list from the database.
“Search” button: opens a panel with the search filter selection criteria, see section 8.8.1.2, “Creating and using search filters”.
“Columns” button: opens a window for checking columns to be displayed in the list (Figure 8-19).

Thrombodynamics Analyzer System T2 US User Manual
version 1.3
63
Figure 8-19. Configuring columns in the result list
”Export” button: o Export measurements: generates a file with complete information about the selected
tests for further import into another database. o Export results: generates a report in CSV text format or in the Microsoft Excel program
(if installed on the computer) on all result calculations for the selected tests. When using Excel images can be exported also (at 5, 15 and 30 min. after the measurement start) The list of fields displayed in the report depends on the visibility of columns in the interface.
o Export TRM: exports data in a specific format.
“Import” button: o Import measurements: imports complete information on the research from another
database into the current one.
8.8.1 Search results
8.8.1.1 Quick search
To find results by sample code, measurement title, device serial number, result identifier (barcode on the result’s printed form), just enter a few characters in the quick search field at the top center of the window (field with white background just under the database name “Local” on Figure 8-18). Search will be performed automatically with 2 seconds delay after the entry. Quick search performs additional filtering within results selected by regular search filter activated to the left of the results list ("All", "Today", etc.).

Thrombodynamics Analyzer System T2 US User Manual
version 1.3
64
8.8.1.2 Creating and using search filters
The software enables you to create your own unique search filters, execute them and save in the list of filters for future use.
To create a new filter, first select any existing filter, except the special filter "All", in the left
pane, and click button. In the panel that opens, you can add new search fields to filter the results
( buttons) and change the selection criteria (Figure 8-20). With any change the software automatically creates a filter in the list on the left side of the window with the name "New". Selected
results of the filter criteria are applied only after pressing button. New filter can be saved for
later use with any unique name by pressing button or can be closed without saving by pressing
button again or by selecting a different filter.
Figure 8-20. Edit search filter conditions panel
To remove any previously saved filter (except standard predefined filters "All" and "Today"), you
must select this filter in the left pane, open the search panel and press button.
8.8.2 Working with tags
Tags help to label a group of tests for further quick selection using the appropriate filters. The same test can be assigned with multiple tags simultaneously.
8.8.2.1 Creating a new tag (and adding it to the test)
Select tests from the list (using filters or manually), that will be assigned a new tag.
Click on the “Change tags” button (available when at least one entry is selected). In the window that opens (Figure 8-21) enter the name of the new tag under the list of existing
tags, tick the tag visibility area (“global" means that the tag is visible and accessible to all users).
Click “Add”. The new tag will be added to the list.
Find the new tag in the list, check its box, click “OK.” The selected entries will be assigned with a new tag.
Figure 8-21. Tag list

Thrombodynamics Analyzer System T2 US User Manual
version 1.3
65
8.8.2.2 Adding an existing tag to the tests
Select test from the list. Click “Change tags” button.
In the window that opens, find the required tag in the list, check its box and click “OK.” Selected tests will be assigned with the tag.
8.8.2.3 Removing tag from tests
Select test from the list.
Click “Change tags” button.
Uncheck the tag you want to exclude from the selected tests, click “OK”.
8.8.2.4 Removing the tag
Select test from the list.
Click “Change tags” button.
Select a tag you want to remove by selecting the entire tag line.
Click “Delete”. After the warning the tag line will be crossed out.
Click “OK.” The tag will be removed.
8.8.3 Calculation
If re-calculation of the selected tests is necessary, click “Calculate” at the top of the sample list window. A window with calculation parameters will appear (Figure 8-22). Automatic test result recalculation is available for group operations, if the current version of the automatic algorithm is newer than the one used to make the last calculation of the selected tests or if non-standard calculation parameters were specified. In case you select a single sample, manual calculation will be available in addition to the automatic method. To start the calculation, click “Calculate”.
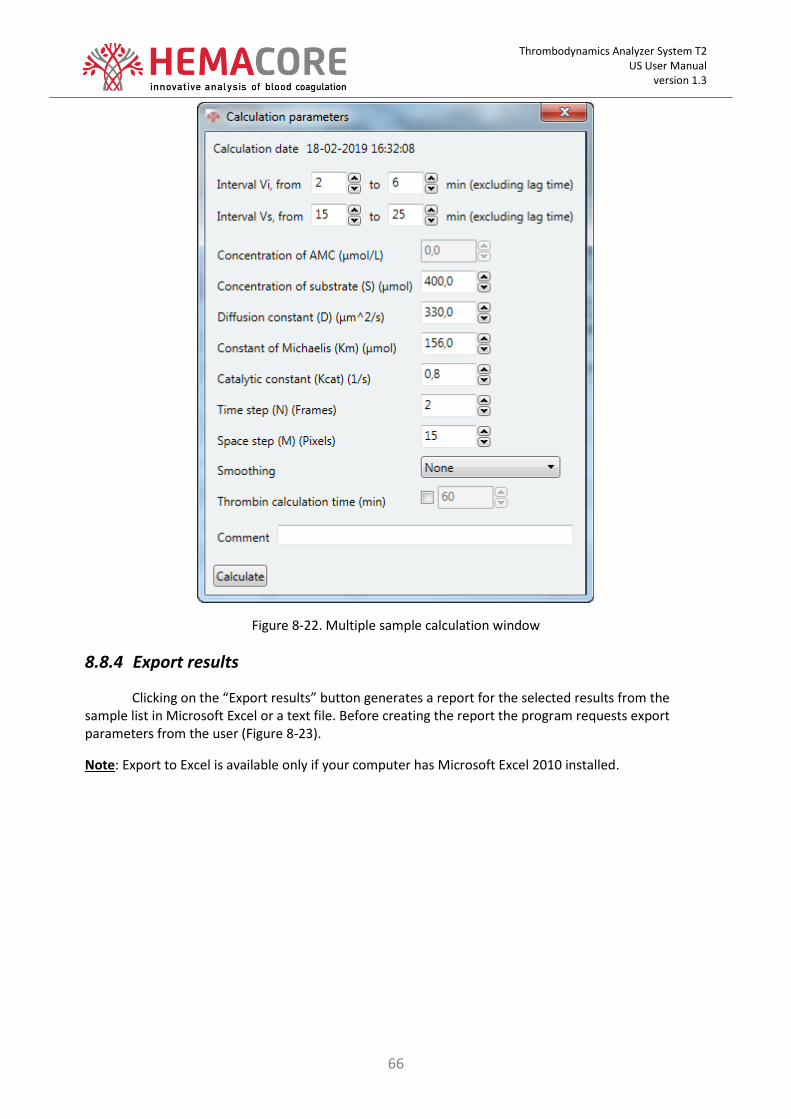
Thrombodynamics Analyzer System T2 US User Manual
version 1.3
66
Figure 8-22. Multiple sample calculation window
8.8.4 Export results
Clicking on the “Export results” button generates a report for the selected results from the sample list in Microsoft Excel or a text file. Before creating the report the program requests export parameters from the user (Figure 8-23).
Note: Export to Excel is available only if your computer has Microsoft Excel 2010 installed.

Thrombodynamics Analyzer System T2 US User Manual
version 1.3
67
Figure 8-23. Microsoft Excel or Text File export parameters
8.8.5 Export of tests
This function is intended for exporting all information on the selected samples from one database to another. To start exporting specify the folder for saving the data (Figure 8-24).
Figure 8-24. Choosing a location and file name during data export

Thrombodynamics Analyzer System T2 US User Manual
version 1.3
68
Figure 8-25. Export progress
8.8.6 Import of tests
This function is intended for importing tests to the current database. To start importing specify the data file (Figure 8-26).
Figure 8-26. Selecting the file for import

Thrombodynamics Analyzer System T2 US User Manual
version 1.3
69
8.8.7 Print results
The print option is available for a group of selected results. For all the selected samples with calculation one file will be generated and opened for viewing and printing. The layout of the print form corresponds to the configuration of print options (see section 8.6, “Print settings”).
8.8.8 Viewing sample results
Window for detailed viewing and commenting on the sample results is opened for checked results in the list by clicking “Details” button. To switch between the selected results use the button
in the title bar.
The window for each sample displays the data of the most recent calculation. If there have been several calculations it is possible to switch between them using the dropdown menu appearing by clicking on the label displaying current calculation date, time and algorithm version.
The left part of the window displays pictures taken during the measurement and tools for their viewing at every moment of time, as well as image correction tools (zoom, contrast, histogram with levels adjustment). The clot growth and spontaneous clot growth area charts (if any) are located in the center. The thrombodynamics tests results with their relation to the reference range of each parameter, obtained as a result of calculation, are located to the right. All images captured are located at the bottom of the result window.
To navigate through the test images use the buttons (first frame, start and stop video, last frame) or select the image by moving the red vertical line on the chart with the mouse or select an image with the mouse at the bottom of the window:
.
The following options are available:
Viewing the clot growth video;
Viewing any frame at a given time from the start of video recording;
Correcting images when viewed in the interface;
Printing the results as a report on the form;
Calculation/recalculation of results;
Saving the clot growth video;
Saving any single frame.
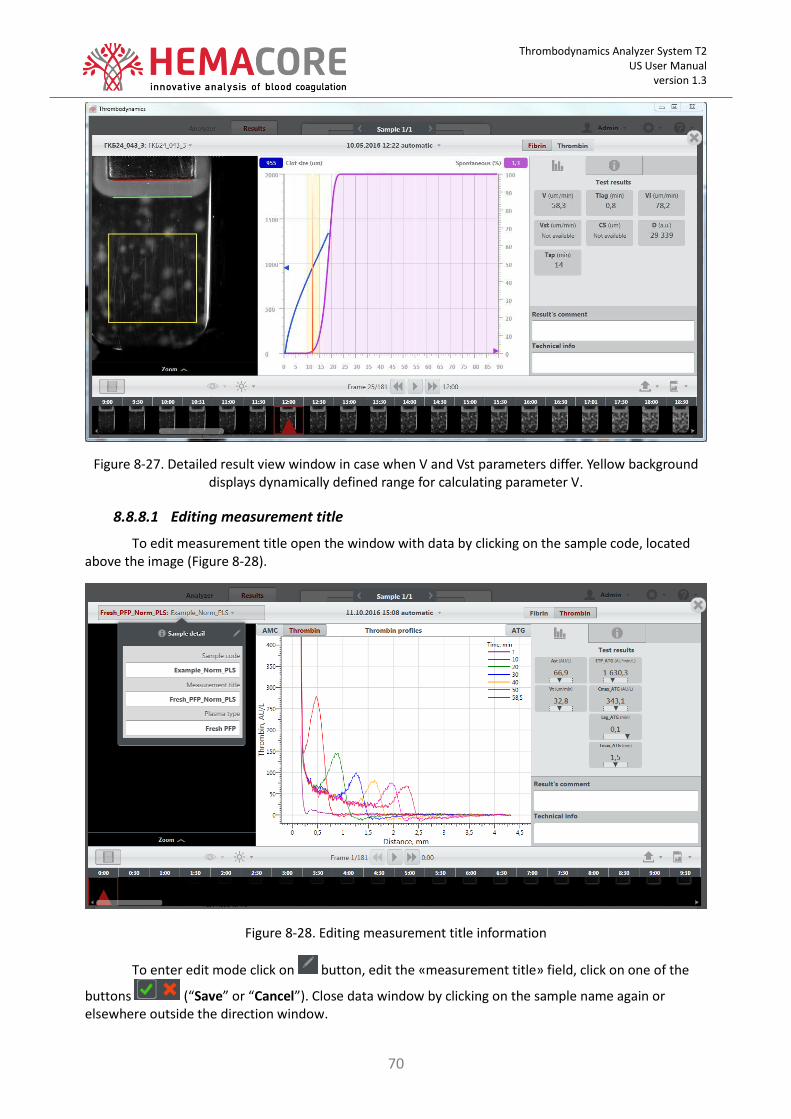
Thrombodynamics Analyzer System T2 US User Manual
version 1.3
70
Figure 8-27. Detailed result view window in case when V and Vst parameters differ. Yellow background displays dynamically defined range for calculating parameter V.
8.8.8.1 Editing measurement title
To edit measurement title open the window with data by clicking on the sample code, located above the image (Figure 8-28).
Figure 8-28. Editing measurement title information
To enter edit mode click on button, edit the «measurement title» field, click on one of the
buttons (“Save” or “Cancel”). Close data window by clicking on the sample name again or elsewhere outside the direction window.

Thrombodynamics Analyzer System T2 US User Manual
version 1.3
71
8.8.8.2 Correcting images when viewing
When viewing pictures, you can change image scale. Clicking on the button
opens the zoom bar (Figure 8-29). Button sets the 100% zoom (one pixel in the image corresponds
to one pixel on the screen). Button will return the default scale (fit on screen).
In the window that opens by clicking on button you can change image contrast, view the current image histogram, view the image or video with the subtraction of the background image. To switch from the auto contrast mode to the original image, manually move the contrast sliders under the histogram to their extremes.
Figure 8-29. Correcting images when viewed in the interface
8.8.8.3 Creating a results report
The thrombodynamics test result report is generated by clicking on the button (“Reports”) from the window of detailed sample result view or from the list of results (Figure 8-18). For details, see section 8.8.7, “Print results” and 8.6, “Print settings”.
8.8.8.4 Saving the clot growth video
The clot growth video obtained after recording can be saved in mp4 or avi (Figure 8-30). After
clicking on button and selecting “Save video.mp4 (H.264)” or “Save video.avi (MPEG4 Part 2)” the standard Save file dialog will appear. After that the file will be saved under the selected name. For further playback of the saved video file in MP4 format install the of H.264 pack of video codecs, for example “K-lite codec pack” by clicking on the link:
http://codecguide.com/download_k-lite_codec_pack_standard.htm

Thrombodynamics Analyzer System T2 US User Manual
version 1.3
72
In case the video was saved in AVI format no additional software is required. These files are played back by the standard Windows media player. When using videos in PowerPoint presentations it is recommended to work with AVI files, as they ensure the best compatibility.
Figure 8-30. Saving the clot growth video file
8.8.8.5 Saving the selected frame
The frame selected when viewing the video can be saved in TIFF format. After pressing the
button and selecting “Save Image” in the menu a standard Save file dialog will open, after which the file will be saved under the selected name.

Thrombodynamics Analyzer System T2 US User Manual
version 1.3
73
8.8.8.6 Result calculation/recalculation
The need for the result calculation/recalculation can arise in case of importing data with no calculations, or upgrading of the automatic algorithm. The calculation can be initiated by clicking on the “Calculate” button in the list of samples (Figure 8-18) for one or more samples or from the window for detailed viewing of an individual result from the list of calculations (above the charts – see Figure 8-31).
Figure 8-31. Calculations list
Figure 8-32. Thrombodynamics test calculation window

Thrombodynamics Analyzer System T2 US User Manual
version 1.3
74
The “Calculate” button will be available if the version of the current automatic calculation algorithm is newer than the one used for calculation earlier or if non-standard calculation parameters were chosen.
Manual test calculation for fibrin parameters is also possible for example if the automatic algorithm was unable to perform calculation. To do this, select “Manual Calculation” in the calculations list menu (see Figure 8-31).
Figure 8-33. Semi-automatic (manual) calculation of the thrombodynamics test parameters
To build light scattering profiles, drag the original green frame in the desired area and resize it with the left mouse button. Next, click “Get profiles” to calculate the test results (Figure 8-33). To change the position of lines of plateau and the beginning of clot growth of the profile chart drag the lines with the circle using the mouse. To save the manual calculation, click “Save result”.
8.9 Device software update
The user can check the availability of the new version and run the automatic update process by selecting “Help/About” in the main menu and clicking “Check update” (Figure 8-34 and Figure 8-35). Internet connection required. If a new version of the update is available, click the “Update” button.

Thrombodynamics Analyzer System T2 US User Manual
version 1.3
75
Figure 8-34. Checking for updates
Figure 8-35. Absence of new version message
8.10 Sending an error file to the manufacturer
After each session with the device software the ThromboDynamics_LOGS.zip file is saved in the “Documents” folder of the current Windows user, which, in the event of an error, must be e-mailed to your local service representative. This archive does not include diagnostic files of big size; these can be copied from the following folder when needed: %AppData%\ThromboDynamics\Log
At the request of the service representative you may also need to run the program in debug mode to gather further information. This is done using the “ThromboDynamics (DEBUG-mode)” shortcut, which is created in the “HemaCore” folder in the “Start” menu when you install the program. Keep in mind that in this case the amount of collected information can be measured up to tens of megabytes per hour. On success, the program automatically creates an archive ThromboDynamics_LOGS.zip, so the shutdown process can be quite long (several minutes – depending on the duration of the last session of the program and the performance of your computer). In case of forced termination of the process through “Task Manager” or by turning off the computer backing up will not be completed, and the resulting file may be damaged.

Thrombodynamics Analyzer System T2 US User Manual
version 1.3
76
8.11 Shutting down the program
To shut down and exit from the program select “User/Shut Down” or close the main window by clicking “X” in the upper right-hand corner. Please note that this starts a background backup process, as described in paragraph 8.10, which can be quite lengthy, especially in case of debug mode.
8.12 Backup
By default, the database and test videos are stored in the computer (laptop), working directly with the device. In this case, it is necessary to regularly backup this information to the backup media in order to prevent its loss due to software or hardware failure.
Typically, the database is stored in folder “C:\HemaCore\Database”», and videos - in folder “C:\HemaCore\Video.” When partitioning a hard drive into multiple logical ones video files are usually stored on the larger disk, for example, in folder “D:\HemaCore\Video.” The exact location of the folders can be can be found out from the service engineer. It is recommended to copy the entire “HemaCore” folders, located at the root of all local drives. Folder backup should not be performed when running the Thrombodynamics software.
8.13 Explanation of automatic algorithm error codes
00 Insufficient duration of the measurement1
01 Activator border was not detected
02 Clot was not detected
03 High levels of background intensity
04 The calculation area overruns image borders
05 Failed to evaluate the plateau level
06 Intensity near the activator is not uniform
07 Negative velocities
08 Failed to evaluate some of the parameters
09 Video is not available or contains not enough frames
10 Spontaneous clots detection area overruns image borders
8.14 Changing the reference ranges
If required, a user with Admin role can change the reference ranges of Thrombodynamics parameters by selecting the “Test parameters range” menu item (Figure 8-36).
1 Code “00” is an informational message, it does not necessarily means an error

Thrombodynamics Analyzer System T2 US User Manual
version 1.3
77
Figure 8-36. Editing Thrombodynamics parameters reference ranges
Reference ranges of test parameters depend on the type of plasma. The software comes with predefined test parameters reference ranges for fresh plasma, approved by the manufacturer, but the end user can change these ranges. When determining whether a Thrombodynamics parameter falls in the reference range only those options that are checked with a mark are analyzed. For example, in the screenshot above the reference range for the parameter “Spontaneous clotting” is not taken into account, as a mark next to it is not checked.
After changing the reference ranges the new values will be used in all subsequent results. The device database will keep full history of measurement calculations and each calculation will be linked to the reference ranges valid at the time of calculation.
If necessary, any measurement can be recalculated and saved with the currently defined reference ranges, see section 8.8.3.
Software version updates may include new reference ranges values based on the additional researches performed by the manufacturer. If you use your own reference ranges, check them after the software update and reset to your values if necessary.

Thrombodynamics Analyzer System T2 US User Manual
version 1.3
78
9 Quality control
9.1 General information
Each laboratory should establish a quality control (QC) procedure. Control Material should be tested prior each series of measurements, to ensure satisfactory instrument, reagents and operator performance. If Control Material samples do not perform as expected, further results should be considered invalid.
Each Control Material sample should be treated in the same manner as the general specimen. The QC measurements are recommended to be run with any change of personnel operating the
System. Thus QC is intended to identify potential problems with the device, reagents, consumables,
pipette performance, user technique. QC procedure is intended to check if the results of laboratory
investigations are reliable enough for coagulation system status estimation.
Quality control procedures should be applied in a way that ensures immediate and constant
control of results obtained. At least one QC measurement should be included with each group of
measurements or when doubt exists about whether a method is under control.
It is strongly recommended to perform QC measurement:
new reagents lot
device recalibration/ repair/ movement
quarterly or extended service procedures
when T2 System was not in use at least for two weeks
software update
Users should also follow local quality control guidelines.
9.2 Potential reasons when QC is out of range
If QC result is outside of the expected range, examine the potential reasons:
Check reagents expiry date
Check Control Material expiry date
Repeat control measurement attentively and carefully in the same conditions. Note. In case of equipment errors contact your service provider immediately. If target values achieved, samples may be tested and valid results can be expected. If problems cannot be resolved, contact your local service provider.
9.3 Registration of the control sample batch
Before using the control sample batch it must be registered in the “Quality Control” window (Figure 9.1) that can be opened from the «settings» item in the main menu.

Thrombodynamics Analyzer System T2 US User Manual
version 1.3
79
Fig.9.1 Registration of the control sample batch
There is a default control batch called «Fresh PFP Pool» with the reference ranges similar to the normal reference ranges for fresh PFP (Figure 9.1). Note! When one changes normal reference ranges for fresh PFP then «Fresh PFP Pool» reference ranges also change.
Press «Add» button. Enter batch name in the «Name/Barcode» field or scan it using barcode scanner (for example from Control Kit certificate). A new batch record will appear in the batch list.
Enter comment, expiry date, measurement and kit type (Figure 9.2).
Enter reference ranges for batch parameters into the table (see par. 11).
Mark parameters that will be used as reference during QC measurement (it is possible to mark only lower or upper limit for each parameter).
Note! When using 30-digit barcode of HemaCore’s Control Plasma the reference ranges will be entered automatically.
Control sample batch parameters
When determining whether a TD or TD4D parameter falls in to the control batch reference range only those options that are checked with a mark are analyzed.
To save information about the control sample batch, click “Save”.

Thrombodynamics Analyzer System T2 US User Manual
version 1.3
80
Fig. 9.2. Entering parameters of the control sample batch
9.4 Control Material pretreatment
Thrombodynamics Control Kit
Please, follow Control Kit instructions for use when using Control Plasma provided by HemaCore for thrombodynamics quality control measurements.
Fresh and Frozen Control Material
Pretreatment of user fresh and frozen Control Material samples for quality control measurement is identical to pretreatment of general fresh and frozen measurement samples (see par. 5.1)
9.5 Running the measurement with Control Material
1. Prepare Control Material sample and package with activating insert from TDX or PLS kit. 2. Select Quality Control preset. «Quality Control» message will appear above sample code field
(Figure 9.3) and specific measurement mode will be initiated automatically (cannot be changed). 3. Enter the bar code from the activating insert package or scan it with bar scanner in to the upper
field on the main screen. 4. Press list button near sample code field and select control batch (pool) that will be used. You can
also type control batch name in the sample code field or scan its barcode. 5. You can change measurement name if necessary. 6. Next steps of the control measurement are identical to general measurement steps.

Thrombodynamics Analyzer System T2 US User Manual
version 1.3
81
Quality Control measurement
Simultaneous usage of different cuvette channels for control measurement and general measurement is prohibited.
Quality control measurement is performed with the Control Material in both cuvette channels simultaneously.
Quality control measurement is considered successful only if the results received from both channels are successful.
Figure 9.3. Quality control mode
QC measurement validates results of further measurements.
9.6 Quality control results
Quality control measurement is performed with the Control Material in both cuvette channels simultaneously. QC measurement is considered successful only if the results received from both channels are successful.
The result of the last quality control performed on the device is shown on the right of the activator barcode field (green, red, yellow star).
Yellow star indicates that no quality control has been performed.
Green star indicates a successful quality control performed.
Red star indicates failure to perform quality control.
Clicking on the button opens a list of five most recent quality control results (Figure 9.4). Color of the result lines also notifies about the success/failure of the quality control.

Thrombodynamics Analyzer System T2 US User Manual
version 1.3
82
Figure 9.4. Results of the last five quality controls
Automatic change of quality control status
Results of QC measurement will be automatically cancelled in the following cases:
Blue channel calibration was preformed
Service menu entry was detected
More than 14 days passed since last measurement
9.7 Working with the list of performed control tests
To obtain the report about the control series press the “Report” button in the “Quality control window”. Enter the time interval of interest. Once the time interval is set, press the “Show” button to create the QC report.

Thrombodynamics Analyzer System T2 US User Manual
version 1.3
83
10 Appendix 1. Performance characteristics
10.1 Technical data
Model T2-F T2-T
Measurement type
Thrombodynamics (TD)
Fibrinolysis
Thrombodynamics (TD)
Thrombodynamics-4D (TD-4D)
Fibrinolysis
Measuring principle Registration of light scattering signal from the growing fibrin clot
Registration of light scattering signal from the growing fibrin clot
Registration of fluorescence signal during cleavage of synthetic AMC-based substrate by thrombin
Measurement duration 30 min for TD by default
Max duration - 8 hours
30 min for TD by default
60 min for TD4D by default
Max duration - 8 hours
Productivity 4 test/hour for TD measurements
4 test/hour for TD measurements
2 test/hour for TD4D measurements
Dimensions 430x230x160 mm (device without notebook)
Weight 10 kg max (device without notebook)
Power supply 100 – 242 V AC, 50 – 60 Hz
Power consumption 230 VA max
Sample volume 0.12 ml
Number of measuring channels
2
Number of preheated places 4
Temperature control 30°C ±0.5°C to 45°C ±0.5°C for all channels simultaneously (0.5°C step)
Brightness control 0 to 255 a.u. for all channels simultaneously

Thrombodynamics Analyzer System T2 US User Manual
version 1.3
84
11 Appendix 2. Frozen Control Material pool preparation, characterization and storage
Frozen Control Material pool can be prepared from fresh PFP from at least 3 healthy individuals without any anticoagulant therapy and not having any hemostatic disorders revealed by anamnesis, clinical presentation and routine coagulation assays.
Preparation of fresh PFP samples
Prepare PFP samples according to 5.1.1.2. Mix plasma samples in a plastic tube to prepare a pool.
Freezing of PFP Control Material batch
Fresh PFP pool can be aliquoted and stored frozen for further use. Prepare 0.5-1ml of plasma pool aliquots in the plastic tubes. Place tubes into the racks.
Place the racks with the tubes into the refrigerator at -75-80° C for storage (liquid nitrogen can be used for initial freezing).
Control Material batch characterization
Not earlier than 24h after freezing ≥40 measurements of the batch samples should be performed for determination of control batch reference ranges for each measurement type (kit).
Perform TD or TD4D measurements on the selected samples.
Calculate QC reference range for each parameter using obtained results. QC reference range is defined as an interval between 5 and 95 percentile for each parameter, except Tlag parameter. Tlag reference range is always defined as 0.6-1.5 min (this range is set wider than it may be determined during pool characterization procedure because it also depends on activating insert individual production lot properties and determined in multiple pool characterization studies conducted by manufacturer on different production lots).
Use obtained reference ranges for Control Material registration in the Software (Section 9.3)
Control Material Storage
Frozen Control Material batch can be stored:
No more than 12 month at temperature ≤ - 75°C
No more than 6 month at temperature ≤ -40°C
No more than 3 month at temperature ≤ -20°C
After expiration of storage term Control Material batch characterization must be repeated.

Thrombodynamics Analyzer System T2 US User Manual
version 1.3
85
12 Appendix 3. Manufacturer’s warranty
Thrombodynamics Analyzer System T2 has a 12 months manufacturer’s warranty, measured from time of installation at customer site.
The warranty does not apply, and the warranty repair is not made, in the event of a System failure is due to:
violation of the rules and conditions of operation, storage and transportation of the System specified in this user manual;
damage to the System as a result of impact of a liquid, mist, fire, aggressive gas, steam or ionization radiation;
damage to the System caused by electrical breakdown, as well as due to voltage deviation (current, frequency) from the nominal values;
damage to the System as a result of computer viruses and similar programs, installing or changing a password, modifying and (or) reinstalling preinstalled software, installing and using third-party software, formatting hard disk drives;
opening the System, unauthorized repair, configuration, modification, and any other refinement;
mechanical, thermal, chemical and other damage.
Warranty does not apply:
for software products supplied with the System, for which end-user license agreements are provided,
software products and information that are not supplied with the System and are installed, stored or created by the user independently,
Data stored or received using the System. The user assumes responsibility for the timely backing up of the important data and its protection.
For any warranty related questions contact your System supplier.

Thrombodynamics Analyzer System T2 US User Manual
version 1.3
86