THREE URBAN TRANSECTS OF SHALLOW SHEAR...
10
THREE URBAN TRANSECTS OF SHALLOW SHEAR-VELOCITY USING THE REFRACTION MICROTREMOR METHOD J.B. Scott 1 , M. Clark 1 , C. Lopez 1 , A. Pancha 1 , T. Rasmussen 2 , S.B. Smith 1 , W. Thelen 3 , and J.N. Louie 4 ABSTRACT Our surveys of shallow shear velocity in the Reno, Los Angeles and Las Vegas urban areas yielded information assisting in the mitigation of earthquake hazards, and in preparing for future damaging earthquakes. The three transects (16, 60, and 13 km long respectively) were completed quickly and economically using the refraction microtremor method, providing 100-m-deep shear-velocity profiles of over 300 separate sites. Shear-wave velocity averaged over 30 m depth (Vs30) is unexpectedly smooth along all three transects. Vs100 values for the three transects, averaging over the 100 m depth to which most of our measurements are valid, show trends mimicking the Vs30 trends. Across all three cities our measurements correlate poorly against available USDA soil maps and geologic mapping, and often poorly against hazard mapping when prepared from general maps. Standard maps do not predict the conditions of any individual site with accuracy sufficient for engineering application; special-purpose mapping for shear velocities, as in Los Angeles, provides better predictions. A detailed stratigraphic model derived from deep water-well logs in Las Vegas predicts Vs30 better than maps, but only in thoroughly sampled areas. 1 Graduate Research Assistant, Nevada Seismological Laboratory, Univ. of Nevada, Reno, NV 89557 2 Geologist, Gary S. Rasmussen & Associates, 1811 Commercenter West, San Bernardino, CA 92408 3 Graduate Research Assistant, Department of Earth and Space Sciences, Univ. of Washington, Seattle, WA 98195 4 Professor, Nevada Seismological Laboratory, University of Nevada, Reno, NV 89557
-
Upload
truongdang -
Category
Documents
-
view
224 -
download
6
Transcript of THREE URBAN TRANSECTS OF SHALLOW SHEAR...

THREE URBAN TRANSECTS OF SHALLOW SHEAR-VELOCITY USING THE REFRACTION MICROTREMOR METHOD
J.B. Scott1, M. Clark1, C. Lopez1, A. Pancha1, T. Rasmussen2, S.B. Smith1, W. Thelen3, and J.N.
Louie4
ABSTRACT Our surveys of shallow shear velocity in the Reno, Los Angeles and Las Vegas
urban areas yielded information assisting in the mitigation of earthquake hazards, and in preparing for future damaging earthquakes. The three transects (16, 60, and 13 km long respectively) were completed quickly and economically using the refraction microtremor method, providing 100-m-deep shear-velocity profiles of over 300 separate sites. Shear-wave velocity averaged over 30 m depth (Vs30) is unexpectedly smooth along all three transects. Vs100 values for the three transects, averaging over the 100 m depth to which most of our measurements are valid, show trends mimicking the Vs30 trends. Across all three cities our measurements correlate poorly against available USDA soil maps and geologic mapping, and often poorly against hazard mapping when prepared from general maps. Standard maps do not predict the conditions of any individual site with accuracy sufficient for engineering application; special-purpose mapping for shear velocities, as in Los Angeles, provides better predictions. A detailed stratigraphic model derived from deep water-well logs in Las Vegas predicts Vs30 better than maps, but only in thoroughly sampled areas.
1Graduate Research Assistant, Nevada Seismological Laboratory, Univ. of Nevada, Reno, NV 89557 2Geologist, Gary S. Rasmussen & Associates, 1811 Commercenter West, San Bernardino, CA 92408 3Graduate Research Assistant, Department of Earth and Space Sciences, Univ. of Washington, Seattle, WA 98195 4Professor, Nevada Seismological Laboratory, University of Nevada, Reno, NV 89557
Introduction
From 2001 to 2003 we conducted intensive and detailed surveys of shallow ground shear velocity across three urban areas. These surveys provide information that will assist in mitigating earthquake hazards in Reno, Los Angeles and Las Vegas, and in responding to a damaging earthquake. This work is an engineering reconnaissance, searching for ``hot spots'' in the seismic shaking hazard. As shallow shear velocity decreases, shaking hazard increases (Borcherdt, et al., 1991). Vs30 is the shear-wave velocity averaged to 30 meters depth and is one predictor of earthquake ground motion amplification and potential hazard in alluvium-filled basins in California (Field et al., 2000). Under NEHRP-Universal Building Code (UBC) provisions (BSSC, 1998) sites are categorized for shaking hazard with Vs30. The three transects were completed quickly and economically by combining the refraction microtremor method of Louie (2001) with roll-along arrays of independent recorders. Shallow shear velocity is traditionally estimated with engineering surveys in boreholes, such as crosshole (ASTM D4428/D4428M-00, 2005), downhole, and suspension logger surveys. Such boreholes are costly, with results publicly available from less than 100 sites in Los Angeles, about five sites in Las Vegas, and one site in Reno. The cone penetration test (CPT) specified by ASTM D5778 (2005) correlates well with borehole tests and is used widely for soft sites. Ghose and Goudswaard (2004) note, however, that the CPT is limited to measured soil strength values obtained at a single geographical point and thus is a poor predictor of the average soil strength over an area of interest. The Spectral Analysis of Surface Waves (SASW) method (Stokoe et al., 1994) measures average shallow shear-wave velocity over an area and provided us additional data from thirty sites in Las Vegas. One deep acoustic log exists for Reno, which provides no constraint on shallow velocities for NEHRP classification. Shaking hazard is best measured by recording damaging earthquakes on strong-motion seismometers, from which data are similarly sparse in all three cities. Hazard mitigation and earthquake emergency response planning both need complete mapping of the shaking hazard. To date these hazard maps have been predicted from geologic map units correlated against sparse downhole shear-velocity measurements (Wills, et al. 2000), but our results (Scott, et al., 2004) show that existing maps may not predict shallow velocities well enough for engineering application.
Methods
The three transects were completed by University of Nevada, Reno students using roll-along linear arrays of IRIS/PASSCAL ``Texan'' single-channel recorders, which recorded ambient noise from traffic and other natural and cultural sources. Data analysis was with Optim's SeisOpt® ReMi™ package, a method developed by Louie (2001). Refraction microtremor surveys have successfully matched deep borehole logs in terms of depth-averaged shear velocities to 10, 30, and 100 m depth, and in comparisons of the site-amplification spectra generated from the shear-velocity profiles (Stephenson et al., 2005). The shear-wave-velocity-versus-depth section we obtained for Las Vegas is shown in fig. 1 as an example of the dense, closely spaced velocity profiles we collected. Louie (2001) reports ±20% velocity accuracy for Vs30 values derived from velocity profiles obtained with the refraction microtremor method. To assess the standard deviation due to noise source and dispersion-picking differences for the individual Vs30 values, more than ten percent of the Las

Vegas transect’s locations were independently modeled by different analysts. The values they obtained were well within the ±20% stated accuracy. We concluded that the variability in the recorded sources of microtremor noise, and in the picking and modeling process could be expected to contribute perhaps less than ±10% error in Vs30.
Figure 1. Shear-wave-velocity section for Las Vegas assembled from forty-nine velocity-depth
profiles that model the dispersion curves derived from all forty-nine, 270-m-long microtremor array segments, from Scott et al. (2005). Velocities deeper than 200 m are least constrained by the dispersion data, and thus vary widely between the segments. The white-line graph plots our best estimate of the maximum depth to which the analyzed Vs is valid; thus the area below the white line is grayed out. This section has 20 times vertical exaggeration. Values contoured in color are in m/s. The white color represents velocity values on the NEHRP B/C boundary at 760 m/s.
Results
Refraction-microtremor estimates of 30-m depth averaged velocities (Vs30) across the three urban areas are plotted in fig. 2. The curves are unexpectedly smooth. In all three cities the lowest velocities observed are close to the NEHRP C/D class boundary, just under 360 m/s. Several Los Angeles deployments around Alamitos Bay, Long Beach, did not find any NEHRP-E class (Vs30 <180 m/s, very low) velocities, despite measuring artificial fill in a lagoon. Another unexpected result in all three cities was the appearance of high velocities, Vs30 values almost at the NEHRP-B/C boundary (760 m/s), where the geology was the most Recent fluvial or alluvial gravel deposits. Such maxima appeared in northern San Gabriel Valley, along the Las Vegas “Strip”, and in west Reno.
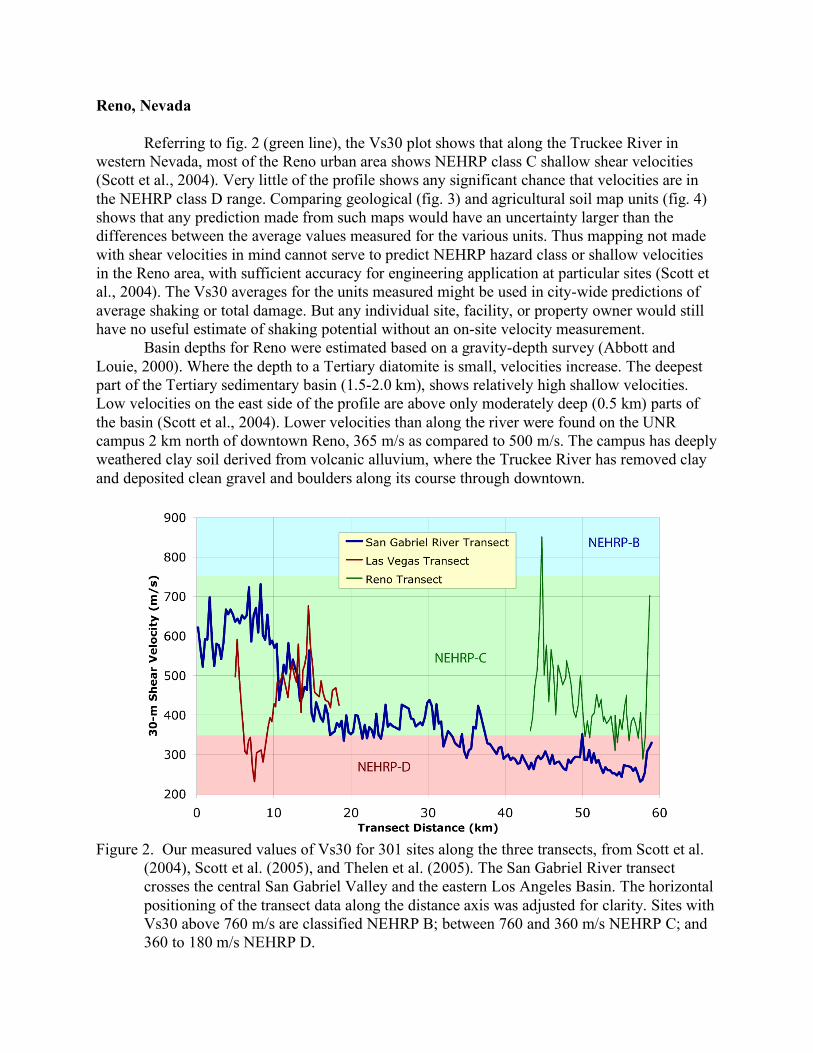
Reno, Nevada Referring to fig. 2 (green line), the Vs30 plot shows that along the Truckee River in western Nevada, most of the Reno urban area shows NEHRP class C shallow shear velocities (Scott et al., 2004). Very little of the profile shows any significant chance that velocities are in the NEHRP class D range. Comparing geological (fig. 3) and agricultural soil map units (fig. 4) shows that any prediction made from such maps would have an uncertainty larger than the differences between the average values measured for the various units. Thus mapping not made with shear velocities in mind cannot serve to predict NEHRP hazard class or shallow velocities in the Reno area, with sufficient accuracy for engineering application at particular sites (Scott et al., 2004). The Vs30 averages for the units measured might be used in city-wide predictions of average shaking or total damage. But any individual site, facility, or property owner would still have no useful estimate of shaking potential without an on-site velocity measurement. Basin depths for Reno were estimated based on a gravity-depth survey (Abbott and Louie, 2000). Where the depth to a Tertiary diatomite is small, velocities increase. The deepest part of the Tertiary sedimentary basin (1.5-2.0 km), shows relatively high shallow velocities. Low velocities on the east side of the profile are above only moderately deep (0.5 km) parts of the basin (Scott et al., 2004). Lower velocities than along the river were found on the UNR campus 2 km north of downtown Reno, 365 m/s as compared to 500 m/s. The campus has deeply weathered clay soil derived from volcanic alluvium, where the Truckee River has removed clay and deposited clean gravel and boulders along its course through downtown.
Figure 2. Our measured values of Vs30 for 301 sites along the three transects, from Scott et al.
(2004), Scott et al. (2005), and Thelen et al. (2005). The San Gabriel River transect crosses the central San Gabriel Valley and the eastern Los Angeles Basin. The horizontal positioning of the transect data along the distance axis was adjusted for clarity. Sites with Vs30 above 760 m/s are classified NEHRP B; between 760 and 360 m/s NEHRP C; and 360 to 180 m/s NEHRP D.

Los Angeles, California Along the San Gabriel River in southern California, Vs30 values stay near the NEHRP-B/C boundary, just below 760 m/s, through the Azusa and the Santa Fe Dam area (fig. 2, blue line), despite the presence of Recent fluvial gravels and many kilometers of basin thickness (Thelen et al., 2005). The bouldery and cobbly nature of the surface there suggests a large average clast size, and a steep hydraulic gradient, that may correlate with higher shallow velocities. Such high velocities, though still within NEHRP-C, appear in Whittier Narrows. These may correlate with the presence of stiff gravel lenses, or perhaps with the presence of older sediments in the shallow subsurface, uplifted by the Whittier blind thrust. The lowest velocities along the San Gabriel River are near Carson Street in Bellflower, corroborated by a cross-line extending 3 km west of the river, and in the Alamitos Bay estuary. Our minimum Vs30 measurements are not below 230 m/s, and never fell into the NEHRP-E class. Velocities rise slightly at Seal Beach, perhaps due to added littoral sand, or to the Holocene uplifts between strands of the Newport-Inglewood fault zone (Thelen et al., 2005). Again we find that neither geological (fig. 3) nor agricultural soil map units (fig. 4) can serve to predict NEHRP hazard class or shallow velocities for the Los Angeles transect. The correlations with velocity measurements and hazard units mapped by Wills et al. (2000) are predictable from our velocity measurements. Such special-purpose mapping for stiffness and hazard class can serve for classification of specific sites, especially if it is adjusted for new measurements in the region (Thelen et al., 2005). Las Vegas, Nevada The results for this transect through an interior alluvial basin (figs. 1 and 2) show that the lowest Vs30 values, at the NEHRP-C/D boundary, are found near Interstate 15 and Lake Mead Blvd. (Scott et al., 2005). Velocities then rise smoothly to the middle of the NEHRP-C range near Sahara Blvd. to the south along Industrial Blvd. Paralleling the Las Vegas “Strip”. There appears to be a slight decline at the south end of the transect near Tropicana Blvd. Again, for the Las Vegas transect, neither geologic (fig. 3) nor agricultural soil units (fig. 4) from existing mapping can serve to predict NEHRP hazard class or shallow velocities with sufficient accuracy for engineering application at any specific site (Scott et al., 2005). In Las Vegas Valley, the simple amalgamation of the local geologic units, similar as they are to the units nearby in California, into the hazard units of Wills et al. (2000) would also fail to predict average shaking in the Valley. The Wills et al. classification is based on few measurements of coarse alluvial sites (C. Wills, CGS, pers. comm. 2005), while coarse fans cover most of the surface of Las Vegas Valley. As well, calcite cementation (a.k.a. caliche) raises Vs30 values within the older fan units, even where they are currently active at the surface (Taylor et al., 2003; Scott et al., 2005). As a result, where an average classification of Las Vegas Valley based on Wills et al. (2000) would be NEHRP-C/D boundary at 360 m/s, the built-up areas of the Valley (most of it) have NEHRP-C velocities, between 500 and 600 m/s (Scott et al., 2005).

Figure 3. Vs30 versus geologic formation for the three transects. The 23 mapped geologic
formations predict Vs30 too poorly for engineering application at specific sites.
Figure 4. Vs30 vs. soil type for the three transects. The 37 different mapped soil types are clearly
poor predictors of Vs30 unless broad averages are needed.

Las Vegas Vs30 map Drawing on data from several sources, Scott et al. (2005) developed a Vs30 model for Las Vegas Valley. Langenheim et al. (2001) produced a 3-D depth map of the Las Vegas basin based on gravity modeling supported by borehole and seismic data. Taylor et al. (2003) and Scott et al. (2005) compiled stratigraphic data from over 1000 well logs and determined bedrock from geologic maps (Matti and Bachhuber, 1985; Matti et al., 1999; Bingler, 1977; and Matti et al.,1987). Additionally, the SASW technique (Stokoe, et al., 1994) was used to obtain Vs data from thirty sites (Liu et al., 2005). Velocity data from our refraction microtremor transect was then combined with data from SASW and crosshole measurements to yield velocity-depth profiles at 79 points. Stratigraphy-velocity correlations were then derived for these locations. Using this information, Taylor et al. (2003) and Scott et al. (2005) developed a simple stratigraphic model for the Valley based on six geologic units: pre-Tertiary, Tertiary, carbonate, gravel, sand and clay, and their 3-d distribution seen in the borehole logs. Average velocities for each unit were derived from the stratigraphic model’s projection through the 79 shear-velocity profiles. Then depth-averaged velocity maps such as of Vs30 could be summarized from the top 100 m of the correlated stratigraphic model (Scott et al., 2005). Deeper zones interpolate the refraction results of C. Snelson of UNLV (pers. comm. 2004). Average velocity of the upper 100 m of the model forms a basis for 3-d finite-difference modeling of wave propagation in the Valley. Tools for this type of modeling are available at www.seismo.unr.edu/ccog. The Vs30 model is shown in fig. 5. As described by Scott et al. (2005) this model predicts Vs30 well in areas having many Vs30 measurements, but can only poorly predict Vs30 outside of the measured areas.
Conclusions
For the first time and at minimal cost, we obtained detailed shallow shear-wave velocity transects across entire urban basins. Shear-wave velocity profiles to 100 meters depth at more than 300 sites in Nevada and southern California were measured in this effort. We could find little predictive correlation between geologic formations or soil units and our Vs30 measurements, as seen in figs. 3 and 4. Mapped geologic and soil units are not accurate predictors of Vs30 measurements in these urban areas, unless the mapping is done specifically with stiffness or shaking hazard in mind. Specific Vs30 measurements are needed at every engineering site, because mapped hazard units show too much Vs30 variation for hazard mapping to be useful for engineering application at any individual site. In all three cities velocities were surprisingly high, with 230 m/s being our minimum Vs30 measurement. Nowhere did we intersect NEHRP-E class Vs30 velocities below 180 m/s, despite many measurements in estuaries, drained swamps, and recent, active river channels. The plot in fig. 3 shows measured Vs30 values above 360 m/s NEHRP-C/D boundary for 82% of the Reno transect. For the Las Vegas transect (figs. 1 and 2) we measured Vs30 values above 360 m/s for 80% of the transect. Classification of most of the Reno and Las Vegas basins as NEHRP-D based on existing geologic mapping is therefore unwarranted. Both cities may have a NEHRP-C hazard class on average, creating somewhat less of a total shaking hazard to Nevada urban centers than was expected from microzonation work in California (e.g., Wills et al., 2000).

Figure 5. Las Vegas Valley Vs30 map constructed by Scott et al. (2005) based on a model
derived from well-log stratigraphy. The velocity values represented by colors are summarized from five stratigraphic units that are assigned constant Vs values Valley-wide, based on 79 Vs profiles. The white-dotted box shows the area of the stratigraphic model. Outside the model, recent sediments are assigned a Vs30 of 350 m/s and bedrock areas are assigned a Vs30 of 760 m/s.

Acknowledgments
These studies were sponsored by the National Earthquake Hazards Reduction Program, U.S. Geological Survey, under award 03HQGR0068; and by Lawrence Livermore National Laboratory, U.S. Dept. of Energy. Thanks to Marcos Alvarez and Steve Azevedo of the PASSCAL Instrument Center for technical assistance and lending us the “Texan” equipment. The instruments used in the field program were provided by the PASSCAL facility of the Incorporated Research Institutions for Seismology (IRIS) through the PASSCAL Instrument Center at New Mexico Tech. Microtremor data collected during these experiments will be available through the IRIS Data Management Center. The facilities of the IRIS Consortium are supported by the National Science Foundation under Cooperative Agreement EAR-0004370 and by the Department of Energy National Nuclear Security Administration.. Many thanks to Bob Greschke, of PASSCAL for his assistance in the field. Prof. Barbara Luke of the UNLV Civil Engineering Dept. obtained some of the velocity results in Las Vegas; all work there was in collaboration with her and with Prof. Cathy Snelson and Prof. Wanda Taylor of the UNLV Dept. of Geosciences. We would like to thank the personnel involved in collecting the field data, including Stefan Beck, UNR students Matt Clark, Warren Dang, Adam Hemsley, Michael Lee, Christopher Lopez, Chris Loughner, Aasha Pancha, Hyunmee Park, Thomas Rennie and Weston Thelen. Satish Pullammanappallil of Optim LLC generously supported us with unlimited use of Optim’s SeisOpt® ReMiTM refraction-microtremor software, as well as with processing and consultation. Thanks to the Cities of Reno, Long Beach and Las Vegas; Clark and Los Angeles Counties and the U.S. Army Corps of Engineers for their assistance and cooperation.
References
Abbott, R.E. and J.N. Louie, 2000. Case history: depth to bedrock using gravimetry in the Reno and Carson City, Nevada, area basins, Geophysics, 65 (2), 340-350.
ASTM D4428/D4428M-00: American Society for Testing and Materials, 2005. Standard test methods for crosshole seismic testing, Annual Book of ASTM Standards 04.08, Conshohoken, Penna.
ASTM D5778: American Society for Testing and Materials, 2005. Standard test method for performing electronic friction cone and piezocone penetration testing of soils, Annual Book of ASTM Standards, 04.08, Conshohoken, Penna.
Bingler, E. C., 1977. Las Vegas SE quadrangle geologic map, [publisher? ,map number?] 1:24,000 scale, 1 sheet.
Borcherdt, R. D., C.M. Wentworth, A. Janssen, T. Fumal, and J. Gibbs, 1991. Methodology for predictive GIS mapping of special study zones for strong ground motion in the San Francisco Bay region, CA, in Proc. Fourth Int. Conf. on Seismic Zonation, Earthquake Engineering Research Institute, Oakland, California, 545-552.
BSSC- Building Seismic Safety Council, 1998. 1997 Edition NEHRP Recommended Provisions for Seismic Regulation for New Buildings, FEMA 302/303, developed for the Federal Emergency Management Agency, Washington, D.C.
Field, E.H. and the SCEC Phase III Working Group, 2000. Accounting for site effects in probabilistic seismic hazard analyses of southern California: Overview of the SCEC Phase III Report, Bull. Seis. Soc. Amer., 90 (6B), S1-S31.
Ghose, R. and J. Goudswaard, 2004. Integrating S-wave seismic reflection data and cone-penetration-test data using a multiangle multiscale approach, Geophysics 69 (2), 440-459.

Langenheim, V.E., J.A. Grow, R.C. Jachens, G.L. Dixon, and J.J. Miller, 2001. Geophysical constraints on the location and geometry of the Las Vegas Valley Shear Zone, Nevada. Tectonics, 20 (2), 189-209.
Liu, Y., B. Luke, S. Pullammanappallil, J. Louie, and J. Bay, 2005. Combining Active- and Passive-Source Measurements to Profile Shear Wave Velocities for Seismic Microzonation: GeoFrontiers 2005 Congress, Austin, Texas, Jan 2005. 24-26.
Matti, J.C., and F.W. Bachhuber 1985. Las Vegas SW quadrangle geologic map, Nevada Bureau of Mines and Geology, Las Vegas Area Map 3Bg, 1:24,000 scale, 1 sheet.
Matti, J.C., S.B. Castor, J.W. Bell, and S.M. Rowland 1999. Las Vegas NE quadrangle geologic map, Nevada Bureau of Mines and Geology, Las Vegas Area Map 3Cg, 1:24,000 scale, 1 sheet.
Matti, J.C., F.W. Bachhuber, D.M. Morton and J.W. Bell 1987. Las Vegas NW quadrangle geologic map, Nevada Bureau of Mines and Geology, Las Vegas Area Map 3Dg, 1:24,000 scale, 1 sheet.
Louie, J.N., 2001. Faster, better: shear-wave velocity to 100 meters depth from refraction microtremor arrays, Bull. Seis. Soc. Amer., 91 (2), 347-364.
Scott, J.B., M. Clark, T. Rennie, A. Pancha, and J.N. Louie, 2004. A shallow shear-wave transect across the Reno, Nevada, area basin, Bull. Seis. Soc. Amer., 94 (6), 2222-2228.
Scott, J.B., T. Rasmussen, B. Luke, W.J. Taylor, J. L. Wagoner, S. B. Smith, and J.N. Louie, 2005. Shallow shear velocity and seismic microzonation of the urban Las Vegas, Nevada basin, submitted to Bull. Seismol. Soc. Amer., 1 March.
Stephenson, W. J., J. N. Louie, S. Pullammanappallil, R. A. Williams, and J. K. Odum, 2005 in press. Blind shear-wave velocity comparison of ReMi and MASW results with boreholes to 200 m in Santa Clara Valley: Implications for earthquake ground motion assessment, Bull. Seis. Soc. Amer., submitted Dec. 18, 2004, accepted July 14.
Stokoe, K. H., II, S. G. Wright, J. A. Bay, and J. M. Roesset, 1994. Characterization of geotechnical sites by SASW method, in Geophysical Characterization of Sites, ed. R. D. Woods, Oxford and IBH Publishing Co., New Delhi, India, 15-25.
Taylor, W. J., E. Fossett, B. Luke, C. Snelson, T. Rasmussen*, D. McCallen, A. Rodgers, and J. Louie, 2003. Quaternary faults and basin-fill sediments of the Las Vegas basin, southern Nevada, presented at Amer. Geophys. Union Fall Mtg., San Francisco, Dec. 8-12.
Thelen, W.A., M. Clark, C. T. Lopez, C. Loughner, H. Park, J.B. Scott, S. B. Smith, B. Greschke, and J. N. Louie, 2005, A transect of 200 shallow shear velocity profiles across the Los Angeles Basin: submitted to Bull. Seismol. Soc. Amer., 5 May 2004, revised 13 February 2005.
Wills, C.J., M. Petersen, W.A. Bryant, M. Reichle, G.J. Saucedo, S. Tan, G. Taylor, and J. Treiman, 2000. A site-conditions map for California based on geology and shear-wave velocity, Bull. Seis. Soc. Amer., 90 (6B), S187-S208.