Three hour lab Pre-lab prep and reading for E2, Parts 3-5 …chem125/F08/Lec04F08E2key.pdf ·...
6
1 Chem.125-126: Sept.24 - 30 Experiment 2 Session 2 Preparation • Pre-lab prep and reading for E2, Parts 3-5 Experiment 2 Session 2 Electrons and Solution Color Three hour lab • Complete E2 (Parts 1 - 5) • Prepare discussion presentation • Prepare team report. • Give team report to GSI at the end of lab or turn in by grace deadline to GSI’s atrium level mailbox. Electrons will move from a lower to an available higher energy level if the provided energy = exactly that needed for a possible energy level transition DEMO Background Information: Energy and electrons If electrons move from a higher to a lower energy level, the difference in energy will be released. λ 400 Violet - Blue - Green - Yellow - Orange - Red λ 800 Visible Light and Energy •The shorter the wavelength (λ), the greater is its energy •The shorter the wavelength (λ), the higher is its frequency Light is a form of energy Light source → Wavelength and Energy Balloon containing H 2 and Cl 2 DEMO 1. Expose a balloon containing H 2 and Cl 2 to red light (≅ λ 650). 2. Expose a balloon containing H 2 and Cl 2 to blue light (≅ λ 450). Upon exposure to blue light, the bonds between H atoms and Cl atoms are broken. When the atoms of H and Cl recombine to form more stable HCl there is a release of energy and the balloon bursts. • The shorter the wavelength, the greater its energy Part 3. Solution Color and Light Interaction • Determine if salt solution color is predictable based on the cations interaction with visible light versus: • Plot an absorption spectrum for each team assigned salt solution - placement of the cation’s element in the periodic table? - the cation’s electron configuration? - the cation’s ionic radius?
Transcript of Three hour lab Pre-lab prep and reading for E2, Parts 3-5 …chem125/F08/Lec04F08E2key.pdf ·...

1
Chem.125-126: Sept.24 - 30Experiment 2 Session 2
Preparation• Pre-lab prep and reading for E2, Parts 3-5
Experiment 2 Session 2Electrons and Solution Color
Three hour lab• Complete E2 (Parts 1 - 5)
• Prepare discussion presentation• Prepare team report.• Give team report to GSI at the end of labor turn in by grace deadline to GSI’s atriumlevel mailbox.
Electrons will move from a lower to an availablehigher energy level if the provided energy = exactlythat needed for a possible energy level transition
DEMO
Background Information: Energy and electrons
If electrons move from a higher to a lower energylevel, the difference in energy will be released.
λ 400 Violet - Blue - Green - Yellow - Orange - Red λ 800
Visible Light and Energy
•The shorter the wavelength (λ), the greater is its energy•The shorter the wavelength (λ), the higher is its frequency
Light is a form of energy
Light source →
Wavelength and Energy
Balloon containing H2 and Cl2
DEMO1. Expose a balloon containing H2 and Cl2 to red light (≅ λ 650).2. Expose a balloon containing H2 and Cl2 to blue light (≅ λ
450).
Upon exposure to blue light, the bonds between H atoms and Clatoms are broken. When the atoms of H and Cl recombine to formmore stable HCl there is a release of energy and the balloon bursts.
• The shorter the wavelength, the greater its energy
Part 3. Solution Color and Light Interaction
• Determine if salt solution color is predictable based onthe cations interaction with visible light versus:
• Plot an absorption spectrum for each teamassigned salt solution
- placement of the cation’s element in the periodic table?
- the cation’s electron configuration?
- the cation’s ionic radius?
2
1A VIIIA1H1s1 IIA IIIA IVA VA VIA VIIA
2He1s2
3Li2s1
4Be2s2
5B
2s22p1
6C
2s22p2
7N
2s22p3
8O
2s22p4
9F
2s22p5
1 0Ne
2s22p6
1 1Na3s1
1 2Mg3s2 IIIB IVB VB VIB VIIB VIIIB ⇔ VIIIB IB IIB
1 3Al
3s23p1
1 4Si
3s23p2
1 5P
3s23p3
1 6S
3s23p4
1 7Cl
3s23p5
1 8Ar
3s23p6
1 9K4s1
2 0Ca4s2
2 1Sc
3d14s2
2 2Ti
3d24s2
2 3V
3d34s2
2 4Cr
3d54s1
2 5Mn
3d54s2
2 6Fe
3d64s2
2 7Co
3d74s2
2 8Ni
3d84s2
2 9Cu
3d1 04s1
3 0Zn
3d1 04s2
3 1Ga
4s24p1
3 2Ge
4s24p2
3 3As
4s24p3
3 4Se
4s24p4
3 5Br
4s24p5
3 6Kr
4s24p6
3 7Rb5s1
3 8Sr5s2
3 9Y
4d15s2
4 0Zr
4d25s2
4 1Nb
4d35s2
4 2Mo
4d55s1
4 3Tc
4d55s2
4 4Ru
4d75s1
4 5Rh
4d85s1
4 6Pd
4d10
4 7Ag
4d1 05s1
4 8Cd
4d1 05s2
4 9In
5s25p1
5 0Sn
5s25p2
5 1Sb
5s25p3
5 2Te
5s25p4
5 3I
5s25p5
5 4Xe
5s25p6
5 5Cs6s1
5 6Ba6s2
5 7La*
5d16s2
7 2Hf
5d26s2
7 3Ta
5d36s2
7 4W
5d46s2
7 5Re
5d56s2
7 6Os
5d66s2
7 7Ir
5d76s2
7 8Pt
5d96s1
7 9Au
5d1 06s1
8 0Hg
5d1 06s2
8 1Tl
6s26p1
8 2Pb
6s26p2
8 3Bi
6s26p3
8 4Po
6s26p4
8 5At
6s26p5
8 6Rn
6s26p6
8 7Fr7s1
8 8Ra7s2
8 9Ac#
6d17s2
1 0 4 +
6d27s2
1 0 5 +6d37s2
1 0 6 +6d47s2
1 0 7 +6d57s2
1 0 8 +6d67s2
1 0 9 +6d77s2
+ Element synthesized,but no official name assigned
Pre-transition.
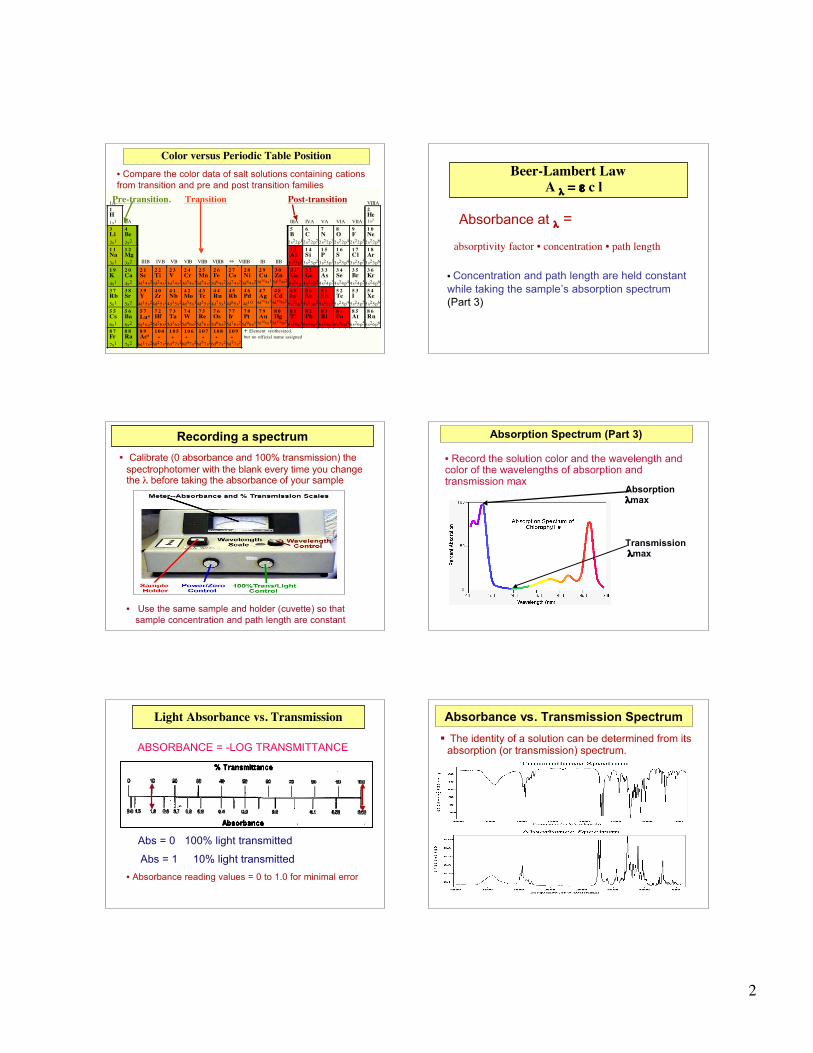
Color versus Periodic Table Position
Transition Post-transition
• Compare the color data of salt solutions containing cationsfrom transition and pre and post transition families
Beer-Lambert Law A λ = ε c l
absorptivity factor • concentration • path length
Absorbance at λ =
• Concentration and path length are held constantwhile taking the sample’s absorption spectrum(Part 3)
Recording a spectrum
• Calibrate (0 absorbance and 100% transmission) thespectrophotomer with the blank every time you changethe λ before taking the absorbance of your sample
• Use the same sample and holder (cuvette) so thatsample concentration and path length are constant
• Record the solution color and the wavelength andcolor of the wavelengths of absorption andtransmission max
Absorption Spectrum (Part 3)
Transmission λmax
Absorptionλmax
Light Absorbance vs. Transmission
Abs = 0 100% light transmitted
Abs = 1 10% light transmitted
ABSORBANCE = -LOG TRANSMITTANCE
• Absorbance reading values = 0 to 1.0 for minimal error
Absorbance vs. Transmission Spectrum
The identity of a solution can be determined from itsabsorption (or transmission) spectrum.

3
Solution Color and Light Interaction
DEMO
Q. What wavelength colors will a solution of NiSO4transmit?
Absorbance differences across wavelengths are due to?1. Differences in the absorptivity coefficient ( ε )2. Differences in the concentration of the sample.3. Differences in the path length of the sample holder.4. All the above.
Spectrum of 0.10 M _________
Which statement below is correct?1. Color of Abs λ max = blue-purple.2. The sample is green.3. ε is greater at λ 500 than at λ 400.
00.10.20.30.40.50.60.7
400 450 500 550 600 650 700
Absor
bance
Wavelength λ (nm)
Violet
Blue
Yello
w
Green Orang
e
Red
00.10.20.30.40.50.60.7
400 450 500 550 600 650 700
Absor
bance
Wavelength λ (nm)
Violet
Blue
Yello
w
Green Orang
e
Red
Beer-Lambert Law and Path Length
Path length and light absorbance are directlyproportional at a fixed wavelength and concentration.
• Different spectrophotometers have different pathlengths! Don’t change spectrophotometers in themiddle of an analysis (Parts 4 and 5)!
DEMO
Path length changes will result in a proportional change inabsorbance values if sample concentration is constant.
Absorbance readings will alter proportionately across allwavelengths; the spectrum pattern will not alter.
Path Length and Absorption Spectra
Fig. Absorption spectra at different sample path lengths
Sample concentration changes will result in a proportionalchange in absorbance values if path length is constant.
Absorbance readings will alter proportionately across allwavelengths; the spectrum pattern will not alter.
Concentration and Absorption Spectra
Fig. Absorption spectra at different sample concentrations

4
Part 4. Concentration and Light Absorbance
- Write a mathematical expression to express thepattern between the concentrations and theabsorbance values of your team assigned sample
• Plot a calibration curve for your team assigned sample
• Successfully use the calibration curve to determine theunknown concentration of your team assigned sample (Part 5)
Beer-Lambert Law A λ = ε c l
absorptivity factor • concentration • path length
Absorbance at λ =
• Wavelength and path length are held constantwhen producing a calibration curve (Part 4)
Beer-Lambert Law and Concentration
0
0.2
0.4
0.6
0.8
1
1.2
0 1 2 3 4 5 6 7 8
Abso
rban
ce
Concentration (mM)
Absorbance is proportional to concentration at aconstant wavelength (λ )and constant path length
DEMO
Absorbance and Path Length
= 1/2pathlength
Absorbance readings for a calibration curve will alter ifthe path length is altered
0.50.40.30.20.10.00.0
0.5
1.0
1.5
2.0
2.5
[Plastocyanin], mM
Abso
rban
ce
Absorbance and Path Length
Answer:• Use a constant sample holder (curvette) while
taking absorbance readings
• Don’t switch spectrophotometers!
Path length must be fixed for a calibration curve orabsorbance readings will be in error.
Q. How do you hold the path length constant?
Preparation of Calibration Curve
Prepare a set of solutions of known and accurateconcentration by diluting the team prepared andassigned 0.1 M solution
M1V1 = M2V2

5
The wavelength of max absorbance is typically chosen. Why?
Preparation of Calibration Curve
• Refer to the samples absorption spectrum to choose awavelength for the calibration curve
Changes in absorbance with changes in concentration aremaximum and the calibration curve line has a maximum slope.
1.20
0.80
0.40
0.00
Abs
orba
nce
Wavelength (nm)250 350 450 550 650 750 0.50.40.30.20.10.0
0.0
0.5
1.0
1.5
2.0
2.5
[Plastocyanin], mM
Absorb
ance
Spectrum of 0.16 mM Plastocyanin Calibration curve at 600nm
Calibration Curve Wavelength
Q. Will the slope of the linear line of a calibration curve produced at550 nm be greater or less than the slope of the line of the abovecalibration curve produced at 600 nm? _______________Less
Wavelength of Calibration Graph?
0
0.1
0.2
0.3
0.4
0.5
0.6
0.7
Abs
orpt
ion
0.8
0 0.1 0.2 0.3 0.4 0.5[M+] (Molar)
0
0.2
0.4
0.6
0.8
1
1.2
Abs
orpt
ion
400 450 500 550 600 650 700
Purp
le
Blue
λ (nm)
Gre
en
Yell
ow
Ora
nge
Red
Q. A 0.4 M solution of M+ has the absorption spectrum onthe left. Circle the wavelength of its calibration graph: 425 500 550 600 650
Preparation of Calibration Curve
Calculate the slope of the linear line of yourcalibration curve
0
0.2
0.4
0.6
0.8
1
1.2
0 1 2 3 4 5 6 7 8
Abso
rban
ce
Concentration (mM)
∆y = 1.15 – 0.0 = .15
∆x 7.5 – 0.0
Calibration Curve Slope
Q. What does the slope of the calibration curverepresent in the Beer-Lambert expression Aλ = εlc?
0
0.2
0.4
0.6
0.8
1
1.2
0 1 2 3 4 5 6 7 8
Abso
rban
ce
Concentration (mM)
Answer:• Aλ = εlc is the same as y = mx + b• The slope of the line = εl
Unknown concentration determination
Q. A sample of unknown concentration of XY(aq) has Abs >1.2 at a λ of 600nm, What is its concentration (mM)?
0
0.2
0.4
0.6
0.8
1
1.2
0 1 2 3 4 5 6 7 8
Abso
rban
ce
Concentration (mM)
Fig. Calibration Curve of XY(aq) at 600 nm
Slope = 0.15Abs/mM

6
Beer-Lambert and Calibration Curve
Fig. Calibration Curve Deviation
• The Beer-Lambert law only applies at low concentrations!• Do NOT extrapolate the linear line of a calibration curve!
• Determine the concentration of a diluted sample of theunknown if the unknown’s absorbance reads above anAbs = 1 or outside the linear line of the calibration curve
“Eyeball” the graph ONLY for an approximateconcentration.
Unknown concentration determination
• Use the slope and Beer-Lambert law to determinean exact concentration
0
0.2
0.4
0.6
0.8
1
1.2
0 1 2 3 4 5 6 7 8
Abs
orba
nce
Concentration (mM)
What is the unknown concentration?The diluted sample has an absorbance at λ of 600nm = 0.57.
0
0.2
0.4
0.6
0.8
1
1.2
0 1 2 3 4 5 6 7 8
Abso
rban
ce
Concentration (mM)
Fig. Calibration Curve of XY(aq) at 600 nm
Slope = 0.15Abs/mM
Abs 0.57 = 0.15Abs/mM • c 3.8 mM = c
Abs λ600 = elc
What is the unknown concentration?Q. A diluted sample of unknown concentration = 3.8 mM. Youprepared the diluted sample by adding 6.0 mL of water to 2.0mL of the sample of unknown concentration. What is theunknown concentration (mM)?
M1V1 = M2V2 M1•2.0 mL = 3.8 mM • 8.0 mL
M1 = 15.2 mM
a) 3.8 mMb) 7.2 mMc) 11.4 mMd) 15.2 mM
Questions?Contact [email protected]