Three Essays on Market and Non-Market Factors Affecting ...
129
Three Essays on Market and Non-Market Factors Affecting International Seafood Trade by Tran Van Nhuong A dissertation submitted to the Graduate Faculty of Auburn University in partial fulfillment of the requirements for the Degree of Doctor of Philosophy Auburn, Alabama May 9, 2011 Keywords: global value chains, shrimp farming, food safety standards, gravity econometric model, Heckman selection model, Poisson family regression Copyright 2011 by Tran Van Nhuong Approved by Norbert W.L. Wilson, Co-chair, Associate Professor of Applied Economics Conner Bailey, Co-chair, Professor of Rural Sociology Diane Hite, Professor of Applied Economics Nedret Billor, Associate Professor of Mathematics and Statistics
Transcript of Three Essays on Market and Non-Market Factors Affecting ...
Three Essays on Market and Non-Market Factors Affecting International Seafood Trade
by
Tran Van Nhuong
A dissertation submitted to the Graduate Faculty of Auburn University
in partial fulfillment of the requirements for the Degree of
Doctor of Philosophy
Auburn, Alabama May 9, 2011
Keywords: global value chains, shrimp farming, food safety standards, gravity econometric model, Heckman selection model, Poisson family regression
Copyright 2011 by Tran Van Nhuong
Approved by
Norbert W.L. Wilson, Co-chair, Associate Professor of Applied Economics Conner Bailey, Co-chair, Professor of Rural Sociology
Diane Hite, Professor of Applied Economics Nedret Billor, Associate Professor of Mathematics and Statistics
ii
Abstract
This dissertation is comprised of three separate essays investigating market and non-
market factors affecting international seafood trade. The first essay analyzes the impact of food
safety standards and management systems established by public and private actors in nations of
the industrial North on shrimp producers, middlemen traders, processors, and exporters in
Vietnam. The shrimp farming industry in Vietnam is organized in the form of buyer-driven
global value chains (GVCs). GVCs dynamically develop and transform through time and place
to generate multiple governing patterns between successive actors participating in the chains.
Food safety institutions, socio-cultural factors as well as environmental resource conditions both
create opportunities and constrain economic organization and governance of the chains for
responding to international shrimp market requirements.
The second essay applies different alternative specifications accounting for zero trade
flows to reevaluate the hypothesis that food safety standards act as barriers to seafood imports
aggregated at two digit levels. Results show that the view of standards as barriers to trade is
robust to the OLS as well as alternative zero-accounting gravity models including the Heckman
maximum likelihood and Poisson family regressions. Formal statistical tests do not allow
specifying which zero accounting model is the best choice. However, based on the magnitude of
estimated coefficients, I contend that the Heckman maximum likelihood estimation provides the
most reliable parameter estimates.

iii
The third essay examines the impact of strengthening chloramphenicol analytical
standards (lowering required analytical limits) on crustacean imports in the EU15, Japan, and the
North America. Results of the gravity econometric model estimation using the Heckman
selection procedure show that enhancing detection standards of chloramphenicol residues in
seafood in developed countries is shown statistically to have negative effects on their bilateral
crustacean imports. Aggregated six digit levels, some crustacean products such as frozen shrimps
and prawns, and frozen rock lobsters received more negative impacts than other crustacean
products. Scale of export is sensitive to the imposition of stricter chloramphenicol analytical
standards. Nations which are top crustacean exporters are disciplined more than other exporting
countries. Top crustacean exporters in Asia, including China, India, Indonesia, Malaysia,
Thailand, and Vietnam experience different impacts, suggesting that the impact of food safety
standards on international trade is complex. Developing countries with higher income levels and
stronger industry organization are better able to cope with stringent market requirements,
strengthen their competitive advantage, and receive lesser negative impacts when food safety
standards become stricter.
iv
Acknowledgement I would like to thank all my committee members for their guidance, support, and encouragement.
Especially, special gratitude is expressed to my co-Chairs, professor Dr. Conner Bailey and
professor Dr. Norbert Wilson who have continued to provide and share their generous support
and friendship throughout my graduate career and dissertation research at Auburn University.
I am grateful to my friends, Giap Nguyen, Duc Nguyen, Hai Pham, Nam Pham, and
others I have not mentioned, who made my graduate study at Auburn University a sucessful and
unforgettable experience: To my family, my parents, my brothers and sisters, my wife Anh
Nguyen my daughter Bong Tran and my son Bach Tran: their unconditional love, support, and
sacrificies have helped and encouraged me complete this long study journey.
My graduate study and dissertation research at Auburn University was supported by the
International Fellowship Program of the Ford Foundation, Department of Agricultural
Economics and Rural Sociology, and fellowship of the Norman Borlaug Leadership
Enhancement in Agriculture Program. I would like to acknowledge professors, leaders, and
managers who made these funding mechanisms available to support my graduate study.
v
Table of Contents
Abstract................................................................ ......................................................................... ..ii
Acknowledgement ..................................................................................................................... ....iv
List of Tables ................................................................................................................................ vii
List of Figures .............................................................................................................................. viii
List of Abbreviations ..................................................................................................................... ix
Introduction ..................................................................................................................................... 1
Background ......................................................................................................................... 1 Dissertation Outline ............................................................................................................ 3 References ........................................................................................................................... 6
Chapter 1: Organization of Global Value Chains (GVC) for Shrimp in Vietnam: Food Safety,
Socio-Cultural Factors and Material Resource Conditions ................................................ 9
Introduction ......................................................................................................................... 9 The GVC Theoretical Framework .................................................................................... 13 Agri-Food Chains.............................................................................................................. 20 Research Methods ............................................................................................................. 21 Global Value Chains for Shrimp in Vietnam .................................................................... 24 Governance of GVC for Shrimp in Vietnam .................................................................... 31 Discussion and Implications for Food Safety and Socio-Economic Development .......... 38 Conclusions ....................................................................................................................... 44

vi
References ......................................................................................................................... 46 Chapter 2: Food Safety Standards and Developed Country Seafood Imports: Fitting
the Gravity Equation with Zero-Accounting Models ....................................................... 57
Introduction ....................................................................................................................... 57 Conventional OLS and Zero-Accounting Models of the Gravity Equation ..................... 60 Empirical Model Specification and Data Sources ............................................................ 68 Estimated Results and Discussions ................................................................................... 71 Conclusions ....................................................................................................................... 79 References ......................................................................................................................... 80
Chapter 3: Standard Harmonization as Chasing Zero (Tolerance Limits): The Impact of
Veterinary (Cloramphenicol Analytical) Standards on Crustacean Imports in the EU, Japan, and North America ................................................................................................. 86
Introduction ....................................................................................................................... 86 Veterinary (Cloramphenicol Analytical) Standards and Impacts on Seafood Trade ........ 88 Theoretical Framework and Model Specification ............................................................. 92 Results and Discussions .................................................................................................... 98 Conclusions ..................................................................................................................... 104 References ....................................................................................................................... 105
Conclusions and Policy Implications .......................................................................................... 117
Conclusions ..................................................................................................................... 117
Policy Implications..........................................................................................................119

vii
List of Tables
Chapter 2:
Table 1: Empirical results of the OLS and Heckman maximum likelihood estimations ........... 84
Table 2: Results of Poisson family regressions ......................................................................... 85
Chapter 3:
Table 1: Results of the OLS, Disdier and Marette (2010), and Heckman 1 models ................ 111
Table 2: OLS parameter estimates and marginal effects of the Disdier and Marette (2010), and Heckman 1 models ................................................................................................. 112 Table 3: Results of the models controlling for product groups, top crustacean exporting group, and top exporters in Asia ................................................................................... 113 Table 4: Marginal effects of RPL and MRL on the intensive and extensive margins of trade control for products .............................................................................................. 115 Table 5: Average marginal effects of RPL on dummy variables representing top crustacean exporters and top exporters in Asia ............................................................. 116

viii
List of Figures
Figure 1: Global value chains or commodity flows for shrimp in Vietnam .............................. 55
Figure 2: Governance of global value chains for shrimp in Vietnam ......................................... 56
ix
List of Abbreviations
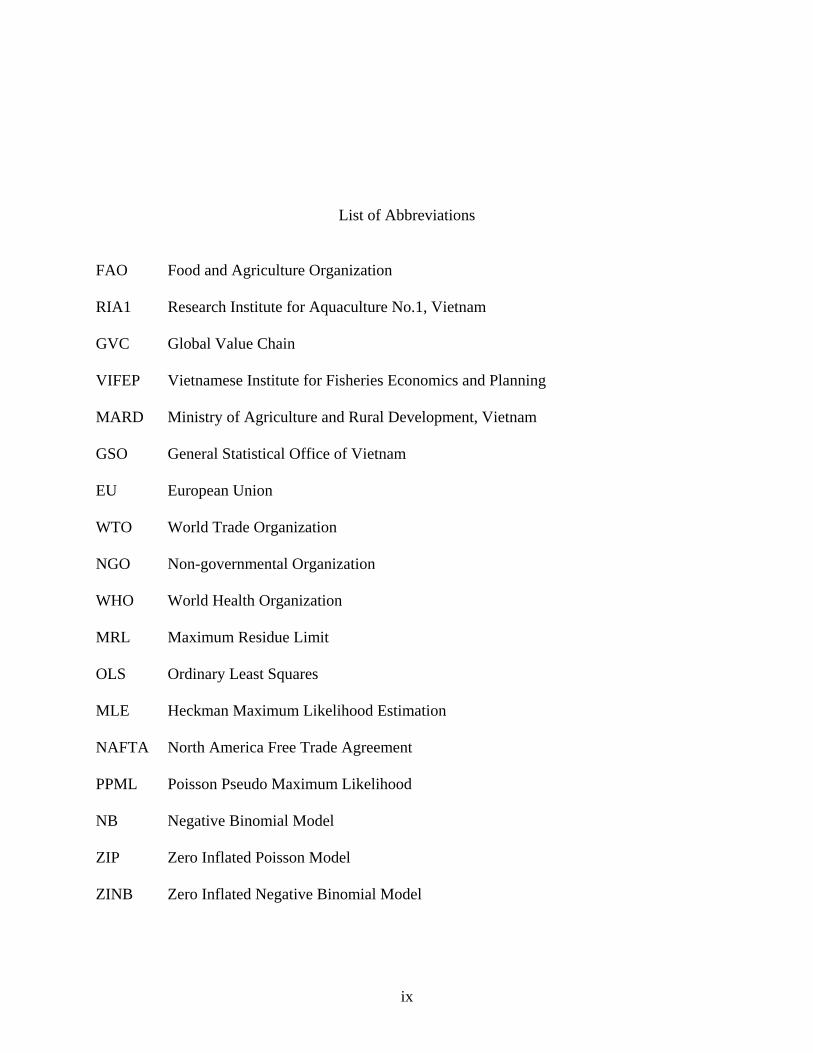
FAO Food and Agriculture Organization
RIA1 Research Institute for Aquaculture No.1, Vietnam
GVC Global Value Chain
VIFEP Vietnamese Institute for Fisheries Economics and Planning
MARD Ministry of Agriculture and Rural Development, Vietnam
GSO General Statistical Office of Vietnam
EU European Union
WTO World Trade Organization
NGO Non-governmental Organization
WHO World Health Organization
MRL Maximum Residue Limit
OLS Ordinary Least Squares
MLE Heckman Maximum Likelihood Estimation
NAFTA North America Free Trade Agreement
PPML Poisson Pseudo Maximum Likelihood
NB Negative Binomial Model
ZIP Zero Inflated Poisson Model
ZINB Zero Inflated Negative Binomial Model
1
INTRODUCTION
Background
International trade in seafood was valued at $85.9 billion in 2004 and is dominated by
export flows from the South to the industrial North (FAO 2008). Continued access to Northern
markets increasingly is being affected by non-tariff measures that have both governmental and
non-governmental (private) origins. Governments of the North have focused attention on food
safety and consumer health impact associated with seafood consumption while non-
governmental organizations (NGOs) have pressed for environmental and social accountability in
global seafood production and trade. Both governmental and non-governmental standards affect
the ability of seafood producers and processors to be involved in valuable export markets.
Meeting new and continually changing standards requires a level of technical sophistication and
financial capacity that is far from universal among seafood producers and processors of the
South. These standards also can be seen to marginalize small-scale producers and processors
who have limited financial capital and technical abilities, resulting in concentration of seafood
production and trade into relatively few hands.
The relative importance of non-tariff measures to trade has been growing because of
tariff reductions resulting from WTO negotiations (Deardoff and Stern 1998; Maskus and Wilson
2001). The 1994 Agreements on the Application of Sanitary and Phytosanitary (SPS) Measures
and Technical Barriers to Trade (TBT) of the World Trade Organization (WTO) provide

2
countries guidelines to regulate food safety, health risk and other market standards of
internationally traded products. The SPS Agreement permits governments to provide stricter
standards than international norms, provided that the standard regulations are based on adequate
risk assessment (Wilson 2003).
A substantial literature exists where economists examine the effects of non-tariff
measures on agri-food exports of developing countries (World Bank 2005; Otsuki, Wilson and
Sewadeh 2001). Seafood trade plays an important role especially in developing countries (e.g.,
an important source of foreign currency earning and employment opportunities for rural people)
and seafood trade regimes are rapidly tightening. However few studies examine the impacts non-
tariff measures on seafood trade (Debaere 2005; Anders and Caswell 2009; Nguyen and Wilson
2009; Disdier and Marette 2010). Most of the existing literature on quantifying non-tariff
measures on agri-food trade examines the effects of standards at the country level and supports
the view that standards represent non-tariff barriers to exporting countries. In addition there are
also arguments that standards can act as catalysts to international trade, helping exporting
countries gain better competitive advantage and position in global markets (Henson and Jaffee
2008). Given heterogeneity of standards, Henson and Jaffee (2008) argue that closer
investigation is needed to provide better understanding of how standards imposed by the North
affect trade from exporting countries, especially nations of the South.
A substantial body of the international trade literature has reviewed methods for
quantifying the impact of non-tariff measures on agri-food trade (e.g., Korinek, Melatos, and Rau
2008; Ferrantino 2006; Fliess and Lejarraga 2005; Beghin and Bureau 2001). The gravity model
is the econometric approach used frequently to examine impacts of public standards on trade
flows at the country level. Partial and general equilibrium models are also commonly used to
3
measure economic welfare impacts of food safety standards at the country level based on the
price gap or trade flows between exporting and importing countries induced or affected by these
barriers. These conventional quantifying approaches however fail to capture dynamic impacts of
food safety standards on actors involved in agri-food value chains in the same country.
Furthermore, quantifying the impact of private standards on agri-food trade represents a
particularly difficult challenge because these measures typically do not result in a levy or
quarantine at the border of exporting and importing countries.
Dissertation outline
The dissertation consists of three separate essays investigating the impact of non-tariff
measures on international seafood trade. The central research questions the dissertation addresses
are: how various stakeholders participate in global seafood value chains in developing countries
are impacted by seafood safety and environmental standards imposed by governments and NGOs
in the North? How food safety standards impact international seafood trade?
Using the global value chain approach, the first essay, “Organization of Global Value
Chains (GVC) for Shrimp in Vietnam: Food Safety, Socio-Cultural Factors and Material
Resource Conditions” examine the impact of food safety standards and management systems
established by governmental and non-governmental actors in the global North on shrimp
producers, middle traders, processors, and exporters in Vietnam. The GVC framework requires a
systematic examination of governance issues that structure relationships between actors, in this
case shrimp farmers, middlemen, processors, exporters, and importers. Governance includes both
market and non-market coordination of economic activities, however within the GVC
framework, governance analysis emphasizes non-market coordination (Gereffi, Humphrey, and

4
Sturgeon 2005). Non-market factors include food safety standards as well as socio-cultural
values and natural resource conditions.
The significance of this essay is highlighted as follows. First the analysis illuminates the
asymmetrical nature of power between actors and how this asymmetry shapes the distribution of
development benefits from international shrimp trade. Second, the essay will situate international
trade in shrimp within the literature on agri-food chain studies that feature systems characterized
by heavy regulation of public and private actors at different times and places. Third, the essay
will contribute to understanding organizational aspects and mechanisms of international trade to
complement conventional economic studies which focus on trade of final products at the country
level as demonstrated in the second and third essays that follow. And fourthly the essay will
contribute to understanding the dynamics of export-oriented development in Vietnam as an
example of how developing countries respond to stringent world market requirements while
maintaining domestic development priorities (e.g., poverty alleviation, ensuring livelihood
opportunities for small-scale farmers).
Vietnam is selected for study because it represents an interesting case for exploring
impacts of non-tariff barriers to seafood trade. Vietnam is a poor country in transition to a market
economy with weak market institutions and low financial, technological, and managerial
capacities compared to other seafood exporting countries in the region (Kagawa and Bailey
2006). The country lacks infrastructure to comply with standards but has strong motivation for
export-oriented aquaculture development to boost local economic development and foreign
exchange earnings to address trade deficits. Export-oriented aquaculture is dominated by small
scale production, vulnerable to changing market requirements.
5
The second essay, “Food Safety Standards and Developed Country Seafood Imports:
Fitting the Gravity Equation with Zero-Accounting Models” applies alternative specifications to
the gravity econometric model to evaluate the impact of food safety standards on bilateral
seafood imports aggregated at two digit level. The impact of food safety standards on
international trade is commonly evaluated using the gravity econometric model. The model is
traditionally estimated by the ordinary least squares (OLS) method in the form of the log normal
transformation (Burger, van Oort, and Linders 2009). The log normal OLS specification of the
gravity model can bias estimated results since zero trade observations have to be omitted and the
homoscedasticity assumption might be violated because of Jensen’s inequality (Santos Silva and
Tenreyro 2006). The essay assesses the performance of different alternative models including the
Heckman selection estimation and Poisson family regressions (Poisson Pseudo Maximum
Likelihood, Negative Binomial, Zero Inflated Possion, and Zero Inflated Negative Binomial
Models).
The third essay, “Standard Harmonization as Chasing Zero (Tolerance Limits): The
Impact of Veterinary (Cloramphenicol Analytical) Standards on Crustacean Imports in the EU,
Japan, and the North America” examines how enhancing chloramphenicol standards (lowering
detection limits) in developed countries affect their bilateral crustacean imports. Research
questions that the essay addresses are: (i) Are different crustaceans products in trade affected
differently? (ii) What is the impact of standards on crustacean exporters with regard to scale of
export? (iii) What are the differential impacts of food safety standards on different exporting
countries based on development/income status? The essay is stimulated by a study of Disdier and
Marette (2010) and the fact that with enhancements in analytical technologies, since 2001
6
developed countries are able to detect chloramphenicol residues in seafood at very low levels
(FAO 2004).
Cloramphenicol is banned in many developed and developing countries because it has
carcinogenic potential in humans. Since an acceptable daily intake (ADI) has not been allocated,
no maximum residue limit (MRL) is established for cloramphenicol in the EU15, Japan, and
North America. Cloramphenicol analytical standards are established based only on analytical
technology improvements and have no cause and effect relationship with health risk. Using the
Heckman selection procedure for the micro-founded gravity model, the paper explores the
impacts of chloramphenicol analytical standards on crustacean imports in the EU15, Japan, and
North America. Unlike Disdier and Marette (2010) the third essay explores the complex impacts
of chloramphenicol standards on different crustacean products aggregated at 6 digit level, scale
of exports, and top crustacean exporters in Asia.
References
Anders, S.M., and J. A. Caswell. 2009. Standards as Barriers versus Standards as Catalyst:
Assessing the Impact of HACCP Implementation on U.S. Seafood Imports. American
Journal of Agricultural Economics 91(2): 310-321
Beghin, J. C. and J. Bureau. 2001. Quantification of Sanitary, Phytosanitary, and Technical
Barriers to Trade for Trade Policy Analysis. Food and Agricultural Policy Research
Institute (FAPRI) Publications 01-wp291, Iowa State University.
Burger, M., F. van Oort, and G.-J. Linders. 2009. On the Specification of the Gravity Model of
Trade: Zeros, Excess Zeros and Zero-inflated Estimation. Spatial Economic Analysis 42:
167–190.

7
Deardorff, A.V. and R. M. Stern. 1998. Measurement of Nontariff Barriers (Studies in
International Economics). Ann Arbor: University of Michigan Press.
Debaere, P. 2005. Small Fish–Big Issues: The Effect of Trade Policy on the Global Shrimp
Market. Discussion paper 5254, Centre for Economic Policy Research, London.
Disdier, A.-C., and S. Marette. 2010. The Combination of Gravity and Welfare Approaches for
Evaluating Nontariff Measures. American Journal of Agricultural Economics 92(3): 713–
726.
Ferrantino, M. 2006. Quantifying the Trade and Economic Effects of Non-Tariff Measures.
OECD Trade Policy Working Papers, No. 28, OECD Publishing.
Fliess, B., and I. Lejarraga. 2005. Non-tariff Barriers of Concern to Developing Countries. In
Looking beyond Tariffs: The Role of Non-tariff Barriers in World Trade, 227-295. OECD
Trade Policy Studies.
Food and Agriculture Organization (FAO). 2008. The State of World Fisheries and Aquaculture
2006. Rome: FAO.
Food and Agriculture Organization of the United Nations (FAO) and World Health Organization
(WHO). 2004. “Joint FAO/WHO Technical Workshop on Residues of Veterinary Drugs
without ADI/MRL.” Retrieved September 16, 2010.
(ftp://ftp.fao.org/docrep/fao/008/y5723e/y5723e00.pdf)
Gereffi, G., J. Humphrey, and T. Sturgeon. 2005. The Governance of Global Value Chains.
Review of International Political Economy 12: 78-104.
Henson, S. and S. Jaffee. 2008. Understanding Developing Country Strategic Responses to the
Enhancement of Food Safety Standards. The World Economy 31(4): 548-568.

8
Kagawa, M. and C. Bailey. 2006. Trade Linkages in Shrimp Exports: Japan, Thailand and
Vietnam. Development Policy Review 24: 303–319.
Korinek, J., M. Melatos and M. Rau. 2008. A Review of Methods for Quantifying the Trade
Effects of Standards in the Agri-Food Sector. OECD Trade Policy Working Papers 79,
OECD Trade Directorate.
Maskus, K. and J. Wilson, eds. 2001. Quantifying the Impact of Technical Barriers to Trade: Can
It Be Done? Ann Arbor: University of Michigan Press.
Nguyen, A. V.T, and N. L. W. Wilson. 2009. Effects of Food Safety Standards on Seafood
Exports to US, EU and Japan. Selected Paper presented at the Southern Agricultural
Economics Association Annual Meeting, Atlanta, Georgia, January 31-February 3, 2009
Santos Silva, J. M. C., and S. Tenreyro. 2006. The Log of Gravity. Review of Economics and
Statistics 88 (4): 641–658.
Wilson, N. L. W. 2003. Clarifying the Alphabet Soup of the TBT and the SPS of the WTO.
Drake Journal of Agricultural Law 8(3): 703-723.
World Bank. 2005. Food Safety and Agricultural Health Standards: Challenges and
Opportunities for Developing Country Exports. Report No. 31207, Poverty Reduction and
Economic Management Trade Unit and Agriculture and Rural Development Department.
Washington DC: the World Bank.
9
CHAPTER 1: ORGANIZATION OF GLOBAL VALUE CHAINS (GVC) FOR SHRIMP IN VIETNAM: FOOD SAFETY, SOCIO-CULTURAL FACTORS AND MATERIAL
RESOURCE CONDITIONS
Introduction
Shrimp is the largest seafood product (value terms) traded globally, accounting for 17%
of the total world fisheries export value ($85.9 billion) in 2006 (FAO 2008). Before the 1980s,
most shrimp production entering international trade came from capture fisheries (Hall 2004).
Cultured production has gradually gained a substantial and increasing share as a result of export
oriented development policies pursued by developing countries in the global South (e.g., Brazil,
China, Columbia, Ecuador, Honduras, India, Indonesia, Mexico, Thailand, and Vietnam). The
contribution of farmed shrimp to world shrimp production skyrocketed from about 6% in 1970
(FAO 2004) to about 30% in 1998 (Rosenberry 1998) and to 43% in 2006 (FAO 2008).
International shrimp trade is characterized by shrimp flows from the South to the industrialized
North (e.g., the USA, EU, and Japan) and money flows from the North to the developing South
(Skadany and Harris 1995). Expansion of the global shrimp industry horizontally and vertically
connects a diverse array of local, national and international actors to each other and to world
markets through dynamic institutions and economic networks (Lebel et al. 2008).
Like many other parts of Southeast Asian nations, shrimp farming has long been a
traditional activity and is well established in Northern and Southern Vietnam in the form of
extensive polyculture farming systems operated by small-scale farmers, fulfilling their family

10
subsistence needs and selling surplus to local markets. Interviews with officials of the former
Ministry of Fisheries of Vietnam revealed that during the period of 1975 to 1986 there was no
incentive for promoting shrimp culture development in Vietnam since the country mainly traded
with the Union of Soviet Socialist Republics (USSR) and landlocked eastern European countries
with low demand for shrimp. The economic reform launched by the Vietnamese Communist
Party (VCP) in 1986 gradually helped the country develop a market economy and establish
diplomatic and trading relationships with all countries in the world. This “open door policy”
connected the country with developed markets with high demand for shrimp, especially Japan,
the U.S., and the European Union (EU), creating favorable conditions for a modern shrimp
industry development in Vietnam.
The first phase of the modern shrimp industry development in Vietnam started in the late
1980s and lasted to the late 1990s, characterized by gradual hatchery production capability
improvements, grow-out culture technology enhancements, and processing capability building.
Nhuong et al. (2006) report that in 1990 Vietnam had 500 shrimp hatcheries and 93,000 ha of
land area for shrimp culture, producing 38,000 metric tons. By the end of the first development
phase in 2000, the number of shrimp hatcheries, cultured area and grow-out production in
Vietnam climbed to 2,900 establishments, 235,000 ha, and 103,000 metric tons (Nhuong et al.
2006). The second phase of shrimp industry development in Vietnam was marked with the
promulgation of Resolution 09/NQ-CP of the Government in June 2000, allowing farmers to
convert low productive rice fields, uncultivated areas, and salt pans into aquaculture ponds.
Shrimp farm area skyrocketed from 235,000 ha in 2000 to 478,000 ha in 2001, 530,000 ha in
2003, and to 630,000 ha in 2008 (Ministry of Fisheries (MoF) annual reports 2000-2003;
Ministry of Agriculture and Rural Development (MARD) annual report 2009). Vietnamese

11
Association of Exporters & Producers (VASEP) reports that shrimp export value in Vietnam
reached $662 million in 2000 and has become a billion dollar annual export industry since 2003
(VASEP 2008). According to Vietnamese Institute for Fisheries Economics and Planning
(VIFEP), Vietnam used 650,000 ha to produce 383,000 tons of shrimp in total (0.59 metric ton
per ha on average) and obtain an export revenue of $1.5 billion in 2009 (VIFEP 2009).
Development of the export oriented global shrimp industry during the last three decades
has important developmental, social and environmental implications, and attracts the attention of
both development and academic communities worldwide. There is a substantial literature on
shrimp farming systems (Boyd and Clay 1998; Neiland et al. 2001; Menasveta 2002), economics
of shrimp production and trade (Traesupap, Matsuda, and Shima 1999; Keefe and Jolly 2001)
and social, political and environmental problems associated with management of the shrimp
farming industry (Bailey 1988; Primavera 1998; Vandergeest, Flaherty, and Miller 1999; Stonich
and Bailey 2000; Bene 2005; Vandergeest 2007; Hatanaka 2010).
Much of the research on shrimp farming in the tropics has been critical of social and
environmental impacts of intensive production systems (e.g., Bailey 1988; Vandergeest,
Flaherty, and Miller 1999; Stonich and Bailey 2000), and concerns have been expressed
regarding antibiotics, biological, and chemical contamination and associated impact on consumer
health (e.g., US GAO 2001; Jonker, Ito, and Fujishima 2005; Sapkota et al. 2008). These
concerns have contributed to the imposition of increasingly stringent seafood safety and
environmental management systems by both governments and non-governmental actors in the
global North. These management systems, ostensibly developed to ensure consumer health,
sustainability, and adoption of best management practices and certification schemes regulating
production, may have unintended consequences of putting small-scale enterprises and farmers in

12
developing countries at a disadvantage, adversely affecting the poorest stakeholders in the global
seafood chain.
In this paper, I use the global value chain (GVC) framework to examine the impact of
food safety management systems established by governmental and non-governmental actors in
the global North on shrimp producers, middlemen traders, processors, and exporters in Vietnam.
The GVC framework requires a systematic examination of governance issues that structure
relationships between actors, in this case shrimp farmers, middlemen, processors, exporters, and
importers. Governance includes both market and non-market coordination of economic activities,
however within the GVC framework, governance analysis emphasizes on non-market
coordination (Gereffi, Humphrey, and Sturgeon 2005). Non-market factors include food safety
standards as well as socio-cultural values and natural resource conditions. The resulting analysis
will illuminate the asymmetrical nature of power between actors and how this shapes the
distribution of development benefits from international shrimp trade. This paper contributes to
the literature on international trade and global value chain analysis in several important
dimensions. First, by examining the structures, governance and relationships between actors
involved in global value chains for shrimp, the paper will illuminate organizational aspects and
mechanisms of international trade to complement conventional economic studies which focus on
trade of final products at the country level. This contribution is important since agri-food trade
and seafood trade in particular often involve the transformation of intermediate products before
crossing borders. Second, focusing on socio-cultural and economic dimensions of food safety
standards, the paper will situate international trade in shrimp within the literature on agri-food
chain studies that feature systems characterized by heavy regulation of public and private actors
at different times and places. The recent trend of increasing stringency of food safety standards

13
in developed countries will likely induce great transformation of agri-food chains and displace
small-scale agri-food producers in developing countries from international markets. Third, the
paper incorporates the political ecology approach to address material resource conditions in
shaping the global value chains for shrimp. And finally the paper will explore the dynamics of
export oriented development in Vietnam as an example of how developing countries respond to
stringent world market requirements while maintaining domestic development priorities (e.g.,
poverty alleviation, ensuring livelihood opportunities for small-scale farmers).
Following this introduction the paper proceeds with an overview of the GVC theoretical
framework. Research methods are presented in section three, and section four describes
structures of global value chains for shrimp in Vietnam based on results of field research. Section
five analyzes governance patterns and dynamic driving forces affecting global value chains for
shrimp in Vietnam. Section six discusses implications for international food safety and socio-
economic development in Vietnam especially international market access and livelihood
opportunities for small-scale actors vis a vis current and likely future transformation of global
value chains for shrimp. Finally, section seven presents conclusions based on study findings.
The GVC theoretical framework
Chain-based study approaches started to appear in academic literatures in the 1960s and
1970s (Girvan 1987; Kaplinsky 2000; Bair 2009) and were used for analyzing dynamic
processes of global capitalism, national development, and industrialization (e.g., roles and
strategies played by actors especially multinational corporations in global production and trade;
the integration of core, semi-periphery and periphery countries in the world economy; the inter-
connection of actors in international production and trade; dynamics of international division of
labor and surplus distribution, etc.). Chain studies became popular during the 1990s as a result of

14
the influential writings of Michael Porter (1985) with the value chain and value system concepts,
and Gereffi and Korzeniewicz (1994) with the global commodity chains (GCC) (Kaplinsky
2000). By the late 1990s, a wide range of chain based studies have been conducted in the
manufacturing, agricultural, extractive, and service sectors using overlapping names and
concepts to analyze similar topics such as global commodity chains, value chains, value systems,
global production networks, value networks, commodity systems, and systems of provision
(Gereffi et al. 2001; Bair 2009). Given this great variation in terminologies and approaches, with
support from Rockefeller Foundation, a group of academic researchers working on chain-based
topics from different countries and disciplines attended a series of workshops and meetings in
Bellagio, Italy in 2000 to work out theoretical issues (Bair 2009). The result was adoption of the
concept “global value chain” (GVC) as a common framework favored over other alternative
concepts (Gereffi et al. 2001; Sturgeon 2009).
Tracing the intellectual lineage from a political economy perspective, Bair (2009)
contends that the GVC framework grew out of and through modification of the GCC approach,
which itself grew out of and through modification of world-systems theory. Within the world-
systems tradition, a commodity chain is defined as “a network of labor and production processes
whose end result is a finished commodity” (Hopkins and Wallerstein 1986 p.159). According to
Gereffi and Korzeniewicz (1994 p.2), “a GCC consists of sets of interorganizational networks
clustered around one commodity or product, linking households, enterprises, and states to one
another within the world-economy.” Each global commodity chain is represented by nodes
linked together to create networks, which are “situationally specific, socially constructed, and
locally integrated” (Gereffi 1994 p.2). The GCC approach emphasizes the social embeddedness
of economic organization and activities. The GCC concept captures “the whole range of
15
activities involved in the design, production, and marketing of a product” (Gereffi 1999 p.38).
By adopting the GCC as a unit of analysis, global commodity researchers depart from world
system analysts who study the world economy as a whole containing core, semi-periphery, and
periphery states/regions linking to each other through commodity chains. While world-systems
analysis explains international division of labor and surplus distribution as a consequence of
exploitative and unequal exchange relationships, GCC analysis explains “the distribution of
wealth within a chain as an outcome of the relative intensity of competition within different
nodes” (Gereffi and Korzeniewicz 1994 p.4).
Gibbon and Ponte (2005 p.77) defines the GVC as “the full range of activities, including
coordination, that are required to bring a specific product from its conception to its end use and
beyond”. This definition is not much different if not identical to the value chain concept as “the
full range of activities which are required to bring a product or service from conception, through
the different phases of production, delivery to final consumers, and final disposal after use.”
offered by Kaplinsky (2000 p.121), combining Porter’s economic terms of value chain and value
system (Porter 1985). The GVC framework absorbs all elements of the GCC approach and
modifies it with a theory of GVC governance derived from three distinctive theories of
transaction costs economics, production networks, and strategic management (Gereffi,
Humphrey, and Sturgeon 2005; Bair 2009). The modification associated with GVC governance
is an important contribution because it acknowledges the possibility of multiple governance
structures along a chain (Talbot 2009). Within the GCC original framework proposed, only a
simple dichotomy of global value chain governance offered, either as producer-driven or buyer-
driven (Gereffi1994). Whereas, after further refinement using the new theory of governance, the
GVC (Gereffi, Humphrey, and Sturgeon 2005) suggests a set of five governance forms ranging

16
from market relation to hierarchical relation, with three types of network governance in between
(Talbot 2009). However, the binary view of GVC governance is still valuable since it focuses
attention on overall governance of a chain (Ponte and Gibbon 2005). The new typology of GVC
governance is important and best suited for examining individual links (the coordination of inter-
firm transactions) in a chain (Ponte and Gibbon 2005; Sturgeon 2009; Talbot 2009).
The new theory of GVC governance (Gereffi, Humphrey, and Sturgeon 2005) centrally
questions how relationships between trading firms are organized and coordinated to avoid
opportunism and malfeasance, arising from nonredeployable investments locking business
partners in mutual dependency. For transaction cost economists (e.g., Williamson 1975 1979),
market governance will be dominant when transactions are nonspecific since products are
standardized, both parties in a transaction can use their own experience to decide to continue or
discontinue a trading relationship with little transitional expense. Williamson (1975 1979 1980)
further argues that once products for trade are customized, transactions are specific and
opportunism (asset-specificity) increases, vertical integration or hierarchy will invariably appear
to remove transaction costs from the market. In between the two extremes, Williamson (1981)
observes an intermediate organizational form with some sort of explicit coordination, but he
argues that it will eventually convert to vertical integration.
Social network theorists especially, Granovetter (1985) and Powell (1990) reject the
thesis of transaction cost economists and contend that a distinct network form of economic
organization exists between market and hierarchical governance structures. A network of firms
in a business relationship can be sustained because economic activity is embedded in social
relationships (Granovetter 1985). Opportunistic and malfeasant actions can be constrained by a
number of variables such as frequency of transactions, social and cultural norms, trust, social and

17
spatial proximity, and the desire to maintain reputation and repeat business with business parties.
Network governance based on trust, reputation, and socio-cultural values are commonly found in
East Asia where trade between parties is implemented with and sustained by informal business
relationships (Moore 1993). Within the strategic management school, Gereffi, Humphrey, and
Sturgeon (2005) picked up the concepts of technological capability and firm-level learning for
justifying the existence of network governance. The central element of strategic management
adopted by Gereffi, Humphrey, and Sturgeon (2005) is that firm-level competences are scare and
difficult to copy so that lead firms cannot internalize all functions to create vertical integration.
Likewise, shifting to other suppliers in a free market approach is also not efficient for timely
competition. In such cases, firms have motivation to develop and maintain networks with each
other for access to expertise and competences, even when asset specificity is significant.
The GVC framework for a particular industry consists of four analytical dimensions:
input-output structure, geography, governance, and institutions (Gereffi, Lee, and Christian
2009). The first dimension, input-output structure outlines the entire process of conceptual and
material transformation of inputs into final products and delivery to consumer’s end. In
development practitioners’ language (e.g., M4P 2008) this involves mapping out the value chain,
showing typical segments in the chain, the key actors (and especially lead firms) involved, and
their characteristics and functions in the chain. The second dimension, geography, refers to the
geographical spread of a chain’s activities. Geographical analysis allows researchers to
understand ecological footprints of a global value chain in real places. For the third dimension,
governance, can be used to analyze authority and power relationships between actors involving
in the chain especially roles of powerful actors in controlling and disseminating profits and
technological competences in the chain. And finally the institutional dimension involves analysis

18
of the domestic and foreign institutions and policies that shape organization and operation of the
chain.
Among these four dimensions, governance analysis has received the most attention
(Dicken et al. 2001; Gibbon 2001; Bair 2009). In the simplest chain categorization, Gereffi
(1994) defines two types of global value chain governance, either as producer-driven or buyer-
driven, based on empirical evidence of global industrial re-structuring studies. Producer-driven
value chains are found in capital and technology intensive industries such as automobiles,
aircraft and computers, in which transnational manufacturers or large integrated firms play key
roles in coordinating the entire production network (Gereffi 1994). Buyer-driven value chains are
characteristic of labor-intensive consumer goods production in which large retailers, branding
enterprises and trading companies control decentralized production networks. Given that drivers,
either multinational producers or retailers and branding firms are all located in the core regions,
looking from the developing world perspective, I argue that ultimately, there is only a single type
of global value chains, one that is core – driven.
The five categories of chain governance called market, modular, relational, captive, and
hierarchical were derived from the new theory of governance (Gereffi, Humphrey, and Sturgeon
2005). These categories were constructed based on three variables: the complexity of
information and knowledge required for maintaining a particular transaction; the ability to codify
and transmit information efficiently between the committed parties without transaction-specific
investment; and the capabilities of potential and actual suppliers required for the transaction.
Market governance is dominant when product specifications are simple, suppliers have
capabilities to produce ordered products with little input from buyers, and transactions are easily
codified with little accumulation of asset-specificity. Modular relation can be expected when the

19
products in question are complex but transactions can be simplified with technical standards and
suppliers have sufficient capabilities to follow specified standards, packages, and modules.
Relational governance patterns typically are found when producers have high capabilities,
transactions are complex and codification of product specifications is difficult. In such situations,
transactional parties are locked in mutual dependency and relationships are sustained and
regulated by reputation, social norms, spatial and cultural proximity, ethnic ties, etc. Captive
governance is expected when suppliers depend on buyers because of their low capabilities, the
product codifiability as well as the complexity of product specifications are both high. Under this
circumstance, suppliers need some sort of control and intervention from lead firms, and lead
firms lock suppliers in their mutual dependency to gain benefits. Lead firms/buyers also create
enough incentives for suppliers so that switching to other chains results higher costs to suppliers.
And finally hierarchical or vertical relationship is typical when product specifications cannot be
codified, products are complex and competent suppliers cannot be found. Lead firms facing this
situation are forced to directly develop and manage their value chains.
The global value chain approach has been used extensively to examine a wide range of
manufacturing and service commodities such as apparel and textiles (Gereffi 1994), tourism
(Clancy 1998), services (Rabach and Kim 1994), electronics (Kenney and Florida 1994;
Sturgeon 2002), and auto components (Kaplinsky and Morris 1999). Most studies of
manufacturing and service products focus on the governance dimension, especially exploring
how lead firms (e.g., transnational brand name companies and large retailers) exercise control,
drive, and coordinate global value chains. To a lesser extent, scientists and development
practitioners also use the GVC approach to study global agricultural industries such as organic
and ethical agricultural products (Raynolds 2004; Guthman 2007), fresh fruits and vegetables

20
(Dolan and Humphrey 2000; Gibbon 2001; Bush and Bain 2004), coffee, cocoa, and tea (Ponte
2002; Talbot 2002), and forest products (Gellert 2003).
Agri-food Chains
Similar to manufacturing chain analysis, studies of agricultural chains have shown how
global agri-food systems are transformed into buyer-driven value chains with powerful roles of
transnational corporations and large retailers in coordinating agri-food chains and displacing
small producers from international markets. However, agri-food chain studies have brought in
several important dimensions. In addition to transnational corporations and large retailers, other
actors also play important roles in driving agri-food chains such as international traders (Gibbon
2001), the state (Gellert 2003), private certification networks (Bush and Bain 2004; Raynolds
2004), and non-governmental organizations (Raynolds 2002; Guthman 2007). Material resource
conditions that constrain or create opportunities for organizing and coordinating agricultural
value chains are also considered (Talbot 2002). These findings highlight the fact that multiple
governance patterns commonly exist in global agri-food commodity chains (Talbot 2009;
Gereffi, Lee, and Christian 2009), in which different segments of global commodity chains are
controlled by different actors. Agri-food value chains are often a result of complex interactions
amongst production, extension, research, activist advocacy, marketing and distribution efforts,
and socio-cultural interactions (Guthman 2009).
Over the past two decades, applying the older version (GCC) of the GVC framework, a
number of studies of the global shrimp industry have been carried out (e.g., Skadany and Harris
1995; Gronski 1997; Kagawa and Bailey 2006; Islam 2008). Studies conducted by Skadany and
Harris (1995) and Gronski (1997) drew on insights from the industrial restructuring and value
chain literatures (Vandergeest, Flaherty, and Miller 1999) to analyze political, economic, and

21
technical forces influencing the emergence of the global shrimp industry, especially power of
transnational and national corporations in defining and dominating concentration, expansion, and
organization of the industry. Vandergeest, Flaherty, and Miller (1999) criticized these studies for
not having given adequate attention to the specifics of shrimp production systems which are
highly dependent on natural resources and called for incorporating political ecology to address
the roles of material resource conditions in shaping the industry’s organization. Research by
Kagawa and Bailey (2006) examines relationships between shrimp importers in Japan and
exporters in Thailand and Vietnam and found that business relationships linking Japanese
importers and seafood exporters in Thailand and Vietnam are informal rather than formal and
contracted. These findings are in line with network theories of global value chain governance
discussed above. However, the major shortcoming of this study is that it only investigates a
single link between importers in Japan and exporters in Thailand and Vietnam and does not tell
us a whole story about how global value chains for shrimp operate. In this paper I will use the
latest GVC framework to examine governance issues that structure relationships between shrimp
farmers, middlemen, processors, exporters in Vietnam, and importers in foreign countries. The
focal point of the study is to examine the impact of public and private standards/institutions for
food safety and environmental management on GVC for shrimp in Vietnam.
Research methods
Primary data for this paper came from field research in Vietnam. From August 2009 to
March 2010, I collected primary data in the Mekong Delta region, the major shrimp bowl of the
country where about 91% of total shrimp farm area and 75% of total farmed shrimp production
come from (VIFEP 2009). Based on discussions with national and local experts in the fisheries
sector, I worked in three provinces. Ca Mau Province was chosen as the center for various forms

22
of (modified/improved) extensive/traditional shrimp farming systems, which are the most
common ones found in the country up to present. Soc Trang Province represents a setting where
larger-scale enterprises engaged in intensive shrimp farming are promoted consciously by local
authorities. Ben Tre Province was chosen because it has a mix of large and small enterprises
engaged in extensive and intensive production systems. From the Research Institute for
Aquaculture No1 (RIA1) in Hanoi, I made monthly visits with an average period of two to three
weeks per trip to the Mekong Delta to collect data.
In total, I interviewed 63 shrimp farmers in the three selected provinces in the Mekong
Delta by using semi-structured interviews. Interview questions focused on shrimp aquaculture
production, their material conditions and resource endowments/constraints, how farmers interact
with each other and with input suppliers, buyers of their product, and other actors involved in
shrimp supply chains. I also collected information on farmers’ knowledge and perceptions on
public and private standards for food safety and environmental management imposed by local,
national or foreign authorities, what problems they faced, and what measures they adopted to
address these problems. From RIA1, I obtained an introduction letter signed by the RIA1 director
and sent to provincial departments for agriculture and rural development to ask for their support
in conducting the research. Initial field visits were made with the assistance of local staff at
provincial or district levels to get acquainted with local areas and community leaders and
farmers. Working through such authorities is necessary while conducting field research in
Vietnam. Once working relationships were established I asked local leaders to introduce me to
farmers who were willing to participate in the research. Interviews ranged from forty minutes to
two hours and were conducted in a conversational style to allow for rapport and trust building
between the interviewer and respondents. The results of the interviews were typed in the evening
23
of the same day or the next day, paraphrasing respondents’ answers. Whenever possible,
interviewed respondents were asked to introduce me to other potential respondents, an approach
known as the “snow-ball” technique for identifying respondents. In addition, I also asked for lists
of shrimp farmers and telephone numbers of community leaders if available in order to establish
relationships and identify potential research participants.
Using a similar approach, I interviewed 42 stakeholders other than shrimp farmers
participating in various nodes of and performing different functions in shrimp value chains in
different provinces in Vietnam (2 shrimp hatchery operators, 2 feed suppliers, 9 shrimp
collectors/middle men, 10 seafood processors and exporters, 5 researchers, 9 government
officials at district, provincial and national levels, 3 officers of seafood industry associations, and
2 NGO officers). Semi-structured interview checklists developed for farm level interviews were
modified to keep relevant questions for each actor category. In moving downward to processors
and exporters of the shrimp value chains in Vietnam as well as to higher administrative levels,
more questions relating to foreign standards for food safety and environmental management were
included since exporters and national level officers had more frequent contacts and deeper
understanding of foreign market requirements. In addition to semi-structured interviews with the
105 actors mentioned above, I had many informal interviews and interacted at many social
gatherings with other farmers and governmental officials where I was able to observe behavior
and use informal conversations to cross check data collected through semi-structured interviews.
Furthermore, in order to gain additional data and understanding, I also participated in 8 group
meetings arranged by local communities, with a range of 15 and 25 participants at each meeting.
The meetings lasted for two to three hours and provided monthly or annual assessments of
shrimp farming operations.

24
Secondary data covering the period 1999-2010, when rapid expansion of the shrimp
farming industry in Vietnam took place, also were collected. In many cases as a RIA1 employee
since 1997, I was directly involved in collection of these data on technical, environmental, socio-
economic and institutional aspects of coastal aquaculture development in Vietnam. These
included data from farm surveys and group discussions I conducted in various provinces in
northern Vietnam.
Though research questions were formulated differently, research components of these
projects on better management practices, social and environmental impact assessment,
stakeholder power analysis and institutional arrangement analysis in coastal aquaculture
development are highly relevant for my current research. With the exception of Ca Mau
Province, data from previous studies were not from provinces covered by this study, so no
attempt is made to provide time series data. However, despite important differences between
provinces and regions, developments in shrimp aquaculture development in one place can affect
other places. Accordingly, I used email and telephone communications with local governments
and RIA 1 staff who are working in those provinces where I had worked to understand what has
happened there since my own direct involvement.
Other secondary data used were reports and statistics provided by government and non-
governmental actors, including both corporate as well as national and international
environmental groups and international development agencies.
Global Value Chains for Shrimp in Vietnam
Presently, global value chains for shrimp in Vietnam can be divided into four functional
stages namely input and service supplies, grow-out production, shrimp collection, and shrimp
25
processing and export. These four stages are embedded in natural material resource conditions,
socio-cultural values, domestic institutions, and local communities. By 2009, the four functional
stages are operating separately by different actor groups and there is only a tiny portion of
shrimp production produced under vertical integration by processing and export companies. Key
actors participate directly in global value chains for shrimp in Vietnam are shrimp hatchery
operators, input suppliers, shrimp producers, a variety of middle traders (e.g., shrimp collectors
and shrimp wholesale agents), processors, and exporters. A visual depiction of the GVC for
shrimp in Vietnam is shown in Figure 1.
Input supply
The input supply stage involves shrimp hatchery operators, feed and veterinary drug
suppliers and financial service providers. Most shrimp hatchery operators in Vietnam work with
domestic black tiger shrimp (Penaeus monodon) with only a few hatching introduced white
shrimp (Litopenaeus. vannamei). Shrimp hatcheries are small-scale and operated by family-
based networks (VIFEP 2009). By 1990 about 500 shrimp hatcheries were established in
Vietnam (Chinh 1995). The number reached a peak of 5,080 facilities in 2003 then dropped back
to 4,300 establishments in 2005, producing 25 to 30 billion shrimp post larvae for grow-out
shrimp production annually (VIFEP 2009). Hatchery operators buy wild shrimp broodstock
captured by fishermen to start a hatching season. Shrimp seed are sold to middlemen or to grow-
out shrimp farmers directly depending on buyers’ requirements. Small-scale producers often get
shrimp seed from local middlemen who buy shrimp seed from hatcheries. Large-scale farms
often prefer to buy shrimp seed directly from hatchery operators. Large-scale farmers may send
their people to stay in a hatchery during a spawning season to make sure that they will receive
good quality seeds, whereas small scale producers have to take risk, depending on middlemen for

26
this essential input. The price of shrimp seed is regulated by the market but bargaining power is
skewed toward hatchery operators or middlemen, especially when dealing with small-scale
producers.
Feed and veterinary drugs are essential input components for semi-intensive and
intensive shrimp farming. Use of these inputs is very limited in extensive and various forms of
modified farming systems. VIFEP (2009) estimates that there are 53 shrimp feed producing
plants and 105 agencies registered for producing and supplying veterinary drugs and chemicals
for shrimp farming in Vietnam, most of them located in the Ho Chi Minh city area. For selling
feed and veterinary drugs to producers, chains of different agent levels are created in shrimp
farming provinces and down to shrimp farming communities. For example, VIFEP (2009)
suggests that there are 1,799 shops selling veterinary drugs, chemical and bio-products to shrimp
farming communities in Vietnam. Feed and veterinary drug suppliers set selling prices based on
their producing plant referring prices, their business investments, and profit sharing agreements
with feed producing plants or veterinary supplying agents. They prefer to receive immediate
payments once a transaction is processed. However, suppliers also loan feed and veterinary drugs
to producers if they find evidence that buyers will be able to pay back. Suppliers normally charge
higher prices compared to cash sales. For a shrimp crop lasting for 4 months on average, loaning
inputs usually occurs in the third month to fourth months, when producers are able to harvest and
sell products if serious risk such as disease problems occur. Large and successful farmers can
more easily obtain inputs or credits than small and poor producers.
Financial services provided to shrimp industry operations involve national banks, local
banks, farmer credit unions, and family, friend-based or input supplier-based networks. Capital
shortage is one of the constraints often most reported by actors, especially small scale producers.

27
Interviews with farmers revealed that national and local banks used to be generous in providing
credits to them when the shrimp farming industry started to develop and especially during the
early 2000s. However banking institutions do not give priorities to the shrimp farming industry
anymore. Alternative capital sources small-scale actors often access are credits from poverty
alleviation or small enterprise development programs initiated by national, local governments or
donor agencies. These programs charge lower interest rates but loan size is usually limited and
the loan period is short. When facing a serious financial crisis, farmers especially the poor and
unsuccessful households try to get loans from local money lenders or input suppliers with higher
interest rates to operate their business. Success of this transaction depends on actors’ social,
cultural and local network relationships and farming credibility.
Shrimp production
The shrimp farm production stage mostly involves small-scale farming operators with
limited participation of large-scale entrepreneurs and processors and exporters who engage in
vertical integration. Presently shrimp farming in Vietnam is practiced in various forms such as
extensive and modified extensive farming (in policulture, shrimp and rice farming in rotation,
shrimp and mangrove forestry), semi-intensive, and intensive shrimp farming systems. The
essential feature providing some differentiation along the extensive to intensive continuum is
additional seed stocking, associated input investments, and management efforts. No artificial
seed is stocked in traditional extensive farming and about up to 5 individuals per square meter
are stocked in modified extensive farming systems. Semi-intensive and intensive farming
associates with higher stocking density ranging from 6-20 individuals per square meter in semi-
intensive and 21 to 80 individuals or higher in intensive farming systems. Different stocking
densities imply different input levels and required technical management efforts. Adoption of

28
farming systems is shaped by material resource conditions, technical and management
capabilities, financial conditions as well as other social, economic, institutional, and community
factors.
VIFEP’s study (2009) estimates that the ratio of intensive/semi-intensive to extensive and
improved extensive shrimp farming in Vietnam in 2007 was 11: 89 in terms of shrimp farm area.
In the same year, an area of 624, 600 ha were used for shrimp culture, producing a total
production of 383,600 metric tons (VIFEP 2009). Extensive and modified extensive farming
productivity ranges from 230 kg per ha in the shrimp and mangrove forest system, and up to 450
kg/ha in modified extensive systems (VIFEP 2009). On average, semi-intensive and intensive
productivity are reported at 1.5 metric tons/ha and 3.5 metric tons per ha, respectively.
Combining VIFEP (2009) and annual reports of MARD (2009), I suggest that in 2007, Vietnam
used 68,700 ha for semi-intensive and intensive, and 555,900 ha for extensive and modified
extensive farming practices. Production from extensive and modified extensive systems range
from 194,600 to 233,500 metric tons, accounting for about 51 to 61 % of total farmed shrimp
production in 2007 (383,600 metric tons). The GSO (2007) reports 330,000 households
operating shrimp farms, of which 79,600 units are in semi-intensive and intensive operations in
2006. Hence, it can be postulated that average size of extensive and modified extensive farms is
around 2 to 2.2 ha, and average size of semi-intensive and intensive farms is from 0.7 to 0.8 ha.
Shrimp collection
Once producers harvest their crops, shrimp products will flow to the collection or middle
trading stage. As Figure 1 shows, shrimp chains from extensive and small-scale producers are
often longer and proceed through a number of middle trading levels (collectors) to a wholesale
agent who is usually registered as a middle trading enterprise with provincial government. The

29
longest middle trading process encountered involved extensive farmers in Ca Mau and Ben Tre
provinces who told me that shrimp goes through 5 middle steps before reaching processing
plants. This is because extensive farmers harvest shrimp based on the tidal regime (e.g., 4-5 days
per regime) and each day they may harvest only 10 to 20 kg. A further constraint is imposed by
the absence of roads. Traders will specialize in collecting shrimp from households and shift by
boat to other middlemen located in the next community. Tapping more products from the first
trader, the second trader will sell to another one, and so on. Intensive and large scale shrimp
farms often sell products through one middlemen step (e.g., a wholesale agent) who will sell
shrimp directly to processors. For small semi-intensive and intensive farms, middle trading
typically involves two steps, for example, from a local collector through a wholesale agent and to
processing plants.
Processing and export
Shrimp processors mainly get their supply from wholesale agents. Only a tiny portion of
farmed shrimp is directly bought from semi-intensive and intensive producers by processors.
Few processors get shrimp product directly from vertically integrated farms. Each processing
and export company often works with a range of 5 to 15 wholesale agents depending on their
processing capacity. To conduct shrimp material transactions, processors will offer buying prices
to wholesale agents. Wholesale agents will adjust their investments and expected profit margin
and set a price to upper middle collectors. Upper middle collectors will adjust their costs and
expected profit margin and offer a buying price to producers.
The National Agro-forestry and Fisheries Quality Assurance Department (NAFIQAD) in
2010 reported that 479 seafood processing plants are approved for exporting seafood products to
foreign countries, of which 330 plants met EU quality standards. The number of firms meeting

30
quality standards and having been approved to export to East Asian countries is 370 plants to
Japan, 459 plants to China, and 457 plants to Korea. There is no official record on how many
processing and export firms work with shrimp processing and export. Statistical data on seafood
export from 1997 to 2008 published by VASEP in 2008 only lists the 100 largest shrimp or other
seafood exporters annually. Shrimp export revenue in 2007 was at $1.51 billion, of which the top
100 largest firms account for 99 % of exports. Among the ten largest seafood export companies,
four of them are located in Ca Mau province (VASEP 2008).
Shrimp products are consumed in both export markets and domestic markets. The
combined markets of Japan, the US, and the EU accounted for 77 % of annual shrimp export
values of Vietnam in 1997 and 1998, increased to 86 % in 2000 and up to 89 % in 2003, and then
dropped to 75 % in 2007 and 74 % in 2008 (VASEP 2008). Data compiled by VASEP (2008)
shows that Vietnamese seafood exporting firms traded with 613 seafood importers in 2007, of
which 111 come from the EU, 65 from Japan, 31 from the US, 283 from newly industrialized
countries of Korea, China, Hong Kong and Taiwan, 78 from Southeast Asian nations, and the 45
remaining importers are from other importing countries. During the years from 1999 to 2006
annual shrimp exported to Japan and the US markets often accounted for about 70 % to 83 % of
Vietnamese shrimp export value totals (VASEP 2008). Vietnamese shrimp products exported to
foreign markets appear in various forms, however, most exported products have low value
added, such as in the headless frozen shrimp form. With the exception of the highest price of
$9.70/kg established in 2000, the nominal price of exported shrimp products aggregated at the
national level ranges from $6.85/kg in 1998 to $9.36/kg in 2007 (VASEP 2008).

31
Governance of GVC for Shrimp in Vietnam
Figure 2 integrates global value chains for shrimp in Vietnam described in Figure 1 with
the public and private regulatory networks affecting organization and governance of shrimp
chains. Figure 2 consists of four quadrants generated by two dotted lines, one vertical and one
horizontal. The two upper quadrants define public (governmental) and private (non-
governmental) regulatory networks operating in Vietnam (upper left quadrant) and in foreign
countries (upper right quadrant) which import Vietnamese shrimps. The two lower quadrants of
Figure 2 contain key actors directly participating in global shrimp chains from Vietnam and the
environments that shrimp chains are embedded. Segments of shrimp chains in Vietnam are
presented in the left lower quadrant and global shrimp markets are in the right lower quadrant.
From Vietnam, four groups of GVC are identified, connecting actors in the shrimp industry in
Vietnam to EU, US, Japan, and other markets. Shrimp commodity flows from left to right, and
governing power to coordinate GVC and the money flow will be from right to left indicating by
arrows. Arrows in producer and exporter boxes express horizontal dynamics of transformation
and consolidation of actors in these links of GVC induced by the impact of increasing stringency
of global market requirements such as food safety and environmental regulation. For example,
up arrows indicate successful actors “racing to the top” and down arrows depict failing actors
being displaced from shrimp GVC and “sinking to the bottom”. Setting up shrimp GVC in three
dimensional space, the two lower quadrants are in a horizontal dimension and the two upper
quadrants are in a vertical dimension.
Governmental regulatory networks include governmental systems in charge of the shrimp
industry development, and food safety and environmental administration in Vietnam as well as in
foreign countries. The typical institutional set-up of governmental regulation of shrimp chains in

32
Vietnam consists of a number of organizations under MARD including research institutions
(RIs), National Agriculture and Fisheries Extension Center (NAFEC), Fisheries Administration
Directorate (FAD), Department of Animal Health (DAH), and NAFIQAD. Domestic seafood
safety regulation belongs to Vietnam Food Administration (VFA) under the Ministry of Health
(MOH). The relative positions shown in Figure 2 reflect organizations’ regulatory management
functions and actors that organizations work with in shrimp chains in Vietnam. For example RIs’
main responsibilities are to develop technologies to be disseminated to hatchery operators and
producers through NAFEC, while NAFIQAD is legally designated by Vietnam and foreign
governments as the competent authority in Vietnam for quality assurance and management.
Foreign governmental institutional setup for shrimp chain governance varies between countries
but typical organizations regulating GVC chains include food safety administrations such as the
Food and Drug Administration (FDA) and USDA Food Safety and Inspection Service in the US.
Super governmental or inter-governmental organizations affecting governance of GVC chains
for shrimp in terms of shrimp aquaculture, shrimp trade, and food safety management include
many institutions such as the World Trade Organization (WTO) with the Sanitary and
Phytosanitary (SPS) and Technical Barriers to Trade (TBT) Agreements, and FAO with the
Codex Alimentarius Commission (CAC), and the World Organization for Animal Health (OIE).
In Vietnam a SPS office was created under MARD to ensure that all regulations proposed by
organizations under MARD framework are consistent with the WTO’s SPS Agreement.
Regulatory networks both in Vietnam and foreign countries containing actors who influence
governance but do not directly possess products produced by shrimp chains.
According to Vandergeest (2007) non-governmental regulatory networks (NGOs)
consists of two groups: one favors and supports market based certification initiatives typically as

33
World Wide Fund for Nature (WWF) and the other supports local and community based
management approaches to address food safety, socio-economic, and environmental issues
associated with the shrimp industry. These two NGO groups operate at local (LNGOs) or
international level (INGOs), mostly focusing on environmental regulation and to some extent
social issues associated with the global shrimp industry. Non-governmental regulatory networks
also include financial institutions (FIs) such as the World Bank and Asian Development Bank,
and industry organizations (IOs) such as Global Aquaculture Alliance (GAA) in the US, Global
Good Agriculture Practices (GLOBALGAP) in Germany, British Retailer Consortium (BRC) in
UK or VASEP in Vietnam. Industry organizations such as GLOBALGAP, BRC, and GAA work
closely with large retailers such as Walmart to drive adoption of certification systems along
shrimp chains.
Due to perceived weaknesses in the public sector and subjectivity critiques of industry
organizations’ certification systems, non-governmental organizations have developed private
regulatory/certification systems and launched activist campaigns, forcing food retail corporations
to address social and environmental responsibility and food safety by adopting third-party
voluntary certification standards. At the global level, certification systems initiated by NGOs
have become more and more popular in recent years. WWF benmark study (2007) documented
that more than 30 certification schemes operated by different branding institutions including
industry organizations and NGOs are in place in aquaculture. Since 2007, WWF in collaboration
with other non-governmental and governmental institutions and local communities have been
working towards creation of an Aquaculture Stewardship Council (ASC), similar to Marine
Stewardship Council (MSC) for regulating capture fisheries and Forest Stewardship Council
(FSC) regulating forest products through private standards. Industry organizations and retailers

34
also have developed and imposed codes of conduct, management practices, and standards for
food safety management as their competitive and risk management strategies. A typical industry
and market based certification system in the global shrimp industry is that operated by the
Aquaculture Certification Council (ACC), which certifies both shrimp farms and processing
plants. Certification NGOs and industry organizations pursue different objective functions (such
as maximizing social, environmental, or industry sustainability). These non-profit and non-
governmental organizations act as branding companies in global shrimp value chains. Though
there are actors in Vietnam participating in private regulatory certification systems, at the current
stage the role and impact of private certification institutions on shrimp GVC in Vietnam is novel,
especially at the shrimp farming stage.
Overall governance of shrimp GVC in Vietnam is consumer/buyer-driven; however, it is
not static but dynamically develops though different time, place, and mechanisms, transforming
power relationships between trading parties and generating different governing patterns and
dominating actors in the chains. Several governing patterns ranging from market to hierarchy
relations categorized by Gereffi, Humphrey, and Sturgeon (2005) are commonly found in shrimp
GVC in Vietnam.
Governance patterns between Vietnamese processing and export companies and foreign
shrimp importers range from market to relational and captive relationships. Seafood importers
from Japan, the US, and EU have strong power in setting shrimp prices with Vietnamese
exporting firms. In the industrial North, shrimp markets are dominated and controlled by
powerful and large retailing companies/supermarkets. The more shrimp and low quality products
developing country exporters supply to global markets, the greater will be the incentive and
power for lead firms to coordinate shrimp GVC chains. Similarly the more irresponsible

35
environmental and social management practices implemented by producers and exporters the
stronger the critiques and incentive for public and private regulation networks to strengthen their
role in GVC governance. As hazards such as foodborne diseases and human health risks or
environmental and social damage became known, consumers and non-governmental
organizations put pressures on foreign governments to regulate shrimp imports. Risks from
public regulations for food safety, product traceability, and country of origin are imposed on lead
actors and retailers/supermarkets in importing countries. Retailing corporations develop and
implement customized product standards, designated certification systems, and product safety
specifications and communicate to seafood importers who then will push on seafood processing
and export companies in Vietnam. Competition between retailers in the market place to offer
“sustainable” seafood further drives change.
Vietnamese seafood firms entered captive relationships with Japanese seafood importers
in the 1980s and early 1990s. During this period, Vietnam’s seafood processing and export
enterprises (mostly owned by national or local governments) harvested abundant seafood
resources but had low processing capabilities and no market access for seafood export. Having
high demand for seafood and sharing an East Asian culture, Japanese investors and importers
took the opportunities to assist Vietnam in establishment of seafood processing plants,
equipment installation, and technical staff training. Japanese investors frequently sent their
technical staff to Vietnam to support Vietnamese enterprises and make sure that seafood
products were processed and packed in accordance with their orders. In the 1980s, more than
80% of Vietnamese seafood exported products went to Japan market (Loc 2006). With economic
reform introduced in 1986 and the lift of the American embargo on Vietnam in 1994,
Vietnamese seafood enterprises were able to find more markets for their seafood products and

36
relax dependent trading relationships with Japanese seafood importers. However traces of
dependent relationships are still present in some Vietnamese seafood enterprises in the early
2000s as documented by Kagawa and Bailey (2006). Relational ties are normally established
between seafood firms in Vietnam and traditional importers in developed markets. While market
relations are established between Vietnamese companies with new importers, especially in newly
established value chains or markets.
Processing plants are commonly integrated with exporting enterprises and hierarchical
relationships are the most common governing pattern between these two actors. These integrated
firms act as leading actors in the upstream of the shrimp value chains in Vietnam. Incentives for
processing and export actors to act as lead firms in Vietnam are also strengthened by measures
of border inspections imposed by foreign governments vis a vis international trade, food safety,
and product quality. These measures impose risks directly on seafood processing and export
companies in Vietnam, mandating them responsibilities for governing upper links in shrimp
chains. Shrimp products from Vietnam have to go through a series of border inspections before
being accepted for imports and delivered through importers and retailers’ systems to reach final
consumers. If food safety or other defects are found, imports will be rejected by foreign
governments and additional scrutiny immediately will be imposed on Vietnamese shrimp
exporters. Furthermore, food safety alert messages will be sent through warning systems
established by foreign governments to negatively affect Vietnam’s whole shrimp industry.
Governance patterns between wholesale agents and processors are similar to those found
in exporter and importer relationships, ranging from market relations to relational and captive
relationships. Power relationships between these parties depend on shrimp seasons (scarcity or
abundance), shrimp farming areas, and number of actors in operation. Processors usually have
37
more power to influence transactions with wholesale agents and dominate in setting the price in
peak of shrimp harvesting seasons. However, if shrimp become scarce due to crop failures or
during off-season, the power of wholesale agents will rise to change established power
relationships with processors and will have more influence in establishing the price.
Due to fragmentation and the small-scale nature of shrimp production, coordination of
chain segments from wholesale agents down to producers and input suppliers presently is out of
control of lead firms in international markets as well as in Vietnam. Governance between
successive actors in these segments ranges from market relations to relational ties. Transactions
between actors in the upper stream links (e.g., between producers and different levels of
collectors) are normally conducted with verbal agreements without formal contracts but
sustained by conventional socio-cultural norms, friends and family based networks. Going
further upstream to producers, bargaining power is weakened. Producers are the most vulnerable
actors because they are small scale and will face higher risks and endure high costs as shrimp
reach harvesting size and there are no buyers. A further constraint weakens producers’ power
associated with technical aspects of shrimp farming operation: to avoid risks caused by diseases
or environmental management problems (e.g., water supply), farmers have to stock and harvest
shrimp at almost the same time.
In Vietnam, pressures on addressing seafood safety hazards management ( e.g.,
antibiotics, chemical, and biological contaminations) to ensure continued access to exported
markets have resulted in heavier public regulations on processors, middlemen traders, producers
and input suppliers, implemented through the regulatory framework established under MARD.
NAFIQAD is mandated responsibilities to control and inspect seafood processing companies and
make sure that standards required by foreign markets such as Hazard Analysis Critical Control

38
Points (HACCP) systems, Sanitation Standard Operating Procedures (SSOP), Good
Manufacturing Practices (GMP), and mandatory antibiotics and chemical residue monitoring
programs be implemented. NAFIQAD also works with foreign food safety administrations to
grant export permits (e.g., the health certificate required by EU market) to processing and export
companies upon companies’ standards meeting foreign food safety standards. Responsibility for
supervising input suppliers, producers and middle trading actors is shared between departments
of Fisheries Administration Directorate and Department of Animal Health from national to
provincial level.
Explicit coordination of shrimp GVC from middle traders down to producers and input
suppliers are challenging tasks faced by lead actors as well as public and private regulatory
networks in Vietnam. Presently only wholesale agents/collecting units registered as companies
under control of regulatory networks established by MARD system. The middle traders and
collectors at upper levels in shrimp GVC are hardly controlled by administrative systems of
MARD and seafood processors. At the shrimp farming level, with the presence of 330,000 small-
scale shrimp producers in Vietnam, processing and export actors cannot trade directly with
producers but have to work through a series of middle traders depending on which material
resource conditions that shrimp value chains are located in.
Discussion and Implications for Food Safety and Socio-economic Development
In the globalization era, the world economy is organized in forms of GVCs,
geographically spread across nations and functionally integrated and coordinated by powerful
actors and institutions in the chains (Gereffi 1999; Gereffi et al. 2001). The shrimp farming
industry in Vietnam is socially and economically constructed into such GVCs. Large
retailers/supermarkets and importers representing consumers in developed markets are powerful

39
actors, driving the chain. Various actors ranging from input suppliers, producers, middlemen,
processors, exporters in Vietnam participate in shrimp GVCs but possess less power. Especially,
small scale producers and enterprises are very vulnerable and with limited influence on
organization and governance of shrimp GVC. Competition among shrimp producing countries in
the developing world is high, whereas with high barriers to entry created and controlled by
powerful actors, competition among shrimp markets is less intense. As shrimp proceeds through
a sequence of value added activities, distribution of development benefits of the global shrimp
industry is determined by competitive pressures and power relationships between actors. Based
on the analysis presented here, both distribution of benefits as well as power relationships among
actors involved in shrimp GVCs are subject to dynamic processes of change through time and
space. Nonetheless, overall governance of shrimp GVCs has remained buyer-driven, a condition
unlikely to change in the foreseeable future.
Similar to findings in other agri-food chain studies (Raynold 2004; Talbot 2002; Bush
and Bain 2004), shrimp GVCs in Vietnam are heavily regulated and influenced by regulatory
networks in Vietnam as well as in foreign countries. Public regulations in Vietnam and foreign
countries are currently very active in coordinating and managing shrimp GVCs. Motivation for
public administration within Vietnam to regulate shrimp GVCs can be explained easily.
Consumers in the global North are increasingly aware of foodborne hazards as well as socio-
economic and environmental sustainability issues. National governments in the global North are
setting standards based on risk assessment approaches. Food safety regulations such as HACCP
systems mandated in the U.S. since 1997 and the food safety and traceability principles specified
in the EU regulation No 178/2002 in 2002 have the effect of providing discipline to market
actors (retailers/supermarkets) in food provision. In addition, these market actors may impose

40
their own standards as a mechanism to improve consumer confidence, acceptance, and approval.
The net result is that the government of Vietnam has no choice but to follow these standards if
they wish to gain access to lucrative foreign markets. Lead firms/retailers have the incentive to
explicitly coordinate actors involved along shrimp GVCs in order to reduce obstacles to the
smooth flow of product.
In Vietnam, through border inspection systems or periodical country visits by foreign
food safety administrators, pressures for coordination of shrimp GVCs are put on the Vietnamese
government and realized through the legal framework established under MARD. Similar to the
forest GVC study by Gellert (2003), the state in Vietnam plays an important role in driving
shrimp GVCs to ensure market requirements are met to maintain access to global shrimp
markets. As foreign markets increase the stringency of seafood standards, the government
networks have to put in place strict inspection and monitoring systems for regulating actors
involved in shrimp GVCs. Historically Vietnam had been a centrally planned economy with a
“big government” thus governmental networks exert strong control over economic activity,
creating favorable conditions for the shrimp industry to effectively respond to international
market requirements. The influence of private regulatory/NGO networks on organization and
governance of shrimp GVCs in Vietnam is limited at present, though aquaculture certification
institutions are active in international shrimp markets (Vandergeest 2007; Hatanaka 2010) as
well as in Vietnam. Several aquaculture certification schemes at the demonstration stage have
been initiated by international NGOs in Vietnam. At this stage, certification institutions and
certification supporting NGOs are experimenting with a dual strategy. On the one hand, capacity
building projects of best management practices/best aquaculture practices are being sponsored by
NGOs and donor agencies to create preliminary foundations for certification standard
41
development and implementation. If pilot projects are successful in selling certified products in
global markets, a premium price may be offered to lure producers to adopt private market based
certification systems such as the organic certification project in mangrove shrimp farming
systems in Ca Mau province. This organic shrimp farming project was funded by the Swiss
Import Promotion Program (SIPPO). Since 2002 organic shrimp in Ca Mau province was
certified by the Naturland, a German certification institution accredited by the International
Federation of Organic Agriculture Movements (IFOAM).
NGOs also organize campaigns to influence consumers, governments, and
retailers/corporations in the industrial North to encourage adoption of third-party certification
systems. Retailers will watch consumer responses to certification to see if certification provides
competitive advantages or reduces risks. In the long run, certification rents will disappear if all
producers/exporters supply certified products to global markets. If this comes to pass,
certification standards will result in improved quality and consumer safety, as they were
designed to do, but at the expense of increasing production costs for producers/suppliers. How
aquaculture certification systems will impact the social and environmental sustainability
associated with the shrimp farming industry in Vietnam is at present unknown. Standards set by
governments, industry organizations or NGOs can become obligatory for shrimp producers,
processors and exporters if powerful food retail corporations mandate them. The question must
be asked whether such standards will have the effect of excluding small scale producers and
processors from participating in shrimp GVCs, in Vietnam and in other nations of the global
South, given their limited financial and technical capabilities.
How do food safety standards affect organization and governance of global shrimp chains
in Vietnam and distribution of developmental benefits and welfare generated by the shrimp
42
farming industry? My analysis in previous sections shows that public and private standards and
regulations are not only just for food safety and environmental or social sustainability per se,
they can affect organization and governance of global value chains for shrimp in the developing
world and in Vietnam in particular. Power relationships between trading parties can be modified
profoundly by regulations and standards. Important implications for international trade learned
from this GVC analysis is that public and private regulatory standards have distributional
impacts on various actors involved in global shrimp chains. Trade standards impact not only
actors actively trading final products, in this case exporters in Vietnam and importers in foreign
markets, but also intermediate actors who participate in producing various products used for
producing the final products traded. Analysis of this study shows how international trade in
shrimp between Vietnam and foreign countries is organized and operated through intermediate
actors along shrimp GVCs. Small scale actors are likely to receive few benefits and their costs of
compliance will be higher.
State-centered approaches to examine the impact of international trade in the
globalization era definitely cannot capture dynamic elements uncovered within the GVC
framework (Bair 2005). The study substantially complements conventional studies of
international trade which usually works with final export production and value of shrimp trade.
Socio-cultural factors and material resource conditions create opportunities and
constraints affecting organization and governance of shrimp GVCs in Vietnam. Most of
Vietnam’s 330,000 shrimp farms in Vietnam are small scale and operated by rural households
coming from a range of previous rural subsistence livelihoods such as rice farming, salt
producing, and fishing with limited technical know-how and no capitalist mind of business
operations. The government’s ability to coordinate producers is limited, as is that of shrimp

43
processors. Many shrimp farmers operate from communities where there are no roads. Under
these conditions, processors cannot work directly with shrimp producers but have to organize
and coordinate shrimp chains through various levels of middleman traders. Government officials
and shrimp farmers alike are critical of these traders, but they play a central role in the flow of
product and money within the system.
Regulating middle traders to ensure foreign food safety and quality standards compliance
is challenging but not impossible. Local authorities regulate middle traders who register with
local governments as business firms and have poor records on other levels of middle traders.
Shrimp processors and exporters are highly concerned when traders use banned drugs or
improper preservation methods. Small scale producers and government authorities express their
frustration and blame middle traders for deteriorating shrimp product quality through
irresponsible practices. These actions can increase food safety hazards and market sanctions, and
negatively affect business of processors and other actors (Loc 2006). Efforts to improve product
quality need to address this critical link in shrimp GVCs. Many of the criticisms of middle
traders are unfounded, reflecting the actions of only a small sub-set of traders. We contend that
middle traders are important in organizing and coordinating shrimp GVCs in Vietnam. They
understand farming communities, are willing to stay in rural settings, and are also able to
communicate and conduct successful transactions with parties residing in urban areas.
Will small-scale operations be viable given the increasing trend of stringent standards for
food safety and environmental management imposed by global markets? As the argument above
shows, small-scale operations distribute the shrimp industry’s benefits to more local people
creating opportunities for promoting rural community development. As standards for seafood
safety and quality management in export markets become more stringent, many small processing

44
and exporting firms face higher risks and have been unable to upgrade and operate their business
successfully. The situation is further complicated by the fact that different markets and GVCs
enforce different standards. Being pushed by stringent requirements from export markets, small-
scale and poor performance processing and export companies will usually be displaced from the
most lucrative value chains and will seek alternative pathways which may include domestic
markets.
A moral beauty contest orchestrated by a variety of actors is shaping how processes of
globalization affect agri-food production and consumption. On the one hand are the rights to
consume safe and certified products in the industrial North, while on the other hand are the rights
of small scale producers to earn a livelihood in the developing South. Affluent consumers in the
industrial North will certainly benefit from increasing vertical organization and governance of
shrimp GVCs. They demand more stringent standards to ensure food safety and protect
consumer health as well as social and environmental sustainability. The irony of such efforts is
that small scale producers and entrepreneurs may become marginalized in the process. This does
not need to be the case, however. Along with strict food safety standards, a full accounting of
social and environmental dimensions needs to be incorporated into certification standards.
Conclusions
Research results presented in the paper show that the shrimp farming industry in Vietnam
is organized as global value chains driven by buyers/consumers represented by lead
retailers/supermarkets in developed countries, especially the EU, Japan, and the U.S. These
shrimp chains are embedded in socio-cultural relationships, regulatory frameworks that are
domestic and foreign as well as public and private, and all are shaped by material resource
conditions – the physical reality of small and physically isolated shrimp farms. Various actors in

45
Vietnam such as hatchery operators, feed suppliers, shrimp producers, middlemen traders,
processors, exporters, as well as importers and retailers in foreign markets directly participate in
the governance of global shrimp chains. Power relationships between actors are asymmetric and
dynamically developed and transformed through times and places to chain established power
balance and generate multiple governing patterns along global shrimp chains in Vietnam. Large
retailers/supermarkets in the industrial North are powerful, whereas hundreds of thousands of
small scale shrimp producers in Vietnam are most vulnerable. Analysis in the paper shows
organizational aspects and mechanisms of international shrimp trade involving and affecting
various intermediate actors within the chain, complementing the literature of international trade
examining only trade of final products.
Though not possessing shrimp and pursuing different utility functions (e.g., maximizing
food safety, environmental, social, production or business sustainability), a range of actors
working in public and private regulatory institutions indirectly exert powerful influences on
global value chains for shrimp. The power of these indirect regulators is internalized within
global shrimp chains through different actors, times and places to affect organization and
governance of the GVCs for shrimp. In Vietnam, public regulatory networks arranged within
MARD take active roles in promoting and coordinating shrimp supply chains, especially in terms
of food safety regulation to respond to international shrimp market requirements. Private/non-
governmental regulatory networks have limited but potentially rising influence on organization
and governance of shrimp chains.
Socio-cultural factors and material resource conditions create opportunities or constraints
to the organization and governance of global shrimp chains in Vietnam. The government of
Vietnam is facing great challenges in pursuing this export oriented shrimp farming industry: the

46
trade-off between small scale operation for maximizing social and economic benefits for local
communities and large scale and intensive operation to respond to high quality and safety
standards raised by international markets.
References
Bailey, C. 1988. Social Consequences of Tropical Shrimp Mariculture Development. Ocean and
Shoreline Management 11: 31-44.
Bair, J. 2005. Global Capitalism and Commodity Chains “Looking Back, Going Forward”.
Competition and Change 9(2): 153-180.
Bair, J. 2009. Global Commodity Chains: Genealogy and Review. In J. Bair (Ed.). Frontiers of
Commodity Chain Research (pp.1-34). Stanford, CA: Stanford University Press.
Bene, C. 2005. The Good, the Bad and the Ugly: Discourse, Policy Controversies and the Role
of Science in the Politics of Shrimp Farming Development. Development Policy Review
23(5): 585–614.
Boyd, C. E., and J. Clay. 1998. Shrimp Aquaculture and the Environment. Scientific American
278(6): 59–65
Busch, L., and C. Bain. 2004. New! Improved? The Transformation of the Global Agrifood
System. Rural Sociology 69(3): 321–346.
Chinh, N. 1995. Several Ideas on P. Monodon Culture. Fishery Review 1: 19-21 (in Vietnamese).
Clancy, M. 1998. Commodity Chains, Services and Development: Theory and Preliminary
Evidence from the Tourism Industry. Review of International Political Economy 5(1): 133-
148.
47
Dicken, P., P.F. Kelly, K. Olds, and H.W. Yeung. 2001. Chains and Networks, Territories and
Scales: Towards a Relational Framework for Analysing the Global Economy. Global
Networks 1(2): 89-112.
Dolan, C.S. and J. Humphrey. 2000. Governance and Trade in Fresh Vegetables, the Impact of
UK Supermarkets on the African Horticulture Industry. Journal of Development Studies
37(2): 147–176.
Food and Agriculture Organization (FAO). 2004. Aquaculture Production, Capture Production,
Commodities: Yearbooks of Fishery Statistics Summary Tables. Rome: FAO.
Food and Agriculture Organization (FAO). 2008. The State of World Fisheries and Aquaculture
2006. Rome: FAO.
Gellert, P. K. 2003. Renegotiating a Timber Commodity Chain: Lessons from Indonesia on the
Political Construction of Global Commodity Chains. Sociological Forum 18(1): 53-84.
General Statistical Office of Vietnam (GSO). 2007. Results of Rural, Agriculture, and Fisheries
Census in 2006. Hanoi, Vietnam: General Statistical Office of Vietnam.
Gereffi G., J. Lee, and M. Christian. 2009. The Governance Structures of U.S.-Based Food and
Agriculture Value Chains and Their Relevance to Healthy Diets. Journal of Hunger and
Environmental Nutrition 4: 357-374.
Gereffi, G. 1994. The Organization of Buyer-Driven Global Commodity Chains. In G. Gereffi
and M. Korzeniewicz (Eds.). Commodity Chains and Global Capitalism (pp. 95-122).
Westport, CT: Praeger.
Gereffi, G. 1999. International Trade and Industrial Upgrading in the Apparel Commodity Chain.
Journal of International Economics 48(1): 37-70.
48
Gereffi, G. and M. Korzeniewicz (eds.). 1994. Commodity Chains and Global Capitalism.
Westport, CT: Praeger.
Gereffi, G., J. Humphrey, and T. Sturgeon. 2005. The Governance of Global Value Chains.
Review of International Political Economy 12: 78-104.
Gereffi, G., J. Humphrey, R. Kaplinsky, and T.J. Sturgeon. 2001. Globalization, Value Chains
and Development. IDS Bulletin 32(3): 1–9.
Gibbon, P. 2001. Upgrading Primary Production: A Global Commodity Chain Approach. World
Development 29(2): 345–363.
Gibbon, P. and S. Ponte. 2005. Trading Down: Africa, Value Chains, and the Global Economy.
Philadelphia, PA: Temple University Press.
Girvan, N. 1987. Transnational Corporations and Non-Fuel Primary Commodities in Developing
Countries. World Development 15(3): 713-740.
Granovetter, M. 1985. Economic Action and Social Structure: The Problem of Embeddedness.
American Journal of Sociology 91: 481–510.
Gronski, R. 1997. Development and Degradation: Intensive Shrimp Culture and Ecological
Rebuke in Southern Thailand. PhD Dissertation. University of Missouri, Columbia,
Missouri, USA.
Guthman, J. 2007. The Polanyian Way? Voluntary Food Labels as Neoliberal Governance.
Antipode 39(3): 456–478.
Guthman, J. 2009. Unveiling the Unveiling: Commodity Chains, Commodity Fetishism, and the
“Value” of Voluntary, Ethical Food Labels. In J. Bair (Ed). Frontiers of Commodity Chain
Research. Stanford, CA: Stanford University Press.

49
Hall, D. 2004. Explaining the Diversity of Southeast Asian Shrimp Aquaculture. Journal of
Agrarian Change 4: 315–335.
Hatanaka, M. 2010. Certification, Partnership, and Morality in an Organic Shrimp Network:
Rethinking Transnational Alternative Agrifood Networks. World Development 38(5): 706–
716.
Hopkins, T., and I. Wallerstein. 1986. Commodity Chains in the World Economy Prior To 1800.
Review X(1): 157-170.
Islam, S. 2008. From Pond to Plate: Towards a Twin-Driven Commodity Chain in Bangladesh
Shrimp Aquaculture. Food Policy 33: 209–223.
Jonker, T. H., H. Ito, and H. Fujishima. 2005. Food Safety and Quality Standards in Japan:
Compliance of Suppliers from Developing Countries. The World Bank, Agriculture and
Rural Development Discussion Paper.
Kagawa, M. and C. Bailey. 2006. Trade Linkages in Shrimp Exports: Japan, Thailand and
Vietnam. Development Policy Review 24: 303–319.
Kaplinsky, R. 2000. Spreading the Gains from Globalisation: What Can Be Learned from Value
Chain Analysis? Journal of Development Studies 37(2): 117-146.
Kaplinsky, R. and M. Morris. 1999. Trade Policy Reform and the Competitive Response in
Kwazulu Natal Province, South Africa. World Development 27(4): 717-737.
Kaplinsky, R. and M. Morris. 2000. A Handbook for Value Chain Research. Sussex, UK:
Institute of Development Studies.
Keefe, A.M. and C.M. Jolly. 2001. Price Flexibility and International Shrimp Supply.
Aquaculture Economics & Management 5: 37-48.
50
Kenney, M. and R. Florida. 1994. Japanese Maquiladoras, Production Organization, and Global
Commodity Chains. World Development 22 (1): 27-44.
Lebel, L., P. Lebel, P. Garden, D. H. Giap, S. Khrutmuang, and S. Nakayama. 2008. Places,
Chains, and Plates: Governing Transitions in the Shrimp Aquaculture Production–
Consumption System. Globalizations 5(2): 211–226.
Loc, V.T.T. 2006. Seafood Supply Chain Quality Management: The Shrimp Supply Chain
Quality Improvement Perpective of Seafood Companies in the Mekong Delta, Vietnam.
PhD thesis, University of Groningen, Groningen, The Netherlands.
Making Markets Work Better for the Poor (M4P) Project, UK Department for International
Development (DFID). 2008. Making Value Chains Work Better for the Poor: a Toolbook
for Practitioners of Value Chain Analysis, Version 3. Phnom Phenh, Cambodia:
Agricultural Development International.
<http://www.markets4poor.org/Making%20Value%20Chains%20Work%20Better%20for
%20the%20Poor> Retrieved April 15, 2010
Menasveta, P. 2002. Improved Shrimp Growout Systems for Disease Prevention and
Environmental Sustainability in Asia. Reviews in Fisheries Science 10: 391–402.
Ministry of Agriculture and Rural Development (MARD). 2009. Report on Implementation of
2008 Plan Implementation and Planning Tasks and Solutions for Agri-forestry and
Fisheries Sector in 2009. Annual administrative report. Hanoi, Vietnam: MARD.
Ministry of Fisheries (MoF). 2000-2003. Report on Progress of Year 2000-2002 Plan
Implementation and Measures for Implementation of 2001-2003 Fisheries Plans. Annual
Administrative Reports. Hanoi: MoF.

51
Moore, M.1993. Declining to learn from the east? The World Bank on “Governance and
Development”. IDS Bulletin 24(1): 39-50.
Neiland, A. E., N. Soley, J.B. Varley, and D. J. Whitmarsh. 2001. Shrimp Aquaculture:
Economic Perspectives for Policy Development. Marine Policy 25: 265–279.
Nhuong, T.V., D.V. Thanh, B.T.T. Ha, T.Q. Tu, L.V. Khoi and T.P. Lai. 2006. The Shrimp
Industry in Vietnam: Status, Opportunities and Challenges. In A. Atiq Rahman, A.H.G.
Quddus, B. Pokrant and Md. L. Ali (eds). Shrimp Farming and industry: Sustainability,
Trade and Livelihoods (pp.235-254). Dhaka, Bangladesh: The University Press Limited.
Ponte, S. 2002. The Latte Revolution: Regulation, Markets and Consumption in the Global
Coffee Chain. World Development 30(7): 1099-1122.
Ponte. S. and P. Gibbon. 2005. Quality Standards, Conventions and the Governance of Global
Value Chains. Economy and Society 34(1): 1-31.
Porter, M. E. 1985. Competitive Advantage: Creating and Sustaining Superior Performance.
New York, NY: The Free Press.
Powell,W. 1990. Neither Market nor Hierarchy: Network Forms of Organization. Research in
Organizational Behaviour 12: 295–336.
Primavera, J. 1998. Tropical Shrimp Farming and Sustainability. In S. De Silva (ed.), Tropical
Mariculture (pp. 257–289). London, UK: Academic Press.
Rabach, E. and E. M. Kim. 1994. Where is the Chain in Commodity Chains?. In G. Gereffi and
M. Korzeniewicz (Eds.). Commodity Chains and Global Capitalism (pp. 95-122).
Westport, CT: Praeger.

52
Raynolds, L.T. 2002. Consumer-Producer Links in Fair Trade Coffee Networks. Sociologia
Ruralis 42(14): 404–424.
Raynolds, L.T. 2004. The Globalization of Organic Agro-Food Networks. World Development
32(5): 725–743.
Rosenberry, B. 1998. World Shrimp Farming 1998. San Diego, CA: Shrimp News International.
Sapkota , A., M. Kucharski, J. Burke, S. McKenzie, P. Walker, and R. Lawrence. 2008.
Aquaculture Practices and Potential Human Health Risks: Current Knowledge and Future
Priorities. Environment International 34: 1215–1226.
Skladany, M. and C.K. Harris. 1995. On Global Pond: International Development and
Commodity Chains in the Shrimp Industry. In P. McMichael (ed.). Food and Agrarian
Orders in the World-Economy (pp.170-191). Westport, CT: Praeger.
Stonich, S. and C. Bailey. 2000. Resisting the Blue Revolution: Contending Coalitions
Surrounding Industrial Shrimp Farming. Human Organization 59(1): 23-36.
Sturgeon, T. 2002. Modular Production Networks: A New American Model of Industrial
Organization. Industrial and Corporate Change 11(3): 451–96.
Sturgeon, T. J. 2009. From Commodity Chains to Value Chains: Interdisciplinary Theory
Building in an Age of Globalization. In J. Bair (Ed.). Frontiers of Commodity Chain
Research (pp.110-135). Stanford, CA: Stanford University Press.
Talbot, J. M. 2002. Tropical Commodity Chains, Forward Integration Strategies and
International Inequality: Coffee, Cocoa and Tea. Review of International Political
Economy 9(4): 701-734.
53
Talbot, J. M. 2009. The Comparative Advantages of Tropical Commodity Chain Analysis. In J.
Bair (Ed.). Frontiers of commodity chain research (pp.93-109). Stanford, CA: Stanford
University Press.
The National Agro-forestry and Fisheries Quality Assurance Department (NAFIQAD). 2010.
List of Seafood Processing Enterprises Approved to Export Seafood Products to EU,
Korea, China, Russia, Brazil, and Japan. Hanoi, Vietnam: The National Agro-forestry and
Fisheries Quality Assurance Department.
Traesupap, S., Y. Matsuda, and H. Shima. 1999. An Econometric Estimation of Japanese Shrimp
Supply And Demand during the 1990s. Aquaculture Economics and Management 3: 315-
221.
US General Accounting Office (GAO). 2001. Federal Oversight of Seafood Does not
Sufficiently Protect Consumers. Report to the Committee on Agriculture, Nutrition, and
Forestry, U.S. Senate. <http://www.gao.gov/new.items/d01204.pdf> Retrieved March 10,
2010.
Vandergeest, P. 2007. Certification and Communities: Alternatives for Regulating the
Environmental and Social Impacts of Shrimp Farming. World Development 35: 1152–
1171.
Vandergeest, P., M. Flaherty, and P. Miller. 1999. A Political Ecology of Shrimp Farming in
Thailand. Rural Sociology 64: 573-96.
Vietnamese Association of Exporters & Producers (VASEP). 2008. Statistics of Vietnam’s Ten
Year Seafood Export 1998-2007. Ha Noi, Vietnam: Agricultural Publishing House.
Vietnamese Institute for Fisheries Economics and Planning (VIFEP). 2009. Master Plan for
Crustacean Culture Development up to 2020. Project Report. Hanoi, Vietnam: VIFEP.
54
Williamson, O. E. 1975. Markets and Hierarchies: Analysis and Antitrust Implications. New
York, NY: Free Press.
Williamson, O. E. 1979. Transaction-Cost Economics: The Governance of Contractual
Relations. J. Law Econ. 22(2): 233-61.
Williamson, O. E. 1980. The Organization of Work. Journal of Economic Behavior and
Organization 1: 5–38.
Williamson, O. E. 1981. The Modern Corporation: Origins, Evolution, Attributes. Journal of
Economic Literature 19: 1537-68.

55
Figure 1: Global Value Chains or Commodity Flows for Shrimp in Vietnam
Input supply
Production
Collection
Processing & Export
Import & Distribution
Branding, Retailing & Buying
Shrimp hatcheries Feed & service suppliers
Producers Extensive Semi-intensive Intensive Small scale Large scale Intensive Vertical Integration
Collectors Wholesale agents/ Middle trading firms
Processors Small Large
Exporters Small Large
Domestic markets
Other importers
US importers
EU importers
Japanese importers
Other markets
EU Markets
US Markets
Japan Markets
Mat
eria
l res
ourc
e co
nditi
ons,
dom
estic
soci
o-cu
ltura
l rel
atio
nshi
ps
and
inst
itutio
ns; c
omm
uniti
es
Collectors

56
Figure 2: Governance of Global Value Chains for Shrimp in Vietnam
WTO: SPS, TBT; FAO: CAC, OIE
Foreign Governments Food & Environ. Administrations
Other markets
EU markets
US markets
Japan markets
EU importers
US importers
JP importers
Other importers
Exporters
Processors
Domestic markets
V. Goverment
Wholesale
agents
Collectors
Collectors
Producers
Hat
cher
ies
Serv
ices
Material resource conditions, socio-cultural relationships, and institutions
INGOss
VASEP LNGOs
MARD
NAFIQAD VFA RIs FAD; DAH
MOH
FIs; Donors
FIs; Donors NAFEC
IOs
SPS
57
CHAPTER 2: FOOD SAFETY STANDARDS AND DEVELOPED COUNTRY SEAFOOD IMPORTS: FITTING THE GRAVITY EQUATION WITH ZERO-ACCOUNTING MODELS
Introduction
The impact of food safety standards on bilateral trade is commonly evaluated using the
gravity econometric model. This model is popular in bilateral trade analysis because it is
supported by both empirically successful studies as well as strong theoretical foundations based
on the constant elasticity of substitution (CES) system (Anderson 1979), the monopolistic
competition model (Bergstrand 1985 1989), the classical Heckscher-Ohlin model (Deardorff
1998), and recently the general equilibrium model (Anderson and van Wincoop 2003; Feenstra
2004).
The gravity model is traditionally estimated by the ordinary least squares (OLS) method
in the form of the log-linear transformation (Burger, van Oort, and Linders 2009). This OLS
specification of the gravity equation recently has been criticized since it truncates all zero trade
values, resulting in biased estimates because dropped zero trade observations are rarely
identically and randomly distributed. In addition, Silva and Tenreyro (2006) argue that the log-
linear transformation of the gravity model can bias estimated results in the presence of
heteroskedasticity because Jensen’s inequality implies that E(ln y) ≠ ln E(y).
Recent applied economic research has explored alternative specifications to address the
problems encountered by the conventional OLS estimation of the gravity model. Arbitrarily

58
adding a small positive number to all trade flows is traditionally the most common approach to
make the logarithmic transformation of zero trade observations be definable (Burger, van Oort,
and Linders 2009). This approach is problematic since it does not rely on any theoretical and
empirical justification (Linders and de Groot 2006). The second alternative for addressing the
zero trade issue is to use a sample selection model, such as the Heckman model. Martin and
Pham (2008) note that the Heckman maximum likelihood model performs well if one can find
true excluded variables. However, Liu (2009) argues that since the Heckman gravity model
adopts the log-linear specification as the conventional OLS estimation, it is still subject to
heteroskedasticity due to the Jensen’s inequality problem raised by Silva and Tenreyro (2006).
The third alternative approach treats bilateral trade data like count data and relies on the
Poisson family regressions for estimating the gravity equation multiplicatively without taking the
log linear transformation. For example, in a recent paper, Silva and Tenreyro (2006) propose to
use the Poisson pseudo maximum likelihood (PPML) estimation. Burger, van Oort, and Linders
(2009) further extend Silva and Tenreyro’s PPML estimation by considering the negative
binomial, zero-inflated Poisson, and zero-inflated negative binomial models. The Poisson
regressions can solve the zero-omitted problem faced by the conventional log-normal OLS
specification of the gravity equation and are robust to heteroskedasticity (Silva and Tenreyro
2006). However, according to Burger, van Oort, and Linders (2009) the standard Poisson model
is sensitive to problems of overdispersion and excess zero trade flows. To date the choice and
accuracy of alternative econometric specifications for accounting zero trade flows in bilateral
trade analysis are mixed and there is not a commonly accepted solution (Burger, van Oort, and
Linders 2009).

59
In this paper I use zero-accounting gravity models to evaluate the impact of food safety
(chemical) standards on developed country seafood imports. The chemical standards on imported
seafood established by developed countries on which I focus include chloramphenicol
(minimum) required performance limit ( ), oxytetracycline maximum residue limit
( ), (fluoro)-quinolones maximum residue limit ( ), and DDT1
pesticide residue limit ( ). The study focuses on the three most important seafood markets
namely the European Union’s 15 members, Japan, and North America (including Canada and the
U.S.). I support the view that standards act as barriers to international trade and hypothesize that
increasing stringency (reducing required performance limit or maximum residue limits) of
chemical standard regulations in developed countries has negative impacts on their bilateral
seafood imports.
With improvements in analytical technologies and scientific understanding on food safety
hazards, developed countries are able to impose more stringent food safety standards. The
stringent transformation of food safety regulations has pushed agri-food exporting countries in
general and developing countries in particular to face the dilemma of losing important export
markets or improving food safety monitoring and management systems to make sure that their
export products meet market requirements (Donovan, Caswell, and Salay 2001; Jaffee and
Henson 2004).
Since the early 2000s, chemical standards including veterinary drug and other chemical
residues have become the most serious challenges in the international seafood trade (Ababouch,
Gandini, and Ryder 2005). This was made possible because of improvements in available
1 Dichlorodiphenyltrichloroethane, this is one of the most well-known synthetic pesticides
60
analytical technologies and increasing awareness and concern of consumers and regulators on
food safety and quality in developed countries. The paper makes a contribution to the ongoing
discussion on whether food safety standards (non-tariff measures) act as catalysts or barriers to
trade. The hypothesis of standards as barriers is tested via the conventional OLS gravity as well
as the alternative zero-accounting specification of the gravity model. In addition, the paper
brings in further discussions on applications of alternative gravity model specifications to
address problems encountered by the conventional gravity model specification such as zero trade
flows and heteroskedasticity.
The paper is organized as follows: after this introduction, the second section provides a
review of the theoretically-based gravity model suggested by Anderson and van Wincoop (2003)
and common zero-accounting alternative specifications of the gravity equation. The third section
specifies empirical estimation models and data sources. Estimated results and conclusions are
presented in the fourth and fifth conclusions.
Conventional OLS and Zero-Accounting Models of the Gravity Equation
Anderson and van Wincoop’s gravity model:
Tinbergen (1962) was the first to apply the Newtonian law of universal gravitation in
physics to generate the gravity econometric model for studying bilateral trade flows. This model
links bilateral trade flows between countries i and j to their GDPs, bilateral distance, and other
factors affecting trade barriers (Anderson and van Wincoop 2003). In its simplest form, the
stochastic gravity econometric model states (Silva and Tenreyro 2006) that:
K
(1)

61
where is bilateral trade flow between countries i and j in period t, and are the GDPs
of country i and country j in period t, respectively; is the bilateral distance between country i
and j; a unknown constant; , , and are unknown parameters; and is a random
error term . From this basic equation, other characteristics affecting bilateral trade such as
common language, common border, colonial tie, regional trade agreements, tariffs, and food
safety standards can be included as control variables. Equation (1) is traditionally converted into
the linear form by taking logarithms of both sides and estimated by the ordinary least square
(OLS) method:
(2)
The gravity equations (1) and (2) are not based on formal economic theory. However,
since 1979 theoretical foundations of the gravity model have been developed by economists such
as Anderson (1979), Bergstrand (1985), and Deardorff (1998). Recently, Anderson and van
Wincoop (2003) argue that previous specifications of the gravity equations ignored multilateral
resistance terms (MRTs) which can result in biasing estimated results. Based on the constant
elasticity of substitution (CES) expenditure system, Anderson and van Wincoop (2003) suggest
that unitary income elasticity with the theoretically grounded gravity model2 be estimated as:
3
exp
2 Equation (3) can be written in the level form as: K

62
exp
where and are multilateral resistance terms (MRTs); is the nominal income
share of countries i (j) in world nominal income; and is the elasticity of substitution between
all goods.
The gravity equation (3) can be estimated by nonlinear or linear OLS with fixed effects
suggested by Anderson and van Wincoop (2003). The relevance of including GDPs in the
gravity equation has been questioned because it is not relevant to the micro-founded gravity
model (Feenstra 2004; Disdier and Marette 2010). Hence, a common trend of recent bilateral
trade studies applying the gravity regression is to exclude GDPs and estimate the gravity model
(3) by the OLS method with time and country fixed effects (e.g., Burger, van Oort, and Linders
2009; Disdier and Marette 2010):
4
where , , are time fixed effects and fixed effects representing MRTs of trading
partner i and j’s, respectively.
Silva and Tenreyro (2006) criticize that the OLS estimation of the log linear gravity
equation (2) - (4) faces two important econometric problems: (i) the homoskedastic assumption
of random errors may not hold because of Jensen’s inequality and (2) the log linear
transformation of zero trade observations is infeasible. As a matter of fact, there are often a large
number of zero trade observations present in bilateral trade data. Researchers either have to drop
zero trade observations or systematically add a small positive number to all trade observations
for the log linear transformation being defined. Since zero trade flows are rarely randomly

63
distributed, truncating these observations can lead to biased results. Similarly adding a small
positive value to trade flows has no theoretical justification and can distort estimated results
(Flowerdrew and Aitkin 1982). Because of these problems, the conventional OLS regression of
the gravity equation will not yield consistent parameter estimates.
The Heckman specification:
The Heckman solution to the gravity econometric model retains the log linear
transformation of the model and treats zero trade values as censored observations. The sample
gravity model now contains both censored and uncensored observations, and is presented in a
two equation context, including the selection equation (5) and the outcome equation (6):
5
6
where defines a latent variable deciding whether or not bilateral trade between two countries
i and j in the sample is observed and determines the logarithm of the volume of bilateral
trade; is the error term associated with the selection process. We do not observe in the
selection equation and the logarithm of the volume of trade in the outcome equation.
Instead we observe: 1 0; 0 0; and 0
and is not observed 0.
The Heckman model requires that error terms in equation (5) and in the equation
(6) follow a bivariate normal distribution with zero means, standard deviation and and
correlation (Hoffmann and Kassouf 2005):
~ 0
0 ,1

64
The model can be estimated by the two-step procedure suggested by Heckman (1979) or
the one step maximum likelihood estimation. The one step approach estimates the selection and
outcome equation simultaneously. Whereas, the two-step procedure first estimates the bivariate
selection equation using a probit model and generates the inverse of the Mills ratio:
Φ
where and Φ are the standard normal density function and the cumulative distribution
function, respectively. The variable is then included as an additional regressor, allowing
the parameters of the outcome equation to be consistently estimated by the OLS method.
The advantage of the Heckman model is that it can deal effectively with the zero trade
observations and also allows researchers to distinguish the impact of bilateral barriers on the
extensive as well as the intensive margins of trade (Cipollina, Laborde, and Salvatici 2010). An
extensive review of the literature on the Heckman model carried out by Puhani (2000) shown
that the one step maximum estimation empirically gives better results than the two-step
Heckman estimator. Based on Monte Carlo simulations, Martin and Pham (2008) also show that
the one step maximum likelihood estimation performs well if one can find true restricted
variables. However with large datasets, the full maximum likelihood approach is
computationally burdensome and in that case the Heckman two step estimation might be
considered as the best procedure (Wooldridge 2002; Helpman, Melitz, and Rubinstein 2008). A
small number of bilateral trade studies using both the two Heckman estimation approaches have
been carried out by economic researchers recently (e.g., Linders and de Groot 2006; Helpman,

65
Melitz, and Rubinstein 2008; Disdier and Marette 2010; Jayasinghe, Beghin, and Moschini
2010).
The Heckman estimation approach faces two essential problems. First, model
identification is a critical issue. Since the selection function is nonlinear, the model is technically
identified. However Cameron and Trivedi (2010) state that if the nonlinearity implied by the
probit selection model is slight, then the identification is fragile and researchers need to look for
exclusion restrictions. An excluded variable is the one that influences the selection process but
does not affect the outcome equation. Second, the Heckman selection estimation does not
address Jensen’s inequality problem raised by Silva and Tenreyro (2006) and is apparently
sensitive to the homoscedasticity and normality assumptions of error terms. If these assumptions
fail to hold, estimated results of the gravity model using the Heckman procedure are biased and
inconsistent. Monte Carlo simulations with a number of estimators conducted by Martin and
Pham (2008) show that heteroskedasticity is an important source of bias. Under such a situation,
Poisson family regressions are competitive approaches to the Heckman selection model since
these models can also deal with zero trade issues efficiently and are less susceptible to the
heteroskedasticity problem.
Poisson family regressions:
The application of Poisson family regressions to bilateral trade analysis is pioneered by
Silva and Tenreyro (2006). In the prevalence of zero bilateral trade flows and heteroskedastic
error terms resulting from Jensen’s inequality, Silva and Tenreyro (2006) argue that the gravity
model should be estimated multiplicatively using the Poisson Peudo Maximum Likelihood
(PPML) estimation. Following Burger, van Oort & Linders (2009), I assume that , the
bilateral trade flow between countries i and j in period t, has a Poisson distribution with a
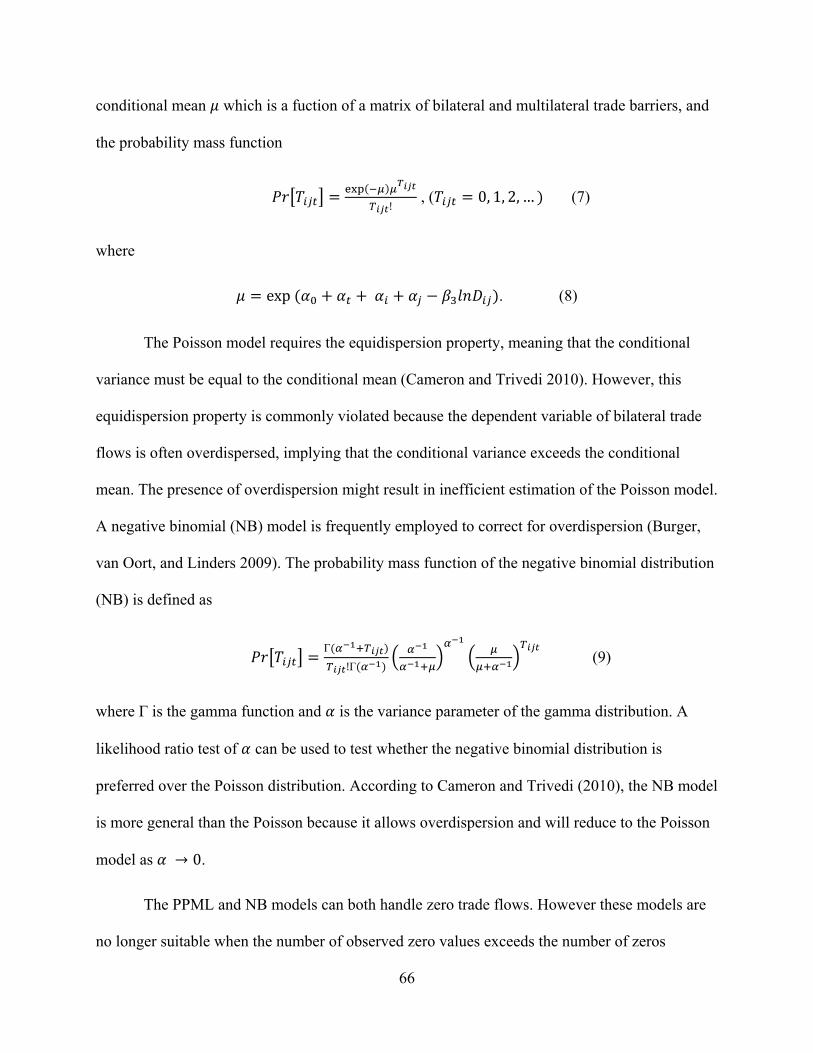
66
conditional mean which is a fuction of a matrix of bilateral and multilateral trade barriers, and
the probability mass function
! , ( 0, 1, 2, … (7)
where
exp . (8)
The Poisson model requires the equidispersion property, meaning that the conditional
variance must be equal to the conditional mean (Cameron and Trivedi 2010). However, this
equidispersion property is commonly violated because the dependent variable of bilateral trade
flows is often overdispersed, implying that the conditional variance exceeds the conditional
mean. The presence of overdispersion might result in inefficient estimation of the Poisson model.
A negative binomial (NB) model is frequently employed to correct for overdispersion (Burger,
van Oort, and Linders 2009). The probability mass function of the negative binomial distribution
(NB) is defined as
Γ!Γ
(9)
where Γ is the gamma function and is the variance parameter of the gamma distribution. A
likelihood ratio test of can be used to test whether the negative binomial distribution is
preferred over the Poisson distribution. According to Cameron and Trivedi (2010), the NB model
is more general than the Poisson because it allows overdispersion and will reduce to the Poisson
model as 0.
The PPML and NB models can both handle zero trade flows. However these models are
no longer suitable when the number of observed zero values exceeds the number of zeros

67
predicted by the estimated model (Burger, van Oort & Linders 2009). Under such a situation,
extensions of the PPML and NB models, Zero Inflated Poisson (ZIP) and Zero Inflated Negative
Binomial (ZINB) models can be used to overcome the encountered problems. The zero inflated
Poisson regression consists of two parts. The first part contains a logit (probit) equation
modeling the probability of zero bilateral trade flows (no trade at all). The second part takes
bilateral trade flows including zero trade values as count data and estimates a Poisson model.
The probability mass functions of the first part and second part of the zero inflated Poisson
model are as equation (9) and (10), respectively:
1 exp if 0 (10)
and
1
! 0 (11)
where is the proportion of zero trade observations in the study sample (0 1). It
appears from equation (9) and (10) that, when 0 the ZIP model reduces to the Poisson
model. In the presence of both overdispersion and zero inflated problems in the study sample, a
zero-inflated negative binomial (ZINB) model can be defined in a similar fashion to the ZIP
model:
1 0 (12)
and
1 Γ!Γ
0 . (13)

68
Similar to the Heckman selection model, the ZIP and ZINB models allow researchers to
examine the impact of trade barriers on both the intensive (the probability of trade being
observed) and extensive (the volume of trade being observed) margins of bilateral trade. In
addition, the ZIP and ZINB models are robust and less sensitive to the heteroskedasticity and
normality assumptions of the error terms. These models might be more appropriate to model
bilateral trade flows with excess zero trade observations. However the choice of the econometric
model specification should be based on standard statistical tests because “having many zeros in
the dataset does not automatically mean that a zero inflated model is necessary” (Cameron and
Trivedi 2010 p.605).
According to Burger, van Oort and Linders (2009), the likelihood ratio test of
overdispersion can be used to test whether the PPML model is favored over the NB model.
Similarly the Vuong statistic (Vuong 1989) can be employed to discriminate between the
ZIP/ZINB model and its counterparts. The Vuong statistic follows a standard normal distribution
with large positive values favoring the ZIP/ZINB model and large negative values favoring the
PPML/NB model (Cameron and Trivedi 2010). For the choice of the model specification,
researchers might apply additional goodness of fit statistics to evaluate the performance of
different alternative models. For example, in addition to formal statistical tests, Burger, van Oort,
and Linders (2009) also compare between the predicted value and observed value of the
dependent variable to examine how well competing models perform. Unfortunately in their study
they found that different goodness of fit statistics do not lead to the same conclusion.
Empirical Model Specification and Data Sources
In order to test the hypothesis that chemical standards act as barriers to international
seafood trade, I first estimate the OLS gravity model suggested by Anderson and van Wincoop
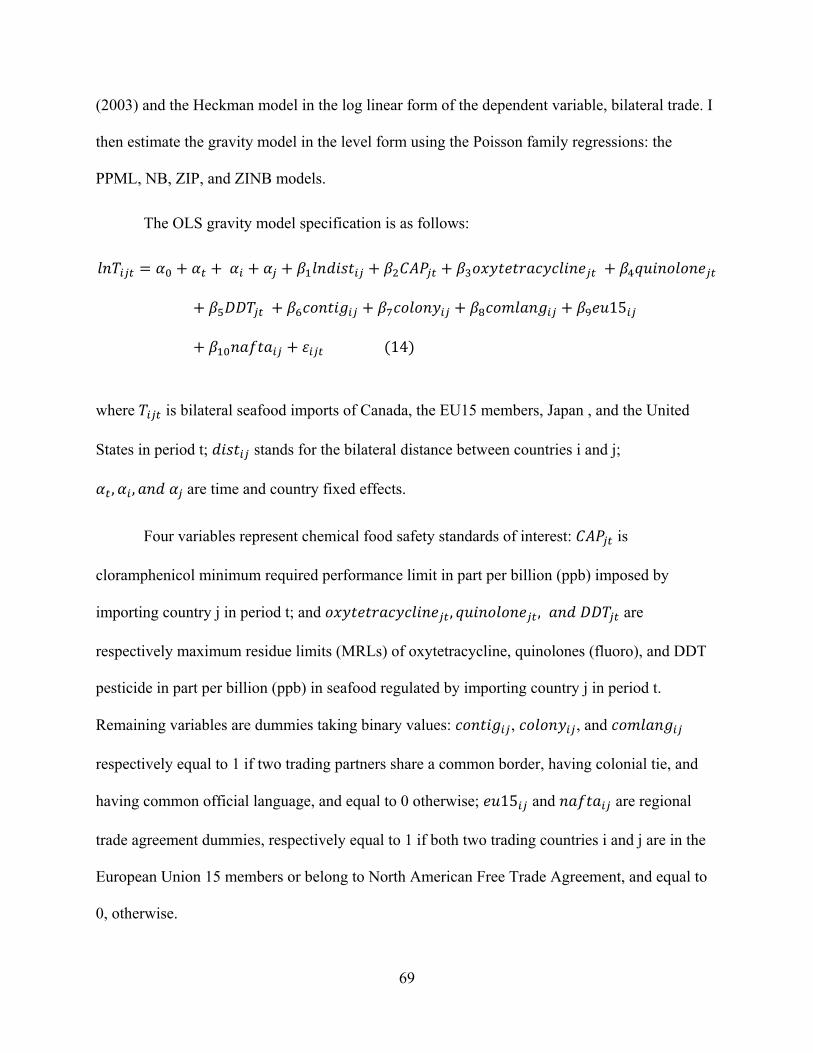
69
(2003) and the Heckman model in the log linear form of the dependent variable, bilateral trade. I
then estimate the gravity model in the level form using the Poisson family regressions: the
PPML, NB, ZIP, and ZINB models.
The OLS gravity model specification is as follows:
15
14
where is bilateral seafood imports of Canada, the EU15 members, Japan , and the United
States in period t; stands for the bilateral distance between countries i and j;
, , are time and country fixed effects.
Four variables represent chemical food safety standards of interest: is
cloramphenicol minimum required performance limit in part per billion (ppb) imposed by
importing country j in period t; and , , are
respectively maximum residue limits (MRLs) of oxytetracycline, quinolones (fluoro), and DDT
pesticide in part per billion (ppb) in seafood regulated by importing country j in period t.
Remaining variables are dummies taking binary values: , , and
respectively equal to 1 if two trading partners share a common border, having colonial tie, and
having common official language, and equal to 0 otherwise; 15 and are regional
trade agreement dummies, respectively equal to 1 if both two trading countries i and j are in the
European Union 15 members or belong to North American Free Trade Agreement, and equal to
0, otherwise.
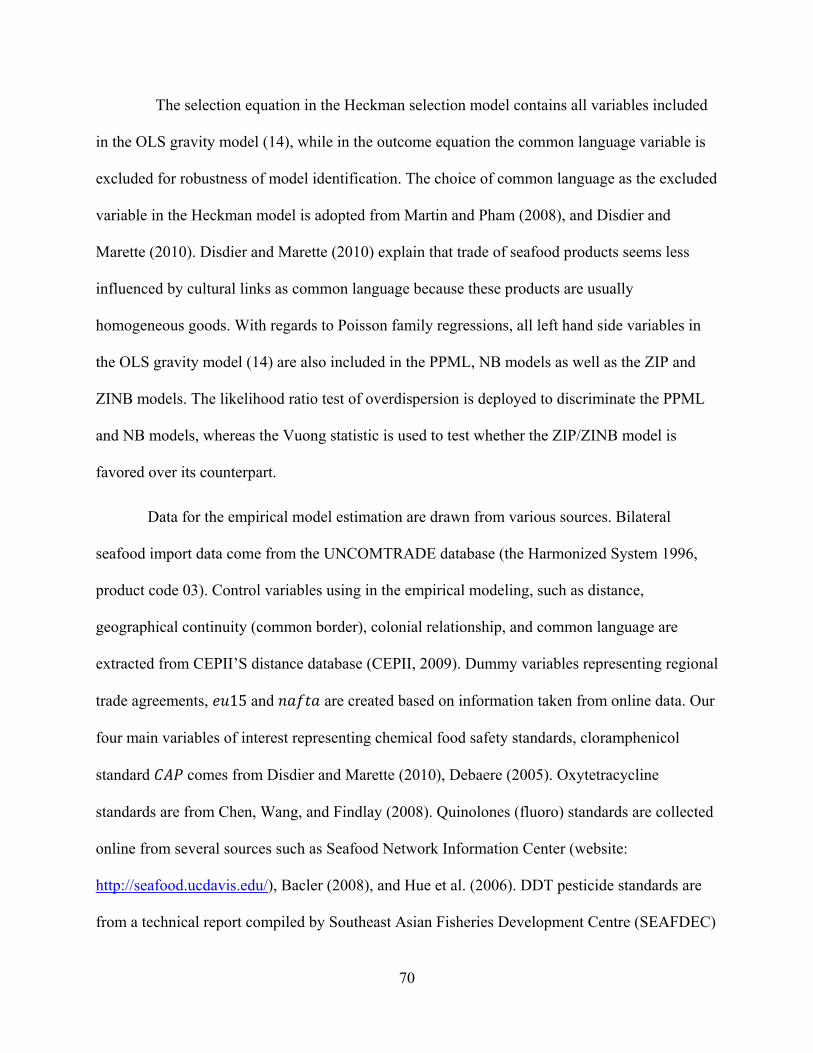
70
The selection equation in the Heckman selection model contains all variables included
in the OLS gravity model (14), while in the outcome equation the common language variable is
excluded for robustness of model identification. The choice of common language as the excluded
variable in the Heckman model is adopted from Martin and Pham (2008), and Disdier and
Marette (2010). Disdier and Marette (2010) explain that trade of seafood products seems less
influenced by cultural links as common language because these products are usually
homogeneous goods. With regards to Poisson family regressions, all left hand side variables in
the OLS gravity model (14) are also included in the PPML, NB models as well as the ZIP and
ZINB models. The likelihood ratio test of overdispersion is deployed to discriminate the PPML
and NB models, whereas the Vuong statistic is used to test whether the ZIP/ZINB model is
favored over its counterpart.
Data for the empirical model estimation are drawn from various sources. Bilateral
seafood import data come from the UNCOMTRADE database (the Harmonized System 1996,
product code 03). Control variables using in the empirical modeling, such as distance,
geographical continuity (common border), colonial relationship, and common language are
extracted from CEPII’S distance database (CEPII, 2009). Dummy variables representing regional
trade agreements, 15 and are created based on information taken from online data. Our
four main variables of interest representing chemical food safety standards, cloramphenicol
standard comes from Disdier and Marette (2010), Debaere (2005). Oxytetracycline
standards are from Chen, Wang, and Findlay (2008). Quinolones (fluoro) standards are collected
online from several sources such as Seafood Network Information Center (website:
http://seafood.ucdavis.edu/), Bacler (2008), and Hue et al. (2006). DDT pesticide standards are
from a technical report compiled by Southeast Asian Fisheries Development Centre (SEAFDEC)

71
in 2008. Information on interested chemical standards are also cross-checked with legal
documents promulgated by competent authorities in importing countries (e.g., the European
Commission Decision 2002/657, the violation records posted on websites of food safety
inspection authorities).
Estimated Results and Discussions
Table 1 shows the empirical results of the OLS and Heckman maximum likelihood
models estimated in the log linear specification form. All zero observations have been omitted in
the OLS model whereas all zero values are retained in the Heckman model. Fixed effects
representing time period, reporters (importers) and partners (exporters) are included in both
models. To control for heteroskedasticity and possible correlations of the same country pair
across years, I use the country pair clustering option with White’s standard error method (1980).
The double log linear OLS model means that the coefficients can be directly interpreted as the
marginal change in the dependent variable induced by a change in independent variables, ceteris
paribus. Whereas, the Heckman ML estimation is nonlinear, its coefficients are just linear
indexes and cannot be directly interpreted as marginal changes in the dependent variable caused
by a change in independent variables. Therefore, average marginal effects of the Heckman model
are computed by the STATA 11.0 software and presented in Column 4, 5, and 6 of Table 1.
The choice of average marginal effects is preferred over marginal effects at means of the
independent variables because the Heckman model is the nonlinear regression method with
marginal effects change from individual to individual observations. Average marginal effects are
computed by averaging marginal effects of individual data values, whereas marginal effects at
the means only computes effect of one data point of independent variables (Cameron and Trivedi
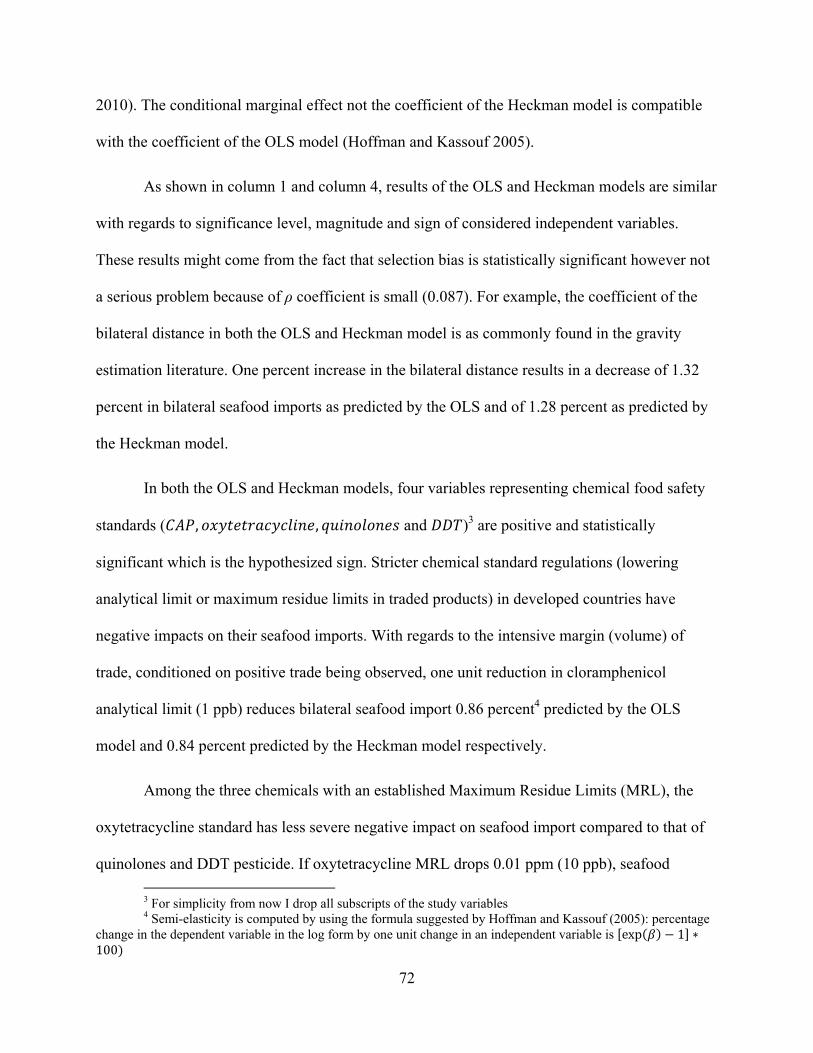
72
2010). The conditional marginal effect not the coefficient of the Heckman model is compatible
with the coefficient of the OLS model (Hoffman and Kassouf 2005).
As shown in column 1 and column 4, results of the OLS and Heckman models are similar
with regards to significance level, magnitude and sign of considered independent variables.
These results might come from the fact that selection bias is statistically significant however not
a serious problem because of ρ coefficient is small (0.087). For example, the coefficient of the
bilateral distance in both the OLS and Heckman model is as commonly found in the gravity
estimation literature. One percent increase in the bilateral distance results in a decrease of 1.32
percent in bilateral seafood imports as predicted by the OLS and of 1.28 percent as predicted by
the Heckman model.
In both the OLS and Heckman models, four variables representing chemical food safety
standards ( , , and )3 are positive and statistically
significant which is the hypothesized sign. Stricter chemical standard regulations (lowering
analytical limit or maximum residue limits in traded products) in developed countries have
negative impacts on their seafood imports. With regards to the intensive margin (volume) of
trade, conditioned on positive trade being observed, one unit reduction in cloramphenicol
analytical limit (1 ppb) reduces bilateral seafood import 0.86 percent4 predicted by the OLS
model and 0.84 percent predicted by the Heckman model respectively.
Among the three chemicals with an established Maximum Residue Limits (MRL), the
oxytetracycline standard has less severe negative impact on seafood import compared to that of
quinolones and DDT pesticide. If oxytetracycline MRL drops 0.01 ppm (10 ppb), seafood 3 For simplicity from now I drop all subscripts of the study variables 4 Semi-elasticity is computed by using the formula suggested by Hoffman and Kassouf (2005): percentage
change in the dependent variable in the log form by one unit change in an independent variable is exp 1100
73
imports in the EU15, Japan and North America would decrease 1.3 percent as predicted by both
the OLS and Heckman model. Whereas, dropping quinolones residue limit by 1 ppb would result
in a decrease of 9 percent in bilateral seafood import in Canada, European 15 members, Japan,
and the United States. DDT pesticide regulation also has a significant influence on reducing
bilateral seafood import. Decreasing DDT maximum limit in seafood 0.01 ppm (10 ppb) would
reduce 2.9 percent of bilateral seafood import.
Dummy variables representing common border ( ), colonial tie ( ) and
European Union 15 membership are statistically significant and have the expected sign in both
the OLS and Heckman model. Bilateral seafood imports between country pairs sharing a
common border are predicted to be 110.11 % (the Heckman model) and 134.44 % (the OLS
model) higher than those between other country pairs. Countries having historical colonial ties
also bilaterally trade more than other country pairs, between 183.42 % (the Heckman model) and
210.16% (the OLS model) higher. Similarly European Union 15 members import a lot of seafood
from each other (ranging from 327.33 % in the Heckman model to 359.49 % higher as predicted
by the OLS model). In contrast, NAFTA membership does not help strengthen the bilateral
seafood trade among its members. This is in line with findings in the trade literature that seafood
trade among NAFTA shows a decreasing trend compared to that between a NAFTA member and
other countries.
In addition to the conditional marginal effect, the Heckman model also provides
information on the unconditional marginal effect (another dimension of the intensive margin of
trade) and the marginal effect on the probability for bilateral trade being taking place (the
extensive margin of trade). In this paper, unconditional marginal effects are computed by the
STATA software under the assumption that the dependent variable (log of bilateral seafood
74
import) is equal to zero when it is not observed. As reported in Column 5 of Table 1,
unconditional marginal effects are smaller than their counterpart conditional marginal effects.
For instance, the magnitude of the average marginal effect of on the dependent variable (log
of bilateral import) changes from 0.008 (conditional) to 0.005 (unconditional). As Hoffmann and
Kassouf (2005) suggest, the unconditional marginal effect equals to the conditional marginal
effect plus the effect associated to a change in the probability of being selected (e.g., into
bilateral trade). It could be that marginal effects on small bilateral trade values (e.g., zero and
small positive observations) are small, resulting in smaller values of unconditional marginal
effects.
With regards to the extensive margin, chemical food safety standards under examination
only have negligible impacts on the probability of bilateral imports. As reported in Column 6 of
Table 1, coefficients of and are not statistically significant, whereas
coefficients of and are significant but with small magnitude. Reducing
one unit (1 ppb) would bring a reduction of 0.003 or 0.3 percent point to the
probability of positive trade being observed. The bilateral distance variable has a negative
relationship with the probability of positive trade being observed. One percent increase in the
bilateral distance results in a drop of 0.121 percent points of the probability of bilateral import.
Compared to other pairs, countries having a colonial relationship have a higher probability (an
additional 0.051) to conduct bilateral seafood imports. The common language variable also has a
similar effect on increasing the probability of trade (with an additional amount of 0.065).
Surprisingly, the dummy variable representing NAFTA membership does not affect the intensive
margins of trade but has a large effect on the extensive margin. This incidental finding might
result from the unusual pattern of bilateral seafood trade between NAFTA member countries.

75
Results of the Poisson family regressions are reported in Table 2. Estimates of the PPML
and NB models are shown in Column 1 and 2, respectively. The ZIP and ZINB models’
coefficients of equations of the ZIP and ZINB models are included in Column 3 to Column 6 of
Table 2. The ZIP and ZINB model each consist of two equations. The logit equation models the
probability of the zero- trade group, and the Poisson or Negative Binomial equation predicts the
probability of bilateral trade (including zero trade observations as an additional count) as count
data. Since the dependent variable in Poisson family equations is linked to the exponential
conditional mean, the coefficients can be interpreted as semi-elasticity (Cameron and Trivedi
2010)5.
As shown in Table 2 with the exception of the NB model, the parameter estimate of the
bilateral distance tends to be lower in the Poisson family regressions compared to those from the
OLS and Heckman model. For example, one percent increase in the bilateral distance would be
associated with a decrease of 0.67%, 0.65%, and 0.36% of bilateral seafood imports as
respectively predicted by the PPML, ZIP, and ZINB models. The direction and magnitude of
coefficients of variables representing chemical food safety standards ( , ,
, remain similar to those found in the OLS and Heckman equations.
Quinolone standards continue to have strongest negative impact on bilateral imports. Decreasing
1ppb in Quinolone standards (increasing the stringency of regulation) results in a reduction of
6.7%, 11.5 %, and 7.2% of imports, predicted by the PPML, NB, and ZINB models respectively.
The impact of and common language variables on seafood imports predicted by
the Poisson family regressions do not show a consistent direction. The parameter estimate of the
5 Percentage change in the dependent variable in the log form by one unit change in an independent
variable is exp 1 100 . This formula is correct for independent variables in level form either continuous or dummy variables. For a continuous variable, semi-elasticity is approximately equal to ( 100).
76
NAFTA variable changes from negatively and statistically significant in the PPML and ZIP
models to positively and statistically significant in the ZINB model. The sign of dummy
variables representing common border ( ), colonial tie ( ), and bilateral pairs of
European Union 15 membership ( 15) in all Poisson family regressions appear as expected.
However the magnitude of coefficient estimates of these variables is generally larger than those
predicted by the OLS and Heckman models. For instance, bilateral seafood imports between
countries sharing common border increases from 86.26%, 191.54%, 195.65%, and up to
1,219.71% as predicted by the PPML, NB, ZIP, and ZINB models. Similarly, the increase in
imports between countries both in European Union 15 members ranges from 197.73% to
689.32%, 702.85%, and 1,011.17% as predicted by the ZINB, ZIP, PPML, and NB models.
Similar to the Heckman selection model, the ZIP and ZINB models also provide an
explanation to zero trade values. However the difference between the two approaches is that the
Heckman selection equation reports factors affecting the probability of positive trade being
observed. In contrast, the logit equation in the ZIP and ZINB models show factors affecting the
probability of having zero trade values. Consequently, the sign of independent variables reported
in the two probability predicting equations are opposite to each other if the estimation is
consistent. As reported in Column 3 and Column 5 of Table 2, distance has a positive effect on
the probability of zero bilateral trade. Increasing bilateral distance associated with increasing the
likelihood of zero trade being presented. Chemical standards (e.g., ) have negative
effects, meaning that stricter food safety regulations (decreasing standards) would increase the
probability of having zero trade values. This prediction is consistent with what I find in the
Heckman model estimation presented in Table 1.

77
The Poisson family regressions became an alternative solution to modeling the gravity
equation after Silva and Tenreyro’s work (2006). The standard Poisson estimator (PPML)
suggested by Silva and Tenreyro (2006) addressed the unobserved heteroskedasticity, however
the PPML model might bias the parameter estimates in the presence of excess zero values and
overdispersion problem. Modified Poisson regressions such as the NB, ZIP, and ZINB models
can be considered as potential alternatives to overcome these problems. However the choice of
specific Poisson model specification should be based on formal statistical test as well as
economic implications of the parameter estimates.
As presented in Table 2, four standard statistical tests namely the Akaike Information
Criterion (AIC), the Bayesian Information Criterion (BIC), the likelihood ratio test of
overdispersion, and the Vuong statistic are computed for determining the best Poisson model
choice. Unfortunately all four statistical tests do not point to the same conclusion. By the AIC as
well as BIC criteria the NB model is favored over the other competing models presented in Table
2. The likelihood ratio test of overdispersion also indicates that the NB model is favored over the
PPML model. However, the Vuong test suggests that the ZINB model is more appropriate than
the NB, ZIP, and PPML models. This finding is similar to what Burger, van Oort and Linders
(2009) found in their empirical estimation that the model selection basing on formal statistics are
indecisive.
Model choice should be based on both statistical test and practical economic
implications. It can be argued that neither Poisson model is the best choice for the current study
sample data because each Poisson model overestimates at least one parameter. For example, the
positive impact of the EU15 dummy variable on seafood import is overestimated by the PPML,
NB, and ZIP model, while the coefficient estimate of the variable representing a common border

78
(contig) is highly inflated by the ZINB estimation. There is no formal statistical test to compare
the Heckman model and the Poisson family model. From empirical results of the Heckman
model estimation presented in Table 1, it can be argued that the Heckman model is the best
choice for the current study sample. The parameter estimates of the Heckman model in Table 1
are commonly found in the trade literature.
Similar to the ZIP and ZINB models, the Heckman model allows researchers to address
selection bias as well as provide an explanation why positive/zero trade occurs. Several issues
need to be considered to verify if the Heckman selection procedure is the best choice. First, the
Heckman estimation also uses the log linear transformation of the dependent variable, the
problem of potential heteroskedasticity implied by Jensen’s inequality remains. According to
Silva and Tenreyro (2006), Jensen’s inequality applies to all econometric equations estimated in
the log normal form. However it seems that the seriousness of unobserved heteroskedasticity
caused by the log linearized transformation is subject to the sample data. If the presence of
unobserved heteroskedasticity is serious, the results of parameter estimates can be biased and
inconsistent. With the option of country pair – clustering and White’s standard errors, the
Heckman ML estimation can mitigate the potential bias and inconsistency caused by the
homoskedasticity assumption failure.
The second issue of concern in the Heckman estimation is the assumption on the bivariate
normality distribution of random errors in the selection and outcome equations. And finally, for
robust model identification, the Heckman model requires a true excluded variable that
statistically affects the selection equation but does not enter the outcome equation. Insignificance
of the common language in the OLS model, combined with the empirical observation that fish
products are generally homogeneous goods signals that this variable can be used as an excluded

79
variable. Unfortunately this variable shows inconsistent behavior in the Poisson family
regressions. Therefore it is not a decisive conclusion that the common language variable is a true
exclusion. If one can verify the issues discussed above, then the Heckman model can provide
reliable parameter estimates, and therefore can be an appropriate alternative to address issues
faced by the conventional gravity model estimation.
Conclusions
The main objective of this paper is to test if food safety (chemical) standards act as
barriers to international seafood trade. Our empirical estimation results confirm this hypothesis
and are robust to the OLS as well as alternative zero-accounting gravity models such as the
Heckman ML procedure and the Poisson family regressions. Increasing the stringency of
regulations by reducing analytical limits or maximum residue limits in seafood in developed
countries has negative impacts on their bilateral seafood imports. Quinolones standard shows
strong negative impacts on seafood trade aggregated at two-digit level. Chloramphenicol
standards ( ) have less negative impact on seafood import aggregated at the two digit level
(product code 03 in the HS 1996 system).
For the choice of the best model specification to account for zero trade and
heteroskedastic issues, the paper shows that it is inconclusive to base on formal statistical tests.
This finding is similar to Martin and Pham (2008) and Burger, van Oort, and Linders (2009)’s
findings. However based on the magnitude of coefficients, its economic implication, and the
literature finding, the Heckman ML estimation provides the most reliable parameter estimates.
Since the correlation coefficient (ρ) between the selection equation and outcome equation is
small, dropping zero trade values do not result in serious bias. Nevertheless the Heckman
estimation is superior to the OLS method since it offers two other dimensions, the statistical

80
inference to the full population (including trading and not trading pairs) and the extensive margin
of trade (the probability for positive trade being observed).
While compliance with these stringent food safety standards is increasingly difficult for
developing countries, it also opens opportunities for successful firms and exporting countries to
sharpen their competitive advantage (Henson and Jaffee 2008). These dynamic impacts of food
safety standards should be further investigated, using the alternative zero accounting
specifications of the gravity model discussed above.
References
Ababouch, L., G. Gandini, and J. Ryder. 2005. Detentions and Rejections in International
FishTrade. Fisheries technical paper 473. Rome: UN Food and Agriculture Organization.
Anderson, J.E. 1979. A Theoretical Foundation for the Gravity Equation. American Economic
Review 69(1):106–16.
Anderson, J.E., and E. vanWincoop. 2003. Gravity with Gravitas: A Solution to the Border
Puzzle. American Economic Review 93(1):170–92.
Bacler, S. 2008. International Regulatory and Trade Issues for Drug Residues in Fish and
Seafood, power point presentation <www.aoac.org/busi_mtg/seafood/drug_res.ppt,
retrieved on September 26, 2010).
Bergstrand, J.H. 1985. The Gravity Equation in International Trade: Some Microeconomic
Foundations and Empirical Evidence. Review of Economics and Statistics 67(3):474–81.
Bergstrand, J.H. 1989. The Generalized Gravity Equation, Monopolistic Competition, and the
Factor Proportions Theory in International Trade. Review of Economics and Statistics
71(1):143– 53.

81
Burger, M., F. van Oort, and G.-J. Linders. 2009. On the Specification of the Gravity Model of
Trade: Zeros, Excess Zeros and Zero-inflated Estimation. Spatial Economic Analysis 42:
167–190.
Cameron, A.C., and P. K. Trivedi. 2010. Microeconometrics Using Stata, Revised Edition.
College Station, Texas: Stata Press.
Chen, C., J. Yang, and C. Findlay. 2008. Measuring the Effect of Food Safety Standards on
China’s Agricultural Exports. Review of World Economics 144 (1): 83-106.
Cipollina M., D. Laborde, and L. Salvatici. 2010. Do Preferential Trade Policies (Actually)
Increase Exports? A Comparison between EU and US Trade Policies. Working paper, the
European Trade Study Group (ETSG).
Deardorff, A. 1998. Does GravityWork in a Neoclassical World? In J. A. Frankel, ed. The
Regionalization of the World Economy. Chicago: University of Chicago Press, pp. 7– 32.
Debaere, P. 2005. Small Fish–Big Issues: The Effect of Trade Policy on the Global Shrimp
Market. Discussion paper 5254, Centre for Economic Policy Research, London.
Disdier, A.C., and S. Marette. 2010. The combination of gravity and welfare approaches for
evaluating nontariff measures. American Journal of Agricultural of Economics 92 (3): 713–
726.
Donovan, J. A., J. A. Caswell, and E. Salay. 2001. The Effect of Stricter Foreign Regulations on
Food Safety Levels in Developing Countries: A Study of Brazil. Review of Agricultural
Economics 23(1):163-175.
Feenstra, R.C. 2004. Advanced International Trade: Theory and Evidence. Princeton: Princeton
University Press.
82
Flowerdew, R., and M. Aitkin. 1982. A method of fitting the gravity model based on the Poisson
distribution. Journal of Regional Science 22: 191-202.
Heckman,J. J. 1979. Sample Selection Bias as a Specification Error. Econometrica 47:153– 161.
Helpman, E., M. Melitz, and Y. Rubinstein. 2008. Estimating Trade Flows: Trading Partners and
Trading Volumes. Quarterly Journal of Economics 123 (2): 441–487.
Henson, S. and S. Jaffee. 2008. Understanding Developing Country Strategic Responses to the
Enhancement of Food Safety Standards. The World Economy 31(4): 548-568.
Hoffmann, R., and A. L. Kassouf. 2005. Deriving Conditional and Unconditional Marginal
Effects in Log Earnings Equations Estimated by Heckman’s Procedure. Applied Economics
37(11): 1303–1311.
Huet, A.C., C. Charlier, S.A. Tittlemier, G. Singh, S. Benrejeb, and P. Delahaut. 2006.
Simultaneous Determination of (Fluoro)quinolone Antibiotics in Kidney, Marine Products,
Eggs, and Muscle by Enzyme-Linked Immunosorbent Assay (ELISA). J. Agric. Food
Chem 54: 2822-2827.
Jaffee, S. and S. J. Henson. 2004. Food Exports from Developing Countries: The Challenges
Posed by Standards. In M. A. Aksoy and J. C. Beghin, eds. Global Agricultural Trade and
Developing Countries. Oxford, UK: Oxford University Press.
Jayasinghe, S., J. Beghin, and G. Moschini. 2010. Determinants ofWorld Demand for U.S. Corn
Seeds:The Role of Trade Costs. American Journal of Agricultural of Economics 92(4):
999–1010.
Linders, G.J.M. and H.F.L. de Groot. 2006. Estimation of the gravity Equation in the Presence of
Zero Flows, Tinbergen Institute Discussion Paper, 2006-072/3.

83
Liu X. 2009. GATT/WTO Promotes Trade Strongly: Sample Selection and Model Specification.
Review of International Economics 17(3): 428-446.
Martin,W. and C. Pham. 2008. Estimating the Gravity Model when Zero Trade Flows Are
Frequent. Working paper, the World Bank.
Puhani, P. 2000. The Heckman Correction for the Sample Selection and its Critique. Journal of
Economic Survey 14:53-68.
Silva, J. M. C., and S. Tenreyro. 2006. The Log of Gravity. Review of Economics and Statistics
88 (4): 641–658.
Southeast Asian Fisheries Development Centre (SEAFDEC). 2008. Technical Compilation of
Heavy Metals, Pesticide Residues, Histamine and Drug Residues in Fish and Fish Products
in Southeast Asia. Singapore: SEAFDEC.
Tinbergen, J. (1962) Shaping the World Economy. The Twentieth Century Fund, New York.
Vuong, Q.H. 1989. Likelihood Ratio Tests for Model Selection and Non-Nested Hypotheses.
Econometrica 57: 307-33.
White, H. 1980. A Heteroskedasticity-Consistent Covariance Matrix Estimator and a Direct Test
for Heteroskedasticity.Econometrica 48 (4): 817–838.
Woolridge, J.M. (2002), Econometric Analysis of Cross Section and Panel Data. Boston: MIT
Press.
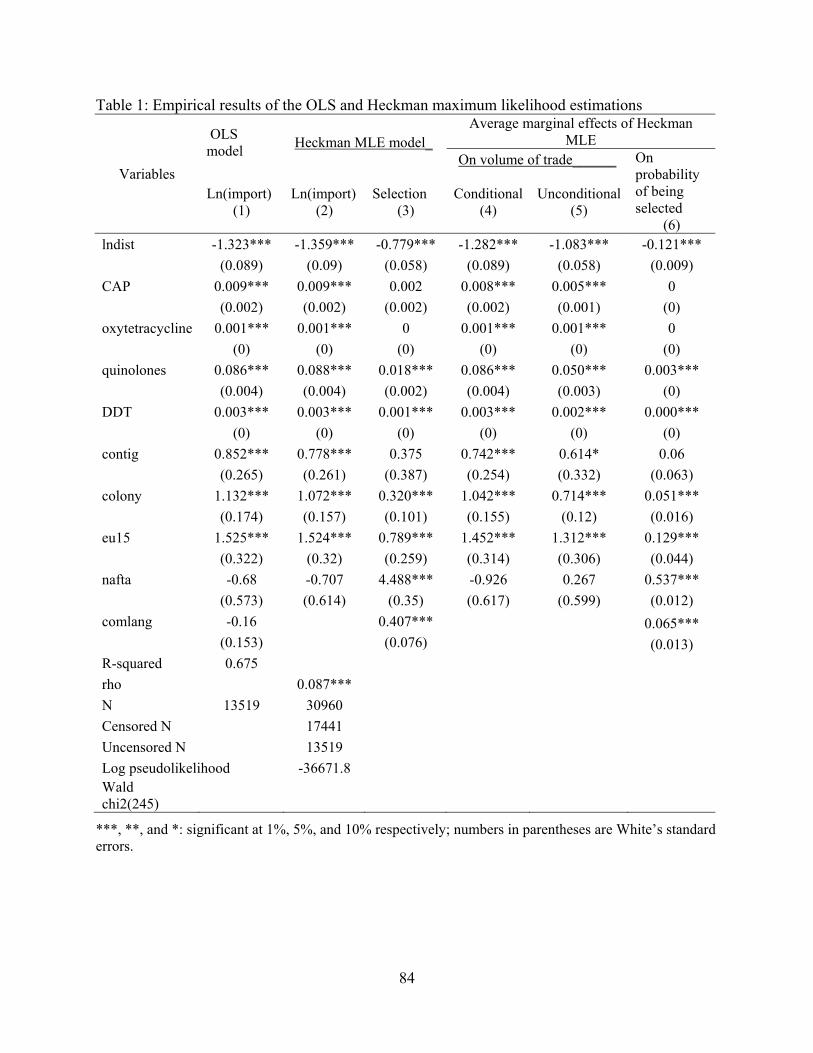
84
Table 1: Empirical results of the OLS and Heckman maximum likelihood estimations
Variables
OLS model Heckman MLE model_
Average marginal effects of Heckman MLE
On volume of trade______ On probability of being selected
(6)
Ln(import) (1)
Ln(import) (2)
Selection (3)
Conditional (4)
Unconditional (5)
lndist -1.323*** -1.359*** -0.779*** -1.282*** -1.083*** -0.121*** (0.089) (0.09) (0.058) (0.089) (0.058) (0.009) CAP 0.009*** 0.009*** 0.002 0.008*** 0.005*** 0 (0.002) (0.002) (0.002) (0.002) (0.001) (0) oxytetracycline 0.001*** 0.001*** 0 0.001*** 0.001*** 0 (0) (0) (0) (0) (0) (0) quinolones 0.086*** 0.088*** 0.018*** 0.086*** 0.050*** 0.003*** (0.004) (0.004) (0.002) (0.004) (0.003) (0) DDT 0.003*** 0.003*** 0.001*** 0.003*** 0.002*** 0.000*** (0) (0) (0) (0) (0) (0) contig 0.852*** 0.778*** 0.375 0.742*** 0.614* 0.06 (0.265) (0.261) (0.387) (0.254) (0.332) (0.063) colony 1.132*** 1.072*** 0.320*** 1.042*** 0.714*** 0.051*** (0.174) (0.157) (0.101) (0.155) (0.12) (0.016) eu15 1.525*** 1.524*** 0.789*** 1.452*** 1.312*** 0.129*** (0.322) (0.32) (0.259) (0.314) (0.306) (0.044) nafta -0.68 -0.707 4.488*** -0.926 0.267 0.537*** (0.573) (0.614) (0.35) (0.617) (0.599) (0.012) comlang -0.16 0.407*** 0.065*** (0.153) (0.076) (0.013) R-squared 0.675 rho 0.087*** N 13519 30960 Censored N 17441 Uncensored N 13519 Log pseudolikelihood -36671.8 Wald chi2(245)
***, **, and *: significant at 1%, 5%, and 10% respectively; numbers in parentheses are White’s standard errors.

85
Table 2: Results of Poisson Family Regressions
Variables PPML model NB model ZIP model ZINB model
logit import logit importlndist -0.668*** -1.732*** 1.412*** -0.645*** 0.322*** -0.359***
(0.095) (0.099) (0.054) (0.000) (0.022) (0.028)CAP 0.007*** 0.010*** -0.004 0.007*** -0.001 0.009***
(0.001) (0.003) (0.004) (0.000) (0.003) (0.004)tetracycline 0.001*** 0.001*** 0.000*** 0.001*** 0.000 0.001***
(0.000) (0.000) (0.000) (0.000) (0.000) (0.000)quinolones 0.067*** 0.115*** -0.032*** 0.067*** -0.007** 0.072***
(0.006) (0.005) (0.003) (0.000) (0.003) (0.003)DDT 0.002*** 0.004*** -0.001*** 0.002*** 0.000*** 0.003***
(0.000) (0.000) (0.000) (0.000) (0.000) (0.000)contig 1.070*** 0.622** -0.885*** 1.084*** -3.402 2.580***
(0.267) (0.293) (0.328) (0.000) (2.589) (0.142)colony 0.608*** 1.020*** -0.599*** 0.590*** -0.610*** 1.306***
(0.234) (0.196) (0.106) (0.000) (0.095) (0.102)eu15 2.083*** 2.408*** -1.418*** 2.066*** -25.306 1.091***
(0.401) (0.282) (0.296) (0.001) (10771.040) (0.081)nafta -0.763* -1.061 -27.992 -0.696*** -23.480 1.050***
(0.417) (0.956) (1823547.000) (0.001) (78357.300) (0.450)comlang 0.018 0.895*** -0.688*** -0.008*** -0.237*** -1.118***
(0.202) (0.157) (0.081) (0.000) (0.067) (0.075)Fixed effects yes yes yes yes Yes YesObservations 30960 30960 30960 30960Log pseudolikelihood -135800000.0 -133206.7 - -140620.9AIC 823223.0 266909.4 253000000 281371.7BIC 823231.3 268977.9 253000000 281913.9Overdispersion (α) 7.2*** 940000000.0***Vuong statistic 65.28*** 52.9***
***, **, and *: significant at 1%, 5%, and 10% respectively; numbers in parentheses are White’s standard errors

86
CHAPTER 3: STANDARD HARMONIZATION AS CHASING ZERO (TOLERANCE LIMITS): THE IMPACT OF VETERINARY (CLORAMPHENICOL ANALYTICAL) STANDARDS ON CRUSTACEAN IMPORTS IN THE EU, JAPAN, AND NORTH
AMERICA
Introduction
Over the last two decades, there has been increased concern among consumers and
regulators in industrialized countries over food safety, health risks, and scandals associated with
food consumption (Henson and Caswell 1999; Otsuki, Wilson, and Sewadeh 2001). Following
the promulgation of the Sanitary and Phytosanitary (SPS) Agreement of the World Trade
Organization (WTO) in 1994, countries are allowed to establish stricter SPS measures than
international standards, provided that the standard regulations are based on adequate risk
assessment (Wilson 2003) and do not arbitrarily discriminate or restrict trade (Wilson and Otsuki
2003). However, in responding to the food safety crisis, industrialized countries (e.g., the
European Union) might take the precautionary principle, which suggests that “regulatory action
against risk is taken, even when science has not established direct cause and effect relationships”
(Otsuki, Wilson, and Sewadeh 2001 p.496). Given the decline of traditional trade barriers such as
tariffs and quotas resulting from WTO negotiations (Deardoff and Stern 1998; Maskus and
Wilson 2001), the proliferation of SPS and food safety standards as nontariff measures (NTMs)
poses major challenges and becomes hot issues in international agri-food trade.
On top of international community concern is the trade impact of SPS and food safety
standards established by developed countries. Trade effects of SPS and food safety standards are

87
dynamic, which can be impediments to, and sometimes facilitators of agri-food trade (Moenius
2006; Disdier, Fontagné, and Mimouni 2008; Jayasinghe, Beghin, and Moschini 2010). Henson
and Jaffee (2008) recognize that food safety standards can act as barriers to trade and at the same
time can also act as catalysts for upgrading agri-food supply chains and repositioning exporting
countries in better competitive advantage in global markets. Trade impacts of SPS and food
safety standards differ across sectors (Moenius 2006), among products and between countries
(Disdier, Fontagné, and Mimouni 2008), subject to specific standards.
Given their weaker institutional, technical, and financial capabilities, there is a pre-
established view that food safety standards impede agri-food exports of developing countries to
markets in industrialized countries (Athukorala and Jayasuriya 2003; Henson and Jaffee 2008;
Anders and Caswell 2009). However the dichotomous categorization of trading partners by their
development status as well as the simple black and white argument between food safety
“standards as barriers” and “standards as catalysts” cannot capture the complex impact of food
safety on trade (Jaffee and Henson 2004; Anders and Caswell 2009). Close examination of
complex impacts of particular standards on products, markets, and countries is required (Anders
and Caswell 2009).
This paper investigates the impact of advancing cloramphenicol analytical standards
(veterinary drug residue regulations) on crustacean imports in the EU15, Japan, and the North
America. The paper extends Disdier and Marette (2010)’s work by examining the following
questions: i) Are different crustacean products in trade affected differently? ii) What is the
impact of standards on crustacean exporters with regard to scale of export? iii) What is the
impact of food safety standards when separating exporting countries by development/income
status? Do developing countries with lower financial, technical capabilities as well as lower well-

88
trained human resources receive more negative effects because of increasing stringency of
cloramphenicol analytical standards?
The current paper will make an important contribution to the literature on the impact of
food safety standards on seafood trade in several ways. Though seafood trade plays an important
role especially in developing countries (e.g., an important source of foreign currency earning and
employment opportunities for rural people) and seafood trade regimes are rapidly tightening,
there are only a few studies investigating the impact of food safety standards on seafood trade
(Anders and Caswell 2009). Using the micro-founded gravity model, the paper will contribute to
this literature by exploring the dynamic impacts of food safety standards on crustacean trade.
Unlike Disdier and Marette’s study (2010) I explore complex impacts of chloramphenicol
standards on different crustacean products aggregated at 6 digit level, scale of exports, and top
crustacean exporters in Asia.
It is important to note that cloramphenicol is banned in many developed and developing
countries because it has carcinogenic potential in humans. Since an acceptable daily intake (ADI)
has not been allocated, consequently no maximum residue limits (MRLs) have been established
for cloramphenicol in the EU15, Japan and the North America. Instead cloramphenicol required
performance limits (standards) are established based only on analytical technology
improvements and have no cause and effect relationship with health risk and consumer welfare.
Veterinary (Cloramphenicol Analytical) Standards and Impacts on Seafood Trade
Regulation of veterinary drug residues in aquaculture originated food has become an
important issue in the last two decades. Given the saturation of capture fisheries, increasing
seafood trade depends on the increase of farmed production of fish. In intensive aquaculture
89
systems, producers have a tendency to use veterinary drugs to treat fish diseases or
environmental problems for reducing crop failures. However, inappropriate use of veterinary
agents may result in drug residue contamination in seafood products, affecting the safety of the
product and exposing consumers to health risks (GESAMP 1997). Consumers and regulators in
developed countries have expressed concern over the use and misuse of veterinary drugs in agri-
food production including aquaculture and its health implications (Wilson, Otsuki, and
Majumdar 2003).
Cloramphenicol is a broad-spectrum antibiotic, which was historically used as a
veterinary drug for farmed animal disease treatment purposes, and it is currently used in human
treatment (WHO 2003). The Joint FAO/WHO Expert Committee and a number of other agencies
(e.g., International Agency for Research on Cancer; European Committee for Veterinary
Medicinal Products; United States Food and Drug Administration) have conducted a series of
chloramphenicol assessments (WHO 2003). According to WHO (2003), concerns have been
expressed about the potential genotoxicity, carcinogenic, and aplastic anemia impact of
cloramphenicol in humans. However, an ADI has never been established and consequently a
MRL has not been set for cloramphenicol because there is insufficient information on toxicity.
Adopting the precautionary principle many developed countries including Canada, the EU, Japan
and the U.S. banned the use of cloramphenicol in the treatment of food-producing animals for
food safety reasons (GESAMP 1997). Since it is banned, countries often enforce the zero
(tolerance) limit policy, implying that no detectable residue of chloramphenicol in food is
acceptable (FAO 2004).
Though countries banning the cloramphenicol use in food-producing animal production
adopt the zero tolerance policy, the policy is enforced differently, depending on their food safety

90
cultures, available analytical technology, financial, and human resources. In the EU, in the early
1990s via Directive 86/469/ECC, EU members were required to implement a monitoring
program with a required detection limit of 10 part per billion (ppb) for cloramphenicol residues
in meat and fish products (Degroodt et al. 1992). With the enhanced methods of mass
spectrometry (MS) and liquid chromatography-mass spectrometry (LC-MS), the EU detected
cloramphenicol residues in food at 1.5 ppb in 2001 (Debaere 2005; Disdier and Marette 2010)
and the detection limit continued to drop to 0.3 ppb after 2001, when the European Commission
introduced the concept of Minimum Required Performance Limits (MRPLs) in Decision
2002/657/EC and Decision 2003/181/EC.
Following the EU, other major seafood importers including the U.S., Canada and, later,
Japan have also applied the enhanced analytical methods to detect cloramphenicol residues in
seafood at lower levels. The United States screened shrimp/crustaceans for cloramphenicol
residues since 1990s (Weston 1996). The United States detected cloramphenicol residues in
shrimp/crustaceans at a limit of 5 ppb until 2001 (Neuhaus, Hurlbut, and Hammack 2002) and the
detection limit dropped to 1 ppb in 2002 and to 0.3 ppb since 2003 (Debaere 2005; Disdier and
Marette 2010). By 2001, the official method used by Canada allowed detection of
cloramphenicol residues at 2.5 ppb (Neuhaus, Hurlbut, and Hammack 2002). However, the
detection limit was dropped to 0.3 ppb since 2002 when Canada adopted the EU approach (Debaere
2005; Disdier and Marette 2010). An agreement signed by Vietnamese and Canadian food safety
inspection authorities in 2006 signaled that Canada’s cloramphenicol detection limit was lowered
to 0.2 ppb since 2007.
In Japan, according to the Japanese Ministry of Health, Labor and Welfare, veterinary
drug residues are regulated by Food Sanitation Law and Quarantine Law. The cloramphenicol

91
detection limit in seafood in Japan was at 50 ppb in 2001 and this limit was unchanged until
2006 (Debaere 2005; Disdier and Marette 2010). However, the Japanese government revised the
basic Food Safety Law and also amended the Food Sanitation Law in 2003 after a number of
food-related scandals were discovered (Jonker, Ito, and Fujishima 2005). With the amendment of
the Food Sanitation Law which went into enforcement in June 2006, Japan adopted a system
featuring a “positive list” with MRLs established for specific residues (Jonker, Ito, and Fujishima
2005). Cloramphenicol appeared in “Table 1” of the amended Food Sanitation Law, listing
agricultural chemicals and veterinary drugs that should not be detected in any food. Inspection
records posted on the website of the Japanese Ministry of Health, Labor and Welfare suggest that
since 2007, the detection limit of cloramphenicol in seafood in Japan was harmonized with the
EU minimum required performance limit of 0.3 ppb.
The harmonization of cloramphenicol analytical methods at much stricter standards in
the EU and other industrialized countries has profound impacts on international seafood trade,
especially on seafood exports from developing countries. With advanced methods, during 2001
and 2002 the EU detected cloramphenicol and nitrofuran residues in imported shrimp from a
number of Asian countries (e.g., China, India, Thailand, and Vietnam). The EU increased
sampling of exports from violated countries for inspection, and in the worst case the EU
suspended the import of Chinese shrimps into the EU in 2002 (Ababouch, Gandini, and Ryder
2005) until competent authorities in China took adequate responses and the results of further
testing shown no contamination. Since Canada, Japan and the United States also imposed similar
stringent testing methods, cloramphenicol contamination in imported seafood was discovered in
Canada (2003, 2005), the U.S. (2004, 2006) and Japan in 2006 (Disdier and Marette 2010).
Ababouch, Gandini, and Ryder (2005) show that since 2001, veterinary drug residues have

92
become the most serious chemical risk for exported seafood consignments being rejected at
border control of importing countries.
Debaere (2005) shows that the EU zero tolerance policy for cloramphenicol in shrimp has
led to a disruption of shrimp trade flows from Europe toward the United States. Using the
Heckman selection procedure to include zero trade flows in the gravity trade model, a recent
study by Disdier and Marette (2010) also suggests that advancing cloramphenicol analytical
standards has a negative impact on crustacean imports into the EU15, Japan and the North
America during a period from 2001 to 2006. A controversial issue Disdier and Marette (2010)
demonstrates in their work is that while a stricter cloramphenicol analytical standard has a
negative impact on crustacean imports, it is welfare improving in both domestic (importers) and
international consideration. In addition, Disdier and Marette (2010) treat the cloramphenicol
analytical standards (e.g., MRPL established by the EU) as if they were MRLs.
Theoretical Framework and Model Specification
The paper relies on the theoretically-based gravity model developed by Anderson and van
Wincoop (2003). The gravity model has been a workhorse for analyzing bilateral trade flows for
over 40 years (Baier and Bergstrand 2007). The earlier applications of the gravity model to
international trade flows, e.g., Tinbergen (1962), Linnemann (1966) and Aitken (1973), were
drawn from an analogy to Newtonian physics without economic theoretical foundations. Based
on constant elasticity of substitution (CES) preferences, a theoretical foundation for the gravity
model has been presented and enhanced by, e.g., Anderson (1979), Bergstrand (1989), and
Deardoff (1998). Relying on the CES expenditure system, Anderson and van Wincoop (2003)
has proved that factors affecting bilateral trade flows between partner i and j can be decomposed
into three components: (i) the bilateral trade barrier between partner i and partner j, (ii) i’s
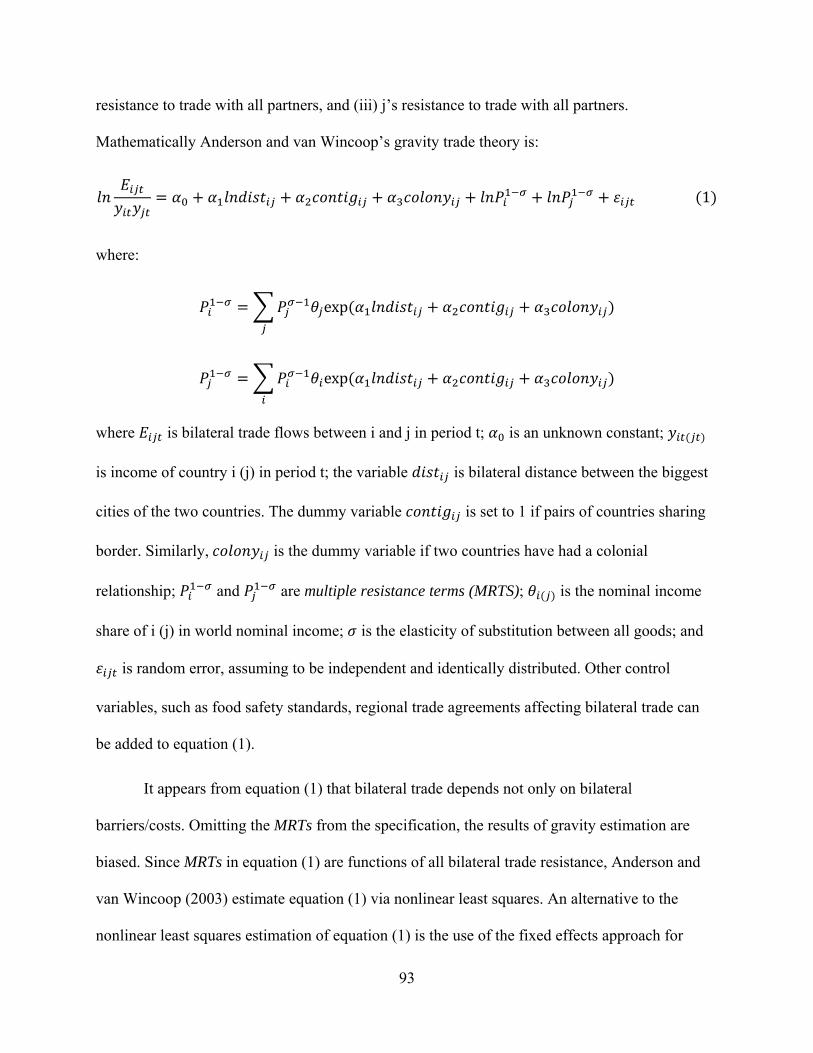
93
resistance to trade with all partners, and (iii) j’s resistance to trade with all partners.
Mathematically Anderson and van Wincoop’s gravity trade theory is:
1
where:
exp
exp
where is bilateral trade flows between i and j in period t; is an unknown constant;
is income of country i (j) in period t; the variable is bilateral distance between the biggest
cities of the two countries. The dummy variable is set to 1 if pairs of countries sharing
border. Similarly, is the dummy variable if two countries have had a colonial
relationship; and are multiple resistance terms (MRTS); is the nominal income
share of i (j) in world nominal income; is the elasticity of substitution between all goods; and
is random error, assuming to be independent and identically distributed. Other control
variables, such as food safety standards, regional trade agreements affecting bilateral trade can
be added to equation (1).
It appears from equation (1) that bilateral trade depends not only on bilateral
barriers/costs. Omitting the MRTs from the specification, the results of gravity estimation are
biased. Since MRTs in equation (1) are functions of all bilateral trade resistance, Anderson and
van Wincoop (2003) estimate equation (1) via nonlinear least squares. An alternative to the
nonlinear least squares estimation of equation (1) is the use of the fixed effects approach for

94
controlling multilateral resistance terms (Baier and Bergstrand 2007). In the gravity model of
Anderson and van Wincoop (2003) as equation (1), they restrict coefficients of the gross
domestic products (GDPs) to one. Baier and Bergstrand (2007)’s fixed effects approach keeps
Anderson and van Wincoop’s theory by scaling the left hand side variable of equation (1) by the
products of incomes. However, including incomes in the gravity model has recently been
questioned for its distance to trade theory (Feenstra 2004; Disdier and Marette 2010). The size
effects of incomes can be captured by using the fixed effects estimation approach (Disdier,
Fontagne and Mimouni 2008).
Following the recent literature of gravity trade analysis (e.g., Disdier and Marette 2010;
Helpman, Melitz and Rubinstein 2008; Disdier, Fontagne and Mimouni 2008), the theoretically-
based gravity model in the log normal form as suggested by Anderson and van Wincoop (2003)
and using the fixed effects estimation approach is:
15 (2)
Here is crustacean imports of country j (Canada, EU15, Japan, and the US) from
country i by time t from 2001 to 2008. The source of crustacean import data is from
UNCOMTRADE database at the six-digit level of the HS1996 classification, consisting of
frozen rock lobster and other sea crawfish (030611), frozen lobsters (030612), frozen shrimps
and prawns (030613), frozen crabs (030614), non-frozen rock lobster and other sea crawfish
(030621), non-frozen shrimps and prawns (030623), and non-frozen crabs (030624). Importer by
product fixed effect, exporter by product fixed effect, and time fixed effect are , , and
respectively.

95
Variables representing bilateral distance, common border, and having colonial
relationship are defined as above section. , 15 , and are dummy variables
if two countries have had an official common language, belongs to European Union 15 members
and NAFTA members, respectively. The cloramphenicol standard ( ) is defined as the
minimum required performance level (MRPL), which is the detection limit in parts per billion
(ppb) for each country from 2001 to 2008. Similar to Disdier and Marette (2010) we assume that
all EU15 members applied the same cloramphenicol analytical standard for each year from 2001
to 2008. And the variable is defined as MRLs in parts per million (ppm)
applied by each importing country from 2001 to 2008. We control for tetracycline (oxy) because
this antibiotic is commonly used in crustaceans aquaculture. Unlike chloramphenicol, ADIs and
MRLs for tetracycline (oxy) are established by the CAC and the importing countries. Each
importing country in the study sample does not change MRLs of oxytetracycline during our
study period (2001-2008); however, different importing countries impose different tetracycline
(oxy) standards for seafood.
Data for , , are extracted from the CEPII database.
Cloramphenicol standards come from Disdier and Marette (2010), Debaere (2005), the European
Commision Decision 2002/657/EC, and the violation records posted on website of food safety
inspection authorities of importing countries (e.g., Japanese Ministry of Health, Labor and
Welfare). Oxytetracycline standards are from Chen, Yang, and Findlay (2008).
I also define the following variables: seven product dummies which take value 1 if
product is frozen rock lobster and other sea crawfish; frozen lobsters; frozen shrimps and
prawns, and so on). Top30 is the world top 30 crustacean exporters (crustaceans aggregation)
during 2001 to 2008 according to UNCOMTRADE data. Six dummies representing individual
96
top world crustacean exporting country in Asia, namely China, India, Indonesia, Malaysia,
Thailand, and Vietnam, are defined in a similar fashion. All six countries are considered
developing countries according to the World Bank’s development status classification. However,
Malaysia and Thailand have higher income levels and better seafood supply chain organizations
compared to the other countries. With the exception of Malaysia, crustacean products exported
from China, India, Indonesia, Thailand, and Vietnam are subject to high scrutiny by importing
markets (e.g., see Debarer 2005; Ababouch, Gandini, and Ryder 2005).
To understand the impact of advancing cloramphenicol analytical standards on different
crustacean products, different scale of crustacean exporters, and different top crustacean
exporters with different income status, the gravity equation (2) is modified by including
appropriate interactions of CAP and the dummy variables of interest described above.
The gravity trade models represented by equations (1) and (2) are traditionally estimated
using ordinary least squares (OLS) with only positive trade values included. However, it has
recently been recognized that the conventional OLS estimation can bias the results of estimation
because of two econometric problems, including heteroskedasticity of error terms and dropping
zero values of bilateral trade. For controlling heterogeneity, Cheng and Wall (2005) propose to
use the panel fixed effect estimation. This approach does not address the second problem, zero
trade issue of the left hand side variable in the gravity model. According to Burger, van Oort, and
Linders (2009) and Jayasinghe, Beghin, and Moschini (2010), different alternatives have been
suggested to deal with the zero trade problem including: (i) keep observations with zero bilateral
trade in the sample and add a small positive number (e.g., 0.01 to 1) to all trade flows so that the
logarithm is definable; (ii) estimate the gravity trade model using the Tobit approach; (iii)
estimate the model with the Poisson Pseudo maximum likelihood (PPML) recommended by

97
Silva and Tenreyro (2006); and (iv) apply the sample selection approach developed by Heckman
(1979) to the model estimation.
In this paper I address the heteroskedasticity issue with the panel fixed effects approach
and take into account the zero-trade issue using the Heckman maximum likelihood estimation. I
opt for the Heckman framework to address the zero trade issue over the other alternatives
because it better fits the data set under investigation. Adding a small number to all trade flows to
address the zero trade issue is inadequate because it lacks both theoretical and empirical
justification (Linders and de Groot 2006). The PPML approach includes zero trade observations
and estimate the gravity equation (1) and (2) in levels as count data, following a Poisson
regression even when the dependent variables are not integers (Santos Silva and Tenreyro 2006).
The problem is that the PPML estimation treats all zero equally, rather than missing observations
(Jayasinghe, Beghin, and Moschini 2010). In addition, according to Martin and Pham (2008) the
PPML approach can be problematic, resulting in biased estimates when a large number of zero
observations is present in the data set (about 83% of observations in my data set are zero).
Dropping zero trade observations from the gravity equation will make the sample
nonrandom and bias the estimation results because error terms in equation (2) are correlated with
explanatory variables. The Heckman approach to deal with the zero trade issue consists of two
equations. The first equation (the selection equation) is estimated through a probit model,
examining the binary likelihood whether bilateral trade occurs (positive trade is observed) or not
(zero trade is observed). The second equation (the outcome equation) is estimated through the
OLS regression as equation (2) with the expected value of the error (called the inverse of the
Mill’s ratio) is included as an extra explanatory variable. The key feature of the Heckman sample
98
selection model is that the error terms in the outcome equation are correlated with the error terms
in the selection equation.
According to Cameron and Trivedi (2010), two equations in the Heckman selection
model can be estimated simultaneously using the maximum likelihood estimation (MLE) or
estimated successively with the Heckman two-step estimation. For the current paper, the MLE
procedure is preferred because it allows controlling for heteroskedasticity and country pair
correlations via a country pair clustering. In the Heckman model, the same independent variables
in the selection equation commonly appear in the outcome equation. However for more robust
identification and avoiding multicolinearity, at least one independent variable that appears in the
selection equation should not be included in the outcome equation (Helpman, Melitz and
Rubinstein 2008). Ideally, this excluded variable affects the selection but not the outcome
equation. Following Disdier and Marette (2010) I use the dummy variable as the
excluded variable (that only appears in the selection equation).
Results and Discussions
As described above, the main objective of this study is to evaluate the impact of
cloramphenicol analytical standards on crustacean imports in Canada, the EU15, Japan, and the
United States using the Heckman selection estimation. The following four Heckman models are
empirically estimated: the Heckman model 1 estimates equation (2) using common language as
the excluded variable (only appearing in the selection equation); the Heckman model 2 adds
interactions of cloramphenicol standards (CAP)1 and 7 product dummies to the Heckman model
1; the Heckman model 3 specifies the interaction of CAP and the top 30 world crustacean
exporters’ dummy to the Heckman model 1; and finally the Heckman model 4 is defined by 1 For simplicity from this section all subscripts are removed when referring to study variables.
99
adding interactions of six dummies representing six top world crustacean exporters in Asia and
the CAP variable to the Heckman model 1.
Direct comparison between Disdier and Marette’s model (2010) and the models
estimated in this paper is impossible because the dependent variable is different (Disdier and
Marette’s dependent variable is crustacean imports aggregated at 4 digit level). However for
comparison purposes, I also estimate the OLS gravity model of Anderson and van Wincoop with
all zero trade values dropped and the Heckman model of Disdier and Marette (2010). Results of
the OLS, Disdier and Marette’s model, and the Heckman 1 models are reported in Table 1. First
of all, results of the OLS estimation (Column 1 of Table 1) are in line with the gravity literature.
The bilateral distance statistically and negatively affect crustacean imports, and dummy variables
representing common border, North America Free Trade Agreement (NAFTA) have positive
impacts on bilateral trade. Variables for colonial tie, European Union 15 membership, and
common language do not have significant impacts on crustacean imports. However the results of
the OLS estimation are biased and inconsistent because all zero trade observations are dropped.
Column 2-3 and 4-5 of Table 1 present coefficients of the outcome equation and the
selection equation of Disdier and Marette (2010)’s model and the Heckman 1 model
respectively. Correlation coefficient (ρ) between random errors of the outcome and selection
equation is statistically significant, suggesting that selection bias must be corrected. Unlike
coefficients of the OLS regression, coefficients of the Heckman model cannot be interpreted as
the marginal impact of independent variables on the dependent variable. For this reason,

100
marginal effects2 of Disdier and Marette’s model and the Heckman model 1 are reported in Table
2 together with coefficients of the OLS.
Similar to Disdier and Marette (2010), my results in Table 2 show that increasing the
cloramphenicol analytical standard (lowering detection limits) has negatively affected crustacean
import flows. Conditional on positive trade values being observed, lowering one unit of
cloramphenicol analytical standards (1 ppb) results in a decrease of 3.6%, 3.0%, and 3.4% in
bilateral crustacean imports in Canada, EU15 members, Japan, and the United States as predicted
by the OLS model, Disdier and Marette’s model, and the Heckman 1 model, respectively3. This
effect is smaller than that predicted by Disdier and Marette (2010) with one unit decrease in CAP
brings a 13 % reduction of crustacean imports.
In contrast to Disdier and Marette (2010), estimated results in Table 2 show that
cloramphenicol standard regulations also affects the probability to import crustaceans. For
instance, the Heckman 1 model predicts that the probability to import crustaceans drop 0.002 or
0.2 percent point if CAP standard is lowered one unit (1 ppb). This result is similar to the finding
of Jayasinghe, Beghin, and Moschini (2010) that the sanitary and phytosanitary (SPS) variable
statistically has a significant impact on both the value and probability of trade. Combining both
the impact of CAP on the extensive margin (probability) and the intensive margin (value) of
trade, my results imply that stricter cloramphenicol standards can displace exporters from
developed markets; however, once they are able to export, the negative impacts on the volume of
trade are lesser than that predicted by Disdier and Marette (2010).
2 Average marginal effects are reported. These are computed by averaging marginal effect of individual
observations. 3 Since CAP and oxytetracycline are in level form and the dependent variable in the log form, coefficients
in the OLS model and marginal effects in the Heckman model are semi-elasticity.

101
Countries sharing common border have a tendency to increase bilateral crustacean
imports. Compared to Disdier and Marette (2010), the impact of the common border variable on
import flows is doubled, changing from 84% increase found in Disdier and Marette (2010) to
191% increase in import flows as predicted by the Heckman model 1. On the other hand, the
impact of bilateral distance and colonial tie on import flows is lowered than that found in Disdier
and Marette (2010). One percent increase in the bilateral distance associates with a decrease of
0.28% of import flows (Column 5) in contrast to 1.19 % decrease of crustacean import volume as
found by Disdier and Marette (2010).
Additional variables to Disdier and Marette (2010), oxytetracycline standards, the EU15
dummy, and the NAFTA dummy also have significant influences on crustacean import flows.
Lowering one unit (1ppm) of oxytetracycline residue limit would cause import flows to drop
170%. CAP has a stronger negative impact on crustacean imports than oxytetracycline since 1
ppb decrease of oxytetracycline only reduces 0.17% of imports. As presented in Table 2, the
EU15 and NAFTA dummy variables have positive impacts on import flows and the magnitude is
in line with the gravity trade literature findings.
For investigating how chloramphenicol analytical standards impact different crustacean
products, scale of crustacean exports, and countries with different income status, the Heckman
model 1 is appropriately augmented to generate the model 2, model 3, and model 4. Empirical
estimation results of these models are presented in Table 3. As shown in Table 3, the sign and
magnitude of control variables in the estimated models (distance, tetracycline (oxy), continuity,
colonial tie, regional EU15, NAFTA, and common language) are consistent and similar to
empirical results of the Heckman 1 model reported in Table 1.

102
As reported in Column 1 and 2 of Table 3, six interactions (one was automatically
omitted to avoid perfect multicolinearity) of cloramphenicol standards (CAP) and products both
have a significant impact on the quantity and probability of imports. These results suggest that
the CAP variable impacts differently on imported products under investigation. Marginal effects
of the CAP and oxytetracycline variables on the intensive and extensive margins of trade over
study products are computed and reported in Table 4. CAP and oxytetracycline standards have
the most negative and significant impact on frozen rock lobster and other sea crawfish (HS
30611), frozen shrimps and prawns (HS 030613), and non-frozen crabs frozen crabs (HS 30624)
regarding both importing value as well as importing likelihood. For example, conditional on
positive trade being observed, lowering 1 unit of CAP (1 ppb) approximately associates with a
decrease of 6.8%, 0.9%, and 2% of rock lobsters, shrimps and prawns, and non-frozen crabs
import flows, respectively. Cloramphenicol standards do not statistically have negative impacts
on import flows of frozen lobsters (HS 30612), frozen crabs (HS 30614), non-frozen rock
lobsters (030621).
These findings suggest several implications. First, stricter cloramphenicol analytical
standards have stronger negative impacts on shrimps and prawns (HS 30613), and crabs (HS
30624). These findings can be supported by the fact that a high portion of these products come
from aquaculture where cloramphenicol antibiotic might be misused by farmers. With regard to
rock lobster products (HS 30611), unlike shrimps and prawns, most of rock lobsters come from
capture fisheries. Non-frozen rock lobsters (HS 30621) are not negatively affected by increasing
stringency of cloramphenicol standards whereas its frozen counterpart (HS 30611) receives most
negative impacts. It is likely that frozen-rock lobsters might be contaminated with

103
cloramphenicol residue in post-harvesting (e.g., middle trading and processing) stages of rock
lobster supply chains.
Results of the Heckman model 3 (controlling for the interaction of top 30 world
crustacean exporters and cloramphenicol standards) reported in Column 3 and 4 of Table 3 show
that top 30 crustacean exporters experience a more negative impact of increasing stringency of
cloramphenicol analytical standards. Conditional on positive trade being observed, import flows
from top 30 world crustacean exporters decrease approximately 4% whereas import flows from
other country in the study sample only reduce 2.8% (Table 5) if cloramphenicol standards are
lowered one unit (1ppb). This trend of difference is also applied to the unconditional marginal
effect and marginal effect on the probability of having positive import flows.
In order to examine complex impacts of cloramphenicol standards on top exporters, I
include interactions of the CAP variable and six dummies representing China, India, Indonesia,
Malaysia, Thailand, and Vietnam. With the exception of Malaysia, crustacean imports from these
Asian countries are subject to greater control at border of importing countries because of higher
product contamination profiles (Debarer 2005; Ababouch, Gandini, and Ryder 2005; Disdier and
Marette 2010). Interestingly, as shown in Column 5 of Table 3, coefficients of the interactions of
China and CAP, and Indonesia and CAP are positive and statistically significant. These results
suggest that these two top exporting countries receive more negative impacts compared to other
countries in the study sample once cloramphenicol standards become more stringent. In contrast,
coefficients of Malaysia and Thailand interactions with the CAP variable are negative and
significant, implying that these countries receive less negative impacts when importing countries
lower their cloramphenicol analytical standards. The impact of the CAP variable on Indonesia
and Vietnam is not different from the impact on other partner countries under investigation.

104
Average marginal effects of the CAP variable on trade flows over these countries are
reported in Table 5. Conditional on positive trade being observed, China’s crustacean exports
would approximately reduce 6.2% while other countries only decrease 3.3% if cloramphenicol
standards are lowered one unit (1ppb). Similarly, with the same level of increasing stringent
cloramphenicol regulation, import flows from India drop 5% while other countries only drop
3.4%. In contrast to the experience of China and India, with higher income level and more
advanced human and technical capabilities, Malaysia and Thailand do not face any loss in
crustacean trade while other countries face a decrease of 3.4% of trade if CAP standards in
developed countries drop one unit (1 ppb). Since the interactions of the CAP variable and
Indonesia and Vietnam dummies are not statistically significant in the Heckman model 4
presented in Column 4 of Table 3, I do not compute marginal effects over these two countries.
Conclusions
For protecting consumers’ health, over the last two decade, developed countries have
imposed more stringent veterinary drug standards. For example, in 1990 the EU promulgated
Council Regulation 2377/90/EEC on establishing procedures for setting maximum residue limits
of veterinary medicinal products in foodstuffs. Other developed countries such as the U.S.,
Canada, and Japan have also taken similar efforts to tighten veterinary drug regulations. With
improvements in analytical technologies, developed countries are able to detect chemical
residues in food products at very low levels.
The findings from this study show that enhancing stringency of food safety standards as
importing countries chase zero detection limits of cloramphenicol residues has negative effects
on international crustacean trade. This is in line with the view that standards act as barriers to
international trade commonly found in the gravity trade literature.

105
Food safety standards imposed by developed countries dynamically affect import flows
of different crustacean products. The finding that shrimps and prawns received stronger negative
impacts implies that farmed products are sensitive to cloramphenicol standard stringency. In
intensive aquaculture farming systems producers might misuse chloramphenicol antibiotic to
treat disease or environmental problems for preventing crop failures. Drug residues in seafood
could expose consumers to health or drug resistant risks. By contrast, frozen rock lobster
products receiving more negative impacts resulting from increasing chloramphenicol regulation
stringency might point to other source of CAP contamination. Since the finding shows that non-
frozen rock lobsters are not negatively and statistically affected by enhancing CAP standards, it
is likely that these products are contaminated during post-harvest handling and processing steps.
Seafood exporters need to improve supply chain management to ensure that final products meet
developed countries’ market requirements.
From the empirical models, I find evidence that scale of export is also sensitive to
increasing standard stringency. Cloramphenicol analytical standards discipline top crustacean
exporting countries more than other countries. Top crustacean exporters may face more scrutiny
at border control and inspection, a point which is especially true for top Asian exporters (e.g.,
China, India, Indonesia, Thailand, and Vietnam) that frequently appear in the food safety
monitoring and rapid alert radar of importing countries. The empirical results call for further
examination on differential effects of food safety standards imposed by developed markets on
developing countries.
The results of this study add new understanding of the implementation and effects of food
safety standards by noting that food safety standards have dynamic impacts on international trade
from developing countries. Developing countries with higher income level and better seafood

106
industry organizations such as Malaysia and Thailand might be able to comply with stringent
standards to meet stringent market requirements and strengthen their competitive advantage and
place them in a better competitive position in international markets. Some developing countries
such as China and India in this study experience more trade loss when food safety standards
become stricter.
References
Ababouch, L., G. Gandini, and J. Ryder. 2005. Detentions and Rejections in International
FishTrade. Fisheries Technical Paper 473, UN Food and Agriculture Organization, Rome.
Aitken, N.D. 1973. The Effect of the EEC and EFTA on European Trade: A Temporal Cross-
Section Analysis. American Economic Review 63 (5):881-892.
Anders, S.M., and J. A. Caswell. 2009. Standards as Barriers versus Standards as Catalyst:
Assessing the Impact of HACCP Implementation on U.S. Seafood Imports. American
Journal of Agricultural Economics 91(2): 310-321
Anderson, J.E. 1979. A Theoretical Foundation for the Gravity Equation. American Economic
Review 69(1):106–16.
Anderson, J.E., and E. vanWincoop. 2003. Gravity with Gravitas: A Solution to the Border
Puzzle. American Economic Review 93(1):170–92.
Athukorala, P. and S. Jayasuriya. 2003. Food Safety Issues, Trade and WTO Rules: A
Developing Country Perspective. The World Economy 26(9): 1395-1416.
Baier, S.L., and J.H. Bergstrand. 2007. Do Free Trade Agreements Actually Increase Members’
International Trade? Journal of International Economics 71(1):72–95.
107
Bergstrand, J. H. 1989. The Generalized Gravity Equation: Monopolistic Competition and the
Factor-Proportions Theory in International Trade. Review of Economics and Statistics 71:
143–153.
Burger, M., F. van Oort, and G.-J. Linders. 2009. On the Specification of the Gravity Model of
Trade: Zeros, Excess Zeros and Zero-inflated Estimation. Spatial Economic Analysis 42:
167–190.
Cameron, A.C., and Pravin K. Trivedi, P.K. 2010. Microeconometrics Using Stata, Revised
Edition. College Station, Texas: Stata Press.
Chen, C., J. Yang, and C. Findlay. 2008. Measuring the Effect of Food Safety Standards on
China’s Agricultural Exports. Review of World Economics 144 (1): 83-106.
Cheng, I. and H. J.Wall. 2005. Controlling for Heterogeneity in Gravity Models of Trade and
Integration. Federal Reserve Bank of St. Louis Review 87(1): 49-63.
Deardorff, A. 1998. Does GravityWork in a Neoclassical World? In J. A. Frankel, ed. The
Regionalization of the World Economy. Chicago: University of Chicago Press, pp. 7– 32.
Deardorff, A.V. and R. M. Stern. 1998. Measurement of Nontariff Barriers (Studies in
International Economics). Ann Arbor: University of Michigan Press.
Debaere, P. 2005. Small Fish–Big Issues: The Effect of Trade Policy on the Global Shrimp
Market. Discussion paper 5254, Centre for Economic Policy Research, London.
Degroodt et al. 1992. Chloramphenicol and Nitrofuran Residue Analysis by HPLC and
Photodiode Array Detection in Meat and Fish. Journal of Liquid Chromatography 15(3):
2355-2371.

108
Disdier, A.-C., and S. Marette. 2010. The Combination of Gravity and Welfare Approaches for
Evaluating Nontariff Measures. American Journal of Agricultural Economics 92(3): 713–
726.
Disdier, A.-C., L. Fontagné, and M. Mimouni. 2008. The Impact of Regulations on Agricultural
Trade: Evidence from SPS and TBT Agreements. American Journal of Agricultural
Economics 90 (2): 336–350.
Feenstra, R.C. 2004. Advanced International Trade: Theory and Evidence. Princeton: Princeton
University Press.
Food and Agriculture Organization of the United Nations (FAO) and World Health Organization
(WHO). 2004. “Joint FAO/WHO Technical Workshop on Residues of Veterinary Drugs
without ADI/MRL.” Retrieved September 16, 2010.
(ftp://ftp.fao.org/docrep/fao/008/y5723e/y5723e00.pdf)
GESAMP (Joint Group of Experts on the Scientific Aspects of Marine Environmental
Protection). 1997. Towards Safe and Effective Use of Chemicals in Coastal Aquaculture.
Reports and Studies No. 65. Rome: FAO. 40p.
Heckman,J. J. 1979. Sample Selection Bias as a Specification Error. Econometrica 47:153– 161.
Helpman, E., M. Melitz, and Y. Rubinstein. 2008. Estimating Trade Flows: Trading Partners and
Trading Volumes. Quarterly Journal of Economics 123 (2): 441–487.
Henson, S. and S. Jaffee. 2008. Understanding Developing Country Strategic Responses to the
Enhancement of Food Safety Standards. The World Economy 31(4): 548-568.
Henson, S., and J.A. Caswell.1999. Food Safety Regulation: An Overview of Contemporary
Issues. Food Policy 24: 589-603.

109
Jaffee, S. and S. J. Henson. 2004. Standards and Agro-Food Exports from Developing Countries:
Rebalancing the Debate. Working paper, the World Bank.
Jayasinghe, S., J. Beghin, and G. Moschini. 2010. Determinants of World Demand for U.S. Corn
Seeds:The Role of Trade Costs. American Journal of Agricultural of Economics 92 (4):
999–1010.
Jonker, T. H., H. Ito, and H. Fujishima. 2005. Food Safety and Quality Standards in Japan:
Compliance of Suppliers from Developing Countries. Agriculture and Rural Development
Discussion Paper, the World Bank.
Linders, G.J.M. and H.F.L. de Groot. 2006. Estimation of the gravity Equation in the Presence of
Zero Flows, Tinbergen Institute Discussion Paper, 2006-072/3.
Linnemann, H. 1966. An Econometric Study of International Trade Flows. Amsterdam: North
Holland.
Martin,W., and C. Pham. 2008. Estimating the Gravity Model when Zero Trade Flows Are
Frequent. Working paper, the World Bank.
Maskus, K. and J. Wilson, eds. 2001. Quantifying the Impact of Technical Barriers to Trade: Can
It Be Done? Ann Arbor: University of Michigan Press.
Moenius, J. 2006. The Good, the Bad, and the Ambiguous: Standards and Trade in Agricultural
Products. Working Paper, University of Redlands.
Neuhaus, Hurlbut, and Hammack. 2002. LC/MS/MS Analysis of Chloramphenicol in Shrimp.
Laboratory Information Bulletin (LIB) No.4290, the Food and Drug Administration (FDA).
Otsuki, T., J.S. Wilson, and M. Sewadeh. 2001. What Price Precaution? European
Harmonization of Aflatoxin Regulations and Aflatoxin Regulations and African
Groundnuts Exports. European Review of Agricultural Economics 28(3): 263-283.

110
Silva, J. M. C., and S. Tenreyro. 2006. The Log of Gravity. Review of Economics and Statistics
88 (4): 641–658.
Tinbergen, J. 1962. “Shaping the World Economy: Suggestions for an International Economic
Policy”. New York: The Twentieth Century Fund.
Weston, D.P. 1996. Environmental Considerations in the Use of Antibacterial Drugs in
Aquaculture, pp. 140-65. In D.J. Baird et al., eds.. Aquaculture and Water Resource
Management. Oxford: Blackwell.
Wilson, J. S. and T. Otsuki. 2003. Food Safety and Trade: Winners and Losers in a Non-
Harmonized World. Journal of Economic Integration 18(2): 266-287.
Wilson, J.S., T. Otsuki, and B. Majumdar. 2003. Balancing Food Safety and Risk: Do Drug
Residue Limits Affect International Trade in Beef? Working paper, the World Bank.
Wilson, N. L. W. 2003. Clarifying the Alphabet Soup of the TBT and the SPS of the WTO.
Drake Journal of Agricultural Law 8(3): 703-723.
Wolrd Heath Organization (WHO). 2003. Evaluation of Certain Veterinary Drug Residues in
Food. WHO Technical Report Series 925. Geneva: Wolrd Heath Organization.

111
Table 1: Results of the OLS, Disdier and Marette (2010), and Heckman 1 models
Variables OLS model (1)
Disdier and Marette model Heckman model 1 Lntrade
(2) Selection
(3) Lntrade
(4) Selection
(5) Lndist -0.393*** -0.641*** -0.681*** -0.577*** -0.530***
(0.105) (0.110) (0.032) (0.109) (0.037) CAP 0.036*** 0.038*** 0.013*** 0.042*** 0.014***
(0.005) (0.005) (0.002) (0.005) (0.002) oxytetracycline 1.717*** 2.060*** 0.642***
(0.201) (0.212) (0.063) Contig 1.270*** 1.536*** 0.581*** 1.408*** 0.628***
(0.248) (0.248) (0.125) (0.253) (0.119) Colony 0.283 0.407* 0.209*** 0.553*** 0.334***
(0.223) (0.208) (0.080) (0.208) (0.076) eu15 0.228 0.689** 0.830***
(0.316) (0.335) (0.098) Nafta 1.702*** 1.603*** 0.855**
(0.485) (0.508) (0.487) Comlang 0.115 0.062*** 0.155***
(0.202) (3.350) (0.060)
Rho 0.322*** 0.324*** Lambda 0.707*** 0.698*** Number of obs 20321 116725 116725 Log pseudolikelihood -74223.93 -73257.4 Wald test of(rho = 0): chi2(1) 50.76*** 63.75***
***, **, and *: significant at 1%, 5%, and 10% respectively; numbers in parentheses are White’s standard errors.

112
Table 2: OLS Parameter Estimates and Marginal Effects of the Disdier and Marette (2010), and Heckman 1 Models
OLS model
(1)
_______Disdier and Marette (2010) model___ ____________Heckman 1
model_____________ On intensive margin of
trade On probability of trade (4)
On intensive margin of trade On probability of trade (7)
Conditional (2)
Unconditional (3)
Conditional (5)
Unconditional (6)
lndist -
0.393*** -0.256*** -0.405*** -0.097*** -0.281*** -0.322*** -0.074*** (0.105) (0.089) (0.026) (0.004) (0.101) (0.030) (0.005)
CAP 0.036*** 0.030*** 0.012*** 0.002*** 0.034*** 0.013*** 0.002*** (0.005) (0.004) (0.001) (0.000) (0.004) (0.001) (0.000)
oxytetracycline 1.717*** 1.701*** 0.628*** 0.089*** (0.201) (0.192) (0.054) (0.009)
contig 1.270*** 1.220*** 0.669*** 0.097*** 1.071*** 0.654*** 0.104*** (0.248) (0.228) (0.138) (0.024) (0.233) (0.132) (0.023)
colony 0.283 0.290 0.174** 0.031** 0.370** 0.263*** 0.051*** (0.223) (0.186) (0.072) (0.013) (0.188) (0.074) (0.013)
eu15 0.228 0.243 0.563*** 0.144*** (0.316) (0.296) (0.126) (0.020)
nafta 1.702*** 1.154*** 0.876* 0.149 (0.485) (0.377) (0.479) (0.101)
comlang 0.115 0.031*** 0.022** (0.202) (0.010) (0.009)
***, **, and *: significant at 1%, 5%, and 10% respectively; numbers in parentheses are White’s standard errors.

113
Table 3: Results of the Models Controlling for Product Groups, Top Crustacean Exporting Group, and Top Exporters in Asia
Variables Model 2: contro for products Model 3: control for top
exporters Model 4: control for top Asian
exporters Lntrade
(1) Selection
(2) Lntrade
(3) Selection
(4) Lntrade
(5) Selection
(6) lndist -0.605*** -0.536*** -0.569*** -0.526*** -0.563*** -0.525***
(0.109) (0.038) (0.109) (0.038) (0.111) (0.038) CAP 0.079*** 0.020*** 0.035*** 0.011*** 0.041*** 0.013***
(0.008) (0.003) (0.007) (0.002) (0.006) (0.002) oxytetracycline 2.125*** 0.648*** 2.062*** 0.643*** 2.055*** 0.641***
(0.214) (0.064) (0.212) (0.063) (0.212) (0.063) contig 1.382*** 0.621*** 1.411*** 0.630*** 1.417*** 0.634***
(0.252) (0.119) (0.253) (0.119) (0.253) (0.119) colony 0.583*** 0.334*** 0.574*** 0.343*** 0.551*** 0.336***
(0.208) (0.076) (0.209) (0.076) (0.208) (0.077) eu15 0.772** 0.836*** 0.716** 0.846*** 0.698** 0.833***
(0.331) (0.098) (0.334) (0.098) (0.335) (0.098) nafta 1.575*** 0.851* 1.648*** 0.872* 1.616*** 0.857*
(0.512) (0.488) (0.508) (0.487) (0.507) (0.486) comlang - 0.159*** 0.152* 0.153**
(0.060) (0.060) (0.060) Product 30612*CAP -0.072*** -0.010***
(0.011) (0.004) Product 30613*CAP -0.065*** -0.009***
(0.008) (0.003) Product 30614*CAP -0.073*** -0.013***
(0.009) (0.003) Product 30621*CAP -0.085*** -0.014***
(0.009) (0.004)

114
Product 30623*CAP -0.068*** -0.015*** (0.010) (0.004)
Product 30624*CAP -0.060*** -0.022*** (0.010) (0.003)
Top30*CAP 0.014* 0.006** (0.008) (0.003)
China*CAP 0.028** 0.002 (0.012) (0.004)
India*CAP 0.016*** 0.004 (0.006) (0.003)
Indonesia*CAP 0.008 0.025*** (0.008) (0.003)
Malaysia*CAP -0.025*** -0.006** (0.009) (0.003) Thailand*CAP -0.020* 0.006
(0.012) (0.004) Vietnam*CAP 0.009 0.006
(0.008) (0.004) rho 0.327*** 0.324*** 0.320*** lambda 0.703 0.699 0.688 Number of obs 116725 116725 116725 Log pseudolikelihood -73138.2 -73235 -73228.5*** Wald test of(rho = 0): chi2(1) 66.25*** 63.9*** 62.5***
***, **, and *: significant at 1%, 5%, and 10% respectively; numbers in parentheses are White’s standard errors; Product 30611: frozen rock lobster and other sea crawfish; 30612: frozen lobsters; 30613: frozen shrimps and prawns; 30614: frozen crabs; 30621: non-frozen rock lobster and other sea crawfish; 30623: non-frozen shrimps and prawns; and 30624: non-frozen crabs.

115
Table 4: Marginal effects of RPL and MRLon the intensive and extensive margins of trade control for products
RPL MRL On volume of trade On
probability of trade
(3)
On volume of trade On probability
of trade (6) Products
Conditional (1)
Unconditional (2)
Conditional (4)
Unconditional (5)
30611 0.068*** 0.025*** 0.003*** 1.756*** 0.735*** 0.107*** (0.007) (0.003) (0.000) (0.193) (0.067) (0.010)
30612 0.001 0.003*** 0.001*** 1.738*** 0.402*** 0.066*** (0.009) (0.001) (0.000) (0.192) (0.038) (0.007)
30613 0.009* 0.011*** 0.002*** 1.782*** 0.977*** 0.102*** (0.005) (0.001) (0.000) (0.194) (0.083) (0.010)
30614 0.003 0.003*** 0.001*** 1.756*** 0.588*** 0.086*** (0.006) (0.001) (0.000) (0.193) (0.052) (0.009)
30621 -0.009 0.001 0.001** 1.735*** 0.351*** 0.062*** (0.006) (0.001) (0.000) (0.192) (0.032) (0.006)
30623 0.008 0.004** 0.001 1.784*** 0.747*** 0.111*** (0.007) (0.002) (0.000) (0.194) (0.066) (0.011)
30624 0.020*** 0.002* 0.000 1.744*** 0.397*** 0.077*** (0.007) (0.001) (0.000) (0.193) (0.038) (0.008)
***, **, and *: significant at 1%, 5%, and 10% respectively; numbers in parentheses are White’s standard errors; Product 30611: frozen rock lobster and other sea crawfish; 30612: frozen lobsters; 30613: frozen shrimps and prawns; 30614: frozen crabs; 30621: non-frozen rock lobster and other sea crawfish; 30623: non-frozen shrimps and prawns; and 30624: non-frozen crabs.

116
Table 5: Average marginal effects of RPL on dummy variables representing top crustacean exporters and top exporters in Asia
On Value of Trade On probability of trade
(3) Dummy variable Dummy values Conditional (1)
Unconditional (2)
Top30 exporters 0 0.028*** 0.008*** 0.001*** (0.006) (0.001) (0.000)
1 0.040*** 0.028*** 0.003*** (0.006) (0.003) (0.001)
China 0 0.033*** 0.013*** (0.005) (0.002)
1 0.062*** 0.037*** (0.011) (0.005)
India 0 0.034*** 0.013*** (0.005) (0.002)
1 0.050*** 0.033*** (0.005) (0.003)
Indonesia 0 0.002*** (0.000)
1 0.007*** (0.001)
Malaysia 0 0.034*** 0.013*** 0.002*** (0.005) (0.002) (0.000)
1 0.013 0.007** 0.001** (0.009) (0.003) (0.000)
Thailand 0 0.034*** 0.013*** (0.005) (0.002)
1 0.012 0.018*** (0.011) (0.005)
Vietnam 0
1
***, **, and *: significant at 1%, 5%, and 10% respectively; numbers in parentheses are White’s standard errors; average marginal effects are not computed for the interacted variables that are not statistically significant in the Heckman model 4.

117
CONCLUSIONS AND POLICY IMPLICATIONS
Conclusions
The three essays of this dissertation examine market and non-market factors affecting
international seafood trade. The essays are connected by the theme of international seafood trade.
The first essay sets a broad background to understand complex and potential impacts of food
safety standards on exporting countries. The second essay explores zero-accounting econometric
approaches for quantifying the impact of food safety standards on international seafood trade
(hypothesizing that standards act as barriers to trade). Taking into account the findings of the
first and second essay, the third essay examines the complex impacts of chloramphenicol
analytical standards on international crustacean imports in developed markets (Canada, EU,
Japan, and the U.S.) by applying the Heckman selection model.
Using the Vietnamese shrimp farming industry as a typical case representing developing
countries, the first essay of the dissertation shows how various stakeholders respond to seafood
standards imposed by developed markets. The finding in the first essay demonstrates that stricter
and dynamic food safety and environmental standards developed and imposed by public and
private actors in developed countries increase coordinating power of leading actors and
transform Vietnamese shrimp farming industry into global value chains, driven by large
retailers/buyers in the global North. Food safety and environmental standards imposed by the
North as well as socio-cultural and natural environmental resource conditions affect and
118
constrain the capability of exporting countries in organizing and transforming supply chains to
meet more stringent market requirements.
Applying alternative zero-accounting gravity econometric models, the second essay tests
the hypothesis that food safety standards act as barriers to international seafood trade and
assesses the choice of alternative gravity model specifications to account for zero trade flows.
The empirical estimation results confirm this hypothesis and are robust to the OLS as well as
alternative zero-accounting gravity models (the Heckman maximum likelihood (ML) procedure
and the Poisson family regressions). Increasing the stringency of regulations by reducing
analytical limits or maximum residue limits in seafood in developed countries has negative
impacts on their bilateral seafood imports. For the choice of the best model specification to
account for zero trade and heteroskedastic issues, the second essay provides inconclusive
evidence to base on formal statistical tests. However based on the magnitude of estimated
coefficients, its economic implication, and the literature finding, the Heckman ML estimation
provides the most reliable parameter estimates.
Using the Heckman ML specification in the gravity econometric model, the third essay
finds that enhancing stringency of cloramphenicol analytical standards has negative effects on
international crustacean imports in developed countries (Canada, EU, Japan, and the U.S.),
decreasing the value and probability of their crustacean imports. Impacts of food safety standards
on trade are complex with regard to scale of crustacean exports, crustacean products exported,
and income level of developing country. Frozen shrimps and rock lobster products are sensitive
to increasing standard stringency (decreasing chloramphenicol analytical limits), and top
crustacean exporters are disciplined more than smaller exporters. Developing countries with

119
higher income levels receive less negative impacts of enhancing food safety standards than
developing countries with lower income levels.
Policy Implications
With reductions of tariffs and quotas resulting from WTO agreements, non-tariff
measures such as food safety and environmental standards have become hot issues in
international seafood trade debates. Findings of the first essay suggest that in order to comply
with more stringent market requirements initiated by public and private actors in the global
North, actors in the seafood industry of Vietnam will have to transform the seafood industry into
global value chains that are responsive to by large and powerful actors in the global North.
Consequently, small scale actors (e.g., producers, processors) who have limited financial and
technical capabilities will be marginalized and seafood production and trade will concentrate into
relatively few hands. Hence while imposing more stringent food safety and environmental
standards might reduce food safety hazards and enhance environmental sustainability, it may
result in negative social consequences (e.g., displacing small producers and enterprises from
markets) for seafood exporting countries (especially poor developing countries) in the global
South.
Investigating the impact of food safety standards on seafood trade aggregated at the
country level with the gravity econometric approach, findings of the second and third essays
confirm that food safety standards act as barriers to international seafood trade. Enhancing food
safety standards (lowering analytical limits or maximum residual limits) is associated with
reducing the value and probability of bilateral seafood trade. The economic implication is that
these effects, caused by increasing transaction costs due to stricter food safety enforcement, will
shift seafood the supply curve backward.

120
How food safety standards impact economic welfare will depend on the slope (elasticity)
of seafood supply and demand curve. For instance, Disdier and Marette (2010) find that
enhancing chloramphenicol analytical standards has a negative impact on crustacean imports,
which they claim results in both increased domestic and international welfare. While combining
the gravity and welfare approaches for evaluating food safety standards is interesting and an
important first step in this area, the finding of Disdier and Marette (2010) is flawed since
chloramphenicol regulations imposed by developed country markets are based on analytical
technology improvements and do not rely on findings of scientific risk assessment methods.
Further research should be conducted to evaluate the trade and welfare impacts of non-tariff
measures such as food safety standards.
Food safety standards act as barriers to trade, however findings of the dissertation also
suggest that the impact of standards on trade is complex that might change from product to
product as well as from country to country with different development status and industry
organization levels. Developing countries with higher income levels can respond better to stricter
food safety standards enforced by public and private actors in the global North. Capacity
building and trade facilitation support should be mobilized to support poor developing countries
while stringent food safety standards are putting into enforcement.
References
Disdier, A.-C., and S. Marette. 2010. The Combination of Gravity and Welfare Approaches for
Evaluating Nontariff Measures. American Journal of Agricultural Economics 92(3): 713–
726.