Three Essays on Hypertension Prevention and Medical ... Abstract This dissertation addresses two...
104
This document and trademark(s) contained herein are protected by law as indicated in a notice appearing later in this work. This electronic representation of RAND intellectual property is provided for non-commercial use only. Unauthorized posting of RAND PDFs to a non-RAND Web site is prohibited. RAND PDFs are protected under copyright law. Permission is required from RAND to reproduce, or reuse in another form, any of our research documents for commercial use. For information on reprint and linking permissions, please see RAND Permissions. Limited Electronic Distribution Rights This PDF document was made available from www.rand.org as a public service of the RAND Corporation. 6 Jump down to document THE ARTS CHILD POLICY CIVIL JUSTICE EDUCATION ENERGY AND ENVIRONMENT HEALTH AND HEALTH CARE INTERNATIONAL AFFAIRS NATIONAL SECURITY POPULATION AND AGING PUBLIC SAFETY SCIENCE AND TECHNOLOGY SUBSTANCE ABUSE TERRORISM AND HOMELAND SECURITY TRANSPORTATION AND INFRASTRUCTURE WORKFORCE AND WORKPLACE The RAND Corporation is a nonprofit research organization providing objective analysis and effective solutions that address the challenges facing the public and private sectors around the world. Visit RAND at www.rand.org Explore Pardee RAND Graduate School View document details For More Information Browse Books & Publications Make a charitable contribution Support RAND
Transcript of Three Essays on Hypertension Prevention and Medical ... Abstract This dissertation addresses two...

This document and trademark(s) contained herein are protected by law as indicated in a notice appearing later in this work. This electronic representation of RAND intellectual property is provided for non-commercial use only. Unauthorized posting of RAND PDFs to a non-RAND Web site is prohibited. RAND PDFs are protected under copyright law. Permission is required from RAND to reproduce, or reuse in another form, any of our research documents for commercial use. For information on reprint and linking permissions, please see RAND Permissions.
Limited Electronic Distribution Rights
This PDF document was made available from www.rand.org as a public
service of the RAND Corporation.
6Jump down to document
THE ARTS
CHILD POLICY
CIVIL JUSTICE
EDUCATION
ENERGY AND ENVIRONMENT
HEALTH AND HEALTH CARE
INTERNATIONAL AFFAIRS
NATIONAL SECURITY
POPULATION AND AGING
PUBLIC SAFETY
SCIENCE AND TECHNOLOGY
SUBSTANCE ABUSE
TERRORISM AND HOMELAND SECURITY
TRANSPORTATION ANDINFRASTRUCTURE
WORKFORCE AND WORKPLACE
The RAND Corporation is a nonprofit research organization providing objective analysis and effective solutions that address the challenges facing the public and private sectors around the world.
Visit RAND at www.rand.org
Explore Pardee RAND Graduate School
View document details
For More Information
Browse Books & Publications
Make a charitable contribution
Support RAND

This product is part of the Pardee RAND Graduate School (PRGS) dissertation series.
PRGS dissertations are produced by graduate fellows of the Pardee RAND Graduate
School, the world’s leading producer of Ph.D.’s in policy analysis. The dissertation has
been supervised, reviewed, and approved by the graduate fellow’s faculty committee.

PARDEE RAND GRADUATE SCHOOL
Three Essays on Hypertension Prevention and Medical Product Safety in China and the United States
Ying Liu
This document was submitted as a dissertation in December 2009 in partial fulfillment of the requirements of the doctoral degree in public policy analysis at the Pardee RAND Graduate School. The faculty committee that supervised and approved the dissertation consisted of Steve Garber (Chair), John Graham, and Wei Zhang.

The RAND Corporation is a nonprofit research organization providing objective analysis and effective solutions that address the challenges facing the public and private sectors around the world. RAND’s publications do not necessarily reflect the opinions of its research clients and sponsors.
R® is a registered trademark.
All rights reserved. No part of this book may be reproduced in any form by any electronic or mechanical means (including photocopying, recording, or information storage and retrieval) without permission in writing from RAND.
Published 2010 by the RAND Corporation1776 Main Street, P.O. Box 2138, Santa Monica, CA 90407-2138
1200 South Hayes Street, Arlington, VA 22202-50504570 Fifth Avenue, Suite 600, Pittsburgh, PA 15213-2665
RAND URL: http://www.rand.orgTo order RAND documents or to obtain additional information, contact
Distribution Services: Telephone: (310) 451-7002; Fax: (310) 451-6915; Email: [email protected]
The Pardee RAND Graduate School dissertation series reproduces dissertations that have been approved by the student’s dissertation committee.

iii
Abstract This dissertation addresses two important public health problems, namely hypertension
prevention and medical product safety in China and the United States. The first essay
employs PoPMoD, a life-table based disease model to analyze the long-term costs
and effectiveness of eight selected hypertension prevention interventions in China. The
results show that selected population-based interventions are more cost-effective
than individual-based pharmaceutical therapies. In particular, a nationwide use of low-sodium
salt substitute mandate could potentially avert 9.4 million disability-adjusted life years
(DALYs) per year, resulting in an annual net savings of $3.9 billion in health expenditures.
The second essay explores the costs of medical product safety litigation in the U.S. –and thus
incentives to invest in product safety - by modeling and estimating changes in the market
values of pharmaceutical firms involved in ongoing medical mass torts. We model investors’
beliefs in terms of subjective probabilities and use Bayes Rule to formalize how beliefs are
updated as new information becomes available. The model predicts that on average the
market would respond negatively to plaintiff verdicts and positively to defendant verdicts.
The model also generates six testable hypotheses regarding the relationship between the size
of the market reaction and factors such as the number of earlier plaintiff (defendant) verdicts
and the size of the damage award when there is an award. Our regression analysis of nine
medical mass torts generates results that are largely consistent with our model predictions.
The third essay reviews recent changes and remaining problems in China’s drug safety
regulation since the occurrence of several high-profile, deadly incidents during 2006-2008.
While the government has made significant progress in upgrading its regulations, several
important market incentive problems remain to be tackled. Among other things, substantial
industry consolidation should be encouraged to close the gap between the government’s
regulation capacity and the enforcement workload; pharmaceutical market incentives need to
be transformed to shift the emphasis from competing on costs to competing on safety and
effectiveness; a strong product liability system, which is embryonic but gaining increasing
attention of policymakers’, could provide stronger private incentives not to engage in
substandard pharmaceutical production and selling.


v
Table of Contents
List of Figures………………………………………………………………………………...vi
List of Tables…………………………………………………………………………………vii
Acknowledgements………………………………………………………………………….viii
Essay 1: Cost-Effectiveness of Individual- and Population-based Strategies to Reduce
Systolic Blood Pressure in China………..…………………………………...01
Essay 2: Confronting Heterogeneity in Litigation Event Studies—the Case of Trial
Verdicts in Medical Products Mass Torts…………........................................38
Essay 3: Combating Unsafe Drugs: China’s Progress and Problems………….............68

vi
List of Figures
Figure 1.1: Four-State PoPMoD Population Model
Figure 1.2: CVD Disease Model
Figure 1.3: Expansion Path of Hypertension Prevention Interventions
Figure 1.4: Impact of CVD Treatment Costs on Cost-Effectiveness Results
Figure 1.5: Expansion Path of Interventions when Smoking Reduction Benefit of
Community CVD Education Included
Figure 2.1: Predicted Change in as Number of Verdicts Increases
Figure 3.1: Total Pharmaceutical Output in China
Figure 3.2: Number of Drug Applications Filed with SFDA
Figure 3.3: Number of ADRs/ADEs Reported per Million People by Year

vii
List of Tables
Table 1.1: Hypertension Prevention Interventions Evaluated
Table 1.2: Health Effects of Interventions Evaluated
Table 1.3: Prevention Costs Assumed in Baseline Analysis
Table 1.4: Acute Hospitalization Costs for CVD
Table 1.5: Annual Costs, Effects and Cost-Effectiveness of Interventions
Table 1.6: Annual Costs, Effects and Cost-Effectiveness of Interventions When Smoking
Reduction Benefit Included
Table 2.1: Summary of Existing Product Liability Litigation Event Studies
Table 2.2: Descriptive Verdict Statistics by Defendant Manufacturer
Table 2.3: Descriptive Statistics for Cumulative Abnormal Returns
Table 2.4: CAVAL1 Regressed on Independent Variables
Table 2.5: Descriptive Statistics for Cumulative Abnormal Returns by Verdict Type and
by Mass Tort
Table 3.1: Overview of Chinese Drug Safety Regulation Framework
viii
Acknowledgements
靡不有初,鲜克有终。 --《诗经·大雅·荡》
To start well is easy; to finish well is difficult.
--Decade of Dang, Da Ya, the Book of Odes, 1000 B.C.
This dissertation has been the focus of my life in the past two years. While I am happy to be
finally able to catch a glimpse of the end of the tunnel, I am even happier that I have had this
opportunity to grow from a textbook reader into a policy researcher. Along this journey of
ups and downs, numerous people have given me generous help, support and encouragement.
Without them, I would never have made this far.
I am especially indebted for the persistent attention and guidance from my dissertation chair
and mentor Steve Garber. For two years, Steve met with me weekly to discuss nearly every
aspect of this dissertation. Steve’s high academic integrity and attention-to-detail set a great
example for me to follow for the rest of my career. I am also grateful to my other dissertation
committee members, John D. Graham, former Dean of PRGS and now Dean of School of
Public and Environmental Affairs at University of Indiana and Wei Wilson Zhang, Assistant
Professor at the China Europe International Business School. John’s insightful suggestions
helped me develop the big picture of the dissertation. Moreover, without the opportunities he
provided to practice the policy analysis tools on teaching projects, PRGS would not have
been the deeply influential experience that it became. My special thanks are also due to Wei,
for his help in collecting data that are critical to this dissertation and for sharing his
experiences in navigating Chinese academia as a U.S.-educated scholar. My experience is a
richer because of his generous contribution of knowledge and time.
I would also like to thank Jim Smith for his enthusiasm and encouragement over my tenure at
the RAND. His guidance led me to this dissertation topic and more importantly, encouraged
me to be a curious and open-minded thinker. Thank-yous are extended to John Adams, Zoe
Cullen, Meena Fernandes, Lionel Galway, Susan Gates, Seo Yeon Hong, Rita Karam,
Krishna Kumar, Erik Meijer, Artur Usanov and Tianbiao Zhu, for their helpful comments and
support along the way.

ix
I am grateful for the financial support from RAND Center for China Aging Studies and
current and former members of the PRGS Board of Governors, Eugene Rosenfeld and John
Vogelstein. Thank you for providing me the time and resources needed to consider seriously
the issue of improving public health in China and the U.S.
Finally, special thanks are due to my fiancé Michael Vanderbeek and my parents, for doing
what families do best.

1
Essay 1
Cost-Effectiveness of Individual- and Population-based Strategies to
Reduce Systolic Blood Pressure in China1
1 I would like to thank the World Health Organization CHOosing Interventions that are Cost-Effective (WHO-CHOICE) project, particular Dr. Dan Chrisholm, for sharing the PoPMoD Cardiovascular model and for offering me extensive technical and data support. Dr. Bruce Neal and Dr. Nicole Li at the George Institute for International Health, Australia provided critical data input and general advice. The author is responsible for any errors or problems with this study.

2
Section 1: Introduction
Hypertension is one of the most important modifiable risk factors for cardiovascular disease
(CVD), the leading cause of mortality both in China and worldwide [1, 2]. According to a
2000 nationally representative survey, 28.6% and 25.8% of Chinese men and women,
respectively, are hypertensive [3]. 2 Annually, China spends more than $3 billion on
hypertension treatment and $30 billion on the treatment of CVD [4, 5], representing a
substantial share of its national health care resources. In the next 25 years, the financial
burden of hypertension will increase even further as the number of hypertensive people is
projected to grow by 65% by 2025 [6].
Given the daunting task China faces in preventing and treating hypertension, it is essential
that China allocates scarce health care resources in a cost-effective way. In this paper, I use
the General Cost-Effectiveness Analysis (GCEA) method, first developed by the World
Health Organization CHOosing Interventions that are Cost-Effective (WHO-CHOICE)
project, to analyze the long-term costs and health benefits of selected hypertension prevention
interventions in China [7]. The selection of interventions took into account factors such as
applicability, strength of evidence, availability of data and so forth. The effects of
each intervention on individual blood pressure levels were derived from existing systematic
reviews or meta-analyses. Health outcomes, quantified in terms of disability-adjusted life
years (DALYs), were simulated for subpopulations differing in age and sex using PoPMoD, a
life-table based longitudinal disease model that was developed by the WHO-CHOICE project
[8].3
This study seeks to improve upon existing literature on hypertension-related cost-
effectiveness analysis in several important ways. First, it considers both individual- and
population-based strategies, whereas most analyses to date have focused on single
2 According to the 2005 China National Hypertension Prevention and Treatment Guideline, hypertension is defined as a systolic blood pressure of 140 mmHg or greater, or a diastolic blood pressure of 90 mmHg or greater. Throughout this paper, the term “high blood pressure” and “hypertension” are used interchangeably. 3 PoPMoD is copyrighted by the WHO. This author was permitted to use PoPMoD by the WHO. The use of the PoPMoD/MCLeague software does not imply endorsement by the WHO of any organization or any published research.

3
interventions. Second, in addition to estimating hypertension prevention costs, I included
downstream cost savings resulting from reduced demand for CVD treatment, a cost category
that has been sometimes neglected in previous studies [9]. Third, unlike many existing
literature that focus exclusively on ischaemic heart disease (IHD) (ICD-9 codes 410-414) [10,
11], I considered both IHD and stroke (ICD-9 codes 430-438).4 This addition is important
because unlike Western countries where IHD dominates, the number of patients who die from
stroke is more than three times of the number that die from IHD in China [12]. Finally, I
conducted an extensive set of sensitivity analyses to test the robustness of the results to
varying assumptions.
Section 2 of this paper introduces and applies screening criteria that support the selection of
eight interventions to reduce systolic blood pressure (SBP) in China. Section 3 describes the
WHO PoPMoD model and other analytical methods. Sections 4 and 5 report baseline and
sensitivity analysis results. Finally, I discuss policy implications and future directions in
Section 6.
Section 2: Selection of Interventions
2.1. Review of existing interventions
Two general approaches for the primary prevention of hypertension and CVD are widely
recognized – individual-based interventions and population-based interventions [13].
Individual-based interventions, which seek to identify high-risk hypertensive individuals and
to offer them pharmacologic treatment, have been the traditional choice for medical
practitioners and policymakers [14-16]. “High-risk” individuals are usually defined as those
who have a blood pressure above a certain threshold. Recently the medical community also
advocates that a 10-year absolute CVD risk score, calculated through a computerized scoring
system, be used to define treatment thresholds for pharmacologic treatment.
4 IHD considered in this paper include acute-myocardial infarction, congestive heart failure and angina.

4
Population-based approaches focus on controlling the determinants of hypertension in the
entire population. These approaches consist of mostly, but not exclusively, strategies aimed at
changing population dietary intake in sodium, potassium and other nutrition elements, all of
which have been linked to blood pressure levels in observational and clinical studies [17-22].
Example interventions include mass media campaigns to change diet, community-based
hypertension health education, declaring of salt content in food labeling, legislation to lower
the salt content of processed foods and so forth [9, 23-26].
A number of existing studies suggest that population-based hypertension prevention
interventions enjoy a cost-effectiveness advantage over individual-based interventions in
developed country settings [9, 13, 14]. This is because most CVD cases occur not among the
small number of individuals at greatest risk, but among the much larger number of
individuals at a lower level of absolute risk [10, 13]. It is unclear, however, whether the same
conclusion could apply to developing countries like China, where the epidemiology of
hypertension and CVD is very different from that in the West and where little evidence about
the effectiveness of population-based CVD prevention interventions exists.
2.2 Selection of Interventions for China
I applied three screening criteria to select hypertension prevention interventions for China.
For each intervention, I considered: (1) is there evidence that the intervention is cost-
effective? (2) are there observational or clinical studies that support the effectiveness of the
intervention in China? (3) does China have adequate human or technological resources to
implement this strategy at a significant population coverage level?
My search resulted in two individual-based interventions: antihypertensive drug combination
treatment for those have a SBP above either 140 or 160 mmHg. I excluded absolute CVD
risk-based treatment because it requires a high level of computerization of the health care
services and high level of risk assessment skills among physicians, neither of which is present
in China [27]. In addition, the current absolute risk scoring method is based on the
5
Framingham Heart Study conducted in the U.S., which has been shown not applicable to the
Chinese population [28].
Two population-based interventions were selected: (1) a nationwide use of low-sodium salt
substitute mandate and (2) a nationwide community-based hypertension health education
campaign, both of which have been demonstrated effective in China through social
experiments or clinical trials. I did not consider any intervention that seeks to decrease the
salt content in processed food, even though such strategies have received the greatest amount
of attention in the U.S. and Europe [29-31]. A critical consideration is that unlike in Western
countries where 75% of the daily sodium intake comes from processed food, 72% of daily
sodium intake in Chinese diet comes from discretionary use of salt during food preparation
and at the table [29, 32]. I further excluded health education through mass media, because I
found little evidence about the effectiveness of such interventions in a developing country
setting.
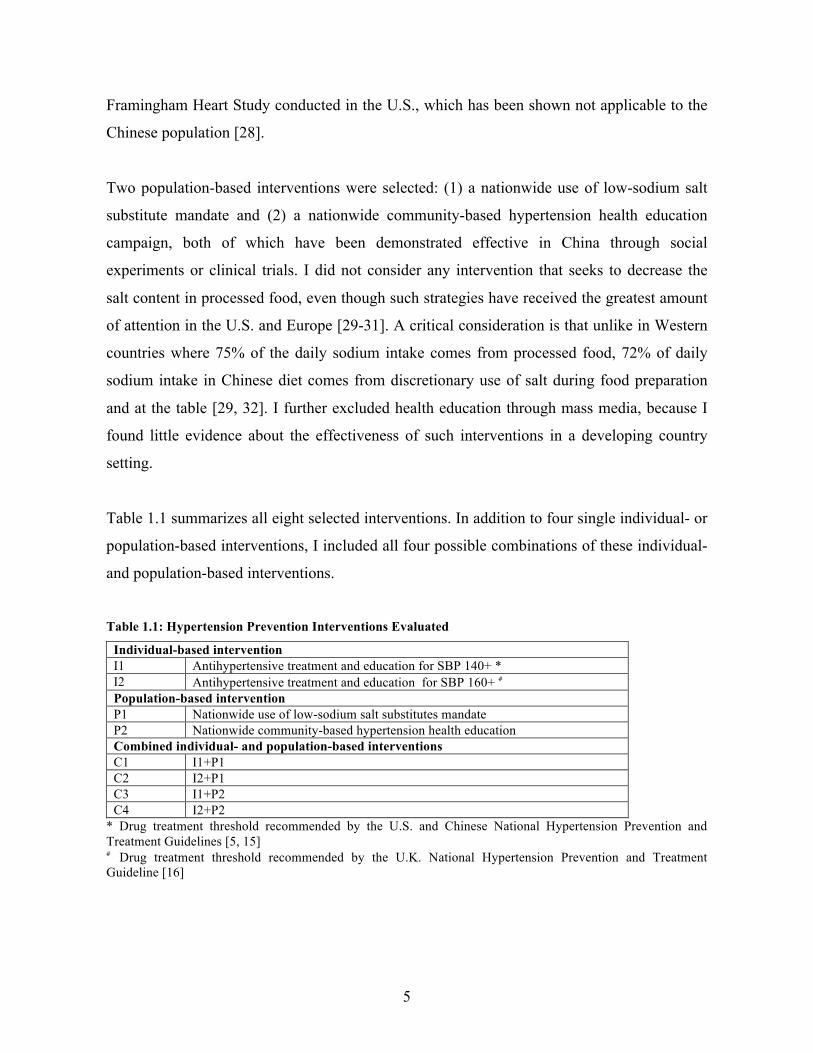
Table 1.1 summarizes all eight selected interventions. In addition to four single individual- or
population-based interventions, I included all four possible combinations of these individual-
and population-based interventions.
Table 1.1: Hypertension Prevention Interventions Evaluated
Individual-based intervention I1 Antihypertensive treatment and education for SBP 140+ * I2 Antihypertensive treatment and education for SBP 160+ # Population-based intervention P1 Nationwide use of low-sodium salt substitutes mandate P2 Nationwide community-based hypertension health education Combined individual- and population-based interventions C1 I1+P1 C2 I2+P1 C3 I1+P2 C4 I2+P2
* Drug treatment threshold recommended by the U.S. and Chinese National Hypertension Prevention and Treatment Guidelines [5, 15] # Drug treatment threshold recommended by the U.K. National Hypertension Prevention and Treatment Guideline [16]

6
Section 3: Methods
3.1 Overview of Model Assumptions
This GCEA framework reports cost-effectiveness results in terms of the net cost effectiveness
ratio (ΔC/ΔE) compared to a null scenario. The null scenario is defined as an absence of any
primary hypertension prevention intervention, a key assumption differing from the more
commonly-used incremental cost-effectiveness analysis framework in which the null is
typically defined as the “current practice” scenario. One advantage of GCEA is that it allows
researchers to evaluate not only new interventions but also the current practice itself, which is
however not included in this study.
I assumed all interventions were to be implemented in a 10-year period from 2005 to 2015,
although the population health effects were tracked for 100 years from 2005 to 2105. Health
effects were quantified in terms of DALYs avoided. Total costs, including both hypertension
prevention costs and CVD treatment costs, were first calculated for each intervention in 2005
Chinese Yuan using the Medical Component of the Chinese Consumer Price Index (CPI)
[33]. They were then converted into 2005 US dollars using purchasing power parity (PPP)
exchange rates [34]. All costs and health effects were discounted at a rate of 3% annually.
3.2 Estimating Health Effects
3.2.1 Intervention Effects on SBP
I1 and I2: two-drug combination treatment for those who have SBP 140 mmHg (160 mmHg)
or above
Several meta-analyses of randomized clinical trials demonstrate that major classes of
antihypertensive drugs, including ACE inhibitors, - blockers, diuretics, and calcium
channel blockers, lower SBP by 9-12 mmHg on average with patients with higher initial SBP
achieving greater reductions [35, 36]. These drugs are also shown to reduce the total CVD
7
event rate, all-cause mortality, and CVD-mortality [37-42]. The efficacies of different classes
of drugs are similar in size, independent and additive. Most patients will require two or more
antihypertensive drugs to achieve their SBP goals. All these conclusions were shown
applicable to Chinese patients in meta-analyses or systematic reviews of large-scale clinical
trials conducted in China [43-45].
Following Murray et al. (2003) [9], I assumed the average SBP reduction for patients who
receive treatment with two antihypertensive drugs to be one third of the difference between
their initial SBP and 115 mmHg, an estimate that is consistent with above-mentioned clinical
trial results. The reduction size is also proportional to patients’ adherence to the treatment.
U.S.-based studies have shown that the long-term hypertensive drug adherence rate decreases
from 80% in the first year to about 35% after the first two years and remains stable thereafter
[46-50]. The few existing Chinese studies report similar results [51-58]. In this study I
assumed the average adherence rate during the 10-year intervention period is 50%.
Furthermore, because not all qualified individuals (SBP 140+ or 160+) will actually seek
treatment, I further assumed a long-term treatment rate of 50% in the baseline analysis, the
midway point between the 27.2% treatment rate in China in 2000 reported by the InterAsia
study [3] and the 65% treatment rate in the U.S. in 2003 [59]. In the sensitivity analyses, I
tested the robustness of baseline results by varying the treatment rate to a lower bound of
30% and an upper bound of 70%.
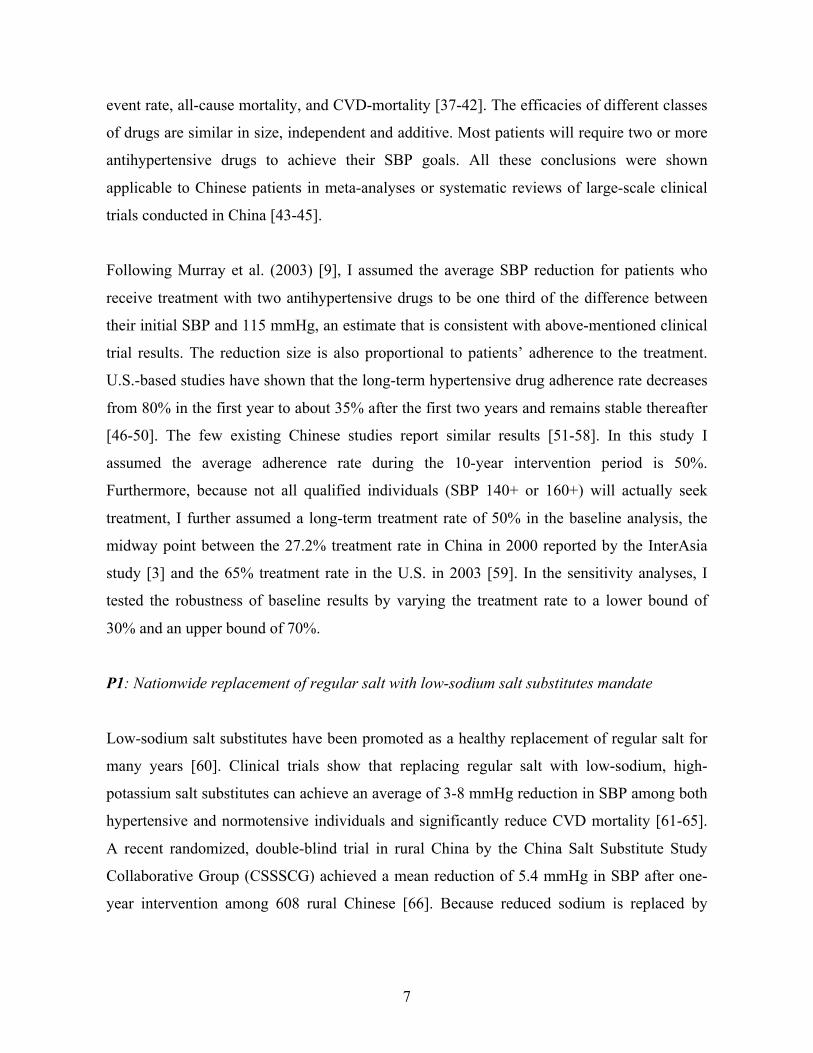
P1: Nationwide replacement of regular salt with low-sodium salt substitutes mandate
Low-sodium salt substitutes have been promoted as a healthy replacement of regular salt for
many years [60]. Clinical trials show that replacing regular salt with low-sodium, high-
potassium salt substitutes can achieve an average of 3-8 mmHg reduction in SBP among both
hypertensive and normotensive individuals and significantly reduce CVD mortality [61-65].
A recent randomized, double-blind trial in rural China by the China Salt Substitute Study
Collaborative Group (CSSSCG) achieved a mean reduction of 5.4 mmHg in SBP after one-
year intervention among 608 rural Chinese [66]. Because reduced sodium is replaced by

8
increased potassium, which also has a salty taste, clinical study participants typically cannot
detect the taste difference between regular salt and salt substitutes in blind tests [61, 63, 67].
I considered a nationwide replacement of common salt (100% sodium chloride) with the low-
sodium salt substitute used by the CSSSCG study. This salt substitute (65% sodium chloride,
25% potassium chloride, 10% magnesium sulphate) is commercially available in big grocery
stores throughout China. As clinical trials do not reflect the full health effects that salt
substitutes could achieve if used with complete adherence, as would be the case under a
national mandate, I projected the effect size of the salt substitute on SBP reduction among
individuals above age 30 based on the association between SBP and sodium intake,
conditional on age, initial SBP and gender, estimated by Law et al. (1991, 1991 & 1991)
(appendix A) [20-22]. Under the assumption that all discretionary use of salt will be replaced
by the salt substitute, the estimated reduction in daily sodium intake would be 26%.5 The
resulting reduction in SBP ranges from 1.9% to 4.7% in men and 1.6% to 4.3% in women
depending on the age group.
P2: Nationwide community-based CVD health education campaign similar to the Tanjin
Project
Since the early 1970s, several controlled social experiments have aimed at promoting risk-
reducing lifestyle changes through community-based CVD health education. The first such
program, the North Karelia Project in Finland, resulted in 16% and 20% net reduction in salt
intake, 4.8% and 11.3% net decreases in SBP as well as 3% and 1% net reductions in serum
cholesterol among men and women respectively after the 20-year intervention [25, 68, 69].
The Stanford Five-City Project in the U.S. achieved a 4% net reduction in SBP, a 2% net
reduction in serum cholesterol and a 13% net reduction in smoking rate among both men and
women [23]. Tianjin Project, the first major community-based CVD education project in
China resulted in a 6% net reduction in dietary salt intake, and 2.6% and 4.3% net reduction
5 Percentage of daily sodium intake coming from discretionary use (75%) × percentage reduction in sodium intake (35%) = 26%.

9
in SBP among men and women respectively. It also achieved 12% smoking rate reduction
among men from 1991-1996 [32, 70, 71].
The current study considered a nationwide community-based CVD health education program
assumed to have health effects similar to those of the Tianjin Project. In the baseline analysis,
I included only net health benefits resulted from SBP reduction. I explored how the smoking
reduction component of the program affects the cost-effectiveness ratio in the sensitivity
analyses.
Table 1.2 summarizes the assumed health effects of all four single interventions (I1, I2, P1,
and P2). For the combination interventions (C1-C4), the effects of population-based
interventions (P1 or P2) were applied first. Individuals remaining above the drug treatment
thresholds (140 or 160 mmHg) were then subject to the same health effects as those with I1
or I2.
Table 1.2: Health Effects of Interventions Evaluated
Intervention Reduction in SBP I1 & I2 33% × (original SBP - 115 mmHg) P1* 1.9%-4.7% in men depending on age group
1.6%-4.3% in women depending on age group P2 2.6% reduction in SBP among men
4.3% reduction in SBP among women * The age groups are 30-44, 45-59, 60-69, 70-79, 80 and above.
3.2.2 Effects on CVD and Survival
Evidence from Clinical Trials
Overviews of randomized controlled trials have confirmed the reduction of CVD risks with
blood pressure lowering [72-76]. These studies suggest that a 10 mmHg lower SBP is on
average associated with a 30-40% lower risk of stroke and a 20-25% lower risk of CVD.
Recent meta-analyses of large scale Chinese antihypertensive clinical trials report similar
results for the Chinese population [37, 43-45]. The reductions are similar for those with or
without hypertension and for both females and males.

10
The PoPMoD CVD Model
In the present study, the effects of hypertension prevention interventions on population SBP
levels were translated into effects on CVD and survival using the PoPMoD model. This
computer-based multi-state dynamic life table model, as described in detail elsewhere [8],
forecasts CVD incidence, prevalence and mortality under various assumptions regarding risk
factor levels and treatment effects.
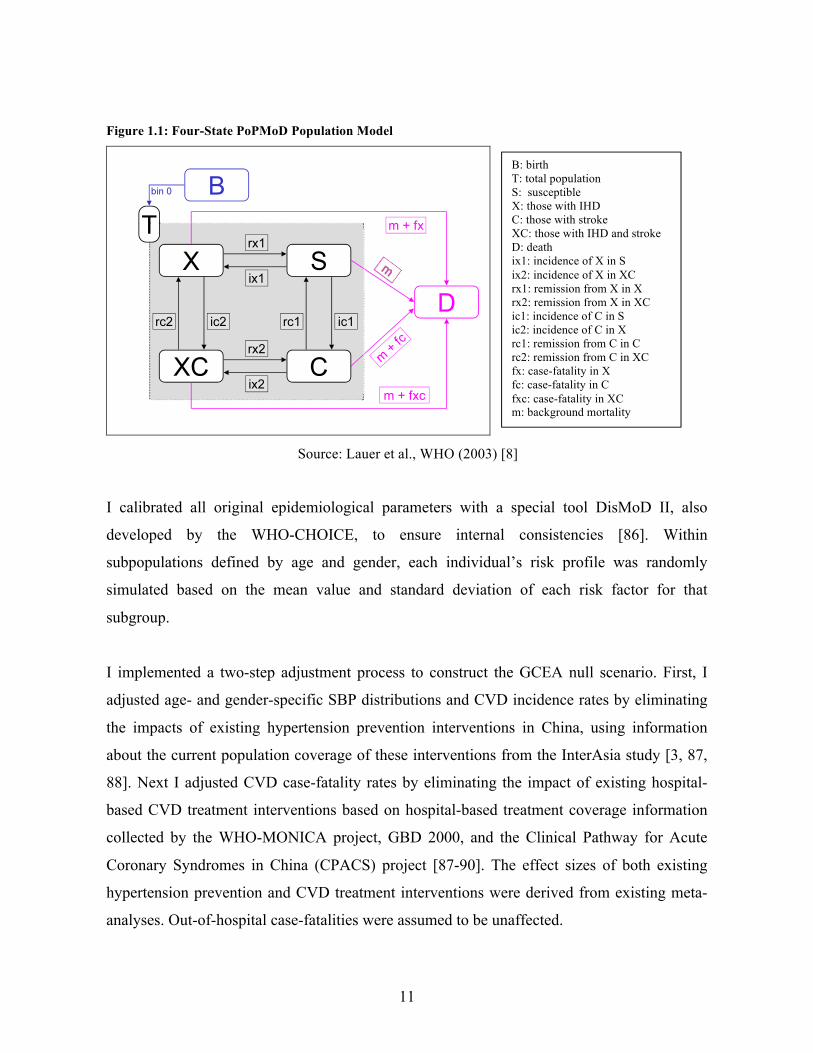
As depicted in Figure 1.1, PoPMoD simulates population evolution by age and by sex subject
to births, deaths and two CVD conditions, i.e. IHD and stroke. The model population is
divided into six age groups: below 30, 30-44, 45-59, 60-69, 70-79 and 80 and above. Each
year a new birth cohort enters the model, some people develop either IHD or stroke or both
conditions, and some people exit the model by death, either due to CVD conditions or other
non-CVD mortality risks. The transitions of members from one state to another are governed
by a system of ordinary differential equations reflecting the population CVD epidemiological
parameters (incidence rates, prevalence rates, remission rates and case-fatalities), which are in
turn determined by the distributions of CVD risk factors (SBP 140 mmHg, total cholesterol
5.7 mmol/L, body mass index (BMI) 28 and smoking) in the population.
Baseline year (2005) Chinese population by age and sex were obtained from the 2005 United
Nations Population Division projection [77]. Age- and gender-specific live births and
mortality rates projected for 2005-2050 were obtained from the same source and assumed to
remain the same for the period of 2051-2105. I estimated baseline distributions of SBP, total
cholesterol, and smoking rate by age and gender using published data from the 2000
InterAsia Study [78-81]. Baseline age- and gender-specific distributions of BMI were
obtained from the Asia-Pacific Cohort Studies Collaboration (APCSC) database [82, 83].
Baseline age- and gender-specific CVD epidemiological parameters were approximated by
the West-Pacific Region B1 (WPR-B) data from the Global Burden of Disease 2000
(GBD2000) study [85]. 6 (A complete list of all data inputs and sources is included in
Appendix C)
6 Chinese population accounts for more than 90% of the total population in the WPR-B region.
11
Figure 1.1: Four-State PoPMoD Population Model
Source: Lauer et al., WHO (2003) [8]
I calibrated all original epidemiological parameters with a special tool DisMoD II, also
developed by the WHO-CHOICE, to ensure internal consistencies [86]. Within
subpopulations defined by age and gender, each individual’s risk profile was randomly
simulated based on the mean value and standard deviation of each risk factor for that
subgroup.
I implemented a two-step adjustment process to construct the GCEA null scenario. First, I
adjusted age- and gender-specific SBP distributions and CVD incidence rates by eliminating
the impacts of existing hypertension prevention interventions in China, using information
about the current population coverage of these interventions from the InterAsia study [3, 87,
88]. Next I adjusted CVD case-fatality rates by eliminating the impact of existing hospital-
based CVD treatment interventions based on hospital-based treatment coverage information
collected by the WHO-MONICA project, GBD 2000, and the Clinical Pathway for Acute
Coronary Syndromes in China (CPACS) project [87-90]. The effect sizes of both existing
hypertension prevention and CVD treatment interventions were derived from existing meta-
analyses. Out-of-hospital case-fatalities were assumed to be unaffected.
B: birth T: total population S: susceptible X: those with IHD C: those with stroke XC: those with IHD and stroke D: death ix1: incidence of X in S ix2: incidence of X in XC rx1: remission from X in X rx2: remission from X in XC ic1: incidence of C in S ic2: incidence of C in X rc1: remission from C in C rc2: remission from C in XC fx: case-fatality in Xfc: case-fatality in C fxc: case-fatality in XC m: background mortality
12
Once I had the null scenario SBP distributions, I applied the health effects of each of the eight
selected hypertension prevention interventions (I1-C4) by adjusting the mean SBP level for
each age- and gender-specific subgroup. The PoPMoD assumes the effect of SBP reduction
on CVD mortality was mediated by its impact on individuals’ relative risks of IHD and
stroke, assuming all other CVD risk factors consistent with or without interventions. Each
individual’s relative risk of IHD and stroke events for a unit change in SBP, cholesterol, BMI
and smoking, conditional on one’s age and gender, was projected using multiple logistic risk
functions estimated by the WHO [9, 91].
To project the full effect of SBP reduction on CVD mortality and DALYs, I used a CVD
disease model that simulates the disease progression after one experiences a specific type of
CVD event (Figure 1.2). For IHD events, I considered the first-ever acute-myocardial
infarction (AMI) subdivided into those that is fatal in the first 28 days and those that survive
the first 28 days, angina subsequent to AMI, and congestive heart failure (CHF) subsequent to
AMI. For stroke events, I consider the first-ever ischemic stroke that is fatal and nonfatal in
the first 28 days and the first-ever non-ischemic stroke that is fatal and nonfatal in the first 28
days. Because the case-fatalities of both AMI and stroke is substantially higher in the first 28
days, I modeled events fatal within the first 28 days via the background mortality rate. A
higher relative risk (RR) of stroke was incorporated for those with previous AMI and a higher
RR for AMI for those with previous stroke.

13
Figure 1.2: The CVD Disease Model
�

14
3.2.3 Effects on DALYs
Population health outcomes were quantified in terms of DALYs by tracking what happens to
each age and gender group of the population over 100 years with each intervention compared
to the null scenario. First developed by the GBD 2000 study, DALY is a summary measure
of population health that combines in a single indicator years of life lost from premature
death and years of life lived with disabilities. DALYs have become increasingly used in
the cost‐effectiveness literature [9, 92‐97]. Mathematically, DALYs were calculated by
multiplying the number of years lived with a disease condition by the disability weight
for that condition. For individuals that have multiple disease conditions, DALYs are the
number of years lived with those conditions times the joint disability weight for those
conditions. A detailed discussion of the principles and techniques of DALY can be found in
Murray & Lopez (1996) [98]. In this study I used the disability weights for living with CVD
conditions estimated by the West Pacific Region from the GBD 2000 study [99] (see
appendix C).
3.3 Estimating Costs
3.3.1 Overview of Cost Structure
For each intervention, the total costs included prevention costs associated with implementing
that intervention and subsequent cost savings resulting from reduced demand for CVD
treatment. I did not consider the costs of productivity loss associated with CVD because little
data exist regarding the employment and income levels of Chinese people aged 50 or above,
arguable the most relevant age groups for CVD. Similarly, I did not include the costs of
treating any non-CVD illness during the added years of life that would not have occurred in
the absence of treatment because I found little data about the age- and gender- specific non-
CVD-related medical expenditure among Chinese people. In theory, these two categories of
omitted costs should affect the total costs in opposite directions, although I did not find any
reliable evidence to determine whether the costs of productivity loss are larger or smaller than
the costs of treating non-CVD illnesses during the added life years. Depending on the relative

15
size of each of these two types of cost, the total costs calculated in this study would tend to
over or underestimate the full social costs of each intervention.
Quantities of patient-level resource inputs required for each individual-based intervention
(e.g. frequency of outpatient visits, medication dosage, lab tests) were identified from the
Chinese National Clinical Guideline for Hypertension [5, 15], assuming Chinese physicians
treat hypertensive patients consistent with what the Guideline recommends.
For combination interventions (C1-C4), the costs of population-based interventions were first
applied. Costs of individual-based interventions (I1 or I2) were then applied to individuals
projected to remain above the individual-based treatment thresholds. .
3.3.2 Prevention Costs
For each of the two individual-based interventions, the prevention costs included the costs
associated with individuals seeking primary-care (such as office visits, diagnostic lab tests
and medicine) for controlling their hypertension. I did not include any possible costs
associated with changing the current recommended hypertension pharmacologic treatment
threshold or educating health care providers about this change because I expect such activities
could be accommodated by the health care system’s routine operations and thus would
involve little or no incremental costs. The prevention costs of nationwide use of low-sodium
salt substitute mandate consisted of the incremental cost difference between the regular salt
and the salt substitute. The prevention costs of the community-based CVD education were
based on published estimates for the Tianjin Project [100]. Table 1.3 at the end of this section
summarizes prevention costs for each of the selected interventions.
It should be noted that both medical services prices and drug prices are regulated in China.
Medical services prices, in particular, are capped at very low levels and therefore do not
reflect the true social costs of providing these services. On the other hand, it is well known
that Chinese physicians and hospitals cross subsidize basic services with a 15%-45% markup
they are allowed to charge on drugs [102, 103]. In other words, while the regulated medical

16
services prices are likely to be lower than the social costs of these services, retail drug prices
are likely to be higher than the social costs. Because I did not find any reliable way to
estimate the respective true social costs of medical services and drugs, I relied on government
retail price caps for both medical services and drugs in the baseline analysis, assuming the
combined prices of medical services and drugs reflect reasonably accurately their true
combined social costs. I explored the impact of different assumptions on medical costs in the
sensitivity analyses.
Office visits
In China, prices for medical services are regulated by the provincial or metropolitan
Development and Reform Commissions (DRCs). In this study, I used Beijing DRC’s 2000
price standard (1.5 Yuan per visit) as my primary source for the cost of office visit [104]. I
further assumed that each patient who was taking the antihypertensive drug treatment would
make two office visits per year. The annual office visit cost per person would be 3 Yuan (4 in
2005 Yuan or $1.2 in 2005 U.S. dollar).
Laboratory tests
The costs of laboratory tests for hypertensive patients were also estimated using the Beijing
DRC standards [104]. For lab tests, I considered electrocardiogram (8 Yuan), urinalysis (8
Yuan), blood glucose and hematocrit (21Yuan), serum potassium (4 Yuan), creatinine and
calcium (12Yuan); and a lipid profile (30 Yuan), all of which were recommended by the
National Guideline [5]. I further assumed that each patient would take the lab tests 1.5 times
per year. Thus the annual cost for lab tests per patient was 124.5 in 2000 Yuan (or 127.2 in
2005 Yuan or $36.9 in 2005 U.S. dollar).
Antihypertensive medication costs
I estimated antihypertensive medication costs using the 2007 National Development and
Reform Committee’s (NDRC) Upper Limit Retail Prices Index [105] and deflated them to
2005 price levels with the medical component of the CPI. To estimate the average price of a
two-drug combination with any two classes of the major antihypertensive drugs, I first
identified the median prices of each of the four major classes of antihypertensive drugs (ACE

17
inhibitors, - blockers, diurectics and calcium channel blockers). Next I computed the
average daily price of the six possible two-drug combinations for the standard dosages. This
resulted 2.5 Yuan per person per day or 927 Yuan per person per year in 2007 (or 900 in 2005
Yuan or $260.9 in 2005 U.S. dollar), This result is similar to the annual medication costs for
hypertensive patients reported by an outpatient survey conducted in Beijing [106].
Salt substitute
The cost of the salt substitute was obtained from the retail price of the salt substitute used in
the CSSSCG study. The retail price of this salt substitute is approximately 3.4 Yuan/kg [107],
or roughly 50% more expensive than the regular salt sold in China. Under the assumption that
each person consumes 12g of salt substitute per day, the annual incremental per person cost
for the salt substitute is 4.9 Yuan in 2005 or ($1.4 in 2005 U.S. dollars).
Community-based CVD education
The average per person cost of the Tianjin Project was 36.2 Yuan in 2005 or $10.5 in 2005
U.S. dollar [100]. Estimated using the ingredient-based approach described in the WHO-
CHOICE project, this number includes the costs of developing educational materials,
personnel costs, transportation costs, utility costs, equipment costs and other related medical
services costs. If there are substantial economies of scale in these activities—due, for
example, to fixed costs of equipment or developing educational materials—then my use of
average costs from the relatively small Tianjin Project would tend to overstate the true
average costs of a nationwide intervention.
Table 1.3: Prevention Costs Assumed in Baseline Analysis
Intervention Cost category Quantity per year per person
Cost per year per person 2005 Yuan ($PPP 2005)
I1 & I2 · Medication · Outpatient visits · Lab tests
· Standard doses · 1.5 times · 1.5 times
· 900.2 ($260.9) · 4.0 ($1.2) · 127.2 ($36.9)
P1 · Salt substitutes · 4.4 kg · 4.96 ($1.4) P2 · Program costs N.A. · 36.2 ($10.5)
18
3.3.3 Costs of Treating CVD
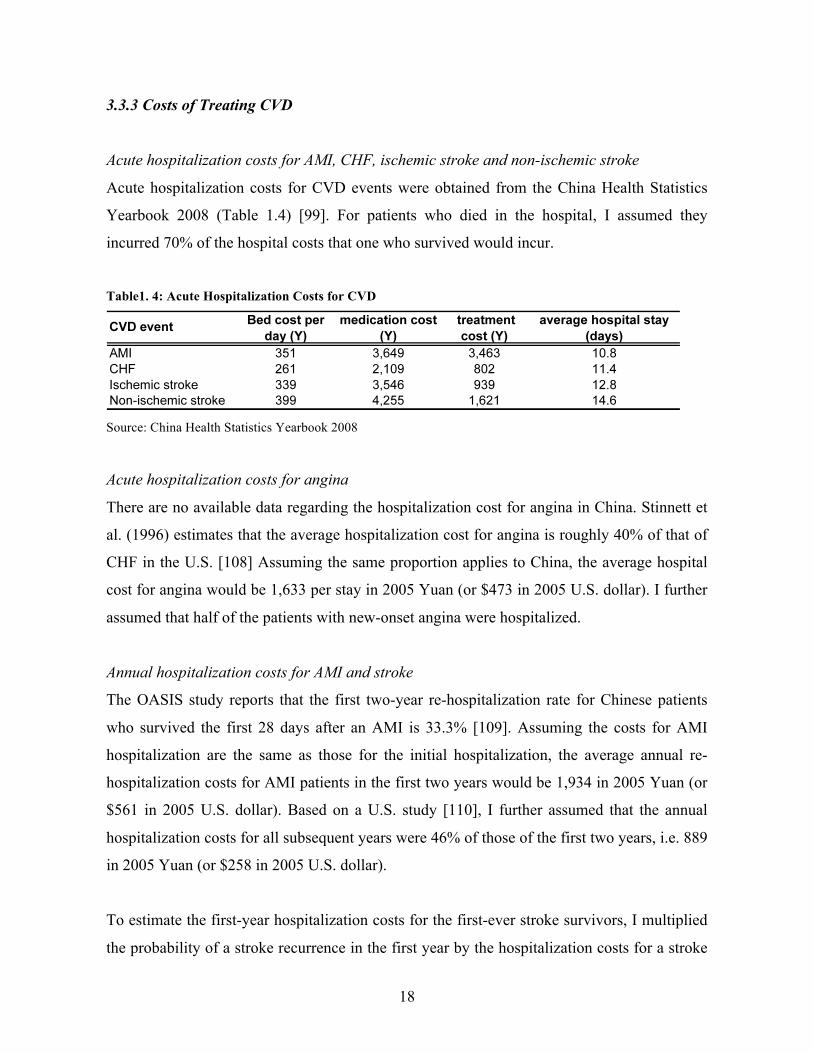
Acute hospitalization costs for AMI, CHF, ischemic stroke and non-ischemic stroke
Acute hospitalization costs for CVD events were obtained from the China Health Statistics
Yearbook 2008 (Table 1.4) [99]. For patients who died in the hospital, I assumed they
incurred 70% of the hospital costs that one who survived would incur.
Table1. 4: Acute Hospitalization Costs for CVD
Source: China Health Statistics Yearbook 2008
Acute hospitalization costs for angina
There are no available data regarding the hospitalization cost for angina in China. Stinnett et
al. (1996) estimates that the average hospitalization cost for angina is roughly 40% of that of
CHF in the U.S. [108] Assuming the same proportion applies to China, the average hospital
cost for angina would be 1,633 per stay in 2005 Yuan (or $473 in 2005 U.S. dollar). I further
assumed that half of the patients with new-onset angina were hospitalized.
Annual hospitalization costs for AMI and stroke
The OASIS study reports that the first two-year re-hospitalization rate for Chinese patients
who survived the first 28 days after an AMI is 33.3% [109]. Assuming the costs for AMI
hospitalization are the same as those for the initial hospitalization, the average annual re-
hospitalization costs for AMI patients in the first two years would be 1,934 in 2005 Yuan (or
$561 in 2005 U.S. dollar). Based on a U.S. study [110], I further assumed that the annual
hospitalization costs for all subsequent years were 46% of those of the first two years, i.e. 889
in 2005 Yuan (or $258 in 2005 U.S. dollar).
To estimate the first-year hospitalization costs for the first-ever stroke survivors, I multiplied
the probability of a stroke recurrence in the first year by the hospitalization costs for a stroke
19
in the first 28 days, assuming the hospitalization costs for recurrent stroke were the same as
those for the initial stroke. A review of existing literature shows that the recurrent rates of
ischemic and non-ischemic strokes in the first two years among Chinese patients are 11% and
24.3% respectively [12, 111]. The resulting annual hospitalization costs for the first two years
were 11%´5,990=719 Yuan ($208.4 in 2005 U.S. dollar) for ischemic stroke and
24.3%´8,491=2,063 Yuan ($598.0 in 2005 U.S. dollar) for non-ischemic stroke. For all
subsequent years, the annual hospitalization costs were projected to be 3% of the initial 28
days [112], resulting in an annual cost of 180 Yuan ($52.2 in 2005 U.S. dollar) for ischemic
stroke or 254 Yuan ($73.5 in 2005 U.S. dollar) for non-ischemic stroke.
Annual outpatient costs and medication costs for AMI and stroke survivors
Chinese National Health Statistical Center reported in 1998 that the average outpatient costs
(including medication cost) per visit after the first AMI were 238 Yuan and 213 Yuan for
stroke [113]. In addition, a survey conducted in 1998 in Tianjin suggests that on average 28-
day AMI survivors paid for 4.92 Yuan per outpatient visit [114]. Another survey conducted in
Beijing reports that the average per outpatient visit for stroke survivors was 7.7 Yuan [115].
Assuming both IHD and stroke survivors make an average of five outpatient visits per year,
the annual outpatient costs would be 1,190 Yuan for MAI survivors and 1,065 Yuan for
stroke survivors in 1998 (or $345 and $308 in 2005 U.S. dollar).
Section 4: Results
Table 1.5 summarizes the total annual costs, annual health effects in terms of DALYs
averted, and cost-effectiveness ratio for each of the eight selected interventions. Generally
speaking, the smaller the cost-effective ratio is, the more cost-effective one intervention is. A
negative sign of the cost-effective ratio indicates that the intervention would result in net
savings in health care expenditure. The WHO recommends that an intervention be considered
“cost-effective” if it has a cost-effectiveness ratio less than three times of a country’s GDP
per capita and “highly cost-effective” if the cost-effectiveness ratio is less than the GDP per
capita [116]. By these standard, all eight selected interventions are highly cost-effective as

20
their cost-effectiveness ratios are far less than China’s GDP per Capita, which was $4,091 in
2005 [98].
Nationwide use of low-sodium salt substitute mandate (P1) is the most cost-effective
intervention, resulting in net annual savings of $424 per DALY averted. The two combination
interventions that involve nationwide use of salt substitutes (C1 and C2) would also lead to
net annual savings in health. Individual-based antihypertensive combination drug treatment
for SBP 160+ (I2) is more cost-effective than antihypertensive treatment for SBP 140+ (I1).
Overall, the two antihypertensive drug treatment interventions (I1 and I2) have the smallest
total amount of health benefit (DALYs averted per year) and the four combined interventions
(C1-C4) have the largest total health benefits.
Table1. 5: Annual costs, effects and cost-effectiveness of interventions
* Annual costs for CVD treatment under the null scenario is 83,147 ($´106)
The cost-effectiveness ratios alone do not tell the whole story. Nationwide use of salt
substitutes (P1) has the most favorable cost-effectiveness ratio, but it does not result in the
largest number of DALYs averted. From a policy perspective, the best intervention is the one
that achieves the greatest health benefits for a given budget. The best policy option for one
budget level may or may not be the best option for a different budget level. To identify the
expansion path of the optimal policy choice as the total budget grows, I calculated the
incremental costs and benefits of each intervention compared with the next best option for
various budget levels. In this chart, the X axis indicates the total number of DALYs averted
and the Y axis represents the total amount of resources required. The slope of the line
connecting the origin to each point is thus the net cost-effectiveness ratio of that intervention.

21
The blue line in Figure 1.3, i.e. the expansion path, demonstrates in which order interventions
would be adopted as the total amount of available resources increases. When budget is very
low, P1 will be adopted first. As the total budget increases to nearly $4,000 million per year,
C2 becomes a better policy as it achieves a higher level total health benefit than P1 does and
it has the best cost-effectiveness ratio among all remaining alternatives. Similarly, when the
total budget increases to near $8,000 million per year, C1 replaces C2 as the best policy
option.
Figure 1.3: Expansion Path of Hypertension Prevention Interventions
Section 5: Sensitivity Analyses
Delay in health effects
Clinical trials have noted a delay between SBP reduction and changes in CVD health
outcomes [72-75]. The WHO Comparative Risk Assessment study recommends a three-year
risk reversal window on the basis of a systematic review of the time taken for risk reversal
after a sustained reduction in SBP from both observational and clinical studies [117].
Assuming interventions implemented in 2005 would begin having an effect on CVD
incidence rates only in 2008, the cost-effectiveness ratios for each of the eight interventions
increased, i.e. becoming less cost-effective, but the relative ranking of all interventions
22
remained the same. Furthermore, all eight interventions remained in the “highly cost
effective” category by the aforementioned WHO cost-effective standards.
Antihypertensive drug treatment rate
Two separate analyses assessed the impact of lowering the hypertension treatment rate to
30%, a lower bound based on the 2000 InterAsia survey [78] and to 70%, an upper bound
equal to the 2003 U.S. hypertension treatment rate [59]. As the treatment rate increases, both
the total health benefits and the total costs increase, but the health benefits grow faster than
the total costs. As a result, the cost-effectiveness of both individual-based interventions (I1
and I2) improves with a higher treatment rate. Nevertheless, the relative rankings of both
interventions did not change when the treatment rate changed from 30% to 70%.
Costs of salt substitutes
The cost-effectiveness ratio of nationwide use of salt substitutes (P1) would remain negative,
i.e. net savings in health expenditure, as long as the cost of the salt substitutes does not
exceed $2.0/kg, or an increase by 624% from its current price. This is because the annual cost
savings in CVD treatment ($3.6 per person) far exceeds the annual prevention costs ($0.5 per
person) associated with this intervention.
Costs of CVD treatment
Two separate analyses assessed the impact of changes in the assumed CVD treatment costs.
A 15% decrease in the CVD treatment cost would simultaneously increase the cost-
effectiveness ratios of all interventions, i.e. less cost-effective because of reduction in
treatment costs involve less projected cost savings. A 15% increase in the CVD treatment, on
the other hand, would simultaneously decrease the cost-effectiveness ratios of all
interventions. In either case, however, the relative rankings of the eight interventions did not
change (Figure 1.4).

23
Figure 1. 4: Impact of CVD Treatment Costs on Cost-Effectiveness Results
Health effects of community-based CVD health education
In the baseline analysis, I considered the health effects only in terms of net reduction in SBP
for the nationwide community-based CVD health education program (P2). If I took into
account the benefit of smoking reduction associated with this program as the Tianjin Project
has demonstrated, the cost-effectiveness ratio of P2 improved from $50.8 per DALY averted
to a negative $-24 per DALY averted, i.e. resulting in net savings of health expenditure.
Similar, the cost-effectiveness ratios of the two combined interventions that involved P2, i.e.
C3 and C4, also improved from $282.3 to $216.2 and from $62.5 to $14.6 respectively. Table
1.6 and Figure 1.5 report the new cost-effectiveness results when the smoking reduction
benefit of P2 was included. .
Table 1.6: Annual costs, effects and cost-effectiveness when smoking reduction benefit included

24
Figure 1.5: Expansion path when smoking reduction benefit included
Section 6: Discussion
Among all eight individual- and population-based interventions, nationwide use of salt
substitutes by legislation is most cost-effective in China. This result is robust under different
model assumptions and consistent with the result from an earlier study by Murray et al. that
examined different hypertension prevention interventions at the global and regional levels
(2003) [9]. The beneficial effects of sodium intake reduction have been well-recognized in
the international public health communities [5, 15, 29, 31]. Wide use of low-sodium salt
substitutes, however, has so far been promoted only in a few European countries, particularly
in Finland [60]. A recent study by Pietinen et al. (1996) suggests that decreased dietary
sodium intake might be responsible for a substantial reduction in CVD deaths in Finland
during 1972-1992 [68]. In the United States, low-sodium salt substitutes are sold as an over-
the-counter product in pharmacies and grocery stores for hypertensive patients, although salt
substitutes have not received as much attention from public health advocates as they do in
Europe.
China offers a very promising environment for large-scale use of low-sodium salt substitutes.
Chinese people on average consume more than 12g of salt everyday, , the highest among all

25
countries included in the INTERMAP study, far exceeding the 5g per day standard
recommended by the WHO [117, 118]. With more than 72% of dietary salt intake comes
from home cooking and discretionary use at table instead of from processed food [29, 32],
replacing regular salt with low-sodium salt substitutes is a very promising solution to reduce
population dietary sodium intake [119]. From a policy implementation point of view, China
has historically been an excellent example of using salt fortification to improve population
health. In particular, China launched nationwide mandatory replacement of regular salt with
iodized salt in the early 1990s. As a result, the average iodine deficiency rate for children age
8-10 has fallen from 20.4% in 1995 to 8.8% in 1999 [120]. China is also the only country to
add medication diethycarbamazine in dietary salt, which has helped to essentially eliminate
lymphatic filariasis, a mosquito-transmitted disease that is ranked as the second leading cause
of disability worldwide in China [121, 122].
Several issues regarding the low-sodium salt substitutes that are not accounted for in the
current study deserve further consideration. First, the potential interaction between salt
substitutes and antihypertensive drugs needs to be further studied. Existing clinical trials have
not found salt substitutes interfere with the efficacies of major antihypertensive drugs,
although rare cases of hyperkalaemia have been reported among patients who have severe
renal disease and are simultaneously taking potassium-sparing antihypertensive drugs [123].
Second, despite clinical trials have shown that a moderate and repeated reduction of sodium
and increase of potassium do not produce discernable taste differences, it is generally
understood that the higher the potassium content is, the bitter a salt substitute tastes [67].
Future research should study more about the optimal mix of sodium, potassium and other
mineral components to achieve the best balance of efficacy, taste and safety. Before the above
mentioned issues are well-studied and understood, population-wide replacement of regular
salt with low-sodium salt substitutes should be implemented sequentially, starting with low
renal disease risk populations and low-risk communities before gradually expanding to the
entire population. 7
7 Continued availability of regular salt during such a transition period raises the possibility that low-risk individuals (who are supposed to use the salt substitute) will attempt to continue to use regular salt, which will remain available to those with high risk of renal disease. Thus, there may be enforcement efforts and additional costs to such a sequential policy approach.

26
Community-based CVD health education program is not as cost-effective as treating
individuals with SBP 160 + with antihypertensive drugs in the baseline analysis. This result
was reversed after taking into account community-education’s impact on male smoking rate.
When reductions in multiple CVD risk factors were considered, nationwide community-based
CVD health education resulted in the largest total amount of health benefits and is more cost-
effective than individual-based drug treatment interventions. It is worth noting that China’s
Tianjin project, which was the basis of the current study, achieved lower reductions in SBP
and in smoking rate than similar programs conducted outside China. For example, both the
North Karelia project in Finland and the Stanford Five-City project achieved significantly
higher reductions in population SBP and in population smoking [25, 68, 69, 124]. If future
Chinese community-based CVD health education programs could improve their effectiveness
to a level similar to that of the North Karelia project or the Stanford Five-City project, even
greater amount of total health benefits and better cost-effectiveness ratios could be achieved
at the population level.
Individual-based antihypertensive drug treatment achieves a more favorable cost-
effectiveness ratio when the treatment threshold is 160 mmHg rather than 140 mmHg and
when the treatment rate is higher. Currently only 27.2% of Chinese hypertensive individuals
are taking antihypertensive drugs [78]. The decisions to initiate and to adhere to
antihypertensive drug treatment are largely private choices made by individuals themselves.
However, public policy can influence such decisions by improving the access to
antihypertensive drugs, increasing the general awareness of hypertension and people’s
knowledge about the health risks of sustained high blood pressure. In the near future,
policymaker can improve the overall cost-effectiveness of drug treatment by changing the
treatment threshold from the current level of140 mmHg to 160 mmHg. In the long run, public
policy should be designed towards expanding health insurance coverage among urban poor
and among rural population, and towards increasing the coverage of blood pressure screening.
The current study has several limitations. First, it examines only the aggregate costs and
benefits associated with each selected intervention. As it is often the case for health

27
interventions, one intervention might have very different impacts on men and women, young
people and the elderly, low-risk groups and high-risk groups. Future study should further look
into each of these subpopulations to offer policy recommendations that are tailored to the
needs of different population groups. Second, for individual-based drug treatment
interventions, prevention costs were estimated based on prices as regulated by the Chinese
central or provincial governments. Arguably these prices do not reflect the true social costs of
health care services that are performed by public hospitals or health clinics. Future studies
could potentially improve the cost estimates by incorporating government subsidies devoted
for hypertension prevention and CVD treatment.
References:
1. He, J., et al., Major Causes of Death among Men and Women in China. New England Journal of Medicine,
2005, 353(11): pp. 1124-1134.
2. Lopez, A.D., et al., Global and Regional Burden of Disease and Risk Factors, 2001: Systematic Analysis of
Population Health Data. The Lancet, 2006, 367(9524): p. 1747-1757.
3. Gu, D., et al., Prevalence, Awareness, Treatment, and Control of Hypertension in China. Hypertension,
2002, 40(6): pp. 920-927.
4. Hodgson, T.A. and L. Cai, Medical Care Expenditures for Hypertension, Its Complications, and Its
Comorbidities. Medical Care, 2001, 39(6): p. 599.
5. China Hypertension Association, China Hypertension Prevention and Treatment Guide 2005. Beijing:
China Ministry of Health Center of Disease Control, 2005.
6. Kearney, P.M., et al., Global Burden of Hypertension: Analysis of Worldwide Data. The Lancet, 2005,
365(9455): pp. 217-223.
7. Edejer, T.T.T., et al., WHO Guide to Cost-Effectiveness Analysis. Geneva: WHO, 2003.
8. Lauer, J.A., et al., PopMod: A Longitudinal Population Model with Two Interacting Disease States. Cost
Effectiveness and Resource Allocation, 2003, 1(6): pp. 1478-7547.
9. Murray, C.J.L., et al., Effectiveness and Costs of Interventions to Lower Systolic Blood Pressure and
Cholesterol: a Global and Regional Analysis on Reduction of Cardiovascular-Disease Risk. The Lancet,
2003, 361(9359): pp. 717-725.
10. Edelson, J.T., et al., Long-Term Cost-Effectiveness of Various Initial Monotherapies for Mild to Moderate
Hypertension. JAMA, 1990, 263(3): pp. 407-413.
11. He, J., et al., Stroke in the People's Republic of China I. Geographic Variations in Incidence and Risk
Factors. Stroke, 1995, 26(12): pp. 2222-2227.

28
12. Liu, M., et al., Stroke in China: Epidemiology, Prevention, and Management Strategies. Lancet Neurology,
2007, 6(5): pp. 456-464.
13. Rose, G., Sick Individuals and Sick Populations. 2001, Int. J. Epidemiology, pp. 427-432.
14. Emberson, J., et al., Evaluating the Impact of Population and High-Risk Strategies for the Primary
Prevention of Cardiovascular Disease. Eur Soc Cardiology, 2004, pp. 484-491.
15. Chobanian, A.V., et al., The Seventh Report of the Joint National Committee on Prevention, Detection,
Evaluation, and Treatment of High Blood Pressure The JNC 7 Report. JAMA, 2003, 289(19): pp. 2560-
2571.
16. Williams, B., et al., British Hypertension Society Guidelines for Hypertension Management 2004 (BHS-
IV): Summary. BMJ, 2004, 328(7440): pp. 634-640.
17. He, F.J. and G.A. MacGregor, Effect of Modest Salt Reduction on Blood Pressure: A Meta-Analysis of
Randomized Trials: Implications for public health. Journal of Human Hypertension, 2002, 16: pp. 761-770.
18. Hooper, L., C. Bartlett, and G.D. Smith, Advice to Reduce Dietary Salt for Prevention of Cardiovascular
Disease (Cochrane Review). The Cochrane Library, 2004.
19. Sacks, F.M., et al., Effects on Blood Pressure of Reduced Dietary Sodium and the Dietary Approaches to
Stop Hypertension (DASH) Diet. JAMA, 2001, 344(1): pp. 3-10.
20. Law, M.R., C.D. Frost, and N.J. Wald, By How Much Does Dietary Salt Reduction Lower Blood Pressure?
I--Analysis of observational data among populations. BMJ, 1991, 302(6780): pp. 811.
21. Frost, C.D., M.R. Law, and N.J. Wald, By How Much Does Dietary Salt Reduction Lower Blood Pressure?
II--Analysis of Observational Data within Populations. BMJ, 1991, 302(6780): pp. 815.
22. Law, M.R., C.D. Frost, and N.J. Wald, By How Much Does Dietary Salt Reduction Lower Blood Pressure?
III--Analysis of Data from Trials of Salt Reduction. BMJ, 1991. 302(6780): pp. 819.
23. Farquhar, J.W., et al., Effects of Communitywide Education on Cardiovascular Disease Risk Factors: The
Stanford Five-City Project. JAMA, 1990, 264(3): pP. 359-365.
24. Neal, B., The Effectiveness and Costs of Population Interventions to Reduce Salt Consumption. Presented
in the WHO Forum and Technical Meeting on "Reducing Salt Intake in Populations", 2006. Paris, France.
25. Pietinen, P., et al., Changes in Dietary Habits and Knowledge Concerning Salt During a Community-Based
Prevention Program for Hypertension. Ann Clin Res, 1984, 16(43): pp 150-155.
26. Selmer, R.M., et al., Cost and Health Consequences of Reducing the Population Intake of Salt. BMJ, 2000,
54(9): pp. 697-702.
27. Jackson, R., et al., Treatment with Drugs to Lower Blood Pressure and Blood Cholesterol Based on an
Individual's Absolute Cardiovascular Risk. The Lancet, 2005, 365(9457): pp. 434-441.
28. Liu, J., et al., Predictive Value for the Chinese Population of the Framingham CHD Risk Assessment Tool
Compared With the Chinese Multi-provincial Cohort Study. 2004, Am Med Assoc. pp. 2591-2599.
29. WHO, Reducing Salt Intake in Populations: Report of a WHO Forum and Technical meeting. 5-7 October
2006, Paris, France. 2006.

29
30. Havas, S., B.D. Dickinson, and M. Wilson, The Urgent Need to Reduce Sodium Consumption. JAMA,
2007, 298(12): p. 1439.
31. Department of Health, U.K., Public Health White Paper: Choosing Health: Making Healthy Choices
Easier. 2004, London, U.K.
32. Tian, H., et al., Dietary Sodium and Potassium, Socioeconomic Status and Blood Pressure in a Chinese
Population. Appetite, 1996, 26(3): pp. 235-246.
33. People’s Republic of China Ministry of Health, China Health Statistics Yearbook 2008. 2008, Beijing,
China.
34. The World Bank, 2005 International Comparison Program - Table of Final Results. 2008. Available at
http://siteresources.worldbank.org/ICPINT/Resources/ICPreportprelim.pdf. Last accessed on December 5,
2009.
35. Law, M.R., et al., Value of low dose combination treatment with blood pressure lowering drugs: analysis of
354 Randomised trials. BMJ, 2003, 326(7404): p. 1427.
36. Wu, J., et al., A Summary of the Effects of Antihypertensive Medications on Measured Blood Pressure.
American Journal of Hypertension, 2005, 18: pp. 935-942.
37. Neal, B., S. MacMahon, and N. Chapman, Effects of ACE inhibitors, Calcium Antagonists, and Other
Blood-Pressure-Lowering Drugs: Results of Prospectively Designed Overviews of Randomised Trials. The
Lancet, 2000, 356(9246): pp. 1955.
38. Black, H.R., et al., Principal Results of the Controlled Onset Verapamil Investigation of Cardiovascular End
Points (CONVINCE) Trial. JAMA, 2003, 289(16): pp. 2073-2082.
39. Dahlöf, B., et al., Cardiovascular Morbidity and Mortality in the Losartan Intervention For Endpoint
reduction in hypertension study (LIFE): A Randomised Trial against Atenolol. The Lancet, 2002,
359(9311): pp. 995-1003.
40. The ALLHAT Officers and Coordinators for the ALLHAT Collaborative Research Group, Major Outcomes
in High-Risk Hypertensive Patients Randomized to Angiotensin-Converting Enzyme Inhibitor or Calcium
Channel Blocker vs Diuretic. JAMA, 2002, 288: pp. 2981-2997.
41. Yusuf, S., et al., Effects of An Angiotensin-converting-Enzyme Inhibitor, Ramipril, on Cardiovascular
Events in High-Risk Patients: The Heart Outcomes Prevention Evaluation Study Investigators. New
England Journal of Medicine, 2000, 342(3): pP. 145-53.
42. PROGRESS Collaborative Group, Randomised Trial of A Perindopril-Based Blood-Pressure-
Lowering Regimen among 6105 Individuals with Previous Stroke or Transient Ischaemic Attack. The
Lancet, 2001, 358(9287): pp. 1026-1027.
43. Wang, W., et al., A Retrospective Drug Study of Large-Scale Clinical Trials on Cardiovascular Disease in
China. China Journal of Cardiology, 2000, 28(5): pp. 335-338.
44. Wang, J., et al., Assessment of Cost-Effectiveness of Treatment for Cardiovascular Disease from Large-
Sample Randomized Clinical Trials in China. China Journal of Cardiology, 2003, 31(1): pp. 24-28.

30
45. Li, W., X.Y. He, and Y.Q. Zhang, Meta-Analysis for Four Large-Scale Antihypertensive Clinical Trials.
China Journal of Disease Control and Prevention, 2007, 11(1): pp. 20-23.
46. Kotchen, T.A., Hypertension Control: Trends, Approaches, and Goals. Hypertension, 2007, 49(1): p. 19.
47. Chapman, R.H., et al., Predictors of Adherence with Antihypertensive and Lipid-Lowering Therapy.
Archives of Internal Medicine, 2005, pp. 1147-1152.
48. Benner, J.S., et al., Long-term Persistence in Use of Statin Therapy in Elderly Patients. JAMA, 2002,
288(4), pp. 455-461.
49. Siegel, D., J. Lopez, and J. Meier, Antihypertensive Medication Adherence in the Department of Veterans
Affairs. JAMA, 2007, 120(1): pp. 26-32.
50. The ALLHAT Officers and Coordinators for the ALLHAT Collaborative Research Group, Major Outcomes
in High-Risk Hypertensive Patients Randomized to Angiotensin-Converting Enzyme Inhibitor or Calcium
Channel Blocker vs Diuretic. JAMA, 2002, 288: pp. 2981-2997.
51. Dai, Junming et al., Compliance of Patients with Antihypertensive Therapy at Community in Shanghai (in
Chinese). Chinese Journal of Hypertension, 2001, 9(1).
52. Yang, Sumei et al., Analysis of Compliance and Influence Factors on Patients with Antihypertensive
Therapy. Journal of Changzhi Medical College, 2001, 15(1).
53. Guo, Hangyuan et al., Compliance with Antihypertensive Therapies among Hypertension Patients (in
Chinese). Chinese Journal of Epidemiology, 2001, 22(6).
54. Chen, Shouying, et al., The Influencing Factors on Compliance of Patient with Antihypertensive Therapy
(in Chinese). Chinese Journal of Hypertension, 2003, 11(5).
55. Tian, Zhenan et al., Analysis of Compliance with Antihypertensive Therapy among 297 Hypertension
Patients (in Chinese). Chinese General Practice, 2004, 7(19).
56. Xiao, Huimin et al. Compliance of Patients with Antihypertensive Therapy and the Influencing Factors.
Chinese Journal of Hypertension, 2002, 10(3).
57. Huang, Cunhua, et al., Survey of Compliance of Antihypertensive Therapy among Hypertension Patients
(in Chinese). Journal of Practical Medicine (Shi Yong Yi Xuan Za Zhi), 2005, 21(1).
58. Wang, J.G., et al., Chinese Trial on Isolated Systolic Hypertension in the Elderly. Systolic Hypertension in
China (Syst-China) Collaborative Group. Archive of Internal Medicine, 2000, 160(2): pp. 211-20.
59. Ong, K.L., et al., Prevalence, Awareness, Treatment, and Control of Hypertension Among United States
Adults 1999-2004. Hypertension, 2007, 49(1): p. 69.
60. Karppanen, H. and E. Mervaala, Sodium Intake and Hypertension. Progress in Cardiovascular Diseases,
2006, 49(2): pp. 59-75.
61. Geleijnse, J.M., et al., Reduction in Blood Pressure with a Low Sodium, High Potassium, High Magnesium
Salt in Older Subjects with Mild to Moderate Hypertension. BMJ, 1994, 309(6952): pp. 436-440.
62. Kawasaki, T., K. Itoh, and M. Kawasaki, Reduction in Blood Pressure with a Sodium-Reduced, Potassium-
and Magnesium-Enriched Mineral Salt in Subjects with Mild Essential Hypertension. Hypertension
Research, 1998, 21(4): pp. 235-43.

31
63. Karppanen, H., et al., Safety and Effects of Potassium-and Magnesium-Containing Low Sodium Salt
Mixtures. Journal of Cardiovascular Pharmacology, 1984, 6(1): p. S236.
64. Mervaala, E.M., et al., Beneficial Effects of A Potassium-and Magnesium-Enriched Salt Alternative.
Hypertension, 1992, 19(6): pp. 535-540.
65. Chang, H.Y., et al., Effect of Potassium-Enriched Salt on Cardiovascular Mortality and Medical Expenses
of Elderly men. American Journal of Clinical Nutrition, 2006, 83(6): p. 1289.
66. The China Salt Substitute Study Collaborative Study Group, Salt Substitution: a Low-cost strategy for
blood pressure control among rural Chinese. A Randomized, Controlled Trial. Journal of Hypertension,
2007, 25(10): pp. 2011-2018.
67. Li, N., et al., The Effects of a Reduced-Sodium, High-Potassium Salt Substitute on Food Taste and
Acceptability in Rural Northern China. British Journal of Nutrition, 2008, 101(07): pp. 1-6.
68. Pietinen, P., et al., Changes in Diet in Finland from 1972 to 1992: Impact on Coronary Heart Disease Risk.
Preventive Medicine, 1996, 25(3): pp. 243-250.
69. Vartiainen, E., et al., Cardiovascular Risk Factor Changes in Finland, 1972-1997. International Journal of
Epidemiology, 2000, 29, pp. 49-56.
70. Tian, H.G., et al., Changes in Sodium Intake and Blood Pressure in a Community-Based Intervention
Project in China. Journal of Human Hypertension, 1995, 9(12): pp. 959-68.
71. Song, G., et al., Analyzing of Risk Factors of Comprehensive Intervention on Non-communication Chronic
Disease in Tianjin. China Journal of Prevention and Control of Chronica Non-Communication Disease,
2000, 8(2): pp. 57-59.
72. Pahor, M., et al., Health Outcomes Associated with Calcium Antagonists Compared with Other First-Line
Antihypertensive Therapies: A Meta-Analysis of Randomised Controlled Trials. The Lancet, 2000,
356(9246): pp. 1949-1954.
73. Collins, R. and R. Peto, Antihypertensive Drug Therapy: Effects on Stroke and Coronary Heart Disease,
Textbook of Hypertension. Oxford: Blackwell Scientific Publications, 1994: pp. 1156–64.
74. Collins, R., et al., Blood Pressure, Stroke, and Coronary Heart Disease. Part 2, Short-Term Reductions in
Blood Pressure: Overview of Randomised Drug Trials in Their Epidemiological Context. The Lancet, 1990,
335(8693): pp. 827-38.
75. He, J. and P.K. Whelton, Elevated Systolic Blood Pressure as A Risk Factor for Cardiovascular and Renal
Diseases. Journal of Hypertension, Supplement, 1999, 17(2): pp. 7-13
76. Psaty, B.M., et al., Health Outcomes Associated with Antihypertensive Therapies Used as First-Line
Agents: A Systematic Review and Meta-Analysis. JAMA, 1997, 277(9): pp. 739-745.
77. UNPD. UN Data, 2008. Available at http://data.un.org/. Last Accessed on December 5, 2008.
78. Gu, D., et al., Prevalence, Awareness, Treatment, and Control of Hypertension in China. Hypertension,
2002, 40: pp. 920-927.
79. He, J., et al., Serum Total and Lipoprotein Cholesterol Levels and Awareness, Treatment, and Control of
Hypercholesterolemia in China. JAMA, 2004, 110(4): pp. 405-411.
32
80. Gu, D., et al., Cigarette Smoking and Exposure to Environmental Tobacco Smoke in China: The
International Collaborative Study of Cardiovascular Disease in Asia. American Journal of Public Health,
2004, 94(11): pp. 1972-1976.
81. Gu, D., et al., Body Weight and Mortality among Men and Women in China. JAMA, 2006, 295(7):.pp. 776-
783.
82. K. Nakamura, F.B., T.-H. Lam, R. Huxley, V. L. Feigin, H. Ueshima, J. Woo, D. Gu, T. Ohkubo, C. M.M.
Lawes, Cigarette Smoking, Systolic Blood Pressure, and Cardiovascular Diseases in the Asia-Pacific
Region. Stroke, 2008, 39(6): pp. 1694 - 1702.
83. Woodward, M., et al., Cohort profile: the Asia Pacific Cohort Studies Collaboration. International Journal
of Epidemiology, 2006, 35(6): pp. 1412.
84. Moran, A., et al., The Future Impact of Population Growth and Aging on Coronary Heart Disease in China:
Projections from the Coronary Heart Disease Policy Model-China. BMC Public Health, 2008, 8(1): pp. 394.
85. Murray, C.J.L., Alan Lopez, Colin Mathers, and Claudia Stein. The Global Burden of Disease 2000 Project:
Aims, Methods and Data Sources. The Program on Evidence for Health Policy Discussion Paper No.36,
WHO, November 2001.
86. WHO, Available at http://www.who.int/healthinfo/global_burden_disease/tools_software/en/. Last accessed
on January 23, 2009.
87. Truelsen, T., et al., Trends in Stroke and Coronary Heart Disease in the WHO MONICA Project. Stroke,
2003, 34(6): p. 1346.
88. WHO. Global Burden of Disease 2008. Available at
http://www.who.int/healthinfo/global_burden_disease/en/index.html. Last accessed on December 20, 2008.
89. Gao, R., et al., Prospective Observational Study of Acute Coronary Syndromes in China: Practice Patterns
and Outcomes. Heart, 2008, 94(5): p. 554.
90. Turnbull, F., A. Patel, and R. Gao, The Experience of Patients Admitted with Acute Coronary Syndromes
(ACS) to Hospitals in China. Heart, Lung and Circulation, 2007, 16: pp. 76-77.
91. Lawes, C.M.M., F. VL, and R. A., Blood pressure and burden of disease, in Ezzati, M., et al. (ed.)
Comparative Quantification of Health risks: Global and Regional Burden of Disease Attributable to
Selected Major Risk Factors. 2004, Geneva: WHO.
92. Marseille, E., et al., Cost Effectiveness of Single-Dose Nevirapine Regimen for Mothers and Babies to
Decrease Vertical HIV-1 Transmission in Sub-Saharan Africa. The Lancet, 1999, 354(9181): pp. 803-809.
93. Bank, T.h.W., World Development Report 1993: Investing in Health. 1993: Oxford University Press.
94. Rushby, J.A.F. and K. Hanson, Calculating and Presenting Disability Adjusted Life Years (DALYs) in
Cost-Effectiveness Analysis. Health Policy and Planning, 2001, 16(3): pp. 326-331.
95. Ranson, M.K., et al., Global and Regional Estimates of the Effectiveness and Cost-Effectiveness of Price
Increases and Other Tobacco Control Policies. Nicotine & Tobacco Research, 2002: 4(3): pp. 311-319.
96. Goodman, C.A., P.G. Coleman, and A.J. Mills, Cost-effectiveness of Malaria Control in Sub-Saharan
Africa. The Lancet, 1999, 354(9176): pp. 378-85.

33
97. Politi, C., et al., Cost-effectiveness Analysis of Alternative Treatments of African Gambiense
Trypanosomiasis in Uganda. Health Economics, 1995, 4(4): pp. 273-87.
98. Murray, C.J.L. and A.D. Lopez, The Global Burden of Disease: A Comprehensive Assessment of Mortality
and Disability from Diseases, Injuries, and Risk factors in 1990 and Projected to 2020. 1996, Cambridge,
MA: Harvard University Press.
99. Mathers, C.D., et al., Alternative Summary Measures of Average Population Health, in Health Systems
Performance Assessment: Debates, Methods and Empiricism, World Health Organization, 2003, Geneva.
100. Tian, H., et al., Cost Estimation for the Tianjin Chronic Non-Communication Disease Project 1991-1996.
China Journal of Prevention and Control of Chronica Non-Communication Disease, 2000, 8(1): pp. 32-34.
101. Sun, Q. et al., Pharmaceutical Policy in China. Health Affairs, 2008, 27(4): pp. 1042-1050.
102. Hu, Shanlian et al., Reform of How Health Care is Paid for in China: Challenges and Opportunities. The
Lancet, 2008, 372(9652): pp. 1846-1853.
103. Beijing NDRC, Medical Services Price in Beijing 2000. Available at
http://service2.bjpc.gov.cn/bjpc/mediprice/MedicalService1.jspUU . Last accessed on Jan. 20, 2009
104. China National Reform and Development Committee, Upper Limit Retail Price for Western Medicine.
2006, Beijing, China.
105. Liu, Y., Personal communication with Dr. Bruce Neal and Dr. Nicole Li in August, 2008.
106. Li, H.Y., et al., Analysis of Outpatient Hypertension Treatment among Different Grade Hospitals in
Beijing. China Journal of Cardiology, 2005, 33(2): pp. 174-177.
107. Stinnett, A.A., et al., The Cost-Effectiveness of Dietary and Pharmacologic Therapy for Cholesterol
Reduction in Adults, in M.R. Gold, et al. (ed.), Cost-Effectiveness in Health and Medicine. 1996, New York
and Oxford: The Oxford University Press.
108. Tan, Huiqiong, et al., Two-Year Follow-Up of Acute Ischemic Syndrome without ST Elevation (in
Chinese). China Medical Journal (Zhong Hua Yi Xue Za Zhi), 2005, 85(3): pp. 184-188.
109. Hemenway, D., et al., Comparative Costs Versus Symptomatic and Employment Benefits of Medical and
Surgical Treatment of Stable Angina Pectoris. Medical Care, 1985, 23(2): pp. 133-41.
110. Wong, K.S. and H. Li, Long-Term Mortality and Recurrent Stroke Risk among Chinese Stroke Patients
With Predominant Intracranial Atherosclerosis. Stroke, 2003, 34: pp. 2361-2366.
111. Taylor, T.N., et al., Lifetime Cost of Stroke in the United States. Stroke, 1996, 27(9): pp. 1459-1466.
112. Xu, L. et al., Factors Affecting the Outpatient Expenditure Among Residents Age 15 and Above in Big
Cities (in Chinese). Chinese Journal of Hospital Statistics (Zhong Guo Yi Yuan Tong Ji), 2000, 7(3): pp.
131-134.
113. Dong, Wenli, et al., Analysis of Factors Affecting Health Care Utilization among AMI patients in Tianjin
(in Chinese). Chinese Journal of Prevention and Control of Chronic Non-Communicable Diseases (Zhong
Guo Man Xing Bing Yu Fang Yu Kong Zhi), 1999, 3(7).
34
114. Yang, Li and Kong Lingzhi, Multi-factor Analysis of the Treatment Costs for Acute Ischemic Syndrome (in
Chinese). Chinese Journal of Prevention and Control of Chronic Non-Communicable Diseases (Zhong Guo
Man Xing Bing Yu Fang Yu Kong Zhi), 2000. 8(2).
115. WHO, Macroeconomics and Health: Investing in Health for Economic Development: Report of the
Commission on Macroeconomics and Health. 2001, Geneva: WHO.
116. WHO, Diet, Nutrition and the Prevention of Chronic Diseases. WHO Technical Report Series No.916.
Geneva: WHO, 2003.
117. Zhou, B.F., et al., Nutrient Intakes of Middle-Aged Men and Women in China, Japan, United Kingdom, and
United States in the Late 1990s: The INTERMAP Study. Journal of Human Hypertension, 2003, 17: pp.
623-630.
118. He, F.J. and G.A. Macgregor, Can a Low-Sodium, High-potassium Salt Substitute Reduce Blood Pressure
in Rural Chinese People? Nature Review Cardiology, 2008, 5, pp.186-187.
119. Vines, G., Preventing Iodine Deficiency in China. 2007. Washington, D.C.: Center for Global
Development.
120. Lammie, P., T. Milner, and R. Houston, Unfulfilled Potential: Using Diethylcarbamazine-Fortified Salt to
Eliminate Lymphatic Filariasis. WHO Bulletin, 2007, 85(7): p. 545.
121. Houston, R., Salt Fortified with Diethylcarbamazine (DEC) as An Effective Intervention for Lymphatic
Filariasis, with Lessons Learned from Salt iodization Programmes. Parasitology, 2001, 121(S1): pp. 161-
173.
122. Doorenbos, C.J. and C.G. Vermeij, Danger of Salt Substitutes that Contain Potassium in Patients with Renal
Failure. BMJ, 2003, 326(7379): pp. 35-36.
123. Tosteson, A.N.A., et al., Cost-Effectiveness of Populationwide Educational Approaches to Reduce Serum
Cholesterol Levels. Circulation, 1997, 95(1): pp. 24-30.

35
Appendix A: predicted change in systolic blood pressure by gender and age group after
nationwide use of a low-sodium salt substitute by legislation
Age Group Men Women
30-44 -1.9% -1.6% 45-59 -2.4% -2.1% 60-69 -3.2% -3.0% 70-79 -3.9% -3.6% 80+ -4.7% -4.3%
* Assume the content of the salt substitute is 65% sodium, 25% potassium and 10% magnesium ** Assuming all discretionary use of salt is replace by the salt substitute, i.e. daily sodium intake reduction is 35%´75%=26% Estimating method based on: Law, M.R., C.D. Frost, and N.J. Wald, By how much does dietary salt reduction lower blood pressure? I--Analysis of observational data among populations. BMJ: British Medical Journal, 1991. 302(6780): p. 811. Frost CD, Law MR, Wald NJ. By how much does dietary salt reduction lower blood pressure? II Analysis of observational data within populations. BMJ 1991. 302: 815–18. Law MR, Frost CD, Wald NJ. By how much does dietary salt reduction lower blood pressure? III Analysis of data from trials of salt reduction. BMJ 1991. 302:819–24. Lawes C, Feigin V, Rodgers A. Estimating reductions in blood pressure following reductions in salt intake by age, sex and WHO region. Auckland: ClinicalTrials Research Unit, University of Auckland, 2002.

36
Appendix B: Key Model Parameters for the PoPMoD Simulation Parameters Source(s) Demography
Live birth Population by age and by gender Mortality rates by age and by gender
UNPD 2005 projection [1]
Epidemiological parameters for IHD Incidence of AMI by age and by gender Ratio of first-ever AMI to all AMI 24-hour case fatality for AMI 28-day case fatality for AMI Out-of-hospital case fatality for AMI Incidence of long-term AMI survivors Prevalence of long-term AMI survivors Case fatality for long-term AMI survivors Mortality for AMI Incidence for angina pectoris Prevalence for angina pectoris % of AMI survivors that develop CHF Incidence of congestive heart failure (CHF) Prevalence of CHF Case fatality of CHF
WHO-MONICA Beijing [2] Global Burden of Disease 2000 [3, 4]
Epidemiological parameters for stroke Incidence for first-ever stroke Prevalence of first-ever stroke 28-day case fatality for stroke % of 28-day fatal stroke cases that are out-of-hospital % of 28-day fatal stroke cases that are ischaemic stroke Incidence of long-term stroke survivors Prevalence of long-term stroke survivors Case fatality for long-term stroke survivors % for long-term stroke survivors dying from stroke Mortality for stroke
WHO-MONICA Beijing [2] Global Burden of Disease 2000 [3, 4]
Current coverage of interventions For AMI during acute phase (28 days) For AMI during post-acute phase For stroke during acute phase (28 days) For stroke during post-acute phase For CHF
WHO-MONICA Beijing [2] Global Burden of Disease 2000 [3, 4] CPACS [5, 6]
1. UNPD. UNdata. 2008 [cited; Available from: http://data.un.org/Browse.aspx?d=POP. 2. Truelsen, T., et al., Trends in Stroke and Coronary Heart Disease in the WHO MONICA Project.
Stroke, 2003. 34(6): p. 1346. 3. Murray, C.J.L., P. Harvard Center for, and S. Development, The Global Burden of Disease 2000
Project: Aims, Methods and Data Sources. 2001: Harvard Burden of Disease Unit, Center for Population and Development Studies.
4. Murray, C.J.L. and A.D. Lopez, The Global Burden of Disease: a comprehensive assessment of mortality and disability from diseases, injuries, and risk factors in 1990 and projected to 2020. 1996, Cambridge, MA: Harvard University Press.
5. Gao, R., et al., Prospective observational study of acute coronary syndromes in China: practice patterns and outcomes. Heart, 2008. 94(5): p. 554.
6. Turnbull, F., A. Patel, and R. Gao, The Experience of Patients Admitted with Acute Coronary Syndromes (ACS) to Hospitals in China. Heart, Lung and Circulation, 2007. 16: p. 76-77.

37
Appendix C: Disability Weights Used for Estimating of DALY
Disease State Disability Weights AMI 0.44321 Angina 0.16109 CHF 0.24683 Acute stroke 0.92000 Long-term Stroke Survivor 0.24309
Mathers, C.D., et al., Alternative Summary Measures of Average Population Health, in Health Systems Performance Assessment: Debates, Methods and Empiricism, World Health Organization, 2003, Geneva.

38
Essay 2
Confronting Heterogeneity in Litigation Event Studies—the Case of Trial
Verdicts in Medical Products Mass Torts8
8 To be submitted to an academic journal with Steve Garber as a co-author.

39
Section 1: Introduction
Many prominent mass torts in the U.S. have involved medical products (i.e., pharmaceuticals
and medical devices). During the past three decades, mass torts involving products such as
silicone-gel breast implants, Fen-phen and Vioxx, have cost defendants billions of dollars in
defense and indemnity costs. The economic effects of product liability for medical products
are a prominent issue in the policy debate concerning reform of the U.S. product liability
system. Garber (1993, 1998) analyzed effects of medical products liability on various
economic outcomes, Manning (1994, 1997) analyzed effects of product liability on drug
prices, and Viscusi and Moore (1993) analyzed effects of product liability, not limited to
medical products, on innovation. Whether the social benefits of such litigation (e.g.,
deterrence of inefficiently unsafe behavior) exceed the social costs (transaction costs of
disputing, inducement of inefficient manufacturer decisions) for medical products or more
broadly is unknown and controversial (e.g., Polinsky and Shavell, 2009).
Recently the Financial Accounting Standards Board (FASB) proposed, for the purposes of
protecting investors, regulations that would require pharmaceutical companies to disclose
estimated costs of on-going litigation. Industry leaders responded to this policy proposal
negatively by asserting that subjective estimates would be unlikely to provide meaningful
information given the volatile nature of product liability litigation (Favoli [is this spelling
correct or the one in the reference list? please correct] and Mundy, 2008). An open question
is the extent to which estimated effects of litigation events such as lawsuit filings, judicial
rulings, trial outcomes and settlements on defendant firms’ stock prices and market values
can be helpful in developing the information that the FASB proposed that manufacturers
disclose to investors.
In this article, we examine effects of verdicts on product liability trials on the value of firms
involved in medical product mass torts. We focus on trial verdicts because they are often very
influential on the eventual defendant costs of mass torts in which thousands or tens of
thousands or more similar lawsuits involving a single drug or device are often resolved
through settlements valued in large part on the basis of the outcomes of a handful of trials.

40
Trials, formally or informally used as “bellwether trials,” offer critical information about the
realities of liability and damages for all pending and future claims to all parties involved in
the mass tort (Barton, 1999; Rheingold 2008). For example, in the recent mass tort involving
the prescription drug Vioxx, Merck reached a $4.5 billion settlement with tens of thousands
of plaintiffs after sixteen trials in federal and state courts. This settlement cost, which was
considerably less than many securities analysts’ initial estimates, is widely viewed as a result
of Merck’s successful track record in Vioxx trials.9 Because a firm’s stock price reflects
investors’ beliefs about the present value of the firm’s future profits—and litigation costs are
part of those profit calculations—trial results in ongoing mass torts should, in principle, affect
a firm’s stock price by changing investors’ beliefs about the firm’s future litigation costs.
This article is organized as follows. The next section reviews previous event studies of
product liability litigation and argues that heterogeneity of events whose average effects are
estimated obscures the meaning of reported results and greatly limits the applicability of these
results to other sets of events. In section 3 we present a model for predicting stock-market
reactions to outcomes of trial verdicts that emphasizes whether the defendant or the plaintiff
prevailed at trial and, in the latter case, the size of the damage award. Section 4 uses the
model to develop testable implications that are summarized by five hypotheses, and section 5
presents the regression equation we use to estimate the determinants of cross-verdict variation
in (abnormal) stock-market reactions and test the hypotheses. Development of our data for
113 trials in nine medical product mass torts is discussed in section 6, and section 7 presents
estimates of average percentage and dollar abnormal returns for our 48 and 65 sample
verdicts for plaintiffs and defendants, respectively. We find large and statistically significant
negative effects on stock prices and defendant firms’ values for plaintiff verdicts, but at best
weak evidence of positive effects when defendants prevail at trial. Section 8 reports results of
our regression analyses. Virtually all of the estimated regression coefficients are of the signs
predicted by our model—most of the estimates pertaining to plaintiff verdicts are statistically
significant, but most of the estimates pertaining to defendant verdicts are not. Concluding
comments are offered in section 9.
9 Merck prevailed in twelve of the sixteen jury trials that reached a verdict. Three of the four plaintiff verdicts were overturned or the awards were subsequently reduced.

41
Section 2: Previous Event Studies of Product Liability Litigation
Several event studies—i.e., studies of stock-price reactions litigation events—have estimated
wealth effects of product liability litigation. Only one of these studies focused entirely on trial
verdicts. One possible reason is that this article (Garber and Adams, 1998) found no
significant average market reactions for the automobile industry. Commentators have
attributed the lack of effect to a variety of reasons. One explanation is that verdicts can be
anticipated by investors and, thus, there is little, if any, new investor-relevant information
when a verdict is announced (Peltzman 1998; Prince and Rubin 2002). This explanation,
however, conflicts sharply with many anecdotal media reports about stock analysts waiting
anxiously for outcomes of verdicts to update their litigation cost estimates for mass torts (e.g.,
in the context of Vioxx see Gold, 2006; Johnson, 2005a,b; Hays 2005).
Another potential explanation for the largely null findings of Garber and Adams (1998) about
average wealth effects for plaintiff and defendant trial wins, however, is that their sample
included two types of verdicts. The first type, which account for a majority of their sample,
includes lawsuits that were not closely related to large numbers of other pending lawsuits
against the defendant firms, and the second type involves lawsuits that were part of a larger
set of similar pending claims (i.e., a “mass” tort). An empirical result supporting this
interpretation is that while Garber and Adams did not find an overall average impact of
plaintiff verdicts on firms’ value when pooling both types claims, they did find evidence that
the second type of verdicts have a significant impact on defendant firms’ market value.10
Because we focus only on verdicts from medical product mass torts in this article, and
numbers of claims in medical products mass torts are often orders of magnitude larger than
those for motor vehicles, we believe the verdicts analyzed here are more likely to have a
significant effects of firms’ value than those analyzed by Garber and Adams (1998).
10 In particular, in a regression analysis of cross-verdict abnormal returns associated with their sample of verdicts for plaintiffs, Garber and Adams (1998) include a variable indicating whether the existence of (presumably, fairly large numbers of) similar lawsuits were reported in the defendant firms’ SEC 10-K reports. This variable was found to be associated with larger (absolute) market responses to verdicts.

42
Other event studies of developments in product liability litigation focus on the automobile or
pharmaceutical industry or both. These studies have produced mixed results. Table 2.1
summarizes major characteristics and results of these studies.
Table 2.1: Summary of Existing Product Liability Litigation Event Studies
* Day t=0 is the day when the event occurred, t < 0 indexes trading days before the event and t > 0 indexes trading days after the event.
The earliest study, Viscusi and Hersch (1990), examine the stock-market reactions to
announcements in the Wall Street Journal of 29 events between 1970 and 1985 related to
defective products. They also provide a brief examination of mass torts involving Agent
Orange and the drug DES (diethylstilbestrol). They found significant negative impact of
litigation events on the market values of firms involved. Prince and Rubin (2002) used
samples of 44 auto-safety litigation events and 62 drug-safety litigation events. Overall they
found significant negative market response associated with initial filing events but not with
what they call “losing” events. Govindaraj et al. (2007) reexamine Prince and Rubin (2002)’s
findings in the auto industry with an expanded sample of 609 litigation events. They found
that after eliminating a single extraordinary litigation outcome involving Ford, stock market
responses are no longer significant. They concluded that the market reacts only to the most
extreme and infrequent litigation events.

43
A common feature of all of the studies discussed above is that, to varying degrees, analysts
have treated sets of somewhat heterogeneous events as a single type and estimated average
effects within such types. As just discussed, Garber and Adams (1998) combine verdicts in
cases that are and are not members of larger sets of related cases. Moreover, the sample of
Viscusi and Hersch (1990) includes safety regulation violations, lawsuit filings and judicial
rulings. The “losing” events analyzed jointly by Prince and Rubin (2002) include both
defendants’ losses at trials and adverse judicial rulings of various types. Finally, Govindaraj
et al. (2008) include a category of “subsequent initial reports” which consist of reports of any
product liability lawsuit claims, regardless of the context. Such aggregation over
heterogeneous events fails to accommodate the possibility that different types of events
within a somewhat heterogeneous set may affect investors’ beliefs about firms’ asset value
through different channels and to substantially different degrees. Thus, the approaches in the
existing literature fails both to offer meaningful estimates of average effects that would apply
to other sets of events and to provide as much information as might be contained in the
available data.
With the exception of Prince and Rubin (2002), the earlier studies use regression analysis to
develop some insight concerning how event-specific characteristics affect the magnitude of
stock market effect size (or lack of impact). For example, the estimates of Garber and Adams
(1998) suggests that market responses to plaintiff verdicts are larger when damage awards are
larger, when the Wall Street Journal reports the verdict, and (as discussed above) when
investors have been informed similar pending cases through the firm’s SEC 10-K filings.
Govindaraj et al. (2008) found that the market response appears to be larger when the
estimated potential damage award associated with a lawsuit filing is larger. However, these
econometric analyses are not based on any formal theoretical model of why and how a
defendant firm’s value is affected by product liability litigation events. We address this gap in
the current study.
Section 3: Litigation Costs, Trial Verdicts and Stock Prices: Theoretical Framework

44
A verdict in a trial that is part of a particular mass tort is expected to affect the stock price of
the defendant firm to the extent that the verdict conveys new information to investors about
the future costs of resolving claims in the same mass tort. When a defendant is found not
liable at trial—an event that we refer to as a “defense win” or a “defense verdict”—the trial
outcome is informative about the likelihood that unresolved claims within the mass tort will
eventually be resolved by a compensation payment (either at trial or through settlement).
Alternatively, when a defendant is found liable at trial—a situation we refer to as a “plaintiff
win” or a “plaintiff verdict”—the trial outcome is informative about the likelihood of future
compensation payments as well as the sizes of such future payments. More specifically, the
size of the award announced by the fact finder (jury or judge) in the case of a plaintiff verdict
also conveys to investors information about sizes of future compensation payments when
such payments are made. We model investors’ beliefs in terms of subjective probabilities and
use Bayes Rule to formalize how beliefs evolve or are updated as new information becomes
available.
In medical product mass torts, the strategy of using verdict outcomes to estimate future
litigation costs to the defendant—and the likelihood that such effects are large enough to be
empirically discernible—is supported by the formal or informal practice of “bellwether” or
“representative” trials. In particular, in a mass tort involving large numbers of similar claims,
bellwether cases are usually selected by the Judge who oversees a consolidated federal or
state mass tort. Although the specific methods used to select bellwether cases vary
substantially from one mass tort to another, it usually involves some level of randomization
and input from both the plaintiff and defendant steering committees, the groups of lawyers on
each side who represent all of the lawyers on their side (Faulk et al.1998; Sherman 2006;
Fallon et al. 2008). The ultimate purpose of holding bellwether trials is often not to resolve
thousands of related cases in “representative” proceeding, but instead to provide meaningful
information and experience to inform lawyers on both sides of the strength or value of such
claims, and this information is used to inform settlement negotiations (Fallon et al. 2008). In
this section, we present a theoretical framework that characterizes the pathways through
which a trial verdict in a mass tort would affect a defendant firm’s market value through
stock-price reactions.

45
Consider a firm that is a defendant in mass tort i, and let the subscript i denote the defendant
firm as well as the mass tort.11 We start with a standard assumption that the value of a
defendant firm i at the close of trading day t—denoted by —equals investors’ assessment of
the present value of the firm’s expected future profits. We additively decompose this value
into two parts, namely the present value of profits absent the mass tort (denoted by ) minus
the present value of expected future costs of mass tort i to the firm (denoted by ).
Formally,
. (1)
Let be an operator denoting a change during an event window w, namely the change from
shortly before to shortly after the announcement of a verdict.12 Then the change in the value
of firm during an event window is the sum of two changes:
(2)
where and are, respectively, the changes during the event window in the value
of the firm due to events that are not and are related to the eventual defendant costs of the
mass tort. As is standard in event studies, we assume that—after netting out effects of general
market movements during the event window13— = 0. Thus
, (3)
11 In our data, there are some firms that are defendants in more than one mass tort and a mass tort (silicon-gel breast implants) in which more than one firm was a defendant. Nonetheless, in the interest of notational economy, in this section, we use a single subscript to denote the firm and the mass tort. 12 For example, in our empirical work, we consider event windows of (i) one trading day before to one trading day after the day the verdict is announced (denoted by (-1,1)), and (ii) for sensitivity analysis purposes, also five trading days before to five trading days after the day the verdict is announced (denoted by (-5,5)). In the case of the (-1,1) window, the operator is defined for any variable by . 13 More specifically, and as detailed in section 6, we (following common practice in event studies) analyze empirically “abnormal” stock returns, which are deviations of actual (or observed) returns from the levels that would be predicted from general stock-market movements during the event windows.

46
or that the expected change in the value of a firm during an event window (after
accounting for general market movements during that time interval) is minus the expected
present value of the change during the event window of investors’ beliefs about the future
costs to the defendant firm associated with the mass tort. Although the defendant’s litigation
costs include both defense costs and indemnity (or compensation) payments, we focus on
indemnity costs, assuming that investors’ forecasts of defense costs depends on factors that
do not change during the event windows.
We model future indemnity costs as resulting from three factors that vary across time within a
mass tort as well as varying across mass torts. These factors, whose product determines a
defendant company’s future costs of a mass tort, are (i) the probability that a claim or lawsuit
that has not yet been resolved will result in an indemnity payment, (ii) the size of an
indemnity payment conditional on such a payment being made, and (iii) the number of claims
that will be resolved in the future. We assume that—according to investors’ subjective
beliefs—the probability of a payment being made (the first factor) is uncorrelated with the
size of a payment when a payment is made (the second factor). We further assume, in this
case for analytic convenience, that the eventual number of claims to be resolved is constant
within an event window.
Invoking these assumptions allows us to write the investors’ expected present value of future
indemnity payments as the product of three variables:14
= , (4)
where
= the mean of investors’ subjective distribution as of day t over the probability that
a currently unresolved claim in mass tort i will result in a payout,
14 Writing the expected value of costs as a product of the expected values of the random variables and (multiplied by the non-stochastic variable ) follows from the assumption that beliefs about the probability of future trial wins by plaintiffs are uncorrelated with beliefs about the size of the award given that there is an award. More specifically, when two random variables are uncorrelated, the expected value of their product is the product of their expected values.

47
= the mean of investors’ subjective distribution as of day t over the dollar size of
the future indemnity payment per unresolved claim in mass tort i conditional on a
payout, and
= the eventual number of claims in mass tort i, which we assume is fixed during an
event window.15
Regarding investors’ beliefs about the probability that a currently unresolved claim will
eventually be resolved by a (compensation or indemnity) payment from the defendant to the
plaintiff, we proceed as follows. We assume that the mean of investors’ subjective
distribution over this probability, which we have denoted by , is determined by a
function , where and are the numbers of plaintiff and defendant trial
verdicts, respectively, in mass tort i prior to the trial event under consideration. We assume
> 0 and < 0, i.e., that a plaintiff verdict increases, and defendant verdict decreases,
the mean of investors’ subjective distributions over the probability of payouts on claims that
will be resolved in the future.
Regarding investors’ beliefs about the sizes of such future payments, we proceed as follows.
First, we assume that is unaffected by information revealed by a defendant win at trial; this
is because a defendant win at trial, which involves no award, reveals no new information
about future payment sizes. In contrast, when the verdict under consideration is a plaintiff
win, the size of the award does reveal new information about sizes of future payments.
Accordingly, we assume that the mean of investors’ subjective distributions, which we have
denoted by , depends on the sizes of all past (non-zero) plaintiff awards in mass tort i.
Formally, , where is a vector, with elements denoted by , containing the dollar
values of all plaintiff awards in mass tort i observed through day t. We assume that the
function f is increasing in all of its arguments; i.e., the larger is any observed award, the
15 We impose this assumption because we have been unable to develop a satisfactory empirical method to account for changes in investors’ beliefs due to a verdict (equivalently, during the event window) about the number of claims to be resolved in the future (whether currently pending or yet to be filed).

48
larger is investors’ expected value of the size of a future payment (conditional on such a
payment). Formally, the assumption is > 0.
With these additional assumptions, (4) can be rewritten as
. (5)
Our interest centers on how investors’ beliefs about the present value of expected future costs
of mass tort i change in response to two features of a new verdict, namely, (i) whether the
trial resulted in a win for the defendant or a win for the plaintiff, and (ii) if the trial resulted in
a plaintiff win, the size of the award. Suppressing the i and t subscripts (for notational
simplicity) and differentiating (5) with respect to , , and yields,
= + + . (6)
Where = 0 when a trial results in a defendant win, and (generally) 0 when the trial
results in a plaintiff win.
Using (6) to approximate changes during event window w in the present value of expected
future costs for discrete changes in , , and , which we denote by , yields
+ + . (7)
To interpret (7), consider the following.
Verdicts for defendants. When the event in window w is a defendant verdict, = 0, =
1 and = 0. Then, using (7), we have
= , (8)
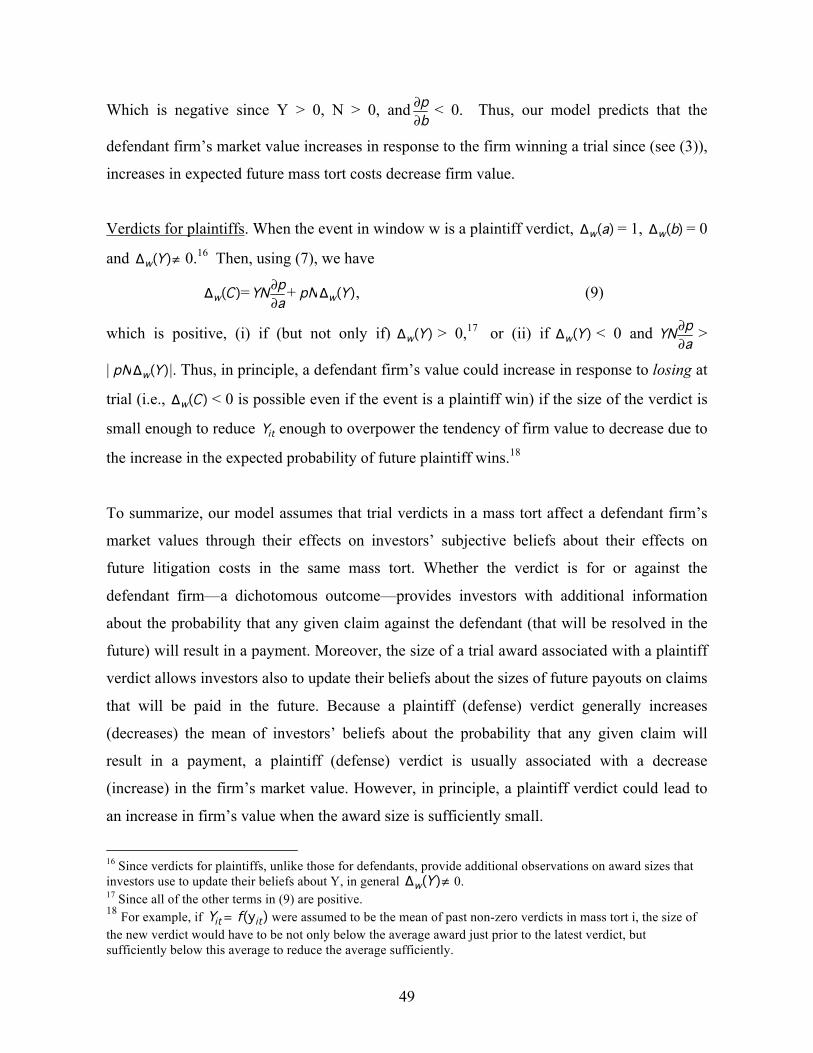
49
Which is negative since Y > 0, N > 0, and < 0. Thus, our model predicts that the
defendant firm’s market value increases in response to the firm winning a trial since (see (3)),
increases in expected future mass tort costs decrease firm value.
Verdicts for plaintiffs. When the event in window w is a plaintiff verdict, = 1, = 0
and 0.16 Then, using (7), we have
= + , (9)
which is positive, (i) if (but not only if) > 0,17 or (ii) if < 0 and >
| |. Thus, in principle, a defendant firm’s value could increase in response to losing at
trial (i.e., < 0 is possible even if the event is a plaintiff win) if the size of the verdict is
small enough to reduce enough to overpower the tendency of firm value to decrease due to
the increase in the expected probability of future plaintiff wins.18
To summarize, our model assumes that trial verdicts in a mass tort affect a defendant firm’s
market values through their effects on investors’ subjective beliefs about their effects on
future litigation costs in the same mass tort. Whether the verdict is for or against the
defendant firm—a dichotomous outcome—provides investors with additional information
about the probability that any given claim against the defendant (that will be resolved in the
future) will result in a payment. Moreover, the size of a trial award associated with a plaintiff
verdict allows investors also to update their beliefs about the sizes of future payouts on claims
that will be paid in the future. Because a plaintiff (defense) verdict generally increases
(decreases) the mean of investors’ beliefs about the probability that any given claim will
result in a payment, a plaintiff (defense) verdict is usually associated with a decrease
(increase) in the firm’s market value. However, in principle, a plaintiff verdict could lead to
an increase in firm’s value when the award size is sufficiently small.
16 Since verdicts for plaintiffs, unlike those for defendants, provide additional observations on award sizes that investors use to update their beliefs about Y, in general 0. 17 Since all of the other terms in (9) are positive. 18 For example, if were assumed to be the mean of past non-zero verdicts in mass tort i, the size of the new verdict would have to be not only below the average award just prior to the latest verdict, but sufficiently below this average to reduce the average sufficiently.

50
Section 4: Testable Predictions about the Sizes of Market Reaction
Our model highlights major pathways through which a verdict affects a defendant firm’s
stock price (market value). It also explains why, on average, we expect plaintiff verdicts to
depress a defendant firms’ market value and defense verdicts to increase a defendant firm’s
market value. A more intriguing question, however, is the circumstances under which we
should we expect a larger or smaller stock-market reaction when a new verdict occurs. We
address that question in this section.
The sizes of the changes in the value of the firm in response to a new trial verdict are
determined by the three exogenous variables, , , and (in the case of a plaintiff verdict) ,
which we use to denote the size of the trial verdict associated with event window w.
To develop comparative static predictions for changes in , , and consider defense and
plaintiff verdicts in turn. For defense verdicts, differentiating (8) yields
. (10)
And for plaintiff verdicts differentiating (9) yields
, (11)
and
(12)
Thus, the signs of the effects in (10) and (11) depend on the signs of second partial
derivatives involving changes in means of investors’ posterior distributions for . And,
according to (12), the sign of the effect of the size of a new award on future defendant costs
of a particular mass tort depends on how the size of this award affects investors’ posterior

51
mean of the size of future payments in that mass tort given that a payment is made. We
consider these issues in turn.
Effects of which party wins at trial. To determine the signs of the second derivatives in (10)
and (11)—which we have not previously addressed19—we specify and analyze Bayesian
updating using an example of the function that was introduced in the previous
section. We adopt a commonly used specification to represent prior beliefs and sampling
about a probability or proportion. Specifically, we assume that investors’ beliefs about are
given by a Beta distribution B(a, b), and that sample information about that probability
(which are dichotomous) are governed by i.i.d. sampling from a binomial distribution. To
specify beliefs about before any verdicts (for a particular mass tort) are observed, we
assume that that is uniformly distributed on the [0,1] interval,20 which corresponds to a = b
= 1. It follows that after observation of + trial verdicts (with plaintiff wins and
defendant wins) the mean of investors’ posterior beliefs about is
= = .21 (13)
The result in (13) indicates that the posterior mean of after plaintiff verdicts and
defense verdicts is a nonlinear function of both and . More specifically, (13) implies
that while a plaintiff (defense) verdict generally increases (decreases) , it does so at a
decreasing (increasing) rate. To establish these results, consider the following.
Differentiating (13) with respect to and yields
> 0 and < 0,
19 The signs of the other terms in (10) and (11) have been addressed above. 20 We specify a uniform prior to represent a lack of prior information about p prior to observing any trial outcomes in the relevant mass tort. 21 See, for example, Hey (1983, pp. 110-120).

52
as assumed in the previous section. And, regarding second derivatives involved in (10) and
(11), it follows that
< 0, (14)
and
> 0. (15)
In sum, other things equal, we should expect (other things equal) a smaller absolute effect of
a plaintiff (defendant) verdict on the stock market reaction as the number of previous plaintiff
(defendant) verdicts increases in the same mass tort. Intuitively, as investors become more
about more informed (from observing trial outcomes) about the probability that a claim will
result in a payout, observations from additional trials will result in smaller and smaller
updating of the mean for . We illustrate the relationships between and and and by
a numerical simulation reported in Appendix A.
Combining results from the previous section and equations (10), (11), (14) and (15), we have
the following testable hypotheses concerning which party wins at trial and the numbers of
previous trial verdicts for plaintiffs and defendants.
Hypotheses 1: Holding constant the size of a trial award (if any), a plaintiff (defense) verdict
will decrease (increase) the stock price of the defendant firm.
Hypothesis 2: The absolute size of the market reaction (in dollars) to a plaintiff verdict in a
mass tort is smaller if more plaintiff verdicts have previously been announced in that mass
tort.

53
Hypothesis 3: The size of the market reaction (in dollars) to a defense verdict in a mass tort is
smaller if more defense verdicts have previously been announced in that mass tort.
Effects of award sizes. To consider effects of the size of the award when the plaintiff prevails,
and generate testable predictions, we approximate investors’ prior beliefs about the size of the
payout per claim (conditional on a positive payout), by a lognormal distribution; i.e., we
assume that ~ N ( , ).22 It follows that after i.i.d. observations on , denoted
by , the posterior mean of investors’ subjective distribution over is
= = , (16)
where, = , = , and ,23 i.e., that the posterior mean is a
function of the mean of the logarithms of the observed award sizes.
The result in (16) reveals that, holding previous plaintiff award values constant, investors’
posterior belief about the size of is an increasing function of the natural logarithm of the
new (or last) trial award . In addition, (16) implies that, holding constant the sizes of the
previous awards, the larger is —the size of the new award—the larger is (since the
logarithm is a monotonically increasing function) and the higher is the posterior mean of .24
Thus, other things equal, the larger is a plaintiff award, the larger is the change in the mean of
investors’ beliefs about the future indemnity payment per paid claim. In addition, as the size
of the plaintiff award increases, investors’ beliefs about the mean indemnity payment per
claim increases at a decreasing rate.25
22 A lognormal distribution captures essential features (for our purposes) of the distribution of award sizes in civil trials, namely: (1) > 0 and (2) has a long tail on the right, i.e. some (fairly rare) verdicts have extremely large values. [can we find a study that documents a log-normal shape?] 23 See, for example, Hey (1983, pp. 160-175), and note that in our application it is that is normally distributed. 24 This follows from > 0.
25 This follows from > 0.

54
Thus, we have the following empirical hypotheses concerning the effects of award sizes of
defendant firms’ market values:
Hypothesis 4: The larger is the award, the larger is the absolute size of market reaction (in
dollars) to a plaintiff verdict.
Hypothesis 5: The size of market reaction (in dollars) to an additional plaintiff verdict
decreases in absolute value as the size of the plaintiff award increases.26
Section 5: Empirical Model
Our basic model is a multiple regression with the dependent variables being , the change
in firm i’s market value (in constant 2000 dollars) due to the jth verdict in mass tort i, from
shortly before and to shortly after the jth verdict in that mass tort. Specifically, the regression
equation we estimate is:
(17)
where,
= 1 if plaintiff wins in the jth verdict of mass tort i, 0 otherwise,
= 1 if defense wins in the jth verdict of mass tort i, 0 otherwise,27
= dollar amount of plaintiff award in the jth verdict of mass tort i,
= number of plaintiff verdicts in mass tort i prior to the jth verdict,
= number of defendant verdicts in mass tort i prior to the jth verdict, and
26 Formally, the result is (from differentiating (12)), > 0, which follows from
/ > 0.
27 Note that there is no intercept term in the regression; instead, we enter both VP and VD, which sum to one for each observation.

55
= the regression disturbance.
This regression equation is a translation of (7) where corresponds to ,
corresponds to , corresponds to , and corresponds to a monotonic
positive function of . Moreover, the signs of the regression coefficients in (17) are
predicted by the hypotheses developed above as follows:
(i) < 0 (Hypothesis 1),
(ii) > 0 (Hypothesis 1),
(iii) < 0 (Hypothesis 4),
(iv) > 0 (Hypothesis 2),
(v) < 0 (Hypothesis 3), and
(vi) > 0 (Hypothesis 5).
We report estimates of four versions of (17) in section 8.
Section 6: Data about Trials and Measures of Stock Market Responses
Using Lexis/Nexis and other sources,28 we collected information about trial verdicts and mass
torts involving Bendectin, Fen-phen, Prempro, silicone-gel breast implants, Rezulin and
Vioxx.29, 30 For each trial, we collected data such as whether the plaintiff or defense won at
trial, damage awards, and cumulative number of plaintiff and defendant verdicts.The resulting
sample includes 65 verdicts for which the defendant manufacturer was found not to be liable
(“defense verdicts”) and 48 verdicts in which the manufacturer was held liable for money
28 For example, web sites and SEC filings (10Ks, 10Qs) of defendant firms. 29 Four pharmaceutical companies were involved as defendants in the silicone-gel breast implants product liability litigation: Baxter International, 3M, Dow Corning and Bristol Myers Squibb. We consider such litigation against each of the four firms as a separate mass tort. 30 We limited our sample to mass torts with at least three trial verdicts and defendant companies whose stock is listed on the New York Stock Exchange. We excluded other medical product mass torts either because no trials occurred in that mass tort during our sample period—such as Zyprexa—or the defendant is a foreign company whose stock is not listed on the New York Stock Exchange—such as Accutane, Baycol and Sulzer hip and knee implants
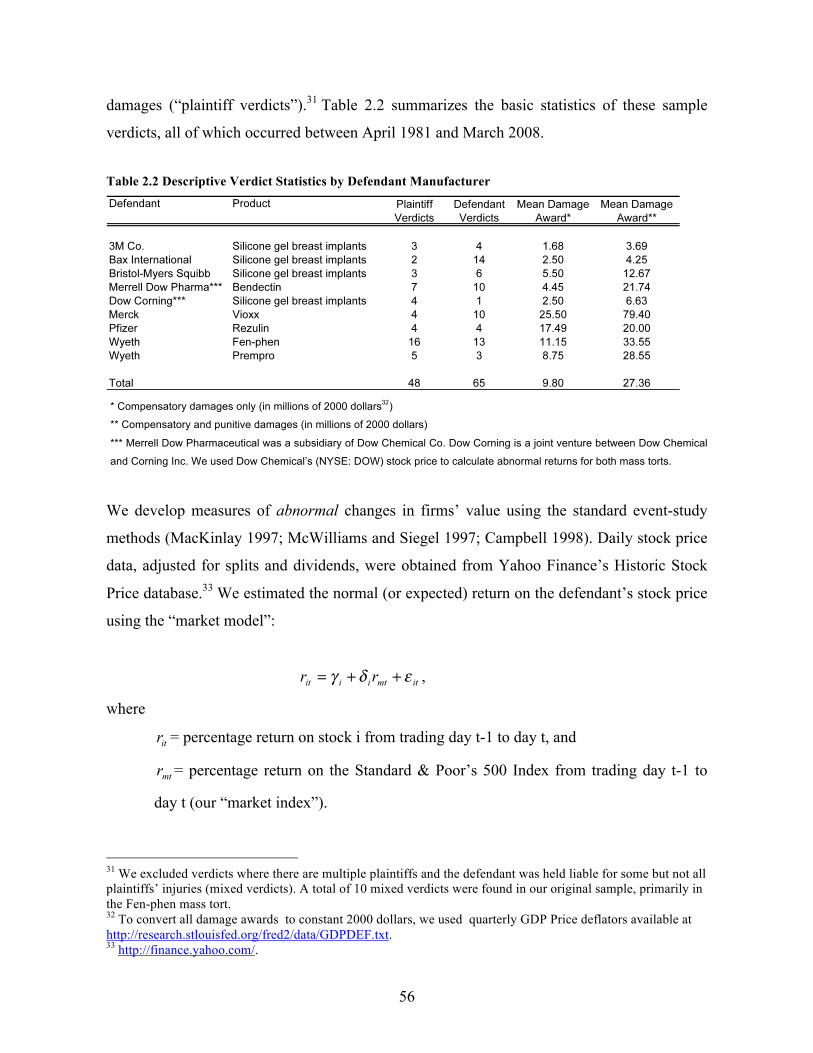
56
damages (“plaintiff verdicts”).31 Table 2.2 summarizes the basic statistics of these sample
verdicts, all of which occurred between April 1981 and March 2008.
Table 2.2 Descriptive Verdict Statistics by Defendant Manufacturer
* Compensatory damages only (in millions of 2000 dollars32)
** Compensatory and punitive damages (in millions of 2000 dollars)
*** Merrell Dow Pharmaceutical was a subsidiary of Dow Chemical Co. Dow Corning is a joint venture between Dow Chemical
and Corning Inc. We used Dow Chemical’s (NYSE: DOW) stock price to calculate abnormal returns for both mass torts.
We develop measures of abnormal changes in firms’ value using the standard event-study
methods (MacKinlay 1997; McWilliams and Siegel 1997; Campbell 1998). Daily stock price
data, adjusted for splits and dividends, were obtained from Yahoo Finance’s Historic Stock
Price database.33 We estimated the normal (or expected) return on the defendant’s stock price
using the “market model”:
,
where
= percentage return on stock i from trading day t-1 to day t, and
= percentage return on the Standard & Poor’s 500 Index from trading day t-1 to
day t (our “market index”).
31 We excluded verdicts where there are multiple plaintiffs and the defendant was held liable for some but not all plaintiffs’ injuries (mixed verdicts). A total of 10 mixed verdicts were found in our original sample, primarily in the Fen-phen mass tort. 32 To convert all damage awards to constant 2000 dollars, we used quarterly GDP Price deflators available at http://research.stlouisfed.org/fred2/data/GDPDEF.txt. 33 http://finance.yahoo.com/.

57
The regression coefficients and were estimated for each sample verdict using data from
200 trading days prior to the beginning of the verdict’s event window.34 , 35 We then
constructed daily abnormal return, for days within two event windows
of differing lengths defined as days (-1, +1) and days (-5, +5) respectively.36 We also
construct CAR1 and CAR5, the cumulative abnormal return for the entire event window of (-
1, +1) or (-5, +5) by summing for days within the event window.
To construct CAVAL1 or CAVAL5, a measure of abnormal dollar returns expressed in
millions of 2000 dollars, we multiple CAR1 and CAR5, respectively, by the average market
capitalization of the company in the month before the relevant verdict.37
Section 7: Average Wealth Effects of Verdicts
Table 2.3 reports summary statistics for four measures of stock market response separately
for the 48 plaintiff verdicts and 65 defense verdicts. The standard errors used to assess the
statistical significance of individual cumulative abnormal returns CAR1 and CAR5 were
calculated according to a methods summarized in Mikkelson and Partch (1988) and Salinger
(1992).38 The significance of the average cumulative abnormal returns for all verdicts were
34 Thus the estimation window is from trading day -202 to trading day -2 for the first event window (-1, +1) and is from trading day -206 to trading day -6 for the second event window (-5, +5). 35 If the verdict was announced less than 200 trading days from previous verdicts, trading days within the event windows for previous verdicts were excluded from the estimation, and the estimation window was expanded backward to include a total of 200 trading days. 36 If the verdict was announced on a non-trading day (i.e., a Saturday, Sunday or holiday), the abnormal return variable incorporates the stock return over the following two trading days. If two verdicts for the same mass tort (and defendant in the case of breast implants) are announced within three days from each other, they are considered as one event and the event window comprises from one day before the first verdict to one day after the second verdict. 37 Market capitalization data were obtained from Standard & Poor’s Compustat North America database. The nominal values of market capitalization and other variables were adjusted using the quarterly GDP deflator.
38 The variance of CAR is calculated as , where T is the length
(in days) of the event window, is the variance of in the market model, U is the lengths (in days) of the

58
tested by summing the t-statistics for individual CAR1 and CAR5 and dividing by the square
root of the number of verdicts included. Because CAVAL1 (or CAVAL5) are simply
products of CAR1 (or CAR5) and a firm’s market capitalization in the month before the
verdict, we did not compute separate test statistics for CAVAL1 or CAVAL5.
Results in Table 2.3 provide evidence that plaintiff verdicts typically depress stock prices and
defense verdicts typically increase them. The average abnormal return corresponding to
plaintiff verdicts, as measured by percentage cumulative abnormal return CAR1 and CAR5,
are both statistically significant. In our sample, a plaintiff verdict on average decreases the
defendant firm’s stock price by 1.5 percent, which corresponds to an average loss in firm
values of more than $908 million for 3-day event window (-1, +1). In contrast, the impact of
defense verdicts on defendant firms’ values, as gauged by either CAR1 or CAR5, is not
statistically significant. The sample means of cumulative abnormal returns by verdict type
and by mass tort are reported in Appendix B.
Section 8: Regression Analysis of Cross-Verdict Variation in Abnormal Returns
The first column and second column of Table 2.4 report the results of estimating a restricted
version the regression equation detailed in (17); in particular, these regressions include only
the first three independent variables included in (17). The difference between the regressions
corresponding to these two columns is that the variable AWD in first column includes only
the compensatory damage award, but in the second column AWD includes the sum of the
compensatory and punitive damage awards. Qualitatively, these results are consistent with the
prediction from our model that plaintiff verdicts increase investors’ estimates about future
litigation costs and thus depress the defendant firm’s market value. In addition, the estimates
support the prediction that the larger a damage award, the larger is the market loss (because
the estimated coefficients of AWD are negative and for column (1) statistically significant).
Finally, defense verdicts appear to decrease investors’ estimates about future litigation costs
estimation window, and are the mean and variance of the market return over the estimation period
of U.

59
Table 2.3: Summary Statistics for Cumulative Abnormal Returns
*** t-statistic for CAR1 = -3.867, which is significant at 0.01 level. **t-statistics for CAR5 = -2.523, which is significant at 0.05 level Source: Author’s calculations. CAR and CAR5 are estimated cumulative abnormal returns during the (-1, +1) and (-5, +5) event windows, respectively. CAVAL and CAVAL5 are the cumulative dollar abnormal returns (in millions of 2000 dollars) during the same event windows, respectively.
and thus increase the defendant firm’s market value, although the estimated coefficients are
not statistically significant.
Columns (3) and (4) report results from estimating all six regression coefficients in (17),
adding to the regressors included in the equations whose results are reported in columns (1)
and (2) the other three independent variables. The addition of these three independent
variables improves the fit considerably; in particular, the R2 values increase by 0.07 to .10, or
roughly 50 percent relative the corresponding equations in columns (1) and (2). In the
estimates reported in both columns (3) and (4), a plaintiff verdict is again associated with a
significant decrease in the defendant firm’s market value and a defendant verdict is associated
with an increase in the firm’s market value, although (as in columns (1) and (2)) in the latter
case the estimated regression coefficients are not statistically significant at the 0.05 level. In
both cases, AWD has a significant negative effect on the firm’s market value, as
hypothesized.

60
Table 2.4: CAVAL1 Regressed on Independent Variables
Coefficents (t-ratios) Explanatory Variables
Predicted sign (1)a (2)b (3)a (4)b
VP - -708*** -807*** -695** -795*** (-3.14) (-3.66) (-2.13) (-2.78) DP + 166 166 397 397* (0.96) (0.94) (1.67) ( -1.68) AWD - -11.8** -1.98 -47.9** -16.1*** (-2.22) (-1.44) (-2.53) (-3.48) VP×PL + 28.6 40.2* (1.17) ( 1.85) VD×DF - -21.6 -21.6 (-1.37) (-1.38) AWD2 + -0.211* 0.0153*** 1.88 (3.22) R2 0.19 0.17 0.26 0.27 N 113 113 113 113
a: AWD includes only compensatory damage award (in millions of 2000 U.S. dollars). b: AWD includes both compensatory and punitive damage awards (in millions of 2000 U.S. dollars). *: significant at 0.10 level **: significant at 0.05 level ***: significant at 0.01 level
The coefficient of the interaction term VP×PL indicates how the effect of a plaintiff verdict
depends on the number of previous plaintiff verdicts in the same mass tort. Results in column
(3) indicate that other things being equal, the stock market loss associated with a plaintiff
verdict is $28.6 million smaller for each previous plaintiff verdict, although this estimate is
not statistically significant. The corresponding estimate in column (4) — i.e., when AWD, the
measure of the award size includes both compensatory and punitive damages—is to $40.18
million and is statistically significant at the 0.1 level. These results are consistent our
prediction in Hypothesis 2 that the impact of a plaintiff verdict on firm’s value decreases
(absolutely) as the number of earlier plaintiff verdicts in the same mass tort increases.

61
Similarly, the coefficients of the interaction term VD×DF indicate how the impact of a defense
verdict varies with the number of previous defense verdicts in the same mass tort. Results in
both column (3) and (4) indicate that, other things being equal, the gain in defendant firm’s
market value is lower by $21.6 million for each previous defense verdict. Although this
coefficient is statistically significant in neither column, its negative sign is consistent with our
prediction in Hypothesis 3.
Finally, a negative coefficient of the variable AWD2 (the square of the award sizes) would
indicate—as predicted by Hypothesis 5—that the rate of decrease in firm’s market value
when AWD increases declines as the award size increases. This prediction is supported by a
significantly negative coefficient of AWD2 in column (3). However, in column (4) the
estimated coefficient of AWD2 is positive.
Section 9: Conclusion
Stock-price reactions to litigation events may be a promising way to help in forecasting future
costs of litigation to defendant companies. Lessons available from previous studies of events
in product liability litigation are limited by the averaging of stock-price reactions over
disparate types of events, casting doubt on the applicability of previous findings to other
litigation events of the same broad type. In this article, we propose and apply a more rigorous
approach to analyzing abnormal returns associated with litigation events, focusing on a
special, but especially important, type of product-liability litigation event—trial verdicts in
cases that are part of mass torts.
In particular, we propose a simple, formal model of the determinants of the sizes of stock-
market reactions to verdicts in medical products mass torts. In many such mass torts, trials are
used to develop a better sense of how juries react to evidence of negligence on the part of the
defendant company and how they view appropriate levels of damages. And in many medical
product mass torts, settlement negotiations involving thousands or tens of thousands or even
hundreds of thousands of pending claims are substantially informed by the outcomes of a
handful of trials. Thus, outcomes of individual trials can have very substantial implications

62
for settlement values and the eventual costs to defendants of resolving pending and future
claims.
According to our model, investors focus on the future costs of paying claims and update their
beliefs (using Bayes Rule) in response to trial outcomes in each mass tort. The model
emphasizes, and leads to refutable predictions about, effects of (i) whether the plaintiff or
defendant prevailed at trial, (ii) the size of the award associated with a plaintiff verdict, and
(iii) the numbers of previous plaintiff and defendant wins at trial in the same mass tort.
Our data pertain to 113 trial verdicts in nine mass torts during the period April 1981 to March
2008, with defendants and plaintiffs prevailing in 65 and 48 trials, respectively. We find that
on average, plaintiff wins depress defendants’ stock prices by about 1.5 percent, or roughly
$900 million (2000) dollars, a result that is highly statistically significant. Our point estimates
of the average effect of defendant wins at trial suggest that stock prices increase, but only by
0.3 percent (or roughly $200 million), and these estimates are not statistically significant. One
potential explanation for our finding larger (and less equivocal) impacts of plaintiff verdicts is
that (more often than not) shortly before a trial ends in a verdict, investors assign a
probability substantial greater than one-half to defendant (i.e., plaintiff wins are typically
more surprising to investors than are defendant wins).
Multiple regression analyses of cross-verdict variation in abnormal dollar returns to our
sample verdicts provides considerable support for five testable hypotheses derived from our
theoretical model. Not surprisingly given our results on average market responses to verdicts
for defendants and plaintiffs, our regression results are considerably stronger with regard to
theoretical predictions for plaintiff verdicts. These include economically substantial and
statistically significant estimates (of the signs predicted by the model) of the effects of
plaintiff verdicts and the sizes of the associated damages awards, but mixed evidence
concerning whether the marginal effect of award size decreases as the award size increases.
None of our estimates pertaining to effects of defendant verdicts is statistically significant at
the 0.05 level, but all of the associated point estimates are of the signs predicted by our
model. More specifically, the estimates pertaining to effects of defendants win at trial are

63
positive—suggesting an average investor loss of almost $400 million 2000 dollars—with p-
values of about 0.1, and a smaller impact of a defendant verdict the larger is the number of
previous defendant verdicts in the same mass tort.
Our basic approach and methods have several limitations, both in our empirical application
and for extension to other types of litigation events. Our approach involves focusing on
homogenous types of litigation events that would plausibly affect stock prices by
econometrically discernible amounts. We chose to focus on trial verdicts in medical products
mass torts, largely because the stakes in individual trials can be exceptionally high. Our set of
sample events, however, is not entirely homogenous, and we have been able to control for
only some important sources of heterogeneity with variables that could be accurately
measured and incorporated in a regression analysis (i.e., the winning party, the size of the
award, and numbers of previous trial victories for each side). Most troubling in this regard, it
seems, are (i) that we do not control for differences across our sample mass torts in the
numbers of claims that have yet to be resolved, which includes both currently pending claims
and future claims that have yet to be filed; and (ii) we do account for potential effects of trial
outcomes on numbers of future filings.
Extending our general approach to studying stock-market reactions to other events in product-
liability litigation confronts several challenges. Most challenging, it seems, are identifying
other types of litigation events that are sufficiently (i) homogenous or whose heterogeneity
can be adequately controlled with observable variables, and (ii) numerous to permit
econometric analysis—over almost three decades, our sample includes only a modest number
of trial verdicts. Thus, it is an open question whether the kind of analyses we have conducted
can be fruitfully adapted and applied to the study of other types of litigation events.
References
Ahmed, P., John Gardella and Sudhir Nanda, Wealth Effects of Drug Withdrawals on Firms and Their
Competitors. Financial Management, 2002, 31(3): pp. 21-41.
Barber, B.M. and Douglas Loeffler, The “Dartboard” Column: Second-Hand Information and Price Pressure.
The Journal of Financial and Quantitative Analysis, 1993, 88(2): pp. 273-284.

64
Barton, R.J., Utilizing Statistics and Bellwether Trials in Mass Torts: What Do the Constitution and Federal
Rules of Civil Procedure Permit? William & Mary Bill of Rights Journal, 1999. 8: pp. 199-240.
Campbell, J.Y., et al., The Econometrics of Financial markets. Macroeconomic Dynamics, 1998, 2(4): pp. 559-
562.
Fallon, Eldon E., Jeremy T. Grabill, and Robert Pitard Wynne, Bellwether Trials in Multidistrict Litigation.
Tulane Law Review, 2008, 82(6): 2323-2368.
Faulk, Richard O., Robert E. Meadows, and Kevin L. Colbert, Building A Better Mousetrap? A New Approach
to Trying Mass Tort Cases. Texas Tech Law Review, 1998, 29(3): pp. 779-810.
Favole, J.A. and A. Mundy, Drug Makers Protest Plan on Legal Costs. The Wall Street Journal, August 12,
2008. p. B8.
Garber, S., Product Liability and the Economics of Pharmaceuticals and Medical Devices, Santa Monica:
RAND Corporation, 1993.
Garber, S., Product Liability, Punitive Damages, Business Decisions and Economic Outcomes. Wisconsin Law
Review, 1998(1): p. 237-295.
Garber, S. and John Adams, Product and Stock Market Responses to Automotive Product Liability Verdicts.
Brookings Papers on Economic Activity and Microeconomics, 1998: pp. 1-44.
Gold, J., Analysts unsettled by jury findings on marketing of Vioxx. The Associated Press, April 6, 2006.
Govindaraj, S., P. Lee, and D. Tinkelman, Using the Event Study Methodology to Measure the Social Costs of
Litigation-A Re-Examination Using Cases from the Automobile Industry. Review of Law & Economics,
2007, 3(2): pp. 341-382.
Hays, K., Week's Business: Two state trials down, first federal trial next up for Merck. The Associated Press,
November 4, 2005.
Hey, John D., Data in Doubt: An Introduction to Bayesian Statistical Inference for Economists. Blackwell, 1993.
Johnson, L.A., Analysts: Vioxx win was crucial for Merck, but legal costs will mount. The Associated Press,
November 3, 2005a.
Johnson, L.A., Merck shares fall, but analysts mixed after Vioxx mistrial. The Associated Press, December 12,
2005b.
MacKinlay, A.C., Event Studies in Economics and Finance. Journal of Economic Literature, 1997, 35(1): pp.
13-39.
Manning, R.L., Changing the Rules in Tort Law and the Market for Childhood Vaccines. Journal of Law and
Economics, 1993, 37(1): pp. 247-275.
Manning, R.L., Products Liability and Prescription Drug Prices in Canada and the United States. Journal of Law
and Economics, 1997, 40(1): pp. 203-244.
McWilliams, A. and D. Siegel, Event Studies in Management Research: Theoretical and Empirical Issues.
Academy of Management Journal, 1997, 40(3): pp. 626-657.
Mikkelson, W.H. and M. Megan Partch, Withdrawn Security Offerings. The Journal of Financial and
Quantitative Analysis, 1988, 23(2): pp. 119-133.

65
Polinsky, A.M. and S. Shavell, The Uneasy Case for Product Liability. 2009 (forthcoming Harvard Law
Review); http://ssrn.com/abstract=1468562.
Peltzman, S., Comments. Brookings Papers on Economic Activity and Microeconomics, 1998. 1998: pp. 45-48.
Prince, D.W. and P.H. Rubin, The Effects of Product Liability Litigation on the Value of Firm. American Law
and Economics Review, 2002, 4(1): pp. 44-87.
Rheingold, P.D., Litigating Mass Tort Cases. 2008: Thomson Reuters/West.
Salinger, M., Standard Errors in Event Studies. The Journal of Financial and Quantitative Analysis, 1992, 27(1):
pp. 39-53.
Sherman, Edward F., Segmenting Aggregate Litigation: Initiatives and Impediments for Reshaping the Trial
Process. Review of Litigation, 2006, 25(4): pp. 691-718.
Viscusi, W.K. and M.J. Moore, Product Liability, Research and Development, and Innovation. Journal of
Political Economy, 1993, 101(1): pp. 161-184.
Viscusi, W.K. and J. Hersch, The Market Response to Product Safety Litigation. Journal of Regulatory
Economics, 1990, 2(3): pp. 215-230.

66
Appendix A: Comparative Statics of Bayesian updating result for
Figure 2.1: Predicted Change in as Number of Verdicts Increases
In Figure 2.1, the Y axis is the projected size of (triangles) or (diamonds) and the X
axis is the number of cumulative plaintiff verdicts or defense verdicts. When calculating ,
we assume b=1 for all values of a. Similarly, when calculating , we assume that a=1 for all
values of b.

67
Appendix B Table 2.5: Sample Means and Standard Deviations for Cumulative Abnormal Returns by Verdict Type
and by Mass Tort

68
Essay 3
Combating Unsafe Drugs: China’s Progress and Problems39
39 To be submitted to an academic journal with Wei Wilson Zhang as a co-author.

69
Section1: Introduction
The Chinese pharmaceutical industry has experienced tremendous growth in recent years,
fueled by rapidly growing domestic consumption and accelerating global demand for
inexpensive pharmaceutical ingredients. Between 1998 and 2007, the total output of Chinese
pharmaceutical production increased from $16.5 billion to $86.7 billion. During the same
period, the total value of Chinese pharmaceutical exports increased from $3.4 billion to $14
billion [1] (Figure 3.1). At present, China is one of the world’s largest pharmaceutical
ingredient suppliers. Together with India, it supplies 40% of active pharmaceutical
ingredients (APIs) consumed in the U.S. and 80% in Europe [2, 3].
China’s fast growing pharmaceutical sector could potentially help to lower global drug prices
and improve consumer welfare. However, it also generates significant challenges to drug
safety regulators at home and abroad. China-originated counterfeit and substandard drugs
have flourished thanks to insufficient regulatory oversight, weak legal institutions and a
domestic market that does not incentivize strict compliance with safety standards. The
resulting episodes of high profile drug safety problems, which occurred during 2006-2008
both within and outside China, have brought Chinese drug safety under intense public
scrutiny. Under pressure from both the domestic population and foreign trading partners,
China has since taken promising steps to overhaul its regulatory framework. This rapidly
evolving regulatory environment has inevitably led to uncertainty as regulators and
businesses alike struggle to understand the impacts and deficiencies of policy interventions.
Drawing evidence from an extensive review of the literature and interviews with high-level
Chinese regulatory officials (see Appendix A), we review key policy changes and seek to
identify remaining issues as well as areas of future promise within China’s drug safety
regulatory system. It should be noted that drug-related injuries can result from different types
of safety problems.40 This paper focuses on safety problems inherent in the drug itself (such
40 First, drug safety problem might be caused by manufacturing defects, such as substandard ingredients, improper sterilization or package contamination, which are dangerous to the drug’s users. Second, the safety problem can be inherent in the chemical properties of the drug even when properly manufactured. For example, various drugs are believed to cause injuries (e.g. heart attack, stroke, breast cancer etc.) in a proportion of its

70
as the chemical properties of the drug or manufacture defects) rather than those resulting from
user problems (including not being used as directed or being used among unacceptably risky
populations). In so doing so, we hope to concentrate our discussion on the regulation of the
pharmaceutical industry, since it is the most critical player in China’s recent drug safety
crisis.
Figure 3.1: Chinese pharmaceutical output and exports 1998-2007
Sources: China Pharmaceutical Year Books 2002-2008
Section 2: A Brief History of Pharmaceutical Regulation in China
The enactment of the Pharmaceutical Administrative Law (PAL) in 1984 marked the
beginning of China’s modern-day drug safety regulation [1]. While previously drug makers
could easily receive drug manufacturing licenses from provincial health departments, the new
law required companies to conduct systematic pre-marketing testing to prove the safety and
efficacy of their drugs. During 1984-1998, drug safety oversight duties were shared by three
national regulatory agencies, namely, the Ministry of Health's (MOH) Drug Administration
Bureau, the State Pharmaceutical Administration Bureau, the State Administration of
Traditional Chinese Medicine.
users even though the drug appears to be safe in clinical trials that involve a limited number of users. Finally, injuries can be caused by drugs because they are prescribed to people for whom the drug is unacceptable risky (e.g. pregnant women, people with abnormal liver function, people who are taking drugs that interact badly with the drug in question.) or because the drug is not used as directed (e.g. above or below recommended dosage).

71
In 1998, an independent regulatory authority, the State Drug Administration (which later
became the State Food and Drug Administration, or SFDA), was established to provide a
unified authority for drug safety regulation. Using the U.S. Food and Drug Administration
(FDA) as a model, the SFDA oversees the development, manufacture, distribution and
marketing of all pharmaceutical products, biomedical products, Chinese traditional medicine
and medical devices [4]. It also provides regulatory leadership to thousands of provincial and
municipal drug departments who are responsible for carrying out routine market and
manufacture inspections and assisting the SFDA to collect and screen new drug applications.
Provincial and municipal drug departments, however, maintain a substantial level of
independence from the SFDA, partly because they also receive oversight from the provincial
government within whose jurisdiction they are located.
During its first ten years, the SFDA embraced a host of reforms that replaced various
provincial regulations with uniform national standards. It also expanded its regulations from
covering only drug registration and inspection to governing the entire supply chain of
pharmaceutical production, including both pre-marketing drug evaluation (preclinical, clinical
and new drug approval) and post-marketing safety surveillance (production quality control,
distribution and adverse drug reactions or ADRs monitoring). Table 3.1 presents an overview
of the current SFDA regulatory framework [1, 5, 6]. SFDA requires preclinical laboratory and
animal studies and clinical trials (phase I, II and III studies) to be conducted based on national
Good Laboratory Practice (GLP) and Good Clinical Practice (GCP) guidelines starting in
2007 and 2004, respectively [5, 6]. Once a new drug goes through these trials, the SFDA
evaluates the results submitted by the manufacturer/developer and decides whether the drug
should be approved for marketing according to safety and efficacy standards set forth by the
Provisions on Drug Registration (PDR). Since 2004, SFDA mandates manufacturers to
comply with the national Good Manufacture Practice (GMP) which specifies how drugs
should be manufactured to ensure safety, efficacy and quality. The SFDA also enacted quality
control standards for distributors, i.e. the Good Supply Practice (GSP) in 2002. For drugs that
are already in the market, the SFDA and its provincial counterparts conduct routine quality
inspections at manufacturing sites as well as retail outlets. Starting in 2004, SFDA adopted a
national Adverse Drug Reactions (ADRs) monitoring system that requires manufacturers,

72
distributors and health care providers to monitor and report adverse drug reactions (ADRs) to
provincial or national ADRs monitoring centers.
The true impact of the SFDA’s efforts to build a comprehensive drug safety framework is
difficult to measure, particular since China has not collected data on drug safety in any
systematic way. Indirect evidence shows that progress has been made in several areas. For
example, about 4,000 drug manufacturers who failed to pass the national mandatory GMP
certification were forced to close down by June 2004 [1]. Unofficial reports circulated by
Chinese media indicate that the share of counterfeit and substandard drugs sold in the market
decreased from about 18% in 1997 to less than 2% in recent years [7]. Meanwhile the number
of ADRs reports received by the SFDA increased from less than 5,000 in 2001 to more than
360,000 in 2006 [8, 9].
Table 3.1: Overview of SFDA’s Regulatory Framework Stage Preclinical Clinical Approval Production Distribution Use Activities Toxicology
study Safety, dosage, efficacy, side effects
Clinical results, manufacture license
Process control, validation, documents
Warehouse & transportation quality control
Post- marketing surveillance
Standards Good Laboratory Practice (GLP)
Good Clinical Practice (GCP)
Provisions for drug registration (PDR)
Good Manufacture Practice (GMP)
Good Supply Practice (GSP)
The Rule on ADRs Reporting (ADRs Rule)
Adoption years
2007 2004 2002 2007 (revised)
1995 1998 2007
2002 2004
In addition to the SFDA, China’s National Development and Reform Commission (NDRC)
also plays an important role in shaping China’s pharmaceutical policy. NDRC and its
provincial counterparts set maximum domestic retail prices for prescription drugs in the
Essential Medicine list and various national and provincial health insurance drug lists [10].
New drugs are generally exempted from price regulation to encourage innovation [11].
However, because the SFDA had defined “new drug” broadly as drugs that have not been
marketed or sold in China, rather than for example new chemical entities (NCEs) that have
not previously been approved for human use in the U.S. or other countries, manufacturers
were able to obtain the so-called new drug status for existing generic drugs simply by

73
changing the dosage or packaging, thereby avoided price regulation [12, 13]. Overall, about
60% of pharmaceutical sales in China now occur at regulated prices [10].
Section 3: Drug Safety Crisis in 2006-2008
Despite China’s progress in modernizing its drug safety regulation, a series of high profile
drug safety incidents broke out beginning in 2006 and quickly evolved into an international
crisis. The first domestic incident occurred in April 2006 when 11 people died and more were
injured from an injection of Armillarisin A that was produced with substandard propylene
glycolin by the Qiqihar No.2 Pharmaceutical Co. Ltd [14]. Four months later, at least 11 more
people died in China from an antibiotic injection called clindamycin phosphate glucose due to
its not having been properly sterilized by its producer Anhui Huayuan Worldbest Biology
Pharmacy Co. [15]. In July 2007, nearly 200 Chinese leukemia patients were sickened by
Methotrexate & Cytarabine injection contaminated with Vincristine Sulfate that was
manufactured by Shanghai Hualian Pharmaceutical Co. [16]. A year later, an herbal injection
called Wu Jia Ci that was contaminated during distribution claimed at least three lives and
injured dozens in Yunnan province [17]. Outside of China, more than 100 people reportedly
died in early 2007 in Panama after consuming cough medicine contaminated by diethylene
glycol that was produced in China [18]. Also in the same year, 95 Americans died from
anticoagulant Heparin believed to have been contaminated by raw materials produced in
China [19]. Although the exact cause of the Heparin deaths was disputed by Chinese
authorities, this case received great attention from both the U.S. government and the mass
media, and brought substantial negative publicity about Chinese pharmaceutical products in
general.
Section 4: Responding to the Crisis - China’s Regulatory and Legal Changes
In the wake of the high profile drug safety failure, the Chinese government has moved
quickly to introduce an overhaul of its regulatory and legal institutions to rebuild public
confidence in China’s pharmaceutical products. Major policy interventions include tightening
market entry control by raising standards for new drug approval, enhancing the production

74
quality control through rewriting the GMP guidelines, expanding post-market ADRs
surveillance, introducing a national drug recall system and increasing the criminal penalties
for producing and selling counterfeit and substandard drugs. Each of these regulatory
developments is discussed in turn in this section.
4.1. Raising the Bar for New Drug Approval
New drug approval was the first focus of post-crisis reform, thanks to extensive media reports
about the abuse of approval authority by the former SFDA Head Zheng Xiaoyu. According to
a widespread news report, the SFDA approved 19,000 new drug applications in 2004. In the
same news article, this figure was compared to 148 that were approved by the U.S. FDA in
the same year to highlight the lack of rigor in SFDA’s new drug evaluation [20].41 After the
two deadly drug incidents that happened in April and August 2006, the SFDA drastically
tightened the technical standards for new drug applications. As a result, the annual number of
applications filed with the SFDA dropped by nearly two thirds (Figure 3.2). In October 2007,
SFDA officially raised the bar for new drug approval through a revised version of PDR.
Among other things, the new PDR requires SFDA to take steps to confirm the clinical
information filed in support of a new drug application, to inspect the manufacturer’s
production site, and to improve collection of samples by taking samples at the site of
manufacturing instead of relying on samples sent by the applicant, as was the case in the past
[21-23]. The new PDR also prevents manufacturers from obtaining the “new drug” status by
changing dosage, route of administration or inactive ingredients of existing products.42 Such
practice had been common in the past to avoid NDRC’s retail price caps. With these new
measures, approval rate for new drug applications has reportedly fallen from 80% to 37%
[21].
41 The large difference between the number of news drugs approved in China and the U.S. is obviously also due to SFDA’s broad definition of new drug. 42 NCEs and generics that have been marketed abroad but not in China are still both considered new drugs.

75
Figure 3.2: Number of Drug Applications Filed with SFDA
* Drug applications for Chinese Traditional Medicine (CTM) not included.
** “Other” category includes drugs manufactured based on existing standards in the Chinese Pharmacopoeia.
Sources: monthly drug review updates on CDE website http://www.cde.org.cn/.
4.2. Re-Examining Existing Drugs, Manufactures and Distributors
In addition to strengthening the standards for new drug approval, SFDA launched a six-month
national “clearing house” campaign [24]. By July 2007, the government announced that it had
re-examined more than 28,204 drugs and revoked 578 drug licenses [25]. The SFDA also
withdrew from 128 manufacturers of their GMP certifications and ordered another 2,025
manufactures – nearly one third of all manufacturers – to correct violations of the GMP code
within speficied time periods [25]. In addition, the SFDA inspected 89.6% of drug
distributors and retailers nationwide, which resulted in the loss of GSP certifications by 481
distributors and the discovery of 3,325 illegal distributors and retailers [25]. As an extension
of this campaign, the new PDR adds a provision that requires all previously approved drugs
to re-register every five years [26]. The application package for re-registration must include
information about phase IV clinical trial results and evaluation of ADRs. Nationwide re-
registration officially began in July 2009 and is expected to be completed for all drugs

76
approved prior to 2006 by September 30, 2010 [26]. Drugs approved after 2006 will be
expected to comply with the new regulations once their five-year marketing periods end.
4.3. Tightening Production Quality Control
China introduced Good Manufacture Practice (GMP) for manufacturing and quality control
of pharmaceutical products in the early 1990s. In 2004, about 6,000 pharmaceutical
companies passed the nationwide mandatory GMP certification [1]. However, unlike the U.S.
FDA’s current GMP (cGMP) standards and the European Medicines Agency’s (EMEA)
GMP standards, the Chinese GMP guideline primarily focused on production facilities and
equipment while overlooking critical issues such as quality control, risk analysis, personal
hygiene, ongoing stability checking and process validation [2]. To better align the Chinese
GMP Guideline with international standards, SFDA issued a new GMP guideline in
September 2007 [27]. The new guideline greatly expands technical requirements for
personnel qualifications, production processes, quality control and validation documentation.
Another highly publicized new addition is the requirement for each manufacturer to have a
designated Quality Authorizer to ensure quality standards are met throughout the production
process [28]. Besides tightening GMP standards, SFDA hired more GMP inspectors to carry
out scheduled as well as unannounced GMP inspections. Specifically, the number of GMP
inspectors grew by more than 50% from 1,715 in 2006 to 2,629 in 2008 [29, 30].
4.4. Expanding Post-Marketing Surveillance
Adverse drug reaction (ADR) usually refers to “harm associated with the use of a drug at
normal dosage for intended purposes” [31]. Although it is often difficult to determine the
exact cause of such reactions, systematic monitoring of ADRs may provide essential
information about a new drug’s safety and effectiveness under real-life conditions that was
not detected during clinical trials [31]. Policymakers worldwide therefore rely heavily on
analysis of ADRs to make evidence-based decisions about labeling change, package
modification or recalling of a drug. China did not have a national ADRs monitoring system
until 2004, when the first national Rule on ADRs Reporting and Monitoring (the “ADRs
77
Rule”) was established [1]. Since then, China has made great strides in increasing the number
of ADR events reported, although it still lags significantly behind the U.S. in terms of
numbers of ADR reports per million people [32-34]. (Figure 3.3) One particular issue is that
despite China’s ADRs Rule requiring all drug manufacturers, distributors and health care
providers to report ADRs within specified time frames, Chinese drug manufacturers have
historically lacked incentives to fulfill their obligations to report ADRs. For example, Chinese
drug makers contributed less than 10% of all ADRs reported during 2004-2007, far less than
90% in the U.S. and other countries despite having largely the same set of reporting protocol
[32]. In June 2009, SFDA issued a new draft revision of the Rule on ADRs Reporting and
Monitoring (the New “Rule”) [35]. The proposed new Rule expands the scope of events that
are required be reported to include not only ADRs, but also all Adverse Drug Events (ADEs),
as is the case in the U.S. [34].43 The new Rule shortens the timeline within which an event
must be reported and places an increased reporting burden on manufacturers. If a drug is
confirmed to have caused severe ADRs by the national ADR Monitoring Center, the drug
manufacturer is now required to take timely actions to communicate with physicians, patients
and the public, revise drug packaging, labels and product inserts, or recall the drug if
necessary.
4.5. Launching a National Drug Recall System
Progress in building a national ADRs reporting network from 2004 to 2007 provided an
opportunity for the SFDA to launch China’s drug recall system based on post-marketing
surveillance. In December 2007, SFDA officially introduced the first national drug recall
system [36]. Following international practice, drug recalls are classified into three levels with
varying severity: Category 1 Recalls involve drugs that can potentially cause severe injuries
or even death and should be issued within 24 hours of the announcement; Category 2 Recalls
involve drugs that may cause temporary or reversible health problems and should be issued
within two days; Category 3 Recalls involve drugs that must be recalled within three days for
43 Adverse Drug Event (ADE), is defined broadly as “all medical events occurred during a pharmaceutical treatment that are harmful and suspected to be related to the use of a drug”. The difference between ADR and ADE lies in that the latter does not assume that the adverse outcome to have occurred at normal doses for intended uses.

78
reasons other than safety, such as improper packaging. Manufacturers are given incentives to
withdraw problematic drugs voluntarily, namely lower fines and administrative punishment
or even avoid paying any fines or punishment. Those who are aware of problems with their
drugs but fail to issue voluntary recalls will face fines of up to three times the value of the
recalled drugs or even be deprived of drug-manufacturing licenses.
Figure 3.3: Number of ADRs/ADEs Reported per Million People by Year
Sources: SFDA Annual ADRs reports and FDA Adverse Event Reporting Systems (AERS) statistics
4.6. Expanding Criminal Prosecution for Producing or Selling Counterfeit and
Substandard Drugs
The majority of China’s drug safety incidents, including high profile scandals that occurred
between 2006-2008, involve counterfeit and substandard drugs, i.e. drugs whose composition
and ingredients do not meet the correct technical specifications and which are consequently
ineffective and often dangerous to patients [37].44 China’s Criminal Law prohibits the sale
and production of counterfeit and substandard drugs by imposing a sentence of up to three-
year imprisonment or criminal detention, in addition to a fine for 50%-200% of the sale value
44 This is significantly different from the U.S. and other developed countries where counterfeit and substandard drugs are rare and drug safety injuries occur primarily because of ADRs/ADEs associated with NCEs that are recently sold in the market

79
when the products cause serious injuries [38]. In May 2009, China’s Supreme People’s Court
and Supreme People’s Procuratorate jointly released a new Special Judicial Interpretation of
the 141st and 142nd Clauses of the Chinese Criminal Law [39].45 Under the new interpretation,
physicians who knowingly prescribe and sell counterfeit or substandard drugs will be
prosecuted as accomplices as will individuals or companies who supply capital, raw
ingredients, shipping services, storage, packaging, advertisement or other services for the
production or sales of counterfeit or substandard drugs despite knowing the drugs are
counterfeit or substandard. This Interpretation provides a detailed list of criteria to define
prosecution thresholds based on the severity of “injuries and health problems”.
Section 5: How Well Will the New Policies Work?
Pharmaceutical safety control is a complex process within which governmental regulations
interact with market incentives to determine the level of safety investment private companies
should choose to make. In regulatory economics, corporate compliance behavior is
considered to be influenced by the strengths of regulation as well as by the market reward for
good compliance [40]. SFDA’s post-crisis regulation overhaul, from this broader perspective,
should be viewed as an important step forward towards raising the minimum safety standards
deemed necessary by the government. The success of these governmental interventions in
improving China’s drug safety will rely on at least two key conditions: first, rigorous
enforcement of existing and new government regulations; and second, a market that rewards
safe drugs and punishes unsafe drugs. In this section, we identify key barriers and areas of
promise for each of these two conditions.
5.1. Barriers and Promise for Effective Regulation Enforcement
Governmental Enforcement Capacity
45 The Supreme People’s Procuratorate is China’s highest law enforcement agency, analogous to the U.S. Department of Justice.

80
Insufficient resources have historically been a major contributing factor to China’s weak drug
safety regulatory enforcement. According to a speech by China’s Vice Premier Wu Yi in
2005, “80% of municipal and local drug departments did not have fixed office space and the
majority of them lacked adequate testing, inspection and transportation equipment to carry
out routine quality and safety control activities they were required to conduct by law.” [4] To
change this situation, the Chinese government recently announced that it will invest a total of
$1.2 billion in the next three to five years, or $120 million to $204 million annually, to
improve the technical and personnel infrastructure for drug safety regulation [41]. By
comparison, the annual budget of the U.S. FDA has been about $2 billion in each of the past
few years [42]. The goal in China is that within five years, 90% of provincial and 60% of
municipal drug safety control departments will be able to conduct full-scale drug safety
testing [41].
In addition to financial constraints, the decentralized structure of the Chinese regulatory
system remains another challenge to the quality of enforcement. While provincial drug
departments have full jurisdiction over municipal and local drug departments, the SFDA
shares with provincial governments the authority to oversee provincial drug departments [1].
Provincial drug departments, which receive substantial funding from the provincial
governments, often choose to enforce SFDA regulations selectively to promote local
developmental, employment or political objectives [4]. Because cracking down on drug
safety often entails loss of tax revenue and employment opportunities in a province,
provincial drug departments seem to apply looser standards for regulation enforcement. For
example, it was reported that the SFDA approved only 45 applications for manufacturing
establishments during the three years from 1998 to 2001. However, after the approval
authority was temporarily delegated to provincial departments, 70 new establishments were
approved in the first six months of 2003 alone [43].
Despite the weak, uneven and inconsistent enforcement across provinces, the government is
reluctant to create an entirely centralized drug safety regulation system. Perhaps it fears such
a system would further open the door for corruption and other illegal activities without
necessarily improving the quality of regulation enforcement [44]. Such precaution is
81
understandable given that former SFDA Head Zheng Xiaoyu was found guilty of taking
bribes from the pharmaceutical industry [20]. It is therefore unclear whether and how the
central-provincial tension in China’s drug safety regulation will evolve. The most likely
scenario seems to be that a decentralized structure will continue for many years.
The Scope of Enforcement Need
China’s drug safety enforcement task is more difficult by a pharmaceutical industry that has
more than 6,000 manufacturers, 13,000 distributors, 34,000 franchise retailers, and 554,000
rural drug supply outlets [1]. By contrast, the U.S. pharmaceutical industry, which is
significantly larger by sales value, consists of only 1,286 manufacturers, 50 distributors and
55,000 retailers [45, 46]. The sheer number of firms that need to be overseen makes it
impossible for the SFDA to enforce its regulations in an effective and consistent manner. The
sales revenue of the top 10 Chinese drug manufacturers account for only 10% of China’s
pharmaceutical sales, compared to the top 10 international firms, which account for about
60% of U.S. pharmaceutical sales [10, 46]. Small producers often operate at a very low profit
margin with few specialized quality control staff, meaning few of the tests needed to ensure
product safety are ever performed. Many producers see government oversight as a financial
burden and spend significant resources trying to outwit and avoid the system, rather than
“buying in” and focusing their resources on improved compliance with GMP standards.
A large and decentralized distribution structure only adds to the difficulty. In 2005 the
combined market share of the top three Chinese pharmaceutical distributors amounted to
about 25% of the industry’s total sales, far less than the combined market share of more than
90% among the top three pharmaceutical distributors in the U.S. [10, 46]. Many of these
small distributors have neither the scale to automate nor much expertise in distribution.
Furthermore, this lack of scale means that manufacturers seeking to distribute their products
nationally need to use multiple distributors [47]. The need to use multiple distributors
negatively affects product quality because product traceability is hard to guarantee, and when
problems arise, product recalls can be extremely difficult to manage. In addition, small

82
distributors usually lack sophisticated skills and equipment to identify counterfeit and
substandard drugs. Some even find it profitable to collude with counterfeit drug makers.
Both the manufacturing and distribution industries will likely consolidate in the future.
According to a recent report by PriceWaterHouseCoopers, international and domestic
investors have started a strong wave of merge and acquisition (M & A) in China’s
pharmaceutical sector. The total pharmaceutical M&A deal volumes increased from around
$30 million per year prior in 2006 to about $100 million per year after 2006 [47]. Besides
increased investment, declining profit margins are another catalyst for consolidation. NDRC
has issued nine pricing policies to reduce drug prices since 2000 [10]. As a result, the average
profit margins for drug manufacturers and distributors have reportedly decreased substantially
[48]. Consolidation will increase to a certain extent incentives for large manufacturers and
distributors to improve product quality as well as their ability to do so. However, regulators at
both the SFDA and NDRC still need to leverage policy tools they have to facilitate faster
consolidation and encourage bigger firms to be more responsible players.
5.2. Barriers and Promise for a Safety-Inducing Market Environment
Market Rewards for Safer Drugs
In some countries, market share and profitability associated with product quality and/or brand
recognition often provides strong incentives for private firms to invest in their product
quality. China’s health care market conditions, however, do not guarantee economic rewards
for safer drugs. Effective reputational incentives rely on consumers and physicians to have
reliable information about the safety performance of drugs and drug manufacturers. This is
not the case in China. Unlike in the U.S. where the FDA-maintained MedWatch program is
dedicated to informing and educating consumers about various drug safety issues, the
Chinese SFDA has yet established any comprehensive program to systematically collect,
analyze and release drug safety information. Despite recent progress in post-marketing
surveillance, most drug safety information databases are generally regarded as sensitive
information and are not publicly accessible. The SFDA releases limited safety information

83
selectively and in most cases on an ad hoc basis [49].46 Due to legal and political constraints,
China also lacks powerful consumer groups, such as the Public Citizen in the U.S., that
advocate drug safety on behalf of consumers and educate consumers about safe and unsafe
drugs [50].
The Chinese health care financing system only adds to the problem of lack of market
incentives for safer drugs. In China, public hospitals account for 80% of all retail
pharmaceutical sales [51]. Due to a large reduction in governmental funding, hospitals derive
more than half of their revenue from a 15% markup they are allowed to charge on their drug
purchase procurement prices [10]. Because most Chinese pharmaceutical manufacturers are
small firms producing largely the same set of “me-too” drugs sold at prices capped by NDRC,
hospitals have gained a dominant position in the market place and often demand deep
“rebates” from manufacturers [52]. To afford competitive rebates to hospitals and remain
financially viable, manufacturers are in turn forced to cut production costs, which often leads
to lower quality standards.
Another effect of the 15% markup rule is hospitals and doctors prefer the so-called “new”
drugs because they are not subject to NDRC price caps and thus are sold at higher prices [53].
This has encouraged drug makers to frequently change the form, packaging and dosage of
their drugs to be qualified for “new” drug status [13]. According to a study by Peking
University Guanghua Graduate School of Management, nearly 60% of the 449 generic drugs
procured by one Beijing Hospital during 2004-2006 had some type of change in packaging,
form or dosage [54]. Such high frequency of changes further increases the risk of introducing
new quality problems and ADRs because it makes it difficult for physicians and patients to
keep abreast of the many subtle, but sometimes important differences between “new” and
“old” versions of the same drug. For example, ADRs might occur if patients do not recognize
that the new version is more potent than the old version. 46 For example, the SFDA releases drug market quality inspection results quarterly or bi-annually. However, in most cases little information is given about how the samples were selected and what tests were applied. The SFDA also releases ADRs warnings on an ad hoc basis. But the national ADRs database, unlike in the U.S. that is publicly accessible, can be only accessed by authorized personnel at the National ADRs Monitoring Center. GMP inspection results are generally not available unless a manufacturer is revoked of its GMP certification. More information about what information is and what information is not publicly available can be found at the SFDA website (www.sfda.gov.cn) in Chinese.

84
In January 2009, China’s Ministry of Health proposed a plan to replace the 15% markup rule
with a fixed service fee [55]. Hospitals would earn a fixed and independent service fee for
each prescription they dispense, thus hopefully losing their interest in dispensing high-priced
drugs, choosing instead to make prescribing decisions based on a drug’s cost-effectiveness.
Meanwhile, the SFDA also narrowed the definition of “new” drug to exclude those that only
include changes in form, packaging or dosage [22]. A different, but also encouraging new
development is the fact that foreign firms have become increasingly influential in advocating
a differential pricing policy for high quality drugs. The Research & Development
Pharmaceutical Association (PDPAC), which represents dozens of international R&D-based
pharmaceutical firms, has provided substantial advice for the SFDA and NDRC by sharing
their expertise in international practices and business know-how [55]. Preferential pricing
policy is currently being pilot tested in Guangdong province [56]. It is hoped that if
successful, such policy will eventually be implemented nationwide.
Civil Penalties for Unsafe Drugs
In many developed countries, product liability laws entitle consumers to bring private
lawsuits against firms that produce defective drugs. Potential litigation costs associated with
settlements and damage awards often amount to millions of dollars and sometimes billions of
dollars and serve as a strong deterrent – in addition to government sanctions – that
incentivizes firms not to produce unsafe drugs [57]. In the United States, pharmaceutical
product liability litigation involving drugs such as the diet pills Phen-fen and the nonsteroidal
anti-inflammatory drug Vioxx has resulted in some of the World’s most expensive litigation
events [58, 59].
In China, the product liability system remains largely undeveloped. The Chinese Consumer
Protection Law entitles consumers who suffered personal or financial injuries from
counterfeit or substandard products the right to sue the manufacturer or distributor. However,
the total compensation for consumers is capped at two times the company’s illegal earnings
[60]. In cases where there are no illegal earnings, the firm is subject to an administrative fine

85
of up to RMB 10,000 (about $1,500). Compared to the U.S. where pharmaceutical litigation
costs to manufacturers can amount to billions of dollars, the Chinese civil penalties for
defective drugs are almost trivial and are unlikely to be large enough to deter drug makers
from engaging in substandard production. In addition, the Product Quality Law explicitly
states that firms are not responsible from any harm or injury resulting from products that are
manufactured according to national standards (a concept that is often called “regulatory
preemption” in the U.S.) [61].This Clause thus excludes victims of ADRs from pursuing
compensation through the legal system because by definition ADRs relate to drugs that are
manufactured according to regulatory standards set forth by SFDA [62].
In a recent encouraging development, the National People’s Congress (NPC) is currently
drafting China’s first Tort Liability Law [63]. Among other things, the draft Law entitles
victims and/or estates of product-related injuries to seek compensation from manufacturers,
distributors or retailers of the product. In addition, manufacturers, distributors and retailers of
defective products are subject to punitive damages if they are proven to have engaged in
manufacturing or selling the product despite knowing that it is defective. However, the
current draft still largely leaves out the issue of providing legal foundation for ADR victims
to seek compensation from drug manufacturers. In March 2009, 37 NPC and People’s
Political Consultative Conference Representatives submitted a petition to NPC’s Standing
Committee, requesting the enactment of a National Drug Safety Law [64].47 The petition
suggests that China should introduce a public ADR victim compensation system to
compensate victims of unsafe drugs. Hopefully these ongoing legal developments will
gradually improve the incentives for drug manufacturers and distributors to improve product
safety.
Section 6: Concluding Comments
Deadly pharmaceutical incidents involving sulfanilamide and thalidomide in the early and
middle twentieth century pushed the United States to drastically expand and improve
47 The National People’s Congress (NPC) is China’s highest legislative body. The NPC General Office has the most important authority in deciding the agenda of lawmaking in China. The People’s Political Consultative Conference serves an advisory body to NPC but does not have any formal legislative authority.

86
regulation over pharmaceutical products [65]. Today, the U.S. has one of the safest drug
markets and the world’s largest and most innovative pharmaceutical industry. From this
perspective, recent catastrophic events related to Chinese pharmaceutical products should be
viewed as both a challenge to and an opportunity of Chinese policymakers. While high-
profile executions and new laws will not drastically reduce drug-related injuries, increased
enforcement and the education of consumers can accomplish much. Since SFDA cannot be
omnipresent, public enforcement activities are only part of the solution. Policymakers should
encourage self-regulation within the supply chain by leveraging a broader set of policy tools,
such as new drug approval, GMP enforcement and pharmaceutical pricing policy, to
incentivize the production, distribution and prescription of high quality products. Despite
SFDA’s recent reform measures, strategic problems remain to be resolved. The
modernization of China’s drug safety system, however, responds to a real and lasting grass-
roots demand for safer medicines by the increasingly vocal and powerful Chinese consumers.
As the Chinese population becomes more affluent, such demands will only grow. It is
therefore likely, if not inevitable that Chinese pharmaceutical products will improve over
time. The questions are when and how such improvements in quality and safety will occur
and the extent to which overall safety is improved.
References
1. The State Council of People’s Republic of China, The Status Quo of China’s Drug Safety Regulation (in
Chinese), issued on July 1, 2008. Available online at
http://www.cde.org.cn/policy.do?method=showState&id=315. Last accessed on October 3, 2009.
2. Prinz, Heinrich and Christian Schulz, Comparison of the EC-GMP Guide Part I with SFDA-GMP Guideline
for Chinese Companies. Pharmaceutical Industry, 2008, 70(9): pp. 1070-1076.
3. Bates, Roger and Karen Porter, The Problems and Potential of China’s Pharmaceutical Industry. AEI Health
Policy Outlook No.3, April 2009. Available online at http://www.aei.org/docLib/03%20HPO%20Bate-
Porter-g.pdf. Last accessed on October 22, 2009.
4. Song, Hualin, The Causes and Driving Forces of Government Regulation Reform: A Case Study of China’s
Recent Drug Safety Regulation (in Chinese). Management World (Guan Li Shi Jie), 2008, 8: pp. 40-51.
5. Li, Xiang-Hong and Jin Ren, Establishment of a GLP Compliance Program for Drug Safety Studies at
SIMM. The Quality Assurance Journal, 2005, 9(3): pp. 228-233.

87
6. Cao, Cai, Current Status of the Implementation of Good Clinical Practice in China. International Journal of
Pharmaceutical Medicine, 2006, 20(6): pp. 361-366.
7. Liu, Peng, From Infrastructure Building to Quality Regulation: History of China’s Ten-Year Drug Safety
Regulation (in Chinese). China Prescription Drug, 2008, No.3.
8. Tian, C. et al., The Status Quo of China’s Adverse Drug Reactions Monitoring and Remaining Problems (in
Chinese). China Pharmacy, 2004, 15(3): pp.132-134.
9. SFDA, National ADRs Monitoring Report 2006. Document No. 2007-47, January 23, 2007. Available
online at http://www.sda.gov.cn/WS01/CL0055/10640.html. Last accessed on October 29, 2009.
10. Sun, Q. et al., Pharmaceutical Policy in China. Health Affairs, 2008, 27(4): pp. 1042-1050.
11. NDRC, Comments on Reforming the Management of Pharmaceutical Prices (in Chinese). Policy Document
no.961 (Beijing: NDRC, 2000); and NDRC, The Method of Government Drug Pricing (in Chinese), Policy
Document no. 2142 (Beijing: NDRC, 2000).
12. Deng, R. and Kenneth I. Kaitin, The Regulation and Approval of New Drugs in China. Drug Information
Journal, 2004, 37: pp. 29-39.
13. Li Xiaohong, SFDA: Maintain the Credibility of “Drugs Approved by SFDA”; Closely Control New Drug
Approval (in Chinese). The People’s Daily, February 1, 2007. Available online at
http://gov.people.com.cn/GB/46737/5353720.html. Last accessed on October 6, 2009.
14. China Daily, Official Sacked Over Lethal Fake Drug Case in Northeast China. July 20, 2006. Available
online at http://english.peopledaily.com.cn/200607/20/eng20060720_285069.html. Last accessed on
October 4, 2009.
15. People’s Daily, Boss Hangs Self after Deadly Drug Scandal. November 7, 2006. Available online at
http://english.peopledaily.com.cn/200611/07/eng20061107_318987.html. Last accessed on October 4,
2009.
16. Hooker, J. and Walt Bogdanich, Tainted Drugs Tied to Maker of Abortion Pill. The New York Times,
January 31, 2008. Available online at
http://www.nytimes.com/2008/01/31/world/asia/31pharma.html?pagewanted=1. Last accessed on October
4, 2009.
17. SFDA, Answers to Questions Regarding the Decision to Temporarily Stop the Use and Approval of
Yuxingcao Herbal Injection (in Chinese), June 1, 2006. Available online at
http://www.sda.gov.cn/yxc/1.htm. Last accessed on October 5, 2009.
18. Bogdanich, W. and Jake Hooker, From China to Panama, a Trail of Poisoned Medicine. The New York
Times, May 6, 2007. Available online at
http://www.nytimes.com/2007/05/06/world/americas/06poison.html. Last accessed on October 4, 2009.
19. Barboza, David, China Orders New Oversight of Heparin, with Tainted Batches Tied to U.S. Deaths. The
New York Times, March 22, 2008. Available online at
http://www.nytimes.com/2008/03/22/world/asia/22heparin.html. Last accessed on October 4, 2009.

88
20. China Daily, Former SFDA Chief Executed for Corruption, July 10, 2007. Available online at
http://www.chinadaily.com.cn/china/2007-07/10/content_5424937.htm. Last accessed on October 22, 2009.
21. The Development Research Center of the State Council of the People’s Republic of China, From New Drug
Approval to New Drug Innovation (in Chinese), August 19, 2009. Available online through member
subscription at
http://www.drcnet.com.cn/DRCNet.Common.Web/DocViewSummary.aspx?docid=2017956&chnid=1027
&leafid=70&gourl=/DRCNet.Common.Web/DocView.aspx. Last accessed on October 5, 2009.
22. SFDA Press Release, New Changes in China’s Drug Registration Management, September 8, 2009.
Available online at http://www.sda.gov.cn/WS01/CL0051/41288.html. Last accessed on October 6, 2009.
23. China Pharmaceutical News, Strengthen Regulation Institutions, Guarantee Drug Safety from the
Origination (in Chinese), July 12, 2007, page A1. Available online at
http://www.cnpharm.com/www/yyb/yyb_view.jsp?pp_id=80874. Last accessed on October 6, 2009.
24. People’s Daily, Watchdog Steps Up Policing of Pharmaceutical Market, May 31, 2006. Available online at
http://english.peopledaily.com.cn/200605/31/eng20060531_269881.html. Last accessed on October 6,
2009.
25. SFDA Press Release, Nationwide Drug Market Policing Campaign Achieved Milestone Results (in
Chinese), July 9, 2007. Available online at http://www.sfda.gov.cn/WS01/CL0051/4060.html. Last
accessed on October 6, 2009.
26. SFDA, SFDA Released Newly Revised Provisions for Drug Registration (in Chinese), July 11, 2007.
Available online at http://www.sfda.gov.cn/WS01/CL0051/4061.html. Last accessed on October 6, 2009.
27. Xinhua News, China Raises Threshold for Drug GMP Certification (in Chinese), October 29, 2007.
Available online at http://news.xinhuanet.com/english/2007-10/29/content_6972050.htm. Last accessed on
April 29, 2008.
28. SFDA Press Release, SFDA Initiated Quality Authorizer Policy among Pharmaceutical Companies, April
10, 2009. Available online at http://www.sda.gov.cn/WS01/CL0287/37145.html. Last accessed on October
6, 2009.
29. SFDA, Yearly Statistics Reporter, 2008. China: Beijing. Chinese version available online at
http://www.sfda.gov.cn/WS01/CL0108/41834.html. Last accessed on October 22, 2009.
30. SFDA, Yearly Statistics Reporter, 2006. China: Beijing. Chinese version available online at
http://www.sfda.gov.cn/WS01/CL0108/25441.html. Last accessed on October 22, 2009.
31. Brewer T. and Graham A. Colditz, Postmarketing Surveillance and Adverse Drug Reactions: Current
Perspectives and Future Needs. JAMA, 1999, 281(9), pp. 824-829.
32. SFDA Press Release, Notice about 2006 Nationwide ADRs Reporting (in Chinese), January 23, 2007.
Available online at http://www.sda.gov.cn/WS01/CL0055/10640.html. Last accessed on October 6, 2009.
33. China Pharmaceutical News, ADRs Reports Mount to 62,000 in 2008 (in Chinese), January 21, 2009.

89
34. FDA, Reports Received and Reports Entered into AERS by Year, available online at
http://www.fda.gov/Drugs/GuidanceComplianceRegulatoryInformation/Surveillance/AdverseDrugEffects/u
cm070434.htm. Last accessed Nov.12, 2009.
35. SFDA Press Release, SFDA Solicits Feedback on the ADR Reporting Rule Amendment (in Chinese), June
30, 2009. Available online at http://www.sfda.gov.cn/WS01/CL0055/39654.html. Last accessed on October
6, 2009.
36. SFDA Press Release, SFDA Releases Provisions on Drug Recall (in Chinese), December 12, 2007.
Available online at http://www.sfda.gov.cn/WS01/CL0051/26935.html. Last accessed on October 7, 2009.
37. The World Health Organization, Substandard and Counterfeit Medicine. Webpage available at
http://www.who.int/mediacentre/factsheets/2003/fs275/en/. Last accessed on October 7, 2009.
38. Wong, Natasha, Counterfeit Medicine: Is It Curing China? Asian Pacific Law & Policy Journal, 2004,
Vol.5, pp. 155-187.
39. SFDA Press Release, Supreme People’s Court and Supreme People’s Procuratorate Releases Special
Judicial Interpretation (in Chinese), May 26, 2009. Available online at
http://www.sda.gov.cn/WS01/CL0026/38244.html. Last accessed on October 7, 2009.
40. Henson, S. and Julie Caswell, Food Safety Regulation: An Review of Contemporary Issues. Food Policy,
1999, No. 24: pp. 589-603.
41. SFDA Press Release, SFDA Held Press Conference on New Development in Food and Drug Regulation (in
Chinese), August 8, 2007. Available online at http://www.sfda.gov.cn/WS01/CL0329/25313.html. Last
accessed on October 9, 2009.
42. FDA, Budget Summaries 2005-2009, Available online at
http://www.fda.gov/AboutFDA/ReportsManualsForms/Reports/BudgetReports/default.htm. Last accessed
on October 22, 2009.
43. Hu, Y. et al., The Chinese Pharmaceutical Market: Dynamics and a Proposed Investment Strategy. Journal
of Medical Marketing, 2007, 7(1): pp. 18-24.
44. Tang, S. et al., Pharmaceutical Policy in China: Issues and Problems. WHO China Pharmaceutical Policy
Studies Summary Paper, June 2007. Available online at
http://archives.who.int/tbs/ChinesePharmaceuticalPolicy/BackgroundENGdefault.htm. Last accessed on
October 20, 2009.
45. Scherer, F. M., Dynamics and Regulation of the Asian Pharmaceutical Industry: A Critical Review. HKS
Working Paper No. RWP08-021, 2008. Available at SSRN: http://ssrn.com/abstract=1124293.
46. The Health Strategies Consultancy LLC, Follow the Pill: Understanding the U.S. Commercial
Pharmaceutical Supply Chain. A Report Prepared for the Kaiser Family Foundation, March 2005.
47. PriceWaterHouseCoopers, Investing in China’s Pharmaceutical Industry (2nd Edition), 2009.
48. China Pharmaceutical News, Pharmaceutical Commerce in 2004, January 4, 2005.
49. Gottlieb, S., Access to Information in People’s Republic of China: Do Controls on Information about the
Safety of Chinese and Drug Imports Hinder the Ability of U.S. Regulators to Protect American Consumers?
90
Testimony before the U.S.-China Economic and Security Review Commission, July 13, 2007. Available at
http://www.aei.org/speech/26576.
50. Public Citizen: Protection Health, Safety and Democracy, http://www.citizen.org/,
51. Wang, Y.R., Price Competition in the Chinese Pharmaceutical Market. International Journal of Health Care
Finance and Economics, 2006, 6(2): pp. 119-129.
52. The Economist, Overdosed: China is Saddling Multinationals with the Bill for Reforming its Corrupt
Health Care System. 1998, 349(8093): pp. 71-72.
53. Blumenthal, D. and William Hsiao, Privatization and its Discontent – The Evolving Chinese Health Care
System. The New England Journal of Medicine, 2005, 353(11): pp. 1165-1170.
54. Zhang, W. and Xue Liu, Challenges to China’s Pharmaceutical Industry and Their Policy Implications. In
Eggleston, K. (ed.), Prescribing Cultures and Pharmaceutical Policy in Asia Pacific. Palo Alto, CA: Walter
H. Shorenstein Asia-Pacific Research Center, Stanford University, 2009.
55. Breckner, M. et al., China’s Pharmaceutical Market: Business Environment and Market Dynamics. In
Gunter Festel, Andreas Kreimeyer, Udo Oels, and Maximilian Von Zedtwitz (ed.), The Chemical and
Pharmaceutical Industry in China. Berlin, Germany: the Springer, 2005.
56. People’s Government of Guangdong Province, Preferential Drug Pricing Policy (pilot version), August 7,
2009, Policy No. 186. Available online at
http://www.gd.gov.cn/govpub/bmguifan/200909/t20090908_102138.htm. Last accessed on October 22,
2009.
57. Kesselheim, A. S. and Jerry Avorn, The Role of Litigation in Defining Drug Risks. JAMA, 2007, 297(3):
pp. 308-311.
58. Wall Street Journal (Eastern Edition), Breaking Views/Insights on Investing: How Deep Do Merck’s
Wounds Go? Drug Maker’s Troubles Could Grow Amid Deadline for Filing Vioxx Lawsuits. New York,
N.Y. September 30, 2006, p.B. 14.
59. Washington Post, Merck Agrees to Blanket Settlement on Vioxx, November 10, 2007. Available online at
http://www.washingtonpost.com/wp-dyn/content/article/2007/11/09/AR2007110900597.html. Last
accessed on October 22, 2009.
60. People’s Republic of China, Product Quality Law (in Chinese). Beijing: National People’s Congress
Publication, 2000.
61. People’s Republic of China, Consumer Protection Law (in Chinese). Beijing: China Legal Publishing
House, July 2006.
62. Lin Qing-Feng, Civil Liability and Relief System of Adverse Drug Reaction (in Chinese). Hebei Law
Science, 2004, 22(3): pp. 114-117.
63. Conk, George W. and Zhu, Wang, Tort Liability Law of the People's Republic of China (2d official
discussion draft December 21, 2008) (November 6, 2009). Fordham Law Legal Studies Research Paper No.
1501302. Available at SSRN: http://ssrn.com/abstract=1501302.

91
64. Economic Observer News, Pharmaceutical Representatives Call for Enactment of Drug Safety Law (in
Chinese), March 9th, 2009. Available online at
http://www.eeo.com.cn/Politics/beijing_news/2009/03/09/131747.shtml. Last accessed on October 23,
2009.
65. Scherer, F.M., The Pharmaceutical Industry. In Culyer, A.J. and J.P. Newhouse (ed.), Handbook of Health
Economics, 1994.

92
Appendix A: List of Interviews Conducted
Time Location Interviewee Interview content Sept.2, 2009 Beijing Deputy director of one
municipal drug department in Beijing
GMP standards and enforcement, market quality inspection.
Sept.3, 2009 Beijing Deputy director of one municipal ADRs monitoring center in Beijing
Post-marketing surveillance, ADRs monitoring, and drug recalls
Sept.3, 2009 Beijing Senior analyst, Center for Drug Evaluation, SFDA
New drug approval, SFDA organization reform
Sept.4, 2009 Beijing Senior researcher, Center for Drug Evaluation, SFDA
New drug approval, SFDA organization reform
Sept.6, 2009 Beijing Senior director, Department of Policy & Regulations, SFDA
New drug approval, GMP standards, post-marketing surveillance and other regulations
Sept.7, 2009 Shanghai Health policy analyst, Ministry of Labor and Social Security, People’s Republic of China
China’s health care reform and pharmaceutical pricing policy