THREE ESSAYS ON CANCER SURVIVORSHIP AND LABOR …
145
The Pennsylvania State University The Graduate School College of Health and Human Development THREE ESSAYS ON CANCER SURVIVORSHIP AND LABOR SUPPLY A Dissertation in Health Policy and Administration by Michael P. Markowski © 2010 Michael P. Markowski Submitted in Partial Fulfillment of the Requirements for the Degree of Doctor of Philosophy December 2010
Transcript of THREE ESSAYS ON CANCER SURVIVORSHIP AND LABOR …

The Pennsylvania State University
The Graduate School
College of Health and Human Development
THREE ESSAYS ON CANCER SURVIVORSHIP
AND LABOR SUPPLY
A Dissertation in
Health Policy and Administration
by
Michael P. Markowski
© 2010 Michael P. Markowski
Submitted in Partial Fulfillment
of the Requirements
for the Degree of
Doctor of Philosophy
December 2010

ii
The dissertation of Michael P. Markowski was reviewed and approved* by the following:
Pamela F. Short
Professor of Health Policy and Administration, Demography, and Public Health Sciences
Dissertation Adviser
Chair of Committee
John Moran
Assistant Professor of Health Policy and Administration
Christopher S. Hollenbeak
Associate Professor of Surgery and Public Health Sciences
Janice Penrod
Associate Professor of Nursing
Dennis Shea
Professor of Health Policy and Administration
Head of the Department of Health Policy and Administration
*Signatures are on file in the Graduate School

iii
ABSTRACT
These essays examine the effects of cancer on labor supply by cancer survivors in three
situations: patients deciding whether to continue working during treatment, spouses deciding
whether and how much to work in the years following treatment, and survivors deciding about the
timing of retirement. These choices affect individual and societal welfare. Work matters to
individual cancer survivors because it is a source of personal fulfillment, a measure of health and
vitality, income, and employer-sponsored health insurance benefits. Work matters to society. The
National Cancer Institute has estimated that cancer costs over $20 billion annually in work-loss
days. Efforts to support and accommodate work by cancer survivors would reduce the indirect
economic costs of cancer to society and would potentially improve the well-being of cancer
survivors and their families.
Although sixty percent of newly diagnosed cancer survivors decide to continue to work
during treatment, little is known about the factors that are associated with that decision.
Furthermore, spouses share in the cancer survivorship journey, yet the labor supply effect of
cancer on spouses in working couples is unknown. With the incidence of cancer increasing with
age, the labor supply decision of older cancer survivors increasingly becomes a decision about
retirement.
The studies use data from the Penn State Cancer Survivor Study (PSCSS) funded by the
National Cancer Institute, and supplemented with data from the Health and Retirement Study
(HRS), to produce estimates of the effects of cancer on work status and the usual hours of work
per week for cancer survivors and spouses at difference stages of survivorship. Logistic
regression methods were used to produce estimates of the effects of cancer on working or on
complete retirement. Tobit models were used to estimate the effect of cancer on hours of work.
The first study finds that the decision to work during treatment is mainly determined by
clinical considerations, such as cancer type and stage, although job-related health insurance of
iv
survivors and spouses is associated with a greater likelihood of working through treatment. The
second study finds that cancer has little long-term effect on the labor supply of the spouses of
survivors, at least in older couples or where both partners were working at diagnosis, the
situations that were the focus of this research. The third study finds that survivors of both
genders who remain cancer-free postpone retirement compared to other adults with no cancer
history, but female survivors with recurrences or new cancers retire sooner.

v
TABLE OF CONTENTS
LIST OF TABLES....……………………………………………………………………………..vii
LIST OF FIGURES....………………………………………………………………………….....ix
LIST OF CHARTS………………………………………………………………………………...x
ACKNOWLEDGEMENTS...….……………………………………………………………….....xi
CHAPTER ONE: Introduction…..……………………………………………………………1
REFERENCES………………………………………………………………….12
CHAPTER TWO: What Factors Affect the Decision to Keep Working During Treatment?..19
BACKGROUND………………………………………………………………..20
CONCEPTUAL MODEL…………………………………………………….…23
METHODS……………………………………………………………………...29
RESULTS……………………………………………………………………….33
DISCUSSION…………………………………………………………………...39
REFERENCES………………………………………………………………….46
CHAPTER THREE: What is the Effect of Cancer on the Labor Supply of Spouses of Cancer
Survivors?......…………………………………………………………..65
BACKGROUND…………………………………………………………..……66
CONCEPTUAL MODEL……………………………………………………….68
METHODS……………………………………………………………………...71
RESULTS……………………………………………………………………….79
DISCUSSION…………………………………………………………………...82
REFERENCES………………………………………………………………….85

vi
CHAPTER FOUR: What is the Effect of Cancer on Time-to-Retirement?.............................102
BACKGROUND………………………………………………………………103
CONCEPTUAL MODEL……………………………………………………...105
METHODS…………………………………………………………………….109
RESULTS……………………………………………………………………...116
DISCUSSION………………………………………………………………….118
REFERENCES………………………………………………………………...120
CHAPTER FIVE: Conclusions……………………………………………………………...130

vii
LIST OF TABLES
Table 1.1: Dissertation Design & Cancer Survivor Literature Contribution…………………....18
Table 2.1: Characteristics of Cancer Survivor Study Sample at Diagnosis by Gender………….51
Table 2.2: Percent of Survivors Working During Treatment by Cancer Site and Stage at
Diagnosis within Gender..…………………………………………………………...54
Table 2.3: Percent of Survivors Working During Treatment by Characteristic at Diagnosis
within Gender………………………………………………………………………..55
Table 2.4: Percentile Distribution of Treatment Period Durations by Cancer Type and
Cancer Survivor Gender (Months)…………………………………………………..57
Table 2.5: Adjusted Odds Ratios for Factors Associated with Working During the
Treatment Period, Male Survivors…………………………………………………..58
Table 2.6: Adjusted Odds Ratios for Factors Associated with Working During the
Treatment Period, Female Survivors………………………………………………...60
Table 2.7: Odds Ratios for Main Effects and Interaction of Own Health Insurance at
Diagnosis for Married Cancer Survivors, Where Cancer Survivor is Working at
Diagnosis……………………………………………………………………….……62
Table 3.1: Changes in Patterns of Married Couples’ Work Choices from Diagnosis to
Wave 2……………………………………………………………...………………..90
Table 3.2: Characteristics of Spouses of Cancer Survivors in Working Couples at
Diagnosis and the Association with Working at Wave 2...…………………...……..91
Table 3.3: Husbands: Mean Usual Hours of Work by Cancer Characteristic of Survivors in
Working Couples at Diagnosis……..………………………………………………..94
Table 3.4: Wives: Mean Usual Hours of Work by Cancer Characteristic of Survivors in
Working Couples at Diagnosis……..………………………………………………..95
Table 3.5: Results of Logit Models: All Spouses, Adjusted Odds Ratios of Likelihood of
Working at Wave 2 Interview, Given Cancer of Survivor and Both Working
at Diagnosis………………………………………………………………………….96
Table 3.6: Results of Tobit Models: Contribution to Hours Worked by Spouse of Cancer
Survivor at Wave 2 Interview, Given Both Working at Diagnosis………………….97
Table 3.7: Characteristics of CSS and HRS Spouses at Diagnosis in Working Couples..………98
Table 3.8: Results of Logit Models: Adjusted Odds Ratios for Husbands of Cancer
Survivors Compared to Husbands without Cancer in Married Couples with
Both Working at Diagnosis …………………………………………………………99

viii
Table 3.9: Results of Logit Models: Adjusted Odds Ratios for Wives of Cancer Survivors
Compared to Wives without Cancer in Married Couples with Both Working at
Diagnosis…………………………………………………………………………..100
Table 3.10: Results of Tobit Models: Effects of Cancer on Hours of Work: CSS vs. HRS,
Given Both Working at Time of Diagnosis………………………………………...101
Table 4.1: Characteristics of PSCSS and HRS Samples, Working at Diagnosis/Baseline……..125
Table 4.2: Attrition in Surveys by Gender, by Count and by Percentage Lost in Follow-up
for Any Reasons……………………………………………………………………127
Table 4.3: Adjusted Odds Ratios for Factors Associated with Time Until First Retirement,
Self-Reported Completely Retired; Excludes Partially Retired, Males: CSS
Survivors v. HRS Controls………………………………………………….……...128
Table 4.4: Adjusted Odds Ratios for Factors Associated with Time Until First Retirement,
Self-Reported Completely Retired; Excludes Partially Retired, Females: CSS
Survivors v. HRS Controls…………………………………………………….…...129

ix
LIST OF FIGURES
Figure 1.1: Stages of Cancer Survivorship (Mullan 1985)……………………………………....16
Figure 1.2: Key Employment Decisions Faced by Cancer Survivors: A Sequence of
Choices……...……………………………………………………………………….17
Figure 2.1: Conceptual Model of Factors Which Affect Time for Treatment and Ability to
Work in the Treatment Period……………………………………………………….50
Figure 3.1: Key Employment Decisions Faced by Spouses of Cancer Survivors: A
Sequence of Choices at Each Stage of the Joint Survivorship Experience……….…88
Figure 3.2: Conceptual Model of Factors Which Affect the Work Decision at Wave 2………...89
Figure 4.1: Conceptual Model of Factors Which Affect the Retirement Decision……………..123
Figure 4.2: From Survey to Sample in Study, 1936-1947 Birth Cohorts……………………....124

x
LIST OF CHARTS
Chart 1: Estimated Odds Ratios and 95% Confidence Intervals for Working During
Treatment by Cancer Site, Male Survivors (Colorectal Cancer Reference
Group)……………………………………………………………………….………….63
Chart 2: Estimated Odds Ratios and 95% Confidence Intervals for Working During
Treatment by Cancer Site, Female Survivors (Colorectal Cancer Reference
Group)……………………………………………………………………….………….64

xi
ACKNOWLEDGEMENTS
―It takes a village‖ might best describe the dissertation process. I am grateful to the
cancer survivors and families, who despite the challenges placed in their way by this disease,
generously gave their time and information to benefit others. My adviser, Pamela Farley Short,
helped immensely with her constant encouragement and frequent critical reviews of work in
process. Thanks to my committee members, John Moran, Christopher Hollenbeak, and Janice
Penrod, for their valuable time and suggestions. Besides my adviser, I was blessed with many
good teachers, whose gifts were included in this work: Rebecca Wells, Peter Kemper, Dennis
Shea, Tom Arnold, Jim Prichard, Neil Storms, the IHM community, and especially, Joe Vasey for
his SAS assistance. My cohort colleagues, Chandra Ganesh, Yu Bai, Tokunbo Oluwole, and
Harry Holt spent many hours in study group sessions, classes, and sharing time outside of class
with me. It was very difficult to spend the weekdays and nights on campus separated from my
wife, but they helped to lessen the pain by their kind words and thoughtfulness. Finally, Bev Fahr
helped with course registration, oral defense logistics, and completion of required documentation.
My wife, Pat, deserves special thanks for the gift of time – time to attend classes at a
distant campus and time spent in hours of programming and writing in the production of this
dissertation. Our son, Paul, and daughter-in-law, Marisa, provided much needed logistical
support, and our grandsons, Nolan and Shane, provided inspirational boosts when energy
wavered. Our son, Andrew, and daughter-in-law, Jenell, along with granddaughters Elyse and
Layne, offered encouragement via Skype and shared laughter to help us along the way. My
sisters, Ann and Kathy, provided timely encouragement. Last, but not least, without the sacrifices
of my mom, Mary Ann, and my dad, Joe ―the truck driver,‖ I would not have been in a position to
write this dissertation.
1
CHAPTER ONE
INTRODUCTION
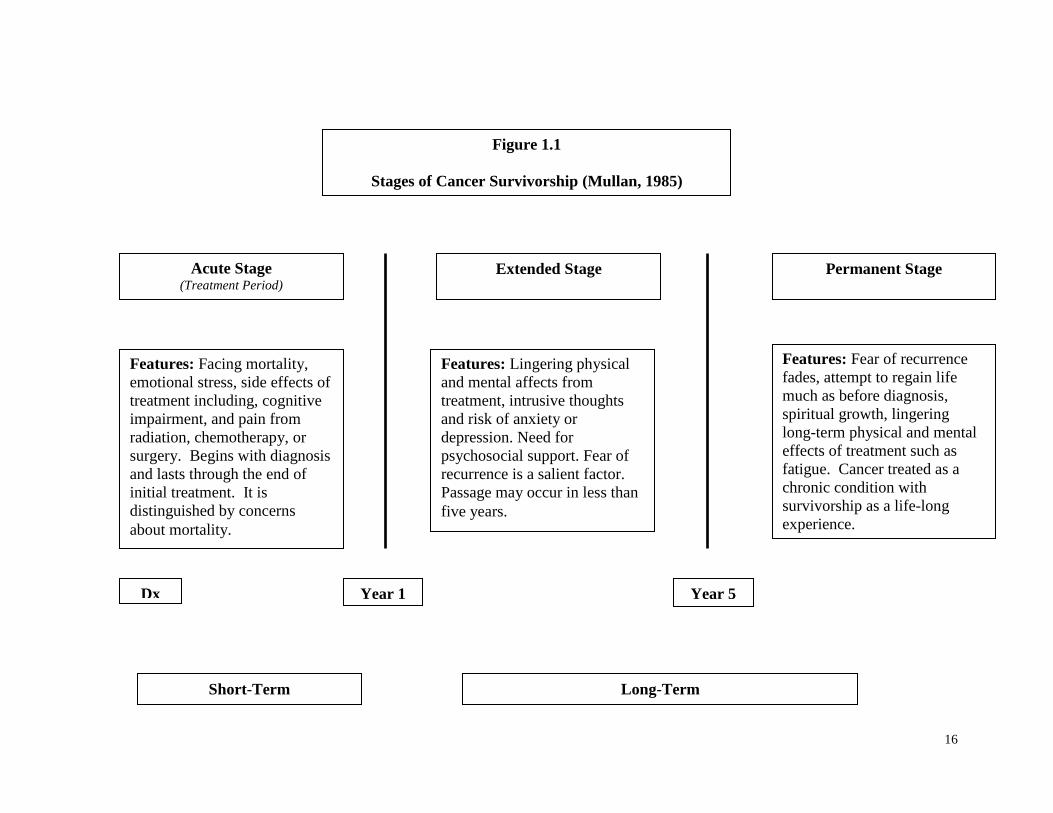
This dissertation is about cancer survivors and the decision to work at various stages of the
survivorship experience. These stages have been described by a physician and cancer survivor,
Fitzhugh Mullan, as ―seasons of survival‖ (Figure 1.1). Each survivor’s journey begins with
diagnosis and lasts a lifetime. The announcement of a cancer diagnosis forces a confrontation
with mortality in the acute stage which is coterminous with the treatment period. Decisions about
working in this stage are complicated by stress and side effects from radiation, chemotherapy or
surgery. Following treatment, a cancer survivor lives with the daily fear of recurrence and
lingering effects of treatment in the extended survival stage. When the fear of recurrence fades
into the background, a cancer survivor crosses a psychological boundary into the permanent
survival stage. However, some consequences of treatment, ―late effects,‖ may manifest
themselves long after the initial treatment. Late effects include fatigue, pain, diminished
cognitive function, and most significantly, the recurrence of cancer.
The treatment stage, or acute survival stage as characterized by Mullan, is dominated by
fear of dying. The cancer survivor must cope with the shock of the life-threatening diagnosis,
engage the medical system for assessments and treatments, and share the news with family,
friends, co-workers and employers. The cancer survivor has intense contact with healthcare
professionals and a support network. Cancer survivors must make choices under duress with
potential negative consequences for health outcomes, including longevity and quality-of-life.
Fatigue, difficulty focusing on mental tasks, intrusive thoughts, anxiety, depression, lymphedema,
and worries about finances are commonly reported by cancer survivors in treatment (Anderson,
& Hacker, 2008; Fallowfield, Ratcliffe, Jenkins, & Saul, 2001; Doyle-Lindrud, 2007; King et

2
al., 2008; Loscalzo, & Clark, 2007; Spelten, et al., 2003; Rodin, 2008; Towers, Carnevale, &
Baker, 2008).
Once treatment has been completed, the cancer survivor enters a transitional stage in
which the cancer survivor faces a major process of adjustment that continues with the progression
to the stage of permanent survival. The adjustment process involves physical, mental, spiritual,
social, emotional, and economic issues. Fear of mortality is replaced by fear of recurrence in the
extended survival stage. Cancer survivors engage in a heightened sense of self-monitoring for
new signs of cancer and many experience excessive worrying. Many have difficulty with
memory and problem-solving from chemotherapy. Pain and complications like increased levels
of fatigue may linger from treatment or only manifest themselves over time. Cancer survivors
report a lessening of support from families, friends, co-workers, and employers who assume that
successful treatment has restored a cancer survivor to his or her state of physical and mental
health prior to the diagnosis. With the end of treatment, cancer survivors lose the frequency and
intensity of contact they once held with healthcare professionals, who offered support and
reassurance. As Mullan notes, a cancer survivor’s perspective has changed forever (American
Cancer Society, 2010; Institute of Medicine, 2006; Main, Nowels, Cavender, Etschmaier, &
Steiner, 2005; Michaelson et al., 2008; Pryce, Munir, & Haslam, 2007).
In the permanent survival stage, a cancer survivor’s fears of recurrence gradually fade as
a daily concern and the adjustment process that began with diagnosis is largely achieved. The
fear of recurrence never leaves entirely, but its intensity and intrusiveness diminish significantly
(Mullens, McCaul, Erickson, & Sandgren, 2004). However, not all risks diminish. For example,
an increased risk of suicide remains (Rowland, 2006). For some cancer survivors, their journey
yields spiritual growth and infuses their lives with new meaning (Peuckmann et al., 2007;
Schroevers, Ranchor, & Sanderman, 2006). For others, simply returning to as much normalcy as
possible is sufficient. In this stage, a cancer survivor may endure some residual effects from

3
cancer treatment, such as fatigue or cognitive deficits, like memory issues or problem-solving
capacity (Lawenda, Mondry, & Johnstone, 2009).
Each stage of cancer brings a somewhat different set of set of work choices by cancer
survivors (Figure 1.2). Furthermore, decisions made at one stage in survivorship may reverberate
through subsequent stages. In the treatment stage, the time required for treatment and its side
effects like fatigue, pain, and difficulties with mental concentration and problem-solving may
influence the work decisions of cancer survivors (Reeves, 2008). While working may yield
positive psychological benefits by helping a survivor cope with their worries, working may be an
economic necessity for others (Main, Nowels, Cavender, Etschmaier, & Steiner, 2005). Cancer
survivors may not receive accommodating support from employers for time off for medical
treatments or with the burden of the side effects that make working more difficult (Pryce, Munir,
& Haslam, 2007). Co-workers may or may not be able to temporarily replace the work forgone
by cancer survivors (Hansson, Bostrom, & Harms-Ringdahl, 2006). Paid sick leave, which
allows taking time off for treatment may not be a job benefit. Wage losses may be significant
(Longo, Fitch, Deber, & Williams, 2006). Future career prospects or even continued
employment with associated job benefits like health insurance may be jeopardized (Main,
Nowels, Cavender, Etschmaier, & Steiner, 2005). Cancer survivors’ work decisions may be
influenced by these concerns since they may lose income or access to employer-sponsored health
insurance, when they need them the most.
Survivors may continue working during treatment, but this choice may affect their future
health status and ability to work at later stages. Some survivors may choose to stop working
altogether during treatment. Others may continue working but reduce hours of work or take some
time off for treatment. Survivors have reported foregoing treatment due to work considerations.
Failure to comply fully with treatment protocols may have effects on health and work choices in
subsequent stages (Bradley, Neumark, Luo, & Bednarek, 2007). In addition, the shock of a

4
serious illness may have changed their preferences for work or leisure (Bradley, Neumark, Luo,
& Bednarek, 2007; Coile, 2004; McClellan, 1998).
In the extended survival season, the transition stage, attention turns to issues surrounding
return-to-work for cancer survivors who stopped working during treatment. Job duties may
change because of lingering treatment effects like fatigue and its interaction with cognitive
impairment, including memory loss, inability to concentrate on complex tasks, and difficulty with
learning or multitasking (Bradley, Neumark, Luo, Bednarek, & Schenk, 2005; Mulrooney, 2008).
Other treatment consequences like pain, sexual dysfunction, and incontinence may diminish
quality of life and the ability to work (American Cancer Society, 2010; Shaw, 2008; Stilos,
Doyle, & Daines, 2008; Reeves, 2008; Jackson et al., 2008; Vadivelu, Schreck, Lopez,
Kodumudi, & Narayan, 2008). The number of work hours may be reduced as survivors cope
with the outcomes of treatment. The physical and mental burdens may induce some survivors
who worked through treatment to stop working. Alternatively, some survivors who stopped
working may have difficulty returning to work, due to the expectations of normalcy by employers
and co-workers or from lingering effects of treatment previously noted. Others who did return to
work may reduce hours or stop working again. Still others, who worked during treatment, may
stop working in the extended survival season as a consequence of effects of poor health outcomes
from treatment. The poor outcomes may occur for two reasons. The outcome may be due to
working instead of concentrating on recovery or sacrificing treatment in order to work.
In the permanent survival period, the last stage, cancer survivors have come to terms with
cancer as a chronic illness and lingering effects like pain (American Cancer Society, 2010; de
Ridder, Geenen, Kuijer, & van Middendorp, 2008; Hinton, 2008). Most of the adjustments in
return-to-work or the number of hours spent working have been made by this stage. Some
cancer survivors may continue working to recover income losses from earlier stages or to
maintain benefits to assist with future medical expenses. Alternatively, some survivors may retire

5
sooner for health reasons or because their preferences for leisure have changed in the course of
their personal journey (Bradley, Neumark, Luo, & Bednarek, 2007).
The literature on cancer survivorship and employment has largely focused on return-to-
work issues. The return-to-work studies have reported the proportion of cancer survivors
working in two different timeframes measured from diagnosis. The short-term timeframe spans
from 1 to 5 years after diagnosis. The long-term timeframe continues beyond the traditional cure
reference point of 5 years. These periods roughly correspond to the later stages of survival
proposed by Mullan (1985) and the National Cancer Institute’s classification of cancer patients
along a survivorship continuum that includes treatment, post-treatment, and continuing care
(Institute of Medicine, 2006).
The treatment stage ends within approximately 12 months for most survivors. For
example, one study of breast cancer survivors’ post-treatment return-to-work suggested that most
survivors had completed treatment prior to 12 months (Bouknight, Bradley, & Luo, 2006).
Another study has suggested that the return-to-work adjustment was largely finished by 12
months with 73% of cancer survivors returning to work. In the following 12 months, the
cumulative return rate increased slightly to 78% (Short, Vasey, & Tunceli, 2005). Consequently,
research on return-to-work often focuses on employment 12 months or more after diagnosis.
Studies of employment in the initial 12 months after diagnosis are often interpreted as
characterizing employment patterns during treatment (Lauzier et al., 2008). Significant time
costs have been found in the treatment of initial cancers in the first 12 months (Yabroff et al.,
2007).
Under the circumstances, rates of employment for cancer survivors reported in the
literature depend on the stage of survivorship or time from diagnosis. One study on return-to-
work reported that 71% of breast cancer survivors were working at 3 months (Satariano &
DeLorenze, 1996). Another study of prostate cancer survivors found that 72% were working at
six months (Bradley, Neumark, Luo, Bednarek, & Schenk, 2005). In the extended survival stage,

6
a study of breast cancer survivors reported that 82% were working at twelve months (Bouknight,
Bradley, & Luo, 2006). Another study found that 87% of cancer survivors were working at one
to five years (Short, Vasey, & Tunceli, 2005). In a study in the permanent survival stage, eighty-
six percent of testicular cancer survivors were working over 11 years later (Skaali et al., 2008).
The return-to-work studies largely ignore the issues surrounding the decision to work
during treatment. One survivor study found that cancer survivors were approximately evenly
divided on the decision to work or stop working during treatment (Short, Vasey, & Tunceli,
2005). In addition, most studies in the return-to-work literature are limited to survivors with a
single type of cancer, usually the most prevalent cancer such as breast, prostate, colon, and lung
(Bradley, & Bednarek, 2002; Bradley, Neumark, Luo, & Bednarek, 2007; Bouknight, Bradley, &
Luo, 2006; Drolet, Maunsell, Mondor, Brisson, C., Brisson, J., & Deschenes, 2005; Sanchez,
Richardson, & Mason, 2004), which makes it more difficult to compare employment patterns by
cancer site.
In making decisions about work, cancer survivors confront two forces that push in
opposite directions. The fatigue, pain, cognitive impairment, or psychosocial stresses that
accompany the disease may increase the value of taking time off to focus on health issues. On
the other hand, good jobs, pensions, and health insurance can provide social support, income, and
benefits in the face of uncertainty about future medical costs. Economic theory cannot predict
which of these twin forces will be dominant. Hence, the answers to questions about cancer’s
effect on labor supply require empirical studies.
The number of cancer survivors is large and growing. The National Cancer Institute
estimated that the number of people alive, who ever had a diagnosis of invasive cancer,
approached 11.4 million in 2006 (American Cancer Society, 2010). This population is expected
to double by 2020 as the incidence of cancer increases in an aging population and longevity is
increased through early detection and treatment (Edwards et al., 2002). The Institute of

7
Medicine provided a ―state of the cancer survivor‖ in its report, ―From Cancer Patient to
Survivor‖ (2006). The Institute noted that 61% of cancer survivors were 65 years of age or older
with an additional 38% in the prime working ages from 20 to 64 years. Breast, prostate and
colon cancers accounted for half of all cancer sites. Breast and prostate cancers were the most
prevalent sites respectively for women and men. Colon cancer affected men and women and
ranked third overall among cancers in prevalence.
The short-term and long-term effects of cancer on the employment of survivors add to the
economic costs of the disease. The total monetary burden of the disease was estimated by the
National Institutes of Health at $263.8 billion in 2010 (American Cancer Society, 2010).
Interestingly, the direct medical expense of $102.8 billion represents less than half of the total
costs (38%). Morbidity costs or the productivity lost due to the effects of the illness were $20.9
billion (7.9%). The morbidity cost or the productivity lost due to premature death was $140.1
(53.1%). Over 1.65 billion work days of a total of 2.5 billion work days were impaired by cancer
(Kessler, Greenberg, Mickelson, Meneades, & Wang, 2001).
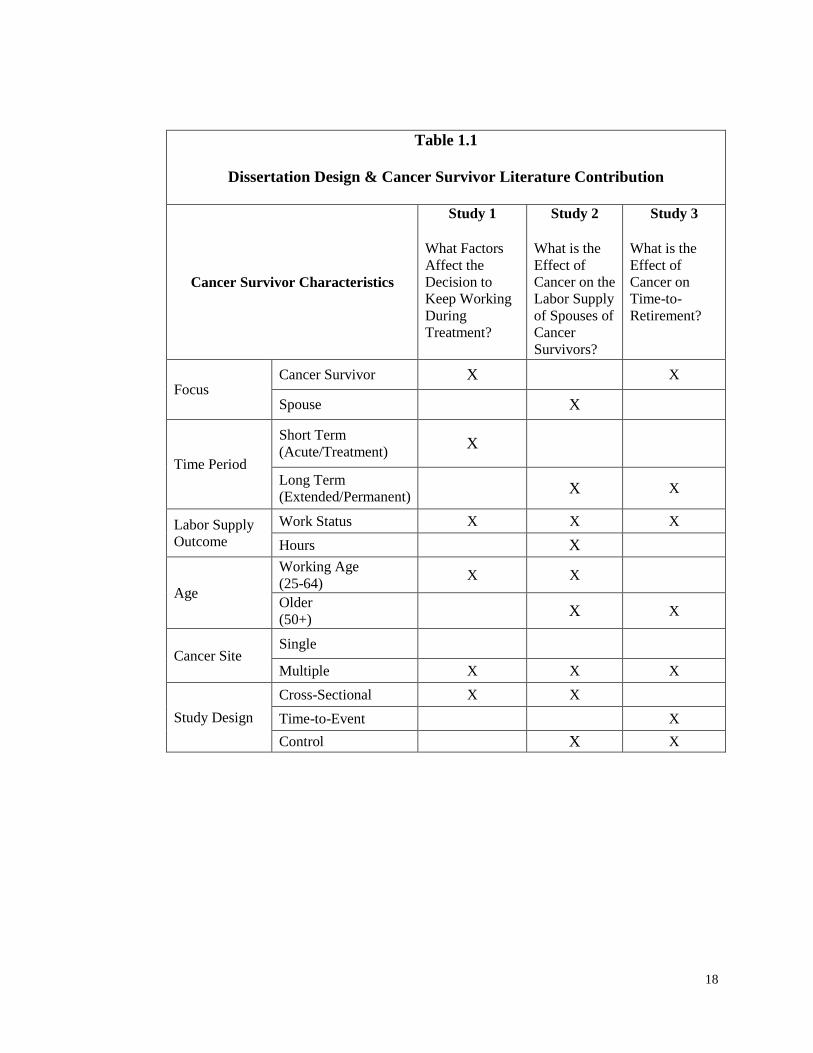
The three essays comprising this dissertation aim at filling important gaps in the
literature on survivorship and employment (Table 1.1). All three studies use data from the Penn
State Cancer Survivor Survey (PSCSS). The Penn State Cancer Survivor Survey is a population-
based panel survey funded by the National Cancer Institute. The longitudinal design spans the
period 1997 through 2004. Cancer survivors were recruited from cancer registries at four medical
centers including The Johns Hopkins Hospital, Lehigh Valley Hospital and Health Network,
Geisinger Medical Center, and Milton S. Hershey Medical Center. Participants were included
based on these criteria: (1) between the ages of 25 and 62 at diagnosis, (2) with a first cancer
diagnosed between January 1997 and December 1999, and (3) with a prognosis that would permit
participation over four waves in the panel survey. The first of four annual interviews was
conducted from October 2000 through December 2001. The survey participants varied by wave

8
beginning with 1,761 in Wave 1 and ending with 1,232 in Wave 4. Retrospective questions were
asked about employment status and health at diagnosis. Change was measured at the annual
interviews. Survey questions mirrored the content of the Health and Retirement Survey. This
panel survey, which is managed by the University of Michigan, began in 1992. It includes 30,000
participants who are aged 51 or older.
Most previous studies of cancer survivorship and employment have focused on a single
cancer site, and often breast or prostate cancers (Bouknight, Bradley, & Luo, 2006; Bradley,
Bednarek, & Neumark, 2002; Bradley, Neumark, Luo, Bednarek, & Schenk, 2005; Drolet et al.,
2005; Maunsell et al., 2004). The PSCSS included multiple cancers, which will facilitate effect
due to clinical differences in cancer and expand the potential generalization of results to a wider
population of cancer survivors.
The need for better designed studies including population-based research and control
groups was noted in an assessment of the literature on cancer and labor supply studies (Steiner,
Cavender, Main, & Bradley, 2004), and two of the studies comprising this thesis make use of
non-cancer control groups drawn from the Health and Retirement Study (HRS). The use of more
rigorous methods and complementary research designs will add to the growing body of
knowledge about labor supply effects of cancer.
The first study examined cancer survivor labor supply decisions during the treatment
period. The treatment period has been included in studies with two different objectives. Two
studies estimated the economic costs of cancer within 18 months of diagnosis (Longo, Fitch,
Deber, & Williams, 2006; Lauzier et al., 2008). However, neither study estimated the labor
supply changes in work status or hours on subsequent financial consequences. Other studies have
included the treatment period in measuring return-to-work for cancer survivors who stopped
working during treatment (De Boer et al., 2008; Short, Vasey, & Tunceli, 2005). However, this

9
focus does not address the 60% of cancer survivors who continue to work during treatment
(Short, Vasey, & Tunceli, 2005). The decision to work during treatment may affect labor supply
choices in subsequent stages. The initial work decisions during treatment may ultimately affect
health outcomes or the survival trajectory or quality of life for long-term survivors. Here,
working during treatment is studied with retrospective questions about work status at diagnosis
and working during treatment asked in the first PSCSS interview, which occurred one to five
years after diagnosis. Baseline covariates for cancer, socio-demographic, and job-related
characteristics were tested for their association with the decision to keep working during
treatment.
The second study addressed the labor supply decisions of the spouses of cancer
survivors. Research sponsors, like the Office of Cancer Survivorship, have supported a broader
definition of cancer survivor that includes spouses, families, caregivers, and others affected by
cancer (Institute of Medicine, 2006). Bradley and Bednarek (2002) have encouraged studies of
spousal labor supply to provide a complete picture of the labor supply effects of cancer. Spouses
may add to the cost of cancer by reducing labor supply or mitigate the economic loss to society
by continuing to work. In the PSCSS, considering working age cancer survivors (25-64) two to
six years after diagnosis, two-thirds of the cancer survivors were married and both partners were
working at diagnosis in two-thirds of those survivor couples. Thus, the potential effects of cancer
on spouse employment could be quite significant. These effects are examined here by making
comparisons at two levels. The first set of comparisons is limited to a sample drawn only from
the Penn State Cancer Survivor Survey that is limited to married survivors and their spouses.
Studying employment differences among survivors’ spouses that are associated with differences
in cancer type, socio-demographic, and job-related characteristics may inform the design of
employer accommodation programs or psychosocial support offerings. At the second level, the
effect of cancer on spousal labor supply is estimated by comparing survivor spouses in PSCSS to

10
a non-cancer control group, married individuals in the Health and Retirement Study who are not
married to a cancer survivor. Labor supply outcomes are measured at the larger and extensive
margin of work status and at the smaller and intensive margin of usual hours of work per week.
The third study focused on providing a longitudinal perspective that would complement
the cross-sectional designs used in the study of retirement decisions by older cancer survivors.
Retirement is a process that occurs over time. Some people may ―retire‖ by changing to less
stressful jobs. Others may partially retire by working less than full-time. Still others completely
retire by leaving the work-for-pay labor market. This study used a time-to-event methodology
where the event was defined as time to first complete retirement. It compared cancer survivors
with persons without cancer from the HRS across four annual PSCSS interviews. Baseline
covariates were used to predict if cancer survivors were more or less likely to retire compared to
HRS individuals. The outcome measures were work status and the usual hours of work per week.
With over 60% of cancer survivors aged 65 or older (Institute of Medicine, 2006), cancer may
have significant welfare implications if it accelerates or constrains the timing of retirement. One
cross-sectional study with population-based methods and a control group from a nationally
representative survey concluded that cancer had little long-term effect on the employment of
older survivors who remained cancer-free (Short, Vasey, & Moran, 2008). Here that conclusion
is re-examined with different methods, but with data from essentially the same cancer and non-
cancer samples, drawn respectively, from PSCSS and HRS. Multiple methods may provide
more reliable evidence by including a time-to-event design that compensates for the observations
missing at some future measurement point by observing cancer survivors over an extended period
of time and not at a slice in time.
In summary, the purposes of this dissertation were to fill gaps in the cancer survivor
literature for labor supply effects of cancer related to three important types of decisions:
decisions about working during treatment made by cancer survivors, longer term decisions about

11
working made by spouses, and decisions about the timing of retirement made by older cancer
survivors. The information will provide a basis for more complete estimates of the economic cost
of cancer in general and for retirees, and help with the design of work accommodations based on
consideration of cancer survivor characteristics.

12
References
American Cancer Society (2010). Cancer Facts & Figures 2010.
Anderson, Nancy J. & Hacker, Eileen D. (2008). Fatigue in women receiving intraperitoneal
chemotherapy for ovarian cancer: A review of contributing factors. Clinical Journal of
Oncology Nursing, 12(3), 445-454.
Bouknight, R., Bradley, C., & Luo, Z. (2006). Correlates of return to work for breast cancer
survivors. Journal of Clinical Oncology, 24(3), 345-353.
Bradley, C.J. & Bednarek H. (2002). Employment patterns of long-term cancer survivors.
Psycho-Oncology, 11 (2002), 188-198.
Bradley, C.J., Bednarek H., & Neumark, D. (2002). Breast cancer and women’s labor supply.
Journal of Health Economics, 21 (2002), 757-779.
Bradley, C.J., Neumark, D., Luo, Z., & Bednarek, H.L. (2007). Employment-contingent health
insurance, illness, and labor supply of women: evidence from married women with breast
cancer. Health Economics, 16, 719-737.
Bradley, C.J., Neumark, D., Luo, Z., Bednarek, H.L., & Schenk, M. (2005). Employment
outcomes of men treated with prostate cancer. Journal of the National Cancer Institute,
97(13), 958-965.
Coile, C. (2004). Health shocks and couples’ labor supply decisions. National Bureau of
Economic Research Working Paper Series #10810, National Bureau of Economic
Research, Cambridge, MA.
De Boer, A., Verbeek, J., Spelten, E., Uitterhoeve, A., Ansink, A., De Reijke, T., Kammeijer, M.,
Sprangers, M., & Van Dijk, F. (2008). Work ability and return-to-work in cancer patients.
The British Journal of Cancer, 98(8), 1342-7.
de Ridder, D., Geenen, R., Kuijer, R., & van Middendorp, H. (2008). Psychological Adjustment
to Chronic Disease. The Lancet, 372(9634), 246-255.
Doyle-Lindrud, S. (2007). Prostate cancer: A chronic illness. Clinical Journal of Oncology
Nursing, 11(6), 857-861.
Drolet, M., Maunsell, E., Brisson, J., Brisson, C., Masse, B., & Deschenes, L. (2005). Not
working three years after breast cancer: predictors in a population-based study. Journal of
Clinical Oncology, 23(33), 8305-8312.
Drolet M., Maunsell, E., Mondor, M., Brisson, C., Brisson, J., & Deschenes, L. (2005). Work
absence after breast cancer diagnosis: a population-based study. Canadian Medical
Association Journal, 173(7), 765-769.

13
Edwards, B.K., Howe, H.I., Ries, L. A., Thun, M.J., Rosenberg, H. M., Yancik, R., Wingo, P.A.,
Jemel, A., & Feigal, E.G. (2002). Annual report to the nation on the status of cancer
1973-1999, featuring implications of age and aging on U.S. cancer burden. Cancer,
94(10), 2766-2792.
Fallowfield, L., Ratcliffe, D., Jenkins, V., & Saul, J. (2001). Psychiatric morbidity and its
recognition by doctors in patients with cancer. British Journal of Cancer, 84(8), 1011-
1015.
Hansson, M., Bostrom, C., & Harms-Ringdahl. (2006). Sickness absence and sickness attendance
– what people with neck or back pain think. Social Science & Medicine, 62, 2183-2195.
Hinton, D. (2008). Living with skin cancer. Dermatology Nursing, 20(3), 240, 246.
Institute of Medicine. (2006). From cancer patient to cancer survivor: Lost in transition.
Washington: National Academies Press.
Jackson, E., Kelley, M., McNeil, P., Meyer, E., Schlegel, L., & Eaton, M. (2008). Does
therapeutic touch help reduce pain and anxiety in patients with cancer? Clinical Journal
of Oncology Nursing, 12(1), 113-120.
Kessler, R. C., Greenberg, P. E., Mickelson, K, D., Meneades, L.M., & Wang, P. S. (2001). The
effects of chronic medical conditions on work loss and work cutback. Journal of
Occupational and Mental Health, 43(3), 218-225.
King, L., Quinn, G., Vadaparampil, S., Gwede, C., Miree, C., Wilson, C., Clayton, H., & Perrin,
K. (2008). Oncology nurses’ perceptions of barriers to discussion of fertility preservation
with patients with cancer. Clinical Journal of Oncology Nursing, 12(3), 467-476.
Lauzier, S., Maunsell, E., Drolet, M., Coyle, D., D., Heber-Croteau, N., Brisson, J., Masse, B.,
Abdous, B., Robidoux, A., & Robert, J. (2008). Wage Losses in the Year After Breast
Cancer: Extent and Determinants Among Canadian Women. Journal of the National
Cancer Institute, 100(5), 321-32. Retrieved July 1, 2010, from Health Module.
(Document ID: 1441412171).
Lawenda, B., Mondry, T., & Johnstone, P. (2009). Lymphedema: A primer on the identification
and management of a chronic condition in oncologic treatment. CA: A Cancer Journal
for Clinicians, 59(1), 8-24.
Longo, C.J., Fitch, M., Deber, R. B., & Williams, A.P. (2006). Financial and family burden
associated with cancer treatment in Ontario, Canada. Support Care Cancer, 14, 1077-
1085.
Loscalzo, M. & Clark, K. (2007). Problem-related distress in cancer patients drives requests for
help: A prospective study. Oncology, 21(9), 1133.
Main, D. S., Nowels, C.T., Cavender, T.A., Etschmaier, M., & Steiner, J. F. (2005). A qualitative
study of work and work return in cancer survivors. Psycho-Oncology, 14, 992-1004.
14
Maunsell, E., Drolet, M., Brisson, J., Brisson, C., Masse, B., &. Deschenes, L. (2004). Work
situation after breast cancer: results from a population-based study. Journal of the
National Cancer Institute, 96(24), 1813-1822
McClellan, M. (1998). Health events, health insurance, and labor supply: Evidence from the
health and retirement survey. Frontiers in the Economics of Aging, 301-352.
Michaelson, M., Cotter, S., Gargollo, P., Zietman, A., Dahl, D., & Smith, M. (2008).
Management of complications of prostate cancer treatment. CA: A Cancer Journal for
Clinicians, 58(4), 196-213.
Mullan, F. (1985). Seasons of survival: reflections of a physician with cancer. New England
Journal of Medicine, 313, 270-273.
Mullens, A., McCaul, K., Erickson, S. & Sandgren, A. (2003). Coping after cancer: Risk
perceptions, worry, and health behaviors among colorectal cancer survivors. Psycho-
Oncology, 13(2), 367-376.
Mulrooney, T. (2008). Cognitive impairment after breast cancer treatment. Clinical Journal of
Oncology Nursing, 12(4), 678-680.
Peuckmann, V., Ekholm, O., Rasmussen, N., Moller, S., Groenvold, M., Christiansen, P.,
Eriksen, J., & Sjogren, P. (2007). Health-related quality of life in long-term breast cancer
survivors: Nationwide survey in Denmark. Breast Cancer Research Treatment, 104, 39-
46.
Pryce, J., Munir, F., & Haslam, C. (2007). Cancer survivorship and work: Symptoms, supervisor
response, co-worker disclosure and work adjustment. Journal of Occupational
Rehabilitation, 17, 83-92.
Reeves, K. (2008). A cancer pain primer. MEDSURG Nursing, 17(6), 413-420.
Rodin, G. (2008). Treatment of depression in patients with cancer. The Lancet, 372(9632), 8-10.
Rowland, J. (2006). Decades after cancer, suicide risk remains high. Journal of the National
Cancer Institute, 98(19), 1356-1358.
Sanchez, K., Richardson, J., & Mason, H. (2004). The return to work experiences of colorectal
cancer survivors. AAOHN Journal, 52(12), 500-510.
Satariano, W.A., & DeLorenze, G.N. (1996). The likelihood of returning to work after breast
cancer. Public Health Reports, 111(3), 236-241.
Schroevers, M., Ranchor, A., & Sanderman, R. (2006). Adjustment to cancer in the 8 years
following diagnosis: A longitudinal study comparing cancer survivors with healthy
individuals. Social Science & Medicine, 63(3), 598-610.
Shaw, J. (2008). Diagnosis and treatment of testicular cancer. American Family Physician,
77(4), 469-474.

15
Short, P.F., Vasey, J. J., & Moran, J.R. (2008). Long-term effects of cancer survivorship on the
employment of older workers. Health Services Research, 43(1), Part I, 193-210.
Short, P.F., Vasey, J. J., & Tunceli, K. (2005). Employment pathways in a large cohort of adult
cancer survivors. Cancer, 103(6), 1292-1301.
Skaali, T., Fossa, S., Bremnes, R., Dahl O., Haaland, C., Hauge, E., Klepp, O., Oldenburg, J.,
Wist, E., & Dahl, A. (2008). Fear of recurrence in long-term testicular cancer survivors.
Psycho-Oncology. DOI. 10.1002/pon.
Spelten, E., Verbeek, J., Uitterhoeve, A., Ansink, A., van der Lelie, J., de Reijke, T., Kammeijer,
M., de Haes, J., & Sprangers, M. (2003). Cancer, fatigue and the return of patients to
work—a prospective cohort study. European Journal of Cancer, 39, 1562-1567.
Steiner, J.F., Cavender, T.A., Main, D.S., & Bradley, C.J. (2004). Assessing the impact of cancer
on work outcomes. Cancer, 101(8), 1703-1711.
Stilos, K., Doyle, C., & Daines, P. (2008). Addressing the sexual health needs of patients with
gynecologic cancers. Clinical Journal of Oncology Nursing, 12(3), 457-463.
Towers, A., Carnevale, F., & Baker, M. (2008). The psychosocial effects of cancer-related
lymphedema. Journal of Palliative Care, 24(3), 134-143.
Vadivelu, N., Schreck, M., Lopez, J., Kodumudi, G., & Narayan, D. (2008). Pain after
mastectomy and breast reconstruction. The American Surgeon, 74(4), 285-296.
Yabroff, K., Davis, W., Lamont, E., Fahey, A., Topor, M., Brown, M., & Warren, J. (2007).
Patient time costs associated with cancer care. Journal of the National Cancer Institute,
99(1), 14-23.
16
Figure 1.1
Stages of Cancer Survivorship (Mullan, 1985)
Dx Year 1
Acute Stage (Treatment Period)
Year 5
Extended Stage Permanent Stage
Features: Facing mortality,
emotional stress, side effects of
treatment including, cognitive
impairment, and pain from
radiation, chemotherapy, or
surgery. Begins with diagnosis
and lasts through the end of
initial treatment. It is
distinguished by concerns
about mortality.
Features: Lingering physical
and mental affects from
treatment, intrusive thoughts
and risk of anxiety or
depression. Need for
psychosocial support. Fear of
recurrence is a salient factor.
Passage may occur in less than
five years.
Features: Fear of recurrence
fades, attempt to regain life
much as before diagnosis,
spiritual growth, lingering
long-term physical and mental
effects of treatment such as
fatigue. Cancer treated as a
chronic condition with
survivorship as a life-long
experience.
Short-Term Long-Term

17
Figure 1.2
Key Employment Decisions Faced by Cancer Survivors: A Sequence of Choices
Work through
Treatment
Return to Work?
Quit during /
after Treatment?
Reduce Hours?
Not
Employed
Employed
Part Time
Employed
Full Time
No
Yes
No
Yes Yes
No
Yes
No
18
Table 1.1
Dissertation Design & Cancer Survivor Literature Contribution
Cancer Survivor Characteristics
Study 1
What Factors
Affect the
Decision to
Keep Working
During
Treatment?
Study 2
What is the
Effect of
Cancer on the
Labor Supply
of Spouses of
Cancer
Survivors?
Study 3 What is the
Effect of
Cancer on
Time-to-
Retirement?
Focus Cancer Survivor X X
Spouse X
Time Period
Short Term (Acute/Treatment)
X
Long Term (Extended/Permanent)
X X
Labor Supply
Outcome
Work Status X X X
Hours X
Age
Working Age (25-64)
X X
Older (50+)
X X
Cancer Site Single
Multiple X X X
Study Design
Cross-Sectional X X
Time-to-Event X
Control X X

19
CHAPTER TWO
WHAT FACTORS AFFECT THE DECISION TO KEEP WORKING DURING
TREATMENT?
Abstract
Background. About 60% of cancer survivors continue to work during treatment, but little is
known about the factors that are associated with this decision.
Data. A sample of survivors working at diagnosis was identified using data from Wave I of the
Penn State Cancer Survivor Study. Work status during treatment was identified from
retrospective questions asked at the Wave 1 interview.
Study design. Logistic regression was used to estimate the likelihood of working through
treatment with three types of covariates: cancer characteristics, socio-demographic
characteristics, and job-related characteristics. Separate models were estimated for male and
female survivors. A supplementary analysis focused on married survivors and the effects of
having one’s own job-related health insurance and a spouse with job-related insurance.
Principal findings. Type and stage of cancer were the most important predictors of the decision
to keep working during treatment. There were few significant differences associated with socio-
demographic variables, except that more highly educated women were more likely to continue
working. Survivors with insurance from their own jobs at diagnosis were more likely to continue
working, as were female survivors married to husbands with job-related insurance.
Conclusions. There is some evidence that decisions about working during treatment are
influenced by health insurance considerations (―job lock‖). However, these decisions mainly
depend on clinical considerations such as cancer type.

20
Background
Cancer survivors pass through stages in the survivorship experience. According to
Mullan (1985), a cancer diagnosis is a life-changing event with lasting consequences for cancer
survivors on their personal journey through three stages of survivorship or the ―seasons of
survival.‖ Each stage presents unique challenges to the cancer survivor for his or her health and
the consequences those decisions have for working. The announcement of a cancer diagnosis
forces a confrontation with mortality in the acute stage, which is coterminous with the treatment
period. Decisions about working in this stage are complicated by stress and side effects from
radiation, chemotherapy or surgery. Following treatment, a cancer survivor lives with the daily
fear of recurrence and lingering effects of treatment in the extended survival stage. As time since
diagnosis increases, a cancer survivor crosses a psychological boundary into the permanent
survival stage, as fear of recurrence fades into the background.
Studies of cancer survivors in the treatment stage have largely addressed the amount of
time taken off for treatment and its economic effects. One study conducted in the first six months
after diagnosis, found that female breast cancer survivors and male prostate cancer survivors lost
22 and 20 days respectively (Bradley, Oberst, & Shenk, 2006). Another found that a third of
cancer survivors experienced a loss of one third of their work days over a month of treatment,
which added to their financial distress (Longo, Fitch, Deber, & Williams, 2006). There has been
considerably less emphasis on whether people work or not during treatment.
The goal of this study is to address the omission of the decision to work during treatment
from the research on cancer treatment and employment, and to extend its focus on a few specific
cancer sites to all types of cancer. First, this study compares the likelihood of working across
cancer types. Second, this study examines factors associated with return-to-work in the previous
literature to assess their association with working through treatment. These factors include cancer
stage, recurrence, time since diagnosis, gender, age, education, physically-demanding occupation,
full-time work, self-employment, and job-related benefits including health insurance and pensions

21
at diagnosis (Spelten, Sprangers, & Verbeek, 2002; Short, Vasey, & Tunceli, 2005; Bradley,
Neumark, Luo, & Bednarek, 2007).
This study will inform the design of clinical support programs that can help cancer
survivors make informed choices about working during treatment. Clinicians will have more
information about factors that may compromise treatment protocols. The design of clinical
support programs may be improved with features that prioritize the recovery of cancer survivors
and minimize the consequences of their work choices during treatment. Furthermore, this study
will aid employers in improving the design of employee accommodation programs to ease the
burden of fatigue and diminished cognitive processing. Employers adjust accommodation
programs to reduce the tension cancer survivors experience in their decision to work during
treatment (Pryce, Munir, & Haslam, 2007). This tension arises from the conflict between
working for financial reasons and the desire to stop working and devote maximum effort to
treatment and recovery (Bradley, Neumark, Luo, & Bednarek, 2007).
Cancer survivorship is an important topic for study for several reasons. First, many
people will get cancer. The lifetime risk for cancer in males is 1 in 2 and 1 in 3 for females
(American Cancer Society, 2010). Second, cancer’s effects are felt through all three stages of
survivorship. Fears of recurrence may persist for extended periods (van den Beuken-van
Everdingen et al., 2008). Survivors experience increased self-monitoring behavior and have more
intrusive thoughts because of the fear of recurrence. Hewitt, Rowland, and Yancik (2003)
identified an extensive list of physical and mental effects of cancer including sexual dysfunction,
chronic pain from lymphedema, anxiety, sense of isolation, and economic hardship. Furthermore,
significant proportions of cancer survivors reported health problems that affected their ability to
work, including poor to fair health (30%), psychological problems (5%), difficulty with daily
living activities (11%), and functional limitations (58%).
The physical and mental effects of cancer and its treatment have consequences for
working during all stages of survivorship. Cancer has contributed to work-related disability and

22
increased the likelihood of quitting work in the extended survival stage. These effects have been
found to differ by cancer site, stage, and recurrence (Short, Vasey, & Tunceli, 2005).
Chemotherapy treatment has delayed return-to-work after stopping for treatment (Sanchez,
Richardson, & Mason, 2004) in the short-term. Seventeen percent of cancer survivors reported
that they were unable to work (Hewitt, Rowland, & Yancik, 2003).
Cancer survivorship is increasing. Improvements in prevention, screening, and treatment
programs have produced higher five-year survival rates. Overall, the five-year survival rate for
all stages of cancer has increased from an average of 50% for cancers diagnosed in 1974-1975 to
66% for cancers detected in 1996-2003. In 2006, the cancer survivor population was estimated
at 11.4 million survivors (American Cancer Society, 2010) or about 4% of the U.S. population.
By 2025, the cancer survivor population is projected to double (Edwards et al., 2002). More
people are surviving cancer, so they are experiencing the long-term effects of cancer and its
treatment. Consequently, decisions in the treatment period have greater significance since more
cancer survivors will reach the extended and permanent survival stages. The work decisions in
those stages may be influenced by the decision to work during the treatment stage.
The effects of cancer on employment add to the economic disease burden of cancer. The
disease burden includes direct medical expenditure for prevention and treatment, and indirect
productivity costs on society through lost production due to mortality (premature death) and
morbidity (effects of illness). The total monetary burden of the disease was estimated by the
National Institutes of Health at $264 billion in 2010 (American Cancer Society, 2010). Morbidity
and mortality cost respectively, $21 billion and $140 billion. Lost days of work contribute to the
indirect costs of cancer. Cancer accounts for two-thirds of the 2.5 billion work-impaired days lost
annually to chronic illness (Kessler, Greenberg, Mickelson, Meneades, & Wang, 2001). As the
number of cancer survivors increase and live into the extended and permanent survival stages, the
economic burden of cancer will increase for direct medical treatment and indirect productivity
23
losses. However, the increase in this burden may be mitigated over the stages of cancer by
improved clinical support programs and employer accommodations in the treatment stage.
Conceptual Model
Becker (1965) observed that time has alternative uses that give rise to associated
opportunity costs. Individuals allocate their time among many activities in a way that brings
them the maximum satisfaction from their combination of work and leisure time. Grossman
(1972) conceptualized an individual’s health as an asset that depreciates over time unless restored
by investments in health, which includes the consumption of medical services. The decision to
restore health involved consideration of the costs and benefits of seeking medical treatment to
restore productivity and its effects on future benefits including income. Coile (2004) describes a
serious illness, like cancer, as a ―health shock.‖ Shock implies reconsideration of work
preferences with new information about the perceived risk of mortality. Confronted with worries
about survival, cancer patients re-evaluate the costs and benefits of restoring health and their
original work-leisure preferences (Berger, 1983; Berger & Fleisher, 1984; Bradley, Neumark,
Luo, & Bednarek, 2007; Bradley, Bednarek, & Neumark, 2002; Killingsworth, 1983; McClellan,
1998). The key factors from the return-to-work literature, that influence the opportunity costs of
whether or not to work during treatment, are summarized in Figure 2.1. These factors formed
three general categories: cancer-related, personal characteristics, and job-related features
(Bouknight, Bradley, & Luo, 2006).
Restoring health typically requires consumption of medical care. Treatment requires time
for visits and recuperation (Bradley, Oberst, & Shenk, 2006; Drolet et al., 2005). This time must
be reallocated from leisure activities, household production or market work time. In making a
decision about taking time off for treatment, workers compare the benefits of continuing to work
with its cost (Killingsworth, 1983; Paringer, 1983).
24
Framing the decision to work or not during treatment as a cost-benefit decision by a
cancer survivor requires consideration of the costs and benefits of working or not during
treatment. On the cost side of working, a cancer survivor may jeopardize his or her survival
prospects in the treatment stage if working reduces time for appointments, treatment doses, or
recuperation. Furthermore, continuing to work may harm the long-term trajectory for health in
the extended or permanent survival stages by exacerbating treatment side effects like fatigue and
pain. A reduction in productivity from poor health outcomes may jeopardize promotional
opportunities or continued employment with associated benefits like health insurance, sick leave,
retirement plan, and income in the extended or permanent survival stages. Alternatively, working
during treatment minimizes lost income in the treatment stage and retains access in the short-term
to job-related benefits like health insurance and sick leave. It may also demonstrate a strong
desire to work which may be interpreted by an employer as a signal of work commitment. This
may reduce the risk of losing a job in later cancer survivorship stages.
Stopping work for treatment has its own costs and benefits. On the cost side, there may
be a loss of income without full sick leave benefits. Also, stopping work may increase the risk of
slower promotion or unemployment in the extended or permanent stages, especially under poor
economic conditions. This might cost access to health insurance, retirement plans, sick leave
benefits, and future income. However, the benefits may accrue in better survival odds in
treatment and subsequent stages, recuperation to improve health outcomes and minimize the side
effects of treatment on productivity in the extended and permanent survival stages.
Time represents the largest opportunity cost in this cost-benefit framework. Its impact is
two-fold. First, there are of hours of work and income that may be lost in the decision to stop
working during treatment. Second, continuing to work during treatment may be associated with
poorer health outcomes over the cancer patient’s survival trajectory.
In the short-term, the decision to work or not during treatment requires cancer survivors
to allocate their time to work or to non-work activities like treatment. Treatment requires time for
25
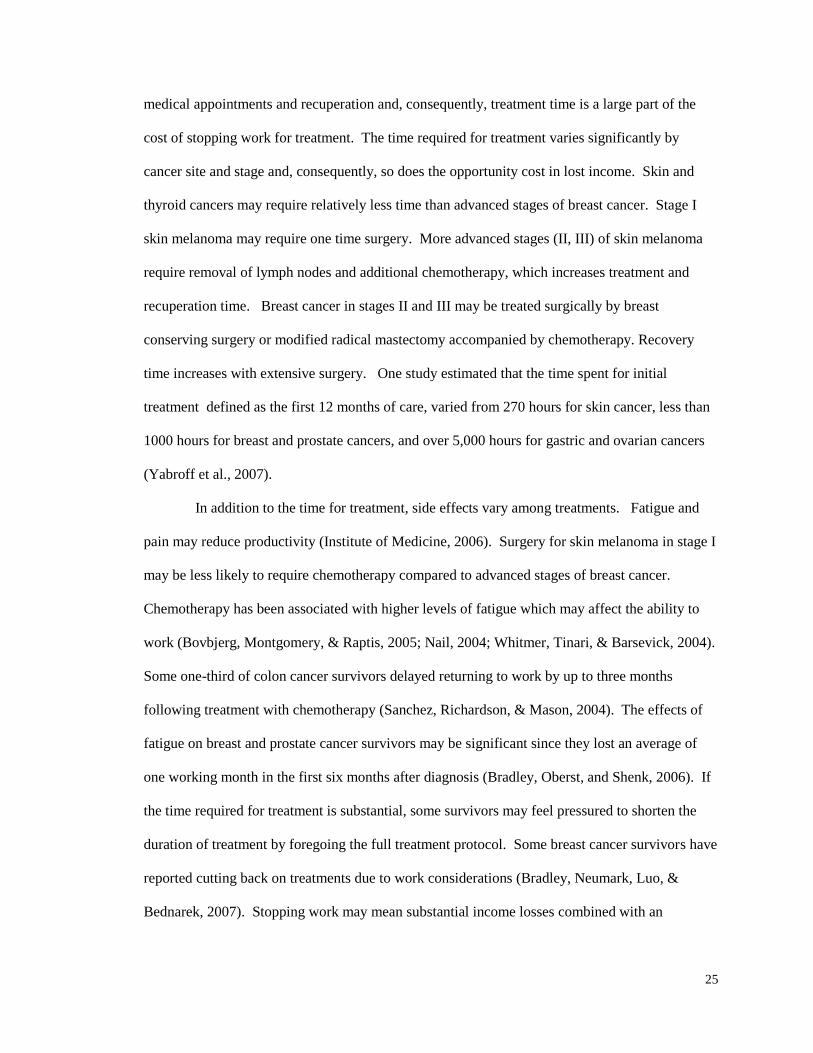
medical appointments and recuperation and, consequently, treatment time is a large part of the
cost of stopping work for treatment. The time required for treatment varies significantly by
cancer site and stage and, consequently, so does the opportunity cost in lost income. Skin and
thyroid cancers may require relatively less time than advanced stages of breast cancer. Stage I
skin melanoma may require one time surgery. More advanced stages (II, III) of skin melanoma
require removal of lymph nodes and additional chemotherapy, which increases treatment and
recuperation time. Breast cancer in stages II and III may be treated surgically by breast
conserving surgery or modified radical mastectomy accompanied by chemotherapy. Recovery
time increases with extensive surgery. One study estimated that the time spent for initial
treatment defined as the first 12 months of care, varied from 270 hours for skin cancer, less than
1000 hours for breast and prostate cancers, and over 5,000 hours for gastric and ovarian cancers
(Yabroff et al., 2007).
In addition to the time for treatment, side effects vary among treatments. Fatigue and
pain may reduce productivity (Institute of Medicine, 2006). Surgery for skin melanoma in stage I
may be less likely to require chemotherapy compared to advanced stages of breast cancer.
Chemotherapy has been associated with higher levels of fatigue which may affect the ability to
work (Bovbjerg, Montgomery, & Raptis, 2005; Nail, 2004; Whitmer, Tinari, & Barsevick, 2004).
Some one-third of colon cancer survivors delayed returning to work by up to three months
following treatment with chemotherapy (Sanchez, Richardson, & Mason, 2004). The effects of
fatigue on breast and prostate cancer survivors may be significant since they lost an average of
one working month in the first six months after diagnosis (Bradley, Oberst, and Shenk, 2006). If
the time required for treatment is substantial, some survivors may feel pressured to shorten the
duration of treatment by foregoing the full treatment protocol. Some breast cancer survivors have
reported cutting back on treatments due to work considerations (Bradley, Neumark, Luo, &
Bednarek, 2007). Stopping work may mean substantial income losses combined with an

26
increased burden of out-of-pocket expenses that result in significant financial distress (Lauzier et
al., 2008; Longo, Fitch, Deber, & Williams, 2006).
Longer term, the decision to stop working may jeopardize job security and benefits by
increasing the risk of being laid off (Main, Nowels, Cavender, Etschmaier, & Steiner, 2005).
Stopping work is a signal to an employer that the employee may significantly increase health
insurance costs for the employer or is at risk of becoming less productive. A survivor’s lifetime
income may be reduced if stopping work channels a survivor into a different promotion path
(Hesselius, 2007; Kennedy, Haslam, Munir, & Pryce, 2007). Continuing to work during
treatment may affect future health if treatment protocols are compromised by work demands on
their time and increased stress levels. New health issues may develop or late effects of cancer
may be accelerated if cancer survivors reduce treatments or allow insufficient recuperation to
meet work demands (Bradley, Neumark, Luo, & Bednarek, 2007).
Alternatively, in the short term, working during treatment may help survivors cope with
the psychological burden of the diagnosis and provide ―psychic benefits‖ (Becker, 1965;
Kennedy, Haslam, Munir, & Pryce, 2007; Main, Nowels, Cavender, Etschmaier, & Steiner, 2005;
Peteet, 2000). For some survivors, working during treatment is an economic necessity (Hansson,
Bostrom, & Harms-Ringdahl, 2006; Hesselius, 2007; Judiesch & Lyness, 1999; Kennedy,
Haslam, Munir, & Pryce, 2007). Working also avoids reduction in income in the absence of
sick leave benefits (Bradley, Neumark, Luo, & Bednarek, 2007; Longo, Fitch, Deber, &
Williams, 2006; Lauzier et al., 2008).
Personal characteristics may influence the decision to work during treatment. There are
differences in labor force participation by gender that suggest men would be more likely to
continue working during treatment than women. Since men on average earn more than women,
men incur a higher opportunity cost for stopping work during treatment. Consequently, male
cancer survivors may be more likely to keep working given the higher cost of stopping compared
to female cancer survivors. Furthermore, younger cancer survivors may be more able to cope

27
with the side effects of treatment and continue working compared to older survivors whose
productivity may diminish significantly. Likewise, younger cancer survivors may not have
access to accumulated savings or retirement plans that compensate for the lost wages from
stopping work during treatment. Persons with higher levels of education are more likely to
continue working, since education is associated with better job characteristics including working
conditions, health insurance, retirement, sick leave and wages. The opportunity cost of lost
income increases with educational levels and also more benefits are at risk in the longer term.
Race may matter because of cultural differences and the possibility of discrimination. Whites
earn more on average than African-Americans so the opportunity cost of stopping work would be
greater in comparison to black Americans. A married survivor may be more likely to continue
working because a spouse could minimize income losses by working, facilitate treatment
appointments, or take up additional household duties that allow the survivor to work. Cancer
patients with children may be more or less likely to keep working depending on their productivity
in market work or child-raising functions. Some survivors may stop working because they are
now more productive in child-rearing compared to working. Other survivors may keep on
working since they cannot sustain the lost income because there are few areas of child-raising
where consumption might be cut. Cancer survivors in less densely populated areas have longer
distances to travel, which increases the time away from work, and raises the opportunity cost of
stopping work. Some travel is unavoidable for treatment. However, cancer survivors may
continue working to minimize the total amount of time lost from work for treatment
appointments. Self-employed persons are more likely to keep working since they have more
flexibility to accommodate the time required for medical appointments. This flexibility in their
use of time can minimize the opportunity costs from lost wages from not working a fixed
schedule of hours. Cancer survivors working full-time may be more likely to continue working
since they have greater opportunity costs in lost income due to not working. However, full-time
workers may have less flexibility to accommodate appointments for medical treatment. Other

28
workers may be too dependent on the work of the cancer survivor. The expense of trying to
accommodate a cancer survivor might jeopardize his or her long-term employment.
Consequently, a cancer survivor may be forced to incur short-term losses in income to avoid
increasing the risk of losing a job in the longer term. The existence of other chronic medical
conditions may combine with cancer to reduce productivity and increase the likelihood that
cancer survivors will stop working in the treatment stage. Survivors with other sources of non-
labor income or assets may be less likely to continue working since they can replace income lost
from not working.
Job characteristics influence opportunity costs and the likelihood of working during
treatment. Cancer survivors with employer-contingent health insurance may be more likely to
work during treatment due to the large costs they would incur for unsubsidized medical prices in
treatment and the uncertain medical expenses in the extended and permanent survivorship stages.
This could result in ―job lock‖ where cancer survivors feel compelled to continue working during
treatment and not increase their risk of losing benefits when they are most needed. Likewise,
survivors with rich retirement benefits, such as defined benefit plans, may be more likely to keep
working since the benefits depend on longevity in the job. Cancer survivors with access to paid
sick leave incur lower opportunity costs for stopping work in the short-term because they may
lose little if any income. Many of the foregoing benefits are provided by large employers, so
cancer survivors may be more or less likely to quit working if employed by a large employer
compared to a small firm. Unlike small firms that offer no job protections for stopping work
during treatment, large employers are required by the Family Medical Leave Act to provide
unpaid time (US Department of Labor, 2007). This reduces the risk of losing employment due to
taking time off from work for treatment and consequently lowers the opportunity cost of not
working. Cancer survivors working in physically demanding jobs may be less likely to work
during treatment due to the added burden of side effects of treatment or recuperation from surgery
which reduces their productivity in their current job.

29
Methods
Sample
The cancer survivors in this study were identified in the first wave of the Penn State
Cancer Survivor Study (PSCSS), which has been described in detail by Short, Vasey, & Tunceli
(2005). This study used the same sample of cancer survivors, but focused on the responses to
questions about working during treatment. The PSCSS eligibility criteria included: (1) cancer
survivors between the ages of 25 and 62 at diagnosis, (2) with a first cancer diagnosed between
January 1997 and December 1999, and (3) with a prognosis that would permit participation over
four waves in the panel survey. Survivors were recruited from cancer registries at four medical
centers including The Johns Hopkins Hospital, Lehigh Valley Hospital and Health Network,
Geisinger Medical Center, and Milton S. Hershey Medical Center. The first of four annual
interviews was conducted from October 2000 through December 2001.
Of the 1,763 survivors interviewed at Wave 1, 1,393 (79%) were working for pay at the
time of their cancer diagnosis. Seventy-eight (5.6%) cancer survivors did not respond about
working during treatment. The final study sample included 1,315 cancer survivors, who were
working at the time of diagnosis and who responded to the question about working during
treatment. Of these, 794 (60.3%) continued to work during treatment while 521 survivors
(39.7%) stopped working entirely during treatment. Survivors who continued to work during
treatment were asked a follow-up question about how much time, if any, they had taken off
during treatment, while still working throughout the period.
The distribution of the sample characteristics is summarized in Table 2.1. Survivors with
breast cancer represented almost one-third of the sample (32%). Forty-two percent were
diagnosed with stage I cancer. Thirty-nine percent were treated at The Johns Hopkins Hospital.
At diagnosis, 82% were less than 57 years-old. Ninety-three percent were white. Eighty percent
were married at diagnosis. Sixty-five percent had some college education. Sixteen percent were
employed in physical occupations. Over 98% had health insurance at diagnosis, including fifty-

30
four insured through their own employer at the time of diagnosis. Thirty-seven percent of the
survivors had children under age 18. Seventy-eight percent were working full-time. Thirteen
percent were self-employed. Seventy percent had some type of retirement benefit either as a
defined benefit (traditional pension) or defined contribution (401k) or both. Seventy-five percent
lived in areas with a total population of less than 1 million. Fifty-six percent worked in locations
with fewer than 100 employees at the work location.
Variables
The primary outcome of interest is whether patients who were working at diagnosis
continued working during treatment. Working during treatment was operationalized by a survey
question: ―Did you stop working while you were being treated (for the cancer you had at that
time)?‖ In addition, interviewers were directed to code responses according to the following
instructions: if R (cancer survivor) stopped working for only part of the treatment, code ―no.‖ If
R (survivor) never went back to work, code ―yes.‖ While every attempt was made to accurately
determine the work status of cancer survivors through the treatment period, there was some
ambiguity present that may have affected the responses of cancer survivors. A cancer survivor
may have used sick leave for part of the treatment period and otherwise kept working. One
cancer survivor might have reported that choice as working through treatment (correct) while
another cancer survivor may have responded that they had stopped working (incorrect).
Consequently, this ambiguity introduces some degree of measurement error for the outcome
variable. From a statistical perspective, this adds to the variability in the data and diminishes the
likelihood of finding statistically significant differences.
All covariates were measured at the time of diagnosis. Some covariates were not
included in the models because of the small number of observations (e.g., race), or variables were
measured at interview, which is subsequent to the treatment period (e.g., chronic medical
conditions). Other variables like wages, salaries, sick leave, and working conditions are

31
measured by proxy using educational attainment or the size of employers, since these variables
are correlated with better paying jobs, benefits, and working conditions.
Cancer site and stage were abstracted from the cancer registries. Colorectal cancer serves
as the reference cancer site since it is highly prevalent and common to both genders. There is no
stage IV cancer per se since that stage was by definition included with blood cancers and by
design included in lymphoma stage IV. The remaining cancers include varying proportions of
stages I-III cancer.
The physical nature of the cancer survivor’s job was constructed by examination of the
survivor’s responses to a question about his or her work. ―What sort of work do you do?‖ The
responses were assigned to one of twenty-three Bureau of Labor Statistics Standard Occupational
Classification categories (2000). The 23 codes were collapsed into a dichotomous variable that
reflected the nature of the work based the BLS job descriptions for the standard occupation
categories.
Full-time work is defined by working 35 or more hours at diagnosis. Since the type of
retirement plan may have different consequences for labor market behavior, retirement benefits
are categorized by defined benefit or defined contribution (Gustman, Mitchell, & Steinmeier,
1994).
Cancer survivors living in rural locations must use more time for travel associated with
cancer treatment. Beale codes, which indicate the degree of rurality using population size, were
assigned to cancer survivors based on their residence at the time of diagnosis (Economic
Research Service, 2008). Cancer survivor locations were categorized as populations ―less than
250,000,‖ ―250,000 to less than one million,‖ and ―one million or more.‖
Since this is a sample of cancer survivors and not all cancer patients, healthy survivor
bias may be present. Consequently, time since diagnosis in yearly categories is used to control
for unobserved differences between the longest surviving patients and the newer survivors at the
first interview.

32
Statistical Analysis
Since the labor economics literature traditionally examines the labor supply separately for
men and women, analyses were conducted separately by gender. Statistical tests of the bivariate
relationship between working and the covariates were conducted using Chi-square tests.
Multivariate logistic regression models of the likelihood of working during treatment were
estimated for male and female survivors. Pair-wise comparisons of covariates with multiple
categories such as cancer site, stage, age, education, retirement benefits, and time since diagnosis
were conducted using Wald tests for the equality of the coefficients. SAS version 9.2 was used in
all statistical tests.
The sample includes both unmarried and married cancer survivors. Since married
survivors may have an alternative source of health insurance through a spouse, the effect of
having health insurance from a current employer may be accentuated or diminished by a spouse
with his or her own health insurance. A married survivor might be less likely to work during
treatment if the survivor believes that he or she has a potential alternative source for health
insurance. Alternatively, a survivor may be more likely to work if he or she views the health
insurance benefit as a potential replacement against a spouse’s risk of losing his or her own health
insurance. Consequently, an interaction term for survivor and spouse health insurance was tested
in a subset of married couples with 601 female and 408 male cancer survivors. There were 71
female (11.8%) and 51 male (12.5%) cancer survivors among the couples with both spouses as
policy holders.

33
Results
Bivariate Summary
The overall proportion of cancer survivors working during treatment (60%) varied by
cancer site, stage (Table 2.2), socio-demographic, and job characteristics (Table 2.3). Treatment
period durations varied by cancer site (Table 2.4) but averaged 4 and 6 months for male and
female cancer survivors respectively.
The proportion of male cancer survivors working during treatment was associated (chi-
square test, alpha level) with cancer site (.10), stage (.05), race (.10), education (.05), physical
occupation (.05), employer-contingent health insurance (.05), and employer retirement benefit
plans (.05) (Table 2.2). Male cancer survivors worked most frequently with the following
characteristics: lymphatic cancer in stages I-III (83%), stage I cancers (70%), white (60%), post-
graduate education (71%), non-physical occupation (64%), employer-contingent health benefits
(64%), and a combination of defined benefit and defined contribution retirement plans (89%)
(Table 2.3). For the most prevalent male cancers, prostate, colon, skin, and lung, the proportion
working during treatment was respectively 61, 61, 75, and 31 percent (Table 2.2).
Likewise, the proportion of female survivors who worked was associated (chi-square test,
alpha level) with cancer site (.01), education (.01), physical occupation (.01), employer-
contingent health insurance (.05), and time since diagnosis (.05). Female cancer survivors were
more likely to work with melanoma skin cancer (77%), post-graduate education (71%), a non-
physical occupation (63%), employer-contingent health insurance (64%), and 2 to 3 years since
diagnosis. For the most prevalent female cancers, breast, colon, skin, and lung, the proportion
working during treatment was respectively 68, 52, 77, and 39 percent (Table 2.2).
While the treatment period duration varied by cancer site which require different
protocols involving combinations of surgery, radiation, and chemotherapy in varying doses, 50%
of male cancer survivors’ treatment periods ended in less than 6 months and 75% finished within
7 months (Table 2.4). Similarly, half of the female cancer survivors completed treatment by 6

34
months and 75% in a little over one year (Table 2.4). Melanoma skin cancer was the shortest
duration for both male and female cancer survivors with half completing treatment in less than
two months. Alternatively, blood cancer treatment periods took more time for both male and
female cancer survivors with half of the survivors completing treatment within one year but many
required more than one year or longer. For the most prevalent cancers, half of male cancer
survivors completed prostate cancer treatment within 3 months with seventy-five percent
completion by a little more than half-a-year. Half of breast cancer survivors had treatment
durations of 8 months or less and seventy-five percent spent up to a little more than a year in
treatment.
Multivariate Results
The adjusted odds ratios (OR) from the multivariate regression models for male and
female cancer survivors are presented in Table 2.5 (male) and Table 2.6 (female). The models
include three specifications to illustrate the effects of adding blocks of variables for cancer
(Model I), person covariates (Model II), and job characteristics (Model III). The results are
reported as odds ratios with 95% confidence intervals. Male (Chart 1) and female (Chart 2)
comparisons of cancer sites are organized by adjusted odds ratios in descending order.
Male Cancer Survivors
Male survivors (Table 2.5) with blood cancer (OR = 0.38; .14, 1.05, p=.06) were less
likely to work through treatment compared to the colorectal cancer reference group. There were
additional differences among cancer sites based on pair-wise comparisons which are summarized
in Chart 1. Male survivors with lymph stages I-III were more likely to work than male survivors
with blood (p =.008), respiratory (p =.04), or other cancers (p =.04). Prostate cancer survivors
were more likely to work compared to male survivors with blood (p =.01), respiratory (p =.09), or
other cancers (p =.05). Male survivors with skin cancer were more likely to work compared to

35
male survivors with blood cancer (p =.03), but not compared to those with respiratory (p <.12) or
other cancer (p <.14). However, this result is likely related to the small number of cases in the
sample. On balance, the results indicate that male survivors with blood, respiratory, and other
cancers were less likely to work during treatment compared to male survivors with lymph cancer
in stages I-III, skin, or prostate cancer.
Male survivors with stage II (OR = 0.48; 0.27, 0.87, p =.04), stage III (OR = 0.50; 0.26,
96, p =.08) or unstaged (OR = 0.36; 0.12, 1.12, p =.07) cancers were less likely to work in the
treatment period compared to survivors with stage I cancer. Paired comparisons of stages found
no significant differences. There were no differences in the likelihood of working associated with
time since diagnosis for male survivors.
Among person-related covariates, male survivors aged 45-52 were less likely to work
compared to survivors aged 25-44 (OR=0.60; 0.34, 1.06, p =.08). There were no significant
effects for other age groups, education, race, marital status, the presence of children under age 18,
or the size of the metropolitan area.
For job-related factors, male survivors with current employer health insurance were more
likely to continue working during treatment compared to male survivors who were not dependent
on their employer for health insurance (OR = 1.73; 1.09, 2.73, p =.02). Male survivors with
defined benefit retirement plans (OR = 2.18; 1.03, 4.59, p =.02) or a combined defined benefit
and defined contribution plan (OR = 9.53; 1.82, 49.96, p =.008) were more likely to work during
treatment compared to male survivors with no retirement benefit plan. Furthermore, male
survivors with a combined defined benefit and contribution plan were more likely to keep
working than male survivors with only a defined benefit plan (p =.06). Male survivors in firms
with 100-499 employees were less likely to keep working during treatment compared to male
survivors in firms with fewer than 25 employees (OR = 0.41; 0.16, 1.05, p =.06). However, there
was no consistent pattern to this effect across employer size. There were no statistically

36
significant effects for physical occupations, full-time work, or self-employment in the
multivariate analysis.
Female Cancer Survivors
Female survivors (Table 2.6) with breast (OR = 2.20; 0.93, 5.20, p =.07), melanoma of
the skin (OR = 4.95; 1.33, 18.47, p =.02) or thyroid (OR = 2.50; 0.89, 7.0, p = 7.00) cancer were
more likely to work through treatment compared to the colorectal cancer reference group.
Additional differences were found in pair-wise comparisons of cancer sites (Chart 2). Female
survivors with skin cancer were more likely to work in treatment compared to female survivors
with central nervous system, blood (p =.004), head and neck (p =.03), lymph stages I-III (p
=.095), respiratory (p =.003), uterus (p =.007), and other cancers not individually identified (p
=.006). Female survivors with lymph stage IV were more likely to work compared to female
survivors with blood (p =.05), central nervous system (p =.03), or respiratory (p =.05) cancers,
but less likely to work compared with skin cancer survivors (p =.095). Female survivors with
thyroid cancer were more likely to work compared to survivors with blood (p =.01), central
nervous system (p =.008), respiratory (p =.01), uterus (p =.02), or other cancers not separately
listed (p =.02). Female survivors with breast cancer were more likely to work compared to
female survivors with central nervous system (p =.007), blood (p =.008), respiratory (p =.006),
uterine (p =.009), or other cancers (p =.004). On balance, female survivors with central nervous
system, blood, respiratory, colon, uterus, or other cancers were less likely to work during
treatment compared to female survivors with skin, lymph stage IV, thyroid, or breast cancer.
Stage was not statistically significant. Female survivors 3 to 4 years since diagnosis
(OR = 2.14; 1.19, 3.87, p =.01) were more likely to be working compared to female survivors
with less than one year since diagnosis.
For person-related variables, educational attainment categories were the covariate with
statistical significance. Neither age, race, marital status, the presence of children under age 18,
37
nor size of metropolitan area had a significant effect for female survivors on the likelihood of
working. Female survivors who completed high school (OR = 4.40; 1.51, 12.83, p =.007), some
college (OR = 4.63; 1.56, 13.75, p =.006), college (OR = 6.51; 2.12, 19.96, p =.0009), or post-
graduate work (OR = 6.68; 2.19, 20.42, p =.0008) were more likely to work during treatment than
female survivors with ―less than high school‖ education. Pair-wise comparisons found
differences among educational levels. Female survivors with college (p =.09) or post-graduate (p
=.08) education were more likely to work compared to high school graduates. Likewise, female
survivors with college (p =.03) or post-graduate (p =.02) education were more likely to work
compared to female survivors with other technical or vocational training.
There were no statistically significant results for job-related variables. No effects were
found in the multivariate analysis for physical occupation, full-time work, and self-employment,
health insurance with a current employer, retirement benefits, or firm size.
Married Cancer Survivors and Health Insurance through a Current Employer
Married cancer survivors may have another option for health insurance through their
spouse. Some cancer survivors may view this as an option or form of ―insurance hedge‖ against
losing their own health insurance if they stop working. Other cancer survivors may be married to
a spouse without his or her own health insurance and are more likely to work rather than take
time off and jeopardize the only source of health insurance. If a married cancer survivor and his
or her spouse have independent health insurance policies, the cancer survivor may be less likely
to work because if he or she does lose access to health insurance, his or her spouse may be able to
provide replacement coverage.
One widely used approach in the literature to test for the effect of job lock is by use of an
interaction term. A subset of married cancer survivors was selected from the cancer respondents.
The test for interaction of each spouse’s own employer-contingent health insurance availability
was measured by creating a counterfactual group which included non-working spouses at the time

38
of diagnosis. These spouses may have a prior employer-sponsored plan or the potential for
obtaining one from re-employment.
The direct effect of having employer-contingent health insurance increases the likelihood
of working for both male (OR = 2.1; 1.1, 4.1, p <.05) and female cancer survivors (OR = 2.1; 1.1,
4.1, p <.05). Having a spouse with employer health insurance also has a direct effect and
increases the likelihood of working by female cancer survivors (OR = 1.9; 1.0, 3.5, p <.05). One
reason for this effect may be that the female cancer survivor may not have access to coverage
through that policy and keeps working to minimize the impact of uncertain future medical
expenses.
There is no strong evidence for job lock among married male cancer survivors (Table 2.7,
row 3, column 1) since the odds ratio is not statistically significant (OR = 0.7; 0.2, 1.9) for the
interaction term. However, there is evidence of job lock among married female cancer survivors
(Table 2.7, row 3, column 4). The direct effect is diminished for female cancer survivors if both
have their own employer-contingent health insurance (OR = 0.4; 0.2, 0.9). The cancer survivor is
less likely to continue working if her husband or partner also has employer-sponsored health
insurance. Having a potential alternative to her employer-contingent health insurance decreases
the likelihood of working during treatment and weakens the ―job lock‖ effect of the employer-
contingent health insurance.

39
Discussion
The major finding in this paper is that the decision to work during treatment is
consistently associated with clinical variables like cancer site and stage. Few significant effects
were found among the personal attributes or job characteristics. Several variables that were
statistically significant in bivariate analyses were not significant in multivariate analyses.
Controlling for other covariates, the male survivor model found no significant differences for
respiratory cancer compared to colorectal cancer, high school education compared to less than
high school diploma, or physical occupation compared to occupations without physically
demanding work. The female model failed to find statistically significant differences for cancers
of blood, respiratory systems, or uterus compared to colorectal cancer, physical occupation
compared to occupations with less physical work, health insurance from an employer at diagnosis
compared to not holding a policy, and defined contribution retirement plans compared to no
retirement plan
Even in the multivariate models, however, male cancer survivors differed in the
likelihood of working by cancer site. While cancer on balance reduces labor supply for working
cancer survivors in the treatment period (Short, Vasey, Tunceli, 2005), the proportion of
survivors working during treatment varies by cancer site. This study found that male survivors
with prostate, skin, or lymph cancer (stages I-III) were more likely to work during treatment
compared to male survivors with blood, respiratory, and other cancers. In a similar study of
cancer survivors in the extended survivorship period, Short, Vasey, & Tunceli (2005) found
virtually the same result. In another study of cancer survivors from the extended survival season,
Schultz, Beck, Stava, & Sellin (2002) found approximately the same results. They reported that
cancer survivors with genitourinary, melanoma, and Hodgkin’s cancers were more likely to be
working compared to survivors with lung cancers. Since the incidence of new cases varies by
cancer site, estimates of the proportion of cancer survivors who work during treatment must

40
account for cancer sites. Prostate, lung, skin, and non-Hodgkin’s lymphoma cancers represent
half of all new cases in men (American Cancer Society, 2010).
Likewise, female cancer survivors differed in the likelihood of working during treatment
according to the type of cancer. Female survivors with breast, skin, thyroid, or lymph cancer
(stage IV) were more likely to work during treatment compared to survivors with central nervous
system, blood, respiratory, colon, uterine, or other cancers. Again, these differences by cancer
site are consistent with the return-to-work literature in the extended survivorship period (Schultz,
Beck, Stava, & Sellin, 2002; Short, Vasey, & Tunceli, 2005). Breast, lung, skin, thyroid, and
non-Hodgkin’s lymphoma cancers comprise about half of all new cases in women (American
Cancer Society, 2010).
Cancer stage affects the likelihood of working by male cancer survivors working during
treatment for stages I-III. Male survivors with localized (stage I) cancers were more likely to
work during treatment compared to survivors with more advanced cancer at diagnosis (stages II-
III or unstaged). While stage IV is not measured separately in this sample, it is included in
differences between blood cancers and lymphoma stage IV. Similar findings were reported by
Short, Vasey, & Tunceli (2005) for cancer survivors in the extended survivorship period.
However, closer examination of the most prevalent male cancer, prostate, found no differences by
stage. In a prospective study of prostate cancer survivors, Bradley, Neumark, Luo, Bednarek, and
Schenk (2005) found that any initial differences by stage in the likelihood of returning to work
had faded by the end of the treatment period. The lack of differences in the current study for
prostate cancer by stage may result from the nature of the sample which contains few stage I
cases.
Female cancer survivors’ likelihood of working during treatment is not associated with
cancer stage. In contrast, the literature suggests mixed results. One study of female breast cancer
survivors near the end of the treatment period (twelve months) found that survivors were less
likely to be working with stage III or IV cancers compared to stage 0 (Bouknight, Bradley, &

41
Luo, 2006). Since differences were not found for stage I or II cancers, this suggests that findings
for a staging effect may be strongly influenced by the selection of the reference group. Stage 0 or
in situ breast cancer is the most localized presentation and requires less extensive surgery or
doses of radiation or chemotherapy treatment. Consequently, any other stage in comparison with
stage 0 involves more extensive treatment which may affect the decision to work during
treatment. Using stage I as the reference group in this study, yielded no association between the
likelihood of working during treatment and cancer stage. Another study of married breast cancer
survivors in the extended survival period found that even with ―in situ‖ or stage 0 cancers as a
reference group, no effects were found for cancer stage (Bradley, Neumark, Luo, & Bednarek,
2007). A study of combined male and female cancer survivors did find that survivors with stage
II or stage III cancer were less likely to be working in the extended survival period compared to
survivors with stage I cancer at diagnosis (Short, Vasey, & Tunceli, 2005). However, this result
in a composite group may be influenced by an association between stage and the likelihood of
working by men as found in the present study. A separate analysis of female breast cancer
survivors in this study found no significant differences in the likelihood of working during
treatment for cancer stage. There may be other cancer sites with less prevalence where cancer
stage may have an effect on the likelihood of working during treatment. However, the evidence
from this study suggests that the decision to continue working during treatment by female cancer
survivors is driven more by cancer site than stage at diagnosis.
There was only one personal characteristic of significance. While female cancer
survivors were more likely to work with greater levels of education, no similar association was
found for men. Female cancer survivors with high school, some college, college, or post-
graduate study were more likely to work during treatment compared to survivors with a less than
high school education. The literature has reported mixed results for the effect of education. In a
similar multisite cancer study of cancer survivors regardless of gender, higher levels of education
increased the likelihood of working in the extended survival stage (Short, Vasey, & Tunceli,

42
2005). In studies of female breast cancer survivors, higher levels of educational attainment have
been associated with greater likelihood of working at the end of the treatment period and in the
extended survival stage (Bouknight, Bradley, & Luo, 2006) while another found no effect in the
extended survival stage (Drolet et al., 2005). A separate analysis of breast cancer survivors in
this study found an association between higher levels of education and a greater likelihood of
working during treatment. Furthermore, the lack of association between education and working
for male cancer survivors is consistent with one recent study of prostate cancer survivors at the
end of the12-month treatment period (Bradley, Neumark, Luo, Bednarek, & Schenk, 2005) which
found no strong pattern of evidence for education. A separate analysis of prostate cancer
survivors in this study sample yielded similar results to the Bradley study.
Employer-sponsored health insurance and retirement benefits were associated with an
increased likelihood of working during treatment for male cancer survivors. There are no reports
in the return-to-work literature for the impact of employer-sponsored benefits on the likelihood of
working by male cancer survivors. However, a study of married breast cancer survivors
(Bradley, Neumark, Luo, & Bednarek, 2007) suggested that employer-sponsored health insurance
increased the likelihood of working at six month intervals up to 18 months after diagnosis –
essentially during, at the end, and post-treatment stage. Other focus group studies support the
idea that job benefits, especially health insurance, are one of the reasons cancer survivors worked
during treatment (Main, Nowels, Cavender, Etschmaier & Steiner, 2005).
There is evidence of job lock among married female cancer survivors. A wife with
cancer and with her own employer-sponsored health insurance was less likely to work if her
husband also had his own health insurance from his employer. This finding is consistent with is
consistent with more general labor market studies on ―job lock‖ and health insurance.
The apparent difference in the importance of education versus employer-sponsored job
benefits by gender may be an artificial distinction. Since better education is often associated with
better jobs including rich benefit packages, there is a significant amount of multicollinearity

43
between education and job-related covariates. Larger samples with more power to discriminate
between the contributions of each covariate would provide more discriminating results. What
should not be overlooked is that to the extent that jobs and education imply a ―better job with
greater earnings,‖ this may act as a powerful incentive to continue working during treatments as
suggested in focus group studies (Main, Nowels, Cavender, Etschmaier & Steiner, 2005).
However, the financial pressure to keep working during treatment may have unintended
consequences for health outcomes and productivity in subsequent stages (Bradley, Neumark, Luo,
& Bednarek, 2007; Main, Nowels, Cavender, Etschmaier, & Steiner, 2005).
Two limitations of this study include the healthy survivor effect and the measurement of
the outcome variable, ―working during treatment.‖ The ideal counter-factual sample would
include all survivors at diagnosis with measurement of their treatment period work decisions – a
prospective study design. Since this study is retrospective, it only includes a subset of the ideal
sample, those cancer survivors who lived at least until the first interview. Consequently, this
sample does not include the sickest patients. This affects the study results since the sicker
patients would more likely have stopped working than continued working during treatment. The
likelihood of working during treatment is therefore, overstated to an unknown degree. The
results here may be improved by additional prospectively designed studies. The advantage to the
current study design is that it provides an economical approach without sacrificing material
accuracy about the size of effects on the likelihood of working during treatment.
The other limitation is the measurement of ―working during treatment‖ and the potential
errors by survivors who self-report work status during treatment. This increases the measurement
error of the outcome variable, which in turn increases the variability of the data and the
magnitude of the error term. Larger standard errors make it more difficult to declare differences
statistically significant. This may partly explain the lack of findings, especially for the personal
and job characteristics which suffer to some extent from multicollinearity. This is especially
relevant for the distinguishing between the effects of employer-sponsored benefits in contrast to

44
the effects of education on the likelihood of working, since greater education is itself associated
with better jobs that include benefits.
Clinicians can assist patients in making choices about working during treatment.
Clinicians can inform patients about types of cancer or stage that provide less of a barrier to
continue working during treatment. This information can allay patient fears about risking the loss
of livelihood or health insurance benefits, especially in the context of current labor market
conditions and long-term unemployment (U.S. Department of Labor, 2010). Since cancer is
associated with aging, many older cancer survivors, who stop working, may face the same fears
of older unemployed workers that they might never work again once they become unemployed
(Rich, 2010). However, while cancer survivors continue to work, little is known about the effects
of working on outcomes, including longevity and quality-of-life, compared to cancer survivors,
who are able to stop working during treatment. Future research may provide more information
about the health consequences of working or not during treatment for cancer.
Employers must weigh choices about accommodations for cancer survivors. Many cancer
survivors with specific types of cancer or stage are more likely to work during treatment.
Employers who can accommodate the need for time off for treatment with flexible work hours or
arrange for temporary coverage may find that this is a cost-effective way to retrain valuable
employees when the cost of searching, training, and replacing an employee may be substantial.
Average turnover costs per employee were $14,000 and ranged from $7,500 in leisure and
hospitality to almost $20,000 in information processing industries (O’Connell & Kung, 2007).
Beyond the financial costs to replace and train an employee, there are morale costs to other
employees. Other employees may evaluate the fairness and justice of accommodation for a
cancer survivor as a litmus test for their own health or caregiver issues. Work place justice and
equity have been linked to dissatisfaction with consequences for morale and organizational trust
(Forret & Love, 2008; Hubbell & Chory-Assad, 2005; Nichols, 2008).

45
The importance of employer-sponsored benefits either measured by health insurance,
retirement plans, or education associated with access to jobs with rich benefits suggests that there
may be an unintended consequence of employer-sponsored benefits designed to reduce turnover
and retain productive workers. Focus groups have suggested that a salient reason for working
during treatment when survivors would prefer not to work is the potential financial impact from
the loss of income and health insurance benefits when they are most needed in facing uncertain
future medical expenses.
The consistency between cancer types in the treatment period used in the present study
and the extended survivorship season in the literature has implications for investments in support
programs and employer accommodations. Since cancer survivors with breast or prostate cancer
are more likely to work during treatment and in the extended survival season, early use of support
programs and workplace accommodations may lead to further reductions in lost productivity.
The benefits also accrue over a longer period of time which will affect cost-benefit evaluations of
these programs and accommodations.
Finally, cancer survivors with more education and higher income jobs are not more
likely to take time off for treatment because they can afford that choice. In fact, they are more
likely to continue working during treatment because of the higher opportunity costs of lost
income and potential for jeopardizing access to health insurance if they take time off. On the
other hand, less educated cancer survivors, who are more likely to be working in lower-paying
jobs, that may also lack health insurance benefits, were more likely to quit because of lower
opportunity costs, lose income that may be needed for out-of-pocket expenses. The disparity in
educational opportunities exacerbates any existing healthcare disparities.

46
References
American Cancer Society. (2010) Cancer Facts and Figures 2010. Washington, DC.
Becker, G.S. (1965). A theory of the allocation of time. The Economic Journal, 75(299), 493-517.
Berger, M. (1983). Labor supply and spouse’s health. Social Science Quarterly, 64(3), 494-509.
Berger, M., & Fleisher, B.M. (1984). Husband’s health and wife’s labor supply. Journal of
Health Economics, 3, 63-75.
Bovbjerg, Dana H., Montgomery, Guy H., & Raptis, G. (2005). Evidence for classically
conditioned fatigue responses in patients receiving chemotherapy treatment for breast
cancer. Journal of Behavioral Medicine, 28(3), 231-237.
Bouknight, R., Bradley, C. & Luo, Z. (2006). Correlates of return to work for breast cancer
survivors. Journal of Clinical Oncology, 24(3), 345-353.
Bradley, C.J., Bednarek H., & Neumark, D. (2002). Breast cancer and women’s labor supply.
Journal of Health Economics, 21(2002), 757-779.
Bradley, C.J., Neumark, D., Luo, Z., & Bednarek, H.L. (2007). Employment-contingent health
insurance, illness, and labor supply of women: evidence from married women with breast
cancer. Health Economics, 16, 719-737.
Bradley, C.J., Neumark, D., Luo, Z., Bednarek, H.L., & Schenk, M. (2005). Employment
outcomes of men treated with prostate cancer. Journal of the National Cancer Institute,
97(13), 958-965.
Bradley, C.J., Oberst, K., & Shenk, M. (2006). Absenteeism from work: the experience of
employed breast and prostate cancer patients in the months following diagnosis. Psycho-
Oncology, 15, 739-747.
Bureau of Labor Statistics (2000). Standard Occupational Classification, SOC Major Groups.
Retrieved from http://www.bls.gov/soc/soc_majo.htm
Coile, C. (2004). Health shocks and couples’ labor supply decisions. National Bureau of
Economic Research Working Paper Series #10810, National Bureau of Economic
Research, Cambridge, MA.
Drolet M., Maunsell, E., Mondor, M., Brisson, C., Brisson, J., & Deschenes, L. (2005). Work
absence after breast cancer diagnosis: a population-based study. Canadian Medical
Association Journal, 173(7), 765-769.
Edwards, B.K., Howe, H.L., Ries, L.A.G., Thun, M.J., Rosenberg, H.M., Yancik, R., Wingo,
P.A., Jemel, A., & Felgal, E.G. (2002). Annual report to the nation on the status of
cancer, 1973-1999, featuring implications of age and aging on U.S. cancer burden.
Cancer, 94(10), 2766-2792.

47
Economic Research Service (2008). Rural-Urban continuum codes. Retrieved from
http://www.ers.usda.gov/Briefing/Rurality/RuralUrbCon/
Forret, M., & Love, M. S. (2008). Employee justice perceptions and coworker relationships.
Leadership and Organization Development Journal, 29(3), 248-260.
Grossman, M. (1972). On the concept of health capital and the demand for health. The Journal of
Political Economy, 80(2), 223-255.
Gustman, A. L., Mitchell, O. S., & Steinmeier, T.L. (1994). The role of pensions in the labor
market: a survey of the literature. Industrial and Labor Relations Review, 47(3), 417-438.
Hansson, M., Bostrom, C., & Harms-Ringdahl. (2006). Sickness absence and sickness attendance
– what people with neck or back pain think. Social Science & Medicine, 62, 2183-2195.
Hesselius, P. (2007). Does sickness absence increase the risk of unemployment? The Journal of
Socio-Economics, 36, 288-310.
Hewitt, M., Rowland, J., & Yancik, R. (2003). Cancer survivors in the United States: Age, health,
and disability. Journal of Gerontology: MEDICAL SCIENCES, 58(1), 82-91.
Hubbell, A.P., & Chory-Assad, R. M. (2005). Motivating factors: Perceptions of justice and their
relationship with managerial and organization trust. Communication Studies, 56(1), 47-
70.
Institute of Medicine. (2006). From cancer patient to cancer survivor: Lost in transition.
Washington: National Academies Press.
Judiesch, M.K., & Lyness, K.S. (1999). Left behind? The impact of leaves of absence on
managers’ career success. The Academy of Management Journal, 42(6), 641-651.
Kennedy, F., Haslam, C., Munir, F., & Pryce, J. (2007). Returning to work following cancer: a
qualitative exploratory study into the experience of returning to work following cancer.
European Journal of Cancer Care, 16, 17-25.
Kessler, R.C., Greenberg, P.E., Mickelson, K.D., Meneades, L.M., & Wang, P.S. (2001). The
effects of chronic medical conditions on work loss and work cutback. Journal of
Occupational and Environmental Medicine, 43(3), 218-225.
Killingsworth, M.K. (1983). Labor Supply. New York: Cambridge University Press.
Lauzier, S., Maunsell, E., Drolet, M., Coyle, D, Hebert-Croteau, N., Brisson, J., Masse, B.,
Abdous, B., Robidoux, A., & Robert, J. (2008). Wage losses in the year after breast
cancer: extent and determinants among Canadian women. Journal of the National
Cancer Institute, 100(5), 321-332.
Longo, C.J., Fitch, M., Deber, R. B., & Williams, A.P. (2006) Financial and family burden
associated with cancer treatment in Ontario, Canada. Support Care Cancer, 14, 1077-
1085.

48
Main, D. S., Nowels, C.T., Cavender, T.A., Etschmaier, M., & Steiner, J. F. (2005). A qualitative
study of work and work return in cancer survivors. Psycho-Oncology, 14, 992-1004.
McClellan, M. (1998). Health events, health insurance, and labor supply: Evidence from the
health and retirement survey. Frontiers in the Economics of Aging, 301-352.
Mullan, F. (1985). Seasons of survival: reflections of a physician with cancer. New England
Journal of Medicine, 313, 270-273.
Nail, L. (2004). My get up and go got up and went: Fatigue in people with cancer. Journal of the
National Cancer Institute Monographs, 32, 72-75.
Nichols, J.L. (2008). The influence of coworker justice perceptions on worksite accommodations
and the return to work of persons with disabilities. Journal of Applied Rehabilitation
Counseling, 39(3), 33-39.
O’Connell, M. & Kung, M. (2007). The cost of employee turnover. Industrial Management,
49(1), 14-19.
Paringer, L. (1983). Women and absenteeism: health or economics? The American Economic
Review, 73(2), 123-127.
Peteet, J.R. (2000). Cancer and the meaning of work. General Hospital Psychiatry, 22(3), 200-
205.
Pryce, J., Munir, F., & Haslam, C. (2007). Cancer survivorship and work: Symptoms, supervisor
response, co-worker disclosure and work adjustment. Journal of Occupational
Rehabilitation, 17, 83-92.
Rich, M. (2010, September 19). For the unemployed over 50, fears of never working again. New
York Times. Retrieved from
http://www.nytimes.com/2010/09/20/business/economy/20older.html?ref=the_new_poor
&pagewanted=all
Sanchez, K., Richardson, J., & Mason, H. (2004). The return to work experiences of colorectal
cancer survivors. AAOHN Journal, 52(12), 500-510.
Schultz, P.N., Beck, M.L., Stava, C. & Sellin, R.V. (2002). Cancer survivors: work related issues.
American Association of Occupational Health Nursing Journal, 50(5), 220-226.
Short, P.F., Vasey, J. J., & Tunceli, K. (2005). Employment pathways in a large cohort of adult
cancer survivors. Cancer, 103(6), 1292-1301.
Spelten, E.R., Sprangers, M.A.G., & Verbeek, J.A.M. (2002). Factors reported to influence the
return to work of cancer survivors: a literature review. Psycho-Oncology, 11, 124-131.
U.S. Department of Labor (2007). Family Medical Leave Act – Frequently asked questions.
Retrieved from http://www.dol.gov/elaws/esa/fmla/faq.asp
U.S. Department of Labor (2010). The employment situation – October 2010. Retrieved from
http://www.bls.gov/news.release/pdf/empsit.pdf

49
Van den Beuken-van Everdingen, M., Peters, M., de Rijke, J., Schouten, H., van Kleef, M., &
Patijn, J. (2008). Concerns of former breast cancer patients about disease recurrence: a
validation and prevalence study. Psychooncology, 17(11), 1137-1145.
Whitmer, K., Tinari, M., & Barsevick, A. (2004). How do we manage fatigue in cancer patients?
Rehabilitation Nursing, 29(4), 112-113.
Yabroff, K., Davis, W., Lamont, E., Fahey, A., Topor, M., Brown, M., & Warren, J. (2007).
Patient time costs associated with cancer care. Journal of the National Cancer Institute,
99(1), 14-23.
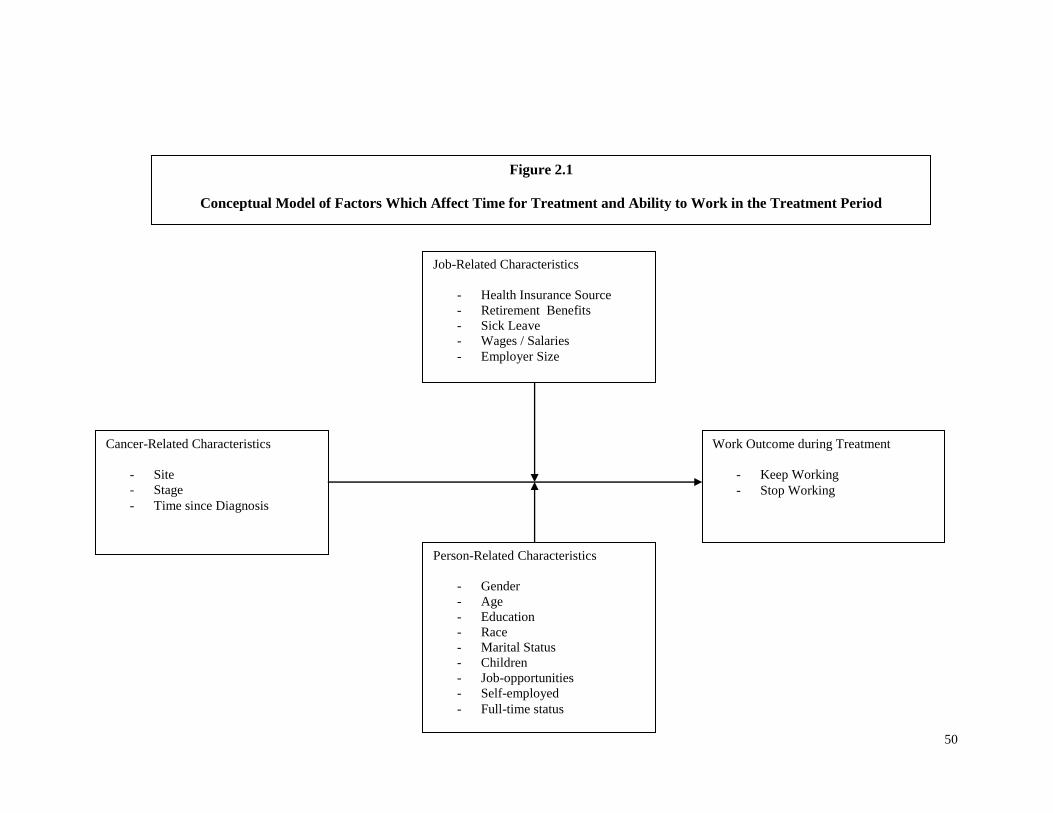
50
Figure 2.1
Conceptual Model of Factors Which Affect Time for Treatment and Ability to Work in the Treatment Period
Cancer-Related Characteristics
- Site
- Stage
- Time since Diagnosis
Work Outcome during Treatment
- Keep Working
- Stop Working
Person-Related Characteristics
- Gender
- Age
- Education
- Race
- Marital Status
- Children
- Job-opportunities
- Self-employed
- Full-time status
Job-Related Characteristics
- Health Insurance Source
- Retirement Benefits
- Sick Leave
- Wages / Salaries
- Employer Size
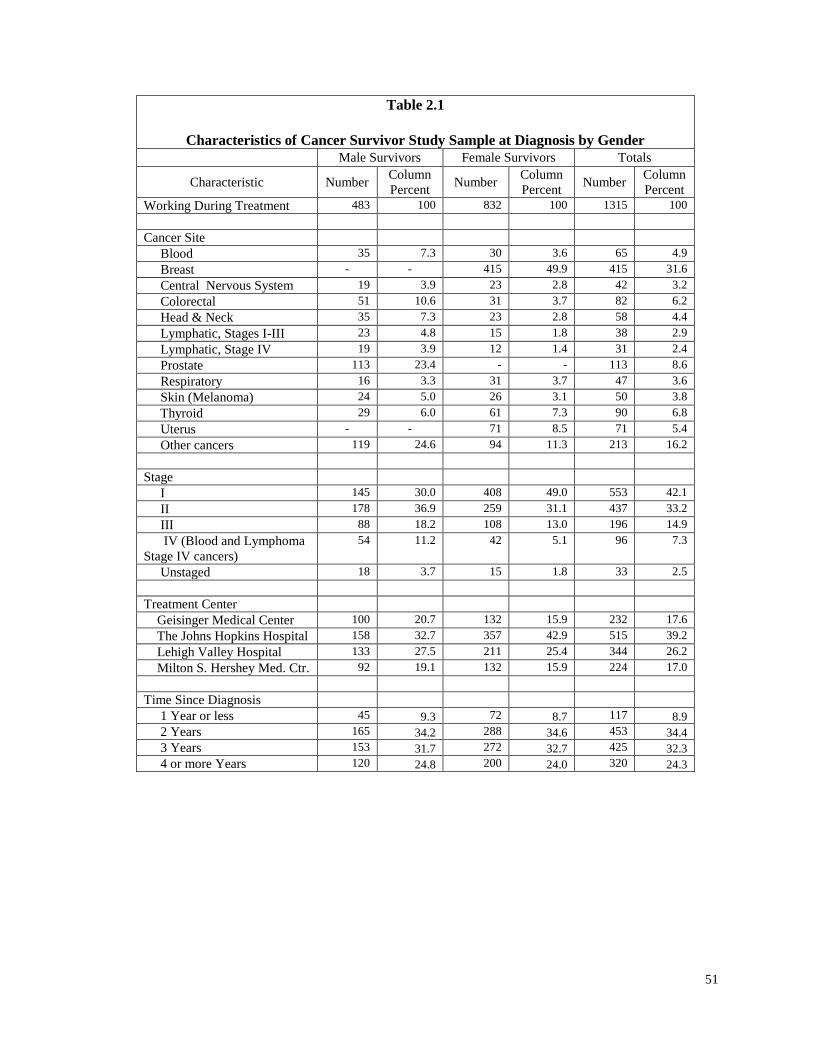
51
Table 2.1
Characteristics of Cancer Survivor Study Sample at Diagnosis by Gender
Male Survivors Female Survivors Totals
Characteristic Number Column
Percent Number
Column
Percent Number
Column
Percent
Working During Treatment 483 100 832 100 1315 100
Cancer Site
Blood 35 7.3 30 3.6 65 4.9
Breast - - 415 49.9 415 31.6
Central Nervous System 19 3.9 23 2.8 42 3.2
Colorectal 51 10.6 31 3.7 82 6.2
Head & Neck 35 7.3 23 2.8 58 4.4
Lymphatic, Stages I-III 23 4.8 15 1.8 38 2.9
Lymphatic, Stage IV 19 3.9 12 1.4 31 2.4
Prostate 113 23.4 - - 113 8.6
Respiratory 16 3.3 31 3.7 47 3.6
Skin (Melanoma) 24 5.0 26 3.1 50 3.8
Thyroid 29 6.0 61 7.3 90 6.8
Uterus - - 71 8.5 71 5.4
Other cancers 119 24.6 94 11.3 213 16.2
Stage
I 145 30.0 408 49.0 553 42.1
II 178 36.9 259 31.1 437 33.2
III 88 18.2 108 13.0 196 14.9
IV (Blood and Lymphoma
Stage IV cancers)
54 11.2 42 5.1 96 7.3
Unstaged 18 3.7 15 1.8 33 2.5
Treatment Center
Geisinger Medical Center 100 20.7 132 15.9 232 17.6
The Johns Hopkins Hospital 158 32.7 357 42.9 515 39.2
Lehigh Valley Hospital 133 27.5 211 25.4 344 26.2
Milton S. Hershey Med. Ctr. 92 19.1 132 15.9 224 17.0
Time Since Diagnosis
1 Year or less 45 9.3 72 8.7 117 8.9
2 Years 165 34.2 288 34.6 453 34.4
3 Years 153 31.7 272 32.7 425 32.3
4 or more Years 120 24.8 200 24.0 320 24.3

52
Table 2.1 (cont.)
Characteristics of Cancer Survivor Study Sample at Diagnosis by Gender
Male Survivors Female Survivors Totals
Characteristic Number Column
Percent Number
Column
Percent Number
Column
Percent
Age Group (Years)
25-44 145 30.0 302 36.3 447 34.0
45-52 136 28.2 286 34.4 422 32.1
53-57 105 21.7 156 18.7 261 19.8
58-61 89 18.4 79 9.5 168 12.8
62+ 8 1.7 9 1.1 17 1.3
Race
White 457 94.6 765 91.9 1222 92.9
Non-White 25 5.2 65 7.8 90 6.8
Missing 1 <1 2 <1 3 <1
Total 483 100 832 100 1315 100
Married
Single 63 13.0 193 23.2 256 19.5
Married or Living with Partner 420 87.0 639 76.8 1059 80.5
Education
Less Than HS 23 4.8 28 3.4 51 3.9
High School 147 30.4 252 30.3 399 30.3
Some College 87 18.0 212 25.5 299 22.7
College 117 24.2 159 19.1 276 21.0
Post-graduate 105 21.7 167 20.1 272 20.7
Other Training 4 <1 13 1.6 17 1.3
Missing 0 0 1 <1 1 <1
Physical Occupation
No 339 70.2 759 91.2 1098 83.5
Yes 141 29.2 72 8.7 213 16.2
Total 483 100 832 100 1315 100
Current Employer-Contingent
Health Insurance
No 184 38.1 412 49.5 596 45.3
Yes 297 61.5 410 49.3 707 53.8
Missing 2 <1 10 1.2 12 <1

53
Table 2.1 (cont.)
Characteristics of Cancer Survivor Study Sample at Diagnosis by Gender
Male Survivors Female Survivors Totals
Characteristic Number Column
Percent Number
Column
Percent Number
Column
Percent
Children Under 18
No 312 64.6 523 62.9 835 63.5
Yes 171 35.4 309 37.1 480 36.5
Fulltime Employment
No 49 10.1 217 26.1 266 20.2
Yes 429 88.8 601 72.3 1030 78.3
Missing 5 1.1 14 1.6 19 1.4
Self-employed
No 402 83.2 738 88.7 1140 86.7
Yes 81 16.8 93 11.2 174 13.2
Missing 0 1 <1 1 <1
Company-wide
Employees
Less than 25 97 20.1 177 21.3 274 20.8
25-99 53 11.0 84 10.1 137 10.4
100-499 68 14.1 138 16.6 206 15.7
500 more 254 52.6 408 49.0 662 50.3
Missing 11 2.3 25 3.0 36 2.7
Any Retirement Benefit
Defined Benefit 150 31.1 241 29.0 391 29.7
Defined Contribution 181 37.5 285 34.3 466 35.4
Defined Benefit &
Defined
Contribution 18 3.7 23 2.8 41 3.1
No Benefit 128 26.5 255 30.6 383 29.1
Missing 6 1.2 28 3.4 34 2.6
Size of Metro Area
Population
Over 1 million 103 21.3 234 28.1 337 25.6
250k – 1million 249 51.6 387 46.5 636 48.4
Under 250k 131 27.1 211 25.4 342 26.0
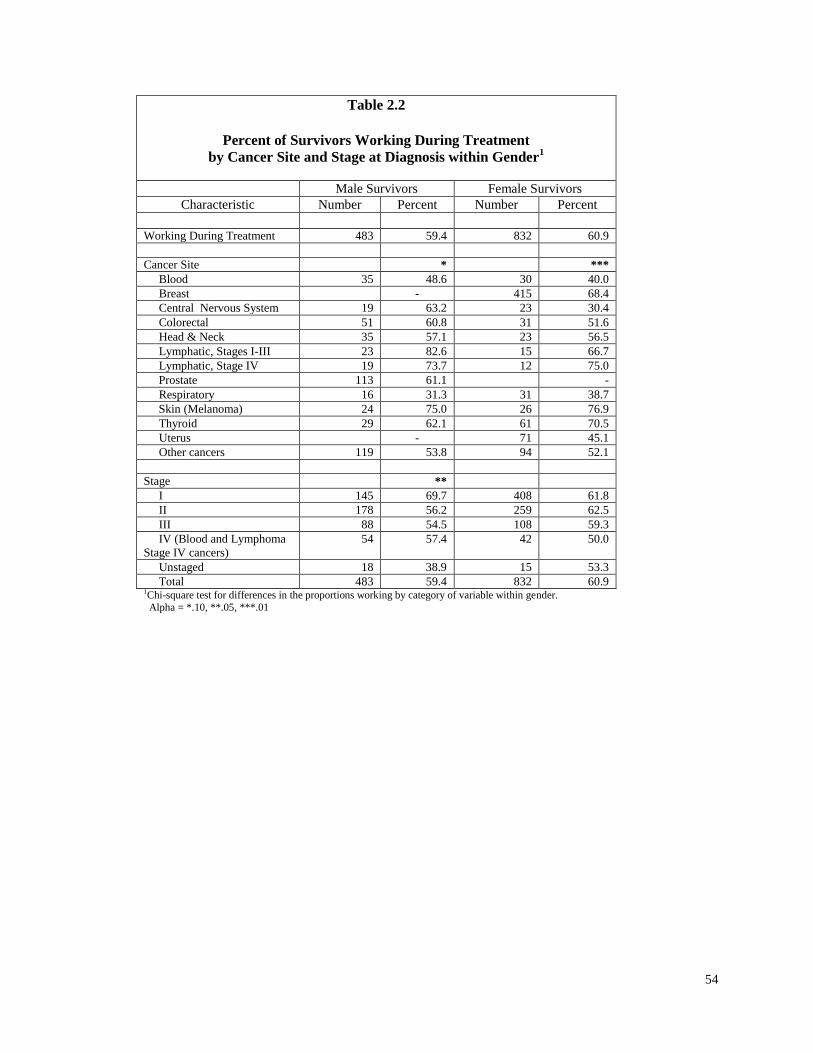
54
Table 2.2
Percent of Survivors Working During Treatment
by Cancer Site and Stage at Diagnosis within Gender1
Male Survivors Female Survivors
Characteristic Number Percent Number Percent
Working During Treatment 483 59.4 832 60.9
Cancer Site * ***
Blood 35 48.6 30 40.0
Breast - 415 68.4
Central Nervous System 19 63.2 23 30.4
Colorectal 51 60.8 31 51.6
Head & Neck 35 57.1 23 56.5
Lymphatic, Stages I-III 23 82.6 15 66.7
Lymphatic, Stage IV 19 73.7 12 75.0
Prostate 113 61.1 -
Respiratory 16 31.3 31 38.7
Skin (Melanoma) 24 75.0 26 76.9
Thyroid 29 62.1 61 70.5
Uterus - 71 45.1
Other cancers 119 53.8 94 52.1
Stage **
I 145 69.7 408 61.8
II 178 56.2 259 62.5
III 88 54.5 108 59.3
IV (Blood and Lymphoma
Stage IV cancers)
54 57.4 42 50.0
Unstaged 18 38.9 15 53.3
Total 483 59.4 832 60.9 1Chi-square test for differences in the proportions working by category of variable within gender.
Alpha = *.10, **.05, ***.01

55
Table 2.3
Percent of Survivors Working During Treatment By Characteristics at Diagnosis within Gender
1
Male Survivors Female Survivors
Characteristic Number Percent Number Percent
Working During Treatment 483 59.4 832 60.9
Age Group at diagnosis
(Years)
25-44 145 64.1 302 58.6
45-52 136 54.4 286 64.0
53-57 105 59.1 156 57.7
58-61 89 58.4 79 64.6
62+ 8 75.0 9 66.7
Race *
White 457 60.4 765 61.3
Non-White 25 44.0 65 56.9
Missing 2 -
Married
Single 63 57.1 193 59.6
Married or Partner 420 59.8 639 61.4
Education ** ***
Less Than HS 23 43.5 28 21.4
High School 147 51.0 252 55.2
Some College 87 59.8 212 62.3
College 117 61.5 159 66.7
Post-graduate 105 71.4 167 71.3
Other Training 4 75.0 13 38.5
Missing 1 -
Physical Occupation ** ***
Yes 141 48.2 72 41.7
No 339 63.7 759 62.9
Missing 3 - -
Current Employer-Contingent
Health Insurance
** **
Yes 297 64.0 410 64.4
No 184 52.2 412 57.5
Missing 3 - 10 -
Size of Metro Area
Population (persons)
Over 1 million 103 62.1 234 63.7
250k – 1million 249 59.8 387 61.8
Under 250,000 131 56.5 211 56.4 1Chi-square test for differences in the proportions working by category of variable within gender.
Alpha = *.10, **.05, ***.01

56
Table 2.3 (cont.)
Percent of Survivors Working During Treatment By Characteristics at Diagnosis within Gender
1
Male Survivors Female Survivors
Characteristic Number Percent Number Percent
Children Under 18
Yes 145 58.6 257 60.7
No 338 59.8 575 61.0
Fulltime Employment Yes 429 59.4 601 60.7
No 49 61.2 217 61.3
Missing 5 - 14 -
Self-employed
Yes 77 63.0 86 58.1
No 402 58.7 738 61.4
Missing 4 - 8 -
Employees Company-Wide
Less than 25 102 62.8 185 56.2
25-99 57 59.7 89 69.7
100-499 69 47.8 142 65.5
500 more 254 61.0 409 59.7
Missing 1 - 7 -
Retirement Benefit **
No Retirement Benefit 128 52.3 255 56.1
Defined Benefit 150 62.7 241 61.0
Defined Contribution 181 58.6 285 66.3
Defined Benefit &
Defined Contribution
18 88.9 23 65.2
Missing 6 - 28 -
Time Since Diagnosis Until
1st Interview **
Less than 1 Year 45 51.1 72 50.0
1- 2 Years 165 57.6 288 60.1
2- 3 Years 153 62.1 272 68.0
3 to 4 or More Years 420 61.7 200 56.5 1Chi-square test for differences in the proportions working by category of variable within gender.
Alpha = *.10, **.05, ***.01

57
Table 2.4
Percentile Distribution of Treatment Period Durations
by Cancer Type and Cancer Survivor Gender1
(Months) Male Survivors
n=483
Female Survivors
n=832
Cancer Site 50
th
Percentile (95th CI)
75th
Percentile (95th CI)
50th
Percentile (95th CI)
75th
Percentile (95th CI)
Blood 12 (7-50)
50 (18-∞)
9 (6-35)
46 (13- ∞)
Breast NA NA 8 (7-9)
13 (11-15)
Central Nervous System 4 (3-14)
19 (4--∞)
6 (1- ∞)
NC
Colorectal 8 (6-10)
15 (10-29)
7 (3-8)
9 (8-11)
Head & Neck 3 (1-4)
5 (3-7)
4 (1-5)
6 (4-21)
Lymphatic, Stages I-III 6 (5-7)
17 (6-17)
10 (6-10)
17 (10- ∞)
Lymphatic, Stage IV 7 (5-15)
15 (7- ∞)
8 (3-12)
11.5 (7- ∞)
Prostate 3 (2-4)
7 (5-9)
NA NA
Respiratory 6 (1-7)
NC 4 (1-7)
8 (4-24)
Skin (Melanoma) 1.5 (1-4)
8 (2-∞)
1 (1-13)
15 (3-36)
Thyroid 4 (2-24)
NC 3
(2-4) 18
(5- ∞)
Uterus NA NA 1 (1-3)
4
(3-7)
Other cancers 4 (3-5)
7 (6-10)
6 (4-7)
16 (9-24)
All Survivors 5 (4-5)
10 (8-12)
7 (6-7)
12 (11-15)
1Notes:
The treatment period duration was calculated by using the difference between the date of diagnosis in the registry and the last date of treatment for the initial cancer and reported by the cancer survivor. This method does not include any additional recuperation time
from surgery or side effects from chemotherapy or radiation. Furthermore, treatment may still be ongoing for some survivors. The
Kaplan-Meier method was used in SAS Proc Lifetest to estimate the 50th and 75th percentiles and the 95% confidence intervals for the treatment duration measured in months since diagnosis. Some cancer survivors treatments were not observed as ending since 182
persons (14%) were still in treatment at the time of their Wave 1 interview. NA = not applicable; NC = cannot be computed.

58
Table 2.5
Adjusted Odds Ratios for Factors Associated with Working During the Treatment Period Male Survivors
1
(*** p<.01; **p<.05; *p<.10, n=469)
All Covariates
Measured at Diagnosis
(except area population)
Model I
Cancer-
Related (n=469)
Lower 95%
CI
Upper 95%
CI
Model II
Person-
Related (n=469)
Lower 95%
CI
Upper 95%
CI
Model III
Job-
Related (n=465)
Lower 95%
CI
Upper 95%
CI
Blood 0.383** 0.15 0.976 0.372** 0.141 0.985 0.381* 0.138 1.052
Central Nervous System 0.969 0.311 3.016 0.835 0.256 2.721 0.981 0.288 3.347
Head & Neck 0.89 0.364 2.173 1.046 0.413 2.647 0.965 0.365 2.553
Lymphatic,
Stages I, II, III 2.938* 0.842 10.255 2.857 0.797 10.238 2.555 0.684 9.548
Lymphatic, Stage IV 1.129 0.333 3.825 1.065 0.3 3.776 0.993 0.267 3.693
Prostate 1.324 0.633 2.768 1.338 0.618 2.899 1.399 0.62 3.157
Respiratory 0.283** 0.083 0.965 0.328* 0.092 1.175 0.474 0.126 1.783
Skin (Melanoma) 2.089 0.686 6.364 1.87 0.583 6 1.661 0.489 5.643
Thyroid 0.879 0.333 2.321 0.829 0.3 2.294 0.811 0.282 2.332
Other Cancers 0.812 0.408 1.616 0.756 0.372 1.538 0.711 0.337 1.498
Stage II 0.527** 0.311 0.894 0.517** 0.296 0.903 0.483** 0.269 0.867
Stage III 0.522** 0.292 0.931 0.477** 0.258 0.881 0.503** 0.264 0.956
Unstaged 0.265** 0.093 0.758 0.253** 0.085 0.751 0.364* 0.12 1.102
2 years since diagnosis 1.186 0.59 2.385 1.15 0.556 2.377 1.11 0.524 2.352
3 years since diagnosis 1.537 0.752 3.142 1.473 0.698 3.11 1.313 0.61 2.827
4 years since diagnosis 1.374 0.658 2.868 1.262 0.582 2.739 1.169 0.527 2.594
Age 45-52 0.744 0.433 1.28 0.595* 0.335 1.058
Age 53-57 0.88 0.471 1.645 0.685 0.353 1.327
Age 58-61 0.835 0.417 1.67 0.732 0.348 1.541
High School 1.277 0.472 3.455 1.145 0.405 3.242
Some College 1.636 0.581 4.604 1.38 0.458 4.155
College 1.962 0.716 5.375 1.477 0.48 4.549
Post-graduate 2.955** 1.044 8.366 2.183 0.692 6.882
Technical-Trade 2.387 0.169 33.652 2.11 0.129 34.418
Non-white 0.636 0.251 1.61 0.653 0.248 1.716
Married 1.124 0.599 2.11 1.131 0.583 2.195
Child Under 18 0.778 0.482 1.255 0.725 0.442 1.19

59
Table 2.5 (cont).
Adjusted Odds Ratios for Factors Associated with Working During the Treatment Period
Male Survivors1
(*** p<.01; **p<.05; *p<.10, n=469)
All Covariates
Measured at Diagnosis
(except area population)
Model I
Cancer-
Related
Lower 95%
CI
Upper 95%
CI
Model II
Person-
Related
Lower 95%
CI
Upper 95%
CI
Model III
Job-
Related
Lower 95%
CI
Upper 95%
CI
Mid-size Metro Area at
Interview 0.849 0.482 1.494 0.91 0.502 1.651
Small Metro Area at
Interview 0.757 0.401 1.426 0.763 0.392 1.483
Physical Occupation 0.773 0.441 1.354
Full-time 0.803 0.384 1.68
Self-employed 1.362 0.56 3.31
Own Health Insurance
from Employer 1.727** 1.093 2.729
Defined Benefit 2.178** 1.033 4.592
Defined Contribution 1.572 0.801 3.086
Defined Benefit &
Defined Contribution 9.526*** 1.816 49.959
Company-wide 25-99 0.803 0.316 2.043
Company-wide 100-499 0.409* 0.158 1.054
Company-wide 500 + 0.654 0.281 1.522
-2 Log Likelihood 602.1** 584.6** 557.5*** 1Note - Reference Group includes colorectal cancer, stage I, age 25-44 at diagnosis, less than high school education; white, single, no children under 18, large urban areas over 1 million in population;
job without physical demands; part-time work; working for someone else; health insurance from source other than employer at diagnosis, no employer-sponsored retirement benefit (defined benefit like pension or defined contribution like 401(k)), and companies with fewer than 25 total employees..
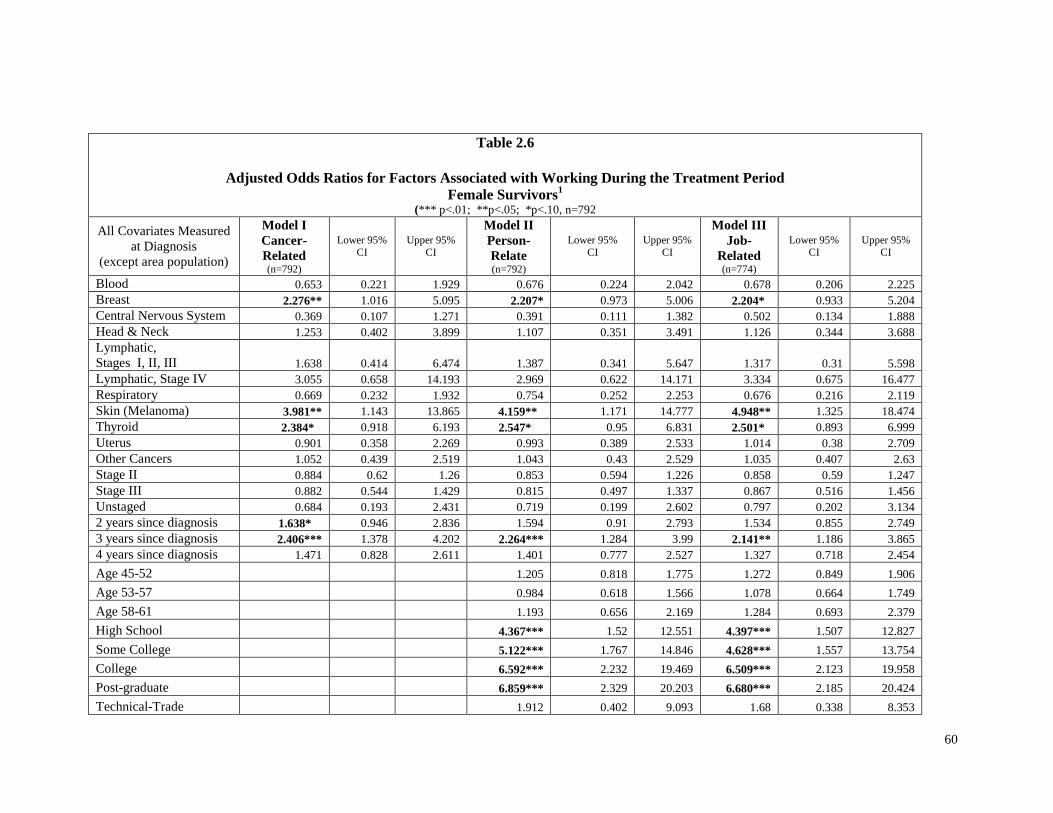
60
Table 2.6
Adjusted Odds Ratios for Factors Associated with Working During the Treatment Period
Female Survivors1
(*** p<.01; **p<.05; *p<.10, n=792
All Covariates Measured
at Diagnosis
(except area population)
Model I
Cancer-
Related (n=792)
Lower 95%
CI
Upper 95%
CI
Model II
Person-
Relate (n=792)
Lower 95%
CI
Upper 95%
CI
Model III
Job-
Related (n=774)
Lower 95%
CI
Upper 95%
CI
Blood 0.653 0.221 1.929 0.676 0.224 2.042 0.678 0.206 2.225
Breast 2.276** 1.016 5.095 2.207* 0.973 5.006 2.204* 0.933 5.204
Central Nervous System 0.369 0.107 1.271 0.391 0.111 1.382 0.502 0.134 1.888
Head & Neck 1.253 0.402 3.899 1.107 0.351 3.491 1.126 0.344 3.688
Lymphatic,
Stages I, II, III 1.638 0.414 6.474 1.387 0.341 5.647 1.317 0.31 5.598
Lymphatic, Stage IV 3.055 0.658 14.193 2.969 0.622 14.171 3.334 0.675 16.477
Respiratory 0.669 0.232 1.932 0.754 0.252 2.253 0.676 0.216 2.119
Skin (Melanoma) 3.981** 1.143 13.865 4.159** 1.171 14.777 4.948** 1.325 18.474
Thyroid 2.384* 0.918 6.193 2.547* 0.95 6.831 2.501* 0.893 6.999
Uterus 0.901 0.358 2.269 0.993 0.389 2.533 1.014 0.38 2.709
Other Cancers 1.052 0.439 2.519 1.043 0.43 2.529 1.035 0.407 2.63
Stage II 0.884 0.62 1.26 0.853 0.594 1.226 0.858 0.59 1.247
Stage III 0.882 0.544 1.429 0.815 0.497 1.337 0.867 0.516 1.456
Unstaged 0.684 0.193 2.431 0.719 0.199 2.602 0.797 0.202 3.134
2 years since diagnosis 1.638* 0.946 2.836 1.594 0.91 2.793 1.534 0.855 2.749
3 years since diagnosis 2.406*** 1.378 4.202 2.264*** 1.284 3.99 2.141** 1.186 3.865
4 years since diagnosis 1.471 0.828 2.611 1.401 0.777 2.527 1.327 0.718 2.454
Age 45-52 1.205 0.818 1.775 1.272 0.849 1.906
Age 53-57 0.984 0.618 1.566 1.078 0.664 1.749
Age 58-61 1.193 0.656 2.169 1.284 0.693 2.379
High School 4.367*** 1.52 12.551 4.397*** 1.507 12.827
Some College 5.122*** 1.767 14.846 4.628*** 1.557 13.754
College 6.592*** 2.232 19.469 6.509*** 2.123 19.958
Post-graduate 6.859*** 2.329 20.203 6.680*** 2.185 20.424
Technical-Trade 1.912 0.402 9.093 1.68 0.338 8.353

61
Table 2.6 (cont).
Adjusted Odds Ratios for Factors Associated with Working During the Treatment Period
Female Survivors1
(*** p<.01; **p<.05; *p<.10, n=792) All Covariates
Measured at Diagnosis
(except area population)
Model I
Cancer-
Related
Lower 95% CI
Upper 95% CI
Model II
Person-
Related
Lower 95% CI
Upper 95% CI
Model III
Job-
Related
Lower 95% CI
Upper 95% CI
Non-white 0.842 0.451 1.572 0.896 0.466 1.722
Married 1.04 0.715 1.514 1.004 0.675 1.494
Child Under 18 0.832 0.58 1.193 0.871 0.598 1.268
Mid-size Metro Area at
Interview 0.892 0.598 1.329 0.974 0.582 1.632
Small Metro Area at
Interview 0.756 0.483 1.183 0.814 0.482 1.374
Physical Occupation 1.152 0.736 1.804
Full-time 0.721 0.394 1.321
Self-employed 0.91 0.611 1.356
Own Health Insurance
from Employer 0.984 0.524 1.851
Defined Benefit 1.152 0.795 1.671
Defined Contribution 1.141 0.686 1.898
Defined Benefit &
Defined Contribution 1.448 0.897 2.337
Company-wide 25-99 2.331 0.814 6.673
Company-wide 100-499 1.732 0.894 3.359
Company-wide 500+ 1.462 0.803 2.66
-2 Log Likelihood 998.3*** 969.9*** 931.9*** 1Note - Reference Group includes colorectal cancer, stage I, age 25-44 at diagnosis, less than high school education; white, single, no children under 18, large urban areas over 1 million in population;
job without physical demands; part-time work; working for someone else; health insurance from source other than employer at diagnosis, no employer-sponsored retirement benefit (defined benefit like
pension or defined contribution like 401(k)), and companies with fewer than 25 total employees.
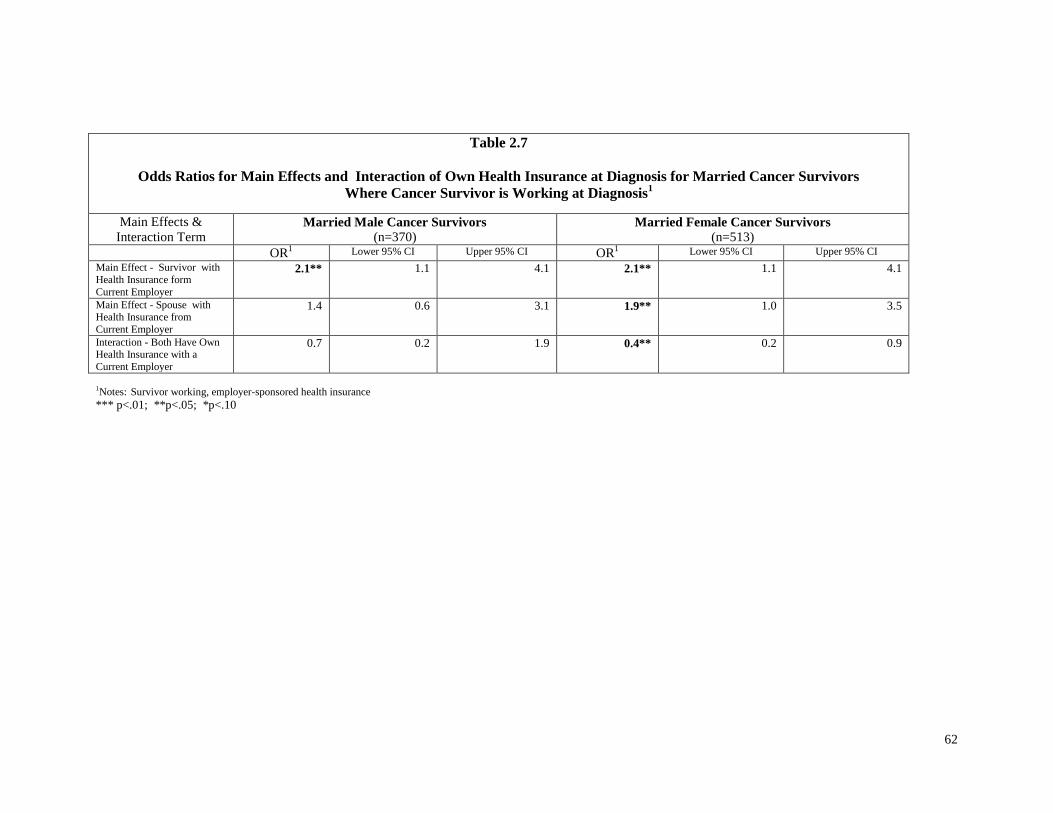
62
Table 2.7
Odds Ratios for Main Effects and Interaction of Own Health Insurance at Diagnosis for Married Cancer Survivors
Where Cancer Survivor is Working at Diagnosis1
Main Effects &
Interaction Term Married Male Cancer Survivors
(n=370) Married Female Cancer Survivors
(n=513) OR
1 Lower 95% CI Upper 95% CI OR1 Lower 95% CI Upper 95% CI
Main Effect - Survivor with
Health Insurance form
Current Employer
2.1** 1.1 4.1 2.1** 1.1 4.1
Main Effect - Spouse with Health Insurance from
Current Employer
1.4 0.6 3.1 1.9** 1.0 3.5
Interaction - Both Have Own Health Insurance with a
Current Employer
0.7 0.2 1.9 0.4** 0.2 0.9
1Notes: Survivor working, employer-sponsored health insurance *** p<.01; **p<.05; *p<.10

63
Chart 1
Estimated Odds Ratios and 95% Confidence Intervals
for Working During Treatment by Cancer Site
Male Survivors
(Colorectal Cancer Reference Group)
0.1 1 10
Blood
Respire
Other
Thyroid
CNS
HeadNeck
Colon
Lymph4
Prostate
Skin
Lymph1239
Notes: Lymph4 = Lymphatic Cancer, Stage IV; Lymph1239 = Lymphatic Cancer all
other stages; CNS=Central Nervous System; Scale is Logarithmic for symmetry in odds
ratio, meaning an OR = 2.0 is symmetrical in effect with OR = 0.5

64
Chart 2
Estimated Odds Ratios and 95% Confidence Intervals
for Working During Treatment by Cancer Site
Female Survivors
(Colorectal Cancer Reference Group)
0.1 1 10 10
0
CNSBlood
RespireColon
UterusOther
HeadNeckLymph1239
BreastThyroidLymph4
Skin
Notes: Lymph4 = Lymphatic Cancer, Stage IV; Lymph1239 = Lymphatic Cancer all
other stages; CNS=Central Nervous System; Scale is Logarithmic for symmetry in
odds ratio, meaning an OR = 2.0 is symmetrical in effect with OR = 0.

65
CHAPTER THREE
WHAT IS THE EFFECT OF CANCER ON THE LABOR SUPPLY OF SPOUSES OF
CANCER SURVIVORS?
Abstract
Background. Two-thirds of cancer survivors are married and two-thirds of married couples are
―working couples‖ where both husband and wife were working at the time of diagnosis. Cancer
may contribute to the variation in labor supply decisions among spouses as well as differentiate
them from spouses in couples without cancer.
Data. A sample of 739 working couples with a cancer survivor was identified from Wave 1 of
the Penn State Cancer Survivor Study (PSCSS) with diagnosis dates from 1997 through 1999.
Labor supply outcomes were measured at two to six years after diagnosis at Wave 2 (2002). A
subset of 286 PSCSS couples was combined with a sample of 1,026 working couples from the
Health and Retirement Study for ages 55 and over. Variables included clinical, socio-
demographic, and job-related characteristics.
Study design. Logistic regression was used to estimate the likelihood of working. Tobit
regression methods were used to estimate effects on hours of work. Separate labor supply models
were estimated by gender for spouses of cancer survivors. These models were also used to
compare differences between spouses in cancer and non-cancer couples.
Principal findings. There were few clinical effects for cancer on spousal labor supply in
working couples. Labor supply was associated with education and job benefits.
Conclusions. Cancer did not result in systematic labor supply adjustments by spouses in the
short-term period from two to six years after diagnosis. There may be some distributional
consequences around husbands in treatment or advanced cancer stage III.

66
Background
Cancer affects more than cancer survivors (National Cancer Institute, 2004; Twombly,
2004). In married couples, the diagnosis presents new challenges to the spouse of a cancer
survivor. These challenges include making adjustments in spousal labor supply through a
sequence of cancer survivorship stages beginning with conditions at diagnosis and continuing
through the long-term. This paper provides estimates of spousal labor supply two to six years
after diagnosis.
Cancer imposes significant economic costs. The disease burden includes direct medical
expenditure for prevention and treatment, and indirect productivity costs on society through lost
production due to mortality (premature death) and morbidity (effects of illness). The total
monetary burden of the disease was estimated by the National Institutes of Health at $263.8
billion in 2010 (American Cancer Society, 2010). Morbidity and mortality cost respectively,
$20.9 and $140 billion. In addition to the dollar costs of lost productivity, cancer accounted for
1.65 billion of the work-impaired days lost annually to chronic illness (Kessler, Greenberg,
Mickelson, Meneades, & Wang, 2001).
In addition to the economy-wide economic costs of cancer, there is a disproportionate
human toll on spouses and families. Fatigue from treatment may be severe and linger for cancer
survivors. Severe fatigue may increase the caregiving burden on a spouse which reduces his or
her work effort or makes work more difficult (Passick & Kirsch, 2005). In some cases, the
caregiving burden leads to loss of income and subsequent financial distress (Longo, Fitch, Deber,
& Williams, 2006).
Most cancer survivors are married. In 2001, two-thirds of adult cancer survivors were
married or living with a partner (Ibrahim, Short, & Tunceli, 2004). The data used in this paper
suggest that two-thirds of the married couples were ―working couples‖ at the time of diagnosis

67
(Table 3.1), where a ―working couple‖ is defined as a married couple where husband and wife
both work for pay.
Labor supply choices by married couples involve some degree of joint decision-making
(Chiappori, 1997; Killingsworth, 1983; Vermulen, 2005). The economic models of the
negotiated work choices in married couples range from unitary to collective decisions. In
elementary unitary models, each spouse independently maximizes his or her utility from a unique
combination of work and leisure hours. The total utility for the couple and labor supply is
simply the sum of the independent decisions about the hours of work. Furthermore, a spouse’s
utility function may or may not incorporate factors that affect the utility of his or her partner’s
satisfaction. Becker (1965) has referred to incorporation of the other person’s utility function as
altruistic behavior. Alternatively, collective models assume that labor supply decisions are
determined simultaneously by the spouses.
There are gaps in the cancer survivor literature for spousal labor supply. Bradley and
Bednarek (2002) reported on spouses working several years after diagnosis, but information on
baseline labor supply was inadequate for more extensive analysis. A small pilot study of a
convenience sample by Passick and Kirsch (2005) examined the spousal effects of caregiving for
survivors with significant fatigue. They found that some spouses reported fewer work hours
(28%), reduced job responsibilities (32%), or diminished effectiveness at work (32%). However,
significant limitations in the sample and covariates were a barrier to labor supply estimates. A
study of short-term cancer survivors by Longo, Fitch, Deber, and Williams (2006) reported that
some households experienced financial distress (20%) from reductions in spousal work hours
during the two-year period following diagnosis and treatment. The study, however, did not report
labor supply estimates. In summary, the current studies with spouses in the cancer survivor
literature are limited by the lack of power, dependence on bivariate frameworks, inadequate
quantitative measures of labor supply, or study designs that omit control groups.

68
The purpose of this paper is to fill a gap in the cancer survivor literature about spousal
labor supply. The paper addresses two related research questions. First, what factors explain,
especially cancer type and stage, differences in the labor supply adjustments of spouses of
working age cancer survivors (25-64)? Second, what is the effect of cancer on the labor supply of
spouses of older working cancer survivors (50-64)? Answers to these questions will provide
information to married couples, clinicians, social workers, employers, and public policymakers.
Married couples will have more information about how others have adjusted to cancer.
Clinicians and social workers will be able to improve the design of support programs for the
needs of married couples. Employers may implement or modify programs of accommodation for
spouses of cancer survivors. Finally, policymakers and supporting cost-effectiveness studies will
benefit from knowledge of spousal responses to cancer.
Conceptual Model
Serious illness, like cancer, disturbs the equilibrium in a married couple’s joint labor
supply decision. A cancer diagnosis may change preferences for work or leisure for one or both
marriage partners. Some spouses of cancer survivors may work more to compensate for lost
income or benefits, while other spouses may work less to provide caregiving or perform
household activities. A spouse’s decision to work more or less depends on the spouse’s utility
function and comparison of opportunity costs of working or not working (Berger, 1983; Coile,
2004; McClellan, 1998).
Spousal work choices may not be entirely independent of work decisions made by the
cancer survivor. Economic models of joint labor supply decisions in married couples provide
alternative decision-making frameworks across a continuum of ―jointness‖ (Blundell &
MaCurdy, 1999; Chiappori, 1999; Fortin, & Lacroix, 1997; Keeley, 1981; Killingsworth, 1983;
Vermulen, 2005). The models range from a simple or unitary perspective in which each spouse
makes independent adjustments in his or her labor supply to more complicated collective

69
decisions. In the simplest decision-making model, each spouse evaluates the opportunity cost of
working or not working and maximizes his or her own utility. The married couple’s joint utility
is simply the sum of the independent labor supply decisions. In more complicated models, the
labor supply decisions are correlated, given simultaneously determined decisions by each spouse
(Apps& Rees, 1997; Chiappori, 1997; Clain & Leppel, 1994; Duguet & Simonnet, 2003; Fortin
& Lacroix, 1997). Among older working couples, the labor supply decision may take the form of
a joint retirement decision (Blau, 1998; Coile, 2003, 2004; Gustman & Steinmeier, 2004).
Adjustments in labor supply may occur at the extensive or intensive margin. At the
extensive margin, the marginal adjustment is binary – to work or not work. An adjustment of this
magnitude involves greater risks for losing job-related benefits or large reductions in lifetime
income. On the intensive margin, the marginal adjustment is along a continuum of hours of work.
Here, a spouse may be able to make smaller changes and reduce the risk of loss of benefits or
income while providing caregiving or household production services.
Spouses share in the cancer survivorship experience. Mullan (1985) has described this
experience as progression through stages of survival. Collectively, Mullan named these stages
―seasons of survival.‖ The first stage is the acute stage, which is synonymous with the initial
treatment period (i.e., approximately one year or less). This stage is followed by the extended
survival stage or ―post-acute stage.‖ For many survivors, this stage may last from one to five
years after diagnosis while they deal with fears of recurrence. Once those fears recede into the
background of daily life, the survivor has transitioned into the third and final stage – permanent
survival. Traditionally, the five-year post-diagnosis has been the benchmark for long-term
survival. Not all survivors spend the same time in the extended survival stage. Some cancer
survivors may quickly resolve fears of recurrence and live life much in the same manner as before
the diagnosis. Mullan’s framework guides our conceptualization of the sequence and context of
decisions facing cancer survivors and provides a reference point for comparison with the
literature. The acute and extended survival stages approximate the short-term period (1 up to 5

70
years) and the permanent survival stage represents the long-term period (5 or more years).
Spouses and cancer survivors negotiate the joint labor supply decision in the short-run and long-
run periods. At each period, a spouse weighs the opportunity costs of working more or less and
the effect on his or her own utility (Becker, 1965; Gronau, 1997; Keeley, 1981).
Spouse work choices in either the short-run or long-run are constrained by the work
situation in the household at diagnosis (Figure 3.1). From this initial condition, a spouse makes
choices about work in a sequence of survivorship stages. Initial decisions made at one stage may
become permanent in subsequent stages. Spouses working at diagnosis face large and small
marginal decisions about working. At the extensive margin, a spouse must decide to keep
working or stop working. At the intensive margin, a spouse considers working the same, more, or
fewer hours. Continuing to work maintains the flow of work-related income and may provide
access to another source of health insurance. Stopping work may allow more time for caregiving
or taking on additional household production duties (e.g., child-rearing). Alternatively, the labor
supply decisions of non-working spouses are to continue not to work or start working at the
extensive margin.
The situation for working and non-working spouses at diagnosis is further constrained by
the work status of a cancer survivor at diagnosis (Table 3.1). The most frequent work status
combination at diagnosis is both spouses working at diagnosis. A spouse with a working cancer
survivor has more flexibility in work choices compared with a spouse who is also the sole worker
at diagnosis.
A spouse’s work decision involves three sets of factors which are categorized as cancer,
socio-demographic, and job-related (Figure 3.2). Cancer, stage, treatment, co-morbid conditions,
and physically demanding work may alter the productivity and the work preferences of a cancer
survivor. These changes may ―spillover‖ and influence the productivity and work-leisure
preferences of the spouse. Time-since diagnosis allows more time to make adjustments and make
decisions on their permanence. Spousal socio-demographic characteristics may increase or

71
decrease labor supply since labor force participation differs by gender. People are less likely to
work as they age and near retirement or have young children at home. Education is indirectly
associated with better paying jobs and working conditions. Employers may provide health
insurance or pension benefits that may increase or decrease labor supply. Other benefits may
depend on the size of an employer. Large employers are more likely to offer paid sick leave,
have labor capacity to offer flexible arrangements, and must comply with the Family Medical
Leave Act for unpaid leave.
Methods
Overview
Labor supply may vary due to differences in spousal characteristics broadly categorized
as cancer, socio-demographic, and job-related. The effect of cancer may be demonstrated in two
ways. First, cancer may have differential effects among spouses of cancer survivors. Second,
cancer may have different effects on spouses in married couples with and without cancer. Each
effect provides information that will inform the decisions of married couples, program managers,
and policymakers.
These effects were measured in two separate analyses. The first analysis measured
cancer’s effect on ―within group differences‖ in labor supply for spouses of cancer survivors.
Measurement of these differences will aid the design of employee accommodations, psychosocial
support programs, and cancer survivorship plans. Data for this analysis was provided by the Penn
State Cancer Survivor Survey (PSCSS), which was funded by the National Cancer Institute. The
second analysis measured cancer’s effect on the differences in labor supply ―between groups.‖
The magnitude of the differences in labor supply between spouses in married couples with and
without cancer will benefit cancer survivorship plans, employee accommodations, and
policymaking choices in allocating resources to mitigate indirect economic costs of cancer on
productivity due to morbidity. The Health and Retirement Study (HRS) provided data for the

72
comparison group and the PSCSS data in the first analysis were restricted to the age range in the
HRS. Consequently, the ―between group‖ differences were measured for spouses of older cancer
survivors.
Labor supply effects in each analysis were measured for two outcomes: work status and
usual hours of work per week. The extensive margin is the decision to work or not. Labor supply
effects were estimated at the extensive margin using logistic regression methods for the
likelihood of working at two to six years after diagnosis. The effects were reported as odds ratios
for the likelihood of working at two to six years after diagnosis. The intensive margin measures
changes in the hours of work. However, changes in the hours of work included zero hours of
work. The large number of zero observations would bias estimated coefficients for cancer and
other spousal characteristics. If one conceptualizes the number of work hours as the result of two
decisions, the decision to work at all (extensive margin) and given that decision, how many hours
to work (intensive margin), then the bias in the estimated effects can be reduced by using an
alternative to OLS (Ordinary Least Squares). Tobit regression methods were used to estimate the
effect of cancer for a combination of intensive and extensive margins – the decision to work and
if working, how many hours of work per week. Given large differences in labor force
participation between men and women, separate estimates of labor supply were made by gender.
Data
Overview of Penn State Cancer Survivor Survey (PSCSS)
The main data source was the Penn State Cancer Survivor Survey (PSCSS), which
collected data from survivors not only about their own work but also about their spouses’ work.
This survey, funded by the National Cancer Institute, gathered four waves of data in annual
interviews from late 2000 through 2004. Data for spouses of cancer survivors were selected from
the Wave 2 (2002) of the PSCSS survey which represented the time period two to six years after
diagnosis.

73
There were four waves of annual interviews from 2001 through 2004 (Short, 2001).
Three major criteria governed inclusion in the survey: (1) a first cancer diagnosis occurred from
1997 to 1999, (2) a high probability of survival over the four data collection waves (as
determined by staging and ICD-Oncology), and (3) ages 25 to 62 at the time of diagnosis.
Patients were selected from tumor registries at four hospitals (Geisinger Medical Center, Lehigh
Valley Hospital and Health Network, Milton S. Hershey Medical Center, and The Johns Hopkins
Hospital). The survey instrument included retrospective questions about work status, hours of
work, socio-demographic characteristics, employment-related benefits, and cancer attributes at
time of diagnosis (study baseline). Details about the PSCSS have been published elsewhere
(Short & Mallonee, 2006; Short, Vasey, & Tunceli, 2005).
The data in this study were provided by Wave 2 (2002) of the PSCSS. This wave
contained 1,107 married couples. A ―married couple‖ was defined as a husband and wife who
reported that they were married at diagnosis and remained so through the interview date at Wave
2. About seven percent of the responses to marital status questions were excluded because the
cancer survivor was living with a partner, in a same-sex relationship, or was not married to the
same person as at diagnosis.
The initial working status varied among married couples at diagnosis. Joint decisions
about working or not working made prior to diagnosis resulted in four combinations of work
status at diagnosis (Table 3.1). In most couples, a cancer survivor and spouse, a ―working
couple,‖ were both working at baseline (739, 67.4%). The remaining married couples had one or
nobody working at diagnosis: survivor-only (154, 14.1%), spouse-only (147, 13.4%) and nobody
(56, 5.1%). These combinations form the context for the contribution of spousal characteristics
to labor supply choices. Given the magnitude of the combination of both husband and wife
working at diagnosis (67.4%), the analyses of spousal labor supply focused on this combination.
Estimates of spousal labor supply at two to six years after diagnosis were conditional on a
―working couple‖ at diagnosis.

74
First Analysis: The PSCSS Data for Within Group Differences Among Spouses of Cancer
Survivors
The PSCSS data in the two analyses have common data sources. Data were collected at
diagnosis (baseline) by retrospective questions in the Wave 1 interview or from cancer registries.
Changes since baseline were captured in the subsequent interviews at Waves 1 and 2. The study
endpoint is the Wave 2 interview which occurs two to six years after diagnosis.
Spousal characteristics in ―working couples,‖ including the condition of the cancer
survivor at diagnosis, are described in Table 3.2. The spouse sample included 739 working
couples with 469 husbands (63.5%) and 270 wives (36.5%). The proportion of husbands aged 53
or older at diagnosis (31.3%) was larger than the proportion of wives in the same age groups
(26%). Post-graduate education was slightly higher among husbands (24.3%) than wives
(22.1%). More husbands (55%) had health insurance through a current employer than wives
(40.7%). The proportion of young children at home was greater for wives (7.8%) than husbands
(5.5%). Husbands worked more often in full-time jobs (88.7%) than wives (66.3%).
Second Analysis: PSCSS Data for Between Group Differences
The spouses of cancer survivors aged 55 or older in 2002 were selected from the working
couple data in Table 3.2 for comparison to a control group of similar ages. The data contained
286 working couples with 153 husbands and 135 wives among the spouses. Characteristics of the
sample are described in Table 3.7.
Second Analysis: HRS data for Between Group Differences
The data are from the Health and Retirement Study (HRS), Version H, Round 6, 2002.
The biennial survey began in 1992 and is managed by the University of Michigan (Leacock,
2006). Data are collected every two years on the socioeconomic, demographic, health, work, and
retirement characteristics for a nationally representative sample of persons aged 50 or older.

75
HRS version H had over 30,000 persons (RAND HRS, 2008). There were 1,026 working
couples aged 55 or older in 2002. Among the spouses in this group were 416 husbands and 610
wives. The sample data from the PSCSS and HRS are compared in Table 3.7. The main
differences between the samples are in educational attainment and employer-sponsored health
insurance (chi-square, alpha=.05).
Statistical Analysis
Given large differences in labor force participation between men and women, labor
supply has often been measured separately by gender. Consequently, the data are analyzed
separately for effects on a husband or a wife of a cancer survivor.
Bivariate associations between spousal characteristics at diagnosis and work status at
Wave 2 used chi-square tests. These methods were also applied to comparison of sample
differences between the PSCSS and HRS working couple data. Changes in mean hours of work
between diagnosis and Wave 2 were examined using t-tests and displayed as confidence intervals.
All statistical tests used an alpha=.05 criterion for statistical significance.
Work status model parameters were estimated via logistic regression methods, using
maximum likelihood methods and conditional on both spouse and cancer survivor working at the
time of diagnosis. Hour models were estimated using a Tobit method. The Tobit procedure
estimates coefficients when samples are censored with respect to observations of the outcome
variable – zero work hours. The Tobit procedure compensates for the unobserved work hours and
produces estimates of the latent variable that includes the effects of both large and small
adjustments in work hours by spouses. Tobit coefficients are not directly interpretable as OLS
coefficients. The coefficients require an adjustment procedure for comparison to OLS
coefficients. All statistical analyses were executed in SAS version 9.2.

76
Variable Specifications: First Analysis – Between Group Differences - PSCSS
With few exceptions, model outcome and explanatory variables were specified as binary
variables with the presence of a characteristic represented as 1, and 0 otherwise. Hours were
reported as a continuous variable with a lower bound of zero. Data for work status, and usual
hours of work per week, were based on questions in the PSCSS that were identical to wording in
the HRS survey. Work status was determined by the answer to the question: ―Are you working
for pay?‖ Hours of work were captured by the question: ―How many hours a week do you
usually work?‖ The usual hours of work variable was specified as continuous from a lower
boundary of zero. Full-time work status was determined by a response to survey questions about
full-time work, or, if that response was missing, by using working more than 35 hours in the usual
hours worked per week.
The effect of cancer on spousal labor supply was specified by the potential behavior of a
working cancer survivor and his or her likelihood of quitting work. A cancer survivor’s
likelihood of quitting work is associated with cancer sites. Short, Vasey, and Tunceli (2005)
found that with some cancer sites, cancer survivors were more or less likely to quit working. The
likelihood of quitting may be viewed as a proxy variable for the severity of cancer and its work
impairment. It may also signal an increasing demand on spouses for caregiving, assistance with
medical appointments, or taking on additional household activities. These demands could reduce
the spousal labor supply. On the other hand, a spouse faced with an increasing likelihood that a
cancer survivor will quit working, may respond by continuing to work to maintain access to
health insurance benefits and minimize income losses. Short, Vasey, and Tunceli (2005),
grouped cancer sites by differences in the log odds of quitting work compared to a cancer in
common among men and women – colon cancer. Cancer survivors with blood, central nervous
system, and head & neck cancers were most likely to stop working. They were followed by
survivors with respiratory, lymph, melanoma (skin), thyroid, and other cancers. Finally,
survivors who were least likely to stop working included those with uterine, female breast,
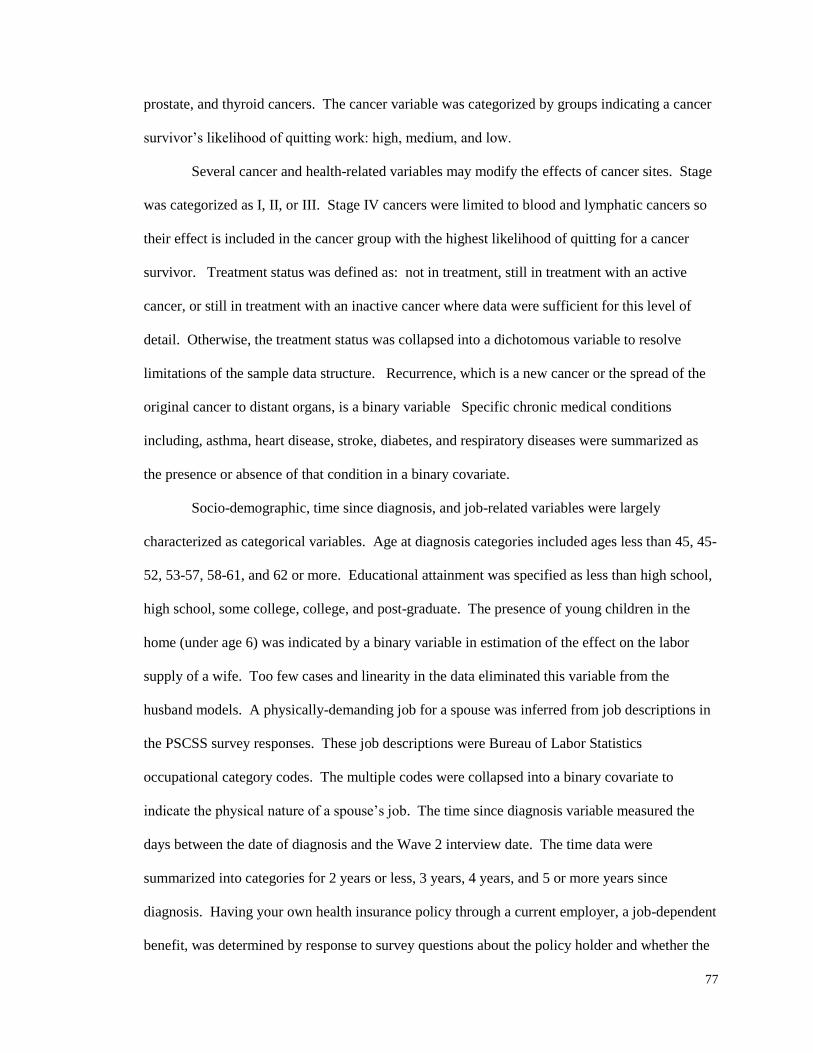
77
prostate, and thyroid cancers. The cancer variable was categorized by groups indicating a cancer
survivor’s likelihood of quitting work: high, medium, and low.
Several cancer and health-related variables may modify the effects of cancer sites. Stage
was categorized as I, II, or III. Stage IV cancers were limited to blood and lymphatic cancers so
their effect is included in the cancer group with the highest likelihood of quitting for a cancer
survivor. Treatment status was defined as: not in treatment, still in treatment with an active
cancer, or still in treatment with an inactive cancer where data were sufficient for this level of
detail. Otherwise, the treatment status was collapsed into a dichotomous variable to resolve
limitations of the sample data structure. Recurrence, which is a new cancer or the spread of the
original cancer to distant organs, is a binary variable Specific chronic medical conditions
including, asthma, heart disease, stroke, diabetes, and respiratory diseases were summarized as
the presence or absence of that condition in a binary covariate.
Socio-demographic, time since diagnosis, and job-related variables were largely
characterized as categorical variables. Age at diagnosis categories included ages less than 45, 45-
52, 53-57, 58-61, and 62 or more. Educational attainment was specified as less than high school,
high school, some college, college, and post-graduate. The presence of young children in the
home (under age 6) was indicated by a binary variable in estimation of the effect on the labor
supply of a wife. Too few cases and linearity in the data eliminated this variable from the
husband models. A physically-demanding job for a spouse was inferred from job descriptions in
the PSCSS survey responses. These job descriptions were Bureau of Labor Statistics
occupational category codes. The multiple codes were collapsed into a binary covariate to
indicate the physical nature of a spouse’s job. The time since diagnosis variable measured the
days between the date of diagnosis and the Wave 2 interview date. The time data were
summarized into categories for 2 years or less, 3 years, 4 years, and 5 or more years since
diagnosis. Having your own health insurance policy through a current employer, a job-dependent
benefit, was determined by response to survey questions about the policy holder and whether the
78
insurance was sponsored by a current employer. No racial or ethnic variables were specified
since the PSCSS survey instrument limited the question to cancer survivors.
Variable Specifications: Second Analysis – Between Group Differences
The previously defined variables were included here with the following exceptions. A
binary indicator for cancer replaces site detail, recurrence, stage, and treatment status. Age
groups reflect an older population, so the categories included less than 58, 58-61, and 62 and
over. In order to maintain equivalency with the HRS, the separate educational categories of
college and post-graduate education were collapsed into a single category.
Since the PSCSS survey used many of the same questions as the HRS, the construction of
corresponding variables from HRS data was similar with one exception: time since diagnosis.
Since there was no cancer diagnosis date for the HRS control group observations, a ―pseudo-
diagnosis date‖ was created for a baseline reference point by randomly assigning PSCSS cases to
HRS spouses (Short, Vasey, & Moran, 2008). Assignment was made separately by gender. The
diagnosis date in the PSCSS case became the start date for the corresponding HRS case. The
time since diagnosis was calculated as the elapsed time from this date until the Wave 2 interview
date. Differences were not statistically significant in the distribution of the time-since-diagnosis
data for the PSCSS and HRS spouses (chi-square, alpha = .05).
79
Results
First Analysis: Cancer Effects on Labor Supply Within a Group of Spouses of Cancer Survivors
Bivariate Results
Fewer married couples were ―working couples‖ 2 to 6 years after diagnosis. The number
of working couples decreased from 738 to 604 (-18.2%). Work status at Wave 2 was associated
with spousal characteristics at diagnosis (Table 3.2). For husbands, associations were found for
age-at-diagnosis, own employer-sponsored health insurance, breast and respiratory cancers, and a
wife’s chronic medical condition. A wife’s work status was also associated for age-at-diagnosis,
own employer health insurance, a young child at home, a full-time job, recurrence of cancer in
her husband and his treatment status. All associations were tested for significance via chi-square
tests (alpha = .05).
Cancer characteristics of survivors were not statistically significant in effect on the
change in hours between diagnosis and Wave 2. There were no statistically significant
differences between the mean hours of work in a usual week at diagnosis and years later at Wave
2 (Tables 3.3 and 3.4). No effects were found for cancer site, stage, treatment status, or
recurrence for husbands or wives who worked in both periods (t-test, alpha=.05).
Multivariate Results
Work status effects of cancer, socio-demographic, and job-related characteristics are
reported as odds ratios (OR) for married couples, conditioned on both spouse and cancer survivor
working at diagnosis (Table 3.5). The odds ratios measure the likelihood of working two to six
years after diagnosis. No cancer characteristics at diagnosis were associated with work status of
spouses. Current treatment status at the time of the interview was negatively associated with
working for wives (OR=0.1; 0.24, 0.406, p <.01). The presence of a young child (under age 6)
80
reduced the likelihood of working for wives (OR=0.027; 0.006, 0.118, p <.01). Both husbands
and wives were less likely to work with age (p <.01).
The hour effects of cancer characteristics and covariates are reported as Tobit coefficient
estimates (Table 3.6). These estimates account for spouses who were working at diagnosis but
later reported zero hours of work in a usual week. Treatment status effects were negatively
associated with hours worked by wives (-13.5, p =.005). Increasing age at diagnosis was
negatively associated with hours for husbands and wives (p <.01). Working full-time at
diagnosis was positively associated with the number of hours worked at Wave 2 for husbands
(5.6, p <.05) and wives (9.5, p <.01).
Second Analysis: Cancer Effect on the Labor Supply of Spouses Comparing Married Couples
with and without Cancer
Bivariate Results
The proportion of husbands and wives working two to six years after diagnosis decreased
for both married couples with and without a cancer survivor (Table 3.7). Significant covariates
for working at Wave 2 included educational attainment and own health insurance benefits that
were contingent on a current employer (chi-square, alpha=.05).
Multivariate Results
Work status differences at two to six years after diagnosis are reported as odds ratios for
husbands (Table 3.8) and wives (Table 3.9) in a comparison of working couples with and without
a cancer survivor. The odds ratios measure the marginal effect of a variable on the likelihood of a
spouse working at two to six years after diagnosis given the condition of working couple at
diagnosis. Models I, II, and III illustrate the initial effect, if any, of cancer and how that effect
changes in magnitude as other covariates are included for the full model (Model III) results which
follow.

81
Cancer was not associated with the likelihood of working. Other socio-demographic and
job-related variables accounted for differences in work status. For husbands, age was negatively
associated with the likelihood of working (p <.01). Positive associations were found for
husbands with college and postgraduate education (OR=2.012; 1.075, 3.763, p <.05) and working
full-time at diagnosis (OR=1.606; 0.942, 2.737, p <.10). Wives were less likely to work with age
(p <.01). Wives were more likely to work with some college education (OR=1.955; 1.093, 3.498,
p < .05), college and post-graduate education (OR=2.717; 1.472, 5.015, p <.01), and a job-
dependent health insurance benefit (OR=1.925; 1.290. 2.872, p <.01).
Results for cancer and the usual hours of work per week are reported as Tobit
coefficients in Table 3.10. No association was found for cancer and the usual hours of work per
week. For husbands, age was negatively associated with hours (p <.01), but a positive association
was found working full-time at diagnosis (13.53, p <.01). There was a negative association for
working with increasing age for wives (p <.01). Positive associations were found for high school
(4.35, p <.10), some college (6.59, p <.05), college and post-graduate education (10.13, p <.01),
working full-time at diagnosis (11.52, p <.01), and job-dependent health insurance (7.68, p <.01).

82
Discussion
This paper addressed the effects of cancer on spousal labor supply in married working
couples in the short-term after initial treatment. Time since diagnosis ranged from two to six
years. This paper incorporated two analyses of the effects of cancer on labor supply in working
couples: (1) differences within a group of spouses of cancer survivors of working age (25-64) and
(2) differences between cancer survivors (age 55 and up) and persons without a history of cancer.
The major finding is that there is little evidence for widespread systematic effects of
cancer on the labor supply of spouses in working married couples. While this is good news for
the overall picture of average effects, there are some distributional consequences for wives under
certain conditions.
A wife whose husband was in treatment was less likely to work. If her husband was in an
advanced stage of cancer (III), she reduced her usual hours of work per week. Since this new
round of treatment extends beyond an initial treatment period, it may imply that the health of the
cancer survivor has deteriorated, perhaps as a result of recurrence or other late effects. In
addition, married couples may experience new financial distress or a continuation of financial
distress from treatment shortly after diagnosis. The magnitude of wage losses suffered by
married couples in the first year after treatment is significant. Lauzier et al. (2008) found that
wage losses for Canadian breast cancer survivors in married couples averaged 27% in the year
after diagnosis due in part to working fewer hours. The average wage loss masked even larger
losses. Ten percent lost two-thirds or more of pay and another sixteen percent lost between one-
third and two-thirds of salary Wage losses were more likely among survivors who were less
educated, worked part-time or were self-employed, short job tenure, or had chemotherapy.
Longo, Fitch, Deber, and Williams (2006) reported significant financial stress on families in the
year following diagnosis. Seventeen percent of the families reported significant financial distress
which was associated with time off from work for caregivers, including spouses, and
chemotherapy. Wives who reduce work well after the initial treatment period could face similar

83
economic consequences. For some, this may represent a continuation of financial distress or a
new episode after a brief respite.
There are several limitations to this study related to measurement of potentially important
variables that may affect spousal labor supply. These include spouse’s own health, pensions, and
differentiation of cancer site effects. While more direct measures of spousal health and pension
benefits might improve coefficient estimates, some of the effects of these variables may have
been captured in other covariates. Age may act as proxy for chronic medical conditions since
there is some correlation between aging and chronic conditions. Likewise, education is often
associated with better paying jobs and benefits, like pensions, so these variables may also account
for some of the pension effects. Given the small numbers of some types of cancer, the cancer
sites were grouped into three broad categories of cancers. Although no effect was found for
cancer, in general, in the short-term, certain types of cancer may be associated with labor supply
effects in the long-run as late effects appear.
The findings suggest several policy implications. First, the good news is that in general,
once past treatment, on average, most spouses in working couples continue to work in the short-
run. Adjustments in labor supply during treatment were largely temporary. Second, given the
evidence in this study for treatment effects, some segment of married working couples may be at
risk for financial distress. How many and how deep that distress is should be explored in future
research. Third, spouses share in the cancer survivorship experience, so efforts by clinicians and
social workers that improve care for cancer survivors will yield additional benefits for spousal
labor supply and alleviation of financial distress. Efforts to mitigate chemotherapy side effects
should improve care plans. Social workers can be proactive in dealing with clients with risk
factors for financial distress. Fourth, employers can feel more confident that investments in
accommodation programs for spouses will be beneficial since most working spouses will
continue to work years after treatment. Lastly, government income assurance programs or health

84
insurance subsidies may improve the economic welfare of married couples where treatment
effects on spousal labor supply are significant burdens.

85
References
American Cancer Society. (2010). Cancer Facts and Figures 2010. Washington, DC.
Apps, P.F., & Rees, R. (1997). Collective labor supply and household production. Journal of
Political Economy, 105(11), 178-190.
Becker, G.S. (1965). A theory of the allocation of time. The Economic Journal, 75(299), 493-517.
Berger, M.C. (1983). Labor supply and spouse’s health: the effects of illness, disability, and
mortality. Social Science Quarterly, 64(3), 494-509.
Blau, D.M. (1998). Labor force dynamics of older married couples. Journal of Labor Economics,
16(3), 595-629.
Blundell R., & MaCurdy, T. (1999). Labor supply: a review of alternative approaches. Handbook
of Labor Economics, Ashenfelter, O. & Card, D., eds. Volume 3A, 1559-1695.
Bradley, C.J. & Bednarek H. (2002). Employment patterns of long-term cancer survivors.
Psycho-Oncology, 11 (2002), 188-198.
Chiappori, P.A. (1997). Introducing household production in collective models of labor supply.
Journal of Political Economy, 105(1), 191-209.
Clain, S.H. & Leppel, K. (1994). New evidence of the interdependence in the labor supply
behavior of white couples. Atlantic Economic Journal, 22(3), 61-69.
Coile, C. (2003). Retirement incentives and couples retirement decisions. Topics in Economic
Analysis & Policy, 4(1), 1-28.
Coile, C. (2004). Health shocks and couples’ labor supply decisions. National Bureau of
Economic Research Working Paper Series #10810, National Bureau of Economic
Research, Cambridge, MA.
Duguet, E. & Simonnet, V. (2003). The participation of couples in the labor market: an
econometric analysis. Team 2003, working paper series, Cahiers de la MSE – Team
2003(126). Paris: Universite de Paris I-Pantheon-Sorbonne.
Fortin, B. & Lacroix, G. (1997). A test of the unitary and collective models of household labour
supply. The Economic Journal, 107, 933-955.
Gronau, Reuben. (1997). The theory of home production: the past ten years. Journal of Labor
Economics, 15(2), 197-205.
Gustman, A.L. & Steinmeier, T.L. (2004). Social security, pensions, and retirement behavior
within the family. Journal of Applied Econometrics, 19, 723-737.
Ibrahim I.A., Short, P.F., & Tunceli, K. (2004). A profile of cancer survivors in the United States.
Population Research Institute, Working Paper 04-04. University Park, PA: The
Pennsylvania State University.

86
Keeley, M. (1981). Labor Supply and Public Policy. New York: Academic Press.
Killingsworth, M.R. (1983). Labor supply. New York: Cambridge.
Kessler, R. C., Greenberg, P. E., Mickelson, K, D., Meneades, L.M., & Wang, P. S. (2001). The
effects of chronic medical conditions on work loss and work cutback. Journal of
Occupational and Mental Health, 43(3), 218-225.
Leacock, C. (2006) Getting started with the Health and Retirement Study: Version 1.0. Health
and Retirement Study, Survey Research Center, Institute for Social Research. Ann Arbor:
University of Michigan.
Lauzier, S., Maunsell, E., Drolet, M., Coyle, D, Hebert-Croteau, N., Brisson, J., Masse, B.,
Abdous, B., Robidoux, A., & Robert, J. (2008). Wage losses in the year after breast
cancer: extent and determinants among Canadian women. Journal of the National Cancer
Institute, 100(5), 321-332.
Longo, C.J., Fitch, M., Deber, R. B., & Williams, A.P. (2006). Financial and family burden
associated with cancer treatment in Ontario, Canada. Support Care Cancer, 14, 1077-
1085.
McClellan, M. (1998). Health events, health insurance, and labor supply: Evidence from the
Health and Retirement Survey. In D. A. Wise (Ed.), Frontiers in the Economics of
Aging, (pp.301-352). Chicago, IL: University of Chicago Press.
Mullan, F. (1985). Seasons of survival: reflections of a physician with cancer. New England
Journal of Medicine, 313, 270-273.
National Cancer Institute (2004). About Survivorship Research: Survivorship Definitions.
Retrieved from http://dccps.nci.nih.gov/ocs/definitions.html
Passick, S.D., & Kirsch, K.L. (2005). A pilot examination of the impact of cancer patient’s
fatigue on their spousal caregivers. Palliative and Supportive Care, 3, 273-279.
RAND (2008) RAND HRS Data, Version H. Produced by the RAND Center for the Study
of Aging, with funding from the National Institute on Aging and the Social
Security Administration. Santa Monica, CA.
Short, P. F. (2001). The Economic Consequences of Cancer Survival. Unpublished IRB
application, The Pennsylvania State University.
Short, P.F., Vasey, J. J., & Moran, J.R. (2008). Long-term effects of cancer survivorship on the
employment of older workers. Health Services Research, 43(1), Part I, 193-210.
Short, P.F., Vasey, J. J., & Tunceli, K. (2005). Employment pathways in a large cohort of adult
cancer survivors. Cancer, 103(6), 1292-1301.
Short, P.F., & Mallonee, E.L. (2006). Income disparities in the quality of life of cancer survivors.
Medical Care, 44(1), 16-23.

87
Twombly, R. (2004). What’s in a name: Who is a cancer survivor? Journal of the National
Cancer Institute, 96(191), 1414-1415.
Vermulen, F. (2005). And the winner is: An empirical evaluation of unitary and collective supply
models. Empirical Economics, 30, 711-734.

88
Figure 3.1
Key Employment Decisions Faced by Spouses of Cancer Survivors:
A Sequence of Choices at Each Stage of the Joint Survivorship Experience
Work
No
Yes
Employed
Full Time
Employed
Part Time
No Yes
No
No
Yes Yes
Not
Employed
Reduce Hours? Quit in Stage
Return to Work?

89
Figure 1: Conceptual Model of Factors Which Affect the Retirement Decision
Figure 3.2
Conceptual Model of Factors Which Affect the Work Decision at Wave 2
Spouse Job-Related Characteristics
- Full-time status
- Own Health Insurance
- Size of Employer
Survivor Health and Accommodation
Characteristics
- Cancer & Site
- Stage
- Treatment Status
- Years since Diagnosis
- Recurrence
- Number of Chronic Conditions
- Own Health Insurance
- Paid Sick Leave
- Size of Employer
Work Outcome at Wave 2
- Keep or Stop Working
- Change in Usual Hours of Work
Per Week
Socio-Demographic Characteristics
- Gender
- Age
- Educational Attainment
- Marital Status
- Race

90
Table 3.1
Changes in Patterns of Married Couples’ Work Choices
from Diagnosis to Wave 2
Household
Work
Combinations
at Diagnosis
Household Work Combinations at Wave 2 (Changes) (n=1108)
Nobody
Working
Survivor
Only
Working
Spouse
Only
Working
Both
Working Total
Row
Percent
Nobody
Working 41 9 4 2 56 5.1
Survivor
Only
Working
34 84 6 30 154 14.1
Spouse Only
Working 26 2 81 38 147 13.4
Both
Working 37 55 112 534 739 67.4
Total 138 150 203 604 10961
Column
Percent 12.6 13.7 18.5 55.2 100.0
1Note: 12 observations (1%) of sample missing work status
Chi-Square 693; DF 9; p-value <.0001

91
Table 3.2
Characteristics of Spouses of Cancer Survivors in Working Couples
1 at Diagnosis and
the Association with Working at Wave 2
(*Chi-Square .05, Association of Covariate with working at Wave 2; H =Husband, W=Wife)
Husbands n=469
Wives n=270
Totals n=739
Characteristic Number Column
Percent Number
Column
Percent Number
Column
Percent
Spouse: Age in years at
Diagnosis H,W
25-44 166 35.4 105 38.9 271 36.7
45-52 156 33.3 95 35.2 251 34.0
53-57 69 14.7 49 18.2 118 16.0
58-61 52 11.1 20 7.4 72 9.7
62+ 26 5.5 1 0.4 27 3.7
Missing
Spouse: Education at
Interview
Less Than HS 20 4.3 11 4.1 31 4.2
High School 160 34.1 97 35.9 257 34.8
Some College 79 16.8 53 19.6 132 17.9
College 91 19.4 59 21.9 150 20.3
Post-graduate 114 24.3 49 18.2 163 22.1
Other 4 0.9 11 4.1 4 0.5
Missing 1 0.2 1 0.4 2 0.3
Spouse: Own Health
Insurance from Current
Employer at Diagnosis H,W
No 211 45.0 160 59.3 371 50.2
Yes 258 55.0 110 40.7 368 49.8
Spouse: Children Under 6
years at Interview W
No 443 94.5 249 92.2 692 93.6
Yes 26 5.5 21 7.8 47 6.4 1Note: Working couple is defined as both husband and wife working at diagnosis.

92
Table 3.2 (cont.)
Characteristics of Spouses of Cancer Survivors in Working Couples
1 at Diagnosis and
the Association with Working at Wave 2
(*Chi-Square .05, Association of Covariate with working at Wave 2; H =Husband, W=Wife)
Husbands n=469
Wives n=270
Totals n=739
Characteristic Number Column
Percent Number
Column
Percent Number
Column
Percent
Spouse: Fulltime Status at
Diagnosis W
Working Part-time 42 9.0 82 30.4 124 16.8
Working Full-time 416 88.7 179 66.3 595 80.5
Missing 11 2.3 9 3.3 20 2.7
Surviving Partner’s Cancer
Site
Blood 17 3.6 20 7.4 37 5.0
Breast H
261 55.7 - - 261 35.3
CNS 12 2.6 11 4.1 23 3.1
Colorectal 16 3.4 37 13.7 53 7.2
Head & Neck 8 1.7 23 8.5 31 4.2
Lymphatic
Stage I, II, III
10 2.1 13 4.8 23 3.1
Lymphatic
Stage IV
8 1.7 8 3.0 16 2.2
Prostate - - 61 22.6 61 8.3
Respiratory H
12 2.6 10 3.7 22 3.0
Skin 19 4.1 12 4.4 31 4.2
Thyroid 34 7.3 19 7.0 53 7.2
Uterus 39 8.3 - - 39 5.3
Other Cancer 33 7.0 56 20.7 89 12.0
Surviving Partner’s Stage of
Cancer
I 240 51.2 92 34.1 332 44.9
II 144 30.7 94 34.8 238 32.2
III 52 11.1 45 16.7 97 13.1
IV 25 5.3 28 10.4 53 7.2
Unstaged 8 1.7 11 4.1 19 2.6
Surviving Partner’s Cancer
Recurrence W
No 390 83.2 223 82.6 613 83.0
Yes 78 16.6 47 17.4 125 16.9
Missing 1 0.2 1 0.1 1Note: Working couple is defined as both husband and wife working at diagnosis.
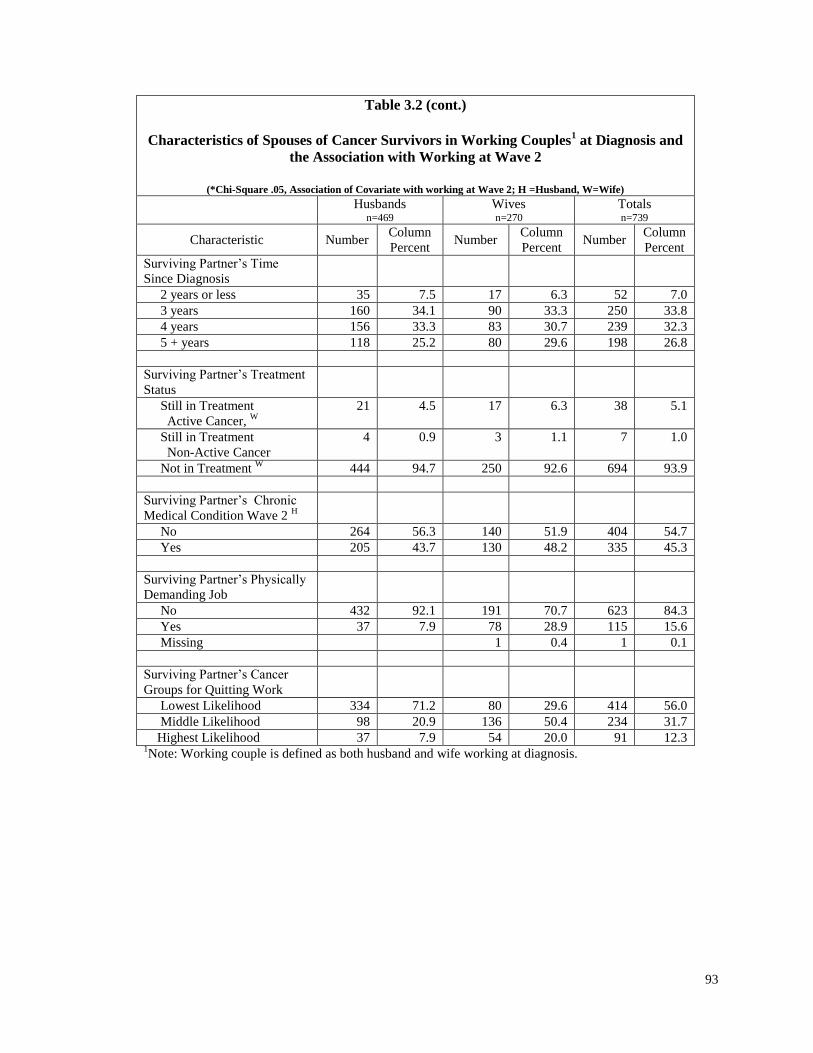
93
Table 3.2 (cont.)
Characteristics of Spouses of Cancer Survivors in Working Couples
1 at Diagnosis and
the Association with Working at Wave 2
(*Chi-Square .05, Association of Covariate with working at Wave 2; H =Husband, W=Wife)
Husbands n=469
Wives n=270
Totals n=739
Characteristic Number Column
Percent Number
Column
Percent Number
Column
Percent
Surviving Partner’s Time
Since Diagnosis
2 years or less 35 7.5 17 6.3 52 7.0
3 years 160 34.1 90 33.3 250 33.8
4 years 156 33.3 83 30.7 239 32.3
5 + years 118 25.2 80 29.6 198 26.8
Surviving Partner’s Treatment
Status
Still in Treatment
Active Cancer, W
21 4.5 17 6.3 38 5.1
Still in Treatment
Non-Active Cancer
4 0.9 3 1.1 7 1.0
Not in Treatment W
444 94.7 250 92.6 694 93.9
Surviving Partner’s Chronic
Medical Condition Wave 2 H
No 264 56.3 140 51.9 404 54.7
Yes 205 43.7 130 48.2 335 45.3
Surviving Partner’s Physically
Demanding Job
No 432 92.1 191 70.7 623 84.3
Yes 37 7.9 78 28.9 115 15.6
Missing 1 0.4 1 0.1
Surviving Partner’s Cancer
Groups for Quitting Work
Lowest Likelihood 334 71.2 80 29.6 414 56.0
Middle Likelihood 98 20.9 136 50.4 234 31.7
Highest Likelihood 37 7.9 54 20.0 91 12.3 1Note: Working couple is defined as both husband and wife working at diagnosis.

94
Table 3.3
Husbands: Mean Usual Hours of Work by the Cancer Characteristic of Survivors in
Working Couples1 at Diagnosis
Husband Working Both at Diagnosis and Wave 2
Cancer Survivor
Characteristic Diagnosis Wave 2
n
(408)
Mean Lower
95%
CI
Upper
95%
CI
n
(408)
Mean Lower
95%
CI
Upper
95%
CI Site
Blood 16 39.7 34.2 45.2 16 38.1 31.1 45.1
Breast 217 43.8 42.4 45.2 217 44.6 43.1 46.0
CNS 11 40.5 33.7 47.2 11 47.3 41.2 53.3
Colorectal 14 43.6 39.8 47.5 14 42.1 39.0 45.3
Head & Neck 8 43.8 40.0 47.5 8 45.6 39.5 51.7
Lymphatic
Stage I, II, III
10 43.5 36.0 51.0 10 48.3 39.1 57.5
Lymphatic
Stage IV
7 45.0 37.9 52.1 7 44.0 38.6 49.4
Respiratory 8 47.5 41.6 53.4 8 50.0 38.2 61.8
Skin 19 49.1 43.9 54.3 19 46.5 41.2 51.7
Thyroid 31 44.1 38.5 49.6 31 44.4 41.0 47.8
Uterus 35 40.9 37.7 44.1 35 42.2 37.8 46.6
Other 32 42.1 37.8 46.3 32 42.8 39.8 45.7
Lower Probability Quitting Work 283 43.5 42.2 44.8 283 44.3 43.0 45.5
Same Probability Quitting Work 90 44.7 42.5 46.8 90 44.8 42.8 46.8
Higher Probability Quitting Work 35 40.9 37.7 44.0 35 42.7 38.8 46.6
Stage
I 209 43.1 41.4 44.7 209 44.9 43.4 46.4
II 123 44.5 42.9 46.1 123 43.9 42.2 45.6
III 45 45.2 43.0 47.4 45 44.7 41.6 47.8
IV 23 41.3 37.1 45.5 23 39.9 34.8 44.9
Unstaged 8 36.3 23.1 49.4 8 42.8 29.3 56.2
Treatment Status
Still in Treatment
Active Cancer
17 44.4 40.7 48.0 17 43.8 40.8 46.7
Still in Treatment
Non-Active Cancer
4 41.3 31.2 51.3 4 46.3 34.3 58.2
Not in Treatment 387 43.5 42.4 387 44.2 43.2 45.3 387
Any New Cancer Since Diagnosis
Yes 67 45.0 42.2 47.9 67 45.1 42.3 48.0
No 341 43.2 42.1 44.3 341 44.1 43.0 45.2
Total 408 43.5 42.5 44.6 408 44.2 43.2 45.3
1Note: Working couple is defined as both husband and wife working at diagnosis.

95
Table 3.4 Wives: Mean Usual Hours of Work by the Cancer Characteristic of Survivors in
Working Couples1 at Diagnosis
Wife Working Both at Diagnosis and Wave 2
Cancer Survivor
Characteristic Diagnosis Wave 2
n
(222)
Mean Lower
95%
CI
Upper
95%
CI
n
(222)
Mean Lower
95%
CI
Upper
95%
CI Site
Blood 16 36.5 31.6 41.4 16 35.1 29.4 40.7
CNS 11 27.1 17.8 36.4 11 32.9 25.3 40.5
Colorectal 33 40.2 37.1 43.4 33 37.5 33.8 41.1
Head & Neck 21 40.1 34.3 45.9 21 37.0 32.7 41.4
Lymphatic
Stage I, II, III
11 37.6 30.6 44.6 11 36.6 29.3 43.9
Lymphatic
Stage IV
8 38.3 33.2 43.3 8 37.8 29.4 46.1
Prostate 50 38.2 34.2 42.1 50 37.5 34.1 40.9
Respiratory 7 37.1 25.5 48.7 7 37.1 27.2 47.1
Skin 11 36.4 27.6 45.1 11 35.1 27.3 42.8
Thyroid 16 36.3 28.6 43.9 16 35.6 29.7 41.6
Other 38 36.4 32.6 40.2 38 41.0 38.3 43.7
Lower Probability Quitting Work 66 37.7 34.3 41.1 66 37.0 34.2 39.9
Same Probability Quitting Work 108 37.9 35.9 39.9 108 38.4 36.5 40.2
Higher Probability Quitting Work 48 35.9 32.2 39.6 48 35.4 32.5 38.4
Stage
I 77 37.3 34.5 40.0 77 37.6 35.4 39.9
II 80 36.9 33.9 39.9 80 36.7 34.3 39.1
III 34 40.8 37.5 44.1 34 39.8 35.8 43.8
IV 24 37.1 33.6 40.5 24 36.0 31.6 40.3
Unstaged 7 28.9 15.3 42.4 7 34.1 25.2 43.1
Treatment Status
Still in Treatment
Active Cancer
9 43.3 31.8 54.9 9 37.8 25.6 49.9
Still in Treatment
Non-Active Cancer
1 20 - - 1 15 - -
Not in Treatment 212 37.2 35.6 38.8 212 37.4 36.1 38.8
Any New Cancer Since Diagnosis
Yes 34 33.0 28.1 37.8 34 34.9 31.6 38.3
No 188 38.2 36.5 39.9 188 37.8 36.3 39.3
Total 222 37.4 35.8 39.0 222 37.3 36.0 38.7 1Note: Working couple is defined as both husband and wife working at diagnosis.

96
Table 3.5
Results of Logit Models: All Spouses
Adjusted Odds Ratios of Likelihood of Working at Wave 2 Interview, Given Cancer of
Survivor and Both Working at Diagnosis1
Variable Sp=Spouse; S=Survivor
Dx = at Diagnosis; W=Wave I
Interview
Husbands (n=456) Wives (n=264) OR 95% CI OR 95% CI
Sp_High School-W 0.712 0.186 0.712 0.416 0.048 3.606
Sp_Some College-W 0.639 0.152 0.639 0.208 0.021 2.026
Sp_College-W 0.702 0.154 0.702 0.454 0.046 4.451
Sp_Post-graduate-W 1.269 0.282 1.269 0.679 0.053 8.641
Sp_Age53_57-W 0.4 0.131 0.4 0.268** 0.075 0.948
Sp_Age58_61-W 0.164*** 0.056 0.164 0.135*** 0.039 0.462
Sp_Age62_over-W 0.072*** 0.028 0.072 0.031*** 0.006 0.153
Sp_Own Health Insurance-Dx 1.396 0.682 1.396 1.628 0.592 4.476
Sp_Child Under Age 6-Dx NA NA NA 0.027*** 0.006 0.118
S_Time Since Dx-3 years 1.356 0.367 5.01 0.372 0.037 3.732
S_Time Since Dx-4 years 1.226 0.34 4.421 0.369 0.036 3.776
S_Time Since Dx 5 + years 1.517 0.381 6.04 0.355 0.034 3.668
S_Stage II-Dx 0.885 0.424 1.845 1.07 0.334 3.433
S_Stage III Dx 1.103 0.32 3.795 0.614 0.192 1.963
S_Still in Treatment-W 0.58 0.134 2.51 0.1*** 0.024 0.406
S_Cancer Spread / Returned-W 1.294 0.509 3.286 0.946 0.299 2.988
S_Chronic Medical Cond.-W 0.848 0.407 1.764 0.899 0.374 2.16
S_Has Physically Demanding
Job-Dx
1.513 0.377 6.066 0.549 0.214 1.409
Sp_Working Full-time -Dx 1.042 0.379 2.868 1.701 0.662 4.37
S_Cancer Group – Same
Probability of Quitting Work as
Colon Cancer-Dx
1.926 0.705 5.256 0.562 0.187 1.69
S_Cancer Group – Higher
Probability of Quitting Work
Than Colon Cancer-Dx
1.888 0.392 9.092 2.582 0.575 11.592
1Note: Reference group includes cancer group with lowest likelihood of survivor quitting work, Stage I at diagnosis, time since
diagnosis less than two years, age less than 53, no children under age 6, less than high school education, job at diagnosis not
physically demanding, no chronic conditions.
*** p < .01; ** p < .05; * p <.10

97
Table 3.6
Results of Tobit Models:
Contribution to Hours Worked by Spouse of Cancer Survivor at Wave 2 Interview
Given Both Working at Diagnosis1
Variable Sp=Spouse; S=Survivor
Dx = at Diagnosis;
W=Wave 2 Interview
Husband of Survivor (n=452) Wife of Survivor (n=204)
Est. S.E. T p Est. S.E. t p
Intercept 41.80 5.37 7.78 .0001 21.87 9.01 2.43 0.015
Sp_High School-W -4.98 3.85 -1.29 0.196 3.98 6.59 0.60 0.546
Sp_Some College-W -4.25 4.09 -1.04 0.299 -6.17 6.81 -0.91 0.365
Sp_College-W -2.60 4.11 -0.63 0.527 0.52 6.78 0.08 0.939
Sp_Post-graduate-W -1.42 4.06 -0.35 0.727 4.91 7.04 0.70 0.485
Sp_Age53_57-W -6.48*** 2.13 -3.05 0.002 -3.34 3.18 -1.05 0.293
Sp_Age58_61-W -12.18*** 2.64 -4.62 .0001 -17.50*** 4.05 -4.32 .0001
Sp_Age62_over-W -20.38*** 2.49 -8.18 .0001 -19.69*** 6.90 -2.85 0.004
Sp_Own Health Insurance-
Dx
2.25 1.64 1.37 0.169 1.31 2.63 0.50 0.619
Sp_Child Under Age 6-Dx 0.78 3.20 0.24 0.807 -1.42 5.29 -0.27 0.788
S_Time Since Dx-3 years -1.55 3.22 -0.48 0.630 2.33 5.27 0.44 0.658
S_Time Since Dx-4 years 0.06 3.31 0.02 0.986 0.86 5.36 0.16 0.873
S_Time Since Dx 5 +
years
-1.51 1.79 -0.84 0.399 2.96 3.01 0.98 0.327
S_Stage II-Dx 0.12 2.66 0.05 0.963 0.46 3.42 0.13 0.894
S_Stage III Dx -3.27 3.69 -0.89 0.375 -13.54*** 4.78 -2.83 0.005
S_Still in Treatment-W 2.51 2.22 1.13 0.259 -2.93 3.26 -0.90 0.368
S_Cancer Spread /
Returned-W
-0.79 1.67 -0.47 0.638 -1.21 2.52 -0.48 0.632
S_Chronic Medical Cond.-
W
0.53 3.23 0.16 0.870 2.14 2.82 0.76 0.448
S_Has Physically
Demanding Job-Dx 5.58** 2.69 2.07 0.038 9.49*** 2.77 3.42 0.001
Sp_Working Full-time -Dx 3.51* 2.00 1.75 0.080 3.63 4.25 0.85 0.393
S_Cancer Group – Same
Probability of Quitting
Work as Colon Cancer-Dx
0.19 2.99 0.06 0.950 6.50 4.65 1.40 0.162
Sigma _ Model
Significance
16.40 0.60 27.51 .0001 16.24 0.92 17.64 <.0001
1Note: Reference group includes cancer group with lowest likelihood of survivor quitting work, Stage I at diagnosis, time since
diagnosis less than two years, age less than 53, no children under age 6, less than high school education, job at diagnosis not physically demanding, no chronic conditions.
*** p < .01; ** p < .05; * p <.10
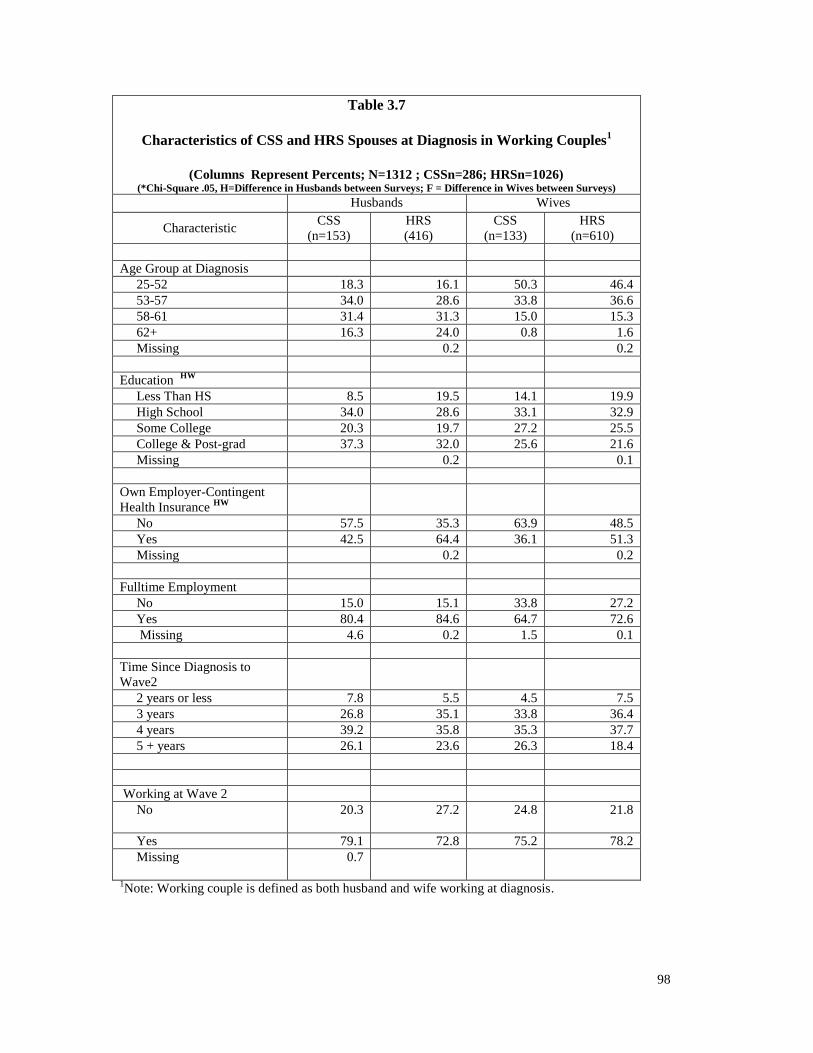
98
Table 3.7
Characteristics of CSS and HRS Spouses at Diagnosis in Working Couples
1
(Columns Represent Percents; N=1312 ; CSSn=286; HRSn=1026)
(*Chi-Square .05, H=Difference in Husbands between Surveys; F = Difference in Wives between Surveys)
Husbands Wives
Characteristic CSS
(n=153)
HRS
(416)
CSS
(n=133)
HRS
(n=610)
Age Group at Diagnosis
25-52 18.3 16.1 50.3 46.4
53-57 34.0 28.6 33.8 36.6
58-61 31.4 31.3 15.0 15.3
62+ 16.3 24.0 0.8 1.6
Missing 0.2 0.2
Education HW
Less Than HS 8.5 19.5 14.1 19.9
High School 34.0 28.6 33.1 32.9
Some College 20.3 19.7 27.2 25.5
College & Post-grad 37.3 32.0 25.6 21.6
Missing 0.2 0.1
Own Employer-Contingent
Health Insurance HW
No 57.5 35.3 63.9 48.5
Yes 42.5 64.4 36.1 51.3
Missing 0.2 0.2
Fulltime Employment
No 15.0 15.1 33.8 27.2
Yes 80.4 84.6 64.7 72.6
Missing 4.6 0.2 1.5 0.1
Time Since Diagnosis to
Wave2
2 years or less 7.8 5.5 4.5 7.5
3 years 26.8 35.1 33.8 36.4
4 years 39.2 35.8 35.3 37.7
5 + years 26.1 23.6 26.3 18.4
Working at Wave 2
No 20.3
27.2 24.8 21.8
Yes
79.1 72.8 75.2 78.2
Missing 0.7
1Note: Working couple is defined as both husband and wife working at diagnosis.
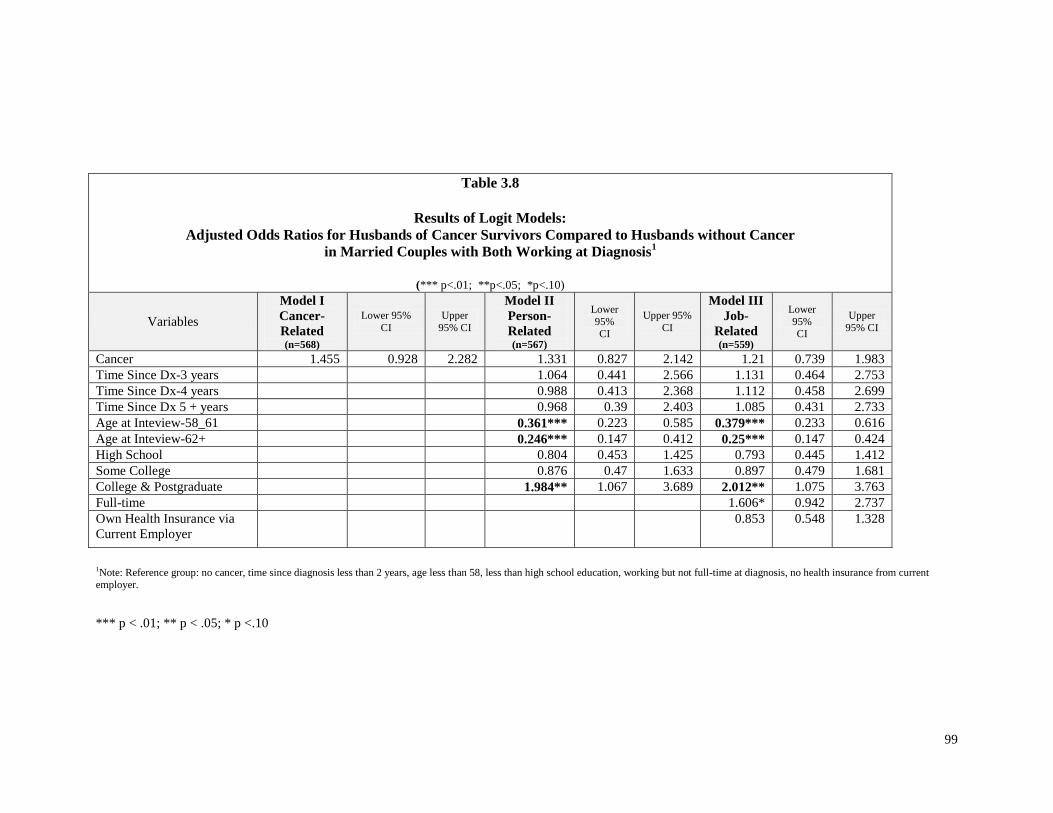
99
Table 3.8
Results of Logit Models:
Adjusted Odds Ratios for Husbands of Cancer Survivors Compared to Husbands without Cancer in Married Couples with Both Working at Diagnosis
1
(*** p<.01; **p<.05; *p<.10)
Variables
Model I
Cancer-
Related (n=568)
Lower 95%
CI
Upper
95% CI
Model II
Person-
Related (n=567)
Lower
95% CI
Upper 95%
CI
Model III
Job-
Related (n=559)
Lower
95% CI
Upper
95% CI
Cancer 1.455 0.928 2.282 1.331 0.827 2.142 1.21 0.739 1.983
Time Since Dx-3 years 1.064 0.441 2.566 1.131 0.464 2.753
Time Since Dx-4 years 0.988 0.413 2.368 1.112 0.458 2.699
Time Since Dx 5 + years 0.968 0.39 2.403 1.085 0.431 2.733
Age at Inteview-58_61 0.361*** 0.223 0.585 0.379*** 0.233 0.616
Age at Inteview-62+ 0.246*** 0.147 0.412 0.25*** 0.147 0.424
High School 0.804 0.453 1.425 0.793 0.445 1.412
Some College 0.876 0.47 1.633 0.897 0.479 1.681
College & Postgraduate 1.984** 1.067 3.689 2.012** 1.075 3.763
Full-time 1.606* 0.942 2.737
Own Health Insurance via
Current Employer
0.853 0.548 1.328
1Note: Reference group: no cancer, time since diagnosis less than 2 years, age less than 58, less than high school education, working but not full-time at diagnosis, no health insurance from current employer.
*** p < .01; ** p < .05; * p <.10

100
Table 3.9
Results of Logit Models:
Adjusted Odds Ratios for Wives of Cancer Survivors Compared to Wives without Cancer in Married Couples with Both Working at Diagnosis
1
(*** p<.01; **p<.05; *p<.10, n=692)
Variables
Model I
Cancer-
Related (n=743)
Lower 95% CI
Upper 95% CI
Model II
Person-
Related (n=742)
Lower
95%
CI
Upper 95% CI
Model III
Job-
Related (n=739)
Lower 95% CI
Upper 95% CI
Cancer 0.845 0.545 1.309 0.797 0.501 1.269 0.951 0.587 1.543
Time Since Dx-3 years 0.625 0.26 1.5 0.647 0.268 1.564
Time Since Dx-4 years 0.496 0.208 1.185 0.527 0.219 1.267
Time Since Dx 5 + years 0.437 0.176 1.084 0.458 0.183 1.145
Age at Inteview-58_61 0.338*** 0.218 0.524 0.374*** 0.238 0.586
Age at Inteview-62+ 0.191*** 0.056 0.653 0.177*** 0.051 0.608
High School 1.557 0.913 2.653 1.486 0.866 2.55
Some College 2.034** 1.144 3.617 1.955** 1.093 3.498
College & Postgraduate 2.966*** 1.623 5.421 2.717*** 1.472 5.015
Full-time 1.169 0.776 1.763
Own Health Insurance via
Current Employer 1.925*** 1.29 2.872
1Note: Reference group: no cancer, time since diagnosis less than 2 years, age less than 58, less than high school education, working but not full-time at diagnosis, no health insurance from current
employer.
*** p < .01; ** p < .05; * p <.10
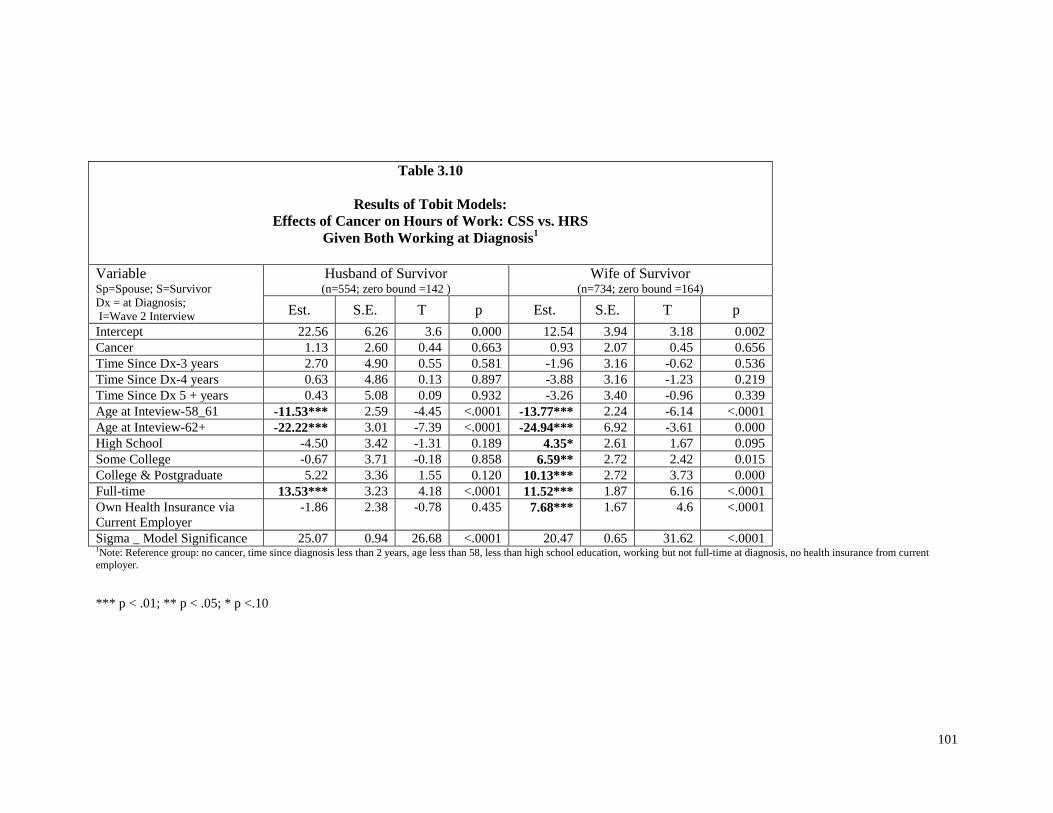
101
Table 3.10
Results of Tobit Models:
Effects of Cancer on Hours of Work: CSS vs. HRS
Given Both Working at Diagnosis1
Variable Sp=Spouse; S=Survivor
Dx = at Diagnosis;
I=Wave 2 Interview
Husband of Survivor (n=554; zero bound =142 )
Wife of Survivor (n=734; zero bound =164)
Est. S.E. T p Est. S.E. T p
Intercept 22.56 6.26 3.6 0.000 12.54 3.94 3.18 0.002
Cancer 1.13 2.60 0.44 0.663 0.93 2.07 0.45 0.656
Time Since Dx-3 years 2.70 4.90 0.55 0.581 -1.96 3.16 -0.62 0.536
Time Since Dx-4 years 0.63 4.86 0.13 0.897 -3.88 3.16 -1.23 0.219
Time Since Dx 5 + years 0.43 5.08 0.09 0.932 -3.26 3.40 -0.96 0.339
Age at Inteview-58_61 -11.53*** 2.59 -4.45 <.0001 -13.77*** 2.24 -6.14 <.0001
Age at Inteview-62+ -22.22*** 3.01 -7.39 <.0001 -24.94*** 6.92 -3.61 0.000
High School -4.50 3.42 -1.31 0.189 4.35* 2.61 1.67 0.095
Some College -0.67 3.71 -0.18 0.858 6.59** 2.72 2.42 0.015
College & Postgraduate 5.22 3.36 1.55 0.120 10.13*** 2.72 3.73 0.000
Full-time 13.53*** 3.23 4.18 <.0001 11.52*** 1.87 6.16 <.0001
Own Health Insurance via
Current Employer
-1.86 2.38 -0.78 0.435 7.68*** 1.67 4.6 <.0001
Sigma _ Model Significance 25.07 0.94 26.68 <.0001 20.47 0.65 31.62 <.0001 1Note: Reference group: no cancer, time since diagnosis less than 2 years, age less than 58, less than high school education, working but not full-time at diagnosis, no health insurance from current
employer.
*** p < .01; ** p < .05; * p <.10
102
CHAPTER FOUR
WHAT IS THE EFFECT OF CANCER ON TIME-TO-RETIREMENT?
Abstract
Background. Cross-sectional methods may not detect cancer effects on retirement. The selected
time period may occur after the effects have happened. Since retirement decisions unfold over
time, changes in the time-to-retirement carry economic and social consequences for individuals.
Data. A sample of older cancer survivors from the Penn State Cancer Survivor Survey was
identified from Wave 1 and compared to a sample with non-cancer individuals of similar ages
from the Health and Retirement Study in Round 5 (2000). Cancer, socio-demographic, and job-
related characteristics were included to measure effects on the time-to-complete-retirement.
Study design. A longitudinal approach used logistic regression to measure the likelihood of
completely retiring compared to a control group of persons without a history of cancer. Monthly
observations were created for cancer, recurrence, socio-demographic, and job-dependent benefits,
including health insurance and pensions. Data were tracked from diagnosis date until lost to
follow-up, or until the event, complete retirement, or the end of the study period in 2004.
Principal findings. Cancer-free men and women are less likely to retire completely and
continued to work compared to men and women with no history of cancer. Recurrence increases
the likelihood of retiring sooner for women with cancer compared to women with no history of
cancer.
Conclusions. Overcoming economic losses from cancer may require individuals to work longer
than they otherwise might if they had no history of cancer. Recurrence can pose a threat to
economic recovery or the sense of fulfillment from a job – a loss upon loss. Longitudinal
methods are necessary for decisions like retirement that unfold over time.

103
Background
The employment of cancer survivorship has been studied at different points in the
lifetime continuum or ―seasons of cancer‖ (Mullan, 1985). The studies have contributed to our
knowledge of employment patterns from the time of diagnosis through the treatment period up to
long-term survivors (Bouknight, Bradley, & Luo, 2006; Bradley, Neumark, Bednarek, & Schenk,
2005; Short, Vasey, & Tunceli, 2005). While a diagnosis of cancer may occur at any age, the
incidence of cancer in persons aged 50 or more at diagnosis is substantially higher than under the
age of 50. In 2005, the age-adjusted incidence rate for all cancers under age 50 was 95 cases per
100,000 persons compared to 1,382 cases per 100,000 persons for those 50 or older (National
Cancer Institute, 2005). As the incidence of cancer and its risk rise with age, the health shock
from cancer may increasingly occur in the context of a retirement decision.
Cancer in the period just before retirement has implications for both cancer survivor and
society. Does cancer for older survivors (50-64) accelerate or delay retirement compared to
cancer-free persons? There are important economic consequences to this decision. If cancer
survivors retire sooner, they may have less saved for the post-retirement period than they had
planned (Jefferson, 2007; Johnson, Mermin, & Murphy, 2007). In addition, society suffers the
loss of their economic contributions. However, if cancer survivors retire later, they may increase
their savings for retirement or continue working as a hedge against uncertain future medical costs.
The individual decisions to work longer until complete retirement contribute important economic
and social benefits to society (Butrica, Smith, & Steuerle, 2006).
While health has been linked to retirement decisions, the retirement literature has not
focused specifically on cancer. Health has been broadly defined by a variety of measures.
Measures of health have included self-reported health status, activities of daily living (ADL), and
the presence of any number of chronic diseases, but with no specific focus on cancer (Bound,
1989; Bound, Schoenbaum, Stinebrickner, & Waidmann, 1998; Coile, 2004; Costa, 1994;
Kerkhofs, Lindeboom, & Theeuwes, 1999; Smith, 2003; Larsen & Gupta, 2007). It is impossible

104
to answer questions about the effect of cancer on retirement given the limitations in the current
retirement literature.
Alternatively, the cancer survivor literature has addressed the work choices of older
survivors across the stages of cancer survivorship. Studies have spanned the treatment period
(Bouknight, Bradley, & Luo, 2006), longer-term cancer survivors in post treatment (Bradley &
Bednarek, 2002; Bradley, Bednarek, & Neumark, 2002a; Bradley, Bednarek, & Neumark, 2002b;
Bradley, Neumark, Bednarek, & Schenk, 2005; Bradley, Neumark, Luo, & Bednarek, 2005;
Drolet et al., 2005; Short, Vasey, & Tunceli, 2005), and older cancer survivors nearing retirement
(Bednarek & Bradley, 2005; Short, Vasey, & Moran, 2008).
A major limitation of the cancer survivor literature is the absence of studies that
emphasize retirement as the focal decision. The current body of research has focused mainly on
work status, not specifically on retirement, and has usually relied on cross-sectional instead of
longitudinal data and methods. Cross-sectional methods may miss effects over time because they
miss events that occurred before the designated study period. A thought experiment will illustrate
this. Imagine that most people retire at age 65. If a cross-section was taken at age 66, one would
find little difference in employment between cancer survivors and other individuals. Any
retirement because of cancer could have occurred before this age. It would have been lost in the
noise created by the large wave of retirements prior to age 65. One might conclude that cancer
had no employment effect. However, the employment effect of cancer can be measured by
whether it accelerates or delays retirement. A longitudinal approach tracks an individual over
multiple slices of time and is more likely to detect events.
The purpose of this paper is to answer a key question about the retirement behavior of
cancer survivors from the time of diagnosis through several years afterwards. Are older cancer
(aged 50-64) survivors more likely to ―retire completely,‖ sooner or later, than persons without
cancer? This paper contributes to the cancer survivor literature in two ways. First, it specifically
focuses on the impact of cancer on the time to complete retirement. Second, it provides a

105
complementary framework to existing cross-sectional study results. Multiple perspectives
increase the reliability of assessments of cancer survivor behavior. The information may be used
to help plan for retirement with a better understanding of the risks and consequences of cancer for
individual welfare. It will also inform public policy makers about growing needs and potential
work contributions of cancer survivors as they live longer with a chronic disease.
Conceptual Model
Older cancer survivors, like other individuals, allocate their time between work life and
retirement. From the perspective of the traditional labor supply model, modified to include the
effects of health, they must decide if the utility of retirement is greater than the utility of
continuing to work (McGarry, 2002). In making this decision, there are practical dimensions
including uncertainty over the adequacy of savings to supplement consumption in the retirement
period and the prospect of increasing medical expenditures as their health declines (Smith, 2003).
One of the prime events that may influence the ability to earn income and save for retirement is
the occurrence of cancer later in life. These years are often considered to be the prime earning
years. They are particularly important because they represent an opportunity to save for
retirement. Cancer may increase the uncertainty about future medical expenditures and alter the
value that individuals assign to leisure time. While the desire to increase savings from income
may influence individuals to continue working as a hedge against future consumption, individuals
may also substitute leisure for work if their work-leisure preferences have changed with the shock
of an illness like cancer (Becker, 1965; Berger, 1983; Berger & Pelkowski, 2004; Kalemli-Ozcan,
& Weil, 2002).
Traditional views of retirement as a singular and one-time event are challenged by
growing evidence of retirement as a process of many events and decisions (Figure 4.1).
Retirement may be an initial one-time choice or it may be the result of a gradual process of
slowly withdrawing from the labor force by reducing effort via changing jobs, working fewer

106
hours, or shifting to part-time work (Cahill, Giandrea, & Quinn, 2008; Taylor, 2007; De Vaus,
Wells, Kendig, & Quine, 2007; Moen, 2007). Subsequent to that initial choice, retirees may
return to the labor force in a reverse process of some degree of labor force attachment.
There is a first time for the complete retirement event (Gustman, Mitchell, & Steinmeier,
1995). If cancer accelerates the timing of that choice, cancer survivors may enter retirement with
inadequate savings and income when they face potentially greater medical expenses. Cancer may
delay the timing of retirement, if cancer survivors continue to work because they are worried
about losing benefits or income to pay medical and other bills.
Cancer effects on retirement may increase the likelihood of retiring sooner or later than
persons without cancer. A cancer survivor compares the utility from retirement to the utility of
continuing to work. If the value (utility) of his or her remaining leisure time increases, he or she
may choose to stop working and retire (Short, Vasey, & Moran, 2008). Alternatively, cancer
survivors may place less value on their remaining leisure time and continue working to provide
income in future periods or because working provides psychic benefits (Bradley, Bednarek, &
Neumark, 2002b).
In addition to cancer, other covariates affect retirement decisions. One event that is
unique to cancer survivors is recurrence, which is the spread of an existing cancer to distant sites,
or the occurrence of a new cancer. Recurrence may affect the timing of retirement. It may
accelerate the event if its affect on an individual’s life expectancy leads to increasing the value of
his or her remaining leisure time (Short, Vasey, & Moran, 2008). Alternatively, a cancer survivor
may delay retirement because he or she gains utility from a sense of ―making a contribution‖ with
his or her remaining time and health (Bradley, Bednarek, & Neumark, 2002b).
Increasing age may raise the likelihood of retiring because of the availability of financial
support from Social Security, defined benefit pension plans, and 401(k) plans. Alternatively,
increasing age may not increase the likelihood of complete retirement, if older workers preference
for work and leisure change with time and yield more utility from working instead of retiring.

107
Chronic diseases may affect the ability of cancer survivors to continue working and may
accelerate the decision to retire. The increasing burden and cumulative impact of several chronic
diseases may tip the comparison of utility from working to more utility from leisure due to the
effort required to work when in poor health (Becker, 1965; Short, Vasey, Tunceli, 2005).
Marital status may increase the likelihood of retiring because of resources like extra
income, pensions, or an alternative source of health insurance that is unavailable to single
persons. Alternatively, marriage may decrease the likelihood of retiring since an individual may
work to increase savings to support a spouse and pay for uncertain medical expenditures (Berger
& Pelkowski, 2004; Coile, 2003).
Effects of social and economic disparities may be captured in racial and ethnic variables.
In the case of discrimination or disparities, individuals may be forced to delay retirement to build
savings for the post-retirement period due to lower wages over their working lives. Alternatively,
Social Security and Medicare benefits may offer more incentive to retire, since they may reduce
some of the inequality in the post-retirement period.
Higher levels of education are associated with greater income, benefits, and perhaps less
physically-demanding jobs, which combined may increase the likelihood of delaying retirement.
However, the greater life-time income and benefits afforded by educational attainment may
provide income in the post-retirement period through savings made possible by the higher
education. This may accelerate retirement (Short, Vasey, Tunceli, 2005).
The greater physical demands of work may lead to earlier retirement. The amount of
effort to provide a marginal hour of labor may be relatively large for a cancer survivor who
suffers from the side effects of treatment or late effect of cancer. Consequently, leisure time
becomes more attractive (Short, Vasey, Tunceli, 2005).
Full-time work may lengthen the time to retirement since it provides more income,
benefits, and opportunities for socialization than part-time work. Alternatively, the accumulation

108
of savings made possible by the income and benefits of a full-time job may make earlier
retirement possible.
Self-employment may increase the time to retirement, since self-employed individuals
may not have the income or benefit package available to those who work for someone else. In
particular, self-employed individuals may have sustained significant income losses during
treatment and must continue to work to recoup that lost income for future retirement.
Individuals with health insurance based on employment may retire later, since this health
insurance is a protection against the risk of unexpected medical costs (Bradley, Bednarek,
Neumark, 2002a). Alternatively, if an employer’s health benefit package is available to retirees,
this may accelerate retirement decisions.
The availability of retirement benefits may reduce the length of time to retirement if the
benefit package offers accumulation of large sums before retirement. On the other hand,
retirement benefit packages that create a large portion of post-retirement income based on the last
few years of salary or wages provide incentives to delay retirement.
The time since diagnosis may affect retirement decisions. A cancer survivor may have
had more or less time to make adjustments at work, which now offers more or less utility than
retirement. Part of that adjustment process may include a change in preferences for work and
leisure.

109
Methods
In order to control for secular changes in factors and economic conditions which may
affect the time-to-first complete retirement outcome for older cancer survivors, this paper used a
control sample of cancer-free individuals taken from the Health and Retirement Study (HRS)
sample, RAND H, Round 6. The control sample is the reference for the effect of cancer on the
time to first complete retirement in the Penn State Cancer Survivor Study (PSCSS) sample. Since
this paper focuses on the timing of the first retirement choice, there are three selection criteria
common to both samples: the individual must be born in the years 1936 through 1947, working
at the time of diagnosis, and has not retired at any time prior to this diagnosis. The birth year
requirement ensures that both control and cancer samples include persons aged 50 through 64, the
year prior to the age for qualification for full Social Security benefits (Figure 4.2).
The ―time-to-complete retirement – the first time‖ outcome depends on survey responses
to questions for the PSCSS and HRS. For the PSCSS cancer survivors, complete retirement was
operationalized by responses to two questions. First, complete retirement candidates were
determined by responses to either of two questions: (1) ―Are you working for pay, temporarily
laid off or on leave, unemployed and looking for work, retired, disabled and unable to work, a
homemaker, a student or something else?‖ and (2) ―Are you doing any work for pay at the present
time?‖ Second, the survey responses from Waves 1 through 4 were examined for the ―first time a
cancer survivor reported that he or she had retired and were not doing any work for pay.‖ The
month and year of this event were recorded from responses to the question: ―In what month and
year did you retire?‖ For the HRS sample, complete retirement was indicated by the responses to
the question: ―At this time, do you consider yourself to be completely retired, partly retired, or
not retired at all?‖ Rounds in HRS were searched for the first response to this question
(SAYRET variable in the HRS data set), and the month and year were recorded by responses to
this question: ―In what month and year did you retire?‖

110
Samples
The cancer survivors in this study were originally identified in the first wave of the Penn
State Cancer Survivor Study (PSCSS) which has been described in detail by Short, Vasey, &
Tunceli (2005). The study eligibility criteria included: (1) cancer survivors between the ages of
25 and 62 at diagnosis, (2) with a first cancer diagnosed between January 1997 and December
1999, and (3) with a prognosis that would permit participation over four waves in the panel
survey. Survivors were recruited from cancer registries at The Johns Hopkins Hospital, Lehigh
Valley Hospital and Health Network, Geisinger Medical Center, and Milton S. Hershey Medical
Center. The first wave of interviews at annual intervals was conducted from October 2000 into
December 2001. Thereafter, panel participants were interviewed in subsequent annual waves
from 2002 through 2004.
The final PSCSS sample includes 584 cancer survivors aged 51-64 with 196 observed
retirement events (33.6%). Each person contributes information up to the point in time he or she
is no longer observed or reaches the end point for the survey, which is the Wave 4 interview date
in the PSCSS observation. The PSCSS cancer survivors represent a total of 30,085 person-months
in the study period.
The Health and Retirement Survey (HRS) is a panel survey that began in 1992 under the
auspices of the University of Michigan. It enrolls a sample of persons at age 51 and follows them
through time with interviews at two-year intervals. Questions about employment, retirement,
and health are framed as ―What has changed since the last interview?‖ This paper uses
information from HRS Waves 1 through 8 (1992-2006). HRS Waves prior to the study period
(2000-2004; Waves 1-4) and after the study period (Wave 8 - 2008) were reviewed for references
to cancer, last dates of employment, and the timing of retirement events. The objective of this
review was to select control cases that met the following criteria: no evidence of cancer,
employed at baseline, and the first retirement date after baseline. HRS Waves 5 through 7
(2000-2004) parallel Waves 1-4 in the PSCSS (2000-2004) over the study period.

111
Observations were selected from Wave 5 (2000) since this HRS wave approximates the
baseline period in Wave 1 PSCSS period (1997-1999). The time-to-event analysis requires the
same starting date between cancer and control cases. Since there is no date of diagnosis
(baseline) date in the HRS sample, one must be imputed. Therefore, a ―pseudo-baseline‖ date was
created using a method found in prior cancer survivorship studies using control groups (Bradley,
Bednarek, & Neumark, 2002b; Short, Vasey, & Moran, 2008). The diagnosis date for the PSCSS
cases is the starting point or ―baseline date‖ for linked HRS observations. To assign a baseline
date to HRS cases, comparable to the date of diagnosis in PSCSS, HRS cases were randomly
assigned the diagnosis date of a case in the PSCSS samples (with replacement and separately by
gender).Based on the previously specified inclusion criteria and, after cancer survivors were
excluded from the HRS, the final HRS sample included 2,447 persons. There were 1,093 first
retirement events over the study period, which was 44.7% of the initial sample. The observations
represent 135,698 person-months.
The sample characteristics for the PSCSS and HRS are described in Table 4.1 and
differences are noted at the Chi-square .05 level. While the retirement percentages are similar of
males (40.5 PSCSS; 42.8 HRS), there is a statistically significant difference in female retirement
rates between the cancer and control samples (29.0 PSCSS; 46.8 HRS). This may be due to the
age differences between the samples. The distribution of ages for females shows that almost half
(44.5%) of the PSCSS observations are less than 55 years of age, while about a quarter of the
HRS cases are in the same age group (27.8%). The two samples were statistically different in the
proportion of non-white observations, with the cancer group showing much less diversity in
percentage composition for males (3.9 PSCSS; 14.6 HRS) and females (8.0 PSCSS; 22.3 HRS).
The proportion of married individuals was greater in the PSCSS sample compared to the HRS.
However, in comparing differences by gender, the rate difference for males was not statistically
significant (88.4 PSCSS; 87.8 HRS), while the difference was significant for females (74.7
PSCSS; 62.9 HRS). Educational differences were significant for both males and females in the

112
PSCSS sample compared to the HRS. There is a higher proportion of males (39.7 PSCSS; 30.3
HRS) and females (33.5 PSCSS; 21.6) in the PSCSS sample who have completed college degrees
or post-graduate degrees. The type of job that implies greater physical requirements (―blue
collar‖) occurs in larger proportion among the HRS observations. Both males (28.9 PSCSS; 49.8
HRS) and females (11.4 PSCSS; 28.8 HRS) in HRS are found more often in ―blue collar‖ jobs.
HRS individuals were more likely to be working full-time for males (91.0 PSCSS; 93.4 HRS)
with statistically significant differences for females (71.0 PSCSS; 78.1 HRS). There are no
statistically significant differences for self-employed individuals between the samples for males
(19.8 PSCSS; 20.1 HRS) or females (14.5 PSCSS; 11.9 HRS). With regard to any retirement
benefit (defined benefit or defined contribution), a greater proportion of males in the PSCSS
sample (75.9%) have benefits compared to HRS individuals (67.2%) and this difference is
statistically significant. The difference between samples for females is not significant (64.2
PSCSS; 64.2 HRS). Given health insurance benefits from a current employer, the HRS sample
had greater proportions for males with that benefit (59.9 PSCSS; 65.4 HRS) and a statistically
significant greater proportion among females (46.0 PSCSS; 62.5 HRS).
While the attrition rates are similar between genders, they differ by survey (Table 4.2).
The attrition on a percentage basis is slightly greater for females than for males in the HRS
survey. The percentage of the original number of participants who were engaged in all four waves
was 64.1% for males and 62.3% for females. The rate of attrition was higher in the PSCSS
survey. Only 43.1% of males participated in all 4 waves compared to 49.4% for females. The
rates of attrition are lower for the HRS survey with 35.9% of males and 37.7% of females in the
HRS who were lost to follow-up over the four waves. The higher rates of attrition were in the
PSCSS survey with 56.9% of males and 50.6% of females lost in the study period. The attrition
rates included all cases lost to follow-up over the baseline interview for whatever cause. Reasons
vary from death, to inability to locate, and to simply refusal to participate.

113
Variables
The date of the first complete retirement is critical for the construction of the time to first
and complete retirement. Retirement events were recorded in response to questions on both the
PSCSS and HRS survey instruments that ask if the respondent has retired since the last wave
interview and, if so, when (month, year). Responses were recorded as ―retired first time‖ if the
associated date indicated that this event occurred after the baseline date (diagnosis date). For
PSCSS individuals, the baseline date is the date of cancer diagnosis, while linked HRS
observations use the same baseline date as a reference point to determine if HRS responses are
valid (i.e., retirement dates on or after the baseline date). The HRS date of first retirement was
constructed by finding the date of first retirement and cross-referencing to other variables about
whether retirement was complete or partial. Only cases that were recorded as complete were
retained for this study.
The response variable is the number of days between the two dates. The days were
converted to months for the statistical analysis. For those who retired during the study period, the
number of days was the first retirement date less the baseline date. Those who did not retire
during the study period were censored observations, either because we did not observe the
retirement event due to dropping out of the study or the event had not yet occurred by the end of
the study period. For censored observations, the number of days was measured by the last
observed date less the baseline date (which is the date of diagnosis for the PSCSS individuals and
the ―pseudo-date‖ of diagnosis for the HRS individuals). Each person contributed ―person-
months‖ according to the length of time in which they were observed in the study period.
Since each person was measured in terms of person-months until an event, we are
interested in the average length of time until an individual retires after a cancer diagnosis and
what factors might explain the length of time to the retirement event. How long individuals with
cancer continue working compared to a reference control group is an indication of the effect of
cancer on retiring sooner or later.

114
There are three sets of control variables: cancer-related, person, and job. In addition to
the direct effect of cancer on the elapsed time to first retirement, there may be an effect from a
cancer-related condition, recurrence – a new cancer or the spread of an existing cancer.
Recurrence may accelerate the retirement effect of the original cancer diagnosis as leisure time
becomes more valuable with the diminished expectations about life expectancy. On the other
hand, recurrence may delay retirement if an individual continues working to avoid the income
loss in the face of uncertain future medical expenses or consumption levels, which may affect the
individual or family members. Recurrence is a time-varying variable and was recorded in the
month since diagnosis in which it happens. Survey responses must indicate the date (month, year)
that a new cancer occurred or that the original cancer had spread. The month and year were
converted to a month since baseline in which this recurrence occurred. Once recurrence occurred,
the monthly binary variable was set equal to 1 to indicate the potential effects of recurrence over
time.
The person-related variables include time-varying age and chronic medical conditions,
and time-invariant variables like marital status, race, and the level of educational attainment.
Person-related time-invariant variables were measured at diagnosis. Time-varying variables were
measured at each wave. Age was incremented for each month. Other time-varying variables were
kept at a constant value in the months between waves and changed only at wave interview
intervals.
Age was calculated using birthdates from the registries for the PSCSS individuals and the
birth date supplied on the survey for HRS respondents. Age was grouped in the regression model
into categories as persons aged over the course of the study period: less than 60, 60-61, 62, 63-
64, and 65 and older. The lowest age group is the reference category. Marital status is a binary
variable with 1 indicating married and 0 not married. Information about race was dichotomized
as non-white =1 and white=0. The education variable measured the highest level attained, and it

115
was categorized into less than high school, high school, some college, and college or post-
graduate. Less than high school is the reference category.
The job context variables included the physical nature of the work, full-time, self-
employed, source of health insurance, and any retirement benefits. All are time-invariant
variables with initial values determined at baseline.
The physical nature of the work is represented by dichotomizing the occupation code
(BLS Occupational Codes) of the survivor into a physically-demanding type job (yes=1, no=0).
Full-time work was defined by working 35 or more hours at diagnosis for PSCSS respondents.
Respondents who reported weekly hours of 35 or more hours were coded as 1, otherwise, 0. For
HRS individuals, full-time work was a response to a survey question about working full-time or
part-time. HRS respondents were coded as 1 for a response of full-time work, otherwise 0. Self-
employment is a binary variable based on survey questions that ask if the respondent is working
for someone else (1= yes; 0= no). The source of health insurance was dichotomized by whether
or not the cancer survivor has his or her own coverage with a current employer at baseline. If a
person’s own health insurance benefit was contingent on working for a current employer, the own
health insurance was coded as 1, otherwise, 0. Any retirement benefit is a binary variable. It was
set equal to 1, if the survivor reports having a defined benefit pension plan, defined contribution
like a 401(k), or both at baseline. Otherwise, lacking a reported retirement benefit, it was coded
as 0. Time since diagnosis is a time-varying variable which was measured continuously as
months since diagnosis. Since the effect of the passage of time may be nonlinear, the concept of
time since diagnosis was captured by using two variables in the regression model – time since
diagnosis and years since diagnosis squared since this relationship may be non-linear.

116
Statistical Analysis
Time-to-event models with discrete measurements may be estimated using standard
logistic regression techniques (Allison, 1995; Singer & Willett, 2003). Since the retirement
literature commonly treats male and female retirement choices separately, this paper follows a
similar approach and estimates separate multivariate logistic regression models for the odds ratio
(OR) of the independent variables with results reported up to the .10 level. SAS version 9.3 was
used in all statistical tests. The full effect of cancer includes the cancer and the recurrence
variable. A Wald test was performed to determine if the combined coefficient was statistically
significant.
Results
Separate multiple logistic regression models are estimated for male and female cancer
survivors in Table 4.3 and Table 4.4. The models estimated the association between cancer and
covariates on the likelihood of retiring completely for the first time over the post-diagnosis
period, compared to a control without cancer in the study period. Cancer and its recurrence form
the base specification (Model I), cancer and person characteristics follow, (Model II), and the full
model specification includes cancer, person, and job characteristics (Model III).
Male Cancer Survivors
The Model III column in Table 4.3, the full specification form of the model, contains the
estimated parameters for the three groups of variables and their 95% confidence interval. Cancer-
free survivors were less likely to retire completely (OR=.529; 0.408, 0.686) and hence, retire later
than individuals without cancer. The marginal effect of recurrence alone on the log odds of the
likelihood of retiring were not significant (OR=0.965; 0.461, 2.021). However, the combination
of coefficients for cancer and recurrence was significant at the .10 level (p =0.065) and suggests
that cancer survivors with recurrence are more likely to retire, compared to cancer-free survivors
117
without recurrence and individuals without cancer. Cancer-free male cancer survivors retire later,
but recurrence leads to earlier retirement.
Aging increases the likelihood of retiring compared to individuals under age 60. Age
categories were consistently associated with retiring (p <.01). The odds ratios range ranged from
1.58 to 4.76. As time since diagnosis passed, a cancer survivor was more likely to retire
(OR=1.03; 1.015, 1.045). A cancer survivor working with a defined benefit plan at diagnosis was
more likely to retire (OR=1.409; 1.098, 1.807). Cancer survivors were less likely to retire with a
full-time job (OR=0.678; 0.503, 0.914), if self-employed (OR=0.56; 0.416, 0.753), or with job-
dependent insurance from a current employer (OR=0.651; 0.525, 0.806).
Female Cancer Survivors
The combined coefficient effect of cancer (OR=0.323; 0.247, 0.423) and recurrence
(OR=1.57; 0.906, 2.722) was significant (p =0.009). This suggests that the combined effect may
be small and its direction is unclear, since the magnitudes and signs of the resulting odds ratio are
opposites.
Cancer-free survivors were less likely to retire completely (OR=0.323; 0.247, 0.423), and
hence, retire later than individuals without cancer. The marginal effect of recurrence alone on
the log odds of the likelihood of retiring were not significant (OR=1.57; 0.906, 2.722).
However, the combination of coefficients for cancer and recurrence was significant at the .01
level (p =0.009) and suggests that cancer survivors with recurrence are more likely to retire,
compared to cancer-free survivors without recurrence and individuals without cancer. Cancer-
free female cancer survivors retire later, but recurrence leads to earlier retirement.
Cancer survivors were more likely to retire with age (p <.01). This effect was consistent
across the age categories with odds ratios from 1.525 to 3.246. Time since diagnosis (OR=1.014;
0.999, 1.028), and any type of pension plan like defined benefit (OR=1.676; 1.279, 2.195),
defined contribution (OR=1.325; 1.024, 1.714), or a combination of both (OR=1.9; 1.355, 2.664)
118
also made earlier retirement more likely. A cancer survivor was less likely to retire if he or she
had some college (OR=0.722; 0.544, 0.959), or his or her own health insurance policy through a
current employer (OR=0.643; 0.52, 0.794).
Discussion
Cancer-free cancer survivors are those who have survived since diagnosis without recurrence
(i.e., spread of the original cancer to a new site or return of an old cancer). Cancer-free survivors
are less likely to retire sooner than older individuals without cancer. The cancer-free survivors
continue to work and delay retirement. Some of the model factors that are significant offer clues
to working longer – the employer-sponsored health insurance for men and women. Good pension
programs were negatively associated with longer durations until retirement. Furthermore, the
cancer-free survivors may work longer to recover income lost during treatment or life-time
income lost because cancer altered a career path. Their preference for the use of time may have
changed as they found a new source of fulfillment in working. What is clear is that recurrence
changes this trajectory. Cancer survivors with recurrence retire sooner. They lose the
opportunity to continue working and accrue the income, health insurance, pension benefits, and
perhaps personal fulfillment from working.
If job lock affects workers at the younger working ages, it may be at work with older
cancer survivors. It may, however, be more than health insurance. It may also reflect trying to
recover from economic costs of cancer. Cancer survivors were more likely to retire with the
availability of a rich benefits package. That package may more than compensate for any wage
losses during the treatment period or additional out-of-pocket costs over time.
In a study of employed older cancer survivors, Short, Vasey, & Moran (2008) found that
female survivors were less likely to be working 7-10 years post-diagnosis, while there was no
statistically significant difference for men. However, Bradley, Bednarek, & Neumark (2002b)
found that female breast cancer survivors worked more hours after returning to work. Both

119
studies were cross-sectional snapshots at a point in time post-diagnosis. A time-to-event
perspective, such as the approach used in this paper, follows an individual and measures the
hazard of retiring over that period compared to a similar control group. If the analysis reveals
that cancer survivors are more likely to retire, then estimates at the end-point in the cross-
sectional studies may be biased and underestimate the consequence of cancer in labor supply
adjustments over time.
One limitation of this study lies in its longitudinal design. A longitudinal study exposes
findings to attrition bias and a healthy survivor effect. Some of the attrition is normal in the
course of longitudinal surveys. The danger is that over time, the surviving sample becomes less
representative of the population of cancer survivors. Another limitation is that this study
examined only one aspect of a very complex concept like retirement. Future studies of cancer
survivors and retirement can add missing pieces like decisions involving a choice between full-
time or part-time work or changing jobs.
120
References
Allison, P.D. (1995). Survival analysis using SAS: a practical guide. Cary, NC: SAS Institute.
Becker, G.S. (1965). A theory of the allocation of time. The Economic Journal, 75(299), 493-517.
Bednarek, H.L, & Bradley, C.J. (2005). Work and retirement after cancer diagnosis. Research in
Nursing & Health, 28, 126-135.
Berger, M.C. (1983). Labor supply and spouse’s health: the effects of illness, disability, and
mortality. Social Science Quarterly, 64(3), 494-509.
Berger, M.C., & Pelkowski, J.M. (2004). Health and family labor force transition. Quarterly
Journal of Business and Economics, 43(3/4), 113-138.
Bouknight, R., Bradley, C. & Luo, Z. (2006). Correlates of return to work for breast cancer
survivors. Journal of Clinical Oncology, 24(3), 345-353.
Bound, J. (1989). Self-reported and objective measures of health in retirement models. National
Bureau of Economic Research Working Paper Series #2997, National Bureau of
Economic Research, Cambridge, MA.
Bound, J., Schoenbaum, M., Stinebrickner, T. R., Waidmann, T. (1998). The dynamic effects of
health on labor force transitions of older workers. National Bureau of Economic
Research Working Paper Series #6777, National Bureau of Economic Research,
Cambridge, MA.
Bradley, C.J. & Bednarek H. (2002). Employment patterns of long-term cancer survivors.
Psycho-Oncology, 11 (2002), 188-198.
Bradley, C.J., Bednarek H., & Neumark, D. (2002a). Breast cancer survival, work, and earnings.
Health Services Research, 37(5), 1309-1328.
Bradley, C.J., Bednarek H., & Neumark, D. (2002b). Breast cancer and women’s labor supply.
Journal of Health Economics, 21 (2002), 757-779.
Bradley, C.J., Neumark, D., Bednarek, H.L., & Schenk, M. (2005). Short-term effects of breast
cancer on labor market attachment: results from a longitudinal study. Journal of Health
Economics, 24(1), 137-160.
Bradley, C.J., Neumark, D., Luo, Z., & Bednarek, H.L. (2005). Employment-contingent health
insurance, illness, and labor supply of women: evidence from married women with breast
cancer. National Bureau of Economic Research Working Paper Series #11304, National
Bureau of Economic Research, Cambridge, MA.
Butrica, B.A., Smith, K.E., & Steuerle, C.E. (2006). Working for a good retirement. Center for
Retirement Research Working Paper CR R WP 2006-8, Boston College, Chestnut Hill,
MA.
121
Cahill, K.E., Giandrea, M.D., & Quinn, J.F. (2008). A micro-level analysis of recent increases in
labor force participation among older workers. Center for Retirement Research Working
Paper CR R WP 2008-8, Boston College, Chestnut Hill, MA.
Coile, C. (2003). Retirement incentives and couples retirement decisions. Topics in Economic
Analysis & Policy, 4(1), 1-28.
Coile, C. (2004). Health shocks and couples’ labor supply decisions. National Bureau of
Economic Research Working Paper Series #10810, National Bureau of Economic
Research, Cambridge, MA.
Costa, D. (1994). Health and labor force participation of older men, 1900-1991. National Bureau
of Economic Research Working Paper Series #4929, National Bureau of Economic
Research, Cambridge, MA
De Vaus, D., Wells, Y., Kendig, H., & Quine, S. (2007). Does gradual retirement have a better
outcome than abrupt retirement? Results from an Australian panel study. Aging &
Society, 27, 667-682.
Drolet M., Maunsell, E., Mondor, M., Brisson, C., Brisson, J., & Deschenes, L. (2005). Work
absence after breast cancer diagnosis: a population-based study. Canadian Medical
Association Journal, 173(7), 765-769.
Gustman, A., Mitchell, O., & Steinmeier, T. (1995). Retirement measures in the Health and
Retirement Study. The Journal of Human Resources, 30, S57-S83.
Jefferson, T. (2007). Discussing retirement: insights from a qualitative research project.
Australian Journal of Labour Economics, 10(2), 129-145.
Johnson, R.W., Mermin, G.B.T., & Murphy, D. (2007). The impact of late-career health and
employment shocks on social security and other wealth. Center for Retirement Research
Working Paper CR R WP 2007-26, Boston College, Chestnut Hill, MA.
Kalemli-Ozcan, S, & Weil, D. (2002). Mortality change, the uncertainty effect, and retirement.
National Bureau of Economic Research Working Paper Series #8742, National Bureau of
Economic Research, Cambridge, MA
Kerkhofs, M., Lindeboom, M., & Theeuwes, J. (1999). Retirement, financial incentives, and
health. Labour Economics, 6, 203-227.
Larsen, M., & N.D. Gupta. (2007). Identifying the impact of health on individual retirement plans
employing a wide array of measures. Employment and Labour Market Issues, Working
Paper 07:2007. Danish National Institute of Social Research.
McGarry, K. (2002). Health and retirement: Do changes in health affect retirement
expectations? NBER Working Paper 9317. Cambridge: National Bureau of Economic
Research.
Moen, P. (2007). Not so big jobs and retirements: what workers (and retirees) really want.
Generations, 31(1), 31-36.

122
Mullan, F. (1985). Seasons of survival: reflections of a physician with cancer. New England
Journal of Medicine, 313, 270-273.
National Cancer Institute (2005). SEER: Cancer Statistics – Age-Adjusted Incidence Rates 2000-
2005, Ages Under 50 and 50+. Retrieved from
http://seer.cancer.gov/faststats/selections.php#Output
Singer, J.D., & Willett, J.B. (2003). Applied longitudinal data analysis: modeling change and
event occurrence. New York: Oxford University Press.
Short, P.F., Vasey, J. J., & Moran, J.R. (2008). Long-term effects of cancer survivorship on the
employment of older workers. Health Services Research, 43(1), Part 1, 193-210.
Short, P.F., Vasey, J. J., & Tunceli, K. (2005). Employment pathways in a large cohort of adult
cancer survivors. Cancer, 103(6), 1292-1301.
Smith, J. P. (2003). Consequences and predictors of new health events. National Bureau of
Economic Research Working Paper Series #10063, National Bureau of Economic
Research, Cambridge, MA
Taylor, P. (2007). Older workers and the labor market: lessons from abroad. Generations, 31(1),
96-101.

123
Next Retirement Decision
- Re-entry
o Full-time v Part-time
- Retire
o Complete
o Partial
- Keep repeating cycle
Figure 4.1
Conceptual Model of Factors Which Affect the Retirement Decision
Health-Related Characteristics Over Time
- Cancer
- Years since Diagnosis
- Recurrence
- Number of Chronic Conditions
First Retirement Decision
- Impetus
o Voluntary
o Involuntary
- First Retirement
o Complete
o Partial
- Keep Working
o Full-time v Part Time
o Change Careers v Jobs
Socio-Demographic Characteristics
- Gender
- Age
- Education
- Race
- Marital Status
Job-Related Characteristics
- Self-employed
- Full-time status
- Health Insurance Source
- Retirement Benefits
- Wages

124
PSCSS
All Survivors at Wave 1
Interview
1763
PSCSS
All Survivors Working at
Diagnosis and First Retirement is
After Diagnosis
1335
PSCSS
Study Sample
Birth Years 1936-1947
584
30085 Person-Months
196 Retirement events
Figure 4.2
From Survey to Sample in Study
1936-1947 Birth Cohorts
HRS
All Respondents in RAND-H
30405
HRS
Birth Years 1936-1947
7862
HRS
Study Sample
No Cancer, Working at
Diagnosis, First Retirement after
Diagnosis
2447
135698 Person-Months
1093 Retirement events

125
Table 4.1
Characteristics of PSCSS and HRS Samples
Working at Diagnosis/Baseline
(Column Percents)
(*Chi-Square .05, M =Difference in Males between Surveys; F = Difference in Females between Surveys)
Males Females
Characteristic CSS
(n=232)
HRS
(1313)
CSS
(n=352)
HRS
(n=1134)
Age Group at Diagnosis M,F
Less than 55 40.1 30.5 44.9 27.8
55-59 36.6 50.7 40.1 52.9
60-61 19.4 16.2 11.1 16.3
62+ 3.9 2.7 4.0 3.0
Total
100 100 100 100
Race M,F
White 93.5 85.4 90.1 77.7
Non-White 3.9 14.6 8.0 22.3
Missing 2.6 2.0
Total 100 100 100 100
Married F
Single 11.6 12.2 25.3 37.0
Married or Partner 88.4 87.8 74.7 62.9
Missing 0.2
Total 100 100 100 100
Education M,F
Less Than HS 31.5 29.3 35.2 33.2
High School 7.3 21.3 7.4 19.2
Some College 19.0 19.0 21.9 26.0
College & Post-grad 39.7 30.3 33.5 21.6
Missing 2.6 0.2 2.0
Total 100 100 100 100
Physical Occupation M,F
No 71.1 49.6 88.1 69.8
Yes 28.9 49.8 11.4 28.8
Missing 0.6 0.6 1.4
Total 100 100 100 100

126
Table 4.1 (cont.)
Characteristics of PSCSS and HRS Samples
Working at Diagnosis/Baseline
(Column Percents)
(*Chi-Square .05, M =Difference in Males between Surveys; F = Difference in Females between Surveys) Males Females
Characteristic CSS
(n=232)
HRS
(1313)
CSS
(n=352)
HRS
(n=1134)
Fulltime Employment F
No 6.9 6.6 26.7 21.8
Yes 91.0 93.4 71.0 78.1
Missing 2.2 0.1 2.3 0.1
Total 100 100 100 100
Self-employed
No 80.2 79.7 85.2 87.7
Yes 19.8 20.1 14.5 11.9
Missing 0.2 0.3 0.4
Total 100 100 100 100
Any Retirement Benefit M
No 23.7 32.1 34.9 34.8
Yes 75.9 67.2 64.2 64.2
Missing 0.4 0.8 0.9 1.0
Total 100 100 100 100
Own Employer-Contingent
Health Insurance F
No 38.4 34.4 52.0 37.4
Yes 59.9 65.4 46.0 62.5
Missing 1.7 0.2 2.0 0.1
Total 100 100 100 100
Time Since Diagnosis to Wave1
Lt 1 Year 9.5 7.7 6.3 7.3
1-2 Years 29.3 28.1 27.6 25.8
2-3 Years 34.9 35.6 30.4 32.6
4 or more Years 26.3 28.6 35.8 34.3
Total 100 100 100 100
Retire in Post Diagnosis Period
Through Wave4F
No 59.5 57.2 71.0 53.2
Yes 40.5 42.8 29.0 46.8
Total 100 100 100 100
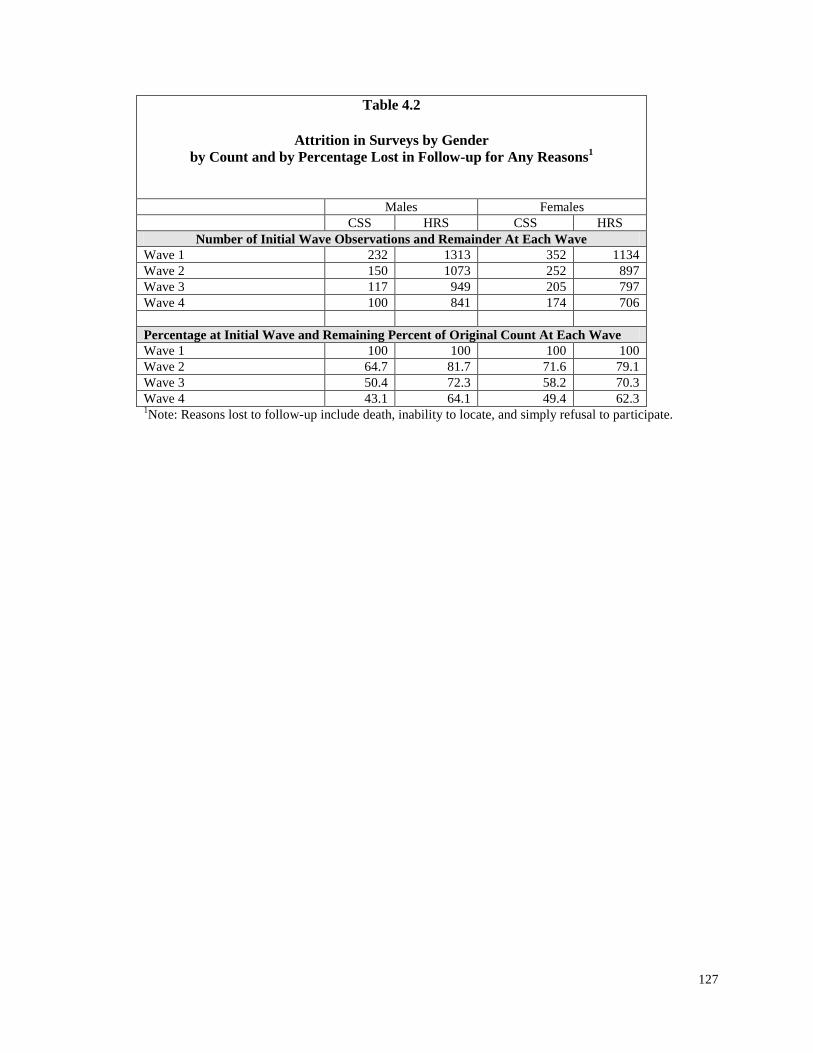
127
Table 4.2
Attrition in Surveys by Gender
by Count and by Percentage Lost in Follow-up for Any Reasons1
Males Females
CSS HRS CSS HRS
Number of Initial Wave Observations and Remainder At Each Wave Wave 1 232 1313 352 1134
Wave 2 150 1073 252 897
Wave 3 117 949 205 797
Wave 4 100 841 174 706
Percentage at Initial Wave and Remaining Percent of Original Count At Each Wave
Wave 1 100 100 100 100
Wave 2 64.7 81.7 71.6 79.1
Wave 3 50.4 72.3 58.2 70.3
Wave 4 43.1 64.1 49.4 62.3 1Note: Reasons lost to follow-up include death, inability to locate, and simply refusal to participate.

128
Table 4.3
Adjusted Odds Ratios for Factors Associated with Time Until First Retirement
Self-Reported Completely Retired; Excludes Partially Retired Males: CSS Survivors v. HRS Controls
1
(*** p<.01; **p<.05; *p<.10, n=40,482 person-months)
Variables Model I
Cancer-
Related
Lower
95%
CI
Upper
95% CI Model II
Person-Related
Lower
95%
CI
Upper
95% CI Model III
Job-Related
Lower 95%
CI
Upper
95% CI
Cancer- Dx 0.426*** 0.334 0.426 0.518*** 0.403 0.667 0.529*** 0.408 0.686
Recurrence 1.032 0.496 1.032 0.93 0.445 1.944 0.965 0.461 2.021
Ages 60-61 1.581*** 1.272 1.966 1.577*** 1.267 1.964
Age 62 4.761*** 3.816 5.939 4.932*** 3.946 6.165
Ages63-64 1.905*** 1.441 2.518 1.987*** 1.498 2.635
Ages 65 and older 3.395*** 2.376 4.85 3.513*** 2.436 5.066
Nonwhite - Dx 1.155 0.905 1.474 1.099 0.86 1.405
Married - Dx 0.993 0.784 1.259 0.958 0.755 1.216
High school - Dx 1.062 0.845 1.336 1.069 0.849 1.347
Some College - Dx 0.961 0.742 1.245 0.97 0.74 1.271
College & More - Dx 1.026 0.809 1.302 1.093 0.825 1.447
Chronic Cond. (Count.) 1.073 0.979 1.176 1.073 0.979 1.176
Time since Dx (month) 1.028*** 1.014 1.043 1.03*** 1.015 1.045
Physically job - Dx 1.104 0.901 1.353
Fulltime Job - Dx 0.678** 0.503 0.914
Self-employed - Dx 0.56*** 0.416 0.753
Own Employer Health
Insurance – Dx
0.651*** 0.525 0.806
Defined Benefit - Dx 1.409*** 1.098 1.807
Defined Contribution - Dx 0.871 0.679 1.117
Both Benefit & Contribution 1.195 0.885 1.614
Test -2 Log L Chi-Sq P-value -2 Log L Chi-Sq P-value -2 Log L Chi-Sq P-value
Cancer + Recurrence 5.2663 0.022** 4.0852 0.043** 3.415 0.065*
Model Fit 6433.786 50.45 <.0001 6147.628 358.78 <.0001 6102.509 402.2387 <.0001 1Note: Reference group includes age less than 60, less than high school education, white, single, job without physical demands, part-time work, working for someone else, health insurance from source other than employer at diagnosis, no employer-sponsored retirement benefit (defined benefit like pension or defined contribution like 401(k)).

129
Table 4.4
Adjusted Odds Ratios for Factors Associated with Time Until First Retirement
Self-Reported Completely Retired; Excludes Partially Retired Females: CSS Survivors v. HRS Controls
1
(*** p<.01; **p<.05; *p<.10, n=45,443 person-months)
Variables Model I
Cancer-
Related
Lower 95%
CI
Upper 95%
CI Model II
Person-
Related
Lower 95%
CI
Upper 95%
CI Model III
Job-Related
Lower 95%
CI
Upper 95%
CI
Cancer- Dx 0.253*** 0.196 0.325 0.318*** 0.244 0.414 0.323*** 0.247 0.423
Recurrence 1.79** 1.037 3.091 1.547 0.893 2.679 1.571 0.906 2.722
Ages 60-61 1.525*** 1.217 1.912 1.551*** 1.236 1.945
Age 62 3.214*** 2.514 4.108 3.302*** 2.58 4.227
Ages63-64 1.819*** 1.38 2.397 1.88*** 1.424 2.483
Ages 65 and older 3.246*** 2.268 4.646 3.385*** 2.354 4.868
Nonwhite – Dx 1.118 0.908 1.376 1.086 0.878 1.342
Married – Dx 0.997 0.839 1.186 0.953 0.799 1.137
High school - Dx 0.874 0.687 1.112 0.828 0.641 1.071
Some College - Dx 0.793* 0.614 1.023 0.722** 0.544 0.959
College & More -Dx 0.774* 0.594 1.008 0.694** 0.511 0.941
Chronic Cond. (Count.) 1.017 0.923 1.122 1.031 0.934 1.138
Time since Dx (month) 1.013* 0.998 1.027 1.014* 0.999 1.028
Physically job - Dx 1.015 0.812 1.268
Fulltime Job - Dx 0.96 0.776 1.189
Self-employed - Dx 0.875 0.643 1.192
Own Employer Health
Insurance - Dx
0.643*** 0.52 0.794
Defined Benefit 1.676*** 1.279 2.195
Defined Contribution 1.325** 1.024 1.714
Both Benefit & Contribution 1.9*** 1.355 2.664
Test -2 Log L Chi-Sq P-value -2 Log L Chi-Sq P-value -2 Log L Chi-Sq P-value
Cancer + Recurrence 9.6631 0.002*** 7.4633 0.006*** 6.712 0.009***
Model Fit 6127.967 120.1009 <.0001 5947.517 310.7295 <.0001 5920.521 335.791 <.0001 1Note: Reference group includes age less than 60, less than high school education, white, single, job without physical demands, part-time work, working for someone else, health insurance from source
other than employer at diagnosis, no employer-sponsored retirement benefit (defined benefit like pension or defined contribution like 401(k)).
130
CHAPTER FIVE
CONCLUSIONS
This dissertation addressed three research questions about the effects of cancer
on labor supply in three different scenarios. The purpose of the studies was to fill gaps in niches
in the cancer survivor literature and inform our understanding for improvements in support
program design, employer accommodations, and public policies to enhance the welfare of cancer
survivors. This chapter summarizes the study findings and the policy relevance.
What is the Effect of Cancer on the Labor Supply of Spouses of Cancer Survivors?
The major finding is that with the exception of treatment status, there is little evidence for
systematic effects of cancer on the labor supply of spouses in working married couples. Yet
while this is a null finding with positive policy implications, treatment effects suggest that some
distributional issues may be masked by this average effect. A wife whose husband was in
treatment was less likely to work and reduced hours of labor supply. Since this occurs after the
initial treatment, some married couples may experience new financial distress or a continuation of
financial distress from treatment shortly after diagnosis. The magnitude of wage losses suffered
by married couples in the first year after treatment is significant. The literature included evidence
of mean wage losses of 27% for breast cancer survivors in the first year after diagnosis and
significant financial distress in 16.5% of families and married couples.
The findings suggest several policy implications. First, the good news is that in general,
once past treatment, on average, most spouses in working couples continue to work in the short-
run. Adjustments in labor supply during treatment were largely temporary. Second, given the
evidence in this study for treatment effects, some segment of married working couples may be at
risk for financial distress. How many and how deep that distress is should be explored in future

131
research. Third, spouses share in the cancer survivorship experience, so efforts by clinicians and
social workers that improve care for cancer survivors will yield additional benefits for spousal
labor supply and alleviation of financial distress. Efforts to mitigate chemotherapy side effects
should improve cancer treatment and cancer survivorship care plans. Social workers can be
proactive in dealing with clients with risk factors for financial distress. Fourth, employers can
feel more confident that investments in accommodation programs for spouses will be beneficial,
since most working spouses will continue to work years after treatment. Lastly, government
income assurance programs or health insurance subsidies may improve the economic welfare of
married couples, where treatment effects on spousal labor supply are significant burdens.
What Factors Affect the Decision to Keep Working During Treatment?
While cancer survivors decide to work or not to work during treatment in about equal
proportions, this decision is driven by the type of cancer, and to some extent for men, the stage of
cancer. Certain cancers require shorter treatment protocols (e.g., skin melanoma) or short courses
of chemotherapy or radiation. Other cancers, like blood and lymphoma, may require
chemotherapy for some time with significant side-effects from the treatment, in addition to the
fatigue associated with cancer treatment. Male survivors with prostate, skin, or lymph cancer
(stages I-III) were more likely to work during treatment, compared to male survivors with blood,
respiratory, and other cancers. Likewise, female survivors with breast, skin, thyroid, or lymph
cancer (stage IV) were more likely to work during treatment, compared to survivors with central
nervous system, blood, respiratory, colon, uterus, or other cancers. Male survivors with localized
(stage I) cancers were more likely to work during treatment, compared to survivors with more
advanced cancer at diagnosis (stages II-III or unstaged). Female cancer survivors’ likelihood of
working during treatment is not associated with cancer stage. While female cancer survivors
were more likely to work with greater levels of education, no similar association was found for

132
men. Employer-sponsored health insurance and retirement benefits were associated with an
increased likelihood of working during treatment for male cancer survivors. However, there is
some evidence of ―job lock‖ behavior by wives with cancer. They are more likely to stop
working if a husband has his own employer-sponsored health insurance. Wives may view this as
a ―hedge‖ against the risk of losing benefits by stopping work.
Several policy implications follow from these findings. First, the importance of
employer-sponsored health insurance and working in better paying jobs, that is often associated
with higher education, suggests that there may be unintended consequences for job-dependent
health insurance. Stopping work to focus on treatment or recovery may be a luxury for many,
who fear that this will jeopardize their access to health insurance benefits when it is most needed.
Two options are possible. Employers can increase efforts to allay worker fears of losing a job by
focusing on cancer treatment and recovery. Alternatively, gradually opening up high-risk
insurance pools with greater federal subsidies to ensure affordable access may provide the
security desired by cancer survivors. Second, the impact of treatment period decisions to work or
not have yet to be studied in terms of future outcomes or quality of life for cancer survivors.
Third, cancer survivors with breast or prostate cancer are more likely to work during treatment
compared to other cancers. Since these are among the most prevalent cancers, early use of
support programs and workplace accommodations may benefit employers’ retention of valuable
employees, but the programs may mitigate potentially significant wage losses. Finally, the
disparities in educational opportunities have consequences for healthcare disparities. Less
educated cancer survivors, who are more likely to be working in lower-paying jobs, often without
health insurance benefits, are more likely to quit because of lower opportunity costs. In the long-
run, these disparities can be addressed by reductions in educational disparities. In the short run,
identifying those cancer survivors who are at greater risk for quitting and losing income can help
employers and public policy makers tailor supportive interventions.

133
What is the Effect of Cancer on Time-to-Retirement?
There is some evidence that cancer and recurrence increased the duration of time-to-
retirement for male cancer survivors and, consequently, they worked longer compared to persons
without cancer. However, the evidence for female cancer survivors contains inconsistent signals
over its direction and magnitude. Some of the factors that are significant offer clues to working
longer. Retirement was negatively associated with access to employer-sponsored health
insurance. The opportunity cost of retirement is greater with good health insurance benefits.
However, good pension programs had the opposite effect and were positively associated with
retirement. From a policy perspective, access to health insurance that is independent of an
employer, may facilitate retirement decisions and improve the well-being of older cancer
survivors, whose preferences have changed for more leisure.

CURRICULUM VITA
Michael Markowski, Ph.D.
EDUCATION
2010 Ph.D. The Pennsylvania State University
Health Policy and Administration University Park, PA
1977 M.A. Economics George Mason University
Fairfax, VA
1972 A.B. Economics King’s College
Wilkes-Barre, PA
PROFESSIONAL HEALTHCARE EXPERIENCE
PharMetrics, Boston, MA, 2001; Director, Health Economics. Designed and managed
pharmacoeconomics studies and production of analytic data files for pharmaceutical industry and
managed care clients.
Independence Blue Cross, Philadelphia, PA, 1998 – 2001; Director, Health Services Research.
Managed production of HEDIS reports for NCQA accreditation and utilization reports for medical
management.
Keystone Health Plan Central, Camp Hill, PA, 1994 – 1998; Director, Healthcare Research &
Analysis. Managed production of HEDIS and medical utilization reports and evaluated outcomes
of quality improvement interventions for managed care enrollees.
Hospital Association of Pennsylvania, Camp Hill, PA, 1992 – 1994; 1986 – 1989; Director, Policy
Analysis. Analyzed legislation for impacts and produced briefing papers on issues of interest to
hospital members.
Pennsylvania Health Care Cost Containment Council, Harrisburg, PA, 1989 – 1992; Director of
Operations. Managed production of hospital cost and outcome reports, including the first
statewide hospital financial report.
OTHER PROFESSIONAL EXPERIENCE
1973 – 1986: Worked in economic rural development, logistics management, and transportation
planning and economic modeling, mainly for federal agencies including USDA, DOT, and DOD.
TEACHING EXPERIENCE
Adjunct instructor since 1988 at several institutions: Pennsylvania State University (World Campus /
Harrisburg), Immaculata University, Delaware County Community College, and the University of St.
Francis. Taught a variety of undergraduate and graduate courses in economics, accounting, business,
and healthcare finance.