Projections and their transformations We have looked at modeling 3-dimensional figures in a 3
Three-Dimensional Topography of Corticopontine Projections fromRat Barrel Cortex: Correlations with Corticostriatal Organization
Trygve B. Leergaard,1 Kevin D. Alloway,2 Joshua J. Mutic,2 and Jan G. Bjaalie1
1Department of Anatomy, Institute of Basic Medical Sciences, University of Oslo, N-0317 Oslo, Norway, and 2PennsylvaniaState University, Department of Neuroscience and Anatomy, Hershey, Pennsylvania 17033
Subcortical re-entrant projection systems connecting cerebralcortical areas with the basal ganglia and cerebellum are topo-graphically specific and therefore considered to be parallel cir-cuits or “closed loops.” The precision of projections within thesecircuits, however, has not been characterized sufficiently to indi-cate whether cortical signals are integrated within or amongpresumed compartments. To address this issue, we studied thefirst link of the rat cortico-ponto-cerebellar pathway with antero-grade axonal tracing from physiologically defined, individualwhisker “barrels” of the primary somatosensory cortex (SI). Thelabeled axons in the pontine nuclei formed several, sharply de-lineated clusters. Dual tracer injections into different SI whiskerbarrels gave rise to partly overlapping, paired clusters, indicatingsomatotopic specificity. Three-dimensional reconstructions re-vealed that the clusters were components of concentrically or-ganized lamellar subspaces. Whisker barrels in the same rowprojected to different pontine lamellae (side by side), the soma-
totopic representation of which followed an inside-out sequence.By contrast, whisker barrels from separate rows projected toclusters located within the same lamellar subspace (end to end).In the neostriatum, this lamellar topography was the opposite,with barrels in the same row contacting different parts of thesame lamellar subspace (end to end). The degree of overlapamong pontine clusters varied as a function of the proximity ofthe cortical injections. Furthermore, corticopontine overlap washigher among projections from barrels in the same row thanamong projections from different whisker barrel rows. This an-isotropy was the same in the corticostriatal projection. Thesefindings have important implications for understanding conver-gence and local integration in somatosensory-related subcorticalcircuits.
Key words: 3-D reconstruction; basal ganglia; cerebellum; ce-rebrocerebellar; double anterograde tracing; parallel circuits;pontine nuclei; somatosensory maps; somatotopy
Neurons in the cerebral cortex project to a number of subcorticaltargets. Many of these neurons belong to two major corticosubcor-tical re-entrant circuits, one including the basal ganglia (for review,see Heimer et al., 1995; Parent and Hazrati, 1995) and anotherincluding the pontine nuclei and cerebellum (for review, see Brodaland Bjaalie, 1992, 1997; Schmahmann and Pandya, 1997). Struc-tural and functional specification have been studied extensively inthe first links of these circuits, i.e., in the projections from thecerebral cortex to the pontine nuclei (Brodal, 1968, 1978; Mihailoffet al., 1978, 1985; Wiesendanger and Wiesendanger, 1982; Bjaalieand Brodal, 1989; Leergaard et al., 2000) and the neostriatum(Webster, 1961; Malach and Graybiel, 1986; Gerfen, 1989; Allowayet al., 1999). During development, the global topography of corti-copontine projections appears to be determined by simple temporaland spatial gradients operative within source (cerebral cortex) andtarget (pontine nuclei) region (Leergaard et al., 1995). In agree-ment with these topographic principles, we recently demonstratedthat the adult pontine projections from primary somatosensorycortex (SI) are systematically organized in a clustered three-dimensional (3-D) map (Leergaard et al., 2000). Thus, the terminalfields of axons originating in different SI body part representations(perioral region, trunk, extremities) are largely segregated andpreserve the somatotopic order of the cortical map. One interpre-tation of this arrangement would be that there are separate chan-nels through the pontine nuclei for different major body represen-tations of SI. Such segregated projection systems, connecting
cerebral cortical areas with the cerebellum, have previously beenreported in the monkey (Hoover and Strick, 1999) and haveprompted hypotheses of parallel pathways (“closed loops”) in thecerebrocerebello–thalamocortical re-entrant circuits [for reviewand comparison with basal ganglia circuitry, see Middleton andStrick (2000)]. The detailed organization of pontine projectionsfrom neighboring cortical sites within the same SI body part rep-resentation is not known. Projections at this finer level could eithermaintain topographic specificity and segregation or, alternatively,allow structural convergence and functional integration, compara-ble with the assumed integration in the neostriatum of functionallyrelated signals originating from separate SI cortical sites [for gen-eral considerations on parallel basal ganglia circuitry, see Alex-ander et al. (1986, 1990), Alexander and Crutcher (1990), andAlloway et al. (1999)].
To test these hypotheses, we have analyzed the small-scaletopography of corticopontine projections from the orderly repre-sentation of mystacial vibrissae in SI (Woolsey and Van der Loos,1970; Welker, 1976). In the present study, we have mapped the 3-Dpattern of corticopontine projections in rats that received injectionsof two anterograde tracers in different SI whisker “barrels.” Wereport that corticopontine projections from individual barrels aretopographically organized. Our findings also suggest that pontineneurons can integrate functionally related signals from neighboringcortical sites. Because most of these rats had also been used tocharacterize the organization of corticostriatal projections (Allo-way et al., 1999), we compared the relative patterns of corticostria-tal and corticopontine projections from the same cortical sites. Thiscomparison revealed several important principles concerning thecomparative organization of these major corticofugal pathways.
MATERIALS AND METHODSSurg ical procedures and electrophysiolog ical mapping. Thirteen adult maleSprague Dawley rats were used (see Table 1). All animal procedures wereapproved by an institutional animal welfare committee and were in com-pliance with National Institutes of Health guidelines for the use and careof laboratory animals.
Received May 12, 2000; revised Aug. 17, 2000; accepted Aug. 29, 2000.Financial support was provided by European Community Grant Bio4 CT98-0182 to
J.G.B., The Research Council of Norway, The Norwegian Academy of Sciences, andNational Institutes of Health Grant NS37532 to K.D.A. We thank Annabjørg Bore andChristian Pettersen for expert technical assistance, Petter Laake for helpful assistancewith the statistical analysis, and James M. Bower and Per Brodal for valuablecomments on this manuscript.
Correspondence should be addressed to Dr. Jan G. Bjaalie, Department of Anat-omy, Institute of Basic Medical Sciences, University of Oslo, P.O. Box 1105 Blindern,N-0317 Oslo, Norway. E-mail: [email protected] © 2000 Society for Neuroscience 0270-6474/00/208474-11$15.00/0
The Journal of Neuroscience, November 15, 2000, 20(22):8474–8484
The animals were anesthetized with intramuscular administration ofketamine (20 mg/kg) and xylazine (6 mg/kg). Each animal receivedatropine sulfate (0.05 mg/kg) to reduce bronchial secretions and chloro-mycetin sodium succinate (50 mg/kg) to prevent infection. The animalswere intubated with a 16 gauge plastic tube before being immobilized in astereotaxic frame. Perioperative anesthesia was maintained by ventilationwith a 2:1 mixture of nitrous oxide and oxygen containing 0.5% halothane.End tidal CO2, cardiac rate, and body temperature were monitoredthroughout the procedure. The body temperature was maintained with athermostatically controlled homeothermic blanket. Corneal drying wasprevented with ophthalmic ointment. Two small holes were made in thecranium overlying the right SI whisker representations as reported previ-ously (Alloway et al., 1999). A carbon fiber electrode (Armstrong-Jamesand Millar, 1979) was inserted through each cranial opening and loweredto a cortical depth of 800–1000 mm. Extracellular recordings of multiunitactivity were amplified and displayed by conventional means, and individ-ual whiskers were stimulated with a slender rod to determine the bestwhisker for activating neuronal discharges.
Tracer injections and histochemistry. The two electrophysiologically iden-tified whisker representation sites received injections of either 10% bio-tinylated dextran amine (BDA) (Molecular Probes, Eugene, OR), or 10%rhodamine-conjugated dextran amine [FluoroRuby (FR), MolecularProbes]. FR was loaded into a glass micropipette (100 mm tip) cemented toa 1.0 ml Hamilton syringe that was placed in a microinjection unit (Kopf5000, Kopf Instruments, Tujunga, CA). The pipette was inserted perpen-dicular to the cortical surface, and a volume of 25 nl of FR was injected ata depth of 1400 mm below the pial surface. After 5 min, the pipette wasretracted to 1200 mm, and 25 nl of FR was deposited. Five minutes later athird 25 nl volume of FR was injected at a depth of 1000 mm. To avoidbackflow of the tracer, the pipette was left in position for 10 min beforeretraction. BDA was injected iontophoretically through a glass micropi-pette (35–40 mm tip). Three injections were placed at cortical depths of1400, 1200, and 1000 mm, respectively, by passing a pulsed 4.0 mA current(duty cycle 7 sec) through the pipette for 7–8 min.
After a survival period of 1 week, each rat was reanesthetized with anintraperitoneal injection of sodium pentobarbital (50 mg/kg) and perfusedtranscardially with cold saline containing 1000 U heparin and 20 mglidocaine, followed by 500 ml cold 4% paraformaldehyde in 0.1 M phos-phate buffer, pH 7.4, and finally another 500 ml of the same solution with5% sucrose added. The brains were removed and cryoprotected in 4%
paraformaldehyde with 30% sucrose. Subsequently the right cerebral cor-tex was dissected out as a slab and flattened between two glass slides.Tangential sections of the cortical slab and transverse sections of thebrainstem were cut at 50 mm on a freezing microtome.
Alternate serial sections from the flattened cortex were processed forBDA as described previously (Kincaid and Wilson, 1996; Alloway et al.,1998, 1999). The remaining alternate sections through SI cortex wereprocessed for cytochrome oxidase (CO) using a previously describedprocedure (Wong-Riley, 1979; Land and Simons, 1985; Alloway et al.,1999). The complete series of transverse sections through the brainstemwas processed for BDA according to steps 1–7 in Lanciego and Wouter-lood (1994) using a streptavidin-biotinylated horseradish-peroxidase com-plex (Amersham, Buckinghamshire, UK) as a substitute for the avidin-biotin solution used in the original protocols. Sections were mounted ongelatin-coated glass and coverslipped with Eukit.
Digitization, 3-D reconstruction, and data analysis. The distribution oflabeled axons within the pontine nuclei and several anatomic landmarkswere recorded using an image-combining computerized microscope sys-tem, based on a Leica DMR microscope. Details on software and technicalsolutions are reported in Leergaard and Bjaalie (1995). Complete series ofsections through the pontine nuclei were digitized using a Leitz PlanFluotar 253 or 403 lens. The ventral surface of the pons, the outlines ofthe pontine gray, the contours of the corticobulbar and corticospinal fibertracts (in the following referred to as the peduncle), the midline, and thefourth ventricle served as reference lines.
The plexuses of BDA-labeled axons were viewed with translucent light,and the FR-labeled axons were viewed with excitation light of 515–560 nm(Leitz N2.1 filter block). The labeled plexuses within the pontine gray werecoded semiquantitatively as points (see also Leergaard and Bjaalie, 1995;Leergaard et al., 1995, 2000). In areas with a low density of labeling, pointcoordinates were placed at regular intervals along the length of single axons.In areas with dense labeling it was impossible to assign coordinates toindividual fibers. Although the distribution of labeling was recorded accu-rately, a rough correspondence was sought between the density of labelingand number of digitized points, resulting in tight point clusters correspondingto dense axonal plexuses. The two categories of labeling were digitizedindependently, and the correspondence of labeling and digitized image forboth labeled categories was studied carefully using alternating light micros-copy and fluorescence microscopy with the 253 and 403 lenses.
For the 3-D visualization and analysis of the distribution of labeling, weused program Micro3D for Silicon Graphics workstations (Oslo ResearchPark, Oslo, Norway), which was developed at the Neural Systems andGraphics Computing Laboratory, University of Oslo (http://www.nesys.uio.no/). Forerunners of this software were used in several recent investi-gations (Leergaard et al., 1995, 2000; Malmierca et al., 1995, 1998; Bjaalieet al., 1997a,b; Berg et al., 1998; Bajo et al., 1999; Vassbø et al., 1999). Thedigitized sections were aligned interactively on the screen with the aid ofthe reference lines (see above). Each section was assigned a z-value definedby its thickness and serial number. Tissue shrinkage was estimated bycomparison of drawings of sections before and after the histochemicalprocessing. To maintain correct in vivo proportions in the 3-D reconstruc-tions, section thickness (which was originally 50 mm) was set to 47.5 mm asan adjustment for a linear shrinkage of ;5%. To facilitate the alignment,real-time rotation with inspection of the 3-D reconstructions from differentangles of view was used. The reconstructions served as a basis for thefurther visualization and analyses of densities and distribution of pointclusters. Surface modeling was performed with a simple triangulationmethod or with the use of the software library SISL (SINTEF SplineLibrary) (cf. Bjaalie et al., 1997a).
To facilitate the visualization of results and comparison among cases, weused the standard pontine coordinate system and related diagrams forvisualization presented in Leergaard et al. (2000). This coordinate systemis divided into relative values from 0 to 100%. The origin of coordinates isdefined by the intersection of the midline and a line perpendicular to themidline and tangential to the rostral border of the pontine nuclei. Only thetwo halfway (50%) reference lines are shown in the figures.
The degree of overlap between the BDA- and FR-labeled terminal fieldswas estimated by subdividing individual sections into an array of 35 mm 2
bins and counting the numbers of digitized coordinate pairs per bin.Similar solutions were used previously by others (He et al., 1993; Allowayet al., 1999). To avoid analyzing areas with very low density of labeling,
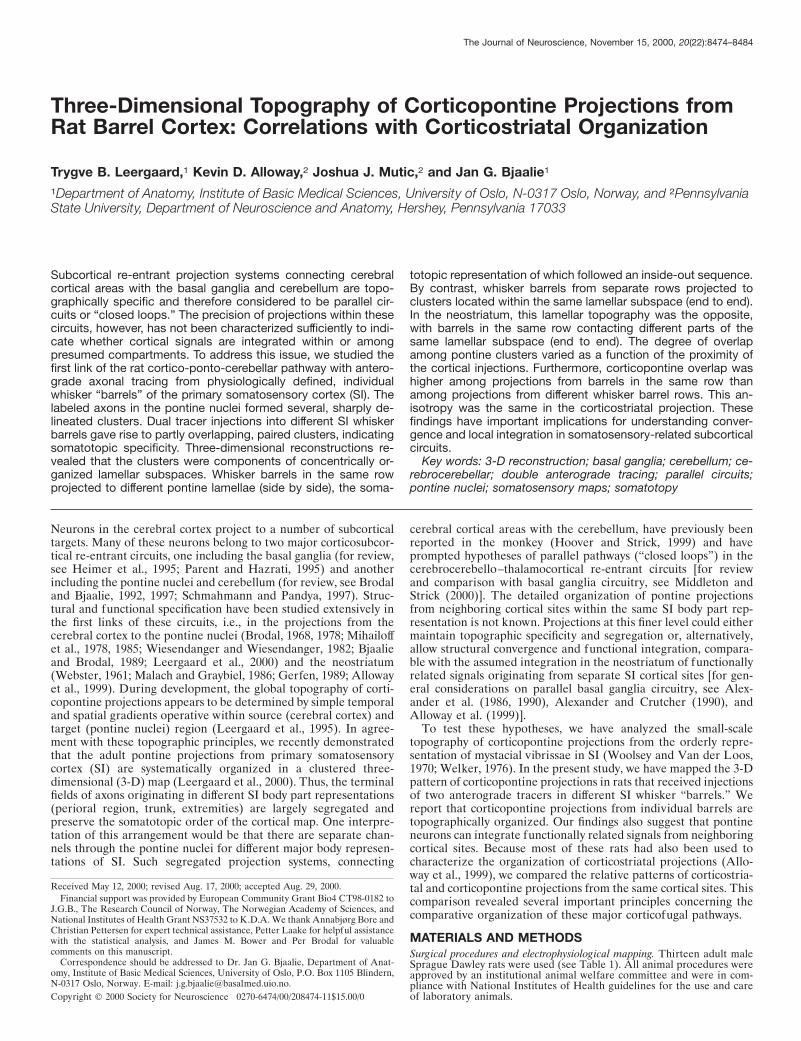
Figure 1. A, Drawing of the right cerebral hemi-sphere of the rat with a cartoon representation ofthe SI somatotopic map and the SI barrel cortex(redrawn from Welker, 1971, with permission). B,Drawing of somatotopically organized SI barrelsrepresenting the mystacial vibrissae (arranged inrows A–E, corresponding to the arrangement ofvibrissae on the contralateral mystacial pad), as theyappear in CO-stained sections (redrawn from Fabriand Burton, 1991, with permission). Scale bar, 1mm. A, Anterior; M, medial; L, lateral.
Table 1. Location, size, and relation between BDA and FR injection sites
Case # BDA FRSeparation(mm)
Totaloverlap (%)
Within rowsD44 C2, D2 D4, 5 730 13.4D45 E4 E2 760 20.0D46 E5 E2, 3 930 12.1
D53 ABS E2 1700 1.7D43 d, g D4 1740 8.7
Across rowsD48 D2 C3 120 14.5D51 C2, 3 E2 630 9.6D42 C4, 5 E1, 2 850 1.3D41 C4 E2 880 1.8
D52 B3, 4 E2 1200 1.7D40 E2 C4, C5 1370 2.7D49 B2, 3 E3 1530 0.5D55 A6, B6 ABS 2000 4.4
ABS, Anterolateral barrel subfield.
Leergaard et al. • Pontine Projections from SI Whisker Barrel Field J. Neurosci., November 15, 2000, 20(22):8474–8484 8475
bins containing only one point were excluded. Because areas with highdensity of labeling were recorded by approximation, no attempt was madeto differentiate the labeled zones according to density. Bins containing twoor more red or blue points were defined as “red” or “blue,” respectively.Bins containing two or more points of both categories were defined as“white” bins, representing overlap. The numbers of red, blue, and whitebins were counted for each section, summed across sections, and used toestimate an index of total overlap. The overlap estimate is highly influ-enced by bin size and threshold criteria. If small bins (e.g., 5 mm 2) and highthresholds (e.g., .10 points per bin) were used, the amount of overlapappeared minimal, whereas by comparison, large bins and low thresholdsresulted in increased overlap. We chose the same bin size (35 mm 2) as usedby Alloway et al. (1999), partly to facilitate comparison across brainregions and partly because similar arguments for this bin size were appli-cable to the pontine nuclei. Bins .35 mm tended to yield overlap insituations where the labeled terminals appeared segregated. Smaller binswere not used because clearly overlapping areas then tended to be definedas segregated.
We have based our analysis on an overlap index defined as the numberof white bins divided by the number of red, blue, and white bins. StatisticalANOVA was performed using the Statistical Package for the Social Sci-ences (SPSS Inc., Chicago, IL).
I llustrations were assembled with Showcase (Silicon Graphics, MountainView, CA), Adobe Illustrator 8.0, and Adobe Photoshop 5.0. Digitalphotomicrographs were obtained through a CoolSnap camera (Photomet-rics, Tucson, AZ). The gray-scale levels of the images were optimizedusing the “curves” function for “autolevels” in Adobe Photoshop.
RESULTSFor this report, results from four representative animals are illus-trated and described in detail. More documentation, includingoriginal data sets with 3-D spatial coordinates, is available athttp://www.nesys.uio.no/ and http://www.cerebellum.org/.
Injection sitesIn each experiment, restricted injections of BDA and FR wereplaced into separate regions of the SI barrel cortex (Fig. 1). Ten ofthe 13 experiments were selected by criterion of labeling in theneostriatum and thalamus and were used previously in a study ofcorticostriatal organization (Alloway et al., 1999). All cases con-tained anterograde BDA and FR labeling in the pontine nuclei. Allinjections were restricted to the gray matter. The outlines andposition of the injection sites were estimated with respect to thewhisker barrels by comparison of adjacent BDA- and CO-processed tangential sections through cortical layers IV and V. Theposition of injections in the whisker barrel field corresponded tothe electrophysiological recordings made before tracer injection.The diameter of the injection sites (Table 1), defined by the
maximum width of dense staining in layer V (the cortical layercontaining cell bodies of corticopontine neurons), ranged from 200to 800 mm. Each injection involved one to two barrels (Table 1). Infive cases, both tracers were confined to the same row of barrels(“within rows”), and in eight cases the tracers were injected intoseparate rows of barrels (“across rows”). The edge-to-edge separa-tion between the two injection sites was measured in layer V (Fig.
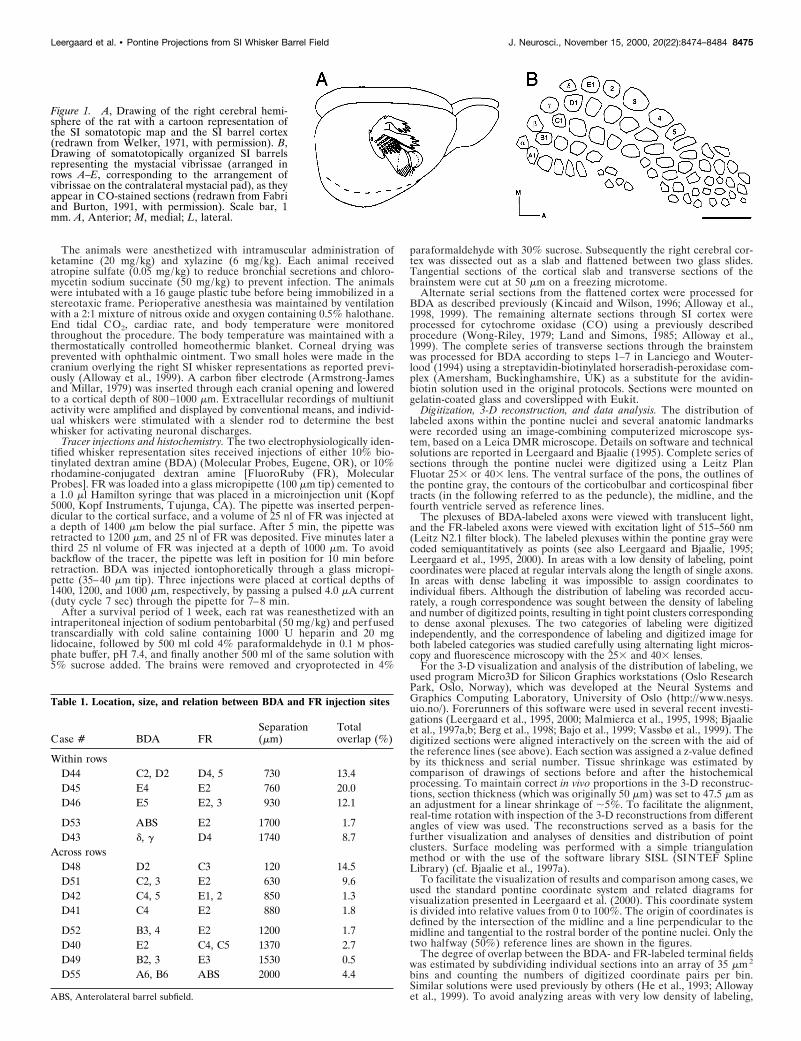
Figure 2. Topography of BDA and FR injections in two representative cases (A–D: D51, E–H: D53). A, B and E, F are corresponding photomicrographsof tangential sections through layer V of SI, revealing the extent of the BDA and FR injection sites in cases D51 and D53, respectively. C and G are overlaysof the photomicrographs in A, B and E, F, respectively. D and H show tangential sections (corresponding to A–C and E–G, respectively) through layerIV of SI cortex labeled for CO to indicate the location of individual whisker barrels. Dashed circles indicate the boundaries of the injection sites. Arrowheadsindicate corresponding sets of blood vessels in each panel. In case D51 (D), the BDA injection is located between barrels C2 and C3, whereas the FRinjection is restricted to E2. In case D53 (H ), the BDA injection site is located in the anterolateral barrel subfield, and the FR injection is located in E2.Scale bar, 500 mm. A, Rostral; M, medial.
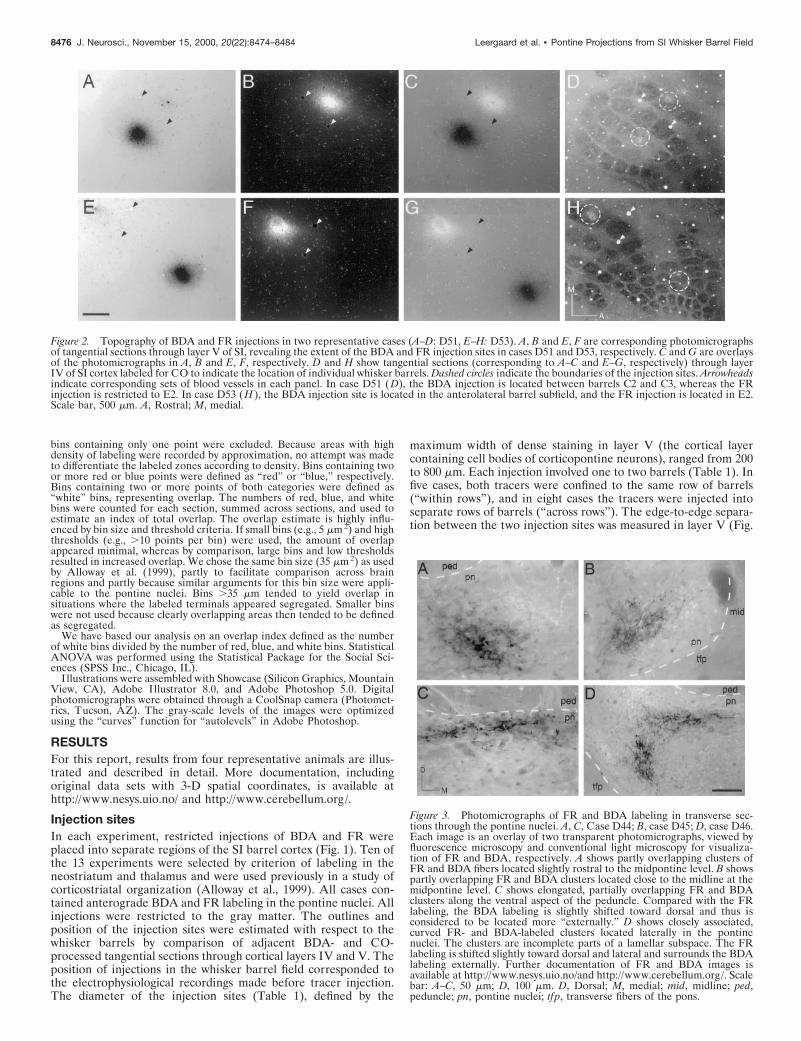
Figure 3. Photomicrographs of FR and BDA labeling in transverse sec-tions through the pontine nuclei. A, C, Case D44; B, case D45; D, case D46.Each image is an overlay of two transparent photomicrographs, viewed byfluorescence microscopy and conventional light microscopy for visualiza-tion of FR and BDA, respectively. A shows partly overlapping clusters ofFR and BDA fibers located slightly rostral to the midpontine level. B showspartly overlapping FR and BDA clusters located close to the midline at themidpontine level. C shows elongated, partially overlapping FR and BDAclusters along the ventral aspect of the peduncle. Compared with the FRlabeling, the BDA labeling is slightly shifted toward dorsal and thus isconsidered to be located more “externally.” D shows closely associated,curved FR- and BDA-labeled clusters located laterally in the pontinenuclei. The clusters are incomplete parts of a lamellar subspace. The FRlabeling is shifted slightly toward dorsal and lateral and surrounds the BDAlabeling externally. Further documentation of FR and BDA images isavailable at http://www.nesys.uio.no/and http://www.cerebellum.org/. Scalebar: A–C, 50 mm; D, 100 mm. D, Dorsal; M, medial; mid, midline; ped,peduncle; pn, pontine nuclei; tfp, transverse fibers of the pons.
8476 J. Neurosci., November 15, 2000, 20(22):8474–8484 Leergaard et al. • Pontine Projections from SI Whisker Barrel Field
2). Injection sites never overlapped. Photomicrographs of represen-tative injection sites are shown in Figure 2.
General features of labeling and overall topographyThe BDA and FR injections gave rise to labeling in several intra-cortical and subcortical targets. Topographically organized fibercomplexes were found in the ipsilateral neostriatum and in thethalamic nuclei together with retrogradely labeled cells (Alloway etal., 1999). Within the ipsilateral pontine nuclei, anterogradely la-beled fibers branched extensively to form several dense axonalplexuses that were assumed to represent terminal fields (Fig. 3). Weobserved beaded varicosities along the trajectories of all BDA andFR fibers inside the pontine nuclei. Recent ultrastructural analysesdemonstrated that similar varicosities along corticostriatal fiberscontained synaptic vesicles and thus may represent corticostriatalsynapses (Kincaid et al., 1998). Because the beaded varicositiesobserved in the pontine nuclei may represent synaptic contacts(Mihailoff et al., 1981), we have chosen to record the completetrajectory of the labeled fibers within the pontine nuclei.
The shape, size, and density of labeled plexuses produced by thetwo tracers were very similar. Viewed in single sections, the BDAand FR labeling were aggregated in sharply defined, rounded
patches that were 50–200 mm in diameter (Fig. 3A,B) and elon-gated thin bands that were ;50–100 mm wide (Fig. 3C). Thecomputerized reconstructions showed that the two-dimensional(2-D) patches are parts of 3-D clusters (Figs. 4, 5). The shape anddistribution of the clusters suggest that they are incomplete com-ponents of concentric layers or lamellae (Fig. 6).
In general, the aggregates of BDA and FR labeling were colo-calized and frequently partially overlapping (Fig. 3). Completelysegregated patches of BDA and FR labeling were often observed,whereas completely overlapping patches were not found. The wide-spread distribution and lamellar shape provides a large side-by-sideinterface between neighboring terminal fields. Furthermore, afterinjection of BDA and FR into different SI whisker barrels, we oftenobserved clusters of BDA- and FR-labeled fibers laterally, medi-ally, and dorsally in the pontine nuclei (Figs. 4–6), which indicatethe presence of multiple pontine body representations. This is inagreement with previous findings from the mapping of larger SIbody representations onto the pontine nuclei (Leergaard et al.,2000).
To describe the spatial relationships between labeled clusters, wedefined the internal region of the pontine nuclei as a centrally
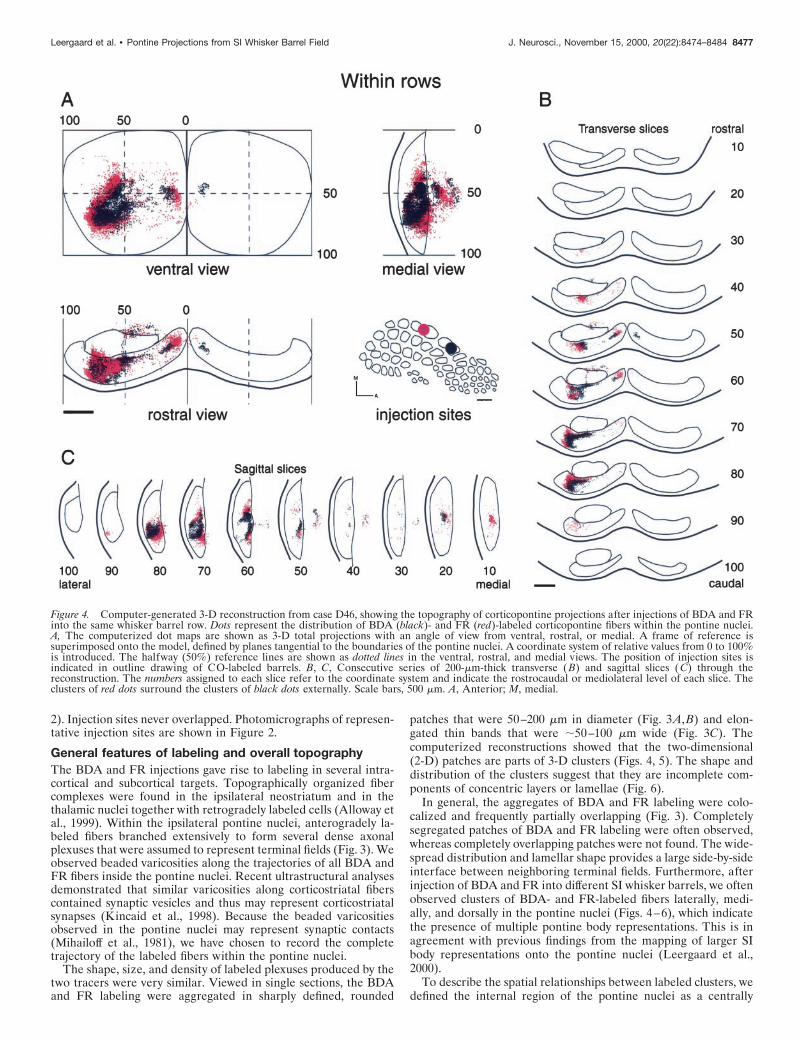
Figure 4. Computer-generated 3-D reconstruction from case D46, showing the topography of corticopontine projections after injections of BDA and FRinto the same whisker barrel row. Dots represent the distribution of BDA (black)- and FR (red)-labeled corticopontine fibers within the pontine nuclei.A, The computerized dot maps are shown as 3-D total projections with an angle of view from ventral, rostral, or medial. A frame of reference issuperimposed onto the model, defined by planes tangential to the boundaries of the pontine nuclei. A coordinate system of relative values from 0 to 100%is introduced. The halfway (50%) reference lines are shown as dotted lines in the ventral, rostral, and medial views. The position of injection sites isindicated in outline drawing of CO-labeled barrels. B, C, Consecutive series of 200-mm-thick transverse (B) and sagittal slices ( C) through thereconstruction. The numbers assigned to each slice refer to the coordinate system and indicate the rostrocaudal or mediolateral level of each slice. Theclusters of red dots surround the clusters of black dots externally. Scale bars, 500 mm. A, Anterior; M, medial.
Leergaard et al. • Pontine Projections from SI Whisker Barrel Field J. Neurosci., November 15, 2000, 20(22):8474–8484 8477
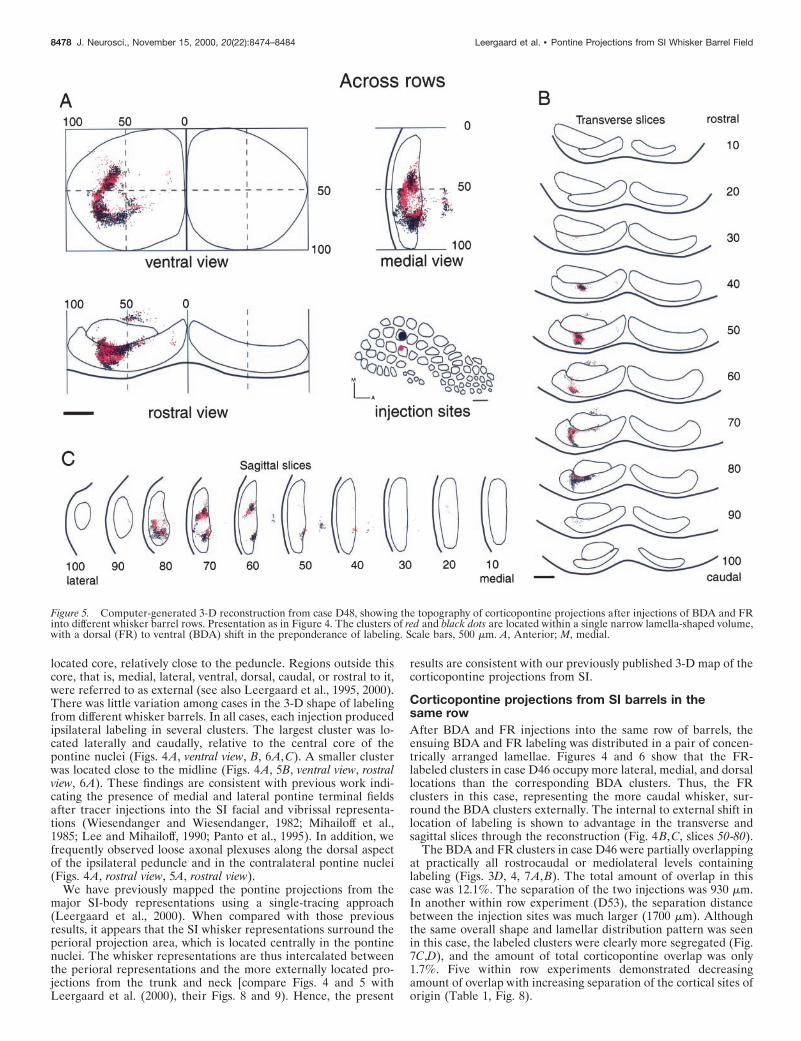
located core, relatively close to the peduncle. Regions outside thiscore, that is, medial, lateral, ventral, dorsal, caudal, or rostral to it,were referred to as external (see also Leergaard et al., 1995, 2000).There was little variation among cases in the 3-D shape of labelingfrom different whisker barrels. In all cases, each injection producedipsilateral labeling in several clusters. The largest cluster was lo-cated laterally and caudally, relative to the central core of thepontine nuclei (Figs. 4A, ventral view, B, 6A,C). A smaller clusterwas located close to the midline (Figs. 4A, 5B, ventral view, rostralview, 6A). These findings are consistent with previous work indi-cating the presence of medial and lateral pontine terminal fieldsafter tracer injections into the SI facial and vibrissal representa-tions (Wiesendanger and Wiesendanger, 1982; Mihailoff et al.,1985; Lee and Mihailoff, 1990; Panto et al., 1995). In addition, wefrequently observed loose axonal plexuses along the dorsal aspectof the ipsilateral peduncle and in the contralateral pontine nuclei(Figs. 4A, rostral view, 5A, rostral view).
We have previously mapped the pontine projections from themajor SI-body representations using a single-tracing approach(Leergaard et al., 2000). When compared with those previousresults, it appears that the SI whisker representations surround theperioral projection area, which is located centrally in the pontinenuclei. The whisker representations are thus intercalated betweenthe perioral representations and the more externally located pro-jections from the trunk and neck [compare Figs. 4 and 5 withLeergaard et al. (2000), their Figs. 8 and 9). Hence, the present
results are consistent with our previously published 3-D map of thecorticopontine projections from SI.
Corticopontine projections from SI barrels in thesame rowAfter BDA and FR injections into the same row of barrels, theensuing BDA and FR labeling was distributed in a pair of concen-trically arranged lamellae. Figures 4 and 6 show that the FR-labeled clusters in case D46 occupy more lateral, medial, and dorsallocations than the corresponding BDA clusters. Thus, the FRclusters in this case, representing the more caudal whisker, sur-round the BDA clusters externally. The internal to external shift inlocation of labeling is shown to advantage in the transverse andsagittal slices through the reconstruction (Fig. 4B,C, slices 50-80).
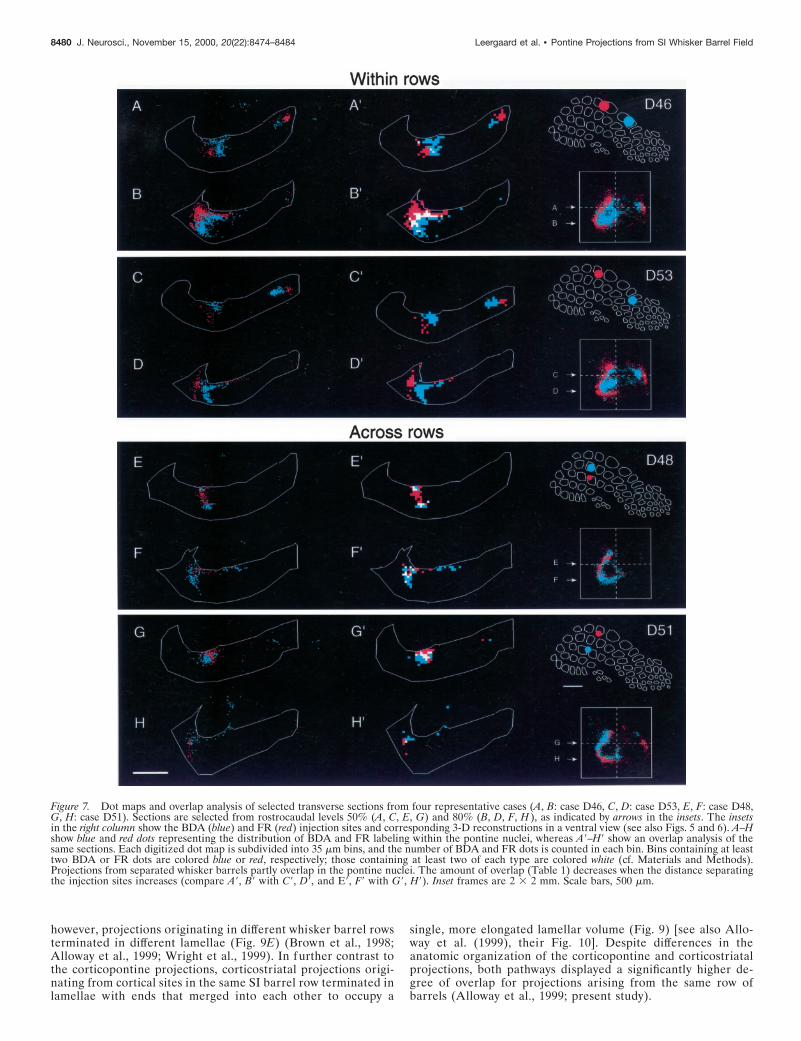
The BDA and FR clusters in case D46 were partially overlappingat practically all rostrocaudal or mediolateral levels containinglabeling (Figs. 3D, 4, 7A,B). The total amount of overlap in thiscase was 12.1%. The separation of the two injections was 930 mm.In another within row experiment (D53), the separation distancebetween the injection sites was much larger (1700 mm). Althoughthe same overall shape and lamellar distribution pattern was seenin this case, the labeled clusters were clearly more segregated (Fig.7C,D), and the amount of total corticopontine overlap was only1.7%. Five within row experiments demonstrated decreasingamount of overlap with increasing separation of the cortical sites oforigin (Table 1, Fig. 8).
Figure 5. Computer-generated 3-D reconstruction from case D48, showing the topography of corticopontine projections after injections of BDA and FRinto different whisker barrel rows. Presentation as in Figure 4. The clusters of red and black dots are located within a single narrow lamella-shaped volume,with a dorsal (FR) to ventral (BDA) shift in the preponderance of labeling. Scale bars, 500 mm. A, Anterior; M, medial.
8478 J. Neurosci., November 15, 2000, 20(22):8474–8484 Leergaard et al. • Pontine Projections from SI Whisker Barrel Field
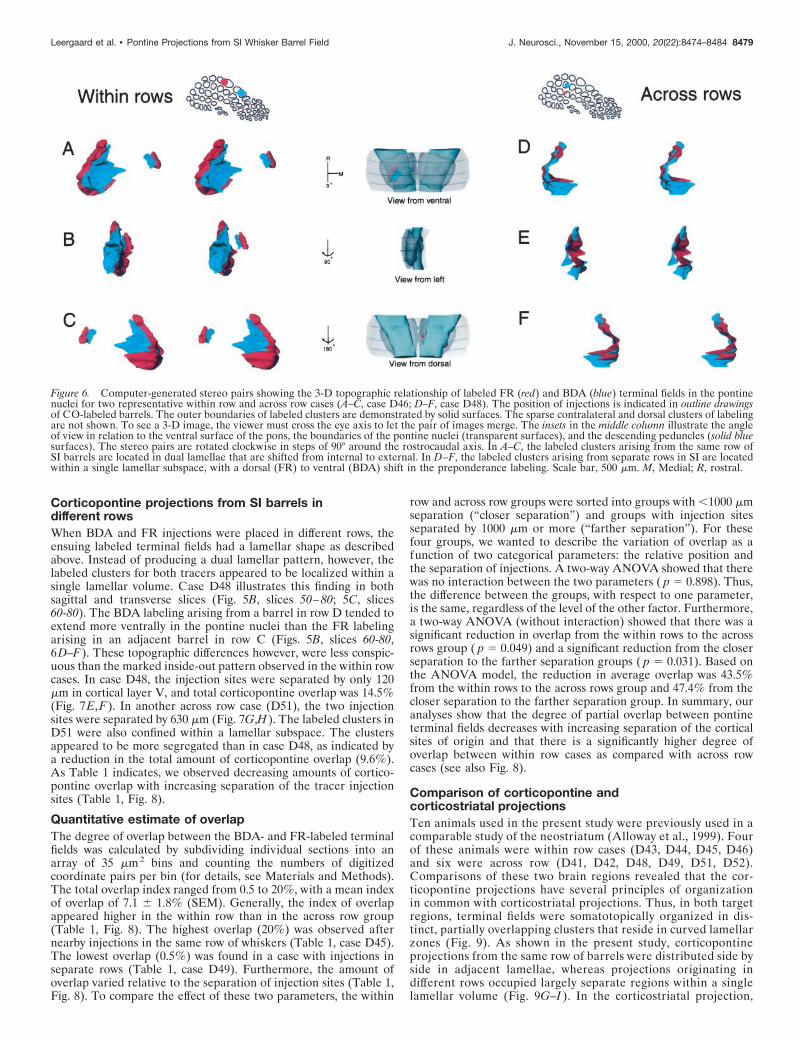
Corticopontine projections from SI barrels indifferent rowsWhen BDA and FR injections were placed in different rows, theensuing labeled terminal fields had a lamellar shape as describedabove. Instead of producing a dual lamellar pattern, however, thelabeled clusters for both tracers appeared to be localized within asingle lamellar volume. Case D48 illustrates this finding in bothsagittal and transverse slices (Fig. 5B, slices 50–80; 5C, slices60-80). The BDA labeling arising from a barrel in row D tended toextend more ventrally in the pontine nuclei than the FR labelingarising in an adjacent barrel in row C (Figs. 5B, slices 60-80,6D–F). These topographic differences however, were less conspic-uous than the marked inside-out pattern observed in the within rowcases. In case D48, the injection sites were separated by only 120mm in cortical layer V, and total corticopontine overlap was 14.5%(Fig. 7E,F). In another across row case (D51), the two injectionsites were separated by 630 mm (Fig. 7G,H). The labeled clusters inD51 were also confined within a lamellar subspace. The clustersappeared to be more segregated than in case D48, as indicated bya reduction in the total amount of corticopontine overlap (9.6%).As Table 1 indicates, we observed decreasing amounts of cortico-pontine overlap with increasing separation of the tracer injectionsites (Table 1, Fig. 8).
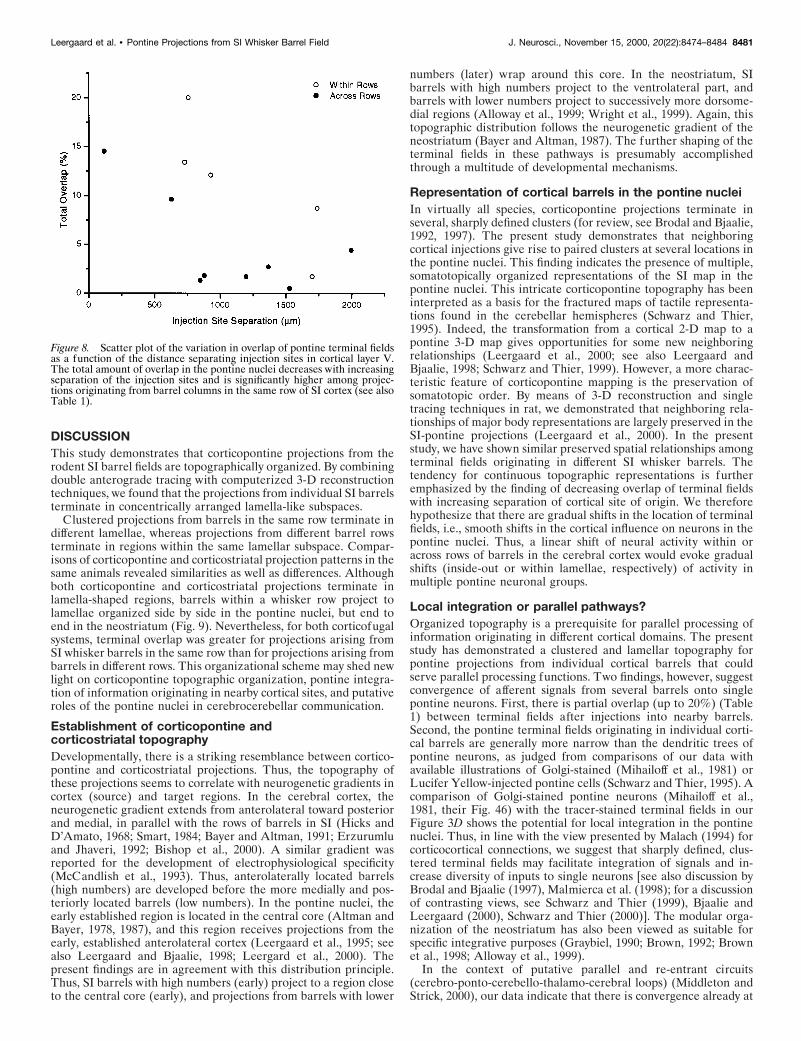
Quantitative estimate of overlapThe degree of overlap between the BDA- and FR-labeled terminalfields was calculated by subdividing individual sections into anarray of 35 mm2 bins and counting the numbers of digitizedcoordinate pairs per bin (for details, see Materials and Methods).The total overlap index ranged from 0.5 to 20%, with a mean indexof overlap of 7.1 6 1.8% (SEM). Generally, the index of overlapappeared higher in the within row than in the across row group(Table 1, Fig. 8). The highest overlap (20%) was observed afternearby injections in the same row of whiskers (Table 1, case D45).The lowest overlap (0.5%) was found in a case with injections inseparate rows (Table 1, case D49). Furthermore, the amount ofoverlap varied relative to the separation of injection sites (Table 1,Fig. 8). To compare the effect of these two parameters, the within
row and across row groups were sorted into groups with ,1000 mmseparation (“closer separation”) and groups with injection sitesseparated by 1000 mm or more (“farther separation”). For thesefour groups, we wanted to describe the variation of overlap as afunction of two categorical parameters: the relative position andthe separation of injections. A two-way ANOVA showed that therewas no interaction between the two parameters ( p 5 0.898). Thus,the difference between the groups, with respect to one parameter,is the same, regardless of the level of the other factor. Furthermore,a two-way ANOVA (without interaction) showed that there was asignificant reduction in overlap from the within rows to the acrossrows group ( p 5 0.049) and a significant reduction from the closerseparation to the farther separation groups ( p 5 0.031). Based onthe ANOVA model, the reduction in average overlap was 43.5%from the within rows to the across rows group and 47.4% from thecloser separation to the farther separation group. In summary, ouranalyses show that the degree of partial overlap between pontineterminal fields decreases with increasing separation of the corticalsites of origin and that there is a significantly higher degree ofoverlap between within row cases as compared with across rowcases (see also Fig. 8).
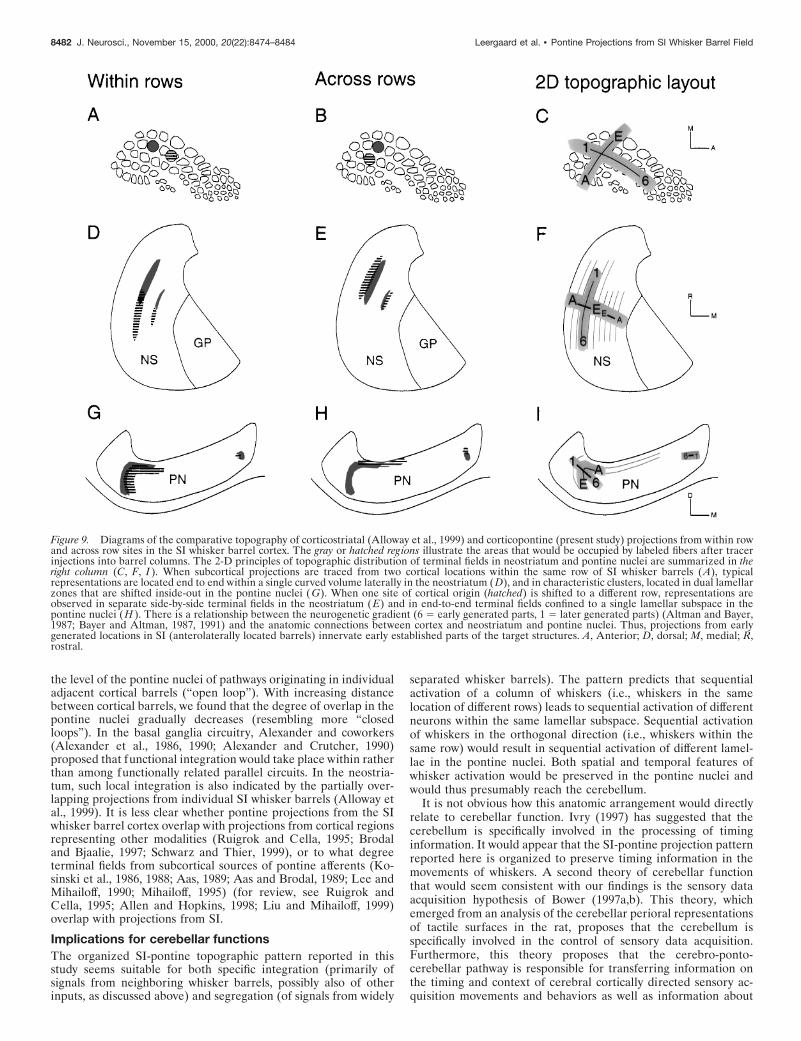
Comparison of corticopontine andcorticostriatal projectionsTen animals used in the present study were previously used in acomparable study of the neostriatum (Alloway et al., 1999). Fourof these animals were within row cases (D43, D44, D45, D46)and six were across row (D41, D42, D48, D49, D51, D52).Comparisons of these two brain regions revealed that the cor-ticopontine projections have several principles of organizationin common with corticostriatal projections. Thus, in both targetregions, terminal fields were somatotopically organized in dis-tinct, partially overlapping clusters that reside in curved lamellarzones (Fig. 9). As shown in the present study, corticopontineprojections from the same row of barrels were distributed side byside in adjacent lamellae, whereas projections originating indifferent rows occupied largely separate regions within a singlelamellar volume (Fig. 9G–I ). In the corticostriatal projection,
Figure 6. Computer-generated stereo pairs showing the 3-D topographic relationship of labeled FR (red) and BDA (blue) terminal fields in the pontinenuclei for two representative within row and across row cases (A–C, case D46; D–F, case D48). The position of injections is indicated in outline drawingsof CO-labeled barrels. The outer boundaries of labeled clusters are demonstrated by solid surfaces. The sparse contralateral and dorsal clusters of labelingare not shown. To see a 3-D image, the viewer must cross the eye axis to let the pair of images merge. The insets in the middle column illustrate the angleof view in relation to the ventral surface of the pons, the boundaries of the pontine nuclei (transparent surfaces), and the descending peduncles (solid bluesurfaces). The stereo pairs are rotated clockwise in steps of 90° around the rostrocaudal axis. In A–C, the labeled clusters arising from the same row ofSI barrels are located in dual lamellae that are shifted from internal to external. In D–F, the labeled clusters arising from separate rows in SI are locatedwithin a single lamellar subspace, with a dorsal (FR) to ventral (BDA) shift in the preponderance labeling. Scale bar, 500 mm. M, Medial; R, rostral.
Leergaard et al. • Pontine Projections from SI Whisker Barrel Field J. Neurosci., November 15, 2000, 20(22):8474–8484 8479
however, projections originating in different whisker barrel rowsterminated in different lamellae (Fig. 9E) (Brown et al., 1998;Alloway et al., 1999; Wright et al., 1999). In further contrast tothe corticopontine projections, corticostriatal projections origi-nating from cortical sites in the same SI barrel row terminated inlamellae with ends that merged into each other to occupy a
single, more elongated lamellar volume (Fig. 9) [see also Allo-way et al. (1999), their Fig. 10]. Despite differences in theanatomic organization of the corticopontine and corticostriatalprojections, both pathways displayed a significantly higher de-gree of overlap for projections arising from the same row ofbarrels (Alloway et al., 1999; present study).
Figure 7. Dot maps and overlap analysis of selected transverse sections from four representative cases (A, B: case D46, C, D: case D53, E, F: case D48,G, H: case D51). Sections are selected from rostrocaudal levels 50% (A, C, E, G) and 80% (B, D, F, H ), as indicated by arrows in the insets. The insetsin the right column show the BDA (blue) and FR (red) injection sites and corresponding 3-D reconstructions in a ventral view (see also Figs. 5 and 6). A–Hshow blue and red dots representing the distribution of BDA and FR labeling within the pontine nuclei, whereas A9–H9 show an overlap analysis of thesame sections. Each digitized dot map is subdivided into 35 mm bins, and the number of BDA and FR dots is counted in each bin. Bins containing at leasttwo BDA or FR dots are colored blue or red, respectively; those containing at least two of each type are colored white (cf. Materials and Methods).Projections from separated whisker barrels partly overlap in the pontine nuclei. The amount of overlap (Table 1) decreases when the distance separatingthe injection sites increases (compare A9, B9 with C9, D9, and E9, F9 with G9, H9). Inset frames are 2 3 2 mm. Scale bars, 500 mm.
8480 J. Neurosci., November 15, 2000, 20(22):8474–8484 Leergaard et al. • Pontine Projections from SI Whisker Barrel Field
DISCUSSIONThis study demonstrates that corticopontine projections from therodent SI barrel fields are topographically organized. By combiningdouble anterograde tracing with computerized 3-D reconstructiontechniques, we found that the projections from individual SI barrelsterminate in concentrically arranged lamella-like subspaces.
Clustered projections from barrels in the same row terminate indifferent lamellae, whereas projections from different barrel rowsterminate in regions within the same lamellar subspace. Compar-isons of corticopontine and corticostriatal projection patterns in thesame animals revealed similarities as well as differences. Althoughboth corticopontine and corticostriatal projections terminate inlamella-shaped regions, barrels within a whisker row project tolamellae organized side by side in the pontine nuclei, but end toend in the neostriatum (Fig. 9). Nevertheless, for both corticofugalsystems, terminal overlap was greater for projections arising fromSI whisker barrels in the same row than for projections arising frombarrels in different rows. This organizational scheme may shed newlight on corticopontine topographic organization, pontine integra-tion of information originating in nearby cortical sites, and putativeroles of the pontine nuclei in cerebrocerebellar communication.
Establishment of corticopontine andcorticostriatal topographyDevelopmentally, there is a striking resemblance between cortico-pontine and corticostriatal projections. Thus, the topography ofthese projections seems to correlate with neurogenetic gradients incortex (source) and target regions. In the cerebral cortex, theneurogenetic gradient extends from anterolateral toward posteriorand medial, in parallel with the rows of barrels in SI (Hicks andD’Amato, 1968; Smart, 1984; Bayer and Altman, 1991; Erzurumluand Jhaveri, 1992; Bishop et al., 2000). A similar gradient wasreported for the development of electrophysiological specificity(McCandlish et al., 1993). Thus, anterolaterally located barrels(high numbers) are developed before the more medially and pos-teriorly located barrels (low numbers). In the pontine nuclei, theearly established region is located in the central core (Altman andBayer, 1978, 1987), and this region receives projections from theearly, established anterolateral cortex (Leergaard et al., 1995; seealso Leergaard and Bjaalie, 1998; Leergard et al., 2000). Thepresent findings are in agreement with this distribution principle.Thus, SI barrels with high numbers (early) project to a region closeto the central core (early), and projections from barrels with lower
numbers (later) wrap around this core. In the neostriatum, SIbarrels with high numbers project to the ventrolateral part, andbarrels with lower numbers project to successively more dorsome-dial regions (Alloway et al., 1999; Wright et al., 1999). Again, thistopographic distribution follows the neurogenetic gradient of theneostriatum (Bayer and Altman, 1987). The further shaping of theterminal fields in these pathways is presumably accomplishedthrough a multitude of developmental mechanisms.
Representation of cortical barrels in the pontine nucleiIn virtually all species, corticopontine projections terminate inseveral, sharply defined clusters (for review, see Brodal and Bjaalie,1992, 1997). The present study demonstrates that neighboringcortical injections give rise to paired clusters at several locations inthe pontine nuclei. This finding indicates the presence of multiple,somatotopically organized representations of the SI map in thepontine nuclei. This intricate corticopontine topography has beeninterpreted as a basis for the fractured maps of tactile representa-tions found in the cerebellar hemispheres (Schwarz and Thier,1995). Indeed, the transformation from a cortical 2-D map to apontine 3-D map gives opportunities for some new neighboringrelationships (Leergaard et al., 2000; see also Leergaard andBjaalie, 1998; Schwarz and Thier, 1999). However, a more charac-teristic feature of corticopontine mapping is the preservation ofsomatotopic order. By means of 3-D reconstruction and singletracing techniques in rat, we demonstrated that neighboring rela-tionships of major body representations are largely preserved in theSI-pontine projections (Leergaard et al., 2000). In the presentstudy, we have shown similar preserved spatial relationships amongterminal fields originating in different SI whisker barrels. Thetendency for continuous topographic representations is furtheremphasized by the finding of decreasing overlap of terminal fieldswith increasing separation of cortical site of origin. We thereforehypothesize that there are gradual shifts in the location of terminalfields, i.e., smooth shifts in the cortical influence on neurons in thepontine nuclei. Thus, a linear shift of neural activity within oracross rows of barrels in the cerebral cortex would evoke gradualshifts (inside-out or within lamellae, respectively) of activity inmultiple pontine neuronal groups.
Local integration or parallel pathways?Organized topography is a prerequisite for parallel processing ofinformation originating in different cortical domains. The presentstudy has demonstrated a clustered and lamellar topography forpontine projections from individual cortical barrels that couldserve parallel processing functions. Two findings, however, suggestconvergence of afferent signals from several barrels onto singlepontine neurons. First, there is partial overlap (up to 20%) (Table1) between terminal fields after injections into nearby barrels.Second, the pontine terminal fields originating in individual corti-cal barrels are generally more narrow than the dendritic trees ofpontine neurons, as judged from comparisons of our data withavailable illustrations of Golgi-stained (Mihailoff et al., 1981) orLucifer Yellow-injected pontine cells (Schwarz and Thier, 1995). Acomparison of Golgi-stained pontine neurons (Mihailoff et al.,1981, their Fig. 46) with the tracer-stained terminal fields in ourFigure 3D shows the potential for local integration in the pontinenuclei. Thus, in line with the view presented by Malach (1994) forcorticocortical connections, we suggest that sharply defined, clus-tered terminal fields may facilitate integration of signals and in-crease diversity of inputs to single neurons [see also discussion byBrodal and Bjaalie (1997), Malmierca et al. (1998); for a discussionof contrasting views, see Schwarz and Thier (1999), Bjaalie andLeergaard (2000), Schwarz and Thier (2000)]. The modular orga-nization of the neostriatum has also been viewed as suitable forspecific integrative purposes (Graybiel, 1990; Brown, 1992; Brownet al., 1998; Alloway et al., 1999).
In the context of putative parallel and re-entrant circuits(cerebro-ponto-cerebello-thalamo-cerebral loops) (Middleton andStrick, 2000), our data indicate that there is convergence already at
Figure 8. Scatter plot of the variation in overlap of pontine terminal fieldsas a function of the distance separating injection sites in cortical layer V.The total amount of overlap in the pontine nuclei decreases with increasingseparation of the injection sites and is significantly higher among projec-tions originating from barrel columns in the same row of SI cortex (see alsoTable 1).
Leergaard et al. • Pontine Projections from SI Whisker Barrel Field J. Neurosci., November 15, 2000, 20(22):8474–8484 8481
the level of the pontine nuclei of pathways originating in individualadjacent cortical barrels (“open loop”). With increasing distancebetween cortical barrels, we found that the degree of overlap in thepontine nuclei gradually decreases (resembling more “closedloops”). In the basal ganglia circuitry, Alexander and coworkers(Alexander et al., 1986, 1990; Alexander and Crutcher, 1990)proposed that functional integration would take place within ratherthan among functionally related parallel circuits. In the neostria-tum, such local integration is also indicated by the partially over-lapping projections from individual SI whisker barrels (Alloway etal., 1999). It is less clear whether pontine projections from the SIwhisker barrel cortex overlap with projections from cortical regionsrepresenting other modalities (Ruigrok and Cella, 1995; Brodaland Bjaalie, 1997; Schwarz and Thier, 1999), or to what degreeterminal fields from subcortical sources of pontine afferents (Ko-sinski et al., 1986, 1988; Aas, 1989; Aas and Brodal, 1989; Lee andMihailoff, 1990; Mihailoff, 1995) (for review, see Ruigrok andCella, 1995; Allen and Hopkins, 1998; Liu and Mihailoff, 1999)overlap with projections from SI.
Implications for cerebellar functionsThe organized SI-pontine topographic pattern reported in thisstudy seems suitable for both specific integration (primarily ofsignals from neighboring whisker barrels, possibly also of otherinputs, as discussed above) and segregation (of signals from widely
separated whisker barrels). The pattern predicts that sequentialactivation of a column of whiskers (i.e., whiskers in the samelocation of different rows) leads to sequential activation of differentneurons within the same lamellar subspace. Sequential activationof whiskers in the orthogonal direction (i.e., whiskers within thesame row) would result in sequential activation of different lamel-lae in the pontine nuclei. Both spatial and temporal features ofwhisker activation would be preserved in the pontine nuclei andwould thus presumably reach the cerebellum.
It is not obvious how this anatomic arrangement would directlyrelate to cerebellar function. Ivry (1997) has suggested that thecerebellum is specifically involved in the processing of timinginformation. It would appear that the SI-pontine projection patternreported here is organized to preserve timing information in themovements of whiskers. A second theory of cerebellar functionthat would seem consistent with our findings is the sensory dataacquisition hypothesis of Bower (1997a,b). This theory, whichemerged from an analysis of the cerebellar perioral representationsof tactile surfaces in the rat, proposes that the cerebellum isspecifically involved in the control of sensory data acquisition.Furthermore, this theory proposes that the cerebro-ponto-cerebellar pathway is responsible for transferring information onthe timing and context of cerebral cortically directed sensory ac-quisition movements and behaviors as well as information about
Figure 9. Diagrams of the comparative topography of corticostriatal (Alloway et al., 1999) and corticopontine (present study) projections from within rowand across row sites in the SI whisker barrel cortex. The gray or hatched regions illustrate the areas that would be occupied by labeled fibers after tracerinjections into barrel columns. The 2-D principles of topographic distribution of terminal fields in neostriatum and pontine nuclei are summarized in theright column (C, F, I ). When subcortical projections are traced from two cortical locations within the same row of SI whisker barrels (A), typicalrepresentations are located end to end within a single curved volume laterally in the neostriatum (D), and in characteristic clusters, located in dual lamellarzones that are shifted inside-out in the pontine nuclei (G). When one site of cortical origin (hatched) is shifted to a different row, representations areobserved in separate side-by-side terminal fields in the neostriatum (E) and in end-to-end terminal fields confined to a single lamellar subspace in thepontine nuclei (H ). There is a relationship between the neurogenetic gradient (6 5 early generated parts, 1 5 later generated parts) (Altman and Bayer,1987; Bayer and Altman, 1987, 1991) and the anatomic connections between cortex and neostriatum and pontine nuclei. Thus, projections from earlygenerated locations in SI (anterolaterally located barrels) innervate early established parts of the target structures. A, Anterior; D, dorsal; M, medial; R,rostral.
8482 J. Neurosci., November 15, 2000, 20(22):8474–8484 Leergaard et al. • Pontine Projections from SI Whisker Barrel Field
the ongoing processing of sensory tactile data within the cerebralcortex. The organized pontine topography combined with localintegration capabilities discussed above could represent a substratefor such information transfer.
REFERENCESAas J-E (1989) Subcortical projections to the pontine nuclei in the cat.
J Comp Neurol 282:331–354.Aas J-E, Brodal P (1989) Demonstration of a mamillo-ponto-cerebellar
pathway a multi-tracer study. Eur J Neurosci 1:61–74.Alexander GE, Crutcher MD (1990) Neural representations of the target
(goal) of visually guided arm movements in three motor areas of themonkey. J Neurophysiol 64:164–178.
Alexander GE, DeLong MR, Strick PL (1986) Parallel organization offunctionally segregated circuits linking basal ganglia and cortex. AnnuRev Neurosci 9:357–381.
Alexander GE, Crutcher MD, DeLong MR (1990) Basal ganglia-thalamocortical circuits: parallel substrates for motor, oculomotor, “pre-frontal” and “limbic” functions. Prog Brain Res 85:119–146.
Allen GV, Hopkins DA (1998) Convergent prefrontal cortex and mamil-lary body projections to the medial pontine nuclei: a light and electronmicroscopic study in the rat. J Comp Neurol 398:347–358.
Alloway KD, Mutic JJ, Hoover JE (1998) Divergent corticostriatal pro-jections from a single cortical column in the somatosensory cortex of rats.Brain Res 785:341–346.
Alloway KD, Crist J, Mutic JJ, Roy SA (1999) Corticostriatal projectionsfrom rat barrel cortex have an anisotropic organization that correlateswith vibrissal whisking behavior. J Neurosci 19:10908–10922.
Altman J, Bayer SA (1978) Prenatal development of the cerebellar systemin the rat. II. Cytogenesis and histogenesis of the inferior olive, pontinegray, and the precerebellar reticular nuclei. J Comp Neurol 179:49–75.
Altman J, Bayer SA (1987) Development of the precerebellar nuclei in therat: IV. The anterior precerebellar extramural migratory stream and thenucleus reticularis tegmenti pontis and the basal pontine gray. J CompNeurol 257:529–552.
Armstrong-James M, Millar J (1979) Carbon fibre microelectrodes. J Neu-rosci Methods 1:279–287.
Bajo VM, Merchan MA, Malmierca MS, Nodal FR, Bjaalie JG (1999)Topographic organization of the dorsal nucleus of the lateral lemniscusin the cat. J Comp Neurol 407:349–366.
Bayer SA, Altman J (1987) Directions in neurogenetic gradients and pat-terns of anatomical connections in the telencephalon. Prog Neurobiol29:57–106.
Bayer SA, Altman J (1991) Neocortical development. New York: Raven.Berg BG, Almaas TJ, Bjaalie JG, Mustaparta H (1998) The macroglo-
merular complex of the antennal lobe in the tobacco budworm mothHeliothis virescens: specified subdivision in four compartments accordingto information about biologically significant compounds. J Comp Physiol[A] 183:669–682.
Bishop KM, Goudreau G, O’Leary DD (2000) Regulation of area identityin the mammalian neocortex by Emx2 and Pax6. Science 288:344–349.
Bjaalie JG, Brodal P (1989) Visual pathways to the cerebellum: segrega-tion in the pontine nuclei of terminal fields from different visual corticalareas in the cat. Neuroscience 29:95–107.
Bjaalie JG, Leergaard TB (2000) Functions of the pontine nuclei incerebro-cerebellar communication. Trends Neurosci 23:152.
Bjaalie JG, Daehlen M, Stensby TV (1997a) Surface modelling from bio-medical data. In: Numerical methods and software tools in industrialmathematics (Daehlen M, Tveito A, eds), pp 9–26. Boston: Birkhauser.
Bjaalie JG, Sudbø J, Brodal P (1997b) Corticopontine terminal fibres formsmall scale clusters and large scale lamellae in the cat. NeuroReport8:1651–1655.
Bower JM (1997a) Control of sensory data acquisition. Int Rev Neurobiol41:489–513.
Bower JM (1997b) Is the cerebellum sensory for motor’s sake, or motorfor sensory’s sake: the view from the whiskers of a rat? Prog Brain Res114:463–496.
Brodal P (1968) The corticopontine projection in the cat. I. Demonstra-tion of a somatotopically organized projection from the primary senso-rimotor cortex. Exp Brain Res 5:210–234.
Brodal P (1978) The corticopontine projection in the rhesus monkey.Origin and principles of organization. Brain 101:251–283.
Brodal P, Bjaalie JG (1992) Organization of the pontine nuclei. NeurosciRes 13:83–118.
Brodal P, Bjaalie JG (1997) Salient anatomic features of the cortico-ponto-cerebellar pathway. Prog Brain Res 114:227–249.
Brown LL (1992) Somatotopic organization in rat striatum: evidence for acombinational map. Proc Natl Acad Sci USA 89:7403–7407.
Brown LL, Smith DM, Goldblum LM (1998) Organizing principles ofcortical integration in the rat neostriatum: somatotopic organization ofsensorimotor activity. J Comp Neurol 392:468–499.
Erzurumlu RS, Jhaveri S (1992) Emergence of connectivity in the embry-onic rat parietal cortex. Cereb Cortex 2:336–352.
Fabri M, Burton H (1991) Ipsilateral cortical connections of primary so-matic sensory cortex in rats. J Comp Neurol 311:405–424.
Gerfen CR (1989) The neostriatal mosaic: striatal patch-matrix organiza-tion is related to cortical lamination. Science 246:385–388.
Graybiel AM (1990) Neurotransmitters and neuromodulators in the basalganglia. Trends Neurosci 13:244–254.
He SQ, Dum RP, Strick PL (1993) Topographic organization of cortico-spinal projections from the frontal lobe: motor areas on the lateralsurface of the hemisphere. J Neurosci 13:952–980.
Heimer L, Zahm DS, Alheid GF (1995) Basal ganglia. In: The rat nervoussystem (Paxinos G, ed), pp 579–628. San Diego: Academic.
Hicks SP, D’Amato CJ (1968) Cell migrations to the isocortex in the rat.Anat Rec 160:619–634.
Hoover JE, Strick PL (1999) The organization of cerebellar and basalganglia outputs to primary motor cortex as revealed by retrograde tran-sneuronal transport of herpes simplex virus type 1. J Neurosci19:1446–1463.
Ivry R (1997) Cerebellar timing systems. Int Rev Neurobiol 41:555–573.Kincaid AE, Wilson CJ (1996) Corticostriatal innervation of the patch
and matrix in the rat neostriatum. J Comp Neurol 374:578–592.Kincaid AE, Zheng T, Wilson CJ (1998) Connectivity and convergence of
single corticostriatal axons. J Neurosci 18:4722–4731.Kosinski RJ, Neafsey EJ, Castro AJ (1986) A comparative topographical
analysis of dorsal column nuclear and cerebral cortical projections to thebasilar pontine gray in rats. J Comp Neurol 244:163–173.
Kosinski RJ, Azizi SA, Mihailoff GA (1988) Convergence of cortico- andcuneopontine projections onto components of the pontocerebellar systemin the rat: an anatomical and electrophysiological study. Exp Brain Res71:541–556.
Lanciego JL, Wouterlood FG (1994) Dual anterograde axonal tracingwith Phaseolus vulgaris-leucoagglutinin (PHA-L) and biotinylated dex-tran amine (BDA). Neuroscience Protocols 94–050-06–01-13.
Land PW, Simons DJ (1985) Cytochrome oxidase staining in the rat SmIbarrel cortex. J Comp Neurol 238:225–235.
Lee HS, Mihailoff GA (1990) Convergence of cortical and cerebellar pro-jections on single basilar pontine neurons: a light and electron micro-scopic study in the rat. Neuroscience 39:561–577.
Leergaard TB, Bjaalie JG (1995) Semi-automatic data acquisition forquantitative neuroanatomy. MicroTrace—computer programme for re-cording of the spatial distribution of neuronal populations. Neurosci Res22:231–243.
Leergaard TB, Bjaalie JG (1998) From cortical 2-D to brain stem 3-Dmaps: organization of corticopontine projections in developing and adultrats. Soc Neurosci Abstr 24:262.9.
Leergaard TB, Lakke EA, Bjaalie JG (1995) Topographical organizationin the early postnatal corticopontine projection: a carbocyanine dye and3-D computer reconstruction study in the rat. J Comp Neurol 361:77–94.
Leergaard TB, Lyngstad KA, Thompson JH, Taeymans S, Vos BP, DeSchutter E, Bower JM, Bjaalie JG (2000) Rat somatosensory cerebro-pontocerebellar pathways: spatial relationships of the somatotopic map ofthe primary somatosensory cortex are preserved in a three-dimensionalclustered pontine map. J Comp Neurol 422:246–266.
Liu H, Mihailoff GA (1999) Hypothalamopontine projections in the rat:anterograde axonal transport studies utilizing light and electron micros-copy. Anat Rec 255:428–451.
Malach R (1994) Cortical columns as devices for maximizing neuronaldiversity. Trends Neurosci 17:101–104.
Malach R, Graybiel AM (1986) Mosaic architecture of the somaticsensory-recipient sector of the cat’s striatum. J Neurosci 6:3436–3458.
Malmierca MS, Rees A, Le Beau FE, Bjaalie JG (1995) Laminar organi-zation of frequency-defined local axons within and between the inferiorcolliculi of the guinea pig. J Comp Neurol 357:124–144.
Malmierca MS, Leergaard TB, Bajo VM, Bjaalie JG, Merchan MA (1998)Anatomic evidence of a three-dimensional mosaic pattern of tonotopicorganization in the ventral complex of the lateral lemniscus in cat.J Neurosci 18:10603–10618.
McCandlish CA, Li CX, Waters RS (1993) Early development of the SIcortical barrel field representation in neonatal rats follows a lateral-to-medial gradient: an electrophysiological study. Exp Brain Res92:369–374.
Middleton FA, Strick PL (2000) Basal ganglia and cerebellar loops: motorand cognitive circuits. Brain Res Rev 31:236–250.
Mihailoff GA (1995) Orthograde axonal transport studies of projectionsfrom the zona incerta and pretectum to the basilar pontine nuclei in therat. J Comp Neurol 360:301–318.
Mihailoff GA, Burne RA, Woodward DJ (1978) Projections of sensorimo-tor cortex to the basilar pontine nuclei in the rat: an autoradiographicstudy. Brain Res 145:347–354.
Mihailoff GA, McArdle CB, Adams CE (1981) The cytoarchitecture, cy-tology, and synaptic organization of the basilar pontine nuclei in the rat.I. Nissl and Golgi studies. J Comp Neurol 195:181–201.
Mihailoff GA, Lee H, Watt CB, Yates R (1985) Projections to the basilarpontine nuclei from face sensory and motor regions of the cerebral cortexin the rat. J Comp Neurol 237:251–263.
Panto MR, Cicirata F, Angaut P, Parenti R, Serapide F (1995) Theprojection from the primary motor and somatic sensory cortex to thebasilar pontine nuclei. A detailed electrophysiological and anatomicalstudy in the rat. J Hirnforsch 36:7–19.
Parent A, Hazrati LN (1995) Functional anatomy of the basal ganglia. I.
Leergaard et al. • Pontine Projections from SI Whisker Barrel Field J. Neurosci., November 15, 2000, 20(22):8474–8484 8483

The cortico-basal ganglia-thalamo-cortical loop. Brain Res Rev20:91–127.
Ruigrok TJ, Cella F (1995) Precerebellar nuclei and red nucleus. In: Therat nervous system (Paxinos G, ed), pp 277–308. San Diego: Academic.
Schmahmann JD, Pandya DN (1997) The cerebrocerebellar system. IntRev Neurobiol 41:31–60.
Schwarz C, Thier P (1995) Modular organization of the pontine nuclei:dendritic fields of identified pontine projection neurons in the rat respectthe borders of cortical afferent fields. J Neurosci 15:3475–3489.
Schwarz C, Thier P (1999) Binding of signals relevant for action: towardsa hypothesis of the functional role of the pontine nuclei. Trends Neurosci22:443–451.
Schwarz C, Thier P (2000) Functions of the pontine nuclei in cerebro-cerebellar communication. Trends Neurosci 23:152–153.
Smart IH (1984) Histogenesis of the mesocortical area of the mousetelencephalon. J Anat 138:537–552.
Vassbø K, Nicotra G, Wiberg M, Bjaalie JG (1999) Monkey somatosen-sory cerebrocerebellar pathways: uneven densities of corticopontine neu-rons in different body representations of areas 3b, 1, and 2. J CompNeurol 406:109–128.
Webster KE (1961) Cortico-striate interrelations in the albino rat. J Anat95:532–544.
Welker C (1971) Microelectrode delineation of fine grain somatotopicorganization of (SmI) cerebral neocortex in albino rat. Brain Res26:259–275.
Welker C (1976) Receptive fields of barrels in the somatosensory neocor-tex of the rat. J Comp Neurol 166:173–189.
Wiesendanger R, Wiesendanger M (1982) The corticopontine system inthe rat. II. The projection pattern. J Comp Neurol 208:227–238.
Wong-Riley M (1979) Changes in the visual system of monocularly su-tured or enucleated cats demonstrable with cytochrome oxidase histo-chemistry. Brain Res 171:11–28.
Woolsey TA, Van der Loos H (1970) The structural organization of layerIV in the somatosensory region (SI) of mouse cerebral cortex. Thedescription of a cortical field composed of discrete cytoarchitectonicunits. Brain Res 17:205–242.
Wright AK, Norrie L, Ingham CA, Hutton EA, Arbuthnott GW (1999)Double anterograde tracing of outputs from adjacent “barrel columns” ofrat somatosensory cortex. Neostriatal projection patterns and terminalultrastructure. Neuroscience 88:119–133.
8484 J. Neurosci., November 15, 2000, 20(22):8474–8484 Leergaard et al. • Pontine Projections from SI Whisker Barrel Field