Three-dimensional, three-component velocity measurement in an inclined micro-round tube Lisbon 2006
8
Paper#1294 13th Int Symp on Applications of Laser Techniques to Fluid Mechanics Lisbon, Portugal, 26-29 June, 2006 Three-dimensional, three-component velocity measurement in an inclined micro-round tube Nejdet Erkan 1 , Kyosuke Shinohara 2 , Koji Okamoto 3 1: Department of Quantum Eng. and Sys. Science, University of Tokyo, Tokyo, Japan, [email protected] 2: Department of Quantum Eng. and Sys. Science, University of Tokyo, Tokyo, Japan, [email protected] 3: Department of Environmental studies, University of Tokyo, Tokyo, Japan, [email protected] Abstract A tentative study on a technique for measuring the full field (x,y,z,u,v,w) velocity distribution of the fluid flow at the micrometer scale using single high-speed camera, an epifluorescent microscope, a CW laser, and a piezo actuator. To investigate the three-dimensional (3D) flow structures on a microscopic scale flow, 3D scanning micro-particle image velocimetry was applied to the inclined micro round tube. An ensemble of time sequential images was taken, in-plane displacements were eliminated utilizing the iterative image distortion PIV algorithm. Then these images are inter-correlated with the medium image. The correlation peak height alterations are investigated. 1. Introduction Microfluidic devices have been used in many different chemical and biochemical applications (Wilkner et al. 2004). The miniaturization and integration of chemical operations has many advantages, such as increased speed, efficiency, portability and reduced consumption, these are achieved through the merits of scale, short diffusion distances and high interface surface-to-volume ratios. On the micro/nanoscopic scale, the dominant factors affecting fluid dynamics are completely different to those on the macroscopic scale, in particular, surface tension and electrostatic forces are much greater than inertia forces (Eijkel et al. 2005). Thus, the investigation and understanding of fluid dynamics at this scale is indispensable for the efficient design and development of new micro/nanofluidic devices. However, there remain many unsolved problems, especially in multiphase flow systems. The generation of transient vortices at the water/oil interface in a micro counter-current flow system has been reported (Shinohara et al. 2004). The micro counter-current flow system is a highly efficient solvent extraction device used for the detection of very small amounts of metal complexes (Aota et al. 2003) and for the control of very small amounts of dissolved gases (Hibara et al. 2005). Such devices have a width of 100 µm and a depth of 25 µm. Although it can be assumed that, because of their low Reynolds number of less than 0.1, the flow in these devices is strictly laminar, time-resolved fluorescent particle motions indicated that complicated three-dimensional flow fields were occurring at the water/oil interface. Since the flow fields at the interface are a significant factor in mass transport across the water/oil interface, these complex three-dimensional flow fields must be completely understood in order to optimize these solvent extraction devices. The micro-particle image velocimetry (PIV) technique is a popular method for the investigation of mass transport and fluid mechanics on the microscopic scales. In many applications of micro fluidic devices, the flow is three-dimensional. To investigate the flow behavior correctly in these systems such as chaotic mixers or micro vortex separation devices, full field measurements including 3D (x, y, z) and 3C (u, v, w) velocity information should be carried out. A stereoscopic - 1 -
Transcript of Three-dimensional, three-component velocity measurement in an inclined micro-round tube Lisbon 2006

8/13/2019 Three-dimensional, three-component velocity measurement in an inclined micro-round tube Lisbon 2006
http://slidepdf.com/reader/full/three-dimensional-three-component-velocity-measurement-in-an-inclined-micro-round 1/8
Paper#1294 13th Int Symp on Applications of Laser Techniques to Fluid MechanicsLisbon, Portugal, 26-29 June, 2006
Three-dimensional, three-component velocity measurement in an inclined
micro-round tube
Nejdet Erkan1, Kyosuke Shinohara
2, Koji Okamoto
3
1: Department of Quantum Eng. and Sys. Science, University of Tokyo, Tokyo, Japan, [email protected]
2: Department of Quantum Eng. and Sys. Science, University of Tokyo, Tokyo, Japan, [email protected]
3: Department of Environmental studies, University of Tokyo, Tokyo, Japan, [email protected]
Abstract A tentative study on a technique for measuring the full field (x,y,z,u,v,w) velocity distribution ofthe fluid flow at the micrometer scale using single high-speed camera, an epifluorescent microscope, a CWlaser, and a piezo actuator. To investigate the three-dimensional (3D) flow structures on a microscopic scaleflow, 3D scanning micro-particle image velocimetry was applied to the inclined micro round tube. Anensemble of time sequential images was taken, in-plane displacements were eliminated utilizing the iterative
image distortion PIV algorithm. Then these images are inter-correlated with the medium image. Thecorrelation peak height alterations are investigated.
1. Introduction
Microfluidic devices have been used in many different chemical and biochemical applications
(Wilkner et al. 2004). The miniaturization and integration of chemical operations has many
advantages, such as increased speed, efficiency, portability and reduced consumption, these are
achieved through the merits of scale, short diffusion distances and high interface surface-to-volumeratios.
On the micro/nanoscopic scale, the dominant factors affecting fluid dynamics are completely
different to those on the macroscopic scale, in particular, surface tension and electrostatic forces are
much greater than inertia forces (Eijkel et al. 2005). Thus, the investigation and understanding of
fluid dynamics at this scale is indispensable for the efficient design and development of new
micro/nanofluidic devices. However, there remain many unsolved problems, especially in
multiphase flow systems. The generation of transient vortices at the water/oil interface in a micro
counter-current flow system has been reported (Shinohara et al. 2004). The micro counter-current
flow system is a highly efficient solvent extraction device used for the detection of very small
amounts of metal complexes (Aota et al. 2003) and for the control of very small amounts of
dissolved gases (Hibara et al. 2005). Such devices have a width of 100 µm and a depth of 25 µm.Although it can be assumed that, because of their low Reynolds number of less than 0.1, the flow in
these devices is strictly laminar, time-resolved fluorescent particle motions indicated that
complicated three-dimensional flow fields were occurring at the water/oil interface. Since the flow
fields at the interface are a significant factor in mass transport across the water/oil interface, these
complex three-dimensional flow fields must be completely understood in order to optimize these
solvent extraction devices.
The micro-particle image velocimetry (PIV) technique is a popular method for the investigation
of mass transport and fluid mechanics on the microscopic scales. In many applications of micro
fluidic devices, the flow is three-dimensional. To investigate the flow behavior correctly in these
systems such as chaotic mixers or micro vortex separation devices, full field measurementsincluding 3D (x, y, z) and 3C (u, v, w) velocity information should be carried out. A stereoscopic
- 1 -

8/13/2019 Three-dimensional, three-component velocity measurement in an inclined micro-round tube Lisbon 2006
http://slidepdf.com/reader/full/three-dimensional-three-component-velocity-measurement-in-an-inclined-micro-round 2/8
Paper#1294 13th Int Symp on Applications of Laser Techniques to Fluid MechanicsLisbon, Portugal, 26-29 June, 2006
micro-PIV technique has previously been suggested as a three-dimensional measurement method
for determining the velocity distribution in a microfluidic device having complex geometry (Klank
et al. 2002). However, due to the principles of such stereoscopic measurement methods, their spatial
resolution is limited to the sub-millimeter scale. Therefore, the stereo micro-PIV technique is
unsuitable for full field measurements of velocity distribution in very small test sections, such as
those having 100 x 25 µm channels. Park et al 2005 presented three-dimensional micro-PTVmeasurement in microscale using a single camera with deconvolution microscopy. This method
devises tracking of the line-of-sight (z) flow vectors by correlating the diffraction pattern ring size
variation with defocusing distances of small particle locations. Depth-vise spatial measurement
resolution was limited to 5.16 µm in a 100 µm x 100 µm micro-channel.
A three-dimensional (3D) scanning micro-PIV technique, which is reported by Shinohara et al.
2005 , having a micrometer scale spatial resolution is applied to an inclined micro round tube to
develop the 3D-3C velocity measurement technique with a formerly known out of plane velocity
component.
2. Experimental setup
Figure 1 and 2 shows the experimental setup for the 3D scanning micro-PIV technique. The
flow in a micro-round tube was visualized using fluorescent particles. The test fluid was pure water
which was pressure-driven at a constant flow rate using a 100 µL microsyringe pump in a 100
inclined micro-round tube.
The fluid was illuminated with a Nd:YAG CW laser (532 nm) positioned below the microscope
stage. To visualize the internal flow, fluorescent particles of 1.0 µm diameter were seeded into the
water at a concentration of 0.4 % by volume and were uniformly dispersed. The fluorescent
particles absorb green light (~535 nm) and emit orange light (~575 nm). The flow images werecaptured using a high-speed CMOS (Complementary Metal Oxide Semiconductor) camera (512 x
512 pixels, 10-bit grayscale, 6000 frames/s) capable of recording 8000 images via an epi-
fluorescence microscope equipped with an optical filter (λ = 550 nm) and a water-immersion
objective lens ( M = 60, NA = 0.9).
In the micro-PIV technique, the depth of field is described by the formula (Meinhart et al. 2000):
d d
NA
n z ++=
θ
λ δ
tan
16.232 (1)
where n is the index of refraction of the immersion medium between the micro tube and theobjective lens, λ is the wavelength of light in a vacuum, NA is the numerical aperture of the
objective lens, d is the diameter of the PIV particle and θ is the small light collection angle. In this
case, n was 1.3, λ was 575 nm, NA was 0.9 (60x), d was 1.0 µm and tanθ was 0.69. The depth of
field was calculated to be 6.2 µm.
- 2 -
8/13/2019 Three-dimensional, three-component velocity measurement in an inclined micro-round tube Lisbon 2006
http://slidepdf.com/reader/full/three-dimensional-three-component-velocity-measurement-in-an-inclined-micro-round 3/8
Paper#1294 13th Int Symp on Applications of Laser Techniques to Fluid MechanicsLisbon, Portugal, 26-29 June, 2006
High-speed camera
12× 512 pixels 6000 frame/s
Microscope
Water-immersion
objective lens (60x)
Mirror
PCColor filter (550 nm)
Nd:YAG CW laser
λ = 532 nm
Microtube
Syringe 100 µL
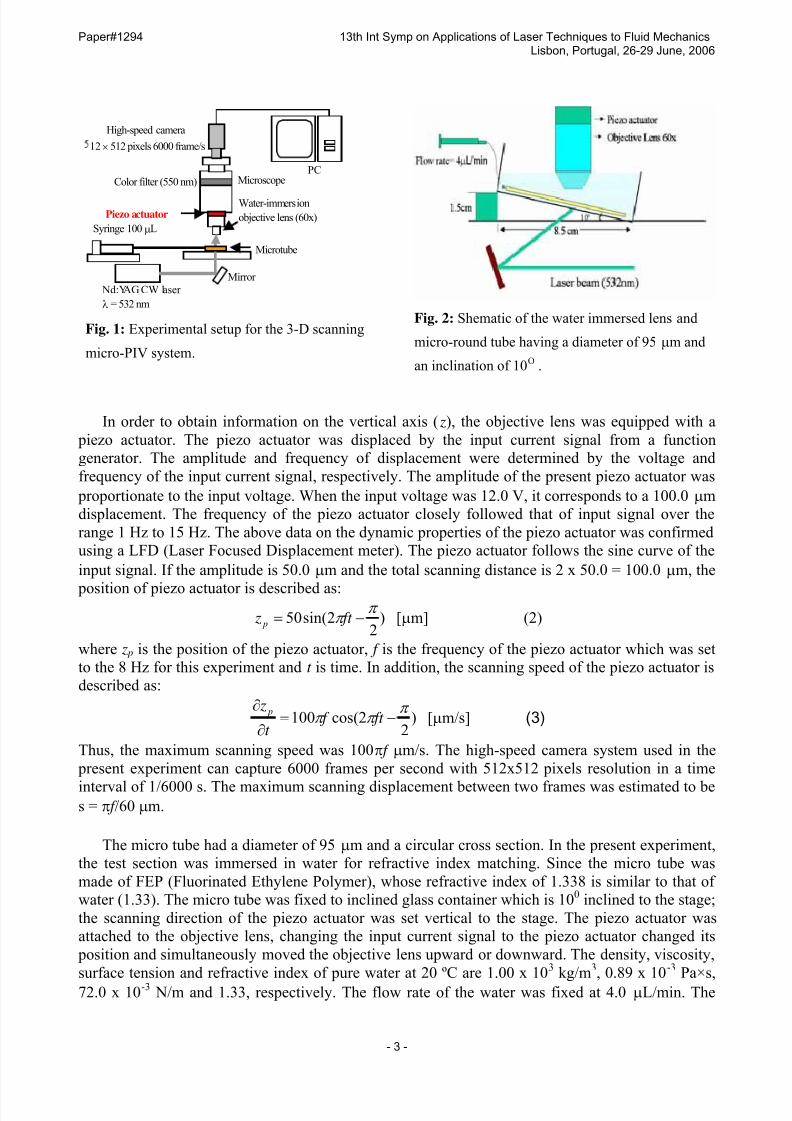
Fig. 1: Experimental setup for the 3-D scanning
micro-PIV system.
Fig. 2: Shematic of the water immersed lens and
micro-round tube having a diameter of 95 µm and
an inclination of 10O .
Piezo actuator
In order to obtain information on the vertical axis ( z), the objective lens was equipped with a
piezo actuator. The piezo actuator was displaced by the input current signal from a function
generator. The amplitude and frequency of displacement were determined by the voltage and
frequency of the input current signal, respectively. The amplitude of the present piezo actuator was
proportionate to the input voltage. When the input voltage was 12.0 V, it corresponds to a 100.0 µm
displacement. The frequency of the piezo actuator closely followed that of input signal over the
range 1 Hz to 15 Hz. The above data on the dynamic properties of the piezo actuator was confirmed
using a LFD (Laser Focused Displacement meter). The piezo actuator follows the sine curve of the
input signal. If the amplitude is 50.0 µm and the total scanning distance is 2 x 50.0 = 100.0 µm, the
position of piezo actuator is described as:
)2
2sin(50 π π −= ft z p [µm] (2)
where z p is the position of the piezo actuator, f is the frequency of the piezo actuator which was set
to the 8 Hz for this experiment and t is time. In addition, the scanning speed of the piezo actuator is
described as:
)2
2cos(100 π π π −=
∂
∂ ft f
t
z p [µm/s] (3)
Thus, the maximum scanning speed was 100π f µm/s. The high-speed camera system used in the
present experiment can capture 6000 frames per second with 512x512 pixels resolution in a time
interval of 1/6000 s. The maximum scanning displacement between two frames was estimated to bes = π f /60 µm.
The micro tube had a diameter of 95 µm and a circular cross section. In the present experiment,
the test section was immersed in water for refractive index matching. Since the micro tube was
made of FEP (Fluorinated Ethylene Polymer), whose refractive index of 1.338 is similar to that of
water (1.33). The micro tube was fixed to inclined glass container which is 100 inclined to the stage;
the scanning direction of the piezo actuator was set vertical to the stage. The piezo actuator was
attached to the objective lens, changing the input current signal to the piezo actuator changed its
position and simultaneously moved the objective lens upward or downward. The density, viscosity,
surface tension and refractive index of pure water at 20 ºC are 1.00 x 10³ kg/m3, 0.89 x 10⁻³ Pa×s,
72.0 x 10⁻³ N/m and 1.33, respectively. The flow rate of the water was fixed at 4.0 µL/min. The
- 3 -

8/13/2019 Three-dimensional, three-component velocity measurement in an inclined micro-round tube Lisbon 2006
http://slidepdf.com/reader/full/three-dimensional-three-component-velocity-measurement-in-an-inclined-micro-round 4/8
Paper#1294 13th Int Symp on Applications of Laser Techniques to Fluid MechanicsLisbon, Portugal, 26-29 June, 2006
corresponding Reynolds number was ρUL/µ = 0.91, where ρ is the density, µ is the viscosity, U is
the axial average velocity and L is the diameter.
3. Methods and results
Calculation procedure composed of two essential parts. First one is the instantaneous in-plane
velocity measurement, the other one is the out of plane velocity measurement. Since the latter is
currently under development some explanation about the tentative results and also some
explanation about the methods are going to be presented in this report.
3.1 PIV evaluation method Instantaneous velocity vector maps are calculated using window deformation iterative multi grid
(WIDIM) image distortion interrogation algorithm (Scarano 2002). This technique is derived from
the pattern image distortion (PID) method proposed by Huang et al (1993) and progressiverefinement of the interrogation window size implementation is added to compensate for the in-plane
flow motion progressively at smaller scale iteration after iteration. (1) The flow images having the
resolution of 512x512 pixels are interrogated with 64x64 pixels 50% overlapped interrogation
window (IW) initially. (2) The obtained displacement data is used to build a predictor displacement
field over all the image pixels. A bilinear interpolation scheme (IS) is used for this purpose. (3) The
two images are deformed according to the displacement of the every pixel. The image deformation
include the re-sampling of the pixel values at intermediate locations, the bi-cubic interpolation
which performs significantly better by halving the error with respect to bi-linear IS (Astarita et al
2005) is applied. Both images are distorted symmetrically to have a second order accurate
estimation of the velocity. (4) The interrogation window size is reduced or halved to finer grid
resolution. (5) The images are interrogated, yielding a displacement field with this finer resolution.(6) The displacement results are validated and added to the previous displacements. (7) The
validated velocity distribution is then used an iterative input to the step 2 until reaching the final
16x16 pixels (4.3x4.3 µm) IW size with 8x8 pixels (2.2x2.2 µm) vector grid spacing.
3.2 Optical Flow images
A sinusoidal 8Hz alternating current, which has amplitude of 12V, was applied to the piezo
actuator. From down to top, during the half period of the piezo actuator’s movement 378 image
sheets are recorded at different cross-sections along the depth-wise direction. Centerline strip,
which has 512-pixel width and 1-pixel height, is taken from every sequential images recordedduring one period (actuator’s up-and-down motion), then, a new optical flow image with a
resolution of 756-pixel width and 512-pixel height is generated.
In Figure 2, reconstruction process is illustrated schematically. Reconstructed optical flow
image, which is made from the images recorded in one period of the piezo actuator, is shown in
Figure 3. On the optical flow image, vertical axis corresponds to the width of the original image,
horizontal axis corresponds to the number of the time sequential image accordingly one period of
piezo.
- 4 -

8/13/2019 Three-dimensional, three-component velocity measurement in an inclined micro-round tube Lisbon 2006
http://slidepdf.com/reader/full/three-dimensional-three-component-velocity-measurement-in-an-inclined-micro-round 5/8
Paper#1294 13th Int Symp on Applications of Laser Techniques to Fluid MechanicsLisbon, Portugal, 26-29 June, 2006
Fig. 2: Reconstruction of new image
from time sequential images. Fig. 3: Reconstructed optical flow image.
On the left side of Figure 3, while the piezo actuator is climbing up on the sine curve, the fluid
accompanied by the tracer particles is flowing from up to down side. Since the picture taken by the
6000frame/sec camera through the objective lens with 6.2 µm depth-of-focus, every subsequent
image overlapped to each other with a particular ratio in the depth-wise direction. It can be expected
that the particle intensity located in the centerline strip will be conserved for a while in the time
sequential images. This evidence appears as the line patterns in the optical image. Vertical projection length of the line patterns are approximately 5 pixels corresponding to 5 time sequential
images.
As for the right side of Figure 3, while the piezo actuator is descending on the sine curve, the
fluid flow and piezo are in the same direction. Therefore, the line patterns can be seen longer.
Vertical projection length of the line patterns are approximately 15 pixels corresponding to 15 time
sequential images. As can be inferred from the optical flow images, this line patterns keep depth
wise velocity information. How to extract this depth wise velocity information with a reasonable
accuracy is a challenging problem.
3.2 Change of correlation in time sequential images without in-plane velocity
In two time sequential micro or macro PIV images, if they are correlated and then they are
deformed with respect to the half of the in-plane displacements they will become almost the same.
If the image recording device, laser sheet or objective lens is moving in the direction of the out of
plane displacements, particle images in two sequential images are not same but still there is a
similarity. If we can measure the change of this similarity and the relation between the
displacements of our correlation plane, it can be expected to reach the real out-of-plane
displacements of the particles. The degree of the similarity between the two image patterns can be
taken as the correlation peak height.
- 5 -
8/13/2019 Three-dimensional, three-component velocity measurement in an inclined micro-round tube Lisbon 2006
http://slidepdf.com/reader/full/three-dimensional-three-component-velocity-measurement-in-an-inclined-micro-round 6/8
Paper#1294 13th Int Symp on Applications of Laser Techniques to Fluid MechanicsLisbon, Portugal, 26-29 June, 2006
(a)(b)
(c) (d)
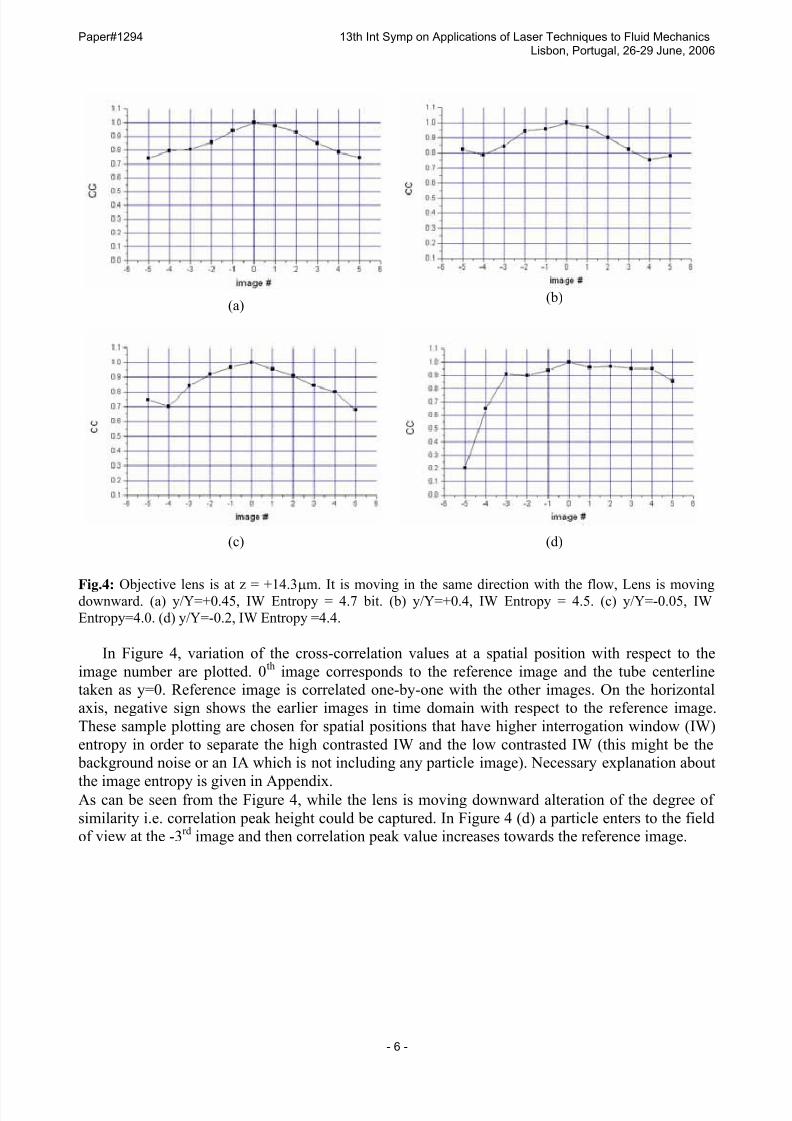
Fig.4: Objective lens is at z = +14.3µm. It is moving in the same direction with the flow, Lens is movingdownward. (a) y/Y=+0.45, IW Entropy = 4.7 bit. (b) y/Y=+0.4, IW Entropy = 4.5. (c) y/Y=-0.05, IW
Entropy=4.0. (d) y/Y=-0.2, IW Entropy =4.4.
In Figure 4, variation of the cross-correlation values at a spatial position with respect to the
image number are plotted. 0th image corresponds to the reference image and the tube centerline
taken as y=0. Reference image is correlated one-by-one with the other images. On the horizontal
axis, negative sign shows the earlier images in time domain with respect to the reference image.
These sample plotting are chosen for spatial positions that have higher interrogation window (IW)
entropy in order to separate the high contrasted IW and the low contrasted IW (this might be the
background noise or an IA which is not including any particle image). Necessary explanation about
the image entropy is given in Appendix.As can be seen from the Figure 4, while the lens is moving downward alteration of the degree of
similarity i.e. correlation peak height could be captured. In Figure 4 (d) a particle enters to the field
of view at the -3rd image and then correlation peak value increases towards the reference image.
- 6 -

8/13/2019 Three-dimensional, three-component velocity measurement in an inclined micro-round tube Lisbon 2006
http://slidepdf.com/reader/full/three-dimensional-three-component-velocity-measurement-in-an-inclined-micro-round 7/8
Paper#1294 13th Int Symp on Applications of Laser Techniques to Fluid MechanicsLisbon, Portugal, 26-29 June, 2006
(a)(b)
(c) (d)
Fig. 5: Objective lens is at z = +11.5µm. It is moving in the inverse direction with the flow, Lens is movingupward. (a) y/Y=-0.2, IW Entropy=5.0 bit. (b) y/Y= +0.2, IW Entropy=5.3 bit. (c) y/Y=-0.15, IW
Entropy=4.9 bit. (d) y/Y=-0.05, IW Entropy=4.7 bit
As for the Figure 5, objective lens is mowing upward inverse to the depth wise component of the
flow velocity, therefore, correlation peak height alteration becomes steeper. As shown in the left
side of the Figure 3, line patterns are shorter than the right side. This is reflected to the correlation
graphs such that some correlation values at the tail of the graphs do not represent the similarity to
the reference image.
4. Conclusion
Micro-PIV scanning system was applied to the inclined micro round tube aiming the
measurement of the 3D3C velocity field using single high-speed camera, CW laser, epifluorescent
microscope and piezo actuator. Iterative image deformation PIV algorithm is applied. In-plane
velocity measurement was carried out. A reference distorted image (in-plane velocity component
have already been eliminated) cross-correlated with the 5 former and 5 latter time sequential images
one-by-one. In-plane relative displacements were removed by deforming the two correlated images
with respect to each other. Correlation peak height alteration captured clearly in time sequential
image assemblies. From these correlation gradients, extraction of depth-wise velocity component
could seem to be straight forward, however, it still needs huge improvements in the aspect of the
correlation algorithm and post processing which includes generation of calibration curve for a particular phezo actuator characteristics.
- 7 -

8/13/2019 Three-dimensional, three-component velocity measurement in an inclined micro-round tube Lisbon 2006
http://slidepdf.com/reader/full/three-dimensional-three-component-velocity-measurement-in-an-inclined-micro-round 8/8
Paper#1294 13th Int Symp on Applications of Laser Techniques to Fluid MechanicsLisbon, Portugal, 26-29 June, 2006
Appendix
Image entropy is defined as the following (Gonzalez et al. 2002):
A random event occurs with the probability of P (E) is said to contain:
)(log)(
1log)( E P E P
E I −== (A1)
units of information. I(E) called as self information of E. The amount of self-information attributed
to event E is inversely related to the probability of E.
The set of source symbols {a1,a2,….,aJ}is referred to as source alphabet A. a j are the eymbols or
letters.
1)(1
=∑=
J
j
jaP (A2)
Average information per source (per pixel) output:
)(log)(1
j
J
j
j aPaP H ∑=
−= (A3)
This quantity is called the uncertainty or entropy of the source. If the source symbols are equally
probable, the entropy or uncertainty is maximized and the source provides the greatest possible
average information per source symbol. (Base of logarithm was taken 2 to determine the unit as
bit).
References
Aota A, Nonaka M, Hibara A, Kitamori T (2003) Proc. µ-TAS (Squaw Valley) Vol.1,p441.Astarita T, Cardone G (2005) Analysis of interpolation schemes for image deformation methods in PIV, Exp.
Fluids 38:233-243.
Eijkel JCT, van den Berg A (2005) Nanofluidics: what is it and what can we expect from it? Microfluidics
and Nanofluidics 1(3):249-276.
Hibara A, Iwayama S, Matsuoka S, et al. (2005) Surface modification method of micro channels for gas-
liquid two-phase flow in micro chips, Analytical Chemistry 77(3):943-947
Huang H T, Fielder H F, Wang J J. (1993) Limitation and improvement of PIV, part I. Limitation of
conventional techniques due to the deformation of particle image patterns. Exp. Fluids 15:168-74.
Klank H,Goranovic G, Kutter JP, et al.(2002) PIV measurements in a microfluidic 3D-sheating structure
with three-dimensional flow behaviour. Journal of Micromechanics and Microengineering 12(6):862-869.
Meinhart CD, Wereley ST, Gray MHB (2000) Volume illumination for two-dimensional particle image
velocimetry, Measurement Science and Technology 11(6):809-814.Park J S, Kihm K D (2005) Three-dimensional micro-PTV using deconvolution microscopy 40:491-499
Gonzalez RC, Woods RE (2002) Digital image processing, Prentice-Hall, Inc.
Scarano F (2002) Iterative image deformation methods in PIV, Meas. Sci. and Technol. 13:R1-R9
Shinohara K, Sugii Y, Aota A, et al. (2004) High-speed micro-PIV measurements of transient flow in
microfluidic devices Measurement Science & Technology 15 (10): 1965-1970
Shinohara K, Sugii Y, Jeong H J, Okamoto K (2005) Development of a three-dimensional scanning micro
particle image velocimetry system using a piezo actuator, Review of Scientific Instruments 76(10):106-109
Vilkner T, Janasek, Manz A (2004) Micro total analysis systems. Recent developments, Analytical
Chemistry 76(12):3373-3385.
- 8 -