Three-dimensional sphericity, roundness and fractal dimension...
13
Three-dimensional sphericity, roundness and fractal dimension of sand particles B. ZHOU , J. WANG† and H. WANG Particle morphological features at different scale levels hold the key to understanding the geological origin and mechanical behaviourof natural sands. In this context, it is necessary to characterise and quantify these morphological features by defining a series of reasonable descriptors. In this study, based on X-ray micro-computed tomographic (μCT) images collected from a series of image-processing techniques, the authors first introduced spherical harmonic analysis to reconstruct a three-dimensional (3D) realistic surface of the sand particles. Then 3D sphericity, roundness and fractal dimensionwere introduced to define the global form, local features and surface textures of the particle morphology. Based on the spherical harmonic–reconstructed surface, a novel framework was established to measure the descriptors of 3D sphericity, roundness and fractal dimension of sand particles. The 3D fractal dimension was an original descriptor used to characterise the fractal nature of the surface textures of real sand particle morphology. By using the proposed methods, these morphological descriptorswere measured for two types of natural sand particle. The statistical results show clear correlations between different descriptors at different characteristic scales. The correlation relies heavily upon the distance between the characteristic scales of the morphological descriptors. KEYWORDS: discrete-element modelling; fractals; sands; soil classification INTRODUCTION Particle morphology is an inherent soil characteristic that plays an important role in understanding the mechanical behaviour of natural sands. Many experimental studies have shown that the macroscopic mechanical properties of sands, such as their compressibility, shear strength, crushability and critical state behaviour, are highly influenced by the mor- phological features of the particles (Guo & Su, 2007; Rousé et al., 2008; Tsomokos & Georgiannou, 2010; Altuhafi & Coop, 2011). As an alternative to investigating fundamental soil behaviour, the discrete-element method, first proposed by Cundall & Strack (1979), has made significant contri- butions to the elucidation of the micromechanics of particle morphology that affect the mechanical properties of sands (Wang & Gutierrez, 2010; Mahmood & Iwashita, 2011; Zhou et al., 2013). To determine the effects of particle morphology on mechanical properties of sands in both experimental and numerical frameworks, it is necessary to characterise and quantify the morphological features of the particle in advance. In this context, three descriptors, including sphericity, roundness and fractal dimension, are widely accepted to define particle morphology at different length scales in terms of global form, local features and surface textures (Soga & Mitchell, 2005; Blott & Pye, 2008). The fractal dimension, which characterises the self-similar nature of particle morphology, is a scientific topic that has intrigued many authors (e.g. Hyslip & Vallejo, 1997; Santamarina & Cho, 2004; Langroudi et al., 2014; Hanaor et al., 2016). Sphericity and roundness have traditionally been used to classify and quantify the morphological properties of soils in engineering and geology (Mehring & McBride, 2007; Santamarina & Cho, 2014). According to Wadell (1935), sphericity is quantified by comparing the surface area of a particle to that of a sphere with equal volume, and roundness is quantified by the average ratio of the curvature radius of all corners to the radius of the largest inscribed sphere of a particle. In engineering applications, two-dimensional (2D) sphericity and roundness are easily measured by comparing the microscopic view with the standard chart provided by Krumbein & Sloss (1963) and ASTM International (ASTM, 2009). With the development of micrography and image- processing techniques, 2D sphericity, roundness and some other descriptors (e.g. compactness, convexity, angularity and principal dimensions) can be measured by image analysis and computational geometry from 2D projections of particles (Mora & Kwan, 2000; Sukumaran & Ashmawy, 2001; Altuhafi et al., 2012). To quantify the surface textures and roughness details of particles, different definitions have been introduced, including the Alshibli et al. (2014) material roughness indices (i.e. average and root-mean- square roughness) for a local area, Zheng & Hryciw (2015) statistical indices (i.e. locally weighted regression and k-fold cross-validation) and the Fourier descriptors of Bowman et al. (2001) and Mollon & Zhao (2012) for 2D projections. With regard to the earlier studies in a 2D framework, it should be emphasised that measuring 2D sphericity, round- ness and fractal dimension from a random projection of particles always results in random and inaccurate values. Hence, the measurement of three-dimensional (3D) spheri- city, roundness and fractal dimension is significant for the authenticity and accuracy of the quantification of particle morphology. In the past two decades, the development of X-ray micro-computed tomography (μCT) technology has provided apowerful tool for 3D visualisation and character- isation of the internal microstructures and morphological features of sand particles (Fonseca et al., 2012; Alshibli Department of Civil Engineering and Mechanics, Huazhong Universityof Science and Technology, Wuhan, P. R. China. † Department of Architecture and Civil Engineering, City University of Hong Kong, Kowloon, Hong Kong. Manuscript received 8 August 2016; revised manuscript accepted 11 April 2017. Discussion on this paper is welcomed by the editor. Zhou, B. et al. Géotechnique [http://dx.doi.org/10.1680/jgeot.16.P.207] 1 Offprint provided courtesy of www.icevirtuallibrary.com Author copy for personal use, not for distribution
Transcript of Three-dimensional sphericity, roundness and fractal dimension...

Three-dimensional sphericity, roundness andfractal dimension of sand particles
B. ZHOU�, J. WANG† and H. WANG�
Particle morphological features at different scale levels hold the key to understanding the geologicalorigin and mechanical behaviour of natural sands. In this context, it is necessary to characterise andquantify these morphological features by defining a series of reasonable descriptors. In this study, basedon X-ray micro-computed tomographic (μCT) images collected from a series of image-processingtechniques, the authors first introduced spherical harmonic analysis to reconstruct a three-dimensional(3D) realistic surface of the sand particles. Then 3D sphericity, roundness and fractal dimension wereintroduced to define the global form, local features and surface textures of the particle morphology.Based on the spherical harmonic–reconstructed surface, a novel framework was established to measurethe descriptors of 3D sphericity, roundness and fractal dimension of sand particles. The 3D fractaldimension was an original descriptor used to characterise the fractal nature of the surface textures ofreal sand particle morphology. By using the proposed methods, these morphological descriptors weremeasured for two types of natural sand particle. The statistical results show clear correlations betweendifferent descriptors at different characteristic scales. The correlation relies heavily upon the distancebetween the characteristic scales of the morphological descriptors.
KEYWORDS: discrete-element modelling; fractals; sands; soil classification
INTRODUCTIONParticle morphology is an inherent soil characteristic thatplays an important role in understanding the mechanicalbehaviour of natural sands. Many experimental studies haveshown that the macroscopic mechanical properties of sands,such as their compressibility, shear strength, crushability andcritical state behaviour, are highly influenced by the mor-phological features of the particles (Guo & Su, 2007; Rouséet al., 2008; Tsomokos & Georgiannou, 2010; Altuhafi &Coop, 2011). As an alternative to investigating fundamentalsoil behaviour, the discrete-element method, first proposedby Cundall & Strack (1979), has made significant contri-butions to the elucidation of the micromechanics of particlemorphology that affect the mechanical properties of sands(Wang & Gutierrez, 2010; Mahmood & Iwashita, 2011;Zhou et al., 2013). To determine the effects of particlemorphology on mechanical properties of sands in bothexperimental and numerical frameworks, it is necessary tocharacterise and quantify the morphological features of theparticle in advance. In this context, three descriptors,including sphericity, roundness and fractal dimension, arewidely accepted to define particle morphology at differentlength scales in terms of global form, local features andsurface textures (Soga & Mitchell, 2005; Blott & Pye, 2008).The fractal dimension, which characterises the self-similarnature of particle morphology, is a scientific topic thathas intrigued many authors (e.g. Hyslip & Vallejo, 1997;Santamarina & Cho, 2004; Langroudi et al., 2014; Hanaoret al., 2016).
Sphericity and roundness have traditionally been usedto classify and quantify the morphological properties of soilsin engineering and geology (Mehring & McBride, 2007;Santamarina & Cho, 2014). According to Wadell (1935),sphericity is quantified by comparing the surface area of aparticle to that of a sphere with equal volume, and roundnessis quantified by the average ratio of the curvature radius of allcorners to the radius of the largest inscribed sphere of aparticle. In engineering applications, two-dimensional (2D)sphericity and roundness are easily measured by comparingthe microscopic view with the standard chart provided byKrumbein & Sloss (1963) and ASTM International (ASTM,2009). With the development of micrography and image-processing techniques, 2D sphericity, roundness and someother descriptors (e.g. compactness, convexity, angularityand principal dimensions) can be measured by imageanalysis and computational geometry from 2D projectionsof particles (Mora & Kwan, 2000; Sukumaran & Ashmawy,2001; Altuhafi et al., 2012). To quantify the surface texturesand roughness details of particles, different definitionshave been introduced, including the Alshibli et al. (2014)material roughness indices (i.e. average and root-mean-square roughness) for a local area, Zheng & Hryciw(2015) statistical indices (i.e. locally weighted regressionand k-fold cross-validation) and the Fourier descriptorsof Bowman et al. (2001) and Mollon & Zhao (2012) for2D projections.With regard to the earlier studies in a 2D framework, it
should be emphasised that measuring 2D sphericity, round-ness and fractal dimension from a random projection ofparticles always results in random and inaccurate values.Hence, the measurement of three-dimensional (3D) spheri-city, roundness and fractal dimension is significant for theauthenticity and accuracy of the quantification of particlemorphology. In the past two decades, the development ofX-ray micro-computed tomography (μCT) technology hasprovided a powerful tool for 3D visualisation and character-isation of the internal microstructures and morphologicalfeatures of sand particles (Fonseca et al., 2012; Alshibli
� Department of Civil Engineering and Mechanics, HuazhongUniversity of Science and Technology, Wuhan, P. R. China.† Department of Architecture and Civil Engineering, CityUniversity of Hong Kong, Kowloon, Hong Kong.
Manuscript received 8 August 2016; revised manuscript accepted 11April 2017.Discussion on this paper is welcomed by the editor.
Zhou, B. et al. Géotechnique [http://dx.doi.org/10.1680/jgeot.16.P.207]
1
Offprint provided courtesy of www.icevirtuallibrary.comAuthor copy for personal use, not for distribution

et al., 2014; Zhao et al., 2015). Based on μCT images, thecalculation methods of these 3D morphological factors canbe divided into two groups. The first relies on the applicationof image analysis and computational geometry to theμCT images. It is easy to measure the volume, the momentof inertia and the principal dimensions of the particlesby applying simple algorithms to their component voxels(Fonseca et al., 2012; Zhao et al., 2015). However, it is still achallenge to measure the reasonable particle surface area dueto its scale-dependent characteristic (Hanaor et al., 2014)and the error in boundary-detection algorithms (Fonseca,2011). From μCT images, a particle’s surface can be capturedby a series of boundary voxels that are identified by theboundary-detection algorithm and connectivity criterion.However, the voxel-constructed surface is always char-acterised by a saw-tooth pattern and overlapping voxelsinduced by the high-order connectivity. For this reason,at the analysis scale of μCTresolution, the voxel-constructedsurface always results in an overestimation of the reasonablesurface area that greatly influences the accuracy of themeasured sphericity (Zhou et al., 2015). Moreover, it isalso impossible to obtain the correct surface curvatureand roundness of the particle from this kind of unsmoothsurface.
The other group mainly includes mathematical approachesto calculating the geometric properties based on a particlesurface reconstructed from μCT images (Alshibli et al., 2014;Zhao & Wang, 2016). To reconstruct the particle surface,a variety of smoothing algorithms (Field, 1988; Kobbeltet al., 2001) have been proposed to simultaneously removethe stair-steps and preserve the overall particle morphology.In this context, the efficiency of surface smoothing reliesheavily upon the μCT resolution and the algorithm mechan-ism. Mathematically, particle surfaces reconstructed in thisfashion are still not strictly continuous and differentiable,which leads to an inaccurate estimate of the surface curvatureand roundness. To overcome this problem, Mollon &Zhao (2013, 2014) and Hanaor et al. (2015) proposed theproduction of virtual sand particles through the 3D inter-polation of three orthogonal 2D cross-sections simulatedby Fourier descriptors and fractal geometry. However, theartificial choice of these cross-sections probably resulted ina loss of the local features of the particle morphology,especially for highly irregular particles. For these reasons,the authors introduced a more sophisticated method usingspherical harmonic (SH) analysis to characterise the 3Dparticle morphology and reconstruct its continuous particlesurface (Zhou & Wang, 2015, 2017; Zhou et al., 2015). Inaddition, the measurement of 3D fractal dimension for theclosed surfaces of sand particles is still a major challenge thathas not yet been overcome.
Hence, this study mainly developed practical approachesto calculate the 3D sphericity and roundness of real sandparticles and further proposed a novel method to calculatethe fractal dimension for a 3D closed particle surface. First,high-resolution X-ray scanning was conducted to obtainμCT images of two types of natural sand particles: LeightonBuzzard sand (LBS) particles and highly decomposed granite(HDG) particles. A series of image-processing techniqueswere then applied to the μCT images to extract themorphological information of each individual particle. The3D particle surface was then reconstructed using SH analysis.Based on the SH-reconstructed particle surface, calculationsof the surface area and local surface curvature weredeveloped and discussed to further measure the 3D spheri-city and roundness of the sand particles. Furthermore, afractal dimension for the 3D closed surface of sand particleswas defined, and its innovative measurement method wasestablished by combining SH analysis and image analysis.
The statistics of these morphological descriptors are dis-cussed here to validate the efficiency of the proposedcalculation methods in this study.
RECONSTRUCTION OF PARTICLE SURFACEμCT reconstruction and image processingLeighton Buzzard sand is quarried near the town of
Leighton Buzzard in southeast England. It comes from thelower Greensand sequence, which was deposited in shallowsea and estuarine environments. The mineralogy is predomi-nantly quartz with some feldspar and is characterised bychemical inertness and considerable hardness. The roundedand smooth particle morphology, as shown in Figs 1(a) and1(c), may be the result of geological transportation processes.HDG, commonly found in Hong Kong, is mainly producedfrom the weathering and erosion of granitic rock outcrops.The particle morphology of HDG is always characterised bylocal angularity, roughness and some surface cavities, asshown in Figs 1(b) and 1(d). To implement the μCT scanningof the sand particles, about 120 LBS particles and 80 HDGparticles between 1·18 mm and 2·36 mm were randomlyselected from the screening packing. For each type of sand,several layers of particles were placed in a small polycarbo-nate pipe with a diameter of 16 mm and a height of 20 mmand fixed with silicone oil, as illustrated in Figs 1(a) and 1(b).A Carl Zeiss CT system (Metrotom 1500), provided bythe Shenzhen Meixin Testing Technology Co. Ltd was usedto conduct high-resolution X-ray μCT scanning and volumereconstruction of these two specimens. The voxel size of thereconstructed μCT images was 32·65 μm due to the size ofthe specimen and the total pixels of the detector.To extract and separate the scanned particles, the re-
constructed 3D μCT images were put through a series ofimage-processing steps. The built-in 3D segmentation plug-in(Ollion et al., 2013) within the image-processing packageImageJ (Abràmoff et al., 2004) was used in this study. Theseimage-processing techniques mainly included segmentingdifferent phases, reducing noise and separating and labellingindividual particles. The solid phases (i.e. sand particles)were first distinguished from the void and silicone greaseusing thresholding, and binary CT images were obtained,with the solid pixels being white and the background pixelsblack. A 3Dmedian filter with an intensity level of five pixelswas then used to reduce the noise within the binary μCTimages. To separate the particles in contact, a modified 3Dwatershed was applied to the μCT images to preventover-segmentation. Finally, the individual particles werelabelled with sequential grey levels using a simple segmenta-tion algorithm. The processed μCT images were renderedand visualised in Figs 1(c) and 1(d).
Spherical harmonic reconstruction of particle surfaceThe authors proposed to reconstruct the particle surface
by SH analysis, which has been proven to be a powerfultool to represent particle morphological features at multiplescale levels (Zhou & Wang, 2015, 2017; Zhou et al., 2015).For completeness, the SH theory used is briefly introducedhere. Within the μCT images that were subjected to theimage-processing techniques mentioned in the previoussection, the voxels of each particle could be easily identifiedby their labelled grey level. The intrinsic function ‘bwperim’in Matlab (Mathworks, 2010) was then used to detect theboundary voxels of a selected particle. A set of marginalvertices (x, y, z) can be determined by the spatial positionsof these boundary voxels and by the voxel resolution (i.e. thewidth of each voxel). As expressed in equation (1), the firststep of SH analysis is to expand the polar radius from a unit
ZHOU, WANG AND WANG2
Offprint provided courtesy of www.icevirtuallibrary.comAuthor copy for personal use, not for distribution

sphere to the particle profile composed of the marginalvertices (x, y, z) and to calculate the associated SHcoefficients
rðθ; ϕÞ ¼X1n¼0
Xnm¼�n
amn Ymn ðθ;ϕÞ ð1Þ
where r(θ, ϕ) is the polar radius from the particle centre withthe spherical coordinates θ [ 0; π½ � and ϕ[ [0, 2π], whichcan be obtained by the Cartesian-to-spherical coordinateconversion from (x, y, z); Yn
m (θ, ϕ) is the SH series givenby equation (2); and an
m is the associated SH coefficient thatneeds to be determined.
Ymn ðθ; ϕÞ ¼
ffiffiffiffiffiffiffiffiffiffiffiffiffiffiffiffiffiffiffiffiffiffiffiffiffiffiffiffiffiffiffiffiffiffið2nþ 1Þðn�mÞ!
4πðnþmÞ!
sPmn ðcos θÞei mϕ ð2Þ
where Pnm (x) are the associated Legendre polynomials
defined by the differential equation
Pmn ðxÞ ¼
ð�1Þm2nn!
1� x2� �m=2 dnþm
dxnþm x2 � 1� �n ð3Þ
where n and m are the degree and order of Pnm (x),
respectively. Note that n is a non-negative integer from zeroto infinity according to the required fitting precision, andthus the total number of one set of an
m is (n+1)2.Taking r(θ, ϕ) as the input on the left side of equation (1),
a linear system of equations is obtained with (n+1)2
unknowns. The authors (Zhou & Wang, 2015, 2017) havealready proven that SH analysis is sufficient (i.e. the localerror is less than 2% at the μCT scanning scale) to representthe local morphological features (i.e. local roundness andsurface textures) of the particle surface when the maximum
(c) (d)
(a) (b)
2 mm2 mm
Fig. 1. Scanning specimens and volume rendering of μCT images: (a) a layer of LBS particles; (b) a layer of HDG particles; (c) μCT images ofLBS particles; (d) μCT images of HDG particles
3D SPHERICITY, ROUNDNESS AND FRACTAL DIMENSION OF SAND PARTICLES 3
Offprint provided courtesy of www.icevirtuallibrary.comAuthor copy for personal use, not for distribution
SH degree is greater than 15. With the current μCTresolution, the number of surface vertices is approximately20 000, which is large enough to uniquely solve this equationsystem. Adopting the standard least-squares estimation, it iseasy to determine its optimised solution of an
m. Note that thisset of an
m includes all complex numbers due to the propertiesof the associated Legendre polynomials. By using theobtained an
m and a mapping spherical mesh (see Fig. 2), itis possible to reconstruct the continuous fitting surface of the
particle by using
rðθ; ϕÞ ¼Xnmax
n¼0
Xnm¼�n
amn Ymn ðθ;ϕÞ ð4Þ
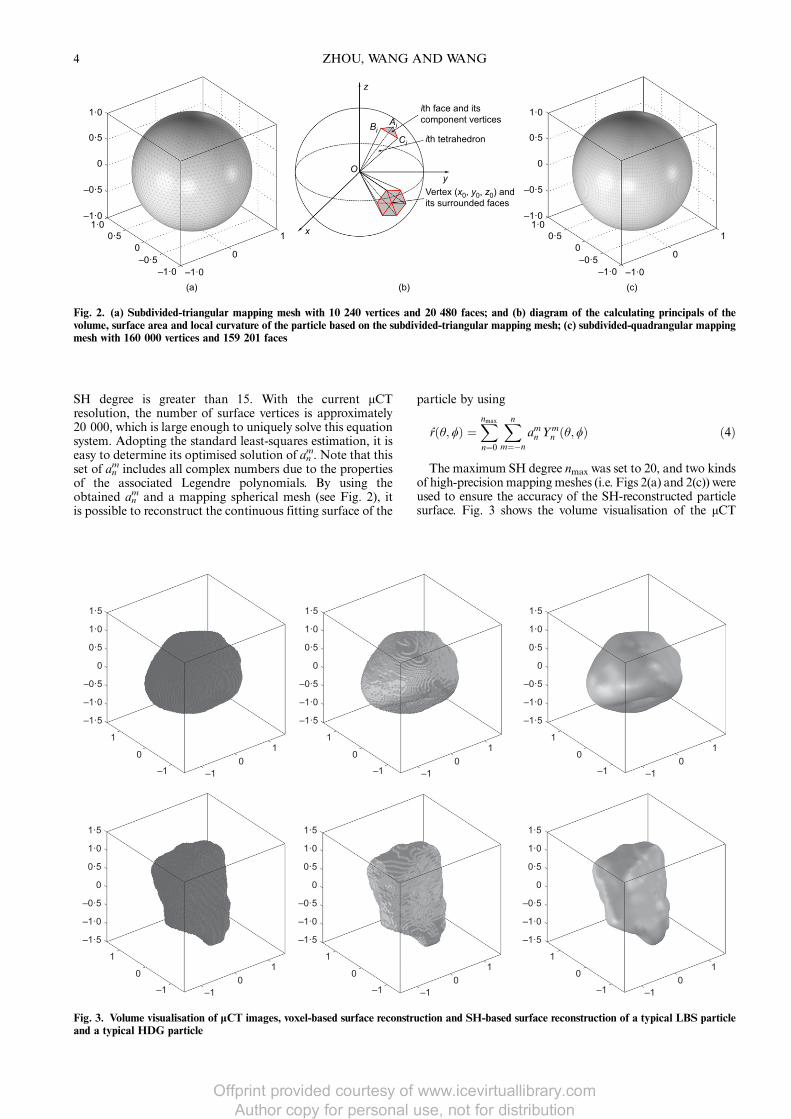
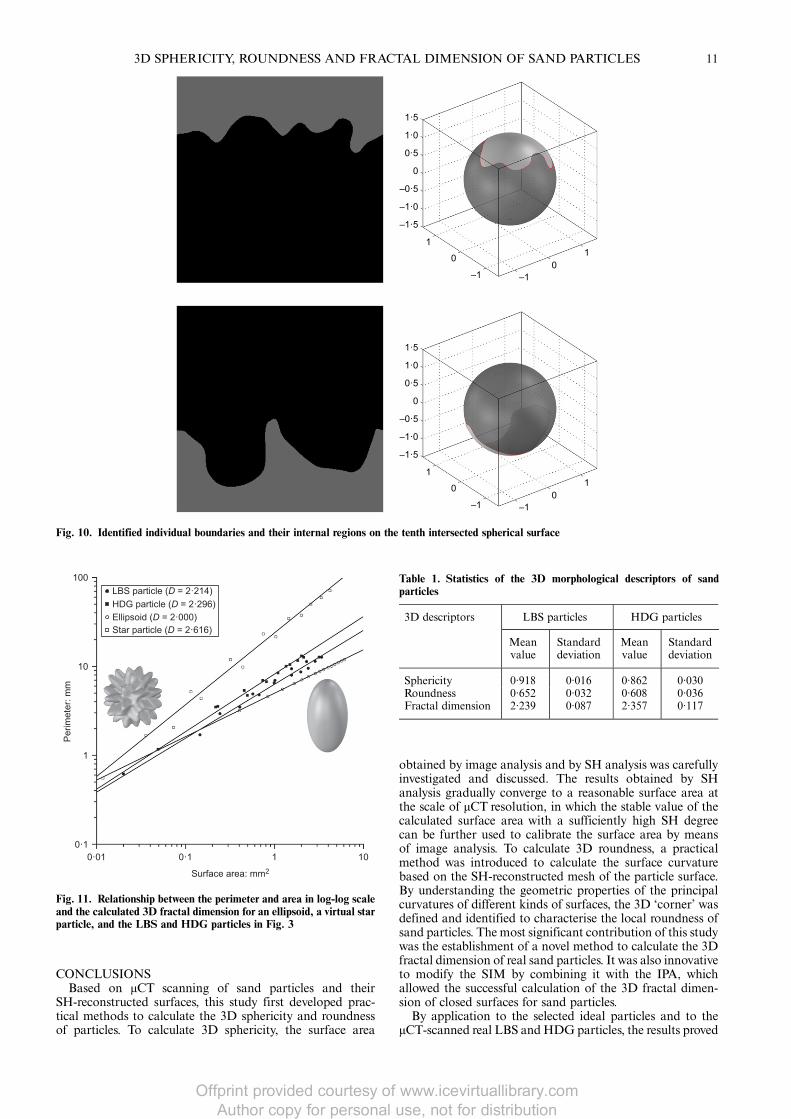
The maximum SH degree nmax was set to 20, and two kindsof high-precisionmappingmeshes (i.e. Figs 2(a) and 2(c)) wereused to ensure the accuracy of the SH-reconstructed particlesurface. Fig. 3 shows the volume visualisation of the μCT
1·0
0·5
0
–0·5
–1·01·0
0·5
–0·5–1·0 –1·0
0
10
1·0
0·5
0
–0·5
–1·01·0
0·5
–0·5–1·0 –1·0
0
ith face and itscomponent vertices
ith tetrahedron
10
z
x
yO
BiAi
Ci
(a) (b) (c)
Vertex (x0, y0, z0) andits surrounded faces
Fig. 2. (a) Subdivided-triangular mapping mesh with 10 240 vertices and 20 480 faces; and (b) diagram of the calculating principals of thevolume, surface area and local curvature of the particle based on the subdivided-triangular mapping mesh; (c) subdivided-quadrangular mappingmesh with 160 000 vertices and 159 201 faces
1·0
1·5
0·5
0
–0·5
–1·5
–1·0
1
–1 –10
10
1·0
1·5
0·5
0
–0·5
–1·5
–1·0
1
–1 –10
10
1·0
1·5
0·5
0
–0·5
–1·5
–1·0
1
–1 –10
10
1·0
1·5
0·5
0
–0·5
–1·5
–1·0
1
–1 –10
10
1·0
1·5
0·5
0
–0·5
–1·5
–1·0
1
–1 –10
10
1·0
1·5
0·5
0
–0·5
–1·5
–1·0
1
–1 –10
10
Fig. 3. Volume visualisation of μCT images, voxel-based surface reconstruction and SH-based surface reconstruction of a typical LBS particleand a typical HDG particle
ZHOU, WANG AND WANG4
Offprint provided courtesy of www.icevirtuallibrary.comAuthor copy for personal use, not for distribution

images, voxel-based surface reconstruction and SH-basedsurface reconstruction of a typical LBS particle and atypical HDG particle. It is can be clearly seen that thevoxel-based surface contains many jagged stair-steps, whereasthe SH-based surface possesses smooth and continuouscharacteristics. From visual inspection, the morphologicalfeatures of the SH-reconstructed surface agree well withthe microscopic view of the sand particle in Figs 1(a) and1(b). According to previous findings by the authors, theSH-reconstructed surface has three major advantages: (a) it isa progressive accumulation of surface textures; (b) it is a globaloptimisation to minimise the error to the original particlesurface; and (c) it has the characteristics of the SH function,including continuity and differentiability.
MORPHOLOGICAL DESCRIPTORSOF SAND PARTICLESThree-dimensional sphericityThe commonly used sphericity definition first proposed
by Wadell (1935) indicates the ratio of the surface area ofa sphere with the same volume as the given particle to thesurface area of the particle, as expressed by
S ¼ffiffiffiffiffiffiffiffiffiffiffiffiffiffi36πV 23
p
SAð5Þ
where S is the 3D sphericity of the given particle, and V andSA are the volume and the surface area of the given particle,respectively.Using equation (5), it is easy to calculate the 3D sphericity
of a given particle if its accurate volume and surface area areobtained. To calculate the particle’s volume and surfacearea, two methods are introduced based on image analysisand SH analysis, respectively. Based on image analysis ofthe μCT images, the volume and the surface area can beeasily obtained by counting the number of total voxelsand boundary voxels, respectively. With regard to SHanalysis, many studies have focused on the mathematicalcalculations of its geometrical properties, including volume,surface area, inertia of the moment and surface curvature(Garboczi, 2002; Bullard & Garboczi, 2013; Zhou et al.,2015). However, these mathematical calculations have alwaysinvolved complicated derivations and large computations.Hence, the present authors proposed a simple and practicalmethod based on the SH-reconstructed surface mesh tocalculate the particle’s volume, surface area and localsurface curvature. In this and the following section, thesubdivided triangular mesh (see Fig. 2(a)) is used asthe mapping spherical mesh of the SH reconstruction.As illustrated in Fig. 2(b), the particle’s surface area andvolume are the sum of the micro-surface area of all faces andthe sum of the micro-volume of all tetrahedrons, which canbe expressed by
SA ¼Xi
12AiBi
��*� BiCi
��*�������� ð6Þ
V ¼Xi
16OAi
��*� OBi
��*�OCi
��*� ��������� ð7Þ
where O is the centre of the particle and Ai, Bi and Ci are thecomponent vertices of the ith face of the surface mesh.To validate the efficiency of these two methods, a unit
octahedron and an ellipsoid with principal dimensions of2, 1 and 1 mm were selected to calculate their volumeand surface area. Fig. 4(a) shows the evolution of the particlevolume from the CT reconstruction and the SH
reconstruction with the increasing voxel resolution and SHdegree. The results obtained with both methods rapidlyconverge to the theoretical value as the voxel resolution andSH degree increase. Therefore, it can be concluded that bothmethods are capable of accurately calculating the volume ofparticles if the voxel resolution and the SH degree aresufficiently high. This result also proves the efficiency of SHreconstruction in representing the particle morphology.To calculate the particle surface area by image analysis,
the boundary voxels should first be identified with theboundary-detection algorithm combined with voxel connec-tivity criterion. In image analysis, there are three typicalconnectivities or neighbourhood relations between 3D voxels.The terms six-, 18- and 26-connectivity are used according tothe number of voxels that have a common face, common edgeor common vertex with a given voxel, respectively (Fonseca,2011). To investigate the influence of voxel resolution andvoxel connectivity on the calculated surface area, Figs 4(b)and 4(c) present the development of the calculatedsurface area of ideal particles (i.e. the unit octahedron andthe ellipsoid) and real sand particles (i.e. the LBS particleand HDG particle in Fig. 3, respectively. The surface areacalculated by image analysis observably increases as the voxelresolution and connectivity order increase, especially in thelatter case. Specifically, in Fig. 4(b), most of the imageanalysis results deviate from the theoretical value of thesurface area. With regard to SH analysis, the results graduallyconverge to a stable value for both ideal particles and realsand particles. The stable results for ideal particles agree wellwith their theoretical values. Fig. 3 demonstrates the reasonwhy SH analysis instead of image analysis can obtain areasonable particle surface area. The boundary voxelsdetected by higher-order connectivity are highly overlapping,which always results in an overestimation of the calculatedsurface area. Consequently, the surface area calculated byimage analysis is highly sensitive to the connectivity order, asshown in Figs 4(b) and 4(c). For this reason, Fonseca (2011)suggested that lower-order connectivity should be used forhighly complex and irregular particles to avoid overestimationof the surface area. In contrast, for the SH-reconstructedsurface, it optimally fits the original particle profile andretains the smooth and continuous properties of the realparticle surface at this observation scale. Two major con-clusions can be drawn: (a) the measurement of surface area byimage analysis is uncertain and (b) the measurement ofsurface area by SH analysis is able to achieve a reasonableresult when the SH degree is sufficiently high.To calibrate the surface area calculated by image analysis,
Fig. 5 plots the correlation between the results of the surface areaof sand particles by SH analysis and by image analysis. A linearcorrelation can be clearly observed for the particles in whichdifferent slopes are obtained for different connectivities.Therefore, the calibration of the image-based surface area(SAimage) of these two types of sand particles can be expressed by
SAimage ¼ αSASH ð8Þwhere α is the correction coefficient that is the reciprocalof the line slope in Fig. 5. For LBS and HDG particles,the α value is 1·08 and 1·2 for six-connectivity, 0·71 and 0·79for 18-connectivity and 0·62 and 0·68 for 26-connectivity,respectively. Once the correct volume and surface area of theparticle are determined, the accurate 3D sphericity of thisparticle can be easily obtained with equation (5).
Three-dimensional roundnessAccording to Wadell (1935) and Blott & Pye (2008), 2D
roundness is quantified by the average ratio of the curvature
3D SPHERICITY, ROUNDNESS AND FRACTAL DIMENSION OF SAND PARTICLES 5
Offprint provided courtesy of www.icevirtuallibrary.comAuthor copy for personal use, not for distribution

radius of all corners to the radius of the largest inscribedcircle of a particle. However, the curvature of a regular 3Dsurface measured at a given point depends on the paththrough the point, which means that a unique curvature at a
given point does not exist. For this reason, based on theunderstanding of the surface curvature, the introduction of areasonable definition of the ‘corner’ on the particle surfaceand its characteristic index was necessary in this study.
10
8
6
4
2
0
35
30
25
20
15
10
5
0
32
28
24
20
16
12
8
4
0 4 8SH degree
12 16 20
0 4 8SH degree
12 16 20
0 4 8SH degree
(a)
(b)
(c)
12 16 20
Volu
me:
mm
3S
urfa
ce a
rea:
mm
2S
urfa
ce a
rea:
mm
2
0·001 0·01CT resolution: mm/pixel
0·1 1
0·001 0·01CT resolution: mm/pixel
0·1 1
0·001 0·01CT resolution: mm/pixel
0·1 1
Theoretical value of the ellipsoid
Theoretical value of the octahedron
SH reconstruction of the octahedronSH reconstruction of the ellipsoid
CT reconstruction of the octahedronCT reconstruction of the ellipsoid
SH reconstruction
SH reconstruction
Theoretical value
Theoretical value
SH reconstruction of the LBS particleSH reconstruction of the HDG particle
LBS particle with Conn = 26LBS particle with Conn = 18LBS particle with Conn = 6HDG particle with Conn = 26HDG particle with Conn = 18HDG particle with Conn = 6
Fig. 4. Development of particle volume and surface area based on image analysis and SH analysis with an increase in the voxel resolution and SHdegree: (a) calculated particle volume of ideal particles (i.e. the unit octahedron and the ellipsoid); (b) calculated surface area of ideal particles; (c)calculated surface area of real sand particles (i.e. the LBS particle and the HDG particle in Fig. 3)
ZHOU, WANG AND WANG6
Offprint provided courtesy of www.icevirtuallibrary.comAuthor copy for personal use, not for distribution

Generally, two principal curvatures, that is, the maximumand the minimum of the normal curvatures κmax and κmin,were commonly used to measure the maximum andminimum bending of a surface at a given point (DoCarmo, 1976). The perpendicular directions of the pathsthat hold the principal curvatures are called the principaldirections, and the inverses rmax = 1/κmin and rmin = 1/κmax arethe principal curvature radii. In this study, the authorsintroduced a practical approach proposed by Colombo et al.(2006) to measure the local principal curvatures at a givenvertex (x0, y0, z0) on the SH-reconstructed surface. The keyidea of this approach is to generate a local micro-surfacemade of first-ring adjacent faces of this given vertex, asillustrated in Fig. 2(b), and to establish a biquadraticpolynomial function to approximate this micro-surface, asexpressed by
z ¼ f ðx; yÞ � aþ bðx� x0Þ þ cðy� y0Þþ dðx� x0Þðy� y0Þ þ eðx� x0Þ2 þ gðy� y0Þ2
ð9Þ
where a, b, c, d, e and g are the unknown coefficients thatneed to be determined.Because there are seven vertices inside the micro-surface
forming the input of this function, it is easy to calculate thesesix unknowns using the least-squares fitting method. Theshape characteristics of the micro-surface at this given vertexcan be described by the 2� 2 Hessian matrix (Do Carmo,1976), as expressed by equation (10). The principal curva-tures and principal directions are the eigenvalues andeigenvectors of this Hessian matrix, respectively.
H x0; y0ð Þ ¼ fxx x0; y0ð Þ fxy x0; y0ð Þfyx x0; y0ð Þ fyy x0; y0ð Þ
� �ð10Þ
where fxx, fxy, fyx and fyy are the second derivatives of f (x, y)in equation (9), in which fxx(x0, y0) = 2e, fxy(x0, y0) =fyx(x0, y0) = d and fyy(x0, y0) = 2g.Figure 6 shows the contours of κmax and κmin of the unit
octahedron and the LBS and HDG particles in Fig. 3. Takethe unit octahedron for illustration, the principal curvaturesat any vertex on the plane are κmax = κmin = 0, and thecurvature radii are rmin = rmax =∞. Therefore, no ‘corners’can be defined on the planes. Imagine placing a slightlyrounded edge along one edge of an octahedron to connect its
two conjoint planes, the principal curvatures are κmin = 0 andκmax (where κmax is a real number that depends on the size ofthe rounded edge) along the edge direction and perpendicu-lar to the edge direction, respectively. The correspondingcurvature radii are rmax =∞ and rmin = 1/κmax, respectively.From a natural understanding of the meaning of the ‘corner’of an edge, rmin is a reasonable index to characterise thecurvature radius of this kind of ‘corner’. Furthermore, for thesand particles in Fig. 6, κmax is much more distinguishablethan κmin to identify the ‘corners’. Consequently, thecurvature radius rmin = |κmax|
�1 was used to characterise apotential ‘corner’ at a given vertex on the surface and definedthe ‘corner’ by
gðκÞ ¼ 1 if κmaxj j�1 , Rins
0 if κmaxj j�1 � Rins
ð11Þ
where 1 or 0 indicates that the ‘corner’ is acceptable orunacceptable, respectively, and Rins is the radius of themaximum inscribed sphere of the particle, which is preciselythe minimum polar radius in equation (4). The 3D roundnessof the particle can then be obtained by
R ¼P
gðκÞ κmaxj j�1
NRinsð12Þ
where N is the total number of acceptable ‘corners’.
Three-dimensional fractal dimensionHyslip & Vallejo (1997) first developed 2D fractal
geometry to characterise and quantify irregular and frag-mented patterns within natural sand particles. The idea is touse different yardsticks to measure the perimeter of theprofile extracted from the 2D particle projection and evaluatethe fractal dimension based on the relationship between theyardsticks and the measured perimeters in log–log scale.With regard to a 3D open surface (e.g. the fracture surfaceand topographic surface), the triangular prism method(TPM) first proposed by Clarke (1986) and the slit islandmethod (SIM) first proposed by Mandelbrot et al. (1984)have been widely applied to evaluate the 3D fractaldimension. With the TPM, the plane projection of thefracture surface is divided into uniform squares with different
50
40
30
20
10
0
CT
imag
e an
alys
is: m
m2
50
40
30
20
10
0
CT
imag
e an
alys
is: m
m2
0 10 20SH analysis: mm2
30
(a) (b)
40 50 0 10 20SH analysis: mm2
30 40 50
Conn = 6Conn = 18Conn = 26
Conn = 6Conn = 18Conn = 26
Slope = 1·462
Slope = 1·270
Slope = 0·834
Slope = 1·607
Slope = 1·409
Slope = 0·927
Fig. 5. Correlation between the results of the surface area by SH analysis and by image analysis: (a) LBS particles; (b) HDG particles
3D SPHERICITY, ROUNDNESS AND FRACTAL DIMENSION OF SAND PARTICLES 7
Offprint provided courtesy of www.icevirtuallibrary.comAuthor copy for personal use, not for distribution

sizes, and the associated surface area is then calculated.Within the SIM, the fractured specimen is first mounted in aresin plane base. The next step consists of careful polishing ofthe fracture surface parallel to the plane base to highlight thematerial ‘islands’ surrounded by air ‘lakes’, as illustrated inFig. 7. Charkaluk et al. (1998) and Yuan et al. (2003) foundthat the relationship between the perimeter P and area A ofthe ‘islands’ represents the fractal nature well, which can be
expressed by
P1=d / A1=2 ð13Þwhere d is the fractal dimensional increment. The convertingform of this function is
logP ¼ 0�5d logAþ C ð14Þwhere C is a constant. Therefore, the fractal dimension of afractured surface is
D ¼ d þ 1 ð15ÞHowever, the TPM and SIM are not capable of calculating
the fractal dimension of the 3D closed surface, such as a sandparticle surface. No plane projection can cover the fullmorphological information of the 3D closed surface usingthe TPM. Similarly, by using the SIM, there might be onlyone ‘island’ and no neighbouring ‘lake’, regardless of thepolishing degree. For this reason, the present authorsattempted to develop a novel method based on the idea ofthe SIM to evaluate the 3D fractal dimension of the 3Dclosed surface of sand particles. For an open surface, SIMcaptures the ‘islands’ and ‘lakes’ from the polishing planesparallel to the base. For a closed surface, a similar idea wasfollowed to polish the particle spherically and produce aseries of ‘islands’ and ‘lakes’ on the spherical polishingsurface. In practice, a spherical surface was expanded fromthe maximum inscribed sphere to the minimum circum-scribed sphere of a given particle to intersect the particleprofile in the spherical coordinate space. The portion ofthe particle outside this spherical surface was polished toproduce a series of ‘islands’ surrounded by ‘lakes’ or a seriesof ‘lakes’ surrounded by ‘islands’ on the spherical surface.These ‘islands’ and ‘lakes’ carry the morphological
1·0
1·5
0·5
0
–0·5
–1·5
–1·0
1
–1 –10
10
1·0
1·5
0·5
0
–0·5
–1·5
–1·0
1
–1 –10
1 10
1·0
1·5
0·5
0
–0·5
–1·5
–1·0
1
–1 –10
0
1·0
1·5
0·5
0
–0·5
–1·5
–1·0
1
–1 –10
10
1·0
1·5
0·5
0
–0·5
–1·5
–1·0
1
–1 –10
1 10
1·0
1·5
0·5
0
–0·5
–1·5
–1·0
1
–1 –10
0
4
3
2
1
0
–1
–2
–3
–4
4
3
2
1
0
–1
–2
–3
–4
Fig. 6. Contours of κmax and κmin of the unit octahedron and the LBS and HDG particles in Fig. 3
t1
t2
t3
t1
t2
t3
Fig. 7. Diagram of the procedures of the slit island method(Charkaluk et al., 1998). t1, t2 and t3 represent the evolution of theslit ‘islands’ (i.e. black regions) and ‘lakes’ (i.e. white regions) withincreasing polishing times
ZHOU, WANG AND WANG8
Offprint provided courtesy of www.icevirtuallibrary.comAuthor copy for personal use, not for distribution

information of the surface texture and roughness. Bycalculating the perimeters and the areas of the ‘islands’ or‘lakes’ subject to different polishing degrees, it is possible toestimate the 3D fractal dimension of the real particlemorphology according to equations (14) and (15).The major difficulty in this method is to identify the
individual ‘islands’ and ‘lakes’ on the spherical polishingsurface. To overcome this difficulty, a novel method, ‘imageprojection analysis’ (IPA), is proposed in this section. The keyidea of IPA is to project the spherical polishing surface toa binary image and then identify the closed boundaries andtheir corresponding regions (i.e. ‘islands’ or ‘lakes’) withimage-processing techniques. Figure 8 illustrates the flowchart to calculate the 3D fractal dimension of the particlemorphology. The flow chart includes two main parts: thepolishing and geometry calculation part with solid lineblocks and the IPA part with dashed line blocks. Followingthis flow chart, the calculation process of the 3D fractaldimension is described in detail as follows.First, the 3D particle surface was generated by the
high-level SH reconstruction discussed in the earlier sectionentitled ‘Spherical harmonic reconstruction of particlesurface’. To implement the IPA, a subdivided quadrangularmesh, instead of a subdivided triangular mesh, was chosenas the mapping spherical mesh, as shown in Fig. 2(c). To
ensure the resolution of the projected image, the sphericalcoordinate matrix used in this section was 400� 400.Similarly to Rins, it is also easy to determine the radius ofthe minimum circumscribed sphere (Rcir) of the particle thatis the maximum polar radius in equation (4). A sphericalsurface was then continuously expanded to intersect theparticle surface (to imitate the polishing procedures) toproduce a series of ‘islands’ and ‘lakes’ (i.e. the regions insidethe intersecting line boundaries) on this spherical surface, asillustrated in the first row of Fig. 9.To identify the individual boundaries and their contain-
ing regions (i.e. ‘islands’ or ‘lakes’) on the intersectingspherical surface, the intersected particle surface wasprojected to a binary image in which the location of apixel corresponds to the spherical coordinate of a vertex,and the grey level of this pixel was initialised as one or zeroif this vertex lay outside or inside the intersecting sphericalsurface, respectively, as demonstrated in the second row ofFig. 9. By using the intrinsic function edge in Matlab, eachof the edge pixels in this image can be detected to produce abinary edge-image in which the grey levels of the edge pixelsand the background pixels are set to one and zero,respectively, as shown in the third row of Fig. 9. To separatethe individual boundaries, the intrinsic function ‘bwlabel’ inMatlab was applied to this edge-image. In addition, theindividual boundaries can be identified and labelled with aset of connected edge pixels with the same grey levels. Foreach individual boundary, a new binary image wasinitialised in which the grey level of the constituent edgepixels and the background pixels were set to zero and one,respectively. The function ‘bwlabel’ was again applied toidentify the two individual parts of this image. It wasdetermined that the smaller part is exactly the region thatbelongs to this boundary, as demonstrated in Fig. 10. Thisdefinition can be easily understood by imagining that aclosed curve on a spherical surface divides this sphericalsurface into two parts. It is then reasonable to regard thesmaller part and the larger part as its internal region andexternal region, respectively. If the number of total pixelswithin the identified region was larger than three, theboundary pixels and region pixels were projected back tothe spherical coordinate space, and the correspondingboundary vertices and the faces belonging to this boundarycould finally be determined.By implementing the above steps, Fig. 10 plots the boun-
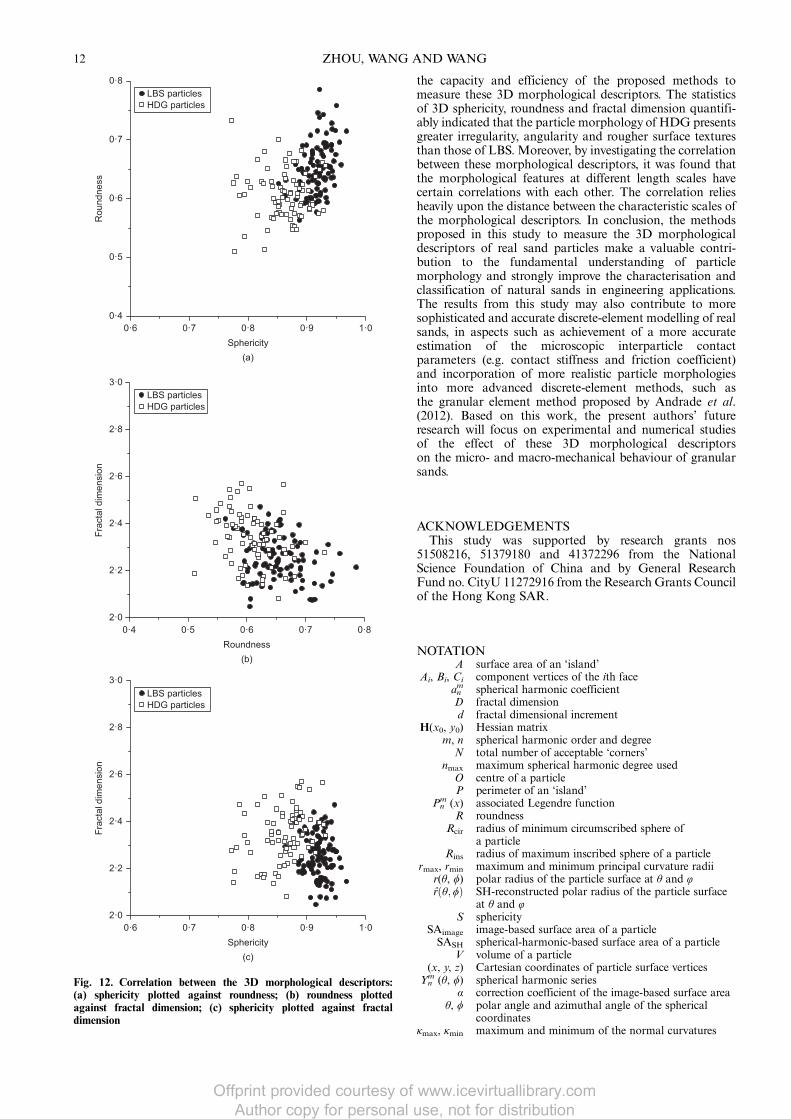
daries (i.e. the intersecting lines that consist of the detectedboundary vertices) and the regions (i.e. the grey curvedsurface that consists of the detected faces) of the identifiedindividual ‘islands’ on the tenth intersecting spherical surfacein Fig. 9. It is easy to calculate the perimeter and area of an‘island’ based on its boundary vertices and belonging facesin 3D Cartesian coordinate space. Finally, it is possible toinvestigate the correlation between the total perimeter andtotal area of each of the identified ‘islands’ or ‘lakes’ ondifferent intersecting spherical surfaces at log–log scale andevaluate the 3D fractal dimension of the particle mor-phology. Fig. 11 shows the relationship between the obtainedperimeter and area in log–log scale and the calculated 3Dfractal dimension for an ellipsoid, a virtual star particleand the LBS and HDG particles in Fig. 3. The powerful lawcan be clearly observed for all of the particles. The fractaldimension of the ellipsoid is 2·0, which means that notextures or roughness details can be captured on its surface.The increase in the fractal dimension indicates the increase ofthe surface textures and roughness details of the particle.For the selected particles in Fig. 11, the virtual star particlewith numerous projections has the largest fractal dimensionof 2·616, and the fractal dimension of the HDG particle isslightly larger than that of the LBS particle.
SH reconstruction of the particle by a uniformspherical coordinate matrix r (θ, φ)
Continuously expand a spherical surface to intersect the particleprofile: Rn = Rins + n(Rcir - Rins)/20, (loop n = 1, 2, …, 19)
Plot Pn–Sn curve at log–log scale and evaluate the3D fractal dimension of the particle morphology
Find the radii of the maximum inscribed sphere (Rins) and theminimum circumscribed sphere (Rcir) of the particle
Detect the edge pixels inside the binary image
N > 3?
YesFind the faces inside the mth region
No
Initialise a binary image (400 × 400 pixels) corresponding to thespherical coordinate matrix with the pixel grey level:
gij = 1 if r (θij, φij) ≥ Rn, and gij= 0 if r (θij, φij) < Rn
Separate M individual closed edges, loop m = 1, 2, ..., M
Initialise a binary image (400 × 400 pixels): gij = 0 if apixel belongs to the mth edge, and gij = 0 if a pixel is
outside the mth edge
Divide the image into two parts, define the smallerpart as the mth region with N constituent pixels
Map the mth edge and the internal faces back to thespherical surface, and then calculate the perimeterof the mth edge and surface area of the mth region
Sum total perimeter (Pn) of M edges and total surface area (Sn)of their internal regions on the nth intersection
Fig. 8. Flow chart for calculating the 3D fractal dimension
3D SPHERICITY, ROUNDNESS AND FRACTAL DIMENSION OF SAND PARTICLES 9
Offprint provided courtesy of www.icevirtuallibrary.comAuthor copy for personal use, not for distribution

RESULTS AND DISCUSSIONAccording to the proposed calculation methods in the
previous section ‘Morphological descriptors of sandparticles’, the 3D sphericity, roundness and fractal dimensionof real LBS and HDG particles can be obtained. Thestatistics and correlation of these morphological descriptorsare investigated in the present section. The statistical indicesof the results for 120 LBS particles and 80 HDG particlesare summarised in Table 1. As expected, the HDG particleshave lower mean values and higher standard deviationsof sphericity and roundness than the LBS particles, whichagain proves that the particle morphology of HDG is moreirregular and angular than that of LBS. With regard tofractal dimension, the mean value and the standard deviationof the HDG particles are higher than those of the LBSparticles. This indicates that the surface textures of the HDGparticles are rougher and more complex than those of LBSparticles.
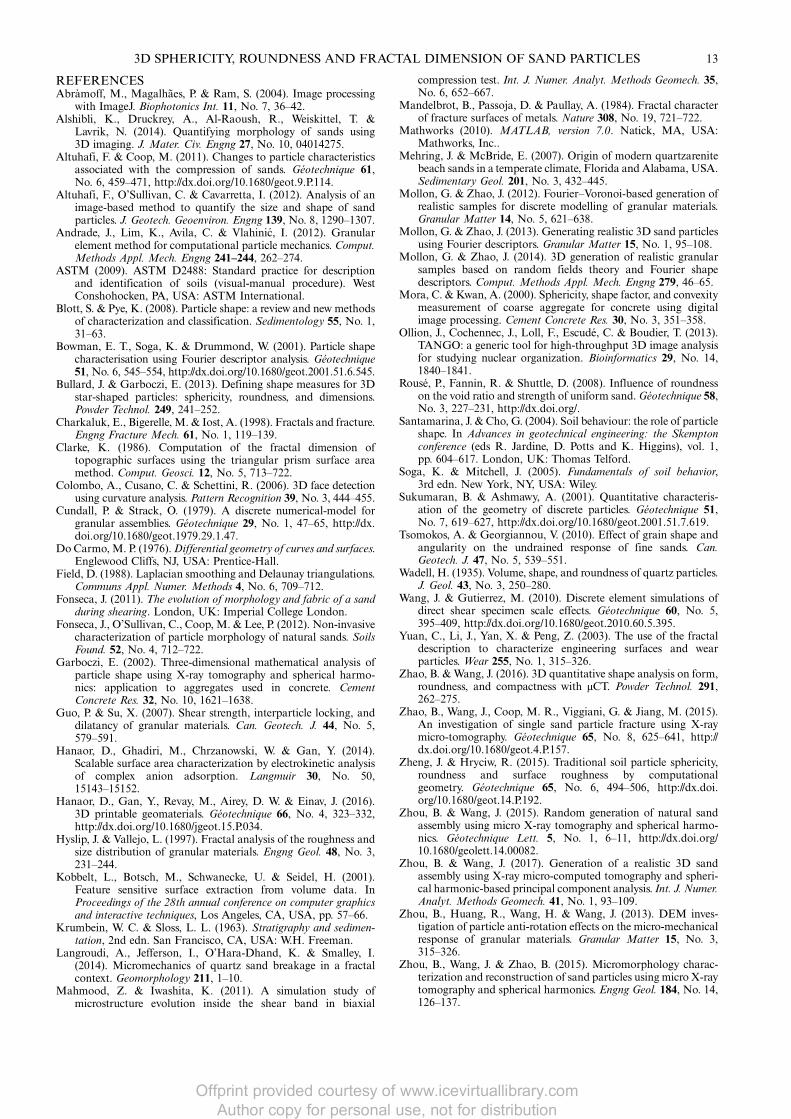
Figure 12 further shows the correlation between these 3Dmorphological descriptors. On the whole, a correlation can
be observed in any subfigure, which indicates that themorphological features of the particle at different scales arenot independent. Specifically, two relatively high correlationcoefficients of 0·415 and 0·424 were obtained betweensphericity and roundness and between roundness andfractal dimension, respectively. This result agrees well withthe results of Fonseca et al. (2012) and Zhao &Wang (2016),who found a strong correlation between the sphericity andthe convexity and roundness of sand particles. The relativelyhigh correlation between the roundness and the fractaldimension is mainly because no definitive boundary existsbetween the scales of local corners and surface textures ofsand particles (Soga & Mitchell, 2005). In contrast, arelatively low correlation coefficient of 0·179 was obtainedbetween sphericity and fractal dimension, probably becausesphericity describes the general form of the particle on a largescale, whereas the fractal dimension characterises the surfacetexture and roughness at fine scales. These results suggest thatthe correlation between any two morphological descriptorsdepends on the distance between their characteristic scales.
1·0
1·5
0·5
0
–0·5
–1·5
–1·0
1
–1 –10
10
1·0
1·5
0·5
0
–0·5
–1·5
–1·0
1
–1 –10
1 10
1·0
1·5
0·5
0
–0·5
–1·5
–1·0
1
–1 –100
Fig. 9. Identification of the individual boundaries on the fifth, tenth and 15th intersected spherical surfaces
ZHOU, WANG AND WANG10
Offprint provided courtesy of www.icevirtuallibrary.comAuthor copy for personal use, not for distribution
CONCLUSIONSBased on μCT scanning of sand particles and their
SH-reconstructed surfaces, this study first developed prac-tical methods to calculate the 3D sphericity and roundnessof particles. To calculate 3D sphericity, the surface area
obtained by image analysis and by SH analysis was carefullyinvestigated and discussed. The results obtained by SHanalysis gradually converge to a reasonable surface area atthe scale of μCT resolution, in which the stable value of thecalculated surface area with a sufficiently high SH degreecan be further used to calibrate the surface area by meansof image analysis. To calculate 3D roundness, a practicalmethod was introduced to calculate the surface curvaturebased on the SH-reconstructed mesh of the particle surface.By understanding the geometric properties of the principalcurvatures of different kinds of surfaces, the 3D ‘corner’ wasdefined and identified to characterise the local roundness ofsand particles. The most significant contribution of this studywas the establishment of a novel method to calculate the 3Dfractal dimension of real sand particles. It was also innovativeto modify the SIM by combining it with the IPA, whichallowed the successful calculation of the 3D fractal dimen-sion of closed surfaces for sand particles.By application to the selected ideal particles and to the
μCT-scanned real LBS and HDG particles, the results proved
1·0
1·5
0·5
0
–0·5
–1·5
–1·0
1
–1 –10
10
1·0
1·5
0·5
0
–0·5
–1·5
–1·0
1
–1 –10
10
Fig. 10. Identified individual boundaries and their internal regions on the tenth intersected spherical surface
LBS particle (D = 2·214)HDG particle (D = 2·296)Ellipsoid (D = 2·000)Star particle (D = 2·616)
100
10
1
0·10·01 0·1
Surface area: mm2
1 10
Per
imet
er: m
m
Fig. 11. Relationship between the perimeter and area in log-log scaleand the calculated 3D fractal dimension for an ellipsoid, a virtual starparticle, and the LBS and HDG particles in Fig. 3
Table 1. Statistics of the 3D morphological descriptors of sandparticles
3D descriptors LBS particles HDG particles
Meanvalue
Standarddeviation
Meanvalue
Standarddeviation
Sphericity 0·918 0·016 0·862 0·030Roundness 0·652 0·032 0·608 0·036Fractal dimension 2·239 0·087 2·357 0·117
3D SPHERICITY, ROUNDNESS AND FRACTAL DIMENSION OF SAND PARTICLES 11
Offprint provided courtesy of www.icevirtuallibrary.comAuthor copy for personal use, not for distribution
the capacity and efficiency of the proposed methods tomeasure these 3D morphological descriptors. The statisticsof 3D sphericity, roundness and fractal dimension quantifi-ably indicated that the particle morphology of HDG presentsgreater irregularity, angularity and rougher surface texturesthan those of LBS. Moreover, by investigating the correlationbetween these morphological descriptors, it was found thatthe morphological features at different length scales havecertain correlations with each other. The correlation reliesheavily upon the distance between the characteristic scales ofthe morphological descriptors. In conclusion, the methodsproposed in this study to measure the 3D morphologicaldescriptors of real sand particles make a valuable contri-bution to the fundamental understanding of particlemorphology and strongly improve the characterisation andclassification of natural sands in engineering applications.The results from this study may also contribute to moresophisticated and accurate discrete-element modelling of realsands, in aspects such as achievement of a more accurateestimation of the microscopic interparticle contactparameters (e.g. contact stiffness and friction coefficient)and incorporation of more realistic particle morphologiesinto more advanced discrete-element methods, such asthe granular element method proposed by Andrade et al.(2012). Based on this work, the present authors’ futureresearch will focus on experimental and numerical studiesof the effect of these 3D morphological descriptorson the micro- and macro-mechanical behaviour of granularsands.
ACKNOWLEDGEMENTSThis study was supported by research grants nos
51508216, 51379180 and 41372296 from the NationalScience Foundation of China and by General ResearchFund no. CityU 11272916 from the Research Grants Councilof the Hong Kong SAR.
NOTATIONA surface area of an ‘island’
Ai, Bi, Ci component vertices of the ith faceanm spherical harmonic coefficientD fractal dimensiond fractal dimensional increment
H(x0, y0) Hessian matrixm, n spherical harmonic order and degree
N total number of acceptable ‘corners’nmax maximum spherical harmonic degree used
O centre of a particleP perimeter of an ‘island’
Pnm (x) associated Legendre function
R roundnessRcir radius of minimum circumscribed sphere of
a particleRins radius of maximum inscribed sphere of a particle
rmax, rmin maximum and minimum principal curvature radiir(θ, ϕ) polar radius of the particle surface at θ and φrðθ; ϕÞ SH-reconstructed polar radius of the particle surface
at θ and φS sphericity
SAimage image-based surface area of a particleSASH spherical-harmonic-based surface area of a particle
V volume of a particle(x, y, z) Cartesian coordinates of particle surface vertices
Ynm (θ, ϕ) spherical harmonic series
α correction coefficient of the image-based surface areaθ, ϕ polar angle and azimuthal angle of the spherical
coordinatesκmax, κmin maximum and minimum of the normal curvatures
0·8
0·7
0·6
0·5
0·4
Rou
ndne
ss
3·0
2·8
2·6
2·4
2·2
2·0
Frac
tal d
imen
sion
3·0
2·8
2·6
2·4
2·2
2·0
Frac
tal d
imen
sion
0·6 0·7 0·8 0·9 1·0Sphericity
0·4 0·5 0·6 0·7 0·8Roundness
0·6 0·7 0·8 0·9 1·0Sphericity
(a)
(b)
(c)
LBS particlesHDG particles
LBS particlesHDG particles
LBS particlesHDG particles
Fig. 12. Correlation between the 3D morphological descriptors:(a) sphericity plotted against roundness; (b) roundness plottedagainst fractal dimension; (c) sphericity plotted against fractaldimension
ZHOU, WANG AND WANG12
Offprint provided courtesy of www.icevirtuallibrary.comAuthor copy for personal use, not for distribution
REFERENCESAbràmoff, M., Magalhães, P. & Ram, S. (2004). Image processing
with ImageJ. Biophotonics Int. 11, No. 7, 36–42.Alshibli, K., Druckrey, A., Al-Raoush, R., Weiskittel, T. &
Lavrik, N. (2014). Quantifying morphology of sands using3D imaging. J. Mater. Civ. Engng 27, No. 10, 04014275.
Altuhafi, F. & Coop, M. (2011). Changes to particle characteristicsassociated with the compression of sands. Géotechnique 61,No. 6, 459–471, http://dx.doi.org/10.1680/geot.9.P.114.
Altuhafi, F., O’Sullivan, C. & Cavarretta, I. (2012). Analysis of animage-based method to quantify the size and shape of sandparticles. J. Geotech. Geoenviron. Engng 139, No. 8, 1290–1307.
Andrade, J., Lim, K., Avila, C. & Vlahinic, I. (2012). Granularelement method for computational particle mechanics. Comput.Methods Appl. Mech. Engng 241–244, 262–274.
ASTM (2009). ASTM D2488: Standard practice for descriptionand identification of soils (visual-manual procedure). WestConshohocken, PA, USA: ASTM International.
Blott, S. & Pye, K. (2008). Particle shape: a review and new methodsof characterization and classification. Sedimentology 55, No. 1,31–63.
Bowman, E. T., Soga, K. & Drummond, W. (2001). Particle shapecharacterisation using Fourier descriptor analysis. Géotechnique51, No. 6, 545–554, http://dx.doi.org/10.1680/geot.2001.51.6.545.
Bullard, J. & Garboczi, E. (2013). Defining shape measures for 3Dstar-shaped particles: sphericity, roundness, and dimensions.Powder Technol. 249, 241–252.
Charkaluk, E., Bigerelle, M. & Iost, A. (1998). Fractals and fracture.Engng Fracture Mech. 61, No. 1, 119–139.
Clarke, K. (1986). Computation of the fractal dimension oftopographic surfaces using the triangular prism surface areamethod. Comput. Geosci. 12, No. 5, 713–722.
Colombo, A., Cusano, C. & Schettini, R. (2006). 3D face detectionusing curvature analysis. Pattern Recognition 39, No. 3, 444–455.
Cundall, P. & Strack, O. (1979). A discrete numerical-model forgranular assemblies. Géotechnique 29, No. 1, 47–65, http://dx.doi.org/10.1680/geot.1979.29.1.47.
Do Carmo,M. P. (1976).Differential geometry of curves and surfaces.Englewood Cliffs, NJ, USA: Prentice-Hall.
Field, D. (1988). Laplacian smoothing and Delaunay triangulations.Communs Appl. Numer. Methods 4, No. 6, 709–712.
Fonseca, J. (2011). The evolution of morphology and fabric of a sandduring shearing. London, UK: Imperial College London.
Fonseca, J., O’Sullivan, C., Coop, M. & Lee, P. (2012). Non-invasivecharacterization of particle morphology of natural sands. SoilsFound. 52, No. 4, 712–722.
Garboczi, E. (2002). Three-dimensional mathematical analysis ofparticle shape using X-ray tomography and spherical harmo-nics: application to aggregates used in concrete. CementConcrete Res. 32, No. 10, 1621–1638.
Guo, P. & Su, X. (2007). Shear strength, interparticle locking, anddilatancy of granular materials. Can. Geotech. J. 44, No. 5,579–591.
Hanaor, D., Ghadiri, M., Chrzanowski, W. & Gan, Y. (2014).Scalable surface area characterization by electrokinetic analysisof complex anion adsorption. Langmuir 30, No. 50,15143–15152.
Hanaor, D., Gan, Y., Revay, M., Airey, D. W. & Einav, J. (2016).3D printable geomaterials. Géotechnique 66, No. 4, 323–332,http://dx.doi.org/10.1680/jgeot.15.P.034.
Hyslip, J. & Vallejo, L. (1997). Fractal analysis of the roughness andsize distribution of granular materials. Engng Geol. 48, No. 3,231–244.
Kobbelt, L., Botsch, M., Schwanecke, U. & Seidel, H. (2001).Feature sensitive surface extraction from volume data. InProceedings of the 28th annual conference on computer graphicsand interactive techniques, Los Angeles, CA, USA, pp. 57–66.
Krumbein, W. C. & Sloss, L. L. (1963). Stratigraphy and sedimen-tation, 2nd edn. San Francisco, CA, USA: W.H. Freeman.
Langroudi, A., Jefferson, I., O’Hara-Dhand, K. & Smalley, I.(2014). Micromechanics of quartz sand breakage in a fractalcontext. Geomorphology 211, 1–10.
Mahmood, Z. & Iwashita, K. (2011). A simulation study ofmicrostructure evolution inside the shear band in biaxial
compression test. Int. J. Numer. Analyt. Methods Geomech. 35,No. 6, 652–667.
Mandelbrot, B., Passoja, D. & Paullay, A. (1984). Fractal characterof fracture surfaces of metals. Nature 308, No. 19, 721–722.
Mathworks (2010). MATLAB, version 7.0. Natick, MA, USA:Mathworks, Inc..
Mehring, J. & McBride, E. (2007). Origin of modern quartzarenitebeach sands in a temperate climate, Florida and Alabama, USA.Sedimentary Geol. 201, No. 3, 432–445.
Mollon, G. & Zhao, J. (2012). Fourier–Voronoi-based generation ofrealistic samples for discrete modelling of granular materials.Granular Matter 14, No. 5, 621–638.
Mollon, G. & Zhao, J. (2013). Generating realistic 3D sand particlesusing Fourier descriptors. Granular Matter 15, No. 1, 95–108.
Mollon, G. & Zhao, J. (2014). 3D generation of realistic granularsamples based on random fields theory and Fourier shapedescriptors. Comput. Methods Appl. Mech. Engng 279, 46–65.
Mora, C. & Kwan, A. (2000). Sphericity, shape factor, and convexitymeasurement of coarse aggregate for concrete using digitalimage processing. Cement Concrete Res. 30, No. 3, 351–358.
Ollion, J., Cochennec, J., Loll, F., Escudé, C. & Boudier, T. (2013).TANGO: a generic tool for high-throughput 3D image analysisfor studying nuclear organization. Bioinformatics 29, No. 14,1840–1841.
Rousé, P., Fannin, R. & Shuttle, D. (2008). Influence of roundnesson the void ratio and strength of uniform sand. Géotechnique 58,No. 3, 227–231, http://dx.doi.org/.
Santamarina, J. & Cho, G. (2004). Soil behaviour: the role of particleshape. In Advances in geotechnical engineering: the Skemptonconference (eds R. Jardine, D. Potts and K. Higgins), vol. 1,pp. 604–617. London, UK: Thomas Telford.
Soga, K. & Mitchell, J. (2005). Fundamentals of soil behavior,3rd edn. New York, NY, USA: Wiley.
Sukumaran, B. & Ashmawy, A. (2001). Quantitative characteris-ation of the geometry of discrete particles. Géotechnique 51,No. 7, 619–627, http://dx.doi.org/10.1680/geot.2001.51.7.619.
Tsomokos, A. & Georgiannou, V. (2010). Effect of grain shape andangularity on the undrained response of fine sands. Can.Geotech. J. 47, No. 5, 539–551.
Wadell, H. (1935). Volume, shape, and roundness of quartz particles.J. Geol. 43, No. 3, 250–280.
Wang, J. & Gutierrez, M. (2010). Discrete element simulations ofdirect shear specimen scale effects. Géotechnique 60, No. 5,395–409, http://dx.doi.org/10.1680/geot.2010.60.5.395.
Yuan, C., Li, J., Yan, X. & Peng, Z. (2003). The use of the fractaldescription to characterize engineering surfaces and wearparticles. Wear 255, No. 1, 315–326.
Zhao, B. &Wang, J. (2016). 3D quantitative shape analysis on form,roundness, and compactness with μCT. Powder Technol. 291,262–275.
Zhao, B., Wang, J., Coop, M. R., Viggiani, G. & Jiang, M. (2015).An investigation of single sand particle fracture using X-raymicro-tomography. Géotechnique 65, No. 8, 625–641, http://dx.doi.org/10.1680/geot.4.P.157.
Zheng, J. & Hryciw, R. (2015). Traditional soil particle sphericity,roundness and surface roughness by computationalgeometry. Géotechnique 65, No. 6, 494–506, http://dx.doi.org/10.1680/geot.14.P.192.
Zhou, B. & Wang, J. (2015). Random generation of natural sandassembly using micro X-ray tomography and spherical harmo-nics. Géotechnique Lett. 5, No. 1, 6–11, http://dx.doi.org/10.1680/geolett.14.00082.
Zhou, B. & Wang, J. (2017). Generation of a realistic 3D sandassembly using X-ray micro-computed tomography and spheri-cal harmonic-based principal component analysis. Int. J. Numer.Analyt. Methods Geomech. 41, No. 1, 93–109.
Zhou, B., Huang, R., Wang, H. & Wang, J. (2013). DEM inves-tigation of particle anti-rotation effects on the micro-mechanicalresponse of granular materials. Granular Matter 15, No. 3,315–326.
Zhou, B., Wang, J. & Zhao, B. (2015). Micromorphology charac-terization and reconstruction of sand particles using micro X-raytomography and spherical harmonics. Engng Geol. 184, No. 14,126–137.
3D SPHERICITY, ROUNDNESS AND FRACTAL DIMENSION OF SAND PARTICLES 13
Offprint provided courtesy of www.icevirtuallibrary.comAuthor copy for personal use, not for distribution