Three dimensional prediction of stability lobes in end ...
12
Transcript of Three dimensional prediction of stability lobes in end ...
Scientia Iranica B (2022) 29(1), 41{52
Sharif University of TechnologyScientia Iranica
Transactions B: Mechanical Engineeringhttp://scientiairanica.sharif.edu
Three dimensional prediction of stability lobes in endmilling of thin-walled structures based on tool andworkpiece dimensions
M. Mahboubkhaha;�, M.R. Movahhedyb, and A. Jodeiri Feizia
a. Department of Mechanical Engineering, University of Tabriz, Tabriz, P.O. Box 51666{16471, Iran.b. Department of Mechanical Engineering, Sharif University of Technology, Tehran, Iran.
Received 6 June 2020; received in revised form 11 February 2021; accepted 24 May 2021
KEYWORDSThin-walledstructures;Milling chatterstability;Machining geometricalparameters;Three dimensionalstability lobediagrams.
Abstract. Nowadays, researchers are very interested to investigate the dynamic behaviorof thin-walled structures during the machining process due to their broad application inaerospace, automotive industries, etc. One of the main problems in the machining of thin-walled structures is unstable chatter vibrations, which causes poor machined surface qualityand decreases the system life span. Therefore, the main aim of this paper is to propose apractical method to solve the chatter instability problem during the milling process of thin-walled components. To this end, �rst, the e�ects of geometrical parameters like workpieceheight, thickness, tool overhang, diameter, and their ratios on the chatter stability are inves-tigated. Based on the mentioned parameters, three-dimensional Stability Lobe Diagrams(SLDs) are presented for the �rst time in which one can use the diagrams to switch theunstable machining process to a stable one by changing the values of the system parameters.Finally, the results obtained by the experimental test show that the presented three-dimensional diagrams can be utilized to avoid chatter instability in the milling process.© 2022 Sharif University of Technology. All rights reserved.
1. Introduction
Monolithic thin-walled structures and components arewidely used in di�erent industrial applications suchas aerospace and automotive industries. High-speedend milling is often used to give the desired shape tothese components. Because of the low dynamic rigidityof these parts as well as high machining speed, theprobability of chatter occurrence during machining ofthese parts increases [1,2]. Chatter is a dynamic in-stability the root of which is the self-excited vibrationsresulting from tool-workpiece interactions in machining
*. Corresponding author. Tel.: +98-41-33392462E-mail address: [email protected] (M.Mahboubkhah)
doi: 10.24200/sci.2021.56130.4565
processes. This phenomenon reduces the MaterialRemoval Rate (MRR) as well as the e�ciency of themachining process and results in low surface quality,high machining noise, tool wear, and, if not controlled,breakage of tool or damage to workpiece [3{5]. There-fore, it is of absolute signi�cance to prevent chatter.
Initial studies on this phenomenon have beendone by Tobias and Fishwick [6] and Tlusty andPolacek [7]. They recognized the mechanism of thechatter phenomenon and presented its mathematicalmodel with a delay di�erential equation. Tang andLiu [8] investigated the e�ect of the helix and cuttingangle on the stability of the milling process. Theyfound that increasing the helix and cutting angleenhanced stability. Seguy et al. [9] have investigatedthe chatter phenomenon in the milling of thin-walledparts using the Finite Element Method (FEM). Their�ndings showed that milling with a long tool with

42 M. Mahboubkhah et al./Scientia Iranica, Transactions B: Mechanical Engineering 29 (2022) 41{52
a small diameter or machining highly exible wallsgreatly increases the probability of chatter. Gonzaloet al. [10] simulated the machining process of thin-walled aluminum parts. Their simulation was basedon a mechanistic model in the time domain. In theirresearch, they used a Finite Element (FE) model ofthe workpiece for de�ning the dynamic properties ofthe thin-walled parts under machining. Campa etal. [11,12] solved the variable dynamic problem of thin-walled parts by computing three-dimensional StabilityLobe Diagrams (SLDs). In their research, the thirddimension of the diagram is the position of the toolalong the workpiece. Song et al. [13] similarly proposeda method to predict the stability of the milling of thin-walled parts, where changes in dynamic characteristicsare correlated with tool position. They extractedthe Frequency Response Function (FRF) from the FEmodel and extracted the SLD by continuously scanningthe dynamic properties of the FE model during ma-chining. To obtain optimal machining parameters formaximum MRR in the machining of thin-walled parts,Tang and Liu [14] derived a 3D SLD the axes of whichrepresented spindle speed, axial cutting depth, andradial Depth Of Cut (DOC). Ismail and Ziaei [15] usedtwo types of online and o�ine measurement methods toavoid chatter in the machining of exible turbine bladesin a �ve-axis machine. Bravo et al. [16] performeda dynamic simulation of the system based on therelative FRF, which sums up the response functionsof the machine and the workpiece. Through machiningexperiments, they proved that SLDs obtained in thisway are more accurate than those obtained with eitherthe machine tool response function or the workpieceresponse function alone. Ma~n�e et al. [17] analyzedthe dynamic interaction between two systems of ma-chine tool-tool and machine tool-thin walled part viathe FEM to predict the stability of the machiningprocess. The relationship between chatter instabilityand surface roughness variations in the milling ofthin-walled parts was studied by Seguy et al. [18].Atlar et al. [19] studied the stability of the machiningprocess by using the relative Transfer Function (TF)between the tool and the workpiece. They studiedthe e�ect of the workpiece variable dynamics, di�erentcutting conditions, and machining strategies on theMRR. Zhang et al. [20] used multiple structural modeinteractions rooted in the cutting force to extract themilling stability boundaries of the exible workpiece.The obtained results revealed that in the machiningof exible components, several vibrational modes ofthe exible structure a�ect machining stability. Themachining time for a turbine blade was reduced from35 minutes to 19 minutes when the milling of thin-walled parts was based on a predicted SLD in whichthe variable dynamics of the workpiece were taken intoaccount in addition to those of the tool, according
to Budak et al. [21]. Signi�cant reduction in thetime of machining along with avoidance of chatter onthe �nished surface of the workpiece indicates thatincorporation of the variable dynamics of the workpiecein the milling of thin-walled parts is essential. Usingoperational modal analysis and solely based on systemresponse data measured by accelerometer during ma-chining, Powa lka and Jemielniak [22] extracted SLDs.Their results showed that the SLDs obtained fromthis method are not sensitive to the coe�cients ofthe cutting force model. Wan et al. [23] provided ane�ective way to improve the stability of the millingof thin-walled parts. In the proposed method, masswas added to the workpiece to improve the stabilitybehavior of the system. In another paper, Wan etal. [24] showed that the stability of machining of thin-walled parts could be improved by applying pre-stressto the workpiece. Yan and Zhu [25] investigated thestability of thin-walled parts on the milling processbased on improved multi-frequency solutions. Theresults revealed that improved multi-frequency solutionbe more accurate than zero-order analysis. Zhu etal. [26] optimized milling parameters by genetic algo-rithm based on process damping. Their achievementprovided a theoretical foundation and reference for themilling mechanism research. Wan et al. [27] studiedthe e�ect of vibration assistance on chatter stabilityin the milling process. The results revealed that thevibration assistance does not improve the critical DOC,but generates new stability lobes between the originaltwo adjacent lobes corresponding to no vibration assis-tance. Liu et al. [28] investigated the chatter stabilityof thin-walled parts in milling utilizing relative TFand process damping. Their results showed that theprocess damping can signi�cantly improve the stabilityof the low-speed region. Liu et al. [29] proposed anew method to detect the milling chatter based onvariational mode decomposition and energy entropy.The simulation and experimental results revealed thatthe proposed approach can e�ectively detect chatter.Wan et al. [30] presented an active chatter suppressionmethod by using a sliding mode control approachand electromagnetic actuator. The obtained resultsshowed that the chatter-free domain is signi�cantlyenhanced in a wide spindle speed range. Wu etal. [31] studied the stability behavior of Ti-6Al-4V thin-wall in the milling process by considering tool wearand thermal-mechanical coupling. They presented anovel predictive model to compute the cutting-inducedthermal-mechanical loads and workpiece de ection inthe milling Ti-6Al-4V components. Finally, a seriesof cutting experiments were conducted to validate theproposed method. Yan et al. [32] investigate chatterstability in milling with variable cross-sections anda large length-to-diameter ratio tool holder. Theyproposed a new tool holder with high dynamic sti�ness
M. Mahboubkhah et al./Scientia Iranica, Transactions B: Mechanical Engineering 29 (2022) 41{52 43
to improve the chatter stability. The theoretical resultsshow that increasing dynamic sti�ness can improvethe stability behavior of the system. Altintas etal. [33] reviewed the dynamics of machining and thefundamentals of chatter stability laws developed in thefrequency and discrete-time domains. In their research,Zhu and Liu [34] conducted a systematic review ofchatter, focusing on o�ine chatter prediction, onlinechatter detection, and chatter suppression techniques.Dun et al. [35] propose a numerical di�erence methodfor predicting stability in milling based on the Adams-Bashforth scheme. Moreover, they proposed a multi-modal scheme of the numerical approach. Dang etal. [36] proposed a theoretical approach to analyzingthe dynamics of the milling process of the pocket-shaped thin-walled workpieces with viscous uid toprevent chatter vibrations. Zhu et al. [37] presenteda method for detection of chatter for peripheral millingthin-walled workpieces by using sample entropy andenergy entropy. The �ndings showed that chatteris essentially an entropy-increasing phenomenon. Itmeans that sample entropy and energy entropy willincrease when the cutting process chatters.
According to previous studies, vibrational testscan be used to determine the stability of a system.However, there are few manufacturing workshops inwhich both test equipment and vibration specialists areavailable. As a result, vibration analysis is not a practi-cal method for predicting the stable zone of machiningin production workshops. Therefore, this researchwork aims to develop a method to predict the stabilityof the thin-walled parts in end milling based on thegeometrical parameters of the machining system suchas the length and the diameter of the tool and the sizeof the workpiece. It should be noted that, due to theavailability of dimensional measurement equipment inalmost all machining workshops, the presented methodis applicable in all machining workshops. As a result,for the �rst time in this study, three-dimensional SLDsbased on the geometrical parameters of the workpieceand tool are presented, in which one can avoid chatterinstability by using the mentioned three-dimensionalSLDs and dimensional measuring tools.
This paper is organized as follows: �rst, thedynamic model of the workpiece and the machine toolis constructed and the FRFs of the system are calcu-lated. Next, three-dimensional SLDs diagrams basedon the geometrical parameters of the workpiece andthe machine tool are extracted. Finally, an exampleof the application of the diagrams to prevent chatterinstability is shown by performing an experimental test.
2. The dynamic model of the system andextracting the relative TF
In this study to model the dynamic behavior of the
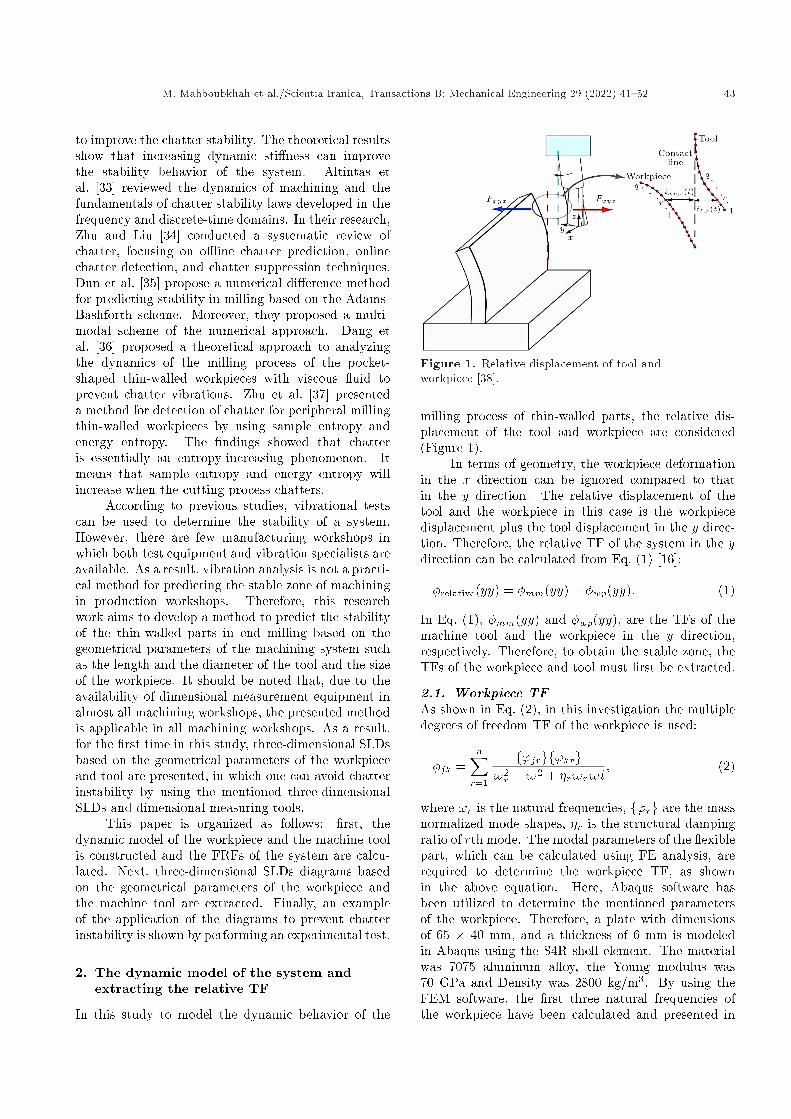
Figure 1. Relative displacement of tool andworkpiece [38].
milling process of thin-walled parts, the relative dis-placement of the tool and workpiece are considered(Figure 1).
In terms of geometry, the workpiece deformationin the x direction can be ignored compared to thatin the y direction. The relative displacement of thetool and the workpiece in this case is the workpiecedisplacement plus the tool displacement in the y direc-tion. Therefore, the relative TF of the system in the ydirection can be calculated from Eq. (1) [16]:
�relative(yy) = �mm(yy) + �wp(yy): (1)
In Eq. (1), �mm(yy) and �wp(yy), are the TFs of themachine tool and the workpiece in the y direction,respectively. Therefore, to obtain the stable zone, theTFs of the workpiece and tool must �rst be extracted.
2.1. Workpiece TFAs shown in Eq. (2), in this investigation the multipledegrees of freedom TF of the workpiece is used:
�jk =nXr=1
f'jrgf'krg$2r �$2 + �r$r$i
; (2)
where !r is the natural frequencies, f'rg are the massnormalized mode shapes, �r is the structural dampingratio of rth mode. The modal parameters of the exiblepart, which can be calculated using FE analysis, arerequired to determine the workpiece TF, as shownin the above equation. Here, Abaqus software hasbeen utilized to determine the mentioned parametersof the workpiece. Therefore, a plate with dimensionsof 65 � 40 mm, and a thickness of 6 mm is modeledin Abaqus using the S4R shell element. The materialwas 7075 aluminum alloy, the Young modulus was70 GPa and Density was 2800 kg/m3. By using theFEM software, the �rst three natural frequencies ofthe workpiece have been calculated and presented in

44 M. Mahboubkhah et al./Scientia Iranica, Transactions B: Mechanical Engineering 29 (2022) 41{52
Table 1. The �rst three natural frequencies of theworkpiece in Hz.
Mode no. Current study Leissa [39]1 1171.4 1162.52 3903.1 4187.23 6139.1 7168.8
Figure 2. First three mode shapes of the workpiece.
Table 1. Also, the �rst three mode shapes of the plateare illustrated in Figure 2. Three frequencies obtainedusing Abaqus software were compared with theoreticalresults obtained in [39] to ensure proper modeling of theworkpiece in FEM software and accuracy of the results.
To acquire the damping ratio, the experimentalmodal test was performed. The plate was subjectedto external excitation for this purpose, as shown inFigure 3, and the acceleration of a speci�c point onit was measured. The equipment used for the modaltest was the 222B miniature accelerometer with asensitivity of 16 pC/g and an HP2035 dual-channelanalyzer. The FRF of the workpiece are obtained inthe above modal test as well as in simulations shownin Figure 4. It is worth noting that, the �rst threedamping ratios of the workpiece were obtained by usingmodal software (Table 2).
2.2. Tool TFTo determine the relative TF of the system, thefrequency response of the tool is needed, which canbe obtained as follow.
First, the tool is modeled as a cantilever beam
Figure 4. Frequency Response Function (FRF) of theworkpiece in the y direction.
Figure 5. Schematic model of the tool.
Table 2. First three damping coe�cients of theworkpiece.
Mode no. Damping ratio (%)1 0.252 0.413 0.61
as illustrated in Figure 5. Then the motion equationsof a cantilever are derived and the time responseof the tool which is subjected to impact force isobtained. Finally performing the Fourier transform ondisplacement signal, the frequency response of the toolis achieved.
The vibrational equation of the beam under theexcitation of the force P can be expressed as [40]:
Figure 3. Workpiece modal test.
M. Mahboubkhah et al./Scientia Iranica, Transactions B: Mechanical Engineering 29 (2022) 41{52 45
EI@4w(x; t)@x4 +c
@w(x; t)@t
+m@2w(x; t)@t2
=p�(x�a);(3)
where c is the Rayleigh damping coe�cient, w is thedisplacement of the beam at point x, EI is the bendingsti�ness, and m is the mass per unit length of thecantilever. The boundary conditions can be expressedas:
@w@x
����x=0
= 0; wjx=0 = 0;
@2w@x2
����x=Lt
= 0;@3w@x3
����x=Lt
= 0: (4)
The solution of Eq. (3) can be expressed as follows:
w(x; t) =1Xr=1
r(x)�r(t); (5)
where �r(t) is the modal coordinate and r(x) is:
r(x) =Dr
�cosh
��rLtx�� cos
��rLtx�
��r�
sinh��rLtx�� sin
��rLtx���
; (6)
where:
�r =sinh�r � sin�rcosh�r + cos�r
: (7)
�r is acquired from the following equation:
1 + cosh�r cos�r = 0: (8)
The natural frequency of the system is expressedthrough the following equation:
!r = �2r
sEImL4
t: (9)
Eq. (10) can be derived by substituting Eq. (5) intoEq. (3) and applying the orthogonality criteria:
d2�r(t)dt2
+ 2�r!rd�r(t)dt
+ !2r�r(t)
=1m
Z L
0 s(x)p(t)�(x� a)dx; r=1; 2; 3: (10)
In the above relation the damping ratio can be com-puted from Eq. (11):
2�r!r =cm: (11)
The time response of the cantilever with Lt = 60 mm,r = 10 mm, E = 200 GPa, � = 7800 kg/m3 is derivedby using the Runge-Kutta 4th order method. One can
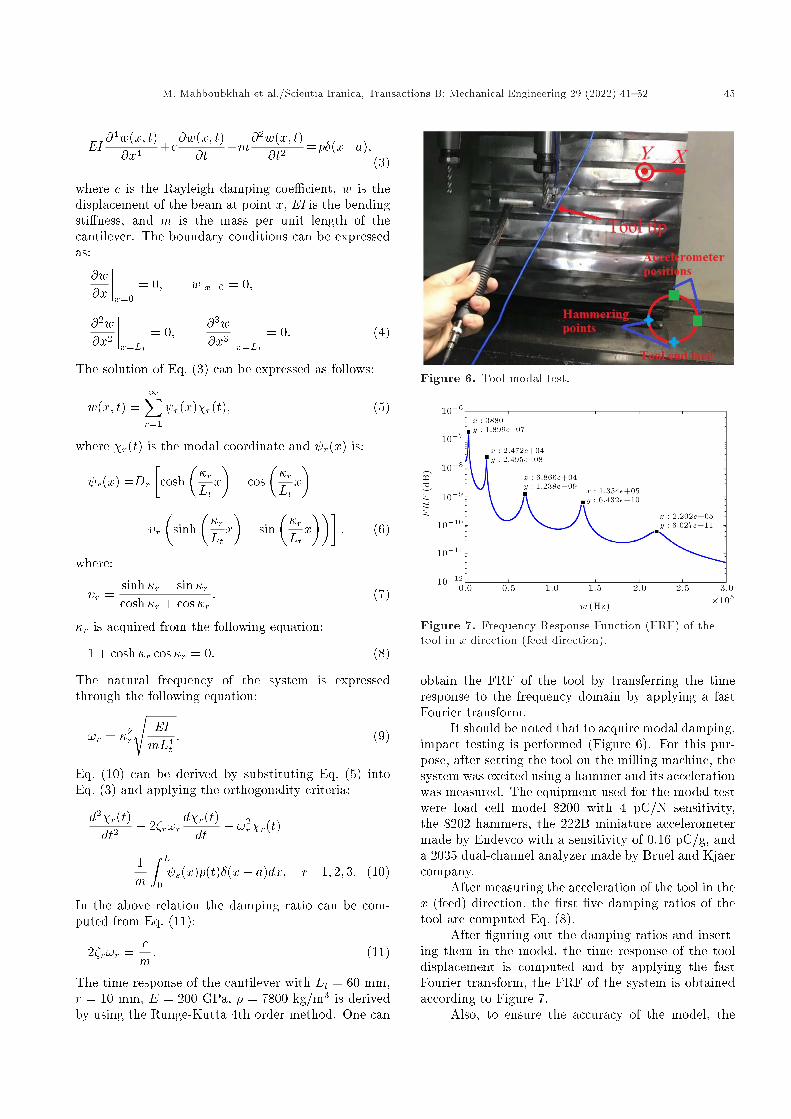
Figure 6. Tool modal test.
Figure 7. Frequency Response Function (FRF) of thetool in x direction (feed direction).
obtain the FRF of the tool by transferring the timeresponse to the frequency domain by applying a fastFourier transform.
It should be noted that to acquire modal damping,impact testing is performed (Figure 6). For this pur-pose, after setting the tool on the milling machine, thesystem was excited using a hammer and its accelerationwas measured. The equipment used for the modal testwere load cell model 8200 with 4 pC/N sensitivity,the 8202 hammers, the 222B miniature accelerometermade by Endevco with a sensitivity of 0.16 pC/g, anda 2035 dual-channel analyzer made by Bruel and Kjaercompany.
After measuring the acceleration of the tool in thex (feed) direction, the �rst �ve damping ratios of thetool are computed Eq. (8).
After �guring out the damping ratios and insert-ing them in the model, the time response of the tooldisplacement is computed and by applying the fastFourier transform, the FRF of the system is obtainedaccording to Figure 7.
Also, to ensure the accuracy of the model, the
46 M. Mahboubkhah et al./Scientia Iranica, Transactions B: Mechanical Engineering 29 (2022) 41{52
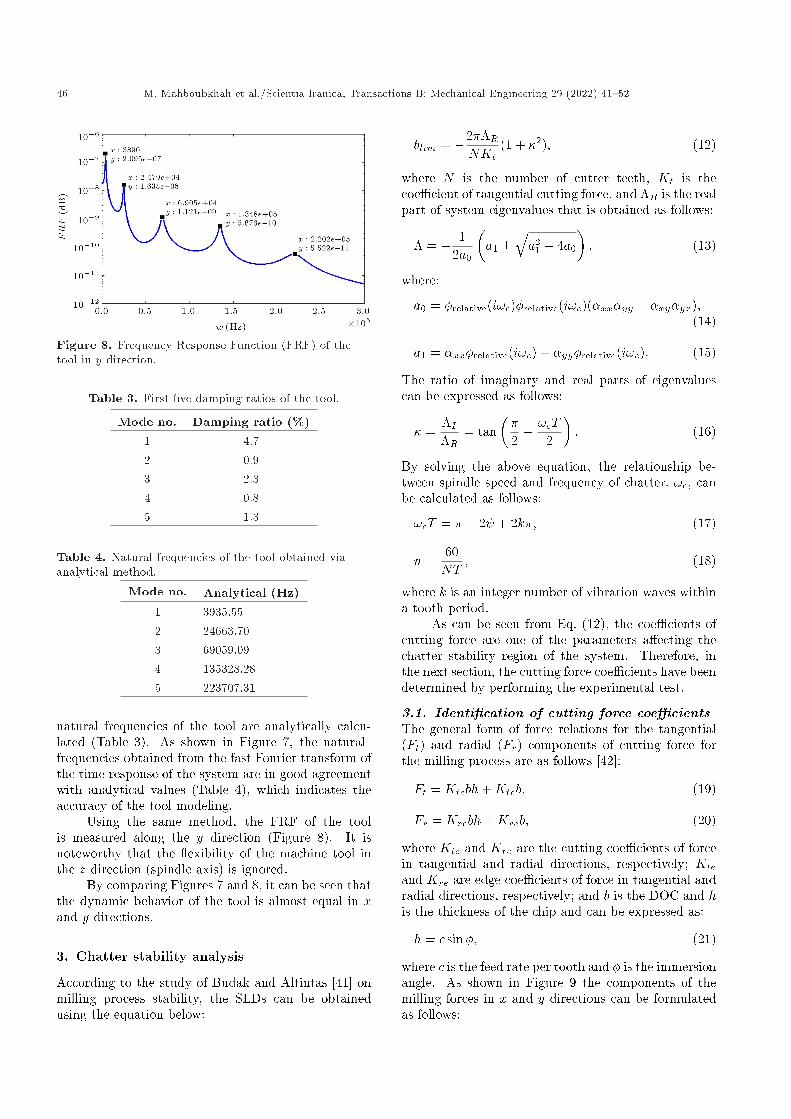
Figure 8. Frequency Response Function (FRF) of thetool in y direction.
Table 3. First �ve damping ratios of the tool.
Mode no. Damping ratio (%)1 4.72 0.93 2.34 0.85 1.3
Table 4. Natural frequencies of the tool obtained viaanalytical method.
Mode no. Analytical (Hz)1 3935.552 24663.703 69059.094 135328.285 223707.31
natural frequencies of the tool are analytically calcu-lated (Table 3). As shown in Figure 7, the naturalfrequencies obtained from the fast Fourier transform ofthe time response of the system are in good agreementwith analytical values (Table 4), which indicates theaccuracy of the tool modeling.
Using the same method, the FRF of the toolis measured along the y direction (Figure 8). It isnoteworthy that the exibility of the machine tool inthe z direction (spindle axis) is ignored.
By comparing Figures 7 and 8, it can be seen thatthe dynamic behavior of the tool is almost equal in xand y directions.
3. Chatter stability analysis
According to the study of Budak and Altintas [41] onmilling process stability, the SLDs can be obtainedusing the equation below:
blim = �2��RNKt
(1 + �2); (12)
where N is the number of cutter teeth, Kt is thecoe�cient of tangential cutting force, and �R is the realpart of system eigenvalues that is obtained as follows:
� = � 12a0
�a1 �
qa2
1 � 4a0
�; (13)
where:
a0 = �relative(i!c)�relative(i!c)(�xx�yy � �xy�yx);(14)
a1 = �xx�relative(i!c) + �yy�relative(i!c): (15)
The ratio of imaginary and real parts of eigenvaluescan be expressed as follows:
� =�I�R
= tan��2� !cT
2
�: (16)
By solving the above equation, the relationship be-tween spindle speed and frequency of chatter, !c, canbe calculated as follows:
!cT = � � 2 + 2k�; (17)
n =60NT
; (18)
where k is an integer number of vibration waves withina tooth period.
As can be seen from Eq. (12), the coe�cients ofcutting force are one of the parameters a�ecting thechatter stability region of the system. Therefore, inthe next section, the cutting force coe�cients have beendetermined by performing the experimental test.
3.1. Identi�cation of cutting force coe�cientsThe general form of force relations for the tangential(Ft) and radial (Fr) components of cutting force forthe milling process are as follows [42]:
Ft = Ktcbh+Kteb; (19)
Fr = Krcbh+Kreb; (20)
where Ktc and Krc are the cutting coe�cients of forcein tangential and radial directions, respectively; Kteand Kre are edge coe�cients of force in tangential andradial directions, respectively; and b is the DOC and his the thickness of the chip and can be expressed as:
h = c sin�; (21)
where c is the feed rate per tooth and � is the immersionangle. As shown in Figure 9 the components of themilling forces in x and y directions can be formulatedas follows:

M. Mahboubkhah et al./Scientia Iranica, Transactions B: Mechanical Engineering 29 (2022) 41{52 47
Figure 9. Components of cutting forces in x and ydirections [43].
Fx = Ft cos�+ Fr sin�; (22)
Fy = Ft sin�� Fr cos�: (23)
By substituting Eqs. (19) to (21) in Eqs. (22) and (23),the total milling force for end-mill with N number ofteeth is obtained as follows:
Fx =NXj=1
�Ktcac
sin 2�j2
+Ktea cos�j
+Krcac1� cos 2�j
2+Krea sin�j
�g(�j); (24)
Fy =NXj=1
�Ktcac
1� cos 2�j2
+Ktea sin�j
�Krcacsin 2�j
2�Krea cos�j
�g(�j); (25)
where g(�j) is the unit step function, which shows thestate of the cutting edge engagement and is expressedas:
g(�j) =
(1 if �st < �j < �ex0 if �j < �st or �j > �ex
); (26)
where, �st and �ex are entry and exit angles of thetool, respectively. By integrating Eqs. (24) and (25)in the
��st �ex
�interval and taking into account the
groove machining conditions (�st = 0 and �ex = �),the average force per tooth is calculated as below:
Table 5. Cutting parameters of groove-millingexperiments.
Experimentno.
Axial DOC(mm)
Spindle speed(RPM)
1 3 7002 3 5003 2 7004 2 5005 1 10006 1 700
�Fx =NaKrc
4c+
NaKre
�; (27)
�Fy =NaKtc
4c+
NaKtc
�: (28)
According to Eqs. (27) and (28), the average forceper tooth is a linear function of feed rates. Also onecan obtain cutting coe�cients of force by deriving thementioned equations. For this purpose, six groups ofgroove-milling experiments, with the conditions shownin Table 5 were carried out. In each test, �rst, theaverage cutting force in the x and y directions wasmeasured in 7 di�erent values of feed rates i.e., c =[0.01, 0.025, 0.04, 0.055, 0.07, 0.085, 0.1] mm/th, con-stant spindle speed and axial DOC. For this purpose,the dynamometer type KISTLER 9257B is placed on athree-axis CNC milling table and an aluminum block(AL7075) is mounted on it (Figure 10). Next, using a4-edge end-mill, mentioned six groups of groove-millingexperiments, were carried out.
Figure 10. Measuring the cutting forces in groovemilling.

48 M. Mahboubkhah et al./Scientia Iranica, Transactions B: Mechanical Engineering 29 (2022) 41{52
Figure 11. Average cutting force in x and y directionsfor di�erent values of feed rate.
In each of these test sets, the average cutting forcein the x and y directions was measured in the di�erentvalues of feed rates. For example, the average cuttingforce versus feed rate in x and y directions for the �rstcase of the experiment is illustrated in Figure 11. By�tting the curve on the data and using Eqs. (27) and(28), the cutting coe�cients Krc = 344:5 MPa andKtc = 939:83 MPa are obtained for the �rst case test.Finally, the cutting coe�cients are obtained as Krc =309:94 MPa and Ktc = 964:42 MPa by averaging theresults of all experiment cases.
3.2. E�ect of workpiece and tool dimensionson the chatter stability region
Figure 12 shows the SLDs for three di�erent workpieceheights, L = 60 mm, L = 70 mm, and L = 80 mm, fora thin-walled 7075 aluminum workpiece with a widthof 40 mm and a thickness of 6 mm. Radial DOCwas taken 4 mm and the values of other parametersare the same as Sections 2.1 and 2.2. As can beseen in Figure 12, with increasing the height of theworkpiece, the stability lobes moved downward andthe stability region of the system decreased. Thereason for decreasing the stability region of the system
Figure 12. Stability lobe diagram for three di�erentworkpiece heights.
Figure 13. Stability lobe diagram for three di�erent toollengths.
is that as the height of the workpiece increases thesti�ness of the system decreases. Also, as can be seenfrom the mentioned �gure, the lobes move leftwards byincreasing the height of the workpiece. The reason forthis is that as the height of the workpiece rises, thenatural frequencies of the workpiece fall, causing thelobes to shift to the left.
Moreover the SLDs for three di�erent tool lengths,Lt = 80 mm, Lt = 90 mm, and Lt = 100 mmare presented in Figure 13. As seen in this �gure,the stability region decreases as the length of the toolincreases.
3.3. Three dimensional SLD based on thegeometrical parameter of the system
As shown earlier, to de�ne the stability region ofthe machining process the vibrational tests are nec-essary. In practice, however, no vibration equipmentor specialists are available in all workshops to predictthe stability boundaries. Therefore three-dimensionalstability diagrams based on the geometrical parametersof the machining system are presented.
In Figure 14, three-dimensional SLD is illustratedfor di�erent values of workpiece thickness/workpiece
Figure 14. Three dimensional stability lobe diagram interms of the workpiece thickness/height ratio.
M. Mahboubkhah et al./Scientia Iranica, Transactions B: Mechanical Engineering 29 (2022) 41{52 49
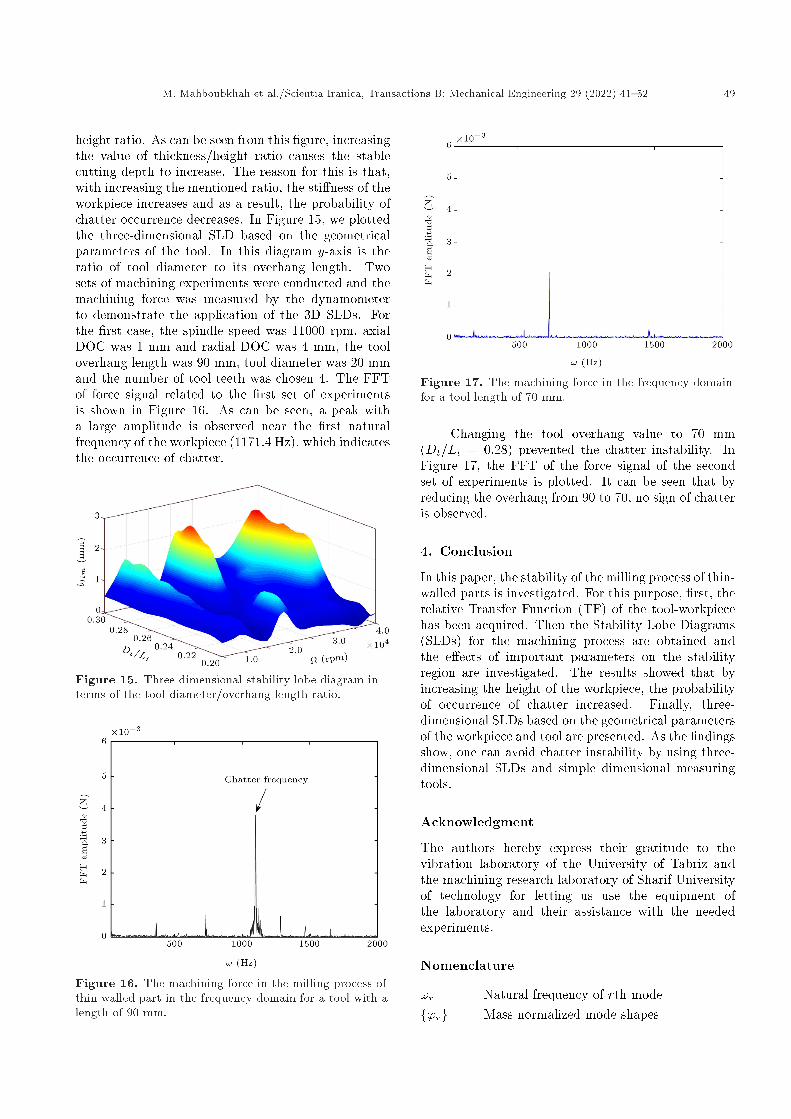
height ratio. As can be seen from this �gure, increasingthe value of thickness/height ratio causes the stablecutting depth to increase. The reason for this is that,with increasing the mentioned ratio, the sti�ness of theworkpiece increases and as a result, the probability ofchatter occurrence decreases. In Figure 15, we plottedthe three-dimensional SLD based on the geometricalparameters of the tool. In this diagram y-axis is theratio of tool diameter to its overhang length. Twosets of machining experiments were conducted and themachining force was measured by the dynamometerto demonstrate the application of the 3D SLDs. Forthe �rst case, the spindle speed was 11000 rpm, axialDOC was 1 mm and radial DOC was 4 mm, the tooloverhang length was 90 mm, tool diameter was 20 mmand the number of tool teeth was chosen 4. The FFTof force signal related to the �rst set of experimentsis shown in Figure 16. As can be seen, a peak witha large amplitude is observed near the �rst naturalfrequency of the workpiece (1171.4 Hz), which indicatesthe occurrence of chatter.
Figure 15. Three dimensional stability lobe diagram interms of the tool diameter/overhang length ratio.
Figure 16. The machining force in the milling process ofthin-walled part in the frequency domain for a tool with alength of 90 mm.
Figure 17. The machining force in the frequency domainfor a tool length of 70 mm.
Changing the tool overhang value to 70 mm(Dt=Lt = 0:28) prevented the chatter instability. InFigure 17, the FFT of the force signal of the secondset of experiments is plotted. It can be seen that byreducing the overhang from 90 to 70, no sign of chatteris observed.
4. Conclusion
In this paper, the stability of the milling process of thin-walled parts is investigated. For this purpose, �rst, therelative Transfer Function (TF) of the tool-workpiecehas been acquired. Then the Stability Lobe Diagrams(SLDs) for the machining process are obtained andthe e�ects of important parameters on the stabilityregion are investigated. The results showed that byincreasing the height of the workpiece, the probabilityof occurrence of chatter increased. Finally, three-dimensional SLDs based on the geometrical parametersof the workpiece and tool are presented. As the �ndingsshow, one can avoid chatter instability by using three-dimensional SLDs and simple dimensional measuringtools.
Acknowledgment
The authors hereby express their gratitude to thevibration laboratory of the University of Tabriz andthe machining research laboratory of Sharif Universityof technology for letting us use the equipment ofthe laboratory and their assistance with the neededexperiments.
Nomenclature
!r Natural frequency of rth modef'rg Mass normalized mode shapes
50 M. Mahboubkhah et al./Scientia Iranica, Transactions B: Mechanical Engineering 29 (2022) 41{52
�r Structural damping ratio of rth modew(x; t) Displacement of the beam at point xc Rayleigh damping coe�cientEI Bending sti�nessm Mass per unit length of the beam�r(t) Modal coordinate r(x) Mass normalized eigenfunction�r Dimensionless frequency parameterKt Coe�cient of tangential cutting force�R Real part of system's eigenvalues!c Frequency of chatterKtc Cutting coe�cient of force in tangential
directionKrc Cutting coe�cient of force in radial
directionKte Edge coe�cient of force in tangential
directionKre Edge coe�cient of force in radial
direction� Immersion angleg(�j) Unit step function�st Entry angle of the tool�ex Exit angle of the tool
References
1. Herranz, S., Campa, F., Lacalle, L.L., et al. \Themilling of airframe components with low rigidity: ageneral approach to avoid static and dynamic prob-lems", Proceedings of the Institution of Mechanical En-gineers, Part B: Journal of Engineering Manufacture,219, pp. 789{801 (2005).
2. Ding, Y. and Zhu, L. \Investigation on chatter stabilityof thin-walled parts considering its exibility basedon �nite element analysis", The International Journalof Advanced Manufacturing Technology, 94, pp. 3173{3187 (2018).
3. Sunilsing, R. and Deshmukh, D. \Experimental analy-sis of regenerative chatter in BFW vertical milling ma-chine", International Journal of Innovative Researchin Science, Engineering and Technology, 3, pp. 13731{13739 (2014).
4. Insperger, T., Mann, B.P., St�ep�an, G., and Bayly,P.V. \Stability of up-milling and down-milling, part 1:alternative analytical methods", International Journalof Machine Tools and Manufacture, 43, pp. 25{34(2003).
5. Otto, A., Rauh, S., Kolouch, M., and Radons, G.\Extension of Tlusty's law for the identi�cation ofchatter stability lobes in multi-dimensional cuttingprocesses", International Journal of Machine Toolsand Manufacture, 82, pp. 50{58 (2014).
6. Tobias, S.A. and Fishwick, W., A Theory of Regener-ative Chatter, The Engineer London (1958).
7. Tlusty, J. and Polacek, M. \The Stability of the ma-chine tool against self-excited vibration in machining",ASME Int. Res. in Production, 1, pp. 465{474 (1963).
8. Tang, A.J. and Liu, Z.Q. \E�ect of helix angle and nor-mal rake angle on stability in end milling", AdvancedMaterials Research, 69, pp. 394{398 (2009).
9. Seguy, S., Campa, F.J., Lacalle, L.L., Arnaud, L.,Dessein, G., and Aramendi, G., \Toolpath dependentstability lobes for the milling of thin-walled parts",International Journal of Machining and Machinabilityof Materials, 4, pp. 377{392 (2008).
10. Gonzalo, O., Peigne�e, G., and Gonza�alez, D. \Highspeed machining simulation of thin-walled compo-nents", In Proceedings of 5th International Conferenceon High Speed Machining, University of Metz, Metz,France (2006).
11. Campa, F.J., Seguy, S., Lacalle, L.L., Arnaud, L.,Dessein, G., and Aramendi, G. \Stable milling ofthin-walled parts with variable dynamics", Tekniker,Ed., In 6th International Conference on High SpeedMachining, San Sebastia�an, Spain (2007).
12. Campa, F.J., Lacalle, L.L., Urbikain, G., and Ruiz,D. \De�nition of cutting conditions for thin-to-thinmilling of aerospace low rigidity parts", In Interna-tional Manufacturing Science and Engineering Confer-ence, 48517, pp. 359{368 (2008).
13. Song, Q.H., Wan, Y., Yu, S.Q., Ai, X., and Pang,J.Y. \Stability prediction during thin-walled workpiecehigh-speed milling", Advanced Materials Research,69{70, pp. 428{432 (2009).
14. Tang, A. and Liu, Z. \Three-dimensional stability lobeand maximum material removal rate in end milling ofthin-walled plate", Int. J. Adv. Manuf. Technol., 43,pp. 33{39 (2009).
15. Ismail, F. and Ziaei, R. \Chatter suppression in �ve-axis machining of exible parts", International Journalof Machine Tools and Manufacture, 42, pp. 115{122(2002).
16. Bravo, U., Altuzarra, O., Lacalle, L.L., S�anchez,J.A., and Campa, F.J. \Stability limits of millingconsidering the exibility of the workpiece and themachine", International Journal of Machine Tools andManufacture, 45, pp. 1669{1680 (2005).
17. Ma~n�e, I., Gagnol, V., Bouzgarrou, B.C., and Ray, P.\Stability-based spindle speed control during exibleworkpiece high-speed milling", International Journalof Machine Tools and Manufacture, 48, pp. 184{194(2008).
18. Seguy, S., Dessein, G., and Arnaud, L. \Surfaceroughness variation of thin wall milling, related tomodal interactions", International Journal of MachineTools and Manufacture, 48, pp. 261{274 (2008).
19. Atlar, S., Budak, E., and �Ozg�uven, H.N. \Modelingpart dynamics and chatter stability in machining con-sidering material removal", In 1st International Con-ference on Process Machine Interactions, Hannover,pp. 61{72 (2008).

M. Mahboubkhah et al./Scientia Iranica, Transactions B: Mechanical Engineering 29 (2022) 41{52 51
20. Zhang, X., Xiong, C., and Ding, Y. \A new solutionfor stability prediction in exible part milling", InInternational Conference on Intelligent Robotics andApplications, Berlin, Heidelberg, pp. 452{464 (2011).
21. Budak, E., Tun�c, L.T., Alan S., and �Ozg�uven, H.N.\Prediction of workpiece dynamics and its e�ects onchatter stability in milling", CIRP Annals - Manufac-turing Technology, 61, pp. 339{342 (2012).
22. Powa lka, B. and Jemielniak, K. \Stability analysis inmilling of exible parts based on operational modalanalysis", CIRP Journal of Manufacturing Science andTechnology, 9, pp. 125{135 (2015).
23. Wan, M., Dang, X.B., Zhang, W.H., and Yang, Y.\Optimization and improvement of stable processingcondition by attaching additional masses for millingof thin-walled workpiece", Mechanical Systems andSignal Processing, 103, pp. 196{215 (2018).
24. Wan, M., Gao, T.Q., Feng, J., and Zhang, W.H. \Onimproving chatter stability of thin-wall milling by pre-stressing", Journal of Materials Processing Technology,264, pp. 32{44 (2019).
25. Yan, B. and Zhu, L. \Research on milling stabil-ity of thin-walled parts based on improved multi-frequency solution", The International Journal of Ad-vanced Manufacturing Technology, 102(1{4), pp. 431{441 (2019).
26. Zhu, L., Liu, B., and Chen, H. \Research on chatterstability in milling and parameter optimization basedon process damping", Journal of Vibration and Con-trol, 24(12), pp. 2642{2655 (2018).
27. Wan, S., Jin, X., Maroju, N.K., and Hong, J. \E�ectof vibration assistance on chatter stability in milling",International Journal of Machine Tools and Manufac-ture, 145, p. 103432 (2019).
28. Liu, B., Zhu, L., Dun, Y., and Liu, C. \Investigation onchatter stability of thin-walled parts in milling basedon process damping with relative transfer functions",The International Journal of Advanced ManufacturingTechnology, 89(9{12), pp. 2701{2711 (2017).
29. Liu, C., Zhu, L., and Ni, C. \Chatter detection inmilling process based on VMD and energy entropy",Mechanical Systems and Signal Processing, 105, pp.169{182 (2018).
30. Wan, S., Li, X., Su, W., Yuan, J., and Hong, J.\Active chatter suppression for milling process withsliding mode control and electromagnetic actuator",Mechanical Systems and Signal Processing, 136, p.106528 (2020).
31. Wu, G., Li, G., Pan, W., Wang, X., and Ding,S. \A prediction model for the milling of thin-wallparts considering thermal-mechanical coupling andtool wear", International Journal of Advanced Man-ufacturing Technology, 107(11{12), pp. 4645{4659(2020).
32. Xia, Y., Wan, Y., Luo, X., et al. \Development of atoolholder with high dynamic sti�ness for mitigatingchatter and improving machining e�ciency in face
milling", Mechanical Systems and Signal Processing,145, p. 106928 (2020).
33. Altintas, Y., Stepan, G., Budak, E., Schmitz, T.,and Kilic, Z.M. \Chatter stability of machining op-erations", Journal of Manufacturing Science and En-gineering, 142, pp. 110801{110819 (2020).
34. Zhu, L. and Liu, C. \Recent progress of chatter predic-tion, detection and suppression in milling", MechanicalSystems and Signal Processing, 143, p. 106840 (2020).
35. Dun, Y., Zhu, L., and Wang, S. \Multi-modal methodfor chatter stability prediction and control in millingof thin-walled workpiece", Applied Mathematical Mod-elling, 80, pp. 602{624 (2020).
36. Dang, X.B., Wan, M., Zhang, W.H., and Yang,Y. \Chatter analysis and mitigation of milling ofthe pocket-shaped thin-walled workpieces with viscous uid", International Journal of Mechanical Sciences,194, p. 106214 (2021).
37. Zhu, L., Liu, C., Ju, C., and Guo, M. \Vibrationrecognition for peripheral milling thin-walled work-pieces using sample entropy and energy entropy",The International Journal of Advanced ManufacturingTechnology, 108(9), pp. 3251{3266 (2020).
38. Eksioglu, C., Kilic, Z.M., and Altintas, Y. \Discrete-time prediction of chatter stability, cutting forces, andsurface location errors in exible milling systems",Journal of Manufacturing Science and Engineering,134(6), p. 061006 (2012).
39. Leissa, A.W., Vibration of Plates, Ohio State UnivColumbus (1969).
40. Rezaee, M., Yam, G.F., and Fathi, R. \Development ofmodal analysis free vibration response only method forrandomly excited systems", Acta Mechanica, 226(12),pp. 4031{4042 (2015).
41. Budak, E. and Altintas, Y. \Analytical prediction ofchatter stability in milling{part I: general formula-tion", Journal of Dynamic Systems, Measurement, andControl, 120, pp. 22{30 (1998).
42. Altintas, Y., Manufacturing Automation: Metal Cut-ting Mechanics, Machine Tool Vibrations, and CNCDesign, Cambridge University Press (2000).
43. Schmitz, T.L. and Smith, K.S., Machining Dynamics :Frequency Response to Improved Productivity, Springer(2009).
Biographies
Mehran Mahboubkhah was born in 1975. He isAssociate Professor in the Department of MechanicalEngineering at University of Tabriz, Iran. He ob-tained his BSc degree from Amirkabir University ofTechnology, Iran in 1998, his MSc degree from SharifUniversity of Technology (SUT), Iran in 2000, and hisPhD degree from the University of Tarbiat Modares,Iran in 2007, all in Mechanical Engineering, Manufac-turing branch. His research interests include machining
52 M. Mahboubkhah et al./Scientia Iranica, Transactions B: Mechanical Engineering 29 (2022) 41{52
and machine tool dynamics, design of machine toolstructure, Parallel Kinematic Machine tools (PKMs),and metrology.
Mohamad Reza Movahhedy received his BSc de-gree from the University of Tehran, Iran in 1988, hisMSc degree from University of Waterloo, Canada in1994, and his PhD degree from University of BritishColombia, Canada in 2000, all in Mechanical Engineer-ing. He is currently a Professor in the Departmentof Mechanical Engineering at Sharif University ofTechnology (SUT), Iran. His research interests areFEM simulation of metal cutting/forming processes,machining and machine tool dynamics, mechanics ofmachining process, experimental modal analysis, andcomputer-aided tolerancing.
Amir Jodeiri Feizi received his BSc degree from theUniversity of Tabriz, Iran in 2000, his MSc degreefrom Sharif University of Technology (SUT), Iran in2003, all in the Mechanical Engineering, Manufac-turing branch. He started his work as a precisionmeasurement expert in the Metrology Laboratory ofIran Tractor Manufacturing Company (ITMCO), Iran.He continued his profession as a machining processdesigner in Saipa Engineering and Manufacturing ofEquipment and Tools company (SEMETCO), Iran.Since then he is a PhD student of Mechanical Engineer-ing, Manufacturing branch, at Mechanical EngineeringDepartment of the University of Tabriz, Iran. Workingon his PhD thesis made him experienced in the ModalTest of machine tools and machining process. Hisresearch interests are in machining and metrology.