Three-Dimensional Morphology and Gene Expression Mapping...
12
Topic Introduction Three-Dimensional Morphology and Gene Expression Mapping for the Drosophila Blastoderm David W. Knowles To properly understand the transcriptional network of animals, we must have full quantitative com- prehension of the spatial and temporal expression patterns of transcription factors and their targets. Visual inspection of embryos stained to reveal the patterns of genes shows levels of expression that change from cell to cell in a complex manner. With our current wealth of knowledge regarding the basic biology of animal genomes and the components of their transcriptional regulatory networks, combined with current technologies in optical microscopy, computing, and image and vision analysis, we should be able to capture quantitative, three-dimensional (3D) information about the transcrip- tional network (all factors and targets) for an entire animal at cellular resolution. It should also be poss- ible to assemble these data into a single computationally analyzable database—an atlas—that could be the basis for uncovering new biology governing regulatory gene networks. This article describes pro- gress toward realizing these goals, with the focus on Drosophila melanogaster. It describes a suite of high-throughput methods that have been used to create the first quantitative 3D description of gene expression and morphology at cellular resolution in a whole animal, and it presents some of the new biology that has been revealed by this quantitative atlas. INTRODUCTION This article describes the efforts of the Berkeley Drosophila Transcription Network Project (BDTNP) (http://bdtnp.lbl.gov) to produce a computationally analyzable atlas of morphology and gene expression in a whole blastoderm embryo at cellular resolution. This work has been a multidisciplinary collaboration involving expertise in biology, imaging, image analysis, mathematics, computer science, vision, visualization, and database construction, and so it is not feasible to create a practical manual of all these areas in one article. However, the methods and references used in the project are described in detail in the BDTNP publications. The first part of this article describes the thinking required to develop the strategy for this project, and the second part briefly outlines the techniques that enabled the atlas to be produced and some of the consequent biological discoveries. The aim is to promote understanding and to inspire readers to think of the many endeavors that become possible with comprehensive morphology and gene expression data of an entire animal. THINKING ABOUT A STRATEGY Looking at Gene Expression in Drosophila Embryos If you walk down Bungtown Road to the sandbar at Cold Spring Harbor, you will be fascinated by the prehistoric-looking horseshoe crabs found there on the beach. But, for now, imagine you are in the Adapted from Imaging in Developmental Biology (ed. Sharpe and Wong). CSHL Press, Cold Spring Harbor, NY, USA, 2011. © 2012 Cold Spring Harbor Laboratory Press Cite this article as Cold Spring Harbor Protoc; 2012; doi:10.1101/pdb.top067843 150
-
Upload
trinhthien -
Category
Documents
-
view
221 -
download
2
Transcript of Three-Dimensional Morphology and Gene Expression Mapping...
Topic Introduction
Three-Dimensional Morphology and Gene ExpressionMapping for the Drosophila Blastoderm
David W. Knowles
To properly understand the transcriptional network of animals, we must have full quantitative com-prehension of the spatial and temporal expression patterns of transcription factors and their targets.Visual inspection of embryos stained to reveal the patterns of genes shows levels of expression thatchange from cell to cell in a complex manner. With our current wealth of knowledge regarding thebasic biology of animal genomes and the components of their transcriptional regulatory networks,combined with current technologies in optical microscopy, computing, and image and vision analysis,we should be able to capture quantitative, three-dimensional (3D) information about the transcrip-tional network (all factors and targets) for an entire animal at cellular resolution. It should also be poss-ible to assemble these data into a single computationally analyzable database—an atlas—that could bethe basis for uncovering new biology governing regulatory gene networks. This article describes pro-gress toward realizing these goals, with the focus on Drosophila melanogaster. It describes a suite ofhigh-throughput methods that have been used to create the first quantitative 3D description of geneexpression and morphology at cellular resolution in a whole animal, and it presents some of thenew biology that has been revealed by this quantitative atlas.
INTRODUCTION
This article describes the efforts of the Berkeley Drosophila Transcription Network Project (BDTNP)(http://bdtnp.lbl.gov) to produce a computationally analyzable atlas of morphology and geneexpression in a whole blastoderm embryo at cellular resolution. This work has been amultidisciplinarycollaboration involving expertise in biology, imaging, image analysis, mathematics, computer science,vision, visualization, and database construction, and so it is not feasible to create a practical manual ofall these areas in one article. However, the methods and references used in the project are described indetail in the BDTNP publications. The first part of this article describes the thinking required todevelop the strategy for this project, and the second part briefly outlines the techniques thatenabled the atlas to be produced and some of the consequent biological discoveries. The aim is topromote understanding and to inspire readers to think of the many endeavors that become possiblewith comprehensive morphology and gene expression data of an entire animal.
THINKING ABOUT A STRATEGY
Looking at Gene Expression in Drosophila Embryos
If you walk down Bungtown Road to the sandbar at Cold Spring Harbor, you will be fascinated by theprehistoric-looking horseshoe crabs found there on the beach. But, for now, imagine you are in the
Adapted from Imaging in Developmental Biology (ed. Sharpe and Wong). CSHL Press, Cold Spring Harbor, NY, USA, 2011.
© 2012 Cold Spring Harbor Laboratory PressCite this article as Cold Spring Harbor Protoc; 2012; doi:10.1101/pdb.top067843
150

laboratory peering down amicroscope at an early-stage embryo of another arthropod,Drosophila mel-anogaster, one of the most studied model organisms. Your goal is to better understand how thegenome orchestrates transcriptional control during morphogenesis to produce such incredible bio-logical structures. This has been a long-standing problem that will continue to baffle and delightus. The transcriptional regulatory network in each animal is composed of thousands of differentgenetically controlled components, many of which interact directly and/or indirectly with oneanother with varying binding strengths. Such networks give rise to intricate patterns of expressionthat vary in space and time and direct morphogenesis.
Drosophila embryos are �500-µm long, which is an ideal size for high-resolution fluorescenceimaging. Moreover, this animal comes with >100 years of research data, including extensive workon the genetic basis of morphogenesis (for which the Nobel Prize was awarded in 1995) and, morerecently, the entire genetic sequence (Adams et al. 2000). In our imaginary scene, the embryo,which is termed a blastoderm before gastrulation, has been fluorescently stained for one or two ofthe many genes that are involved in Drosophila development. The blastoderm, which exists for thefirst 3 h of embryogenesis, is a multinucleated syncytium that comprises a central yolk surroundedby a single layer of some 6000 nuclei (Campos-Ortega et al. 1997). The single layer of cells meansthat the gene expression patterning (which controls the body plan) is on the embryo surface, andthis is why the patterning is so evident as you look under the microscope. The transcriptional regulat-ory network is also relatively simple, comprising only�50 transcription factors, which control�1000target genes (Lawrence 1992), most of which have been well characterized.
Switching to phase-contrast microscopy, you see that the embryo is in the process of cellularizing.Cell membranes are invaginating from the surface of the embryo, on the apical sides of the nuclei, andgrowing toward the basal side through the cytoplasm that separates the newly forming cells. Closerobservation of several embryos at different orientations reveals that cellularization is more completeon the ventral side than on the dorsal side. Cellularization occurs through stage 5 and does not quitecomplete before the embryo starts to gastrulate. You also notice that nuclei are more spherical at thebeginning of cellularization and elongate during stage 5 with their long axis aligning with the normalvector of the embryo surface.
Perhaps the pattern being viewed under fluorescence is one of the maternally expressed genes suchas bicoid, or maybe it is one of the later, more intricate patterns expressed by the developing embryoalong either its anteroposterior (A–P) or dorsoventral (D–V) axis. What is striking is how clever theunderlying transcriptional regulatory information encoded in animal genomes must be for suchexquisitely varying patterns to be created. Because the patterning is on the surface, a simple adjust-ment of the focus is all that is needed to clearly see the rise and fall of expression levels along theA–P axis. It becomes clear that this complexity can only occur if expression levels vary in preciselydetermined, quantitative ways from one cell to another. Furthermore, although these cell-to-cellexpression variations are clearly observed along the A–P axis, they are difficult to appreciatearound the D–V axis. This is caused by a combination of the geometry of the embryo, the limiteddepth of focus of high-numerical-aperture lenses, and the difficulty of perceiving patterns in thethird or optical z dimension. Nevertheless, there is no reason to think that expression level variationsaround the D–V axis are any less complex.
You then lower the magnification by switching objectives, or you view the embryo under a bin-ocular dissecting fluorescence microscope. The longer depth of focus created by the lower numericalaperture of the lens (i.e., a simple geometric pinhole effect) allows the 3D nature of the pattern, whichenvelops the embryo, to be revealed. And although the numerical aperture and resolving power at thismagnification are lower, you can still appreciate the cellular level of the patterning. To overcome thelimited perception around the D–V axis, you imagine inventing a rotisserie system for the embryo or apotato peeler, whereby the embryo could be skinned and the skin laid flat for better observation. Theembryo could perhaps be squashed and analyzed on one side, but that would perturb the delicatesystem being studied and make it difficult to determine the D–V orientation. You wish for a betterway than either skinning or squashing to quantitatively examine this beautifully patterned develop-mental canvas of life.
Cite this article as Cold Spring Harbor Protoc; 2012; doi:10.1101/pdb.top067843 151
3D Morphology and Gene Expression Mapping

Pattern Dynamics: Looking at Fixed versus Live Embryos
Gene expression pattern formation is dynamic. Broadly expressed maternal proteins initiate the pat-terning of increasingly complex target gene expression. The earliest patterns in the system can bedivided into those having dominantly A–P or D–V dependence. These early A–P and D–V patternsact largely independently at first, but at some stage, their interaction is needed to create later patternsof greater complexity that have both A–P and D–V dependences. How do these regulators interact,and what is the shape of the network?
Pattern dynamics result from individual nuclei that change their expression level with time. Arethese nuclei uniformly distributed on the embryo surface, or are they also dynamic like the pattern?Nuclear spatial dynamics would certainly impact the underlying mechanism of pattern formation. Itwas long assumed that nuclei were uniformly distributed at the periphery of the embryo during stage5, although they underwent great dynamics during earlier stages when they migrated to the embryosurface. Also, as soon as the embryo gastrulates, the nuclei are neither stationary nor distributed uni-formly. So there is really no evidence to suggest that nuclei should be uniformly distributed duringstage 5. To understand embryonic pattern formation, it is likely important tomapboth gene expressionlevels and nuclear position through time. In fact, it would not be surprising if there were significantrearrangements of nuclear positions that correlated spatially with imminent gastrulation events.
But why are we looking at fixed embryos when, for studying dynamics, live animals would cer-tainly be better? A few calculations quickly reveal that live animals bring other complexities. First,the yolk is opaque because it is granulated and optically similar to a bag of glass marbles in air.Fixed embryos are carefully optically cleared by amountingmedium thatmakes the central yolk trans-parent, in much the same way as those marbles would become clear by mounting them in moltenglass. The mountant also has a refractive index that matches that of the cover glass, and thisremoves the possibility of spherical aberration (caused by refractive index mismatch at the opticalinterface of the cover glass and biology), which increasingly obscures image formation with acqui-sition depth. Having a single refractive index throughout the object allows you to see clearly all theway through the embryo. Second, stage 5 only lasts for a little <1 h. To properly capture thepattern dynamics, each image must be acquired within 1 min or so. This is a problem because theacquisition time for a high-resolution 3D image of an entire blastoderm takes almost an order of mag-nitude longer than this with a laser-scanning microscope. Finally, it is far easier to create probes thatcan be hybridized to any product of the 1000 genes of interest than it is to create live animals thatexpress fluorescent proteins for 1000 genes. In light of these points, fixed embryos provide an excellentstarting point for developing an image-based strategy to capture the morphology and the geneexpression patterns of the developing embryo.
In summary, assessment of the imaginary scenario described above allows you to make the follow-ing notes and observations regarding the development of a strategy for mapping 3D morphology andgene expression in Drosophila embryos.
1. The size of a Drosophila embryo makes it well suited for microscopy because it fits into a singlefield of view.
2. The blastoderm is a syncytium in which the expression patterning that controls the body plan iscompletely revealed on the embryo surface.
3. Only �50 transcription factors and 1000 genes are thought to be involved in the transcriptionalnetwork of the blastoderm.
4. Cellularization begins during stage 5, the period before the onset of gastrulation. Cell membranesgrow from the embryo surface inward, and nuclei become elongated.
5. Complex patterning requires expression level variations between individual cells. These variationsare precisely controlled over the entire animal.
6. Variations of expression are clearly seen along the A–P axis. It is difficult to see around the D–Vaxis, but patterning in this direction is probably just as complex.
152 Cite this article as Cold Spring Harbor Protoc; 2012; doi:10.1101/pdb.top067843
D.W. Knowles

7. To track expression pattern dynamics, a precise temporal staging system is required.
8. How do the early A–P and D–V expression patterns interact?
9. What is the role of nuclear position on the regulatory canvas? Are the nuclei distributed uniformlythrough stage 5? Do the nuclei reorganize in preparation for gastrulation?
10. Live animals would be ideal, but they complicate the imaging. Initially, let us use fixed embryos.
High-Throughput Imaging and Analysis to Create a ComputationallyAnalyzable Gene Expression Atlas
High-throughput biology has become commonplace in many areas, including proteomics, genomics,and drug discovery, in which the research involves screening and analysis of repetitious biologicalexperiments. Fluorescence microscopy is a well-established tool in biology, but increasingly sophisti-cated applications are replacing point-and-click experiments in which a single representative image isused to elucidate a biological question. Current technologies in microscopy and computing allow newkinds of experiments to be envisioned and to be performed, and these require automated image acqui-sition, large repositories for data management and storage, and fast automated image-analysis andquantitative visualization techniques.
For the Drosophila blastoderm atlas, the goal is to produce a computationally analyzable record ofthe pattern of protein expression of �50 transcription factors and the mRNA expression of 1000genes, which together encompass the primary patterning regulators and their targets. Although it isrelatively straightforward to produce probes that are specific for any given gene, current stainingand imaging technologies do not allow 1000 different genes to be stained and to be imaged in asingle embryo. Instead, several thousand embryo images will be required if we are to capture all ofthe patterns of interest in a single atlas. To enable such a large project, automation must be developedfor acquiring and analyzing the images, and a database will be needed to track the associatedmetadata.Embryos should be imaged at as high a numerical aperture as possible, but the lens must have suffi-cient working distance to allow the whole embryo to be imaged. Each image will have to be analyzed toremove the inherent image acquisition artifacts and to quantify and to tabulate the gene expressionand morphology at cellular resolution to produce computationally analyzable data sets. This analysiswill condense the information from a large 3Dmultichannel image into a much smaller point cloud—a table of the nuclear coordinates and the relative expression per nucleus for the genes imaged (LuengoHendriks et al. 2006).
To create the atlas, the point clouds of multiple embryos will need to be registered together onto anaverage morphological framework. This framework will allow new patterns to be added, and the atlascan be built in a sequential manner. Image registration is a field of research in computer science andvision. As microprocessor power increases, new computational techniques are being developed toautomatically find objects of interest in an image and to track them over multiple images. One ofthe goals of such work is the identification of unique fiducial points in two images that correspondto the same object. Here, we will apply image registration techniques to the point cloud data ratherthan try to register the large raw image files. Embryo point cloud registration is complicated by thesimplicity of the blastoderm morphology, which limits the availability of fiducial marks needed tocoordinate reciprocal positions between different embryos. Point clouds can be coarsely registeredby aligning the embryo’s A–P and D–V axes, as well as by registering their surfaces, but this coarseregistration is only the first step and does not provide the final accuracy needed. Different embryosat the same stage differ in size, shape, and in the relative location of expression patterns (Luengo Hen-driks et al. 2006; Keränen et al. 2006). At late stage 5, for example, the maxima of pair-rule stripes areonly two or three cells wide, and the relative positions of these stripes vary slightly between differentembryos. Coarsely registered embryos would average these biological variations by incorrectly blur-ring the pair-rule stripe patterns over too many nuclei and thereby would produce representationsof patterns that are incorrect. To circumvent this, expression patterns need to be registered on anucleus-by-nucleus basis. Even so, it would be difficult to uniquely identify nuclei based on
Cite this article as Cold Spring Harbor Protoc; 2012; doi:10.1101/pdb.top067843 153
3D Morphology and Gene Expression Mapping

morphology alone. However, if each embryo is stained for a common gene that has a complex patternof expression, then many nuclei could be uniquely identified based on their relative position to the A–P and D–V axes and their relative expression level. These fiducial marks could then be used to establishone-to-one correspondences between all the nuclei of two embryos to produce pairwise averages thatdo not blur the expression patterns (Fowlkes et al. 2008).
The imaging and registration strategy now becomes clear. To allow nuclear segmentation, eachembryo must be stained and imaged for fluorescent markers of total DNA. One common markergene is needed to aid registration, and other expression patterns that are imaged can be registeredto the atlas. Embryo point clouds are first coarsely registered to the framework based on the A–Pand D–V axes and then are finely registered based on a set of fiducial marks defined by the coordinatesof individual nuclei. For practical reasons, based on the number of acquisition channels of the micro-scope and the complexity of hybridizing probes to an embryo, three-channel imaging provides asimple solution. This means that one fluorescent channel will be used to capture new expression pat-terns, which will be added to the atlas. Finally, the atlas will be complex and 3D, and we will need asophisticated visualization tool to allow the data to be quantitatively explored. This strategy thendefines an imaging and acquisition pipeline that involves the following steps.
1. Staining, mounting, and imaging. The procedures involved include construction of a cDNA probe,in situ hybridization, tyramide signal amplification, immunohistochemistry, and other techniquesfor fluorescently labeling mRNA, protein, and nuclear DNA in whole embryos. Imaging is accom-plished with a two-photon laser-scanning microscope, and a managed data repository is estab-lished for the image and its associated metadata.
2. Temporal staging.
3. Conversion of images to point clouds. Image analysis is achieved by 3D nuclear and cellular seg-mentation, and extraction analysis algorithms are used to turn each embryo image into a compu-tationally analyzable data point cloud. Computers with sufficient capability are required.
4. Registration of point clouds into a virtual embryo. Three-dimensional image registration methodsare used to register multiple point clouds at cellular resolution and thereby create a virtual embryoatlas of morphology and gene expression.
5. PointCloudXplore. This is a visualization tool for viewing and analyzing the atlas.
Details for many of the methods described here are provided in Luengo Hendriks et al. 2006. Allthe software tools that were developed to produce the BDTNP atlas are freely available.
THE PIPELINE
Staining, Mounting, and Imaging
Some of the crucial steps in acquiring images are proper staining and mounting. Poor images resultfrom an inadequate interface between the disciplines of biology and imaging; for example, the staininghas not worked well, the autofluorescence is overwhelming, and/or the mounting is not optimal.Often, many experiments are needed to determine the proper staining and mounting conditionsfor a particular application. For high-resolution optical imaging, attention to detail is requireddown to the scale of 0.5 µm. This dimension is that of the fluorescence emission wavelength,which determines the diffraction-limited resolution of the optical system.
In the BDTNP pipeline, RNA probes for specific genes can be visualized with tyramide signalamplification reactions using many fluorescent dyes (e.g., Cy3 and coumarin), and total DNA canbe stained with SYTOXGreen (LuengoHendriks et al. 2006). These dyes have well-separated emissionspectra and are all excited by two-photon absorption of a single wavelength, which allows three-channel images to be acquired simultaneously. The stained embryos can then be mounted inDePex, a xylene-based plastic (Electron Microscopy Sciences, Hatfield, PA). This mountant has the
154 Cite this article as Cold Spring Harbor Protoc; 2012; doi:10.1101/pdb.top067843
D.W. Knowles
advantage of creating permanent solid slides that protect the fluorophores from oxygen, therebymaking the samples resistant to photobleaching. The mountant also optically clears the embryoyolk and has a refractive index similar to that of the cover glass. Accurate determination of the refrac-tive index of the mountant is critical because it sets the length scale along the optical z direction. Therefractive index can be determined from geometric measurements made from the images of embryomorphology, which are assumed to be independent of the orientation of the embryo when it is imaged.
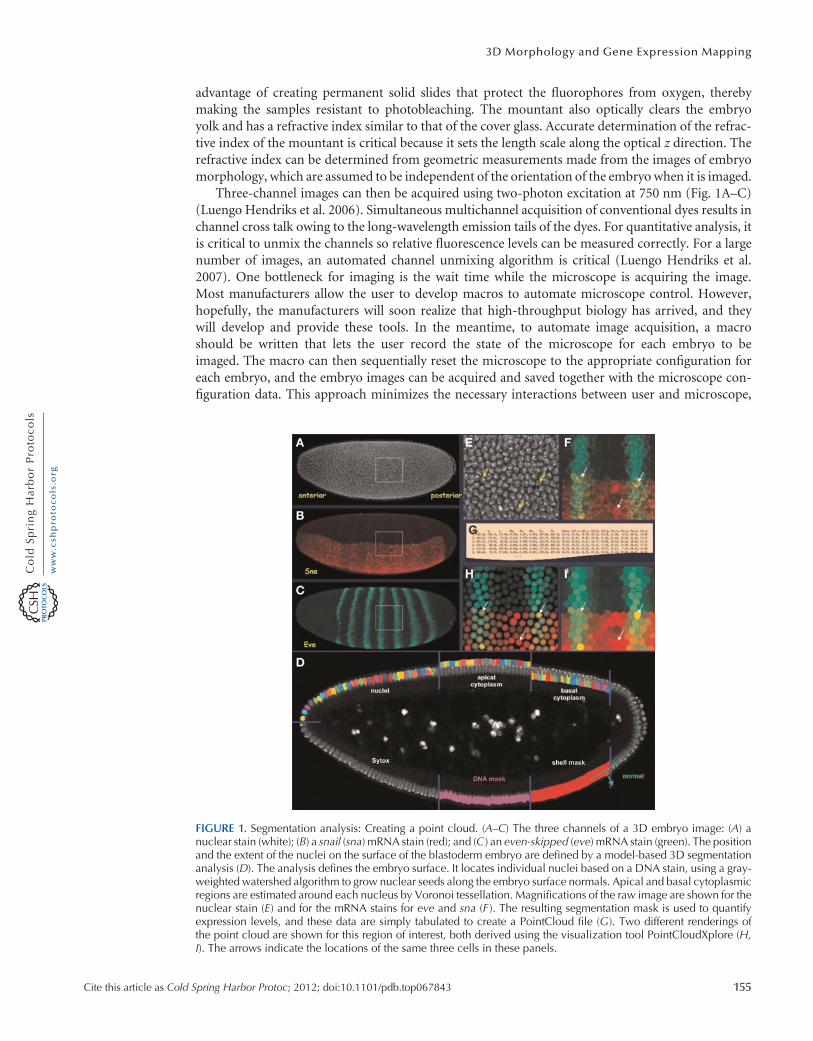
Three-channel images can then be acquired using two-photon excitation at 750 nm (Fig. 1A–C)(Luengo Hendriks et al. 2006). Simultaneous multichannel acquisition of conventional dyes results inchannel cross talk owing to the long-wavelength emission tails of the dyes. For quantitative analysis, itis critical to unmix the channels so relative fluorescence levels can be measured correctly. For a largenumber of images, an automated channel unmixing algorithm is critical (Luengo Hendriks et al.2007). One bottleneck for imaging is the wait time while the microscope is acquiring the image.Most manufacturers allow the user to develop macros to automate microscope control. However,hopefully, the manufacturers will soon realize that high-throughput biology has arrived, and theywill develop and provide these tools. In the meantime, to automate image acquisition, a macroshould be written that lets the user record the state of the microscope for each embryo to beimaged. The macro can then sequentially reset the microscope to the appropriate configuration foreach embryo, and the embryo images can be acquired and saved together with the microscope con-figuration data. This approach minimizes the necessary interactions between user and microscope,
FIGURE 1. Segmentation analysis: Creating a point cloud. (A–C) The three channels of a 3D embryo image: (A) anuclear stain (white); (B) a snail (sna) mRNA stain (red); and (C ) an even-skipped (eve) mRNA stain (green). The positionand the extent of the nuclei on the surface of the blastoderm embryo are defined by a model-based 3D segmentationanalysis (D). The analysis defines the embryo surface. It locates individual nuclei based on a DNA stain, using a gray-weighted watershed algorithm to grow nuclear seeds along the embryo surface normals. Apical and basal cytoplasmicregions are estimated around each nucleus by Voronoi tessellation. Magnifications of the raw image are shown for thenuclear stain (E) and for the mRNA stains for eve and sna (F ). The resulting segmentation mask is used to quantifyexpression levels, and these data are simply tabulated to create a PointCloud file (G). Two different renderings ofthe point cloud are shown for this region of interest, both derived using the visualization tool PointCloudXplore (H,I). The arrows indicate the locations of the same three cells in these panels.
Cite this article as Cold Spring Harbor Protoc; 2012; doi:10.1101/pdb.top067843 155
3D Morphology and Gene Expression Mapping

and allows the microscope to sequentially image multiple embryos without user intervention. Becauseall the acquisition parameters are recorded, any slide can be put back on themicroscope, and any or allof the embryos that have been previously imaged can be automatically revisited and/or reimaged.
Temporal Staging
To study pattern dynamics, a precise temporal staging system is required. Embryos can be staged byvisual inspection under phase-contrast microscopy and can be broadly classified via the stages pre-viously described (Campos-Ortega et al. 1997). However, a finer temporal staging system is neededto fully capture the rapid changes in morphology and gene expression. During stage 5, the percentageof membrane invagination can be used as a temporal marker. Membrane invagination is clearly seenunder phase-contrast microscopy but is only accurately measured in the x–y plane. Further, becauseembryos are mounted in randomD–V orientations and membrane invagination is more advanced onthe ventral side than on the dorsal side, the final membrane invagination percentage must be extrapo-lated from the value measured on the ventralmost surface and the D–V orientation of the embryo,which can be accurately determined after the point cloud from that image is made.
Conversion of Images to Point Clouds
Toquantify the relative expression levels from images, the image positions of all the nuclei are required.The total-DNA SYTOX image (Fig. 1A) can be used to determine the position and the extent of allembryonic nuclei to produce a segmentation mask. Many basic algorithms have been developed inthe field of image analysis to enable image segmentation, but segmentation remains a problem thatis not trivial. Model-based approaches are usually required in which the segmentation algorithmrelies on a priori knowledge of the objects to be segmented and high image quality is essential.
For speed, the segmentation analysis can be restricted to the embryo surface by creating a 3Dbinary mask, the shell mask (Fig. 1D). The mask can be produced by taking an adaptive thresholdof the SYTOX image, which isolates the bright DNA fluorescence and adapts for signal attenuationwith image depth. The shell mask is then used to direct spectral unmixing and to allow attenuationcorrection of the SYTOX channel required for the segmentation. The shell mask can be refined toproduce a DNA mask (Fig. 1D) that identifies regions in the image belonging to the nuclei. TheSYTOX image within this mask is then convolved with a narrow Gaussian, and the positions of indi-vidual nuclei, termed seeds, are defined by local maxima in this image. To eliminate multiple seeds pernucleus, the embryo surface normal for each seed is computed, and neighboring seeds that lie alongthis normal are removed. Each seed is then grown to fill the nuclei, using a region-growing technique.To use both geometrical and gray-value information of the image, the region growing should combinea watershed algorithm and a gray-weighted distance transform (Luengo Hendriks et al. 2006). Thecombination of these two algorithms creates nuclear boundaries that match actual boundarieswhen visible, yet divides distances between seeds equally when boundaries are not distinguishable.
To capture the labeled mRNA expression levels, the cellular extent surrounding each nucleus canbe estimated by growing the nuclear segmentation mask along the apical and basal directions into thecytoplasm by tessellation (Fig. 1D). The distances grown were established by determining the cyto-plasmic extent, which can be estimated by its autofluorescence from the raw image. The resultingcytoplasmic mask is then used in combination with the nuclear mask to divide each cell into threeregions: apical, nuclear, and basal (Fig. 1D). Expression levels are estimated on a per cell basis asthe average value within each of these regions for all the channels (Fig. 1E,F). These values, togetherwith the center of mass of the nuclei, the volumes of the various cellular regions, and the neighbor-hood relationships between cells, are then written to a text PointCloud file (Fig. 1G). The PointCloudfile captures the information from the image and allows the data to be visualized (Fig. 1H,I). For sub-sequent analysis, expression values from the point clouds are corrected for signal attenuation by divid-ing the results from the Cy3 and coumarin channels by those from the SYTOX channel. This approachassumes that the average SYTOX intensity is constant from nucleus to nucleus and that it is represen-tative of the attenuation of the other channels.
156 Cite this article as Cold Spring Harbor Protoc; 2012; doi:10.1101/pdb.top067843
D.W. Knowles
Registration of Point Clouds into a Virtual Embryo
The atlas is constructed by registering individual point clouds onto a common framework, created asan average over an ensemble of point clouds. The registration takes into account the significant vari-ation between embryo sizes, number of cells, and relative locations of gene expression patterns. Thekey is identifying corresponding cells, or fiducial marks, between images of multiple embryos andusing these correspondences to combine measurements of expression and morphology (Fowlkeset al. 2008) (Fig. 2A). Fiducial marks can be established by using the pair-rule patterns of eve andfushi tarazu (ftz) as common expression markers. These patterns can be used, along with the A–Pand D–V coordinates, to define a set of cells along pattern boundaries that act as the correspondencepoints between pairs of embryos. Once these are established, it is straightforward to find the corre-spondence for the remaining cells in the embryo so that an average virtual embryo can be built. Mul-tiple frameworks are required because both the embryomorphology and the relative position of nucleichange during stage 5. Thus, to properly understand the dynamics, a temporal correspondence is alsorequired between different frameworks for the temporal cohorts (Fig. 2A) (Fowlkes et al. 2008).
The accuracy of the resulting registration can be tested by comparing average expression levelsrecorded in the virtual embryo with those measured directly in embryos costained for the expressionof two genes. For this experiment, a set of cells along the anterior edge of eve stripe 2 are selected, inwhich the transcription factor gt is known to repress eve expression (Fig. 2B). gt versus eve expressionis plotted for these cells from a set of embryos costained for eve and gt (Fig. 2C) and from a set of eve-ftzand gt-ftz embryos, registered using ftz expression (Fig. 2D). As Figure 2D shows, the virtual measure-ment of eve and gt should replicate the relation derived from the costained embryos (Fig. 2C). Infer-ences about regulatory relationships made using the virtual embryo are, thus, similar to those madefrom individual embryos. As a comparison, the coexpression of eve and gt can be plotted for a set ofcoarsely registered embryos (Fig. 2E). This experiment shows the superiority of the fine registrationtechnique and shows that building cellular resolution expression atlases frommultiple embryos is notonly possible but is biologically accurate and also provides useful data for understanding transcrip-tional regulation.
PointCloudXplore: A Visualization Tool
To date, the BDTNP has registered PointCloud data from �3000 embryos containing around 100different mRNA and protein expression patterns to form a VirtualEmbryo representation of the blas-toderm. One of the challenges of such a large multidimensional data set is making it accessible forvisual observation and quantitative exploration. The BDTNP has developed a suite of visualizationtools (PointCloudXplore), which show the data in multiple views (Weber et al. 2009; Rübel et al.2010). Using PointCloudXplore, expression patterns such as those of eve and sna can be displayedon an average embryo morphology for multiple temporal cohorts (Fig. 3A), or these patterns canbe unrolled and displayed as a surface projection (Fig. 3B). Other relationships can be seen formultiplegenes (Fig. 3C), and height maps of the expression patterns can be added (Fig. 3D). More complexanalyses such as scatter plots and parallel coordinates are also possible using PointCloudXplore.
NEW BIOLOGY REVEALED
The PointCloud and VirtualEmbryo data can be used to reveal new features of the blastoderm system.Calculations of the local spatial density of nuclei have revealed an intricate morphology of nucleardensity patterns that changes during stage 5 (Fig. 4A–F) (Keränen et al. 2006). An overlay of thesedensity maps onto the expression patterns of eve and sna (e.g., Fig. 4G) shows that the pattern oflower nuclear densities corresponds to the embryo locations that are about to undergo gastrulationand to form the cephalic and the ventral furrows. The location of pair-rule expression stripes hasalso been shown to move relative to the field of nuclei (Keränen et al. 2006). These two resultshave a critical impact on the choice of method for temporal registration of the PointCloud data.
Cite this article as Cold Spring Harbor Protoc; 2012; doi:10.1101/pdb.top067843 157
3D Morphology and Gene Expression Mapping

The latter result indicates that a reference gene pattern cannot be used to register data between tem-poral cohorts, and the former result shows that temporal correspondences cannot be obtained byusing common spatial coordinates. Thus, to register average frameworks of different temporalcohorts, a model of the nuclear position dynamics is required (Fowlkes et al. 2008).
The atlas makes it possible to describe expression patterns quantitatively along both the A–P andthe D–V axes. Expression pattern gradients can be used to define the pattern boundaries, and theirdynamics and relative expression levels can be plotted (Keränen et al. 2006). For example, it is now
FIGURE 2.Construction of a virtual embryo. Images from hundreds of embryos are grouped into temporal cohorts, andeach cohort is registered based on a common pair-rule marker gene, which is shown in red. Expression patterns ofmany other genes stained in different embryos are, thus, brought into a common frame. Temporal correspondencebetween registered cohorts produces the virtual embryo atlas of multiple genes over multiple times (A). The accuracyof the virtual embryo was shown by plotting the coexpression of giant (gt) and eve for a set of cells along the anteriorborder of eve stripe 2 that are known to be repressed by gt (B). A plot of the coexpression of gt and eve in embryoscostained for eve and gt shows a clear anticorrelation (C ). A plot of the coexpression of gt and eve for these cells inembryos costained for eve-ftz and gt-ftz and registered using ftz shows the same anticorrelation (D). However, aplot of coexpression of gt and eve in embryos costained for eve-ftz and gt-ftz that were only coarsely registered ismuch less accurate and does not reveal the anticorrelation (E).
158 Cite this article as Cold Spring Harbor Protoc; 2012; doi:10.1101/pdb.top067843
D.W. Knowles

easy to plot the relative expression of pair-rule stripes around the D–V axis (Fig. 4H,I). These plotsshow that there are unsuspected quantitative changes along the D–V axis of pair-rule stripes(Luengo Hendriks et al. 2006). Interestingly, the D–V dependencies of pair-rule expression stripesare almost lost in dorsalizingmutants, suggesting that D–V acting factors regulate A–P expression pat-terns (Keränen et al. 2006). Although the atlas is an average over thousands of embryos, the biologicalvariability is not lost and can be studied from individual embryo point clouds. For example, plotting
FIGURE 3. PointCloudXplore. The visualization toolsof the blastoderm project provide multiple physicalviews. This figure shows expression patterns of eveand sna (A,B) and gt, rho, fkh, ftz, kr, and knrl (C,D)from the blastoderm atlas. The patterns can be visual-ized in 3D on a virtual embryo, which can be rotatedto any angle (A), or the embryo surface can be unrolledto reveal the entire pattern in a 2D view (B,C). Thisview can also be rotated, and height maps of the rela-tive expression for each gene can be added (D).
Cite this article as Cold Spring Harbor Protoc; 2012; doi:10.1101/pdb.top067843 159
3D Morphology and Gene Expression Mapping
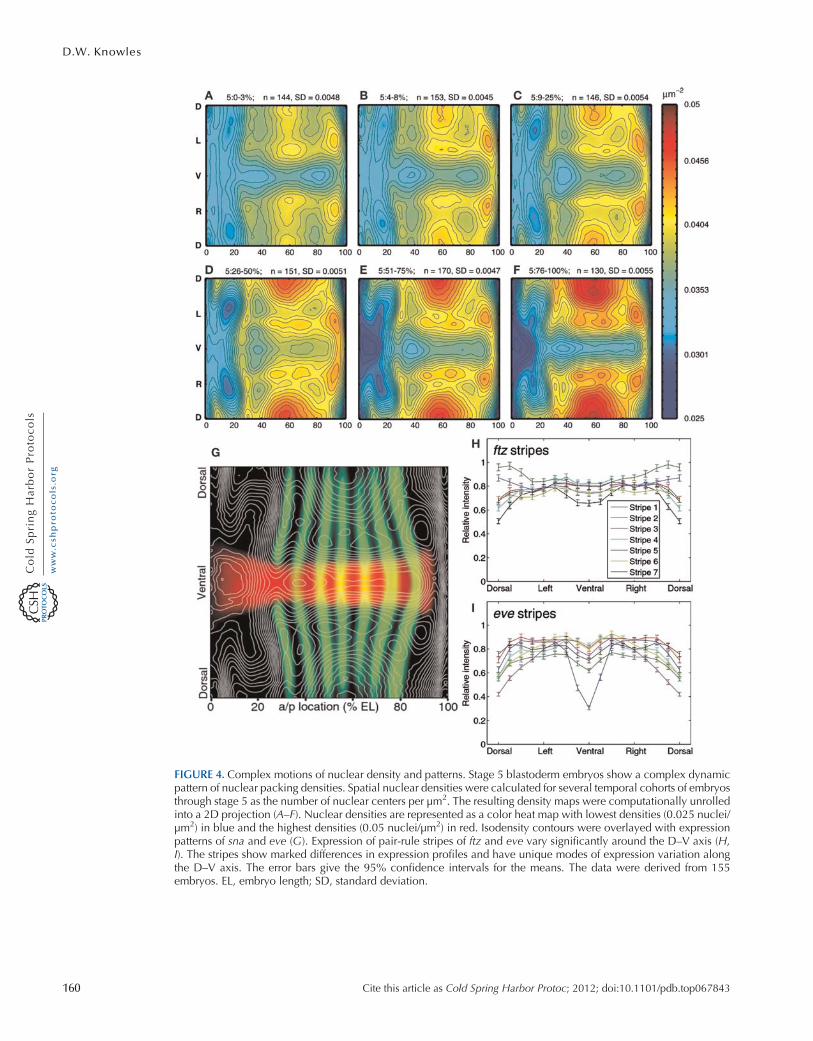
FIGURE 4. Complex motions of nuclear density and patterns. Stage 5 blastoderm embryos show a complex dynamicpattern of nuclear packing densities. Spatial nuclear densities were calculated for several temporal cohorts of embryosthrough stage 5 as the number of nuclear centers per µm2. The resulting density maps were computationally unrolledinto a 2D projection (A–F). Nuclear densities are represented as a color heat map with lowest densities (0.025 nuclei/µm2) in blue and the highest densities (0.05 nuclei/µm2) in red. Isodensity contours were overlayed with expressionpatterns of sna and eve (G). Expression of pair-rule stripes of ftz and eve vary significantly around the D–V axis (H,I). The stripes show marked differences in expression profiles and have unique modes of expression variation alongthe D–V axis. The error bars give the 95% confidence intervals for the means. The data were derived from 155embryos. EL, embryo length; SD, standard deviation.
160 Cite this article as Cold Spring Harbor Protoc; 2012; doi:10.1101/pdb.top067843
D.W. Knowles
the number of nuclei per embryo versus A–P egg length (Fowlkes et al. 2008) shows that embryo sizecorrelates with number of nuclei, suggesting that egg size depends on mitosis rate.
The chief motivation for developing the blastoderm expression atlas was to understand the regu-lation of target genes by transcription factors. By using the atlas, it has been shown that the patterns ofmany transcription factors correlate or anticorrelate with the patterns of other genes (Fowlkes et al.2008) in the same way that the expression of gt and eve stripe 2 anticorrelate (Fig. 2B–E). From thesecorrelations, it is possible to infer potential regulatory relationships within the network, a number ofwhich meet the expectations of previous molecular genetic data (Fowlkes et al. 2008). Although suchinferences cannot be used to imply that a transcription factor directly binds and regulates a target gene,in combination with other classes of data, such as genome-wide in vivo binding data and in vitro DNAspecificity data (Li et al. 2008), they will provide a significant constraint on possible models for thestructure of the regulatory network.
CONCLUSION
Current technologies in optical microscopy and computing allow high-throughput, image-basedinvestigations of multicellular biological systems. The data obtained in these studies have facilitatedthe construction of multidimensional computationally analyzable maps, which provide unprece-dented opportunities for revealing the biology of a system at the macromolecular level and on aper cell basis. The BDTNP has produced the first quantitative, 3D atlas of gene expression and mor-phology of early embryonic development in Drosophila. These technologies are profound and have abroad and exciting future.
ACKNOWLEDGMENTS
I am privileged in collaborating with an outstanding group of scientists frommultiple disciplines who,as part of the BDTNP, brought their expertise to bear on this problem. Special thanks are due to MarkD. Biggin. Many biologists are overwhelmed by today’s image-based technologies and what they canprovide. Mark quickly understood the possibilities and provided leadership and drive, without whichthis project would not have been realized. Thanks to Soile V.E. Keränen and Mark for helpful sugges-tions with this article.
REFERENCES
Adams MD, Celniker SE, Holt RA, Evans CA, Gocayne JD, Amanatides PG,Scherer SE, Li PW, Hoskins RA, Galle RF, et al. 2000. The genomesequence of Drosophila melanogaster. Science 287: 2185–2195.
Campos-Ortega JA, Hartenstein V. 1997. The embryonic development of Dro-sophila melanogaster, 2nd ed. Springer, Berlin.
Fowlkes CC, Luengo Hendriks CL, Keränen SVE, Weber GH, Rübel O,Huang MY, Chatoor S, DePace AH, Simirenko L, Henriquez C, et al.2008. A quantitative spatiotemporal atlas of gene expression in theDro-sophila blastoderm. Cell 133: 364–374.
Keränen SVE, Fowlkes CC, Luengo Hendriks CL, Sudar D, Knowles DW,Malik J, Biggin MD. 2006. Three-dimensional morphology and geneexpression in the Drosophila blastoderm at cellular resolution II:Dynamics. Genome Biol 7: R124. doi: 10.1186/gb-2006-7-12-r124.
Lawrence PA. 1992. The making of a fly: The genetics of animal design Black-well-Scientific, Oxford.
Li X, MacArthur S, Bourgon R, Nix D, Pollard DA, Iyer VN, Hechmer A,Simirenko L, Stapleton M, Luengo Hendriks CL, et al. 2008. Transcrip-tion factors bind thousands of active and inactive regions in the
Drosophila blastoderm. PLoS Biol 6: e27. doi: 10.1371/journal.pbio.0060027.
Luengo Hendriks CL, Keränen SVE, Fowlkes CC, Simirenko L, Weber GH,DePace AH, Henriquez C, Kaszuba DW, Hamann B, Eisen MB, et al.2006. Three-dimensional morphology and gene expression in the Dro-sophila blastoderm at cellular resolution I: Data acquisition pipeline.Genome Biol 7: R123.
Luengo Hendriks CL, Keränen SVE, Biggin MD, Knowles DW. 2007. Auto-matic channel unmixing for high-throughput quantitative analysis offluorescence images. Opt Express 15: 12306–12317.
Rübel O, Weber GH, Huang M, Bethel EW, Biggin MD, Fowlkes CC,Luengo Hendriks CL, Keränen SVE, Eisen MB, Knowles DW, et al.2010. Integrating data clustering and visualization for the analysis of3D gene expression data. Trans Comput Biol Bioinform 7: 64–79.
Weber GH, Rübel O, Huang M, DePace AH, Fowlkes CC, Keränen SVE,Luengo Hendriks CL, Hagen H, Knowles DW, Malik J, et al. 2009.Visual exploration of three-dimensional gene expression using physicalviews and linked abstract views.TransComput Biol Bioinform 6: 296–309.
Cite this article as Cold Spring Harbor Protoc; 2012; doi:10.1101/pdb.top067843 161
3D Morphology and Gene Expression Mapping