Turning Gaits and Optimal Undulatory Gaits for a Modular ...
Terrestrial gaits and gait transitions provide a generalframework for understanding many facets of locomotion, suchas the neural control of movement and change of speed, thebiomechanics of locomotor support and the energetic cost oflocomotion (e.g. Goslow et al., 1973; Cavagna et al., 1977;Biewener and Taylor, 1986; Alexander, 1989). Given theimportance of gait and gait transitions to these broad aspectsof locomotor function, it is not surprising that attempts toclassify different flapping flight strokes into gait types havealso had a long history (Brown, 1953; Rüppell, 1975).However, the aerodynamic effects of prospective flappinggaits, previously distinguished by differences in kinematicpatterns and qualitative observations of flight style, were firstdemonstrated by a series of flow visualization experiments(Kokshaysky, 1979; Spedding et al., 1984; Rayner et al., 1986;Spedding, 1986, 1987).
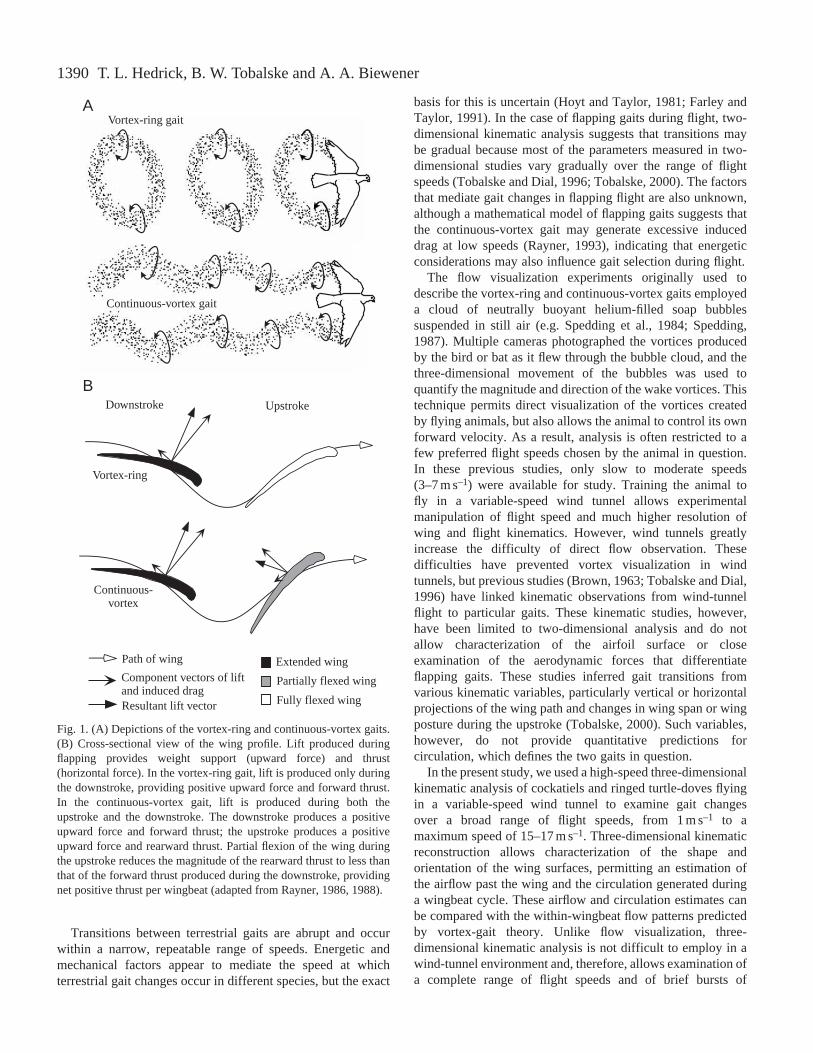
These studies revealed two basic gait types used by birds andbats during free flight: a ‘vortex-ring’ gait employed in veryslow flight and a ‘continuous-vortex’ gait used in faster forwardflight. In slow-speed flight (3 m s–1 or less), birds and batsemploy the vortex-ring gait in which each downstroke producesa single vortex ring shed from the wing into the wake at the endof the downstroke. The upstroke appears to be aerodynamicallyinactive at slow speeds, with little or no vortex shedding andlift generation (Fig. 1A,B). In faster flight (approximately7 m s–1), several bird and bat species employ a continuous-vortex gait in which each wingtip sheds a separate vortex trailduring both the upstroke and downstroke (Fig. 1A) (Rayner,1986; Spedding, 1987). This implies that a constant boundcirculation is maintained over the airfoil (wing) throughout theentire wingbeat cycle and that lift is generated during both theupstroke and downstroke (Fig. 1B) (Rayner, 1993).
1389The Journal of Experimental Biology 205, 1389–1409 (2002)Printed in Great Britain © The Company of Biologists LimitedJEB4029
Birds and bats are known to employ two different gaitsin flapping flight, a vortex-ring gait in slow flight and acontinuous-vortex gait in fast flight. We studied the use ofthese gaits over a wide range of speeds (1–17 m s–1) andtransitions between gaits in cockatiels (Nymphicushollandicus) and ringed turtle-doves (Streptopelia risoria)trained to fly in a recently built, variable-speed windtunnel. Gait use was investigated viaa combinationof three-dimensional kinematics and quasi-steadyaerodynamic modeling of bound circulation on the distaland proximal portions of the wing. Estimates of lift fromour circulation model were sufficient to support bodyweight at all but the slowest speeds (1 and 3 m s–1). Fromcomparisons of aerodynamic impulse derived from ourcirculation analysis with the impulse estimated fromwhole-body acceleration, it appeared that our quasi-steadyaerodynamic analysis was most accurate at intermediatespeeds (5–11 m s–1). Despite differences in wing shape andwing loading, both species shifted from a vortex-ring to acontinuous-vortex gait at 7 m s–1. We found that the shift
from a vortex-ring to a continuous-vortex gait (i) wasassociated with a phase delay in the peak angle of attack ofthe proximal wing section from downstroke into upstrokeand (ii) depended on sufficient forward velocity to provideairflow over the wing during the upstroke similar to thatduring the downstroke. Our kinematic estimates indicatedsignificant variation in the magnitude of circulation overthe course the wingbeat cycle when either species used acontinuous-vortex gait. This variation was great enough tosuggest that both species shifted to a ladder-wake gait asthey approached the maximum flight speed (cockatiels15 m s–1, doves 17 m s–1) that they would sustain in thewind tunnel. This shift in flight gait appeared to reflect theneed to minimize drag and produce forward thrust inorder to fly at high speed. The ladder-wake gait was alsoemployed in forward and vertical acceleration at mediumand fast flight speeds.
Key words: cockatiel, Nymphicus hollandicus, ringed turtle-dove,Streptopelia risoria, flight, kinematics, vortex, gait.
Summary
Introduction
Estimates of circulation and gait change based on a three-dimensional kinematicanalysis of flight in cockatiels (Nymphicus hollandicus) and ringed turtle-doves
(Streptopelia risoria)
Tyson L. Hedrick1,*, Bret W. Tobalske2 and Andrew A. Biewener1
1Concord Field Station, Museum of Comparative Zoology, Harvard University, Old Causeway Road, Bedford,MA 01730, USA and 2Department of Biology, University of Portland, 5000 N. Willamette Boulevard, Portland,
OR 97203, USA*e-mail: [email protected]
Accepted 4 March 2002
1390
Transitions between terrestrial gaits are abrupt and occurwithin a narrow, repeatable range of speeds. Energetic andmechanical factors appear to mediate the speed at whichterrestrial gait changes occur in different species, but the exact
basis for this is uncertain (Hoyt and Taylor, 1981; Farley andTaylor, 1991). In the case of flapping gaits during flight, two-dimensional kinematic analysis suggests that transitions maybe gradual because most of the parameters measured in two-dimensional studies vary gradually over the range of flightspeeds (Tobalske and Dial, 1996; Tobalske, 2000). The factorsthat mediate gait changes in flapping flight are also unknown,although a mathematical model of flapping gaits suggests thatthe continuous-vortex gait may generate excessive induceddrag at low speeds (Rayner, 1993), indicating that energeticconsiderations may also influence gait selection during flight.
The flow visualization experiments originally used todescribe the vortex-ring and continuous-vortex gaits employeda cloud of neutrally buoyant helium-filled soap bubblessuspended in still air (e.g. Spedding et al., 1984; Spedding,1987). Multiple cameras photographed the vortices producedby the bird or bat as it flew through the bubble cloud, and thethree-dimensional movement of the bubbles was used toquantify the magnitude and direction of the wake vortices. Thistechnique permits direct visualization of the vortices createdby flying animals, but also allows the animal to control its ownforward velocity. As a result, analysis is often restricted to afew preferred flight speeds chosen by the animal in question.In these previous studies, only slow to moderate speeds(3–7 m s–1) were available for study. Training the animal tofly in a variable-speed wind tunnel allows experimentalmanipulation of flight speed and much higher resolution ofwing and flight kinematics. However, wind tunnels greatlyincrease the difficulty of direct flow observation. Thesedifficulties have prevented vortex visualization in windtunnels, but previous studies (Brown, 1963; Tobalske and Dial,1996) have linked kinematic observations from wind-tunnelflight to particular gaits. These kinematic studies, however,have been limited to two-dimensional analysis and do notallow characterization of the airfoil surface or closeexamination of the aerodynamic forces that differentiateflapping gaits. These studies inferred gait transitions fromvarious kinematic variables, particularly vertical or horizontalprojections of the wing path and changes in wing span or wingposture during the upstroke (Tobalske, 2000). Such variables,however, do not provide quantitative predictions forcirculation, which defines the two gaits in question.
In the present study, we used a high-speed three-dimensionalkinematic analysis of cockatiels and ringed turtle-doves flyingin a variable-speed wind tunnel to examine gait changesover a broad range of flight speeds, from 1 m s–1 to amaximum speed of 15–17 m s–1. Three-dimensional kinematicreconstruction allows characterization of the shape andorientation of the wing surfaces, permitting an estimation ofthe airflow past the wing and the circulation generated duringa wingbeat cycle. These airflow and circulation estimates canbe compared with the within-wingbeat flow patterns predictedby vortex-gait theory. Unlike flow visualization, three-dimensional kinematic analysis is not difficult to employ in awind-tunnel environment and, therefore, allows examination ofa complete range of flight speeds and of brief bursts of
T. L. Hedrick, B. W. Tobalske and A. A. Biewener
Continuous-vortex gait
Vortex-ring gait
Vortex-ring
Downstroke Upstroke
Continuous-vortex
Path of wing
Resultant lift vector
Component vectors of liftand induced drag
Extended wing
Fully flexed wing
Partially flexed wing
A
B
Fig. 1. (A) Depictions of the vortex-ring and continuous-vortex gaits.(B) Cross-sectional view of the wing profile. Lift produced duringflapping provides weight support (upward force) and thrust(horizontal force). In the vortex-ring gait, lift is produced only duringthe downstroke, providing positive upward force and forward thrust.In the continuous-vortex gait, lift is produced during both theupstroke and the downstroke. The downstroke produces a positiveupward force and forward thrust; the upstroke produces a positiveupward force and rearward thrust. Partial flexion of the wing duringthe upstroke reduces the magnitude of the rearward thrust to less thanthat of the forward thrust produced during the downstroke, providingnet positive thrust per wingbeat (adapted from Rayner, 1986, 1988).
1391Three-dimensional kinematic analysis of avian gait change
acceleration or deceleration. The three-dimensional kinematicanalysis also includes the information available in two-dimensional kinematic studies, and three-dimensional changesin airfoil shape and estimates of airflow can be related tosimpler two-dimensional kinematic parameters.
The goals of our analysis are to identify the speeds at whichgait transitions occur in both species and to test whether gaittransitions during flight are gradual or abrupt. We also seek toevaluate what key kinematic changes underlie the aerodynamicbasis of a gait change during flapping flight. The two speciesinvolved in this study differ in body mass, wing shape andwing loading (body weight/wing area). Ringed turtle-doveshave approximately twice the body mass of cockatiels and haveshorter, broader wings with a proportionately larger wing areaproximal to the wrist joint; cockatiels have longer and morepointed wings with a greater distal wing area. Species with ahigh wing length-to-width ratio (aspect ratio) are expected toshift to a continuous-vortex gait at lower speeds than similarlysized species with shorter or broader wings (Rayner, 1991).Species with lower wing loading should also shift to acontinuous-vortex gait at lower flight speeds because themagnitude of circulation developed during the upstroke anddownstroke required to support the body weight should belower. Because cockatiels have approximately two thirds thewing loading of ringed turtle-doves as well as longer, morepointed wings, we expected cockatiels to adopt a continuous-vortex gait at lower speeds than ringed turtle-doves.
Materials and methodsAnimals and flight training
Two cockatiels (Nymphicus hollandicus Kerr; body mass76.5 and 76.9g, wingspan 435 and 440 mm, mean wing chord66 and 72 mm, respectively) and two ringed turtle-doves(Streptopelia risoria L.; body mass 152.0 and 128.9 g,wingspan 456 and 432 mm, mean wing chord 83 and 82 mm,respectively) (hereafter termed doves) were purchased from a
local licensed animal vendor and housed in the Concord FieldStation animal care facilities, where they were provided withfood and water ad libitum. The birds were trained to fly overa range of speeds from 1 to as high as 17 m s–1 in the ConcordField Station wind tunnel. Training lasted 1 month andconsisted of a minimum of five 30 min bouts of flight trainingper week. All individuals tended to fly in the upper forwardquadrant of the working section of the wind tunnel. Flightposition was more variable at slow speeds. Whereas thecockatiels tended to oscillate from side to side in the tunnel,the doves tended to hold a more fixed lateral position. Lateraloscillations in flight movement decreased in both species atfaster flight speeds. Cockatiels learned to fly steadily in thewind tunnel in 2–4 days and were then exercised for at leastthree additional weeks prior to data recording. The trainedcockatiels were willing to fly for at least 10 min without rest at9 m s–1. At fast and slow speeds, the duration of flights that thebirds were willing to sustain was less than this. The maximumspeed of each bird was defined as the highest speed at whichthe bird was willing and able to maintain position in the windtunnel for 15 s. Doves learned to fly steadily more slowly,requiring as much as 1 month of training to achieve flights ofmore than 2 min duration at any given speed.
Design of the wind tunnel
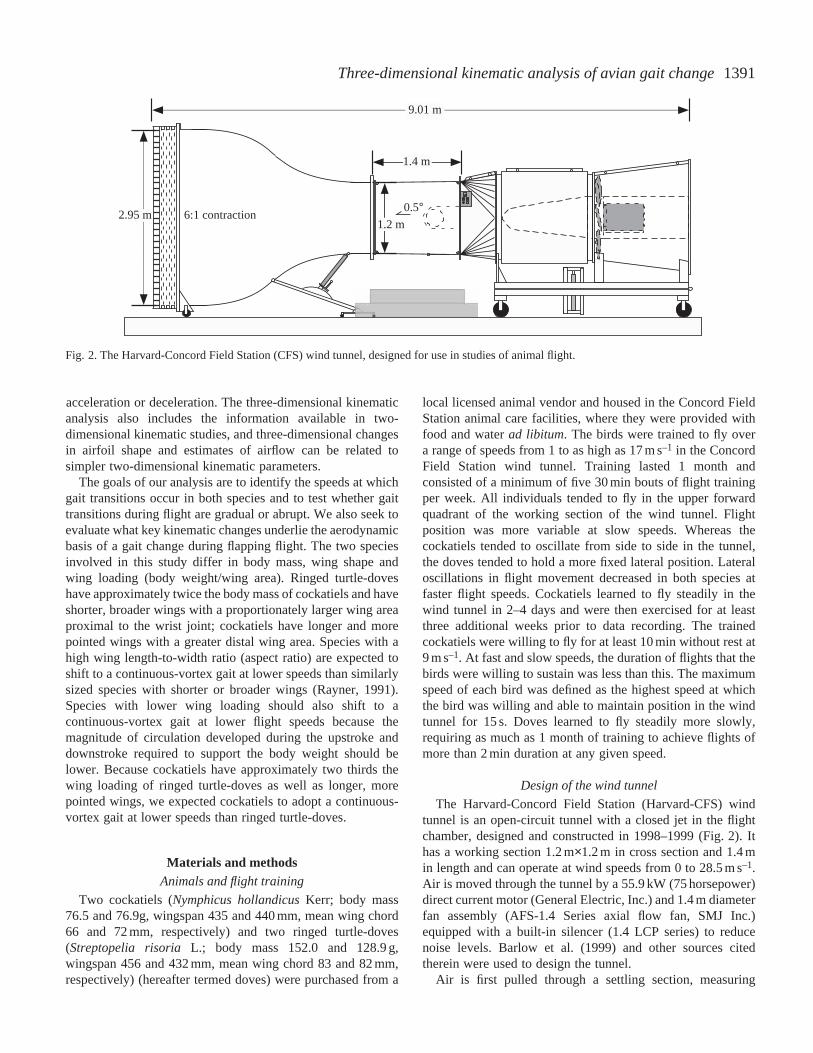
The Harvard-Concord Field Station (Harvard-CFS) windtunnel is an open-circuit tunnel with a closed jet in the flightchamber, designed and constructed in 1998–1999 (Fig. 2). Ithas a working section 1.2 m×1.2 m in cross section and 1.4 min length and can operate at wind speeds from 0 to 28.5 m s–1.Air is moved through the tunnel by a 55.9 kW (75 horsepower)direct current motor (General Electric, Inc.) and 1.4 m diameterfan assembly (AFS-1.4 Series axial flow fan, SMJ Inc.)equipped with a built-in silencer (1.4 LCP series) to reducenoise levels. Barlow et al. (1999) and other sources citedtherein were used to design the tunnel.
Air is first pulled through a settling section, measuring
Fig. 2. The Harvard-Concord Field Station (CFS) wind tunnel, designed for use in studies of animal flight.
6:1 contraction0.5°
9.01 m
1.4 m
1.2 m2.95 m
1392
9.36 m2 in cross section, constructed with a 10.2 cm deepaluminum (ACG) honeycomb panel (Hexcel Corp.), with>95 % open area and a cell diameter of 9.5 mm, followed by aseries of six stainless-steel screens (16 mesh; 72 % open area;wire diameter 0.2 mm; McMaster-Carr, Inc.) spaced 3.8 cmapart. These produce laminar airflow that is accelerated viaasettling chamber and inlet with a 6:1 contraction ratio beforeentering the working section of the tunnel. Air is moved outfrom the working section and through a first diffuser, providinga transition from a square to a circular cross section. Toimprove efficiency viarecovery of static pressure, the fanexhausts air through a second diffuser. The inner diameter ofthe diffuser’s outlet is 1.8 m.
The working section consists of Lexan wall panels, 6.4 mmthick, mounted to an aluminum frame that bolts onto thecontraction section in front and the first diffuser section at therear. A barrier composed of tensioned 250µm gauge verticalstainless-steel wires spaced 2 cm apart is located between thecontraction and working sections to prevent the birds fromflying out of the working section. This is an unavoidable designlimitation of any tunnel suitable for studies of animal flight.Flow separation and turbulence downstream in the workingsection resulting from the barrier screen, however, are minimal(see below). The working section flares out very slightly at0.5 ° to allow for boundary layer thickening in order tomaintain a functionally constant inner diameter (Barlow et al.,1999). The top panel of the working section has a small (1 cmdiameter) port located midway along its length, allowingfor light-weight cabling to transmit and record signals(electromyography, strain gauge, sonomicrometry) from theanimal during flight. The left wall has an opening 0.25 m widelocated 75 % along its depth (Fig. 2) that can be used tointroduce the animal to the working section. A clear Lexandoor can be closed to seal the port from unwanted air intakeduring flight trials. The floor of the working section also has asmall (0.3 m×0.5 m) door that can be opened to allow aninvestigator access to the inside of the working section for thepurposes of flight training, animal retrieval and cleaning.Again, to avoid disrupting airflow and introducing turbulence,this door remains closed during flight trials. The rear of theworking section is separated from the diffuser and motor-fanassembly by a wire screen to prevent the animals from beingsucked into the fan.
A significant problem with obtaining good kinematicrecordings of flight movements is reflection from incidentlighting located outside a clear acrylic wall. To solve thisproblem, the working section of the tunnel is equipped with300 W halogen lamp mounts positioned in six of its eightcorners. In practice, depending on camera position, 4–6 of themounts were used at any one time (providing 1200–1800 W oftotal illumination) to achieve the lighting necessary forobtaining high-speed digital video recordings of the animal(see below). Although the lamp mounts necessarily introducelocal turbulence in the corners of the working section, thebenefit of the lighting quality far outweighs any problems thatthis may cause. In fact, the birds never fly in these extreme
regions of the tunnel (see below), choosing to avoid the lightswhen they are turned on.
To monitor true wind velocity (Vo) in the tunnel, thedynamic pressure (q) is obtained from the pressure measuredbetween two ports located in the front and rear of thecontraction section using a differential pressure transducer(Setra 239; nominal precision 0.3 Pa), where:
q=rVo2/2 (1)
and ρ is air density. Because the differential pressure measuredby the transducer is proportional to, but less than, the dynamicpressure, it is converted to dynamic pressure by a linearcalibration based on the dynamic pressure measured using apitot-static probe (Dwyer Series 160-36) positioned in theworking section. The probe is connected to a handheld digitalmanometer (Dwyer Series 475 Mark II).
To make our measurements, obtained under the atmosphericconditions of the tunnel’s location in Bedford, Massachusetts,USA (58 m above sea level; mean air temperature during datacollection was 26.5 °C and air pressure was 100.9 kPa),comparable with measurements obtained from studiesinvolving wind tunnels at other locations, we followPennycuick et al. (1997) in reporting equivalent wind speed(Ve) rather than true wind speed:
Ve=√2q/ρo , (2)
where ρo is air density at sea level (1.225 kg m–3).
Performance of the wind tunnel
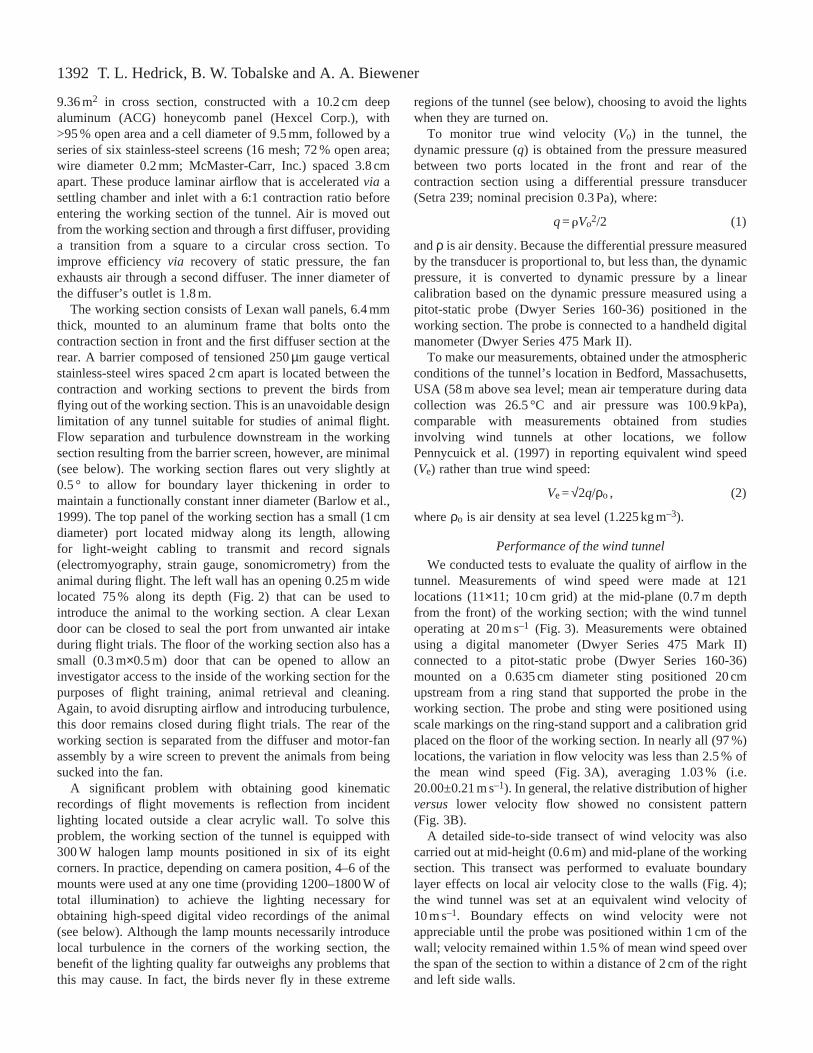
We conducted tests to evaluate the quality of airflow in thetunnel. Measurements of wind speed were made at 121locations (11×11; 10 cm grid) at the mid-plane (0.7 m depthfrom the front) of the working section; with the wind tunneloperating at 20 m s–1 (Fig. 3). Measurements were obtainedusing a digital manometer (Dwyer Series 475 Mark II)connected to a pitot-static probe (Dwyer Series 160-36)mounted on a 0.635 cm diameter sting positioned 20 cmupstream from a ring stand that supported the probe in theworking section. The probe and sting were positioned usingscale markings on the ring-stand support and a calibration gridplaced on the floor of the working section. In nearly all (97 %)locations, the variation in flow velocity was less than 2.5 % ofthe mean wind speed (Fig. 3A), averaging 1.03 % (i.e.20.00±0.21 m s–1). In general, the relative distribution of higherversus lower velocity flow showed no consistent pattern(Fig. 3B).
A detailed side-to-side transect of wind velocity was alsocarried out at mid-height (0.6 m) and mid-plane of the workingsection. This transect was performed to evaluate boundarylayer effects on local air velocity close to the walls (Fig. 4);the wind tunnel was set at an equivalent wind velocity of10 m s–1. Boundary effects on wind velocity were notappreciable until the probe was positioned within 1 cm of thewall; velocity remained within 1.5 % of mean wind speed overthe span of the section to within a distance of 2 cm of the rightand left side walls.
T. L. Hedrick, B. W. Tobalske and A. A. Biewener
1393Three-dimensional kinematic analysis of avian gait change
To measure mean air turbulence, we used a 30 cm diameterturbulence sphere (Barlow et al., 1999). We computed aturbulence factor by dividing an assumed ideal Reynoldsnumber (Re) of 385×103 by the observed critical Reof theturbulence sphere. The critical Reof the sphere matched thepoint on a fitted line (polynomial fit) at which the pressurecoefficient was 1.22. We computed percentage turbulencefrom our observed turbulence factor using the regressionprovided in Fig. 6.7 of Barlow et al. (1999).
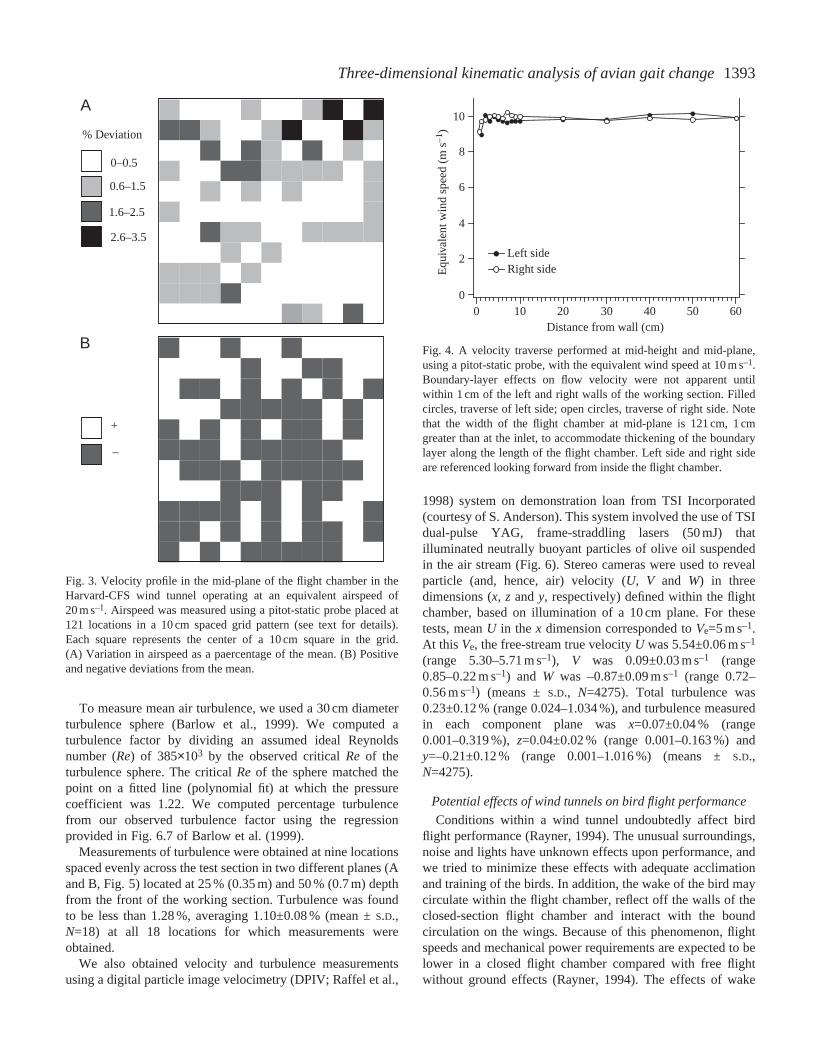
Measurements of turbulence were obtained at nine locationsspaced evenly across the test section in two different planes (Aand B, Fig. 5) located at 25 % (0.35 m) and 50 % (0.7 m) depthfrom the front of the working section. Turbulence was foundto be less than 1.28 %, averaging 1.10±0.08 % (mean ±S.D.,N=18) at all 18 locations for which measurements wereobtained.
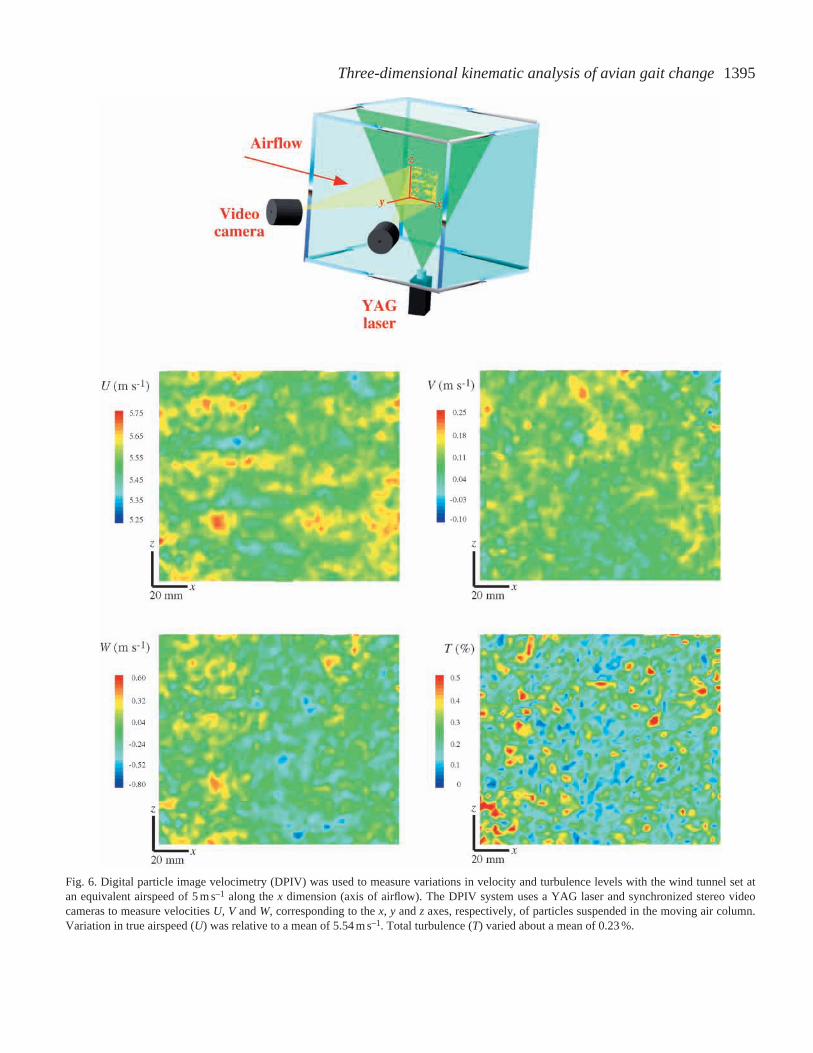
We also obtained velocity and turbulence measurementsusing a digital particle image velocimetry (DPIV; Raffel et al.,
1998) system on demonstration loan from TSI Incorporated(courtesy of S. Anderson). This system involved the use of TSIdual-pulse YAG, frame-straddling lasers (50 mJ) thatilluminated neutrally buoyant particles of olive oil suspendedin the air stream (Fig. 6). Stereo cameras were used to revealparticle (and, hence, air) velocity (U, V and W) in threedimensions (x, z and y, respectively) defined within the flightchamber, based on illumination of a 10 cm plane. For thesetests, mean Uin the xdimension corresponded to Ve=5 m s–1.At this Ve, the free-stream true velocity Uwas 5.54±0.06 m s–1
(range 5.30–5.71 m s–1), V was 0.09±0.03 m s–1 (range0.85–0.22 m s–1) and W was –0.87±0.09 m s–1 (range 0.72–0.56 m s–1) (means ±S.D., N=4275). Total turbulence was0.23±0.12 % (range 0.024–1.034 %), and turbulence measuredin each component plane was x=0.07±0.04 % (range0.001–0.319 %), z=0.04±0.02 % (range 0.001–0.163 %) andy=–0.21±0.12 % (range 0.001–1.016 %) (means ±S.D.,N=4275).
Potential effects of wind tunnels on bird flight performance
Conditions within a wind tunnel undoubtedly affect birdflight performance (Rayner, 1994). The unusual surroundings,noise and lights have unknown effects upon performance, andwe tried to minimize these effects with adequate acclimationand training of the birds. In addition, the wake of the bird maycirculate within the flight chamber, reflect off the walls of theclosed-section flight chamber and interact with the boundcirculation on the wings. Because of this phenomenon, flightspeeds and mechanical power requirements are expected to belower in a closed flight chamber compared with free flightwithout ground effects (Rayner, 1994). The effects of wake
+
–
B
0–0.5
0.6–1.5
1.6–2.5
2.6–3.5
A
% Deviation
Fig. 3. Velocity profile in the mid-plane of the flight chamber in theHarvard-CFS wind tunnel operating at an equivalent airspeed of20 m s–1. Airspeed was measured using a pitot-static probe placed at121 locations in a 10 cm spaced grid pattern (see text for details).Each square represents the center of a 10 cm square in the grid.(A) Variation in airspeed as a paercentage of the mean. (B) Positiveand negative deviations from the mean.
Fig. 4. A velocity traverse performed at mid-height and mid-plane,using a pitot-static probe, with the equivalent wind speed at 10 m s–1.Boundary-layer effects on flow velocity were not apparent untilwithin 1 cm of the left and right walls of the working section. Filledcircles, traverse of left side; open circles, traverse of right side. Notethat the width of the flight chamber at mid-plane is 121 cm, 1 cmgreater than at the inlet, to accommodate thickening of the boundarylayer along the length of the flight chamber. Left side and right sideare referenced looking forward from inside the flight chamber.
10
8
6
4
2
06050403020100
Distance from wall (cm)
Left sideRight sideE
quiv
alen
t win
d sp
eed
(m s–1)
1394
reflection are expected to decrease with increasing flight speed.Wind-tunnel effects are well documented for fixed-wingmodels (Barlow et al., 1999) but not for birds engaged inflapping flight. One study that compares wind-tunnel with free-flight performance in a bird suggests that mean wingbeatfrequency is lower in the field and that other wing kinematicsexhibit slight differences between tunnel and free flight(Tobalske et al., 1997).
Aerodynamic corrections for bird flight in a closed-sectionwind tunnel take into account the ratio of the diameter of theflight chamber to the wing span and also the position of thebird inside the chamber. The chamber diameter:wing span ratiowas 2.48 for the cockatiels and 2.56 for the doves. In a cross-sectional view, the birds of both species generally flew nearthe horizontal mid-plane or slightly above. This positionequates to h/Hvalues that ranged from 0 to 0.25, where h isthe altitude of the body above the midline of the chamber andH is the vertical height of the chamber (Rayner, 1994). UsingRayner’s (1994) model, for these animal dimensions andpositions, minimum power and maximum range speeds mayhave been reduced by 3 % and mechanical power at thesespeeds may have been reduced by 10 % relative to the samespeeds in free flight.
Lacking comparable field data, it is not possible at presentto assess the effects of the tunnel uponflight kinematics in the cockatiel anddove; nonetheless, the potential thattunnel conditions may exert a certainsystematic effect on our results shouldbe kept in mind.
Three-dimensional coordinatereconstruction
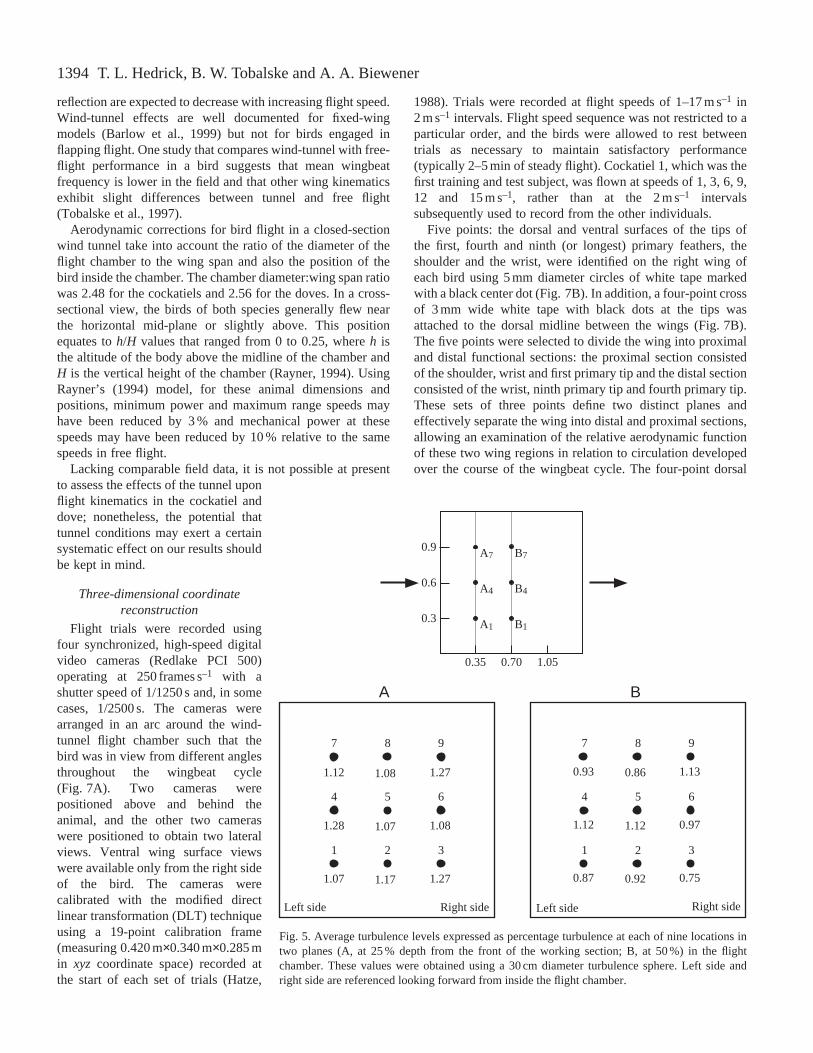
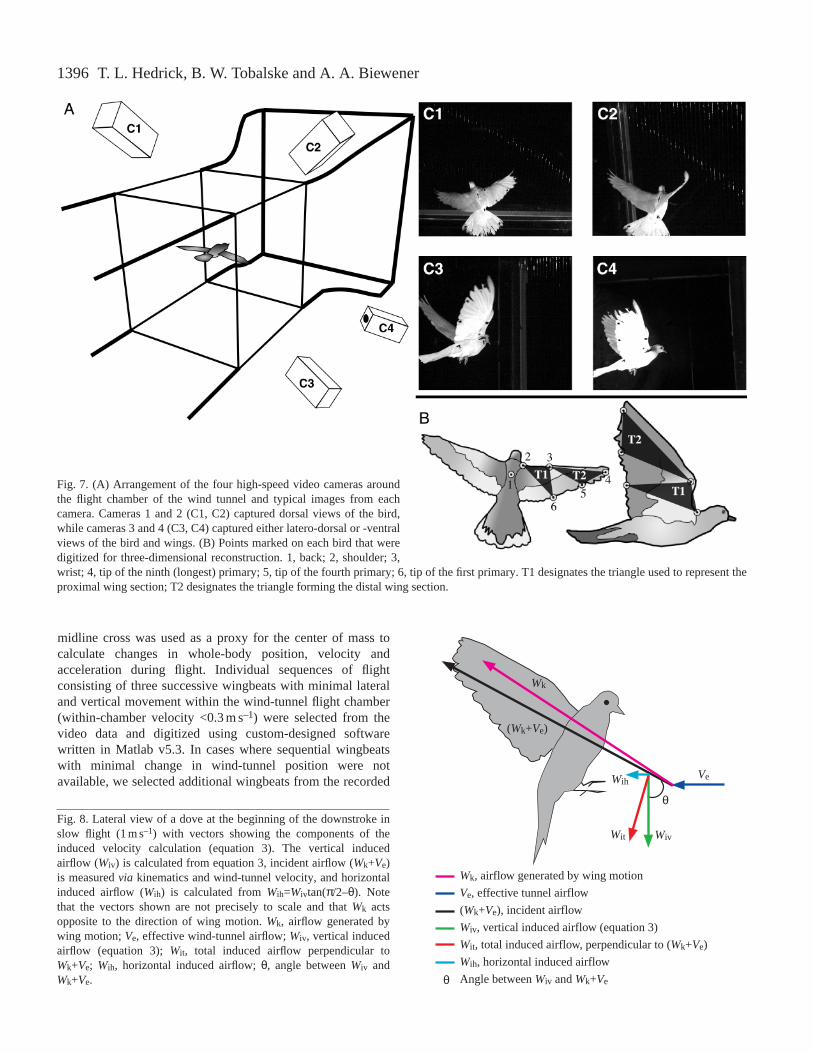
Flight trials were recorded usingfour synchronized, high-speed digitalvideo cameras (Redlake PCI 500)operating at 250 frames s–1 with ashutter speed of 1/1250 s and, in somecases, 1/2500 s. The cameras werearranged in an arc around the wind-tunnel flight chamber such that thebird was in view from different anglesthroughout the wingbeat cycle(Fig. 7A). Two cameras werepositioned above and behind theanimal, and the other two cameraswere positioned to obtain two lateralviews. Ventral wing surface viewswere available only from the right sideof the bird. The cameras werecalibrated with the modified directlinear transformation (DLT) techniqueusing a 19-point calibration frame(measuring 0.420 m×0.340 m×0.285 min xyz coordinate space) recorded atthe start of each set of trials (Hatze,
1988). Trials were recorded at flight speeds of 1–17 m s–1 in2 m s–1 intervals. Flight speed sequence was not restricted to aparticular order, and the birds were allowed to rest betweentrials as necessary to maintain satisfactory performance(typically 2–5 min of steady flight). Cockatiel 1, which was thefirst training and test subject, was flown at speeds of 1, 3, 6, 9,12 and 15 m s–1, rather than at the 2 m s–1 intervalssubsequently used to record from the other individuals.
Five points: the dorsal and ventral surfaces of the tips ofthe first, fourth and ninth (or longest) primary feathers, theshoulder and the wrist, were identified on the right wing ofeach bird using 5 mm diameter circles of white tape markedwith a black center dot (Fig. 7B). In addition, a four-point crossof 3 mm wide white tape with black dots at the tips wasattached to the dorsal midline between the wings (Fig. 7B).The five points were selected to divide the wing into proximaland distal functional sections: the proximal section consistedof the shoulder, wrist and first primary tip and the distal sectionconsisted of the wrist, ninth primary tip and fourth primary tip.These sets of three points define two distinct planes andeffectively separate the wing into distal and proximal sections,allowing an examination of the relative aerodynamic functionof these two wing regions in relation to circulation developedover the course of the wingbeat cycle. The four-point dorsal
T. L. Hedrick, B. W. Tobalske and A. A. Biewener
A7 B70.9
0.6
0.3
0.35 0.70 1.05
A B
321
654
987
321
654
987
1.07
1.28
1.12
1.17
1.07
1.08
1.27
1.08
1.27
0.87
1.12
0.93
0.92
1.12
0.86
0.75
0.97
1.13
Left side Right side Left side Right side
A4 B4
A1 B1
Fig. 5. Average turbulence levels expressed as percentage turbulence at each of nine locations intwo planes (A, at 25 % depth from the front of the working section; B, at 50 %) in the flightchamber. These values were obtained using a 30 cm diameter turbulence sphere. Left side andright side are referenced looking forward from inside the flight chamber.
1395Three-dimensional kinematic analysis of avian gait change
Fig. 6. Digital particle image velocimetry (DPIV) was used to measure variations in velocity and turbulence levels with the wind tunnel set atan equivalent airspeed of 5 m s–1 along the xdimension (axis of airflow). The DPIV system uses a YAG laser and synchronized stereo videocameras to measure velocities U, V and W, corresponding to the x, y and z axes, respectively, of particles suspended in the moving air column.Variation in true airspeed (U) was relative to a mean of 5.54 m s–1. Total turbulence (T) varied about a mean of 0.23 %.
1396
midline cross was used as a proxy for the center of mass tocalculate changes in whole-body position, velocity andacceleration during flight. Individual sequences of flightconsisting of three successive wingbeats with minimal lateraland vertical movement within the wind-tunnel flight chamber(within-chamber velocity <0.3 m s–1) were selected from thevideo data and digitized using custom-designed softwarewritten in Matlab v5.3. In cases where sequential wingbeatswith minimal change in wind-tunnel position were notavailable, we selected additional wingbeats from the recorded
T. L. Hedrick, B. W. Tobalske and A. A. Biewener
Fig. 7. (A) Arrangement of the four high-speed video cameras aroundthe flight chamber of the wind tunnel and typical images from eachcamera. Cameras 1 and 2 (C1, C2) captured dorsal views of the bird,while cameras 3 and 4 (C3, C4) captured either latero-dorsal or -ventralviews of the bird and wings. (B) Points marked on each bird that weredigitized for three-dimensional reconstruction. 1, back; 2, shoulder; 3,wrist; 4, tip of the ninth (longest) primary; 5, tip of the fourth primary; 6, tip of the first primary. T1 designates the triangle used to represent theproximal wing section; T2 designates the triangle forming the distal wing section.
Wk, airflow generated by wing motion
Ve, effective tunnel airflow
(Wk+Ve), incident airflow
Wiv, vertical induced airflow (equation 3)
Wit, total induced airflow, perpendicular to (Wk+Ve)
Wih, horizontal induced airflow
Angle between Wiv and Wk+Ve
WivWit
(Wk+Ve)
Ve
Wk
Wih
θ
θ
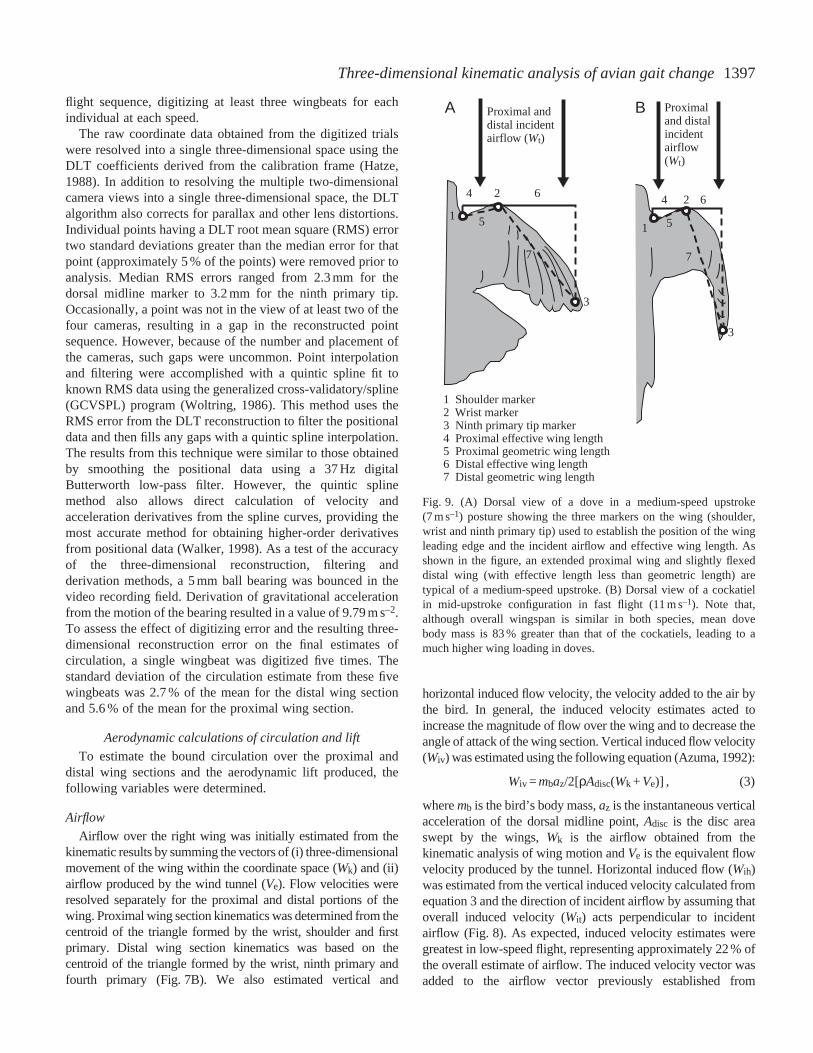
Fig. 8. Lateral view of a dove at the beginning of the downstroke inslow flight (1 m s–1) with vectors showing the components of theinduced velocity calculation (equation 3). The vertical inducedairflow (Wiv) is calculated from equation 3, incident airflow (Wk+Ve)is measured viakinematics and wind-tunnel velocity, and horizontalinduced airflow (Wih) is calculated from Wih=Wivtan(π/2–θ). Notethat the vectors shown are not precisely to scale and that Wk actsopposite to the direction of wing motion. Wk, airflow generated bywing motion; Ve, effective wind-tunnel airflow; Wiv, vertical inducedairflow (equation 3); Wit, total induced airflow perpendicular toWk+Ve; Wih, horizontal induced airflow; θ, angle between Wiv andWk+Ve.
1397Three-dimensional kinematic analysis of avian gait change
flight sequence, digitizing at least three wingbeats for eachindividual at each speed.
The raw coordinate data obtained from the digitized trialswere resolved into a single three-dimensional space using theDLT coefficients derived from the calibration frame (Hatze,1988). In addition to resolving the multiple two-dimensionalcamera views into a single three-dimensional space, the DLTalgorithm also corrects for parallax and other lens distortions.Individual points having a DLT root mean square (RMS) errortwo standard deviations greater than the median error for thatpoint (approximately 5 % of the points) were removed prior toanalysis. Median RMS errors ranged from 2.3 mm for thedorsal midline marker to 3.2 mm for the ninth primary tip.Occasionally, a point was not in the view of at least two of thefour cameras, resulting in a gap in the reconstructed pointsequence. However, because of the number and placement ofthe cameras, such gaps were uncommon. Point interpolationand filtering were accomplished with a quintic spline fit toknown RMS data using the generalized cross-validatory/spline(GCVSPL) program (Woltring, 1986). This method uses theRMS error from the DLT reconstruction to filter the positionaldata and then fills any gaps with a quintic spline interpolation.The results from this technique were similar to those obtainedby smoothing the positional data using a 37 Hz digitalButterworth low-pass filter. However, the quintic splinemethod also allows direct calculation of velocity andacceleration derivatives from the spline curves, providing themost accurate method for obtaining higher-order derivativesfrom positional data (Walker, 1998). As a test of the accuracyof the three-dimensional reconstruction, filtering andderivation methods, a 5 mm ball bearing was bounced in thevideo recording field. Derivation of gravitational accelerationfrom the motion of the bearing resulted in a value of 9.79 m s–2.To assess the effect of digitizing error and the resulting three-dimensional reconstruction error on the final estimates ofcirculation, a single wingbeat was digitized five times. Thestandard deviation of the circulation estimate from these fivewingbeats was 2.7 % of the mean for the distal wing sectionand 5.6 % of the mean for the proximal wing section.
Aerodynamic calculations of circulation and lift
To estimate the bound circulation over the proximal anddistal wing sections and the aerodynamic lift produced, thefollowing variables were determined.
Airflow
Airflow over the right wing was initially estimated from thekinematic results by summing the vectors of (i) three-dimensionalmovement of the wing within the coordinate space (Wk) and (ii)airflow produced by the wind tunnel (Ve). Flow velocities wereresolved separately for the proximal and distal portions of thewing. Proximal wing section kinematics was determined from thecentroid of the triangle formed by the wrist, shoulder and firstprimary. Distal wing section kinematics was based on thecentroid of the triangle formed by the wrist, ninth primary andfourth primary (Fig. 7B). We also estimated vertical and
horizontal induced flow velocity, the velocity added to the air bythe bird. In general, the induced velocity estimates acted toincrease the magnitude of flow over the wing and to decrease theangle of attack of the wing section. Vertical induced flow velocity(Wiv) was estimated using the following equation (Azuma, 1992):
Wiv =mbaz/2[ρAdisc(Wk +Ve)] , (3)
where mb is the bird’s body mass, az is the instantaneous verticalacceleration of the dorsal midline point, Adisc is the disc areaswept by the wings, Wk is the airflow obtained from thekinematic analysis of wing motion and Ve is the equivalent flowvelocity produced by the tunnel. Horizontal induced flow (Wih)was estimated from the vertical induced velocity calculated fromequation 3 and the direction of incident airflow by assuming thatoverall induced velocity (Wit) acts perpendicular to incidentairflow (Fig. 8). As expected, induced velocity estimates weregreatest in low-speed flight, representing approximately 22% ofthe overall estimate of airflow. The induced velocity vector wasadded to the airflow vector previously established from
Proximal anddistal incidentairflow (Wt)
4
7
6
1
2
3
A
5
1 Shoulder marker2 Wrist marker3 Ninth primary tip marker4 Proximal effective wing length5 Proximal geometric wing length6 Distal effective wing length7 Distal geometric wing length
Proximaland distalincidentairflow(Wt)
1
2
3
4
5
6
7
B
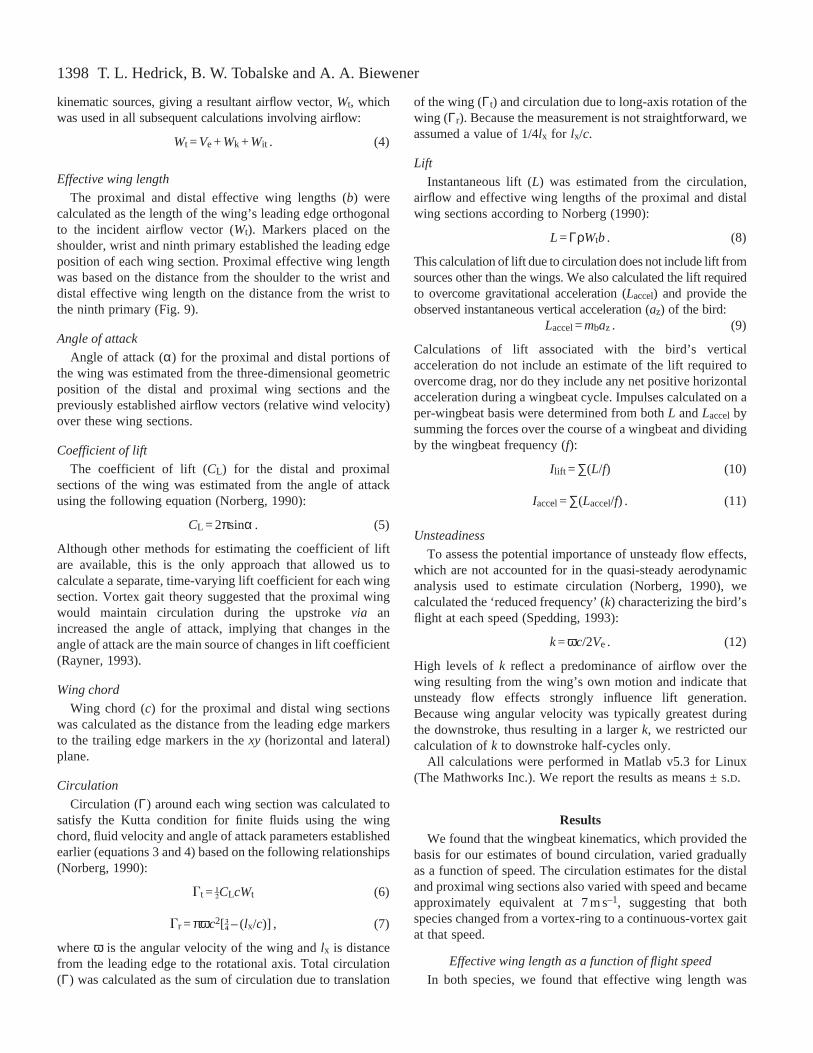
Fig. 9. (A) Dorsal view of a dove in a medium-speed upstroke(7 m s–1) posture showing the three markers on the wing (shoulder,wrist and ninth primary tip) used to establish the position of the wingleading edge and the incident airflow and effective wing length. Asshown in the figure, an extended proximal wing and slightly flexeddistal wing (with effective length less than geometric length) aretypical of a medium-speed upstroke. (B) Dorsal view of a cockatielin mid-upstroke configuration in fast flight (11 m s–1). Note that,although overall wingspan is similar in both species, mean dovebody mass is 83 % greater than that of the cockatiels, leading to amuch higher wing loading in doves.
1398
kinematic sources, giving a resultant airflow vector, Wt, whichwas used in all subsequent calculations involving airflow:
Wt =Ve+Wk +Wit . (4)
Effective wing length
The proximal and distal effective wing lengths (b) werecalculated as the length of the wing’s leading edge orthogonalto the incident airflow vector (Wt). Markers placed on theshoulder, wrist and ninth primary established the leading edgeposition of each wing section. Proximal effective wing lengthwas based on the distance from the shoulder to the wrist anddistal effective wing length on the distance from the wrist tothe ninth primary (Fig. 9).
Angle of attack
Angle of attack (α) for the proximal and distal portions ofthe wing was estimated from the three-dimensional geometricposition of the distal and proximal wing sections and thepreviously established airflow vectors (relative wind velocity)over these wing sections.
Coefficient of lift
The coefficient of lift (CL) for the distal and proximalsections of the wing was estimated from the angle of attackusing the following equation (Norberg, 1990):
CL = 2πsinα . (5)
Although other methods for estimating the coefficient of liftare available, this is the only approach that allowed us tocalculate a separate, time-varying lift coefficient for each wingsection. Vortex gait theory suggested that the proximal wingwould maintain circulation during the upstroke via anincreased the angle of attack, implying that changes in theangle of attack are the main source of changes in lift coefficient(Rayner, 1993).
Wing chord
Wing chord (c) for the proximal and distal wing sectionswas calculated as the distance from the leading edge markersto the trailing edge markers in the xy(horizontal and lateral)plane.
Circulation
Circulation (Γ) around each wing section was calculated tosatisfy the Kutta condition for finite fluids using the wingchord, fluid velocity and angle of attack parameters establishedearlier (equations 3 and 4) based on the following relationships(Norberg, 1990):
Gt = GCLcWt (6)
Gr =πωc2[K – (lx/c)] , (7)
where ω is the angular velocity of the wing and lx is distancefrom the leading edge to the rotational axis. Total circulation(Γ) was calculated as the sum of circulation due to translation
of the wing (Γt) and circulation due to long-axis rotation of thewing (Γr). Because the measurement is not straightforward, weassumed a value of 1/4lx for lx/c.
Lift
Instantaneous lift (L) was estimated from the circulation,airflow and effective wing lengths of the proximal and distalwing sections according to Norberg (1990):
L =ΓρWtb . (8)
This calculation of lift due to circulation does not include lift fromsources other than the wings. We also calculated the lift requiredto overcome gravitational acceleration (Laccel) and provide theobserved instantaneous vertical acceleration (az) of the bird:
Laccel=mbaz . (9)
Calculations of lift associated with the bird’s verticalacceleration do not include an estimate of the lift required toovercome drag, nor do they include any net positive horizontalacceleration during a wingbeat cycle. Impulses calculated on aper-wingbeat basis were determined from both L and Laccelbysumming the forces over the course of a wingbeat and dividingby the wingbeat frequency (f):
I lift =∑(L/f) (10)
Iaccel=∑(Laccel/f) . (11)
Unsteadiness
To assess the potential importance of unsteady flow effects,which are not accounted for in the quasi-steady aerodynamicanalysis used to estimate circulation (Norberg, 1990), wecalculated the ‘reduced frequency’ (k) characterizing the bird’sflight at each speed (Spedding, 1993):
k=ωc/2Ve. (12)
High levels of kreflect a predominance of airflow over thewing resulting from the wing’s own motion and indicate thatunsteady flow effects strongly influence lift generation.Because wing angular velocity was typically greatest duringthe downstroke, thus resulting in a larger k, we restricted ourcalculation of kto downstroke half-cycles only.
All calculations were performed in Matlab v5.3 for Linux(The Mathworks Inc.). We report the results as means ±S.D.
ResultsWe found that the wingbeat kinematics, which provided the
basis for our estimates of bound circulation, varied graduallyas a function of speed. The circulation estimates for the distaland proximal wing sections also varied with speed and becameapproximately equivalent at 7 m s–1, suggesting that bothspecies changed from a vortex-ring to a continuous-vortex gaitat that speed.
Effective wing length as a function of flight speed
In both species, we found that effective wing length was
T. L. Hedrick, B. W. Tobalske and A. A. Biewener
1399Three-dimensional kinematic analysis of avian gait change
A 1 m s–1
Distal Proximal
i
ii
iii
iv
v
200
0
–200
20
10
0
150
100
50
0
90
0
–90
2
0
–2
z-ax
is m
otio
n(m
m)
Win
g le
ngth
(mm
)A
irflo
w(m
s–1
)A
ngle
of a
ttack
(deg
rees
)C
ircul
atio
n(m
2 s–
1 )
0.100.050 0.300.250.200.15
Time (s)
0.100.050 0.300.250.200.15
Time (s)
B 5 m s–1
i
ii
iii
iv
v
C 9 m s–1
i
ii
iii
iv
v
D 17 m s–1
i
ii
iii
iv
v
200
0
–200
20
10
0
150
100
50
0
90
0
–90
2
0
–2
z-ax
is m
otio
n(m
m)
Win
g le
ngth
(mm
)A
irflo
w(m
s–1
)A
ngle
of a
ttack
(deg
rees
)C
ircul
atio
n(m
2 s–
1 )
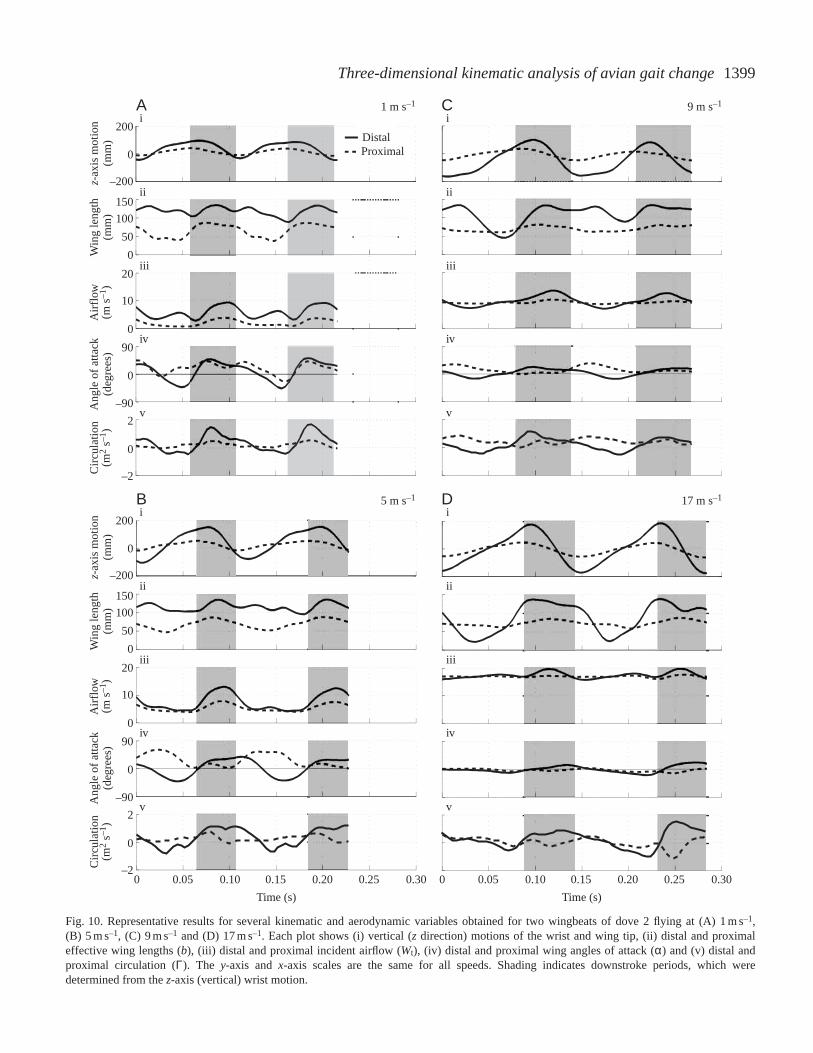
Fig. 10. Representative results for several kinematic and aerodynamic variables obtained for two wingbeats of dove 2 flying at (A) 1 m s–1,(B) 5 m s–1, (C) 9 m s–1 and (D) 17 m s–1. Each plot shows (i) vertical (zdirection) motions of the wrist and wing tip, (ii) distal and proximaleffective wing lengths (b), (iii) distal and proximal incident airflow (Wt), (iv) distal and proximal wing angles of attack (α) and (v) distal andproximal circulation (Γ). The y-axis and x-axis scales are the same for all speeds. Shading indicates downstroke periods, which weredetermined from the z-axis (vertical) wrist motion.
1400 T. L. Hedrick, B. W. Tobalske and A. A. Biewener
0.100.050 0.30 0.350.250.200.15
Time (s)
B 5 m s–1
i
ii
iii
iv
v
0.100.050 0.30 0.350.250.200.15
Time (s)
D 15 m s–1
i
ii
iii
iv
v
200
0
–200
20
10
0
150
100
50
0
90
0
–90
2
0
–2
z-ax
is m
otio
n(m
m)
Win
g le
ngth
(mm
)A
irflo
w(m
s–1
)A
ngle
of a
ttack
(deg
rees
)C
ircul
atio
n(m
2 s–1
)A 1 m s–1
i
ii
iii
iv
v
C 9 m s–1
i
ii
iii
iv
v
200
0
–200
20
10
0
150
100
50
0
90
0
–90
2
0
–2
z-ax
is m
otio
n(m
m)
Win
g le
ngth
(mm
)A
irflo
w(m
s–1
)A
ngle
of a
ttack
(deg
rees
)C
ircul
atio
n(m
2 s–1
)
DistalProximal
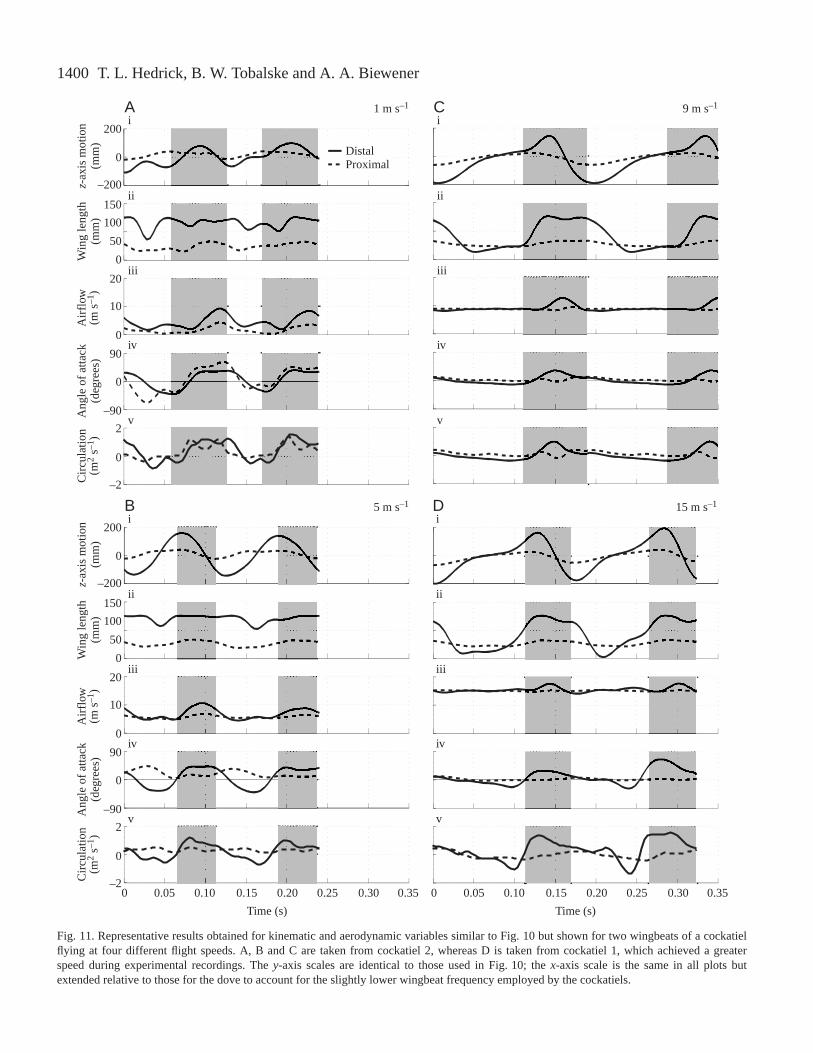
Fig. 11. Representative results obtained for kinematic and aerodynamic variables similar to Fig. 10 but shown for two wingbeats of a cockatielflying at four different flight speeds. A, B and C are taken from cockatiel 2, whereas D is taken from cockatiel 1, which achieved a greaterspeed during experimental recordings. The y-axis scales are identical to those used in Fig. 10; the x-axis scale is the same in all plots butextended relative to those for the dove to account for the slightly lower wingbeat frequency employed by the cockatiels.
1401Three-dimensional kinematic analysis of avian gait change
more constant at low than at high speeds (Figs 10A,B, 11A,B).The wing was fully extended during the downstroke andremained extended through much of the upstroke, but with theindividual primary feathers supinated to permit airflowbetween them, a maneuver known as a ‘tip reversal upstroke’or ‘upstroke flick’ (Brown, 1963; Norberg, 1976; Tobalskeand Dial, 1996; Tobalske, 2000). Both species graduallyabandoned this behavior as speed increased, leading to greatervariation in wing length over the wingbeat cycle as distaleffective length was reduced during the upstroke. Effectivewing length during the upstroke decreased in both species atintermediate and fast speeds (Figs 10C,D, 11C,D) as a resultof flexion at the wrist. Wrist flexion was initiated rapidly atwing turn-around and typically reached a maximum as thewing passed the level of the shoulder. At intermediate and fastspeeds (Figs 10C,D, 11C,D), the wings of both species werefully extended for the majority of the downstroke. At thesefaster speeds, the variation in effective wing length within thewingbeat cycle was much greater in the distal wing than in theproximal wing, which remained fully extended throughout thewingbeat cycle.
Airflow magnitude as a function of flight speed
In both species, the flapping motion of the wing providedmost of the airflow at slow speed flights (1–7 m s–1), whereasat faster flight speeds (9–17 m s–1) airflow was increasinglydriven by the bird’s overall forward velocity. For example, ata forward flight speed of 1 m s–1, peak airflow over the distalportion the wing of dove 1 approached 10 m s–1 (Fig. 10A),while at a forward flight speed of 17 m s–1 the peak airflowduring downstroke was only elevated to 19 m s–1 (Fig. 10D).This overall trend affected the variation in circulation withinthe wingbeat cycle and over the length of the wing across therange of speeds studied. Because of the wing’s rotationalmotion (downstroke depression and upstroke elevation),airflow over the proximal section of the wing during slow-speed flight was much lower in magnitude than that over thedistal section (Figs 10A,B, 11A,B). In contrast, becauseairflow was driven mainly by the bird’s forward velocity athigh speeds, considerably less variation in airflow magnitudewas observed between the upstroke and downstroke, andairflows over the proximal and distal portions of the wing werealso of similar magnitude. These trends become morepronounced as speed increased (Figs 10C,D, 11C,D).
Angle of attack as a function of flight speed
Similar to patterns of airflow over the wing, variation in thewing’s angle of attack over the course of the wingbeat cycledecreased with increasing speed in both species. Angles ofattack (α) at low speeds (Figs 10A, 11A, with peaks of 52 ° forthe proximal and 43 ° for the distal wing sections) were muchgreater than those commonly used by aircraft airfoils (0–15 °;McCormick, 1995). Mean angles of attack at faster speedsdecreased (proximal 9–14 °; distal –5 to 14 °) to within therange employed by conventional airfoils. Nevertheless, briefperiods of high angle of attack persisted at all but the fastest
speeds. Peak angle of attack for the distal wing section of bothspecies at all speeds typically occurred at mid-downstroke, asthe wrist passed below the shoulder. At this time, the distalwing’s angle of attack was due primarily to the motion of thewing relative to the bird’s body as the wing chord was orientednearly parallel to airflow within the tunnel. In contrast to thedistal wing, patterns of proximal wing section peak angle ofattack for both species changed with speed. In slow-speedflight, the proximal peak angle of attack occurred at mid-downstroke, concomitant with the peak for the distal section.Consequently, its timing and magnitude were also due to thewing’s motion rather than to its orientation to airflow withinthe tunnel (Figs 10A, 11A). At faster speeds, however, changesin proximal angle of attack were phase-delayed relative todistal angle of attack, with the result that proximal angle ofattack peaked during the upstroke (Figs 10B–D, 11B–D). Thistrend was more pronounced in the doves than in the cockatiels,but clearly occurred in both species. Because of the lowerangular velocity of wing motion during the upstroke, the angleof attack achieved by the proximal wing section at this phasewas primarily due to a more angled orientation of the wingsection relative to airflow within the tunnel.
Circulation as a function of flight speed
At slow speeds in both species, the distal wing sectionduring the downstroke provided most of the estimatedcirculation developed over the course of the wingbeat cycle. Ingeneral, circulation about the proximal wing section during thedownstroke was low and generated little lift (Figs 10A,B,11A,B). As forward speed increased, estimated circulation wasinfluenced by two trends: (i) differences in airflow between theproximal and distal wing sections and between the upstrokeand downstroke declined in magnitude, and (ii) the proximalwing section’s peak angle of attack was phase-delayed into theupstroke. The interaction between these two trends at fasterspeeds resulted in the development of significant circulationabout the proximal wing during the upstroke and a maintaineddominance of distal wing circulation during the downstroke(Figs 10C, 11C). At near maximum flight speeds, upstrokecirculation decreased relative to downstroke circulation. Thisresulted from the very low angle of attack of the proximal wingduring the upstroke, which severely reduced its estimatedcirculation despite the large magnitude of airflow moving pastit (Figs 10D, 11D). In general, circulation became moreconstant as flight speed increased, but some intra-wingbeatvariation still occurred. In slow flight, the distal wingdownstroke (Figs 10A,B, 11A,B) dominated circulationpatterns. In intermediate and fast flight, circulation switchedbetween the distal wing during the downstroke and theproximal wing during the upstroke, resulting in an overalldecline in within-wingbeat variation in circulation.
To examine general patterns of circulation for the full rangeof flight speeds studied, we averaged the estimated circulationover half-wingbeat intervals (mean proximal upstroke versusmean distal downstroke). We alternated between the distal andproximal wing sections for each phase of the wingbeat cycle
1402
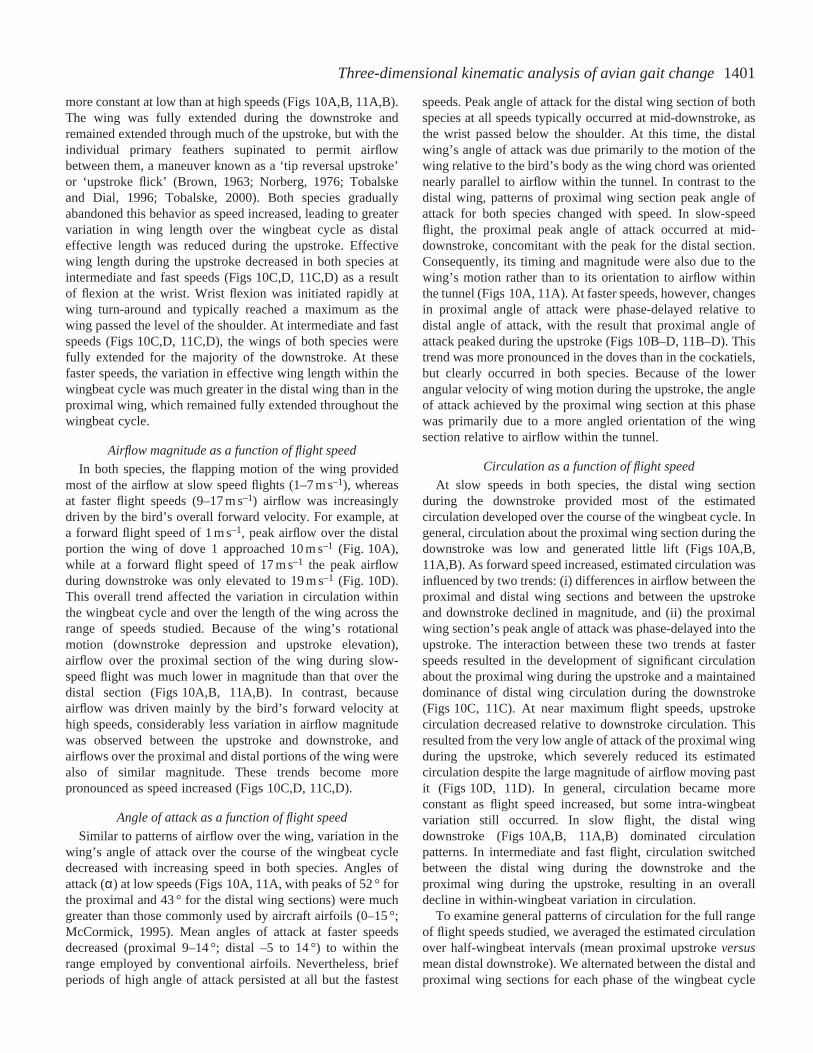
because our intra-wingbeat results (Figs 10, 11) showed thatthe distal wing dominated lift production during thedownstroke and that the proximal wing section dominatedduring the upstroke. This resulted from the interaction betweenestimated circulation magnitude and effective wing lengthduring each phase. In both species at slow speeds, circulationduring the downstroke was much greater than that achievedduring the upstroke (Fig. 12). As speed increased, meandownstroke circulation decreased and upstroke circulationincreased, the two becoming nearly equivalent at 7 m s–1
(Fig. 12). The match between downstroke and upstrokecirculation was maintained up to nearly the fastest speeds atwhich each species flew in the tunnel. At the fastest speeds(>12 m s–1 for the cockatiels and >15 m s–1 for the doves),circulation developed by the proximal wing section during theupstroke again began to decline. The decline in proximal wingsection upstroke circulation correlated with the difference inmean maximum speed observed for the two species (cockatiels15 m s–1; doves 17 m s–1). Equivalent circulation during theupstroke and downstroke should result in a continuous-vortexgait, whereas much greater downstroke circulation relative toupstroke circulation should result in a ladder-wake gait(Pennycuick, 1988). Thus, both species started with a vortex-ring gait and switched to a continuous-vortex gait at 7 m s–1.Cockatiels maintained a continuous-vortex gait to 12 m s–1 anddoves to 15 m s–1 (Fig. 12), whereupon they appeared tochange to a ladder-wake gait.
Translational and rotational circulation
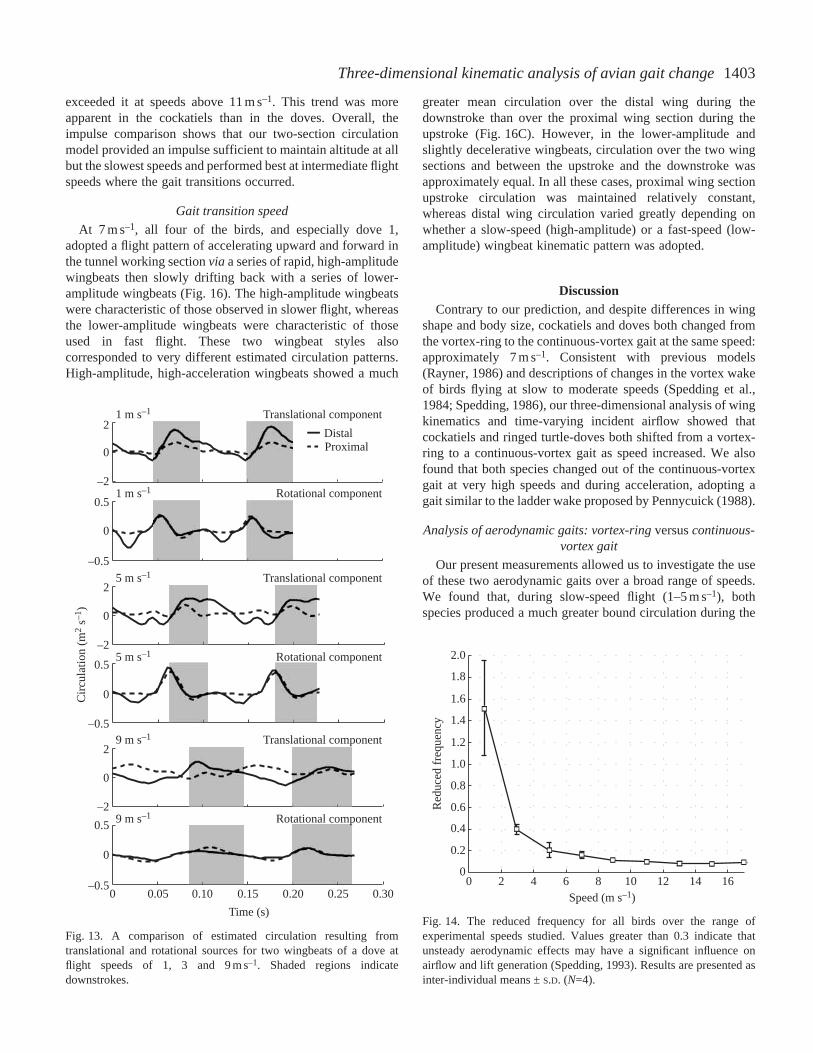
We derived our overall estimate of circulation fromtwo different sources: circulation due to wing translation(Γt) and circulation due to long-axis rotation of the wing(Γr). We found that translational circulation made up themajority of the total, providing 90 % or more of the totalcirculation at all speeds when averaged over a completewingbeat cycle. However, our analysis suggests that abrief period of high rotational circulation occurs at thetransition from the upstroke to the downstroke in slowflight (Fig. 13). This pulse of rotational circulation wasprominent in doves at speeds of 1, 3 and 5 m s–1 and incockatiels flying at 1 and 3 m s–1.
Reduced frequency
The quasi-steady aerodynamic analysis that weemployed to estimate circulation assumes steady airflowover the wing during the upstroke and downstrokephases of the wingbeat cycle. To assess the validity ofthis assumption, we calculated the reduced frequency ofthe bird’s flight at each speed from the angular velocityof the bird’s wing during the downstroke with respect tothe bird’s forward flight speed (Fig. 14). In general,flight conditions involving a reduced frequency of lessthan 0.3 support the assumption of steady flow and canbe accurately modeled using a quasi-steady analysis(Spedding, 1993). This condition was met for bothspecies at speeds of 5.0 m s–1 or above. The reduced
frequency results at 1.0 and 3.0 m s–1 do not support a quasi-steady analysis. Inter-trial variation in reduced frequency wasmuch greater at low speeds because the unsteadiness of thebird’s position within the flight chamber at low speedscontributes much more to the overall unsteadiness of airflowthan when the birds flew at higher speeds.
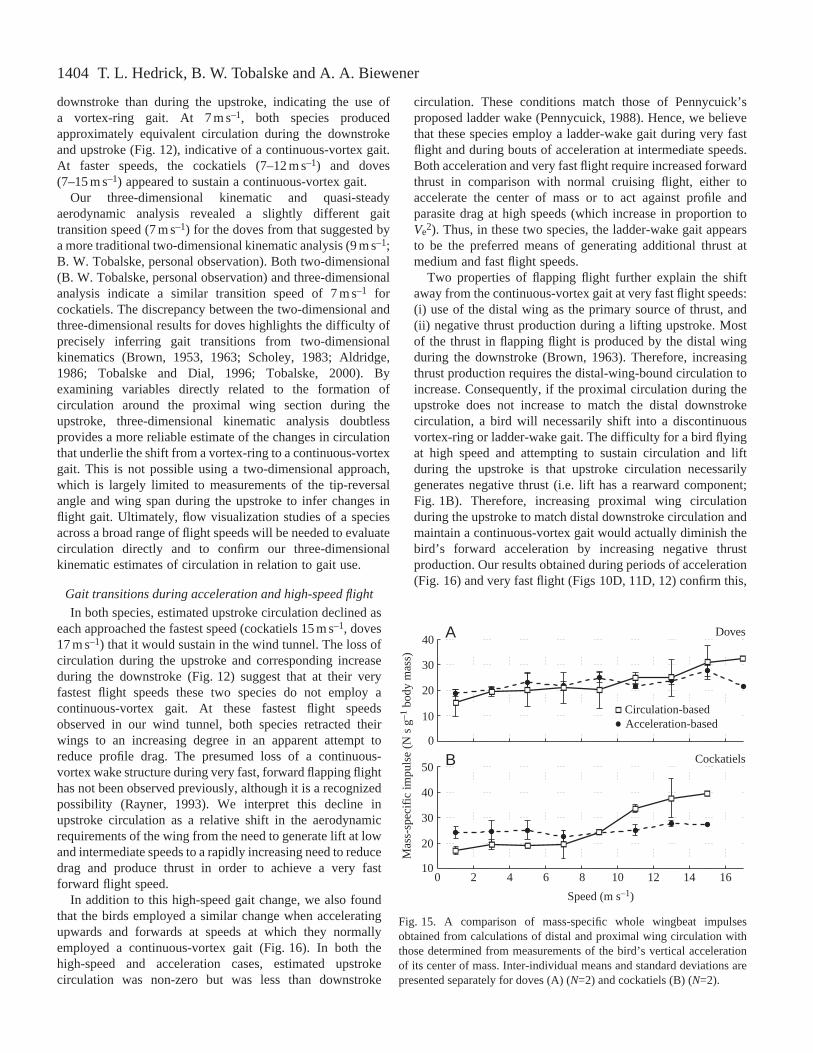
Impulse comparison: accuracy of the two-section circulationmodel
As a further check of the results that we obtained from ourquasi-steady analysis, we compared the vertical impulseprovided by lift calculated from the circulation results(equation 10) with that determined from the verticalacceleration of the bird (equation 11; Fig. 15). Thesecalculations do not include all the forces acting on the bird; inparticular, we omit all drag and lift from surfaces other thanthe wings. However, vertical acceleration to overcome gravityis believed to be much greater than that required to overcomedrag, and the wings are expected to provide the majority of liftat all speeds (Pennycuick et al., 2000). Thus, our omission ofdrag and body or tail lift should still allow a useful, ifapproximate, comparison between the impulse provided by ourcirculation estimates and the impulse required for weightsupport. As expected, the impulse calculated from accelerationchanged little with speed, reflecting the near-constant verticalposition that the birds held at all speeds. The impulsecalculated from circulation for both species underestimated theacceleration derived impulse at speeds below 5 m s–1, wasapproximately equal at intermediate speeds (5–11 m s–1) and
T. L. Hedrick, B. W. Tobalske and A. A. Biewener
–0.5
0
0.5
1.0
1.5
–0.2
0
0.2
0.4
0.6
Circ
ulat
ion
(m2
s–1)
0 2 4 6 8 10 12 14 16
Speed (m s–1)
A
B
Doves
Cockatiels
Distal downstroke Proximal upstroke
Fig. 12. A comparison of the mean proximal wing circulation during theupstroke and the mean distal wing circulation during the downstroke for thedoves (A) and cockatiels (B) over the full range of flight speeds examined.Values are means ±S.D. (N=2). for each species at each speed. The shadedregion indicates the range of speeds in which downstroke and upstrokecirculation are approximately equivalent, resulting in a continuous-vortexwake.
1403Three-dimensional kinematic analysis of avian gait change
exceeded it at speeds above 11 m s–1. This trend was moreapparent in the cockatiels than in the doves. Overall, theimpulse comparison shows that our two-section circulationmodel provided an impulse sufficient to maintain altitude at allbut the slowest speeds and performed best at intermediate flightspeeds where the gait transitions occurred.
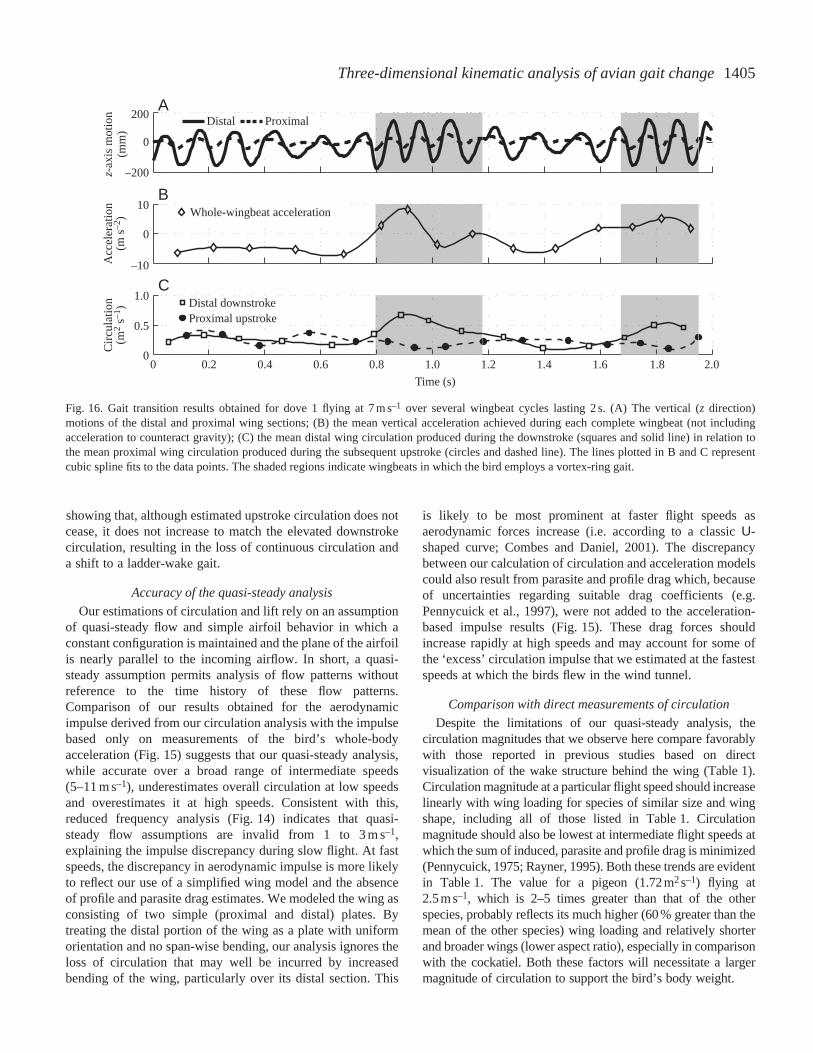
Gait transition speed
At 7 m s–1, all four of the birds, and especially dove 1,adopted a flight pattern of accelerating upward and forward inthe tunnel working section via a series of rapid, high-amplitudewingbeats then slowly drifting back with a series of lower-amplitude wingbeats (Fig. 16). The high-amplitude wingbeatswere characteristic of those observed in slower flight, whereasthe lower-amplitude wingbeats were characteristic of thoseused in fast flight. These two wingbeat styles alsocorresponded to very different estimated circulation patterns.High-amplitude, high-acceleration wingbeats showed a much
greater mean circulation over the distal wing during thedownstroke than over the proximal wing section during theupstroke (Fig. 16C). However, in the lower-amplitude andslightly decelerative wingbeats, circulation over the two wingsections and between the upstroke and the downstroke wasapproximately equal. In all these cases, proximal wing sectionupstroke circulation was maintained relatively constant,whereas distal wing circulation varied greatly depending onwhether a slow-speed (high-amplitude) or a fast-speed (low-amplitude) wingbeat kinematic pattern was adopted.
DiscussionContrary to our prediction, and despite differences in wing
shape and body size, cockatiels and doves both changed fromthe vortex-ring to the continuous-vortex gait at the same speed:approximately 7 m s–1. Consistent with previous models(Rayner, 1986) and descriptions of changes in the vortex wakeof birds flying at slow to moderate speeds (Spedding et al.,1984; Spedding, 1986), our three-dimensional analysis of wingkinematics and time-varying incident airflow showed thatcockatiels and ringed turtle-doves both shifted from a vortex-ring to a continuous-vortex gait as speed increased. We alsofound that both species changed out of the continuous-vortexgait at very high speeds and during acceleration, adopting agait similar to the ladder wake proposed by Pennycuick (1988).
Analysis of aerodynamic gaits: vortex-ring versuscontinuous-vortex gait
Our present measurements allowed us to investigate the useof these two aerodynamic gaits over a broad range of speeds.We found that, during slow-speed flight (1–5 m s–1), bothspecies produced a much greater bound circulation during the
DistalProximal
2
0
–2
0.5
0
–0.5
1 m s–1 Translational component
1 m s–1 Rotational component
Circ
ulat
ion
(m2
s–1)
0.100.050 0.300.250.200.15
Time (s)
2
0
–2
0.5
0
0.5
0
–0.5
5 m s–1 Translational component
5 m s–1 Rotational component
2
0
–2
–0.5
9 m s–1 Translational component
9 m s–1 Rotational component
Fig. 13. A comparison of estimated circulation resulting fromtranslational and rotational sources for two wingbeats of a dove atflight speeds of 1, 3 and 9 m s–1. Shaded regions indicatedownstrokes.
0 2 4 6 8 10 12 14 16Speed (m s–1)
0
1.4
1.6
1.8
2.0
Red
uced
freq
uenc
y
0.2
0.4
0.6
0.8
1.0
1.2
Fig. 14. The reduced frequency for all birds over the range ofexperimental speeds studied. Values greater than 0.3 indicate thatunsteady aerodynamic effects may have a significant influence onairflow and lift generation (Spedding, 1993). Results are presented asinter-individual means ±S.D. (N=4).
1404
downstroke than during the upstroke, indicating the use ofa vortex-ring gait. At 7 m s–1, both species producedapproximately equivalent circulation during the downstrokeand upstroke (Fig. 12), indicative of a continuous-vortex gait.At faster speeds, the cockatiels (7–12 m s–1) and doves(7–15 m s–1) appeared to sustain a continuous-vortex gait.
Our three-dimensional kinematic and quasi-steadyaerodynamic analysis revealed a slightly different gaittransition speed (7 m s–1) for the doves from that suggested bya more traditional two-dimensional kinematic analysis (9 m s–1;B. W. Tobalske, personal observation). Both two-dimensional(B. W. Tobalske, personal observation) and three-dimensionalanalysis indicate a similar transition speed of 7 m s–1 forcockatiels. The discrepancy between the two-dimensional andthree-dimensional results for doves highlights the difficulty ofprecisely inferring gait transitions from two-dimensionalkinematics (Brown, 1953, 1963; Scholey, 1983; Aldridge,1986; Tobalske and Dial, 1996; Tobalske, 2000). Byexamining variables directly related to the formation ofcirculation around the proximal wing section during theupstroke, three-dimensional kinematic analysis doubtlessprovides a more reliable estimate of the changes in circulationthat underlie the shift from a vortex-ring to a continuous-vortexgait. This is not possible using a two-dimensional approach,which is largely limited to measurements of the tip-reversalangle and wing span during the upstroke to infer changes inflight gait. Ultimately, flow visualization studies of a speciesacross a broad range of flight speeds will be needed to evaluatecirculation directly and to confirm our three-dimensionalkinematic estimates of circulation in relation to gait use.
Gait transitions during acceleration and high-speed flight
In both species, estimated upstroke circulation declined aseach approached the fastest speed (cockatiels 15 m s–1, doves17 m s–1) that it would sustain in the wind tunnel. The loss ofcirculation during the upstroke and corresponding increaseduring the downstroke (Fig. 12) suggest that at their veryfastest flight speeds these two species do not employ acontinuous-vortex gait. At these fastest flight speedsobserved in our wind tunnel, both species retracted theirwings to an increasing degree in an apparent attempt toreduce profile drag. The presumed loss of a continuous-vortex wake structure during very fast, forward flapping flighthas not been observed previously, although it is a recognizedpossibility (Rayner, 1993). We interpret this decline inupstroke circulation as a relative shift in the aerodynamicrequirements of the wing from the need to generate lift at lowand intermediate speeds to a rapidly increasing need to reducedrag and produce thrust in order to achieve a very fastforward flight speed.
In addition to this high-speed gait change, we also foundthat the birds employed a similar change when acceleratingupwards and forwards at speeds at which they normallyemployed a continuous-vortex gait (Fig. 16). In both thehigh-speed and acceleration cases, estimated upstrokecirculation was non-zero but was less than downstroke
circulation. These conditions match those of Pennycuick’sproposed ladder wake (Pennycuick, 1988). Hence, we believethat these species employ a ladder-wake gait during very fastflight and during bouts of acceleration at intermediate speeds.Both acceleration and very fast flight require increased forwardthrust in comparison with normal cruising flight, either toaccelerate the center of mass or to act against profile andparasite drag at high speeds (which increase in proportion toVe2). Thus, in these two species, the ladder-wake gait appearsto be the preferred means of generating additional thrust atmedium and fast flight speeds.
Two properties of flapping flight further explain the shiftaway from the continuous-vortex gait at very fast flight speeds:(i) use of the distal wing as the primary source of thrust, and(ii) negative thrust production during a lifting upstroke. Mostof the thrust in flapping flight is produced by the distal wingduring the downstroke (Brown, 1963). Therefore, increasingthrust production requires the distal-wing-bound circulation toincrease. Consequently, if the proximal circulation during theupstroke does not increase to match the distal downstrokecirculation, a bird will necessarily shift into a discontinuousvortex-ring or ladder-wake gait. The difficulty for a bird flyingat high speed and attempting to sustain circulation and liftduring the upstroke is that upstroke circulation necessarilygenerates negative thrust (i.e. lift has a rearward component;Fig. 1B). Therefore, increasing proximal wing circulationduring the upstroke to match distal downstroke circulation andmaintain a continuous-vortex gait would actually diminish thebird’s forward acceleration by increasing negative thrustproduction. Our results obtained during periods of acceleration(Fig. 16) and very fast flight (Figs 10D, 11D, 12) confirm this,
T. L. Hedrick, B. W. Tobalske and A. A. Biewener
10
20
30
40
50
0
10
20
30
40
Mas
s-sp
ecifi
c im
puls
e (N
s g–1 b
ody
mas
s)
Circulation-basedAcceleration-based
A
B
Doves
Cockatiels
0 2 4 6 8 10 12 14 16
Speed (m s–1)
Fig. 15. A comparison of mass-specific whole wingbeat impulsesobtained from calculations of distal and proximal wing circulation withthose determined from measurements of the bird’s vertical accelerationof its center of mass. Inter-individual means and standard deviations arepresented separately for doves (A) (N=2) and cockatiels (B) (N=2).
1405Three-dimensional kinematic analysis of avian gait change
showing that, although estimated upstroke circulation does notcease, it does not increase to match the elevated downstrokecirculation, resulting in the loss of continuous circulation anda shift to a ladder-wake gait.
Accuracy of the quasi-steady analysis
Our estimations of circulation and lift rely on an assumptionof quasi-steady flow and simple airfoil behavior in which aconstant configuration is maintained and the plane of the airfoilis nearly parallel to the incoming airflow. In short, a quasi-steady assumption permits analysis of flow patterns withoutreference to the time history of these flow patterns.Comparison of our results obtained for the aerodynamicimpulse derived from our circulation analysis with the impulsebased only on measurements of the bird’s whole-bodyacceleration (Fig. 15) suggests that our quasi-steady analysis,while accurate over a broad range of intermediate speeds(5–11 m s–1), underestimates overall circulation at low speedsand overestimates it at high speeds. Consistent with this,reduced frequency analysis (Fig. 14) indicates that quasi-steady flow assumptions are invalid from 1 to 3 m s–1,explaining the impulse discrepancy during slow flight. At fastspeeds, the discrepancy in aerodynamic impulse is more likelyto reflect our use of a simplified wing model and the absenceof profile and parasite drag estimates. We modeled the wing asconsisting of two simple (proximal and distal) plates. Bytreating the distal portion of the wing as a plate with uniformorientation and no span-wise bending, our analysis ignores theloss of circulation that may well be incurred by increasedbending of the wing, particularly over its distal section. This
is likely to be most prominent at faster flight speeds asaerodynamic forces increase (i.e. according to a classic U-shaped curve; Combes and Daniel, 2001). The discrepancybetween our calculation of circulation and acceleration modelscould also result from parasite and profile drag which, becauseof uncertainties regarding suitable drag coefficients (e.g.Pennycuick et al., 1997), were not added to the acceleration-based impulse results (Fig. 15). These drag forces shouldincrease rapidly at high speeds and may account for some ofthe ‘excess’ circulation impulse that we estimated at the fastestspeeds at which the birds flew in the wind tunnel.
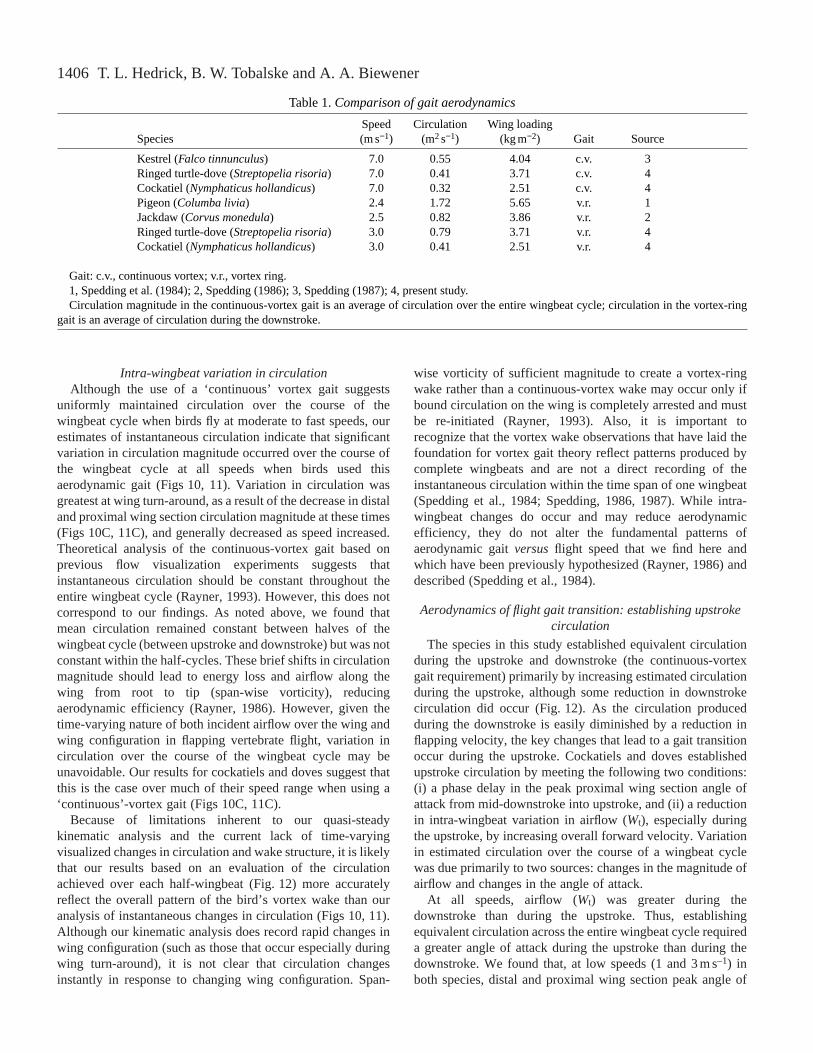
Comparison with direct measurements of circulation
Despite the limitations of our quasi-steady analysis, thecirculation magnitudes that we observe here compare favorablywith those reported in previous studies based on directvisualization of the wake structure behind the wing (Table 1).Circulation magnitude at a particular flight speed should increaselinearly with wing loading for species of similar size and wingshape, including all of those listed in Table 1. Circulationmagnitude should also be lowest at intermediate flight speeds atwhich the sum of induced, parasite and profile drag is minimized(Pennycuick, 1975; Rayner, 1995). Both these trends are evidentin Table 1. The value for a pigeon (1.72m2s–1) flying at2.5ms–1, which is 2–5 times greater than that of the otherspecies, probably reflects its much higher (60% greater than themean of the other species) wing loading and relatively shorterand broader wings (lower aspect ratio), especially in comparisonwith the cockatiel. Both these factors will necessitate a largermagnitude of circulation to support the bird’s body weight.
Fig. 16. Gait transition results obtained for dove 1 flying at 7 m s–1 over several wingbeat cycles lasting 2 s. (A) The vertical (z direction)motions of the distal and proximal wing sections; (B) the mean vertical acceleration achieved during each complete wingbeat (not includingacceleration to counteract gravity); (C) the mean distal wing circulation produced during the downstroke (squares and solid line) in relation tothe mean proximal wing circulation produced during the subsequent upstroke (circles and dashed line). The lines plotted in B and C representcubic spline fits to the data points. The shaded regions indicate wingbeats in which the bird employs a vortex-ring gait.
0 0.2 0.4 0.6 0.8 1.0 1.2 1.4 1.6 1.8 2.00
0.5
1.0
Time (s)
Distal downstrokeProximal upstroke
–10
0
10
C
–200
0
200A
B
Distal Proximal
Whole-wingbeat acceleration
z-ax
is m
otio
n(m
m)
Acc
eler
atio
n(m
s–2
)C
ircul
atio
n(m
2 s–1
)
1406
Intra-wingbeat variation in circulationAlthough the use of a ‘continuous’ vortex gait suggests
uniformly maintained circulation over the course of thewingbeat cycle when birds fly at moderate to fast speeds, ourestimates of instantaneous circulation indicate that significantvariation in circulation magnitude occurred over the course ofthe wingbeat cycle at all speeds when birds used thisaerodynamic gait (Figs 10, 11). Variation in circulation wasgreatest at wing turn-around, as a result of the decrease in distaland proximal wing section circulation magnitude at these times(Figs 10C, 11C), and generally decreased as speed increased.Theoretical analysis of the continuous-vortex gait based onprevious flow visualization experiments suggests thatinstantaneous circulation should be constant throughout theentire wingbeat cycle (Rayner, 1993). However, this does notcorrespond to our findings. As noted above, we found thatmean circulation remained constant between halves of thewingbeat cycle (between upstroke and downstroke) but was notconstant within the half-cycles. These brief shifts in circulationmagnitude should lead to energy loss and airflow along thewing from root to tip (span-wise vorticity), reducingaerodynamic efficiency (Rayner, 1986). However, given thetime-varying nature of both incident airflow over the wing andwing configuration in flapping vertebrate flight, variation incirculation over the course of the wingbeat cycle may beunavoidable. Our results for cockatiels and doves suggest thatthis is the case over much of their speed range when using a‘continuous’-vortex gait (Figs 10C, 11C).
Because of limitations inherent to our quasi-steadykinematic analysis and the current lack of time-varyingvisualized changes in circulation and wake structure, it is likelythat our results based on an evaluation of the circulationachieved over each half-wingbeat (Fig. 12) more accuratelyreflect the overall pattern of the bird’s vortex wake than ouranalysis of instantaneous changes in circulation (Figs 10, 11).Although our kinematic analysis does record rapid changes inwing configuration (such as those that occur especially duringwing turn-around), it is not clear that circulation changesinstantly in response to changing wing configuration. Span-
wise vorticity of sufficient magnitude to create a vortex-ringwake rather than a continuous-vortex wake may occur only ifbound circulation on the wing is completely arrested and mustbe re-initiated (Rayner, 1993). Also, it is important torecognize that the vortex wake observations that have laid thefoundation for vortex gait theory reflect patterns produced bycomplete wingbeats and are not a direct recording of theinstantaneous circulation within the time span of one wingbeat(Spedding et al., 1984; Spedding, 1986, 1987). While intra-wingbeat changes do occur and may reduce aerodynamicefficiency, they do not alter the fundamental patterns ofaerodynamic gait versusflight speed that we find here andwhich have been previously hypothesized (Rayner, 1986) anddescribed (Spedding et al., 1984).
Aerodynamics of flight gait transition: establishing upstrokecirculation
The species in this study established equivalent circulationduring the upstroke and downstroke (the continuous-vortexgait requirement) primarily by increasing estimated circulationduring the upstroke, although some reduction in downstrokecirculation did occur (Fig. 12). As the circulation producedduring the downstroke is easily diminished by a reduction inflapping velocity, the key changes that lead to a gait transitionoccur during the upstroke. Cockatiels and doves establishedupstroke circulation by meeting the following two conditions:(i) a phase delay in the peak proximal wing section angle ofattack from mid-downstroke into upstroke, and (ii) a reductionin intra-wingbeat variation in airflow (Wt), especially duringthe upstroke, by increasing overall forward velocity. Variationin estimated circulation over the course of a wingbeat cyclewas due primarily to two sources: changes in the magnitude ofairflow and changes in the angle of attack.
At all speeds, airflow (Wt) was greater during thedownstroke than during the upstroke. Thus, establishingequivalent circulation across the entire wingbeat cycle requireda greater angle of attack during the upstroke than during thedownstroke. We found that, at low speeds (1 and 3 m s–1) inboth species, distal and proximal wing section peak angle of
T. L. Hedrick, B. W. Tobalske and A. A. Biewener
Table 1. Comparison of gait aerodynamics
Speed Circulation Wing loadingSpecies (m s−1) (m2s−1) (kg m−2) Gait Source
Kestrel (Falco tinnunculus) 7.0 0.55 4.04 c.v. 3Ringed turtle-dove (Streptopelia risoria) 7.0 0.41 3.71 c.v. 4Cockatiel (Nymphaticus hollandicus) 7.0 0.32 2.51 c.v. 4Pigeon (Columba livia) 2.4 1.72 5.65 v.r. 1Jackdaw (Corvus monedula) 2.5 0.82 3.86 v.r. 2Ringed turtle-dove (Streptopelia risoria) 3.0 0.79 3.71 v.r. 4Cockatiel (Nymphaticus hollandicus) 3.0 0.41 2.51 v.r. 4
Gait: c.v., continuous vortex; v.r., vortex ring.1, Spedding et al. (1984); 2, Spedding (1986); 3, Spedding (1987); 4, present study.Circulation magnitude in the continuous-vortex gait is an average of circulation over the entire wingbeat cycle; circulation in the vortex-ring
gait is an average of circulation during the downstroke.
1407Three-dimensional kinematic analysis of avian gait change
attack occurred during the downstroke (Figs 10Aiv, 11Aiv).Whereas the distal wing’s peak angle of attack occurred duringthe downstroke at all flight speeds, at 5 m s–1 and faster, bothspecies adopted a phase delay in the proximal wing sectionpeak angle of attack, so that it peaked during the upstrokerather than the downstroke. However, airflow at this speed wasinsufficient to create a continuous-vortex gait (Figs 10Biii,11Biii, 12). Both the motion of the wing and the bird’s forwardvelocity contributed to airflow over the wing during thedownstroke. In contrast, wing motion during the upstrokeadded little to the flow provided by the bird’s overall forwardvelocity. Thus, the flow available for establishing upstrokecirculation was determined almost exclusively by the bird’sforward velocity. It was not until both species flew at 7 m s–1
that the flow magnitude over the wing, in combination with theproximal wing section angle of attack, was sufficient toproduce the substantial upstroke circulation necessary toestablish a continuous-vortex gait.
Aerodynamics of gait transition: fast flight, acceleration andmorphology
After making a transition into a continuous-vortex gait at7 m s–1, both species progressively decreased the angle ofattack of the proximal and distal sections of the wing at fasterspeeds. At the same time, however, both species maintainedthe phase delay in the proximal wing section’s angle of attackrelative to the distal wing. Because of the extreme reduction inthe proximal wing section angle of attack (2 °) at the fastestspeeds (cockatiels 15 m s–1, doves 17 m s–1) that either specieswould sustain in the wind tunnel, estimated upstrokecirculation declined substantially relative to that generated bythe distal wing during the downstroke, resulting in the loss ofa continuous-vortex gait. As noted above, however, thisreduction in angle of attack was apparently necessary forreducing profile drag for the birds to sustain these very fastflight speeds. This resulted in a second gait transition, in whichboth species appeared to adopt a ladder-wake gait.
The phase delay in the proximal wing section’s angle ofattack that developed at a steady forward flight speed of5 m s–1, prior to the transition into a continuous-vortex gait,was also observed when the birds accelerated within the windtunnel at intermediate flight speeds (Fig. 16). Incident airflowvelocities developed during the use of such rapid, high-amplitude downstrokes were much greater than thosedeveloped during the upstroke. Consequently, estimateddownstroke circulation was much greater than that achievedduring the upstroke, resulting in brief shifts between the use ofa ladder-wake gait during the acceleration burst and acontinuous-vortex gait when the bird returned to a steady flightspeed.
Contrary to our prediction that the cockatiels would switchto a continuous-vortex gait at a lower speed than the dovesbecause of their 33 % lower wing loading, the transition speedwas identical for both species. We had anticipated that thecockatiels’ lower wing loading would result in their requiringa lower overall circulation at any given flight speed and that this
should enable them to shift to a continuous-vortex gait at alower speed than the doves because it would require lessupstroke circulation to match that produced during thedownstroke and establish a continuous-vortex gait. Althoughthe mean magnitude of circulation produced by the cockatielswas indeed approximately 50 % of that of the doves, thisdifference was apparently insufficient to enable them to adopta continuous-vortex gait at 5 m s–1, despite the presence of aphase delay in the proximal wing’s angle of attack at that speed.
Vortex wake gaits in comparison with terrestrial gaits
Terrestrial gait transitions are typically correlated withchanges in footfall and shifts in muscle use patterns(Hildebrand, 1959; Goslow et al., 1981). Different terrestrialgaits can be distinguished by distinct patterns of whole-bodycenter of mass energy fluctuations and mechanical work(Cavagna et al., 1977). In the present study, we found that bothcockatiels and ringed turtle-doves gradually switched from adiscontinuous vortex-ring to a continuous-vortex gait, finallymaking the transition at a similar distinct speed (7 m s–1). Theuse of the vortex-ring or ladder-wake gaits at speeds above7 m s–1 was associated with brief periods of acceleration,whereas the use of a continuous-vortex gait at slow speeds wasassociated with brief periods of deceleration. The gradualnature of vortex gait transitions that we observe here for thesetwo avian species and previous two-dimensional kinematicresults (Tobalske and Dial, 1996; Tobalske, 2000) suggest thatvortex gaits should not be viewed as distinct locomotor gaitssimilar to those used by terrestrial animals but simply theaerodynamic consequences of changes in speed.
However, the gradual change in aerodynamic gait that weobserved probably reflects the constraints that a wind-tunnelenvironment places on a flying animal’s forward velocity. Wefound that shifting from a vortex-ring to continuous-vortex gaitrequired adjustment of both peak angle of attack timing andoverall flight speed. By restricting flight speed (i.e. by havingthe birds fly in a relatively constricted space, 1.4 m in length),we may constrain the birds to use a gradual gait transition. Theflight chamber in our wind tunnel is large enough to allow thespecies we examined in this study some freedom of movementand, as noted above, individual animals occasionally used thisspace to alternate rapidly between gaits, accelerating with aladder-wake gait and decelerating with a continuous-vortexgait. Such a pattern of acceleration and deceleration is evidentin the 7 m s–1 trial shown in Fig. 16, where gait changesapparently occur within two wingbeats. Similar oscillationshave been observed to occur in magpies flying in a wind tunneland in the field (Tobalske et al., 1997). It would be interestingto test whether such variation in gait use is characteristic ofcockatiel and dove flight in the field or whether birds in thewild tend to avoid flying at such transition speeds. Undernatural, free-flight conditions, both the timing of angle ofattack and overall flight speed are under the direct control ofthe bird. As a result, the switch from a vortex-ring gait at5 m s–1 to a continuous-vortex gait at 7 m s–1 may occur withinthe duration of a few wingbeats.
1408
Concluding remarks
Our analysis of wing kinematics combined with a quasi-steady airflow analysis shows that cockatiels and ringed turtle-doves both shift from a vortex-ring to a continuous-vortex gaitat 7 m s–1. Both species also shift to a vortex-ring gait insituations calling for maximal thrust production such asacceleration and very fast flight. We expected that differencesin wing shape and body size would result in differentcirculation levels and different gait transition speeds betweencockatiels and ringed turtle-doves. While estimated circulationmagnitude did differ as expected, gait transitions occurred atthe same speed (7 m s–1), although greater resolution in speednear the transition might show some difference. Vortex gaittransitions occur gradually in the wind tunnel, but may occurrapidly in free flight where the bird is free to vary its flightspeed, e.g. when reaching cruising flight speeds from take-off.Thus, further investigation of gait transition speed wouldbenefit from free-flight conditions where the experimentalapparatus (wind-tunnel or still-air corridor) does not constrainflight behavior. Finally, the use of flow visualization in avariable-speed wind tunnel remains the best prospect forfurther investigation of the aerodynamic effects of flight gaitsand is more likely to resolve the variability in circulationexperienced by a bird employing a continuous-vortex gait.
List of symbolsaz vertical accelerationAdisc disc area swept by the wingb effective wing lengthc wing chordf wingbeat frequencyh altitude of the body above the midline of the chamberH vertical height of the chamberk reduced frequencymb body massCL coefficient of liftlx distance from the leading edge of the axis of rotationI lift per wingbeat impulse calculated from LIaccel per wingbeat impulse calculated from Laccel
L lift calculated from circulation and spanLaccel lift estimated from vertical accelerationq dynamic pressureT turbulenceU particle velocity in the xdirectionV particle velocity in the ydirectionVe equivalent air velocityVo observed air velocityW particle velocity in the zdirectionWit total induced airflowWiv vertical induced airflowWih horizontal induced airflowWk airflow from kinematic sourcesWt total (kinematic, tunnel and induced) airflowα angle of attack relative to wind, including induced
velocity
Γ circulationΓt translational circulationΓr rotational circulationθ angle between the incident airflow (Ve+Wk) and verticalω angular velocity of the wingr observed air densityρ0 standard air density (1.225 kg m–3)
We would like to thank Mike Williamson, Jason Soleau,Raphael Dasté and the Concord Field Station research groupfor their considerable assistance with this project. Themanuscript was greatly improved by comments from twoanonymous referees. Special thanks to Pierre Tresfort(Tresfort Metal Works) and Quentin Spendrup (SMJ Inc.) forquality construction of the wind tunnel. Supported by NSFIBN-0090265 and Murdock 99153.
ReferencesAldridge, H. D. J. N. (1986). Kinematics and aerodynamics of the greater
horseshoe bat, Rhinolophus ferrumequinum, in horizontal flight at variousspeeds. J. Exp. Biol.126, 479–497.
Alexander, R. McN. (1989). Optimization and gaits in the locomotion ofvertebrates. Physiol. Rev.69, 1199–1227.
Azuma, A. (1992). The Biokinetics of Flying and Swimming. Hong Kong:Springer Verlag.
Barlow, J. B., Rae, W. H., Jr and Pope, A.(1999). Low-speed Wind TunnelTesting. Third edition. New York: Wiley-Interscience.
Biewener, A. A. and Taylor, C. R.(1986). Bone strain: a determinant of gaitand speed? J. Exp. Biol. 123, 383–400.
Brown, R. H. J. (1953). The flight of birds. II. Wing function in relation toflight speed. J. Exp. Biol.30, 90–103.
Brown, R. H. J. (1963). The flight of birds. Biol. Rev.38, 460–489.Cavagna, G. A., Heglund, N. C. and Taylor, C. R.(1977). Mechanical work
in terrestrial locomotion: two basic mechanisms for minimizing energyexpenditure. Am. J. Physiol.233, R243–R261.
Combes, S. A. and Daniel, T. L.(2001). Shape, flapping and flexion: wingand fin design for forward flight. J. Exp. Biol.204, 2073–2085.
Farley, C. T. and Taylor, C. R. (1991). A mechanical trigger for thetrot–gallop transition in horses. Science253, 306–308.
Goslow, G. E., Jr, Reinking, R. and Stuart, D.(1973). The cat step cycle:hind limb joint angles and muscle lengths during unrestrained locomotion.J. Morphol. 141, 1–42.
Goslow, G. E., Jr, Seeherman, H. J., Taylor, C. R., McCutchin, M. N.and Heglund, N. G. (1981). Electrical activity and relative lengthchanges of dog limb muscle as a function of speed and gait. J. Exp. Biol.94, 15–42.
Hatze, H. (1988). High-precision three-dimensional photogrammetriccalibration and object space reconstruction using a modified DLT-approach.J. Biomech.21, 533–538.
Hildebrand, M. (1959). Motions of the running cheetah and horse. J.Mammal. 40, 481–495.
Hoyt, D. F. and Taylor, C. R.(1981). Gait and energetics of locomotion inhorses. Nature292, 239–240.
Kokshaysky, N. V. (1979). Tracing the wake of a flying bird. Nature 279,146–148.
McCormick, B. W. (1995). Aerodynamics, Aeronautics and FlightMechanics.New York: John Wiley & Sons.
Norberg, U. M. (1976). Kinematics, aerodynamics and energetics ofhorizontal flapping flight in the long-eared bat Plecotus auritus. J. Exp. Biol.65, 179–212.
Norberg, U. M. (1990). Vertebrate Flight: Mechanics, Physiology,Morphology, Ecology and Evolution.New York: Springer-Verlag.
Pennycuick, C. J.(1975). Mechanics of flight. In Avian Biology, vol. 5 (ed.D. S. Farner and J. R. King), pp. 1–75. New York: Academic Press
Pennycuick, C. J. (1988). On the reconstruction of pterosaurs and theirmanner of flight, with notes on vortex wakes. Biol. Rev.63, 209–231.
Pennycuick, C. J., Alerstam, T. and Hedenström, A.(1997). A new low-
T. L. Hedrick, B. W. Tobalske and A. A. Biewener
1409Three-dimensional kinematic analysis of avian gait change
turbulence wind tunnel for bird flight experiments at Lund University,Sweden. J. Exp. Biol.200, 1441–1449.
Pennycuick, C. J., Hedenstrom, A. and Rosen, M.(2000). Horizontal flightof a swallow (Hirundo rustica) observed in a wind tunnel, with a newmethod for directly measuring mechanical power. J. Exp. Biol.203,1755–1765.
Raffel, M., Willert, C. E. and Kompenhans, J. (1998). Particle ImageVelocimetry. A Practical Guide. Berlin: Springer-Verlag.
Rayner, J. M. V. (1986). Vertebrate flapping flight mechanics andaerodynamics and the evolution of flight in bats. In Biona Report5, BatVlight – Fledermausflug(ed. W. Nachtigall), pp. 27–74. Stuttgart: GustavFischer Verlag.
Rayner, J. M. V. (1988). Form and function in avian flight. Curr. Orn. 5,1–66.
Rayner, J. M. V. (1991). Wake structure and force generation in avianflapping flight. Acta XX Cong. Int. Orn.II, 702–715.
Rayner, J. M. V. (1993). On aerodynamics and the energetics of vertebrateflapping flight. Cont. Math.141, 351–400.
Rayner, J. M. V. (1994). Aerodynamic corrections for the flight of birds andbats in wind tunnels. J. Zool., Lond. 234, 537–563.
Rayner, J. M. V. (1995). Dynamics of the vortex wakes of swimming andflying vertebrates. In Biological Fluid Dynamics(ed. C. P. Ellington and T.J. Pedley). Symp. Soc. Exp. Biol. XLIX, 131–155.
Rayner, J. M. V., Jones, G. and Thomas, A.(1986). Vortex flowvisualizations reveal change of upstroke function with flight speed inmicrochiropteran bats. Nature321, 162–164.
Rüppell, G. (1975). Der Vogelflug. München: Kinder. [Translated as BirdFlight, New York: van Nostrand Rheinhold, 1977].
Scholey, K. D.(1983). Developments in vertebrate flight: climbing and glidingof mammals and reptiles, and the flapping flight of birds. PhD thesis,University of Bristol.
Spedding, G. R.(1986). The wake of a jackdaw (Corvus monedula) in slowflight. J. Exp. Biol. 125, 287–307.
Spedding, G. R.(1987). The wake of a kestrel (Falco tinnunculus) in flappingflight. J. Exp. Biol.127, 59–78.
Spedding, G. R. (1993). On the significance of unsteady effects in theaerodynamic performance of flying animals. Cont. Math.141, 401–419.
Spedding, G. R., Rayner, J. M. V. and Pennycuick, C. J.(1984).Momentum and energy in the wake of a pigeon (Columba livia) in slowflight. J. Exp. Biol.111, 81–102.
Tobalske, B. W. (2000). Biomechanics and physiology of gait selection inflying birds. Physiol. Biochem. Zool.73, 736–750.
Tobalske, B. W. and Dial, K. P.(1996). Flight kinematics of black-billedmagpies and pigeons over a wide range of speeds. J. Exp. Biol.199, 263–280.
Tobalske, B. W., Olson, N. E. and Dial, K. P.(1997). Flight style of theblack-billed magpie: variation in wing kinematics, neuromuscular controland muscle composition. J. Exp. Zool.279, 313–329.
Walker, J. A. (1998). Estimating velocities and accelerations of animallocomotion: a simulation experiment comparing numerical differentiationalgorithms. J. Exp. Biol.201, 981–995.
Woltring, H. J. (1986). A FORTRAN package for generalized, cross-validatoryspline smoothing and differentiation. Adv. Engng. Software8, 104–113.