Three Advanced Gold Projects in Western Australia with 1 ... · GASCOYNE RESOURCES LIMITED . AMEC...
26
GASCOYNE RESOURCES LIMITED AMEC Conference June 2015 Three Advanced Gold Projects in Western Australia with 1.78Moz on Granted Mining Leases
Transcript of Three Advanced Gold Projects in Western Australia with 1 ... · GASCOYNE RESOURCES LIMITED . AMEC...

GASCOYNE RESOURCES LIMITED
AMEC Conference June 2015
Three Advanced Gold Projects in Western Australia with 1.78Moz on Granted Mining Leases

This presentation contains forward looking statements that are subject to risk factors associated with resources businesses. It is believed that the expectations reflected in these statements are reasonable but they may be affected by a variety of variables and changes in underlying assumptions which could cause actual results or trends to differ materially, including but not limited to: price fluctuations, actual demand, currency fluctuations, drilling and production results, reserve estimates, loss of market, industry competition, environmental risks, physical risks, legislative, fiscal and regulatory developments, economic and financial market conditions in various countries and regions, political risks, project delay or advancement, approvals and cost estimates. Information in this presentation is based on data compiled by Gascoyne’s Managing Director Mr Michael Dunbar who is a member of The Australasian Institute of Mining and Metallurgy. Mr Dunbar has sufficient experience which is relevant to the style of mineralisation and type of deposit under consideration and to the activity which they are undertaking to qualify as Competent Persons under the 2012 Edition of the Australasian Code for reporting of Exploration Results, Mineral Resources and Ore Reserves. Mr Dunbar consents to the inclusion of the data in the form and context in which it appears. The Glenburgh Mineral Resources have been estimated by RungePincockMinarco Limited, an external consultancy, and are reported under the 2012 Edition of the Australasian Code for reporting of Exploration Results, Mineral Resources and Ore Reserves (see GCY -ASX announcement 24th July 2014 titled: High Grade Domains Identified Within Updated Glenburgh Gold Mineral Resource). The company confirms that it is not aware of any new information or data that materially affects the information included in the original market announcements and, in the case of estimates of Mineral Resources that all material assumptions and technical parameters underpinning the estimate in the relevant market announcement continue to apply and have not materially changed. The company confirms that the form and context in which the Competent Person’s findings are presented have not materially modified from the original market announcements. The Glenburgh 2004 JORC resource (released to the ASX on April 29th 2013) which formed the basis for the preliminary Feasibility Study was classified as Indicated and Inferred and as a result, is not sufficiently defined to allow conversion to an ore reserve; the financial analysis in the preliminary Feasibility Study is conceptual in nature and should not be used as a guide for investment. It is uncertain if additional exploration will allow conversion of the Inferred resource to a higher confidence resource (Indicated or Measured) and hence if a reserve could be determined for the project in the future. Production targets referred to in the preliminary Feasibility Study and in this report are conceptual in nature and include areas where there has been insufficient exploration to define an Indicated mineral resource. There is a low level of geological confidence associated with inferred mineral resources and there is no certainty that further exploration work will result in the determination of indicated mineral resources or that the production target itself will be realised. This information was prepared and first disclosed under the JORC Code 2004, the resource has now been updated to conform with the JORC 2012 guidelines. The new JORC 2012 resource, reported above, will form the basis for any future studies. The Gilbeys and Golden Wings resources have been estimated by Elemental Geology Pty Ltd, an external consultancy, and are reported under the 2012 Edition of the Australasian Code for reporting of Exploration Results, Mineral Resources and Ore Reserves (see GCY -ASX announcement 1st August 2013 titled: Dalgaranga Gold Resource Increases 80% to 685,000oz and Dalgaranga scoping study outlines low cost/high margin development 23rd June 2015). The company confirms that it is not aware of any new information or data that materially affects the information included in the original market announcements and, in the case of estimates of Mineral Resources that all material assumptions and technical parameters underpinning the estimate in the relevant market announcement continue to apply and have not materially changed. The company confirms that the form and context in which the Competent Person’s findings are presented have not materially modified from the original market announcements. The Egerton Resource estimate and Gaffney’s Find prospect historical exploration results have been sourced from Exterra Resources annual reports and other publicly available reports which have undergone a number of peer reviews by qualified consultants, who conclude that the resources comply with the JORC code and are suitable for public reporting. This information was prepared and first disclosed under the JORC Code 2004. It has not been updated since to comply with the JORC Code 2012 on the basis that the information has not materially changed since it was last reported. All references to dollars, cents or $ in this presentation are to AUS$ currency, unless otherwise stated.
DISCLAIMER & COMPETENT PERSON STATEMENT
SNAPSHOT OF GASCOYNE RESOURCES GCY – Ordinary Shares 178 Million
Unlisted Options 3.9 Million (price 26c)
Share Price A 7.3c
Market Capitalisation ~A$13M
Cash (March 2015) A$1.35M
JORC Gold Resources 1,780,000oz (Measured, Indicated and Inferred)
EV / Resource Ounce ~A$ 6.5
Major Shareholders Board and Management ~ 25 % JP Morgan 8.3 % Citi Corp Nominees 6.9 % National Nominees 5.4 % HSBC Nominees 3.5 % TOP 30 >74 %
BOARD OF DIRECTORS Mike Joyce Non – Exec Chairman Mike Dunbar Managing Director Non Exec. Directors: Graham Riley John den Dryver Gordon Dunbar Stan Macdonald MANAGEMENT TEAM Julian Goldsworthy General Manager Eva O’Malley Company Sec / CFO
GCY Share Price – last 12 months high 21.5c, low 6.3c Last 7.3c

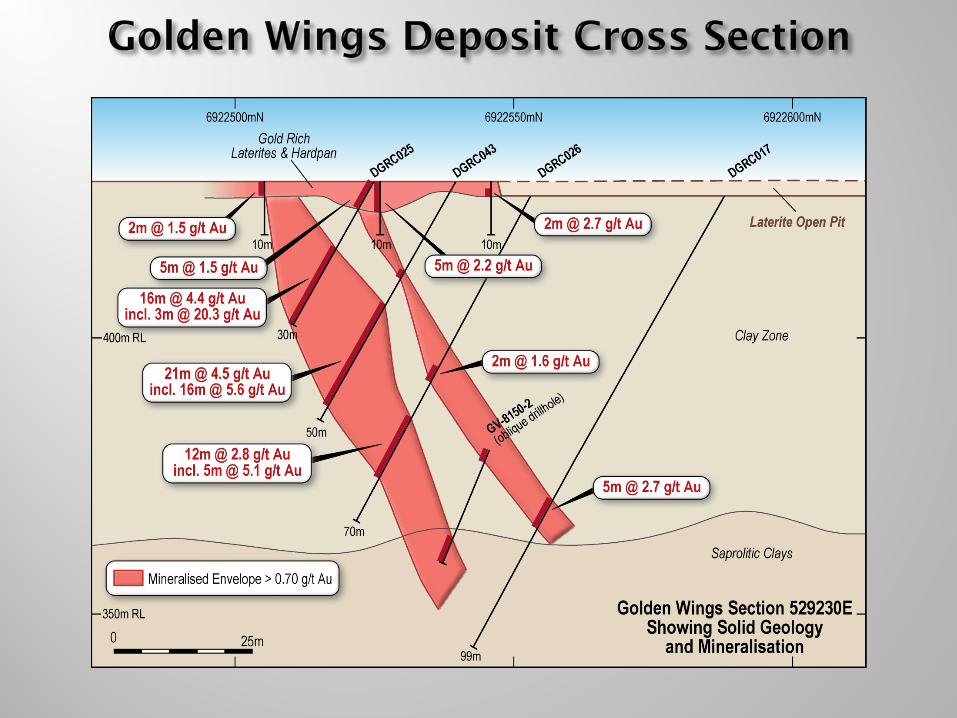
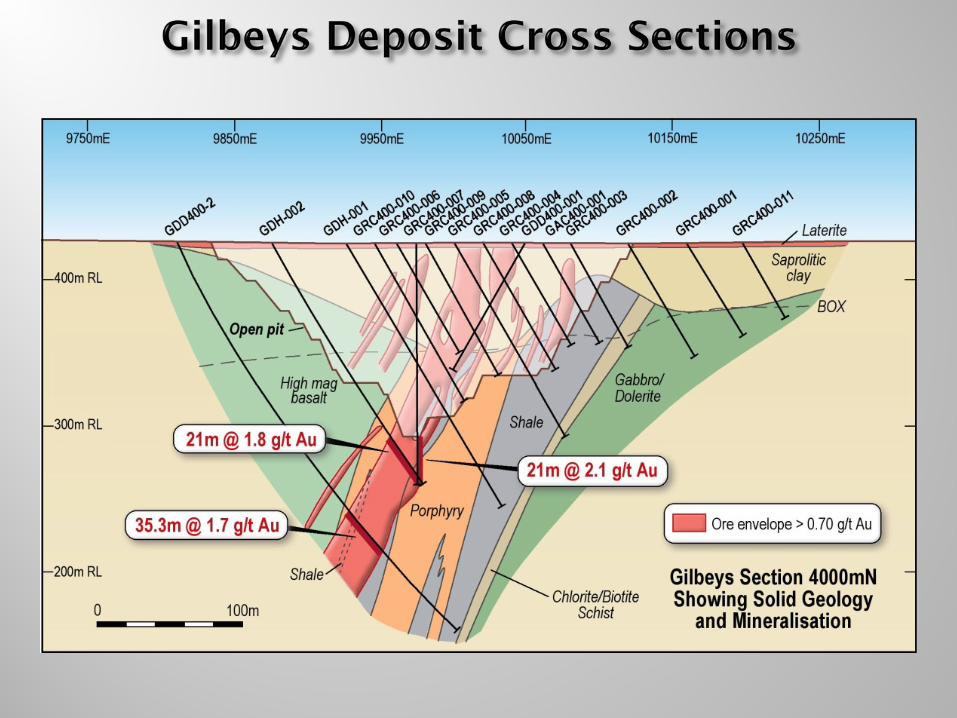
Dalgaranga Project– Brownfields Gold Project in the Murchison Region Resource base of 756,000oz on a Granted Mining Lease Detailed Scoping Study completed (see ASX announcement 23rd June 2015) Shallow high grade RC results include 16m@ 4.4 g/t to EOH , 17m @ 3.9 g/t, 6m @ 3.5 g/t,
5m @ 5.1 g/t & 21m @ 4.5 g/t Dominant Land Position in Under explored fertile Greenstone belt
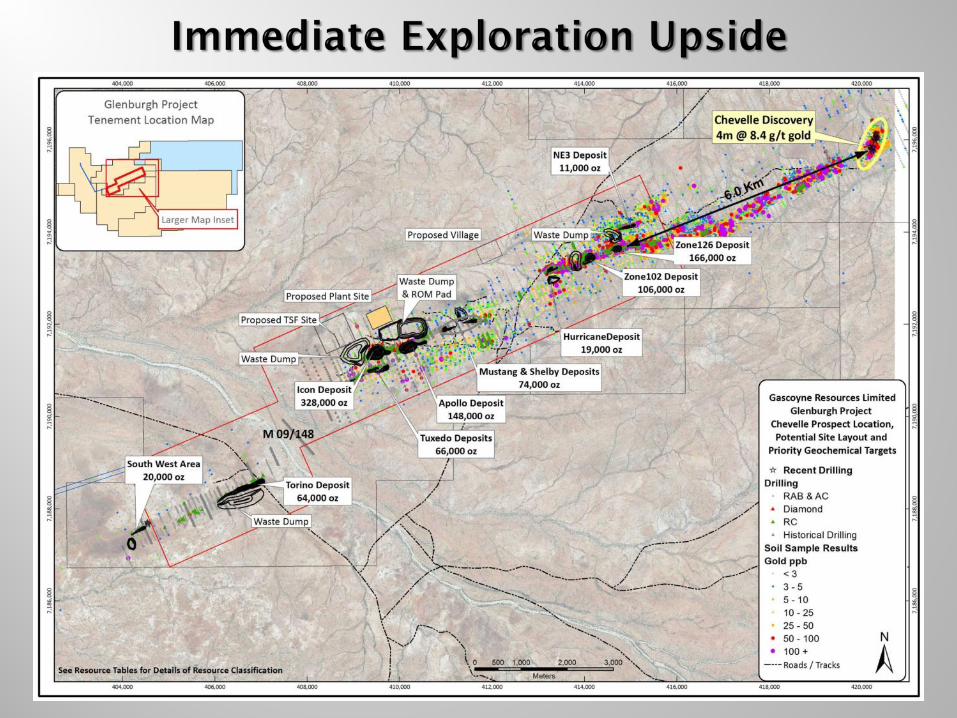
Glenburgh Project – Greenfields Gold Project in the Gascoyne Region Measured, Indicated and Inferred Resource of over 1.0 million ounces High grade core of 2.09Mt @ 4.1 g/t gold for 273,000 ounces identified Positive Preliminary FS Completed in 2013; Further improvements identified Native Title Agreement Signed and Mining Lease Granted New prospect discovered (4m @ 8.4 g/t gold) 6km north east of known resources
Egerton Project – Greenfields Gold Project in the Gascoyne Region High Grade Hibernian deposit (23,800 oz @ 6.4 g/t gold) on a Granted Mining Lease Recent shallow RC drilling resulted in intersections up to 8m @ 11.4g/t gold Extensions identified to known deposits
See Slide 25 to 27 for Resource Classification Details

Peak Hill Gold Field
Plutonic Gold Field
Western Australian Geological Map
Carnarvon
PERTH
Tropicana Gold Deposit
~ 8.0 Moz resource
Mount Magnet Gold Field
Project Locations
Paulsens Gold Field
SIR - Nova
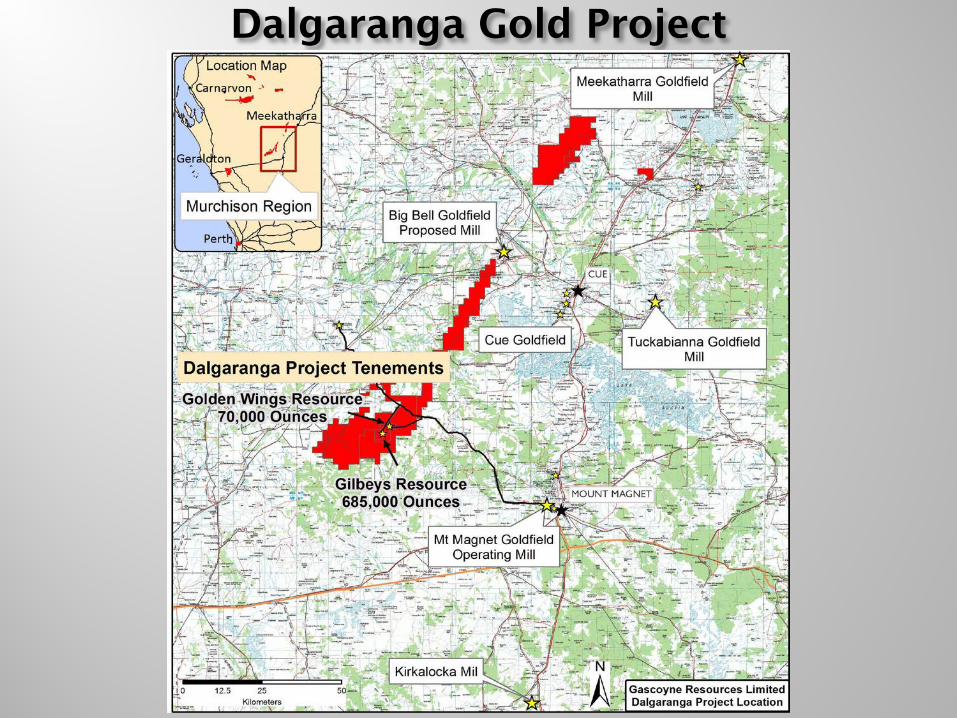
Dalgaranga Gold Project
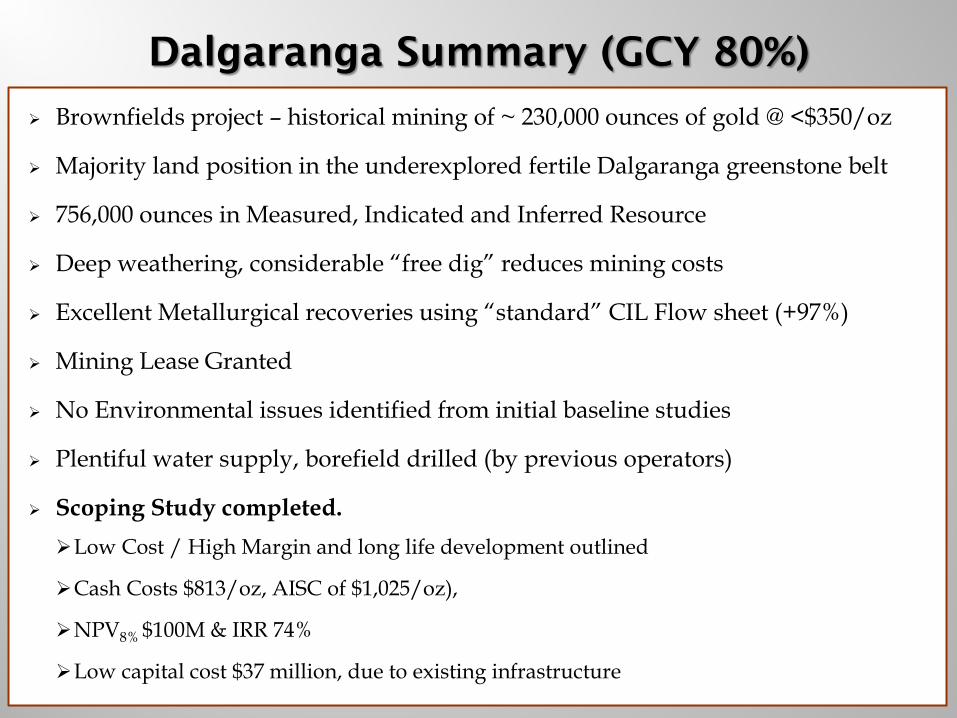
Dalgaranga Summary (GCY 80%)
Brownfields project – historical mining of ~ 230,000 ounces of gold @ <$350/oz
Majority land position in the underexplored fertile Dalgaranga greenstone belt
756,000 ounces in Measured, Indicated and Inferred Resource
Deep weathering, considerable “free dig” reduces mining costs
Excellent Metallurgical recoveries using “standard” CIL Flow sheet (+97%)
Mining Lease Granted
No Environmental issues identified from initial baseline studies
Plentiful water supply, borefield drilled (by previous operators)
Scoping Study completed. Low Cost / High Margin and long life development outlined
Cash Costs $813/oz, AISC of $1,025/oz),
NPV8% $100M & IRR 74%
Low capital cost $37 million, due to existing infrastructure


Dalgaranga – Deep weathering: Considerable Free Dig- low mining costs
70m
Ore Zone

On site processing plant and associated equipment the preferred development path Two options considered:
Base Case: US$1,050 (75c FX) pit optimisations & pit designs Production Target: 7.5Mt @ 1.4 g/t for 330,000oz contained gold for 60,000ozpa for ~6 years 75% Classified as Indicated, 25% Inferred Low cost / high margin development Cash Cost $813/oz, AISC $1,025/oz, Operating Cashflow: $183M, NPV8% $100M, IRR 74%
Upside Case: US$1,200 (75c FX) pit optimisations & pit designs Production Target: 14.1Mt @ 1.3 g/t for 595,000oz contained gold for 60,000ozpa for 10 years Provides excellent leverage to expected future gold prices 52% Classified as Indicated, 48% Inferred Operating Cashflow: $206M
Low Pre-Production Capitial Costs: $37 million due to existing infrastructure
Dalgaranga – Scoping Study
Conceptual Gilbeys Pit Design Cautionary Statement The Company Advises that the Scoping Study is based on lower-level technical and preliminary economic assessments, and is insufficient to support estimation of Ore Reserves or to provide assurance of an economic development case at this stage, or to provide certainty that the conclusions of the Scoping Study will be realised. The Production Target referred to in this report is partly based on Inferred Mineral Resources (being 25% for the Base Case and 48% for the Upside Case). There is a low level of geological confidence associated with Inferred Mineral Resources and there is no certainty that further exploration work will result in the determination of Indicated Mineral Resources or that the production target or preliminary economic assessment will be realised Financial analysis undertaken using US$1,200 & 75c FX

Glenburgh Summary
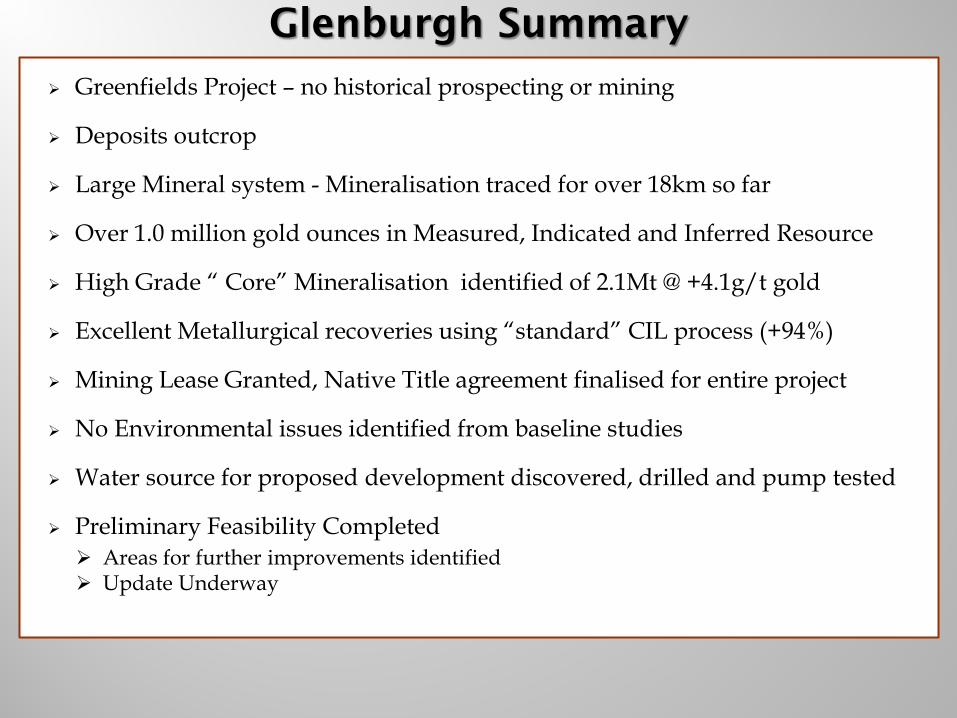
Greenfields Project – no historical prospecting or mining
Deposits outcrop
Large Mineral system - Mineralisation traced for over 18km so far
Over 1.0 million gold ounces in Measured, Indicated and Inferred Resource
High Grade “ Core” Mineralisation identified of 2.1Mt @ +4.1g/t gold
Excellent Metallurgical recoveries using “standard” CIL process (+94%)
Mining Lease Granted, Native Title agreement finalised for entire project
No Environmental issues identified from baseline studies
Water source for proposed development discovered, drilled and pump tested
Preliminary Feasibility Completed Areas for further improvements identified Update Underway

Glenburgh Preliminary Feasibility Study*
Initial Production Target: 4.9Mt @ 2.0g/t gold for 316,000 oz over 4+ years (pit designs based on US$1,050oz and 75c exchange rate pit optimisations)
Operating Surplus ~ $160 million
LOM Revenue ~ $448 million
All in Sustaining Costs: A$994/oz – High Margins
Capital Costs: A$70.4 million including $10 million working capital
Average Annual Production Target 73,000oz
Areas identified for further improvement including: 15-20% reduction power costs by using gas fired power generation Resource update completed – High Grade Core defined 2.09Mt @ 4.1g/t gold within +1.0Moz resource Potential for smaller throughput plant – lowering capital costs New mineralisation discovered 6km north east of known resources New Drill targets identified
* The Preliminary Feasibility study was first announced to the ASX on the 5th of August 2013 under JORC 2004. The assumptions which underpin the study have not been updated to reflect the recent decrease in mining costs and power costs which are expected to significantly improve the projects economics. The feasibility included ~30% Inferred resources. There is a low level of geological confidence associated with inferred mineral resources and there is no certainty that further exploration work will result in the determination of indicated mineral resources or that the production target itself will be realised. The financial assessments provided are preliminary in nature and there is no guarantee that future drilling will result in the conversion of the Inferred resource to Indicated allowing a reserve to be calculated. The capital costs assume a second hand processing facility. The financial results assume US$1,200 and an A$ exchange rate of 80c. The resource has recently been updated to include all drilling completed to June 2014. The updated JORC2012 resource (see Appendix for Resource for details) will be used for any future development studies for the project.


“Central Zone” Cross Section “NE Zone” Cross Section

Cross Section
130m
Conceptual Zone 126 Mine Design
Open
Open
Open


100% GCY High Grade Resource 24,000oz @ 6.4g/t gold within 50m of surface on granted Mining Lease Over 8km of undrilled mineralised shear Gaffneys Find high grade prospect, drilling includes up to 72.9 g/t gold – not in resource Potential for further high grade discoveries and for short term high grade development
Egerton Gold Project
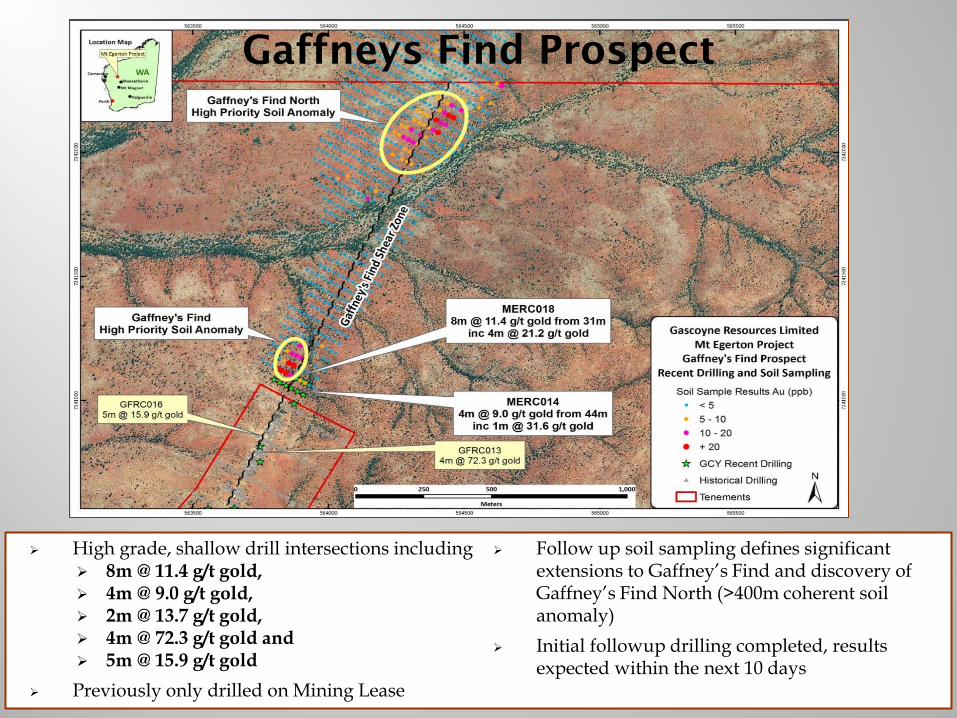
High grade, shallow drill intersections including 8m @ 11.4 g/t gold, 4m @ 9.0 g/t gold, 2m @ 13.7 g/t gold, 4m @ 72.3 g/t gold and 5m @ 15.9 g/t gold
Previously only drilled on Mining Lease
Follow up soil sampling defines significant extensions to Gaffney’s Find and discovery of Gaffney’s Find North (>400m coherent soil anomaly)
Initial followup drilling completed, results expected within the next 10 days
Gaffneys Find Prospect
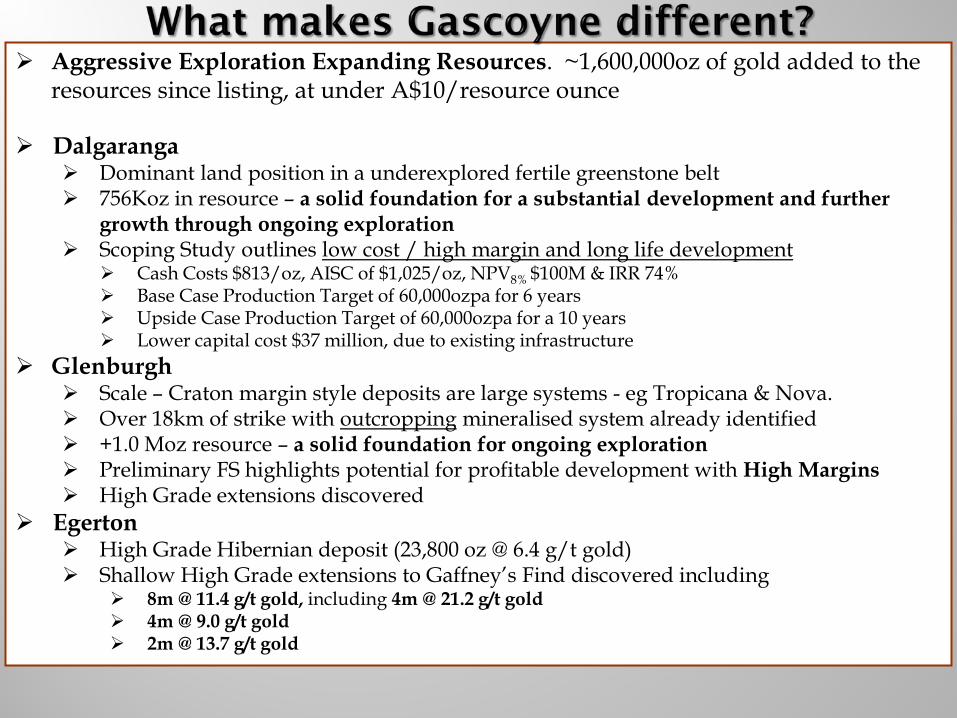
Aggressive Exploration Expanding Resources. ~1,600,000oz of gold added to the resources since listing, at under A$10/resource ounce
Dalgaranga
Dominant land position in a underexplored fertile greenstone belt 756Koz in resource – a solid foundation for a substantial development and further
growth through ongoing exploration Scoping Study outlines low cost / high margin and long life development
Cash Costs $813/oz, AISC of $1,025/oz, NPV8% $100M & IRR 74% Base Case Production Target of 60,000ozpa for 6 years Upside Case Production Target of 60,000ozpa for a 10 years Lower capital cost $37 million, due to existing infrastructure
Glenburgh Scale – Craton margin style deposits are large systems - eg Tropicana & Nova. Over 18km of strike with outcropping mineralised system already identified +1.0 Moz resource – a solid foundation for ongoing exploration Preliminary FS highlights potential for profitable development with High Margins High Grade extensions discovered
Egerton High Grade Hibernian deposit (23,800 oz @ 6.4 g/t gold) Shallow High Grade extensions to Gaffney’s Find discovered including
8m @ 11.4 g/t gold, including 4m @ 21.2 g/t gold 4m @ 9.0 g/t gold 2m @ 13.7 g/t gold
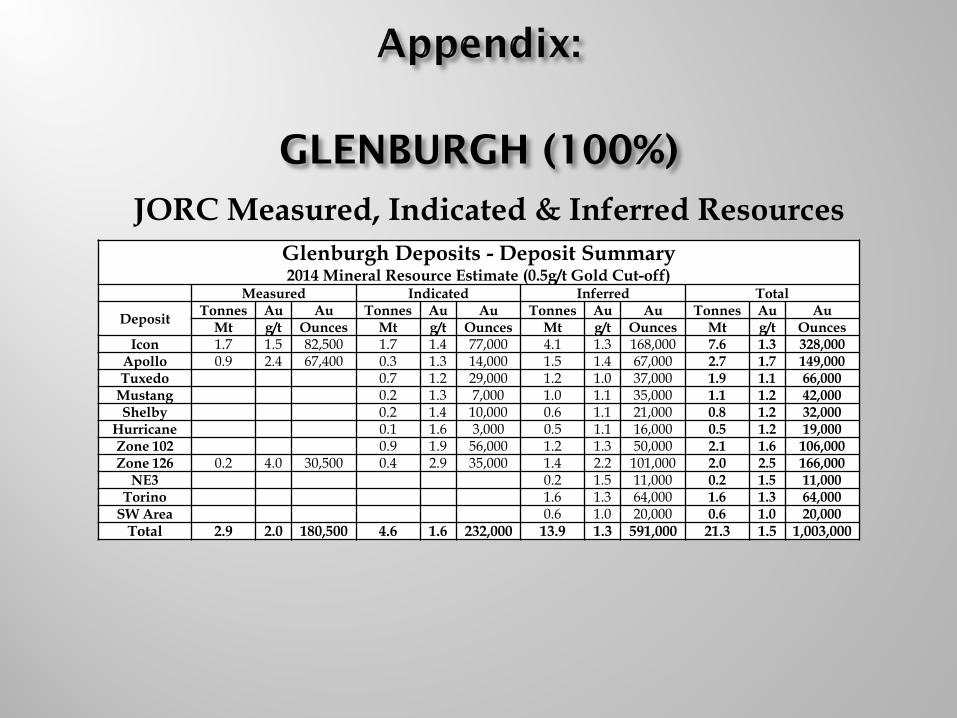
GLENBURGH (100%)
Glenburgh Deposits - Deposit Summary 2014 Mineral Resource Estimate (0.5g/t Gold Cut-off)
Measured Indicated Inferred Total
Deposit Tonnes Au Au Tonnes Au Au Tonnes Au Au Tonnes Au Au Mt g/t Ounces Mt g/t Ounces Mt g/t Ounces Mt g/t Ounces
Icon 1.7 1.5 82,500 1.7 1.4 77,000 4.1 1.3 168,000 7.6 1.3 328,000 Apollo 0.9 2.4 67,400 0.3 1.3 14,000 1.5 1.4 67,000 2.7 1.7 149,000 Tuxedo 0.7 1.2 29,000 1.2 1.0 37,000 1.9 1.1 66,000
Mustang 0.2 1.3 7,000 1.0 1.1 35,000 1.1 1.2 42,000 Shelby 0.2 1.4 10,000 0.6 1.1 21,000 0.8 1.2 32,000
Hurricane 0.1 1.6 3,000 0.5 1.1 16,000 0.5 1.2 19,000 Zone 102 0.9 1.9 56,000 1.2 1.3 50,000 2.1 1.6 106,000 Zone 126 0.2 4.0 30,500 0.4 2.9 35,000 1.4 2.2 101,000 2.0 2.5 166,000
NE3 0.2 1.5 11,000 0.2 1.5 11,000 Torino 1.6 1.3 64,000 1.6 1.3 64,000
SW Area 0.6 1.0 20,000 0.6 1.0 20,000 Total 2.9 2.0 180,500 4.6 1.6 232,000 13.9 1.3 591,000 21.3 1.5 1,003,000
JORC Measured, Indicated & Inferred Resources
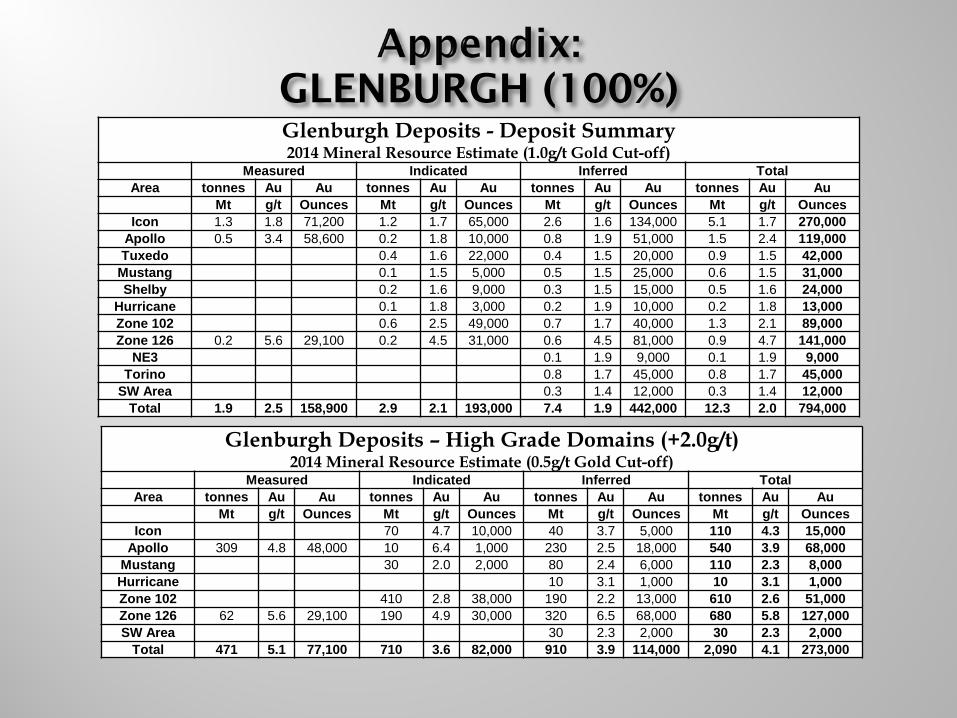
GLENBURGH (100%) Glenburgh Deposits - Deposit Summary 2014 Mineral Resource Estimate (1.0g/t Gold Cut-off)
Measured Indicated Inferred Total Area tonnes Au Au tonnes Au Au tonnes Au Au tonnes Au Au
Mt g/t Ounces Mt g/t Ounces Mt g/t Ounces Mt g/t Ounces Icon 1.3 1.8 71,200 1.2 1.7 65,000 2.6 1.6 134,000 5.1 1.7 270,000
Apollo 0.5 3.4 58,600 0.2 1.8 10,000 0.8 1.9 51,000 1.5 2.4 119,000 Tuxedo 0.4 1.6 22,000 0.4 1.5 20,000 0.9 1.5 42,000
Mustang 0.1 1.5 5,000 0.5 1.5 25,000 0.6 1.5 31,000 Shelby 0.2 1.6 9,000 0.3 1.5 15,000 0.5 1.6 24,000
Hurricane 0.1 1.8 3,000 0.2 1.9 10,000 0.2 1.8 13,000 Zone 102 0.6 2.5 49,000 0.7 1.7 40,000 1.3 2.1 89,000 Zone 126 0.2 5.6 29,100 0.2 4.5 31,000 0.6 4.5 81,000 0.9 4.7 141,000
NE3 0.1 1.9 9,000 0.1 1.9 9,000 Torino 0.8 1.7 45,000 0.8 1.7 45,000
SW Area 0.3 1.4 12,000 0.3 1.4 12,000 Total 1.9 2.5 158,900 2.9 2.1 193,000 7.4 1.9 442,000 12.3 2.0 794,000
Glenburgh Deposits – High Grade Domains (+2.0g/t) 2014 Mineral Resource Estimate (0.5g/t Gold Cut-off)
Measured Indicated Inferred Total Area tonnes Au Au tonnes Au Au tonnes Au Au tonnes Au Au
Mt g/t Ounces Mt g/t Ounces Mt g/t Ounces Mt g/t Ounces Icon 70 4.7 10,000 40 3.7 5,000 110 4.3 15,000
Apollo 309 4.8 48,000 10 6.4 1,000 230 2.5 18,000 540 3.9 68,000 Mustang 30 2.0 2,000 80 2.4 6,000 110 2.3 8,000 Hurricane 10 3.1 1,000 10 3.1 1,000 Zone 102 410 2.8 38,000 190 2.2 13,000 610 2.6 51,000 Zone 126 62 5.6 29,100 190 4.9 30,000 320 6.5 68,000 680 5.8 127,000 SW Area 30 2.3 2,000 30 2.3 2,000
Total 471 5.1 77,100 710 3.6 82,000 910 3.9 114,000 2,090 4.1 273,000
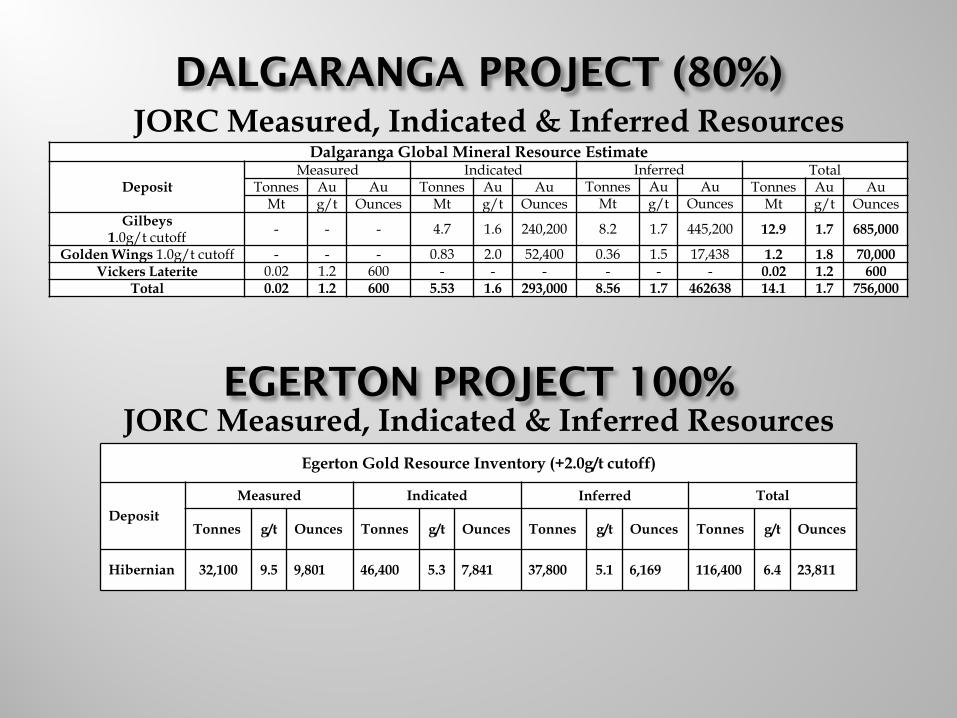
DALGARANGA PROJECT (80%) JORC Measured, Indicated & Inferred Resources
EGERTON PROJECT 100% JORC Measured, Indicated & Inferred Resources
Egerton Gold Resource Inventory (+2.0g/t cutoff)
Deposit Measured Indicated Inferred Total
Tonnes g/t Ounces Tonnes g/t Ounces Tonnes g/t Ounces Tonnes g/t Ounces
Hibernian 32,100 9.5 9,801 46,400 5.3 7,841 37,800 5.1 6,169 116,400 6.4 23,811
Dalgaranga Global Mineral Resource Estimate
Deposit Measured Indicated Inferred Total
Tonnes Au Au Tonnes Au Au Tonnes Au Au Tonnes Au Au Mt g/t Ounces Mt g/t Ounces Mt g/t Ounces Mt g/t Ounces
Gilbeys 1.0g/t cutoff - - - 4.7 1.6 240,200 8.2 1.7 445,200 12.9 1.7 685,000
Golden Wings 1.0g/t cutoff - - - 0.83 2.0 52,400 0.36 1.5 17,438 1.2 1.8 70,000 Vickers Laterite 0.02 1.2 600 - - - - - - 0.02 1.2 600
Total 0.02 1.2 600 5.53 1.6 293,000 8.56 1.7 462638 14.1 1.7 756,000