THREAT ANALYSIS REPORT DDoS’s Newest Minions: … · THREAT ANALYSIS REPORT . DDoS’s Newest...
30
F5. COM/ LABS 1 THREAT ANALYSIS REPORT DDoS’s Newest Minions: IoT Devices July 2016
Transcript of THREAT ANALYSIS REPORT DDoS’s Newest Minions: … · THREAT ANALYSIS REPORT . DDoS’s Newest...
F 5 . C O M / L A B S 1
THREAT ANALYSIS REPORT
DDoS’s Newest Minions: IoT Devices
July 2016

F 5 . C O M / L A B S 2
F5 LABS THREAT ANALYSIS REPORT DDoS’s Latest Minions: IoT Devices
This report was written by F5 Labs in conjunction with Loryka.
Table of Contents Table of Contents ............................................................................................................... 2
Table of Figures .................................................................................................................. 3
DDoS is Commonplace ....................................................................................................... 4
What’s New? ..................................................................................................................... 5 IoT devices are the latest minions in cyber weaponry toolkits ................................................... 5
The Interest is High ............................................................................................................ 7 Hunting for IoT devices with default passwords ........................................................................ 7 SSH brute force attack numbers and trends .............................................................................. 8 Telnet brute force attack numbers and trends......................................................................... 10
July Remaiten spike ....................................................................................................................... 12 Telnet brute force attack origin countries ............................................................................... 13
Top 10 countries scanning ............................................................................................................ 13 Telnet and SSH attacks by ASN................................................................................................ 16
Why are Telnet attacks getting so popular? ................................................................................. 17 Top 1000 ASNs launching SSH attacks ..................................................................................... 18 Top 1000 ASNs launching Telnet attacks ................................................................................. 19
IoT Botnets DDoSing ......................................................................................................... 21 IoT Botnets attacked multiple US state agencies ..................................................................... 22
How much can one device do? ..................................................................................................... 24 Android botnet DDoS attack ................................................................................................... 25
IoT DDoS Attacks Increasing .............................................................................................. 28
Where are the C & Cs? China, China, China ........................................................................ 28
TCP Attack Abuse Warnings! ............................................................................................. 28
Conclusion ........................................................................................................................ 29
ABOUT F5 LABS ................................................................................................................. 30
ABOUT LORYKA ................................................................................................................. 30

F 5 . C O M / L A B S 3
F5 LABS THREAT ANALYSIS REPORT DDoS’s Latest Minions: IoT Devices
Table of Figures Figure 1: Default Password Scanning Major Trends .............................................................................. 8 Figure 2: Six months of SSH brute force attacks .................................................................................... 9 Figure 3: SSH brute force attacks average day of week ........................................................................ 9 Figure 4: SSH Brute force attacks by month (daily average) ............................................................... 10 Figure 5: Telnet attacks increasing slow and then suddenly ............................................................... 11 Figure 6: Telnet Attacks Day of Week Average ................................................................................... 11 Figure 7: Telnet attacks daily average by month ................................................................................. 12 Figure 8: Telnet brute force attacks by country - last 30 days ............................................................ 13 Figure 9: Telnet brute force attacks by country - Last six months ...................................................... 14 Figure 10: Top 20 Countries hunting for IoT devices with Telnet brute force scans - last 30 days ..... 15 Figure 11: Total ASNs launching telnet & SSH brute force attacks ..................................................... 16 Figure 12: Total ASNs participating in SSH attacks .............................................................................. 17 Figure 13: Total ASNs participating in Telnet attacks .......................................................................... 17 Figure 14: Top 1000 ASNs and their contribution to the total SSH attack volume ............................. 18 Figure 15: Top 24 ASNs contributing more than 1% of the total SSH attack volume ......................... 19 Figure 16: Top 1000 ASNs and their contribution to the total Telnet attack volume ......................... 20 Figure 17: Top 32 ASNs contributing more than 1% of the total Telnet attack volume ..................... 20 Figure 18: Telnet attacks in relation to the attacking IP, ASN, and destination IP addresses ............. 21 Figure 19: US State agency sampled attack traffic .............................................................................. 22 Figure 20: US State Agency TCP attack ................................................................................................ 22 Figure 21: Source ports of the attack .................................................................................................. 23 Figure 22: Attack byte distribution breakdown ................................................................................... 24 Figure 23: IoT DDoS attack: top source port ....................................................................................... 25 Figure 24: IoT DDoS Attack —top destination port ............................................................................. 25 Figure 25: Mobile botnet DDoS attack: top source port ..................................................................... 26 Figure 26: Mobile botnet DDoS attack: top destination port .............................................................. 26 Figure 27: Andriod botnet all TCP traffic ............................................................................................. 27 Figure 28: DDoS attacks per day by IoT botnets .................................................................................. 28
F 5 . C O M / L A B S 4
F5 LABS THREAT ANALYSIS REPORT DDoS’s Latest Minions: IoT Devices
DDoS is Commonplace Distributed Denial of Service (DDoS) attacks in general, and multi-vector attacks designed to avoid
mitigations, aren’t anything new, but they have evolved over the years. New protocols are being
exploited (NTP? Really? Who knew that time could be a cyber weapon?), and attack volumes of
100+ Gbps are occurring regularly. Gone are the days of on-premises DDoS gear being an
adequate mitigation strategy. Most organizations need outside help to deal with attacks of this
volume. F5’s Security Operations Center (SOC), which provides such services, has mitigated two
attacks this year greater than 400 Gbps, one peaking at almost 450 Gbps. Because of peering and
network saturation, it’s highly likely that packets were dropped prior to reaching the Silverline DDoS
Protection service provided by the F5 SOC, and the overall bandwidth volume destined for the
target was larger than measured by Silverline.
In this report, we look at the nation-states who are conducting attacks that both find more devices
to add to botnets and that utilize these botnets for DDoS attacks. Before we get into the details,
here are some high-level observations:
• China, a major player in cyber attacks, is unlikely to stop censoring the Internet in its own
country or dial back its cyber opposition forces and nation-state espionage activities.
• Global leaders like the US, Canada, and members of the EU will continue to be top monetary
targets because they are strong financial sectors. As a result, a lot of today’s malware targets
the financial industry specifically, especially since the release of Zeus in 2011.
• Behind China, Russia, Ukraine, Brazil, and India will likely remain the top 5 countries of origin
from which DDoS attacks are launched.
• China, followed by Russia, Romania, Brazil, and Vietnam are the most likely locations for
Command and Control (C&C) servers.

F 5 . C O M / L A B S 5
F5 LABS THREAT ANALYSIS REPORT DDoS’s Latest Minions: IoT Devices
What’s New?
IoT devices are the latest minions in cyber weaponry toolkits Cyber weaponry has evolved. It started with vulnerable home computers, mostly operated by
people who scarcely know what anti-virus software is. Many of these users mistake “odd behavior”
from their computer (slow response time, pop-ups) as a sign that it’s “broken” when really it’s been
pwned and part of a botnet.
While home computers still make up a significant part of today’s botnet armies, the latest easy
targets for conscription are devices in the Internet of Things (IoT).
The world has yet to grasp the IoT and its impact on our daily lives. Virtually everything we come in
contact with throughout the day is becoming connected online. The obvious ones are the phones
and computers we use to manage our day-to-day activities, do our jobs, access bank accounts,
catch up on the latest world news, find a restaurant, get driving directions, watch TV, and play

F 5 . C O M / L A B S 6
F5 LABS THREAT ANALYSIS REPORT DDoS’s Latest Minions: IoT Devices
video games. Less obvious to Internet consumers are the things in your home—refrigerators that
cycle through family portraits, residential security cameras that increase your personal sense of
security, baby monitors that give you peace of mind, printers—even the car you drive and the
airplanes you fly in are all connected online.
In addition to the devices that have become mainstream and “smart” are those that are still smart,
but most consumers are unaware of:
• Residential modems for cable and DSL continue to be plagued with vulnerabilities.
• Residential routers, from consumer-friendly, all-in-one devices made by popular manufacturers to the pro-consumer products from lesser known companies seemingly all have CVE reports detailing how uPNP (as an example) can be exploited and used as traffic sources for SSDP-based DDoS attacks.
• The new fancy home security systems that let you lock your door from your cell phone
• Development boards and other DIY project kits
• That free “fancy” thermostat issued by your local municipality or utility company
• The multi-color LED bulbs that change color based on time of day or via an application on your smartphone
• Digital signage, from freeways to shopping malls
• Cameras on the road that monitor traffic, send you speeding tickets, and collect tolls
Even less known, but more threatening from a cyber risk standpoint are public infrastructure
Supervisory Control and Data Acquisition (SCADA) systems that are used to monitor and control
things like traffic lights at intersections, air traffic control systems, the water systems and power
grids you depend on, the 911 system, and the range of systems used by hospitals (everything from
breathing systems to physical doors).
Welcome to cyber space and the IoT.
F 5 . C O M / L A B S 7
F5 LABS THREAT ANALYSIS REPORT DDoS’s Latest Minions: IoT Devices
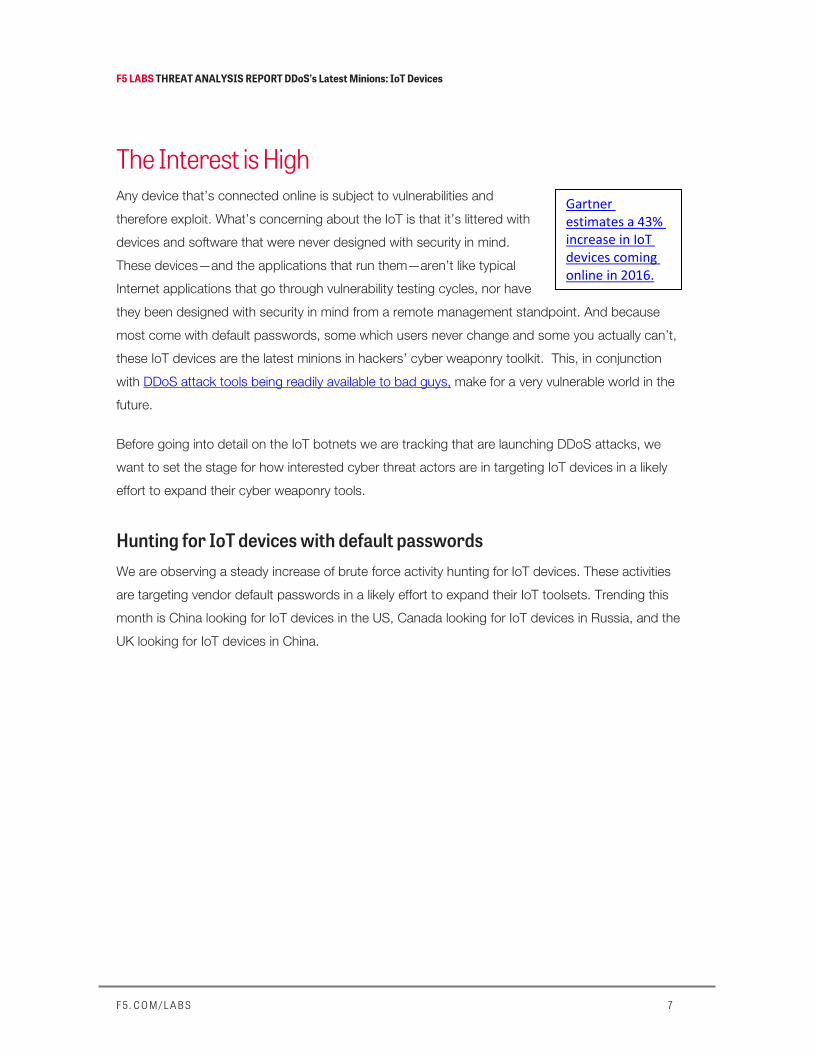
The Interest is High Any device that’s connected online is subject to vulnerabilities and
therefore exploit. What’s concerning about the IoT is that it’s littered with
devices and software that were never designed with security in mind.
These devices—and the applications that run them—aren’t like typical
Internet applications that go through vulnerability testing cycles, nor have
they been designed with security in mind from a remote management standpoint. And because
most come with default passwords, some which users never change and some you actually can’t,
these IoT devices are the latest minions in hackers’ cyber weaponry toolkit. This, in conjunction
with DDoS attack tools being readily available to bad guys, make for a very vulnerable world in the
future.
Before going into detail on the IoT botnets we are tracking that are launching DDoS attacks, we
want to set the stage for how interested cyber threat actors are in targeting IoT devices in a likely
effort to expand their cyber weaponry tools.
Hunting for IoT devices with default passwords We are observing a steady increase of brute force activity hunting for IoT devices. These activities
are targeting vendor default passwords in a likely effort to expand their IoT toolsets. Trending this
month is China looking for IoT devices in the US, Canada looking for IoT devices in Russia, and the
UK looking for IoT devices in China.
Gartner estimates a 43% increase in IoT devices coming online in 2016.
F 5 . C O M / L A B S 8
F5 LABS THREAT ANALYSIS REPORT DDoS’s Latest Minions: IoT Devices
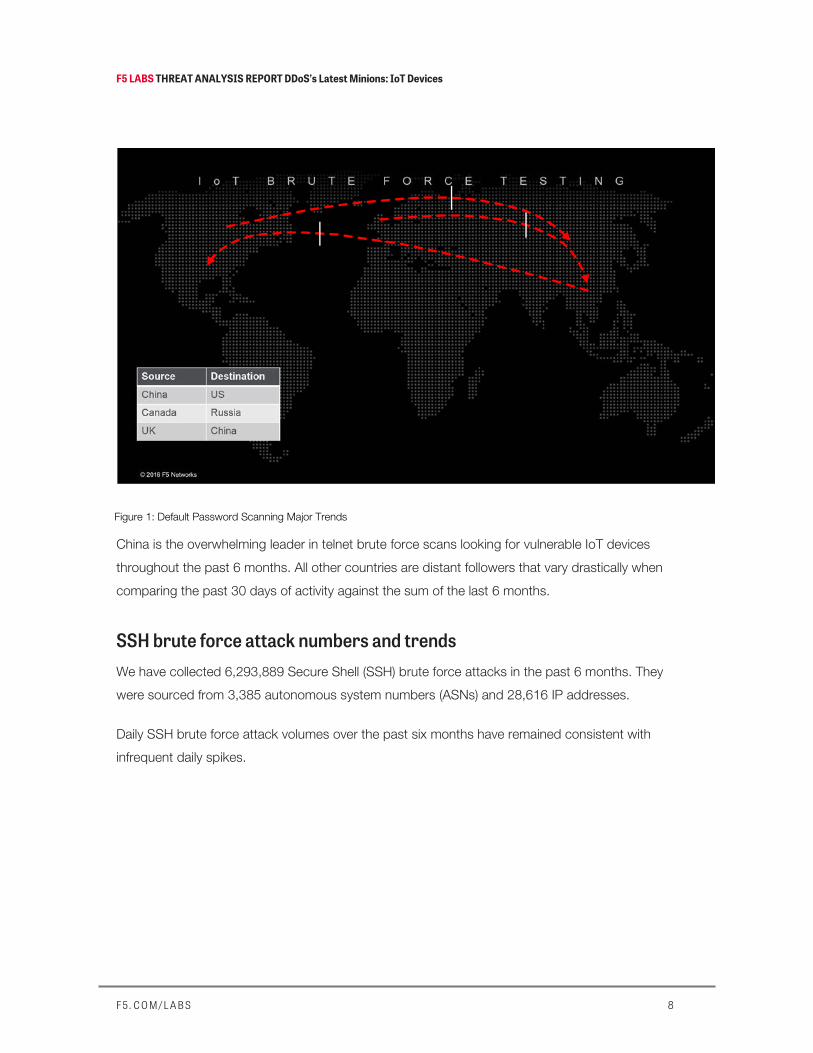
Figure 1: Default Password Scanning Major Trends
China is the overwhelming leader in telnet brute force scans looking for vulnerable IoT devices
throughout the past 6 months. All other countries are distant followers that vary drastically when
comparing the past 30 days of activity against the sum of the last 6 months.
SSH brute force attack numbers and trends We have collected 6,293,889 Secure Shell (SSH) brute force attacks in the past 6 months. They
were sourced from 3,385 autonomous system numbers (ASNs) and 28,616 IP addresses.
Daily SSH brute force attack volumes over the past six months have remained consistent with
infrequent daily spikes.

F 5 . C O M / L A B S 9
F5 LABS THREAT ANALYSIS REPORT DDoS’s Latest Minions: IoT Devices
Figure 2: Six months of SSH brute force attacks
Viewing the average number of attacks by day of week, there is relative consistency with a slight
dip on Wednesdays.
Figure 3: SSH brute force attacks average day of week
Looking at the average daily volume of brute force SSH attacks by month, volume steadily declined
from February through May and then began climbing again.
0
20000
40000
60000
80000
100000
120000
140000
160000
180000
200000
2/1/2016 3/2/2016 4/1/2016 5/1/2016 5/31/2016 6/30/2016
0
10000
20000
30000
40000
50000
60000
70000
Monday Tuesday Wednesday Thursday Friday Saturday Sunday
Brute force SSH Attack Volume Day of Week Average

F 5 . C O M / L A B S 10
F5 LABS THREAT ANALYSIS REPORT DDoS’s Latest Minions: IoT Devices
Figure 4: SSH Brute force attacks by month (daily average)
Telnet brute force attack numbers and trends We have collected 2,174,216 Telnet brute force attacks in the past 6 months. The Telnet attacks
were sourced from a much boarder scope of ASN’s, coming in at a total of 8,516, which is a much
larger pool of IP addresses to the tune of 543,819.
Telnet scans are our rising attack vector and have spiked significantly over the past month.
0
10000
20000
30000
40000
50000
60000
70000
80000
90000
Feburary March April May June July
Average Daily SSH Attack Volume Per Month

F 5 . C O M / L A B S 11
F5 LABS THREAT ANALYSIS REPORT DDoS’s Latest Minions: IoT Devices
Figure 5: Telnet attacks increasing slow and then suddenly
Telnet scans have no consistency throughout the days of the week:
Figure 6: Telnet Attacks Day of Week Average
If we trend line the current attack pattern, we expect to see Telnet brute force attacks on a
significant rise.
0
5000
10000
15000
20000
25000
30000
35000
40000
45000
2/1/2016 3/2/2016 4/1/2016 5/1/2016 5/31/2016 6/30/2016
12000
12500
13000
13500
14000
14500
Monday Tuesday Wednesday Thursday Friday Saturday Sunday
Telnet Brute Force by Day of Week Average
F 5 . C O M / L A B S 12
F5 LABS THREAT ANALYSIS REPORT DDoS’s Latest Minions: IoT Devices
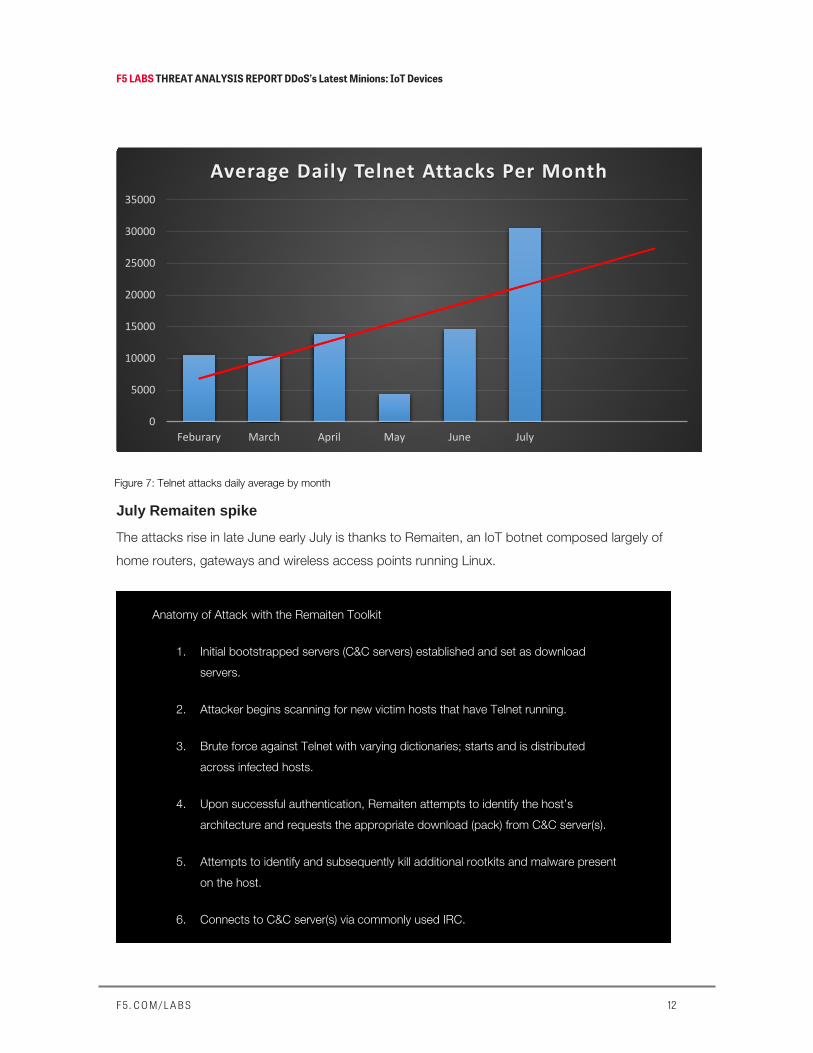
Figure 7: Telnet attacks daily average by month
July Remaiten spike
The attacks rise in late June early July is thanks to Remaiten, an IoT botnet composed largely of
home routers, gateways and wireless access points running Linux.
0
5000
10000
15000
20000
25000
30000
35000
Feburary March April May June July
Average Daily Telnet Attacks Per Month
Anatomy of Attack with the Remaiten Toolkit
1. Initial bootstrapped servers (C&C servers) established and set as download
servers.
2. Attacker begins scanning for new victim hosts that have Telnet running.
3. Brute force against Telnet with varying dictionaries; starts and is distributed
across infected hosts.
4. Upon successful authentication, Remaiten attempts to identify the host’s
architecture and requests the appropriate download (pack) from C&C server(s).
5. Attempts to identify and subsequently kill additional rootkits and malware present
on the host.
6. Connects to C&C server(s) via commonly used IRC.
F 5 . C O M / L A B S 13
F5 LABS THREAT ANALYSIS REPORT DDoS’s Latest Minions: IoT Devices
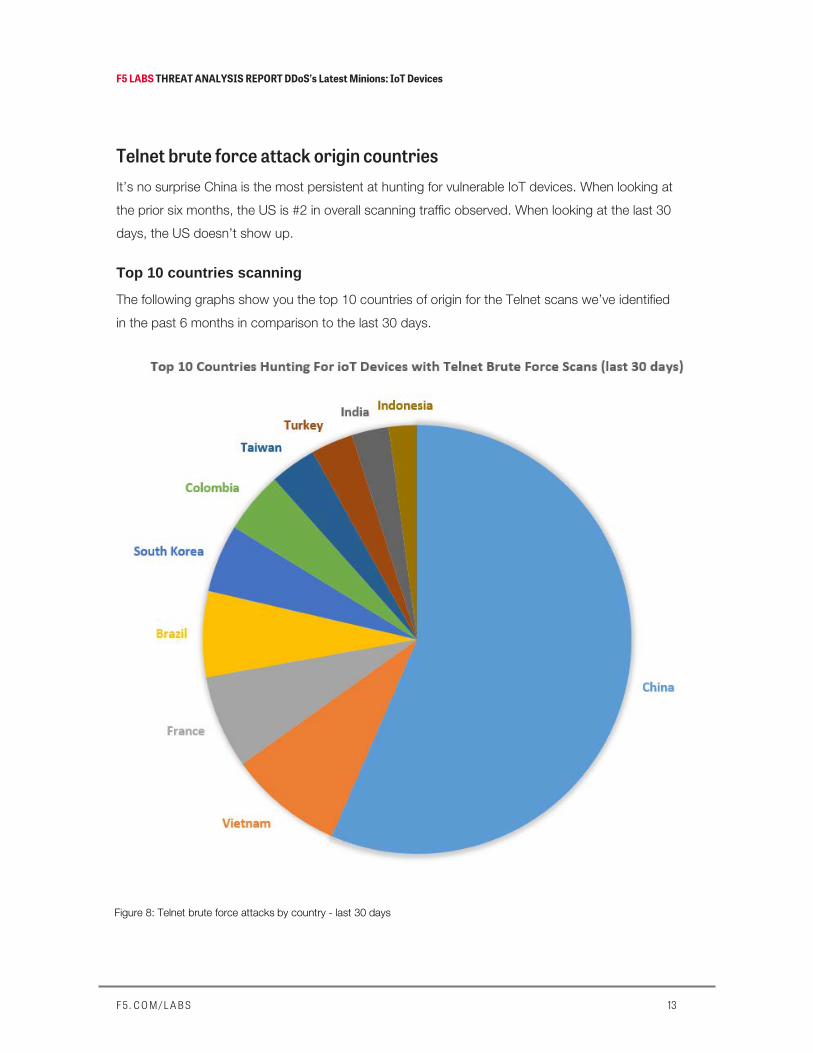
Telnet brute force attack origin countries It’s no surprise China is the most persistent at hunting for vulnerable IoT devices. When looking at
the prior six months, the US is #2 in overall scanning traffic observed. When looking at the last 30
days, the US doesn’t show up.
Top 10 countries scanning
The following graphs show you the top 10 countries of origin for the Telnet scans we’ve identified
in the past 6 months in comparison to the last 30 days.
Figure 8: Telnet brute force attacks by country - last 30 days

F 5 . C O M / L A B S 14
F5 LABS THREAT ANALYSIS REPORT DDoS’s Latest Minions: IoT Devices
Figure 9: Telnet brute force attacks by country - Last six months
We’ve seen significant change in country activity over the past 30 days. 60% of the countries who
were on the top 20 activity list in the past 6 months did not show up on the top 20 actors list for
the past 30 days.

F 5 . C O M / L A B S 15
F5 LABS THREAT ANALYSIS REPORT DDoS’s Latest Minions: IoT Devices
Top 20 Countries Conducting Telnet Brute Force Attacks
Position Last 30 days Position Last 6 months 1 China 1 China 2 Vietnam 2 US 3 France 3 France 4 Brazil 4 Germany 5 South Korea 5 Vietnam 6 Colombia 6 Great Britain 7 Taiwan 7 Russia 8 Turkey 8 Netherlands 9 India 9 South Korea 10 Indonesia 10 Ukraine 11 Philippines 11 India 12 Mexico 12 Poland 13 Thailand 13 Indonesia 14 Argentina 14 Brazil 15 Malaysia 15 Turkey 16 Pakistan 16 Chile 17 Kazakhstan 17 Canada 18 American Samoa 18 Hong Kong 19 South Africa 19 Japan 20 Bhutan 20 Singapore
To give an idea of volume, the graph below shows the total Telnet brute force scans observed over
the past 30 days from the top 20 countries. China is conducting more brute for scans then the
other top 19 combined.
Figure 10: Top 20 Countries hunting for IoT devices with Telnet brute force scans - last 30 days

F 5 . C O M / L A B S 16
F5 LABS THREAT ANALYSIS REPORT DDoS’s Latest Minions: IoT Devices
Telnet and SSH attacks by ASN ASNs participating in Telnet and SSH brute force attacks vary day by day. 92 ASNs comprise the
2.1+ million Telnet brute force scans conducted in the past 30 days referenced in Figure 10 above.
Four of them are China telecom, backbone, and peering providers and make up for 57% of the
total.
Figure 11: Total ASNs launching telnet & SSH brute force attacks
Separating out ASNs participating in Telnet versus SSH attacks, we’re seeing a steady use of
ASNs in the SSH attacks indicating the threat actors are consistent.
F 5 . C O M / L A B S 17
F5 LABS THREAT ANALYSIS REPORT DDoS’s Latest Minions: IoT Devices
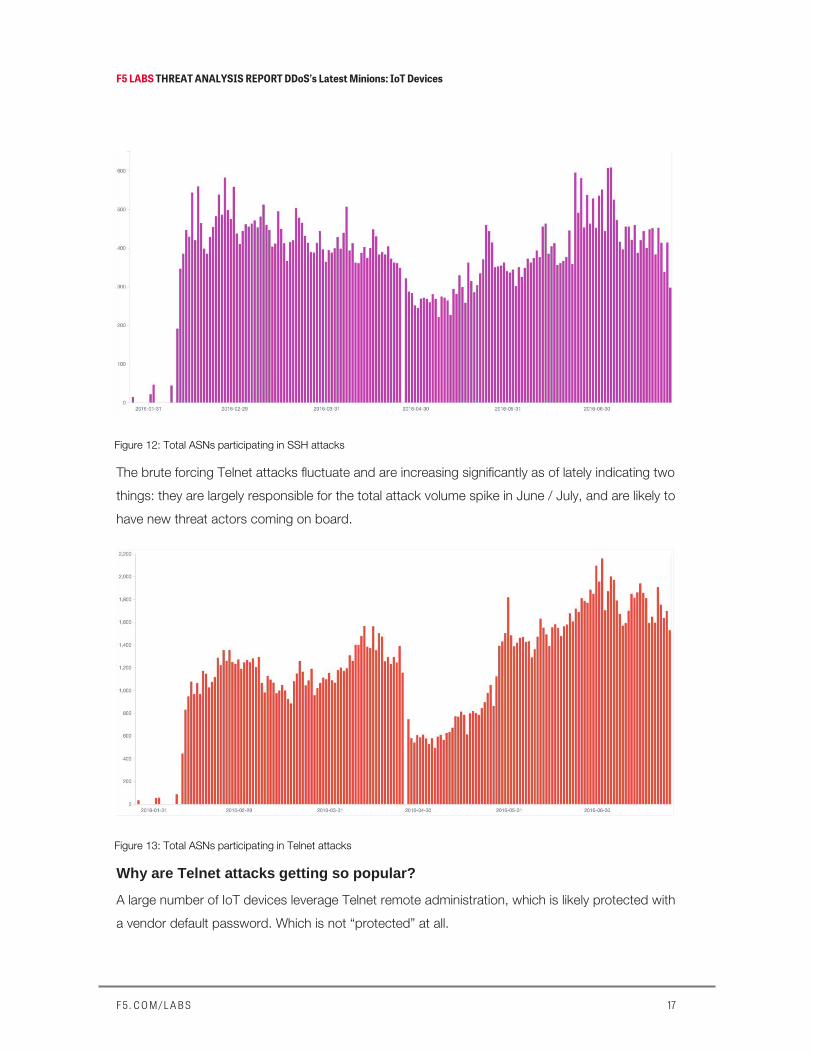
Figure 12: Total ASNs participating in SSH attacks
The brute forcing Telnet attacks fluctuate and are increasing significantly as of lately indicating two
things: they are largely responsible for the total attack volume spike in June / July, and are likely to
have new threat actors coming on board.
Figure 13: Total ASNs participating in Telnet attacks
Why are Telnet attacks getting so popular?
A large number of IoT devices leverage Telnet remote administration, which is likely protected with
a vendor default password. Which is not “protected” at all.
F 5 . C O M / L A B S 18
F5 LABS THREAT ANALYSIS REPORT DDoS’s Latest Minions: IoT Devices
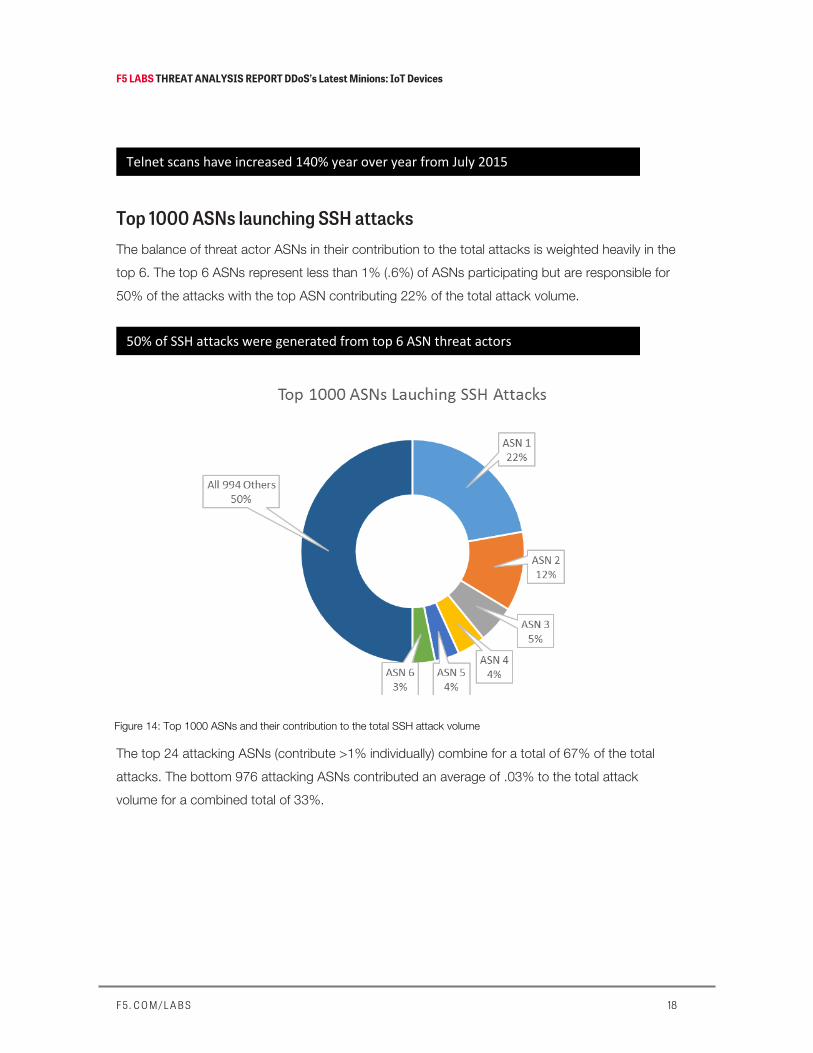
Top 1000 ASNs launching SSH attacks The balance of threat actor ASNs in their contribution to the total attacks is weighted heavily in the
top 6. The top 6 ASNs represent less than 1% (.6%) of ASNs participating but are responsible for
50% of the attacks with the top ASN contributing 22% of the total attack volume.
Figure 14: Top 1000 ASNs and their contribution to the total SSH attack volume
The top 24 attacking ASNs (contribute >1% individually) combine for a total of 67% of the total
attacks. The bottom 976 attacking ASNs contributed an average of .03% to the total attack
volume for a combined total of 33%.
Telnet scans have increased 140% year over year from July 2015
50% of SSH attacks were generated from top 6 ASN threat actors

F 5 . C O M / L A B S 19
F5 LABS THREAT ANALYSIS REPORT DDoS’s Latest Minions: IoT Devices
Figure 15: Top 24 ASNs contributing more than 1% of the total SSH attack volume
Top 1000 ASNs launching Telnet attacks An analysis of the Top 1000 ASNs participating in Telnet attacks netted some very interesting
results. Contribution to the total attack number is very evenly spaced throughout the 1000 ASNs
with 968 of them producing less than a half of 1% each to the total. The average contribution per
ASN is .10% and the top threat actor only contributed to 8% of the total attacks.
50% of Telnet attacks were generated from top 13 ASN threat actors

F 5 . C O M / L A B S 20
F5 LABS THREAT ANALYSIS REPORT DDoS’s Latest Minions: IoT Devices
Figure 16: Top 1000 ASNs and their contribution to the total Telnet attack volume
The top 32 attacking ASNs (contribute >1% individually) combine for a total of 66% of the total
attacks. The bottom 968 attacking ASNs contributed an average of .035% to the total attack
volume for a combined total of 34%.
Figure 17: Top 32 ASNs contributing more than 1% of the total Telnet attack volume

F 5 . C O M / L A B S 21
F5 LABS THREAT ANALYSIS REPORT DDoS’s Latest Minions: IoT Devices
The scatter chart shown in Figure 18 is a great representation of the current scanning going on,
which is the precursor to botnet creation.
Figure 18: Telnet attacks in relation to the attacking IP, ASN, and destination IP addresses
IoT Botnets DDoSing Several outlets have reported DDoS attacks with the "lizard stresser” tool which leverages home
routers. Recent data confirms active botnets generating DDoS attacks from a new variant and
mash-up of older tools refactored for infecting additional architectures such as x86_64, MIPS,
ARM.
F 5 . C O M / L A B S 22
F5 LABS THREAT ANALYSIS REPORT DDoS’s Latest Minions: IoT Devices
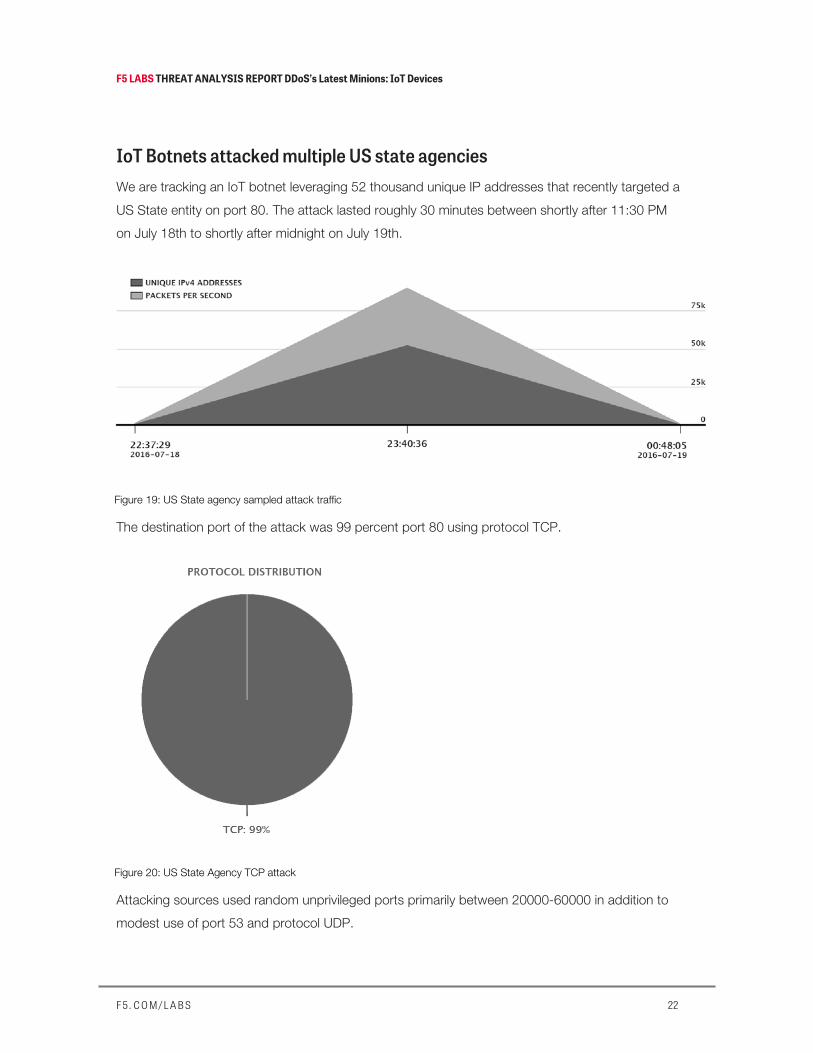
IoT Botnets attacked multiple US state agencies We are tracking an IoT botnet leveraging 52 thousand unique IP addresses that recently targeted a
US State entity on port 80. The attack lasted roughly 30 minutes between shortly after 11:30 PM
on July 18th to shortly after midnight on July 19th.
Figure 19: US State agency sampled attack traffic
The destination port of the attack was 99 percent port 80 using protocol TCP.
Figure 20: US State Agency TCP attack
Attacking sources used random unprivileged ports primarily between 20000-60000 in addition to
modest use of port 53 and protocol UDP.

F 5 . C O M / L A B S 23
F5 LABS THREAT ANALYSIS REPORT DDoS’s Latest Minions: IoT Devices
Figure 21: Source ports of the attack

F 5 . C O M / L A B S 24
F5 LABS THREAT ANALYSIS REPORT DDoS’s Latest Minions: IoT Devices
Figure 22: Attack byte distribution breakdown
We witnessed a similar SYN flood attack targeting port 80 on another US government target that
was 2.3 Gbps logged that we cannot provide more details on.
How much can one device do?
In the graph below, you’ll see that each infected IoT device is contributing only 0.1 percent to the
total attack. What’s interesting and frankly, scary, about IoT devices is the virtually unlimited
number available for compromise and the damage they can do as a collective whole, once they’ve
joined a botnet. When you can get hundreds of thousands of small devices participating in a
botnet, none of them need to have 100 Mbps capacity on their own.

F 5 . C O M / L A B S 25
F5 LABS THREAT ANALYSIS REPORT DDoS’s Latest Minions: IoT Devices
Source Port Protocol Percent
58979 TCP 0.1%
54644 TCP 0.1%
44727 TCP 0.0%
5255 TCP 0.1%
53 TCP 0.1%
Figure 23: IoT DDoS attack: top source port
Destination Port Protocol Percent
80 TCP 99.9%
1785 UDP 0%
19603 UDP 0%
33337 UDP 0%
Figure 24: IoT DDoS Attack —top destination port
Android botnet DDoS attack Another attack witnessed against the US State Agency’s IP space came from an Android phone
botnet. In this attack, each infected device does not contribute more than 0.1% to the total attack.

F 5 . C O M / L A B S 26
F5 LABS THREAT ANALYSIS REPORT DDoS’s Latest Minions: IoT Devices
Source Port Protocol Percent
39989 TCP 0.0%
37880 TCP 0.0%
28111 TCP 0.0%
31115 TCP 0.0%
46034 TCP 0.0%
Figure 25: Mobile botnet DDoS attack: top source port
Destination Port Protocol Percent
80 TCP 99.9%
1785 UDP 0%
19603 UDP 0%
33337 UDP 0%
Figure 26: Mobile botnet DDoS attack: top destination port

F 5 . C O M / L A B S 27
F5 LABS THREAT ANALYSIS REPORT DDoS’s Latest Minions: IoT Devices
The Android botnet is all TCP traffic.
Figure 27: Andriod botnet all TCP traffic

F 5 . C O M / L A B S 28
F5 LABS THREAT ANALYSIS REPORT DDoS’s Latest Minions: IoT Devices
IoT DDoS Attacks Increasing The DDoS attacks we are monitoring from IoT botnets have been steadily increasing with spikes on
July 6th and 12th of this year.
Figure 28: DDoS attacks per day by IoT botnets
Where are the C & Cs? China, China, China We can’t share with you the specific details, but what we can say is that 90 percent of IoT bots we
are tracking that are launching DDoS attacks are in China, 10 percent in the US. The C&C server
ASNs also correlate with the ASNs we found brute force attacking looking for more vulnerable
devices.
TCP Attack Abuse Warnings! What’s most interesting in the attacks we are observing is that 70% of the packets are not
originating from a spoofed source address as many of the originating networks (the networks the
IoT devices reside on) are following BCP-38 and, due to the attack vectors, are relying on TCP
instead of UDP.
As a result, our partner Loryka sends an average of 30,000 MARF (“Abuse Reporting Format”)
messages daily!

F 5 . C O M / L A B S 29
F5 LABS THREAT ANALYSIS REPORT DDoS’s Latest Minions: IoT Devices
Conclusion The blessing and curse of IoT devices is that they are stateless
devices that reboot under stress, which means they have
limited capacity for launching attacks, but once recycled, they
get re-infected and leveraged all over again. We proved you
don’t need a lot of bandwidth per device when you can
leverage so many devices at once. But it’s becoming
abundantly clear that these devices have seemingly endless
attack potential, given their vast quantity and vulnerability
state, and should be taken very seriously by the global
Internet.
It’s also clear that threat actors are targeting IoT devices
around the world with increasing frequency and evolving their
toolsets as new devices are released. We are already seeing
the results of their continued efforts to compromise IoT
devices and continue the trend that nearly everything
connected to the Internet can be exploited.
So, what’s next? These devices will continue to get exploited
and used as weapons to attack individuals and businesses
until they are properly dealt with by their manufacturers.
The idea that individuals must protect themselves and every network is responsible for mitigating
their own attacks won’t scale in the IoT. The bad guys will win if we don’t start from within and
remediate basic access control vulnerabilities within each IoT device.
Until manufacturers become good “netizens,” companies must update their detection mechanisms
for IoT DDoS attacks since their behavior patterns are different (that is, they have lots of smaller,
not typically monitored packet sizes). On the flip side, counter measures are just like those for any
other DDoS attack, so at least organizations can mitigate the attacks once identified—assuming
they have appropriate DDoS mitigation devices in place or a service provider to help.
What does the future look like?
How many IoT devices have
management ports online
protected by vendor default
passwords?
• Delivery driver scanners
• Transportation cards
• Barcode scanners
• Elevators
• Your Raspberry Pi developer kit
Think of everything around us
that’s online.

F5 LABS THREAT ANALYSIS REPORT DDoS’s Latest Minions: IoT Devices
F 5 . C O M / L A B S 30
F5 Networks, Inc. | f5.com
US Headquarters: 401 Elliott Ave W, Seattle, WA 98119 | 888-882-4447 // Americas: [email protected] // Asia-Pacific: [email protected] // Europe/Middle East/Africa: [email protected] // Japan: [email protected]
©2016 F5 Networks, Inc. All rights reserved. F5, F5 Networks, and the F5 logo are trademarks of F5 Networks, Inc. in the U.S. and in certain other countries. Other F5 trademarks are identified at f5.com. Any other products, services, or company names referenced herein may be trademarks of the irrespective owners with no endorsement or affiliation, expressed or implied, claimed by F5.
ABOUT F5 LABS F5 Labs combines the threat intelligence data we collect with the expertise of our security researchers to provide actionable, global intelligence on current cyber threats—and to identify future trends. We look at everything from threat actors, to the nature and source of attacks, to post-attack analysis of significant incidents to create a comprehensive view of the threat landscape. From the newest malware variants to zero-day exploits and attack trends, F5 Labs is where you’ll find the latest insights from F5’s threat intelligence team.
ABOUT LORYKA Loryka is a team of dedicated researchers that monitor and investigate emerging attacks, advanced persistent threats, and the organizations and individuals responsible. The team also develops research tools to identify, investigate, and track ongoing attacks and emerging threats.
For more information, visit: https://loryka.com