Though the South Jersey region generally has population ... Regional Transpo rtation Plan...
74
South Jersey Transportation Planning Organization 782 South Brewster Road, Unit B6 Vineland, New Jersey 08361 2016 UPDATE TO THE REGIONAL TRANSPORTATION PLAN WWW.SJTPO.ORG FINAL JULY 25, 2016 Contents: G.1. SJTPO 2040 RTP Performance Report G.2. Transportation Matters Performance Report--2016 Update
Transcript of Though the South Jersey region generally has population ... Regional Transpo rtation Plan...

South Jersey Transportation
Planning Organization
782 South Brewster Road, Unit B6 Vineland, New Jersey 08361 2016 UPDATE TO THE REGIONAL TRANSPORTATION PLAN
WWW.SJTPO.ORG
FINAL JULY 25, 2016
Contents: G.1. SJTPO 2040 RTP Performance Report G.2. Transportation Matters Performance Report--2016 Update

[This page is intentionally left blank]
South Jersey Transportation
Planning Organization
782 South Brewster Road, Unit B6 Vineland, New Jersey 08361 2016 UPDATE TO THE REGIONAL TRANSPORTATION PLAN
WWW.SJTPO.ORG
FINAL JULY 25, 2016

[This page is intentionally left blank]

FINAL 7/3/2015
www.sjtpo.org

2040 Regional Transportation Plan Performance Report 2
Contents Contents ............................................................................................................................................2
How are we doing? ............................................................................................................................3
Indicator 1.1: Is the region making progress in increasing bicycle lanes and paths? ........................................... 8 Performance Measure .......................................................................................................................................... 9
Indicator 1.2: Is transit ridership increasing? ..................................................................................................... 11 Transit Accessibility ............................................................................................................................................. 13
Indicator 1.3: Is the region making progress in increasing goods movement? .................................................. 18
Goal 2: Support the Regional Economy ......................................................................................... 20
Indicator 2.1: Are TIP projects Benefiting Employment and Retail Centers? ..................................................... 20
Goal 3: Improve Transportation Safety ......................................................................................... 24
Indicator 3.1: Are traffic fatalities and serious injuries decreasing? .................................................................. 24 Transportation Safety ......................................................................................................................................... 24 Trends within the Region .................................................................................................................................... 24 Comparison with other Areas ............................................................................................................................. 24 Transportation Safety Performance .................................................................................................................... 25
Goal 4: Improve Emergency Evacuation .................................................................................... 28
Indicator 4.1: Are SJTPO’s evacuation routes in good condition? ...................................................................... 28
Goal 5: Mitigate Traffic Congestion ............................................................................................... 31
Indicator 5.1: Are we driving less? ..................................................................................................................... 31 Indicator 5.2: Are there fewer vehicle-hours of delay? ...................................................................................... 32
Goal 6: Protect and Enhance the Environment .............................................................................. 35
Indicator 6.1: Has air quality improved? ............................................................................................................ 35 Indicator 6.2: What is the region’s carbon footprint? ........................................................................................ 38
Goal 7: Enhance the Integration and Connectivity of the Transportation System ............................ 42
Indicator 7.1: Has accessibility to transit stations/bus stops improved? ........................................................... 42
Goal 8: Restore, Preserve and Maintain the Existing Transportation System .................................. 43
Indicator 8.1: What is the pavement condition of our roads? ........................................................................... 43 Indicator 8.2: What is the average sufficiency rating of our bridges? ................................................................ 45
Bridge Management System (BMS) .................................................................................................................... 45
Summary and Next Steps ................................................................................................................. 48

2040 Regional Transportation Plan Performance Report 3
How are we doing? In 2012, the South Jersey Transportation Planning Organization (SJTPO) adopted the Regional Transportation Plan 2040, a long-range blueprint that assesses existing conditions of the transportation system and identifies locations of interest for future strategies and future projects. By law, Metropolitan Planning Organizations (MPOs) that are in a non-attainment area (as SJTPO is), must update their long-range plans every four years. As the SJTPO is now at the mid-point of a four-year planning cycle, this mid-planning cycle report card assesses our progress in reaching the goals and objectives of the 2040 RTP and sets the foundation for the next long-range plan update, in 2016. In other words, what is the performance of the transportation system with respect to the vision laid out in RTP 2040? This performance report is also in alignment with the current federal transportation bill, Moving Ahead for Progress in the 21st Century (MAP-21), which puts a high premium on performance-based planning, and the proposed rules stemming from MAP-21 prescribe specific performance measures on which all MPOs must report for the next RTP and beyond. This report assesses performance in each of the goals from the Regional Transportation Plan 2040, using the following agreed-upon indicators. Specifically, a performance indicator is a performance measure that is used to document and monitor progress towards a particular goal. While a stand-alone performance measure is usually precise and consists of a specific quantitative metric, if the metric does not assess progress towards a particular goal or objective, it may not be very useful on its own. For example, for the goal of mitigating congestion, a widely used performance measure is vehicle-miles travelled (VMT). While the statement, “VMT has declined by 5% over the last 10 years” does denote a clear trend, it would be stronger to say, “The region is meeting its goal of mitigating congestion, as indicated by the 5% decline in VMT over the last 10 years.” The goals contained in the SJTPO’s 2040 RTP and the associated indicators are listed in Table 1. This report makes the use of a dial to indicate whether performance under a particular measure is trending in a positive direction, neutral, or in a negative direction. Determining the direction of the arrow on the dial (i.e., whether the region is making progress towards a particular goal), is based on looking at past trend data. If overall there has been positive movement towards the attainment of a particular goal (e.g., the air is getting cleaner), the dial is pointed towards the “green” part, or in positive territory. If a negative trend is depicted, (e.g., the number of traffic fatalities are increasing, (which they are not, but this is listed as an example)), the arrow would be pointed in the “red” part, or in negative territory. If the trend is neither positive nor negative, the arrow is pointing straight up. For some of these measures, there is just not enough data to establish a trend, and the information being collected will serve as a baseline for future performance reporting. In these cases, no arrow is depicted.

2040 Regional Transportation Plan Performance Report 4
Table 1: 2040 RTP Performance Report: Goals and Indicators
Goal 1: Promote transportation choices for the movement of people and goods Indicator 1.1: Is the region making progress in increasing bicycle lanes and paths?
Status: Yes In the SJTPO region as a whole, 43.2 miles of existing bikeways have been implemented or identified as existing since 2005, a 27% increase.
Indicator 1.2: Is transit ridership increasing?
Status: No, but has remained steady Due to the Great Recession and overall tepid economic growth since then, transit ridership has leveled off in recent years. SJTPO will continue to support policies that promote transportation choices, which include transit.
Indicator 1.3: Is the region making progress in increasing goods movement?
Status: Not Enough Information The information compiled will serve as a baseline for future comparison.
Goal 2: Support the Regional Economy Indicator 2.1: Are TIP projects benefiting Employment and Retail Centers?
Status: Yes 16 projects from FY 2014-2023 TIP (almost 46.6% of total Federal funds allocated to the SJTPO Region) intersect Employment and Retail Centers.
Goal 3: Improve Transportation Safety Indicator 3.1: Are traffic fatalities and serious injuries decreasing?
Status: Yes Between 2007 and 2012, vehicle fatalities in the SJTPO region declined by 29.6%, while serious injuries declined by 37.9%.
Goal 4: Improve Emergency Evacuation Indicator 4.1: Are SJTPO’s evacuation routes in good condition?
Status: They are in “adequate” condition Based on the Pavement Condiction Index (PCI) ratings, most of the evacuation routes in the SJTPO region are in at least “Fair” Condition.

2040 Regional Transportation Plan Performance Report 5
Goal 5: Mitigate traffic congestion Indicator 5.1: Are we driving less?
Status: No Overall VMT has remained steady during the 5-year period from 2008 to 2012.
Indicator 5.2: Are there fewer vehicle-hours of delay?
Status: New data source; baseline established There is not enough historical data to determine progress towards this goal. This will serve as baseline data for future comparison.
Goal 6: Protect and Enhance the Environment Indicator 6.1: Has air quality improved?
Status: Yes The design values for the two monitors located in the SJTPO region show that the region has experienced just one violation of the 2008 8-hour ozone standard (at the Brigantine monitor in 2012). As such, while the state as a whole is exceeding the 2008 8-hour ozone standards, the SJTPO region is showing a positive trend.
Indicator 6.2: What is the region’s carbon footprint?
Status: Not Enough Information In 2010, the SJTPO region’s carbon footprint was 9.94 million metric tons of CO2-equivalents. Its emissions per capita were 13.84 metric tons of CO2-equivalents. As this is the first year this type of data has been collected, this will serve as baseline data for future comparison.
Goal 7: Enhance the Integration and Connectivity of the Transportation System Indicator 7.1: Has accessibility to transit stations/bus stops improved?
Status: Not Enough Information The information compiled will serve as a baseline for future comparison.

2040 Regional Transportation Plan Performance Report 6
Goal 8: Restore, Preserve and Maintain the Existing Transportation System Indicator 8.1: What is the pavement condition of our roads?
Status: Not Enough Information While the most recent Asset Management System (AMS) inventory shows that almost 46% of the toal roadway mileage within the region has a Pavement Condition Index (PCI) of either “Satisfactory” or “Excellent,” this is based on just one year’s worth of data for all but Vineland and Atlantic County and as such, progress towards a goal cannot be determined. The information compiled will serve as a baseline for future comparison.
Indicator 8.2: What is the average sufficiency rating of our bridges?
Status: Improving slightly The average Sufficiency Rating for bridges in the SJTPO region in 2014 is 82.33 (Satisfactory). The rating has increased slightly but steadily since 2008. The number of “Structurally Deficient” bridges in the region has also decreased slightly by 28%.
Given the wide range of our goals and objectives, as well as the extensive amount of assets in the region, and the data that has been and is currently being compiled assessing the performance of the system, this Performance Report only presents a slice of the entire picture. It is also important to note that MPOs have limited control over outcomes in many of these areas. Air quality is a good example of this, where mobile source emissions are just one component of the overall ambient air quality. It should also be noted that in many cases, since data for many of these assets have not been collected on a regular basis until recently, (i.e., within the past year), that only one value is provided, as opposed to multiple data points, so as to establish a trend. However, once a baseline has been established, system performance can be monitored on a regular basis, an important component of the performance-based planning process. We intend that this mid-planning cycle performance report will become a “biennial report card,” and an important element of SJTPO’s performance-based planning process. It is also possible that this list of indicators will change and that the goals of the next RTP Update will be altered, which will, in turn, alter the indicators. This RTP 2040 Progress Report represents a critical milestone, and will serve as a foundation for not only the next long-range plan, but also the planning process and future plans. With an established a baseline on which to assess progress towards regional goals, the SJTPO is in a better position to formulate additional strategies to meet its goals. This information can also be used to establish targets, a requirement under MAP-21. Figure 1 illustrates SJTPO’s Performance-Based Planning Process.

2040 Regional Transportation Plan Performance Report 7
Figure 1: SJTPO’s Performance-Based Planning Process

2040 Regional Transportation Plan Performance Report 8
Goal 1:
Promote transportation choices for the movement of people1
Indicator 1.1:
Is the region making progress in increasing bicycle lanes and paths?
and goods
Status: Yes In the SJTPO region as a whole, SJTPO’s bikeway mileage has increased by 43.2 miles, or 27%, since 2005.
In addition to their purely recreational benefits, provision of bicycle lanes and paths can encourage the use of alternate forms of transportation for work, shopping, and other trips. While they do not appreciably reduce vehicular traffic volumes, they do represent one of several transportation alternatives designed to achieve this objective. It should be noted that the provision of wide shoulders along a roadway alone is not necessarily an indicator of a user-friendly bike route. Other factors such as route length and continuity, average route traffic speed, traffic volume, and connections to desired destinations are also important and should be taken into consideration when identifying and/or designating a road segment as a bike lane. Cross County Connection (the Transportation Management Association serving South Jersey) requires that, for a road to be identified as a bike lane or route, it must have bikeway signage or road markings, or at least “share the road” signs. Another factor contributing to the high usage of bike lanes is providing the public with access to information (location, type of facility, etc.) on bike lanes and paths in their region through bikeway route brochures, web pages, and other sources. With this in mind, SJTPO counties and municipalities have been active in efforts to identify and develop on-road and off-road bicycle facilities, and propose future bike lanes and paths. Progress made includes the following:
1 The full goal, as stated in the 2040 RTP, is “Promote transportation choices for the movement of people and goods.” However, as we are only focusing on the movement of people in this report, only “people” are included.
2040 Regional Transportation Plan Performance Report 9
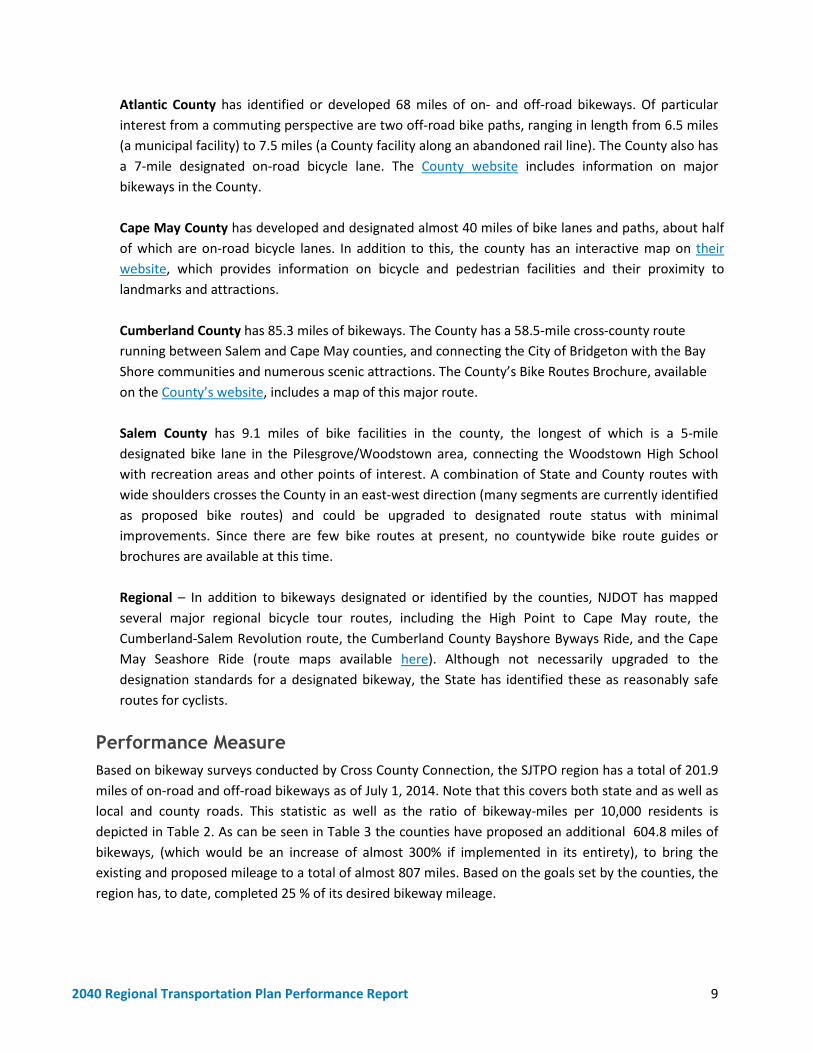
Atlantic County has identified or developed 68 miles of on- and off-road bikeways. Of particular interest from a commuting perspective are two off-road bike paths, ranging in length from 6.5 miles (a municipal facility) to 7.5 miles (a County facility along an abandoned rail line). The County also has a 7-mile designated on-road bicycle lane. The County website includes information on major bikeways in the County. Cape May County has developed and designated almost 40 miles of bike lanes and paths, about half of which are on-road bicycle lanes. In addition to this, the county has an interactive map on their website, which provides information on bicycle and pedestrian facilities and their proximity to landmarks and attractions. Cumberland County has 85.3 miles of bikeways. The County has a 58.5-mile cross-county route running between Salem and Cape May counties, and connecting the City of Bridgeton with the Bay Shore communities and numerous scenic attractions. The County’s Bike Routes Brochure, available on the County’s website, includes a map of this major route. Salem County has 9.1 miles of bike facilities in the county, the longest of which is a 5-mile designated bike lane in the Pilesgrove/Woodstown area, connecting the Woodstown High School with recreation areas and other points of interest. A combination of State and County routes with wide shoulders crosses the County in an east-west direction (many segments are currently identified as proposed bike routes) and could be upgraded to designated route status with minimal improvements. Since there are few bike routes at present, no countywide bike route guides or brochures are available at this time. Regional – In addition to bikeways designated or identified by the counties, NJDOT has mapped several major regional bicycle tour routes, including the High Point to Cape May route, the Cumberland-Salem Revolution route, the Cumberland County Bayshore Byways Ride, and the Cape May Seashore Ride (route maps available here). Although not necessarily upgraded to the designation standards for a designated bikeway, the State has identified these as reasonably safe routes for cyclists.
Performance Measure Based on bikeway surveys conducted by Cross County Connection, the SJTPO region has a total of 201.9 miles of on-road and off-road bikeways as of July 1, 2014. Note that this covers both state and as well as local and county roads. This statistic as well as the ratio of bikeway-miles per 10,000 residents is depicted in Table 2. As can be seen in Table 3 the counties have proposed an additional 604.8 miles of bikeways, (which would be an increase of almost 300% if implemented in its entirety), to bring the existing and proposed mileage to a total of almost 807 miles. Based on the goals set by the counties, the region has, to date, completed 25 % of its desired bikeway mileage.

2040 Regional Transportation Plan Performance Report 10
Table 2: Existing Bikeway-Miles per 10,000 Residents
SJTPO Counties Existing Bikeways+
2010 Residential Population Bikeways – Miles per
10,000 Residents Total Miles*
Percent Of Total
Total – 2010
Percent Of Total
Atlantic County 68.0 36% 274,549 46% 2.48 Cape May County 39.5 21% 97,265 16% 4.06 Cumberland County 85.3 39% 156,898 26% 5.44 Salem County 9.1 5% 66,083 11% 1.38 SJTPO Region 201.9 100% 594,795 100% 3.39
* Source: Cross-County Connection TMA. + On-road and off-road bikeways
Table 3: Existing and Proposed On-Road and Off-Road Bikeway-Miles per 10,000 Residents
Bikeway Mileage – SJTPO Region * 2010
SJTPO Population
Bikeways
Miles Per 10,000
Population
Percent of Total
On-Road Off-Road Total Existing 155.0 46.9 201.9
594,795 3.4 25%
Proposed 536.8 67.9 604.8 10.2 75% Total 691.8 114.8 806.7 13.56 100%
* Source: Cross-County Connection + On-road and off-road bikeways
From another perspective, if the counties’ existing and proposed bike mileage can be used as a reasonable estimate of what the region’s bikeway mileage should be, it roughly calculates to 13.6 miles of bikeways per 10,000 residents. At present, there are 3.4 bikeway miles per 10,000 residents. As depicted in Table 4, this is a higher rate than some of SJTPO’s contiguous counties. Table 4: Existing Bikeway Mileage-per 10,000 residents in Contiguous Counties
Miles of Existing Bikeways+
Population (2010) Miles of Bikeway per
10,000 residents
Camden County (2013) 72.55 513,666 1.41 Burlington County (2012) 152.75 448,731 3.40 Gloucester County (2010) 23.50 288,288 0.82 SJTPO Region (2014) 201.9 594,795 3.39
SOURCE: Cross-County Connection TMA. 2014. +On-road and Off-road bikeways
For the most part, the SJTPO counties are actively involved in providing an impressive network of bikeways in the region, and in developing the resources that inform the public as to the existence and

2040 Regional Transportation Plan Performance Report 11
location of these facilities. In general, the performance rating provided here indicates where the counties are with respect to this effort in comparison with where they want to be. Since 2005, there has been an increase of more than 43 miles of bikeways, a 27% increase since 2005, at a rate of approximately 4.8 miles per year. Hopefully, the region will, at a minimum, continue this rate of growth, if not increase it, especially given its ambitious program for proposed expansion. * NOTE: Information on existing and proposed bikeway mileage for all SJTPO counties is provided by Cross County Connection (CCC). Some counties have reported higher bikeway mileage; however, the CCC figures were used to ensure that uniform criteria were used to define bike lanes and routes. The data depicted in Tables 2, 3 and 4 above is current as of 2014.
Indicator 1.2:
Is transit ridership increasing?
Status: No Due to the Great Recession and overall tepid economic growth since then, transit ridership has leveled off in recent years. SJTPO will continue to support policies that promote transportation choices, which include transit.
NJ TRANSIT operates 23 bus routes, which together average approximately 41,000 vehicle-miles2
Figure 2
daily that service at least part of the 4-county SJTPO region. In addition, NJ TRANSIT contracts out to the Atlantic City Jitney Association to provide shuttle service to the Atlantic City casinos. , below, indicates that median weekday ridership has leveled off somewhat, while Saturday ridership is declining slightly.
2 NJ TRANSIT Data. 7/2014.

2040 Regional Transportation Plan Performance Report 12
Figure 2: Median Bus Ridership, SJTPO Region, 2009-2013
26,000
27,000
28,000
29,000
30,000
31,000
32,000
33,000
34,000
35,000
2009 2010 2011 2012 2013
Weekday Saturday
Source: NJ TRANSIT
The SJTPO region has one rail transit line—the Atlantic City Rail Line. In 2010, annual passenger miles with at least one origin or destination in the SJTPO region totaled 22.6 million.3 Figure 3 shows that total ridership on the line has increased slightly since 2006. The average weekday number of trips from July to September 2012 was 3,450, a 4.5% increase from the previous year.4 The 2012 Atlantic City Rail Passenger Survey indicates that more than 80% of boardings on a typical weekday and weekend are from stations in the DVRPC region. However, Atlantic City (in the SJTPO region) has the highest proportion of alightings (64% on a weekday, 80% on a weekend), suggesting that it remains a strong attractor of trips. This is most likely due to casino-related travel, including casino employees. The majority of trip purposes on weekdays are work trips, while the majority of trip purposes are recreational on the weekends. The 2012 Atlantic City Rail Passenger Survey also indicated that most customers gave NJ TRANSIT high marks for customer service.5
3 SJTPO Regional Greenhouse Gas Emissions Inventory. June 2014. 4 NJ TRANSIT. Quarterly Ridership Trends Analysis--First Quarter. FY 2013. November 2012. 5 NJ TRANSIT. Atlantic Rail Survey. June 2013.

2040 Regional Transportation Plan Performance Report 13
Figure 3: Total Boarding Passengers – Eastbound to Atlantic City, Average Weekday, ACRL
1,244
1,620
0
200
400
600
800
1,000
1,200
1,400
1,600
1,800
2006 2012
Sources: ACRL Passenger Survey, 2006, 2012; NJ Transit
In addition to the fixed route transit services, numerous paratransit services within the SJTPO region provide demand-responsive service. In 2014, under the Job Access Reverse Commute (JARC) program, these services carried approximately 1,000 trips per average weekday.6
Transit Accessibility Though the South Jersey region generally has population densities that are lower than in northern parts of the state, and has a large amount of rural or semi-rural territory, many of the larger towns, cities, and other population centers in the region are connected by transit service. The SJTPO region contains 2,404 bus stops7 and 4 rail transit stations. Proximity to transit facilities plays an important role in peoples’ ability to use the public transit system. In terms of distance, a generally accepted measure of transit accessibility is ¼ to ½ mile walking distance from a bus stop or train station. (This corresponds to a 5 to 15 minute walk, assumed to be a reasonable time span.8
Figures 4 through 7 depict the Year 2010 Census Blocks that intersect a ¼-mile buffer (a quarter-mile circle placed around each transit stop). Overall, there are 8,500 Census blocks, containing 311,484 people (more than 50% of the 2010 regional population) that at least intersect this buffer zone. As depicted in Figures 4 to 7, when measuring Census blocks that lie completely within this ¼-mile buffer, there are 5,259 Census Blocks containing 151,337 persons, a little more than 25% of the regional population (meaning that more than 25% of the 2010 regional population lives within ¼ mile of a transit stop).
Though many people in the region live near to transit, a lower share uses transit on a regular basis in this part of the state. This is primarily due to lower densities that characterize the region – where travel origins and destinations are more decentralized, and may be out of reach of transit, or not convenient. 6 NJ JARC Applications, 2014. May 2014. 7 As of April, 2011. 8 NJ Transit. Planning for Transit-Friendly Land Use: A Handbook for New Jersey Communities. 1994.

2040 Regional Transportation Plan Performance Report 14
NJ TRANSIT encourages transit-oriented development for communities as they plan for future growth. By concentrating development and supportive activities such as shopping and services near to transit facilities, residents are provided with travel options that rely less on driving and more on transit, walking and biking. This provides for healthier lifestyles, supports local economic development, reduces road-related costs, and supports transit expansion. Figure 4: Transit-Accessible Blocks within Atlantic County3
3SOURCE: 2010 Census Data, and 2011 Bus Stop Information from NJ TRANSIT.

2040 Regional Transportation Plan Performance Report 15
Figure 5: Transit-Accessible Blocks within Cape May County
3SOURCE: 2010 Census Data, and 2011 Bus Stop Information from NJ TRANSIT.

2040 Regional Transportation Plan Performance Report 16
Figure 6: Transit-Accessible Blocks within Cumberland County
3SOURCE: 2010 Census Data, and 2011 Bus Stop Information from NJ TRANSIT.

2040 Regional Transportation Plan Performance Report 17
Figure 7: Transit-Accessible Blocks within Salem County3
3SOURCE: 2010 Census Data, and 2011 Bus Stop Information from NJ TRANSIT.

2040 Regional Transportation Plan Performance Report 18
Indicator 1.3:
Is the region making progress in increasing goods movement?
Status: Not Enough Information The information compiled will serve as a baseline for future comparison.
Table 5 depicts total tonnage into and out of the SJTPO region. As can be seen in Table 5 below, there is a net outflow of goods from the region to other New Jersey counties. Table 6 depicts the freight flows by value. The total tonnage of approximately 65.1 million is approximately 15.1% of the total tonnage of 431.5 million9
exchanged throughout the State in 2003. In 2003, over $131.6 M worth of commodities was exchanged between the counties within the SJTPO region and outside of the region. The total value of $131.6 M represents approximately 9.5% of the total dollar value of goods exchanged throughout the State of New Jersey. There is undoubtedly a significant amount of goods movement activity generated by the SJTPO region.
Table 5: Summary of County Freight Flows by Weight Flow Type Total Tonnage Estimated Weight (Short Tons) Truck Rail Water Air Inbound 24,742,912 21,637,427 1,871,881 1,232,998 606 Outbound 32,970,889 30,461,666 602,703 1,906,061 459 Internal 7,372,101 7,351,104 20,824 173 0 Total 65,085,902 59,450,197 2,495,408 3,139,232 1,065 Source: NJDOT. 2003 TRANSEARCH Freight Profile.
9 NJDOT. 2003 TRANSEARCH Freight Profile.

2040 Regional Transportation Plan Performance Report 19
Table 6: Summary of County Freight Flows by Value
Flow Type Total Value ($ Million)
Estimated Weight (Short Tons)
Truck Rail Water Air Inbound $84,883.6 $78,634.1 $1,821.5 $4,422.2 $5.9 Outbound $41,182.7 $33,084.7 $1,579.9 $6,514.5 $3.6 Internal $5,594.1 $5,538.8 $54.8 $0.5 $0.0 Total $131,660.4 $117,257.6 $3,456.3 $10,937.1 $9.5 Source: NJDOT. 2003 TRANSEARCH Freight Profile. As data of this type is frequently expensive and difficult to obtain, it is quite old. For future reports, SJTPO will attempt to obtain more recent information with which to compare this data.

2040 Regional Transportation Plan Performance Report 20
Goal 2:
Support the Regional Economy
Indicator 2.1:
Are TIP projects Benefiting Employment and Retail Centers?
Status: Yes Sixteen projects from FY 2014-2023 TIP (almost 46.6% of total Federal funds allocated to SJTPO Region) intersect Employment and Retail Centers.
One of the 2040 RTP’s goals is “Support the Regional Economy,” and one of the main goals of New Jersey’s State Development and Redevelopment Plan (SDRP), adopted in 2001, is to “maintain and revitalize Urban Centers.” For this analysis, designated Centers of the SDRP are being used as a proxy for employment and retail centers. Encouraging and promoting growth in the Centers is also a more environmentally sustainable form of development, resulting in lower land consumption and energy consumption, as well as lower public service costs. Job and population growth is also encouraged in the Centers.10
As such, accessibility to the jobs located in these Centers would, in theory, help to improve the regional economy. To measure this indicator, SJTPO’s 2014-2023 TIP projects were overlaid onto the regional transportation network to see if they were actually impacting these centers.
As shown in Figure 8, SJTPO’s TIP investments impact many of the designated Centers (39 in total)13. Two Centers intersect TIP intersection and bridge projects, while 13 Centers intersect TIP roadway projects. Conversely, 13 TIP roadway projects and three bridge and intersection projects directly intersect Centers. In total, 28 projects, with total costs of more than $157 million over the next 10 years, will have some impact on the Designated Centers. This is a little less than 50% of total SJTPO project funds ($336.7 million programmed from FY 2014 through 2023), showing that some Federal investment is directed towards Designated Centers.
10 In the analysis, in addition to Designated Urban Centers, Designated Towns (DTs), Designated Villages (DVs), and Regional Centers (RCs) were included.

2040 Regional Transportation Plan Performance Report 21
Figure 8: Designated Centers and 2014-2023 TIP Projects
SOURCE: NJ Department of State. Office for Planning Advocacy. As can be seen by Figure 9, below, the highest number of workers is, for the most part, concentrated in Designated Centers such as Vineland and Atlantic City. This would suggest that the Centers are functioning as centers of the current economy. There are a few areas, such as Egg Harbor Township and Middle Township that do have a sizable number of workers, but are not designated as centers. Similar to number of workers, the cities with the highest number of firms are also “Designated Centers,” as depicted by Figure 10. As current employment distribution is concentrated largely within these “Centers,” the SJTPO region is making some progress in the goal of “Supporting the Regional Economy.” One strong caveat that should be noted here is that numerous factors outside the purview of the SJTPO affect the regional economy and are not discussed here.

2040 Regional Transportation Plan Performance Report 22
Figure 9: Workers by Municipality, 2007
SOURCE: NJDOL (Worker Data)

2040 Regional Transportation Plan Performance Report 23
Figure 10: Firms by Municipality, 2007
SOURCE: NJDOL (Firm Data)

2040 Regional Transportation Plan Performance Report 24
Goal 3:
Improve Transportation Safety
Indicator 3.1:
Are traffic fatalities and serious injuries decreasing?
Status: Yes Between 2007 and 2012, vehicle fatalities in the SJTPO region declined by 29.6%, while serious injuries declined by 37.9%.
Transportation Safety Transportation safety is measured using the number of traffic fatalities and serious injuries in the SJTPO region. The fatality data is from the Fatality Analysis Reporting System (FARS). The serious injury data is from the Rutgers University Plan4Safety system, which uses NJDOT traffic records. For the purposes of this report, the USDOT defines as a “fatality” any injury which results in the death of a person at the time of the motor vehicle accident, or within 30 days of the accident,11
while a “serious injury” is represented by a road user that was identified as incapacitated as a result of a crash, according to the NJDOT traffic records.
Trends within the Region Comparing figures over time provides some insight into performance compared to previous time periods. Analysis of safety trends and improvements, such as reduction in fatality and injury rates is an ongoing activity at SJTPO. SJTPO employs a multi-pronged approach as espoused by the US Department of Transportation (USDOT) of “Engineering, Enforcement, Education and Emergency Services,” (sometimes referred to as the 4 “E’s”), to reduce the number of crashes, fatalities, and injuries, including roadway safety projects, programs, and driver education. However, it is important to note that there are other factors that impact fatality and injury trends, such as vehicle safety technology, vehicle-miles travelled, weather, and driver behavior.
Comparison with other Areas Comparing SJTPO's performance to State (New Jersey) and national statistics is another monitoring method. Vehicle Miles Traveled (VMT) is factored into the statistics to make these regions more 11 At: http://www.fmcsa.dot.gov/regulations/title49/section/390.5.

2040 Regional Transportation Plan Performance Report 25
comparable.12
For example, the SJTPO region has a higher percentage of rural roads compared to the State as a whole (33% vs. 15%). SJTPO also has a higher percentage of rural VMT compared to the State as a whole (24% vs. 6%).
Transportation Safety Performance SJTPO’s Transportation System Performance is measured by the total number of fatalities and serious injuries adjusted for VMT using a five-year rolling average. This is consistent with the measure in USDOT’s proposed Safety Performance Measure Rule, as required by MAP-21. The SJTPO region experiences a relatively small number of fatalities and incapacitating injuries during any given year. Since the year-to-year changes for these figures can be high relative to their yearly total, the average for a five-year period is more relevant for identifying trends. Figure 11 displays the five-year rolling average of fatalities for the SJTPO region from 2007 through 2012. Total traffic fatalities have been decreasing throughout the region. Figure 11: SJTPO Region Fatalities (5-Year Rolling Average)
115110 109
94 8981
0
20
40
60
80
100
120
140
2007 2008 2009 2010 2011 2012
SOURCE: National Highway Traffic Safety Association (NHTSA). Fatality Analysis Reporting System (FARS) at: http://www.nhtsa.gov/FARS.
Figure 12 displays the five-year rolling average for Traffic Fatalities per 100 Million VMT for all public roads, including State, County, and Local or Municipal roads. The SJTPO region has a higher traffic fatality rate than the US and New Jersey. As with the number of traffic fatalities above, there is a trend of decreasing traffic fatalities per 100 Million VMT for the region.
12 VMT data for New Jersey is from the Highway Performance Monitoring System (HPMS), available at: http://www.state.nj.us/transportation/refdata/roadway/pdf/hpms2012/prmvmt_12.pdf. VMT data for the US is from the National Highway Safety Administration website at: (http://www-nrd.nhtsa.dot.gov/Pubs/812032.pdf)

2040 Regional Transportation Plan Performance Report 26
Figure 12: Fatalities per 100 Million Vehicle Miles Traveled (5-Year Rolling Average)
0.00
0.20
0.40
0.60
0.80
1.00
1.20
1.40
1.60
1.80
2.00
2007 2008 2009 2010 2011 2012
SJTPO Region New Jersey National
SOURCE: FARS.HPMS.NHTS.
Figure 13 displays the five-year rolling average of serious injuries in the SJTPO region. As with the number of traffic fatalities and traffic fatalities per 100 Million VMT (see above), incapacitating injuries demonstrates a decreasing trend for the years 2007 to 2012. Figure 13: SJTPO Incapacitating Injuries (5-Year Rolling Average)
SOURCE: Rutgers University, Plan4Safety, (NJDOT data)
Figure 14 displays New Jersey’s and SJTPO’s traffic-related incapacitating injuries figures with VMT taken into consideration. The state and the region each have a decreasing trend, with SJTPO rates for the five-year period higher compared to the state.

2040 Regional Transportation Plan Performance Report 27
Figure 14: Incapacitating Injuries per 100 Million Vehicle Miles Traveled (5-Year Rolling Average)
0.00
0.50
1.00
1.50
2.00
2.50
3.00
3.50
4.00
4.50
5.00
2007 2008 2009 2010 2011 2012
SJTPO Region New Jersey
SOURCE: Rutgers University, Plan4Safety, (NJDOT data)

2040 Regional Transportation Plan Performance Report 28
Goal 4:
Improve Emergency Evacuation13
Indicator 4.1:
Are SJTPO’s evacuation routes in good condition?
Status: They are in “adequate” condition Based on the Pavement Condiction Index (PCI) ratings, most of the evacuation routes in the SJTPO region are in at least “Fair” Condition.
Figure 15: Pavement Condition on Coastal Evacuation Routes on County Roads in Cape May, Cumberland, and Salem Counties
13 The actual goal in Regional Transportation Plan 2040 is: “Improve Security.”
2040 Regional Transportation Plan Performance Report 29
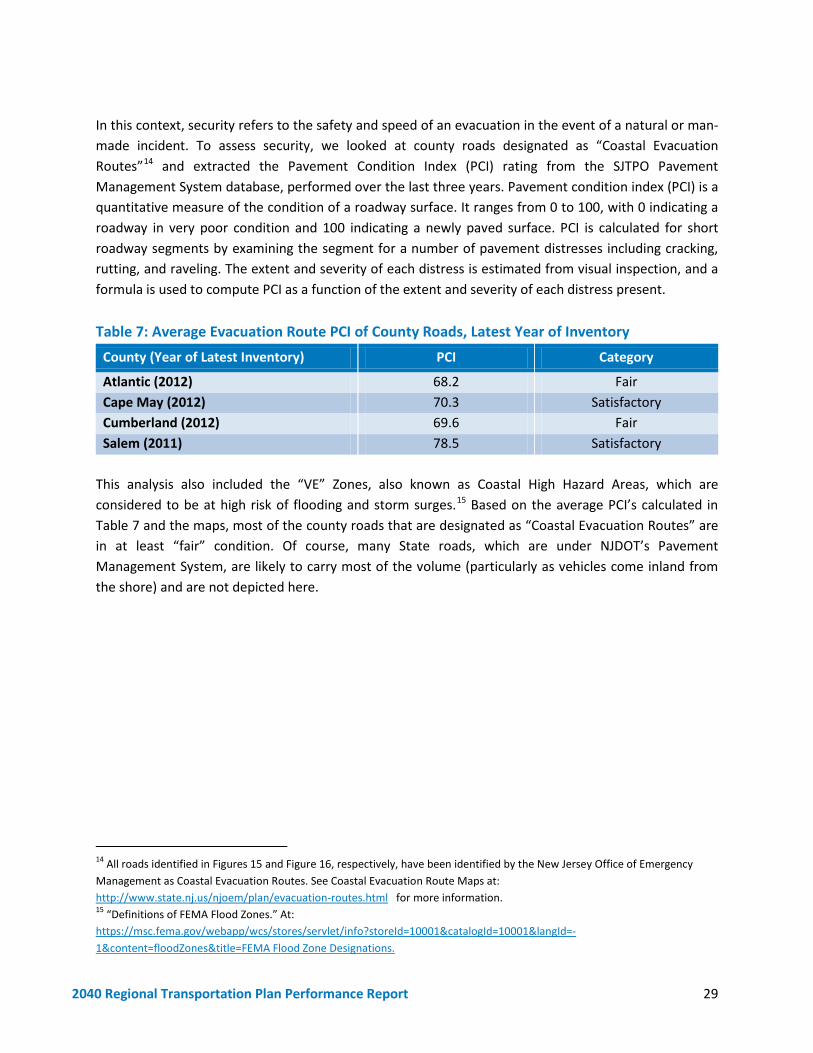
In this context, security refers to the safety and speed of an evacuation in the event of a natural or man-made incident. To assess security, we looked at county roads designated as “Coastal Evacuation Routes”14
and extracted the Pavement Condition Index (PCI) rating from the SJTPO Pavement Management System database, performed over the last three years. Pavement condition index (PCI) is a quantitative measure of the condition of a roadway surface. It ranges from 0 to 100, with 0 indicating a roadway in very poor condition and 100 indicating a newly paved surface. PCI is calculated for short roadway segments by examining the segment for a number of pavement distresses including cracking, rutting, and raveling. The extent and severity of each distress is estimated from visual inspection, and a formula is used to compute PCI as a function of the extent and severity of each distress present.
Table 7: Average Evacuation Route PCI of County Roads, Latest Year of Inventory County (Year of Latest Inventory) PCI Category
Atlantic (2012) 68.2 Fair Cape May (2012) 70.3 Satisfactory Cumberland (2012) 69.6 Fair Salem (2011) 78.5 Satisfactory
This analysis also included the “VE” Zones, also known as Coastal High Hazard Areas, which are considered to be at high risk of flooding and storm surges.15
Table Based on the average PCI’s calculated in
7 and the maps, most of the county roads that are designated as “Coastal Evacuation Routes” are in at least “fair” condition. Of course, many State roads, which are under NJDOT’s Pavement Management System, are likely to carry most of the volume (particularly as vehicles come inland from the shore) and are not depicted here.
14 All roads identified in Figures 15 and Figure 16, respectively, have been identified by the New Jersey Office of Emergency Management as Coastal Evacuation Routes. See Coastal Evacuation Route Maps at: http://www.state.nj.us/njoem/plan/evacuation-routes.html for more information. 15 “Definitions of FEMA Flood Zones.” At: https://msc.fema.gov/webapp/wcs/stores/servlet/info?storeId=10001&catalogId=10001&langId=-1&content=floodZones&title=FEMA Flood Zone Designations.

2040 Regional Transportation Plan Performance Report 30
Figure 16: Pavement Conditions on Coastal Evacuation Routes on County Roads in Atlantic County
In addition to these evacuation routes, it should also be noted that every county within the 4-county SJTPO region has their own office of emergency management with their own website, which gives residents instructions on how to prepare for an incident, such as a hurricane, and informs them of the appropriate evacuation zones.

2040 Regional Transportation Plan Performance Report 31
Goal 5:
Mitigate Traffic Congestion
Indicator 5.1:
Are we driving less?
Status: No Overall VMT has remained steady during the 5-year period from 2008 to 2012.
In recent years, the amount of travel in the SJTPO region has remained steady. During the five-year period from 2008 to 2012, vehicle travel fluctuated only slightly from the average of 5.7 billion vehicle-miles travelled (VMT) each year. This includes all roads (both State and local/county roads) within the SJTPO region. While vehicle-miles traveled (VMT) is the selected measure and a common indicator for this particular goal, it should be noted that overall VMT is a very general proxy or indicator of congestion. In addition to VMT growth being stagnant, population growth has been slow in recent years – around 1% per year for each of the SJTPO counties. While most counties saw a slight increase in vehicle travel in this period, Cape May County experienced a 14% decrease. Because much of the travel in the SJTPO region is seasonal, this may indicate fewer shore travelers. The largest growth in travel is seen in Atlantic County, which gained about 150 million vehicle miles of travel in the five-year period. Prior to 2008, travel was increasing steadily in Atlantic and Cape May counties, reaching its peak in 2006. Travel declined in 2007 and 2008, likely due to the economic downturn and rise in gas prices.

2040 Regional Transportation Plan Performance Report 32
Figure 17: Annual Vehicle-Miles Travelled (in millions) by County, 2000-2012
-
500
1,000
1,500
2,000
2,500
3,000
3,500
2000 2002 2004 2006 2008 2010 2012
Atlantic Cape May Cumberland Salem
Source: NJDOT Highway Performance Monitoring System.
As much of the travel in the SJTPO region is seasonal, and the economies of many shore communities are driven by recreational travel, higher VMT is generally considered good for the region. Higher VMT in Atlantic and Cape May counties correspond with more visitors to shore destinations. However, VMT would cause increased traffic congestion on roadway facilities operating near capacity, as well as increased vehicle emissions. At present, regional VMT is expected to remain steady in the coming years.
Indicator 5.2:
Are there fewer vehicle-hours of delay?
Status: New data source; baseline established There is not enough historical data to determine progress towards this goal. This will serve as baseline data for future comparison.
The SJTPO region is traversed by several major roadways including the Garden State Parkway, Atlantic City Expressway, New Jersey Turnpike, and I-295. In addition, many state and county routes serve important economic centers, including the shore. Congestion on these roadways may be measured using speed and travel time data obtained from the Vehicle Probe Project (VPP), an extensive archive of operations data collected from vehicles travelling along the I-95 Corridor. Managed and maintained by the I-95 Corridor Coalition in partnership with the University of Maryland, the Vehicle Probe Project collects data from connected devices in vehicles on many major roadways in the region. Most of these are state roadways, but also include county roadways. Roadways are divided into short segments, and for each segment, the average speed of vehicles on the segment is recorded in five-minute intervals.

2040 Regional Transportation Plan Performance Report 33
Coverage from the VPP extends back several years on Authority roads, but coverage was only recently obtained on most state and county roadways, and one full year of data on these roadways is not yet available. While more detailed time series data may be available for individual roadways, as this report is meant to measure the system as a whole, as opposed to individual roadways, the VPP was deemed to be the most appropriate data source. The speed and travel time data may serve as a baseline for comparison for future years as more data is recorded by the VPP. Table 8 lists the VPP estimates of total hours of vehicle delay on each roadway in 2013. Only the extent of the roadways in the SJTPO region is considered; estimates of roadway miles in each direction are listed. Table 8: Vehicle-hours of Delay on Limited Access Roadways in the SJTPO Region, 20131
Roadway County Roadway miles Estimated total vehicle-hours
of delay in 2013 Garden State Parkway Atlantic and
Cape May 49.5 111,441
Atlantic City Expressway Atlantic 27.5 64,851 New Jersey Turnpike Salem 9.5 40,344 I-295 Salem 9.5 13,146 NJ-55 Cumberland 18.5 5,339 Additional roadways All — Data available beginning July 2013;
will be tracked in the future 1Data from Vehicle Probe Project Suite. Delay is defined as additional travel time needed when travelling 10 mph or more under the free-flow speed.
Another tool provided by the Vehicle Probe Project Suite is the Bottleneck Ranking tool, used to identify bottlenecked conditions. The tool scans through speed data and identifies locations and time periods where the average speed drops below 60% of the free-flow speed for more than five minutes. The duration of the bottleneck is recorded, along with the estimated length of the queue formed by the bottleneck. Congestion in the SJTPO region is largely seasonal, with many roadways experiencing congestion on summer weekends. The Bottleneck Ranking tool was applied to all roadways in the region for the summer of 2013, from July 1st (the date for which expanded coverage began) through September 2nd (Labor Day Monday). The results were screened to remove bottlenecks with queues mostly outside the region (such as certain NJ Turnpike queues) and to remove erroneous outlier data. Bottlenecked roadways were then ranked based on the Bottleneck Impact Factor. Impact factor is computed as the product of the average bottleneck duration (in minutes), average queue length (in miles), and number of bottleneck occurrences.

2040 Regional Transportation Plan Performance Report 34
Figure 18: Top 10 Bottlenecked Roads in the SJTPO Region, July 1st through September 2nd, 2013
Rank Roadway County Total Impact Factor
1 Garden State Pkwy Atlantic and Cape May 101,850 2 NJ-47/347 Cumberland and Cape May 84,870 3 Atlantic City Expy Atlantic 52,108 4 US-40/322 Atlantic 23,701 5 US-9 Atlantic and Cape May 19,610 6 New Jersey Tpke Salem 14,554 7 Wrangleboro Rd (CR-575) Atlantic 9,427 8 NJ-109 Cape May 9,257 9 Fire Rd Atlantic 8,134 10 US-40 Salem 7,651
SOURCE: VPP
Bottlenecks typically occur at locations where there is a reduction in roadway capacity or at interchanges where additional traffic enters the roadway. On the Garden State Parkway, bottlenecks were reported by the Vehicle Probe Project at the traffic signals in Cape May, the toll barrier in Atlantic County, and at the interchange with the Atlantic City Expressway. Many of these bottlenecks are currently being addressed through roadway improvements; for example, the traffic signals in Cape May are being removed and replaced with interchanges, and the Parkway is to be widened in Atlantic County. On NJ-47, bottlenecking occurs at the locations where the roadway splits into 47 and 347 (in southern Cumberland County), and at the location where the roadways merge back together (in Cape May County). On the Atlantic City Expressway, bottlenecking was observed by the Vehicle Probe Project near the construction that occurred in the summer of 2013 between the interchange with NJ-54/US-206 and the interchange with NJ-50. On seasonal roadways such as the Garden State Parkway, NJ-47, and the Atlantic City Expressway, bottlenecking is most commonly observed in the southbound and eastbound directions (toward the shore) on Friday afternoons and Saturdays and in the northbound and westbound directions (away from the shore) on Sundays. The above data from the summer of 2013 may serve as a baseline for comparison to future data, to see if bottlenecks are mitigated by roadway improvements.

2040 Regional Transportation Plan Performance Report 35
Goal 6:
Protect and Enhance the Environment
Indicator 6.1:
Has air quality improved?
Status: Yes The design values for the two monitors located in the SJTPO region show that the region has experienced just one violation of the 2008 8-hour ozone standard (at the Brigantine monitor in 2012). As such, while the state as a whole is exceeding the 2008 8-hour ozone standards, the SJTPO region is showing a positive trend.
New Jersey Department of Environmental Protection (NJDEP) monitors ambient air quality levels throughout the state with specialized air quality monitors. There are two monitoring sites located within the SJTPO region; in Brigantine, Atlantic County and Millville, Cumberland County. Currently, the SJTPO is in nonattainment for Ozone, which is one of six criteria air pollutants identified by the EPA. These pollutants can injure health, harm the environment, and cause property damage. The EPA calls these pollutants criteria air pollutants because the agency has developed health-based criteria (science-based guidelines) as the basis for setting permissible levels in the air we breathe. The EPA establishes National Ambient Air Quality Standards (NAAQS), which apply to the concentration of a pollutant in the outdoor air, for each of the criteria pollutants. If the air quality in a geographic area does not meet the national standard, it is called a nonattainment area.16
Ground-level ozone is created when nitrogen oxides (NOx) and volatile organic compounds (VOC’s) react in the presence of sunlight. NOx is primarily emitted by motor vehicles, power plants, and other sources of combustion, while VOC’s are emitted from sources such as motor vehicles, chemical plants, factories, consumer and commercial products, and even trees.17
The current 8-hour ozone standard, promulgated in 2008, is 0.075 parts per million (ppm), or 75 parts per billion (ppb). The original 8-hour ozone standard, promulgated in 1997, was 0.08 ppm, or 80 ppb, but was revoked in 2012.
The best way to determine if an area is meeting the NAAQS is to measure the design value of an area. For a concentration-based standard such as ozone, the air quality design value for a site is defined as the standard-related test statistic that is used to determine whether an area is meeting the standard. The 16 http://www.epa.gov/pmdesignations/faq.htm#4. Accessed 9/9/14. 17 NJDEP. 2012 Ozone Summary. At: www.njaqinow.net.

2040 Regional Transportation Plan Performance Report 36
design value is the 3-year average of the annual fourth-highest daily maximum 8-hour average ozone concentration at each monitor. The highest design value at a particular site is taken as the overall “design value” for the region. The overall design value for the region is depicted in Figure 19. For example, for 2009, the design value of 83 is the maximum of the three-year averages of the fourth-highest maximum 8-hour ozone concentrations from 2007 to 2009. Similarly, for 2010, the design value of 81 is the maximum of the three-year averages of the fourth-highest maximum 8-hour ozone concentrations taken from 2008 to 2010. The design values in each subsequent year are averaged over that year as well as the two preceding years. As can be seen by Figure 19 the overall design value for New Jersey has exceeded both the current 2008 8-hour ozone standard (75 ppb) for all 5 years, from 2009 to 2013. Table 9 contains the actual design values for the State of New Jersey, from 2009 to 2013. However, the design values for the two monitors located in the SJTPO region show that the region has experienced just one violation of the 2008 8-hour ozone standard (at the Brigantine monitor in 2012). As such, while the state as a whole is exceeding the 2008 8-hour ozone standards, the SJTPO region is showing a positive trend. Figure 19: 8-Hour Ozone Design Values (Preliminary), 2009-2013, State of New Jersey
50
55
60
65
70
75
80
85
90
2009 2010 2011 2012 2013
Desi
gn V
alue
(ppb
)
New Jersey Standard (2008)
Millville Brigantine
Table 9: 8-Hour Ozone Design Values (Preliminary), 2009-2013, State of New Jersey
Year 2009 2010 2011 2012 2013
3-Year Span 2007-2009 2008-2010 2009-2011 2010-2012 2011-2013 Design Value (ppb) 83 81 82 87 84
SOURCE: NJ DEP, 6/2014.
Figure 20 depicts the historic and current trend of mobile source emissions in the SJTPO region since 2005. Since the SJTPO region lies within the 8-hour ozone nonattainment area, it is required to show that its future plans and projects conform to NAAQS, by modeling expected mobile source generated VOC and NOx emissions (the two ozone precursors), and ensuring they fall at or below the mobile

2040 Regional Transportation Plan Performance Report 37
source emissions budgets, depicted in Figure 20 via the dashed lines. While air quality conformity is primarily oriented towards modeling the impact of the future transportation system on air quality emission levels, baseline data, (which precede the forecast years and in most cases are based on a past year), are frequently run as part of the modeling process. As such, Figure 20 depicts the baseline years from a series of past conformity runs. Figure 20 shows a gradual decrease in VOC from 2005 to 2015. NOx has decreased significantly from 2005 to 2010, but has started to increase from 2010 to 2015 although it is still substantially below the emissions budget of 29.64 tpd. Nevertheless, even though past regional emissions analyses are showing increases in NOx levels; as a whole, as can be seen by Figure 19, ambient concentration of 8-hour ozone levels are decreasing, leading to the overall positive rating in air quality. Figure 20: VOC and NOx Mobile Source Emissions in tons per day (tpd), SJTPO Region, 2005-2015*
35.08 35.54
17.65
21.5221.85
14.77
11.77
6.43
0
5
10
15
20
25
30
35
40
2005 2007 2010 2015
NOx VOC
NOx Budget VOC Budget
29.64
13.03
*2015 is projected SOURCE: SJTPO. FY 2006, 2013, and 2014 Air Quality Conformity Runs. Selected conformity analysis years based on conformity regulation rule-§93.106 and vetted by Interagency Consultation Group. Not every year is an analysis year.

2040 Regional Transportation Plan Performance Report 38
Indicator 6.2:
What is the region’s carbon footprint?
Status: Not Enough Information In 2010, the SJTPO region’s carbon footprint was 9.94 million metric tons of CO2-equivalents. Its emissions per capita were 13.84 metric tons of CO2-equivalents. As this is the first year this type of data has been collected, this will serve as baseline data for future comparison.
Figure 21: SJTPO Gross Greenhouse Gas (GHG) Emissions by Sector, 2010
*Industrial Process and Fossil Fuel SOURCE: SJTPO Region Greenhouse Gas Emissions Inventory—Final Report. June 2014.
In 2014, SJTPO completed a Regional Greenhouse Gas (GHG) Emissions Inventory, which will serve as a basis for formulating and evaluating GHG reduction policies and action plans at the regional, county, and municipal levels. This region-wide GHG inventory will serve as the first part of larger, long-range climate initiative at the SJTPO, which will include a forecast of the inventory and may include regional mitigation and adaptation plans, as well as creation of a framework for incorporating climate impacts into the evaluation criteria for program and project selection and prioritization.
45.5%
7.7%
1.9% 0.7%
15.3%
21.3%
5.0%
2.6%
44.2%
Transportation IP&FF * Waste Management Agriculture Residential Commercial Industrial Non - Road
Total SJTPO Emissions
(million metric tons CO 2 e):
9.94
RCI
2040 Regional Transportation Plan Performance Report 39
Table 10: SJTPO Gross Emissions by Sector, 2010 Greenhouse Gas Emissions By Source (2010) In million metric tons CO2e
Residential 1.52 Commercial 2.11 Industrial 0.49 Non-Road 0.26 Transportation 4.52 Industrial Processes and Fossil Fuel (IP&FF) 0.76 Agriculture 0.07 Waste Management 0.19 Land Use, Land Use Change and Forestry (LULUCF)* 0.002 Total 9.94
*Includes Non-road Engines used for forestry, and non-agricultural fertilizer application, often referred to as “settlement soils” SOURCE: SJTPO Region Greenhouse Gas Emissions Inventory, Final Summary Report, AKRF, June 2014.
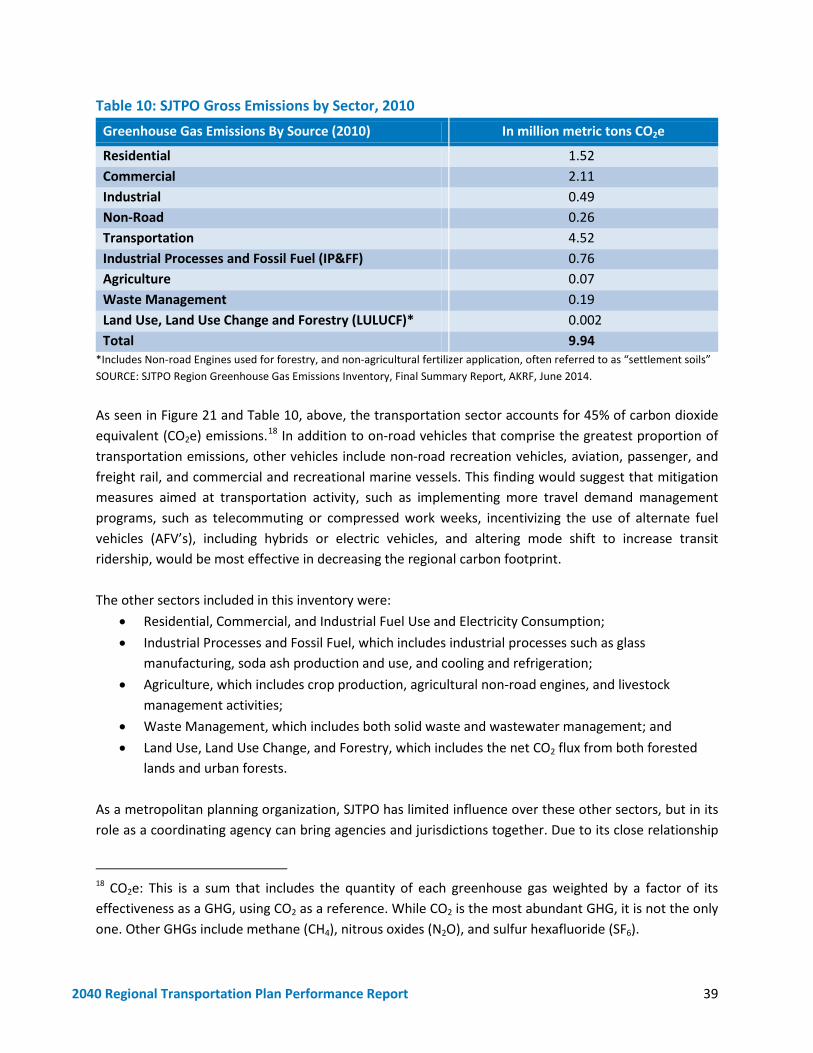
As seen in Figure 21 and Table 10, above, the transportation sector accounts for 45% of carbon dioxide equivalent (CO2e) emissions.18
In addition to on-road vehicles that comprise the greatest proportion of transportation emissions, other vehicles include non-road recreation vehicles, aviation, passenger, and freight rail, and commercial and recreational marine vessels. This finding would suggest that mitigation measures aimed at transportation activity, such as implementing more travel demand management programs, such as telecommuting or compressed work weeks, incentivizing the use of alternate fuel vehicles (AFV’s), including hybrids or electric vehicles, and altering mode shift to increase transit ridership, would be most effective in decreasing the regional carbon footprint.
The other sectors included in this inventory were: • Residential, Commercial, and Industrial Fuel Use and Electricity Consumption; • Industrial Processes and Fossil Fuel, which includes industrial processes such as glass
manufacturing, soda ash production and use, and cooling and refrigeration; • Agriculture, which includes crop production, agricultural non-road engines, and livestock
management activities; • Waste Management, which includes both solid waste and wastewater management; and • Land Use, Land Use Change, and Forestry, which includes the net CO2 flux from both forested
lands and urban forests. As a metropolitan planning organization, SJTPO has limited influence over these other sectors, but in its role as a coordinating agency can bring agencies and jurisdictions together. Due to its close relationship
18 CO2e: This is a sum that includes the quantity of each greenhouse gas weighted by a factor of its effectiveness as a GHG, using CO2 as a reference. While CO2 is the most abundant GHG, it is not the only one. Other GHGs include methane (CH4), nitrous oxides (N2O), and sulfur hexafluoride (SF6).

2040 Regional Transportation Plan Performance Report 40
with its counties, which work closely with their municipalities, SJTPO is in a position to work with these entities to formulate mitigation strategies to reduce GHG emissions. Figure 22 shows the on-road emissions in CO2e by municipality.19
Figure 22: On-Road Emissions by Municipality, 2010
Atlantic City and Vineland, two of the most populous cities in the region, accounted for the highest and second-highest amount, respectively, of on-road emissions in the SJTPO region in 2010.
Table 11, below, gives the CO2e emissions per capita of the SJTPO region, in comparison to the Delaware Valley Regional Planning Commission (DVRPC), State of New Jersey, and the USA. Interestingly enough, SJTPO’s emissions per capita are slightly higher than the State of New Jersey. This could be due to a number of reasons, although these are all speculative. Since SJTPO has a much smaller population relative to the rest of the State, the emissions burden per person is higher. Also, the high number of visitors and seasonal traffic coming into and out of the region is probably one of the reasons behind
19 These are consumption-based emissions, which consider emissions that result from the energy consumed, even if the emissions occur outside the geographic area. (These are in contrast to direct emissions, which consider the emissions occurring at the source, as in exhaust from a vehicle tailpipe.) More information on these two different types of accounting can be found in the Final Summary Report.

2040 Regional Transportation Plan Performance Report 41
transportation being the largest greenhouse gas emitting sector in the region, and on a relative basis, accounts for a higher proportion of emissions within the region than the State as a whole. As such, this too could explain the SJTPO’s region’s overall higher emissions per capita. Table 11: Emissions per Capita, 20102
Jurisdiction Emissions per capita (mtCO2e)
SJTPO Region 13.84 DVRPC3 14.40 New Jersey4 12.87 USA5 21.93
2 Inventory assuming direct-based emissions without energy-cycle emissions plus consumption-based electricity emissions 3 Provided by DVRPC via email, 7/22/14. 4 Source: NJDEP. Statewide Greenhouse Gas Emission Inventory for 2009. November 2012. 5 Source: Inventory of U.S. GHG Emissions and Sinks, 1990-2012. April 15, 2014.
As this is the first time a detailed inventory such as this has been done for the SJTPO region, this data will serve as a baseline for future comparison. However, the state as a whole has reduced its CO2 emissions by 8.5 percent between 2000 and 2011. During this same period, the entire nation saw an 8.3 percent drop in emissions20
; both of these are positive trends.
20Source: US Energy Information Administration. (EIA). At: http://www.eia.gov/environment/emissions/state/state_emissions.cfm.

2040 Regional Transportation Plan Performance Report 42
Goal 7:
Enhance the Integration and Connectivity of the Transportation System
Indicator 7.1:
Has accessibility to transit stations/bus stops improved?
Status: Not Enough Information The information compiled will serve as a baseline for future comparison.
In addition to being one of the main goals espoused in the SJTPO 2040 Regional Transportation Plan, intermodal connectivity is an important attribute of any transportation system and has a great influence on how people utilize the system. One area in which the SJTPO region has made inroads is the ability to link a bicycle portion of a trip to a transit bus. Although only about 40% of the bus lines in the SJTPO region are served by buses equipped with bike racks, the lines without bus racks have luggage compartments under the bus that will accommodate a bike. As part of the Subregional Transportation Program, Atlantic County recently conducted an inventory of the bus stops and shelters within the county. The inventory consisted of heavily traveled local commuter routes, and included stops on both county roads and state highways. Out of the 92 bus stops surveyed, 84 (91.4%) had a sidewalk connected to it.21
This would suggest good connectivity in Atlantic County, where the majority of the bus stops in the region are located.
21 Atlantic County Department of Regional Planning and Economic Development. Atlantic County Project of the Assessment of Bus Stop/Shelter Accessibility and Safety. July 2013.

2040 Regional Transportation Plan Performance Report 43
Goal 8:
Restore, Preserve and Maintain the Existing Transportation System
Indicator 8.1:
What is the pavement condition of our roads?
Status: Not Enough Information While the most recent Asset Management System (AMS) inventory shows that almost 46% of the toal roadway mileage within the region has a Pavement Condition Index (PCI) of either “Satisfactory” or “Excellent,” this is based on just one year’s worth of data for all but Vineland and Atlantic County and as such, progress towards a goal cannot be determined. The information compiled will serve as a baseline for future comparison.
The pavement constituting the region’s roads comprises a large portion of the region’s transportation infrastructure. SJTPO’s Asset Management System (AMS) includes a pavement inventory on county roads within the four-county SJTPO region, as well as municipal roads in the City of Vineland. Each pavement section has a Pavement Condition Index (PCI), which is based on the condition of the road. Using PCI, we can determine the number of road-miles that are in good condition (See Goal 4, above, for a more complete explanation of PCI). Out of the 1,749 miles of roadway in SJTPO’s Asset Management System, the average PCI for the region is 69.67, which is considered “good.” Figures 23 and 24 show the distribution of road pavement miles within the AMS across each category in the form of a pie and bar chart, respectively. Using the most recent inventory done for each county, out of the 1,749 total miles, 806 (46%) of the total AMS roadway mileage falls within the two highest categories (Satisfactory and Excellent) while 943 (54%) of the total roadway miles falls within the lowest five categories (Failed, Serious, Very Poor, Poor, and Fair).
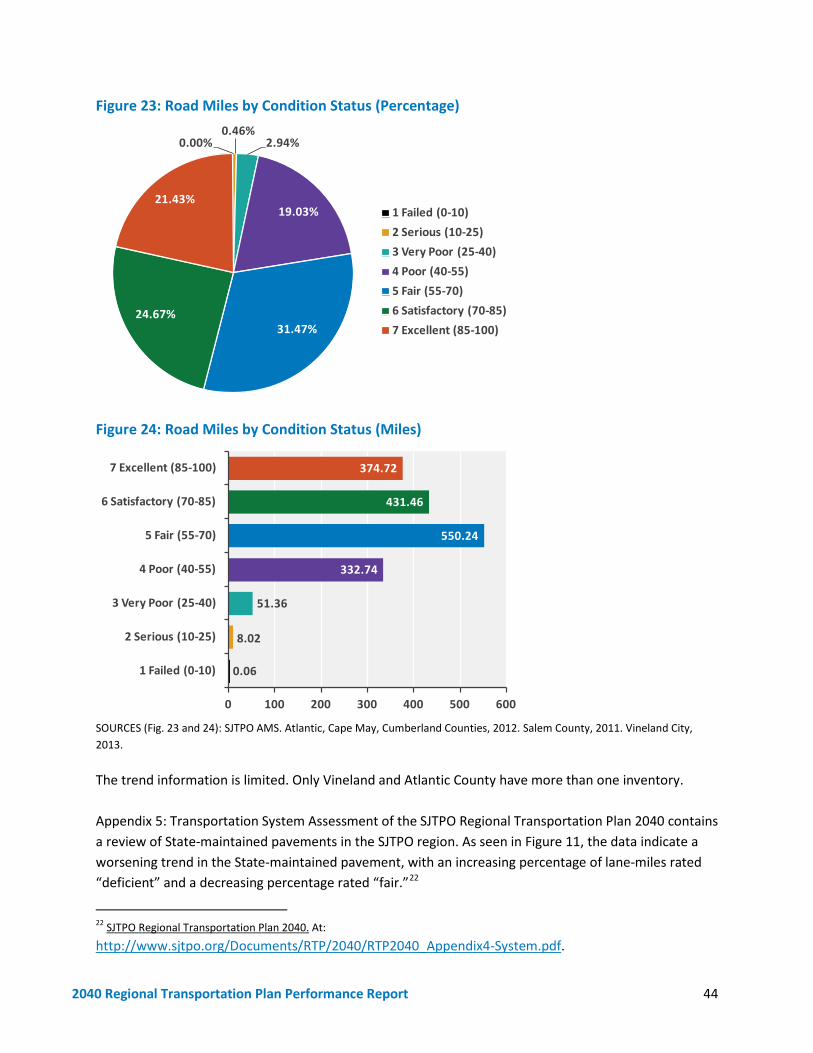
2040 Regional Transportation Plan Performance Report 44
Figure 23: Road Miles by Condition Status (Percentage)
0.00%0.46%
2.94%
19.03%
31.47%24.67%
21.43%1 Failed (0-10)2 Serious (10-25)3 Very Poor (25-40)4 Poor (40-55)5 Fair (55-70)6 Satisfactory (70-85)7 Excellent (85-100)
Figure 24: Road Miles by Condition Status (Miles)
0.06
8.02
51.36
332.74
550.24
431.46
374.72
0 100 200 300 400 500 600
1 Failed (0-10)
2 Serious (10-25)
3 Very Poor (25-40)
4 Poor (40-55)
5 Fair (55-70)
6 Satisfactory (70-85)
7 Excellent (85-100)
SOURCES (Fig. 23 and 24): SJTPO AMS. Atlantic, Cape May, Cumberland Counties, 2012. Salem County, 2011. Vineland City, 2013.
The trend information is limited. Only Vineland and Atlantic County have more than one inventory. Appendix 5: Transportation System Assessment of the SJTPO Regional Transportation Plan 2040 contains a review of State-maintained pavements in the SJTPO region. As seen in Figure 11, the data indicate a worsening trend in the State-maintained pavement, with an increasing percentage of lane-miles rated “deficient” and a decreasing percentage rated “fair.”22
22 SJTPO Regional Transportation Plan 2040. At:
http://www.sjtpo.org/Documents/RTP/2040/RTP2040_Appendix4-System.pdf.

2040 Regional Transportation Plan Performance Report 45
Indicator 8.2:
What is the average sufficiency rating of our bridges?
Status: Improving slightly The average Sufficiency Rating for bridges in the SJTPO region in 2014 is 82.33 (Satisfactory). The rating has increased slightly but steadily since 2008. The number of “Structurally Deficient” Bridges in the region has also decreased slightly by 28%.
Bridge Management System (BMS) In addition to road pavement, bridges also constitute a significant portion of the regional transportation infrastructure. Condition ratings for bridges in the SJTPO region are performed by NJDOT. Although the BMS is a statewide system, it includes all bridges at least 20 feet in length, regardless of ownership. This allows for comparable reporting at the national level. A Sufficiency Rating is generated for each bridge to summarize its structural condition. According to the “Recording and Coding Guide for the Structure Inventory and Appraisal of the Nation's Bridges (Coding Guide)”:
The sufficiency rating formula described herein is a method of evaluating highway bridge data by calculating four separate factors to obtain a numeric value, which is indicative of bridge sufficiency to remain in service. The result of this method is a percentage in which 100 percent would represent a sufficient bridge and zero percent would represent an insufficient or deficient bridge.
As can be seen from Figure 25, the average Sufficiency Rating for bridges in the SJTPO region is 81.27 (Satisfactory). The rating for the region has increased slightly but steadily since 2008. By way of comparison, the average Sufficiency Rating for the State of New Jersey is 73.7.23
23At: http://www.fhwa.dot.gov/bridge/nbi/disclaim.cfm?nbiYear=2013&nbiState=NJ13.

2040 Regional Transportation Plan Performance Report 46
Figure 25: SJTPO Bridges Average Sufficiency Rating, 2008-2012
SOURCE: NJDOT Bridge Management System. 2015.
Structural Adequacy and Functional Obsolescence are two factors that go into a Bridge’s Sufficiency Rating. Certain portions of the bridge inspection system are used to determine these commonly cited measures. Figure 26 displays data from three different reporting years: 2008, 2012, and 2014. The chart contains the number of bridges that are structurally deficient, functionally obsolete, or neither.24
24 A structurally deficient bridge, when left open to traffic, typically requires significant maintenance and repair to remain in service and eventual rehabilitation or replacement to address deficiencies. The fact that a bridge is classified under the federal definition as “structurally deficient" does not imply that it is unsafe. To remain in service, structurally deficient bridges are often posted with weight limits to restrict the gross weight of vehicles using the bridges to less than the maximum weight typically allowed by statute. A functionally obsolete bridge is one that was built to standards that are not used today. These bridges are not automatically rated as structurally deficient, nor are they inherently unsafe. Functionally obsolete bridges are those that do not have adequate lane widths, shoulder widths, or vertical clearances to serve current traffic demand, or those that may be occasionally flooded. Both definitions from: http://www.iowadot.gov/subcommittee/bridgeterms.aspx#f.

2040 Regional Transportation Plan Performance Report 47
Figure 26: SJTPO Region Bridge Status, 2008, 2012, and 2014
SOURCE: NJDOT Bridge Management System. 2014.
As can be seen in Figure 26, statistics from the NJDOT’s Bridge Management System (BMS) show that in 2014, 43 (9%) of bridges in the SJTPO region are Structurally Deficient, 57 (12%) are Functionally Obsolete, and 374 (79%) are in neither category. The Structurally Deficient category shows a slight decreasing (favorable) trend from 2008, while the Functionally Obsolete category shows a slightly increasing (unfavorable) trend.

2040 Regional Transportation Plan Performance Report 48
Summary and Next Steps SJTPO’s “RTP Performance Report” tells a number of different stories. For some of the goals, such as “Improving Safety” and “Protecting and Enhancing the Environment,” it appears that the region has made progress. For other goals, such as “Promoting Transportation Choices” or “Enhancing Connectivity, “the dial has not really moved since the 2040 RTP and more work or additional policy intervention may be necessary to “alter” the dial. Still for other goals, such as “Mitigating traffic congestion” or “Improving Evacuation Routes,” the results presented here serve more as a baseline with too few data points to determine a specific trend. In any case, these goals and indicators are meant to serve as a foundation for the upcoming 2040 Regional Transportation Plan Update, due out in 2016. It is possible that in the interim, some of these goals and indicators may change. It is also possible that some of the performance measures used in evaluating the indicators may be replaced by different indicators and measures. Because of the higher-level, 30,000-foot view assumed in this report, many details surrounding each of these measures have been omitted. It is the intent that much of these details will be filled in as part of the more detailed system-level reports that will be a part of the next Plan. At any rate, this report represents a major milestone in fulfilling the “System Monitoring, Evaluation and Reporting” requirements of the Performance-Based Planning Process, and constitutes a significant step in steering SJTPO’s planning process towards more of a performance-based process in line with the tenets of MAP-21.

South Jersey Transportation
Planning Organization
782 South Brewster Road, Unit B6 Vineland, New Jersey 08361 2016 UPDATE TO THE REGIONAL TRANSPORTATION PLAN
WWW.SJTPO.ORG
FINAL JULY 25, 2016

[This page is intentionally left blank]

APPENDIX G.2
www.sjtpo.org

Transportation Matters Performance Report-2016 Update 2
How are we doing? In 2014, the SJTPO released its 2040 Regional Transportation Plan Performance Report, a mid-year report card which assessed the region’s progress in reaching the goals and objectives of the 2040 RTP. We utilized carefully vetted and agreed-upon indicators in this process. Specifically, a performance indicator is a performance measure that is used to document and monitor progress towards a particular goal. This report is an update of that report. Where we had updated data, we updated the data contained in those indicators, and added new ones for a few goals. In keeping with SJTPO’s performance-based planning process and the critical step of continuous monitoring and measurement, we intend to release a system performance report, using these same indicators as well as new ones, on a biennial basis.
Table 1 Transportation Matters Performance Report: Goals and Indicators
Goal 1: Promote transportation choices for the movement of people and goods Indicator 1.1: Is the region making progress in increasing bicycle lanes and paths? Measure(s) 2014 2016 Update
Increase in number of bicycle lanes and paths
+43.2 miles since 2005
Data not available
Percent increase in bikeways
27% since 2005 Data not available
Status: Yes, the region is making progress through 2014, data since is incomplete. In the SJTPO region as a whole, 43.2 miles of existing bikeways have been implemented or identified as existing since 2005, a 27% increase.

Transportation Matters Performance Report-2016 Update 3
Indicator 1.2: Is transit ridership increasing? Measure(s) 2014 2016 Update
Median Transit Ridership (Bus and Rail)
Leveled off Slight decline, but increase in community shuttle ridership
Number of residents who live within short walk distance1 to transit stop
311,484, (more than 50% of 2010 regional population)
Data not available
Atlantic City Rail Line Ridership
2,700 2,550
1A population living within ¼ to ½ mile of a transit stop is considered as transit accessible. Status: Yes and No. While NJ TRANSIT bus and rail ridership has declined slightly since 2009, new community shuttle services have been initiated. Due to the Great Recession and overall tepid economic growth region-wide since then, NJ TRANSIT bus ridership has declined slightly in recent years. In addition, ridership on the Atlantic City Rail Line, part of which lies in the SJTPO region, has also been declining in recent years. However, the proximity to a transit top remains solid. In addition to these services, the CCCTMA, in partnership with the NJ TRANSIT and the South Jersey Transportation Authority, recently initiated the Route 54/40 Community Shuttle, a free deviated route service, in January 2016. It services parts of Folsom, Buena, and Buena Vista Townships, in western Atlantic County. As of 2/29/16, there have been 653 one-way trips. SJTPO will continue to support policies that promote transportation choices, which include transit. The NJ TRANSIT bus median ridership for the region for weekdays and Saturdays, for the years 2009 to 2015, respectively, is listed below:

Transportation Matters Performance Report-2016 Update 4
Figure 1.1: Median Bus Ridership, NJ TRANSIT. SJTPO Region, 2009-2015.
SOURCE: NJ TRANSIT Figure 1.2: Average Daily Ridership. Atlantic City Rail Line. 2012-2015
SOURCE: NJ TRANSIT. 2016.

Transportation Matters Performance Report-2016 Update 5
Indicator 1.3: Is the region making progress in increasing goods movement? Measure(s) 2014 2016 Update
County Freight Flows by Weight*
65 M total tons (2003)
-Data not available
County Freight Flows by Value*
$131.6 M (2003)
-Data not available
*SOURCE: NJDOT. 2003 TRANSEARCH Freight Profile. Status: Not Enough Information The information compiled will serve as a baseline for future comparison.
Goal 2: Support the Regional Economy Indicator 2.1: Are TIP projects serving Employment and Retail Centers? Measure(s) 2014 2016 Update
% Total TIP Projects that intersect EJ zones
46.6% 47.2%
Status: Yes 23 projects (out of a total of 48) from FY 2016-2025 TIP (approximately 47.2% of total Federal funds allocated to the SJTPO Region) intersect Employment and Retail Centers.

Transportation Matters Performance Report-2016 Update 6
Figure 2.1: SJTPO TIP FY2016-2025 Projects and Designated Centers
SOURCE: NJDOL (Worker data). Indicator 2.2: What is the status of our freight infrastructure—condition and performance?
Measure(s) 2014 2016 Update
Pavement Condition of Truck Routes
---- 54.6% of total Truck Route+ lane-miles are in either “Good” or “Fair” condition.
Commercial Vehicle-Hours of Delay
---- No Evaluation. Results are uneven for select individual roads (not enough history); not enough of information (road mileage, or history) about all other roads.
+ SOURCE: NJDOT Pavement Management System (PMS). Covers NJDOT-maintained roadways. Status: Not Enough Information. Delay is up on some routes from 2013 to 2015. Caveat: There was construction on select routes (NJ Turnpike, ACE, GSP) in and near our region and that may have contributed to the delay. In addition to the above, since the publication of the 2040 RTP Performance Report, SJTPO has come up with a new performance measure, the pavement condition of truck routes within the SJTPO region, using data from NJDOT’s Pavement Management System. To determine pavement condition status, NJDOT uses the performance measures of International Roughness Index (IRI) and Surface Distress

Transportation Matters Performance Report-2016 Update 7
Index, (SDI), respectively, to assess pavement conditions within their system. These metrics are combined to assign the pavement segments a specific status using the criteria in Table 1, below. To summarize the overall pavement network status, the PMS database is queried for each of the conditions below and the corresponding lane miles of each tenth mile segment are allocated to the appropriate category. The sums of the lane miles in each category are used to calculate percentages of the total network lane miles.
Pavement Condition
Table 2.1: Pavement Measures utilized by NJDOT Pavement Condition Status Deficient (Poor)
International Roughness Index (IRI): > 170 OR Surface Distress Index (SDI) ≤ 2.4
Fair Combinations between the Deficient and Good categories Good IRI < 95 AND SDI ≥ 3.5 SOURCE: NJDOT.
Table 2.2: Truck Route Road condition 2015 Truck Route Conditions Pavement Condition Lane Miles Good 200.4 Fair 357.6 Deficient 464.3 Total 1,022.3 Includes condition of state road truck routes only. SOURCE: NJDOT Pavement Management System (PMS), 2015. SJTPO has access to pavement conditions on only a portion of the truck routes in our region. NJDOT provides the data for all truck routes that are also state roads. There is a total of 1,022.3 lane miles in the SJTPO region that are NJDOT responsibility (pavement condition information is available). These include all of the interstate and State road lane-miles,1
including those that are part of the National Highway System (NHS) as well as the non-NHS. These are all included in NJDOT’s Pavement Management System. All of these state routes are also considered truck routes. In addition, parts of the Garden State Parkway (GSP) as well as the Atlantic City Expressway (ACE) are also truck routes, but they are not covered by the NJDOT PMS.
As depicted in Figure 2, below, 45% of the truck route lane-miles are in deficient condition, 35% in fair condition, and 20% of the truck lane-miles are in good condition. 1 Parts of the state system are not included as well. These include: NJ-73 (6.06 road miles in Atlantic), NJ-167 (0.62 road miles in Atlantic), and NJ-347 (8.58 road-miles in Cumberland).

Transportation Matters Performance Report-2016 Update 8
Figure 2: Condition of Truck Route Lane-Miles, 2015
SOURCE: NJDOT Pavement Management System (PMS), 2015. *This data is from NJDOT Pavement Management System. The information is for the truck route lane-miles that are on the State road system only. This includes all of the Interstate and State road lane- miles (NHS & Non-NHS).
Performance – Hours of Delay Using data from the Vehicle Probe Project, SJTPO has also come up with commercial vehicle-hours of delay. The following table presents data from the VPP system. The commercial Vehicle Hours of Delay is estimated and is dependent on the estimated proportion of commercial vehicles. Results are uneven for the select routes that are reported individually. More information on road miles is needed for other roads.

Transportation Matters Performance Report-2016 Update 9
Table 2.3: Vehicle-Hours of Delay, Commercial Vehicles
Road Counties Miles Vehicle Hours of Delay-Commercial Vehicles
2013 2014 2015 Garden State Parkway
Atlantic and Cape May 49.5 12,611 19,805 18,121
Atlantic City Expressway Atlantic 27.5 7,990 4,687 7,444 New Jersey Turnpike Salem 9.5 2,491 2,541 8,452
I-295 Salem 9.5 843 1,076 682
NJ-55 Cumberland 18.5 596 1,879 2,290
SUBTOTAL 114.5 24,531 29,988 36,989
Other Roads* All ____ 17,624 138,330 96,102
TOTAL --------- 42,155 168,318 133,091 The number of road miles with delay information available increased during 2013. SOURCE: VPP.
Goal 3: Improve Transportation Safety Indicator 3.1: Are traffic fatalities and serious injuries decreasing? Measure(s) Five-Year Average % Change
2012 2015 Fatalities 589.2 NA NA
Fatalities and Serious Injuries
2,121.0 NA NA
SOURCE: National Highway Traffic Safety Association (NHTSA). At: (http://www.fars.nhtsa.dot.gov/Main/index.aspx) Status: Not Enough Information.

Transportation Matters Performance Report-2016 Update 10
Figure 3.1: Vehicle Fatalities and Serious Injuries, 2007-2012
SOURCE: New Jersey Strategic Highway Safety Plan. www.state.nj.us/transportation/about/safety/pdf/2015strategichighwaysafetyplan.pdf
Figure 3.2 : Vehicle Fatalities and Serious Injuries, Five-Year Annual Average, 2007-2012
SOURCE: www.state.nj.us/transportation/about/safety/ (Accessed 4/5/16).

Transportation Matters Performance Report-2016 Update 11
Goal 4: Improve Emergency Evacuation Indicator 4.1: Are SJTPO’s evacuation routes in good condition? (State-maintained roads only) 2014 2016
Percent of roads in at least “fair” condition
---- 45%
Status: They are in “adequate” condition Based on the IRI and/or SDI ratings as utilized by the NJDOT PMS, most of the evacuation routes that we have data for in the SJTPO region are in at least “Fair” Condition.
Figure 4.1 2015 Condition of Evacuation Routes, Mileage and Percentage of Total*
*These include roads with condition information. Of the 1,022.3 lane-miles in the SJTPO region that are NJDOT’s responsibility, a total of 968.4 lane miles are also a part of the Evacuation Route system. SOURCE: NJDOT Pavement Management System (PMS). 2015.

Transportation Matters Performance Report-2016 Update 12
Goal 5: Mitigate traffic congestion Indicator 5.1: Are we driving less? Measure(s) 2014 2016 % Change
Daily Vehicle-Miles Traveled
(VMT) 15.68 M 15.62 M (0. 3%)
Annual Vehicle-Miles
Traveled 5.72 B 5.70 B (0. 3%)
Status: No material change in recent years. Overall regional VMT has declined slightly during the 14-year period from 2000 to 2014, although Atlantic and Cumberland counties did see some slight increases over the same period. Caveat: The economic activity for the region may have been a factor in the level of congestion over the longer-term period (2007-2012). Figure 5.1: Annual Vehicle-Miles Travelled (in millions) by County, 2000-2014
SOURCE: NJDOT Highway Performance Monitoring System.
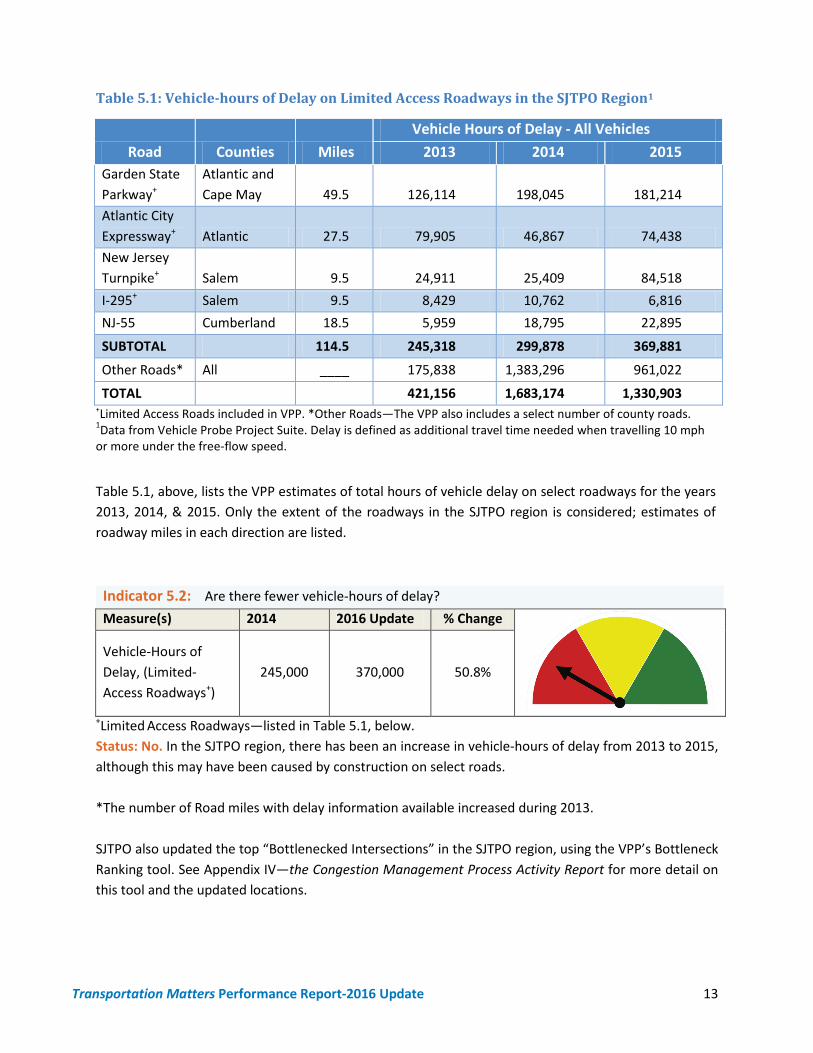
Transportation Matters Performance Report-2016 Update 13
Indicator 5.2: Are there fewer vehicle-hours of delay? Measure(s) 2014 2016 Update % Change
Vehicle-Hours of Delay, (Limited-Access Roadways+)
245,000 370,000 50.8%
+Limited Access Roadways—listed in Table 5.1, below. Status: No. In the SJTPO region, there has been an increase in vehicle-hours of delay from 2013 to 2015, although this may have been caused by construction on select roads. *The number of Road miles with delay information available increased during 2013. SJTPO also updated the top “Bottlenecked Intersections” in the SJTPO region, using the VPP’s Bottleneck Ranking tool. See Appendix IV—the Congestion Management Process Activity Report for more detail on this tool and the updated locations.
Road Counties Miles Vehicle Hours of Delay - All Vehicles
2013 2014 2015 Garden State Parkway+
Atlantic and Cape May 49.5 126,114 198,045 181,214
Atlantic City Expressway+ Atlantic 27.5 79,905 46,867 74,438 New Jersey Turnpike+ Salem 9.5 24,911 25,409 84,518 I-295+ Salem 9.5 8,429 10,762 6,816 NJ-55 Cumberland 18.5 5,959 18,795 22,895
SUBTOTAL 114.5 245,318 299,878 369,881
Other Roads* All ____ 175,838 1,383,296 961,022
TOTAL 421,156 1,683,174 1,330,903
Table 5.1: Vehicle-hours of Delay on Limited Access Roadways in the SJTPO Region1
+Limited Access Roads included in VPP. *Other Roads—The VPP also includes a select number of county roads. 1Data from Vehicle Probe Project Suite. Delay is defined as additional travel time needed when travelling 10 mph or more under the free-flow speed.
Table 5.1, above, lists the VPP estimates of total hours of vehicle delay on select roadways for the years 2013, 2014, & 2015. Only the extent of the roadways in the SJTPO region is considered; estimates of roadway miles in each direction are listed.

Transportation Matters Performance Report-2016 Update 14
Goal 6: Protect and Enhance the Environment Indicator 6.1: Has air quality improved?
Measure(s) 2014 2016 Update
% Change
8-Hour Ozone Design Values (3-Year Period of Measurement)
84 (2012-2014)
68 (2014-2016)
(13%)
Status: Yes—for ambient ozone concentrations. As depicted in Figure 6.1, below, the design values2
for the two monitors located in the SJTPO region show that the region has experienced three violations of the 2008 8-hour ozone standard, two at the Millville monitor in 2009 and 2010, and one at the Brigantine monitor in 2012. Since 2012, however, the region, along with the rest of the PA-MD-NJ-DE Ozone area, is showing a positive trend in ambient air quality concentrations of ozone. This data and overall trends are depicted in Table 4 and Figure 5, below.
Table 4: 8-Hour Ozone Design Values (Preliminary), 2009-2016, PA-NJ-MD-DE Ozone Nonattainment Area
Year 2009 2010 2011 2012 2013 2014 2015 2016
3-Year Span 2007-2009
2008-2010
2009-2011
2010-2012
2011-2013
2012-2014
2013-2015
2014-2016
Design Value (ppb)
83 81 82 87 84 77 75 68*
*Preliminary SOURCE: NJ DEP. 4/2016.
2 For a detailed description of design value, see Appendix G.1., the 2040 RTP Performance Report.

Transportation Matters Performance Report-2016 Update 15
Figure 6.1: 8-Hour Ozone Design Values (Preliminary), 2009-2016: Brigantine, Millville Monitors, Philadelphia-Wilmington-Atlantic City, PA-NJ-MD-DE Ozone Nonattainment Area
SOURCE: NJDEP.

Indicator 6.2: What is the region’s carbon footprint? Measure(s) 2014 2016 Update % Change
Emissions of CO2-equivalents (millions of metric tons)
9.94 NA ---
In 2010, the SJTPO region’s carbon footprint was 9.94 million metric tons of CO2-equivalents. Its emissions per capita were 13.84 metric tons of CO2-equivalents. As this is the first year this type of data has been collected, this will serve as baseline data for future comparison.
Goal 7: Enhance the Integration and Connectivity of the Transportation System Indicator 7.1: Has accessibility to transit stations/bus stops improved? Measure(s) 2014 2016 Update % Change
Connected Stations or Bus Stops
NA NA ---
Bus Stops with Shelters
NA NA ---
Status: Not Enough Information The information compiled will serve as a baseline for future comparison. “Connected” means that a sidewalk serves a bus stop or transit station. Connected stations or bus stops are defined as stations or stops with walkways that provide adequate connections.
Goal 8: Restore, Preserve and Maintain the Existing Transportation System 8.1: Indicator What is the pavement condition of our roads?
Measure(s) 2014 2016 Update % Change
% Lane-miles in at least “Fair” condition (State-owned)*
NA 54.5% ---
% road-miles in at least “Fair” condition (County and locally-owned)**
77.6% N/A
---
*Using SDI and IRI **Using PCI Status: Not enough Information While the most recent Asset Management System (AMS) inventory shows that almost 46% of the toal roadway mileage within the region has a Pavement Condition Index (PCI) of either “Satisfactory” or “Excellent,” this is based on just one year’s worth of data for all but Vineland and Atlantic County and as such, progress towards a goal cannot be determined. The information compiled will serve as a baseline for future comparison.

Transportation Matters Performance Report-2016 Update 17
The pavement condition information in the 2040 RTP Performance Report is for those roads under county jurisdiction and under the jurisdiction of the City of Vineland. The following data is pavement condition information for roads under State jurisdiction within the SJTPO region. The status levels are determined using IRI and SDI, as described above. Table 4: Roadway Conditions under State Jurisdiction, 2015 (in lane-miles) Roads in SJTPO Region DEFICIENT FAIR GOOD Total Interstate (Figure 6.1) 15.2 15.4 6.0 36.6 Non-Interstate, State Roads, NHS (Figure 6.2) 242.6 183.8 117.6 544.0 Non-Interstate, State Roads, Non-NHS (Figure 6.3) 206.5 158.4 76.8 441.7
Total
464.3 357.6 200.4 1,022.3 SOURCE: NJDOT PMS. Figure 6.1 Roadway conditions, Interstate Roads
SOURCE: NJDOT PMS. Figure 6.2 Roadway conditions, Non-Interstate Roads, NHS
SOURCE: NJDOT PMS.

Transportation Matters Performance Report-2016 Update 18
Figure 6.3 Roadway conditions, Non-Interstate Roads, Non-NHS
SOURCE: NJDOT PMS. 8.2: Indicator Are SJTPO’s bridge conditions improving?
Measure(s) 2014 2016 Update** % Change
Sufficiency Rating 82.33 81.27 (1.3)
% Bridges neither “Deficient or Functionally Obsolete”
78.9% 77.5% (1.77%)
**Data actually from 4/2015. Status: Declining slightly The average Sufficiency Rating3
for bridges in the SJTPO region in 2015 is 81.27 (Satisfactory). As depicted by Figures 7, and 8, below, after a steady increase from 2008 to 2014, the rating has decreased slightly since 2014. The number of bridges in the region that are neither “Deficient” nor “Functionally Obsolete” has also decreased slightly.
See the following charts and tables for more detailed information. As can be seen in Figure 8, below, statistics from the NJDOT’s Bridge Management System (BMS) show that in 2014, 43 (9%) of bridges in the SJTPO region are Structurally Deficient, 57 (12%) are Functionally Obsolete, and 374 (79%) are in neither category. The Structurally Deficient category shows a slight decreasing (favorable) trend from 2008, while the Functionally Obsolete category shows a slightly increasing (unfavorable) trend. 3 For a more detailed explanation of Sufficiency Ratings, Structural Adequacy and Functional Obsolescence, see Appendix 7.1 2040 Regional Transportation Plan Performance Report.

Transportation Matters Performance Report-2016 Update 19
Figure 8: SJTPO Bridge Status for the Years: 2008, 2012, 2014, & 2015
SOURCE: NJDOT Bridge Management System, 2015.

South Jersey Transportation
Planning Organization
782 South Brewster Road, Unit B6 Vineland, New Jersey 08361
WWW.SJTPO.ORG