THOR offshore wind farm - ens
51
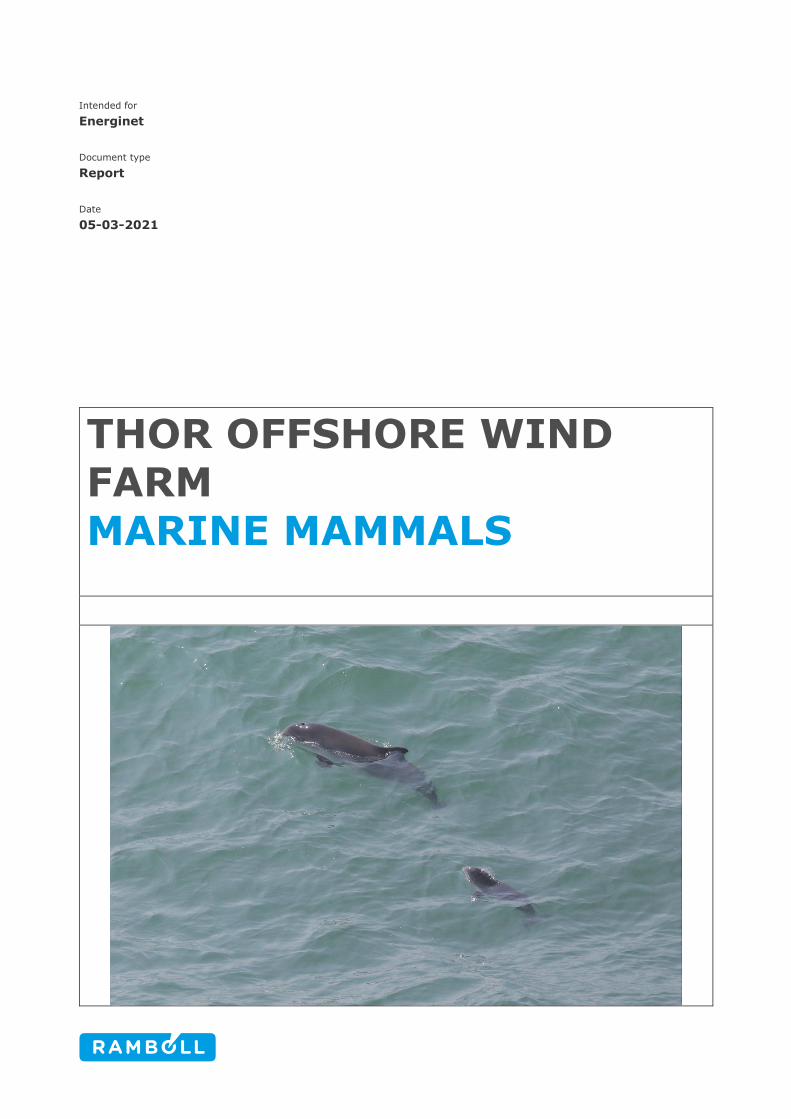
Intended for Energinet Document type Report Date 05-03-2021 THOR OFFSHORE WIND FARM MARINE MAMMALS
Transcript of THOR offshore wind farm - ens
Intended for
Energinet
Document type
Report
Date
05-03-2021
THOR OFFSHORE WIND FARM
MARINE MAMMALS
Rambøll Danmark A/S
DK reg.no. 35128417
Member of FRI
Ramboll
Hannemanns Allé 53
DK-2300 Copenhagen S
Denmark
T +45 5161 1000
F +45 5161 1001
https://ramboll.com
THOR OFFSHORE WIND FARM
MARINE MAMMALS
Project name THOR offshore wind farm environmental investigations
Project no. 1100040575
Recipient Margot Møller Nielsen, Signe Dons (Energinet)
Document no 1100040575-1927259486-4
Version [5.0]
Date 05/03/2021
Prepared by Raul Vilela, Marit Schütte
Checked by Thilo Liesenjohann and Sanne Kjellerup (WSP)
Approved by Thilo Liesenjohann
Description Technical report Work package F Marine Mammals
Rambøll Danmark A/S
DK reg.no. 35128417
Member of FRI
Ramboll
Hannemanns Allé 53
DK-2300 Copenhagen S
Denmark
T +45 5161 1000
F +45 5161 1001
https://ramboll.com
Prepared by BioConsult SH GmbH & Co.KG
For WSP Denmark A/S
Ramboll - THOR offshore wind farm
1/49
CONTENTS
1. Introduction 3 1.1 Objectives 3 2. Project description 5 2.1 Turbines 5 2.2 Foundations 5 3. Methods 6 3.1 Aerial surveys 6 3.1.1 Digital flights 6 3.1.2 Observer flights 6 3.1.3 Study area 7 3.1.4 Data validation of observer and digital flights 7 3.1.5 Data analysis 8 3.1.6 Data modelling 8 3.2 Passive acoustic monitoring 10 3.2.1 Technical details, Deployment and recovery of C-PODs 10 3.2.2 Moorings 12 3.2.3 Parameters and definitions 12 3.2.4 Phenologies 13 4. Baseline situation 14 4.1 Biology and distribution of the harbour porpoise 14 4.2 Biology and distribution of the harbour seal 17 4.3 Biology and distribution of the grey seal 18 5. Results 20 5.1 Aerial data analysis 20 5.1.1 Digital flight 20 5.1.2 Aerial observer data analysis 23 5.2 Passive Acoustic Monitoring (PAM) data analysis 27 5.2.1 Data exploration 27 5.2.2 Phenology 30 5.2.3 Interaction between Time of the day and Day of the year 31 5.2.4 Time series correlation 32 5.3 Summary 33 6. Sensitivity analysis 36 6.1 Method for mapping of baseline conditions 36 6.2 Method to identify potential impacts 36 6.3 Sensitivity of species present and effects on population level 36 6.4 Impact of underwater noise 37 6.5 Potential impacts and sensitivity of marine mammals 37 6.6 Natura2000 and Species protection 41 6.7 Site Optimisation and Mitigation Measures 42 6.8 Knowledge GAP 43 7. Literature 44
Ramboll - THOR offshore wind farm
2/49
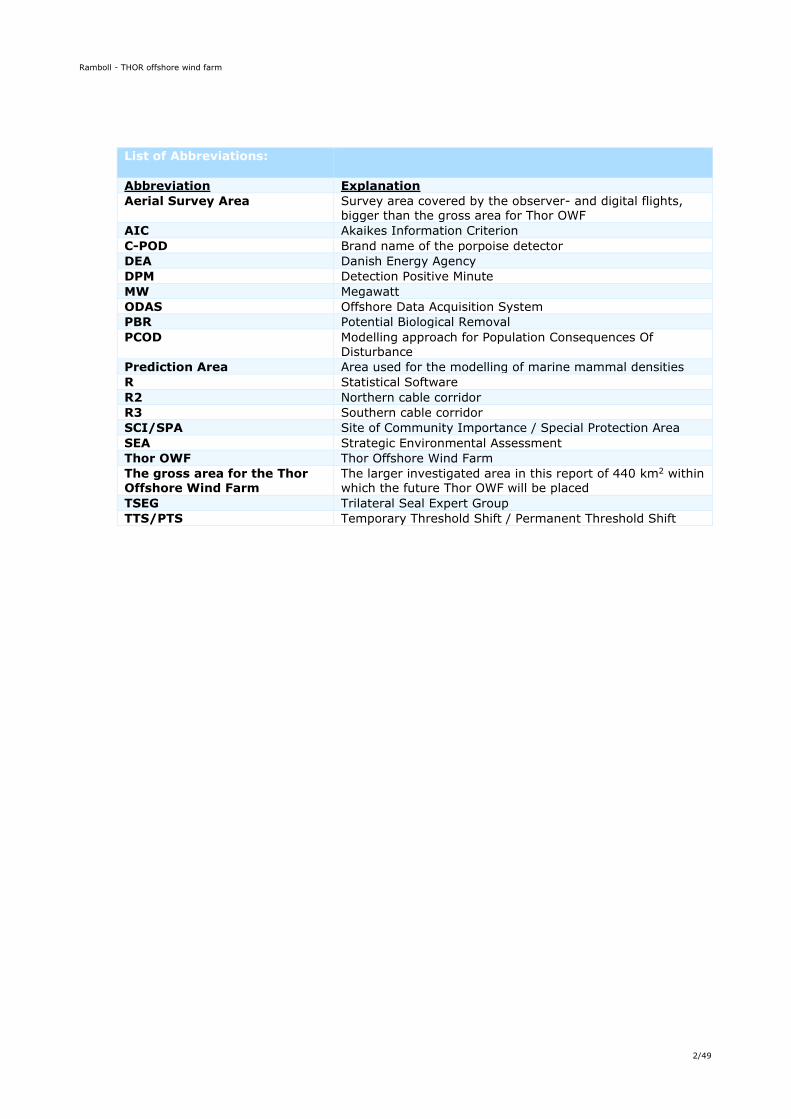
List of Abbreviations:
Abbreviation Explanation
Aerial Survey Area Survey area covered by the observer- and digital flights, bigger than the gross area for Thor OWF
AIC Akaikes Information Criterion
C-POD Brand name of the porpoise detector
DEA Danish Energy Agency
DPM Detection Positive Minute
MW Megawatt
ODAS Offshore Data Acquisition System
PBR Potential Biological Removal
PCOD Modelling approach for Population Consequences Of
Disturbance
Prediction Area Area used for the modelling of marine mammal densities
R Statistical Software
R2 Northern cable corridor
R3 Southern cable corridor
SCI/SPA Site of Community Importance / Special Protection Area
SEA Strategic Environmental Assessment
Thor OWF Thor Offshore Wind Farm
The gross area for the Thor Offshore Wind Farm
The larger investigated area in this report of 440 km2 within which the future Thor OWF will be placed
TSEG Trilateral Seal Expert Group
TTS/PTS Temporary Threshold Shift / Permanent Threshold Shift
Ramboll - THOR offshore wind farm
3/49
1. INTRODUCTION
By adopting the Energy Agreement of June 2018, the Danish Parliament requested the
construction of three additional Offshore Wind Farms (OWF) in Danish waters before 2030, setting
the installed capacity at approximately 1000MW. In the scope of the Energy Agreement 2018 the
grid connection of the additional OWFs was scheduled for 2024 to 2027. In February 2019, the
Danish Energy Agency (DEA) initiated a screening study to identify potential development sites for
large-scale (app. 1000MW) OWF in Danish waters. Based on this screening study the DEA
declared an area in the North Sea 20 km off the coast of Thorsminde as a suitable development
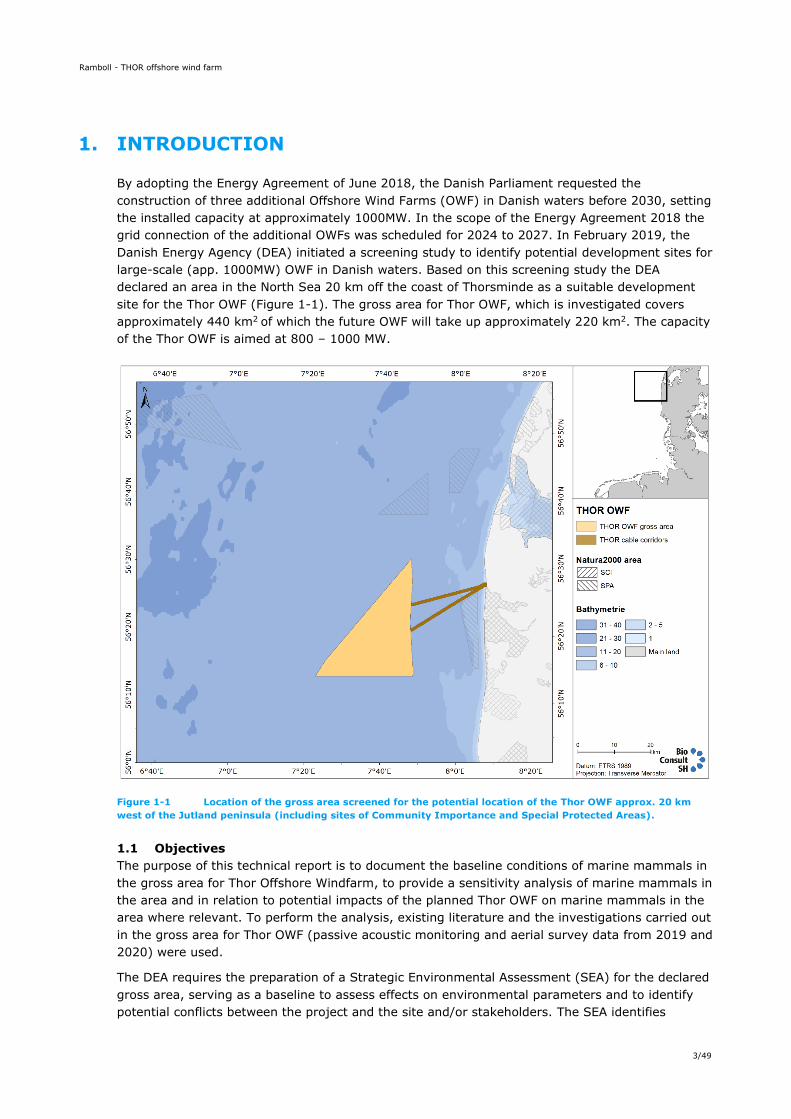
site for the Thor OWF (Figure 1-1). The gross area for Thor OWF, which is investigated covers
approximately 440 km2 of which the future OWF will take up approximately 220 km2. The capacity
of the Thor OWF is aimed at 800 – 1000 MW.
Figure 1-1 Location of the gross area screened for the potential location of the Thor OWF approx. 20 km
west of the Jutland peninsula (including sites of Community Importance and Special Protected Areas).
1.1 Objectives
The purpose of this technical report is to document the baseline conditions of marine mammals in
the gross area for Thor Offshore Windfarm, to provide a sensitivity analysis of marine mammals in
the area and in relation to potential impacts of the planned Thor OWF on marine mammals in the
area where relevant. To perform the analysis, existing literature and the investigations carried out
in the gross area for Thor OWF (passive acoustic monitoring and aerial survey data from 2019 and
2020) were used.
The DEA requires the preparation of a Strategic Environmental Assessment (SEA) for the declared
gross area, serving as a baseline to assess effects on environmental parameters and to identify
potential conflicts between the project and the site and/or stakeholders. The SEA identifies
Ramboll - THOR offshore wind farm
4/49
suitable locations and potential conflicts supported by existing literature and technical reports on
specific environmental subjects (e.g., benthic flora and fauna, fish and fisheries, marine
mammals, etc.), and addresses potential impacts on the environment occurring either during the
construction, operation or decommissioning of the Thor OWF. The SEA is consistent with the
stipulations of the Energy Agreement 2018 and meets the required detailing level for an SEA
under the EU Directive implemented in Denmark.
The present technical report focuses on marine mammals only, with specific focus on the potential
exposure to underwater noise during the construction phase. Other impacts such as habitat loss,
sediment spill, noise during operation, electromagnetic fields are considered minor or negligible
(see chapter 6).
The area around the gross area for Thor OWF is known to be regularly visited by marine
mammals. The most common species are the harbour porpoise (Phocoena phocoena) and the
harbour and grey seal (Phoca vitulina and Halichoerus grypus).
The specific objectives of this baseline report and sensitivity analysis were thus to
• describe and evaluate the use of the gross area for Thor OWF by marine mammals.
• determine the potential effects of the installation, operation and decommissioning of the
offshore elements of the proposed offshore wind farm Thor on the species and to predict
the significance of those impacts in terms of a sensitivity analysis; The sensitivity analysis
includes the ranges of disturbances and physical impacts of noise on marine mammals
and the effects in the closest Natura 2000 sites.
• present a Habitats Regulations Assessment for the proposed development, including the
Natura2000 screening process and an assessment of the conservation obligations for
strictly protected species according to the Habitats Directive.
The construction of the offshore wind farm involves activities that produce underwater noise. Installation of monopiles into the seabed by means of impact pile driving is regarded the most significant noise source with the potential to harm marine mammals and fish in the area. Therefore, an Underwater Noise report (ITAP 2020) has been prepared and used as an initial assessment on the displacement effects on the marine mammals. Technical details (e.g., the precise size of the hammer etc.) will be decided for the specific Thor project, therefore this report is based on assumptions about the technical details of the future project.
Ramboll - THOR offshore wind farm
5/49
2. PROJECT DESCRIPTION
The gross area for the location of the future Thor OWF is located in the Danish North Sea west of Nissum Fjord at least 20 km off the coast of Jutland (Denmark) (Figure 1-1). The water depth in the project area is between 24 m and 32 m (EMODnet), and within the gross area, the uppermost surface layer of the sediment consists of a mix of sand, gravel and clay (see the “Thor OWF
Technical report – Benthic fauna and flora” for details).
At the current planning stage, the final layout and position of the OWF has not been defined yet
and there are several possible configurations with regard to the total capacity of 800 – 1000 MW of the OWF, the number of turbines and the capacity of each individual turbine.
The plan for Thor OWF includes the following elements:
• the gross area for the Thor OWF within which the positioning of wind turbines will be
specified at a later stage,
• the offshore substation (transformer platform),
• two alternative cable corridors (R2 – Northern cable corridor and R3 – Southern cable
corridor) leading to one landfall on the north coast of Nissum Fjord. Either one or both
cable corridors maybe used.
• an onshore substation located close to the landfall area of the export cables and onshore
cables to the grid connection point at Idomlund, which is east of Nissum Fjord.
2.1 Turbines
Turbine capacity and thus turbine numbers have not been identified yet. However, a range
between 8 - 15 MW power capacity is expected, corresponding to a minimum of 67 turbines and a
maximum of 125 turbines (thus representing a total capacity of the wind farm of approximately
1000 MW). Due to the range of potential capacities the assessment is performed on a general
level.
2.2 Foundations
The most likely construction method considering the water depths and the expected seabed
conditions will be a pile-driven monopile. As alternatives, jacket-foundations and suction buckets
are discussed in the assessment. However, the noise emissions used for the assessment of
affected areas are based on the constraints given in the noise report (ITAP 2020 p. 2020) using
as a base case a monopile with 13 m diameter. In an addition a scour protection is most likely
needed, covering a radius of approximately 20 m around each foundation. With an erosion
protection around each turbine of in total 20 m diameter the footprint of the 125 8 MW turbines is
estimated to 0.039 km2 and 0.021 km2 for the 67 15 MW turbines. These assumptions are based
on experience from other windfarm projects along the west coast of Jutland were scour protection
is potentially done with stones placed with a diameter of 15-20 m around the foundation
(Vesterhav Nord vindmøllepark - Miljøkonsekvensrapport 2020, Vesterhav Syd vindmøllepark -
Miljøkonsekvensrapport 2020).
Ramboll - THOR offshore wind farm
6/49
3. METHODS
The assessment of the marine mammal presence within and around the gross area for the Thor
OWF is based on datasets collected during flight surveys as well as datasets from a passive
acoustic monitoring.
3.1 Aerial surveys
The project-based flight surveys were planned as observer-based flights. Due to the COVID-19
restrictions in spring 2020 the first flight was changed to a digital flight on the same transect
design to avoid the contact of crews and observers from German and Danish high-risk areas.
Because the two methods monitor different strip width during the flight, digital and observer-
based flights result in different counts of individuals. This is levelled during the later analysis when
the counts are transformed into the index Individuals/km2 (details see below).
Flights were performed during the months of April (digital flight on 18.04.2020), June (observer
flight on 18.06.2020 and August 2020 (observer flight on 17.08.2020) with technical planning and
long-term weather forecasting beginning in March 2020.
3.1.1 Digital flights
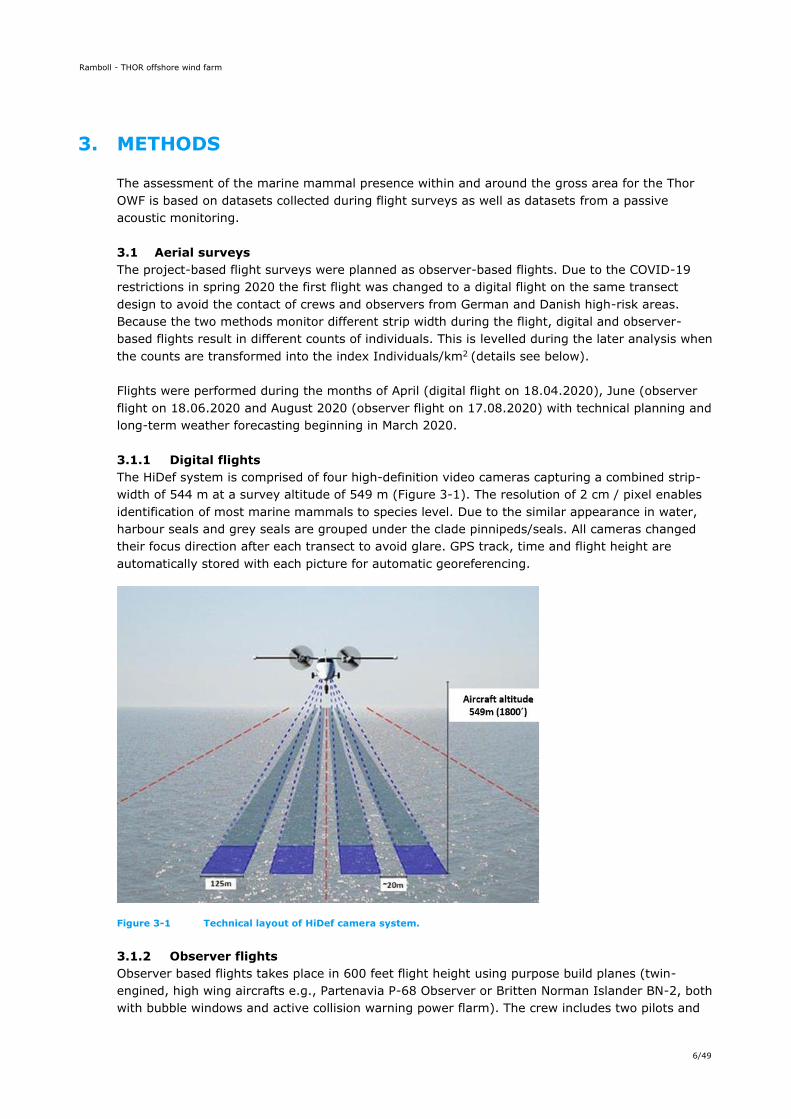
The HiDef system is comprised of four high-definition video cameras capturing a combined strip-
width of 544 m at a survey altitude of 549 m (Figure 3-1). The resolution of 2 cm / pixel enables
identification of most marine mammals to species level. Due to the similar appearance in water,
harbour seals and grey seals are grouped under the clade pinnipeds/seals. All cameras changed
their focus direction after each transect to avoid glare. GPS track, time and flight height are
automatically stored with each picture for automatic georeferencing.
Figure 3-1 Technical layout of HiDef camera system.
3.1.2 Observer flights
Observer based flights takes place in 600 feet flight height using purpose build planes (twin-
engined, high wing aircrafts e.g., Partenavia P-68 Observer or Britten Norman Islander BN-2, both
with bubble windows and active collision warning power flarm). The crew includes two pilots and

Ramboll - THOR offshore wind farm
7/49
three trained marine mammal observers per survey. The flight speed is set to 100 kn. The
observers record all sightings on dictaphones. Concurrently, time and GPS-Position for each
observation are logged and a permanent GPS from the plane is synchronized. Recordings are
transferred and georeferenced in the office and translated into ArcGis raw data.
3.1.3 Study area
The flight transect design agreed with the client covers 2487,53 km2 with twelve transects of
approximately 48 km length and 5 kilometers spacing (see Figure 3-2). Transect layout was
chosen as an east-west design to have transect lines horizontal to the main depth contours. This
allows analysis of avoided areas in relation to water depth. Each transect line covers
approximately 200 m of Danish onshore coastline to also monitor seals on land if present. The
aerial survey area was defined to cover a substantial larger area as the gross area (covering 2487
km2 compared to the Thor gross area of 440 km2). This was done to take into account that marine
mammals are highly mobile and spatial patterns can be distributed over large areas. The chosen
area of the aerial investigations allows to analyze if the gross area is of special importance to
marine mammals in relation to the surrounding area and if regular spatial patterns occur.
Figure 3-2 Flight transect design used during all three aerial surveys.
3.1.4 Data validation of observer and digital flights
Data from digital and observer-based flights yield comparable results and can be directly
compared to each other. Though digital flights cover bigger areas and consequently identify more
objects, the transformation into the index “individuals per km2” levels this initial difference. Data
from digital flights however is less prone to assumptions and variations because no distance
correction needs to be performed and thus the variation within data sets is usually lower. This
Ramboll - THOR offshore wind farm
8/49
change of methods has been done in most projects in the EU and has been documented for
example for the FemarnBelt Fixed Link project and all offshore wind projects in Germany
(documented in the Standard “Investigation of impacts of offshore wind turbines on the marine
environment” (Bundesamt für Seeschifffahrt und Hydrographie 2013) and many in France
(ongoing projects)). Main driver for the change of methods is the flight height, which can be
realized with the digital method. Observer flights are conducted within rotor height and planes fly
in a narrow corridor in operational wind farms. To avoid flights in rotor height of operational wind
farms, digitals flights are performed much higher than the potential tip height of future rotors.
Details of the comparison of both methods are discussed in peer reviewed publications (Žydelis et
al. 2019, Bröker et al. 2019).
3.1.5 Data analysis
The flight data is stored on hard drives (thus raw data is reproducible at any time) and analysed
in the office by a review and identification team. Raw data on hard drives can be handed to the
client after a quality check.
For both methods (observer based and digital flight surveys), distributions and densities of marine
mammals (harbour porpoises, harbour seals and grey seals) are calculated and plotted as density
maps or point sightings maps.
Observer data requires distance sampling correction for adjusting the estimated total number of
sightings (Buckland et al. 2001, Thomas et al. 2002). Distance sampling is a widely used
methodology for estimating animal density or abundance. Its name derives from the fact that the
information used for inference are the recorded distances to animals obtained by surveying lines.
In observer-based surveys, the probability of detecting an animal decreases as its distance from
the observer increases. Much of distance sampling methodology is concentrated on detection
functions, which model the probability of detecting an animal, given its distance from the transect
and the group size (which affects to the species detectability). For the investigation of the aerial
survey area distance sampling analysis was performed using the software Distance 7.3 (Thomas
et al. 2010).
3.1.6 Data modelling
Spatial modelling of aerial flight data is performed within a Bayesian framework making use of
Latent Gaussian Models (LGMs) and the Integrated Nested Laplace Approximation (INLA; (Rue et
al. 2009)) combined with the Stochastic Partial Differential Equation (SPDE) approach (Lindgren
et al. 2011). This approach allows to implement spatial modelling for point process data, while
accounting for spatial-temporal interdependence and autocorrelation in the data. As an
advantage, Bayesian inference uses the Bayes’ theorem to update the probability of a hypothesis
after new data are obtained, where the Bayes' theorem describes the conditional probability of an
event based on data as well as prior information or beliefs about the event or conditions related to
the event (Kruschke 2014). The modelling includes the aerial survey area and some area around
the transect lines, thus the prediction area for marine mammal densities is slightly bigger than
the aerial survey area (3560 km2). However, all modellings a carried out for the index
Individuals/km2 so the results are comparable at any time.
This modelling framework is designed not to make use of any covariates; however, it can
optionally integrate environmental variables, multiple data sources or distance sampling methods,
and it can deal with spatially varying detection probability. Therefore, it is an ideal method for
quantifying animal distribution and abundance from aerial and boat-based surveys, while correctly
considering predictive uncertainty.
Ramboll - THOR offshore wind farm
9/49
Data modelling was performed using the R-package inlabru (Bachl et al. 2019) from the R
statistical software (R Core Team 2020).
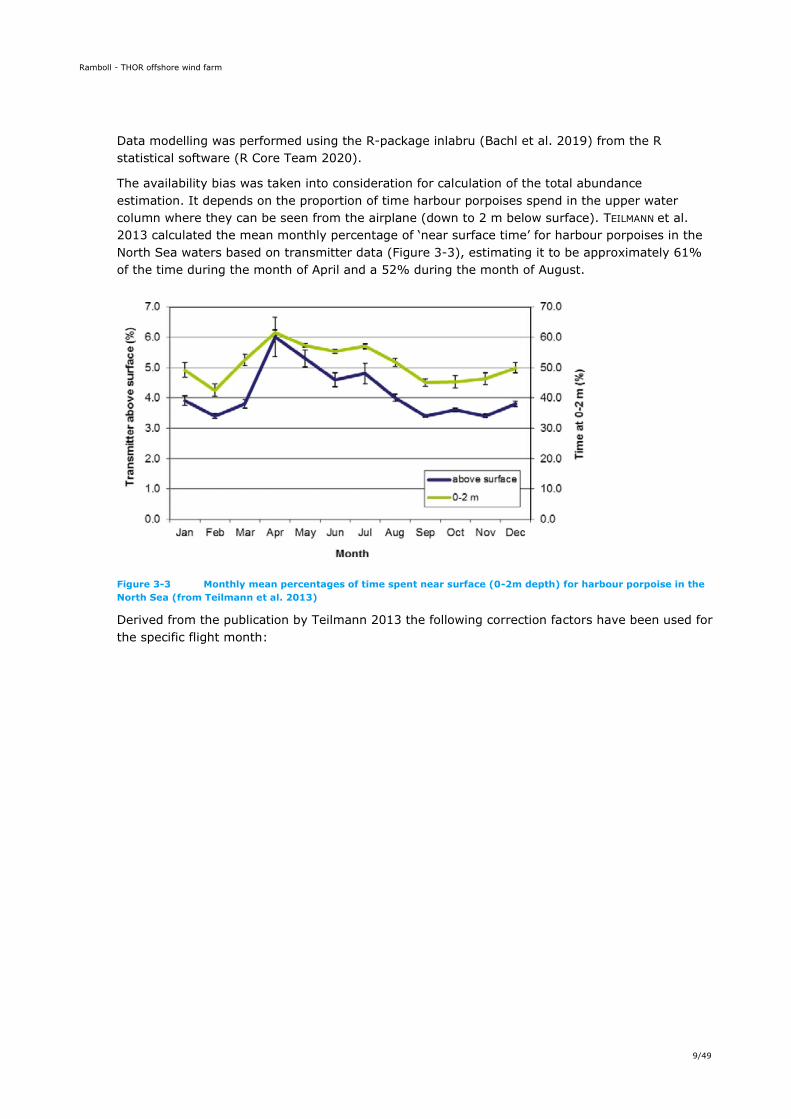
The availability bias was taken into consideration for calculation of the total abundance
estimation. It depends on the proportion of time harbour porpoises spend in the upper water
column where they can be seen from the airplane (down to 2 m below surface). TEILMANN et al.
2013 calculated the mean monthly percentage of ‘near surface time’ for harbour porpoises in the
North Sea waters based on transmitter data (Figure 3-3), estimating it to be approximately 61%
of the time during the month of April and a 52% during the month of August.
Figure 3-3 Monthly mean percentages of time spent near surface (0-2m depth) for harbour porpoise in the
North Sea (from Teilmann et al. 2013)
Derived from the publication by Teilmann 2013 the following correction factors have been used for
the specific flight month:
Ramboll - THOR offshore wind farm
10/49
Table 3-1 Detection probability of harbour porpoises in the surface layer (0 to 2 m) following Teilmann et al.
(2013b) depending on the month of data assessment.
Month Detection probability (0 to 2 m)
January 0,492
February 0,425
March 0,525
April 0,615
May 0,573
June 0,553
July 0,570
August 0,517
September 0,450
October 0,453
November 0,463
December 0,499
3.2 Passive acoustic monitoring
Harbour porpoises orientate themselves by means of echolocation and therefore emit almost
constantly high-frequency clicking sounds (Koschinski et al. 2008, Clausen et al. 2010). These can
be recorded to gather information about the presence of harbour porpoises in an area. To gather
long term data from specific areas, C-PODs are deployed over longer periods returning data on
the presence of individuals on different time scales. To identify harbour porpoise dynamics in the
gross area four stations with two C-PODs at each station have been deployed. However, C-PODs
do not give an estimate of harbour porpoise densities and are thus to be combined with flight
data.
3.2.1 Technical details, Deployment and recovery of C-PODs
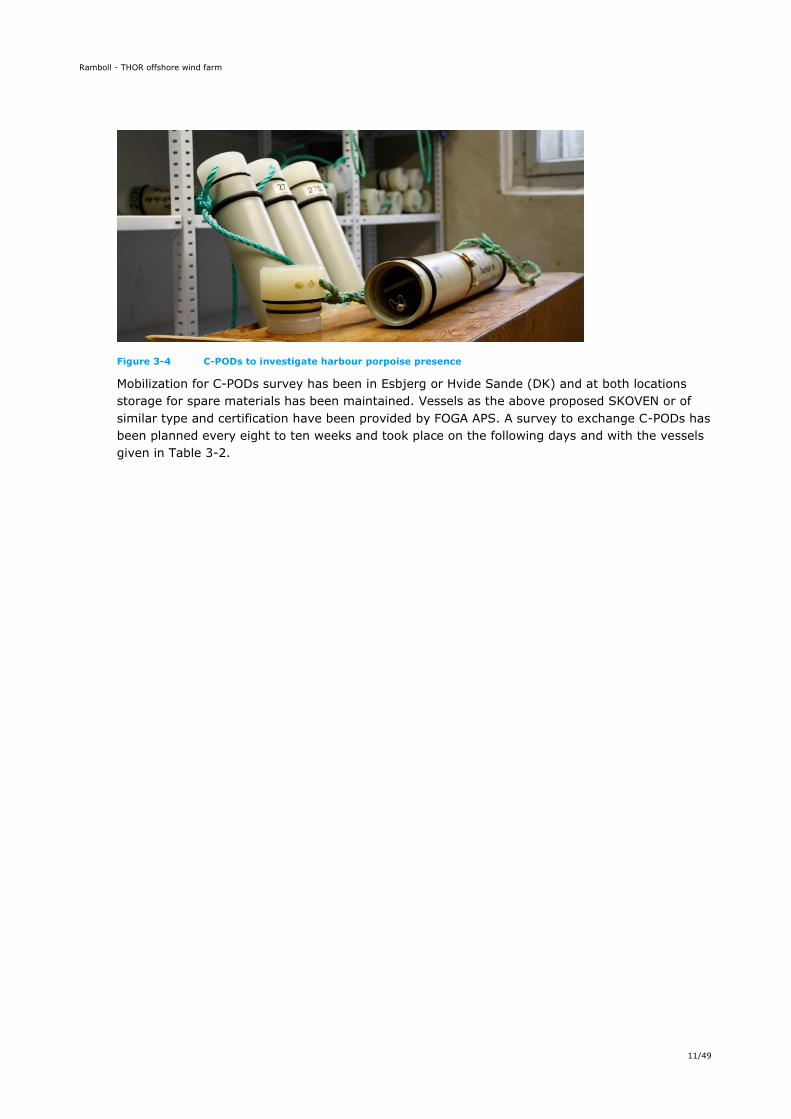
A C-POD (Cetacean POrpoise Detector, Chelonia Ltd, UK; http://www.chelonia.co.uk; Figure 3-4)
is a device that records the high-frequency echolocation calls of harbour porpoises using a built-in
hydrophone up to a distance of approx. 300 m, with an almost 100 percent detection in a radius
of 100 meters (http://www.cpodclickdetector.com). C-PODs consist of an 80 cm long plastic tube
with the hydrophone at one end. Directly below are an amplifier and an electronic filter. The
hydrophone records all sound events omnidirectionally in a frequency range from 20 to 160 kHz.
Main frequency, frequency curve, loudness duration, intensity (in 8 bit steps), bandwidth and
envelope of the frequency spectrum are stored for each individual click. A total of ten 1.5 Volt D
batteries supply the device with enough voltage for at least six weeks. SD cards provide an easy-
to-read memory unit of up to four GB. The devices are calibrated by the manufacturer to the main
frequency of porpoise clicks (130 kHz) and set to the same hearing threshold (±3 dB). Applying
various filters, a C-POD converts the sound waves into digital data and stores them on an SD
card, allowing later evaluation of harbour porpoise presence. All C-PODs are calibrated every two
years at the manufacturer. C-POD data are read out once off-shore, but the SD-card containing
the original data will be stored until final data review in the office. All data are secured daily on
two external servers according to the ISO and OHSAS standards.
Ramboll - THOR offshore wind farm
11/49
Figure 3-4 C-PODs to investigate harbour porpoise presence
Mobilization for C-PODs survey has been in Esbjerg or Hvide Sande (DK) and at both locations
storage for spare materials has been maintained. Vessels as the above proposed SKOVEN or of
similar type and certification have been provided by FOGA APS. A survey to exchange C-PODs has
been planned every eight to ten weeks and took place on the following days and with the vessels
given in Table 3-2.
Ramboll - THOR offshore wind farm
12/49
Table 3-2 Service plan for 2019/2020 C-POD Services.
Survey Date Vessel Purpose
1 19.12.2019 Skoven Deployment
2 26.02.2020 Skoven Service & Repair
3 20.04.2020 Cecilie Service and Repair 4 02.07.2020 Reykjanes Service and Repair
5 27.08.2020 Reykjanes Service and Repair
6 31.10.2020 Skoven Service and Repair
7 28.11.2020 Skoven Recovery
3.2.2 Moorings
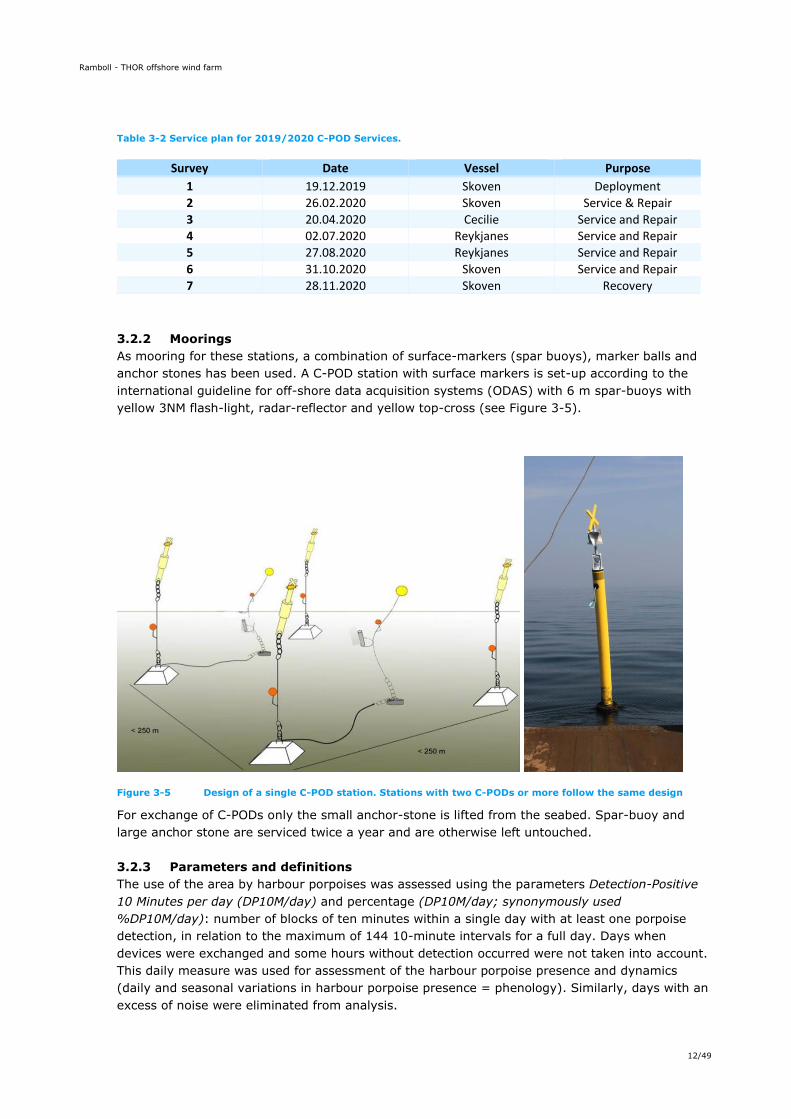
As mooring for these stations, a combination of surface-markers (spar buoys), marker balls and
anchor stones has been used. A C-POD station with surface markers is set-up according to the
international guideline for off-shore data acquisition systems (ODAS) with 6 m spar-buoys with
yellow 3NM flash-light, radar-reflector and yellow top-cross (see Figure 3-5).
Figure 3-5 Design of a single C-POD station. Stations with two C-PODs or more follow the same design
For exchange of C-PODs only the small anchor-stone is lifted from the seabed. Spar-buoy and
large anchor stone are serviced twice a year and are otherwise left untouched.
3.2.3 Parameters and definitions
The use of the area by harbour porpoises was assessed using the parameters Detection-Positive
10 Minutes per day (DP10M/day) and percentage (DP10M/day; synonymously used
%DP10M/day): number of blocks of ten minutes within a single day with at least one porpoise
detection, in relation to the maximum of 144 10-minute intervals for a full day. Days when
devices were exchanged and some hours without detection occurred were not taken into account.
This daily measure was used for assessment of the harbour porpoise presence and dynamics
(daily and seasonal variations in harbour porpoise presence = phenology). Similarly, days with an
excess of noise were eliminated from analysis.
Ramboll - THOR offshore wind farm
13/49
3.2.4 Phenologies
The shape of a phenology curve is usually more interesting than absolute numbers for certain
days. Confidence intervals were not definable for comparisons of phenologies (PP10M/day) on a
daily base. At this temporal resolution, analyses of phenologies had to be kept on a strictly
explorative level. Phenology and 95% Interval Confidence intervals were calculated using a LOESS
smooth function. Monthly detection rates (%DP10M/day) were aggregate by month for all stations
to give an overall idea of the detection rates per month.
Significance of time series correlation among mooring stations were assessed by means of a
hierarchical clustering technique via multiscale bootstrap resampling. For this task only full days
with valid records in all stations simultaneously were used.
In addition, the potential interaction between day of the year and hour of the day was
investigated by means of a Generalized Additive Model. And finally, C-POD data was compared
with aerial flight data during the flight time period by means of a Pearson´s correlation index to
assess for differences between C-POD detections and aerial sightings.
All maps by BioConsult SH are based on bathymetric data by GEBCO (The GEBCO_2014 Grid,
version 20150318, http://www.gebco.net).
Ramboll - THOR offshore wind farm
14/49
4. BASELINE SITUATION
4.1 Biology and distribution of the harbour porpoise
Harbour porpoises are one of the smallest European cetaceans, belonging to the toothed whales
and reaching a length of up to 1.85 m, very rarely even 2 m. On average, however, they are only
1.60 m long. The weight of the adult harbor porpoise varies between approx. 40 and 90 kg.
Females generally become larger and heavier than their male counterparts(Bjørge & Tolley 2009).
Harbor porpoises have a life expectancy of up to 22 years (Benke & Siebert 1994, Bjørge & Tolley
2009). However, they often only reach an age of around 12 years. The males become sexually
mature at 2 to 3 years of age, whereas the females only reach sexual maturity at an age of 3 to 4
years. The mating season is from mid-July to the end of August, leading to a calving season in the
Danish North Sea around July of each year with the calving season spreading between May and
August of each year (Bjørge & Tolley 2009). Porpoises usually swim alone or in pairs (mother/calf
groups). Bigger groups can occur occasionally, but these small whales are seldom found in
schools of more than 7 animals. Their average swimming speed is around 2-7 km/h. This
swimming speed differs greatly between travelling, feeding or even fleeing activities. In
experimental setups the swimming speed of a captive harbour porpoise was around 4.3 km/h in a
baseline measurement reaching 7.1 km/h during playback of simulated piling noise (Kastelein et
al. 2018). This marine mammal species can only be found in the northern hemisphere, preferring
waters close to coasts such as shallow seas, fjords, sounds, bays and estuaries, feeding on fish
living on the seabed as well as schooling fish. These include the goby, the lesser sand eel and the
eel mother, the herring, the sprat, the cod, the whiting, the mackerel and the horse mackerel
(Aarefjord et al. 1995, Börjesson et al. 2003, Santos & Pierce 2003). Occasionally, octopuses,
crustaceans, snails and bristle worms are found in stomach content analyses. Prey species of
Harbour porpoise are generally no larger than 30 cm.
Harbor porpoises can be diurnal as well as nocturnal (Williamson et al. 2017), sometimes
adapting their activity rhythms to prey availability, season or daylength. In adapting to their
habitat, the porpoises have developed a bio-sonar as an orientation aid. With the so-called
"phonic lips", an organ similar to the vocal folds, the animals produce short, high-frequency clicks.
Porpoises can orient themselves in their environment, communicate with conspecifics and catch
prey in complete darkness or in high turbidity waters and adopt their vocalization patterns to
specific tasks (Koschinski et al. 2008, Clausen et al. 2010, Brandt 2016). The hearing abilities of
harbour porpoises have been an object of intensive research due to the fact, that harbour
porpoises rely on their auditory system to search for prey. Thus, any impairments of the auditory
system can lead to starvation. Studies on the hearing abilities of harbour porpoises showed in
audiograms, that harbour porpoises have the best hearing abilities between 16 and 140 kHz with
a lower threshold around 40-60 dB re 1µPa (Kastelein et al. 2002, 2010, Lucke et al. 2008, 2009,
Lee A. Miller & Magnus Wahlberg 2013). This corresponds to the frequencies harbour porpoises
emit clicks, which usually lies between 100 and 140 kHz.
In the North Sea the total harbour porpoise abundance is estimated to be 466,569 individuals
(with a range between the low and high confidence intervals (CI) of 345,306 – 630,417
individuals)(Hammond et al. 2017), but abundances vary greatly as well between years as
between areas of the North Sea, depending on seasonal migration and food availability. The
calculation of the most recent abundances in Hammond et al (2017) is based on flight surveys
covering large areas including the coasts of Spain, Portugal and additional data sets from the
North Atlantic Sighting Survey and the Irish Observer project. But to define the biogeographical
population relevant for projects in the Danish EEZ the ICES assessment unit “North Sea” is used
(ICES 2014), describing the animals distribution from the English Channel up to the Norwegian
coast (Figure 4-1). Thus the estimated population size as part of the total population (pink in

Ramboll - THOR offshore wind farm
15/49
Figure 4-1), relevant for the impact assessment, is assumed to be 345,373 animals with an lower
and upper confidence interval of 246,526 and 495,752 individuals (Hammond et al. 2017).
Figure 4-1 Harbour porpoise assessment units as proposed for OSPAR (ICES 2014). The North Sea
population (pink) is used as reference population in this report.
The gross area for the Thor OWF is located north of the investigation area of yearly flights in the
Danish Southern North Sea (DCE 2011 – 2019), providing comparable results and investigation
areas (Figure 4-2) to assess the importance of the area and the reliability of the data.
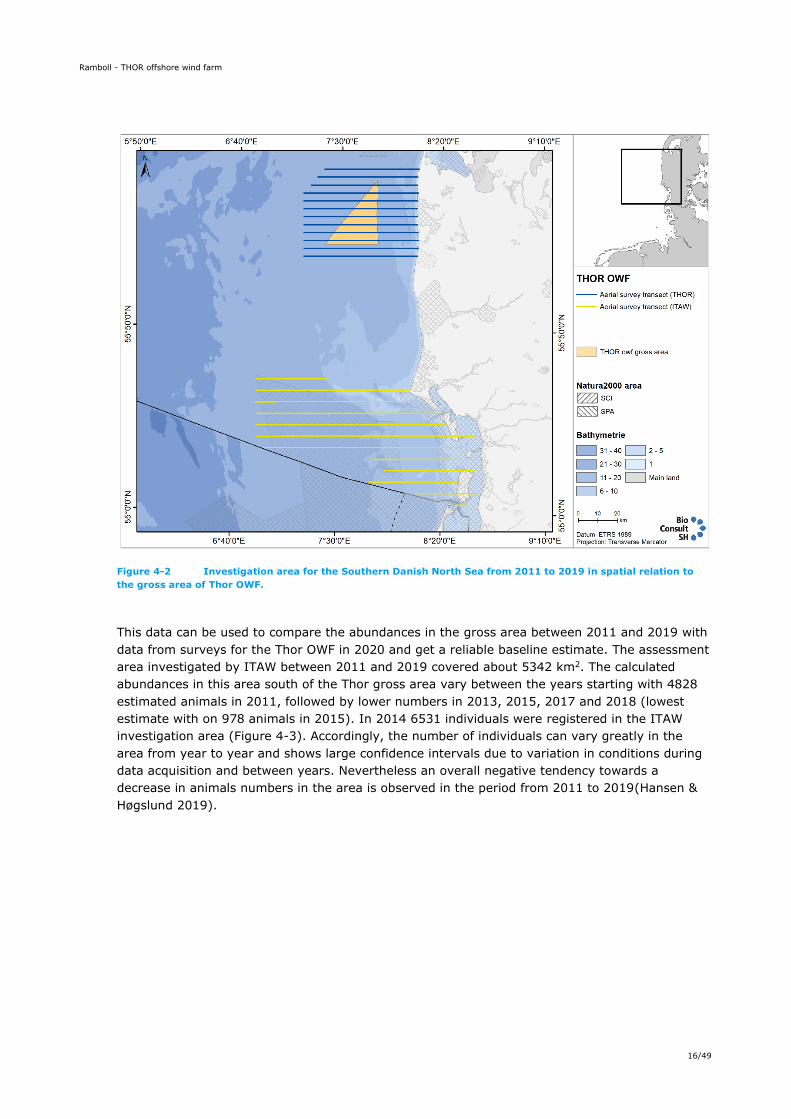
Ramboll - THOR offshore wind farm
16/49
Figure 4-2 Investigation area for the Southern Danish North Sea from 2011 to 2019 in spatial relation to
the gross area of Thor OWF.
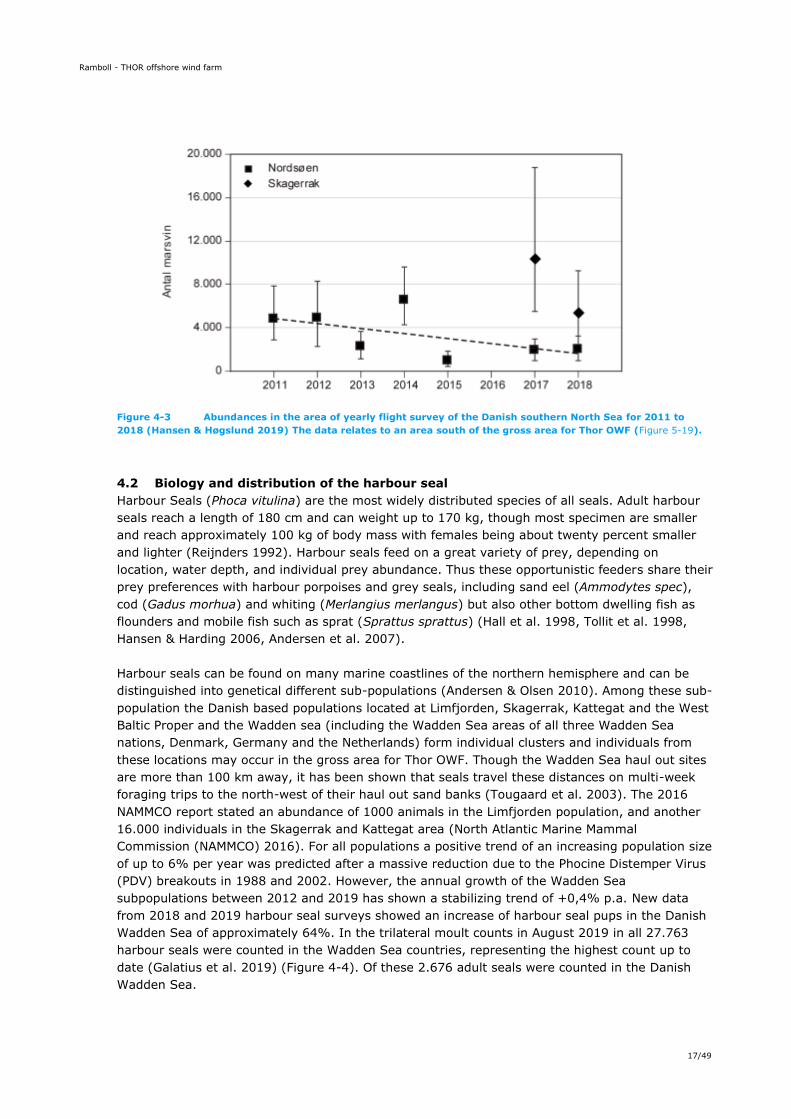
This data can be used to compare the abundances in the gross area between 2011 and 2019 with
data from surveys for the Thor OWF in 2020 and get a reliable baseline estimate. The assessment
area investigated by ITAW between 2011 and 2019 covered about 5342 km2. The calculated
abundances in this area south of the Thor gross area vary between the years starting with 4828
estimated animals in 2011, followed by lower numbers in 2013, 2015, 2017 and 2018 (lowest
estimate with on 978 animals in 2015). In 2014 6531 individuals were registered in the ITAW
investigation area (Figure 4-3). Accordingly, the number of individuals can vary greatly in the
area from year to year and shows large confidence intervals due to variation in conditions during
data acquisition and between years. Nevertheless an overall negative tendency towards a
decrease in animals numbers in the area is observed in the period from 2011 to 2019(Hansen &
Høgslund 2019).
Ramboll - THOR offshore wind farm
17/49
Figure 4-3 Abundances in the area of yearly flight survey of the Danish southern North Sea for 2011 to
2018 (Hansen & Høgslund 2019) The data relates to an area south of the gross area for Thor OWF (Figure 5-19).
4.2 Biology and distribution of the harbour seal
Harbour Seals (Phoca vitulina) are the most widely distributed species of all seals. Adult harbour
seals reach a length of 180 cm and can weight up to 170 kg, though most specimen are smaller
and reach approximately 100 kg of body mass with females being about twenty percent smaller
and lighter (Reijnders 1992). Harbour seals feed on a great variety of prey, depending on
location, water depth, and individual prey abundance. Thus these opportunistic feeders share their
prey preferences with harbour porpoises and grey seals, including sand eel (Ammodytes spec),
cod (Gadus morhua) and whiting (Merlangius merlangus) but also other bottom dwelling fish as
flounders and mobile fish such as sprat (Sprattus sprattus) (Hall et al. 1998, Tollit et al. 1998,
Hansen & Harding 2006, Andersen et al. 2007).
Harbour seals can be found on many marine coastlines of the northern hemisphere and can be
distinguished into genetical different sub-populations (Andersen & Olsen 2010). Among these sub-
population the Danish based populations located at Limfjorden, Skagerrak, Kattegat and the West
Baltic Proper and the Wadden sea (including the Wadden Sea areas of all three Wadden Sea
nations, Denmark, Germany and the Netherlands) form individual clusters and individuals from
these locations may occur in the gross area for Thor OWF. Though the Wadden Sea haul out sites
are more than 100 km away, it has been shown that seals travel these distances on multi-week
foraging trips to the north-west of their haul out sand banks (Tougaard et al. 2003). The 2016
NAMMCO report stated an abundance of 1000 animals in the Limfjorden population, and another
16.000 individuals in the Skagerrak and Kattegat area (North Atlantic Marine Mammal
Commission (NAMMCO) 2016). For all populations a positive trend of an increasing population size
of up to 6% per year was predicted after a massive reduction due to the Phocine Distemper Virus
(PDV) breakouts in 1988 and 2002. However, the annual growth of the Wadden Sea
subpopulations between 2012 and 2019 has shown a stabilizing trend of +0,4% p.a. New data
from 2018 and 2019 harbour seal surveys showed an increase of harbour seal pups in the Danish
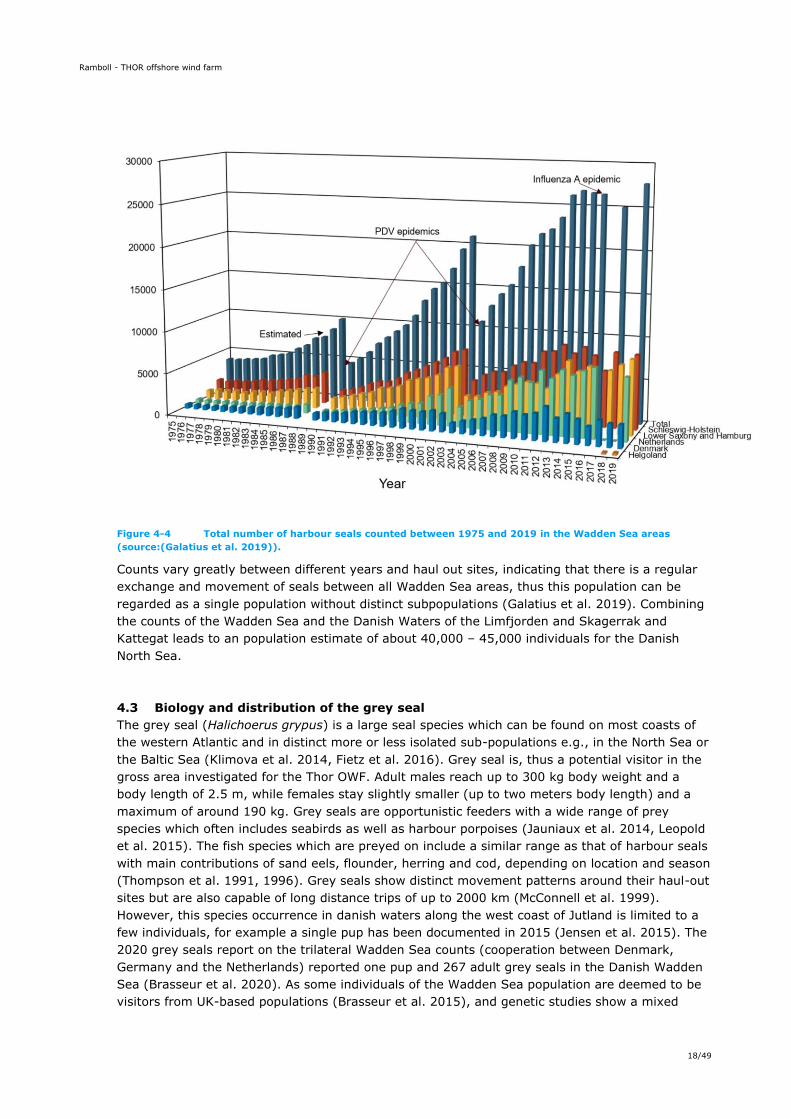
Wadden Sea of approximately 64%. In the trilateral moult counts in August 2019 in all 27.763
harbour seals were counted in the Wadden Sea countries, representing the highest count up to
date (Galatius et al. 2019) (Figure 4-4). Of these 2.676 adult seals were counted in the Danish
Wadden Sea.
Ramboll - THOR offshore wind farm
18/49
Figure 4-4 Total number of harbour seals counted between 1975 and 2019 in the Wadden Sea areas
(source:(Galatius et al. 2019)).
Counts vary greatly between different years and haul out sites, indicating that there is a regular
exchange and movement of seals between all Wadden Sea areas, thus this population can be
regarded as a single population without distinct subpopulations (Galatius et al. 2019). Combining
the counts of the Wadden Sea and the Danish Waters of the Limfjorden and Skagerrak and
Kattegat leads to an population estimate of about 40,000 – 45,000 individuals for the Danish
North Sea.
4.3 Biology and distribution of the grey seal
The grey seal (Halichoerus grypus) is a large seal species which can be found on most coasts of
the western Atlantic and in distinct more or less isolated sub-populations e.g., in the North Sea or
the Baltic Sea (Klimova et al. 2014, Fietz et al. 2016). Grey seal is, thus a potential visitor in the
gross area investigated for the Thor OWF. Adult males reach up to 300 kg body weight and a
body length of 2.5 m, while females stay slightly smaller (up to two meters body length) and a
maximum of around 190 kg. Grey seals are opportunistic feeders with a wide range of prey
species which often includes seabirds as well as harbour porpoises (Jauniaux et al. 2014, Leopold
et al. 2015). The fish species which are preyed on include a similar range as that of harbour seals
with main contributions of sand eels, flounder, herring and cod, depending on location and season
(Thompson et al. 1991, 1996). Grey seals show distinct movement patterns around their haul-out
sites but are also capable of long distance trips of up to 2000 km (McConnell et al. 1999).
However, this species occurrence in danish waters along the west coast of Jutland is limited to a
few individuals, for example a single pup has been documented in 2015 (Jensen et al. 2015). The
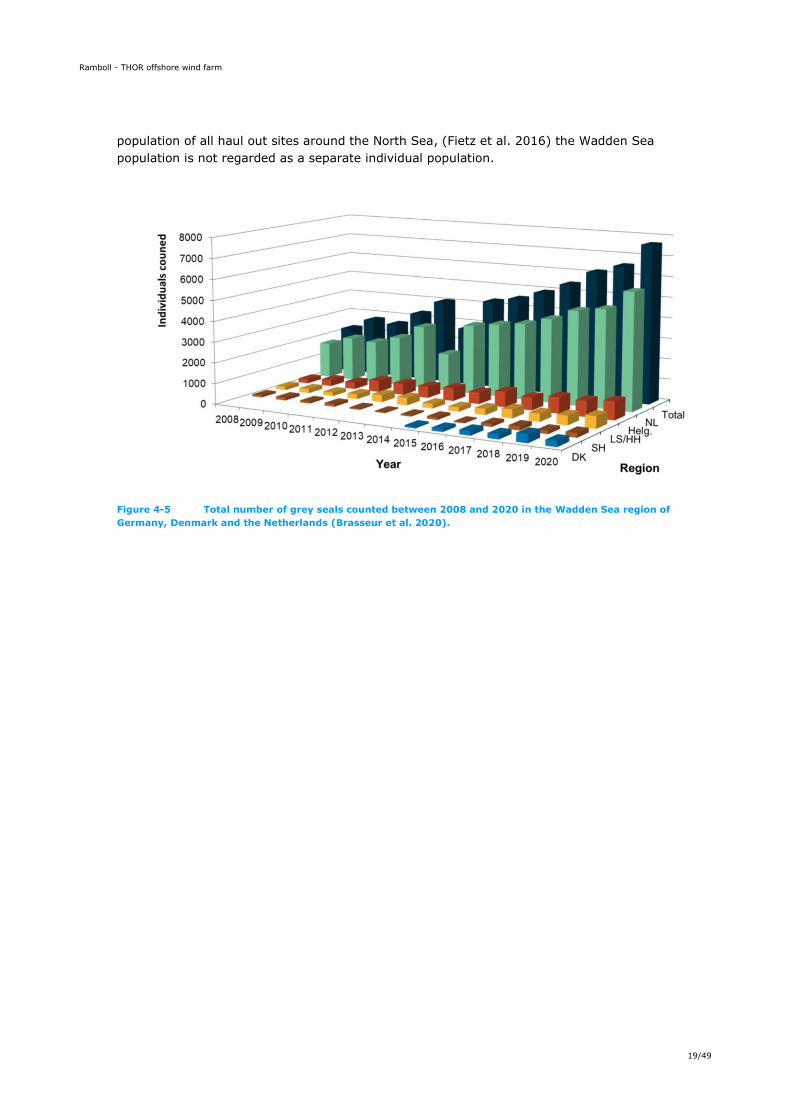
2020 grey seals report on the trilateral Wadden Sea counts (cooperation between Denmark,
Germany and the Netherlands) reported one pup and 267 adult grey seals in the Danish Wadden
Sea (Brasseur et al. 2020). As some individuals of the Wadden Sea population are deemed to be
visitors from UK-based populations (Brasseur et al. 2015), and genetic studies show a mixed
Ramboll - THOR offshore wind farm
19/49
population of all haul out sites around the North Sea, (Fietz et al. 2016) the Wadden Sea
population is not regarded as a separate individual population.
Figure 4-5 Total number of grey seals counted between 2008 and 2020 in the Wadden Sea region of
Germany, Denmark and the Netherlands (Brasseur et al. 2020).
Ramboll - THOR offshore wind farm
20/49
5. RESULTS
5.1 Aerial data analysis
5.1.1 Digital flight
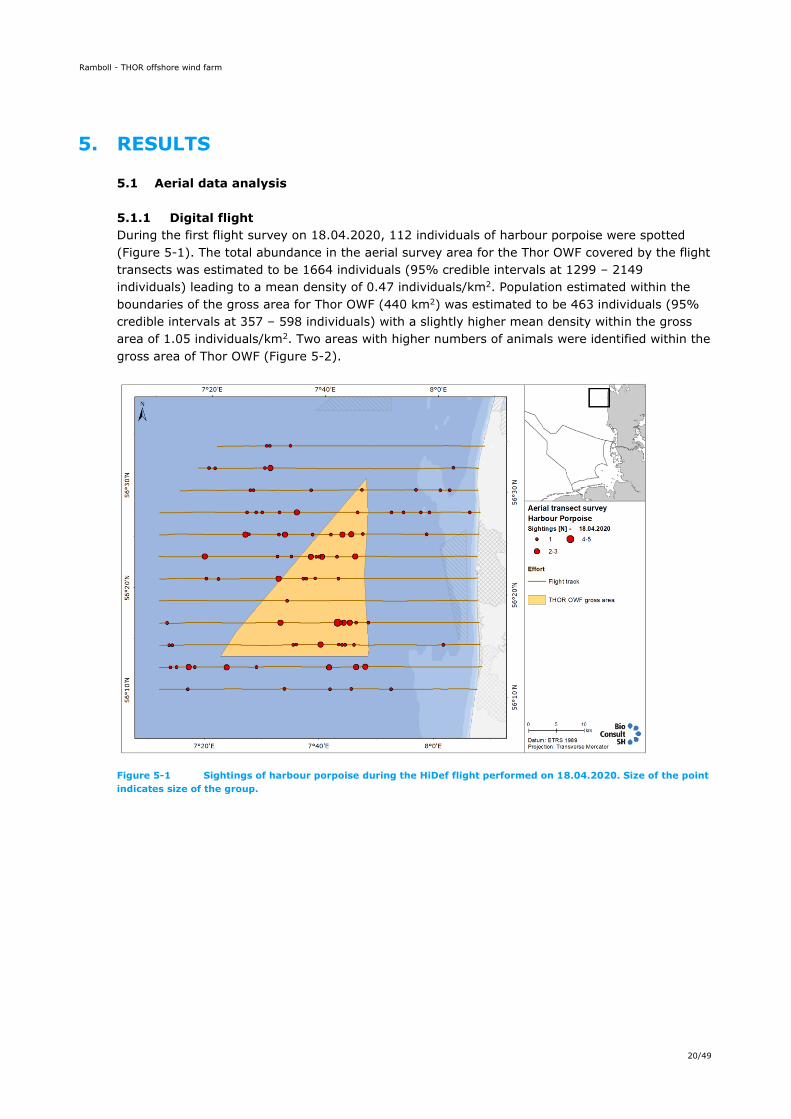
During the first flight survey on 18.04.2020, 112 individuals of harbour porpoise were spotted
(Figure 5-1). The total abundance in the aerial survey area for the Thor OWF covered by the flight
transects was estimated to be 1664 individuals (95% credible intervals at 1299 – 2149
individuals) leading to a mean density of 0.47 individuals/km2. Population estimated within the
boundaries of the gross area for Thor OWF (440 km2) was estimated to be 463 individuals (95%
credible intervals at 357 – 598 individuals) with a slightly higher mean density within the gross
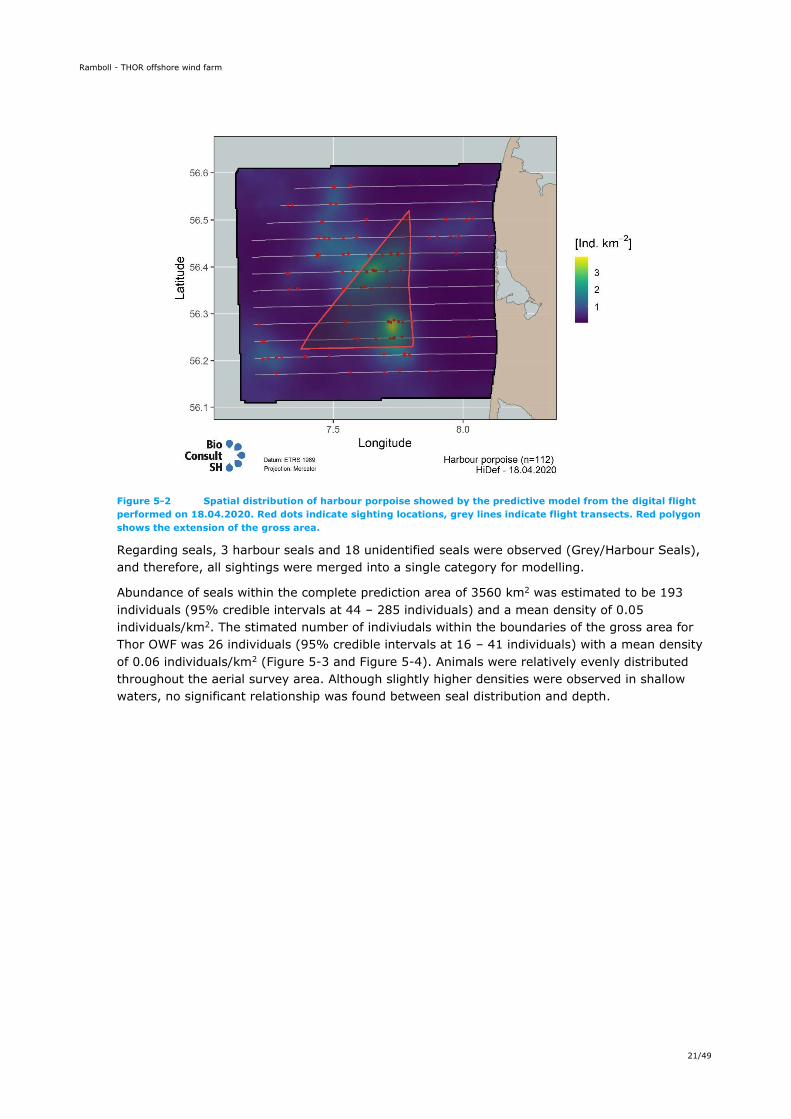
area of 1.05 individuals/km2. Two areas with higher numbers of animals were identified within the
gross area of Thor OWF (Figure 5-2).
Figure 5-1 Sightings of harbour porpoise during the HiDef flight performed on 18.04.2020. Size of the point
indicates size of the group.
Ramboll - THOR offshore wind farm
21/49
Figure 5-2 Spatial distribution of harbour porpoise showed by the predictive model from the digital flight
performed on 18.04.2020. Red dots indicate sighting locations, grey lines indicate flight transects. Red polygon
shows the extension of the gross area.
Regarding seals, 3 harbour seals and 18 unidentified seals were observed (Grey/Harbour Seals),
and therefore, all sightings were merged into a single category for modelling.
Abundance of seals within the complete prediction area of 3560 km2 was estimated to be 193
individuals (95% credible intervals at 44 – 285 individuals) and a mean density of 0.05
individuals/km2. The stimated number of indiviudals within the boundaries of the gross area for
Thor OWF was 26 individuals (95% credible intervals at 16 – 41 individuals) with a mean density
of 0.06 individuals/km2 (Figure 5-3 and Figure 5-4). Animals were relatively evenly distributed
throughout the aerial survey area. Although slightly higher densities were observed in shallow
waters, no significant relationship was found between seal distribution and depth.
Ramboll - THOR offshore wind farm
22/49
Figure 5-3 Sightings of seals during the HiDef flight performed on 18.04.2020. Only single individuals were
observed.
Figure 5-4 Spatial distribution of seal showed by the predictive model from the HiDef flight performed on
18.04.2020. Red dots indicate sighting locations and grey lines indicate flight transects. Black outlines show the
prediction area included in the modelling.
Ramboll - THOR offshore wind farm
23/49
5.1.2 Aerial observer data analysis
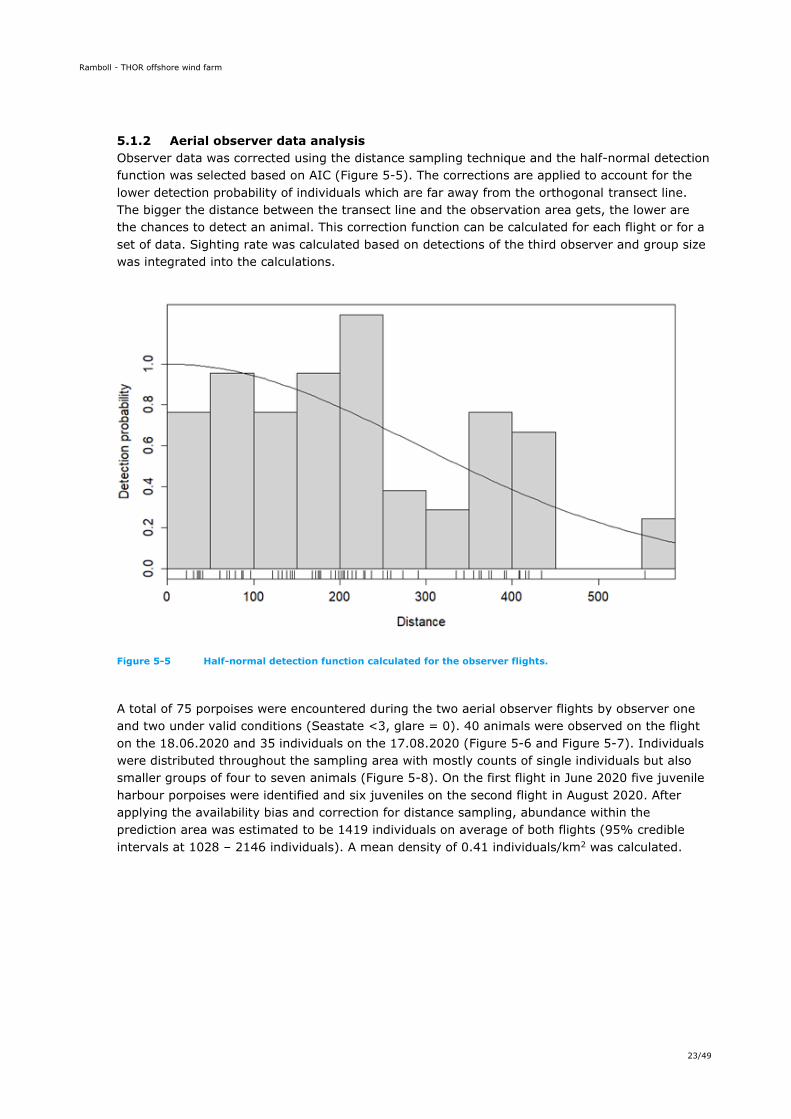
Observer data was corrected using the distance sampling technique and the half-normal detection
function was selected based on AIC (Figure 5-5). The corrections are applied to account for the
lower detection probability of individuals which are far away from the orthogonal transect line.
The bigger the distance between the transect line and the observation area gets, the lower are
the chances to detect an animal. This correction function can be calculated for each flight or for a
set of data. Sighting rate was calculated based on detections of the third observer and group size
was integrated into the calculations.
Figure 5-5 Half-normal detection function calculated for the observer flights.
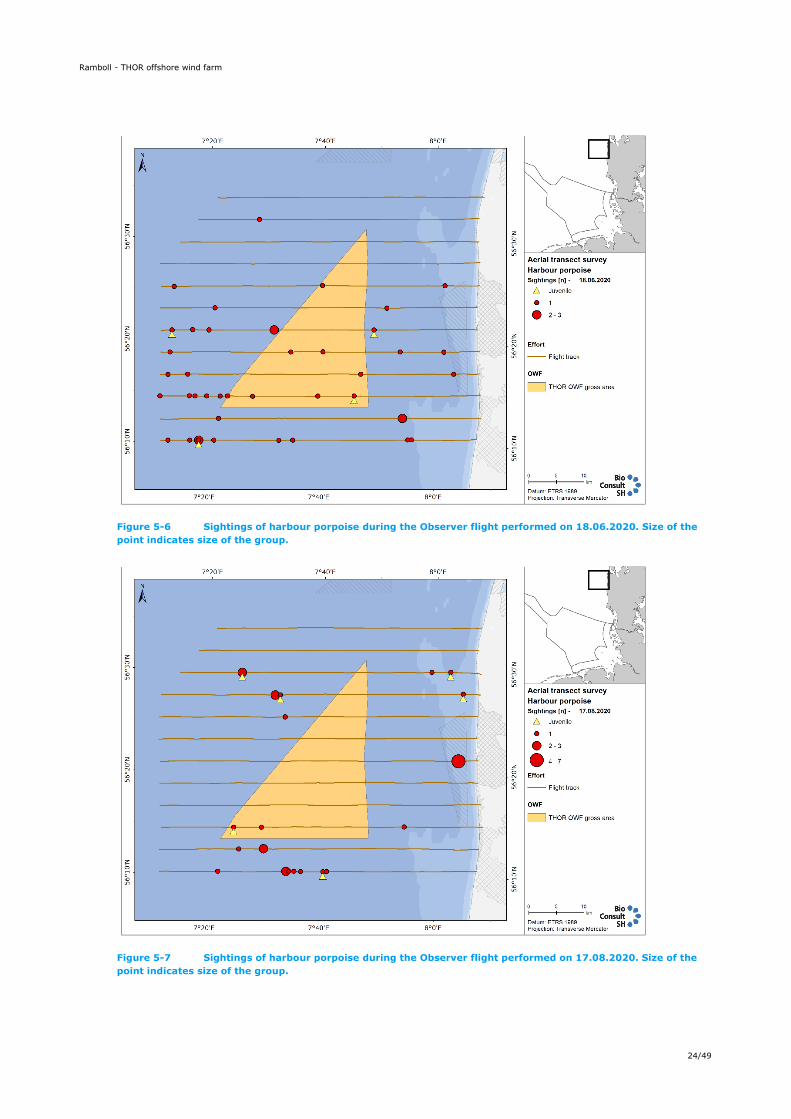
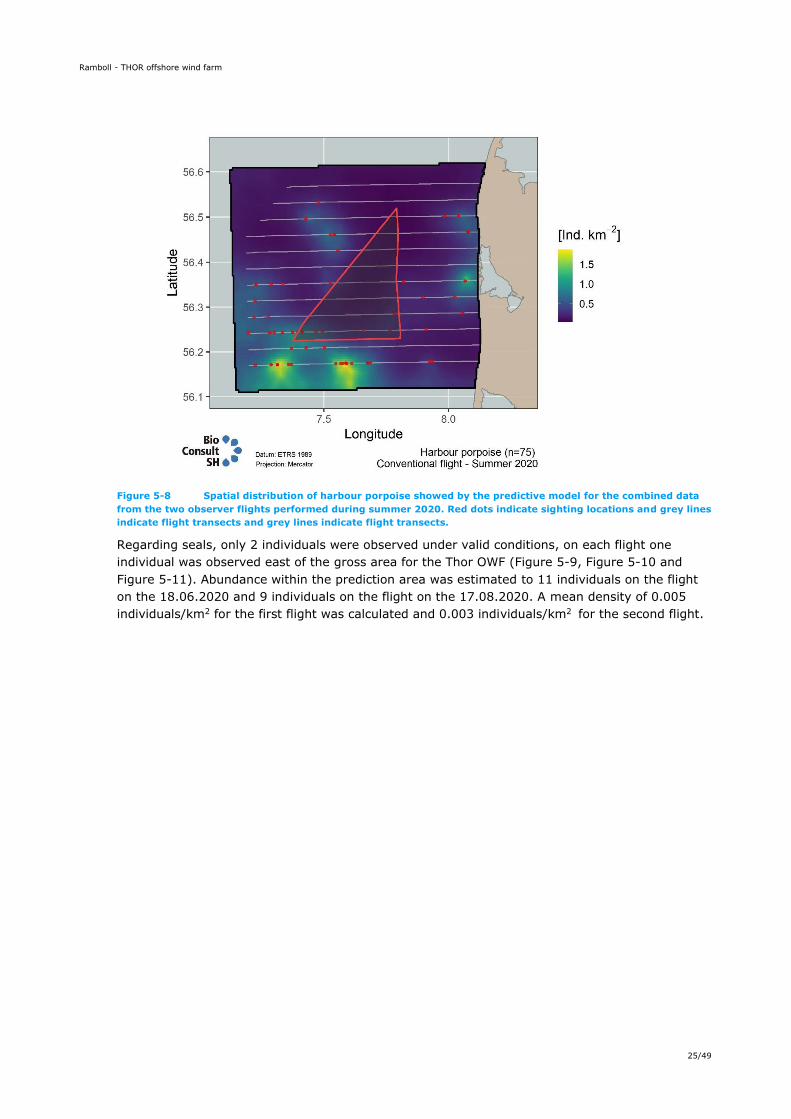
A total of 75 porpoises were encountered during the two aerial observer flights by observer one
and two under valid conditions (Seastate <3, glare = 0). 40 animals were observed on the flight
on the 18.06.2020 and 35 individuals on the 17.08.2020 (Figure 5-6 and Figure 5-7). Individuals
were distributed throughout the sampling area with mostly counts of single individuals but also
smaller groups of four to seven animals (Figure 5-8). On the first flight in June 2020 five juvenile
harbour porpoises were identified and six juveniles on the second flight in August 2020. After
applying the availability bias and correction for distance sampling, abundance within the
prediction area was estimated to be 1419 individuals on average of both flights (95% credible
intervals at 1028 – 2146 individuals). A mean density of 0.41 individuals/km2 was calculated.
Ramboll - THOR offshore wind farm
24/49
Figure 5-6 Sightings of harbour porpoise during the Observer flight performed on 18.06.2020. Size of the
point indicates size of the group.
Figure 5-7 Sightings of harbour porpoise during the Observer flight performed on 17.08.2020. Size of the
point indicates size of the group.
Ramboll - THOR offshore wind farm
25/49
Figure 5-8 Spatial distribution of harbour porpoise showed by the predictive model for the combined data
from the two observer flights performed during summer 2020. Red dots indicate sighting locations and grey lines
indicate flight transects and grey lines indicate flight transects.
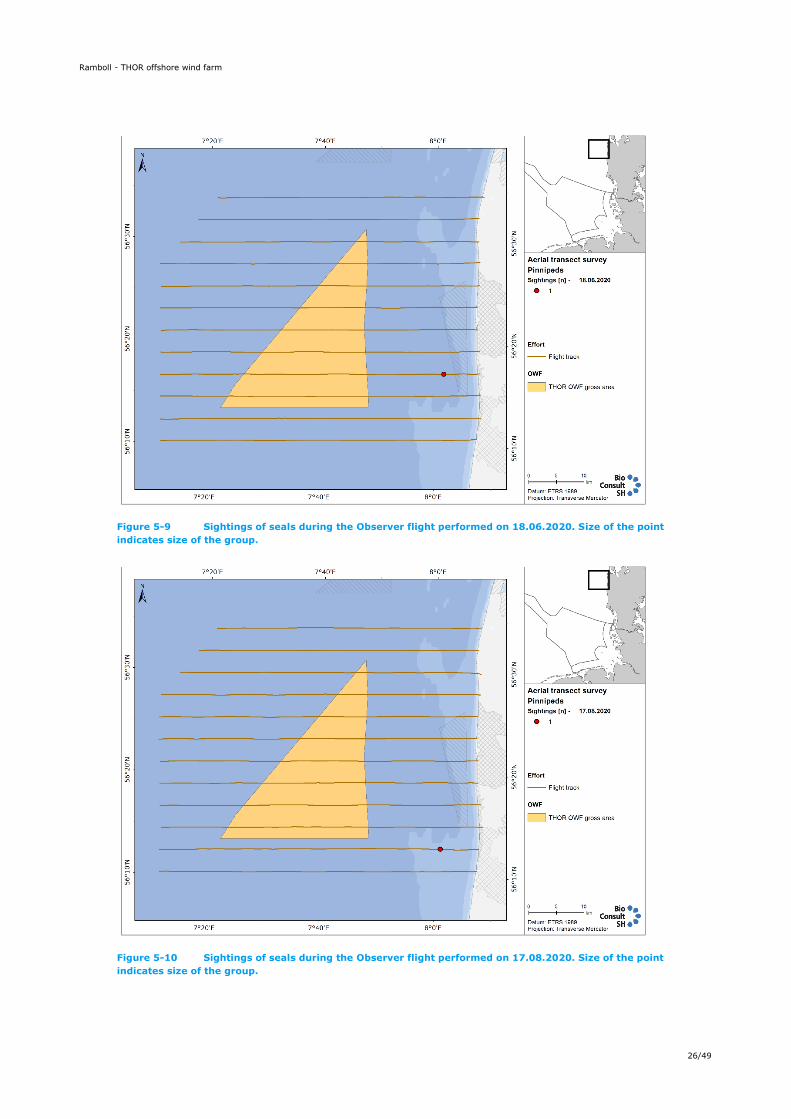
Regarding seals, only 2 individuals were observed under valid conditions, on each flight one
individual was observed east of the gross area for the Thor OWF (Figure 5-9, Figure 5-10 and
Figure 5-11). Abundance within the prediction area was estimated to 11 individuals on the flight
on the 18.06.2020 and 9 individuals on the flight on the 17.08.2020. A mean density of 0.005
individuals/km2 for the first flight was calculated and 0.003 individuals/km2 for the second flight.
Ramboll - THOR offshore wind farm
26/49
Figure 5-9 Sightings of seals during the Observer flight performed on 18.06.2020. Size of the point
indicates size of the group.
Figure 5-10 Sightings of seals during the Observer flight performed on 17.08.2020. Size of the point
indicates size of the group.
Ramboll - THOR offshore wind farm
27/49
Figure 5-11 Spatial distribution of seals showed by the predictive model for the combined data from the two
observer flights performed during summer 2020. Red dots indicate sighting locations and grey lines indicate
flight transects, black lines outline the prediction area.
5.2 Passive Acoustic Monitoring (PAM) data analysis
5.2.1 Data exploration
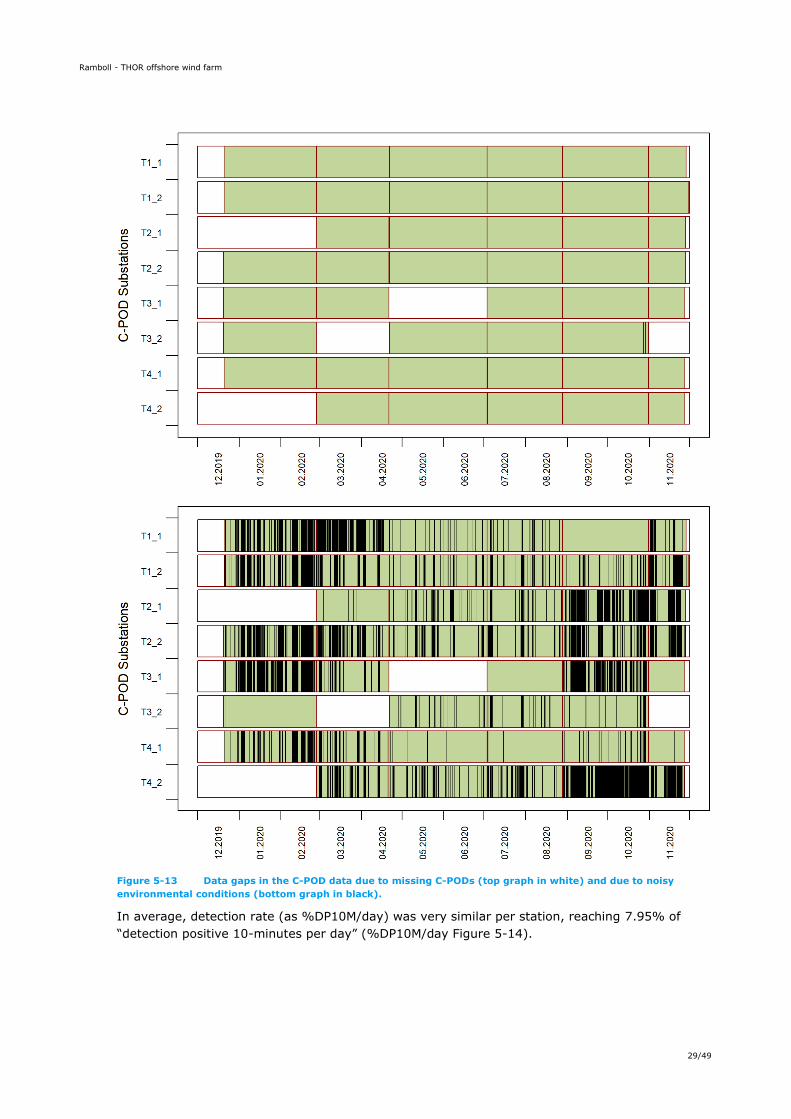
C-POD stations were deployed within the boundaries of the gross area for Thor OWF. Each
substation was collecting data during a period of 253 days in average. Overall, each of the 4 C-
POD stations was collecting data during the entire period, although some data gaps due to
environmental noise were found particularly during the winter season and when vessel activity
was high, for example during explorative survey campaigns (Table 5-1 and Figure 5-13). In total,
82.4% of the days were valid and could be used for analysis.
Table 5-1 Deployment and termination dates and number of days in operation by substation.
Station Substation Deployment Termination Number of days of deployment
Number of valid days
T1 T1_1 20.12.2019 28.11.2020 345 281
T1_2 20.12.2019 28.11.2020 347 287
T2 T2_1 27.02.2020 27.11.2020 275 250
T2_2 20.12.2019 27.11.2020 344 262
T3 T3_1 20.12.2019 27.11.2020 263 180
T3_2 20.12.2019 31.10.2020 264 255
T4 T4_1 20.12.2019 27.11.2020 344 318
T4_2 27.02.2020 27.11.2020 275 194
Ramboll - THOR offshore wind farm
28/49
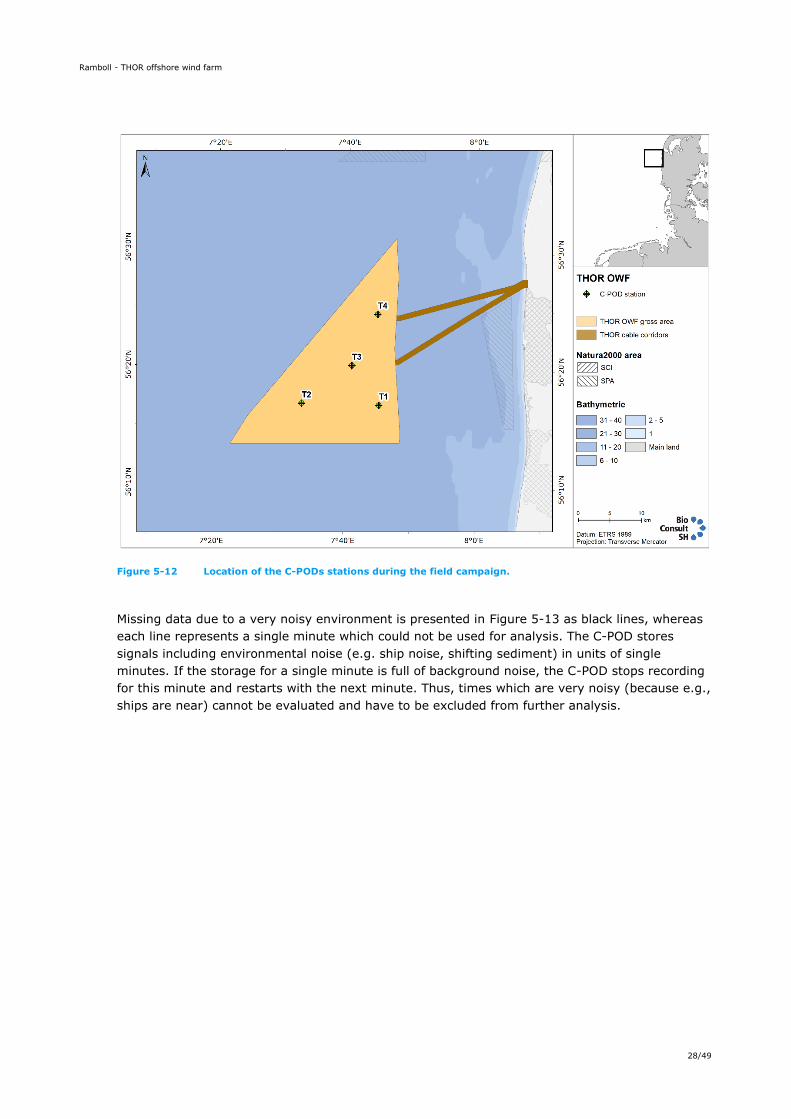
Figure 5-12 Location of the C-PODs stations during the field campaign.
Missing data due to a very noisy environment is presented in Figure 5-13 as black lines, whereas
each line represents a single minute which could not be used for analysis. The C-POD stores
signals including environmental noise (e.g. ship noise, shifting sediment) in units of single
minutes. If the storage for a single minute is full of background noise, the C-POD stops recording
for this minute and restarts with the next minute. Thus, times which are very noisy (because e.g.,
ships are near) cannot be evaluated and have to be excluded from further analysis.
Ramboll - THOR offshore wind farm
29/49
Figure 5-13 Data gaps in the C-POD data due to missing C-PODs (top graph in white) and due to noisy
environmental conditions (bottom graph in black).
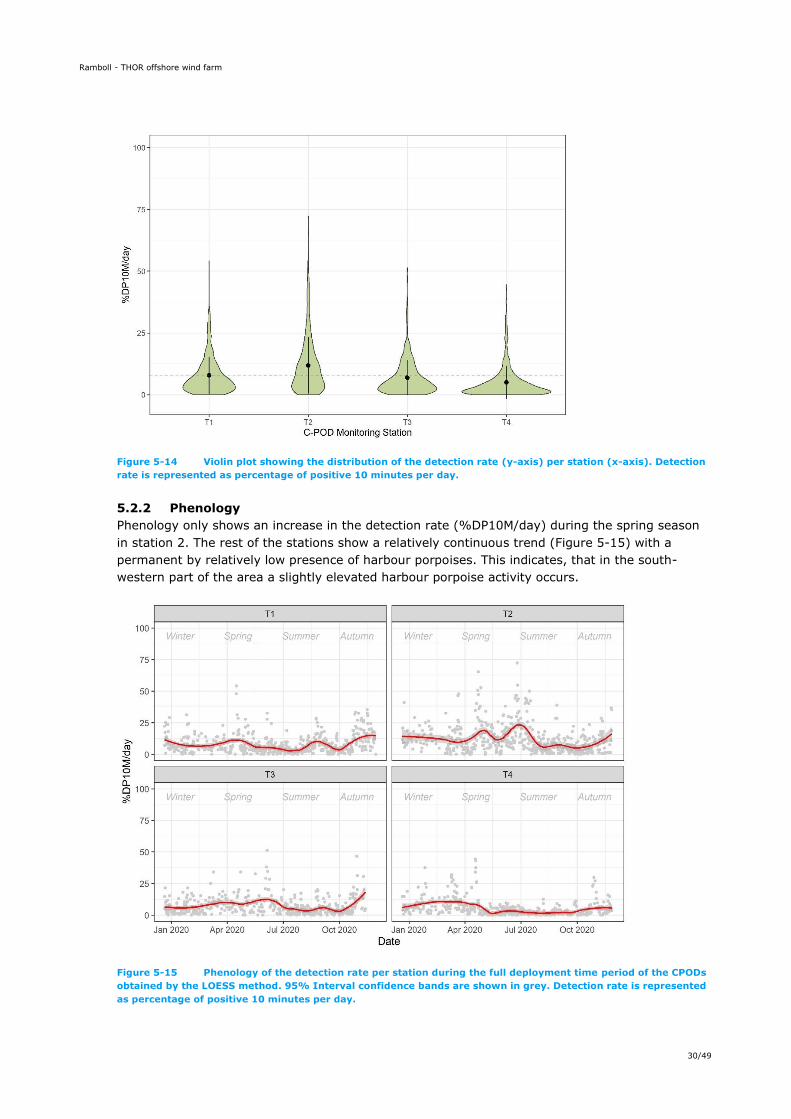
In average, detection rate (as %DP10M/day) was very similar per station, reaching 7.95% of
“detection positive 10-minutes per day” (%DP10M/day Figure 5-14).
Ramboll - THOR offshore wind farm
30/49
Figure 5-14 Violin plot showing the distribution of the detection rate (y-axis) per station (x-axis). Detection
rate is represented as percentage of positive 10 minutes per day.
5.2.2 Phenology
Phenology only shows an increase in the detection rate (%DP10M/day) during the spring season
in station 2. The rest of the stations show a relatively continuous trend (Figure 5-15) with a
permanent by relatively low presence of harbour porpoises. This indicates, that in the south-
western part of the area a slightly elevated harbour porpoise activity occurs.
Figure 5-15 Phenology of the detection rate per station during the full deployment time period of the CPODs
obtained by the LOESS method. 95% Interval confidence bands are shown in grey. Detection rate is represented
as percentage of positive 10 minutes per day.
Ramboll - THOR offshore wind farm
31/49
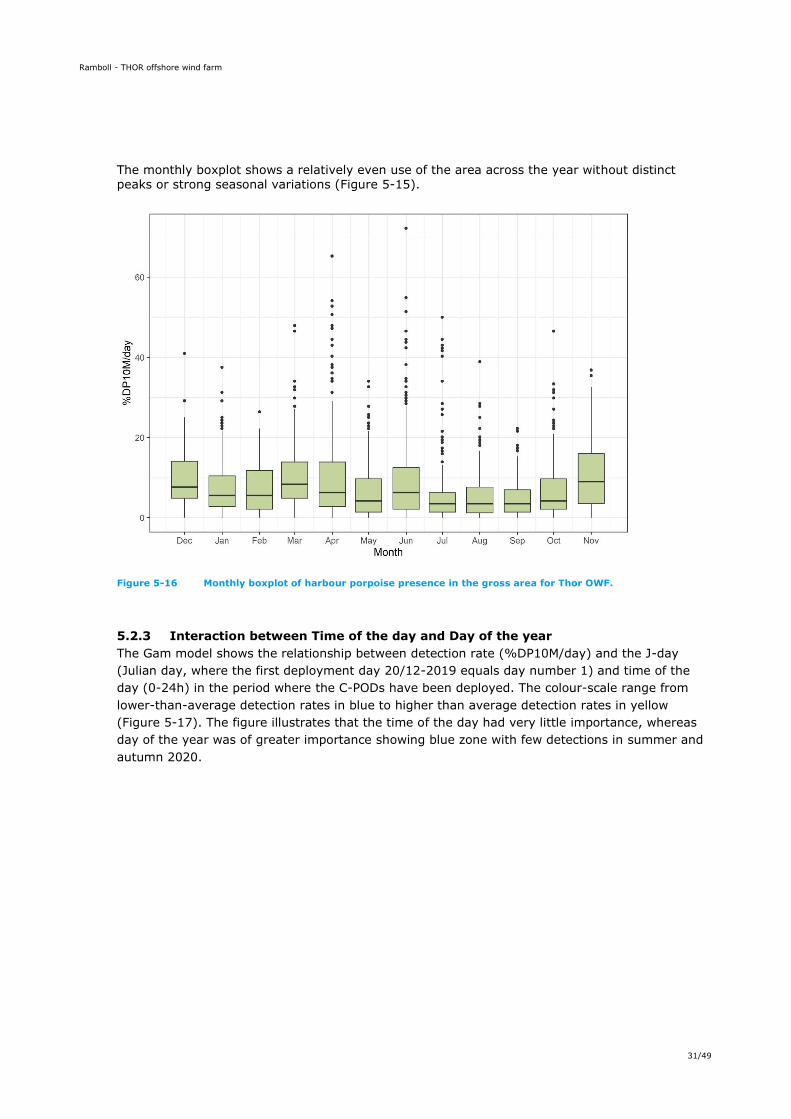
The monthly boxplot shows a relatively even use of the area across the year without distinct peaks or strong seasonal variations (Figure 5-15).
Figure 5-16 Monthly boxplot of harbour porpoise presence in the gross area for Thor OWF.
5.2.3 Interaction between Time of the day and Day of the year
The Gam model shows the relationship between detection rate (%DP10M/day) and the J-day
(Julian day, where the first deployment day 20/12-2019 equals day number 1) and time of the
day (0-24h) in the period where the C-PODs have been deployed. The colour-scale range from
lower-than-average detection rates in blue to higher than average detection rates in yellow
(Figure 5-17). The figure illustrates that the time of the day had very little importance, whereas
day of the year was of greater importance showing blue zone with few detections in summer and
autumn 2020.
Ramboll - THOR offshore wind farm
32/49
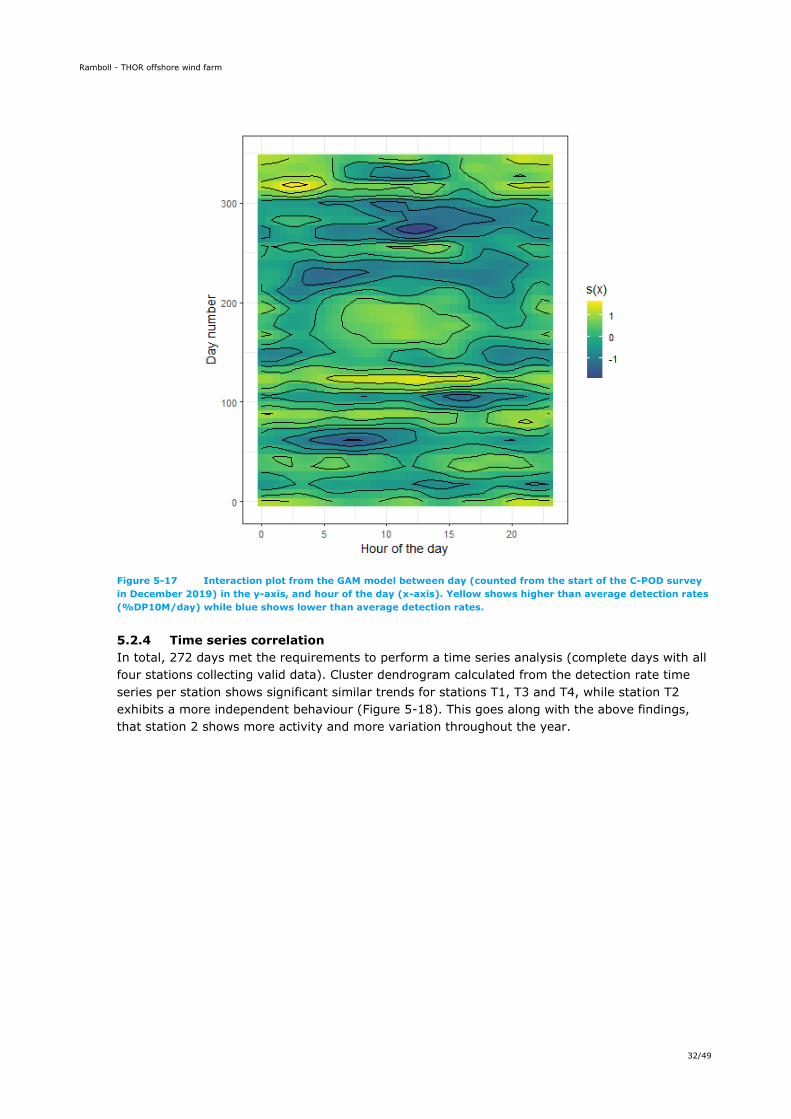
Figure 5-17 Interaction plot from the GAM model between day (counted from the start of the C-POD survey
in December 2019) in the y-axis, and hour of the day (x-axis). Yellow shows higher than average detection rates
(%DP10M/day) while blue shows lower than average detection rates.
5.2.4 Time series correlation
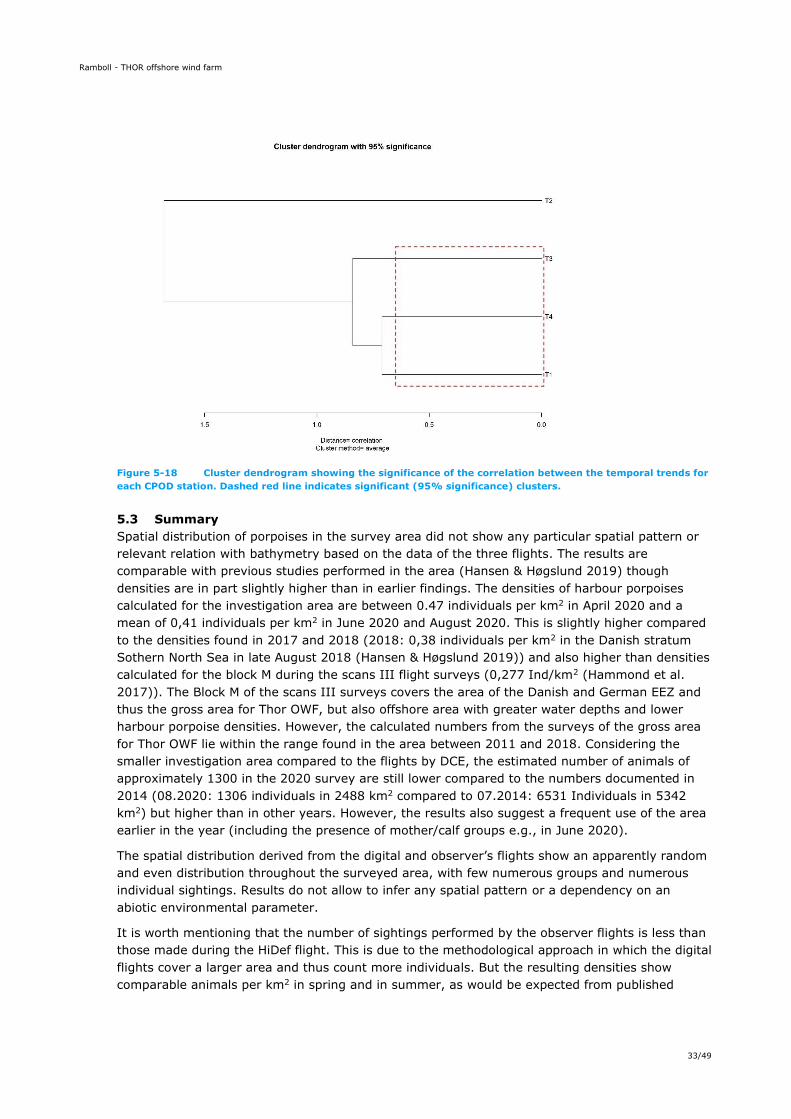
In total, 272 days met the requirements to perform a time series analysis (complete days with all
four stations collecting valid data). Cluster dendrogram calculated from the detection rate time
series per station shows significant similar trends for stations T1, T3 and T4, while station T2
exhibits a more independent behaviour (Figure 5-18). This goes along with the above findings,
that station 2 shows more activity and more variation throughout the year.
Ramboll - THOR offshore wind farm
33/49
Figure 5-18 Cluster dendrogram showing the significance of the correlation between the temporal trends for
each CPOD station. Dashed red line indicates significant (95% significance) clusters.
5.3 Summary
Spatial distribution of porpoises in the survey area did not show any particular spatial pattern or
relevant relation with bathymetry based on the data of the three flights. The results are
comparable with previous studies performed in the area (Hansen & Høgslund 2019) though
densities are in part slightly higher than in earlier findings. The densities of harbour porpoises
calculated for the investigation area are between 0.47 individuals per km2 in April 2020 and a
mean of 0,41 individuals per km2 in June 2020 and August 2020. This is slightly higher compared
to the densities found in 2017 and 2018 (2018: 0,38 individuals per km2 in the Danish stratum
Sothern North Sea in late August 2018 (Hansen & Høgslund 2019)) and also higher than densities
calculated for the block M during the scans III flight surveys (0,277 Ind/km2 (Hammond et al.
2017)). The Block M of the scans III surveys covers the area of the Danish and German EEZ and
thus the gross area for Thor OWF, but also offshore area with greater water depths and lower
harbour porpoise densities. However, the calculated numbers from the surveys of the gross area
for Thor OWF lie within the range found in the area between 2011 and 2018. Considering the
smaller investigation area compared to the flights by DCE, the estimated number of animals of
approximately 1300 in the 2020 survey are still lower compared to the numbers documented in
2014 (08.2020: 1306 individuals in 2488 km2 compared to 07.2014: 6531 Individuals in 5342
km2) but higher than in other years. However, the results also suggest a frequent use of the area
earlier in the year (including the presence of mother/calf groups e.g., in June 2020).
The spatial distribution derived from the digital and observer’s flights show an apparently random
and even distribution throughout the surveyed area, with few numerous groups and numerous
individual sightings. Results do not allow to infer any spatial pattern or a dependency on an
abiotic environmental parameter.
It is worth mentioning that the number of sightings performed by the observer flights is less than
those made during the HiDef flight. This is due to the methodological approach in which the digital
flights cover a larger area and thus count more individuals. But the resulting densities show
comparable animals per km2 in spring and in summer, as would be expected from published
Ramboll - THOR offshore wind farm
34/49
migration dynamics and modelling (Gilles et al. 2016). In addition, the detection rate obtained
from the C-POD data does not suggest a lower use of the area during the summer season.
In a similar way, for seals, even if the number of detections was very low (21 sightings during the
HiDef flight and 2 combined sightings during the observer flights) and densities are slightly higher
in shallower waters, there is not enough evidence to conclude that the species distribution is
driven by the bathymetry or marine traffic.
These observations seem to be confirmed by the temporal series of detection rate provided by the
four C-POD stations placed within the gross area for Thor OWF. Excluding station T2, the rest of
stations did not show any remarkable temporal pattern. On the other hand, station T2 showed an
increase in detections during the spring season and an overall slightly elevated activity level.
However, elevated vessel traffic for ground investigation in the gross area of the Thor OWF and in
parts very close to the C-POD-Stations may be the reason for a temporarily low presence of
marine mammals in the assessment area.
Average detection rates (%DP10M/day) among all stations of 9.75% is similar to those found by
previous studies in near areas like Horns Rev 3 (Nehls et al. 2014) and slightly higher than found
for example during the investigations for the OWF Vesterhav Syd (with an average of 6.74% of
detection positive 10-minute intervals or OWF Vesterhav Nord (with 5.97% 10-minute-intervals
with harbour porpoise detections (Vesterhav Nord. EIA - backgound report. ATR09 marine
mammals 2015, Vesterhav Syd. EIA - background Report. ATR09 marine mammals 2015). In
addition, C-POD data did not show any diurnal trend of the detection rate, although higher
positive rates could be observed during the spring season. These findings in combination with
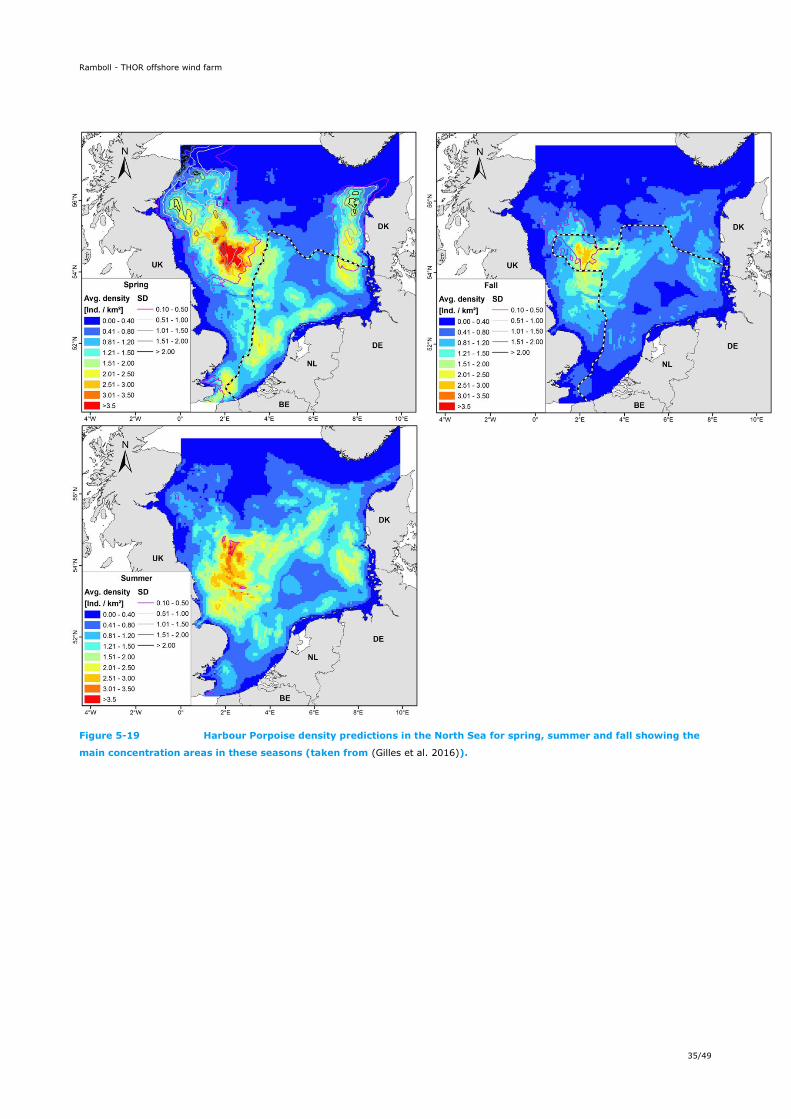
findings of previous studies and large scale modelling of the reference population (Figure 5-19 an
e.g. Gilles et al. (2016)) indicate a low to moderate importance of the area for harbour porpoises
and a very low importance of the area for seals.
Ramboll - THOR offshore wind farm
35/49
Figure 5-19 Harbour Porpoise density predictions in the North Sea for spring, summer and fall showing the
main concentration areas in these seasons (taken from (Gilles et al. 2016)).
Ramboll - THOR offshore wind farm
36/49
6. SENSITIVITY ANALYSIS
6.1 Method for mapping of baseline conditions
The assessment of the potential effects on marine mammals is based on current knowledge of
environmental conditions in and around the gross area for the Thor OWF. Additional field surveys
of the marine mammal baseline surveys conducted between 2011 – 2019 (see chapter 4.1) are
also considered.
6.2 Method to identify potential impacts
The most likely significant impacts of the plan's implementation and reasonable alternatives are
assessed based on the baseline mapping, taking into account the plan's objectives and
geographical scope. In this context, an environmental impact is understood to mean a potential
conflict between the plan and a given environmental parameter. This can be in the form of
conflicts with existing or planned area use within the gross area protection interests or
environmental goals. This report assesses potential impacts of the plan on the marine mammals.
The plan does not contain a description of specific installation patterns, turbine types, location of
high-voltage stations, etc. and is therefore not a framework for the later specific project but must
serve to give the public and responsible authorities an overall impression of which impacts the
realization of Thor OWF might cause on the environment. The assessment of potential impacts is
therefore carried out at a general level (though assuming a base case for piling activities as laid
out in the Thor noise report (ITAP 2020 p. 2020). In a potential later EIA phase, it will be possible
to assessed environmental impacts of the specific project and a specific layout of the wind
turbines in more detail.
As part of the assessment of the overall extent and significance of the impact, it is considered
whether the impact can be reduced by optimization measures or mitigation measures.
6.3 Sensitivity of species present and effects on population level
For the analysis of the potential effects on marine mammals the report focusses on the three
main species: harbour porpoises, harbour seals and grey seals. It is assumed that all other
species occurring rarely as guests in the area are covered by all measures taken to protect these
three species. From these three species the harbour porpoise is seen as the most sensible species
since only harbour porpoises rely on their auditory system to detect prey via an echolocating
system. Thus, a damage of the auditory system can lead to a short- or long-term starvation of
harbor porpoises and thus leads to a violation of article 12 of the Flora-Fauna-Habitats-Directive.
Compared to the seal species, the auditory system of porpoises is more sensible to effects of
harmful noise (e.g., by having a lower threshold level to experience short- or long-term hearing
losses), thus all measures to protect harbour porpoises do also include the protection of seal
species.
Effects on population levels are difficult to assess and different approaches have been tested
including a certain number of individuals that can be removed from a population before an effect
occurs (the potential biological removal figure PBR) or an iPCoD model (Interim Population
Consequences of Disturbance (Nabe-Nielsen & Harwood 2016)). The most straight forward index
however is the 1%-criterion, which is used to assess how many individuals of a population unit
are affected. If the affected percentage is higher as one percent this is assumed to be a high level
of impact with negative consequences on a population level. An assumed population size of
345.373 individuals would thus experience negative effects if 3354 animals are affected.
For harbour seals it is not known whether animals occurring in the construction area are coming
from the colonies in Limfjorden or belong to a colony of the Wadden Sea. Telemetry studies have
Ramboll - THOR offshore wind farm
37/49
shown, that especially younger seals conduct foraging trips of several weeks leading from their
place of tagging in the Danish Wadden Sea south of Esbjerg north west, as well along the coast as
through open waters (Tougaard et al. 2003). Thus, occurrence of seals from the Danish Wadden
Sea in the gross area for the Thor OWF is likely. It is thus assumed that the relevant population
size is a combination of the Wadden Sea individuals and the Limfjorden individuals leading to
approximately 42.000 animals. This corresponds not only with the 2019 numbers given above but
also to earlier estimates from recent reports of the Trilateral Seal Expert Group (TSEG). Thus 420
negatively affects harbour seals would be enough to reach the 1%-criterion.
6.4 Impact of underwater noise
Pile driving is in general seen as the main source of potential harmful underwater noise (Bailey et
al. 2010, Tougaard et al. 2012, Skjellerup et al. 2015, Aarts et al. 2018, Rose et al. 2019). A
single hammer blow or a series of blows have the potential to elicit injuries in the auditory tissue
of mammals and thus impair their hearing ability and (in species relying on their auditory system
to hunt for prey) their ability to identify and locate prey. The thresholds of onset of behavioral
changes and of a reversible or non-reversible damage (temporal / permanent threshold shift
TTS/PTS) have been topics of investigations in harbour porpoises and seals for the last 15 years
((Southall et al. 2007, 2019, Lucke et al. 2008, 2009, Tougaard et al. 2009, 2012, Dähne et al.
2014, Skjellerup et al. 2015, Russell et al. 2016). Nevertheless, a range of weighted and
unweighted threshold values has been used in assessments in the last years. For the impacts of
pile driving in this report data and threshold values from itap GmbH (ITAP 2020) given in Figure
6-1 are used though these values and their correct calculation and weighting is under discussion
(Mikaelsen 2015, Tougaard et al. 2015, Tougaard & Dähne 2017, Tougaard & Michaelsen 2018,
2020).
6.5 Potential impacts and sensitivity of marine mammals
In the following potential impacts of the planned Thor OWF and cable corridors for marine
mammals are assessed. The Danish Energy Agency has prepared a scoping report, which
determines which environmental issues are to be included in a later SEA and at what level they
are to be assessed (Energistyrelsen, 2020). In the delimitation report, the environmental issues
that are likely to be affected by the implementation of the offshore wind farms are identified.
This initial assessment deals with the potential sources of impacts at an overall level, as the
expected impacts will depend on the specific project including choice of turbine types and number,
the locations for the individual turbines, foundation methods, etc.
The potential effects on marine mammals caused by the establishment of Thor OWF and the
relevant project phases are:
- Disturbance, reversible and/or permanent threshold shifts in marine mammals during
piling (and to a lesser extend during decommissioning)
Minor impacts are:
- Disturbance caused by vessel traffic
- Disturbance cause by suspended sediments during cable laying
- Permanent habitat loss by footprint of foundations
- Temporary habitat loss (scour protection, cable protection and construction activities)
- Habitat change
The degree of impact ranks impacts in three levels (“high”, “medium” and “low”) whereas impacts
leading to a potential injury of animals is always ranked in the category “high” while effects
Ramboll - THOR offshore wind farm
38/49
leading to disturbance or behavioural changes can be ranked between “high” and “low” depending
on the number of affected animals, the sensitivity of animals and a potential effect on population
level.
As pointed out above, effects with major impact on marine mammals are expected during the
construction phase especially during piling of offshore foundations. Though additional noise by
emissions from the turbines during the operational phase can be measured, these emissions are
at very low frequencies and of low energy and thus have very short ranges. Because the emitted
frequencies are mostly in the lower Hz range, they are more relevant to larger, low-frequency
marine mammals (Marmo et al. 2013). Studies could show, that harbour porpoises return to
windfarm areas after the construction period and occur to the same extend within the windfarms
as outside, with effects of piling lasting from a few hours up to several days (Nabe-Nielsen et al.
n.d., Brandt et al. 2018, Rose et al. 2019). In addition, earlier studies show that offshore wind
farms might provide a valuable habitat due the exclusion of fishing activities and species richness
due to the artificial structures as stony reefs and vertical piles (Andersson & Öhman 2010).
Compared to the potentially positive effects of the new structures and the overall size of the
marine mammal’s habitat, the habitat loss due to the footprints of the scour-protection or the
monopile itself is neglectable. Disturbance by vessel traffic can have a negative effect on marine
mammals, especially on harbour porpoises. It has been shown, that harbour porpoises react to an
approaching vessel with either a reduction of vocalisation and a reduction of activity or fleeing
(Wisniewska et al. 2018, Roberts et al. 2019). Thus, vessel traffic should be carefully assessed
and managed, and measure taken e.g., to reduce vessel speed or channel the traffic on regular
lanes. Sediment spill and thus reduced visibility in water is not regarded as a major effect because
all marine mammal species have the option to avoid areas with high levels of dissolved sediments
or orientate using their acoustic senses. Harbour porpoises and seals are adapted to life in coastal
waters and are able to locate prey at low visibility (Dehnhardt et al. 2001, 2003, Verfuß et al.
2009). Harbour porpoises have shown that they not only use their echolocation to identify prey
objects and home in on these, but also use their echolocation for spatial orientation and for
identifying objects as landmarks (Verfuß et al. 2005).
The focus in this assessment thus lies on the only major negative effect of the construction
period:
To assess the range of potential injuries or disturbance and the number of affected individuals the
range of the threshold criteria given in the Underwater Noise Report are translated into affected
areas and affected number animals is calculated. Disturbance is included because this is a
stressor leading to behavioural changes as leaving an optimal habitat or reducing the hunt for
food and the nutritional status of animals (effects are modelled e.g. Nabe Nielsen et al (Nabe-
Nielsen et al. 2014, 2018, n.d.). This eventually leads to animals in a reduced physical state,
reduced reproduction rates and can thus have effects on the population level. A graphical example
taken from a virtual position from the Underwater Noise report (ITAP 2020) of the affected area
for seals and harbour porpoise is shown in Figure 6-2 and Figure 6-3. Values for the range of
threshold noise criteria are taken as well from the Underwater Noise Report for the Thor OWF
gross area as shown in Figure 6-1 (ITAP 2020). For eliciting a PTS or TTS a cumulative sound
exposure level SELcum) is used, assuming a noise dose which a marine mammal receives during
a complete piling event. For disturbance, a sound exposure level (SEL) of a single hammer blow is
used to calculate the impact range. This leads to very similar impact ranges for TTS and
disturbance.
Ramboll - THOR offshore wind farm
39/49
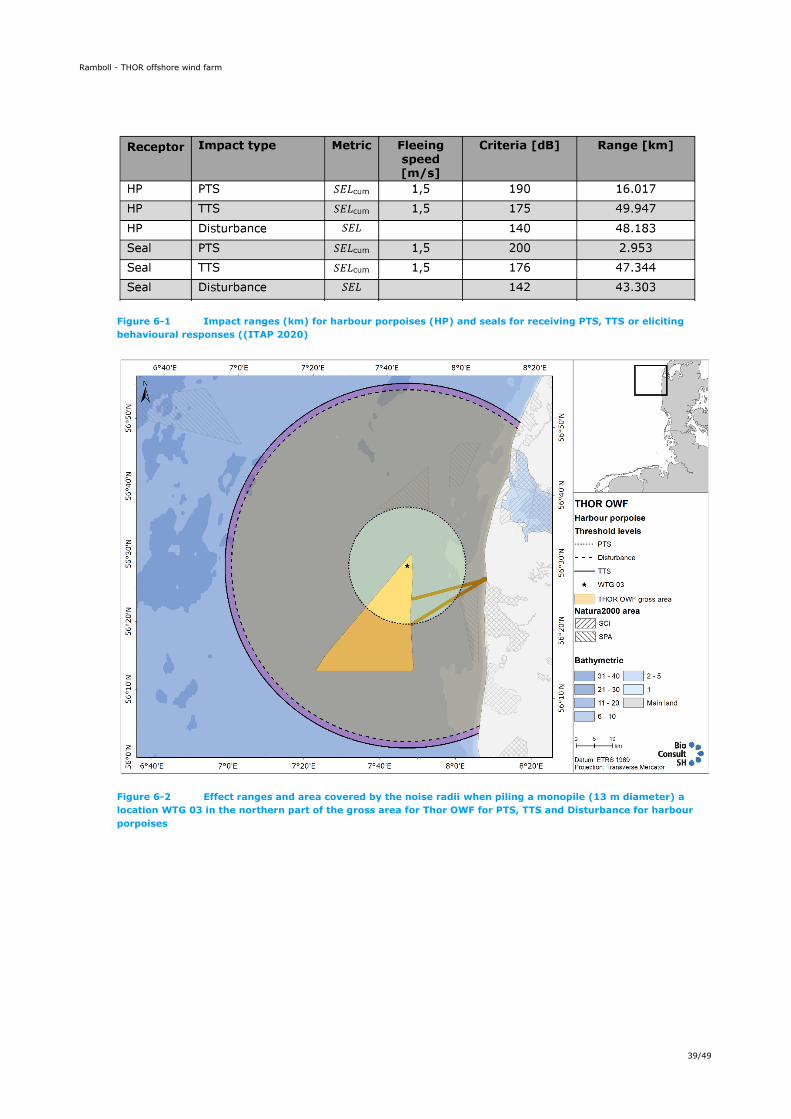
Figure 6-1 Impact ranges (km) for harbour porpoises (HP) and seals for receiving PTS, TTS or eliciting
behavioural responses ((ITAP 2020)
Figure 6-2 Effect ranges and area covered by the noise radii when piling a monopile (13 m diameter) a
location WTG 03 in the northern part of the gross area for Thor OWF for PTS, TTS and Disturbance for harbour
porpoises
Ramboll - THOR offshore wind farm
40/49
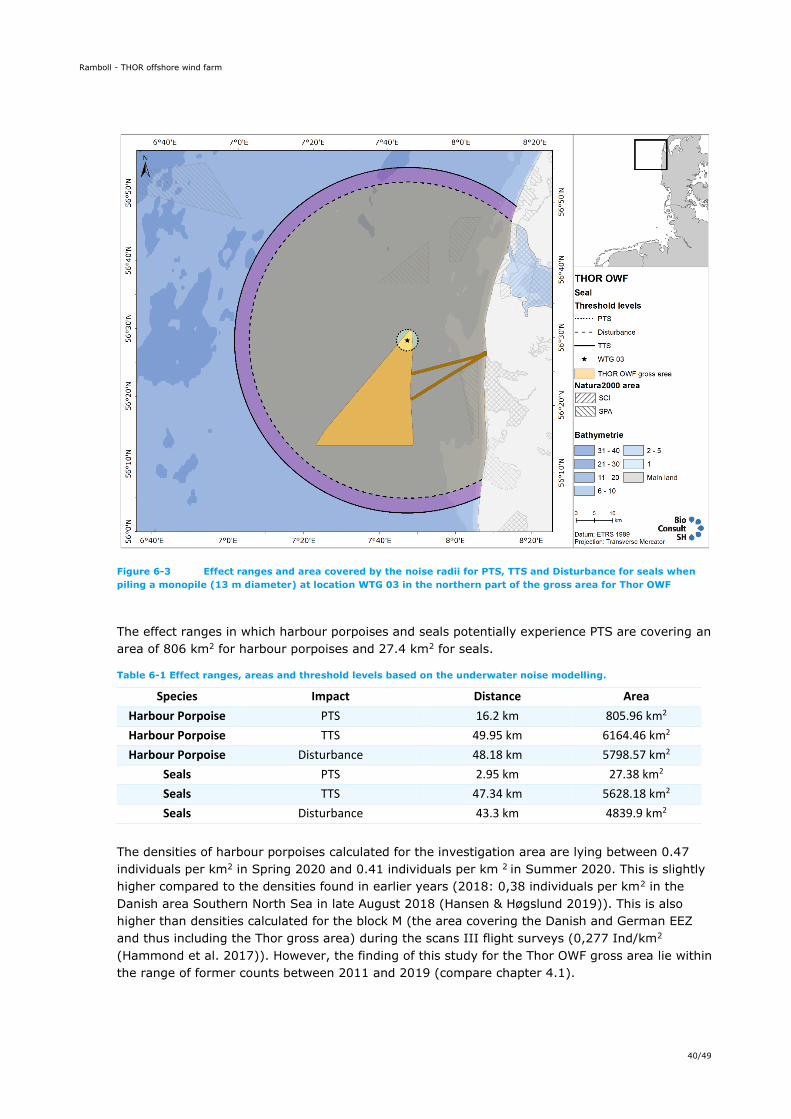
Figure 6-3 Effect ranges and area covered by the noise radii for PTS, TTS and Disturbance for seals when
piling a monopile (13 m diameter) at location WTG 03 in the northern part of the gross area for Thor OWF
The effect ranges in which harbour porpoises and seals potentially experience PTS are covering an
area of 806 km2 for harbour porpoises and 27.4 km2 for seals.
Table 6-1 Effect ranges, areas and threshold levels based on the underwater noise modelling.
Species Impact Distance Area
Harbour Porpoise PTS 16.2 km 805.96 km2
Harbour Porpoise TTS 49.95 km 6164.46 km2
Harbour Porpoise Disturbance 48.18 km 5798.57 km2
Seals PTS 2.95 km 27.38 km2
Seals TTS 47.34 km 5628.18 km2
Seals Disturbance 43.3 km 4839.9 km2
The densities of harbour porpoises calculated for the investigation area are lying between 0.47
individuals per km2 in Spring 2020 and 0.41 individuals per km 2 in Summer 2020. This is slightly
higher compared to the densities found in earlier years (2018: 0,38 individuals per km2 in the
Danish area Southern North Sea in late August 2018 (Hansen & Høgslund 2019)). This is also
higher than densities calculated for the block M (the area covering the Danish and German EEZ
and thus including the Thor gross area) during the scans III flight surveys (0,277 Ind/km2
(Hammond et al. 2017)). However, the finding of this study for the Thor OWF gross area lie within
the range of former counts between 2011 and 2019 (compare chapter 4.1).
Ramboll - THOR offshore wind farm
41/49
Seal densities reach maximum densities of 0,05 Ind/km2 pooled for both species present in the
area in spring 2020 and 0.005 Ind/km2 pooled for both species in summer 2020. Based on the
very low and random counts of grey seals, the estimated population size of 42.000 harbour seals
is used as size of the biogeographical population.
Table 6-2 gives an overview of the affected number of individuals and percentage of the total
biogeographical population as an indicator for the effect level for PTS, TTS and Disturbance. As a
conservative approach the higher density from Summer 2020 is used for the calculation for
harbour porpoises and from Spring 2020 for seals. The densities calculated for June 2020 for
harbour porpoises are high compared to earlier findings, thus the number of affected individuals is
most likely lower than given in Table 6-2. Also, the densities used for the estimates of affected
seals in spring is high, so the number of affected animals is most likely lower as given in this
conservative approach.
Table 6-2 Effect areas, affected number of individuals and affected percentage of the population per species and
impact.
Species Impact Area (km2) Ind/km2 Affected individuals
Population size
Affected population
(%)
HP PTS 805.96 0.47 379 345.373 0.11
HP TTS 6164.46 0.47 2897 345.373 0.84
HP Disturbance 5798.57 0.47 2725 345.373 0.79
Seals PTS 27.38 0.05 1 42.000 0.003
Seals TTS 5628.18 0.05 281 42.000 0.7
Seals Disturbance 4839.9 0.05 242 42.000 0.6
Based on the calculation in Table 6-2 a piling event under the prerequisites given in the
underwater noise modelling (e.g., a monopile with 13m diameter and a maximum blow energy of
3000kJ and no noise mitigation) would not cause PTS on more than one percent of the population
of harbour porpoises and seals. However, the number of harbour porpoises eventually
experiencing PTS is calculated to be up to 379 individuals and virtually all porpoises in the
investigation area can be affected by TTS or at least disturbance. Under these assumptions up to
1.6% of the population receive a TTS or are disturbed by piling noise. Due to the very low number
of seals in the area, seals are at very low risk of experiencing PTS, but are affected by potential
TTS or disturbance. The options to reduce the proportion of affected individuals by applying
mitigation measures are described in chapter 6.7.
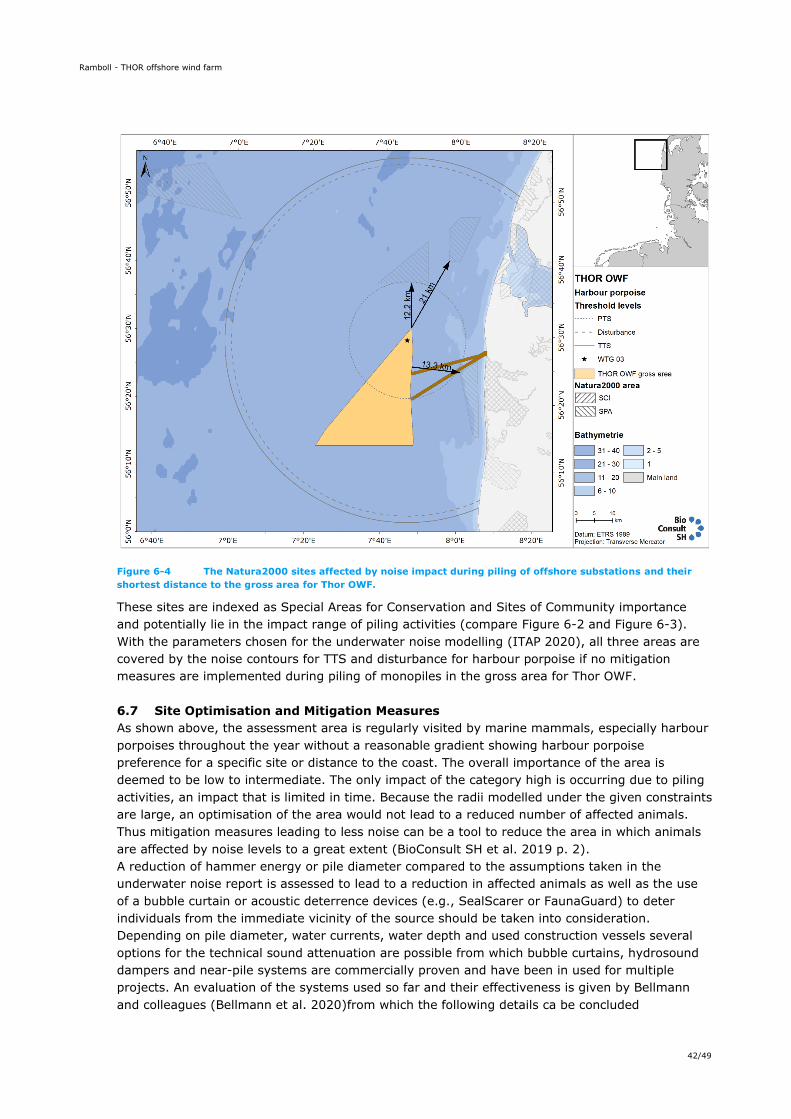
6.6 Natura2000 and Species protection
East and north of the gross area for the Thor OWF are three Natura 2000 sites located which list
as species from Article 4 of directive 2009/147/EC and Annex II of the habitats directive
92/43/EEC the harbour porpoise as present (but not seals), namely “Thyborøn Stenvolde”
(DK00VA348, Habitat-area H256), “Sandbanker ud for Thyborøn” (DK00VA340, Habitat-area
H253) and “Sandbanker ud for Thorsminde” (DK00VA341, Habitat-area H220) Figure 6-4.
Ramboll - THOR offshore wind farm
42/49
Figure 6-4 The Natura2000 sites affected by noise impact during piling of offshore substations and their
shortest distance to the gross area for Thor OWF.
These sites are indexed as Special Areas for Conservation and Sites of Community importance
and potentially lie in the impact range of piling activities (compare Figure 6-2 and Figure 6-3).
With the parameters chosen for the underwater noise modelling (ITAP 2020), all three areas are
covered by the noise contours for TTS and disturbance for harbour porpoise if no mitigation
measures are implemented during piling of monopiles in the gross area for Thor OWF.
6.7 Site Optimisation and Mitigation Measures
As shown above, the assessment area is regularly visited by marine mammals, especially harbour
porpoises throughout the year without a reasonable gradient showing harbour porpoise
preference for a specific site or distance to the coast. The overall importance of the area is
deemed to be low to intermediate. The only impact of the category high is occurring due to piling
activities, an impact that is limited in time. Because the radii modelled under the given constraints
are large, an optimisation of the area would not lead to a reduced number of affected animals.
Thus mitigation measures leading to less noise can be a tool to reduce the area in which animals
are affected by noise levels to a great extent (BioConsult SH et al. 2019 p. 2).
A reduction of hammer energy or pile diameter compared to the assumptions taken in the
underwater noise report is assessed to lead to a reduction in affected animals as well as the use
of a bubble curtain or acoustic deterrence devices (e.g., SealScarer or FaunaGuard) to deter
individuals from the immediate vicinity of the source should be taken into consideration.
Depending on pile diameter, water currents, water depth and used construction vessels several
options for the technical sound attenuation are possible from which bubble curtains, hydrosound
dampers and near-pile systems are commercially proven and have been in used for multiple
projects. An evaluation of the systems used so far and their effectiveness is given by Bellmann
and colleagues (Bellmann et al. 2020)from which the following details ca be concluded
Ramboll - THOR offshore wind farm
43/49
1) Single/double bubble curtains (sBBC, dBBC): Bubble curtains are effective when used in
water depths of less than 40m and at low water current. At water depth of around 25m
single bubble curtains reach an attenuation of 11-15dB, while double bubble curtains
reach at the same water depth twice the attenuation of 14-18dB.
2) HydroSoundDamper (HSD): the HSD has been used in project with water depth up to
40m and reached attenuation values of 11-12dB. The HSD can be combined with a BBC or
dBBC and then reaches an attenuation of 15-20dB
3) Near-Pile IHC Noise mitigation screen (NMS): The NMS is combined with a gripper and
upending tool, thus providing the installation hardware as well as a mitigation system.
The NMS attenuates the source level by 13-17dB, in combinations with bubble curtains up
to 23dB.
Depending on the source level and the technical set-up, these systems have the capability to
substantially reduce the noise which is emitted into the environment. However, their use can be
limited by strong currents and technical details. A thorough evaluation should be performed when
foundation type and construction details are assessed and decided upon.
6.8 Knowledge GAP
Existing long-term data of the marine mammal distribution in the North Sea in combination with
the 2019/2020 field work for the Thor OWF area provides a solid and sufficient database for the
initial impact assessment for marine mammals. The option to compare findings with flight data
from 2011 to 2019 and with investigations for near-by areas for offshore wind farms provides
sufficient information, thus knowledge gaps for the context of this technical report could not be
identified.
Ramboll - THOR offshore wind farm
44/49
7. LITERATURE
AAREFJORD, H., BJORGE, A. J., KINZE, C. & LINDSTEDT, I. 1995. Diet of the harbour porpoise
(Phocoena phocoena) in Scandinavian waters. Pp. 211–222 Biology of the Phocoenids. A
collection of papers. The International Whaling Commission, Cambridge (GBR).
AARTS, G., BRASSEUR, S. & KIRKWOOD, R. 2018. Behavioural response of grey seals to pile-
driving. P. 54. Wageningen Marine Research (University & Research centre), Wageningen
(NLD).
ANDERSEN, L. & OLSEN, M. T. 2010. Distribution and population structure of North Atlantic
harbour seals (Phoca vitulina). NAMMCO Scientific Publications 8:15.
ANDERSEN, S. M., TEILMANN, J., HARDERS, P. B., HANSEN, E. H. & HJØLLUND, D. 2007. Diet of
harbour seals and great cormorants in Limfjord, Denmark: interspecific competition and
interaction with fishery. ICES Journal of Marine Science 64:1235–1245.
ANDERSSON, M. H. & ÖHMAN, M. C. 2010. Fish and sessile assemblages associated with wind-
turbine constructions in the Baltic Sea. Marine and Freshwater Research 61:642–650.
BACHL, F. E., LINDGREN, F., BORCHERS, D. L. & ILLIAN, J. B. 2019. inlabru: an R package for
Bayesian spatial modelling from ecological survey data. Methods in Ecology and Evolution
10:760–766. Wiley Online Library.
BAILEY, H., SENIOR, B., SIMMONS, D., RUSIN, J., PICKEN, G. & THOMPSON, P. M. 2010.
Assessing underwater noise levels during pile-driving at an offshore windfarm and its
potential effects on marine mammals. Marine Pollution Bulletin 60:888–897.
BELLMANN, M. A., MAY, A., WENDT, T., GERLACH, S., REMMERS, P. & BRINKMANN, J. 2020.
Unterwasserschall während des Impulsrammverfahrens: Einflussfaktoren auf Rammschall
und technische Möglichkeiten zur Einhaltung von Lärmschutzwerten Akronym: ERa -
Bericht. P. 130 + 8. Abschlussbericht, Itap GmbH, Oldenburg (DEU).
BENKE, H. & SIEBERT, U. 1994. Zur Situation der Kleinwale im Wattenmeer und in der
südöstlichen Nordsee. Pp. 309–316 Warnsignale aus dem Wattenmeer. gbv.
BIOCONSULT SH, ROSE, A., BRANDT, M., VILELA, R., DIEDERICHS, A., SCHUBERT, A., KOSAREV,
V., NEHLS, G., VOLKENANDT, M., WAHL, V., MICHALIK, A., WENDELN, H., FREUND, A.,
KETZER, C., LIMMER, B., LACZNY, M. & PIPER, W. 2019. Effects of noise-mitigated
offshore pile driving on harbour porpoise abundance in the German Bight 2014-2016
(Gescha 2).
BJØRGE, A. & TOLLEY, K. A. 2009. Harbour porpoise Phocoena phocoena. Pp. 530–533
Encyclopedia of Marine Mammals (2nd edition). Academic Press, Burlington,MA.
BÖRJESSON, P., BERGGREN, P. & GANNING, B. 2003. Diet of harbor porpoises in the Kattegat
and Skagerrak seas: accounting for individual variation and sample size. Marine Mammal
Science 19:38–58.
BRANDT, M. J. 2016. Can diel rhythms of harbour porpoise click recordings reveal information on
foraging behaviour and prey choice? Poster zur 30th Annual Conference of the European
Cetacean Society, Madeira, Portugal.
BRANDT, M. J., DRAGON, A.-C., DIEDERICHS, A., BELLMANN, M., WAHL, V., PIPER, W., NABE-
NIELSEN, J. & NEHLS, G. 2018. Disturbance of harbour porpoises during construction of
the first seven offshore wind farms in Germany. Marine Ecology Progress Series 596:213–
232.
BRASSEUR, S., CARIUS, F., DIEDERICHS, B., GALATIUS, A., JESS, A., KÖRBER, P., SCHOP, J.,
SIEBERT, U., TEILMANN, J., BIE THØSTESEN, C. & KLÖPPER, S. 2020. EG-Seals grey seal
surveys in the Wadden Sea and Helgoland in 2019-2020. Common Wadden Sea
Secretariat, Wilhelmshaven (DEU).
BRASSEUR, S. M. J. M., VAN POLANEN PETEL, T. D., GERRODETTE, T., MEESTERS, E. H. W. G.,
REIJNDERS, P. J. H. & AARTS, G. 2015. Rapid recovery of Dutch gray seal colonies fueled
by immigration. Marine Mammal Science 31:405–426.
BRÖKER, K. C. A., HANSEN, R. G., LEONARD, K. E., KOSKI, W. R. & HEIDE-JØRGENSEN, M. P.
2019. A comparison of image and observer based aerial surveys of narwhal. Marine
Mammal Science:1–27.
Ramboll - THOR offshore wind farm
45/49
BUCKLAND, S. T., ANDERSON, D. R., BURNHAM, K. P., LAAKE, J. L., BORCHERS, D. L. & THOMAS,
L. 2001. Introduction to distance sampling estimating abundance of biological populations
(1st edition). Oxford University Press, Oxford (UK). 452 pp.
BUNDESAMT FÜR SEESCHIFFFAHRT UND HYDROGRAPHIE (Ed.). 2013. Investigation of the
impacts of offshoe wind turbines on marine environment (StUK4). Hamburg & Rostock
(DEU). 86 pp.
CLAUSEN, K. T., WAHLBERG, M., BEEDHOLM, K., DERUITER, S. & MADSEN, P. T. 2010. Click
communication in harbour porpoises Phocoena phocoena. Bioacoustics 20:1–28.
DÄHNE, M., PESCHKO, V., GILLES, A., LUCKE, K., ADLER, S., RONNENBERG, K. & SIEBERT, U.
2014. Marine mammals and windfarms: Effects of alpha ventus on harbour porpoises. Pp.
133–149 in Federal Maritime and Hydrographic Agency & Federal Ministry for the
Environment, Nature Conservation and Nuclear Safety (eds.). Ecological Research at the
Offshore Windfarm alpha ventus – Challenges, Results and Perspectives. Springer
Spektrum.
DEHNHARDT, G., MAUCK, B., HANKE, W. & BLECKMANN, H. 2001. Hydrodynamic trail-following in
harbor seals (Phoca vitulina). Science 293:102–104.
DEHNHARDT, G., MAUCK, B. & HYVÄRINEN, H. 2003. The functional significance of the vibrissal
system of marine mammals. Pp. 127–135 The Merkel Cell. Springer.
FIETZ, K., GALATIUS, A., TEILMANN, J., DIETZ, R., FRIE, A. K., KLIMOVA, A., PALSBØLL, P. J.,
JENSEN, L. F., GRAVES, J. A., HOFFMAN, J. I. & OLSEN, M. T. 2016. Shift of grey seal
subspecies boundaries in response to climate, culling and conservation. Molecular Ecology
25:4097–4112.
GALATIUS, A., BRASSEUR, S., BUSCH, J. A., CREMER, J., CZECK, R., JESS, A., DIEDERICHS, B.,
KÖRBER, P., PUND, R., SIEBERT, U., TEILMANN, J. & THØSTESEN, B. 2019. Trilateral
surveys of Harbour Seals in the Wadden Sea and Helgoland in 2019. Common Wadden
Sea Secretariat, Wilhelmshaven (DEU).
GILLES, A., VIQUERAT, S., BECKER, E. A., FORNEY, K. A., GEELHOED, S. C. V., HAELTERS, J.,
NABE‐NIELSEN, J., SCHEIDAT, M., SIEBERT, U. & SVEEGAARD, S. 2016. Seasonal habitat‐
based density models for a marine top predator, the harbor porpoise, in a dynamic
environment. Ecosphere 7:e01367.
HALL, A. J., WATKINS, J. & HAMMOND, P. S. 1998. Seasonal variation in the diet of harbour seals
in the south-western North Sea. Marine Ecology Progress Series 170:269–281.
HAMMOND, P. S., LACEY, C., GILLES, A., VIQUERAT, S., BÖRJESSON, P., HERR, H., MACLEOD, K.,
RIDOUX, V., SANTOS, M. B., SCHEIDAT, M., TEILMANN, J., VINGADA, J. & ØIEN, N. 2017.
Estimates of cetacean abundance in European Atlantic waters in summer 2016 from the
SCANS-III aerial and shipboard surveys. P. 40. JNCC.
HANSEN, B. J. L. & HARDING, K. C. 2006. On the potential impact of harbour seal predation on
the cod population in the eastern North Sea. Journal of Sea Research 56:329–337.
HANSEN, J. W. & HØGSLUND, S. 2019. Marine områder 2018. NOVANA. P. 156. Aarhus
Universitet, DCE – Nationalt Center for Miljø og Energi, Aarhus (DNK).
ICES (Ed.). 2014. General advice on OSPAR request on implementation of MSFD for marine
mammals. ICES advice 2014, Book 1: 1.6.6.1.
ITAP. 2020. Thor offshore wind farm. Underwater noise. ITAP, Oldenburg (DEU).
JAUNIAUX, T., GARIGLIANY, M.-M., LOOS, P., BOURGAIN, J.-L., BOUVEROUX, T., COIGNOUL, F.,
HAELTERS, J., KARPOUZOPOULOS, J., PEZERIL, S. & DESMECHT, D. 2014. Bite injuries of
grey seals (Halichoerus grypus) on harbour porpoises (Phocoena phocoena). PLOS ONE 9.
JENSEN, L. F., GALATIUS, A. & TEILMANN, J. 2015. First report on a newborn grey seal pup
(Halichoerus grypus) in the Danish Wadden Sea since the 16th Century. Marine
Biodiversity Records 8:e131.
KASTELEIN, R. A., BUNSKOEK, P., HAGEDOORN, M., AU, W. W. L. & DE HAAN, D. 2002.
Audiogram of a harbor porpoise (Phocoena phocoena) measured with narrow-band
frequency-modulated signals. The Journal of the Acoustical Society of America 112:334–
344.
KASTELEIN, R. A., HOEK, L., WENSVEEN, P. J., TERHUNE, J. M. & DE JONG, C. A. 2010. The effect
of signal duration on the underwater hearing thresholds of two harbor seals (Phoca
Ramboll - THOR offshore wind farm
46/49
vitulina) for single tonal signals between 0.2 and 40 kHz. The Journal of the Acoustical
Society of America 127:1135–1145.
KASTELEIN, R. A., VAN DE VOORDE, S. & JENNINGS, N. 2018. Swimming speed of a harbor
porpoise (Phocoena phocoena) during playbacks of offshore pile driving sounds. Aquatic
Mammals 44:92–99.
KLIMOVA, A., PHILLIPS, C. D., FIETZ, K., OLSEN, M. T., HARWOOD, J., AMOS, W. & HOFFMAN, J.
I. 2014. Global population structure and demographic history of the grey seal. Molecular
Ecology 23:3999–4017.
KOSCHINSKI, S., DIEDERICHS, A. & AMUNDIN, M. 2008. Click train patterns of free-ranging
harbour porpoises acquired using T-PODs may be useful as indicators of their behaviour.
Journal of Cetacean Research and Management 10:147–155.
KRUSCHKE, J. 2014. Doing Bayesian data analysis: A tutorial with R, JAGS, and Stan (2nd).
Boston: Academic Press.
LEE A. MILLER & MAGNUS WAHLBERG. 2013. Echolocation by the harbour porpoise: life in coastal
waters. P. 6. Institute of Biology University of Southern Denmark, Odense.
LEOPOLD, M. F., BEGEMAN, L., VAN BLEIJSWIJK, J. D. L., IJSSELDIJK, L. L., WITTE, H. J. &
GRÖNE, A. 2015. Exposing the grey seal as a major predator of harbour porpoises.
Proceedings of the Royal Society B: Biological Sciences 282:20142429.
LINDGREN, F., RUE, H. & LINDSTRÖM, J. 2011. An explicit link between Gaussian fields and
Gaussian Markov random fields: the stochastic partial differential equation approach.
Journal of the Royal Statistical Society: Series B (Statistical Methodology) 73:423–498.
Wiley Online Library.
LUCKE, K., LEPPER, P., BLANCHET, M.-A. & SIEBERT, U. 2008. Testing the acoustic tolerance of
harbour porpoise hearing for impulsive sounds.
LUCKE, K., SIEBERT, U., LEPPER, P. A. & BLANCHET, M.-A. 2009. Temporary shift in masked
hearing thresholds in a harbor porpoise ( Phocoena phocoena ) after exposure to seismic
airgun stimuli. The Journal of the Acoustical Society of America 125:4060–4070.
MARMO, B., ROBERTS, I., BUCKINGHAM, M. P., KING, S. & BOOTH, C. 2013. Modelling of noise
effects of operational offshore wind turbines including noise transmission through various
foundation types. Scottish Government, Edinburgh (GBR).
MCCONNELL, B. J., FEDAK, M. A., LOVELL, P. & HAMMOND, P. S. 1999. Movements and foraging
areas of grey seals in the North Sea. Journal of Applied Ecology 36:573–590.
MIKAELSEN, M. A. 2015. Kriegers Flak Offshore Wind Farm. Underwater Noise Modelling. EIA -
Technical Report.
NABE-NIELSEN, J., VAN BEEST, F. M., GRIMM, V., SIBLY, R. M., TEILMANN, J. & THOMPSON, P.
M. 2018. Predicting the impacts of anthropogenic disturbances on marine populations.
Conservation Letters 11:e12563.
NABE-NIELSEN, J. & HARWOOD, J. 2016. Comparison of the iPCoD and DEPONS models for
modelling population consequences of noise on harbour porpoises. Aarhus Universitet,
DCE – Nationalt Center for Miljø og Energi, Aarhus (DNK).
NABE-NIELSEN, J., SIBLY, R. M., TOUGAARD, J., TEILMANN, J. & SVEEGAARD, S. 2014. Effects of
noise and by-catch on a Danish harbour porpoise population. Ecological Modelling
272:242–251.
NABE-NIELSEN, J., TOUGAARD, J., TEILMANN, J. & SVEEGAARD, S. (n.d.). Effects of wind farms
on harbour porpoise behavior and population dynamics. P. 48. Danish Centre for
Environment and Energy, Aarhus University, 2011.
NEHLS, G., MUELLER-BLENKLE, C., DORSCH, M., GIRARDELLO, M., GAUGER, M., LACZNY, M.,
MEYER-LÖBBECKE, A. & WENGST, N. 2014. Horns Rev 3 Offshore Wind Farm. Marine
Mammals. Endbericht für Energinet.dk., Orbicon, BioConsult SH & IfAÖ, Frederica, Husum
& Neu Brodersdorf.
NORTH ATLANTIC MARINE MAMMAL COMMISSION (NAMMCO). 2016. Report of the Coastal Seals
Working Group, Reykjavik, Iceland.
R CORE TEAM. 2020. R: A language and environment for statistical computing. R Foundation for
Statistical Computing, Vienna, Austria.
Ramboll - THOR offshore wind farm
47/49
REIJNDERS, P. J. 1992. Harbour porpoises Phocoena phocoena in the North Sea: Numerical
responses to changes in environmental conditions. Netherlands Journal of Aquatic Ecology
26:75–85.
ROBERTS, L., COLLIER, S., LAW, S. & GAION, A. 2019. The impact of marine vessels on the
presence and behaviour of harbour porpoise (Phocoena phocoena) in the waters off Berry
Head, Brixham (South West England). Ocean & Coastal Management 179:104860.
ROSE, A., BRANDT, M. J., VILELA, R., DIEDERICHS, A., SCHUBERT, A., KOSAREV, V., NEHLS, G.,
VOLKENANDT, M., WAHL, V., MICHALIK, A., WENDELN, H., FREUND, A., KETZER, C.,
LIMMER, B., LACZNY, M. & PIPER, W. 2019. Effects of noise-mitigated offshore pile driving
on harbour porpoise abundance in the German Bight 2014-2016 (Gescha 2). P. 193. Final
Report, Husum (DEU).
RUE, H., MARTINO, S., LINDGREN, F., SIMPSON, D., RIEBLER, A. & KRAINSKI, E. 2009. INLA:
functions which allow to perform a full Bayesian analysis of structured additive models
using Integrated Nested Laplace Approximation. R package version 0.0.
RUSSELL, D. J. F., HASTIE, G. D., THOMPSON, D., JANIK, V. M., HAMMOND, P. S., SCOTT-
HAYWARD, L. A. S., MATTHIOPOULOS, J., JONES, E. L. & MCCONNELL, B. J. 2016.
Avoidance of wind farms by harbour seals is limited to pile driving activities. Journal of
Applied Ecology 53:1642–1652.
SANTOS, M. B. & PIERCE, G. J. 2003. The diet of harbour porpoise (Phocoena phocoena) in the
northeast Atlantic. Oceanography and Marine Biology: an Annual Review 41:355–390.
SKJELLERUP, P., MAXON, C., TARPGAARD, E., THOMSEN, F., SCHACK, H. B., TOUGAARD, J. &
HEILSKOV, N. F. 2015. Marine mammals and underwater noise in relation to pile driving.
report of working group: Energinet.dk.
SOUTHALL, B. L., BOWLES, A. E., ELLISON, W. T., FINNERAN, J. J., GENTRY, R. L., GREENE, C.
R., KASTAK, D., KETTEN, D. R., MILLER, J. H., NACHTIGALL, P. E., RICHARDSON, W. J.,
THOMAS, J. A. & TYACK, P. L. 2007. Marine Mammal Noise Exposure Criteria: Initial
Scientific Recommendations. Aquatic Mammals 33:411–521.
SOUTHALL, B. L., FINNERAN, J. J., REICHMUTH, C., NACHTIGALL, P. E., KETTEN, D. R., BOWLES,
A. E., ELLISON, W. T., NOWACEK, D. P. & TYACK, P. L. 2019. Marine mammal noise
exposure criteria: Updated scientific recommendations for residual hearing effects.
Aquatic Mammals 45:125–232.
TEILMANN, J., CHRISTIANSEN, C. T., KJELLERUP, S., DIETZ, R. & NACHMAN, G. 2013a.
Geographic, seasonal, and diurnal surface behavior of harbor porpoises. Marine Mammal
Science:1–17.
TEILMANN, J., CHRISTIANSEN, C. T., KJELLERUP, S., DIETZ, R. & NACHMAN, G. 2013b.
Geographic, seasonal, and diurnal surface behavior of harbor porpoises. Marine Mammal
Science 29:E60–E76.
THOMAS, L., BUCKLAND, S. T., BURNHAM, K. P., ANDERSON, D. R., LAAKE, J. L., BORCHERS, D.
L. & STRINDBERG, S. 2002. Distance sampling. Pp. 544–552 Encyclopedia of
Environmetrics (1st edition). J. Wiley & Sons Inc., Chichester (UK).
THOMAS, L., BUCKLAND, S. T., REXSTAD, E. A., LAAKE, J. L., STRINDBERG, S., HEDLEY, S. L.,
BISHOP, J. R. B., MARQUES, T. A. & BURNHAM, K. P. 2010. Distance software: design and
analysis of distance sampling surveys for estimating population size. Journal of Applied
Ecology 47:5–14.
TOLLIT, D. J., BLACK, A. D., THOMPSON, P. M., MACKAY, A., CORPE, H. M., WILSON, B., PARIJS,
S. M., GRELLIER, K. & PARLANE, S. 1998. Variations in harbour seal Phoca vitulina diet
and dive‐depths in relation to foraging habitat. Journal of Zoology 244:209–222.
TOUGAARD, J., CARSTENSEN, J., TEILMANN, J., SKOV, H. & RASMUSSEN, P. 2009. Pile driving
zone of responsiveness extends beyond 20 km for harbor porpoises (Phocoena phocoena
(L.)). The Journal of the Acoustical Society of America 126:11–14.
TOUGAARD, J. & DÄHNE, M. 2017. Why is auditory frequency weighting so important in regulation
of underwater noise? The Journal of the Acoustical Society of America 142:EL415–EL420.
TOUGAARD, J., EBBESEN, I., TOUGAARD, S., JENSEN, J. & TEILMANN, J. 2003. Satellite tracking
of Harbour Seals on Horns Reef. Esbjerg (DNK).
Ramboll - THOR offshore wind farm
48/49
TOUGAARD, J., KYHN, L. A., AMUNDIN, M., WENNERBERG, D. & BORDIN, C. 2012. Behavioral
Reactions of Harbor Porpoise to Pile-Driving Noise. Pp. 277–280 in Popper, A. N. &
Hawkins, A. (eds.). The Effects of Noise on Aquatic Life. Springer New York, New York,
NY.
TOUGAARD, J. & MICHAELSEN, M. 2018. Effects of larger turbines for the offshore wind farm at
Krieger’s Flak, Sweden. Assessment of impact on marine mammals. P. 112. wind farm at
Krieger’s Flak, Sweden. Assessment of impact on marine mammals. Aarhus University,
DCE – Danish Centre for Environment and Energy, Aarhus (DNK).
TOUGAARD, J. & MICHAELSEN, M. 2020. Effects of larger turbines for the offshore wind farm at
Krieger’s Flak, Sweden. Addendum with revised and extended assessment of impact on
marine mammals. P. 32. Aarhus University, DCE – Danish Centre for Environment and
Energy, Aarhus (DNK).
TOUGAARD, J., WRIGHT, A. J. & MADSEN, P. T. 2015. Cetacean noise criteria revisited in the light
of proposed exposure limits for harbour porpoises. Marine Pollution Bulletin 90:196–208.
VERFUSS, U. K., MILLER, L. A., PILZ, P. K. & SCHNITZLER, H.-U. 2009. Echolocation by two
foraging harbour porpoises (Phocoena phocoena). Journal of Experimental Biology
212:823–834.
VERFUSS, U. K., MILLER, L. A. & SCHNITZLER, H.-U. 2005. Spatial orientation in echolocating
harbour porpoises (Phocoena phocoena). Journal of Experimental Biology 208:3385–3394.
Vesterhav Nord. EIA - backgound report. ATR09 marine mammals. 2015. . P. 120. Final, Aarhus
(DNK).
Vesterhav Nord vindmøllepark - Miljøkonsekvensrapport. 2020. . P. 352.
Vesterhav Syd. EIA - background Report. ATR09 marine mammals. 2015. . P. 125. Final, Aarhus
(DNK).
Vesterhav Syd vindmøllepark - Miljøkonsekvensrapport. 2020. . P. 335.
WILLIAMSON, L., BROOKES, K., SCOTT, B., GRAHAM, I. & THOMPSON, P. 2017. Diurnal variation
in harbour porpoise detection potential implications for management. Marine Ecology
Progress Series 570:223–232.
WISNIEWSKA, D. M., JOHNSON, M., TEILMANN, J., SIEBERT, U., GALATIUS, A., DIETZ, R. &
MADSEN, P. T. 2018. High rates of vessel noise disrupt foraging in wild harbour porpoises
(Phocoena phocoena). Proceedings of the Royal Society B: Biological Sciences
285:20172314.
ŽYDELIS, R., DORSCH, M., HEINÄNEN, S., NEHLS, G. & WEISS, F. 2019. Comparison of digital
video surveys with visual aerial surveys for bird monitoring at sea. Journal of Ornithology
160:567–580.


![Thor Offshore Wind Farm - Energistyrelsen...[ISO901] ISO. EN ISO 19901-1: Petroleum and natural gas industries - Specific requirements for offshore structures - Part 1: Metocean design](https://static.fdocuments.in/doc/165x107/6143990a6b2ee0265c022612/thor-offshore-wind-farm-energistyrelsen-iso901-iso-en-iso-19901-1-petroleum.jpg)