Thompson High School ELL PDA Final Presentation Evaluation Year III Spring 2011.
31
Thompson High School ELL PDA Final Presentation Evaluation Year III Spring 2011
-
Upload
branden-russell -
Category
Documents
-
view
220 -
download
1
Transcript of Thompson High School ELL PDA Final Presentation Evaluation Year III Spring 2011.

Thompson High School ELL PDA Final Presentation
Evaluation Year III
Spring 2011

GOALS• To demonstrate
the effectiveness of the EL PDA
• To be able to analyze four types of data using the data sequence cycle
• To use data analysis for continuous improvement planning

What’s been going on at THS for the past three years?
Neely Woodley Jake Parker Kadrian Delaine Allison Lackey Ruth Greathouse Betty Barton Brandy Mitchell
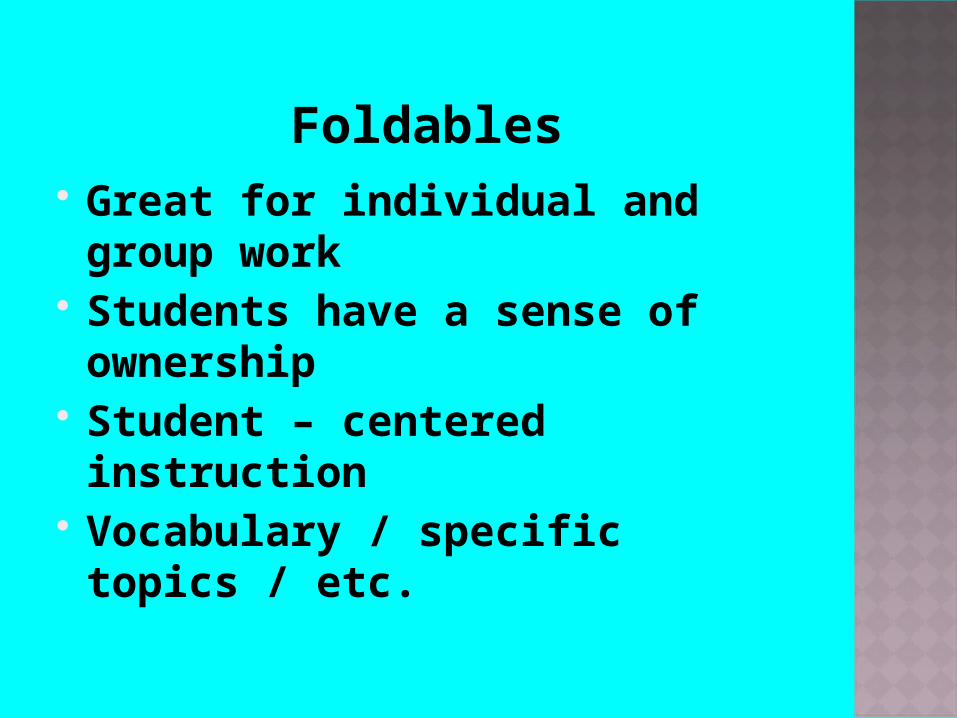
Foldables Great for individual and group work
Students have a sense of ownership
Student – centered instruction
Vocabulary / specific topics / etc.
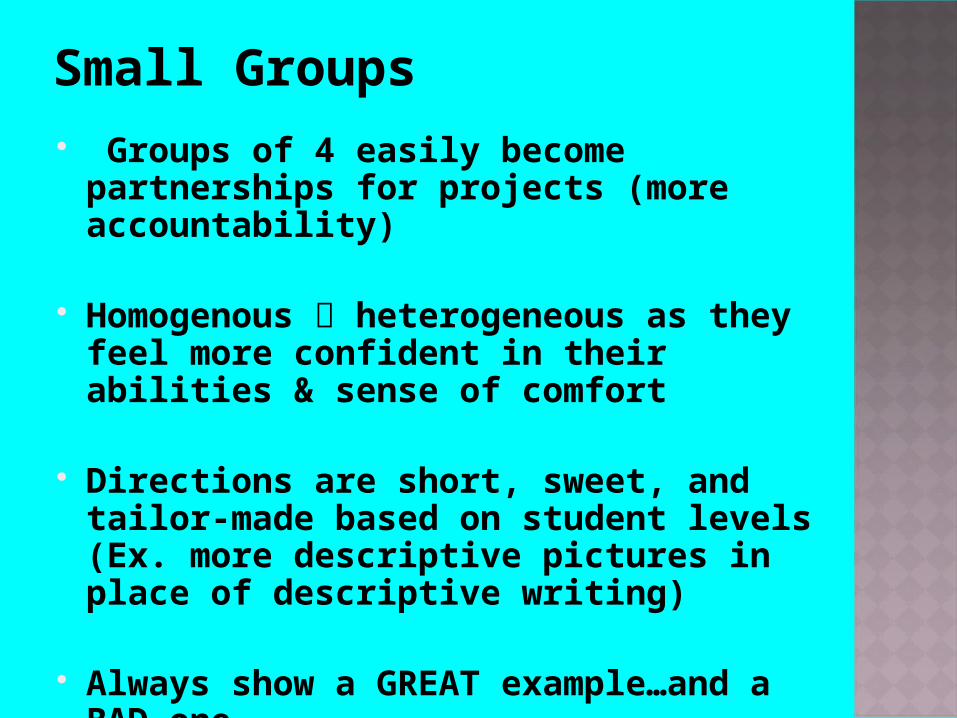
Small Groups Groups of 4 easily become
partnerships for projects (more accountability)
Homogenous heterogeneous as they feel more confident in their abilities & sense of comfort
Directions are short, sweet, and tailor-made based on student levels (Ex. more descriptive pictures in place of descriptive writing)
Always show a GREAT example…and a BAD one

Personal Connections Bellringer Activities – vocabulary
Combination comprehension & Parts-of-Speech
Compare/Contrast Activity – puzzle piecesOriginal Bill of Rights // Modern Mexican
Constitution Extended Activity – journal prompts
Connect BIG IDEA to past experiences (ex. Patrick Henry’s Speech – Have you ever faced opposition when standing up for an ideal? Describe the situation. How did you attempt to persuade people to your line of thinking? Did it work? What methods of persuasion did you use that mirrors Paine’s approach?

Reaching Out to the Community Fall Parent Meetings – PP presentations
in Spanish help parents understand their students’ responsibilities at school
Alabaster ESL Community Celebration- Potluck
Student awards (APLA and exiting certificates)
County ESL Department International Festival
ESL students serve as bi-lingual guides at summer registration and a community event.

Teacher Training and Involvement ESL Inclusion teacher training
session, August 10, 2010 SIOP video lesson “Which Beak Is
Best” ELL- PDA team present successful
methods. ESL staff discuss language levels,
CAN DO descriptors, and procedures. Classroom teachers present ELL tips
during the year. BLOG established to share ideas. Core teachers volunteer in after-
school tutoring for ELLs.

Demographic• Referrals – Special
Ed, GT• Limited to no
formal education• EL retention rate• EL honor roll • Languages• Attendance• Discipline• Credit accrual• Other
Perception • Surveys• Self-
assessment rubric
• Interviews • Observations
Process• Peer
Observations• Type of
Instructional methods
• Master schedule
• Walkthrough data
• Other
Collect 3 years of data for longitudinal trend analysisData Collection
Achievement • ACCESS Reports• List of ELs who met annual cut score for “attained”• AHSGE – all • grades tested• Grad Rate

Demographic Data 6% of students at Thompson
High are ELLs (this includes Flep I and Flep II)
3.6% of students actually took the ACCESS test
6.4% 9th grade 5.2% 10th grade 6.5% 11th grade 6% 12th grade

Achievement Data Include ACCESS scores for the past
three years with a focus on 2010.
Classroom connections

9th Grade ACCESS Data 2010 THS
1 2 3 4 50
2
4
6
8
10
12
School Frequency Report Grade 9, 2010
listening
speaking
reading
writing
WIDA ELP Levels
# o
f Stu
dent
s at
Lev
els

Classroom Connections
• Reading is a strength among the 9th grade EL students.
• Visual support in the classroom, as well as, chunking, small groups, and pre loading vocabulary are strategies that have been used to improve reading skills.
• Speaking is a weakness.
• More small group instruction would provide opportunities to speak.

10th Grade ACCESS Data 2010 THS
1 2 3 4 50123456789
10
School Frequency Report Grade10, 2010
listening
speaking
reading
writing
WIDA ELP Levels
# o
f Stu
dent
s at
Lev
els

Classroom Connections
• Listening and reading are strengths.
• More focus on speaking.
• Small group instruction may assist with speaking skills.
• Vocabulary development and reading techniques such as chunking, visual support, and personal connections have assisted with above average reading and listening scores.

11th Grade ACCESS Data 2010 THS
1 2 3 4 5 60123456789
10
School Frequency Report Grade 11, 2010
listening
speaking
reading
writing
WIDA ELP Levels
# o
f Stu
dent
s at
Lev
els
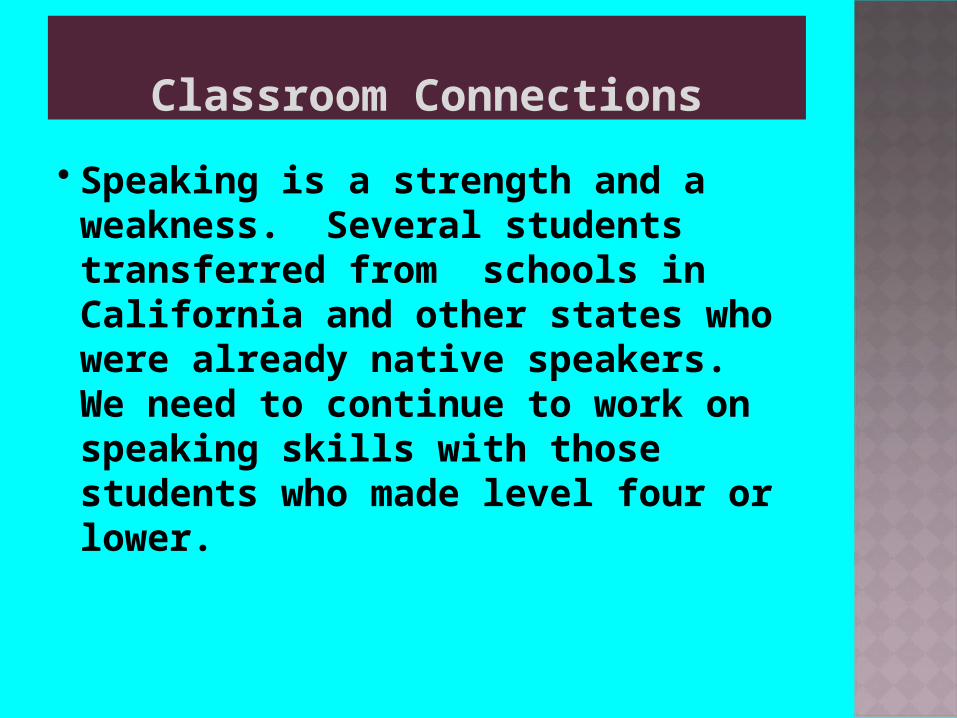
Classroom Connections
• Speaking is a strength and a weakness. Several students transferred from schools in California and other states who were already native speakers. We need to continue to work on speaking skills with those students who made level four or lower.

AMAO Scores 2008-20102008 2009 2010
% making APLA
54.5 52.5 57.4
% of students proficient
11.8 17.6 26.4
Process Data Teacher Observations
Classroom connections

SIOP TEACHER DATA
Opportunities f
or interac
tion
Grouping c
onfigurati
ons
Wait
time
Clarify
key c
oncepts
in L1
Hands-o
n mate
rials
apply
content &
langu
age kn
owledge
Integration of a
ll lan
guag
e domains
00.5
11.5
22.5
33.5
4SIOP Interaction & Practice/Application
Teacher A
Teacher B
Teacher C
4 =
Hig
hly
Evid
ent,
3 =
Evi
dent
, 2=
Som
ewha
t Ev-
iden
t 1 =
Not
Evi
dent
, 0=
N/A
Content Objecti
ves
Language O
bjective
s
Content Conce
pts
Supplementary
Materials
Adaptation of Content
Meaningful Acti
vities
0
0.5
1
1.5
2
2.5
3
3.5
4
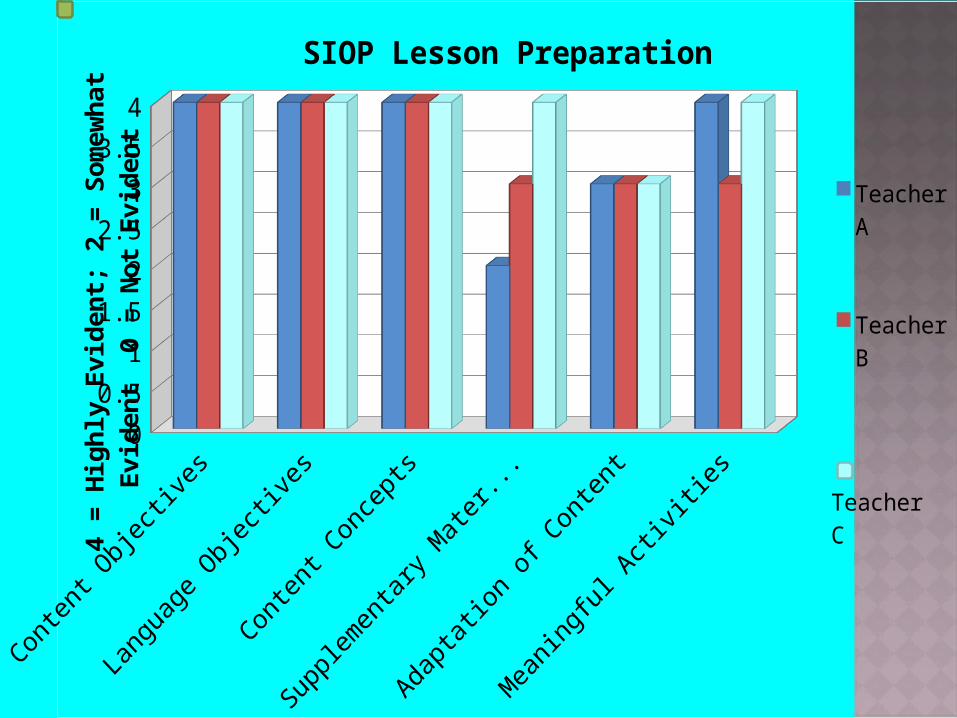
SIOP Lesson Preparation
Teacher A
Teacher B
4 =
Hig
hly
Evid
ent;
2 =
Som
ewha
t Evi
dent
0 =
Not
Ev
iden
t
Teacher C

Concepts
explici
tly lin
ked
Links
explici
tly m
ade
Key Voca
bulary
Speech
Appropriate
Clear Exp
lanation of tasks
Variety
of tech
niques
learning strategies
Scaffolding te
chniques
Higher Order T
hinking
0
0.5
1
1.5
2
2.5
3
3.5
4
SIOP Building Background, Comprehensible Input, Strategies
Teacher A
Teacher B
4 =
Hig
hly
Evid
ent;
2 =
Som
ewha
t; 0
= N
ot
Teacher C

Content objecti
ves c
learly su
pported
Languageobjecti
ves c
learly su
pported
Students
engaged 90-100%
Pacing/abilit
y leve
l
Review of k
ey voca
bulary
review of k
ey conce
pts
Regular feedback
Assessm
ent of c
omprehension and le
arning0
0.51
1.52
2.53
3.54
Lesson Delivery & Review/Assessment
Teacher A
Teacher B
4 =
Hig
hly
Evid
ent;
2 =
Som
ewha
t; 0
= N
ot
Teacher C

Classroom Connections
• All teachers observed have been trained in the SIOP model, part of the ELL PDA.
• Overall, the teachers did a great job of using the SIOP model and instructional strategies that coincide with this model.
• Areas of focus would include speech appropriateness and learning strategies.

Perception Data Teachers
School staff
Administrators

Perception DataSURVEY ON RESPONSIVE ENGLISH LEARNER PEDAGOGY OF THE LEARNING ORGANIZATION
Infusion of academic language
link home, school, and community
teachers' capacity to teach English Learners
recognizing differences among ELs
Responsibility for educating ELs
celebrate the culture of EL population
assessment practices for ELs.
L1 & L2 literacy development of the ELs
participation of ELs in programs and activities
school’s comfort level in using SIOP Model
strengths and weaknesses using SIOP model
Leadership involvement and support
Principal 4 4 3 3 5 4 5 3 5 4 4 5
Group 3 4 3 2 5 2 3 2 2 4 3 3
Asst Principal 3 4 3 3 5 2 3 4 3 3 3 5

Classroom Connections
• All three groups perceived THS as having a responsibility to educating ELLs.
• An area of weakness includes recognizes differences among ELLs. The team should continue to focus on training teachers on how to interpret ACCESS scores in all skill areas.

Comprehensive Data
02468
10
Comprehensive Data Use
BaselineSummative
Criteria Indicators
Emer
ging
= 1
-2.9
; Bas
ic =
3-6
; Ad
vanc
ed =
7-9

Building Back
ground
Interaction
Differentiating In
structi
on
Review & Asse
ssment
0
1
2
3
4
5
6
SIOP COMFORT LEVEL
Baseline
Summative
Criteria Indicators
Emer
ging
= 0
-3; B
asic
= 3
.1-5
.9; A
dvan
ced
= 6-
9

Classroom Connections
• School climate of acceptance and professional learning increased significantly.
• While teacher buy in increased, that goal should still be an area of focus.

So What Now?
Next Steps1. Ell PDA team will continue to
meet monthly.2. Continue training all faculty on
instructing EL students3. Continue to have community
events with EL parents4. Use all ELL data to create a
school improvement goal each year.