Thomas P. DiNapoli Division of State Government...
14
New York State Office of the State Comptroller Thomas P. DiNapoli Division of State Government Accountability Report 2012-S-134 October 2013 Conservaon Fund - Sources and Uses of Funds Department of Environmental Conservaon
Transcript of Thomas P. DiNapoli Division of State Government...

New York State Office of the State ComptrollerThomas P. DiNapoli
Division of State Government Accountability
Report 2012-S-134 October 2013
Conservation Fund - Sources and Uses of Funds
Department of Environmental Conservation

2012-S-134
Division of State Government Accountability 1
Executive SummaryPurposeTo determine whether Conservation Fund (Fund) revenues are accounted for properly and whether expenditures made from the Fund are consistent with applicable State Law and regulations.
BackgroundThe Fund was established in 1925 to provide a stable, long-term source of revenue to help support the Department of Environmental Conservation’s (Department) fish, wildlife and marine resources program (Program), which includes activities such as operating fish hatcheries and game farms, and managing fish and wildlife populations. The Fund’s primary source of revenue is the sale of licenses to sportsmen for hunting, fishing and trapping. Environmental Conservation Law established the Conservation Fund Advisory Board (Board), which advises Department management regarding the Fund, as well as fish and wildlife programs, and also reports to the Governor and Legislature. For the three State fiscal years 2009-2010 through 2011-2012, the Department’s annual cost of carrying out its Program responsibilities ranged between $109 million and $121 million. During this period, the Fund provided annual Program support ranging between $40 million and $45 million based on annual license revenues that totaled $47 million to $69 million per year. In 2012-2013, sporting license sales generated almost $50 million, while Program expenditures from the Fund totaled about $47 million. As of March 31, 2013, the balance in the Fund was $90.7 million.
Key Findings• Fund revenues have been properly accounted for, and expenditures have been related to the
Department’s Program responsibilities, consistent with applicable State law and regulation. • The balance in the Fund has increased to over $90 million since license fees were raised in 2009,
largely due to a one-time spike of over 100,000 lifetime license sales, the fees from which must be invested in a Trust Account and are not available to fund current operations.
• Capital projects increased in the years immediately following the license fee increase, while direct Program expenditures initially declined. More recently, the Fund has begun funding a greater share of the Department’s law enforcement costs, which were shifted to other funding sources before the fee increase. In 2012-2013, the Fund supported 113 fewer Department staff positions than it did eight years earlier: 68 fewer law enforcement staff, 29 fewer support positions and 16 fewer direct Program personnel.
Key Recommendations• No Recommendations
Other Related Audits/Reports of InterestDepartment of Environmental Conservation: Environmental Protection Fund (2008-S-121)

2012-S-134
Division of State Government Accountability 2
State of New YorkOffice of the State Comptroller Division of State Government Accountability
October 9, 2013
Mr. Joseph MartensCommissionerDepartment of Environmental Conservation625 BroadwayAlbany, NY 12233
Dear Commissioner Martens:
The Office of the State Comptroller is committed to helping State agencies, public authorities and local government agencies manage government resources efficiently and effectively and, by so doing, providing accountability for tax dollars spent to support government operations. The Comptroller oversees the fiscal affairs of State agencies, public authorities and local government agencies, as well as their compliance with relevant statutes and their observance of good business practices. This fiscal oversight is accomplished, in part, through our audits, which identify opportunities for improving operations. Audits can also identify strategies for reducing costs and strengthening controls that are intended to safeguard assets.
Following is a report of our audit entitled Conservation Fund - Sources and Uses of Funds. This audit was performed pursuant to the State Comptroller’s authority under Article V, Section 1 of the State Constitution and Article II, Section 8 of the State Finance Law.
This audit’s results are resources for you to use in effectively managing your operations and in meeting the expectations of taxpayers. If you have any questions about this report, please feel free to contact us.
Respectfully submitted,
Office of the State Comptroller Division of State Government Accountability
2012-S-134
Division of State Government Accountability 3
State Government Accountability Contact Information:Audit Director: John BuycePhone: (518) 474-3271 Email: [email protected]:
Office of the State Comptroller Division of State Government Accountability 110 State Street, 11th Floor Albany, NY 12236
This report is also available on our website at: www.osc.state.ny.us
Table of ContentsBackground 4
Audit Findings 6
Accounting for Conservation Fund Revenues and Fund Balance 6
Conservation Fund Expenditures 8
Audit Scope and Methodology 11
Authority 11
Reporting Requirements 11
Contributors to This Report 12
Agency Comment 13
2012-S-134
Division of State Government Accountability 4
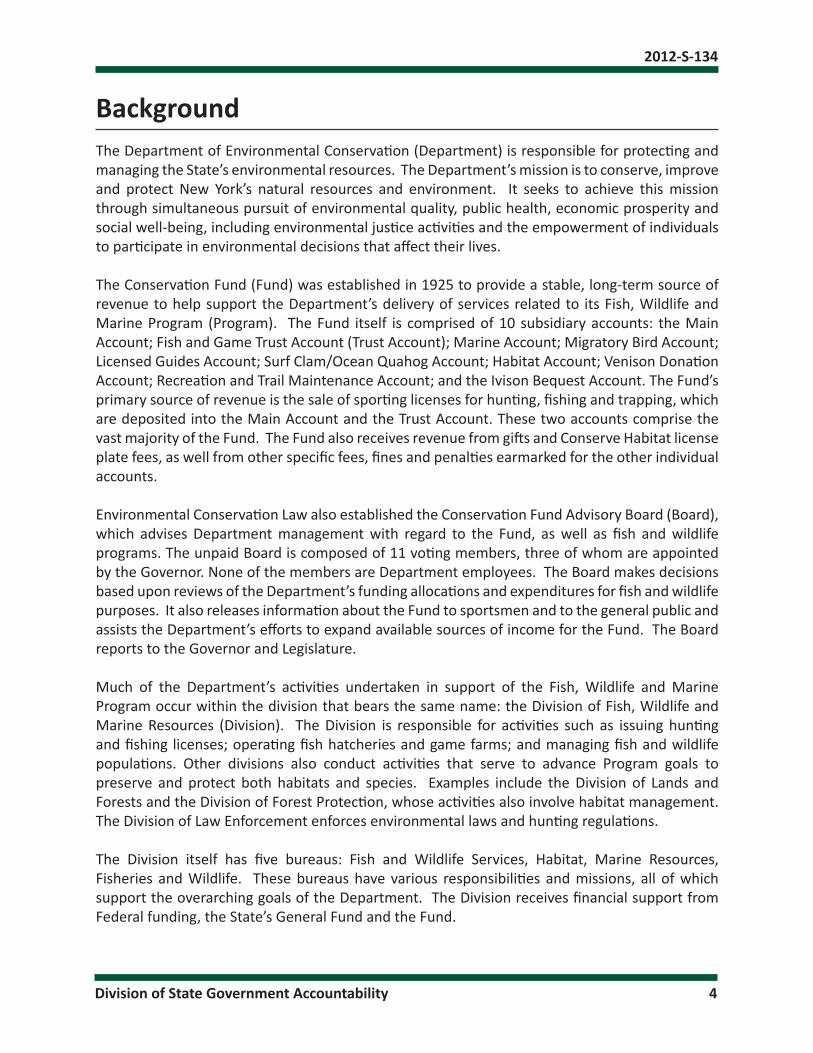
BackgroundThe Department of Environmental Conservation (Department) is responsible for protecting and managing the State’s environmental resources. The Department’s mission is to conserve, improve and protect New York’s natural resources and environment. It seeks to achieve this mission through simultaneous pursuit of environmental quality, public health, economic prosperity and social well-being, including environmental justice activities and the empowerment of individuals to participate in environmental decisions that affect their lives.
The Conservation Fund (Fund) was established in 1925 to provide a stable, long-term source of revenue to help support the Department’s delivery of services related to its Fish, Wildlife and Marine Program (Program). The Fund itself is comprised of 10 subsidiary accounts: the Main Account; Fish and Game Trust Account (Trust Account); Marine Account; Migratory Bird Account; Licensed Guides Account; Surf Clam/Ocean Quahog Account; Habitat Account; Venison Donation Account; Recreation and Trail Maintenance Account; and the Ivison Bequest Account. The Fund’s primary source of revenue is the sale of sporting licenses for hunting, fishing and trapping, which are deposited into the Main Account and the Trust Account. These two accounts comprise the vast majority of the Fund. The Fund also receives revenue from gifts and Conserve Habitat license plate fees, as well from other specific fees, fines and penalties earmarked for the other individual accounts. Environmental Conservation Law also established the Conservation Fund Advisory Board (Board), which advises Department management with regard to the Fund, as well as fish and wildlife programs. The unpaid Board is composed of 11 voting members, three of whom are appointed by the Governor. None of the members are Department employees. The Board makes decisions based upon reviews of the Department’s funding allocations and expenditures for fish and wildlife purposes. It also releases information about the Fund to sportsmen and to the general public and assists the Department’s efforts to expand available sources of income for the Fund. The Board reports to the Governor and Legislature.
Much of the Department’s activities undertaken in support of the Fish, Wildlife and Marine Program occur within the division that bears the same name: the Division of Fish, Wildlife and Marine Resources (Division). The Division is responsible for activities such as issuing hunting and fishing licenses; operating fish hatcheries and game farms; and managing fish and wildlife populations. Other divisions also conduct activities that serve to advance Program goals to preserve and protect both habitats and species. Examples include the Division of Lands and Forests and the Division of Forest Protection, whose activities also involve habitat management. The Division of Law Enforcement enforces environmental laws and hunting regulations.
The Division itself has five bureaus: Fish and Wildlife Services, Habitat, Marine Resources, Fisheries and Wildlife. These bureaus have various responsibilities and missions, all of which support the overarching goals of the Department. The Division receives financial support from Federal funding, the State’s General Fund and the Fund.

2012-S-134
Division of State Government Accountability 5
As of March 31, 2013, the total balance in the Fund was over $90 million. The Main Account and the Trust Account represent about $88 million (almost 97 percent) of this balance. During the three State fiscal years 2009-2010 through 2011-2012, the annual cost associated with carrying out the Department’s Program responsibilities ranged from $109 million to almost $121 million. During this period, the Fund’s Main Account provided annual support ranging from $39.8 million to $44.5 million based, in large part, on annual license revenue of $45.6 million to $46.2 million. For 2012-2013, Department records show annual Fund revenue for the Main Account of $48.9 million and expenditures of $46.9 million, subject to final adjustments for end-of-year transactions which were not yet available.

2012-S-134
Division of State Government Accountability 6
Audit Findings Accounting for Conservation Fund Revenues and Fund Balance
We determined that Fund revenues have been properly accounted for and that the balance in the Fund has increased substantially in recent years, largely due to increases in lifetime license sales, the fees from which must be invested in the Trust account rather than being made available to fund current projects and expenses.
A variety of sporting licenses are available both by type of game and hunting method. For example, separate licenses are available for big game and small game, or in combination. Additional permits can be added to hunt using other means, such as with a muzzleloader or by bow, or to hunt specific species, such as turkey. Annual licenses are valid for one hunting season starting October 1st of each year and can be purchased as early as mid-August. Lifetime licenses are also available and are substantially more expensive with fees based on the age of the sportsman.
Due to solvency issues with the Main Account, the Legislature imposed a license fee increase that was implemented in 2009-2010. This fee hike did increase revenue from annual licenses by about 16 percent; however, about 175,000 fewer annual licenses were sold than in the prior year. At the same time, lifetime license sales increased by more than 100,000 resulting in a 13-fold increase in volume and a $21 million spike in revenue, all of which was deposited into the Trust Account as required by law. Table 1 below illustrates the reduction of annual license sales and the increase in lifetime license holders in 2009-2010 when the license fee was increased.
Whether a sportsman purchases an annual or lifetime license directly impacts the amount of funds available to be spent in support of the Department’s Program activities. Annual license revenues are deposited into the Fund’s Main Account and are available for current expenditures, subject to appropriation by the Legislature and allocation by the Division of Budget. In contrast, revenue from lifetime license sales must be deposited into the Fund’s Trust Account for investment. Only
(1) During 2011‐2012, lifetime license revenue was reduced by almost $1.4 million due to refunds issued to more
than 9,600 anglers with marine fish, or combination fish and marine lifetime, licenses as a result of a change in legislation.
TABLE 1: ANNUAL & LIFETIME SPORTING LICENSE SALES & REVENUE
Fiscal Year
Annual Licenses
Revenue
Lifetime Licenses
Revenue
Total License Revenue
2008‐2009 1,531,377 $ 38,084,426 8,500 $ 1,715,695 $ 39,800,121
2009‐2010 1,355,358 $ 45,666,444 113,215 $ 23,424,177 $ 69,090,621
2010‐2011 1,277,577 $ 46,263,091 12,957 $ 3,821,751 $ 50,084,842 (1) 2011‐2012 1,218,145 $ 46,289,541 9,678 $ 994,226 $ 47,283,767
2012‐2013 1,303,974 $ 47,333,540 5,865 $ 2,566,497 $ 49,900,037
2012-S-134
Division of State Government Accountability 7
the annual earnings are available for transfer to the Main Account in support of current activities. In fact, if the earnings are not transferred in the year earned, they automatically become part of the Trust Account principal and cannot be transferred in subsequent years.
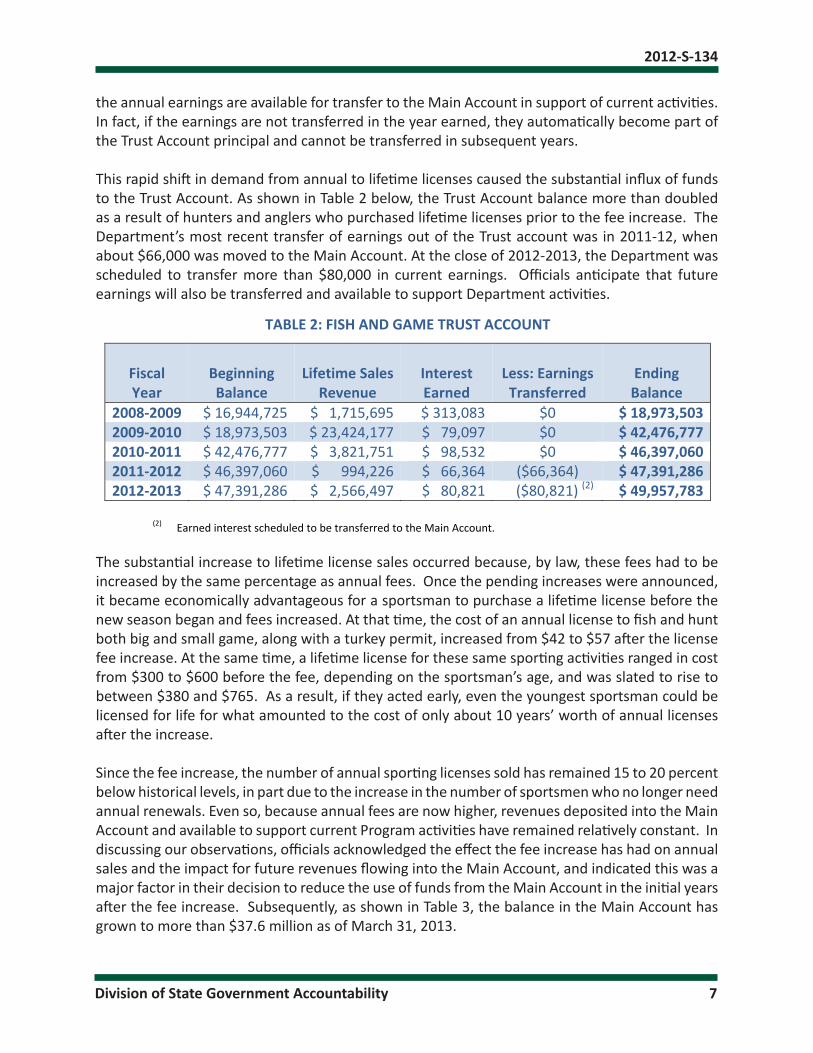
This rapid shift in demand from annual to lifetime licenses caused the substantial influx of funds to the Trust Account. As shown in Table 2 below, the Trust Account balance more than doubled as a result of hunters and anglers who purchased lifetime licenses prior to the fee increase. The Department’s most recent transfer of earnings out of the Trust account was in 2011-12, when about $66,000 was moved to the Main Account. At the close of 2012-2013, the Department was scheduled to transfer more than $80,000 in current earnings. Officials anticipate that future earnings will also be transferred and available to support Department activities.
The substantial increase to lifetime license sales occurred because, by law, these fees had to be increased by the same percentage as annual fees. Once the pending increases were announced, it became economically advantageous for a sportsman to purchase a lifetime license before the new season began and fees increased. At that time, the cost of an annual license to fish and hunt both big and small game, along with a turkey permit, increased from $42 to $57 after the license fee increase. At the same time, a lifetime license for these same sporting activities ranged in cost from $300 to $600 before the fee, depending on the sportsman’s age, and was slated to rise to between $380 and $765. As a result, if they acted early, even the youngest sportsman could be licensed for life for what amounted to the cost of only about 10 years’ worth of annual licenses after the increase.
Since the fee increase, the number of annual sporting licenses sold has remained 15 to 20 percent below historical levels, in part due to the increase in the number of sportsmen who no longer need annual renewals. Even so, because annual fees are now higher, revenues deposited into the Main Account and available to support current Program activities have remained relatively constant. In discussing our observations, officials acknowledged the effect the fee increase has had on annual sales and the impact for future revenues flowing into the Main Account, and indicated this was a major factor in their decision to reduce the use of funds from the Main Account in the initial years after the fee increase. Subsequently, as shown in Table 3, the balance in the Main Account has grown to more than $37.6 million as of March 31, 2013.
TABLE 2: FISH AND GAME TRUST ACCOUNT
Fiscal Year
Beginning Balance
Lifetime Sales
Revenue
Interest Earned
Less: Earnings Transferred
Ending Balance
2008‐2009 $ 16,944,725 $ 1,715,695 $ 313,083 $0 $ 18,973,5032009‐2010 $ 18,973,503 $ 23,424,177 $ 79,097 $0 $ 42,476,7772010‐2011 $ 42,476,777 $ 3,821,751 $ 98,532 $0 $ 46,397,0602011‐2012 $ 46,397,060 $ 994,226 $ 66,364 ($66,364) $ 47,391,2862012‐2013 $ 47,391,286 $ 2,566,497 $ 80,821 ($80,821) (2) $ 49,957,783
(2) Earned interest scheduled to be transferred to the Main Account.

2012-S-134
Division of State Government Accountability 8
Since revenues have stabilized and are now more predictable, Department officials told us they plan to reduce the balance of the Main Account through a projected five-year draw down. As part of this effort, the Legislature approved a reduction in the cost of annual sporting licenses beginning in February 2014.
Conservation Fund Expenditures We performed tests of expenditures charged to the Fund during the three fiscal years ended March 31, 2012. Our tests, which focused on the Main Account and the Trust Account, showed these costs were appropriate and related to the Department’s Program responsibilities.
As shown in Table 4 below, for these three State fiscal years, the Department expended more than $112 million; $109 million; and $120 million, respectively, on Program activities. These efforts were supported by several sources including the Fund, the State’s General Fund, capital project funds, and federal funds. The Fund provided over $44.5 million in 2009-2010 from revenue of $47.4 million; $40.7 million from revenue of $48.2 million in 2010-2011; and $39.8 million from revenue of $51.8 million in 2011-2012.
Table 5 details Program costs by division for the same three-year period. The largest portion of Program expenditures were incurred directly by the Division to support activities such as operating fish hatcheries, and pheasant farms; issuing hunting and fishing licenses; and managing fish and wildlife populations. Other divisions, including Law Enforcement and Indirect Support,
(3) The balance of the Conservation Fund Main Account is reported on the cash basis for the State fiscal years ending March 31st. The expenditures charged to the Conservation Fund Main Account by program are reported on the modified accrual basis, which recognizes expenses incurred but paid subsequent to the end of the fiscal year.
TABLE 3: CONSERVATION FUND MAIN ACCOUNT Fiscal Year
Beginning Balance
Sources of Funds
Uses of Funds(3)
Ending Balance
2009‐2010 $ 4,188.833 $ 47,412,553 $ 42,008,648 $ 9,592,738 2010‐2011 $ 9,592,738 $ 48,212,232 $ 36,758,370 $ 21,046,600 2011‐2012 $ 21,046,600 $ 51,875,985 $ 37,230,410 $ 35,692,175 2012‐2013 $ 35,692,175 $ 48,908,593 $ 46,976,051 $ 37,624,417
TABLE 4: FISH, WILDLIFE & MARINE RESOURCES PROGRAM EXPENDITURES AND FUNDING SOURCES
Fund
Fiscal Year 2009‐2010
Fiscal Year 2010‐2011
Fiscal Year 2011‐2012
Three‐Year Total
Conservation Fund $44,597,182 $40,714,164 $39,872,603 $125,183,949State General Fund $36,707,482 $30,485,424 $43,126,410 $110,319,316Federal Funds $22,671,861 $23,735,545 $24,109,080 $ 70,516,486Capital Funds $ 8,589,392 $14,457,186 $13,578,221 $ 36,624,799
Total $112,565,917 $109,392,319
$120,686,314 $ 342,644,550

2012-S-134
Division of State Government Accountability 9
also incurred substantial costs in support of the Program. In addition, the Program incurred capital costs for projects such as boat launches, estuary projects and fish hatcheries.
While capital projects have been on the increase, direct Program expenditures steadily declined over the three years following the license fee increase, as did Program support from the Fund. Table 6 below shows how the Fund’s Program support during these three years was allocated and expended among the Department’s various divisions.
Although final cost allocations were not yet available for 2012-2013, the Fund’s total Program support appears to have increased to at least $47 million in this latest year.
In the most recent years, the Department’s Law Enforcement Division has been the second largest contributor to Program costs with annual expenses ranging from $20 million to over $30 million. These charges largely represent an increasing number of Environmental Conservation Officers (ECOs) charged to the Program. At the time of our audit, the Department employed about 330 ECOs, many of whom conduct various Program activities that protect various species and their habitats. These duties include enforcing hunting, fishing and trapping laws; conducting special investigations regarding license issuing officers; investigating hunting accidents; providing hunter
TABLE 5: FISH, WILDLIFE & MARINE RESOURCES PROGRAM USE OF FUNDS BY DIVISION
Division
Fiscal Year 2009‐2010
Fiscal Year 2010‐2011
Fiscal Year 2011‐2012
Fish, Wildlife & Marine Resources $ 58,423,902 $ 53,689,353 $ 50,901,740Law Enforcement $ 22,303,451 $ 20,507,297 $ 31,755,992Indirect Support $ 19,244,364 $ 16,576,466 $ 20,100,726Capital Projects $ 8,589,392 $ 14,457,186 $ 13,578,221Operations $ 2,645,437 $ 2,564,041 $ 2,901,554Public Affairs $ 1,359,371 $ 1,138,773 $ 884,289Land and Forest ‐0‐ $ 459,204 $ 563,792
Total $ 112,565,917 $ 109,392,320 $ 120,686,314
TABLE 6: CONSERVATION FUND USE OF FUNDS BY DIVISION
Division
Fiscal Year 2009‐2010
Fiscal Year 2010‐2011
Fiscal Year 2011‐2012
Fish, Wildlife & Marine Resources $ 35,904,264 $ 31,542,296
$ 27,733,725
Law Enforcement $ 1,048,225 $ 2,948,951 $ 5,917,959 Indirect Support $ 5,902,409 $ 5,187,659 $ 5,234,460 Operations $ 1,545,734 $ 864,867 $ 863,190 Public Affairs $ 196,550 $ 170,391 $ 123,270
Total $ 44,597,182 $ 40,714,164
$ 39,872,604

2012-S-134
Division of State Government Accountability 10
safety instruction; pursuing international black market activities related to poaching and sale of native protected species such as turtles, rattlesnakes and salamanders; preventing the illegal night hunting with lights; and enforcing off-road vehicle rules designed to prevent damage to habitats. The Fund contributed just over $1 million toward these efforts in 2009-2010, increasing to $5.9 million in 2011-2012.
The funding sources that support these Law Enforcement costs have varied over the years. Between 2005-2006 and 2008-2009, the Fund supported between 127 and 136 ECOs. Table 7 illustrates how, when the State’s fiscal crisis and the Fund’s solvency issues took hold, these Law Enforcement costs were shifted out of the Fund to other programs in an effort to maintain relatively stable financial support for direct Division staffing. In contrast, from 2008-2009 through 2010-2011, the Fund supported only nine or 10 ECOs. The Fund’s fiscal support for these activities began to return in 2011-2012, when 22 ECOs were funded, and again in 2012-13 with 62 ECOs. During this time period, the number of funded Division Program positions remained relatively constant except for a decline to a low of 200 in 2008-2009. At the same time, funded Program support positions have declined from 40 positions to 11.
Overall, in 2012-2013, the Fund supported 113 fewer Department staff positions than it did eight years earlier: 68 fewer ECOs, 29 fewer support staff and 16 fewer direct Program positions.
Audit Scope and Methodology The objectives of our audit were to determine whether the Conservation Fund’s revenues are accounted for properly and whether expenditures made from the Fund are consistent with applicable State Law and regulations. The audit covers the period of April 1, 2009 through May 31, 2013.
To accomplish these objectives, we reviewed State laws, agency policies and procedures, and
TABLE 7: CONSERVATION FUND SUPPORTED STAFFING
Fiscal Year
Division Positions
Law Enforcement Positions
Other Support Positions
Total 2005‐2006 265 130 40 435 2006‐2007 263 136 38 437 2007‐2008 271 127 37 435 2008‐2009 200 10 15 225 2009‐2010 298 9 14 321 2010‐2011 265 9 13 287 2011‐2012 248 22 10 280 2012‐2013 249 62 11 322
2012-S-134
Division of State Government Accountability 11
interviewed Department officials to gain an understanding of their procedures and practices. In addition, we examined the revenues and expenditures associated with the Main Account and Trust Account, which account for almost 97 percent of the Fund’s $90 million balance.
We conducted our performance audit in accordance with generally accepted government auditing standards. Those standards require that we plan and perform the audit to obtain sufficient, appropriate evidence to provide a reasonable basis for our findings and conclusions based on our audit objectives. We believe that the evidence obtained provides a reasonable basis for our findings and conclusions based on our audit objectives.
In addition to being the State Auditor, the Comptroller performs certain other constitutionally and statutorily mandated duties as the chief fiscal officer of New York State. These include operating the State’s accounting system; preparing the State’s financial statements; and approving State contracts, refunds, and other payments. In addition, the Comptroller appoints members to certain boards, commissions and public authorities, some of whom have minority voting rights. These duties may be considered management functions for purposes of evaluating organizational independence under generally accepted government auditing standards. In our opinion, these functions do not affect our ability to conduct independent audits of program performance.
Authority This audit was performed pursuant to the State Comptroller’s authority under Article V, Section 1 of the State Constitution and Article II, Section 8 of the State Finance Law.
Reporting RequirementsA draft copy of this report was provided to Department officials for their review and comment. Their comments were considered in preparing this final report and are included in their entirety at the end.

2012-S-134
Division of State Government Accountability 12
Division of State Government Accountability
Andrew A. SanFilippo, Executive Deputy Comptroller518-474-4593, [email protected]
Elliot Pagliaccio, Deputy Comptroller518-473-3596, [email protected]
Brian Mason, Acting Assistant Comptroller518-473-0334, [email protected]
Vision
A team of accountability experts respected for providing information that decision makers value.
Mission
To improve government operations by conducting independent audits, reviews and evaluations of New York State and New York City taxpayer financed programs.
Contributors to This ReportJohn Buyce, Audit Director
Walter Irving, Audit ManagerBob Mainello, Audit Supervisor
Kathy Garceau, Examiner-in-ChargeKelly Evers Engel, Staff Examiner

2012-S-134
Division of State Government Accountability 13
Agency Comment