Thomas Liebig - TRENDS AND COMPOSITION OF MIGRATION FLOWS What role for policy?
14
TRENDS AND COMPOSITION OF MIGRATION FLOWS What role for policy? Thomas Liebig International Migration Division, Directorate for Employment, Labour and Social Affairs OECD
-
Upload
migrationpolicycentre -
Category
Presentations & Public Speaking
-
view
648 -
download
0
Transcript of Thomas Liebig - TRENDS AND COMPOSITION OF MIGRATION FLOWS What role for policy?

TRENDS AND COMPOSITION OF MIGRATION FLOWS What role for policy?
Thomas LiebigInternational Migration Division, Directorate for Employment, Labour and Social AffairsOECD

2
About one person in five has a migration background
0
10
20
30
40
50
60
70
Immigrants (foreign-born) Native-born with at least one foreign-born parent%
Population share of immigrants and of native-born offspring of immigrants, around 2013Percentage of the total population
Source: OECD/EU 2015
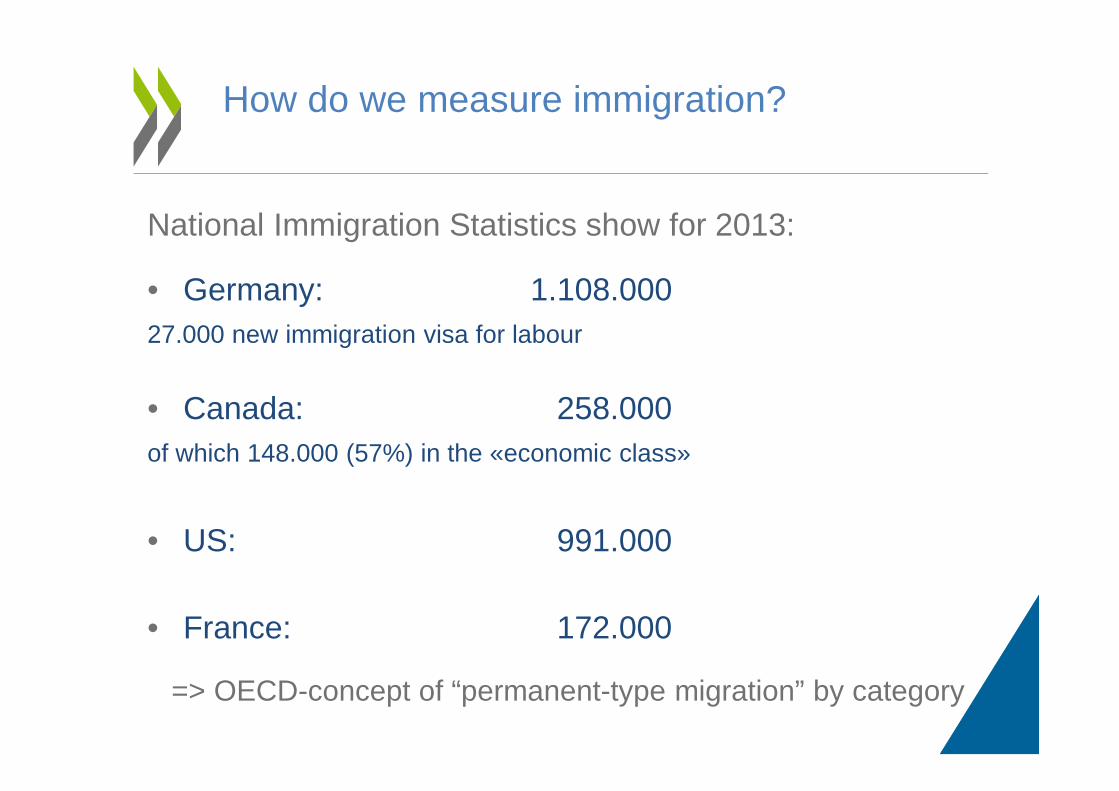
How do we measure immigration?
National Immigration Statistics show for 2013:
• Germany: 1.108.00027.000 new immigration visa for labour
• Canada: 258.000of which 148.000 (57%) in the «economic class»
• US: 991.000
• France: 172.000
=> OECD-concept of “permanent-type migration” by category
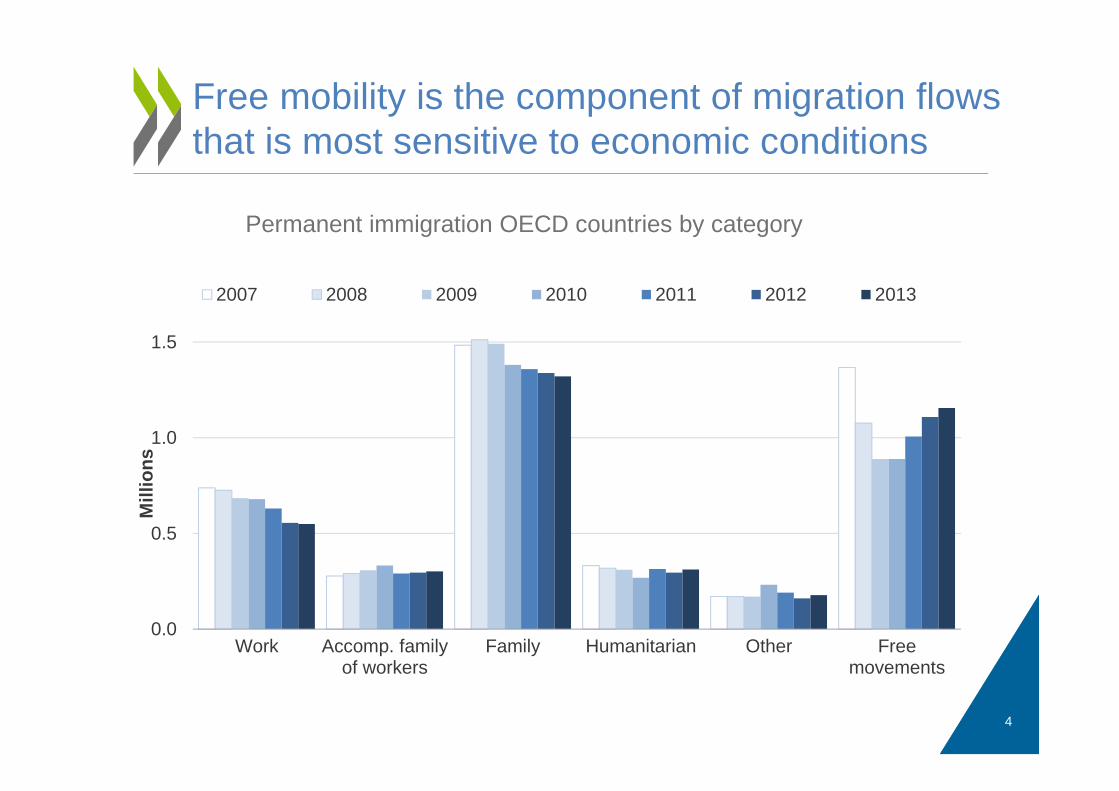
Permanent immigration OECD countries by category
0.0
0.5
1.0
1.5
Work Accomp. familyof workers
Family Humanitarian Other Freemovements
Mill
ion
s
2007 2008 2009 2010 2011 2012 2013
Free mobility is the component of migration flows that is most sensitive to economic conditions
4

5
The destinations for migration have changedsignificantly with the crisis
0.0
0.2
0.4
0.6
0.8
1.0
1.2
1.4
1.6
1.8
2012-2013 2003-11
Permanent inflows to OECD and EU countries, 2003-11 and 2012-13Annual averages in percentage of the total population
Source: OECD International Migration Database

6
In many countries, immigration accounts for a large share of potential new labour marketentriesRatio of permanent inflows to OECD countries relative to the average size of a
single-year age cohort between the ages of 20 and 24, 2013 or most recent year
Source: OECD International Migration Database
0 0.2 0.4 0.6 0.8 1 1.2 1.4
MEXJPN
KORCZEUSAPRTFIN
FRADEUGBR
ITABELNLDCANSWEAUTESPNZLIRL
DNKAUSNORCHE

7
Composition of permanent migration, by category (2012/13)
* 2012 **incl. accompanying family of workers
0%
10%
20%
30%
40%
50%
60%
70%
80%
90%
100%
Free movement Work Family** Humanitarian/Other
Across European countries, there is a large dispersion in the composition of new migration
Source: OECD International Migration Database

Reason for migration is the most important determinant of outcomes for new arrivals, but there is some convergence over time
Employment rate by immigrant category and duration of stay in European OECD countries, 2008
0%
25%
50%
75%
100%
1 2 3 4 5 6 7 8 9 10 11-14 15-19
Duration of stay (years)
International protection Work or study Family
8

• An important factor for policy: only labour migrants are directly selected – but category of migration is rarely considered in analyses of migrants’ outcomes.
• Non-EU migrants who came for work or study have higher qualification levels than family or humanitarian migrants, but still lower than the native-born.
• The returns to qualifications are higher for labour migrants (and for former international students) than for the other two groups but still tend to be lower than for the native-born.
Reason for migration: the single most important determinant of outcomes
9

10
Migrants are often overrepresented at both ends of the educational spectrum
0 10 20 30 40 50 60 70
EstoniaPoland
CanadaSlovak Rep.
HungaryIsrael*
New ZealandCzech Republic
AustraliaUnited Kingdom
IrelandJapan
NorwayLuxembourg
ChileUnited States
FinlandSwitzerland
KoreaDenmarkSlovenia
OECD total (33)SwedenIcelandAustriaMexico
NetherlandsGermany
EU total (28)BelgiumTurkey
PortugalFranceGreece
SpainItaly
Native-born
Percentage of low-educated
0 10 20 30 40 50 60 70
ItalySloveniaGreeceAustria
GermanyTurkeySpain
Czech RepublicPortugal
NetherlandsEU total (28)
KoreaChile
Slovak Rep.FranceFinland
BelgiumIceland
HungaryJapan
SwedenDenmark
OECD total (33)Switzerland
MexicoUnited States
NorwayEstoniaPoland
New ZealandUnited Kingdom
AustraliaLuxembourg
IrelandIsrael*
Canada
Foreign-born
Percentage of highly educated
Source: OECD/EU 2015
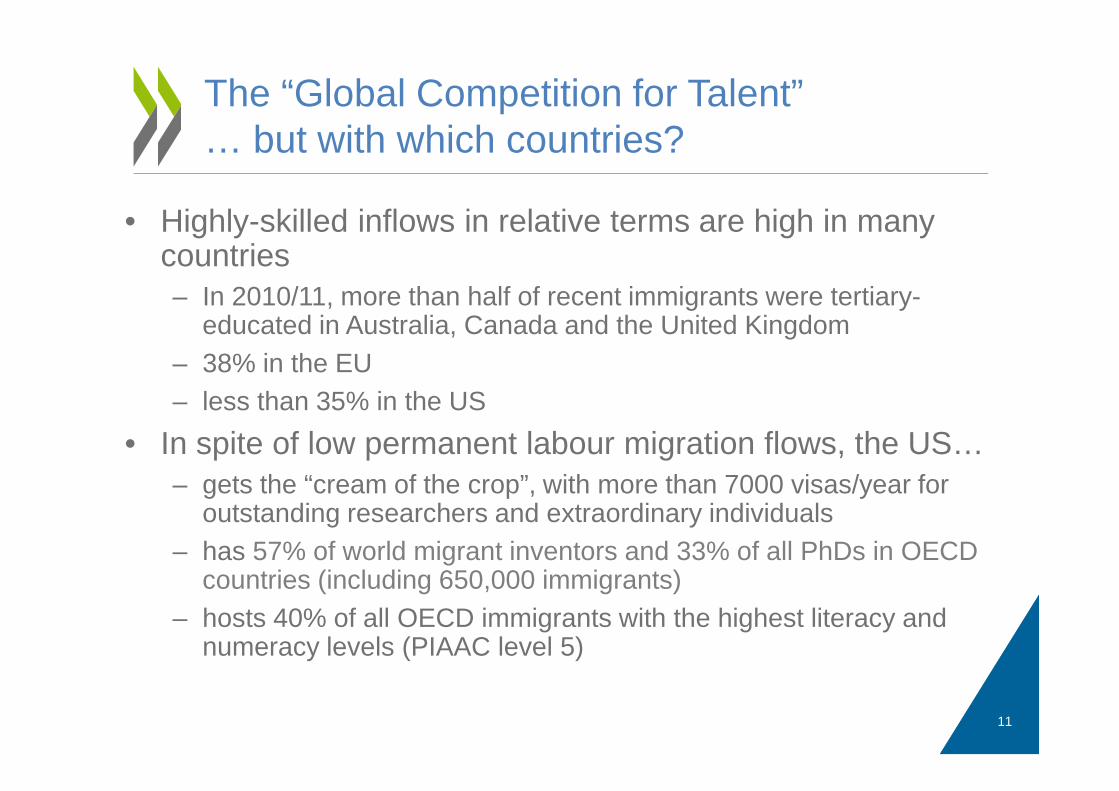
• Highly-skilled inflows in relative terms are high in many countries– In 2010/11, more than half of recent immigrants were tertiary-
educated in Australia, Canada and the United Kingdom – 38% in the EU– less than 35% in the US
• In spite of low permanent labour migration flows, the US…– gets the “cream of the crop”, with more than 7000 visas/year for
outstanding researchers and extraordinary individuals – has 57% of world migrant inventors and 33% of all PhDs in OECD
countries (including 650,000 immigrants)– hosts 40% of all OECD immigrants with the highest literacy and
numeracy levels (PIAAC level 5)
The “Global Competition for Talent” … but with which countries?
11

Approaches in the recruitment of highly-skilled foreign workers
Entry channels(model type)
Job search (supply driven)
Expression of interest
(mix)
Job offer(demand driven)
International students(mix)
Intra-company transfer(demand driven)
Selection Mechanisms
-Education
- Point Based System (PBS)
PBS
- Min. Education- Min. Wage
- Occupations- PBS
Job offer after graduation (usually
matching education)
Minimum seniority, skill level, wage
Limitation
(Cap)
Target numbers
- Labour Market Test- (Numerical Limits)
- Generally more favourable conditions (no LMT, lower salary
requirements)
Usually uncapped, but mostly only temporary
Countries
DEU, AUT, NLD, DNK
AUS, NZL, CAN
- Most European OECD countries; JAP, KOR, SWE (no
NL, no LMT)- USA , UK (NL + LMT)
All OECD countries (except Israel, the US and UK
impose limits)
All OECD countries
Wage thresholds, occupational categories, and language requirements are means to judge the skill level; the same goes for employer demand.
12
• Increasing level of education in countries of origin but alsoincreasing diversity within tertiary educated category => going beyond formal education to select skills
• Increasing mobility => Retention (of international students and temporary high-skilled workers) and emigration (of nationals) are of high policy concern in some countries
• A country’s capacity to attract and retain high-skilled migrantsdepends on many other things than migration policy(economic conditions; wages; employer behaviour; R&D infrastructure; etc.)
13
Conclusions
www.oecd.org/migration
14
For further information on the OECD’s work on migration and integration: