Thomas Debray, PhD · Thomas Debray, PhD Julius Center for Health Sciences and Primary Care,...
23
Meta-analysis of external validation studies Thomas Debray, PhD Julius Center for Health Sciences and Primary Care, University Medical Center Utrecht, The Netherlands Cochrane Netherlands, Utrecht, The Netherlands [email protected]
Transcript of Thomas Debray, PhD · Thomas Debray, PhD Julius Center for Health Sciences and Primary Care,...

Meta-analysis of external validation studies
Thomas Debray, PhD
Julius Center for Health Sciences and Primary Care,University Medical Center Utrecht, The Netherlands
Cochrane Netherlands, Utrecht, The Netherlands

Meta-analysis of external validation studies - Introduction
Prediction
� Turn available information about individuals into a statementabout the probability:. . . of having a particular disease → diagnosis. . . of developing a particular event → prognosis
� Use of multiple predictorsI Subject characteristicsI History and physical examination resultsI Imaging resultsI (Bio)markers
� Typical aimsI to inform patients and their familiesI to guide treatment and other clinical decisionsI to create risk groups
Vigo, July 10, 2017 TPA Debray 2/23

Meta-analysis of external validation studies - Introduction
What is a good model?
IMPACTImprove patient
outcomes
DISCRIMIN
ATION
SUP
PORTG
EN
ERALITY
CALIBRA
TION
Vigo, July 10, 2017 TPA Debray 3/23
Accurate predictionsAbility to distinguishbetween low and highrisk patients
Good and consistentperformance acrossdifferent settings andpopulations
Influence decisionmaking

Meta-analysis of external validation studies - Introduction
Numerous models for same target population + outcomes
1995
“We believe that the main reasons why doctors reject publishedprognostic models are lack of clinical credibility and lack ofevidence that a prognostic model can support decisions aboutpatient care.”
Wyatt JC, Altman DG. Commentary: Prognostic models: clinically useful orquickly forgotten? BMJ. 1995;311(7019):1539–41.
Vigo, July 10, 2017 TPA Debray 4/23

Meta-analysis of external validation studies - Introduction
Numerous models for same target population + outcomes
1995 2012
“Comparing risk prediction models shouldbe routine when deriving a new model forthe same purpose”
Collins GS, Moons KGM. Comparing risk prediction models. BMJ.2012;344:e3186–e3186.
Vigo, July 10, 2017 TPA Debray 5/23

Meta-analysis of external validation studies - Introduction
Numerous models for same target population + outcomes
1995 2012 2016
“There is an excess of models predicting incidentCVD in the general population. The usefulness ofmost of the models remains unclear.”
Damen JAAG, Hooft L, et al. Prediction models for cardiovascular disease riskin the general population: systematic review. BMJ. 2016;353:i2416.
Vigo, July 10, 2017 TPA Debray 6/23

Meta-analysis of external validation studies - Introduction
Numerous models for same target population + outcomes
1995 2012 2016
2017
Formal guidance for systematic review and meta-analysis
Vigo, July 10, 2017 TPA Debray 7/23

Meta-analysis of external validation studies - Guidance
Motivating example
Previous guidance focused on meta-analysis of logistic regressionmodels. Hence, focus of today is on survival models.
Framingham Risk Score (Wilson et al. 1998)
� Model type: Cox regression
� Outcome: Fatal or non-fatal coronary heart disease (CHD)
� Timing: Initial CHD within 10 years
� Evidence: 24 validations in male populations
Summarize estimates of model performance
� Concordance statistic (cstat)
� Ratio of observed versus expected events (OE)
� Calibration slope (slope)
Vigo, July 10, 2017 TPA Debray 8/23
Meta-analysis of external validation studies - Guidance
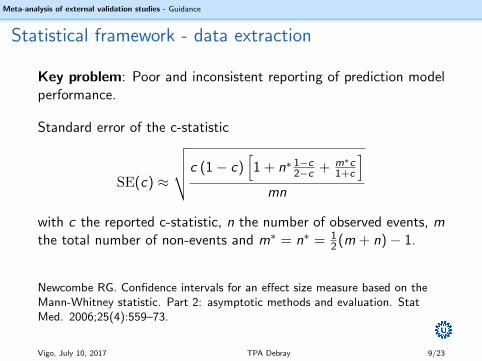
Statistical framework - data extraction
Key problem: Poor and inconsistent reporting of prediction modelperformance.
Standard error of the c-statistic
SE(c) ≈
√√√√c (1− c)[1 + n∗ 1−c2−c + m∗c
1+c
]mn
with c the reported c-statistic, n the number of observed events, mthe total number of non-events and m∗ = n∗ = 1
2(m + n)− 1.
Newcombe RG. Confidence intervals for an effect size measure based on theMann-Whitney statistic. Part 2: asymptotic methods and evaluation. StatMed. 2006;25(4):559–73.
Vigo, July 10, 2017 TPA Debray 9/23

Meta-analysis of external validation studies - Guidance
Estimated versus reported standard error of the c-statistic
EuroSCORE II Framingham
0.000 0.025 0.050 0.075 0.1000.000 0.025 0.050 0.075 0.100
0.000
0.025
0.050
0.075
0.100
Estimated standard error
Rep
orte
d st
anda
rd e
rror
Vigo, July 10, 2017 TPA Debray 10/23

Meta-analysis of external validation studies - Guidance
Statistical framework - data extraction
Ratio of observed versus expected events
� Reference value: 1
� Observed survival probability (SKM,t)
� Expected (predicted) event rate (PE,t)
(O:E)t =1− SKM,t
PE,t
SE(O:E)t =1
PE,tSE(SKM,t)
If unavailable, SE(SKM,t) can be approximated as well:
SE(SKM,t) ≈
√SKM,t(1− SKM,t)
Nt
Vigo, July 10, 2017 TPA Debray 11/23

Meta-analysis of external validation studies - Guidance
Extraction of event rates: an example
Vigo, July 10, 2017 TPA Debray 12/23

Meta-analysis of external validation studies - Guidance
Statistical framework - data extraction
Calibration slope
� Reference value: 1
� The calibration slope β is calculated as follows using IPD:
yk ∼ Bernoulli(pk)
logit(pk) = α + β LPk
� When missing, we can derive β from reported event countsacross j risk strata (e.g. as presented in calibration tables):
Oj ∼ Binom(Nj , pO,j)
logit(pO,j) = η + β logit(PE,j)
Vigo, July 10, 2017 TPA Debray 13/23

Extracted risk estimates for the Framingham Risk Score
0.0
0.1
0.2
0.3
0.4
0.5
0.0 0.1 0.2 0.3 0.4 0.5
Expected risk
Obs
erve
d ris
k
The diagonal line indicates perfect calibration. Risk estimates were reported for 5years follow-up (dashed lines), 7.5 years follow-up (dotted lines) and 10 years
follow-up (full lines).

Meta-analysis of external validation studies - Guidance
Statistical framework - data extraction
cstat SE.cstat OE slope
0
10
20
2421 21
16
11
19
10
4
02
02
00
11 10 11
#va
lidat
ion
s
analysedreported
study authorsapproximated
For 10 studies, calibration performance was only available for < 10 years follow-up.
Vigo, July 10, 2017 TPA Debray 15/23

Meta-analysis of external validation studies - Guidance
Statistical framework - meta-analysis models
Meta-analysis of the c-statistic
� Need to apply logit transformation
logit(ci ) ∼ N(µdiscr,Var (logit(ci )) + τ2discr
)� Use delta method to derive Var (logit(ci )) from SE(ci )
� For Bayesian models, we propose weakly informative priors:I µdiscr ∼ N (0, 106)I τdiscr ∼ Unif(0, 2)I τdiscr ∼ Student-t(0, 0.52, 3)T [0, 10]
based on empirical data from 26 meta-analyses(with τ̂discr ranging from 0 to 0.50).
Vigo, July 10, 2017 TPA Debray 16/23

Meta-analysis of external validation studies - Guidance
Statistical framework - meta-analysis models
Meta-analysis of the c-statistic
Estimation K Summary 95% CI 95% PI
REML 21 0.69 0.66 – 0.71 0.59 – 0.77Bayesian (Unif) 24 0.69 0.66 – 0.71 0.59 – 0.78Bayesian (Student-t) 24 0.69 0.66 – 0.71 0.59 – 0.78
For 3 studies, we did not have information on ci but could neverthelessapproximate SE(ci ).
Vigo, July 10, 2017 TPA Debray 17/23

Meta-analysis of external validation studies - Guidance
Statistical framework - meta-analysis models
Meta-analysis of the total O:E ratio
We can use different models to account for sampling variability:
Option 1 ln(O:E)i ∼ N(µcal.OE,Var (ln(O:E)i ) + τ2cal.OE
)Option 2 Oi ∼ Binom (Ni , pO,i )
Ei ∼ Binom (Ni , pE,i )
ln (pO,i/pE,i ) ∼ N(µcal.OE, τ
2cal.OE
)Option 3 Oi ∼ Poisson (Ei exp(ηi ))
ηi ∼ N(µcal.OE, τ
2cal.OE
)For all models, the interpretation of µcal.OE and τcal.OE is the same.
Vigo, July 10, 2017 TPA Debray 18/23

Meta-analysis of external validation studies - Guidance
Statistical framework - meta-analysis models
Meta-analysis of the total O:E ratio (c’ ed)
� For Bayesian models, we propose weakly informative priors:I µcal.OE ∼ N (0, 106)I τcal.OE ∼ Unif(0, 2)I τcal.OE ∼ Student-t(0, 1.52, 3)T [0, 10]
based on empirical data from 16 meta-analyses(with τ̂cal.OE ranging from 0 to 1.39).
� Possible to extrapolate event rates at time l to time t using:
pt = 1− SKM,t = 1− exp
(t ln(1− pl)
l
)Straightforward to integrate in Bayesian estimation framework
Vigo, July 10, 2017 TPA Debray 19/23

Meta-analysis of external validation studies - Guidance
Statistical framework - meta-analysis models
Meta-analysis of the total O:E ratio
Estimation K Summary 95% CI 95% PI
REML1 6 0.56 0.28 – 1.16 0.09 – 3.62Bayesian1 (Unif) 6 0.61 0.19 – 1.08 0.00 – 2.84Bayesian1 (Student-t) 6 0.61 0.20 – 1.07 0.00 – 2.63ML3 6 0.56 0.25 – 1.26 0.03 – 11.29 ?Bayesian3 (Unif) 7 0.60 0.19 – 1.09 0.00 – 2.91Bayesian3 (Student-t) 7 0.60 0.18 – 1.05 0.00 – 2.67
When applying extrapolation, we have 10 additional studies for meta-analysis(similar results).
Vigo, July 10, 2017 TPA Debray 20/23

Meta-analysis of external validation studies - Guidance
Statistical framework - meta-analysis models
Meta-analysis of the calibration slope
� No transformations needed
� Rely on binomial approximation
Oij ∼ Binom(Nij , pO,ij)
logit(pO,ij) = αi + βi logit(PE,ij)
βi ∼ N (µcal.slope, τ2cal.slope)
� For Bayesian models, we propose weakly informative priors:I µcal.slope ∼ N (0, 106)I τcal.slope ∼ Unif(0, 2)I τcal.slope ∼ Student-t(0, 1.52, 3)T [0, 10]
Vigo, July 10, 2017 TPA Debray 21/23

Meta-analysis of external validation studies - Guidance
Statistical framework - meta-analysis models
Meta-analysis of the calibration slope
Estimation K Summary 95% CI 95% PI
ML 3 1.03 0.90 – 1.16 0.20 – 1.87Bayesian† 3 1.05 0.47 – 1.64 -0.01 – 2.22Bayesian‡ 3 1.05 0.51 – 1.65 -0.06 – 2.17
When applying extrapolation, we have 8 additional studies for meta-analysis(similar results but smaller intervals).
Vigo, July 10, 2017 TPA Debray 22/23

Meta-analysis of external validation studies - Conclusion
Final remarks
� Substantial efforts often needed to restore missing information
� Bayesian estimation methods recommended to fully propagateuncertainty arising from data restoration
� Development of R package metamisc to assist in datapreparation and meta-analysis
� Presence of statistical heterogeneity most likely
� Straightforward extension to meta-regression and multivariatemeta-analysis
Vigo, July 10, 2017 TPA Debray 23/23