THn AUERTcAN MlxERALocrsr - minsocam.org
14
THn AUERTcAN MlxERALocrsr JOURNAL OF THE MINERALOGICAL SOCIETY OF AMERICA Vo]. 32 JULY-AUGUST, 1947 Nos. 7 and 8 LIQUID INCLUSIONS IN GEOLOGIC THERMOMETRY Eanr, fNcBn sov, Geo physical Laboratory, Washington,D. C. Assrnacr A satisfactory method of determining temperatures of crystallization from the liquid inclusions in minerals would aid in the solution of many problems of geologic thermometry. Recently published data on the specific volume of water at high temperatures and pressures allow much more accurate determination of the efiect of original pressure than has been possible before. Data on the critical temperature of aqueous solutions of alkali halides provide the basis for better evaluation of the efiect of concentration. Curves have been prepared showing the relation of degree of filling of inclusions and temperature of disappearance of the vapor phase, both for pure water and for a l0 per cent solution of NaCl and KCl. Two sets of curves show the relation between temperature of disappearance of the vapor phase, pressure at the time of formation, and temperature of formation. Measurements on quartz from pegmatites indicate temperatures below 250" C. Pressure corrections where depth can be estimated range from 54' to 73" C. for specimens studied thus fat by the author. INrnooucrroN The classic work on liquid inclusions in minerals, especially qluartz, was done by Sorby (1858) almost ninety years ago. The method of estimating temperature of formation of minerals from such inclusions has been used in a desultory fashion since that time, but few contribu- tions to theory or technique have been made since Sorbyts paper ap- peared. The unsatisfactory status of the subject is indicated by the fact that a leading textbook of petrology merely indicates that a small vapor bubble is likely to mean relatively low temperature of formation and a large bubble higher temperature. Also, a summary of geologic ther- mometry remarks that the problem becomes insoluble above the critical temperature. However, recent work on the specific volume of water at high temperatures and pressures makes possible much more accurate approximations of temperature than the diagram in the above-mentioned textbook would lead one to believe. and estimates above the critical temperature of the depositing solutions can sometimes be made if the 375
Transcript of THn AUERTcAN MlxERALocrsr - minsocam.org

THn AUERTcAN MlxERALocrsrJOURNAL OF THE MINERALOGICAL SOCIETY OF AMERICA
Vo]. 32 JULY-AUGUST, 1947 Nos. 7 and 8
LIQUID INCLUSIONS IN GEOLOGIC THERMOMETRY
Eanr, fNcBn sov, Geo physical Laboratory,Washington, D. C.
AssrnacrA satisfactory method of determining temperatures of crystallization from the liquid
inclusions in minerals would aid in the solution of many problems of geologic thermometry.Recently published data on the specific volume of water at high temperatures and pressuresallow much more accurate determination of the efiect of original pressure than has beenpossible before. Data on the critical temperature of aqueous solutions of alkali halidesprovide the basis for better evaluation of the efiect of concentration.
Curves have been prepared showing the relation of degree of filling of inclusions andtemperature of disappearance of the vapor phase, both for pure water and for a l0 per centsolution of NaCl and KCl. Two sets of curves show the relation between temperature ofdisappearance of the vapor phase, pressure at the time of formation, and temperature offormation.
Measurements on quartz from pegmatites indicate temperatures below 250" C. Pressurecorrections where depth can be estimated range from 54' to 73" C. for specimens studiedthus fat by the author.
INrnooucrroN
The classic work on liquid inclusions in minerals, especially qluartz,was done by Sorby (1858) almost ninety years ago. The method ofestimating temperature of formation of minerals from such inclusionshas been used in a desultory fashion since that time, but few contribu-tions to theory or technique have been made since Sorbyts paper ap-peared.
The unsatisfactory status of the subject is indicated by the fact that aleading textbook of petrology merely indicates that a small vaporbubble is likely to mean relatively low temperature of formation and alarge bubble higher temperature. Also, a summary of geologic ther-mometry remarks that the problem becomes insoluble above the criticaltemperature. However, recent work on the specific volume of water athigh temperatures and pressures makes possible much more accurateapproximations of temperature than the diagram in the above-mentionedtextbook would lead one to believe. and estimates above the criticaltemperature of the depositing solutions can sometimes be made if the
375

3it6 EARL INGERSON
pressure can be estimated from the geologic data.The fundamental assumption has not changed since Sorby's time,-
that a liquid inclusion cavity was just filled with fluid at the tempera-
ture and pressure under which it was formed. These conditions, and the
composition of the solution, determine the degree of filling of the cavity
as it is observed at room temperature. ff a crystal containing such in-
clusions is heated, the liquid will expand and fill the cavities at the
temperature of formation if the original pressure did not exceed sig-
nificantly the vapor pressure of the solution. If the pressure was consid-
erably greater, then more fluid would have been compressed into each
inclusion; consequently, on re-heating, the liquid would fill the cavity
at a lower temperature than that of crystallization of the mineral.
Other 6ssut/t?tions.It must also be assumed that the change of volume
of the mineral itself is not significant and that changes in volume and
concentration brought about by deposition of material from the solution
as it cools are such as not to affect the result. Relative compressibilitiesof water and quartz are shown in Table 1. Data on water are from Dorsey
Tesln 1. CownnssrsrrrrrEs ol Werrn aNo Qulnrz
P:V.P. HzO P:1 a tm . P:2000 atm.
Quartz Quartz
30/ J
150225
45.248.467.9
136.5
2 . 7 62 . 7 8
2 .652 .67
(1940), pp.240 and 243 and on quaftz are from Sosman (1927), p. 427.
The compressibility of water is more than 13 times that of quartz even
at 2000 atmospheres pressure. At higher temperatures the differencesare even greater.
In most liquid inclusions any material deposited during cooling must
be the same as the including mineral, since no foreign material can be
observed on the walls of the cavities. Water at200" dissolves about 0.1
per cent of silica. If the liquid in inclusions in quartz contained 10 times
that much silica and deposited all of it during cooling, the total change in
composition would be only 1 per cent and the volume change would be
only about 1 part in 300.These are, therefore, second order factors whose total effects are less
than the probable errors in estimating the effect of pressure, so the as-
(All values X10{)

LIQUID INCLUSIONS IN GEOLOGIC TEERMOMETRY 377
sumption that they can be neglected appears to be justified.Second.ary inclusions. ft is necessary to distinguish carefully between
primary and secondary liquid inclusions in a mineral. Only the primaryones record the temperature at which the mineral crystallized; secondaryinclusions may give an indication of prevailing temperature during alater reworking.
Crystals in vugs and other open spaces in veins almost certainly havenot been crushed and cemented together by later solutionsl nor is itlikely that they have been dissolved and recrystallized. Therefore, theassumption that the inclusions in such crystals are primary and can beused for estimates of temperature is probably warranted.
fn interlocking crystalline aggregates in the massive parts of veins, andin metamorphic and igneous rocks, however, the relations are much morecomplex. The crystals of such aggregates may have been partially orentirely recrystallized after the formation of the vein or rock. There-fore, some or all of the inclusions may indicate the temperature of therecrystallization rather than that of the original formation.
If planes of liquid inclusions cross grain boundaries without offset orchange of orientation, the inclusions are almost certainly secondary. ffplanes of inclusions have more or less constant orientation(s) over anentire thin section, regardless of the orientation of the individual grains,the chances are good that the inclusions are secondary, even in planesnot observed to cross grain boundaries.
Where planeb of inclusions are confined to individual mineral grainsor where arrangement in planes is not evident, the chances are betterthat the inclusions are primary. Control of orientation by the crystalIattice of grains can be evidence that inclusions are primary, but it isalso possible for secondary inclusions to be so controlled.
In each case all available evidence should be marshalled in decidine theorigin of inclusions,-paragenesis, alteration, replacement, etc.
TrcuNreun
If a heating stage is available, polished plates can be observed as theyare heated and the actual temperature at which the inclusions becomefull of liquid determined directly. If no heating stage is available, it ispossible to calculate the temperature of disappearance of the vaporphase from the degree of filling of the inclusions. However, it is rarely pos-sible to estimate degree of filling with a satisfactory degree of precision.Only when an inclusion has a very regular form is there a chance to makea reasonably accurate estimate. Such forms include negative crystals,elongate prismatic or tubular inclusions of uniform diameter and flatoval-shaped inclusions where the vapor bubble is appressed so that the

. t /6 EARL INGERSON
relative areas are proportional to the relative volumes. Figure 1 gives
the relation between degree of filling and the temperature at which theinclusions are'just filled with fluid for pure water and for a 10 per centchloride solution. For example, if the ratio of vapor to total volume atroom temperature is 0.2, the vapor would disappear at 250o C. if theliquid is pure water, at 274" C. if it is a 10 per cent solution of alkalihalides.
450
400
350
300
AI
| 2soTtc
200
t50
too
50
o.lo o.2o o3o o.4o ,giro
0.60 o.7o o.ao o.9o loo
"'/vFrc. 1. Graph showing relation between degree of filling of inclusions and temperature
at which they become filled with a homogeheous phase. For ratios less than about 0.70 of
vapor to total volume (left side of dome) this phase is liquid; for higher ratios the phase is
vapor. The curve marked "10 per cent NaCl or KCI solution" is probably usable for any
solution with approximately 10 per cent of any combination of alkali halides with minor
amounts of carbonates, silica, and other compounds.
Elpncr or CoNcENTRATToN
The value of 10 per cent has been chosen because the few availabledata indicate that the solutions in liquid inclusions (at least in quartz)are likely to have concentrations of that order of magnitude.l
r See, for example, Kdnigsberger and Miiller (1906). D. W. J. Grey, of the St. John del
Rey Mining Company, writes that samples of solution taken from vugs in quartz veins well
{n6y,r
$y

LIQUID INCLUSIONS IN GEOLOGIC TEERMOMETRY s79
Sorby (1858, pp. 461-462) studied the expansion of a 10 per centsolution of KCI up to 200o C. and derived a formula for calculating tem-
o
4uld-l
autrJo-Etd
W E I G H T P E R C E N T
Frc. 2. Critical temperatures of solutions of NaCl or KCl. AT to be added to thecritical temperature of water,374" C. Calculated from data of Schrder (1927).
perature of disappearance of the vapor phase at higher temperatures forknown degrees of filling. Schrrier (1927) determined the critical tempera-
below the zone of ground water circulation show concentrations up to 12 per cent NaCl,with minor amounts of other compounds. The mine waters are high in sulfate, but no sulfatewas found in the vugs.

380 EARL INGERSON
tures of solutions of several alkali halides, including solutions of NaCland KCI up to 5 per cent by weight. He plotted ln 100r against ln ATand obtained straight lines. His data were plotted on a larger scale by thepresent writer and points taken therefrom to draw the curve of Fig. 2,which gives the increase in the critical temperature above that of water,against weight per cent KCI or NaCl. Schr<ier's data indicate that theincreases for these compounds are so nearly the same that one curvewill serve for both. The upper part of the curve represents a considerableextrapolation from the experimental data, but probably is not very faroff since the solubilities of these chlorides increase with temperature andthere is no chance that saturation is encountered (Keevil, 1942).
The upper curve of Fig. 1 was obtained by plotting the critical tem-perature of a 10 per cent chloride solution as determined from Fig. 2(T" for water:374" C.+64":438o C.), and fitt ing in Sorby's curve fora 10 per cent solution after applying a correction based on the latestdata on the properties of water in this temperature range. Schrder'svalues show that the critical density of a 10 per cent solution does notdiffer sufficiently from that of pure water to be significant in theseestimates.
Errpcr or PRESSURE
High external pressure produced by the weight of superincumbentrock at the time of formation of the liquid inclusion can greatly affectthe apparent temperature of formation as determined by the tempera-ture of disappearance of the gas bubble. From a diagram2 of the pressure-temperature-volume relations of water, Fig. 3, we can see how to evaluatethe effect of this pressure. Abscissae show ratios of total volume tovolume of liquid at room temperature; ordinates, degrees centigrade.Solid lines, except the "dome," are isobars. Let us consider what hap-pens when an inclusion with a given degree of filling is heated. The ver-tical dashed line follows the course of pressure development in an inclu-sion that is two-thirds full of liquid at ordinary temperatures. As thespecimen is heated, the liquid expands and the pressure increases, untilat 320" C. the vapor disappears. At this point the pressure is 120 atm.Above this temperature, pressure increases very rapidly; at 350" it is500 atm.; at 400", 2500 atm.
ft is apparent that degree of filling and temperature determine thepressure. Conversely, if degree of filling and original pressure are knownthe temperature can be found. Temperature of disappearance of the
2 Compiled from the following sources: Birch (1942), Dorsey (1940), Smith and Keyes(1934), and Van Nieuwenburg and Blumendal (1932).

LIQUID INCLUSIONS IN GEOLOGIC THERMOMETRY
cfr lc_+
Frc. 3. Pressure-temperature-volume relations of water. Modified from a diagramplotted by O. F. Tuttle from data in references mentioned in the text.
vapor phase is a function of degree of filling and is the quantity actuallymeasured. It can be used quite as well as degree of filling, and is moreconvenient. A diagram3 prepared with this in mind, Fig. 4, gives tem-perature of formation when original pressure can be estimated and thetemperature of disappearance of the vapor phase is known. Suppose,for example, that in a given crystal the inclusions are filled with liquidat 100" C. From the geologic occurrence it can be estimated that rock
3 Data from same sources as Fig. 3. Ovetlapping data from different sources always gave
the same correction within 5" C. and usuallv within 2o C.
1T

EARL INGERSON
pressure at the time of formation of the crystal was 2500 atm. By follow-ing the curve that originates at 100" at the left of the diagram over to apressure of 2500 atm. we see that the actual temperature of formationwas 200o C.
t-T-
Dep th I n K rn1 4 5 6 t a 9
T "--T
tI|
3 0 0
"J
ro00 1500P Kd /C r r l ?o /
Frc. 4. Curves showing relations between temperature of disappearance of vapor phase,pressure (or depth) at the time of formation of the inclusion, and temperature of forma-tion of the inclusion. Observed temperatures of disappearance are given by points at IeItend of curves; then each curve shows increasing temperature of formation corresponding tohigher pressures.

LIQUID INCLUSIONS IN GEOLOGIC THERMOMETRI- 3S3
Even when minerals crystallize from solutions above their critical
temperatures it is sometimes possible to determine temperature of for-
mation by this method. For example, suppose that inclusions in a mineral
are just filled with liquid at 360' C. and were formed at a pressure of
2100 atm. The temperature of crystallization was 500" C., which is con-
siderably above the critical temperature not only of water but also of a
10 per cent solution of alkali chlorides.
O
7 loF
UJv.u(J
u
far/)UJtrI
t50 200TEMPERATURE OF DISAPPEARANCE
250OF VAPOR
300PHASE.
Frc. 5. Data of Fig. 4 plotted for use of temperature of disappearance of
the vapor phase without interpolation'

384 EARL INGERSON
Figure 4 has its curves for even temperatures of disappearance of thevapor phase. Since a bubble rarely disappears at just 100' or 250" C.,interpolation is almost always necessary. In Fig. 5 temperature correctionis plotted against temperature of disappearance of the vapor phase andthe curves are for kilometers of depth. Since it is rarely possible to besure of depth of cover nearer than a kilometer or so, at the time offormation of a crystal, necessity for interpolation is much less frequentwith the data in this form.
DrscussroN; Souncns oF ERRoR
Obseraational d,fficulties. With available heating stages a compara-tively large working distance is required, so it is not possible to use highpower objectives. The "U.M." objectives developed by Leitz for use withthe universal stage give greater working distance for the same initialmagnification than ordinary objectives, but have somewhat inferiorresolution. The highest power in this series is the U.M. 4, with initialmagnification of 30X.
With this objective the vapor bubble can be seen in liquid inclusionsdown to a few hundredths of a millimeter in diameter. Ifowever, it is byno means certain that the temperature of disappearance can be deter-mined accurately in inclusions of this size. For example, in one quartzplate the vapor bubbles seemed to disappear in inclusions smaller than0.05 mm. at about 100" C. ; in those f rom 0.06 to 0.08 mm. at 115" C. ;and in those larger than 0.1 mm. at 125" C. As the distribution pre-cluded any zoning effect, it is probable that in the smaller inclusions thevapor bubble became invisible to the eye before the vapor phase com-pletely disappeared. When the size of the inclusions must be considered,as in the above example, the highest value is probably the best one (ifleakage has not taken place, see below).
Rate of heating is also important. ft is sometimes observed, especiallyin a small inclusion, that a vapor bubble disappears during rapid heating,only to reappear several degrees higher when thermal equilibrium hasbeen reached. Continued gradual heating gives a quite different andmore accurate result.
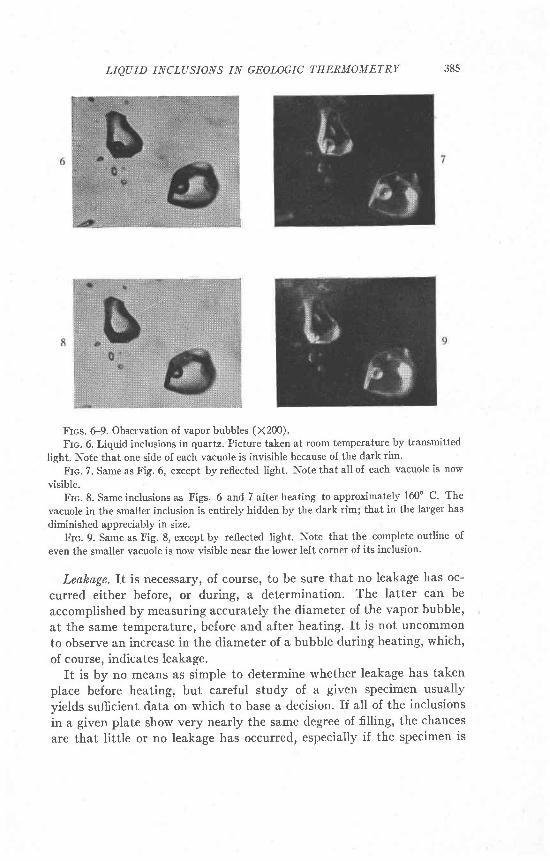
In larger inclusions, as well as these very small ones, another observa-tional difficulty is likely to enter. If the sides of the liquid inclusions arenot vertical there will be a dark border around the inclusion, producedby total reflection. The vapor bubble may disappear behind this darkborder long before the vapor phase is actually gone. Usually the bubblecan be seen again by using reflected light, either with or without trans-mitted light. 'Ihis technique is illustrated in Figs. 6-9.
LIQUID INCLUSIONS IN GEOLOGIC THERMOMETRY 38s
Frcs. G9. Observation of vapor bubbles (X200).
Fro. 6. Liquid inclusions in quartz. Picture taken at room temperature by transmitted
light. Note that one side of each vacuole is invisible because of the dark rim.
Frc. 7. Same as Fig. 6, except by reflected light. Note that all of each vacuole is now
visible.Frc. 8. Same inclusions as Figs. 6 and 7 after heating to approximately 160' C. The
vacuole in the smaller inclusion is entirely hidden by the dark rim; that in the larger has
diminished appreciably in size.Frc. 9. Same as Fig. 8, except by reflected light. Note that the complete outline of
even the smaller vacuole is now visible near the lower Ieft corner of its inclusion.
Leakage. It is necessary, of course, to be sure that no leakage has oc-
curred either before, or during, a determination. The Iatter can be
accomplished by measuring accurately the diameter of the vapor bubble'
at the same temperature, before and after heating. ft is not uncommon
to observe an increase in the diameter of a bubble during heating, which,
of course, indicates leakage.It is by no means as simple to determine whether leakage has taken
place before heating, but careful study of a given specimen usually
yields sufficient data on which to base a decision. If all of the inclusions
in a given plate show very nearly the same degree of filling, the chances
are that little or no leakage has occurred, especially if the specimen is
386 EARL INGERSON
free of fractures. If, however, the degree of filling is highly variable, andchanges in an irregular manner throughout the specimen, leakage hasprobably occurred. In many specimens leakage can be definitely estab-lished by relating lines of inclusions with large vapor bubbles (or entirelyfilled with vapor or gas) to fractures in the specimen.
Where part of the liquid has escaped, the first effect is to raise thetemperature at which the contents of the inclusion become homogeneous.After enough has escaped so that the inclusion contains just the criticalvolume of liquid, the effect reverses and the loss of more liquid (or vapor)lowers the temperature at which homogeneity is reached. In the first case(more than critical volume of liquid) the vapor bubble decreases in sizeand vanishes so that the cavity is completely filled with liquid; in thesecond, the bubble expands until the cavity is filled with vapor.
If some of the inclusions of a given specimen have lost part of theircontents, but they all still become homogeneous by disappearance of thevapor phase, then the lowest temperature found is probably a maximumfor the crystallization of the specimen. If many of the inclusions show thesame temperature of disappearance of the vapor phase, with the othersshowing erratic higher values, then the lower temperature, at which themany disappear, may be taken as the estimated temperature of formationof the crystal.
Estimates of pressure. There is always some uncertainty as to the exactdepth of cover at the time when a mineral was crystallizing. Errors willvary from negligibly small to a factor of several-fold.
Even when depth of cover can be estimated accurately, it cannot beestablished that the solutions were under a pressure equal to that pro-duced by the weight of the overlying rocks. If there was not enough fluidto fill the available pore space at the pressure produced by the over-burden, the pressure could have been lower than that calculated. On theother hand, strength of the crust might have allowed pressure consider-ably greater than that calculated from depth of cover.
Holden (1925) outlines a method for estimating pressure from theinclusions themselves, independent of any figure for depth of burial.The method involves finding inclusions both with and without COz inthe same specimen, so it is of limited applicability. It is possible thatother methods that are more generally useful can be found. Holdenneglected the efiect of pressure in estimating temperature, so for mostcases his technique would have to be modified.
RBsur,rs
Most of the actual determinations thus far have been on quartz. Theresults from pegmatite qtartz, a few of which are shown in Table 2,
LIQUID INCLUSIONS IN GEOLOGIC THERMOMETRY
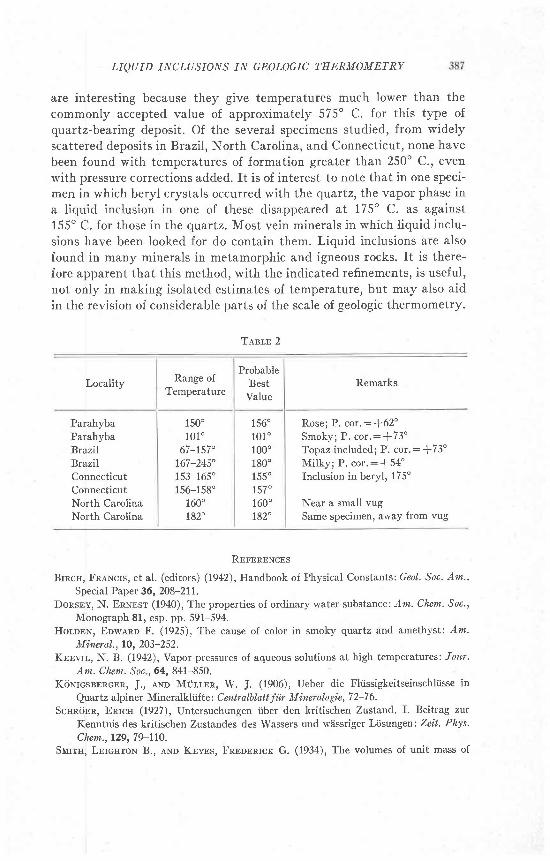
are interesting because they give temperatures much lower than thecommonly accepted value of approximately 575" C. for this type ofquartz-bearing deposit. Of the several specimens studied, from widelyscattered deposits in Brazil, North Carolina, and Connecticut, none havebeen found with temperatures of formation greater than 250o C., evenwith pressure corrections added. It is of interest to note that in one speci-men in which beryl crystals occurred with the qvartz, the vapor phase ina liquid inclusion in one of these disappeared at 175" C. as against155' C. for those in the quartz. Most vein minerals in which liquid inclu-sions have been looked for do contain them. Liquid inclusions are alsofound in many minerals in metamorphic and igneous rocks. ft is there-fore apparent that this method, with the indicated refinements, is useful,not only in making isolated estimates of temperature, but may also aidin the revision of considerable parts of the scale of geologic thermometry.
Tl^st-r. 2
Locality
ParahybaParahybaBrazilBrazilConnecticutConnecticutNorth CarolinaNorth Carolina
Range ofTemperature
ProbableBestValue
150'101'
67-157"167-245"153-165"15G158'
160'182'
156"10101000180'155"157 "160'182"
Remarks
Rose; P. cor.:+62oSmoky; P. cor.:+73oTopaz included; P. cor.: f 73oMilky; P. cor.: +54"fnclusion in beryl, 175"
Near a small vugSame specimen, away from vug
RnlrnrNcBs
Brr.cr, Fnaxcrs, et al. (editors) (1942), Handbook of Physical Constants: Geol. Soe. Am..
Special Paper 36, 208-211.DoRSEy, N. EnNrsr (1940), The properties of ordinary water-substance: Am. Chem. Soc.,
Monograph 81, esp. pp. 591-594.Hor.orx, Eowenr F. (1925), The cause of colot in smoky quartz and amethyst: Atn.
Min er o1,., lO, 203-252.Krnvrl, N. B. (1942), Vapor pressures of aqueous solutions at high temperattres: Jour'
And. Chem. Soc, 64, 841-850.KciNrcsrnncrn, J., AND Miir,r-rn, W. J. (1906), Ueber die Fliissigkeitseinschliisse in
Quartz alpiner Mineralkliif te : C eu,tr albl at t J iir M'in er al o gie, 7 2-7 6.
Scnncinn, Enrcn (1927), Untersuchungen iiber den kritischen Zustand. I. Beitrag zur
Kenntnis des kritischen Zustandes des Wassers und w?issriger Ldsungen: Zei't. Phys.
Chem., 129, 79-110.Surrrr, LnrcnroN B., exo Knvns, Fneonnrcr G. (1934), The volumes of unit mass of

388 EARL INGERSON
liquid water and their correlation as a function of pressure and temperature: Proc.Am. Acad. Arts and. Sci.,69,285-312.
Sonrv, H. C. (f858), On the microscopical structure of crystals: Qu,arl. Jour. Geol,. Soc,Lonilon, 14, 453-500.
SosuaN, R. B. (1S27), The Properties of Silica; An. Ckem. Sae., Monograph 3f.VeN Nrruwrnnunc, C. J., avo BruurNoe.l, I{. B. (lg3}), The isotherms of water from
350"-480" C, and for pressures up to 600 kg/cmz Rec. Trat. Chim, Pays Bas, Sl,707-714.