
Thisis_Can Chu_z3329270
63
THE UNIVERSITY OF NEW SOUTH WALES SCHOOL OF PHOTOVOLTAIC AND RENEWABLE ENERGY ENGINEERING A net-negative carbon energy system via methanogenesis of coccolithophorid algal biomass Can Chu Bachelor of Engineering in Renewable Energy Engineering Course Code: SOLA 4911 Submission Date: 28 th Oct 2014 Supervisor: Dr. Robert John Patterson AssessorA/Prof. Gavin Conibeer
Transcript of Thisis_Can Chu_z3329270

THE UNIVERSITY OF NEW SOUTH WALES
SCHOOL OF PHOTOVOLTAIC AND RENEWABLE ENERGY ENGINEERING
A net-negative carbon energy system via methanogenesis of coccolithophorid
algal biomass
Can Chu
Bachelor of Engineering in Renewable Energy Engineering
Course Code: SOLA 4911
Submission Date: 28th Oct 2014
Supervisor: Dr. Robert John Patterson
AssessorA/Prof. Gavin Conibeer

I

II
Abstract
In this project, is looking for a system that could support both methanogens and
algae living together. Cyanobacteria were used in this system due to their high
growth rate and also they could be easily digested by methanogens as they do not
have any lignin or cellulose. During the experiments, the methane content of the
sample bottle headspace was monitored once or twice a week using gas
chromatography (GC). From the result, this cyanobacteria and methanogens system
could live for about 40 days with methane being produced continuously. The
maximum methane yield among all samples is the one where made by f2 media with
only1/8 of the recommended vitamin concentration. This sample gives 1852.3
µmoles of methane and 45.4% methane content in the headspace volume.
Key words: Algae, coccolithphor, CO2 concentration, methanogenesis, CH4
production, cyanobacteria,

III
Acknowledgements
The author gratefully acknowledges to the guidance and support of post-doctoral
supervisors Dr. Robert Patterson, Dr. Sabrina Beckman, Dr. Valentina, A/Prof. Mike
Manefield and A/Prof. Gavin Conibeer. This project could not get to successes so
smoothly without any of their help. Also gratefully to the support of undergraduate
student Leo Zhan whom helps with the whole process during the experiments.

IV
Table of contents
Abstract ....................................................................................................................... I
Acknowledgements ................................................................................................... III
Table of contents ...................................................................................................... IV
Introduction ................................................................................................................. 1
Background ............................................................................................................. 1
Coccolithophor ..................................................................................................... 2
Previous researches ................................................................................................ 5
CO2 analysis ........................................................................................................ 5
Sea water media .................................................................................................. 8
Photosynthetic microorganisms............................................................................. 10
Methanogenesis .................................................................................................... 12
Proposed experiments .......................................................................................... 13
Preparation for all experiments ................................................................................. 15
Making f/2 media ................................................................................................... 15
Culturing methanogens ......................................................................................... 16
Lighting condition .................................................................................................. 19
Temperature control .............................................................................................. 21
Making CO2 concentration .................................................................................... 22
Pressure ................................................................................................................ 23
General sample containment ................................................................................ 24
Results and discussions ........................................................................................... 25
Varying initial CO2 concentration for the combined system ................................... 25
Varying CO2 concentration for blue-green algae only ........................................... 28
Varying the media vitamin concentration for the combined system ....................... 30
Varying lighting condition for the combined system .............................................. 33
Conclusion ................................................................................................................ 37
References ............................................................................................................... 38
Appendix................................................................................................................... 45
I. Sample preparation ............................................................................................ 45
II. CH4 analyses ..................................................................................................... 47
III.CH4 data for all experiments .............................................................................. 48
IV.Detailed figures of result ................................................................................... 51
V. Media recipes.................................................................................................... 55
VI. Sample calculations ......................................................................................... 57

1
Introduction
Background
With the development of countries leading to a higher quality of life, the average energy
consumption per person is increasing continuously. Traditional power plants are
causing significant issues with respect to global warming and general pollution, so
alternative clean energy sources need to be developed. This could be achieved by
looking for a kind of biomass feedstock that, as a part of its photosynthetic processes,
already contains carbon capture and storage. Figure 1.1.1 shows the carbon cycle of
existing types of power plants and industries. From which could be seen that the
difference in using nature resources as well as net emission. Algae cultivation for CO2
fixation have been suggested since 1955 [1] [2] with the possibility of producing
methane as an energy source through an anaerobic degradation process. Also, it has
other advantages such as does not have the problem of competing with what we
conventionally think of as food for human consumption.
Figure 1.1.1 net emission of power plant or industry.[3] The positive sign means there
are CO2 emission into atmosphere (1), zero means no extra CO2 emission (2&3), and
negative indicate that this project is capturing CO2 from atmosphere (4). For our
experiment, we are focusing to develop a system which could achieve net negative CO2
emission.

2
Coccolithophor
Figure 1.1.2 below shows the ideal carbon cycle of a net-negative energy system. This
cycle is one of the largest naturally carbon storage systems which takes the carbon
from atmosphere and sediment them on the ocean floor. Coccolithophorid algae drive
this cycle. It is has a high pressure in the atmosphere CO2 will slightly dissolve in the
sea water which forms bicarbonate and hydrogen ions. Then coccolithophorid algae
take these bicarbonates to form calcium carbonate on their cell wall during the process
of photosynthesis. As shells are forming on its cell wall, old shells will start to separate
from the cells and drop off to the ocean floor. [4] The formation of this calcium
carbonate is the key that makes this system net negative on carbon.
Figure 1.1.2 Carbon cycle of algae energy system. CO2 is initially existing in the
atmosphere, with the photosynthesis and calcification of algae (step 1) it will form
C6H12O6 (glucose or cellulose) and CaCO3. After bacterial digestion of these sugars,
they will become smaller organic molecules that will be easier for methanogens to
digest (step 2). Then the methane is formed by anaerobic digestion performed by
methanogens (step 3). With the combustion of methane, CH4 will go back to being CO2

3
in the atmosphere (step 4). The process of algae calcification will make this cycle net
negative on carbon.
Figure 1.1.3 Cell structure and calcification of coccolithophorid algae Emiliania Huxleyi.
[5] This figure illustrates the process of algae calcification. The figure on the left shows
only two of the extracellular coccoliths (EC). In E.hux, coccoliths are composed of about
30 units of radially arranged crystalline units and each of them could subdivided into a
connecting wall (a) between a lower element (b) and an upper element (c). Different
intracellular organelles are also shown in the figure including chromatin (Ch);
chloroplast (Chl) cover (Cov); mitochondrion (M); nucleus (N); nucleus envelope (NE);
reticular body (RB); cell vacuole (v); coccolith vesicle (CV). [4] [6]

4
Figure 1.1.4 schematic diagram of one possible photobioreactor (PBR) configuration
suitable for a marine net-negative carbon energy system. Solar energy (1) is incident on
the system, and the algae layer (2) produce calcium carbonate (3) and drop on the
bottom of the reactor taking biomass with them. Methanogens produce CH4 and biogas
(4). After combustion and energy extraction (5), the exhaust gases are recycled (6) back
into the system, filtering (8) step is to prevent CO2 going out of the system since
anaerobic conditions need to be maintained within the PBR. As nutrition is needed to
grow of algae, nutrients will be constantly added into the system (7).
A photobioreactor is a more complex system for culturing algae that will be relevant in
future work. The scope of the research performed in this report is for the purpose of
getting more knowledge about the integrated system of photosynthetic microorganisms
and a methanogenic consortia to determine the best approach to the overall net
negative carbon energy system.
The purpose of this report is to determine the maximum CO2 tolerance level and the
best initial CO2 concentration for culturing algae alone and also with methanogens. The
difference in performance when changing the vitamin concentration is also investigated.
Appropriate lighting is important for optimal algal culture, so an experiment on this
aspect has also been performed.

5
Previous researches
CO2 analysis
With its high lipid content and high sunlight conversion efficiency, algae haves been
considered to be a source of biodiesel during past oil crisis. However, the cost of
dewatering and harvesting makes the operational cost not competitive with other energy
sources. [7] [8] Therefore, growing algae for removing CO2 from industrial flue gases to
produce energy is likely to be a good solution [9]. From the previous research, Brennan
& Owende states that the oil content of most algae is between 20%~30% of their dry
weight and algae typically has an exponential growth rate which could get doubling
rates as short as 3.5 hours [10]. There are many various kinds of algae available in the
natural environment, but for lab conditions, Moheimani suggests that Pleurochrysis
Carterae is more resilient, with growth rate of 3.5x 10⁴ cells/day, and a potential yield of
8.9x 10⁻¹³ grams of CH4/cell. [11]
Since 1970, algae have been used for waste-water treatment, a source of biomass and
many energy-related purposes. Growing algae for methane production as an energy
source has been proposed almost 50 years ago.[12] As algae has not being focused for
a long time, no one has been researched on the effect on growth rate when changing
the CO2 concentration, and the difference of lab media and ocean. Previous research
shows that, Euglena gracilis could grow under 5% to 45% of CO2 concentration, and it
will stop growing when the concentration is over 45%.[13] The best growth of this kind
of algae is when the CO2 concentration is at 5%. [13] Another type of algae, Chlorella
sp. has a CO2 tolerance of 40%. [14] Furthermore, a strain of Chlorella sp. T-1 was
found by Maeda et al, which could grow under 100% initial CO2 concentration, but the
maximum growth rate happens fewer than 10% CO2 concentration,[15] Scenedesmus
sp. has a CO2 tolerance of over 80%, and best performance happens between 10%-
20%.[14] Some CO2 tolerance of other types of algae is shown in the table below.

6
Table 1.2.1 CO2 tolerances of some high lipid content algae. [25]
Species Known Maximum
CO2 tolerance
Concentration
References
Cyanidium Caldarium 100% [16]
Scenedesmus sp. 80% [14]
Chlorococcum littorale 60% [17]
Synechococcus
elongatus
60% [18]
Euglena gracilis 45% [13]
Chlorella sp 40% [19]
Eudorina spp. 20% [20]
Dunaliella tertiolecta 15% [21]
Nannochloris sp. 15% [22]
Chlamydomonas sp. 15% [23]
Tetraselmis sp. 14% [24]
Although the types of algae are with high lipid content not coccolithophorid, but it still
suffices take these values as a reference or indicator of typical algae tolerances. This
table clearly shows the CO2 tolerance for different types of algae is varying over a large

7
range, so for our experiment the CO2 tolerance for our experimental photosynthetic
microorganisms will find out. After this, the CO2 concentration will vary to looking for the
concentration with the best performance of them.
Figure 1.2.2 Effect of CO2 concentrations in the atmosphere on E. hux (circles) and
G.oceanica (squares) [26]This figure is from a research on cocolithophorid algae, under
a prediction of atmosphere condition. With the CO2 concentration increasing, more CO2
will dissolved and lead to increase on pH level. Figure a) shows the trend of particulate
organic carbon (POC) formation rate and figure b) is the trend of calcification rate.
Therefore from the graph, with the increasing concentration of CO2 in atmosphere, the
trend is to form more POC but less calcification, which means that the cells will getting
sequester less carbon with a high CO2 concentration.

8
Sea water media
There is currently very little research on growing algae using just pure sea water, as the
sea water may contain a large amount of other elements that will effect on the growing
of algae and methanogens, such as sulphate ions. Therefore, for lab research, the
media we are using are always made up by the chemicals that algae and methanogens
both required. Also, vitamins are known to be necessary for culturing algae and there is
currently little research on the effects of varying their concentration in the growth media.
In these experiments, pure sea water will be investigated as a medium to culture algae.
Also how the vitamin concentration in the media affects the growth rate will be explored.
Table 1.3.1 Chemical composition of sea water [27]

9
Table 1.3.2 Recipe for f/2 media
Compare between table 1.3.1 and table 1.3.2, the presence of trace metals are missing
for the composition of sea water, also iron ions, vitamins, phosphate, and EDTA are all
required for culturing of the algae but not contained in sea water.
In the lab, we are using f/2 media for culturing the algae. Trace metals are present in
this media assist cellular formation therefore the concentration of them could affect the
growth of algae significantly. From the research on E. Hux before, the concentration of
[Fe] ion will affect the cell growth, and [Zn] ion is related to coccolithophore growth. [28]
Thus, the composition and concentration of media for culturing microorganisms could
influence on resulting growth rate significantly.
After completing these experiments, the result of the best CO2 concentration and the
CO2 tolerance when culturing cyanobacteria will be obtained. Also, algae are initially
living in the ocean, but for lab research, we are always making the media to culture
algae. Therefore, this project will investigate the difference in performance between lab
media and sea water, and how vitamin concentration effects the culturing of the algae.

10
Photosynthetic microorganisms
The photosynthetic microorganisms used in these experiments were bought from a local
aquarium shop. These were expected to grow faster and are cheaper than P.Cart. After
microscopy and researches online, the type of photosynthetic microorganism we were
used was found to be cyanobacteria (blue-green algae).
Figure 2.1.1 The algae used in these experiments imaged under a microscope. From
the image, shows that this microalgae is about 60µm in size, strip in structure, lack of a
visible cell wall and lack of the ability to see a nucleus, which indicate the specie of
these microorganisms to be cyanobacteria.

11
Figure 2.1.2 Image of Cyanobacteria (blue green algae) under microscope [29]
Marine biotechnology has been the focus of much attention due to the fact that marine
microorganisms are suitably involved in the biosynthesis of marine natural products. [30]
[31] The culturing of actinomycetes and fungi are well known to be culturable marine
microorganisms producing some kinds of bioactive metabolites. [32] Cyanobacteria
(blue green algae) are also one of the most promising groups of organisms that have
biochemically active natural products. [33] [34 [35] [36] Studies show that marine
cyanobacteria have the ability to produce secondary metabolites unlike those found in
any terrestrial species. [37]
During the past few decades, cyanobacteria have already been used in the biofuel area
to produce a number of different biofuel related compounds. [38] From previous
research, the nutrients needed for culturing cyanobacteria are simple, just nitrogen and
phosphorus similar to plants, which makes it ideal for large scale culturing of biofuel
production. [39]

12
Methanogenesis
Methane was first identified by Italian physicist Alessandro Volta as „combustible air‟ in
1776 [40], and further work by Bechamp, Popoff, Tappeneiner, Hoppe-Seyler, Sohngen,
and Omelianski revealed that this kind of „air‟ is methane gas. [41] During the past
decade, methane-producing microorganisms (methanogenesis) by anaerobic digestion
have been found to have a widespread and fundamental role in nature. [42] [43] [44] [45]
[46] These microorganisms haves been performing methanogenesis for centuries by
anaerobic digestion of biomass but there has been insufficient knowledge about what
species they are and how they work. [47]
With more research on methanogenesis and also the improvement in biological
characterization technology, there are 3 different broad types of methanogenesis known
at present: hydrogenotrophic (hydrogen consuming), acetotropic (acetate consuming),
and methylotrophic (consuming compounds with methyl groups). [48] The pathway of
hydrogenotrophic methanogensis is consists of the reduction of CO2 by H2, [equation 1]
This kind of methanogenesis is performed by up to 77% of known methanogens. [49]
The acetotrophic type of methanogenesis [equation 2] is used for approximately two-
thirds of biologically produced methane. [50] Finally, for the methylotrophic pathway, the
equations of the reaction are given by equation 3. [50]:
CO2 + 4 H2 → CH4 + 2 H2O (1)
CH3COO- + H+ → CO2 + CH4 (2)
CH3–A +H2O → CH4 + CO2 + A−H (3)
The rate and amount of methane produced by methanogens are always depended on
the conditions in which the methanogens are growing. As their metabolic processes are
anaerobic, oxygen must be prevented from entering their environment when culturing
them. Also, the methanogens are sensitive to the concentration of nutrients, organic
substrates, and lighting conditions.

13
Proposed experiments
For the variation initial CO2 concentration of combined cyanobacteria and
methanogenesis system, the CO2 concentration considered are selected with respect to
the research before as well as the living condition of methanogenesis. The performance
of this system is predict to have better performance at initial CO2 concentration between
60% and 40% which is the reason why more samples prepared within this region.
The initial concentration selected for the experiment on cyanobacteria only aim to find
out the CO2 tolerance level and best-performing CO2 concentration. Thus, samples are
made with high distribution between 100% and 5% initial CO2 concentration. With the
research previously, the best performance initial CO2 concentration for most of high lipid
content algae is in between 20% to 5% which result to have more samples within this
range for the experiments working with cyanobacteria.
The purpose of the experiment on varying the media vitamin concentration is to find out
the minimum vitamin required for culturing algae with methanogensis as methane
produced system, which could reduce the capital cost for industrialise cultivation.
For organisms living depends on the process of photosynthesis, the appropriate lighting
condition is highly demanded in general culturing. In which lack of brightness will
decrease the rate of photosynthesis and intensive light could bring the occur of
photoinhibition. Therefore, during the experiments, the optimal lighting condition for
experimental cyanobacteria will be found out.

14
Table 1.5.1 Samples considered for each experiment (detailed experiment management
see Appendix I)
Experiment Samples going to prepared
Varying initial CO2 concentration for the
combine system
100%, 80%, 60%, 55%, 50%, 45%,
40%, 30%
Varying CO2 concentration for blue-green
algae only
100%, 80%, 60%, 40%, 20%, 15%,
10%, 5%
Varying the media vitamin concentration for
the combined system
1/8 vitamin, 1/4 vitamin, 1/2 vitamin, f/2
vitamin (normal), pure sea water
Varying the lighting condition for the combined
system
Completely dark, normal light, LED light
with paper covers 12:12, completely
LED 12:12

15
Preparation for all experiments
Making f/2 media
According to the table 1.3.2, stock solutions need to be prepared before making the
media. Having these stock solutions will make it much more convenient to make the
media in future experiments. When making the f/2 media, a 2 liter schott is used, a 2L of
water from which the water filtered through a reverse osmosis system. 2ml of each
stock solutions 1~4 need to be added into the bottle before autoclaving After this, the
vitamin and NaH2PO4 as a phosphate provider are added to the media which vitamin
will get damaged and NaH2PO4 will form precipitate that auto-clave separately and
added in the end.
With this media made, the algae can be cultured, to make enough to use in the
experiments.
For the experiment on varying vitamin concentration, as the algae culturing for all the
experiments grow in f/2 media with the full vitamin concentration, to make the samples
for this topic could only change the amount of vitamin slightly with adding in a small
amount of new f/2 made with no vitamin presented. To start with, the f/2 media were
autoclaved with no vitamin added. Then a specific vitamin concentration from the lowest
concentration was added. For example, we make the 1/8 vitamin concentration first.
The normal vitamin concentration for f/2 media is 2ml per litre, so we put 0.25ml of
vitamin for this sample. Then 20ml of sand on the bottom and 10ml of this f/2 media and
48ml algae as well as 2ml methanogens was added, as before. Thus, to make other
samples with higher vitamin concentration, we just keep adding the vitamin. The CO2
concentration for this system is 80%. Also, a sample with only sea water adding in is
made with the sea water taken from Manly beach, and after autoclave, 10ml of that is
added as other samples before adding in the 48ml algae.

16
Culturing methanogens
All samples of methanogens for the experiments come from the beach and cultured by
black sea media with 0.2 ml of methanol adding-in as a food source. After the bottles
are sealed, CO2 was used to flush out the headspace of these samples as
methanogenesis need anaerobic condition for living. After three weeks culturing of
those methanogenesis, it is supposed to have enough methanogensis for the
experiments with checking the CH4 concentration of those samples by Gas
Chromatography (GC).
Figure 2.3.1 Schematic diagram of GC. The injector introduces the gas from head
space of a sample into a continuous flow of carrier gas, and this flows along the entire
column. The various components are separated inside the column section within the
column oven. The detector measures the quantity of the components that exit the
column. [51] The GC for these experiments are using flame ionization detector (FID)
which is based on the detection of ions formed during combustion of organic
compounds in a hydrogen flame. The generation of these ions is proportional to the
concentration of organic species in the sample gas stream.
In this project, 17 sample bottles are obtained in total all of which need methanogenesis.
In order to have enough methanogens solution for all samples, and also considering the
ratio of methanogenic organisms with the algae, 2ml of methanogenesis is considered
to add in each sample with 48ml of algae, which makes up to 50ml in total liquid area.
The reason why 2ml of methanogenesis is selected to obtain in each sample is due to
the consideration of toughness and growth rate of methanogenesis together with
cyanobacteria.

17
From the GC software, the amount of CH4 contained within the sample injected is
shown as in the area under result graph (figure 2.3.2). In order to convert the data into
concentration of CH4, samples with known CH4 concentration are tested using this GC
then calibrated to get a coefficient for calculate area into µmol of CH4.
Figure 2.3.2 Result shown in GC software
18
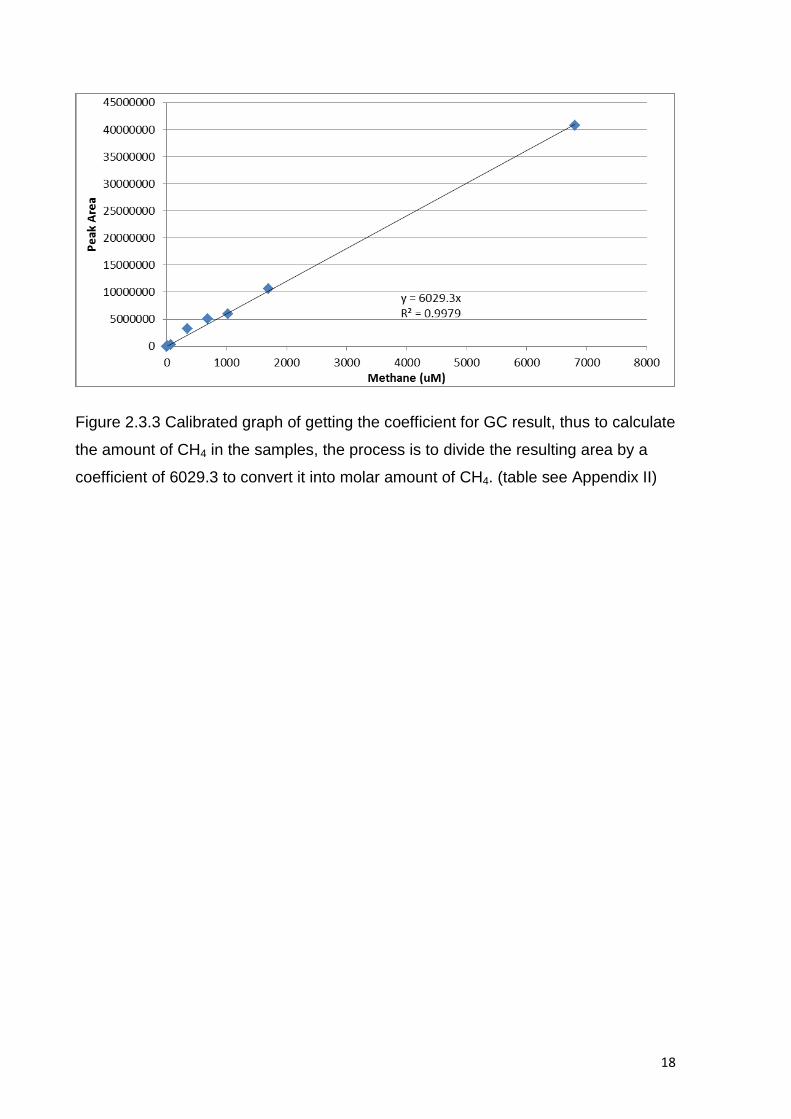
Figure 2.3.3 Calibrated graph of getting the coefficient for GC result, thus to calculate
the amount of CH4 in the samples, the process is to divide the resulting area by a
coefficient of 6029.3 to convert it into molar amount of CH4. (table see Appendix II)

19
Lighting condition
In order to get sufficient light for algae to photosynthesize, two lighting bulbs are bought
from an aquarium shop. One of these is a LED light, and the other one is a florescent
lighting tube. Also switches which are enable to switch off automatically after several
hours are bought for the lights. During the experiments, the lighting hours are set to be
12:12 which means 12 hours photosynthesis of algae and 12 hours dark condition for
them to reproduce.
Figure 2.4.1 lighting condition for the experiments
From figure 2.4.1, it shows the pure algae samples are cultured in the front four
containers. The samples for experiments are placed behind which are in small sample
bottles.

20
Figure 2.4.2 Fluorescent lighting bulb using for the experiments lighting. From the
information of the lighting bulb shown in the instruction, and compare with the light
spectrum, this lighting source slightly contains ultraviolet light, and it might affect the
growth of the experimental cyanobacteria.
Figure 2.4.3 LED light for the experiment, this additional light is done on purpose to
provide sufficient lighting for the growth of cyanobacteria.
With the restriction in space, the samples with varying CO2 concentration for blue-green
algae only is placed under the light in the orbital shaker that is only an orange colored
fluorescent lighting bulb. The other samples are all placed within the tank under both
LED and Fluorescent except the one under normal light for the lighting experiment.

21
Temperature control
To keep the temperature in constant, a container tank is used and a temperature control
thermal-meter, which could heat up the water in the tank (shown as figure 2.4.1) when
the temperature is below the set point which is 20oC. Therefore, samples placing in the
tank are supposed to culturing under same and constant temperature.
Figure 2.5.1 Heater used in the tank to maintain a constant temperature

22
Making CO2 concentration
As CO2 cylinder is available in the lab, pure CO2 is going to use for preparing all of
those samples. The procedure of making CO2 concentration is to flush the head space
with pure CO2 for about 2 minutes, and it is assumed to have pure CO2 concentration
within its headspace. For other concentrations, as the headspace left for all samples are
all 100ml, pure CO2 of headspace are made first and then use a needle to inject certain
calculated amount of air to obtain specific concentration of CO2 as the molar volume of
all gasses are the same.
Figure 2.6.1 Flushing head space with CO2
The presence of two needles on the top is for the purpose to enable gas flowing out of
the sample. The one with a pipe connected is for CO2 injection where the pipe is
connected with CO2 cylinder. If gas is flowing into the system without outlet, pressure
inside the sample will keep increasing which is not recommended for all those
experiments, the present of second needle is for the reason to release the redundant
gas replaced by the injection of CO2.

23
Pressure
As the pressure in the sample bottles will influence the amount of CO2 dissolved in the
liquid part, thus change the pH level. To balance the pressure for each sample is kind of
an important issue that needs to be considered. To do this, after finishing making the
CO2 concentration, a needle is used to balance the pressure of each sample with
atmosphere.
Picture 2.7.1 Pressure balancing, the amount of gas taking out depends on the amount
of inject. For example, if a sample of 50% initial CO2 concentration is going to prepared,
initially the headspace is flushed with pure CO2, and another 50ml of air will be injected
into the system, which means 100ml of CO2 and 50ml of air are presented, then
balancing the pressure by using a needle tube to flush the head space several times in
order to finely mix the gas, then 50ml of mixture gas will be taken out of the system.
Thus, the pressure inside this sample will be the same as atmosphere pressure and
which is made as 50% in CO2 concentration (which is 66.67% actually which realised
after the entire experiments, initial concentrations mentions below are all prepared in
this method).

24
General sample containment
After culturing enough algae for making all samples, the experiments could start. For
the combined system of methanogenesis and cyanobacteria, sand should be placed at
bottom of the sample bottle as to enable the methanogens to „hide‟ away from the light,
also the O2 produced by algae. Thus, in total there will be 20ml of sand with 10ml of
new f/2 media, 2ml of methanogens, 48ml of algae with media and 100ml head space
with different concentration of CO2 for each sample of varying initial CO2 concentration
experiment but 83.33% for the other combined system experiments.
For the sample varying initial CO2 concentration of cyanobacteria only, in order to get
the CO2 concentration more accurate, the samples are prepared by firstly fill all the
sample bottles full with algae, and placing two needles on the top, one is for CO2
injecting, the other one for algae outlet. Therefore, if the sample is going to have 70%
concentration in CO2, 70mL of CO2 in volume will be injected with eject of 70mL of
cyanobacteria. Same method is using for injecting air thus 30mL of air is injected into
the bottle and eject 30mL of cyanobacteria to get 70% initial CO2 concentration. The
volumes of headspace for all samples are in 100ml.

25
Results and discussions
Varying initial CO2 concentration for the combined system
The purpose of this experiment is aim to find out the influence of initial CO2
concentration within the headspace on growth of algae and the amount of CH4
produced.
Figure 3.1.1 Samples of varying CO2 concentration for cyanobacteria-methanogens
combine system
Before checking the methane content of the headspace gases using the GC, a
prediction of result is that the samples with higher CO2 concentration might produce
more CH4 as the methanogens need an anaerobic environment to live. This statement
has been overturned after finish this experiment.
To check the result, GC is used to measure the CH4 concentrations, which will show the
production rate under each CO2 concentration of this algae-methanogens combined
system. Measurements are taken every week or twice a week, data is included in
Appendix III.

26
Figure 3.1.2 final CH4 concentration (day 40th checking account first GC checking as
day 1) in the head space of all samples
From figure 3.1.2, it shows the final CH4 output for all samples. In the final checking, it
clearly shows that for the overall CH4 yield, sample with 55% initial CO2 concentration
gives the lowest performance which has only 29.2% CH4 in volume of headspace, and
50% CO2 gives the maximum of 38.8%
.

27
Figure 3.1.3 CH4 production under different CO2 concentration
Figure 3.1.3 combined all data together, and it could clearly show the difference in CH4
concentration of those samples. From the graph, the sample with 50% CO2 always have
higher CH4 concentration than others, and it has higher production rate at the beginning,
also the sample with 100% CO2 is producing the least CH4 for the first 7 checking, but it
nearly catch up with the 50% sample in the final checking. This might due to the
concentration of CO2 is changing during experiment period and also the algae are
constantly dying. Thus methanogens will have more „food‟ to consume. Therefore, from
that result, shows that the best initial CO2 concentration for algae and methanogens
combined system are at 50% (which is 66.67% in the actual calculation of CO2).
The reason why 50% initial CO2 concentration gives the best result might because the
cyanobacteria lives better under that concentration and the methanogens will have
more cell to consume, also the pH level under that concentration (amount of CO2
dissolved) could affect the activeness of them both. And the CH4 production stops after
50 days culturing due to the lack of nutrition.

28
Varying CO2 concentration for blue-green algae only
Refer to table 1.2.1, different types of algae can have extremely different CO2
tolerances. Since cyanobacteria and similar organisms are found to produce most of the
oxygen presented in earth‟s atmosphere, experiments on several kinds of cyanobacteria
could live under pure CO2 condition is done previously. [52] So for our experimental
cyanobacteria, it is supposed to have relatively high CO2 tolerance and the best
performing CO2 concentration should also be high.
For this experiment, as the growth of cyanobacteria could be seen clearly by difference
in color, the gas concentration of headspace is not needed in this experiment.
Figure 3.2.1 visual checking on 25/08/2014 (4 days after made). As it shown in the
picture, the samples with 100%, 80% and 20% are already almost dead at this time.
Figure 3.2.2 visual checking on 04/09/2014 (14 days after made). In this checking, only
the samples which still alive are shown, from this figure, it is still hard to tell the
difference in between each concentration.

29
Figure 3.2.3 visual checking on 16/09/2014 (26 days after made). This time, the result is
more obvious, only 15%, 40% and 60% are still alive, and it seems like 60% performs
better than others.
Figure 3.2.4 visual checking on 26/09/2014 (36 days after made). In this checking, the
sample with 20% CO2 concentration surprisingly turns back to green but other than that,
the sample with 60% still perform the best whereas others seems already died. Thus for
most of the samples under high CO2 concentration (compare with the atmosphere, 5%
pure CO2 concentration account as “high”) this type of cyanobacteria could survive for
long as 26 days of living.
From the pictures and researches performed in this work, this kind of cyanobacteria is
determined to have CO2 tolerance between 80% and 60%, and its best performance
concentration is at about 60%. Therefore, a suggestion for future experiments with
different photosynthesizing microorganisms is to find out the CO2 tolerance and also
best performing CO2 concentration should be found out first before making other
samples. For cyanobacteria, samples with headspace CO2 concentrations around 60%
are recommended.

30
Varying the media vitamin concentration for the combined system
Due to the fact that the sea water might not have enough nutrients for the growth of
algae, we are thinking that the result of that sample will not be optimistic, and the
samples with more vitamins should perform better than others.
As methanogens are used in this experiment, GC could be used for checking the
performance of each sample.
Figure 3.3.1 Final CH4 concentration in the headspace of each sample.
From figure 3.3.1, it clearly shows that the sample with 1/8 vitamin gives the most CH4
produced at the end which is 1852umol, and pure sea water gives the lowest of
939umol. The growth rates for f/2 media but different vitamin concentration are not
obvious, but it burst up after the check on the 14th day.

31
Figure 3.3.2 CH4 production under different vitamin concentration
This figure shows the data for all samples, and from the graph, the sample with pure
sea water clearly have higher CH4 growth rate than others, but it stops growing after the
14th day of the experiment. This might due to the methanogens and algae having used
up all the nutrition in the media and then died after that. For the other samples, the
reason why CH4 production rate burst up might due to the methanogenesis is more
likely to living under low vitamin concentration. However, why the sample with less
vitamin performs better- is probably because of the vitamin using in our lab is already
being used for a long time which means it might already been oxidized and the
methanogenesis is not much activated under those oxidized vitamin contained media. If
the vitamins are considered to be not oxidized, the result here will consider being-
methanogenesis are more likely to produce more CH4 under low vitamin concentration.
The reason why the sample with pure sea water produces much more CH4 at the
beginning is probably because the type of methanogens used in the experiments are
taken from the beach which is living under nature sea water condition. Thus, for this
experiment, the sea water using is after autoclave, which means the microorganisms

32
contained are all being killed, therefore, more suitable for the growth of methanogens.
With the bloom of methanogenesis at the beginning, the cyanobacteria will be
consumed up in a short term, which indicates that the concentration of CH4 grows up
quickly after the sample was prepared, and then stops due to the lack of food for
methanogens to consume.

33
Varying lighting condition for the combined system
There is a LED light in the sample tank, which might be too bright for algae growing,
and one of the lights slightly contains ultraviolet and might harmful to the algae and
methanogens. Also, the methanogens are more likely to survive in dark conditions. So
the purpose of this experiment is to find out the appropriate lighting condition for this
combined system. In order to make the lighting condition different, one of the samples is
in the tank with others, one with a translucent paper cover in the tank as well, another
one just place on the table so with normal lighting condition, and the last one is covered
entirely with aluminium foil.
Figure 3.4.1 Lighting sample with a translucent paper cover
As we already know, the methanogens are more likely to live in dark conditions, but
algae need lights to photosynthesis. Therefore, for this experiment, the one with dark
condition is expected to produce the most CH4 of all those samples. For the sample
with lighting, as mentioned in the lighting section, the direct light in the tank might not
appropriate for both algae and methanogens, so the result of that sample might not be
optimistic. Thus, as the sample of methanogens using is coming from the beach were
tide takes away the sand and puts it back every day, before using the GC to check the

34
methane content of the headspace gases, the sample with normal light is predicted to
give the best result.
To check the performance of methanogens under these different lighting conditions, GC
is still used to measure the amount of CH4 production.
Figure 3.4.2 Final CH4 concentration in the headspace of all samples.
Figure 3.4.2 shows the data collected from each measurement and surprisingly that the
samples under dark condition and normal light performance much better than the
samples under LED lighting. Therefore, it clearly means that our LED lighting system
using is not suitable for this kind of algae and methanogen combination. Also the algae
under dark condition appear to be still alive after all the data taken, which indicate that
these cyanobacteria could be living under dark condition, but the density is visibly less
than the one under normal light.

35
Figure 3.4.3 CH4 production under different lighting condition
This figure combined all data in one graph, and it shows that the sample under dark
condition produce a large amount of CH4 in the beginning and then stops. The reason
why more CH4 produced under normal light might because the algae are growing faster
with that condition. Thus methanogens could have more food to consume. However if
the algae are growing too fast, it will produce more oxygen which will lead death to the
methanogens, and that could be the solution why the CH4 concentration stops growing
after the GC measurement on the 24th day.
In addition, photoinhibition could be a reason to explain why the samples under LED
lighting condition are all in an „unhappy‟ stage which seems to have died- having a
yellow colour. There are three different time scales for the dynamic characteristics of
photosynthesis: rapid photoresponse (minutes), photoinhibition (hours) and photo
adaptation (days). Photoinhibition mostly happens at the process of electron transfer
chain located at photosystem II (PSII); photo adaptation is the mainly process to change
in physiological and biochemical composition for the light-harvesting system. Significant

36
progress in modelling photo adaptation has been achieved. [53] [54] [55] [56] [57] [58]
[59] [60] [61] The phenomenon of photoinhibition is represented by a decrease in
photosynthesis exhibited by plants when they are exposed to high irradiance. High
irradiance could also cause photo-oxidation of plants and other consequences, but
photoinhibition is usually used to describe the reduction of photosynthetic capacity,
independent of gross change in pigment concentration, induced by exposure to high
irradiance [62] [63]

37
Conclusion
Culturing algae as a bioenergy source has become a pretty mature technology at
present, but the technology for coccolithophorid algae cultivation still needs to be
developed. During this project, the importance of CO2 concentration and lighting
conditions could be observed in the cultivation of algae and the influence on methane
production with varying vitamin concentration.
From the result, this type of cyanobacteria and methanogens system could live for
about 40 days with methane being produced continuously. The maximum methane yield
among all samples is the one where made by f2 media with only1/8 of the
recommended vitamin concentration. This sample gives 1852.3 µmoles of methane and
45.4% methane content in the headspace volume
Therefore, for future experiments on coccolithophorid algae (Eg: E.hux, P.cart, etc.) it
will be better to find out the most suitable CO2 concentration, and the appropriate
lighting condition before other variations to the experiments are undertaken.

38
References
[1] Meier, R.L., 1955. Biological cycles in the transformation of solar energy into useful
fuels. In: Daniels, F., Duffie, J.A. (Eds.), Solar Energy Research. Madison University
Wisconsin Press, Wisconsin, pp. 179–183.
[2] Packer, M. (2009). Algal capture of carbon dioxide ; biomass generationas a tool for
greenhouse gas mitigation with reference to New Zealand energy strategy and
policy. Energy Policy, 37(9), 3428–3437.
[3] Karlsson,H., (2012). The Current Status of BECCS. Presentation for GCEP
workshop on energy supply with negative carbon emissions.
[4] Moheimani, N.R., J.P. Webb, and M.A. Borowitzka, Bioremediation and other
potential applications of coccolithophorid algae: A review. Algal Research, 2012.
1(2): p. 120-133.
[5] P. Van Der Wal, L. De Long, P. Westbroek, W.C. De Bruijn Calcification in the
Coccolithophorid Alga Hymenomonas-Carterae R. Hallberg (Ed.) (1983), pp. P251–
P258
[6] E.W. de Vrind, P.R. de Jong, P.R. van Emburg, J.P.M. de Vrind Mechanisms of
calcification: Emiliania huxleyi as a model system J.C. Green, B.S.C. Leadbeater
(Eds.), The Haptophyte Algae, Clarendon Press, Oxford (1994), pp. 149–166
[7] Ras, M., et al., Experimental study on a coupled process of production and
anaerobic digestion of< i> Chlorella vulgaris</i>. Bioresource technology, 2011.
102(1): p. 200-206.
[8] Uduman, N., et al., Dewatering of microalgal cultures: A major bottleneck to algae-
based fuels. Journal of Renewable and Sustainable Energy, 2010. 2(1): p. -.
[9] Mata, T.M., A.A. Martins, and N.S. Caetano, Microalgae for biodiesel production
and other applications: A review. Renewable and Sustainable Energy Reviews,
2010. 14(1): p. 217-232.

39
[10] Brennan, L. and P. Owende, Biofuels from microalgae—A review of technologies for
production, processing, and extractions of biofuels and co-products. Renewable and
Sustainable Energy Reviews, 2010. 14(2): p. 557-577.
[11] N.R.Moheimani, A.I., J.L., E.R. and M.A.Borowitzka, Coccolithophorid algae culture
in closed photobioreactors. Wiley Onilne Library, 2011
[12] Richmond, A., Handbook of microalgal culture: biotechnology and applied
phycology. 2008: John Wiley & Sons.
[13] Y. Nakano, K. Miyatake, H. Okuno, K. Hamazaki, S. Takenaka, N. Honami, M.
Kiyota, I. Aiga and J. Kondo, “Growth of Photosynthetic Algae Euglena in High CO2
Conditions and Its Photosynthetic Characteristics,” Acta Horticulturae, Vol. 440, No.
9, 1996, pp. 49-54.
[14] N. Hanagata, T. Takeuchi and Y. Fukuju, “Tolerance of Microalgae to High CO2 and
High Temperature,” Phytochemistry, Vol. 31, No. 10, 1992, pp. 3345-3348
[15] K. Maeda, M. Owada, N. Kimura, L. Omata, and I. Karube, “CO2 Fixation from the
Flue Gas on Coalfired Thermal Power Plant by Micro algae‟ Energy conversion
Management, Vol.36, No. 6-9, 1995, pp. 717-720.
[16] J. Seckbach, H. Gross and M. B. Nathan, “Growth and Photosynthesis of
Cyanidium Caldarium Cultured under Pure CO2,” Israel Journal of Botany, Vol. 20,
1971, pp. 84-90,
[17] M. Kodama, H. Ikemoto and S. Miyachi, “A New Species of Highly CO2-Tolreant
Fast-Growing Marine Microalga Suitable for High-Density Culture,” Journal of
Marine Biotechnology, Vol. 1, No. 1, 1993, pp. 21-25.
[18] S. Miyairi, “CO2 Assimilation in a Thermophilic Cyano-bacterium,” Energy
Conversion and Management, Vol. 36, No, 6-9, 1995, pp. 763-766.
[19] H. Nagase, K. Eguchi, K. Yoshihara, K. Hirata and K. Miyamoto, “Improvement of
Microalgal NOx Removal in Bubble Column and Airlift Reactors,” Journal of Fer-
mentation and Bioengineering, Vol. 86, No. 4, 1998, pp. 421-423.

40
[20] K. Yoshihara, H. Nagase, K. Eguchi, K. Hirata and K. Miyamoto, “Biological
Elimination of Nitric Oxide and Carbon Dioxide from Flue Gas by Marine Microalga
NOA-113 Cultivation in a Long Tubular Photobioreac-tor,” Journal of Fermentation
and Bioengineering, Vol. 82, No. 4, 1996, pp. 351-354.
[21] Y. Miura, W. Yamada, K. Hirata, K., Miyamoto and M. Kiyohara, “Stimulation of
Hydrogen Production in Algal Cells Grown under High CO2 Concentration and Low
Temperature,” Applied Biochemistry and Biotechnology, Vol. 39-40, No. 1, 1993, pp.
753-761.
[22] H. Matsumoto, N. Shioji, A. Hamasaki, Y. Ikuta, Y. Fu-kuda, M. Sato, N. Endo and T.
Tsukamoto, “Carbon Di-oxide Fixation by Microalgae Photosynthesis Using Ac-tual
Flue Gas Discharged from a Boiler,” Applied Bio-chemistry and Biotechnology, Vol.
51-52, No. 1, 1995, 681-692.
[23] S. Hirata, M. Hayashitani, M. Taya and S. Tone, “Carbon Dioxide Fixation in Batch
Culture of Chlorella sp. Using a Photobioreactior with a Sunlight-Collection Device,”
Journal of fermentation and bioengineering, Vol. 81, No. 5, 1996, pp. 470-472.
[24] S. Hirata, M. Taya and S. Tone, “Characterization of Chlorella Cell Cultures in Batch
and Continuos Opera-tions under a Photoautotrophic Condition,” Journal of
Chemical Engineering of Japan, Vol. 29, No. 6, 1996, pp. 953-959.
[25] E. Ono and J. L. Cuello, “Selection of Optimal Microalgae Species for CO2
Sequestration,” Proceedings 2nd Annual Conference on Carbon Sequestration,
Alexandria, 2003, pp. 1-7
[26] U. Riebesell, I. Zondervan, B. Rost and P. D. Tortell, “Reduced calcification of
marine plankton in response to increased atmospheric CO2”, Nature, Vol. 407,
2000.
[27] S.N. Santillan, S.B. Valdez, W.M. Schorr, R.A. Martinez, S.J. Colton, (2010)
"Corrosion of the heat-affected zone of stainless steel weldments", Anti-Corrosion
Methods and Materials, Vol. 57 Iss: 4, pp.180 - 184

41
[28] I. Zondervan, “the effects of light, macronutrients, trace metals and CO2 on the
production of calcium carbonate and organic carbon in coccolithophores – a review”,
Deep-sea research II, Vol. 54, 2007, pp. 521-537
[29] Picture from website: save our Sodus, online at:
http://www.saveoursodus.com/2011/08/15/over-150-people-at-first-annual-state-of-
sodus-bay/ access on 19/10/2014
[30] Sone, H.; Kondo, T.; Kiryu, M.; Ishiwata, H.; Ojika, M.; Yamada, K. J. Org. Chem.
1995, 60, 4774-4781.
[31] Nakao, Y.; Yoshida, W. Y.; Szabo, C. M.; Baker, B. J.; Scheuer, P. J. J. Org. Chem.
1998, 63, 3272-3280
[32] Davidson, B. S. Curr. Opin. Biotechnol. 1995, 6, 284-291.
[33] Patterson, G. M. L.; Baldwin, C. L.; Bolis, C. M.l Karuso, H.; Larsen. L. K.; Levine, I.
A.; Moore, R. E.; Nelson. C. S.; Tschappat, K. D.; Tuang, G. D.; Furusawa, E.;
Furusawa, S.; Norton, T. R.; Raybourne, R. B. J. Phycol. 1991. 27. 530-536.
[34] Patterson, G. M. L.; Baker, K. K.; Baldwin, C. L.; Bolis, C. M.; Caplan, F. R.; Larsen.
L. K.; Levine, I. A.; Moore, R. E.; Nelson. C. S.; Tschappat, K. D.; Tuang, G. D.;
Boyd, M. R.; Cardellina, J. H.; Collins, R. P.; Gustafson, K. R.; Snader, K. M.;
Weislow, O. S.; Lewin, R. A, J. Phycol. 1993, 29, 125-130.
[35] Moore, R. E.; Patterson, G. M. L.; Carmichale, W. W. New Pharmaceuticals From
Cultured Blue-Green algae. Biomedical Importance of Marine Organisms-Memoirs
of the Californian Academy of Science; Fautin, D. G., Ed.; Californian Academy of
Science: San Francisco, CA, 1998; Vol. 13, pp. 143-150
[36] Gerwick, W. H.; Proteau, P. J.; Nagle, D. G. Compound Exhibiting Antiproliferative
Activity Against Cells. US Patent number 5,324,739, Oregon State University,
United States of America, 1994.

42
[37] Adam, M. B.; Bernard, B.; Eliane, A. M.; J. Grant, B.; Phillip, C. W. Marine
Cyanobacteria-a prolific source of natural products, Tetrahedron. 2001. 57. 9347-
9377
[38] Machado,I.M.,and Atsumi,S.(2012). Cyanobacterial biofuel production. J. Biotechnol.
162, 50–56.
[39] Nozzi, N. E., Oliver, J. W. K., & Atsumi, S. (2013). Cyanobacteria as a Platform for
Biofuel Production. Frontiers in Bioengineering and Biotechnology, 1(September),
[40] Hoppe-Seyler, F. (1886). Uber die Gahrung der Cellulose mit Bildung von Methan
und Kohlensaure. I. Ueber das Vorkommen der Entwicklung von Methan und
Kohlensaure in Wasserhaltigen Erdboden. Hoppe-Seyler's Z. Physiol. Chem.
10:201-217.
[41] Barker, H. A. (1956). Bacterial fermentations, p.1-95. John Wiley & Sons, Inc., New
York.
[42] Mah, R. A., D. M. Ward, L Baresi, and T. L Glass. (1977). Biogenesis of methane.
Annu. Rev. Microbiol. 31:309-341.
[43] Wolfe, R. S. (1971). Microbial formation of methane,p. 107-146. In A. H. Rose and J.
F. Wilkinson (ed.), Advances in microbiological physiology, vol. 6. Academic Press
Inc., New York.
[44] Wolfe, R. S., and I. J. Higgins. (1979). Biochemistry of methane-a study in contrasts,
p. 267-283. In J. R. Quayl (ed.), Microbial biochemistry. MTP Press Ltd., Lancaster,
England.
[45] Zehnder, A. J. B. (1978). Ecology of methane formation, p. 349-376. In R. Mitchell
(ed.), Water pollution microbiology, vol. 2. John Wiley & Sons, Inc., New York.
[46] Zeikus, J. G. (1977). The biology of methanogenic bacteria. Bacteriol. Rev. 41:514-
541.

43
[47] Suryawanshi, P., A. Chaudhari, and R. Kothari, Mesophilic anaerobic digestion: first
option for waste treatment in tropical regions. Critical reviews in biotechnology,
2010. 30(4): p. 259-282.
[48] Whiticar, M.J., Carbon and hydrogen isotope systematics of bacterial formation and
oxidation of methane. Chemical Geology, 1999. 161(1–3): p. 291-314.
[49] Le Mer, J. and P. Roger, Production, oxidation, emission and consumption of
methane by soils: A review. European Journal of Soil Biology, 2001. 37(1): p. 25-50.
[50] Cavicchioli, R., Archaea: molecular and cellular biology. 2007: ASM Press.
[51] SHIMADZU, Gas Chromatography. Online at: http://shimadzu.com/an/gc/index.html
access on 19/10/2014
[52] David, J.T, Shannon, L. S., Amanda, L. P. and Shawn. M. Z. Reserch Paper:
common freshwater cyanobacteria grow in 100% CO2. ASTROBIOLOGY. Vol.5,
2005, pp. 66–74
[53] Bannister,T.T. (1979) Quantitative description of steady state, nutrient-saturated
algal growth, including adaptation. Limnol. Oceanogr., 24, 76–96.
[54] Shuter,B. (1979) A model of physiological acclimation in unicellular algae. J. Theor.
Biol., 78, 519–552.
[55] Laws,E.A., Redalje,D.G., Karl,D.M. and Chalup,M.S. (1983) A theoretical and
experimental examination of the predictions of two recent models of phytoplankton
growth. J. Theor. Biol., 105, 469–491.
[56] Geider,R.J. and Platt,T. (1986) A mechanistic model of photoadaptation in
microalgae. Mar. Ecol. Prog. Ser., 30, 85–92
[57] Cullen,J.J. and Lewis,M.R. (1988) The kinetics of algal photoadaptation in the
context of vertical mixing. J. Plankton Res., 10, 1039–1063.

44
[58] Geider,R.J. and MacIntyre,H.L. (1996) A dynamic model of photoadaptation in
phytoplankton. Limnol. Oceanogr
[59] Vincent,W.F. (1990) The dynamic coupling between photosynthesis and light in the
phytoplankton environment. Verh. Int. Ver. Limnol., 24, 25–37.Ferris and
Christian1991
[60] Baumert,H. (1996) On the theory of photosynthesis and growth in phytoplankton.
Part I: light limitation and constant temperature. Int. Rev. Ges. Hydrobiol., 81, 109–
139.
[61] Ferris,J.M. and Christian,R. (1991) Aquatic primary production in relation to
microalgal responses tochanging light: a review. Aquat. Sci., 53, 187–217.
[62] Powles,S.B. (1984) Photoinhibition of photosynthesis induced by visible light. Annu.
Rev. Plant Physiol., 35, 15–44
[63] Han, B., Virtanen, M., Koponen, J., & Stras, M. (2000). Effect of photoinhibition on
algal photosynthesis : a dynamic, 22(5), 865–885.
.

45
Appendix I. Sample preparation
Sample Name/Number
Sample Owner (Can/Leo)
Date Made
Total Liquid Volume [mL]
Amount Algae [% or mL]ml
Amount Methanogens [% or mL]ml
Amount Sand [% or mL or g]ml
Volume of Headspace [mL]
Lighting Conditions [aquarium, natural, dark]
Measurement Technique [GC, microscope, visual inspection/picture]
Varying CO2 concentration A&M
100% CO2 with methanogen
Can 18/08/2014 50 48 2 20 100 aquarium GC measure the concentration of CH4
80% CO2 with methanogen
Can 18/08/2014 50 48 2 20 100 aquarium GC
60% CO2 with methanogen
Can 18/08/2014 50 48 2 20 100 aquarium GC
55% CO2 with methanogen
Can 18/08/2014 50 48 2 20 100 aquarium GC
50% CO2 with methanogen
Can 18/08/2014 50 48 2 20 100 aquarium GC
45% CO2 with methanogen
Can 18/08/2014 50 48 2 20 100 aquarium GC
40% CO2 with methanogen
Can 18/08/2014 50 48 2 20 100 aquarium GC
30% CO2 with methanogen
Can 18/08/2014 50 48 2 20 100 aquarium GC
Varying CO2 concentration Algae only
100% CO2 Can 21/08/2014 70 70 0 0 100 orbital shaker visual and pressure

46
80% CO2 Can 21/08/2014 70 70 0 0 100 orbital shaker visual and pressure
60% CO2 Can 21/08/2014 70 70 0 0 100 orbital shaker visual and pressure
40% CO2 Can 21/08/2014 70 70 0 0 100 orbital shaker visual and pressure
20% CO2 Can 21/08/2014 70 70 0 0 100 orbital shaker visual and pressure
15% CO2 Can 21/08/2014 70 70 0 0 100 orbital shaker visual and pressure
10% CO2 Can 21/08/2014 70 70 0 0 100 orbital shaker visual and pressure
5% CO2 Can 21/08/2014 70 70 0 0 100 orbital shaker visual and pressure
Varying lighting
LED lighting 12:12
Can 21/08/2014 50 48 2 20 100 aquarium GC
normal roomlight 24 hrs
Can 21/08/2014 50 48 2 20 100 normal GC
LED lighting with paper cover 12:12
Can 21/08/2014 50 48 2 20 100 aquarium with paper cover
GC
no lighting Can 21/08/2014 50 48 2 20 100 dark GC
Varying vitamin concentration
1/8 vitamin concentration
Can 18/08/2014 50 48 2 20 100 aquarium GC & visual or microscope
1/4 vitamin concentration
Can 18/08/2014 50 48 2 20 100 aquarium GC & visual or microscope
1/2 vitamin concentration
Can 18/08/2014 50 48 2 20 100 aquarium GC & visual or microscope
f2 Can 18/08/2014 50 48 2 20 100 aquarium GC & visual or microscope

47
II. CH4 analyses
volume of gas (uL)
amount of gas (umol)
volume of bottle (mL)
peak area 01August
2013 CH4 (umol/L) Peak Area
1 mol of gas or hydrogen is 24.5 L at 21 oC
0 0 120 0 0 0
50 2.040816327 120 91133.2 17 91133
200 8.163265306 120 360286.1 68 360286
1000 40.81632653 120 3302443.9 340 3302444
2000 81.63265306 120 5078531.4 680 5078531
3000 122.4489796 120 5994208.6 1020 5994209
5000 204.0816327 120 10598098.2 1701 10598098
20000 816.3265306 120 40793339.7 6803 40793340

48
III. CH4 data for all experiments
1 6 14
29/08/2014 4/09/2014 12/09/2014
time area height CH4 time area height CH4 time area height CH4
100 1.894 39492 21871.7 6.550014 1.894 115063 64290.8 19.08397 1.897 402554.5 228881.6 66.76637
30 1.881 34415.5 18531.5 5.708042 1.892 164294.3 90104.8 27.24932 1.902 908532.5 511997.2 150.6862
40 1.873 29154.4 15779.6 4.835454 1.886 132243.3 72955.6 21.93344 1.902 585332.7 329011 97.08137
45 1.883 33985.9 18336.5 5.63679 1.9 153218.1 84569 25.41225 1.903 592234.5 334232 98.22608
50 1.89 74999.2 40916 12.43912 1.899 366571.6 200578.4 60.79837 1.902 2798021.1 1559820 464.0706
55 1.893 10149.9 5183.8 1.683429 1.888 19006.9 9879.4 3.152422 1.902 321355 179586.3 53.29889
60 1.888 22568.1 11968.4 3.743071 1.891 111690.4 61516.5 18.5246 1.9 473984 265692.4 78.61344
80 1.898 24609.9 13371.6 4.081718 1.897 97117.9 54129.7 16.10766 1.895 395151.5 221773.9 65.53854
lighting dark 1.897 123094.4 68035.8 20.41604 1.894 171418.5 96832.4 28.43091 1.906 2735829.9 1525817 453.7558
lighting LED 12v12 1.885 92245.2 50966.7 15.29949 1.887 114668.1 62234.4 19.01848 1.893 431573.1 241169.1 71.5793
lighting LED paper cover 1.899 91905 51433.8 15.24306 1.895 109571.3 59316.2 18.17314 1.893 859305.2 481076.8 142.5216
lighting normal light 24 1.896 124223.7 68676.9 20.60334 1.895 147799.7 80774.8 24.51358 1.901 716757.9 401725.1 118.8791
pure sea water 1.879 1092126.8 604922 181.1366 1.891 2876572 1556979 477.0988 1.899 4789730.9 2586841 794.4091
1/8 vitamin 1.882 53550.2 29050.9 8.881661 1.895 319277.3 176221.5 52.95429 1.881 3513381.4 1911927 582.718
1/4 vitamin 1.895 41245.9 22176.4 6.84091 1.899 204089.9 113055.8 33.84968 1.898 820224.9 455669.6 136.0398
1/2 vitamin 1.889 9625.6 3015.3 1.596471 1.885 214709.8 118527.3 35.61107 1.901 866527.1 476701.4 143.7194
f/2 1.92 41127.5 17015.8 6.821273 1.889 164686.4 91775.1 27.31435 1.901 602801.1 337992.1 99.97862

49
18 21 24
16/09/2014 19/09/2014 22/09/2014
time area height CH4 time area height CH4 time area height CH4
100 1.889 715122.2 404429.6 118.6078 1.882 2027959 1118067 336.3507 1.845 3011976 1666203 499.5565
30 1.897 2854183 1602859 473.3855 1.894 4598402 2547746 762.676 1.862 5696689 3111602 944.8342
40 1.897 1600862 885754.8 265.5137 1.896 4120704 2262317 683.4465 1.82 5218538 2857475 865.5296
45 1.898 1887423 1057296 313.0419 1.885 3353622 1841314 556.2208 1.85 4391088 2427313 728.2916
50 1.889 4463525 2459201 740.3057 1.894 7047968 3848281 1168.953 1.837 7938030 4308079 1316.576
55 1.896 1739214 952413.4 288.4604 1.897 4040281 2238885 670.1078 1.853 5277674 2898090 875.3378
60 1.897 1796476 1009936 297.9576 1.893 2597384 1448913 430.7936 1.849 4283326 2320841 710.4184
80 1.893 727264.1 413497.9 120.6216 1.889 2170537 1189927 359.9982 1.8 3399017 1875861 563.7499
lighting dark 1.896 2925618 1611509 485.2335 1.93 2989592 1657217 495.8439 1.838 3069638 1694319 509.1201
lighting LED 12v12 1.9 643371.7 355573 106.7075 1.895 853940.4 466591.7 141.6318 1.829 939953.5 519353.1 155.8976
lighting LED paper cover 1.894 1351775 754642.4 224.201 1.873 1676085 920644.3 277.99 1.843 2087928 1150766 346.2969
lighting normal light 24 1.894 1897954 1065003 314.7884 1.909 2140364 1179862 354.9937 1.835 2941357 1600060 487.8439
pure sea water 1.894 5129888 2813553 850.8264 1.874 5102103 2805389 846.2182 1.851 5877317 3191682 974.7925
1/8 vitamin 1.891 4161891 2277310 690.2776 1.888 7498037 4095242 1243.6 1.848 9461318 5169009 1569.223
1/4 vitamin 1.9 1291006 707009.5 214.122 1.899 4060414 2240788 673.447 1.842 5799935 3158415 961.9583
1/2 vitamin 1.9 1291006 707009.5 214.122 1.902 5489204 3031144 910.4214 1.86 7926242 4328738 1314.621
f/2 1.893 1776565 995579.1 294.6553 1.904 3412114 1874230 565.922 1.84 4773879 2619238 791.7799

50
28 40
26/09/2014 8/10/2014
time area height CH4 time area height CH4
100 1.907 4748052 2624475 787.4963 1.899 9027985.5 4982917 1497.352
30 1.899 7289178 3972709 1208.959 1.89 8463578.7 4645702 1403.742
40 1.903 7111378 3899557 1179.47 1.902 9135362.9 5070610 1515.161
45 1.905 5742162 3143953 952.3762 1.903 8571139.8 4730236 1421.581
50 1.908 8744579 4805086 1450.347 1.902 9538683.9 5269867 1582.055
55 1.902 6043142 3354370 1002.296 1.905 7186959.3 3911769 1192.006
60 1.905 6199682 3405582 1028.259 1.903 8604752.3 4796202 1427.156
80 1.914 4632261 2537882 768.2916 1.904 7651462.5 4164776 1269.047
lighting dark 1.908 2867399 1609304 475.5773 1.894 3077783 1719411 510.471
lighting LED 12v12 1.914 939649.9 513060.2 155.8473 1.905 939111.3 522016.9 155.7579
lighting LED paper cover 1.908 2054471 1146616 340.7478 1.907 2116618.6 1181337 351.0554
lighting normal light 24 1.91 2887823 1592321 478.9648 1.907 2933129.9 1654230 486.4793
pure sea water 1.9 5861376 3151138 972.1486 1.908 5660876 3067545 938.8944
1/8 vitamin 1.903 10437529 5693011 1731.134 1.902 11168176.6 6133081 1852.317
1/4 vitamin 1.906 7116780 3889620 1180.366 1.901 9401888.9 5100639 1559.367
1/2 vitamin 1.904 7422388 4099832 1231.053 1.907 8626319.1 4818823 1430.733
f/2 1.902 6316054 3498480 1047.56 1.905 8601391 4748275 1426.599

51
IV. Detailed figures of result Varying initial CO2 concentration for the combine system
Figure 4.1.1 CH4 concentration of algae with 100% CO2 (left) and 30% CO2 (right)
Figure 4.1.2 CH4 concentration of algae with 40% CO2 (left) and 45% CO2 (right)
Figure 4.1.3 CH4 concentration of algae with 50% CO2 (left) and 55% CO2 (right)

52
Figure 4.1.4 CH4 concentration of algae with 60% CO2 (left) and 80% CO2 (right)

53
Varying the media vitamin concentration for the combined system
Figure 4.2.1 CH4 concentration of algae with pure seawater (left) and 1/8 vitamin (right)
Figure 4.2.2 CH4 concentration of algae with 1/4 vitamin (left) and 1/2 vitamin (right)
Figure 4.2.3 CH4 concentration of algae with f/2 media Varying the lighting condition for the combined system

54
Figure 4.3.1 CH4 production under dark condition (left) and LED lighting 12:12 (right)
Figure 4.3.2 CH4 production under LED lighting 12:12 with paper cover (left) and normal light condition (right)

55
V. Media recipes Medium f (f2 and fE) - CSIRO Modification Marine and Atmospheric Research
Reference: Guillard, R. R. L. and Ryther, J. H. (1962) Canad. J. Microbiol., 8: 229-239. Stock Solutions
1. NaNO3 150.0 g L-1 H2O 2. Trace metals CuSO4.5H2O 19.6 mg (Weigh and add each chemical individually) ZnSO4.7H2O 44.0 mg (in quantities stated to 750 mL distilled) CoCl2.6H2O 22.0 mg (water, dissolving between each addition.) MnCl2.4H2O 360.0 mg (Make up to final volume of 1 litre.) Na2MoO4.2H2O 12.6 mg 3. Na2SiO3.5H2O 22.7 g L-1 H2O 4. Fe citrate: Ferric citrate 9.0 g Add both chemicals to 1 litre of Citric acid 9.0 g distilled water and autoclave to dissolve. 5. Vitamins Stock Solution to 100mL of distilled water, add the following: Biotin 1.0 mL Vitamin B12 1.0 mL Thiamine HCL 20.0 mg (fresh solution every 3 months) Primary Stocks Vitamin B12 10.0 mg 100 mL-1 H2O Biotin 10.0 mg 100 mL-1 H2O 6. NaH2PO4.2H2O 11.3 g L-1 H2O 7. Na2EDTA.2H2O 30.0 g L-1 H20 (used in fE and fE2 media only) All stock solutions are made up in distilled water. Store all stock solutions in the refrigerator. To reduce risk of contamination and for longer shelf life, stock solutions can be autoclaved or filter sterilised using a 0.22 um filter.
Australian National Algae Culture Collection Street Address Castray Esplanade, Hobart, Tasmania 7000, Australia Mail GPO Box 1538, Hobart, Tasmania 7001, Australia Telephone (03) 6232 5316 Int +61 3 6232 5316 Facsimile (03) 6232 5471 Int +61 3 6232 5471 Web Site http://www.csiro.au/ANACC Email [email protected]

56
Medium f (f2 and fE) - CSIRO
Modification Marine and Atmospheric Research
Reference: Guillard, R. R. L. and Ryther, J. H. (1962) Canad. J. Microbiol., 8: 229-239.
Preparation Methods 1. To Prepare Medium f Add 1 mL of each stock solution (1 – 5) to 1 litre seawater. Dispense to flasks and autoclave at 121°C (15PSI, 15 mins). Phosphate must be sterilised separately from seawater to prevent precipitation. Dilute original phosphate stock with distilled water such that 1 mL added to each flask of sterile medium will give the required concentration of phosphate in the medium. Autoclave dilute phosphate stock at 121°C (15PSI, 15 mins). After cooling, dispense aseptically with sterilised automatic dispenser. For example: For 100 x 125 mL Erlenmeyer flasks, each containing 75 mL medium, prepare dilute phosphate stock as follows: f and fE media: Take 7.5 mL of original phosphate stock and make up to 100 mL with distilled water. Pour into a 250 mL Schott bottle and autoclave to sterilize. Dispense 1 mL per flask asepically. f2 and fE2 media: Take 3.75 mL of original phosphate stock and make up to 100 mL with distilled water. Pour into a 250 mL Schott bottle and autoclave to sterilize. Dispense 1 mL per flask asepically. Scale up in the same proportion for larger volumes. To Prepare Medium fE Prepare as medium f, add 1 mL of Na2EDTA.2H2O stock solution. To Prepare Medium f2 Prepare as medium f, but using 0.5 mL of each stock solution instead of 1.0 mL of each. To Prepare Medium fE2 Prepare as medium f2, add 0.5 mL of Na2EDTA.2H2O stock solution. 2. To Prepare Medium f2 concentrated nutrients Take 5 mL of each stock solution (1 – 6) and make up to 100 mL with distilled water. Pour into a 250 mL Schott bottle. Autoclave at 121°C (15PSI, 15 mins). Alternatively, filter sterilise using a 0.22 um filter into a sterile 250 mL Schott bottle. Use 1 mL/100 mL sterile seawater. Add correct amounts of nutrients aseptically.
Australian National Algae Culture Collection Street Address Castray Esplanade, Hobart, Tasmania 7000, Australia Mail GPO Box 1538, Hobart, Tasmania 7001, Australia Telephone (03) 6232 5316 Int +61 3 6232 5316 Facsimile (03) 6232 5471 Int +61 3 6232 5471 Web Site http://www.csiro.au/ANACC Email [email protected]

57
VI. Sample calculations
1. Making f/2 media
For making the media recipes of f/2, the stock chemicals available within the lab are inadequate. Therefore, when making the stock
solutions, similar substitution are in used.
Table 6.1.1 Substitution recipe calculation
Original Chemical
Recipes
Molar
mass(g/mol)
Amount needed for
stock solution (g/L)
Target
ion
No. of moles
present
Substitution
Recipes
Molar
mass
Amount
needed (g/L)
NaNO3 85 150 N 1.764705882 KNO3 101 178.2352941
CuSO4.5H2O 249.5 0.0196 Cu 7.85571E-05 Cu(NO3)2.3H2O 241.5 0.018971543
ZnSO4.7H2O 287.38 0.044 Zn 0.000153107 Zn(NO3)2.6H2O 297.38 0.045531074
Na2MoO4.2H2O 242 0.0126 Mo 5.20661E-05 (NH4)6Mo7O24 1164 0.008657851
Na2SiO3.5H2O 212 22.7 Si 0.107075472 Na2SiO3 122 13.06320755
Fe citric C6H5FeO7 244.94 0.009 Fe 3.67437E-05 FeCl3.6H2O 270.35 0.009933657
NaH2PO4.2H2O 156 0.0113 P 7.24359E-05 NaH2PO4 120 0.008692308

58
2. CH4 concentration calculation
The molar volume of gas is 24.5 L/mol under 25oC condition, and the headspaces are
known to be 100mL for all the samples. Thus the concentration of CH4 in percentage of
headspace could be calculated.
Table 6.2.1 Calculation of the final CH4 produced in percentage of headspace
Total mole of headspace (μmol) 4081.633
Final CH4 presented (μmol) % of headspace
30 1403.741512 34.4%
40 1515.161445 37.1%
45 1421.581245 34.8%
50 1582.054948 38.8%
55 1192.005589 29.2%
60 1427.156104 35.0%
80 1269.046573 31.1%
100 1497.35218 36.7%
lighting dark AandM CC 510.4710331 12.5%
lighting LED 12:12 AandM 155.7579321 3.8%
lighting LED 12:12 paper cover 351.0554459 8.6%
lighting normal light 24 486.4793425 11.9%
pure sea water 938.894399 23.0%
1/8 vitamin 1852.317284 45.4%
1/4 vitamin 1559.366577 38.2%
1/2 vitamin 1430.733103 35.1%
f/2 1426.59861 35.0%


