This work is published under the responsibility of the ... · traded raw materials in both the...
278
Transcript of This work is published under the responsibility of the ... · traded raw materials in both the...

This work is published under the responsibility of the Secretary-General of the OECD. The opinions expressed and the arguments employed herein do not necessarily reflect the official views of OECD member countries.
This document and any map included herein are without prejudice to the status of or sovereignty over any territory, to the delimitation of international frontiers and boundaries, and to the name of any territory, city or area.
Statistical data for Israel are supplied by and under the responsibility of the relevant Israeli authorities. The use of such data by the OECD is without prejudice to the status of the Golan Heights, East Jerusalem and Israeli settlements in the West Bank under the terms of international law.
The publication of this document has been authorised by Ken Ash, Director of the Trade and Agriculture Directorate
Photo credit: Jukree © Thinkstock
© OECD (2014)
You can copy, download or print OECD content for your own use, and you can include excerpts from OECD publications, databases and multimedia products in your own documents, presentations, blogs, websites and teaching materials, provided that suitable acknowledgment of OECD as source and copyright owner is given. All requests for commercial use and translation rights should be submitted to

FOREWORD – 3
EXPORT RESTRICTIONS IN RAW MATERIALS TRADE: FACTS, FALLACIES AND BETTER PRACTICES © OECD 2014
Foreword
Trade policy discussions and negotiations have long taken aim at removing import restrictions to enable greater access to markets. In recent years their focus has widened. Growing global demand for raw materials and increasing resort to export restrictions has forced governments and other stakeholders to pay close attention to conditions of supply and the adverse effects of government restrictions on exports in this sector and look for ways of placing greater controls on their use.
This volume brings together different strands of analysis carried out by OECD since 2009 on the use of export restrictions in the trade of raw materials. The aim is to contribute to an informed policy dialogue among countries that irrespective of whether they apply export restrictions or not, all rely on a well-functioning global market for at least some of the raw materials needs of their industries. Some of the analysis presented here has been published as individual working papers. But as the saying goes, the whole is greater than the sum of its parts, and it is hoped that this volume will provide the reader with a thorough understanding of how export restrictions affect economies with international supply chains and what could constitute possible actions leading to greater restraint in the use of such measures.
In addition to the authors of the chapters, many other individuals have contributed to the work published here. Overall management is provided by Ken Ash, OECD Director for Trade and Agriculture, and Raed Safadi, OECD Deputy Director for Trade and Agriculture. Collecting the data for the OECD Inventory of Export Restrictions would not have been possible without the collaboration of individuals and government officials in the countries surveyed. The OECD’s work on export restrictions in raw materials trade is directed by Frank van Tongeren, Head of the Division on Policies in Trade and Agriculture. The analysis leading to the various chapters was conducted under the guidance of the OECD Trade Committee and its Working Party, which along with the OECD Business and Industry Advisory Committee and the participants of two multi-stakeholder OECD workshops held in 2009 and 2012 provided valuable data, observations and comments at different stages. Barbara Fliess was the project manager for this publication. Alison Burrell edited the volume and Michèle Patterson coordinated its production.


TABLE OF CONTENTS – 5
EXPORT RESTRICTIONS IN RAW MATERIALS TRADE: FACTS, FALLACIES AND BETTER PRACTICES © OECD 2014
Table of contents
Overview ................................................................................................................................................. 9
Part I. Trends in the Trade of Raw Materials
Chapter 1. Recent developments in the use of export restrictions in raw materials trade by Barbara Fliess, Christine Arriola and Peter Liapis ............................................................................ 17
Part II. Economic Effects of Export Restrictions
Chapter 2. Economics of export restrictions as applied to industrial raw materials by K.C. Fung and Jane Korinek ............................................................................................................. 63
Chapter 3. Effects of removing export taxes on steel and steel-related raw materials by Frank van Tongeren, James Messent, Dorothee Flaig, and Christine Arriola ................................. 93
Chapter 4. How export restrictive measures affect trade in agricultural commodities by Peter Liapis ..................................................................................................................................... 115
Part III. Approaches for Enhanced Control and More Transparent Use of Export Restrictions
Chapter 5 Multilateralising regionalism: Disciplines on export restrictions in regional trade agreements by Jane Korinek and Jessica Bartos ................................................................................................... 149
Chapter 6. Increasing the transparency of export restrictions: Benefits, good practices and a practical checklist by Barbara Fliess and Osvaldo R. Agatiello ........................................................................................ 183
Chapter 7. Mineral resource policies for growth and development: Good practice examples by Jane Korinek ................................................................................................................................... 225


ACRONYMS – 7
EXPORT RESTRICTIONS IN RAW MATERIALS TRADE: FACTS, FALLACIES AND BETTER PRACTICES © OECD 2014
Acronyms
ADA Anti-Dumping Agreement
AMIS Agricultural Market Information System
APEC Asia-Pacific Economic Cooperation
BACI Base pour l’Analyse du Commerce International
CEPII Centre d'Etudes Prospectives et d'Informations Internationales
c.i.f. cost, insurance, freight
DDA Doha Development Agenda
EFTA European Free Trade Area
EITI Extractive Industries Transparency Initiative
f.o.b. free on board
FYROM Former Yugoslav Republic of Macedonia
GAPP Generally Accepted Principles And Practices
GATT General Agreement on Tariffs and Trade
GRB Government of the Republic of Botswana
HHI Hirschman-Herfindahl index
HS Harmonised System (Harmonized Commodity Description and Coding System)
IMF International Monetary Fund
MEP minimum export price
MFDP Ministry of Finance and Development Planning (Botswana)
MOFCOM Ministry of Commerce of the People’s Republic of China
PPI Policy Perception Index
RTA regional trade agreement
SACU South African Customs Union
SCM Subsidies and Countervailing Measures
SDT Special and Differential treatment
SOE state-owned enterprise
SWF sovereign wealth fund
t ton; metric weights and measures are used throughout the volume
URAA Uruguay Round Agreement on Agriculture
USD United States Dollar
WCO World Customs Organisation
WTO World Trade Organisation


OVERVIEW – 9
EXPORT RESTRICTIONS IN RAW MATERIALS TRADE: FACTS, FALLACIES AND BETTER PRACTICES © OECD 2014
OVERVIEW
Introduction
This volume uses multiple approaches to examine world trade in raw materials. “Raw materials”, for the purpose of this publication, comprise the minerals and metals that are crucial inputs for the capital and consumer goods industries around the world, and the agricultural commodities that supplement domestic food supplies in many countries and sustain the global food processing industry. Virtually all countries need access to many or most of these raw materials for core economic activities and to sustain a healthy, well-nourished population.
As no country is self-sufficient in every raw material, it follows that virtually all countries are vulnerable to any attempt to restrict the export of at least some commodities. However, notwithstanding that resource nationalism is increasingly at odds with the interdependence of economies in the 21
st century, the last decade has seen a marked expansion in efforts to regulate
the supply and export flows of these materials through the use of export restrictions around the globe.
In the face of this trend, the issue of export restrictions on raw materials has raised concern within industry and government circles. While some restrictions were put in place in reaction to the strong demand and rising prices of commodities prior to the international financial crisis, or to the sudden demand surges and price peaks in agricultural commodities that accompanied the crisis, others have since followed and many are still in place. Export restrictions have contributed to episodes of global supply shortages and strong swings in prices. They have also become a source of friction and open trade disputes among governments using them and trading partners affected by them. All these developments make raw material export restrictions and other forms of resource protectionism a global challenge that calls for well informed and coordinated responses.
Against this background, the OECD initiated a programme of work in 2009 designed to study these restrictive measures and their economic effects, and to facilitate dialogue among stakeholders directly or indirectly affected by them. The programme has focused on export restrictions affecting, in particular, industrial raw materials. Two workshops were organised.
1 The
first major publication of the programme2
contains a selection of the papers from the first of these workshops.
Since then, the programme has continued to place its work in the public domain via a number of OECD Trade Policy Papers, on which some of the chapters in this volume draw heavily. Other parts of this volume constitute new work that is published here for the first time. The reader should be aware that the work presented in this volume is not concerned with import policies and restrictions on imports. There has been considerable work on import barriers, some of which contributed directly to securing the strong disciplines on imports currently enshrined in WTO legal texts, and this work continues. It is not, however, reflected in this publication.
Some of the chapters make use of a unique new database, the OECD Inventory of Restrictions on Trade in Raw Materials (OECD, 2014) (or, for short in this volume, the OECD Inventory). Set up in 2009 to overcome the dearth of systematically compiled information on export restrictions for raw materials, it covers both industrial raw materials and agricultural commodities. It compiles annual information, from 2007 onwards, on the complete range of export restraint instruments as applied by a large number of exporting countries to the main relevant, internationally

10 – OVERVIEW
EXPORT RESTRICTIONS IN RAW MATERIALS TRADE: FACTS, FALLACIES AND BETTER PRACTICES © OECD 2014
traded raw materials in both the industrial and agricultural categories. Much of the analysis and discussion assembled in the present volume makes use of the information contained in the Inventory.
The chapters are organised in three parts. Part 1 consists of a single chapter, which presents global trends in the use of export restrictions, broken down by exporting country, type of instrument and type of raw material. It documents how, for the vast majority of these commodities, the high concentration of supply or at least of exportable surpluses imparts an oligopolistic structure to the corresponding world market for that commodity. This creates the conditions in which individual large exporters may perceive an incentive to use their leverage over the world market to pursue domestic, or at least country-specific, policy objectives by manipulating the flow of this product onto the world market. The chapter also analyses the information recorded in the Inventory on the reasons given by individual countries for their use of export restrictions. Additional useful components of this chapter are a detailed description of the structure and coverage of the Inventory, a brief overview of current multilateral disciplines concerning export restrictions and some specific examples of their use by particular countries for certain products, together with some specific consequences of these policy choices. Thus, the chapter sets the scene for the rest of the volume, and justifies – albeit implicitly – the various analytical and conceptual approaches taken in subsequent chapters.
Part II consists of three chapters that explore the trade and welfare effects of export restrictions from different perspectives. Chapter 2 uses an economic theory framework to predict the effects of an export restriction on trade flows, world market and domestic prices, and the market outcomes for trading partners, including both exporters of the commodity whose exports are restricted and net-importing countries. Two restrictive instruments – a tax and a quota – are analysed. Welfare transfers and net losses generated by the restriction are also identified. The economic models used are designed to depict the oligopolistic nature of world markets for industrial raw materials. This represents the first time such a model has been used in this precise context. The insights gained from the theoretical analysis are then used to consider whether, and if so in which circumstances, export restrictions might in fact be effective in achieving any of the objectives countries have claimed for their use.
Chapter 3 reports the results of an empirically-based simulation exercise focussing on the global steelmaking industry and the world market for steel. This is an industry where both import protection on the final product and export restrictions on raw materials used as inputs are very prevalent. Using information on export taxes from the OECD Inventory and the OECD Trade Model, it examines the global effects of removing all export taxes currently applied on steel and the main raw materials used in steel production: scrap and ferrous waste, iron ore, and coke. For the most part, the simulated impacts on world market are strongly consistent with the predictions made in Chapter 2. Furthermore, the multilateral policy change that is simulated for just a few sectors and involving relatively few countries nonetheless gives an important boost to global trade. An important finding is that – contrary to widespread belief – export taxes and other export restrictions do not necessarily benefit domestic downstream industries or enhance the domestic value-adding process.
Chapter 4 uses various empirical approaches to capture the effects of recent agricultural export restrictions during 2004 to 2011 on (inter alia) world market prices, on global exports of the product whose exports are restricted, and on the country-specific export prices and exported quantities of certain commodities whose imports are restricted. The results are mixed and for the most part inconclusive. There is some evidence that the use of restrictions on rice exports reduced the exports of the restricting countries and importers diversified sourcing partners, but these effects were not found for two other crops, wheat and maize.
In summary, the two empirical chapters in Part II provide some real-world support for the effects predicted by the theoretical analysis in Chapter 2. The results presented here should not be taken as the final word, as other approaches, longer time series, and more probing statistical approaches are yet to be tried.

OVERVIEW – 11
EXPORT RESTRICTIONS IN RAW MATERIALS TRADE: FACTS, FALLACIES AND BETTER PRACTICES © OECD 2014
Part III consists of four chapters that address the general question: where do we go from here? How can the international community respond to the challenge of improving mutually agreed disciplines in this area, and what can be learned from any progress made so far? As part of the answer, Chapter 5 documents in detail the successes achieved by various regional trade agreements (RTAs) in going beyond the current state of discipline achieved within the WTO. The extent of agreed disciplines in the WTO as regards export restrictions is much less as compared with disciplines on imports. The Chapter first examines the multilateral rules that have been agreed in this area. It then underlines what has been possible within a smaller negotiating group of interested parties within RTAs. What is particularly enlightening is the array of novel strategies and procedures adopted by some of these RTAs for strengthening their disciplines on export restrictions.
Chapter 6 implicitly recognises that robust multilateral disciplines (as currently exist with respect to restrictions on imports) will not be achieved overnight, and explores ways in which, in the meantime, some of the more damaging consequences for stakeholders of the current use of export restrictions can be reduced by the adoption of certain transparency rules governing the design, development and implementation of export restrictions. Undoubtedly, the benefits of greater policy transparency for all those involved, including the policy-setting governments themselves, go well beyond the context of export restrictions and apply across the whole policy spectrum. This chapter, however, keeps its focus closely on the export restriction issue, and shows how well-defined transparency protocols, set out in detail in a transparency checklist, can greatly assist those operating in markets subject to the unpredictability and potential instability that are provoked by the way many export restrictions are currently used.
Finally, Chapter 7 looks in great detail at two success stories provided by Chile’s management of its copper industry, and Botswana’s steering of its mineral industry (principally diamonds) as an engine of growth and development for the economy as a whole. This chapter provides conclusive evidence that the objectives stated by many export-restricting countries to justify the use of this set of trade instruments can be achieved more efficiently and more sustainably over the longer term by quite different policy approaches, which leave their export flows unimpeded. An important common factor shared by these two countries is a strong institutional framework, with full legal backing, to guide the detailed functioning of the respective sector and its role in the wider economy. However, the institutional arrangements are very different between the two countries, in each case tailored to specific circumstances and even to the nature of the raw material concerned. This emphasises that a one-size-fits-all approach to the governance issue is not just unnecessary but may also be counter-productive. Having said that, there is much that can be learned and transferred from these case studies to other national contexts.
Main findings and conclusions
Recent trends in the use of export restrictions (Chapter 1)
Use of export restrictions is often highly unpredictable. Substantive international disciplines in this area are weaker than for import restrictions.
Export restrictions on raw materials have become more frequent over the last decade. The phenomenon includes bursts of escalating but relatively short-lived interventions (e.g. the spiral of restrictions triggered by rising global food prices in 2008-9) as well as creeping protectionism (certain minerals and metal scrap). Some restrictions have been in place unchanged for decades. Sometimes governments adjust restrictions several times a year. Governments use a variety of measures. The OECD Inventory records more than thirteen different types of export-restraining measures or policies, the most common of which are export permits, export taxes and quantitative restrictions.
Export restrictions are broadly applied across all raw materials sectors, from minerals and metals, and metal scrap, to wood and agricultural commodities. They are used mostly, but not exclusively, by emerging and developing countries and for a variety of reasons.

12 – OVERVIEW
EXPORT RESTRICTIONS IN RAW MATERIALS TRADE: FACTS, FALLACIES AND BETTER PRACTICES © OECD 2014
Global markets for raw materials often feature a high concentration of supply of, and hence dependency on, production and exports by a small number of countries. When markets are dominated by a few exporting countries that supply many importing countries, export restrictions have a large and more extensive effect on trade.
Experience shows that export controls can trigger similar actions in other supplier countries, driving up prices further, making price volatility worse, and creating a crisis of confidence that spreads from one resource to the next. Nobody benefits. Countries using export restrictions for some minerals are often heavily reliant on imports of other minerals, where they may face a restricted supply due to the use of similar trade instruments by other countries. These and other circumstances make a strong case in favour of addressing export restrictions and their effects through coordinated action.
The OECD Inventory confirms a transparency deficit in the design and implementation of export restrictions.
Expected economic effects of export restrictions (Chapter 2)
Governments expect export restrictions to help achieve certain policy objectives and tend to ignore that restrictions invariably hurt trading partners and interfere in the allocation of resources in the domestic economy, entailing costs.
Export restrictions distort trade flows. When a country applies a restriction, the welfare of its trading partners invariably suffers. Importers pay a higher price on imports from the restricting partner, user industries see their costs increase and consumers may see the price for final goods rise.
In theory, when an export restriction is applied by a ‘large’ country on its raw material, domestic processing firms, as well as competing foreign raw materials producers, will be favoured at the expense of domestic mining firms and foreign processing firms. In this way, there is a “profit-shifting” effect of export restrictions.
Abroad, raw materials producers gain from higher world prices and lower exports of the firm(s) in the country that is subject to a tax or quota and will therefore increase production. Higher world market prices for their goods increase their profits. They may increase their investment, although due to the uncertainty of the policy, they will engage in less investment than they normally would if they were responding to sustainable changes in market conditions rather than a policy that may be altered. This is another way by which global welfare falls due to export restricting policies.
The welfare gains which a “large” country may hope to obtain from an export tax or quantitative restrictions will not materialise if partner countries caught by this beggar-thy-neighbour policy retaliate in kind. The “large” country is then also worse off.
Exports restrictions taken by one economy give trading partners an incentive to divert their imports to other non-restricting countries supplying the same commodity. Diverting demand to other non-restricting countries creates pressure there to export more. When the restricting country is a large supplier and hence its action lowers world supply and raises world price, this can significantly increase the price of the commodity in the global marketplace. This may prompt these countries to restrict their exports in turn, the result of which would be a further rise in the price on the world market.
Export restrictions reduce domestic prices in the countries applying the measures. They indirectly subsidise domestic industries that use the restricted commodity as input. Assisting downstream industries to grow and compete may be the intended result of such restrictions. However, the restrictions punish producers of the commodity and discourage investment that will ensure long-term local supply of the raw material.

OVERVIEW – 13
EXPORT RESTRICTIONS IN RAW MATERIALS TRADE: FACTS, FALLACIES AND BETTER PRACTICES © OECD 2014
Real-world observations on the effects of export restrictions (Chapters 3 and 4)
Steel, and the iron ore, steel scrap and coke used for steelmaking are part of a supply chain with many industrial activities as end users. Together, these commodities also represent an important share of countries’ industrial production, in the case of emerging economies more than 10%, and significant shares of industrial value added, but their trade is hampered by many export restrictions.
Diversion of raw materials to domestic downstream industries is an important effect of export restrictions, which motivates the policy choices in many countries using those measures. The wisdom of using restrictions to those ends is put into question by the results from a multi-country, multi-sector Computable General Equilibrium (CGE) model. The simulation measures the effects of a simultaneous removal of export taxes in steel and steelmaking raw materials markets, including the indirect effects of the restrictions through the supply chain. When regions that apply export taxes remove these in coordination with similar action by trading partners, their downstream industries actually benefit.
Supply chains are increasingly global, relying on imported intermediate inputs and exporting finished products or semi-finished products for further processing. This means that removing a trade distortion) at one step of the chain has consequences throughout the global economy. As demonstrated for the steel industry, the CGE model simulation of a removal of all export taxes increases global supply and decreases world price. Through these effects and resulting changes in the pattern of increased imports and exports production costs for steel and the main inputs for steelmaking fall across all regions.
Partly because other countries join in the removal of export taxes, production costs decline for the steel industries of all regions that remove restrictions. The same effects are found for the scrap, iron ore and coke industries. The regions with the highest export tax levels experience the greatest price changes, leading to increased demand for their products and higher levels of production that contribute to GDP growth. Overall, coordinated action to lower and eventually remove export taxes helps both the upstream and the downstream industries expand, including in the countries that remove their export taxes.
In another sector, agriculture, use of export restrictions increased noticeably during the 2007 to 2011 period, when the world economy was hit by the financial crisis and the price of many agricultural commodities were rising and volatile. The presence of multiple causal factors makes it difficult however to isolate the effect of export restrictions alone.
Use of a set of statistical approaches found some evidence that the restrictions lowered agriculture exports from the countries imposing them. However, this was not always the case. On a year to year basis, because of the type of measure or its short duration, annual exports from some countries using restrictions continued flowing. In other cases, as would be expected, exports from countries using restrictions were substantially reduced relative to their level in the previous year; but whether due exclusively to the restriction or to tight domestic markets (which might have motivated the restriction itself) is not always clear.
Often the measures taken were highly restrictive (e.g. export bans) and subject to frequent changes, which causes uncertainty, a condition conducive to market disruptions caused by panic buying, shortages and oscillating monthly prices.
Market disruptions occurred in certain markets such as rice or wheat especially during 2008 and 2010, when many restrictions were applied. Some mitigating factors prevented further deterioration. Most restrictions were put in place for only a short time, there was sufficient global supply in order to meet demand and other suppliers stepped in. In most years from 2007 through 2011, exports from countries without restrictive measures made up for potential shortfalls, which allowed global exports to expand despite export restrictions of some countries. However, it cannot be ruled out that individual importers had difficulties finding alternative suppliers, which caused uncertainty and higher costs for them.

14 – OVERVIEW
EXPORT RESTRICTIONS IN RAW MATERIALS TRADE: FACTS, FALLACIES AND BETTER PRACTICES © OECD 2014
Approaches for better control, and more transparent use, of export restrictions (Chapters 5 and 6)
Efforts to enhance disciplines on export restrictions at the multilateral level have stalled, but there has been progress in negotiating restraints on use of export restrictions through bilateral and regional trade agreements.
The provisions found in some RTAs have the potential to inform future rulemaking in this area at the multilateral or pluri-lateral level. Other RTAs extend the disciplines already agreed in WTO rules. Existing disciplines in WTO on export restrictions are however less precise and more open to interpretation than disciplines in other areas, e.g. import restrictions.
RTAs set controls in different, often innovative ways. Many RTAs circumscribe use of export restrictions by setting specific conditions for their use, e.g. by prescribing maximum time limits for their use, or specifying situations in which the restrictions are not allowed or the types of products that can be restricted. Some fix ceilings for export taxes. Other RTAs grandfather restrictions that are in place but do not allow new ones.
RTAs recognise the importance of transparent and predictable application of permitted measures, often requiring members to observe higher publication and consultation standards than are found in WTO provisions. For example, an approach common to many RTAs is to set specific conditions on use of export restrictions. These RTAs showcase various ways of controlling export restrictions, without necessarily banning their use altogether.
Transparency regarding the use of export restrictions should be improved, given the inadequacy of many information policies at national level and the variation in transparency practices across countries.
Transparency is an important policy objective in its own right. Transparency allows trading partners and market operators to anticipate interventions in trade and adjust. Global markets work best when traders and end users can base decisions on rational assessments of potential costs, risks and market opportunities.
Transparency does not mean de-regulation. It is about a predictable business climate for all. Neither exporting nor importing countries benefit from opaque, unpredictable conditions of trade. Non-transparent export regulation in restrictions-using countries deters investors and stifles growth of the export sector in these countries. In countries applying export restrictions, non-transparency can encourage corruption and make it more difficult for a government to ensure regulatory compliance.
Transparency norms in WTO, RTAs and general guidelines for good governance together form a set of state-of-art principles and information requirements that governments can use when they develop and implement export restrictions. The resulting list (provided in Chapter 6) is also a benchmark against which governments can determine the adequacy of their own and their trading partners’ present information policies and which can guide improvements that governments may wish to pursue on their own or through collaboration.
Alternatives to use of export restrictions (Chapter 7)
Export restrictions are undertaken for different reasons, ranging from the generation of government revenue to the conservation of resources, environmental protection and industrial diversification away from resource extraction into upstream or downstream activities. Some may be justified and compatible with WTO rules while others not.
With respect to raw materials, the specific issues that export restrictions are expected to address, in those countries that use them, are in the main domestic market or policy failures, unrelated to trade. Previous chapters in this volume show that the effectiveness of export

OVERVIEW – 15
EXPORT RESTRICTIONS IN RAW MATERIALS TRADE: FACTS, FALLACIES AND BETTER PRACTICES © OECD 2014
restrictions in achieving any of the policy objectives requires close scrutiny. Trade measures such as export taxes or quotas will not be first-best policy instruments for dealing with these issues. Some countries which have the same policy objectives have addressed these effectively without resorting to export restrictions.
Economies dependent on mineral export have to manage the risk of export volatility resulting from booms and busts of international commodity markets. For public sector revenues and spending such dependence is a source of uncertainty and instability. In the case of Chile, the government receives a substantial share of its revenue from the mining sector, but notwithstanding fluctuations in revenue due to changes in copper prices and hence profits of mining firms, does not link government spending to the commodity cycle. Revenue is managed by applying a structural balance rule that disciplines government spending leading to budget surpluses in times of high revenue intake, typical of commodity booms, and provides stable sources of revenue during periods of low government income. Fiscal surpluses have been invested in sovereign wealth funds. A strong legal framework with checks and balances, and accounting practices open to public scrutiny, contribute to its success.
Industry development and diversification is possible in the absence of export restrictions. Chile has developed mining-related sectors, although the largest share of exports comes from mining and mineral extraction is primarily an export-related activity. A widely shared view holds that the country has no comparative advantage in downstream processing. Rather, by opting for promoting a range of less capital and less energy intensive intermediate goods and services industries that support mining operations, Chile is following a path which other minerals-rich countries, including Australia, Canada, Finland and the United States, have taken. These countries are all successful exporters of goods and services in the field of mining technology.
Looking forward
Just as collaboration at the multilateral level proved to be the most effective vehicle for putting in place today’s disciplines on import-restricting trade instruments, a multi-country approach would also be the most effective way to make lasting progress on disciplining export restrictions. There are international discussion and decision-making institutions for this purpose, including the various WTO fora, regional country groupings and trade negotiating fora, the G20 process, as well as smaller sectoral initiatives, such as the global Agriculture Market Information System (AMIS).
These existing mechanisms as well as possibly new multilateral collaborative fora dedicated to raw materials can contribute to address export restrictions and perhaps other trade policy issues in the raw materials sector comprehensively and decisively, leading to results that far exceed the sum of uncoordinated initiatives by individual governments. This volume attempts to contribute to such efforts, highlighting that export restrictions invariably reduce global welfare, typically fail to achieve their stated objectives, and that alternative policy approaches can be more effective at home while avoiding negative international spill-overs.
Notes
1. OECD Workshop on Raw Materials, Paris, 30 October 2009, and OECD Workshop of on Regulatory Transparency in Trade in Raw Materials, 11-12 May 2012.
2. OECD (2010),The Economic Impact of Export Restrictions on Raw Materials, OECD Trade Policy Studies, OECD Publishing, Paris, http://dx.doi.org/10.1787/9789264096448-en.
Reference
OECD (2014), Inventory of Restrictions on Exports of Raw Materials. http://www.oecd.org/tad/ntm/name,227284,en.htm.


1. RECENT DEVELOPMENTS IN THE USE OF EXPORT RESTRICTIONS IN RAW MATERIALS TRADE – 17
EXPORT RESTRICTIONS IN RAW MATERIALS TRADE: FACTS, FALLACIES AND BETTER PRACTICES © OECD 2014
Chapter 1
RECENT DEVELOPMENTS IN THE USE OF EXPORT RESTRICTIONS IN RAW MATERIALS TRADE
Barbara Fliess, Christine Arriola and Peter Liapis1
1.1. Introduction
For decades, trade policy negotiations have concentrated on reducing import barriers that governments use to impede access to national markets and protect domestic producers. The focus has widened in recent years, with governments and the private sector also paying much closer attention to policies and practices that hinder their access to raw material supplies from exporting countries.
Industrial raw materials prices on world markets remained fairly stable during the 1980s and 1990s; since the early 2000s, however, world markets came under pressure from strong economic growth in major emerging and developing economies. Prices of many raw materials soared to historic levels from 2005, and although the adverse environment of the financial crisis abruptly reversed the trend in 2008-09, countries engaged in extracting and exporting minerals have become more inclined to regulate output and trade. Many of these resources are critical inputs for industrial production and have to be procured by many countries through trade. A similar situation has developed in markets for agricultural products. Global demand for agricultural goods has been growing as a result of increasing world population, and higher world incomes have resulted in greater demand for more diversified, healthier diets. Strong demand and periodic weather-related production shortfalls have resulted in higher prices. When the prices of wheat, rice and other agricultural commodities reached record highs during 2007-2009, several governments concerned about inflation and the internal food security situation took steps to restrict export flows.
Access to raw materials, including imported materials, determines in a sense the “heartbeat” of an economy. Traditional industries producing motor vehicles, machinery or steel are major consumers of basic and other minerals as inputs. Since the 1990s a range of new technologies has created additional demand for many industrial raw materials, often used in very small quantities although not visible to end-consumers. A smartphone, for example, contains from 9 to 50 different metals. An array of different minerals are used in areas of clean energy technology. Besides iron ore, ferrous scrap and various alloying metals for steel structures, wind turbines contain aluminium, cobalt, copper, zinc and certain rare earth metals. Building a hybrid car requires aluminium, cadmium, cobalt and at least 16 other metals. The number of non-renewable materials used to make a solar panel, or a LED light bulb, is even higher. Economic activity depends on raw materials, many of which are traded around the world because no country has domestic endowments of all the inputs needed. Thus, all economies are to some extent vulnerable to changing conditions in some raw material markets.
The prospect of more restrictive export policies has prompted firms to factor the risk of less secure world market access to raw materials into their business strategies. Governments of countries that are reliant on procuring food and industrial raw materials abroad have also been following developments on global markets more closely. Where they are dependent on access to commodities that are produced abroad but are of strategic industrial and military value to their own economies, they have begun developing strategies for mitigating supply risks and reducing supply-chain vulnerabilities caused by reliance on foreign supplies.
2 The issue of export restrictions and the
distortions they create in the global marketplace for raw materials and the products for which they

1. RECENT DEVELOPMENTS IN THE USE OF EXPORT RESTRICTIONS IN RAW MATERIALS TRADE – 18
EXPORT RESTRICTIONS IN RAW MATERIALS TRADE: FACTS, FALLACIES AND BETTER PRACTICES © OECD 2014
are inputs has been raised in many trade policy discussions. The rise of tensions and outright conflicts underlines the importance of achieving a more restrained and orderly use of these measures.
This chapter describes and analyses the spread of export restrictions in international trade in raw materials. It draws on recent OECD survey data on export restrictions available from 2009 to 2012 for industrial raw materials and for agricultural raw materials from 2007 to 2011. Section 1.2 outlines the development and the salient features of the global demand-supply relationships and trade in raw materials. Section 1.3 presents statistics compiled by the OECD on the incidence of measures that restrict raw materials exports, starting at the level of broadly defined product groups and trade relationships between countries and then examining in more detail the types of measures adopted and products affected. Section 1.4 looks at the situation of selected industrial and agricultural product groups, namely steelmaking raw materials, mineral waste and scrap, non-ferrous metals, rice and wheat. Section 1.5 examines the motives that prompt governments to introduce export restrictions and identifies features of the measures and ways in which they are implemented from which the distorting effects on international trade can be gauged. Section 1.6 concludes.
1.2. Why the heightened concern about raw materials supplies in recent years?
Demand for industrial and agricultural raw materials has grown consistently over the past 100 years in line with production. The pattern of supply and demand itself has also changed over time. For decades, developing countries were increasing and diversifying their production of raw materials, while demand for them – especially for industrial raw materials – was driven primarily by industrial growth in developed economies. Since the early 2000s, however, accelerating economic growth in China, India and other emerging economies has increased global demand for raw materials, which has contributed to a significant expansion of international trade. China provides the most striking example of recent changes taking place in some of these countries with expanding industries. In 1955, China was the leading producer of 14 commodities monitored by World Minerals Statistics, and by 2012 had become the leading producer of 44 commodities and a top-three producer of a further 12 commodities. Notwithstanding this, and despite a growing and diversifying mining sector, China’s rapidly growing industries have not been able to meet all their mineral needs from domestic supplies and have sourced some of their requirements in the international market (British Geological Survey, 2014).
Increasing incomes, changes in tastes, growing expectations to be able to consume seasonal products throughout the year, rising population and improved communication, transportation and logistics have all led to a steady expansion over time of global trade in agricultural goods. Between 2000 and 2012, trade in agricultural and food products grew at an annual average rate of 10% from less than USD 311 billion to just under USD 1 trillion.
3 As most of
the population and income increases are taking place in the developing world, trade patterns have evolved accordingly. In agriculture, high income countries supplied 58% of the world’s agricultural exports in 2000, but by 2012 their share had fallen to less than 45% reflecting the additional output emanating from developing countries. Even more dramatic is the drop in their share of agricultural imports falling from about two-thirds of the world’s total to about 40% during this time. Developing and emerging countries are not only trading more with the developed world, they are also trading more with each other. South-South agricultural trade was only 14% of the total in 2000 as against a hugely increased 29% in 2012.
Figure 1.1 tracks the evolution of global export volumes for the major categories of non-
energy commodities over the past decade. The increase in global minerals and metals requirements
and production has led to sustained growth in world exports that was reversed only temporarily by the onset of the world financial crisis of 2008. Exports of minerals and metals have doubled since the early 2000s, reaching a record high of 2.3 billion metric tons in 2013. Exports of agricultural commodities rose by 74%, to 1 billion tons. Traded metal waste and scrap more than doubled between 2000 and 2013 from some 48 million to 104 million tons, which is a rough estimate

1. RECENT DEVELOPMENTS IN THE USE OF EXPORT RESTRICTIONS IN RAW MATERIALS TRADE – 19
EXPORT RESTRICTIONS IN RAW MATERIALS TRADE: FACTS, FALLACIES AND BETTER PRACTICES © OECD 2014
because UN Comtrade statistics in this sector are poor for many countries. Wood exports, on the other hand, declined by 30% during the same time period.
Figure 1.1. Global exports raw materials, by sector (net weight)
Note: Net weight of gross exports of unprocessed and semi-processed minerals, metals and wood products and all WTO-defined agricultural products. For the list of products that comprise each category in the figure see the methodological notes accompanying the OECD Inventory accessible at: http://qdd.oecd.org/subject.aspx?subject=8F4CFFA0-3A25-43F2-A778-E8FEE81D89E2. Global exports refer to all countries of the world. Data excludes intra-EU trade.
Source: UN Comtrade.
Every country imports at least some of the raw material inputs necessary for industrial production. While dependence on access to foreign sources varies across economies and industries, exporting and importing economies alike have faced a situation of rising and also more volatile commodity prices in the last decade. Sometimes prices have skyrocketed in the course of a few months. For example, the price of rare earth metals as a whole doubled from 2010 to 2011, while prices of some elements like lanthanum and cerium (both rare earths) rose by 900%. Prices of antimony and tungsten more than doubled over this same period (Silberglitt et al., 2013). Agricultural commodities have experienced similar volatility. Between 1975 and 2000, cereal prices were low and stable, but this situation changed within a few years. Food prices as revealed by the IMF’s food price index rose steeply between 2005 and 2008 to the highest levels in 30 years, before falling by 33% in the second half of 2008. Another peak in world food prices was reached in 2011.
4
World market prices of individual agricultural commodities showed even more extreme swings, and remain much more volatile than in the first five years of this century (see Chapter 4, section 4.4 for more details).
Thus, as demand for raw materials has increased, global markets have become tighter, prices have risen, and so has the tendency for countries supplying these markets to tax exports or erect export barriers in various ways. Export restrictions have become part of the problem of escalating prices and volatile markets for raw materials. They have caused growing apprehension among countries, both developed and developing, that depend on imports for foodstuffs and other raw materials.
Several factors render concerns about restrictive export policies more acute. The first is that resource endowments, and consequently production of raw materials, have a very uneven geographical distribution. This is especially true for minerals and other industrial raw materials. For example, while nickel is mined in at least 30 countries, zinc in 40 countries, and silver in more than 50 countries, global supply of other minerals is concentrated in a small number of countries. In
Agriculture
Minerals and metals
Waste and scrap
Wood
0
500
1000
1500
2000
2500
2000 2001 2002 2003 2004 2005 2006 2007 2008 2009 2010 2011 2012 2013
Million metric tons

1. RECENT DEVELOPMENTS IN THE USE OF EXPORT RESTRICTIONS IN RAW MATERIALS TRADE – 20
EXPORT RESTRICTIONS IN RAW MATERIALS TRADE: FACTS, FALLACIES AND BETTER PRACTICES © OECD 2014
2012, China alone produced 91% of the world’s supply of rare earth metals on which products ranging from hybrid electric vehicles and energy-efficient light bulbs to cell phones and computer displays depend. Some 60% of the world’s chromium, used mostly by the chemical and metallurgical industries, was produced in South Africa and Kazakhstan, which together account for 99% of all currently known chromite reserves. Almost 90% of world production of platinum and related metals occurs in South Africa and the Russian Federation. Recent world production shares of leading producers are shown in Table 1.1 for a number of raw materials. The production figures for minerals and metals mask the fact that known reserves are often less concentrated. The prospect of new supply coming into the market can act as a buffer when demand exceeds supply and prices rise. However, even when high prices lead to new investments, it takes years for mining operations to start.
In contrast to minerals, agricultural commodities are renewable resources. All countries produce agricultural products, but some countries do not produce enough foodstuffs to feed their own populations and thus need to import them. Although world supply of agricultural commodities does not have the pronounced oligopolistic features of many markets for industrial raw materials, there are some large players here too (Table 1.1). Droughts or government interventions affecting supply in key producing regions can easily disrupt global commodity markets and upset trade relationships.
Another factor heightening concern about restrictive export policies is that, in the short run, there are few or no substitutes available for many of the necessary inputs. For example, rare earth metals, antimony, and tungsten are difficult to replace without significantly increasing production costs or compromising the performance of the products in which they are used. Rare earths are used to make lasers and many components of electronic devices and defence systems, antimony is crucial for flame retardant plastics and textiles, and tungsten is used to produce cemented carbides for cutting tools used in many industries (Silberglitt et al., 2013). To safeguard against possible supply shortfalls, some industries and governments have stepped up efforts to stockpile industrial commodities essential for their operations (see, for example, Areddy, 2011, p.10). Similarly, the food price spike of 2008 has given impetus to initiatives at national and regional levels to hold more food stocks in reserve.
In the case of manufactured goods, attempts are being made to reduce dependence on access to primary raw materials by recycling more secondary material (waste and scrap) so that it can be used in the making of new products. Steel, copper and aluminium are among the most recycled secondary materials today, which have become globally traded commodities. As prices for primary raw materials have risen, collecting and processing scrap for re-use has become increasingly cost-effective and small-scale secondary markets and trade opportunities are emerging even for metals used in minute quantities that are difficult to recover, such as rare earths. Another incentive for recovering scrap for recycling is that this process can be very efficient in saving water and energy, and is otherwise environmentally sound.
The availability of secondary material for recycling depends on past production and is limited at national level. With demand growing, and in order to prevent shortages in certain geographical areas and surpluses in others, it is crucial to be able to trade metal scrap internationally as freely as possible. However, the global market for metal waste and scrap has also seen a steady increase in recent years in government-imposed export bans and other types of export restrictions.
The increased use of export restrictions across raw materials markets has caused concern and friction, including two recent challenges at the WTO to the legality of export restraints imposed by China on a broad set of raw materials.
5 At the same time, there have been efforts to strengthen
the disciplines on export restrictions of the multilateral trading system. While WTO rules on the use of import restrictions are numerous and extensive, those on export restrictions are more limited. These multilateral rules are described in Annex 1.A. Various proposals for improvement have been tabled during the ongoing Doha Round trade negotiations, but concrete steps in this direction could not be agreed. As Chapter 5 of this volume shows, the bulk of concrete recent achievements in restraining the use of these measures has occurred in the context of negotiated regional trade agreements (RTAs).

1. RECENT DEVELOPMENTS IN THE USE OF EXPORT RESTRICTIONS IN RAW MATERIALS TRADE – 21
EXPORT RESTRICTIONS IN RAW MATERIALS TRADE: FACTS, FALLACIES AND BETTER PRACTICES © OECD 2014
Table 1.1. Production for selected raw materials
Product Major producers, by share of
world production (2012)
Top 5 producers’
share
Figures in parentheses are percentage shares %
Minerals and metals
Antimony China (82), Tajikistan (4), Russia (4), Bolivia (3), South Africa (2) 95
Chromium South Africa (44), Kazakhstan (20), India (12), Turkey (9), Oman (2) 87
Cobalt Democratic Republic of Congo (68), China (5), Zambia (4), Australia (4), Cuba (3)
84
Copper Chile (32), China (10), Peru (8), United States (7), Australia (5) 62
Iron ore China (44), Australia (18), Brazil (13), India (5), Russia (4) 84
Lithium Chile (49), Australia (30), Argentina (9), United States (5), China (4) 97
Nickel Philippines (17), Russia (14), Indonesia (13), Australia (13), Canada (11)
68
Platinum group metals South Africa (59), Russia (27), Canada (5), United States (4), Zimbabwe (4)
99
Rare earth oxides China (91), United States (4), Australia (3), Russia (2) Brazil (0.2), Malaysia (0.1)
100
Tin China (40), Indonesia (31), Peru (9), Bolivia (7), Brazil (4) 91
Tungsten China (83), Russia (6), Canada (3), Bolivia (2), Rwanda (1) 95
Wood products
Coniferous industrial roundwood
United States (23), Canada (13), Russia (10), China (7%), Brazil (4) 54
Non-coniferous tropical industrial roundwood
Indonesia (28), Brazil (14), Malaysia (10), India (9), Thailand (5) 66
Agricultural commodities
Maize United States (32), China (24), Brazil (9), European Union (7), Argentina (3)
74
Palm oil Indonesia (51), Malaysia (35), Thailand (4), Colombia (2), Nigeria (2) 93
Rice (milled) China (30), India (22), Indonesia (8) Bangladesh (7), Viet Nam (6) 73
Soya beans United States (31), Brazil (31), Argentina (18), China (5), India (4) 89
Soya oil China (27), United States (21), Brazil (16), Argentina (1), European Union (5)
84
Wheat European Union (20), China (18), India (14), United States (9), Russia (6)
68
Note: Figures for shares are rounded up. Production figures for minerals and metals are for ores and concentrates or, where applicable, further processed materials.
Source: Production figures - Minerals and metals: British Geographical Survey (2014). Tropical industrial roundwood: ITTO (2012). Coniferous industrial roundwood: FAO (2014). Agricultural statistics from the US Department of Agriculture, Foreign Agriculture Service, Production, Supply and Distribution, on line http://apps.fas.usda.gov/psdonline/psdQuery.aspx.
Export restrictions stand out in the conduct of trade policy not only because the WTO disciplines regulating their use are less developed, but also because of the opaque way they are used by governments, which makes it difficult to follow and predict what governments are doing or planning to do. Accurate, timely and accessible information about policy measures is a necessary condition for predicting supply and managing production risk. Opacity itself can be a formidable

1. RECENT DEVELOPMENTS IN THE USE OF EXPORT RESTRICTIONS IN RAW MATERIALS TRADE – 22
EXPORT RESTRICTIONS IN RAW MATERIALS TRADE: FACTS, FALLACIES AND BETTER PRACTICES © OECD 2014
barrier to trade. Because the use of market-distorting export restrictions is less systematically notified to trading partners through the WTO system, making these policies more transparent is a challenge in its own right.
To contribute to greater transparency, the OECD began collecting detailed information on export restrictions in the raw materials sector in 2009 (see the following section). Promoting more transparent use of these measures at national government level is another area where the OECD has been actively working. Some of the results of that work are presented in Chapter 6 of this volume.
1.3. Profiling the presence and spread of export restrictions
In the past, comprehensive and up-to-date information on export restrictions has not been readily available. The WTO maintains databases of notifications that members must make when they use some types of export restraints, but these notification obligations are insufficiently enforced. Some industry associations have begun to monitor export restrictions for their members, but this is usually done for the specific sectors in which they operate. Some governments include export restrictions in their regular exercises of monitoring trade policies abroad that are of interest to their countries.
In order to fill this information gap, the OECD started collecting information on export restrictions in 2009, systematically surveying a large set of countries and raw materials. The analysis in this chapter draws on this unique database. The OECD Inventory of Restrictions on Trade in Raw Materials (OECD, 2014a) (hereafter called the OECD Inventory) covers both industrial raw materials and primary agricultural and food commodities
6. The structure of each of the
two parts of the Inventory is tailored to the type of information it contains and its availability. For industrial materials, the Inventory records restrictive trade measures for more than 80 industrial raw materials in their primary and semi-refined/processed state, and in waste and scrap form.
7 For this
information, the survey aims to cover 84 countries (considering the EU as a single region) and data for the entire period 2009 to 2012 are currently available for 72 countries. The survey covers around 80% of world production volume of minerals, metals and wood in their primary state and a large share of related global trade (67% of 2012 total value of exports of primary materials, 45% of total exports of primary and semi-processed materials combined, and over 90% of exports of metals waste and scrap). For agricultural products, 16 countries are surveyed for export restrictions covering the whole range of agricultural commodities as defined by WTO. The most complete set of data for agricultural products covers the years 2007 to 2011, although for some countries available data extend outside this period. The list of surveyed countries and products is provided in Annexes 1.C and 1.D.
Since many more countries were surveyed for industrial raw materials than for agricultural products, the analysis presented in this chapter uses the former part of the Inventory more extensively, complemented by selective information about export restrictions from one sector of agriculture, namely primary bulk commodities.
8
Overview
The list of measures surveyed by the OECD Inventory is comprehensive, ranging from export taxes, prohibitions and non-automatic licensing requirements, to price and tax measures (Box 1.1). These measures are known to restrain export activity. They typically increase the relative price of exported products, decrease the quantity of exports supplied or change the terms of competition among suppliers. The different types of measures are explained further in Annex 1.B. The Inventory does not report export restrictions that are expressly sanctioned by international agreements in well-defined circumstances.
9
The OECD Inventory documents widespread use of export restrictions for industrial raw materials in recent years. Some of the measures recorded as being in force in 2012 (at HS6 level) have been in place for many years or even decades, but three quarters of them have been

1. RECENT DEVELOPMENTS IN THE USE OF EXPORT RESTRICTIONS IN RAW MATERIALS TRADE – 23
EXPORT RESTRICTIONS IN RAW MATERIALS TRADE: FACTS, FALLACIES AND BETTER PRACTICES © OECD 2014
introduced since 2007. More than half the measures in effect in 2012 were introduced after 2009 and almost a quarter in 2012. Expressed as simple counts of measures recorded at the HS6 product level, 466 of over 2000 measures recorded as being in effect in 2012 were introduced in that year (Figure 1.2).
Box 1.1. Types of measures surveyed and recorded by the Inventory
Export tax Dual pricing scheme
Export surtax VAT tax reduction/withdrawal
Fiscal tax on exports Restriction on customs clearance point for exports
Export quota Qualified exporters list
Export prohibition Domestic market obligation
Export licensing requirement Captive mining
Minimum export price/price reference for exports Other measures
Figure 1.2. Year of introduction of measures present in 2012
Note: Measures are counted at the HS6 level of product classification. The measures are restrictions on industrial raw materials. Restrictions that expired and then were reintroduced in the following year were counted as a new introduction of a measure.
Source: UN Comtrade.
Of the 72 countries with data available for 2009-2012, 12 countries did not apply restrictions in 2012 for any of the surveyed products. The other 60 countries applied at least one restriction between 2009 and 2012. OECD Inventory entries exist for nearly all the 90 minerals, metals and wood products at the HS6 product level covered by the survey (see Annex 1.C) and this large number of products affected by restrictions has not changed since 2009.
The agriculture and food section of the OECD Inventory covers numerous products, many of which were subject to export restrictions at least once during 2007 to 2011. Grouping these products into four general categories
10, horticultural products were the least affected by export
restrictive measures, while semi-processed products were restricted the most often. Over this five-year period, among the 16 countries whose agricultural trade data are recorded in the Inventory, there was a 58% probability that an individual country would impose an export restriction on at least one bulk product in any given year, relative to a 50% probability for semi-processed products.
0
50
100
150
200
250
300
350
400
450
500
Number of measures

1. RECENT DEVELOPMENTS IN THE USE OF EXPORT RESTRICTIONS IN RAW MATERIALS TRADE – 24
EXPORT RESTRICTIONS IN RAW MATERIALS TRADE: FACTS, FALLACIES AND BETTER PRACTICES © OECD 2014
However, there were nearly twice as many individual restrictions in place on export of semi-processed products (532 restrictions at HS6 level) relative to those of bulk products (278 restrictions at HS6 level). The measures applied covered the whole gamut of instruments listed in Box 1.1, with outright bans the most common (used by 13 of the 16 countries in the database), followed by export taxes (9 countries) and export quotas (9 countries). At times, countries used a combination of these measures, either concurrently or sequentially.
Certain trends and patterns regarding the use of export restrictions and products affected can be seen:
Export restrictions are broadly applied across all raw materials sectors, from minerals and
metals, and metal scrap, to wood and agricultural commodities. The majority of restrictions are
applied by emerging and developing countries.
The period between 2009 and 2012 witnessed the introduction or tightening of over 900 measures at the HS6 product level in the industrial raw material sector. By comparison, only 400 measures in the Inventory were eliminated or relaxed during that period, and many of these resulted from the liberalisation commitments of countries such as Tajikistan, Ukraine and Viet Nam under their WTO accession protocols. As for primary agricultural bulk commodities, some 337 new or tighter measures (at HS6 level or higher) were added during 2007-2011, and some 70 measures were removed or liberalised.
Many export restrictions imposed between 2007 and 2011 on agricultural commodities were temporary, sometimes lasting less than a year. For industrial raw materials, on the other hand, interventions tend to be medium- to long-term. It was rare that a measure in force in 2009 was discontinued in the course of the next three years.
Governments use a variety of measures. A summary of the number of measures recorded in the OECD Inventory for 2012 is provided in Table 2. Non-automatic export licensing requirements and export taxes are particularly widespread across all three categories of industrial raw materials – minerals and metals, metal waste and scrap, and wood. Governments also impose quantitative restrictions (prohibitions and quotas), notably on exported waste and scrap and primary bulk agricultural commodities, or resort to other policies that restrain export flows.
While a detailed description of international trade patterns is beyond the scope here, it is useful to provide information on the size of the trade flows corresponding to the four categories of raw materials, the leading importers and exporters, and amount of trade affected by the export restrictions in the OECD Inventory. Worldwide imports of the more than 80 minerals and metals surveyed for the Inventory amounted to USD 1.2 trillion in 2012. OCED members, led by the EU and the United States, accounted for 44% of these imports. Moreover, 65% of the imports into the OECD area were sourced from other OECD member countries.
11
Seven per cent12
of the 2012 total gross trade value of minerals and metals were subject to
export restrictions in 28 countries with available trade data. While at this high level of product aggregation the incidence seems quite small, a more nuanced picture emerges for individual products within the minerals and metals sector.
Metals account for the lion’s share of exports value in this sector, with a large share of exports subject to restriction at the individual product level. They comprise 43 products and were exported to the value of USD 1 trillion in 2012. Metal products include aluminum, copper and other base metals widely used across industrial applications, but also the so-called technology metals that are critical inputs to many high-technology industries. More than a third of the exports of metals like thorium (63%), the metal group niobium, tantalum, vanadium (54%), tungsten (52%), and magnesium (46%) were subject to some form of export restrictions in 2012.
13

1. RECENT DEVELOPMENTS IN THE USE OF EXPORT RESTRICTIONS IN RAW MATERIALS TRADE – 25
EXPORT RESTRICTIONS IN RAW MATERIALS TRADE: FACTS, FALLACIES AND BETTER PRACTICES © OECD 2014
Table 1.2. Incidence of export restrictions by type of measure and sector
Minerals and metals
Metal waste and scrap
Wood Primary bulk agricultural
commodities
2012 2012 2012 2011
Domestic market obligation 5
Export prohibition 3 129 9 25
Export quota 20 9 2 7
Export tax 144 141 6 9
Licensing requirement 172 226 27 -
Other export measures 27 47 9 3
Total 371 552 53 44
Note: Counts of measures are at the HS6 level of product classification. For the categories minerals and metals, metal waste and scrap, and wood: Since many products comprise more than one HS6 line and the number of lines per product varies, the simple count was adjusted by dividing counts at the product level by the number of HS lines constituting each product. This adjustment removes the bias inherent in simple counts of HS6 product lines. ‘Other export measures’ include such items as restrictions on customs clearance points for exports, qualified exporters lists, the setting of minimum export price/price references and captive mining. For primary bulk agricultural commodities: the counts of measures shown are not adjusted. Argentina collects export duties of 5% on agricultural products. The OECD Inventory records only exceptions or changes to this policy. Only licenses related to export quotas are recorded for agriculture products.
Source: OECD Inventory, as of June 2014.
The impact of export restrictions is larger and more extensive when they are imposed on products whose world market are dominated by a few exporting countries trading with many
importing countries. For example, the top 5 exporting countries account for 92% of the USD 1.9
billion magnesium export supply in 2012. China alone produced 85% of this metal14
and accounted for about two-thirds of the value of magnesium exports whereas the shares of nine of the top ten importers ranged between 1% and 8%. South Africa, Rwanda, and Brazil made up three-quarters of total exports for the metal group niobium, tantalum and vanadium, which was mainly imported by China (38%), the EU (33%), and Thailand (14%). In instances where the source of trade is concentrated, like magnesium, the impact of export restrictions employed by one exporter is distributed across a larger number of importing countries.
The remaining items in the industrial raw materials section of the OECD Inventory are 41 mostly non-energy industrial minerals. While at USD 183 billion they account for a minor share of the total trade in minerals and metals, some minerals are vital for every economy around the globe. Potash and phosphate rock materials, for example, are used in fertilizers, which are critical inputs for food production. According to US Geological Survey data
15, Canada and the Russian Federation
together account for the bulk of world potash production but significant amounts are also produced in other countries, including Belarus and China, both of which have restricted exports in recent times. In 2012, 18% of potash exports were subject to restrictions by these two countries. For phosphates, the figure of restricted trade (of China and Malaysia) is 5%.
Potash is a highly concentrated export market, where the top 5 exporters (Canada, Russian
Federation, Belarus, United States and Jordan) account for almost all the trade (92%). Over 111 countries are recorded as having imported potash in 2012. For some countries, particularly those with a large agricultural sector, it is a significant part of their raw mineral imports. For example, potash represents 24% of Brazil’s 2012 mineral and metal imports.
World imports of wood products in the OECD Inventory totalled USD 56 billion in 2012. Led by the United States and Japan, OECD imports accounted for 51% of world imports. The largest importers were China (26%), Japan (15%), United States (12%), and the EU (11%), and the top 10 importers accounted for 80% of world imports. Heading the list of suppliers were Canada (14%), the EU (13%), the Russian Federation (12%), the United States (11%), and China (11%). Exports are heavily restricted. Overall, 39% of the value of world exports of wood products surveyed for the OECD Inventory were subject to export restrictions in at least 11 countries, by countries that were

1. RECENT DEVELOPMENTS IN THE USE OF EXPORT RESTRICTIONS IN RAW MATERIALS TRADE – 26
EXPORT RESTRICTIONS IN RAW MATERIALS TRADE: FACTS, FALLACIES AND BETTER PRACTICES © OECD 2014
for the most part leading producers and exporters in this sector. Exports of non-coniferous tropical plywood are both highly restricted and concentrated. The top two producing countries, Malaysia and Indonesia, applied export measures in 2012. Malaysia alone accounted for almost half (49%) of the total trade value and Indonesia over a third (37%). In contrast, the top 5 exporters of non-coniferous tropical sawnwood make up only 65% of world trade and only one of the top 5 exporters applied any restrictions. In the case of non-coniferous tropical plywood, the export policies have a larger effect, since a total of 111 countries import the product from a highly concentrated and highly restricted market.
At some USD 84 billion in 2012, global trade in metal scrap and waste materials is just a fraction of trade in primary minerals and metals extracted from the ground. The largest importer of scrap was China (27%), then European Union (14%), Turkey and South Korea (11% each), and the United States and India (each 9%). The top 5 exporters were all OECD countries, led by the United States (24%), the EU (22%), Japan (7%), Canada (6%) and Australia (2%). The OECD Inventory reports that in 2012 restrictive policies targeting one or more scrap or waste items were in place in 39 (mostly developing) countries. Some 7% of exports of metals waste and scrap totalling USD 5.8 million (according to UN Comtrade) were affected in 2012.
In fact, only a third of the products classified under waste and scrap were found in the UN Comtrade database. Aluminium, copper, platinum and steel are items where trade flows are reported more consistently across countries. For these items, the share of 2012 exports affected by the measures in the OECD Inventory ranged from 3 to 8%. In this sector, approximately 64% of trade was intra-OECD, and OECD countries sourced almost 80% of their imports from other members, a much higher share than their imports of primary minerals and metals. But with production of scrap being concentrated in OECD countries and twelve developing countries imposing bans on exports of waste and scrap, these trade patterns are not surprising.
Total agriculture imports, as defined by the WTO, were valued at USD 914 billion in 2011, of which primary bulk commodities were 27%. Top importers of bulk commodities were China (18%). followed by EU (16%), Japan (7%), United States (6%) and Mexico (4%). Overall, non-OECD countries accounted for half of the imports. The non-OECD countries supplied about half of total exports as well. The leading exporters were the United States (25%), Brazil (15%), Argentina (7%), Canada and India (6% each). The 15 countries for which at least one export restriction was recorded during the 2007-2011 period are all non-OECD countries.
Among the bulk agricultural commodities, wheat, barley and rye were the subject of export measures in the Russian Federation, Argentina and Ukraine in 2011 (the latest year of available OECD Inventory data on export restrictions for agriculture). These countries were also among the top ten exporters of these primary products and accounted for 20% of the total trade. Of the three commodities mentioned, barley had the largest share of exports sourced from these countries with export restrictions (34%), while only 19% of wheat and rye exports came from these sources. Rice was also restricted in 2011, by Argentina, China, Egypt and Myanmar, which accounted for 4% of total exports.
As is shown in the following sections, the situation occurring in 2011 and 2012 represents a point on a trend in export policy that already became apparent much earlier. Many restrictions were already in place in 2009. Especially in the minerals and metals sector, measures have been seldom discontinued, and many individual products have seen the number of export restrictions in force grow between 2009 and 2012.
What measures do governments use?
1. Non-automatic export licensing requirements
At the HS6 product level, non-automatic export licensing requirements are the measure most frequently reported by the OECD Inventory for minerals and metals. Exporters must obtain prior approval, in the form of a license or permit, to export the product. By reviewing applications for a licence on a case-by-case basis, governments can control who exports and how much. The process

1. RECENT DEVELOPMENTS IN THE USE OF EXPORT RESTRICTIONS IN RAW MATERIALS TRADE – 27
EXPORT RESTRICTIONS IN RAW MATERIALS TRADE: FACTS, FALLACIES AND BETTER PRACTICES © OECD 2014
of applying for a license generates extra transaction costs for exporting firms, in time and sometimes monetary terms. Moreover, when processing times are long or unpredictable, this hinders the ability of firms to react quickly to sales opportunities in foreign countries.
In 2009, these measures were applied by 25 countries, including 8 countries that were among the top 5 world producers for at least one of the products affected. The number of countries was slightly higher in 2012 (26) and included more leading producers (9). They affected the trade of some 240 different primary and semi-refined or processed minerals and metals products, at the HS6 level of product classification. Table 1.3 lists the products most frequently subject to non-automatic licensing requirements in 2012, along with the countries imposing them. China, the Dominican Republic, Malaysia, the Philippines and the Russian Federation figure prominently as countries where for many or even all of the products shown businesses must obtain a license to sell abroad. Apparently countries apply export licensing requirements to many products simultaneously or sequentially, rather than targeting particular products selectively.
Table 1.3. Minerals and metals most frequently subject to export licensing requirements, 2012
Product HS6 lines, adjusted
HS6 lines, simple count
Number of countries
Countries applying the measure
Antimony 8.5 11 6 China, Grenada, Malaysia, Philippines, Russia, South Africa
Molybdenum 8.4 21 6 China, Grenada, Malaysia, Philippines, Russia, South Africa
Cobalt 8 10 6 Argentina, China, Grenada, Malaysia, Philippines, Russia
Tungsten 7.5 13 6 China, Grenada, Malaysia, Philippines, Russia, South Africa
Tin 7.25 14 6 China, Grenada, Indonesia, Malaysia, Philippines, Russia
Note: Excludes metal waste and scrap. The products comprise primary and semi-processed metals and minerals. The list of products shown is not exhaustive. Since many products comprise more than one HS6 line and the number of lines per product varies, the simple count was adjusted by dividing counts at the product level by the number of HS lines constituting each product. This adjustment removes the bias inherent in simple counts of HS6 product lines.
Source: OECD Inventory, as of June 2014.
Of the 22 different product groups comprising agricultural bulk commodities, exports of three products – maize, rice and wheat – were subject to licensing requirements in 2009 involving two countries, Argentina and Indonesia. The OECD Inventory contained no records for non-automatic export licensing requirements for agricultural commodities for either 2010 or 2011, the latest years for which it has data.
2. Export taxes
In minerals and metals trade, export taxes are the second most frequently reported type of export restriction. In 2009, 22 countries, including 10 leading (top 5) producers, imposed such taxes on at least one product exported.
16 The total number of export-restricting countries increased by
one in 2012. At least 55 types or groups of minerals and metals (excluding waste and scrap) were affected. In fact, all the products shown in the previous Table 1.3 with a high incidence of non-automatic export licensing requirements are also among the products listed in Table 1.4 as being taxed most frequently.
Export taxes are applied either ad valorem, calculated as a percentage of the value of the export, or as a specific tax, with the exporter paying a given amount of money per unit of the export. Some governments collecting ad valorem taxes also prescribe a minimum monetary amount that

1. RECENT DEVELOPMENTS IN THE USE OF EXPORT RESTRICTIONS IN RAW MATERIALS TRADE – 28
EXPORT RESTRICTIONS IN RAW MATERIALS TRADE: FACTS, FALLACIES AND BETTER PRACTICES © OECD 2014
exporters must pay per ton of material shipped (e.g. 25% or EUR 330/ton, whichever is greater). Ad valorem taxes will be examined in greater detail in a later section of this chapter. The rationale for taxing exports often has to do with governments’ need for revenue.
Some governments tax exports of primary mineral commodities only, others only exported semi-processed materials. Sometimes export duties are applied to materials both in their primary and semi-processed forms, and with systematically different rates depending on their processing or fabrication stages. This is sometimes observed with import tariffs: to encourage value-addition to be carried out locally, lower import tariffs are imposed on raw materials while higher rates are levied for imported products competing with local producers at further stages of processing. As illustrated in Box 1.2, governments may decide to cascade the taxation of exports in order to encourage transformation of local raw materials at home.
Table 1.4. Products most frequently subject to export taxes, 2012
Product HS6 lines, adjusted
HS6 lines, simple count
Number of countries
Countries applying the measure
Copper 9.47 88 9 Argentina, China, Colombia*, Dominican Republic, Malaysia, Russia, Ukraine, Viet Nam, Zambia
Tungsten 9.00 18 5 Bolivia, China, Dominican Republic, Russia, Viet Nam
Cobalt 8.00 10 4 Argentina, China, Dominican Republic, Viet Nam
Antimony 7.50 10 4 Bolivia, China, Dominican Republic, Viet Nam
Manganese 7.00 7 5 China, Dominican Republic, Gabon, India, Viet Nam
Molybdenum 6.40 17 4 China, Dominican Republic, Russia, Viet Nam
Tin 6.25 13 5 Bolivia, China, Dominican Republic, Ukraine, Viet Nam
Silver 5.00 11 5 China, Dominican Republic, Fiji, Malaysia, Viet Nam
Zinc 4.38 14 4 China, Dominican Republic, Malaysia, Viet Nam
Titanium 4.00 5 3 China, Dominican Republic, Viet Nam
Zirconium 4.00 5 3 China, Dominican Republic, Viet Nam
Lead 3.86 9 4 China, Dominican Republic, Malaysia, Viet Nam
Iron and steel 3.63 73 6 Argentina, China, Dominican Republic, India, Ukraine, Viet Nam
Note: Excludes metal waste and scrap. The term ‘export tax’ refers to export taxes, export surtaxes and fiscal taxes on exports. The products comprise primary and semi-processed metals and minerals. * Columbia – applies to polymetallic concentrates. The list of products shown is not exhaustive. Since many products cover more than one HS6 line and the number of lines per product varies, the simple count was adjusted by dividing counts at the product level by the number of HS lines constituting each product. This adjustment removes the bias inherent in simple counts of HS6 product lines.
Source: OECD Inventory, as of June 2014.

1. RECENT DEVELOPMENTS IN THE USE OF EXPORT RESTRICTIONS IN RAW MATERIALS TRADE – 29
EXPORT RESTRICTIONS IN RAW MATERIALS TRADE: FACTS, FALLACIES AND BETTER PRACTICES © OECD 2014
Box 1.2. Examples of export tax variation according to degree of processing
Viet Nam
A multi-tiered taxation regime is applied to exports from the mining sector. The policy includes the following features. Exporters of iron ore and concentrates, the raw material in its least processed form, must pay a 40% export duty. For iron and steel scrap, the government charges a lower tax of 15-17% on shipments abroad whereas exporters of iron ingots and other semi-finished products made from alloy and non-alloy steel pay just 2%. For copper, a 30% tax must be paid for ores and concentrates, a 22% tax for copper waste and scrap and 10-20% for copper that is semi-processed (copper mates, etc.). For other materials including nickel, cobalt, aluminium, lead and zinc, the government collects a 22% tax on ores and concentrates, 22% for waste and scrap and 5-15% for semi-processed material. For molybdenum, it charges a 20% tax on ores and concentrate, a 22% tax on waste and scrap and a 5% tax on semi-processed material.
Argentina
Although not stated as the rationale for the tax structure used, Argentina’s export taxes favour exports of processed products over primary raw materials, and hence are supportive of local processing activities. Exporters pay a 10% export tax when exporting iron ores and concentrates, which falls to 5% for semi-processed items. Iron and steel waste and scrap is also taxed at 5%. The same export policy and rates are applied to the different processing stages of copper and cobalt. In the case of borates, the export of the primary natural borate and concentrate is taxed at 10% whereas the rate on borate-related chemical compounds is 5%. The 5% tax rate for waste and scrap applies to a long list of different types of metal; these metals are not taxed if exported as primary or as semi-processed materials.
Federation of Russia
The Russian Federation is one of the world’s leading exporters of wood products. In recent years the government has applied tax rates ranging from 25 to 80% on exports of raw logs (roundwood in the rough), reportedly in order to slow down the shipping of raw logs and encouraging more domestic lumber manufacturing in the Russian Federation (Hamilton, 2008). For wood in more processed form, such as sheets for veneering, a lower rate of 5% applies.
Source: OECD Inventory, as of June 2014; Hamilton (2008).
Some governments collect other kinds of export taxes. According to the OECD Inventory, four countries collected fiscal taxes or royalties on certain exported raw materials during 2009-2012: Afghanistan (rare earth elements), Colombia (polymetallic concentrates), the Dominican Republic (aluminium, chromium and other metals) and Guinea (bauxite). Two other countries imposed special surtaxes: Bolivia (many base, minor and other metals), and China (phosphates and potash).
The share of world exports subject to all types of export taxes recorded by the OECD Inventory exceeded 40% for several products: graphite (66% of world exports), tungsten (51%), thorium (49%), magnesium (45%) and barytes (41%). These are conservative estimates, since due to its methodology for screening countries the Inventory has probably not captured all export restrictions in force for each product. Moreover, since export restrictions dampen trade flows, the figures for restricted exports are lower than what they would be without the restriction.
Four agricultural bulk commodities were taxed in 2011: barley, oil seeds, soybeans and wheat. Of these, oilseeds were most frequently targeted, and the countries applying export taxes were Indonesia and the Russian Federation. This was followed by wheat with two items taxed by Ukraine. Soybeans and barley each had one restriction, imposed by the Russian Federation and Ukraine, respectively. For agricultural products, governments preferred export taxes, followed by quantitative restrictions.
3. Quantitative export restrictions
Perhaps because the multilateral rules of the WTO set strict conditions for their use, quantitative export restrictions (export prohibitions and, occasionally, export quotas) are less common. As can be seen from Table 1.5, five countries applied these measures to exports of wood products. Among the countries in the OECD dataset only China used quotas to control the export of minerals and metals in the period 2009-12. China applied these measures to 44 products (at the HS6 level) in 2012, slightly down from some 46 products in the previous three years. The products

1. RECENT DEVELOPMENTS IN THE USE OF EXPORT RESTRICTIONS IN RAW MATERIALS TRADE – 30
EXPORT RESTRICTIONS IN RAW MATERIALS TRADE: FACTS, FALLACIES AND BETTER PRACTICES © OECD 2014
cover a range of ferrous and non-ferrous base, minor and precious metals in ore, concentrate and further processed forms, and also as waste and scrap. The share of world exports subject to quantitative export restrictions was highest for antimony (50% of world exports), tungsten (45%), magnesite (44%), fire-clay (43%) and rare earths (39%).
As will be shown later, quantitative restrictions appear to be more often the instrument of choice for governments that wish to restrain the international trade of waste and scrap. This is also true for agricultural products.
Table 1.5. Industrial raw materials most frequently subject to export quotas and prohibitions, 2012
Product HS6 lines, adjusted
HS6 lines, simple count
Number of countries
Countries applying the measure
Sawnwood, coniferous 3.0 3 3 Canada, Indonesia, United States
Industrial roundwood, coniferous 2.5 5 3 Indonesia, Russia, United States
Industrial roundwood, non-coniferous tropical
2.0 4 2 Indonesia, Nigeria
Molybdenum 2.4 6 1 China
Tin 2.0 5 1 China
Antimony 2.0 3 1 China
Tungsten 1.5 4 1 China
Note: Excludes waste and scrap. The products comprise primary and semi-processed products. The list of products shown is not exhaustive. Since many products comprise more than one HS6 line and the number of lines per product varies, the simple count was adjusted by dividing counts at the product level by the number of HS lines constituting each product. This adjustment removes the bias inherent in simple counts of HS6 product lines. Source: OECD Inventory as of June 2014.
Regarding agricultural bulk commodities, Ukraine resorted to quotas in 2011 in order to restrict export of barley, maize, rye, wheat and other grain. Argentina, too, curbed wheat exports through quotas. The number of countries applying export bans was higher, and the bans affected more products. Myanmar and the Russian Federation restricted the most products. Myanmar banned exports of cotton, peanuts and rice, and export bans for maize, rye and wheat were in place in the Russian Federation, for grain flour and groats in Macedonia, for oil seeds in Belarus, for rice in Egypt, and for wheat in Moldova.
4. Other measures
Some governments use other types of instrument that restrict exports in less obvious ways. One way is to refuse reimbursement of value-added tax (VAT) on exports. Governments with VAT systems usually reimburse VAT on exports, and by denying such reimbursements, in part or in full, they make it less attractive to export a product as opposed to selling it locally. This was a tactic used by China in 2010, when the government decided to withdraw the VAT rebate for some 20 minerals and metals. According to OECD Inventory data, China has also used this policy to discourage sales abroad of agricultural products. Thus, in recent years exporters of 93 different horticultural, semi-processed and processed agricultural products at HS6 level have found their VAT rebates being cut or disappearing. The bulk of these actions occurred in 2007.
17
In some other cases, firms that wish to export specific commodities are obliged to register with government authorities. In Ghana, exporters of certain wood products reportedly must pay to obtain a registration certificate that is valid for a limited period of time. Similarly, Indonesia keeps a qualified exporters’ list for precious metals and plywood. As part of China’s extensive export control regime, MOFCOM has, for several raw materials, lists of enterprises that are allowed to export (see American Scrap Coalition, 2008, p.10-11). These practices resemble export licensing requirements.
Argentina, Indonesia and the Russian Federation appear to restrict exports by, inter alia, stipulating minimum export prices or issuing reference prices that exporters are expected to observe. In 2010 Argentina started to enforce reference export prices for a wide range of minerals

1. RECENT DEVELOPMENTS IN THE USE OF EXPORT RESTRICTIONS IN RAW MATERIALS TRADE – 31
EXPORT RESTRICTIONS IN RAW MATERIALS TRADE: FACTS, FALLACIES AND BETTER PRACTICES © OECD 2014
and metals shipped to specific countries, which it then periodically adjusted. Indonesia applies a minimum price regime for wood exports and the Russian Federation does the same for diamonds. Pakistan in 2008 and Viet Nam in 2008, 2009 and 2010 used similar measures for rice exports.
In yet other cases, firms in India are required to pay a 20% congestion surcharge for all traffic to Bangladesh and Pakistan. The government also awards mining rights preferentially to companies that use domestically sourced iron and steel, manganese and coke in their own domestic processing operations. As captive mining concessions increase their share of production, less material is available for sale on the free market, including for destinations abroad. Procedures can, by themselves, hamper or discourage export activity. The Russian Federation reportedly has in recent times designated the customs points through which certain exports must clear. This affected more than 25 countries importing items like refined copper products and iron and steel scrap from the Russian Federation.
The picture of restrictions and the resulting distortions of international trade is more complex still because the majority (34) of countries with restrictions in the OECD Inventory made use of more than one type of measure when restricting industrial raw materials exports. Over the period 2009-12, Indonesia and the Russian Federation, followed by Canada, China, and India employed the greatest variety of different measures: six different measures for Indonesia and the Russian Federation and five for India, Canada, and China, respectively. Eight other countries used three measures (Afghanistan, Belarus, Benin, Ghana, Rwanda, Thailand, Ukraine, and Uruguay) and 20 countries employed two types of measure.
1.4. Analysis by sector
As for products affected by export restrictions, two industrial sectors stand out as ones where restrictive export policies flourish: steelmaking raw materials, and metals waste and scrap. These sectors are examined more closely in this section, along with a group of non-ferrous minor metals, which merits attention because many of these metals are critical inputs for products at the technology frontier. Finally, the situation in the markets of rice and wheat is presented. The cereals markets (mainly maize, rice and wheat) comprise some of the most traded agricultural products and provide much of the caloric requirements for a large segment of the world’s population.
It is striking that, in the following sector-specific analysis, the same countries appear as both major exporters of industrial raw materials and as regular users of various kinds of export restriction for these exports. Yet it would be far too simplistic to categorise trading partners in raw materials markets as consisting of, in one camp, exporting countries that are willing to use restrictions to further domestic policy objectives but with insufficient regard for any market disruptions and artificially high prices they may cause, and in the other camp, importing countries that are passive recipients of the consequences of these policies, with little leverage over the situation either individually or (so far) collectively. As Table 1.6 shows, large exporters who make regular use of restrictions in markets for some minerals are often heavily reliant on imports of other minerals, where they may face a restricted supply due to the use of similar trade instruments by other countries. This suggests that a collective tightening of discipline concerning export restrictions for these tradeables may create surprisingly few ‘losers’, and that a multilateral consensus in this direction may be more achievable than many expect. Chapter 3 presents results from a simulation exercise that support this view.

1. RECENT DEVELOPMENTS IN THE USE OF EXPORT RESTRICTIONS IN RAW MATERIALS TRADE – 32
EXPORT RESTRICTIONS IN RAW MATERIALS TRADE: FACTS, FALLACIES AND BETTER PRACTICES © OECD 2014
Table 1.6. Industrial materials exports and imports, of selected countries using export restrictions
(million USD)
Country Export restrictions applied in 2012 Exports of
minerals (2012) Imports of
minerals (2012)
Argentina Export tax for most goods, including minerals Export licensing requirement for iron, copper and cobalt
2 223 992
China Export quota for bauxite, magnesium, molybdenum, phosphates, rare earth metals and other Export tax for copper, cobalt, iron, manganese, rare earth metals, tungsten, zinc and other Export licensing requirement for bauxite, molybdenum, phosphates, talc, thorium and tin
3 180 140 939
India Export tax for chromium, iron, manganese, mica Export licensing requirement for chromium, manganese, silica sands Captive mining policy for coke, iron and steel, and manganese
6 083 24 524
Indonesia Export prohibition for silica sands Export licensing requirement for precious metals and stones Qualified exporters list for diamonds
5 151 1 206
Kazakhstan Export tax for aluminium products 4 605 688
Russia Export tax on coke, molybdenum, tungsten and diamonds Export licensing requirement for bauxite, antimony, cobalt, copper, sulphur, tin and other Domestic market obligation for certain precious metals and diamonds Minimum export price measure for precious metals and stones
9 043 2 835
South Africa Export licensing requirement for antimony, cadmium, chromium, copper, lead, molybdenum, precious metals and other Export tax for diamonds
13 650 921
Note: Trade figures refer to the countries’ total exports and imports of all unprocessed minerals and metals surveyed for the OECD Inventory. Semi-processed minerals and metals, and metal waste and scrap, are excluded. The export restrictions and products mentioned are not exhaustive.
Source: UN Comtrade HS2007.
Iron and steel and steelmaking raw materials
Steel is one of the most widely produced industrial products in the world, with around 90 countries producing it (World Steel Association, 2013). The steelmaking sector depends heavily on a range of minerals and metals – around 18 materials (such as iron ore, coke, iron and steel scrap manganese, chromium, tin and zinc) are used as inputs for steel.
The 38 economies that imposed export restrictions on these steelmaking raw materials in both 2009 and 2012 accounted for a total of one billion metric tons of crude steel production and one billion metric tons of hot-rolled production in 2012, or 68% and 71% of the world total, respectively (OECD, 2014b). Many of these countries are either very small steel producers or have such limited production that data are not even available. There are, however, several very large producers of steel on the list, including China, India, Japan, the Russian Federation, as well as a number of medium-sized producers such as Indonesia, Kazakhstan, Malaysia, South Africa,

1. RECENT DEVELOPMENTS IN THE USE OF EXPORT RESTRICTIONS IN RAW MATERIALS TRADE – 33
EXPORT RESTRICTIONS IN RAW MATERIALS TRADE: FACTS, FALLACIES AND BETTER PRACTICES © OECD 2014
Thailand, Ukraine, the United Arab Emirates, Venezuela and Viet Nam. The actions of these larger players can strongly influence the global markets for coke, iron ore and other primary inputs. As major producers of steel, they are also among the leading countries generating steel scrap and their export policies influence global scrap prices and supply.
Figure 1.3 shows that in 2012 raw material export policies were generally more restrictive than in 2009 for iron ore, coke and ferrous scrap, the three main steelmaking raw materials that, by weight and volume, represent the vast majority of raw materials used in steel production. Developments since 2012 have led to less restrictive policies in a few cases, while in most other cases policies have become more restrictive. The OECD Inventory also monitors measures affecting trade in semi-processed ferrous metals products. Here, export restrictions appear to play a more limited role and their use fell slightly from 2009 to 2012.
Figure 1.3. Count of measures restricting exports of steelmaking inputs and iron and steel products (2009, 2012)
Note: A count of measures was made per HS6 product line. As many products comprise more than one HS6 line and the number of lines per product varies, the simple count was adjusted by dividing counts at the product level by the number of HS lines constituting each product.
Source: OECD inventory, as of June 2014.
Various types of measure are used to restrict exports of steelmaking raw materials. For iron ore, coke and ferrous scrap, the three main steelmaking raw materials, export licensing requirements have been the most frequently used measure in recent years. Such licensing requirements were applied by 20 governments on ferrous scrap exports in 2012, by five governments on their iron ore exports and by two governments on coke exports, according to the OECD Inventory data. As shown in Figure 1.4, export taxes were the next most frequent measure. In 2012, 14 countries imposed taxes on ferrous scrap exports, five countries on iron ore exports, and two countries on coke exports. Over the period surveyed, the incidence of export prohibitions for steel scrap increased noticeably.
0 5 10 15 20 25 30
Iron & steel - ferrous metals (semi-processed)
Iron & steel waste & scrap
Iron ore
Coke
2009 2012

1. RECENT DEVELOPMENTS IN THE USE OF EXPORT RESTRICTIONS IN RAW MATERIALS TRADE – 34
EXPORT RESTRICTIONS IN RAW MATERIALS TRADE: FACTS, FALLACIES AND BETTER PRACTICES © OECD 2014
Figure 1.4. Restrictions on exports of core steel making inputs in 2009-2012, by share of types of measure
Note: The calculation covers the following products: coke, iron ore, iron and steel waste and scrap and iron and steel ferrous metals (semi-processed). Based on counts adjusted for the number of lines per product.
Source: OECD Inventory, as of June 2014.
Metal waste and scrap
Export restrictions have proliferated in recent years for metal waste and scrap. This is a relatively young but fast growing industry dominated by ferrous scrap used in steel production. Exports have become extensively regulated in many regions of the world and almost the full range of secondary products is affected.
Official trade statistics are particularly sketchy for this sector. According to UN Comtrade figures, world exports of metal waste and scrap totalled 84 billion USD in 2012. Some 60% of this trade is conducted by OECD countries, and OECD countries import predominantly from other OECD countries, especially from Europe and North America, which lead the rest of the world in generating and consuming scrap and which trade freely.
Exporters in other regions, however, have increased their use of restrictions. According to the OECD Inventory data, Argentina, China, India, Morocco and four other countries introduced or tightened export controls in 2009. In 2010, twelve countries took such action, and five and seven other countries followed in 2011 and 2012, respectively. As Figure 1.5 shows, by 2012 conditions of trade had deteriorated for almost every type of metal waste and scrap. Few governments had moved to lift restrictions already in place in 2009, and exports of some 30 different types or groups of scrap were under restriction in 39 countries. Exports of ferrous waste and scrap used in steelmaking, the largest segment of the world scrap market, were restricted most often, i.e. by 34 countries. This was followed by aluminium and copper (29 countries each), lead and zinc (26), antimony and magnesium (23), and beryllium, nickel, tin, and tungsten (22). While export restraints are used almost exclusively by emerging economies and developing countries, the question of safeguarding scrap supplies for local industries is also being debated today in some developed countries.
0% 10% 20% 30% 40% 50% 60% 70% 80% 90% 100%
2012
2011
2010
2009
Export prohibition Export quota Export tax Licensing requirement Minimum export price / price reference for exports Other export measures

1. RECENT DEVELOPMENTS IN THE USE OF EXPORT RESTRICTIONS IN RAW MATERIALS TRADE – 35
EXPORT RESTRICTIONS IN RAW MATERIALS TRADE: FACTS, FALLACIES AND BETTER PRACTICES © OECD 2014
Figure 1.5. Count of measures restricting exports of metal waste and scrap (2009, 2012)
Note: A count of measures was made per HS6 product line. As some types of metal scrap comprise more than one HS6 line and the number of lines per type of scrap varies, the simple count was adjusted by dividing counts at the product level by the number of HS lines constituting each product. The figure does not show some items like Hafnium, Mica, Other ash and residues.
Source: OECD Inventory, as of June 2014.
As Figure 1.6 shows, metal waste and scrap is a sector where outright export prohibitions are gaining in importance relative to other types of measure. In fact, OECD Inventory records suggest that export prohibitions account for a much higher share of total export restrictions in this industry (8% in 2009 and 23% in 2012) than in the primary minerals and metals industry (5% in 2009 and 14% in 2012). Of course, export taxes, export license regimes and other measures, too, can make exporting prohibitively costly. In Mauritius, for example, to qualify for a scrap metal export licence a company must be Mauritian-owned, have a specific site plan, have been in the business for at least 12 months before the date of application for the license, and have undergone an inspection of its scrapyard. Moreover, the licence is valid for six months only and costs MUR 50 000 (approximately USD 1 650). These onerous conditions did not stop exports, but they plunged by 44% in 2009 when the measure was introduced.
The high and growing incidence of outright export prohibitions is confirmed for ferrous waste and scrap, which has seen trade surge from a mere 9.3 million tons in 1990 to 103 million tons in 2012 (World Steel Association, 2013). In 2012, prohibitions (mostly adopted by small exporting countries) accounted for 28% of all restrictions in place in this sector, up from 18% in 2009. This gives the wrong signals in a global market where supply is struggling to keep up with demand. An estimated 490 million tons of ferrous scrap was produced worldwide in 2011, while industry figures put world consumption at 570 million tons, up 7.6% from 2010.
18 Of the world’s leading regions
0 5 10 15 20 25 30
Antimony
Tin
Tungsten
Iron and steel
Magnesium
Molybdenum
Beryllium
Nickel
Tantalum
Copper
Cadmium
Chromium
Cobalt
Titanium
Zirconium
Manganese
Bismuth
Lead
Zinc
Aluminium
Thallium
Gold
Platinum
Silver
Arsenic, mercury, thallium
2009 2012

1. RECENT DEVELOPMENTS IN THE USE OF EXPORT RESTRICTIONS IN RAW MATERIALS TRADE – 36
EXPORT RESTRICTIONS IN RAW MATERIALS TRADE: FACTS, FALLACIES AND BETTER PRACTICES © OECD 2014
generating ferrous scrap (EU, China, United States, Japan, the Russian Federation), the Russian Federation and China have erected export tariff walls for the benefit of domestic user industries. Exports from the Russian Federation have declined significantly over the last decade. Increasing generation of scrap within China and the discouragement of its exportation are working to diminish the country’s reliance on imported steel scrap.
19 As demand from steel producers around the globe
for ferrous scrap continues to grow but trade becomes ever more regulated, global competition over access to this material will grow fiercer.
Figure 1.6. Restrictions on metal waste and scrap exports in 2009-2012, by share of types of measure
Note: Based on counts adjusted for the number of lines per product.
Source: OECD Inventory, as of June 2014.
Non-ferrous minor metals
Traditionally, the term “minor metals” denotes metals that are not traded on formal exchanges, although cobalt and molybdenum are now traded on the London Metal Exchange along with major base metals. Non-ferrous minor metals share certain other characteristics. They are often extracted as by-products of non-ferrous base metals and, compared to aluminium, copper and other major base metals, have a relatively low annual production volume but high unit value. They serve as crucial inputs for high-technology industries and their use is typically very specialised – for example, for filaments in light bulbs, electronic pastes, semi-conductors, components in mobile phones and tablets, and as alloying agents in specialty steels for the automotive and aerospace sectors. Metals such as neodymium (a rare earth element), lithium, indium and gallium are therefore also called “technology metals”. As technology progresses, new applications are found, thereby creating new supply and demand patterns, as demonstrated by the growth in renewables technology.
20
Of the 14 metals shown in Figure 1.7, which range from antimony and beryllium to titanium and zirconium, none was traded freely in 2009 and conditions deteriorated thereafter. By 2012, export restrictions had tightened for more than half the metals listed (germanium and other materials with semi-conductor properties, tungsten, cobalt, molybdenum, magnesium and tantalum). Exports from eight countries (Argentina, Bolivia, Brazil, China, India, the Russian Federation, South Africa, Viet Nam), several of which are major players in the world market, faced restraint. Four and three of the top 5 producers of antimony and tungsten, respectively, restricted their exports in 2012. This includes China, which is a leading world producer of 11 minor metals and which uses export taxes, export quotas, licensing requirements or some combination of these measures extensively across the minor metals sector.
0% 10% 20% 30% 40% 50% 60% 70% 80% 90% 100%
2012
2011
2010
2009
Export prohibition Export quota Export tax Licensing requirement Minimum export price / price reference for exports Other export measures

1. RECENT DEVELOPMENTS IN THE USE OF EXPORT RESTRICTIONS IN RAW MATERIALS TRADE – 37
EXPORT RESTRICTIONS IN RAW MATERIALS TRADE: FACTS, FALLACIES AND BETTER PRACTICES © OECD 2014
The list of products shown here is not exhaustive and, depending on the source, can include other items. The Minor Metals Trade Association, for example, covers some 34 products, including certain precious metals (ruthenium, rhodium, osmium), and chemicals and compounds such as lithium and rare earth elements. Lithium and its compounds have traditionally been used in the production of ceramics, glass and aluminum but demand growth in recent years has come from lithium batteries and applications in cell phones and other portable consumer goods, as well as in hybrid and electric vehicles. The OECD Inventory shows one country, Argentina, collecting export taxes on lithium compounds. Argentina stands out among countries imposing export restrictions because the range and number of raw materials and other products that are taxed when exported is by far the largest. Across all countries in the Inventory, export taxes and non-automatic licensing requirements are easily the dominant types of export measures employed (Figure 1.8).
Figure 1.7. Count of measures restricting exports of non-ferrous minor metals (2009, 2012)
Note: A count of measures was made per HS6 product line. As many products comprise more than one HS6 line and the number of lines per product varies, the simple count was adjusted by dividing counts at the product level by the number of HS lines constituting each product. *Refers to germanium, vanadium, gallium, hafnium, indium, niobium and rhenium.
Source: OECD Inventory, as of June 2014.
0 1 2 3 4 5 6 7
Antimony
Manganese
Germanium*
Tungsten
Cobalt
Molybdenum
Magnesium
Bismuth
Tantalum
Zirconium
Titanium
Beryllium
Cadmium
Chromium
2009 2012

1. RECENT DEVELOPMENTS IN THE USE OF EXPORT RESTRICTIONS IN RAW MATERIALS TRADE – 38
EXPORT RESTRICTIONS IN RAW MATERIALS TRADE: FACTS, FALLACIES AND BETTER PRACTICES © OECD 2014
Figure 1.8. Restrictions on non-ferrous minor metals in 2009-2012, by share of types of measure
Note: The minor metals are: antimony, beryllium, bismuth, chromium, cobalt, germanium, vanadium, gallium, hafnium, indium, niobium, magnesium, manganese, molybdenum. Titanium, tungsten, zirconium. Based on counts adjusted for the number of lines per product. Based on counts adjusted for the number of lines per product. No export prohibitions were reported for non-ferrous minor metals in 2009-2012.
Source: OECD Inventory, as of June 2014.
Rare earth metals21
are other metallic elements critical for high-technology manufacturing, ranging from wind turbines and cell phones to defence applications. Although known deposits are more dispersed around the world, China has over the last decade come to occupy a near-monopoly position at all stages of the supply chain of rare earth materials (raw ores, oxides and alloys) with the result that many countries depend critically on this source. Economic growth and consumer demand have increased the needs of China’s own manufacturing industries for these metals, prompting the government to restrict the outflow of domestic production. Export quotas have been introduced and successively tightened. In 2009, allocations were cut by 40%, followed by a further reduction in 2010. Export duties were increased for all rare earth elements. These actions, by raising export prices and placing non-Chinese downstream manufacturers at a competitive disadvantage, caused friction with trading partners and provoked concern about reliability of supply. Since then, tight supply and high prices have prompted companies around the world to restart or initiate mining and processing operations for some of the rare earth elements outside China (e.g. in Australia, United States).
Other industrial raw materials
Precious metals and stones, and wood, are other sectors affected by export restrictions. In the case of gold and other precious metals, restrictions are mostly applied to already processed products, whereas restrictions affect diamonds only when traded in their raw form. In total, 13 countries applied restrictions in 2012, including three major producers (China for silver, and the Russian Federation and South Africa for diamonds and precious metals).
Eleven of the 21 countries surveyed by the OECD Inventory for wood products applied restrictions. These consisted mostly of non-automatic licensing requirements but also outright export bans, applied to industrial roundwood (i.e. logs) and/or sawnwood and veneer. All the countries surveyed are leading world producers of the respective categories of roundwood and semi-processed products of interest (sawnwood, plywood, veneer). With the exception of Indonesia, which expanded the range of wood products subject to export controls, the governments of the countries surveyed did not change their policies between 2009 and 2012.
0% 10% 20% 30% 40% 50% 60% 70% 80% 90% 100%
2012
2011
2010
2009
Export quota Export tax Licensing requirement Minimum export price / price reference for exports Other export measures

1. RECENT DEVELOPMENTS IN THE USE OF EXPORT RESTRICTIONS IN RAW MATERIALS TRADE – 39
EXPORT RESTRICTIONS IN RAW MATERIALS TRADE: FACTS, FALLACIES AND BETTER PRACTICES © OECD 2014
Agricultural and food products: Rice and wheat22
Agro-food products are produced and consumed throughout the world, but many countries do not produce enough to feed their populations due to climatic and other resource constraints. Rice and wheat are crucial for human survival, providing many of the calories consumed in the developing world while also being among the key targeted commodities for export restrictions. About 89 countries produce rice and 75 countries produce wheat, whereas rice is a staple food in 116 countries and wheat, in 119 countries. Countries that either do not produce them at all, or do not produce enough at competitive prices, rely on the international market to satisfy domestic needs.
(a) Rice
More countries applied a larger variety of export restrictions for rice between 2007 and 2008 than in the other years covered by the inventory. During this period, eight (Argentina, China, Egypt, India, Indonesia, Myanmar, Pakistan and Viet Nam) of the 16 countries had export restrictions in place. Four countries (Argentina, China, Egypt and Viet Nam) taxed rice exports and four (Egypt, India, Myanmar, and Viet Nam) banned them. Three of the four countries imposing export bans had other measures in effect as well. Licensing requirements and minimum export price provisions were also in force. By 2010, five countries still had active export restrictions. Egypt and India imposed quotas and bans, while Argentina continued to impose export taxes on agricultural commodities. Viet Nam maintained its minimum export price policy, first introduced in 2008, while China and Indonesia continued their export license requirement. In 2011, only four countries were actively restricting their rice exports. Argentina continued its export tax, Egypt its export ban and China its export license while Myanmar introduced an export ban.
Export supply of rice is highly concentrated. In 2008, 35 countries exported some of their production but the top five exporters provided 78% of the total and the leading ten exporters supplied 92% of the market. Three of the eight countries restricting their rice exports in 2008 (Viet Nam, Pakistan and India) were among the top five exporters and two more (Myanmar and China) were among the top ten leading exporters (Box 1.3). Total rice exports in 2008 fell below the 2007 level by some 2.5 million tons.
It is not clear, however, that the entire shortfall in exports relative to 2007 was a result of the export restrictions. The largest rice exporter in 2008, Thailand, did not adopt export restrictive policies, yet its exports were 1.4 million tons below 2007 levels, while exports from Viet Nam, the second leading exporter and Myanmar, the sixth largest exporter, both with export restrictive measures, were some 1.3 million tons and 500 thousand tons, respectively, higher than in 2007. Exports from India, the fifth largest exporter, contributed the most to the export shortfall with exports almost 2.6 million tons below 2007 levels.
Box 1.3. Export measures in the rice markets in 2008
In 2008, a total of eight countries imposed measures to restrain their rice exports, with China, Egypt, Indonesia, the Republic of the Union of Myanmar and Pakistan joining three countries (Argentina, India and Viet Nam) that imposed restrictions in 2007. Argentina continued imposing a 10% export tax and India continued banning exports conditional on a minimum export price, but exempting some countries with country-specific quotas. China imposed an export tax of 5% while Viet Nam changed the export ban initiated in July 2007 to, initially an export quota of 4.5 million tons and a minimum export price which was later switched to a variable export tax from USD 30/ton to USD 175/ton, depending upon the free on board (fob) price. Egypt initially imposed an export tax of Egyptian pounds 300/ton but subsequently banned all exports, while in Pakistan’s case, a minimum export price ranging from USD 750/ton to USD 1 500/ton depending on the variety was established. In May 2008, Myanmar temporarily banned exports of rice until November of 2008. Indonesia, although a large net importer, imposed licensing requirements on exporters.

1. RECENT DEVELOPMENTS IN THE USE OF EXPORT RESTRICTIONS IN RAW MATERIALS TRADE – 40
EXPORT RESTRICTIONS IN RAW MATERIALS TRADE: FACTS, FALLACIES AND BETTER PRACTICES © OECD 2014
(b) Wheat
2008 saw a higher incidence of export restrictions also for wheat (Box 1.4). In 2008, 61 countries supplied surplus wheat to the international market. However, as is the case for rice, the international wheat market is highly concentrated, with the top five exporting countries supplying 73% of the world’s import demand, and the ten leading exporters providing 94% of the total. Eight countries imposed export restrictions on wheat. Of these five (Argentina, Kazakhstan, Pakistan, the Russian Federation and Ukraine) were among the ten leading exporters in 2008 while China dropped out of the top ten in 2008 as exports were 2.1 million tons below 2007 level. Exports were below 2007 levels also in Argentina (4.4 million tons) and Kazakhstan (1.8 million tons). But exports from the Russian Federation (5.8 million tons) and Ukraine (11.8 million tons) were above 2007 levels. Overall then, despite a higher incidence of restrictions in 2008 compared to 2007, total exports in 2008 were still more than 27 million tons above 2007 levels.
The main instruments that countries used to restrict wheat exports during the period 2007-2011 were export taxes, quotas and outright bans. In 2008, the year with the highest number of recorded restrictions, eight countries imposed either an export tax or banned exports altogether. China and Argentina applied quota restrictions to exports on certain wheat products. The situation relaxed in 2009 but then deteriorated again in 2010. While in 2009 existing export prohibitions were discontinued and no new bans were introduced, three countries – India, Pakistan and the Russian Federation – resorted to these measures in 2010. Pakistan and Ukraine applied export quotas, and wheat exports from Egypt could only leave from a single port. In 2010, the only country that used export taxes was Argentina.
Box 1.4. Export restrictive measures in the wheat markets in 2008
Eight countries imposed various restrictions on their wheat exports in 2008. India continued its export ban initiated in 2007. Wheat exports were also banned by Kazakhstan, Pakistan and the Russian Federation. Argentina changed its export tax to a variable rate based on government-issued formulae. This was later revised to a fixed rate of 23% or 28% depending on the variety. An export quota of 4.4 million tons was also fixed. China set an export tax of 20%, while the Kyrgyz Republic, albeit a net wheat importer, set an export tax of local currency (soms) 15/kg and Ukraine continued the 3 million ton export quota initiated in 2007. Most of these policies were relatively short term. By 2009, only three countries still had export restrictions for wheat. China first lowered its export tax to 3% and then eliminated it, replacing it by an export license requirement. India replaced its export ban with an export quota of 900 thousand tons with an additional 300 thousand tons allocated to three specific firms, and Argentina continued its export tax and export license requirement.
1.5. The policy context of export restrictions
Why do governments use export restrictions?
When governments restrict exports, they have specific policy objectives in mind. Although not all governments publicly articulate the reason for their actions and the OECD Inventory has gaps in its records, the information available there shows that the justifications offered are very diverse. This holds especially for the measures affecting industrial raw materials.
Whatever the rationale given, it does not appear to depend on the type of mineral. At the same time, the reasons given for restricting the same mineral can vary widely over countries. Agricultural commodities are different: food security and the fight against inflation are very frequently cited policy objectives and are specific to export restrictions in this sector.
As might be expected, a prime motive cited by countries for the use of export taxes is their capacity to generate revenue. But export taxes are at times also justified as being essential to conserve natural resources or to promote downstream processing or value-adding at home. Non-automatic licensing requirements have the widest range of cited objectives, with control of illegal export activity and promotion or protection of local processing/value addition heading the list.

1. RECENT DEVELOPMENTS IN THE USE OF EXPORT RESTRICTIONS IN RAW MATERIALS TRADE – 41
EXPORT RESTRICTIONS IN RAW MATERIALS TRADE: FACTS, FALLACIES AND BETTER PRACTICES © OECD 2014
A high proportion of the exports of developing countries are concentrated in primary, unprocessed commodities. These countries want to add more value to production and export. Advancing to higher stages of processing is advantageous because prices of processed products usually are higher and do not fluctuate as much as primary commodities, processed products can be used locally as well as exported, the local workforce acquires new skills and more links are created with other sectors of the economy.
23 As Table 1.7 shows, export restrictions are often
intended to promote processing and value addition at home or reserve domestic supply (including food supplies) for local consumption. However, precisely because export restrictions lower the domestic price relative to the world market price and act as an indirect subsidy for downstream industries, they have been criticised for artificially protecting domestic raw material-using industries against foreign competition.
24 Whether downstream industries actually become successful players
in the domestic or global marketplace because of export restrictions is a matter of empirical study.
Some governments justify export taxes by their need to generate revenue. For developing countries, and the least-developed countries in particular, it is often easier to raise revenue by collecting a tax at the border than through income and other taxes (Piermartini, 2004, p.14). For some cases where government revenue is one of the stated reasons for export taxes, Table 1.8 shows information about user countries’ income, how much the taxes collected on exports actually contribute to total tax revenue and how much taxes on exports and imports combined contribute to central government revenues. In a few countries export taxes appear to have earned very little for the government. Evidence across countries also shows that tax rates are unrelated to income level: the poorest countries do not levy the highest rates.
Other reasons that are evoked less often for the use of export restrictions on metals, minerals or wood are the aim to conserve natural resources, to protect human health or the natural environment. In such cases, the measure mostly takes the form of non-automatic licensing requirements.
With respect to metal waste and scrap, rising scrap prices over the last decade have caused rampant theft and smuggling, including across borders. Global demand for secondary material has also risen sharply, driven by steelmaking, which increasingly relies on scrap material. In many cases where governments took steps to regulate the export activities in this sector, the stated objective was to prevent theft and sales abroad of material that has been acquired illegally or to ensure availability of secondary material for local user industries.
The information available for export restrictions applied to agricultural commodities shows that some of the reasons for adopting these measures coincide with those provided for raw materials, with some countries giving the same rationale for restrictions on both (see Table 1.7). However, as agricultural goods are essential for human survival, some countries cited the need to ensure food security for their population. Domestic price stability and curbing food price inflation during periods of rising international prices are also cited for this sector only. Food expenditure in developing and low-income countries takes a large share of household income and rising prices create social and political pressures. Hence, concerns about supply and price stability, food price inflation and food security were the most frequent rationales governments cited for restrictive action(s), where this information was available.
Motives given for export restrictions do not differ markedly according to the processing stage of the product, although promotion of domestic value addition and natural resource conservation seem to motivate export restrictions for semi-processed goods somewhat more than for primary commodities.

1. RECENT DEVELOPMENTS IN THE USE OF EXPORT RESTRICTIONS IN RAW MATERIALS TRADE – 42
EXPORT RESTRICTIONS IN RAW MATERIALS TRADE: FACTS, FALLACIES AND BETTER PRACTICES © OECD 2014
Table 1.7. Justifications for export restrictions
Control foreign exchange Protect local industry
Philippines Kazakhstan
Ukraine Malaysia
Viet Nam Rwanda
Generate revenue Promote or protect further processing/value added
Argentina Argentina
Azerbaijan India
Belarus Indonesia
Benin South Africa
Namibia Zambia
Philippines Zimbabwe
Sierra Leone Production considered strategic for the economy
Syria Mauritius
Ukraine Food security*
Conserve natural resources Indonesia*
Australia** Kyrgyz Republic*
China* Ukraine*
Ghana** Viet Nam*
India Safeguard domestic supply
Indonesia Argentina*
Thailand Canada**
United States ** Egypt*
Protect health and/or the environment Former Yugoslav Republic of Macedonia*
China India
India Malaysia
Indonesia Republic of Moldova*
South Africa Republic of the Union of Myanmar*
Malaysia Nigeria**
Fight inflation and stabilise domestic prices* Paraguay
Argentina* South Africa
Egypt* Thailand
Republic of the Union of Myanmar* Uruguay
Monitor / control export activity Viet Nam
Afghanistan Other***
Argentina Brazil
China China
Fiji India
Ghana Tajikistan
Indonesia
Philippines
Ukraine
Viet Nam
Note: Industrial raw materials: Restrictions on exports of metal waste and scrap are not taken into account. * The measure relates to agricultural commodity exports. ** The measure relates only to wood products. ***Other = e.g. reduce congestion, chemical that directly or indirectly may be designated to elaborate illicit narcotics, psychotropics or cause physical dependence, public interest not further defined, implementation of the 2006 Softwood Lumber Agreement between Canada and the United States, national security. Measures recorded as having been eliminated during 2009-12 for industrial raw materials, and during 2007-11 for agricultural commodities, are included.
Source: OECD Inventory, as of June 2014.

1. RECENT DEVELOPMENTS IN THE USE OF EXPORT RESTRICTIONS IN RAW MATERIALS TRADE – 43
EXPORT RESTRICTIONS IN RAW MATERIALS TRADE: FACTS, FALLACIES AND BETTER PRACTICES © OECD 2014
Table 1.8. Export taxes and government revenue
Country Level of income†
Export tax/surtax/ fiscal tax‡
% of tax revenue generated by export taxes*
(2012)
% of total government revenue generated by taxes on exports and imports **(2012)
Afghanistan 1 5-15% 0.2 4.2
Argentina 3 5-40% 15.3 15.8***
Azerbaijan 3 1-2.75% n.a. 2.6
Belarus 3 50-85 EUR/ton 13.7 16
Benin 1 3% 0.1 23.4
Namibia 3 10% n.a. 14.8****
Sierra Leone 1 5-15% n.a. 9.5
Tunisia 3 90-270 TND/ton 0.1 5.9
Ukraine 2 27% 0.1 2.5
Notes: †Level of income refers to World Bank income classification as of 1 July 2013, by GNI per capita (https://wdronline.worldbank.org/worldbank/a/incomelevel). 1 = low income economies, 2= lower middle-income economies; 3 = upper middle-income economies. ‡The tax rates shown are for products surveyed by the OECD Inventory; the government may collect taxes also on exports of other products. * Taxes on exports - all levies on goods being transported out of the country or services being delivered to non-residents by residents. ** Refers to taxes on international trade, including import duties, export duties, profits of export or import monopolies, exchange profits and exchange taxes; *** Data is for 2004; **** Data is for 2011.
Sources: World Bank, World Development Indicators, as of August 2014.
Factors determining the effect of export restrictions
Export restrictions unequivocally affect countries that import from the restricting country negatively and can have significant costs also for the restricting country. The impact depends on several factors. When the restricting country is a small export supplier, the action does not affect the commodity’s price or world market supply. When individual large exporters or several producers with joint market power resort to these measures, supply on the world market falls and world market price rises. The production costs of countries sourcing their material needs abroad, and ultimately the price paid by the consumers of finished products made in these countries, rise. Chapter 2 provides a detailed analysis of the economic effects of export restrictions under different assumptions.
Measures taken by large producers capable of influencing world supply
When one or several countries that either individually or jointly command a large share of traded output impose export restrictions, foreign consumers have few alternative supply sources and will have to compete for a lower quantity of higher priced supply available on the world market. An often cited case concerns rare earth metals, overwhelmingly controlled by China. When the Chinese government decreased export quotas and increased export taxes on rare earth materials, their price on world markets skyrocketed, trading partners protested and a formal complaint against China was filed at the WTO. Another mineral where export restrictions affect a large share of global production is tungsten, where China, again, leads world production, followed at some distance by the Russian Federation, Canada and Bolivia. Jointly accounting for 91 % of world production of tungsten ores and concentrates in 2012 (some 75,000 tons), China, the Russian Federation and Bolivia all have restrictions in place on mined and semi-processed tungsten, as do other countries with very limited or no known tungsten production facilities (Dominican Republic, Grenada, Malaysia, Philippines, South Africa and Viet Nam). In 2012, the restrictions of all these countries combined affected well over 50% of world exports totalling USD 1.7 billion. Antimony is yet another mineral where three producers (Bolivia, China and the Russian Federation) together control about 90% of world production; all three had export restraints in place in 2012. With China alone accounting for half of world antimony exports in 2012 and the Russian Federation and Bolivia jointly for another 12%, their actions affected 62% of global trade of primary mined and semi-processed antimony.

1. RECENT DEVELOPMENTS IN THE USE OF EXPORT RESTRICTIONS IN RAW MATERIALS TRADE – 44
EXPORT RESTRICTIONS IN RAW MATERIALS TRADE: FACTS, FALLACIES AND BETTER PRACTICES © OECD 2014
Table 1.9. Share of world production and exports of major producer countries with restrictions in place in 2012
Product Restricting
country/countries Share of world
production Share of world
exports
% %
Products restricted by one of the top 5 producers in the world
Garnet India 48 46
Magnesite China 65 44
Rare earths* (oxides) China 91 41
Vanadium China 53 36
Vermiculite China ^22 26
Fluorspar China 62 24
Nickel Russia 14 16
Sulphur Russia 10 14
Phosphates China 44 13
Molybdenum China 42 10
Wheat Russia 6 9
Titanium China (ilmenite) 10 8
Maize Ukraine 2 7
Zirconium China 2 4
Products restricted by two of the top 5 producers in the world
Graphite China, India 92 66
Barytes China, India 63 62
Talc China, India 44 43
Chromium India, South Africa 56 40
Alumina + Aluminium China, Russia 46 23
Barley Russia, Ukraine 12 22
Cobalt China, Russia 7 20
Coke China, Russia n.a. 20
Rye Russia, Ukraine 12 19
Products restricted by 3 or more of the top 5 producers in the world
Magnesium Brazil, China, Russia 92 68
Antimony Bolivia, China, Russia 90 62
Industrial roundwood (coniferous) Canada, Russia, United States 46 57
Tungsten Bolivia, China, Russia 91 42
Industrial roundwood (non-coniferous, tropical) Indonesia, India, Malaysia 47 32
Industrial roundwood (non-coniferous, non-tropical) Australia, Canada, United States 48 28
Manganese China, India, Gabon 36 ^^13
Note: Products are shown ranked by share of world exports (last column). The table reflects the situation of 2012 for industrial raw materials and 2011 for primary bulk commodities. With the exception of rare earth oxides, vanadium, alumina and aluminium and a few other metals, production data for minerals are for ores and concentrates. Export data include unprocessed and semi-processed materials. A few products, such as mica, tantalum and coking coal, are omitted because of missing or highly unreliable production or trade statistics. * In 2009 only three countries were found to produce this product, and those three countries are surveyed by the Inventory for export restrictions. A country may produce only a small amount of a product but still rank among the global top 5 producers, or it may account for a much higher share of world exports than its share in global production. For methodological issues related to the OECD datasets, the agricultural commodities listed may not be exhaustive. ^ Figure is for 2011. ^^ Export data not available for Gabon. n.a - Not available.
Sources: OECD Inventory, as of June 2014; US Geological Survey; British Geological Survey. For agricultural products – FAOSTAT. For wood – FAO (2014); ITTO, Annual Review Statistics Database; UN Comtrade.

1. RECENT DEVELOPMENTS IN THE USE OF EXPORT RESTRICTIONS IN RAW MATERIALS TRADE – 45
EXPORT RESTRICTIONS IN RAW MATERIALS TRADE: FACTS, FALLACIES AND BETTER PRACTICES © OECD 2014
Table 1.9 identifies other cases where countries from among the top five producers and using export restrictions in 2012 were large exporters. Their share of global export supply is high in the presence of restrictions and would probably be higher without them. The actions of these countries must have had a discernible effect on world supply and prices. Three countries (China, India and the Russian Federation) stand out in the list because they occur so often. Across all 29 products or product groups shown, China has the most restrictions (18 products). The second most often represented country is the Russian Federation (12 products), and then India (7 products). Other major producers with export restrictions were Bolivia, Brazil, Gabon, South Africa and Ukraine for certain minerals and bulk agricultural commodities and Australia, Canada, Indonesia, Malaysia and United States for wood.
Some measure of the restrictiveness of export taxes
This section focuses on taxes, because the effects of other measures are either self-evident (by definition, export prohibitions ban exports), hard to assess from the data in the OECD Inventory (export licensing requirements and their administration are most often not explained) or the measure is little used (export quotas were used only by China for minerals, metals, waste and scrap, and only by Ukraine and Argentina for certain agricultural bulk commodities).
Export taxes (including fiscal taxes and surtaxes) account for one third of export restrictions on raw materials in 2012 and 16% of restrictions on agriculture products in 2011. In 2012, 86% of the export taxes on minerals and metals were in ad valorem terms. In contrast, three countries imposed export taxes on agricultural products in 2011, the last year for which OECD Inventory data are available, of which only 45% were ad valorem taxes, 29% were specific tax rates, the rest being a mix of the two.
Ad valorem export tax data for industrial raw materials available in the OECD Inventory were examined in order to gauge the heights of the tax walls, which determine the trade effect.
The range and average tax rates for individual products are shown in Figure 1.9. Between 2009 and 2012, less than 3% of ad valorem taxes on metals and minerals were so-called “nuisance” taxes, a term that has been used to refer to (generally import) tariffs of 3% or less that are considered more difficult to implement and collect than actually distorting.
25 Likewise, all
ad valorem export tax rates on agriculture products (not shown) exceed this level in the same period. This means that most of these taxes are expected to raise the export prices of the affected products enough to discourage or even prevent overseas sales.
Export taxes are high also in comparison with import tariffs on industrial raw materials, which averaged 3.2% in 2012 and their processed products, which faced an average import tariff of 4.6%.
26 The average ad valorem export tax for minerals and metals was 10.9 % in 2012.
Unprocessed products had a trade-weighted average tax rate of 8.6% compared to 11.8% of semi-processed items. At the product level, the relationship holds for certain products. For iron and steel, for example, the average tax rate of iron ore (12.8%) is lower than that of semi-processed iron and steel (15.1%). However, for others, antimony, cobalt and copper for example, the higher average tax rate is on the unprocessed form.
By contrast, the maximum tax rates were consistently higher for raw metals and minerals than for the same materials after some processing. For example, the highest tax rate of unprocessed antimony, cobalt, copper and zinc were 20%, 20%, 30%, and 20%, respectively, but in a semi-processed form these same metals had maximum rates of 12.5%, 10%, 21%, and 15%, respectively.
Exports of waste and scrap products also are taxed at trade-distorting levels (not shown here). Compared to minerals and metals, export taxes on waste and scrap have less variation, both in terms of the range as well as the average tax rate applicable. The average export tax rates for waste and scrap products was around 11%, with aluminium and copper scrap each having the widest ranges, of 5%-50%.

1. RECENT DEVELOPMENTS IN THE USE OF EXPORT RESTRICTIONS IN RAW MATERIALS TRADE – 46
EXPORT RESTRICTIONS IN RAW MATERIALS TRADE: FACTS, FALLACIES AND BETTER PRACTICES © OECD 2014
Figure 1.9. Rates of export taxes for select minerals and metals
a. 2012 Export taxes for unprocessed minerals and metals
b. 2012 Export taxes for semi- processed minerals and metals
Note: Numbers in brackets next to the product name are the count of restrictions within each category. Restrictions are counted at the HS6 level. Average export tax rates includes only ad valorem tariffs and are weighted using the average gross export trade from 2010-2012. If a country or product did not have trade data, the OECD average was used. The figure does not include fiscal or export surtax. Export taxes not in force for the entire year were also weighted by the number of days in effect. Only export taxes greater than 0 are included in the averages.
* Gold” includes gold, platinum, iridium, osmium, palladium, rhodium, and ruthenium.
** “Niobium” includes niobium, tantalum, and vanadium.
*** Iridium, osmium, ruthenium.
Source: OECD Inventory of Restrictions on Exports of Raw Materials, UN Comtrade.
Range Weighted Average
0
5
10
15
20
25
30
35
40
45
0
5
10
15
20
25
30

1. RECENT DEVELOPMENTS IN THE USE OF EXPORT RESTRICTIONS IN RAW MATERIALS TRADE – 47
EXPORT RESTRICTIONS IN RAW MATERIALS TRADE: FACTS, FALLACIES AND BETTER PRACTICES © OECD 2014
The bandwagon phenomenon
Export measures may promise benefits to the downstream industry. However, this would appear to have a chance only if a given restriction is imposed without evoking similar policies in other countries. Experience shows that export controls can trigger similar actions in other supplier countries, driving up prices further, making price volatility worse, and creating a crisis of confidence that spreads from one resource to the next. Examples of markets where “snowball-like” rounds of increasingly tighter export restrictions choking global trade flows appear to have occurred in recent year are:
In 2010, in addition to restrictive export policies for copper waste and scrap already being in place in China, India and Viet Nam (the only country adjusting export barriers downward - by cutting its export tax from 37% to 33% that year), several other countries moved to discourage or prevent shipments of this product abroad. In January, Belarus reportedly introduced an export quota for copper scrap alongside an export licencing requirement for copper-containing ash and residues. In April, Guyana banned export of copper scrap and, three months later, Kenya, Rwanda, Tanzania and Uganda took the same action. Finally, Afghanistan imposed a tax on exports of copper scrap in July 2010.
In 2008, China introduced an export tax of 5%, Egypt introduced a specific export tax of 300 Egyptian pounds per ton but subsequently banned all exports, India imposed an export ban (conditional on a minimum export price and country-specific quotas), Myanmar imposed an export ban, Indonesia required export licenses, Pakistan imposed a minimum export price and Viet Nam imposed a minimum export price coupled with an export quota which was subsequently replaced by a variable export tax ranging from USD 30/ton to USD 175/ton, depending on the FOB price.
In 2008, Argentina imposed a variable export tax on wheat, which was later converted to either 28% or 23%, depending on the wheat variety, as well as an export quota. Ukraine also imposed an export quota, while China and the Kyrgyz Republic imposed export taxes of 20% and 15 Kyrgyzstani som per kg, respectively. Export bans were imposed by India, Kazakhstan, Pakistan and Russian Federation.
While RTAs, especially those concluded more recently, have made headway in circumscribing the use of export restrictions, this is not always the case. RTAs can create momentum leading in the opposite direction, when one member manages to persuade its other RTA partners to join forces and adopt a common restrictive stance. This appears to have happened in 2010 when all five members of the East African Community moved to ban shipments of many types of metal scrap destined for third markets.
Practices adding to uncertainty in markets
Lack of transparency in the use of export restrictions, evidenced by the relative paucity of information published on governmental websites and the fact that not all measures are notified to the WTO, is one factor creating uncertainty for markets and trading partners. Another factor is specific to export restrictions in the agro-food sector: most of the restrictions recorded between 2007 and 2011 were temporary, with many lasting less than a year. These measures create market confusion and uncertainty because they were often announced suddenly with no clear indication of how long they would last.
Ad hoc policy changes also render the business environment uncertain. The OECD Inventory shows that governments sometimes adjust their export policies from one year to the next and that, in some cases, this occurs within an even shorter period of time.

1. RECENT DEVELOPMENTS IN THE USE OF EXPORT RESTRICTIONS IN RAW MATERIALS TRADE – 48
EXPORT RESTRICTIONS IN RAW MATERIALS TRADE: FACTS, FALLACIES AND BETTER PRACTICES © OECD 2014
For example:
India adjusted its distance-based charge for iron ore transport (intended for other than domestic consumption) four times in 2010 and at somewhat longer time intervals in the following years.
China repeatedly tightened its regime of export quotas over the years and reportedly not always with advance notice to trading partners. For coke, where China is the world’s largest producer, export quotas were tightened starting in 2004 and this process continued over the course of subsequent years. For example, allocations of 12 million tons in place in 2008 were cut in 2009 to 11,910,000 metric tons, then reduced further, to 9,000,913 tons in 2010 and to 8,419,249 tons in 2011. Along with the export quota, China introduced an export tax on coke in 2006, which it subsequently also raised several times.
27
At the beginning of 2009, Indonesian exporters of furnishing material consisting of varieties of rattan had to pay a 15% or 20% export tax, depending on the variety, which the government replaced in July 2009 by export quotas whose allocation varied according to the type of rattan. These quotas were subsequently replaced by an export ban, which in turn was replaced in December 2009 by export taxes.
In March 2008, Egypt imposed a specific export tax of Egyptian pounds 300/t on the exportation of various rice varieties. In April, the tax was replaced by a ban, scheduled to expire in October but then extended to April 2009. In July 2009, this ban was replaced by an export tax of Egyptian pound 2 000/t, which was replaced by another ban in October 2009. Although the ban was scheduled to end in October 2010, in January 2010 the authorities opened an export quota. Another quota followed in September but in the same month another export ban was decreed, scheduled to expire in October 2011.
Preferential arrangements and other exemptions
Distortions are introduced in international trade when countries apply trade policies in a discriminatory manner. When governments apply export restrictions, do they observe the WTO’s fundamental principles of non-discrimination?
From the limited information available in the OECD Inventory, export restrictions are not always applied even-handedly. There are two kinds of preferential approach. Sometimes governments exempt or apply special rules for specific firms or types of market actors, such as state enterprises. The other approach involves granting exemptions from export restrictions to certain trading partners, such as other parties belonging to a shared regional trade agreement (RTA). The Russian Federation reportedly does not apply restrictions to Belarus and Kazakhstan, with which it shares a custom union. Similarly, members of the Eurasian Economic Community are reported to be exempted from Kazakhstan’s export restrictions for aluminium, copper, iron and steel. Trade between members of the West African Economic and Monetary Union (UEMOA) is excluded from (unverified) export restrictions that the Inventory reports for Senegal.
Exemptions from export restrictions or differential treatment of trading partners appear to be more common for agricultural products. When India banned rice exports in 2008, the Russian Federation and the Maldives were exempted and country-specific quotas were allocated to Madagascar, Comoros, Mauritius, Sierra Leone and Bangladesh. Similarly, an export ban for dried beans and other products in 2008 excluded the Maldives, and when Argentina banned wheat exports in 2007, up to 100,000 tons destined for Brazil were exempted. China too, in 2007, provided specific export quotas for various live animals destined for its autonomous regions of Hong Kong, China and Macao, China. Such differential treatment can compound the distortions that export restrictions introduce in the international market.
Today, the vast majority of countries belong to at least one regional trade agreement. Chapter 5 of this volume presents evidence on how over the last decade a number of regional and bilateral free-trade initiatives have explicitly included export restrictions on their negotiating agenda,
1. RECENT DEVELOPMENTS IN THE USE OF EXPORT RESTRICTIONS IN RAW MATERIALS TRADE – 49
EXPORT RESTRICTIONS IN RAW MATERIALS TRADE: FACTS, FALLACIES AND BETTER PRACTICES © OECD 2014
leading to some tightening of conditions on their use vis-à-vis other parties to these RTAs. Unfortunately, when governments notify or publish information about restrictions planned or in force, they seldom state whether and how their RTA participation affects their use of these measures. Hence, the OECD Inventory contains little information on this and cannot be used to verify how common the preferential practices described here are.
1.6. Conclusions
This chapter has provided evidence that export restrictions are widely used in some sectors and that usage has risen in recent years. Data collected by the OECD for many countries and many industrial and agricultural raw materials shows that from 2007 to 2012 various temporary and longer-term export restrictions have been applied to raw material products, which has undoubtedly affected a sizeable share of world export supply. The extent of the disruptions that can be inferred from the evidence presented on the use of restrictions is probably under-estimated because we only report ex post (i.e. with-restriction) export performance, and because the OECD Inventory dataset does not capture the whole universe of export restrictions. Because of the specific methodology used for collecting information for the OECD Inventory in the industrial raw materials sector, not all countries included in the survey are surveyed for each of the 80 different primary minerals, metals and wood products. As a result, the full scope of industrial raw materials subject to export restrictions in a country is not known. This is not the case for agricultural products, where the Inventory captures the policies of a more limited number of countries and only a subgroup of products was included in this chapter’s analysis.
This chapter has not tried to measure the economic impact of the measures reported. Instead, it prepares the ground for such work by documenting relevant features of measures and product markets, such as the degree of export concentration, the magnitude of export tax rates across products and the structure of taxes along the continuum from unprocessed to semi-processed raw materials. The chapter also discusses the diverse rationales stated by governments for their use of export restrictions. Some convergence can be seen among export tax-using countries around the objectives of revenue collection and promoting food security in the case of restrictions on agricultural exports, but the otherwise large differences between countries raise questions about whether export restrictions can be effective first-best or even second-best instruments for achieving such heterogeneous objectives.
Seen against the achievements of the rules-based multilateral trading system in lowering and controlling import barriers, the spread of export restrictions is a worrying development. Equally disconcerting is their lack of transparency, which the OECD Inventory is helping to remedy. As this chapter has demonstrated, there remain many gaps in our knowledge about the use of these instruments. Trade itself is inevitably affected by the measures, but it also matters how these measures are being applied. For example, little is known about the consistency and even-handedness with which government agencies administer export licenses. This is one of many aspects of export restrictions that merit further research.
Notes
1. Barbara Fliess is a Senior Trade Policy Analyst, Christine Arriola is a Statistician and Peter Liapis is a Senior Agricultural Policy Analyst in the OECD’s Trade and Agriculture Directorate. The authors would like to thank Jane Korinek and the Working Party of the OECD Trade Committee for very helpful comments on earlier versions of this chapter.
2. See for example US Department of Energy (2010), Commission of the European Communities (2008), Japan METI (2008), House of Commons, Science and Technology Committee (2011).
3. Unless otherwise stated, the import and export figures presented in this chapter do not include intra-EU trade. “Exports” include re-exports of a product. Similarly “imports” include re-imports.

1. RECENT DEVELOPMENTS IN THE USE OF EXPORT RESTRICTIONS IN RAW MATERIALS TRADE – 50
EXPORT RESTRICTIONS IN RAW MATERIALS TRADE: FACTS, FALLACIES AND BETTER PRACTICES © OECD 2014
4. For another empirical examination of how trade measures like export restrictions affected world markets, with a focus on the 2005-8 surges in world agricultural prices, see Martin and Anderson (2012).
5. In 2011, the United States, European Union and Mexico won a WTO case against China on its export quotas on nine industrial raw materials. China's appeal to the WTO appellate body was rejected, and it subsequently removed its export restrictions on these materials. A second case challenging China's use of export quotas and tariffs for rare earths, molybdenum and tungsten as an industrial policy tool consistent with WTO rules was brought against China in 2012. In August 2014 the WTO Appellate Body confirmed that China’s export restrictions on rare earth as well as tungsten and molybdenum were in breach of WTO rules.
6. Export restrictions are recorded at the HS6 level of product classification, along with qualitative information about the legal basis for the measure, introduction and ending dates (where applicable), the agency in charge, implementation procedures, and references with links to official sources of information about the measure. The Inventory and a methodological note explaining how the data were collected are available at: http://www.oecd.org/tad/benefitlib/export-restrictions-raw-materials.htm.
7. The industrial raw materials surveyed by the OECD Inventory and discussed in this Chapter comprise the following chapters of the Harmonised System (HS 2007): (1) Minerals and metals: ferrous metals (HS 72), non-ferrous metals (base metals HS 74-80, minor metals HS 81), metal ores and minerals HS 25-26, excl. 2620, chemicals and compounds HS28; (2) Metal waste and scrap HS 72-81, 2620, 252530; and (3) Wood consists of subheadings of HS 44. Primary (unprocessed) forms of materials refer to metal ores and minerals (HS codes from the chapters HS 25 and HS 26), semi-processed forms belong to HS chapters HS 71-72, HS 74-76, HS 78-81, except diamonds.
8. Chapter 4 of this volume provides more comprehensive analysis of the Inventory’s information on agricultural commodities.
9. Examples are the Basel Convention on the Control of Trans-boundary Movements of Hazardous Wastes and their Disposal, the Convention on International Trade in Endangered Species of Wild Fauna and Flora (CITES) and the Kimberley Process.
10. Primary bulk products (e.g. wheat and rice), horticultural products (e.g. fruit and vegetables), semi-processed products (e.g. vegetable oils) and processed products.
11. Intra-OECD trade includes trade between EU members that are part of the OECD.
12. This is a minimum value since the OECD Inventory is not an exhaustive survey of all producers and all products.
13. In compliance with the 2012 WTO rulings in China – Measures Related to the Exportation of Various Raw Materials (WT/DS394, WT/DS395, WT/DS398), the application of export duties to certain reforms of magnesium, as well as of bauxite, coke, fluorspar, manganese, silicon metal and zinc, and the export quotas for certain forms of bauxite, coke, fluorspar, silicon carbide and zinc, which were found inconsistent with the WTO rules by the Panel and the Appellate Body in these disputes, have been removed since January 2013. In August 2014, the WTO Appellate Body confirmed an earlier ruling that China’s export restrictions on rare earth, tungsten and molybdenum, were in breach of WTO rules.
14. US Geological Survey, Mineral Commodity Summaries, January 2013, p. 99.
15. US Geological Survey, Mineral Commodity Summaries, January 2013 p. 123.
16. Azerbaijan Egypt, Kuwait and Trinidad and Tobago are excluded from the count because for these countries the OECD Inventory does not have data available for the years 2009 and 2012.
17. When total Chinese exports of goods slowed down and then fell in 2008 and 2009 as a result of the global financial crisis, China reacted by initially raising VAT rebate rates for many goods, including certain steel products and semi-finished materials from minerals and metals, giving exporters higher rebates as an incentives to supply export markets rather than domestic markets. See Evenett et al. (2012).
18. 2011 consumption figures are from the Bureau of International Recycling, 2011, production figures are from the Japan Ferrous Raw Materials Association.
19. According to UN Comtrade statistics, the Russian Federation’s exports of ferrous scrap declined from 12 million tons in 2004 to just over 4 million in 2012.

1. RECENT DEVELOPMENTS IN THE USE OF EXPORT RESTRICTIONS IN RAW MATERIALS TRADE – 51
EXPORT RESTRICTIONS IN RAW MATERIALS TRADE: FACTS, FALLACIES AND BETTER PRACTICES © OECD 2014
20. This paragraph draws on information provided by the Minor Metals Trade Association. See http://www.mmta.co.uk/minor-metals.
21. “Rare earth metals” is a group of 17 chemically similar metallic elements: lanthanum, cerium, praseodymium, neodymium, promethium, samarium, europium, gadolinium, terbium, dysprosium, holmium, erbium, thulium, ytterbium, lutetium, scandium and yttrium.
22. Trade information is based on United States Department of Agriculture, Foreign Agricultural Service’s Production, Supply, and Distribution (PS&D) database. The PS&D database contains information on
important exporters, like Myanmar, not covered by UN Comtrade.
23. See Economic Commission for Africa (2004), Minerals cluster policy study in Africa: Pilot studies of South Africa and Mozambique, 2004, especially p. 29; Natural Resources Canada (1999).
24. For example, the low cost of products such as coke has been criticised for providing a cost advantage to Chinese steel industry (see OECD, 2013).
25. See WTO Glossary. http://www.wto.org/english/thewto_e/glossary_e/nuisance_tariff_e.htm.
26. These figures are trade weighted averages for import tariffs>0 and were calculated based on import tariff data in the TRAINS database.
27. For more details about these measures, see Price and Nance (2010), p. 89-90.

1. RECENT DEVELOPMENTS IN THE USE OF EXPORT RESTRICTIONS IN RAW MATERIALS TRADE – 52
EXPORT RESTRICTIONS IN RAW MATERIALS TRADE: FACTS, FALLACIES AND BETTER PRACTICES © OECD 2014
References
American Scrap Coalition (2008), Raw deal: How governmental trade barriers and subsidies are distorting global trade in raw materials. Prepared by Wiley Rein LLP, Washington, D.C., November 2008
Areddy, J.T. (2011), “China tightens its grip on rare earth”, The Wall Street Journal, 8 February 2011.
Bonarriva, J., M. Koscielski and E. Wilson (2009), Export controls: An overview of their use, economic effects, and treatment in the global trading system, Office of Industries Working Paper No. ID-23, US International Trade Commission, August 2009.
British Geological Survey (2014), World Minerals Production 2008-2012, London.
Bureau of International Recycling (2011). http://www.bir.org/.
Commission of the European Communities (2008), The Raw materials Initiative—Meeting our Critical Needs for Growth and Jobs in Europe, Communication from the Commission to the European Parliament and the Council, Brussels.
Economic Commission for Africa (2004), Minerals cluster policy study in Africa: Pilot studies of South Africa and Mozambique, 2004.
Evenett, S.J., J. Fritz and Y.C. Jing (2012), “Beyond dollar exchange rate targeting: China’s crisis-era export management regime”, Oxford Review of Economic Policy, 28(2), p. 284-300.
FAO, FAOSTAT, Rome, http://faostat.fao.org/.
FAO (2011), Food prices – From crisis to stability, 16 October, FAO, Rome.
FAO (2014), Yearbook of Forest Products 2008-2012, FAO, Rome.
Goode, W. (1998), A Dictionary of Trade Policy Terms, Centre for International Economic Studies, University of Adelaide.
Hamilton, G. (2008), “Russian export tax opens log markets for local”, Vancouver Sun, 2 May.
House of Commons, Science and Technology Committee (2011), Strategically important metals, Fifth report of session 2012-2, HC 726, 17 May, London.
ITTO (2012), Annual Review and Assessment of the World Timber Situation 2012, http://www.itto.int/annual_review/.
ITTO, Annual Review Statistics Database (updated 2014/06/30), http://www.itto.int/annual_review_output/.
Japan METI (2008), Guidelines for Securing National Resources (provisional translation), Tokyo www.meti.go.jp/english/newtopics/data/pdf/080328Guidelines.pdf. The original text in Japanese is available at http://www.mofa.go.jp/mofaj/gaiko/energy/shishin.html.
Kim, J. (2010), "Recent Trends in Export Restrictions", OECD Trade Policy Papers, No. 101, OECD Publishing, Paris, http://dx.doi.org/10.1787/5kmbjx63sl27-en.
Martin, W. and K. Anderson (2012), Export restrictions and price insulation during commodity price boom, American Journal of Agricultural Economics, Vol. 94(2), p. 422-427.
Mitra, S. and T. Josling (2009), Agricultural export restrictions: Welfare implications and trade disciplines, International Policy Council Position Paper, Agricultural and Rural Development Policy Series, January.
Natural Resources Canada, From Mineral Resources to Manufactured Products: Toward a Value-Added Mineral and Metal Strategy for Canada, Ottawa, 1999, http://publications.gc.ca/pub?id=87321&sl=0.

1. RECENT DEVELOPMENTS IN THE USE OF EXPORT RESTRICTIONS IN RAW MATERIALS TRADE – 53
EXPORT RESTRICTIONS IN RAW MATERIALS TRADE: FACTS, FALLACIES AND BETTER PRACTICES © OECD 2014
OECD (2014a), Inventory of Restrictions on Exports of Raw Materials.
http://www.oecd.org/tad/ntm/name,227284,en.htm. As of 14 June 2014.
OECD (2014b), Export restrictions of steelmaking raw materials: Examining changes in the stance of policy since 2009. DSTI/SU/SC(2014)7, 2014, Paris.
OECD (2013), Sources of trade friction in global steel markets: Selected issues for consideration
DSTI/SU/SC(2013)3, 25 June 2013.
OECD (2003), Analysis of non-tariff measures: The case of export restrictions [TAD/TC/WP(2003)7/FINAL], 4 April.
Piermartini, R. (2004), The role of export taxes in the field of primary commodities, World Trade
Organisation, Geneva.
Price, A.H. and D.S. Nance (2010), Export barriers and the steel industry, in The Economic Impact of Export Restrictions on Raw Materials, OECD Publishing, Paris, http://dx.doi.org/10.1787/9789264096448-en
Silberglitt, R., J.T. Bartis, B.G. Chow, D.L. An, K. Brady (2013), Critical materials. Present danger to U.S. manufacturing. Prepared for the National Intelligence Council. Rand Corporation. http://www.rand.org/content/dam/rand/pubs/research_reports/RR100/RR133/RAND_RR133.pdf.
Smith, Herbert (2009), Export restrictions on raw materials, WTO rules and remedies, December
2009, [mimeo].
United Nations Economic Commission for Europe, Forestry Department, Forest product statistics 2007-2011, http://www.unece.org/forests/fpm/forestproducts.html.
US Department of Agriculture, Foreign Agriculture Service, Production, Supply and Distribution, on line http://apps.fas.usda.gov/psdonline/psdQuery.aspx
US Department of Energy (2010), Critical Materials Strategy, December, Washington, D.C.
US Geological Survey (2013), Mineral Commodity Summaries, January 2013.
US Geological Survey (2012), Minerals Yearbook 2012.
World Bank, World Development Indicators, Taxes on international trade (% of revenue) and Taxes on exports (% of tax revenue), as of August 2014. Accessible at World DataBank, http://databank.worldbank.org/data/views/reports/tableview.aspx.
World Bank income classification as of 1 July 2013, by GNI per capita https://wdronline.worldbank.org/worldbank/a/incomelevel
World Steel Association (Worldsteel) (2013), Steel Statistical Yearbook 2013, Brussels https://www.worldsteel.org/dms/internetDocumentList/statistics-archive/yearbook-archive/Steel-Statistical-Yearbook-2013/document/Steel-Statistical-Yearbook-2012.pdf

54 – 1. RECENT DEVELOPMENTS IN THE USE OF EXPORT RESTRICTIONS IN RAW MATERIALS TRADE
EXPORT RESTRICTIONS IN RAW MATERIALS TRADE: FACTS, FALLACIES AND BETTER PRACTICES © OECD 2014
Annex 1.A.
Multilateral rules on export restrictions1
Export duties, taxes or other charges are not prohibited under WTO rules. Article II of the GATT on Schedules of Concessions deals with import duties and charges in connection with importation only. No mention is made of export duties and charges. Unlike import duties or tariffs, they are generally not bound and hence members can adjust them unilaterally. For new members, however, the WTO accession process may impose disciplines on export taxes (and other types of export restrictions), as was the case for China, Viet Nam and the Russian Federation. For example, in its accession agreement, China committed to eliminate all export duties except for 84 specific items (Smith, 2009). Moreover, Article I:1 of GATT provides for general most-favoured-nation treatment of exports as well as imports. The Article applies “with respect to customs duties and charges of any kind imposed on or in connection with importation or exportation…”.
Article XI of GATT 1994 explicitly prohibits quantitative export restrictions whether through quotas, import or export licenses or other measures. It states that “No prohibitions or restrictions other than duties, taxes or other charges, whether made effective through quotas, import or export licences or other measures, shall be instituted or maintained by any contracting party on the importation of any product of the territory of any other contracting party or on the exportation or sale for export of any product destined for the territory of any other contracting party.” However, Article XI also provides some exceptions to the general rule including under paragraph 2(a): “export prohibitions or restrictions temporarily applied to prevent or relieve critical shortages of foodstuffs or other products essential to the exporting contracting party”, and paragraph 2(b): “import and export prohibitions or restrictions necessary to the application of standards or regulations for the classification, grading or marketing of commodities in international trade”.
A further basis for imposing export restraints is found in Article XX, the “general exceptions” provision. Provided such measures are not applied in a manner which would constitute a means of arbitrary or unjustifiable discrimination between countries where the same conditions prevail, or a disguised restriction on international trade, members are allowed an exemption from otherwise applicable GATT disciplines in specific situations, including:
if necessary to protect human, animal or plant life or health;
to conserve exhaustible natural resources if such measures are made effective in conjunction with restrictions on domestic production or consumption;
in pursuing obligations under any intergovernmental commodity agreement which conforms to the criteria of such agreement;
to ensure that essential quantities of domestic materials are available to a domestic processing industry during periods when the domestic price of such materials is held below the world price as part of a governmental stabilization plan; provided that such restrictions do not increase the exports of or the protection afforded to such domestic industry and are not discriminatory;
if essential to the acquisition or distribution of products in general or local short supply, provided that any such measures shall be consistent with the principle that all contracting parties are entitled to an equitable share of the international supply of such products, and

1. RECENT DEVELOPMENTS IN THE USE OF EXPORT RESTRICTIONS IN RAW MATERIALS TRADE – 55
EXPORT RESTRICTIONS IN RAW MATERIALS TRADE: FACTS, FALLACIES AND BETTER PRACTICES © OECD 2014
that any such measures, which are inconsistent with the other provisions of the Agreement shall be discontinued as soon as the conditions giving rise to them have ceased to exist.
Article XIII provides that when export prohibitions or restrictions are used for goods, they must be applied on a non-discriminatory basis to all members.
Article XXI provides for the exemption of measures, including export restrictions, from the general legal obligations contained in the GATT for the purpose of national security.
Article 12 of the Uruguay Round Agreement on Agriculture (URAA) stipulates that in cases where countries institute new export prohibitions on foodstuffs in accordance with paragraph 2(a) of Article XI of GATT 1994, they must take into account the effects of such prohibitions on importing members’ food security and should give notice in writing as far in advance as practicable to the Committee on Agriculture indicating the nature and duration of the measure. Specifically, a member instituting new export prohibitions must observe the following provisions:
The member instituting the export prohibition or restriction shall give due consideration to the effects of such prohibition or restriction on importing members’ food security;
Before any member institutes an export prohibition or restriction, it shall give notice in writing, as far in advance as practicable, to the Committee on Agriculture comprising such information as the nature and the duration of such measure, and shall consult, upon request, with any other member having a substantial interest as an importer with respect to any matter related to the measure in question. The member instituting such export prohibition or restriction shall provide, upon request, such a member with necessary information.
Paragraph 2 of Article 12 of the URAA exempts developing country members from the requirement to give notice and consult, unless the measure is taken by a developing country member that is a net exporter of the specific foodstuff concerned.
Note to Annex 1.A
1. For more information about WTO rules, see Chapters 4 and 5.

56 – 1. RECENT DEVELOPMENTS IN THE USE OF EXPORT RESTRICTIONS IN RAW MATERIALS TRADE
EXPORT RESTRICTIONS IN RAW MATERIALS TRADE: FACTS, FALLACIES AND BETTER PRACTICES © OECD 2014
Annex 1.B.
Export measures defined
Export restriction Definition*
Export tax A tax collected on goods or commodities when they leave a customs territory. This tax can be set either on a per unit basis or an ad valorem (value) basis. Other terminology equivalent to export tax: export tariff, export duty, export levy, export charge. In some countries the term ‘cess’ is used.
Fiscal tax on exports A tax not paid at the border, but that only applies to, or discriminates against, goods or commodities intended for export. An example is when the sales tax that a government charges is higher for goods or commodities intended for export than when these goods or commodities are offered for sale in the domestic market. Other terminology equivalent to fiscal tax on exports: export royalty.
Export surtax A tax collected on goods or commodities when they leave a customs territory, and which is applied in addition to the normal export tax rate. It can be part of a progressive tax system or can be triggered by a price threshold, and so be of a temporary nature. Example: a USD 10 surcharge is applied on each ton of a commodity exported when the world price of this commodity exceeds USD 900/ton. Other terminology equivalent to export surtax: export surcharge.
Export quota A prescribed maximum volume of exports.
Export prohibition An absolute restriction on exports, i.e. zero exports. Other terminology equivalent to export prohibition: export ban, export embargo.
Export license/Licensing requirement
The requirement to obtain prior approval, in the form of a license, to export a good or commodity. There are two types of licensing requirements: (1) Non-automatic export licensing: Exporters must obtain prior approval, in form of a license, to export a good or commodity. This practice requires submission of an application or other documentation as a condition for being authorised to export. Export licenses are often used in conjunction with export quotas. Apart from economic reasons, licensing can be applied for non-economic reasons: national security, protection of health, safety, the environment, morality, religion, intellectual property, or compliance with international obligations. Licensing schemes can operate on the basis of product lists, such as lists of banned products or of restricted products that require licences, or be applied to restrict exports by destination (e.g. specific countries), or have other conditions attached, such as that export may be used for a specified purpose only. Other terminology equivalent to non-automatic licensing: export permit. (2) Automatic export licensing: Approval for export is granted in all cases, usually immediately upon a standardised application. This kind of measure usually only assists in the compilation of statistics, does not create burdens or extra transaction costs for exporters and is not recorded in the Inventory.
Minimum export price/price reference for exports
A minimum permitted price for a good being exported. This practice is often used in conjunction with export taxes because it can facilitate customs procedures by preventing under-invoicing, and can be used as a base for calculating export taxes. In some cases, minimum export prices are not binding but are used as reference prices. Other terminology equivalent to minimum export price: administered pricing.
Dual pricing scheme The government applies different prices to a product when it is exported than when the same product is sold in the domestic market.
VAT tax rebate reduction/withdrawal
Most countries with a VAT system will rebate the VAT on exports. By denying VAT reimbursement in whole or part, it is less advantageous to export a product than to sell it domestically. This in turn encourages exports of products produced locally that use the input to produce downstream products. A variant is the removal or reduction of rebate from other sales taxes on exports of a product.

1. RECENT DEVELOPMENTS IN THE USE OF EXPORT RESTRICTIONS IN RAW MATERIALS TRADE – 57
EXPORT RESTRICTIONS IN RAW MATERIALS TRADE: FACTS, FALLACIES AND BETTER PRACTICES © OECD 2014
Export restriction Definition*
Restriction on customs clearance point for exports
The government specifies ports/entry points through which export of a good or commodity is to be channelled.
Qualified exporters list The rights to export a certain commodity are allocated to specific companies by the government, through a process of application and registration.
Domestic market obligation (DMO)
The requirement for producers of coal and other minerals to allocate a proportion of their annual production output to the domestic market. (The term “domestic market obligation” appears to be specific to Indonesia, which introduced this measure as an integral part of production-sharing contracts to ensure that foreign contractors were also held responsible for fulfilling the domestic needs of its people.)
Captive mining When a processing company is required to own the mine that produces its inputs, or has been awarded mining rights with the intention that the company will mine the commodity for use in its own domestic processes and not trade it. Captive mining is a form of government support for firms with access to captive supplies, as well as a means of controlling the price and availability of a commodity. When captive mining concessions increase (as a share of production), exports are likely to fall.
Other export measures Measures not elsewhere specified, but which influence de jure or de facto the level or direction of exports of goods or commodities.
* Guidance for these definitions of export measures has been provided by the following: OECD (2003), p.8; Bonnariva et al. (2009), p.2 ; Kim (2010), p.6 and 12 ; Goode (1998).

58 – 1. RECENT DEVELOPMENTS IN THE USE OF EXPORT RESTRICTIONS IN RAW MATERIALS TRADE
EXPORT RESTRICTIONS IN RAW MATERIALS TRADE: FACTS, FALLACIES AND BETTER PRACTICES © OECD 2014
Annex 1.C.
OECD Inventory coverage
Countries surveyed for industrial raw materials Minerals, metals and wood products covered
Algeria India Rwanda Aluminium Lithium Vermiculite
Argentina Indonesia Saudi Arabia Antimony Magnesite Zinc
Afghanistan Iran Senegal Arsenic Magnesium Zircon
Australia Ireland Sierra Leone Asbestos Manganese
Austria Israel Slovak Rep. Barytes Mercury Rare earth elements:
Azerbaijan Italy South Africa Bauxite Mica Yttrium
Belarus Côte d’Ivoire South Korea Bentonite Molybdenum Scandium
Belgium Jamaica Spain Beryllium Nickel Cerium
Benin Japan Sri Lanka Bismuth Niobium Dysprosium
Bolivia Jordan Suriname Borates Palladium Erbium
Botswana Kazakhstan Sweden Bromine Peat Europium
Brazil Kenya Syria Cadmium Perlite Gadolinium
Canada Kuwait Tajikistan Chromium Phosphates Holmium
Cent. African Republic
Kyrgyzstan Tanzania Cobalt Pig iron Lanthanum
Chile Lesotho Thailand Coke Platinum Lutetium
China Malaysia Trinidad and Tobago
Coking coal Potash Neodymium
Chinese Taipei Mali Tunisia Copper Pumice Praseodymium
Colombia Mauritius Turkey Diamonds Rhenium Promethium
Czech Rep. Mexico Turkmenistan Feldspar Rhodium Samarium
Dem. Rep. of Congo
Mongolia Uganda Fluorspar Ruthenium/Iri-dium/Osmium
Terbium
Denmark Morocco UK Fuller’s earth Salt Thulium
Dominican Rep. Mozambique Ukraine Gallium Selenium Ytterbium
Egypt Namibia United Arab Emirates
Garnet Silica
Fiji New Caledonia Uruguay Germanium Silicon
Finland New Zealand United States Graphite Silver Scrap and waste of metal
France Nigeria Uzbekistan Gold Stone
Gabon North Korea Venezuela Guano Strontium
Gambia Norway Viet Nam Gypsum Sulphur Wood
Germany Pakistan Zambia Indium Talc Tropical logs
Ghana Paraguay Zimbabwe Iodine Tantalum Trop.sawnwood
Greece Peru Iron Tellurium Tropical plywood
Grenada Philippines Kaolin Thallium Tropical veneers
Guinea Poland Kyanite Tin Non-tropical logs
Guyana Portugal Lead Titanium Non-tropical sawnwood
Hungary Russia Lime Tungsten Non-trop. plywood
Vanadium Non-trop. veneer
Note: In bold – country was among the top 5 producers in 2009 for one or several of the raw materials (metals, minerals, wood) listed. For the
EU – top producers were identified at the level of individual EU members, but trade flows and findings are reported for the EU as a whole.

1. RECENT DEVELOPMENTS IN THE USE OF EXPORT RESTRICTIONS IN RAW MATERIALS TRADE – 59
EXPORT RESTRICTIONS IN RAW MATERIALS TRADE: FACTS, FALLACIES AND BETTER PRACTICES © OECD 2014
Countries surveyed for agricultural commodities Agricultural commodities covered
Argentina
Belarus
China
Former Yugoslav Republic of Macedonia
Egypt
India
Indonesia
Kazakhstan
Kyrgyz Republic
Moldova
Myanmar
Pakistan
Russia
Tajikistan
Ukraine
Viet Nam
All agricultural and food products as defined by the WTO. This comprises primary bulk commodities, semi-processed commodities and produce (horticultural products and processed products). Primary bulk commodities include: Coffee, tea, coffee mate, wheat, rye, barley, oats, corn, rice, sorghum, other grains, soybeans, peanuts, oilseeds, cocoa beans, tobacco, cotton, hemp.

60 – 1. RECENT DEVELOPMENTS IN THE USE OF EXPORT RESTRICTIONS IN RAW MATERIALS TRADE
EXPORT RESTRICTIONS IN RAW MATERIALS TRADE: FACTS, FALLACIES AND BETTER PRACTICES © OECD 2014
Annex 1.D.
OECD Inventory Countries using export restrictions
Country Minerals
and metals Waste
and Scrap Wood Agriculture
Afghanistan X X
Algeria X
Argentina X X
X
Australia X
Azerbaijan X X
Belarus X X X
Benin X
Bolivia X X
Brazil X X
Canada X
China X X X X
Colombia X X
Cote d'Ivoire
X
Dominican Republic X X
Egypt
X
X
Fiji X
Gabon X
Gambia X X
Ghana X X X
Grenada X
Guinea X X
Guyana X
India X X X X
Indonesia X X X X
Jamaica
X
Japan X
Kazakhstan X X
X
Kenya X
Kuwait
X
Kyrgyz Republic X
Former Yugoslav Republic of Macedonia
X
Malaysia X X X
Mali X
Mauritius X X
Moldova
X
Morocco X
Myanmar
X
Namibia X
Nigeria
X X
Pakistan X X
Paraguay X X

1. RECENT DEVELOPMENTS IN THE USE OF EXPORT RESTRICTIONS IN RAW MATERIALS TRADE – 61
EXPORT RESTRICTIONS IN RAW MATERIALS TRADE: FACTS, FALLACIES AND BETTER PRACTICES © OECD 2014
Country Minerals
and metals Waste
and Scrap Wood Agriculture
Philippines X
Russia X X X X
Rwanda X X
Senegal X
Sierra Leone X
South Africa X X
Sri Lanka X X
Syria X
Tajikistan X X X
Tanzania
X
Thailand X X
Trinidad and Tobago
X
Tunisia X
Turkmenistan X X
Uganda X X
Ukraine X X
X
United Arab Emirates X
United States
X
Uruguay X X
Venezuela
X
Viet Nam X X X
Zambia X X
Zimbabwe X
Column Totals 41 45 11 16
Note: For industrial materials records relate to the period 2009-2012. For agricultural commodities, records relate to 2007-2011.


2. ECONOMICS OF EXPORT RESTRICTIONS AS APPLIED TO INDUSTRIAL RAW MATERIALS – 63
EXPORT RESTRICTIONS IN RAW MATERIALS TRADE: FACTS, FALLACIES AND BETTER PRACTICES © OECD 2014
Chapter 2
ECONOMICS OF EXPORT RESTRICTIONS AS APPLIED TO INDUSTRIAL RAW MATERIALS
K.C. Fung and Jane Korinek1
2.1. Introduction
This chapter analyses the effects of export restrictions from a theoretical perspective, paying particular attention to the specificities of the industrial raw materials sectors.
2 Government
interventions in the industrial raw materials sectors tend to be more prevalent than in many others, and to this end, export taxes and quotas are frequently used. The main insights from this analysis can be found in the concluding section.
The literature on the economic consequences of export restrictions is quite limited, particularly compared with that on import taxes and quotas. Furthermore, much of the analysis relates to the agricultural sector, whose specificities – production decisions at fixed times, long supply lags, uncertainties linked to weather and disease – hardly match those of the industrial raw materials sectors. This chapter develops the analysis of export restrictions in the context of the industrial raw materials sectors, taking their main characteristics into account in the model specifications.
Industrial raw materials sectors exhibit their own particularities. First, natural resources in the extractive industries are often geographically concentrated. For some minerals or metals, the greater part of the world’s exploitable resources are found in just one or two countries. Moreover, for some mineral exporting countries, a few products from the extractive industries make up a large share of their total exports. Thus, export diversification is sometimes low, and domestic income, employment and government revenue are often quite dependent on the value generated by a single industry.
Firms in extractive industries are often multinationals based outside the countries where they operate and with sizeable market power. The relative scarcity of technical skills, access to funding and the ability to assume risk over the long term implies that few firms worldwide are able to compete in large mining ventures (Boadway and Keen, 2010). At the same time, these firms sometimes represent formidable potential for income generation in the countries in which they operate. In some countries, large mining or refining firms are state-owned.
Extractive industries are generally highly capital-intensive with low levels of employment creation. Downstream industries are located along the processing chain where the product is transformed from ore to concentrate to powder, mineral to metal, and finally to finished products. The further downstream a processing industry is from mineral extraction, the more sophisticated technological inputs and knowhow it tends to require and the more jobs it creates. Typically, a refining or smelting plant will be more labour-intensive than a mine, a plant producing semi-finished goods tends to be more labour-intensive than a smelter, and a factory producing finished manufactures will be even more labour-intensive.
Mineral resources are, generally speaking, relatively homogeneous goods. Although the quality and grade of extracted ores can vary, in processed form metals are quite homogeneous

64 – 2. ECONOMICS OF EXPORT RESTRICTIONS AS APPLIED TO INDUSTRIAL RAW MATERIALS
EXPORT RESTRICTIONS IN RAW MATERIALS TRADE: FACTS, FALLACIES AND BETTER PRACTICES © OECD 2014
across different producers. This implies that, although the cost of extraction may vary considerably, the price of the final good is similar across producing firms.
A particular characteristic of the extractive industries is the exhaustibility of the non-renewable natural resources. This does not mean that new deposits are not found, and the extent to which deposits are exploited depends on confluent factors. It means, however, that current optimal extraction rates calculated are a function of optimal extraction rates in the future: there is a trade-off between present and future production and consumption.
The analysis in this chapter takes all these characteristics of the extractive industries sector into account when specifying the theoretical model used to examine the economic effects of export restrictions. The Cournot-Nash oligopolistic model with imperfect competition most closely describes the raw materials sectors, and is used for the first time here to analyse the effect of export restrictions on the extractive industries. The model sheds light on the impacts of export taxes and quotas on domestic and foreign producers and consumers, on governments in terms of the revenue they collect and on their countries’ welfare, and on global prices and availability.
The chapter is organised as follows. The next section reviews very briefly the use of export taxes and quantitative restrictions in the minerals sector. Section 2.3 discusses the relevant literature regarding the impacts of export restrictions. Section 2.4 outlines the Cournot-Nash oligopolistic model for the case of two countries both of which produce the mineral resource and one of which is an exporter. This model is applied to investigate both export taxes and quantitative restrictions. Section 2.5 extends this model to cover three countries, one of which is a non-producing importer of the raw material. This novel extension of the model allows richer insights that can more easily be generalised to a wide range of real-world situations. Section 2.6 discusses whether export restrictions as used by trading countries have been successful in attaining their objectives. Section 2.7 explores some further implications of the foregoing analysis, and Section 2.8 concludes.
2.2. Use of export restrictions on industrial raw materials
Before examining the economic effects of export restrictions, it is useful to recall the extent and scope of the use of export restrictions on metals and minerals. Export restrictions are used more readily for products like metals and minerals than for manufactures. The industrial raw materials sectors are characterised by higher than average export restrictions but relatively low import restrictions. There is some evidence that tariff escalation, that is, higher import tariffs on semi-processed and final products than on raw materials and inputs, can also be found in these sectors.
The OECD Inventory of Restrictions on Trade in Raw Materials (see this volume, Chapter 1, Annex 1.C; Fliess and Mård, 2012; OECD, 2014) compiles detailed data on the prevalence of export restrictions on over 80 raw materials. For each material, official government data were collected and verified for the five leading countries in terms of share of global production in the reference year.
3 The findings of the data collection are included in Chapter 1 of this volume.
The impact of export taxes and quotas on the market for a particular mineral product is generally determined by three main factors: the concentration of production and exports of the product concerned, the prevalence of use of export restrictions and the level of tax or quota applied (Fung and Korinek, 2013).
There is great diversity in the use of export taxes and quotas across countries and across products. Export taxes are used much more often than export quotas or prohibitions, including by large exporters. In 2012, 28 countries, including 12 leading (top 5) producers, imposed export taxes on at least one exported metal or mineral (see Chapter 1 of this volume). In some cases, a substantial share of world exports is affected by export taxes. The share of world exports subject to export taxes was above 30% for a number of products: thorium (49% of world exports), tungsten (47%), barytes (40%), magnesium and vanadium (36% each), rare earths (35%) and magnesite (34%).
4

2. ECONOMICS OF EXPORT RESTRICTIONS AS APPLIED TO INDUSTRIAL RAW MATERIALS – 65
EXPORT RESTRICTIONS IN RAW MATERIALS TRADE: FACTS, FALLACIES AND BETTER PRACTICES © OECD 2014
Markets are most distorted when a large share of world trade is affected by an export tax (either because exports are dominated by a single tax-using exporter, or because exporters responsible for a large share of exports all use taxes), and when the rate or rates of tax are high. The rate of export tax differs significantly among the minerals and metals examined. Export taxes are very high for some commodities, with maximum rates of up to 40% for unprocessed iron and steel; 30% for copper, lead and niobium; 25% for gold; and 20% for aluminium/bauxite, tungsten, molybdenum, cobalt, silver, thorium, antimony and zinc (see Chapter 1, Figure 9a).
Export quotas are used less frequently than export taxes on industrial raw materials, possibly due to the WTO rules disciplining their use. In the period 2009-12, export quotas were used by one country, China, to control the export of certain minerals and metals. In 2012, export quotas were applied on 44 products, down from 46 products in 2009 (Chapter 1). The share of world exports subject to quantitative export restrictions was highest for antimony (44% of world exports), fire-clay (43%), tungsten (41%), rare earths (35%) and magnesite (34%). As will be shown in the following sections, export quotas generally have a more welfare-distorting import than export taxes.
Export taxes and quotas are more prevalent on raw materials than on processed and semi-processed products (Fung and Korinek, 2013).
A review of the structure of world markets for industrial raw materials shows that the conditions in many of these markets involve a small number of dominant sellers facing a much larger number of importing countries. This situation is well-represented, in stylised form, by the three-country model (two exporters, one importer) used for the analysis in Section 2.5. The review of the literature in Section 2.3 underlines the novelty of this three-country model for analysis export restrictions. Before it is deployed, however, a simpler model is used in Section 2.4 to investigate the basic mechanics of export restrictions.
2.3. Insights from recent literature
Overview
There is a small corpus of published work that explicitly models the effects of export restrictions. Some recent papers (Piermartini, 2004; WTO, 2010; Latina et al., 2011) use simple models to explore the impacts of export taxes and quantitative restrictions on domestic and world markets, and on downstream industries, for an exporting country with a significant share of world trade, which is particularly pertinent in the case of mineral resources. In the case of a small country whose policies have no effect on world prices, all impacts occur within the exporting country. These cases are shown in more detail below.
Gandolfo (1998) models export taxes in the case of a small country. He suggests that in the small country case, i.e. where there is no monopolistic power in the broad sense, there is a symmetrical relationship between the social cost of an import duty and an export duty (Lerner symmetry). In fact, Lerner symmetry means that a uniform tariff on all imports is equivalent to an equal uniform tax on all exports (Ethier, 1983). The limitation of Lerner symmetry is that it assumes an economy-wide imposition of either uniform import duties on all products or uniform export duties on all products, which is a purely theoretical case.
Some recent work examining the economics of export restrictions has been set in the context of the 2006-08 rise in agricultural product prices and subsequent restrictive policies. Mitra and Josling (2009) examine the domestic and global impacts of export bans, quotas and taxes on agricultural products. Abbott (2011) models the impact of an export tax when applied following a surge in demand in world markets. Liefert et al. (2012) examine the use of export licenses and domestic quotas as alternatives to complete export bans, and the same authors (Liefert et al., 2013) explore whether export taxes and quotas can be made less market-distorting. Martin and Anderson (2011) highlight the collective action problem associated with using export restrictions as price stabilisation policies: the use of restrictive measures by all exporters would be ineffective in stabilizing domestic prices, while magnifying international price instability. They estimate the extent

66 – 2. ECONOMICS OF EXPORT RESTRICTIONS AS APPLIED TO INDUSTRIAL RAW MATERIALS
EXPORT RESTRICTIONS IN RAW MATERIALS TRADE: FACTS, FALLACIES AND BETTER PRACTICES © OECD 2014
to which changes in insulating policies such as export restrictions have contributed to price surges for staple foods such as rice and wheat, finding substantial impacts during the price surges of 1973-74 and 2006-8. They estimate, for example, that insulating policies affecting the market for rice explain 45% of the increase in the international price for rice in 2006-8 (Martin and Anderson, 2011). Giordani et al. (2012) find evidence to support their hypothesis that a sudden rise in food prices prompts governments to respond by imposing export restrictions, which exacerbates the price shock and in turn induces other exporting countries to apply export restrictions. They estimate that during 2008-10, following the surge in international food prices, every 1% increase in global export restrictions added an additional average increase of 1.1% to international food prices (Giordani et al., 2012).
Bouët and Laborde (2010) examine export taxes as beggar-thy-neighbour policies that degrade terms of trade and real incomes of trading partners and elicit retaliation from importing countries. They analyse restrictive trade policy instruments in a general equilibrium game-theoretic context and find large and significant impacts due to the imposition of export restrictions by one country and the lowering of import tariffs or subsidizing of exports by a trading partner. They also estimate the effect of these policies on a small third country that is obliged to import the good. A scenario modelling the 2006-08 increase in food prices suggests that export restrictions and corresponding import tariff reductions contributed to a doubling of the initial increase in world wheat prices. Thus, beggar-thy-neighbour policies are estimated to have had as much effect on world wheat prices as the initial price surge. The authors conclude from this non-cooperative equilibrium that international cooperation in order to discipline export restrictions is crucial for offsetting the large welfare losses of small countries which cannot use such trade instruments to improve their welfare.
For various reasons, the impacts of agricultural export restrictions used as insulating policies in reaction to surges in food prices are not directly transferable to other sectors such as industrial raw materials. In many of the models (e.g. Mitra and Josling, 2009; Liefert et al. 2012), supply is assumed to be inelastic since the situation modelled is one where export restrictions are put into place after planting decisions have been taken. Additionally, in much of the agricultural literature (e.g. Abbott, 2011; Bouët and Laborde, 2010; Liefert et al., 2012; Mitra and Josling, 2009; and Giordani et al., 2012), the assumption is that export restrictions are placed after a surge in world demand or a surge in world prices. Neither of these assumptions necessarily holds in the case of industrial raw materials.
5 Consequently, this paper will concentrate on models that are not
specifically designed to explain impacts of agricultural export restrictions although some of the considerations in that rich body of literature will be drawn upon. In particular, the paper by Fung and Korinek (2013) examines the impact of imposing export restrictions specifically in a hypothetical industrial raw material industry on variables such as prices, quantities, terms of trade, domestic welfare as well as the effects on the downstream industries, and is the main source for the analysis in Section 2.4 of this chapter.
Export tax imposed by a “small” country
A number of studies illustrate the effects of an export tax on domestic producers and consumers graphically (Latina et al., 2011; WTO, 2010; Mitra and Josling, 2009; Appleyard et al., 2010; Gandolfo, 1998; Abbott, 2011). The partial equilibrium case of an export tax imposed on a good by the government in a small country, defined here as a country whose exports in the restricted good are not large enough to affect the world price, is the most basic. This is well illustrated by Gandolfo (Figure 2.1).
Figure 2.1 shows the domestic demand and supply schedules for the good. At the “free trade” price, OM, the quantity FH (or q4 minus q1) is exported. When an export tax equal to MN is imposed, domestic producers react to ON as the effective supply price and reduce output to q3, since they will have to hand over MN as tax on each unit of the good exported. The domestic price falls to ON, market demand increases to q2 and exports contract to F1H1 (or q3 minus q2). Domestic consumers benefit by an amount equal to area MNF1F in Figure 2.1. Producers lose income equal

2. ECONOMICS OF EXPORT RESTRICTIONS AS APPLIED TO INDUSTRIAL RAW MATERIALS – 67
EXPORT RESTRICTIONS IN RAW MATERIALS TRADE: FACTS, FALLACIES AND BETTER PRACTICES © OECD 2014
to the area MNH1H. Government revenue collected by the export tax is measured by the area F’1F1H1H’1. The social cost of the tax is illustrated by triangles FF1F’1 and H’1H1H (Gandolfo, 1998).
This analysis shows that i) for a small country with no influence on world market prices of the good on which the export tax is levied, domestic welfare in the aggregate is necessarily lower than without the export tax, ii) there is a transfer of income from domestic producers to domestic consumers due to lower prices and greater availability in the domestic market, iii) the more inelastic domestic supply and demand are, the smaller the impact of the tax, and iv) in reality, governments will overestimate the revenue generated by the tax unless they account for the lower level of exports that it will bring about.
These results are exemplified by Argentina where export taxes are imposed on virtually all agricultural products, industrial raw materials, hides and skins, oil and natural gas and their derivatives. Nogués (2008) estimates that an elimination of export barriers would increase Argentina’s GDP by 2-4%, even though temporary adjustment mechanisms would be needed to reduce the social cost of the adjustment to higher consumer prices. He estimates that eliminating Argentina’s export barriers would lead to an expansion of production and therefore employment by 300 000 jobs in the case of Argentina according to the author (Nogués, 2008). At the same time, an important source of government revenue would be eliminated, which may largely explain the plethora of export taxes in Argentina, unparalleled elsewhere in the global economy.
Figure 2.1. Effects of an export tax imposed by a small country
Source: Gandolfo, G. (1998), International Trade Theory and Policy, Springer-Verlag, Berlin.
Export tax imposed by a “large” country
Due to the geographical concentration of mineral deposits, countries exporting industrial raw materials are often “large” in relation to the world market for their export good; in this case, when they use an export tax, world market prices are affected. When an export tax is imposed by a large country, world commodity prices change and both domestic and global market effects should be studied. This is well illustrated by Latina et al. (2011) in Figure 2.2.
V
N
M
R
p
H1
D
S
FF’1
F1
H’1 H
Oq
q3 q4q2q1

68 – 2. ECONOMICS OF EXPORT RESTRICTIONS AS APPLIED TO INDUSTRIAL RAW MATERIALS
EXPORT RESTRICTIONS IN RAW MATERIALS TRADE: FACTS, FALLACIES AND BETTER PRACTICES © OECD 2014
Figure 2.2. Effects of an export tax imposed by a large country
Source: Latina, J., R. Piermartini and M. Ruta (2011), “Natural resources and non-cooperative trade policy”, International Economics and Economic Policy, Vol. 8(2), pp. 177-196, June.
As in the small country case, domestic producers reduce their supply of the good. However, in the large country case, the contraction in world supply (from Sw to S’w) leads to higher world prices (increasing from pw to p’w). At the same time, supply to the domestic market increases as producers attempt to expand within country sales to avoid the export tax; domestic prices therefore fall (from pw to p1). The price differential between the world and domestic prices (p’w minus p1) equals the tax.
Income effects, or changes in welfare, imply that domestic consumers gain from the policy due to lower prices (and correspondingly greater consumption) while foreign consumers lose as they have to pay higher prices (and so consume less). Note that in some cases, domestic consumers are themselves producers of downstream products. In this way, the export tax effectively subsidises downstream industries (Latina et al., 2011). Domestic producers of the raw material lose from the policy since they face lower prices for their goods, and they have to pay the export tax. Government revenue increases by the pale blue area in Figure 2.2.
The net domestic welfare effect for the large country is therefore ambiguous. The area marked a in Figure 2.2 represents the terms-of-trade gain from an increase in the world price. The domestic deadweight loss, or social cost, generated by the export tax is equal to the two shaded triangles in the left-hand panel of Figure 2.2 and represents distortions in production. The net welfare change for this country depends therefore on which of the two effects – the increase in terms of trade or the decrease in efficiency – is greater. Overall, if the terms-of-trade gain exceeds the efficiency loss, a large country may be tempted to improve its welfare by introducing an export tax (Latina et al., 2011). At the level of the world market, however, there is a clear overall welfare loss as the terms of trade gain to producers is more than offset by a loss in income for world market consumers.
Government revenue after the tax has been implemented
Deadweight loss
p D S
q
a
qw q’
w
Dw
Sw
S’w
Quantity exported
p1
pw
p’ w
﹛ T

2. ECONOMICS OF EXPORT RESTRICTIONS AS APPLIED TO INDUSTRIAL RAW MATERIALS – 69
EXPORT RESTRICTIONS IN RAW MATERIALS TRADE: FACTS, FALLACIES AND BETTER PRACTICES © OECD 2014
Export taxes therefore have a re-distributional effect within the country imposing the tax (WTO, 2010). Raw materials producers experience negative consequences whereas downstream consumers of raw materials are indirectly subsidised. The policy actually transfers welfare from the sector producing the raw commodity to the processing industry that uses it. Raw material production is discouraged and employment and wages may fall in the sector. However, the processing industry will benefit from lower prices of its resource inputs, gain competitiveness in the international market and expand (Piermartini, 2004). If they produce intermediate or finished goods, the tax may encourage production of a good in which the country does not have a comparative advantage (WTO, 2010).
An export tax on a raw material imposed by a large country also has a re-distributional effect in the importing country. Consumers in the importing country lose since they must pay higher prices for the good, whereas producers in the importing country, if they exist, will gain from higher prices for their goods due to lower levels of supply by their competitor (Piermartini, 2004).
The precise impact of an export tax on domestic and foreign consumers and producers depends on the size of consumers’ reaction to price changes (the price elasticity of demand). In the case of high responsiveness of demand to price changes (elastic demand), welfare losses are greater than when demand is less elastic. This is because there is more distortion in the quantity of goods consumed when the tax is used (Mitra and Josling, 2009).
The above analysis is static6, and explores changes to production, consumption and prices
that result from the export tax alone. In practice, in the longer term, sustained high world prices create an incentive for importing countries to invest in new resource-saving technologies that reduce their natural resource inputs per unit of output (WTO, 2010). They may also invest in research in order to substitute other raw materials in the production process. In addition, mining activities may be launched that were not profitable when world prices were low but which become viable given higher world prices. There is, however, no guarantee that the distorting export policy, or the resulting artificially high world market prices, will be maintained. This creates greater uncertainty in world markets both for raw materials producers and for downstream consumers, and may have negative long-run effects (Korinek and Kim, 2010).
An export tax also affects the price and availability of the factors of production used in the production process. If production of a raw material decreases due to higher prices, industries that service the raw material production process will suffer, to the extent that they are not mobile. Input industries and services that are not mobile across sectors will necessarily be hurt by an export tax. Similarly, employment in the mining industry will fall. These issues are further discussed below.
Export quotas
There has been less analysis of export quotas than of export taxes. The impacts of an export quota depend on a number of factors including how restrictive the quota is and how it is administered, making it difficult to obtain unambiguous theoretical results. One way of assessing the impact of an export quota is to assume that it has the same effect as a corresponding export tax. As in the case of import quotas, at every level of quota there is theoretically a tax that introduces the same distortions. The analysis of the effect of an export quota then becomes similar to that outlined above for an export tax. Export bans are generally modelled as an extreme case of an export quota of zero. An outstanding difference between an export tax and an export quota is that government revenue is not generated in the case of the quota. However, quota rents – income transfers resulting from the artificial “shortage” of the good on the relevant market – are created.
Who gets the quota rent largely depends how the quota is administered. When the quota is auctioned by the government in the exporting country, exporting firms are willing to buy the right to trade in the good for a price up to the amount equal to the theoretically equivalent export tax (Appleyard et al., 2010). In this case, the government benefits from the quota rent much in the same way it would from levying the corresponding level of export tax. If the exporting firms organise as a single seller, however, and sell the good on the importing countries’ markets at the higher market-clearing price, the quota rent is captured by the exporting firms (Appleyard et al., 2010).

70 – 2. ECONOMICS OF EXPORT RESTRICTIONS AS APPLIED TO INDUSTRIAL RAW MATERIALS
EXPORT RESTRICTIONS IN RAW MATERIALS TRADE: FACTS, FALLACIES AND BETTER PRACTICES © OECD 2014
Export quotas produce larger welfare losses when demand for the restricted product is inelastic.
7 Export taxes, on the other hand, produce bigger welfare losses when applied to products
with more elastic demand, i.e. a greater responsiveness to price changes (Mitra and Josling, 2009).
In general, the exhaustibility of natural resources implies a trade-off between present and future extraction rates. For a country that exports everything it produces, establishing an export quota will generally result in higher future rates of extraction (WTO, 2010). In this case, and in principle, export quotas could be used to achieve optimal rates of extraction should private sector producers otherwise have an incentive to extract minerals faster than is optimal.
8 Even if the country
imposing the quota exports all its production in the short run, it may start to export downstream products if they become competitive due to their access to a supply of raw materials that is cheaper on the domestic market because of the price wedge created by the quota.
9 In this case, the use of
an export quota to reduce the rate of extraction will have failed to achieve its objective.
2.4. The Cournot-Nash model applied to export restrictions: The two-country model
The literature review in the previous section outlines the basic mechanisms of export taxes and quotas. These are further summarised in Annex 2.A for two competing models of the world market for natural resources. The model chosen for analysis is outlined in the next two sections; readers wishing to skip to conclusions are welcome to go to Section 2.6.
Overview of the two-country model10
This section presents a basic theoretical model depicting two countries (denoted X1 and X2), both of which produce a mineral resource. The model is a static, one-shot game in a partial equilibrium framework. The world market for the natural resource is modelled as an international oligopoly rather than a perfectly competitive market, since – as documented in Chapter 1 – a traded mineral or metal is often exported by a relatively small number of countries or producers, who tend to have substantial market power.
This simplified model assumes that each country has one mining firm, which produce a homogeneous product. Country X1 produces quantity q1, of which d1 is
consumed in the domestic
market and x1 is exported to X2. Total mineral output in X1 is:
q1 = d1 + x1
Country X2 produces quantity q2 entirely for its own market. Thus, only X1 exports. Total output in the global mineral industry is:
Q = q1 + q2.
Oligopolistic firms can be modelled as either Bertrand-Nash (price-setting) firms or Cournot-Nash (quantity-setting) firms. We consider that it is more natural to describe these firms as Cournot-Nash firms, because the extractive industries involve a limited number of firms that face differing cost and pricing structures and the Cournot-Nash equilibrium allows price to exceed marginal cost for some or all of them, whereas in the Bertrand equilibrium, price equals marginal cost. In the Cournot-Nash setting, firms produce identical products, but even the higher-cost firms can survive and produce positive outputs. However, it is well known in this theoretical literature that results can change when certain features of the game change. The key features to consider include price-setting versus quantity-setting behaviour, the number of producers, whether there is free entry, and identical versus differentiated products. Various theoretical studies of general stylised cases (see inter alia Brander and Spencer, 1984, Helpman and Krugman, 1985, 1989, Bhagwati et al., 1998, Bagwell and Staiger 2009a, 2009b, Fung, 1989a, 1989b, Grossman and Rogoff, 1995, and Krishna, 1989), offer valuable insights. We have drawn on this literature to develop the model and framework outlined here, which is intended to apply specifically to the case of export restrictions in the industrial raw materials sector.

2. ECONOMICS OF EXPORT RESTRICTIONS AS APPLIED TO INDUSTRIAL RAW MATERIALS – 71
EXPORT RESTRICTIONS IN RAW MATERIALS TRADE: FACTS, FALLACIES AND BETTER PRACTICES © OECD 2014
Export tax
Assume that X1 imposes an export tax t. With an integrated international market, the price in the importing country, p2, equals the price in the exporting country, p1, plus the export tax t, i.e.
p1 + t = p2.
Denoting the demand in the two countries by D1(p1) and D
2(p2), respectively. Substituting
X1’s price into X2’s demand schedule gives D2(p1 + t). Summing these demands horizontally yields
total output Q. This relationship shows that X1’s price p1 is a function of total industry output Q and the export tax t, i.e. P
1(Q, t). Furthermore, since X2’s price is simply X1’s price plus the export tax, it
follows that P2(Q, t). From this market integration feature, therefore, other things being equal, a rise
in the export tax will lower the price in X1 but raise the price in X2. In other words, an export tax directly raises the export price, thereby reducing export demand. To restore equilibrium, X1’s price must fall to stimulate domestic demand.
How do these changes in the raw materials markets affect the two Cournot-Nash firms? The exporting firm’s profit consists of revenue from the domestic market p1d1 and from exports p2x1, with the costs being c1d1, c1x1
and tx1, where c1 denotes the constant marginal cost of production in X1.
Recognising that p2= p1 + t, the profit of X1’s firm can be written as:
B1 = p1q1 – c1q1,
and X2’s firm has profit B2, which is given by B
2 = p2q2 – c2q2, where c2 is the constant marginal cost
of production in X2.
For a given export tax t, profit maximization by the exporting firm yields B1q1= 0, where the
subscript now denotes partial differentiation with respect to the strategic output variable q1. B1q1= 0
is also the exporting firm’s reaction function, which denotes this firm’s profit-maximising choice of q1 for any given level of q2. As is standard, this Cournot-Nash reaction function in q2-q1 space is downward-sloping.
Similarly, maximising the profit of X2’s firm, for a given t, yields B2q2= 0. This first-order
condition provides the reaction function of X2’s firm, with a best-reply q2 for any q1. For each firm’s set of conditional optima, we assume that the second-order conditions hold. In a graph with q2 on the vertical axis and q1 on the horizontal axis, again the Cournot reaction curve for X2’s firm, B
2= 0,
is downward-sloping. The X1 reaction function will also be steeper than the X2 reaction function, yielding a stable equilibrium.
The Cournot-Nash equilibrium occurs at the point where the two firms’ reaction functions intersect, which can be expressed as (q1
CN, q2
CN, t), thus determining the output levels of the two
firms, given a particular rate of the export tax. An increase in the export tax shifts the X1 firm’s reaction curve towards the origin, i.e. the X1 firm produces for every level of q2, whereas it shifts the X2 reaction curve outwards, since with a higher export tax the X2 firm will produce more for every value of the q1.
We maintain the standard assumptions typical of this type of model, in particular that the two outputs q1 and q2 are strategic substitutes, and that the usual stability condition holds. With these standard conditions, the after-tax equilibrium implies less output in X1 and more output in X2 than without the tax. These outcomes hold for straight-line demand functions and other well-behaved demands. When the export tax increases and the X1 firm’s exports fall, the price of this mineral on the world market is simply the price prevailing in X2, since we assumed that X2 does not impose any trade barriers and there are no transport costs or other kinds of transaction cost. The world price, pW, is just p1 + t = p2. Clearly, the world price rises with an increase in the export tax.
There are various welfare implications of an export tax in this international Cournot-Nash oligopoly model. First, we consider domestic consumer surplus, bearing in mind that some consumers may be downstream firms that use these resources as production inputs. Because the domestic price falls with an increase in the export tax, domestic consumer surplus, and possibly the profit of downstream producers, rises. Another way to view this improvement in domestic welfare is

72 – 2. ECONOMICS OF EXPORT RESTRICTIONS AS APPLIED TO INDUSTRIAL RAW MATERIALS
EXPORT RESTRICTIONS IN RAW MATERIALS TRADE: FACTS, FALLACIES AND BETTER PRACTICES © OECD 2014
to consider the distortions introduced by the firms with market power in our model. As it is oligopolistic, the domestic firm will typically charge a price above marginal cost, which creates a deadweight loss in the domestic economy. An increase in the export tax lowers p1 and reduces the inefficiency due to this distortion. In addition, the world price of the exported product rises, so there is a terms-of-trade gain for the exporting country, but a deterioration in the terms of trade for the importing country. For Cournot-Nash firms, profit is positively related to output and market share, and since domestically produced output decline with an increase in or imposition of an export tax, the domestic firm’s profit shrinks. By contrast, the profit of the foreign firm increases as its output increases. So profit is shifted away from the domestic firm to the foreign firm. This profit-shifting (rent-shifting) effect is standard in international oligopoly, but it is new to the literature on export restrictions of minerals or metals which has until now used models that assume perfect competition. A novel conclusion is that the government using the trade policy actually shifts rents away from its own firm and reduces its profit. Finally, the welfare implications of the new (or higher) export tax revenue are that public sector welfare, or the welfare of public spending beneficiaries, increases in the exporting country.
In summary, the export tax means that the producer in X2 gains and consumers or downstream industries in X2 lose. Assuming that the producer continues to sell only to its domestic market, there is also a terms-of-trade loss. By contrast, the X1 producer loses, consumers or downstream industry in X1 gains, there is a terms-of-trade gain and tax revenue also increases. There may be, therefore, an export tax that optimises domestic welfare (despite reducing global welfare).
11 Expressing X1’s welfare as:
W1 = B
1 + S1 + T,
where S1 is domestic consumer surplus and is a function of p1, T is tax revenue, which is equal to tx1 and B
1 is the profit of the domestic producer. The optimal export tax is implicitly defined by W
1t =
0, where the subscript refers to differentiation with respect to the export tax t. Again, we assume that the second-order condition holds.
So far it has been assumed that there are producers and consumers in both X1 and X2. If production in X1 only and consumption takes place only in X2, an export tax imposed by X1 improves the welfare in X1, the world market price of the raw material rises and welfare in X2 falls. In general, the welfare of the global economy will decline.
A richer welfare analysis can be obtained by incorporating into the model some additional characteristics of the international mineral industry. First, suppose there is a downstream firm that uses these raw materials as inputs in its production process. We denote the profit of the downstream firm in X1 by V
1(z1, p1), where z1 is the output of the downstream firm and p1 is the
price of the mineral used by the downstream firm. For a given p1, the downstream firm maximises its profit by choosing z1 so that V
1Z1 = 0. It has been shown already that an increase in export tax
lowers the domestic price of this input, which increases the profit of the downstream firm, i.e. V1P1
< 0. With a lower marginal cost of production, the downstream firm expands its output and thus employment. These results still hold if there is also a downstream firm in country X2. Denoting its profit by V
2(z2, p2), profit maximization by this firm yields V
2Z2 = 0. If the two downstream firms also
engage in strategic rivalry, then we have a two-stage static (one-shot) game. In the first stage, the mineral sector engages in oligopolistic rivalry, yielding Cournot-Nash equilibrium prices p1 and p2. Given these input prices, the two Cournot-Nash downstream firms compete, leading to equilibrium z1 and z2. An increase in the export tax shifts these games to a new equilibrium. This means that, in the second-stage game, X1’s downstream firm has a lower marginal cost of production. Hence, its output, employment and profit are all higher. The downstream firm in X2, by contrast, has a higher marginal cost of production, and therefore its output, employment and profit decline.
When the X1 firm is a multinational affiliate, its profit is at least partially repatriated overseas. If so, the government of X1 may not want to include the profit of the multinational firm in its welfare calculation. This situation could partly explain the willingness of some governments to impose export taxes even though these taxes shift profit away from the firm located in their country.

2. ECONOMICS OF EXPORT RESTRICTIONS AS APPLIED TO INDUSTRIAL RAW MATERIALS – 73
EXPORT RESTRICTIONS IN RAW MATERIALS TRADE: FACTS, FALLACIES AND BETTER PRACTICES © OECD 2014
If jobs and employment are a major issue in X1, the government may include a labour component in its objective welfare function, i.e.
W1 = wL + B
1 + S1 + T,
where w is the wage rate and L is employment. Assuming that w is fairly fixed in the short run, then the scope for improving value of the government objective function depends on employment alone. Notice that in our model, employment may be shifted downstream in the supply chain. This can be seen by noting that an increase in (or the imposition of) an export tax will increase employment in downstream firms, even though there is a drop in the employment in the upstream extraction sector. If the downstream firm is more labour-intensive, then the net impact will tend toward increasing total employment in the exporting country and decreasing employment in the importing country. The actual net effect will depend on the size of each sector.
Export quotas
Using the same model as for the export tax, we examine the impacts of an export quota and compare them with those of the export tax. We assume that the X1 firm pays the government of X1 for a license to export. Specifically, it pays a maximum of (p2 - p1)x1 for a licence to export up to the limit of the quota.
12 The firm’s profit can be written:
B1 = p1d1 - c1d1 + p2x1- c1x1 – (p2 - p1)x1 =(p1 - c1)q1,
which corresponds exactly to the payoffs under the export tax case. The profit of the firm in X2 is also the same as in the export tax case, given as:
B2 = p2q2 - c2q2.
If x1 is fixed at the level given by an export quota (which corresponds to the after-tax level of output in the previous export tax case), and assuming that q2 is at q2
CN, the best response of the X1
firm is to choose d1 so that q1 = d1 + x1, which equals q1CN
. Similarly, if the X1 firm chooses q1CN
, then the best response by the firm in X2 is q2
CN. Since these quantities are mutually optimal, we
obtain a Cournot-Nash equilibrium. Thus, with an export quota that limits exports to the same extent as a given level of export tax, the resulting Cournot-Nash equilibrium will yield the same output levels. Apart from the costs of administration and the distribution of the quota rents, the welfare implications are also the same. For X2, price increases and output is higher. The profit of the X2 producer rises and X2 consumers lose, as in the case of the export tax. If there is a downstream firm in X2, it loses competitiveness since the price of the mineral input in X2 is higher. Thus, the profit and employment of the downstream firm in X2 are reduced by the export quota.
The economic impacts of the export tax and export quota on producers and consumers of the raw material in the Cournot-Nash oligopolistic theoretical model are therefore broadly similar. The surplus created by the quota rent, however, may not be distributed in the same way as the tax revenue. In the case of the export tax, the tax revenue goes to the government that has introduced it. The recipient of the quota rent depends how the quota is attributed or administered. The quota, or license to export, may be auctioned in an open bidding process or may be attributed according to firms’ previous export shares or some other criterion. When firms compete to buy a share of the quota, in theory they bid the price of the license up to the level of the corresponding export tax, and the quota rent goes entirely to the authority administering the policy. If, however, the quota is attributed according to firms’ export shares in the past, for example, or according to another criterion, the quota rent may be distributed among all exporting firms or a subset of them, or shared between firms and the government authority.
So far, we have assumed that the quantity-setting Cournot-Nash model is more typical of trade in mineral resources. However, there may be some specific product markets where other types of behaviour – and hence other models – apply. In these situations, an export quota can be more distorting than an export tax. There are two known situations where this may occur. First, if there is an unexpected increase in the demand for the raw material in the importing country, an export tax will allow an increase in exports as a response. In the case of a binding export quota,

74 – 2. ECONOMICS OF EXPORT RESTRICTIONS AS APPLIED TO INDUSTRIAL RAW MATERIALS
EXPORT RESTRICTIONS IN RAW MATERIALS TRADE: FACTS, FALLACIES AND BETTER PRACTICES © OECD 2014
however, there will be no change in exports. The higher unmet demand will push the price of the raw material up further and create a greater distortion in the world market.
In the second example, under certain market conditions, an export quota creates a potential for collusive behaviour between oligopolistic market participants. This may occur if firms compete on the basis of price (i.e. Bertrand-Nash duopoly) rather than quantity as in the Cournot-Nash case outlined here. It is well established in the literature that in Bertrand-Nash international duopoly models, a quantitative restriction can serve as a “facilitating practice” or a “collusive device” (see Krishna 1989, Grossman and Rogoff 1995, p. 1435). In the Bertrand-Nash case, as firms compete on the basis of price, their prices are driven down close to their marginal cost. Their profits are therefore theoretically close to zero. The effect of a trade restraint is to draw the oligopolistic firms into a collusive partnership as a reaction to an unsustainable drop in profit. A quantitative restriction will therefore generate more distortions than a tax in the case of a price-competing oligopoly.
Bertrand-Nash equilibria in oligopolistic international trade have been studied in the literature, albeit in the context of import – not export – restrictions. Nevertheless, some insight can be drawn. The “collusive” properties associated with quotas are well documented in the literature. If the firms are Bertrand players, Krishna (1989) has shown that an import quota can yield a mixed strategy equilibrium. As elaborated in Helpman and Krugman (1989), with the quota imposed by the importing country, the home firm can opt to charge a higher price, taking advantage of the protection. But if the exporting firm chooses to raise its price sufficiently, the home firm will switch to adopt an aggressive strategy and charge a much lower price to undercut the rival. At equilibrium, both firms’ profits are higher so the quota acts like a “collusive” or “facilitating” device.
In some cases, if the export tax is set high enough, exports will cease and the tax acts like an export ban. Empirically, the threshold level at which an export tax becomes an export ban varies in different raw material industries. One relevant factor is the elasticity of demand for the industrial material: if consumers react strongly to price changes (i.e. the elasticity of demand is high), then imposing an export tax will lower demand more sharply and the rate of tax at which export flows cease is lower than when demand elasticity is low.
It is well established in the literature that an import tax is equivalent to an import quota in models of perfect competition. Once we deviate from perfect competition, the “equivalence” result does not necessarily hold. In the case of a domestic monopoly, for example, an import quota leads to a higher domestic price and lower domestic output compared with an equivalent import tariff (see, for example, Helpman and Krugman, 1989, p.33). Where the domestic firm faces a foreign monopoly, import quotas are also worse than import tariffs for the home country (see Helpman and Krugman 1989, p.56).
These established results concerning import taxes and import quotas can provide some general insights as to why export quotas may be welfare-inferior to export taxes. For example, where a monopoly in the importing country is faced with a perfectly competitive world market, both export taxes and export quotas can shield the monopoly from competition and increase the monopolistic power of the firm. For export quotas, they allow the competitive threats to be eliminated and allow the firm in the importing country the freedom to choose its monopolistic price. With effective export taxes, on the other hand, the implicit “threats” of imports that will swamp the importing market still exist and under some conditions the firm restrains its behaviour. Export quotas will create more distortions than export taxes. In particular, quotas will lead to a higher price and lower quantity consumed in the importing country.
Taking another example, where an exporting country has an export monopoly, the monopoly firm when faced with an export quota can charge a higher export price (such that what is demanded at this price coincides with the quota limit) and thereby capture all the quota rent. In contrast, an export tax that yields the same level of exports will provide the government in the exporting country with tax revenue equivalent to the quota rent.
In sum, there are numerous instances where quantitative restrictions on trade flows are more distorting than border taxes. For example, in the case of an increase in the demand for the raw material, an export tax will allow an increase in exports as a response, thereby alleviating pressure

2. ECONOMICS OF EXPORT RESTRICTIONS AS APPLIED TO INDUSTRIAL RAW MATERIALS – 75
EXPORT RESTRICTIONS IN RAW MATERIALS TRADE: FACTS, FALLACIES AND BETTER PRACTICES © OECD 2014
on world prices. In the case of a binding export quota, however, there will be no change in exports. Additionally, as illustrated above, there are other cases where quotas can lead to greater consumer welfare losses.
2.4 The Cournot-Nash model applied to export restrictions: The three-country model
The basic three-country model
This section extends the two-country model already presented. It describes and applies a theoretical model that highlights the implications of an export restriction on a globally traded industrial raw material in a three-country context, where countries X1 and X2 both produce, consume and export their mineral resource, whereas country M has no domestic production and must rely on imports. This model allows a greater range of insights than in the previous model, which did not include a non-producing country.
As before, the model is a static, one-shot game in a partial equilibrium framework, representing an international oligopoly. Since mineral ores tend to be homogeneous, the upstream sector is considered to produce identical products. The structure and assumptions of the model are inspired by the global chromite industry, where Indian and South African producers (countries X1 and X2 respectively) extract the mineral ore for domestic consumption as well as for export, with a large share of exports going to China. The main use of chromite is in the production of ferrochrome. India began imposing export restrictions on its chromite in 2006. For more details, see Fung and Korinek (2013, Box 2, p.28). In China (country M), domestic production of chromite is virtually non-existent.
In country X1, the firm produces d1 for home consumption and x1 for export to country M. Total production of mineral ore from country X1 is q1 = d1 + x1. Similarly, the firm in country X2 produces d2 for domestic use and x2 for export to M. Total production in X2 is q2 = d2 + x2. Mineral ore q1 and q2 are assumed to be identical. This reflects the general observation that most industrial raw materials are undifferentiated. The international market for the mineral ore clears so that total global supply equals total global demand. The world price of the mineral ore is pW, while the domestic price in X1 is p1 and the domestic price in X2 is p2. With perfect arbitrage, p1 + t1
= pW and
p2 +t2 = pW, where t1 is the export tax imposed by country X1 and t2 is the export tax adopted by country X2, which is assumed to be set to zero for most of the analysis below. Assuming that there are no trade measures in country M, the world price pW is the domestic price in M. Taking the export taxes into account, the law of one price applies to the mineral ore upstream sector.
Each firm’s marginal production cost is assumed to be constant. As in the previous model, the firms in each country behave like Cournot-Nash producers, setting outputs so as to maximise profit. Output-setting behaviour is less competitive, and more feasible, for the firms than setting prices (Bertrand behaviour). In the Cournot-Nash setting with firms producing identical products, even the higher-cost firms can survive and produce positive outputs.
In the context of this model, when X1 imposes or increases an export tax, it effectively adds to the marginal cost of the firm in X1, thereby reducing the competitiveness of its own firm. Other things being equal, ore production from country X1 goes down and production in country X2, the competitive exporting country, goes up. The world price rises, the domestic price in country X1 declines, and exports from country X1 fall. X2’s raw materials exports to country M rise, while the domestic price of the raw material in X2 increases.
Thus, a rise in an export tax in one exporting country displaces the source of the non-producing country’s imports to its competitor. Profit falls for the ore producer in X1 and rises for the producer in X2. Economic rent is thus shifted from the producer in the country imposing the tax to the producer in the other country. This can be illustrated using a reaction curve that shows the optimal or profit-maximizing output responses of a firm for any given output decision implemented by a rival firm. The export tax shifts the reaction curve of the firm in X1 towards the origin and shifts the reaction curve of the firm in X2 outwards from the origin, resulting in lower production in X1 and higher production in X2 (Figure 2.3).

76 – 2. ECONOMICS OF EXPORT RESTRICTIONS AS APPLIED TO INDUSTRIAL RAW MATERIALS
EXPORT RESTRICTIONS IN RAW MATERIALS TRADE: FACTS, FALLACIES AND BETTER PRACTICES © OECD 2014
Figure 2.3. Shift in reaction curves of mineral producing firms due to an export restriction in country X1
The higher output of the firm in X2 leads to a rise in its profit while the lower output of X1’s firm results in a smaller profit. These results are similar to those in Fung and Korinek (2013). In this extended and modified three-country export competition scenario, however, there are also some new results regarding prices and quantities that cannot be generated in the two-country context. With the three-country model, we see that X1’s export tax has spillover effects on the competing exporting country. The domestic price of the mineral ore in the other exporting country rises, exports and total output rise and the profit of the upstream mineral ore firm rise as well. The world price of the mineral ore also increases. The terms of trade improve for both the raw materials exporters and worsen for the importing country.
Like the mineral ore sector, many processed or refined downstream metals sectors are also dominated by a few global producers. It again seems appropriate to adopt an imperfectly competitive market structure for downstream activity. This implies three oligopolistic downstream producers, one in each of the three countries. The processing firms in X1 and X2 export to country M, while the processing firm in M competes in its domestic market with imports from both X1 and X2. The downstream outputs are assumed to have different grades since different types of processing are performed on the mineral ore in different countries.
This set-up parallels the current global ferrochrome situation. Despite having no home production of chromite, China (M) has substantial domestic production of ferrochrome. Although it is now the world’s largest single producer of ferrochrome, China is still a net importer. South Africa and India both export ferrochrome to the Chinese domestic market. The grades of ferrochrome vary, depending on whether it is processed in South Africa, India or China. Theoretically, this is a three-stage game. In the first stage, the Indian government sets the export restriction. In the second stage, the upstream ore producers in India and South Africa set their outputs. The market clearing prices in the first-stage game become the input prices for the downstream processed mineral sector. In the third stage, the three international downstream firms set the quantities they will produce to compete in the import market in country M.

2. ECONOMICS OF EXPORT RESTRICTIONS AS APPLIED TO INDUSTRIAL RAW MATERIALS – 77
EXPORT RESTRICTIONS IN RAW MATERIALS TRADE: FACTS, FALLACIES AND BETTER PRACTICES © OECD 2014
As before, downstream firms compete in a quantity-driven fashion. In this theoretical setting, an increase in the export tax by country X1 in the upstream ore sector lowers the input price to the downstream firm in country X1 while increasing the input price for the downstream firms in countries X2 and M. It follows that in the third stage of the game, X1’s processed metal exports increase, exports of the processed metal decrease from X2 and M’s domestic output of the processed mineral is reduced. Downstream industry profit is higher in country X1, but lower in X2 and in M.
Thus, the export restriction imposed by country X1 in the upstream ore sector shifts rents from the upstream firm in X1 towards the upstream firm in X2. At the same time, the export tax increases profit of the downstream firm in X1 at the expense of the downstream firms in X2 and in M. This suggests that India’s export tax harms its upstream chromium ore industry, but helps its downstream ferrochrome industry. In South Africa, the upstream chromium ore sector profits from the Indian export restriction but its downstream ferrochrome industry is hurt, as is the Chinese ferrochrome sector as a result of the Indian export restriction (see also Fung and Korinek, 2013; Fung 1995, 2002).
Now we consider an export quota imposed by country X1 on its mineral ore sector. For ease of comparison, we assume that the quota restricts the mineral ore export to the same level as does a given export tax. Starting from the initial Cournot-Nash equilibrium, the domestic output of mineral ore in country X1 is affected in exactly the same way as with the export tax, and the resulting Cournot-Nash equilibrium outputs remain the same for either policy for all players. As in the two-country model, however, an important difference is the administration and ownership of the quota rents. The possibilities have been discussed in the previous section.
Since outputs are the same for either an export tax or an export quota, prices also change in the same way, as do profits. Profit declines in X1’s upstream mineral ore industry, and in downstream processing industries of X2 and M, whereas profit rises in X1’s downstream processing industry and in X2’s upstream mineral ore industry. Nonetheless, although an export quota is broadly equivalent to an export tax, there are many instances where an export quota can be more distortionary than an export tax as elaborated in Fung and Korinek (2013).
13
In particular, the rents associated with a quantitative export restriction in country X1 accrue largely to the exporting firm in country X2 due to higher world prices, whereas in the case of an export tax, they generally accrue to the public administration in country X1 through tax revenue (Fung and Korinek, 2013). In addition, the imposition of a quantitative restriction on raw materials may imply a higher world price than the use of an equivalent export tax. In an oligopolistic model, raw materials exporters in X2, shielded from competition by exporters in X1 regardless of the level of the world price, may sell their materials at a higher price since they will not need to compete against raw materials producers in X1 over and above the exports included in X1’s quota. They may therefore take advantage of their position as sole exporter to raise prices further in the face of rising demand.
Race to the bottom: Competitive export restriction strategies
When country X1 imposes an export tax, as described in the previous section, simply adjusting output according to its outward-shifted reaction function is not the only action open to X2. If the downstream processed metal sector is more important to X2 than its primary sector, it has an incentive to respond to its competitor’s export restriction policy with a similar policy change. Indeed, after India imposed an export tariff on chromite exports in 2006 (and then increased it in 2008), the South African government seriously considered imposing a tax on its own chromite exports in response, but finally decided against it at the time (Korinek and Kim, 2010; Fung and Korinek, 2013). Imposing an export tax as a response would have lowered the input ore price in South Africa and potentially raised its national welfare, mitigating the negative beggar-thy-neighbour effects of the Indian export tax on its own downstream sector.
In general, such a reaction is not a straightforward option. There may be legal consequences in the case of quantitative export restrictions that are not allowed under WTO rules, although exceptional situations exist where quantitative export restrictions are permitted. In the case of

78 – 2. ECONOMICS OF EXPORT RESTRICTIONS AS APPLIED TO INDUSTRIAL RAW MATERIALS
EXPORT RESTRICTIONS IN RAW MATERIALS TRADE: FACTS, FALLACIES AND BETTER PRACTICES © OECD 2014
export taxes, some countries are bound by recent accession agreements to the WTO (Chapter 5 of this volume; Karapinar, 2011). Legal or economic consequences to the use of export taxes may also be felt in cases where export taxes are prohibited or regulated in a preferential trade agreement. In the case of the United States, export taxes are prohibited in the Constitution.
Leaving these considerations aside, our model allows us to study the optimal response by country X2 to a restriction placed by X1 on its raw materials exports. We assume that each country, X1 and X2, sets its export tax rate so as to maximise its own economic welfare. Following the standard literature, and simplifying for the purposes of this model, total welfare of country X1, W
1, is
defined as the sum of the profit of the upstream ore firm B1, plus that of the downstream processing
firm V1, plus the export tax revenue T
1 (Bagwell and Staiger, 2009a, 2009b). It was shown above
that all three components are functions of X1’s tax rate (B1 falls, whereas V
1 and T
1 rise, when X1’s
export tax rate increases). We denote by t1* the optimal tax rate that maximises W1. Similarly, t2*
denotes the export tax that maximises the national economic welfare of country X2.
If the downstream firm is more important to X2’s government, a rise in t1 will negatively affect W2, since a rise in t1 raises the ore input price in country X2. Note that both countries have vertically linked firms, each with market power. From the standpoint of economic efficiency throughout the value chain, the input ore price is excessively high given that this is an oligopolistic situation. In other words, the input is provided at a price above marginal cost. An increase of the ore price in X2 due to X1’s export tax exacerbates the existing inefficiency due to imperfect competition, moving the input price still further away from marginal cost and lowering the total economic efficiency of the value chain. Thus, W
2 can be negatively affected by increasing t1. Similarly, in the contrary case,
the welfare of country X1 would decrease if country X2 imposed or increased an export tax. This particular case highlights the potential for strategic export policy interdependence. This is a situation where each country’s own welfare increases with the imposition or increase of its own export tax, but the welfare of the competing exporting country declines. Relative to a free trade equilibrium situation, an export tax is thus a beggar-thy-neighbour policy, where the national welfare of each exporting country rises with its own export tax and declines with the export tax of its competitor.
Now consider the following three-stage game: in the first stage, the governments in both X1 and X2 set their export taxes t1 and t2 independently, each maximizing its own national economic welfare W
1 and W
2. In the second stage, for given export taxes t1* and t2*, each upstream industrial
raw material ore firm chooses its own output, maximising its profits B1 and B
2. The equilibrium
prices of the mineral ores in the second stage become the input prices for the processed metal sectors. Given these input prices, in the last stage the downstream processed metal firms set their output levels, maximizing their respective profits in countries X1, X2 and M.
When the two governments in X1 and X2 set their export taxes independently, each ignoring the impact of its export tax on the other, it is a non-cooperative export tax game. This game is structurally similar to the prisoners’ dilemma game, and as in that case, there exists a co-operative outcome in which both countries would be better off. In theory, governments X1 and X2 can escape the non-cooperative suboptimal outcome through negotiated agreement which would include a maximum level of export tax allowed by each country. If the agreement is considered to be legally binding the outcome can be characterised by Nash bargaining. The Nashian arbitrator can be seen as choosing the level of export taxes in order to maximise weighted joint welfare (W
1)a(W
2)b, where
a is the bargaining power of country X1 and b is the bargaining power of country X2. Cooperation in the form of adopting cooperative export taxes would raise both countries’ welfare. Co-operative export taxes would normally involve maximizing joint national welfare of both countries.
This raises the question as to the potential form of agreement or collusive negotiation. In some cases, export restrictions are disciplined in regional or preferential trade agreements (see Chapter 5 for a full discussion of options currently used to discipline export restrictions in regional trade agreements). In order for a trade agreement to be binding under WTO rules on preferential trade agreements, however, it must include a substantial amount of each country’s trade, which would go well beyond the scope of one product or sector. Alternatively, a smaller, commercial agreement between two firms or governments may be difficult to obtain since the raw materials producers in the two countries are competitors as are the downstream, processed product

2. ECONOMICS OF EXPORT RESTRICTIONS AS APPLIED TO INDUSTRIAL RAW MATERIALS – 79
EXPORT RESTRICTIONS IN RAW MATERIALS TRADE: FACTS, FALLACIES AND BETTER PRACTICES © OECD 2014
exporters. Such agreements may not be fully legally binding nor are such collusive practices accepted in many countries. Therefore, in the real world, the cooperative solution may not be feasible, and when it is available, each country will be strongly tempted to revert to a non-cooperative export tax, increasing its national welfare at the expense of the other, while its partner continues to behave co-operatively. In a static, one-shot game (Figure 2.4), it is more probable that each government applies its non-cooperative export tax, ignoring the welfare of the other country.
Figure 2.4. Cooperative and non-cooperative outcomes in the case of an export tax
One way that a sub-optimal “export tax war” can be avoided is if the commercial agreement is self-enforcing. For a self-enforcing agreement to work, the static game characterization of the export tax is extended to a situation where the game is played repeatedly. For simplicity, in this infinitely repeated game, governments set their export taxes in each period over an infinite time horizon. Here too, one outcome is for the governments to set the non-cooperative export taxes t1
*
and t2* in each period forever. This will yield non-cooperative national welfares W
1 (t1
*) and W
2 (t2
*),
which are sub-optimal for each period.
If, on the other hand, both governments choose their cooperative export taxes t1C and t2
C to
maximise the joint welfare W1 + W
2, their cooperative national welfares will be W
1 (t1
C , t2
C) and W
2
(t1C, t2
C), which are higher than their respective non-cooperative welfares. Furthermore the case
when country X1 cheats while the other country cooperates can be characterised as country X1 choosing t1 to maximise W
1 given that the export tax of the country X2 is at t2
C. The export tax
chosen in the cheating situation is denoted as t1CH
. Similarly the cheating export tax for country X2 is t2
CH. For the trade agreement to be self-enforcing, it is necessary that W
1 (t1
CH , t2
c) – W
1 (t1
C , t2
C)
< 1/r1 [ W1 (t1
C , t2
C) – W
1 (t1
*, t2
*)] and W
2 (t1
C, t2
CH) – W
2 (t1
C, t2
C) < 1/r2 [ W
2 (t1
C, t2
C) – W
2 (t1
*, t2
*)],
where r1 and r2 are the discount rates for country X1 and country X2. In other words, in order to
Co
un
try
X1
Country X2
W2
(t1
CH
, t2
C
)
W1
(t1
CH
, t2
C
)
W2
(t1
*
, t2
*
)
W1
(t1
*
, t2
*
)
W1
(t1
C
, t2
CH
)
W2
(t1
C
, t2
CH
)
W1
(t1
C
, t2
C
)
W2
(t1
C
, t2
C
)
Export tax
No tax
Export tax No tax
80 – 2. ECONOMICS OF EXPORT RESTRICTIONS AS APPLIED TO INDUSTRIAL RAW MATERIALS
EXPORT RESTRICTIONS IN RAW MATERIALS TRADE: FACTS, FALLACIES AND BETTER PRACTICES © OECD 2014
escape the sub-optimal equilibrium, the one-time gain of cheating needs to be dominated by the future discounted loss of cooperation, or alternatively the future discounted punishment.
In summary, an export tax by country X1 negatively affects the national economic welfare of country X2; similarly, an export tax by country X2 affects negatively the economic welfare of country X1. Country M, the importer of raw materials, experiences lower welfare due to the actions of both exporters. Non-cooperative export tax rates lead to a sub-optimal outcome. Trade or commercial agreements that are legally binding or are self-enforcing can in principle be designed to escape this prisoner’s dilemma situation, leading to higher cooperative national welfares for both countries. However, in practice, trade and commercial agreements may be difficult to obtain. In the longer term, it is mainly the threat of future discounted lack of cooperation either through retaliation or a “punishing” reaction on the part of trading partners that may mitigate the sub-optimal policy outcome. In any case, such collusive export taxes would, however, harm third countries and would move the world market farther from a free trade equilibrium in raw materials trade.
Note that an export tax by either country raises the world price of the mineral ore, which confers a terms-of-trade gain on the exporters. It also represents an increase in the input price to the downstream firm in country M, the importing country. The terms-of-trade loss by country M leads to lower economic welfare in country M. Moreover, if the downstream firms in country M relocate to a raw-materials exporting country in order to access raw material inputs more easily, the welfare losses for country M will be even greater than described above. As mentioned earlier, caution should be exercised when applying simplified models to actual situations. The model can, however, provide some insights and can contribute to understanding the complex impacts of exports restrictions as applied to global industrial raw materials markets.
Alternative reactions available to countries that face export restrictions
The previous sub-section focuses on trade policy responses to export restrictions by competing exporting countries. This sub-section considers what reactions if any are available to countries like country M, characterised as an importer of the raw material with no domestic production of the mineral resource, but with a downstream industry that uses the mineral as an input. As seen above, export restrictions raise world prices and reduce the global supply of raw materials, thus affecting trading partners that previously imported the raw material in question. In the past, trading partners that have experienced diminished access to supply, or access to raw materials at higher prices due to restrictive export policies, have contemplated various actions in order to counter their distortive effects. Some of the options that have been discussed in different fora are outlined below:
Reduce or remove any remaining import tariffs on the raw materials that are subject to export restrictions.
Promote and fund research into alternative technologies with the objective of using a more diversified set of minerals and metals as inputs in strategic industries.
Facilitate exploration of new sources of raw materials that are subject to export restrictions, for example in regions that are potential exporters.
Facilitate the development of technologies that recycle metals from discarded final-use products.
Increase cooperation between producers and consumers affected by restrictions to facilitate information flows, improve access to existing supply channels and alleviate short-term supply disruptions.
Develop measures to alleviate the most distorting effects of export restrictions in a multi-lateral context. Some suggestions as regards the agriculture sector have been put forward including “using multilaterally agreed definitions and criteria … to interpret the meaning and scope of exceptions” to the ban on export quotas” (Howse and Josling, 2012), implementing disciplines on food aid such as those outlined in DDA discussions,
14 and outlining a

2. ECONOMICS OF EXPORT RESTRICTIONS AS APPLIED TO INDUSTRIAL RAW MATERIALS – 81
EXPORT RESTRICTIONS IN RAW MATERIALS TRADE: FACTS, FALLACIES AND BETTER PRACTICES © OECD 2014
mechanism for identifying and evaluating the appropriateness of the use of export restrictions in the context of a critical shortage of supply (Howse and Josling, 2012).
Integrate export restrictions provisions in plurilateral agreements among producers and consumers to ensure access to supply and to markets. This may include agreements among market participants to ensure access to supply and open markets, or negotiating disciplines on export restrictions. Some existing regional trade agreements include such clauses (see Chapter 5).
An example of a situation where alternative strategies have been actively sought, and the difficulties of doing so, can be found in Korinek and Kim (2010). It concerns restrictions on exports of rare earths elements
15 by China, which is responsible for over 90% of their production and holds
a substantial share of the world’s reserves. Although export restrictions began in 2000, consuming countries did not react strongly to world market price increases, since these essential inputs are used in extremely small amounts in manufactured goods, so price changes could be absorbed by the final product market. However, when quotas began to introduce supply shortages in the second half of the last decade, importing countries began to implement a number of the strategies outlined above.
2.6. How successful are export restrictions in accomplishing their objectives?
Export restrictions are currently used to achieve a range of stated or implicit policy objectives. This section draws on the theoretical analysis and the ensuing discussion in previous sections to examine how successfully each of these policy objectives may be met. Clearly, a detailed empirical analysis would be required if the aim were to provide a quantified answer to the question posed for a particular country’s use of restrictions in a given sector. We focus on five commonly cited objectives.
1. Export restrictions provide indirect subsidies to downstream industries
Export restrictions are sometimes used by large countries to subsidise their downstream industries. At first glance, this industrial strategy may be valid in the case of a large country with market power on the world market. Imposing export restrictions on the raw material producers raises the world market price for the input purchased by foreign downstream industries while reducing the price for domestic downstream producers, thereby creating an indirect subsidy to their production process. This may be enough in the short run to increase the profitability in such industries so that they can develop to a position of global competitiveness and potentially capture markets abroad.
As with all policy instruments, however, problems such as the creation of vested interest may arise. Once an export restriction is in place, it may be difficult to remove it. A downstream firm that has been indirectly subsidised will lobby to keep the subsidy in place. It will also be in the interest of foreign raw materials suppliers that the policy be kept in place as they will also benefit from higher world prices. In addition, domestic downstream firms that use subsidised inputs will use them more intensively and adopt technologies that are more intensive in the input. Eventually, the economy as a whole will become more dependent on the raw materials.
In the longer term, using an export restriction to provide an indirect subsidy to downstream industries may incur significant costs in terms of the competitiveness of the country using the policy. Raw materials producers will incur an overall welfare loss. This may not be of particular concern to policy makers, in particular if the firm is foreign-owned. Even if it is a state-owned enterprise (SOE), the firm may pursue other societal objectives and not be strictly oriented towards profit and growth. The welfare of the raw materials producing sectors may be considered less important to policymakers because they are generally less labour-intensive. It should be noted, however, that the longer term impact of the policy will depend in part on the extent to which foreign raw materials producers can make up the difference in production levels.

82 – 2. ECONOMICS OF EXPORT RESTRICTIONS AS APPLIED TO INDUSTRIAL RAW MATERIALS
EXPORT RESTRICTIONS IN RAW MATERIALS TRADE: FACTS, FALLACIES AND BETTER PRACTICES © OECD 2014
In the country imposing the export restriction, the incentive for raw materials producers will be to limit exploration, technological improvements and innovation. This will have a significant effect in the long term on their productivity. If they continue to produce at similar levels, the overall impact of the export restrictions will depend on the potential of foreign raw materials producers to capture existing markets. If domestic raw materials producers lose significantly in competitiveness due to lower levels of investment, they may reduce production to the point where the country becomes a net importer of the raw material. Their impact on world markets would therefore be lost as would be the potential to subsidise input prices for downstream firms.
The potential impact of cheaper inputs on the downstream industry depends on the share of the input in the production process. The advantage of having access to a cheaper raw material may be significant when considering a downstream user that processes the raw material directly, for example, a smelter than transforms ore into metal or a facility that refines extracted ore. It will probably not provide significant assistance to most manufacturing industries further down the value chain that use the raw material in their final products, since the price advantage of the cheaper raw material will be diluted and will not bring a strong advantage.
The potential impact of export restrictions will only be felt as long as viable substitute products are not found. In the face of a price increase for an industrial raw material that is expected to be sustained over the medium-to-long term, whether the cause is an export restriction or other factors, users will seek alternative production methods using less of the restricted export, or substituting it altogether. In the short term this may be difficult but in the longer term it may be successful. There are many cases in economic history of such alternatives being developed when world market prices became relatively higher or producers were incapable of adequately supplying world markets.
Examples of alternatives to export restrictions for increasing the potential for spillovers into other sectors of the economy are presented in Chapter 7. Both Chile and Botswana have put considerable efforts into their industrial strategies without resorting to export restrictions.
2. Export restrictions generate government revenue
A significant number of countries use export taxes to generate government revenue. Some use them extensively for this purpose by applying substantial levels of tax on a wide variety of exported products. Indeed, in some countries export taxes are a major source of government revenue. The effects of export taxes on the raw materials sector have been outlined in previous sections: production and exports fall. Very often, when considering applying an export tax, policymakers mistakenly assume that present levels of production and exports will continue. It should be kept in mind that levels will drop, and therefore tax revenue may be less than expected. Indeed, Chapter 1 (Table 1.8) suggests that, exception in a few cases, export restrictions have not produced a substantial revenue for the government.
Tax revenue may also be less than expected in the longer term due to lower production levels if raw materials producers invest less in their operations and in exploration of new deposits. In this case, government revenue will fall short of expectations based on performance and there will be an incentive to apply export taxes on other products or find alternative methods of funding government expenditure. Revenue from taxation of the minerals sector is often best collected through a profit tax or a royalty, although this method of revenue collection requires more sophisticated institutions and adequate levels of governance (see Otto et al., 2006, for a detailed overview of the policy alternatives in the area of taxation of the extractive industries).
Export taxes are sometimes used to generate revenue for the government by countries that have difficulty collecting taxes in another way, such as property taxes, income taxes and corporate profits taxes. Reasons for this may include a lack of qualified personnel in tax administration, under-developed institutional capacity, or wider governance shortcomings. One important underlying issue is transparency. Although not put into place for the purpose of collecting taxes, implementation of the Extractive Industries Transparency Initiative (EITI)
16 can help to make transfers of funds from
the private to public sectors more transparent and accountable.

2. ECONOMICS OF EXPORT RESTRICTIONS AS APPLIED TO INDUSTRIAL RAW MATERIALS – 83
EXPORT RESTRICTIONS IN RAW MATERIALS TRADE: FACTS, FALLACIES AND BETTER PRACTICES © OECD 2014
3. Export restrictions help to conserve natural resources
A common reason given for using export taxes and quotas is to conserve the non-renewable natural resources that are the products of the extractive industries. Indeed, in some cases, private firms may have incentives to extract minerals at higher levels than optimal. There is a trade-off between extraction in the present period and potential future extraction. It should be noted, however, that the imposition of an export tax or quota that is expected to continue over time may dampen exploration and therefore lower future minerals extraction, possibly for many years.
Nonetheless, export restrictions will not necessarily help to achieve optimal extraction rates; they may actually exacerbate problems of over-exploitation. As already shown, the tax creates a price wedge between the domestic and world market price, encouraging domestic use. If as a result more of the products of the mining industry are sold on the domestic market, production may not be significantly lower, depending on the size of the domestic market. Downstream industries that avail themselves of cheaper raw materials due to the export restrictions may use materials more intensively. It is more desirable therefore to manage the total production level of the scarce resource, for example using a minerals tax or royalty, rather than to tax exports. A similar concern sometimes occurs with respect to environmental protection. Export restrictions are not the best way to increase disciplines in this area: emissions standards and environmental regulation of the sector are far superior.
4. Export restrictions monitor or control export activity, or control illegal export activity
Export taxes and quotas are not the best way to monitor export activity or control illegal exports. Chapter 7 includes an overview of some of the complex issues that are related to illegal production and export of metals and minerals in South America. Controlling exports can be done better by issuing export licenses. Monitoring of export activity and controlling illegal exports of metal products can be done better by adequate screening of exports and automatic procedures by which to check shipments. Trade facilitation reforms can also play a key role (see, for example, OECD, 2003).
Moreover, stopping illegal trade is best done in a plurilateral context. When a mechanism is in place for peer reviewing compliance with defined norms, an incentive is created for both importers and exporters to reduce or eliminate illegal trade. Within the context of the CITES convention, for example, some processes have been put in place to enforce mutual compliance so as to eliminate trade in certain animal and plant species (see OECD (2012) for a discussion of this issue).
Many countries ban the export of some of the waste products of the mining industry. Bans or heavy taxes on the export of waste and scrap may be in place to guard against the export of minerals masked as waste and scrap or the export of illegally obtained metal products. This is a well-documented concern in a number of countries. Waste and scrap are subjected to almost as many documented export restrictions as all metals and minerals combined (see Chapter 1). The analysis in this paper does not cover the export restrictions applied to waste and scrap, which is a somewhat separate issue. Given the nature of the product, it is likely to require a different model specification.
5. Export restrictions control flows of foreign exchange and manage the exchange rate
For some countries, exports of minerals or metals are the primary source of foreign currency denominated revenue. Mineral exports may in part determine the value of their exchange rate. For this reason, some central governments attempt to manage their exchange flows using export restrictions. The impact of export restrictions on the exchange rate is outside the scope of our theoretical analysis here and requires a different model specification. However, export restrictions are an inexact tool with which to manage the flow of foreign exchange, and doing so may be contrary to other development objectives. Export restrictions seem to be used less and less for controlling foreign exchange (see Chapter 1, Table 7). Chapter 7 discusses alternative policies other than export restrictions for achieving fiscal and exchange rate stability in the context of recent

84 – 2. ECONOMICS OF EXPORT RESTRICTIONS AS APPLIED TO INDUSTRIAL RAW MATERIALS
EXPORT RESTRICTIONS IN RAW MATERIALS TRADE: FACTS, FALLACIES AND BETTER PRACTICES © OECD 2014
experience in Chile, where the mining sector contributes 50% or more of the value of its exports (see also Korinek, 2013).
2.6. Some further implications of the theoretical analysis of export taxes and quotas
It has been shown that an export tax or quota in a large producing country implies a shift in welfare and in profits from domestic raw materials producers and foreign downstream producers to domestic downstream producers and foreign raw materials producers. Unless domestic downstream producers fully make up the loss of foreign sales, domestic raw materials producers move to lower production levels. Whether or not this occurs, the profit of domestic raw materials firms is lower, which induces a fall in their rate of investment. Downstream producers will increase production and their use of other inputs. In some cases, the downstream producer is a subsidiary or partner of the raw materials-producing firm. In this case, a within-firm reallocation of resources occurs. In mining, the downstream sector is generally more labour-intensive. Therefore, a net shift within the country imposing the restriction will occur toward greater investment in the downstream technology and toward job creation in the labour-intensive industry. It should be noted, however, that an export tax or quota causes a fall in employment in the mining of the raw material in the country imposing the policy. This may give rise to particular challenges, since many mines are located in geographically remote areas with few alternatives for employment.
Abroad, raw materials producers gain from higher world prices and lower exports of the firm(s) in the country that is subject to a tax or quota. Raw materials producers in countries that are not subject to the export restrictions therefore increase production. They may start exporting if not doing so already. Higher world market prices for their goods increase their profits. They may use the higher revenue to increase their investment, although the extent to which they do so will depend on the length of time they think the policy will be in place. Due to the uncertainty of the policy, they will engage in less investment than they normally would if they were responding to sustainable changes in market conditions rather than a policy that may be altered. Foreign downstream producers lose out because of higher prices for their inputs. They invest and produce less due to their lower profit margins. If their original margins were low, some firms may exit the market. Jobs will tend to decrease in countries not subject to the export restriction since the downstream industries tend to be more labour intensive.
Some downstream producing firms in the mining sector use proprietary technological processes. When this is the case, the downstream industry in the country imposing the export restriction is not necessarily able to take advantage of the more favourable market conditions due to the lower prices of its inputs. It will therefore look to foreign investment and transfers of technology in order to expand or initiate production. Issues of process patents are relevant here. Downstream foreign firms (i.e. firms outside the country imposing the export restriction on raw materials), hit by higher prices of inputs, may be willing to outsource some of their production to firms in the country where the export restriction is imposed. They may also be willing to sell some of their know-how or proprietary processes if they can no longer produce profitably. The government imposing the export restriction may use its position to create an incentive for greater investment in its downstream industry by competing foreign firms.
In the longer term, however, technological innovation in downstream production processes could suffer overall. This is because the returns to such innovation will have fallen in all countries outside the one imposing the export restriction. One area in which technological innovation will be fostered is in finding alternative materials, or ways in which to use less of the raw material whose export is restricted. If such a breakthrough occurs, the export restrictive policy will have been self-defeating, and all producers of the raw material will become less profitable due to lower demand for their goods and the subsequent fall in prices. In this case, downstream producers will be relatively less affected as they will adapt to a change in input (in the case of the foreign firms) or may continue to use the original input mix (in the case of the domestic firm). But if the domestic downstream firm is a subsidiary or partner to the raw materials producer, that firm will lose significantly.

2. ECONOMICS OF EXPORT RESTRICTIONS AS APPLIED TO INDUSTRIAL RAW MATERIALS – 85
EXPORT RESTRICTIONS IN RAW MATERIALS TRADE: FACTS, FALLACIES AND BETTER PRACTICES © OECD 2014
Ultimately, the outcome depends on specific market conditions. In some cases, foreign producers will increase production, and exports and market conditions will be restored close to their original levels. This is more likely when supply is not scarce or geographically located in a small area, and when the firm(s) located in countries not using export restrictions are able to produce at a similar cost to those in the country using the restriction. In other cases, use of an export restriction in one country may lead other countries to adopt a similar policy. In the case of an export tax, the impact of the measure will be diminished if other countries apply similar measures. Section 2.5 explored the question of an optimal set of export taxes that jointly maximise the welfare of exporting countries that wish to restrict their exports. It was stressed that the inter-country cooperation required to implement a collectively agreed policy would be difficult to achieve, and in any case the welfare of countries outside the agreement (including non-producing importing countries) would still be diminished.
The impact of an export tax or quota depends in part on the ownership of the raw materials firm in the country using the restriction. Lower profit levels due to the restriction may induce multinational raw materials producers to shift investment away from the country imposing the restriction to its mining operations elsewhere in order to benefit from higher world prices and avoid the restrictive measure. A state-owned raw materials producing firm may be less likely to focus exclusively on profit maximization and more mindful of economy-wide employment objectives than a privately owned firm, and so may not react as strongly to the imposition of the restriction. If so, the state-owned raw materials producer may reduce production, and even exports, less than a private firm would have done in order to supply government revenue through the tax or help achieve other societal goals, such as employment goals, for which a quota may have been placed.
A government considering implementing an export restriction may also take into account the ownership of the raw materials firm in its choice of policy instrument. When the raw materials firm is multinational with foreign headquarters, it may be more likely to use an export tax than an export quota to curb exports in order to collect revenue from the foreign-owned firm. By contrast, if an export quota were used, the multinational firm could well capture a substantial share of the quota rent. A government that is managing exports by colluding with a state-owned raw materials producer, however, may prefer to use a quota, allowing the SOE to capture the quota rent while the downstream industry is able to access their inputs at a lower price.
This reasoning may well dominate the choice of instrument when the main objective of export taxes is the collection of government revenue. When the revenue from export taxes is a significant part of total government revenue, and especially if income from raw materials exports is a significant share of GDP, export taxes rather than quotas will be a trade policy instrument of choice since they create revenue for the government.
17 The choice becomes more clear-cut when
the producing firm is foreign-owned and the downstream processing firms are domestically owned, since the export tax also implies a shift of welfare (and profit) from the foreign-owned firm producing domestically to downstream producers. However, this may not always occur. When the downstream industry is relatively weak or does not possess the necessary technology or growth potential to take advantage of the situation, imposition of an export tax will shift welfare away from the extractive industries firm but—in the domestic arena—only the government will benefit (through export tax revenue). Political economy factors could make the policy setting unstable. If the mining firms have a strong political voice within the country, they may use their influence to do away with the export restriction or limit its implementation.
Not only are foreign and domestic producers of the raw materials and their downstream products affected by an export restriction; so too are producers and consumers of complementary and substitute products. This is a particularly important issue in the metals sector since many rare and precious metals are alloyed with steel to produce materials with precise characteristics. In the country using the restriction, demand for complementary inputs (i.e. that are used together with the raw material) will increase, while demand for substitutes (that can be used instead of the raw material) will fall. On the world market, however, the reverse is true. Complementary products will suffer from imposition of the restriction, whereas substitutes, when they exist, will experience higher demand.

86 – 2. ECONOMICS OF EXPORT RESTRICTIONS AS APPLIED TO INDUSTRIAL RAW MATERIALS
EXPORT RESTRICTIONS IN RAW MATERIALS TRADE: FACTS, FALLACIES AND BETTER PRACTICES © OECD 2014
There is a further complication in metals and minerals markets due to the fact that some mining products are in part by-products of extraction of other minerals. One example is copper and molybdenum. Molybdenum is obtained from two different types of mines: primary molybdenum mines and copper mines. At primary mines, its recovery is the prime target of the mining operation. It is also mined as a by-product of copper extraction in some countries and regions. If the price of copper falls due to an export restriction, firms producing copper will reduce their production levels. In that case, their production of molybdenum will also fall, and once stockpiles of the unrefined by-product are exhausted, the domestic price of molybdenum will rise. If the copper-producing firms are significant global producers of molybdenum, the world price of molybdenum will also rise as a result of the export restriction on copper, other things remaining equal. If, however, the export restriction is placed on the by-product (molybdenum) rather than the main metal extracted (copper), production of the main product will continue while the by-product will probably be stockpiled as long as its price remains low. Hence, the impact of an export restriction on a product such as molybdenum may be quite complex, depending on a number of factors such as the type of production (primary or by-product), developments in related minerals markets (in this case, copper) and reactions of foreign producers in both primary and secondary markets.
The industrial raw materials that are produced from extractive industries are by nature non-renewable natural resources. Their supply, however, is not fixed in the medium term, nor is it always known. In many countries, new deposits are found regularly and information concerning existing deposits is revised. Imposing an export tax, and to an even greater extent an export quota, will negatively affect future production by reducing firms’ incentives to undertake new exploration. Exploration is a costly and high-risk activity, and most exploration ventures are unsuccessful. Firms are likely to reduce their exploration activities in countries imposing export restrictions, which then strongly compromises their future production possibilities. Given that exploration is a necessary activity in the extractive industries, the effects of export restrictions could be negatively felt in the domestic industry for many years.
It has been seen that some of the impacts of export restrictions are potentially stronger in the case of an export quota than with an export tax, although production levels and changes in world prices may be similar. With quotas, the incentive to capture the quota rent may lead to more collusive behaviour on the part of participating firms. The potential of collusion to fix prices is strong particularly in the case of a price-setting duopoly or small number of participating firms. This implies that governments implementing quantitative restrictions on exports need be mindful of such incentives to participating firms.
The impact of an export quota on economic actors is somewhat harder to ascertain due to potential differences in quota administration. In the case that export quotas are auctioned in an open-bidding process, their impact is potentially similar to that of a tax – the quota could in principle be sold at a price that would provide the government with the same amount of revenue as would be provided by a tax. However, the outcome could be quite different: competing firms or a single firm with substantial market power could obtain the quota rent and increase its profits while limiting production. Moreover, the amount of revenue generated by auctioning the export quota is generally thought to be less than the full quota rent in practice so the welfare shift from the exporting firms to the government in the case of the quota will probably be smaller than the potential maximum.
In reality, export restrictions have sometimes been justified as a way to counter a surge in the demand for a raw material due to an increase in demand for the processed product. As demand for both the raw material and the processed product rise, the quantitative restriction – assuming it is binding – reveals itself to be a more distorting trade policy instrument than an export tax, as the country using the quota maintains the same level of exports regardless of the international price of the product. International prices for the raw material will rise further in the case of a quantitative export restriction, relative to an equivalent export tax, and impacts on the downstream processing industry will be felt more strongly, i.e. downstream producers in both countries that have not imposed the export restriction will be hit harder whereas downstream producers in the country imposing the restriction will be more heavily subsidised, albeit indirectly.

2. ECONOMICS OF EXPORT RESTRICTIONS AS APPLIED TO INDUSTRIAL RAW MATERIALS – 87
EXPORT RESTRICTIONS IN RAW MATERIALS TRADE: FACTS, FALLACIES AND BETTER PRACTICES © OECD 2014
In the special case where international demand for the resource is completely inelastic, the export tax is unlikely to affect demand, and hence the quantity exported will not fall. World market price will increase by the amount of the tax. On the other hand, the export quota will restrict the physical volume of the good coming onto the world market, with steeply rising prices as importers compete for insufficient supplies. This explains the developments in the world markets for rare earths, for example, nearly all of which is supplied by China. Reaction from trading partners to China’s export tax introduced in 2000 was muted, but markets responded strongly when export quotas were subsequently introduced.
18
2.7. Conclusions
This chapter has presented the economic theory underlying the functioning of export taxes and quotas, first in a 2-country setting, where both countries are producers of the raw material resource, and then in a 3-country model where the two producing countries are joined by a non-producing, importing country. The Cournot-Nash oligopolistic model selected for the analysis corresponds well to the situation in mineral and metal resource industries, where a relatively small number of countries produce a substantial share of world output, which is then widely traded. The theoretical analysis is exploited to obtain insights into the complex pattern of price and welfare changes, and shifts in profitability and employment, that export restrictions unleash. Moreover, the similarities and differences between the two restrictive instruments – taxes and quotas – are fully explored, as well as the reasons governments may have for preferring one to the other. Whether and if so, in what circumstances, it is appropriate for a country to respond to an export restriction imposed by a trading partner or competitor by introducing a restrictive measure of its own is also examined, as well as other alternative reactions (which are the only possibilities for non-producing non-exporting countries for whom an export restriction is not an option). The theory also provides a valuable basis against which to evaluate the claims made by countries using export restrictions concerning their objectives and motivation. In most cases, the arguments put forward as justification are revealed to be partial or misguided, or in need of careful qualification.
The chapter has teased out some of the implications of the situation where the use of an export restriction by one country encourages a second exporter to do the same. Indeed, the analysis in the three country model (with two exporters and one, non-producing importer) suggests that both exporters will implement export restrictions in order to shield their processing sectors from competition. These policies could become further entrenched as time goes on and governments review their export restrictions in place. An outcome where both exporters use export restrictions is sub-optimal for both exporters and harmful for the importing country that does not produce the raw material. The theory indicates, however, that both exporters will act in this counter-productive fashion, characterised as a “prisoner’s dilemma” situation.
Policy makers in exporting countries will undoubtedly attempt to counteract the negative impact on welfare of this sub-optimal situation. One way to move forward is via an international agreement in which both exporting countries agree to reduce or eliminate their use of export restrictions. This might be attempted in the context of a regional or preferential trade agreement (RTA). In order to be recognised as such within the WTO, however, an RTA must diminish, not increase trade barriers.
19 An RTA must also eliminate the duties and other restrictive regulations of
commerce on “substantially all the trade” (GATT Article XXIV). Negotiating a ceiling to or the elimination of export taxes on a range of industrial raw materials would presumably need to be part of a wider-ranging package of trade policies in order to qualify as a preferential trade agreement. This may in practice be difficult to achieve.
The two exporting countries could otherwise try to come to a collusive agreement. In order to be effective, however, the agreement must be considered legally binding by both parties, and it is doubtful it would stand up against a dispute panel. Ostensibly, the outcome of the export restriction “repeated game” is therefore the sub-optimal one of imposition of an export restriction by both exporting countries. According to the theory, it is a repetitive outcome, i.e. exporting countries continue to use an export tax, other things being equal, and may even further reduce global welfare

88 – 2. ECONOMICS OF EXPORT RESTRICTIONS AS APPLIED TO INDUSTRIAL RAW MATERIALS
EXPORT RESTRICTIONS IN RAW MATERIALS TRADE: FACTS, FALLACIES AND BETTER PRACTICES © OECD 2014
by increasing their tax rates thereby bringing about a situation of competitive regulatory export barriers.
A possible reaction by the importing country is to retaliate in some way, either by imposing export restrictions of its own on a product it exports, or some other measure. Although this scenario is outside the confines of the two-sector, three-country model outlined here, it is a real option for the importing country which is doubly hit by the export restrictions placed by both raw materials exporters. If the importing country takes retaliatory measures, the welfare of both raw material exporters falls further, and global welfare is lower than it was before the importing country’s response.
The analysis here indicates that the outcome of the “repeated game” of export restrictions depends on the future discounted loss of cooperation, or alternatively the future discounted punishment. Moreover, the bargaining outcome is weighted by the market power of each player. In this way, larger players with greater market share may retaliate more credibly when faced with export restrictions that harm their producers. Smaller players will be less able to credibly retaliate in a non-cooperative situation.
WTO disciplines are much weaker as regards export restrictions compared with more “traditional” areas of international trade policymaking such as import restrictions, subsidies and non-cooperative trade practices.
20 Attempts to introduce disciplines in this area in international
negotiating fora have not met with overall success although disciplining export restrictions in agriculture has met with somewhat more consensus. The outcomes described above indicate that the use of export restrictions leads by default to a situation of lower global welfare. Insofar as this can be considered a market failure, an international regulatory response may be envisaged to discipline export restrictions on raw materials, in particular those that can be produced in a finite number of locations. Inasmuch as such disciplines would represent a regulatory response to an international market failure, they would represent a public good.
This chapter has illustrated the negative impact on welfare of the imposition of export restrictions and any subsequent reactive measures. In the case of a global welfare reducing measure, a remedy at the multilateral level would seem optimal. Similarly, large regional agreements could include the issue of export restrictions and some prominent existing RTAs have done so (see Chapter 5 of this volume). Export restrictions could also be at the forefront of newly-styled negotiations on disciplines necessary for supply-chain trade to flourish, as suggested by Richard Baldwin (Baldwin, 2012). If export restrictions were to be disciplined at a plurilateral level, it remains to be seen what the appropriate venue would be. An issue such as export restrictions could be discussed in a sectoral fashion similar to an ITA (Information Technology Agreement) for metals and minerals. This type of discussion has proven successful partly because it is of narrow enough scope to focus participants on the sector and the issues that are most important in governing it. As with the ITA, such negotiations are often discussed among a limited but substantial group and applied to all trade in the sector, i.e. multi-lateralised. Alternatively, discussions on export restrictions disciplines could be part of a single undertaking. Although such negotiations have proven difficult in the recent past, this may be the most logical from an economic standpoint.
Notes
1. K.C. Fung is Professor of Economics at the University of California at Santa Cruz and Jane Korinekis is a Trade Policy Analyst in the OECD’s Trade and Agriculture Directorate. The authors are grateful for comments and discussions on earlier versions of this chapter by Frank van Tongeren and Barbara Fliess of the OECD Secretariat, Roberta Piermartini of the WTO Secretariat, and Tim Josling, Professor Emeritus of Stanford University. Statistical assistance was provided by Tarja Mård. The final report benefitted from discussions in the OECD Working Party of the Trade Committee, which has agreed to make the study more widely available through declassification on its responsibility.

2. ECONOMICS OF EXPORT RESTRICTIONS AS APPLIED TO INDUSTRIAL RAW MATERIALS – 89
EXPORT RESTRICTIONS IN RAW MATERIALS TRADE: FACTS, FALLACIES AND BETTER PRACTICES © OECD 2014
2. Much of this chapter has been published separately as an OECD Policy Paper (Fung and Korinek, 2013). The basic model developed there is supplemented by the 3-country model included here in section 2.5.
3. www.oecd.org/tad/ntm/oecd_tad_methodologyinventoryexportrestrictionsrawmaterials.pdf provides a methodological note outlining the criteria used to compile the data, product and country coverage, etc. See also Fliess and Mård (2012).
4. More detail is given in Chapter 1. These are conservative estimates, since the criteria used for including countries in the Inventory mean that not all export restrictions in force for each product have been identified. Moreover, since export restrictions dampen trade flows, trade in products subject to export restrictions are lower than they would have been without the restrictions.
5. This is not to suggest that industrial raw materials supply is particularly elastic. In the short to medium term, however, many mining facilities can increase their levels of production somewhat. It would therefore, be inappropriate to illustrate these sectors using a perfectly vertical supply curve as is done in some of the analysis of the agriculture sector.
6. In particular, there appears to be no study that looks at the optimal path of export taxes on exhaustible resources (WTO, 2010, p. 148).
7. This is particularly likely for an industrial raw material that is a key input used in a sophisticated manufacturing supply chain.
8. It is unclear in the theoretical literature whether this is a significant issue. Stiglitz (1976) suggests that the rate of exploitation of exhaustible natural resources by a profit-maximizing monopolist is not higher than that in a competitive market.
9. This occurred with striking results for molybdenum after China implemented a series of export restrictive measures (see Korinek and Kim, 2010; Fung and Korinek, 2013, p.28, Box 2).
10. Details of how this model is solved can be found in Fung and Korinek (2013), Appendix.
11. For more on the issue of an optimal export tax in the raw materials sectors, see Tarr (2010), p. 139.
12. This would also be the case if the domestic resource firm is state-owned, in which case the quota rents are technically also owned by the government.
13. Relevant comparisons of export taxes and export quotas in the literature include Helpman and Krugman (1989), Krishna (1989), Grossman and Rogoff (1995).
14. December 2008 Revised Draft Modalities for Agriculture, TN/AG/W/4/Rev.4, Annex L.
15 Which are used in trace amounts in some high technology and environmental goods (hybrid vehicles, cell phones, computers, televisions, energy-efficient light bulbs and wind turbines).
16. This initiative was launched in 2003 to promote and oversee the EITI standard. Any country can observe this standard, but there are currently just 26 countries with the status “EITI compliant”, indicating that their relevant procedures have been validated.
17. An indication of the importance of export taxes in government revenue in some countries can be found in Chapter 1.
18 For more details, see Fung and Korinek (2013), p.31, Box 3.
19. “The purpose of a customs union or of a free-trade area should be to facilitate trade between the constituent territories and not to raise barriers to the trade of other contracting parties with such territories”, GATT Article XXIV, http://www.wto.org/english/tratop_e/region_e/regatt_e.htm.
20. Disciplines and procedures that have been used in different international fora to regulate export restrictions are outlined in Chapter 5 of this volume.

90 – 2. ECONOMICS OF EXPORT RESTRICTIONS AS APPLIED TO INDUSTRIAL RAW MATERIALS
EXPORT RESTRICTIONS IN RAW MATERIALS TRADE: FACTS, FALLACIES AND BETTER PRACTICES © OECD 2014
References
Abbott, P. (2011), Export Restrictions as Stabilizing Responses to Food Crisis, American Journal of
Agricultural Economics, 94(2), pp. 428-434.
Appleyard, D., A. Field, and S. Cobb (2010), International Economics, Seventh Edition, McGraw Hill.
Bagwell, K. and R. Staiger (2009a), Profit Shifting and Trade Agreements in Imperfectly Competitive Markets, NBER Working Paper 14803, March.
Bagwell, K. and R. Staiger (2009b), The Economics of Trade Agreements in the Linear Cournot Delocation Model, NBER Working Paper 15492, November.
Boadway, R. and M. Keen (2010), “Theoretical perspectives on resource taxation design”, in P. Daniel, M. Keen and C. McPherson (eds.) The Taxation of Petroleum and Minerals: Principles, Problems and Practice, Routledge and the International Monetary Fund, London and New York.
Bouet, A. and D. Laborde (2010), Economics of Export Taxation in a Context of Food Prices: A Theoretical and CGE Approach Contribution, IFPRI Discussion Paper 00994, June.
Brander, J. and B. Spencer (1984), Tariff Protection and Imperfect Competition, in Monopolistic Competition and International Trade, ed. Henryk Kierzkowski, Oxford: Oxford University Press, pp. 194-206.
Ethier, W.J. (1983), Modern International Economics, W.W. Norton and Co.
Fung, K.C. (2002), “International Trade and Bank Groups: Welfare Enhancing or Welfare Reducing?” Journal of the Japanese and International Economics, Vol.16.
Fung, K.C. (1995), “Rent Shifting and Rent Sharing: A Re-examination of the Strategic Industrial Policy Problem”, Canadian Journal of Economics, Vol. 28(2).
Fung, K.C. (1989a), “Tariffs, Quotas, and International Oligopoly”, Oxford Economic Papers, No. 41, pp.749-759.
Fung, K.C. (1989b), “Unemployment, Profit-Sharing and Japan's Economic Success”, European Economic Review, Vol. 33.
Fung, K. and J. Korinek (2013), "Economics of Export Restrictions as Applied to Industrial Raw Materials", OECD Trade Policy Papers, No. 155, OECD Publishing, Paris, http://dx.doi.org/10.1787/5k46j0r5xvhd-en.
Gandolfo, G. (1998), International Trade Theory and Policy, Springer-Verlag, Berlin.
Giordani, P., N. Rocha and M. Ruta (2012), “Food Prices and the Multiplier effect of Export Policy”, LLEE Working Paper No. 97, LUISS Guido Carli, March/April.
Grossman, G. and K. Rogoff (1995), Handbook of International Economics, Vol. 3, North Holland, Elsevier Science B.V.
Helpman, E. and P. Krugman (1989), Trade Policy and Market Structure, Cambridge, Massachusetts, MIT Press.
Helpman, E. and P. Krugman (1985), Market Structure and Foreign Trade: Increasing Returns, Imperfect Competition, and the International Economy, Cambridge, Massachusetts, MIT Press.
Howse, R. and T. Josling (2012), “Agricultural Export Restrictions and International Trade Law: A Way Forward”, IPC Position Paper, September.
Karapinar, B. (2011), “Export Restrictions on Natural Resources: Policy Options and Opportunities in Africa,” mimeo, World Trade Institute, University of Bern, Switzerland.

2. ECONOMICS OF EXPORT RESTRICTIONS AS APPLIED TO INDUSTRIAL RAW MATERIALS – 91
EXPORT RESTRICTIONS IN RAW MATERIALS TRADE: FACTS, FALLACIES AND BETTER PRACTICES © OECD 2014
Korinek, J. (2013), "Mineral Resource Trade in Chile: Contribution to Development and Policy Implications", OECD Trade Policy Papers, No. 145, OECD Publishing, Paris, http://dx.doi.org/10.1787/5k4bw6twpf24-en.
Korinek, J. and J. Kim (2010), "Export Restrictions on Strategic Raw Materials and Their Impact on Trade and Global Supply", in OECD, The Economic Impact of Export Restrictions on Raw Materials, OECD Publishing, Paris, http://dx.doi.org/10.1787/9789264096448-7-en.
Krishna, K. (1989), “Trade Restrictions as Facilitating Practices,” Journal of International Economics, Vol. 26.
Latina, J., R. Piermartini and M. Ruta (2011), “Natural resources and non-cooperative trade policy”, International Economics and Economic Policy, Vol. 8(2), June.
Liefert, W.M., P. Westcott and J. Wainio (2013), “Modifying Export Taxes and Quotas To Make Them Less Market-Distorting”, IATRC Working Paper, No. 13-04.
Liefert, W.M., P. Westcott and J. Wainio (2012), “Alternative Policies to Agricultural Export Bans that are less Market-Distorting”, American Journal of Agricultural Economics, Vol. 94(2).
Martin, W. and K. Anderson (2011), “Export Restrictions and Price Insulation during Commodity Price Booms”, American Journal of Agricultural Economics, Vol. 94(2).
Mitra, S. and T. Josling (2009), “Agricultural Export Restrictions: Welfare Implications and Trade Disciplines”, IPC Position Paper – Agricultural and Rural Development Policy Series, January.
Noguès, J. (2008), “The Domestic Impact of Export Restrictions: The Case of Argentina”, IPC Position Paper – Agricultural and Rural Development Policy Series, July.
OECD (2014), Inventory of Restrictions on Exports of Raw Materials.
http://qdd.oecd.org/subject.aspx?subject=8F4CFFA0-3A25-43F2-A778-E8FEE81D89E2.
OECD (2012), "Regulatory Transparency in Multilateral Agreements Controlling Exports of Tropical Timber, E-Waste and Conflict Diamonds", OECD Trade Policy Papers, No. 141, OECD Publishing, Paris, http://dx.doi.org/10.1787/5k8xbn83xtmr-en.
OECD (2003), “Trade Facilitation Reforms in the Service of Development”, paper prepared for the Working Party of the Trade Committee, Unclassified, 30 July 2003, http://vi.unctad.org/files/studytour/strussia10/files/12%20April/Hoffmann%20UNCTAD/OECD_TF%20Reform.pdf
Otto, J., C. Andrews, F. Cawood, M. Doggett, P. Guj, F. Stermole, J. Stermole and J. Tilton (2006), Mining Royalties: A Global Study of Their Impact on Investors, Government, and Civil Society, World Bank, Washington, D.C.
Piermartini, R. (2004), The Role of Export Taxes in the Field of Primary Commodities, World Trade Organization, Geneva.
Stiglitz, J.E. (1976), “Monopoly and the Rate of Extraction of Exhaustible Resources”, The American Economic Review, Vol. 66, No. 4, September.
Tarr, D. (2010), "The Economic Impact of Export Restraints on Russian Natural Gas and Raw Timber", in OECD, The Economic Impact of Export Restrictions on Raw Materials, OECD
Publishing, Paris, http://dx.doi.org/10.1787/9789264096448-8-en.
World Trade Organisation (WTO)(2010), World Trade Report 2010, Trade in Natural Resources, Geneva.

92 – 2. ECONOMICS OF EXPORT RESTRICTIONS AS APPLIED TO INDUSTRIAL RAW MATERIALS
EXPORT RESTRICTIONS IN RAW MATERIALS TRADE: FACTS, FALLACIES AND BETTER PRACTICES © OECD 2014
Annex 2.A.
Comparison of impacts of an export tax in the perfectly competitive case with the oligopolistic case
The model outlined in this annex assumes an oligopoly as this seems to most accurately reflect the minerals sector. Other models are possible, however, and the table below summarises the aggregate impacts of an export tax in two different ones.
Impact of export tax
Perfect competition, large country
Oligopoly
World price Increases Increases
Domestic price of exporting country Decreases Decreases
Terms of trade of exporting country Improves Improves
Domestic consumer surplus Increases Increases
Domestic producer surplus Decreases NA
Domestic economic rent NA Decreases
Domestic reaction curve NA Shifts in
Domestic output Increases Increases
Export Decreases Decreases

3. EFFECTS OF REMOVING EXPORT TAXES ON STEEL AND STEEL-RELATED RAW MATERIALS – 93
EXPORT RESTRICTIONS IN RAW MATERIALS TRADE: FACTS, FALLACIES AND BETTER PRACTICES © OECD 2014
Chapter 3
EFFECTS OF REMOVING EXPORT TAXES ON STEEL AND STEEL-RELATED RAW MATERIALS
Frank van Tongeren, James Messent, Dorothee Flaig, and Christine Arriola
1
3.1. Introduction
This chapter examines the consequences of export taxes on steel and steel-related raw materials for domestic industries and world markets. Information on export taxes is taken from the OECD Inventory of Restrictions on Trade in Raw Materials and used in the OECD Trade Model to simulate the global effects of removing all export taxes currently applied on steel and the main raw materials used in steel production: ferrous waste and scrap, iron ore, and coke.
Steel is one of the most widely produced industrial products in the world, with more than 90 countries involved in its production. Over the last 40 years, steel production worldwide has more than doubled from less than 600 million tons in 1970 to more than 1.4 billion tons in 2010. The period 2000-2007 was marked by unprecedented expansion, with a global growth rate exceeding 60% (World Steel Association, 2010a). This rapid growth in steel production has led to concerns about the sustainability of the supply of raw material inputs. In response, many governments have engaged in a range of policies that aim at securing inputs for their domestic steel making industries.
More recently, the financial performance of the global steel industry has been deteriorating following a period of relatively subdued activity immediately after the global economic and financial crisis. The market downturn, with current low steel demand and modest growth forecasts for the medium term, low prices and low profitability, is triggering further policy responses that negatively affect the openness and dynamism of global steel markets. Both import protection on the final product and export restrictions on raw materials have proliferated in the steel industry.
The remainder of this chapter describes the global steel industry and the current level of export taxes before discussing the effects of removing those taxes. The chapter draws on the key insights from the modelling results to conclude.
3.2. The global steel industry
The global steel industry has long been subject to government interventions. In many countries, the steel industry was considered a strategic sector and significant efforts were made to build up or to expand the domestic industry. Industrial growth is literally built on steel, as it is widely used in sectors such as building and infrastructure construction, automotive and other transportation, machinery and metal products, as well as in energy-related sectors like power generation and petrochemicals. In many countries, governments have often owned steel companies or maintained support programmes to foster and facilitate development of the industry (OECD, 2005).
Industrial users of steel products
Figure 3.1 shows the industries that purchase steel and its related raw materials as intermediate inputs, as represented in the OECD Trade Model database.
2 It shows that nearly 92%

94 – 3. EFFECTS OF REMOVING EXPORT TAXES ON STEEL AND STEEL-RELATED RAW MATERIALS
EXPORT RESTRICTIONS IN RAW MATERIALS TRADE: FACTS, FALLACIES AND BETTER PRACTICES © OECD 2014
of steel is used as an intermediate input in industrial products like metal products, steel, construction, motor vehicles or other manufacturing. Significant shares of the raw materials are purchased by the steel industry, but also by industries that themselves provide inputs into industrial production, including petroleum and coal products, and transport services.
Figure 3.1.Industrial users of steel and related raw materials, 2007
Source: OECD Trade Model database, base year 2007.
Global patterns of production and use
China is clearly the world’s largest producer of iron and steel (Figure 3.2). Its iron production is more than 7.5 times greater than that of the European Union, while its steel production is 4 times that of European Union (the world’s second largest steel producer) and 7 times that of Japan and nearly 9 times that of the United States.
The database of the OECD Trade Model includes both production and use data from 2007 (Figure 3.3). Comparing the production figures between Figures 3.2 and 3.3 shows the rapid growth of the Chinese iron and steel industry between 2007 and 2013. While China accounted for roughly a quarter of the value of global steel production in 2007 and about 40% of global iron ore production, its share in those commodities, measured in tons, had grown to 50% and 60% respectively by 2013.
0
10
20
30
40
50
60
70
80
90
%Steel
0
10
20
30
40
50
60
70
80
90
% Iron ore
0
10
20
30
40
50
60
70
80
90
%Coke
0
10
20
30
40
50
60
70
80
90
% Ferrous waste and scrap

3. EFFECTS OF REMOVING EXPORT TAXES ON STEEL AND STEEL-RELATED RAW MATERIALS – 95
EXPORT RESTRICTIONS IN RAW MATERIALS TRADE: FACTS, FALLACIES AND BETTER PRACTICES © OECD 2014
Figure 3.2. Global production of steel and iron, 2013
1. Iron figures are the sum of pig iron, blast furnace iron and direct reduced iron production. The countries included in these statistics accounted for approximately 99% of the blast furnace and 87% of direct reduced iron production in 2012.
2. The steel figures include 65 countries. Those countries accounted for approximately 99% of total world crude steel production in 2012. The figures are based on tons of production.
Source: World Steel Association.
More than 50% of the global production and use of ferrous waste and scrap takes place in the industrialised economies of the United States, the European Union and Japan. China is also a big producer and an even bigger consumer of this raw material, though Turkey is the world’s largest importer of scrap due to its vast steel production based on the scrap-intensive electric-arc furnace technology (see below). China is the world’s leading producer of steel, coking coal and coke. Although China is an important producer of iron ore, the quality (i.e. iron content) of its ore is comparatively low. After adjusting for the iron content of its iron ore, China is the world’s third largest iron ore producer, after Australia and Brazil. Adjusted for iron content, the country produced approximately 15% of the world’s iron ore, while it accounted for more than 54% of global demand in 2012. For this reason, China remains largely dependent on imports of iron ore, mainly from India and Australia, to meet the input requirements of its large and growing steel industry.
0
10
20
30
40
50
60
70
China Other EuropeanUnion
Japan India Russia Korea UnitedStates
Brazil Turkey South Africa Argentina Australia
%Iron
0
10
20
30
40
50
60
China Other EuropeanUnion
Japan UnitedStates
India Russia Korea Turkey Brazil South Africa Argentina Australia
%Steel
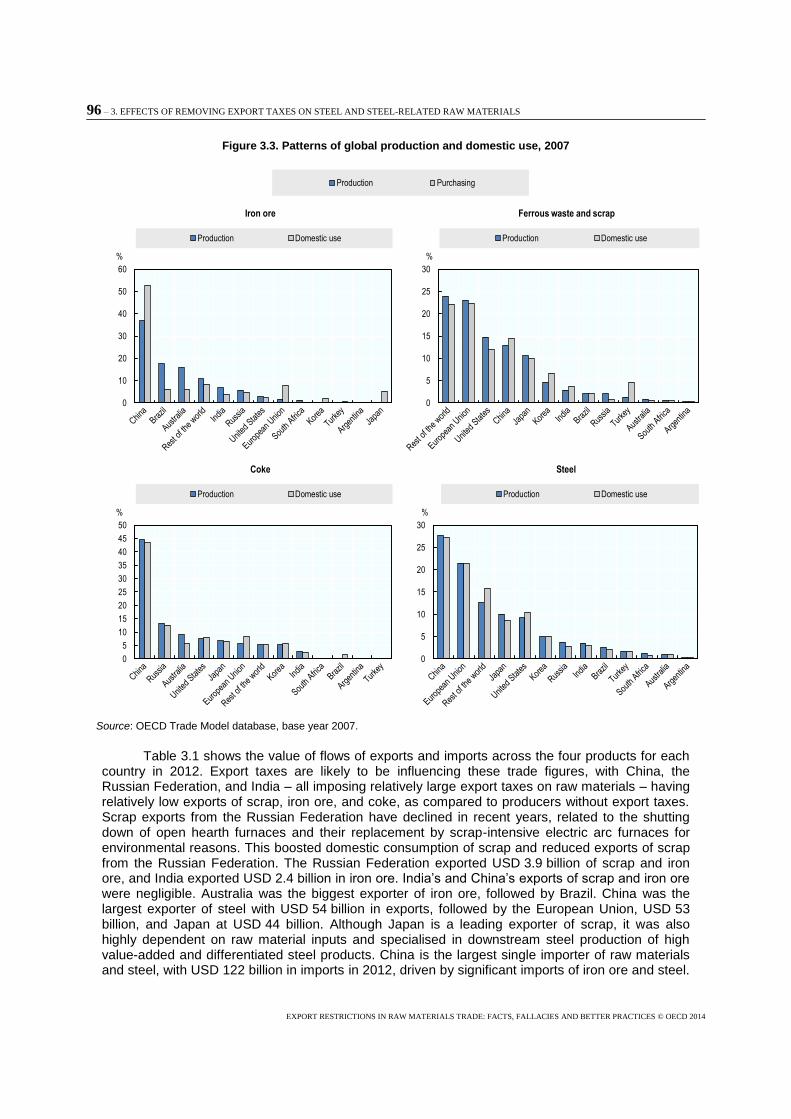
96 – 3. EFFECTS OF REMOVING EXPORT TAXES ON STEEL AND STEEL-RELATED RAW MATERIALS
EXPORT RESTRICTIONS IN RAW MATERIALS TRADE: FACTS, FALLACIES AND BETTER PRACTICES © OECD 2014
Figure 3.3. Patterns of global production and domestic use, 2007
Source: OECD Trade Model database, base year 2007.
Table 3.1 shows the value of flows of exports and imports across the four products for each country in 2012. Export taxes are likely to be influencing these trade figures, with China, the Russian Federation, and India – all imposing relatively large export taxes on raw materials – having relatively low exports of scrap, iron ore, and coke, as compared to producers without export taxes. Scrap exports from the Russian Federation have declined in recent years, related to the shutting down of open hearth furnaces and their replacement by scrap-intensive electric arc furnaces for environmental reasons. This boosted domestic consumption of scrap and reduced exports of scrap from the Russian Federation. The Russian Federation exported USD 3.9 billion of scrap and iron ore, and India exported USD 2.4 billion in iron ore. India’s and China’s exports of scrap and iron ore were negligible. Australia was the biggest exporter of iron ore, followed by Brazil. China was the largest exporter of steel with USD 54 billion in exports, followed by the European Union, USD 53 billion, and Japan at USD 44 billion. Although Japan is a leading exporter of scrap, it was also highly dependent on raw material inputs and specialised in downstream steel production of high value-added and differentiated steel products. China is the largest single importer of raw materials and steel, with USD 122 billion in imports in 2012, driven by significant imports of iron ore and steel.
Production Purchasing
0
5
10
15
20
25
30
%
Ferrous waste and scrap
Production Domestic use
0
5
10
15
20
25
30
%
Steel
Production Domestic use
0
10
20
30
40
50
60
%
Iron ore
Production Domestic use
0
5
10
15
20
25
30
35
40
45
50
%
Coke
Production Domestic use

3. EFFECTS OF REMOVING EXPORT TAXES ON STEEL AND STEEL-RELATED RAW MATERIALS – 97
EXPORT RESTRICTIONS IN RAW MATERIALS TRADE: FACTS, FALLACIES AND BETTER PRACTICES © OECD 2014
The European Union and the United States followed, both with large imports of steel. Korea was also a large importer of steel, and like the European Union also a large importer of iron ore.
This analysis distinguishes 12 regions and the rest of the world, selected due to their importance in the steel and raw material markets. Japan, China and the European Union had the highest net exports of steel in 2012, followed by the Russian Federation (Table 3.1). The United States and the Rest of the World are net importers of steel, as is Australia. The net trading position of the raw materials is more varied. Brazil and Australia are the largest net exporters, though their exports were less than the net imports of the two largest importers, China and Japan. India, Korea and Turkey were other important net importers of all three of these raw materials in 2012.
Table 3.1. Trade flows, 2012
Billions of USD
Steel Ferrous waste
and scrap Iron ore Coke
Exports Imports Exports Imports Exports Imports Exports Imports
Argentina 1.66 1.87 0.00 0.00 0.03 0.73 0.01 0.02
China 53.84 23.40 0.00 3.09 0.01 95.61 0.45 0.01
Japan 43.83 10.28 4.31 0.31 0.00 19.23 0.47 0.34
United States 20.84 45.03 9.44 1.65 1.44 0.80 0.21 0.40
India 11.04 10.94 0.01 4.48 2.43 0.42 0.15 1.14
Russia 23.40 8.72 1.41 0.00 2.49 0.83 0.58 0.18
Korea 30.28 21.37 0.32 4.87 0.01 9.53 0.00 0.15
Turkey 13.14 11.10 0.15 9.42 0.03 1.15 0.00 0.12
Brazil 11.15 5.01 0.22 0.02 30.99 0.00 0.00 0.59
Australia 0.74 4.48 1.00 0.01 56.73 0.13 0.30 0.00
South Africa 6.71 1.70 0.66 0.00 7.51 0.09 0.01 0.38
European Union - including intra EU trade
177.47 155.99 24.01 18.00 3.44 17.17 3.26 2.66
European Union - excluding intra EU trade
54.34 35.00 8.91 2.25 3.01 13.98 0.92 0.28
Rest of world 78.70 155.25 6.70 10.46 15.19 8.22 1.97 1.52
Total including intra EU trade 472.79 455.13 48.23 52.31 120.30 153.93 7.40 7.52
Total excluding intra EU trade 349.66 334.14 33.12 36.56 119.86 150.74 5.06 5.15
Note: Total exports do not match total imports in the trade statistics used here.
Source: UN COMTRADE, 2012.
The economic importance of steel and steel-related raw materials varies across the countries and regions considered in this chapter. In 2007, the base year of the model, these commodities together represent more than 10% of industrial production in emerging economies, and significant shares of industrial value added. Value added is the remuneration of primary production factors, labour and capital, and is a measure of the contribution of the industry to Gross Domestic Product (GDP) (Figure 3.4). Iron and steel, iron ore and coke also contribute substantially to Australia’s economy in terms of production and exports.
3 These commodities are relatively
important for Turkey, Korea and Japan also, which are all major steel exporters but are heavily reliant on raw material imports. In contrast, the steel complex contributes less to the economies of the European Union and the United States, but the shares of industrial production and value added are still around 4%. In South Africa and India, the share of steel and steel-related materials in industrial value added exceeds the share in production, which may point to the use of relatively labour-intensive production methods in those countries

98 – 3. EFFECTS OF REMOVING EXPORT TAXES ON STEEL AND STEEL-RELATED RAW MATERIALS
EXPORT RESTRICTIONS IN RAW MATERIALS TRADE: FACTS, FALLACIES AND BETTER PRACTICES © OECD 2014
Figure 3.4. Share of steel and steel-related raw materials in domestic industrial production and value added, 2007
Note: Industrial production and industrial value added contains all sectors other than agriculture, food and services.
Source: OECD Trade Model database, base year 2007.
Steel production methods
There are two main processes for making steel: ore-based and scrap-based. The ore-based process either combines iron ore and coke in a chemical reaction to produce molten iron, or iron ore is heated with natural gas to make direct reduced iron. The molten iron can be cooled to make pig iron, or placed directly in a basic oxygen furnace (BOF) with small amounts of carbon and up to 30% steel scrap to produce steel. In the scrap-based process, steel scrap, often with small amounts of pig iron or direct reduced iron, is melted in an electric arc furnace (EAF) to produce steel. These three materials – iron ore, coke, and steel scrap – constitute by weight and volume by far the greater part of the raw materials used in steel making (Price and Nance, 2010).
4
While many countries rely more on the BOF process, the EAF process is the primary method in several countries including the United States, Mexico, and Turkey (World Steel Association, 2010b). This is reflected in the OECD Trade Model database, with the steel industry purchasing significantly more scrap than iron ore in the United States and Turkey, and high cost shares of scrap in India, South Africa and the European Union. China, at the other end of the spectrum, purchases 2.5 times more iron ore than scrap for its steel making industry, although scrap use has been increasing in recent years.
5
Steel industry export taxes
Chapter 1 of this volume presents the OECD Inventory of Restrictions on Trade in Raw Materials, which includes measures on the following steel related raw materials: iron ore, chromium, cobalt, limestone, manganese, molybdenum, nickel, niobium, silicon, tin, titanium, tungsten, vanadium, zinc, coking coal and coke as well as ferroalloys and scrap. Nearly two-thirds (61%) of the quantifiable measures in the OECD Inventory are export taxes, which are usually levied as an ad valorem tax. Only a small fraction of the cases are specific taxes (i.e. a specific amount of money per ton) or mixed taxes.
6 For the analysis reported in this chapter, only ad valorem export
taxes for the year 2012 are taken into account and other types of taxes and remaining export measures, such as non-automatic export licensing, are ignored The tax rates at the HS6 level are combined with COMTRADE trade statistics to calculate trade-weighted average tax rates at the level of commodity, country, and trade partner aggregation used in the trade model analysis. Countries and commodities verified as having no export restrictions are included in the analysis with
0
2
4
6
8
10
12
14
16
18
China Brazil Australia South Africa Turkey Korea Russia India Japan Argentina Rest of theworld
EuropeanUnion
UnitedStates
%
Production Value Added

3. EFFECTS OF REMOVING EXPORT TAXES ON STEEL AND STEEL-RELATED RAW MATERIALS – 99
EXPORT RESTRICTIONS IN RAW MATERIALS TRADE: FACTS, FALLACIES AND BETTER PRACTICES © OECD 2014
Figure 3.5. Export tax rates, ad valorem percentage
Source: OECD Trade Model database.
a zero tax rate. Additional information on export taxes that are not included in the OECD Inventory because of its incomplete country or sector coverage is taken from the GTAP database (version 8.1)
The level of taxes as included in the Inventory and mapped to the model aggregation is shown in Figure 3.5. Some export tax rates are high and may exceed 30% of the value of the exported product. In addition, export taxes can accumulate in the value chain. For example, the price that Chinese importers of iron ore from India have to pay includes a 30% average export tax, and China itself charges an average tax of 3.7% on exported finished steel. The calculation of average export taxes on steel takes into account the existing tax exemptions in India and China. The iron and steel sector as delineated in the model database comprises 209 codes of the harmonized system (HS) and includes semi-processed and processed goods. The OECD Inventory of export restrictions covers 162 of these lines (semi-processed only). China imposes an export tax on 48 of those products, which covers about 9% of the exports in 2010-2012. China’s export taxes on individual semi-processed steel products can vary between 0% and 25%, and the average tax on the subset of steel products that is taxed amounts to about 15.6%. For India the number of steel-related HS lines with an export tax is smaller and various exemptions on export duties are currently in place, typically exempting the more processed products from the export tax.
0
5
10
15
20
25
30
35
40
45
China Russia Rest of the world
%Coke
0
5
10
15
20
25
30
35
China India Russia Rest of the world
%Ferrous waste and scrap
0
5
10
15
20
25
30
35
India Argentina China Rest of the world
%Iron ore
0
1
2
3
4
5
6
7
India China Rest of the world Argentina
%Steel

100 – 3. EFFECTS OF REMOVING EXPORT TAXES ON STEEL AND STEEL-RELATED RAW MATERIALS
EXPORT RESTRICTIONS IN RAW MATERIALS TRADE: FACTS, FALLACIES AND BETTER PRACTICES © OECD 2014
In view of high tax rates and the large volumes of exports, export taxes on steel and steel-related raw materials make notable contributions to government revenue in China and India, while they are negligible in the other countries considered in this analysis. Calculations based on the trade model database and IMF statistics (IMF, 2014) show that in both cases these taxes amount to about 1% of government income. Consequently, changes in export taxes have repercussions on the government budget and these impacts are taken into account in the modelling analysis.
3.3. Modelling approach
The OECD Trade Model is a multi-regional, computable general equilibrium (CGE) model, which provides a unique vehicle for capturing inter-industry affects while tracking differences in trade patterns by individual country and sector. This model is employed to simulate the effects on international trade of removing export taxes in the steel industry and the broader effects of this change throughout the domestic and global economy.
Since supply chains are increasingly global, relying on imported intermediate inputs and exporting finished and semi-finished products for further processing, the removal of a trade distortion at one point spreads throughout the global economy. These effects are captured in the OECD Trade Model by distinguishing trade on a bilateral basis (between countries) as well as by end use (whether an imported product is used as an intermediate input, for final consumption, government consumption or as a capital good). Imports compete with domestic goods, and producers’ decisions to export are based on relative price differentials between domestic and foreign markets. The model tracks all intermediate inputs used in production, as well as the primary production factors labour and capital. Further details of the model and the aggregation used in these scenarios are provided in Annex 3.A.
In order to capture the fiscal implications of removing export taxes, the model allows government expenditure to change, while all tax rates other than export taxes remain fixed at observed levels. All countries’ exchange rates are held constant, thus trade balances are assumed to adjust. Sensitivity analysis of the robustness of the results to these assumptions was carried out and is reported in the relevant sections, as well as summarised in Annex 3.C.
3.4. Removing export taxes
Export taxes create a wedge between the price that exporters receive and the price that importers have to pay. As shown in Chapter 2, the wedge raises the tax-inclusive price that international buyers have to pay and because this depresses demand it also reduces the price that sellers on export markets receive. Conversely, removing these taxes will increase the returns from exporting relative to selling in the domestic market. Simultaneously, the price that importers have to pay falls, triggered by the tax removal and increasing export supply. How big these effects are depends on size of the supply response, the market share of the exporter and the elasticity of import demand. The OECD Trade Model takes all those effects into account and in addition includes cross-market effects, such as changing steel production costs due to removal of export taxes on raw materials. There are important indirect effects through the supply chain to consider. Lower import prices for steel-related raw materials can be expected to lower steel production costs to countries importing them, which in turn can reduce the price of steel used in other activities, such as infrastructure and motor vehicles.
The effects of export taxes are examined by conducting a counterfactual simulation experiment that asks the question: what if all export taxes on steel and steel-related raw materials shown in Figure 3.5 were simultaneously removed?’
Changes in international trade prices
Removing export taxes raises the export prices that producers in the reforming countries receive (the “sellers’ price” in Table 3.2), while lowering the price that importers have to pay (the “buyers’ price” in Table 3.2) for those commodities. Table 3.2 shows the extent to which the removal

3. EFFECTS OF REMOVING EXPORT TAXES ON STEEL AND STEEL-RELATED RAW MATERIALS – 101
EXPORT RESTRICTIONS IN RAW MATERIALS TRADE: FACTS, FALLACIES AND BETTER PRACTICES © OECD 2014
of the export tax wedge ultimately leads to changes in those prices, once all the direct and indirect market adjustments are taken into account. For example, the average export tax on scrap and ferrous metals in the Russian Federation is estimated at 13.4%. After removal of this tax and all other export taxes shown in Figure 3.5, the price that international buyers of Russian scrap and ferrous metals have to pay is reduced by 10.4%, which is less than the change of the tax rate. The price that Russian sellers receive is increased by 4.4%, driven by an expansion of international demand for their products. Sellers’ prices fall in countries that do not make any policy changes, as international supply in those products increases, and changes in international markets are already fully transmitted to domestic producers.
Table 3.2. Simulated changes in international trade prices, percentage change from base
Steel Ferrous waste
and scrap Iron ore Coke
Exporter/ Importer
Buyers' price
Sellers' price
Buyers' price
Sellers' price
Buyers' price
Sellers' price
Buyers' price
Sellers' price
Argentina -1.42 0.35 -0.81 -0.81 -9.99 0.02 -13.59 -13.59
China -2.19 1.71 -18.01 24.08 -6.99 3.34 -28.73 18.78
Japan -0.78 -0.78 -0.89 -0.89 0.00 0.00 -8.67 -8.67
United States -0.51 -0.51 -0.86 -0.86 -0.08 -0.08 -6.25 -6.25
India -3.05 3.22 -7.54 7.86 -24.92 7.14 -18.14 -18.14
Russia -0.37 -0.31 -10.39 4.42 -0.49 -0.49 -10.04 -6.33
Korea -0.63 -0.63 -0.23 -0.23 0.31 0.31 11.13 11.13
Turkey -1.03 -1.03 -0.03 -0.03 1.29 1.29 26.80 26.80
Brazil -0.73 -0.53 -0.47 -0.39 -0.40 -0.40 0.04 0.04
Australia -0.45 -0.45 -0.34 -0.34 -0.55 -0.55 -9.32 -9.32
South Africa -0.51 -0.51 -0.36 -0.36 -0.04 -0.04 -2.10 -2.10
European Union
-0.43 -0.42 -0.36 -0.36 -0.04 -0.04 -6.60 -6.60
Rest of the World
-1.23 0.35 -1.48 0.45 -0.73 -0.42 -9.03 -8.78
Note: Reforming countries indicated by bold and italicised text.
Source: OECD Trade Model.
Removal of export taxes increases the returns from exporting relative to serving the domestic market, but there is an exception in the case of coke: the Russian Federation imposes a relatively low export tax on coke and has a small share on the relatively thin world market for coke. China is the biggest exporter of coke according to the data reported in Table 3.1, and its coke exports increase substantially (about 50%) after the simulated removal of export taxes. As a result, world prices for coke plummet and this leads to a fall in the price that Russian exporters receive. The same reasoning holds for the Rest of the World.
Macroeconomic results
The macroeconomic effects of the removal of export taxes are found to be quite modest, with negligible impacts on GDP in individual countries. Globally, households experience an increase of about USD 10.5 billion, or 0.03% of household income. Relatively small macroeconomic effects are consistent with the sector-specific and country-specific nature of the simulated policy change. Improvements in GDP and household income stem from improved allocation of resources and the model does not take dynamic effects through investments into account.
The removal of export taxes may have some noticeable impact on government revenue, especially in China and India. The model assumes that the loss in tax revenue is translated into a reduced level of government expenditure. In order to test the macroeconomic importance of this

102 – 3. EFFECTS OF REMOVING EXPORT TAXES ON STEEL AND STEEL-RELATED RAW MATERIALS
EXPORT RESTRICTIONS IN RAW MATERIALS TRADE: FACTS, FALLACIES AND BETTER PRACTICES © OECD 2014
assumption, an alternative model specification requires income tax rates to adjust to keep government expenditure fixed. While this is clearly a very simple specification of the fiscal implications, it illustrates the weight of export tax revenue in the government accounts. At the macro level, this alternative closure has marginally greater negative GDP effects for these two countries, as the burden of government expenditure shifts from export to income tax, and private consumption in the two countries falls.
Although the counterfactual policy simulation concerns changes in only a few sectors and only in the subset of countries that have export taxes in place in the base data, the results show important effects on boosting global trade. Each region becomes more connected with the global economy, as reflected by each region’s increased imports, with additional imports totalling about USD 13.8 billion. Exports increase mostly in those economies with significant export taxes in the base data, while exports in the remaining regions fall slightly, reflecting different patterns of demand effects associated with the change in relative prices.
7
Steel and relevant raw material industries
The regions with the highest rates of export tax on scrap, iron ore and coke experience the greatest price movements when these taxes are removed, leading to increased export demand for their products, which provides a stimulus to production. There are some large increases in export values. The Russian Federation increases its scrap exports by USD 1.3 billion (+67%), India increases iron exports by USD 2.5 billion (+49%), and China increases coke exports by USD 2.2 billion (+50%), but some of the large percentage changes reported in Table 3.3 stem from the small initial base values of most of these countries (for example, China and India in the scrap industry, China in the iron ore industry, and India in the coke industry).
Economies with no export taxes in the base run, and hence no policy change, experience more competition on the international raw materials market and see their market shares reduced. This illustrates the profit-shifting effect discussed in Chapter 2, where the theoretical model showed that an export tax can raise the relative profitability of other countries’ raw materials sectors. For example, the removal of export taxes on iron ore by Argentina, and India leads to expansion of their iron ore output and greater supplies to world markets. This in turn leads to contractions of iron ore production in those countries that had no export restriction on iron ore in place. The expansion of iron ore production is simulated to amount to nearly 1% in Argentina and 21% in in India (Table 3.3). China, on the other hand is found to reduce its iron ore production by 1.2%, although it is amongst the countries that removes its export tax on iron ore. It had a relatively low export tax when compared to the level of other export taxes on these commodities; as a result, prices of its international competitors fall relatively further and demand from both domestic and international buyers shifts to those cheaper inputs.
As a result of removing export taxes on these inputs into steel making, the sourcing of these raw materials shifts to where they are relatively cheaper. When prices of both domestic and foreign inputs into an industry fall, the decline tends to be greater for domestic inputs, which suggests a relative shift towards cheaper foreign supply. For example, domestic prices for ferrous waste and scrap input into steel making in the European Union are simulated to fall by 0.2% while prices of imported ferrous waste and scrap decline by 1.1%.
The falling prices of foreign intermediate inputs causes a shift in sourcing patterns of steel making inputs: all countries and country blocs increase their imports of intermediate inputs and in some cases this is at the expense of domestic input sources (Table 3.3). The economies that remove taxes on steel (Argentina, China, India, Rest of the World) see the fastest expansion of their output, and as this expansion requires more inputs they also increase purchases from domestic intermediate producers, although their input mix is simulated to have a higher share of imports.

3. EFFECTS OF REMOVING EXPORT TAXES ON STEEL AND STEEL-RELATED RAW MATERIALS – 103
EXPORT RESTRICTIONS IN RAW MATERIALS TRADE: FACTS, FALLACIES AND BETTER PRACTICES © OECD 2014
Table 3.3. Simulated effects on producing industries
Percentage change from base
ARG CHN JPN USA IND RUS KOR TUR BRA AUS ZAF EU ROW
Steel
Production
Quantity produced 1.65 0.96 -0.12 -0.79 2.36 -1.41 -0.78 1.13 -0.11 -1.02 -0.73 -0.76 0.69
Production cost -0.23 -0.52 -0.67 -0.15 -0.24 -0.02 -0.55 -1.16 -0.46 0.01 -0.29 -0.34 -0.27
Production inputs
Domestic steel inputs 1.60 0.74 -0.56 -1.30 2.12 -2.04 -1.36 0.23 0.02 -1.44 -0.90 -1.42 0.09
Imported steel inputs 2.05 3.26 2.96 1.38 3.75 2.46 1.32 3.28 1.39 1.71 1.41 0.03 1.74
Total imported inputs 1.96 2.41 2.25 0.48 2.65 0.28 0.94 2.88 0.38 0.00 -0.06 -0.19 1.39
Exports
Intermediate exports 3.45 7.76 -0.46 -1.83 13.65 -2.29 -1.01 1.50 -0.31 -2.34 -1.39 -1.00 2.63
Total exports 3.45 7.89 -0.46 -1.83 13.65 -2.21 -1.01 1.50 -0.31 -2.34 -1.39 -1.00 2.60
Ferrous waste and scrap
Production
Quantity produced 1.55 1.28 -0.23 -1.61 0.50 46.78 -2.03 -4.90 0.12 -1.45 -0.80 -3.13 0.22
Production cost -0.22 -0.26 -0.27 -0.06 -0.01 -0.03 -0.37 -0.34 -0.03 0.01 -0.04 -0.10 -0.21
Production inputs
Domestic steel industry inputs 1.49 1.36 -0.22 -2.07 0.53 46.83 -2.29 -4.62 0.05 -1.83 -0.99 -3.43 -0.07
Imported steel industry inputs 2.00 1.16 -0.10 -1.54 0.33 46.86 -1.96 -4.85 0.18 -1.38 -0.76 -3.06 0.31
Total imported inputs 1.85 0.11 0.04 -0.06 0.02 1.23 -0.06 -0.08 0.01 -0.01 0.00 -1.74 0.43
Exports
Intermediate exports -0.20 97.00 -2.02 -3.91 26.12 66.95 -1.63 -4.02 -0.93 -2.44 -1.73 -3.89 2.22
Total exports -0.20 97.00 -2.02 -3.91 26.12 66.95 -1.63 -4.02 -0.93 -2.44 -1.73 -3.89 2.22
Iron ore Production
Quantity produced 0.86 -1.15 1.16 -0.15 21.36 -0.31 -0.60 0.15 -2.04 -2.92 -3.83 -0.40 -0.59
Production cost 0.01 -0.06 -0.02 -0.01 0.17 0.01 0.00 0.04 0.00 -0.01 -0.02 -0.01 0.01
Production inputs
Domestic steel inputs 6.86 -2.24 4.35 -0.51 21.06 -0.47 -0.45 0.90 -2.07 -3.00 -6.06 -1.07 -0.73
Imported steel inputs -1.37 2.56 2.19 26.95 1.27 2.06 0.28 -0.13 -1.35 17.33 0.00 -0.07
Total imported inputs 0.28 -0.55 36.17 0.07 21.40 -0.07 -0.63 0.15 -2.07 -2.79 -3.71 -0.38 -0.57
Exports
Intermediate exports 0.89 9.34 1.22 -0.38 48.54 -1.78 0.29 3.96 -3.21 -4.52 -3.87 -0.52 -1.88
Total exports 0.89 9.34 1.22 -0.38 48.54 -1.78 0.29 2.98 -3.21 -4.52 -3.87 -0.52 -1.88

104 – 3. EFFECTS OF REMOVING EXPORT TAXES ON STEEL AND STEEL-RELATED RAW MATERIALS
EXPORT RESTRICTIONS IN RAW MATERIALS TRADE: FACTS, FALLACIES AND BETTER PRACTICES © OECD 2014
Table 3.3. Simulated effects on producing industries (cont.)
Percentage change from base
ARG CHN JPN USA IND RUS KOR TUR BRA AUS ZAF EU ROW
Coke Production
Quantity produced -26.06 3.35 -3.87 -3.73 -2.75 -0.34 -0.48 -29.09 -43.31 -0.31 -36.89 -14.31 -2.92
Production cost 0.02 0.07 0.00 0.00 0.12 0.01 0.01 0.00 -0.09 -0.08 -0.01 0.02 0.02
Production inputs
Domestic steel inputs 3.22 -3.96 -2.76 -0.62
Imported steel inputs 4.53 -1.95 -1.94 5.67
Total imported inputs -25.16 3.35 -3.87 -3.75 -2.36 -0.30 -0.49 -13.00 -43.37 -0.85 -36.90 -14.32 -2.92
Exports
Intermediate exports -45.43 50.17 -20.97 -16.22 -36.65 -13.03 24.21 12.04 -48.49 -18.87 -42.36 -27.14 -19.83
Total exports -45.42 50.16 -20.97 -16.22 -36.65 -13.03 24.11 13.64 -48.49 -18.87 -42.36 -27.14 -19.83
Notes: (1) For the individual sector results, ‘exports’ refers to the commodity exports of the sector and ‘imports’ refers to total intermediate commodities imported to that sector. (2) In this table, ‘steel inputs’ relates to the use of steel and related raw materials as inputs into the production process in each sector.
Source: OECD Trade Model.

3. EFFECTS OF REMOVING EXPORT TAXES ON STEEL AND STEEL-RELATED RAW MATERIALS – 105
EXPORT RESTRICTIONS IN RAW MATERIALS TRADE: FACTS, FALLACIES AND BETTER PRACTICES © OECD 2014
Table 3.4. Simulated effects on major steel or related raw materials purchasing industries, percentage change from base
ARG CHN JPN USA IND RUS KOR TUR BRA AUS ZAF EU ROW
Metal products and machinery
Production
Quantity produced 0.15 0.31 0.02 -0.06 0.19 0.01 0.10 0.48 0.07 -0.15 -0.03 -0.05 0.19
Production cost -0.10 -0.15 -0.07 -0.03 -0.18 -0.04 -0.08 -0.17 -0.07 -0.01 -0.05 -0.03 -0.10
Production inputs
Domestic steel inputs 0.06 0.35 -0.03 -0.60 0.22 -0.54 -0.35 1.04 -0.02 -0.63 -0.24 -0.41 -0.25
Imported steel inputs 0.58 0.66 2.01 2.45 0.44 3.29 1.96 0.13 3.30 2.37 1.97 0.40 0.86
Total imported inputs 0.29 0.20 0.21 0.48 0.13 0.49 0.40 0.43 0.39 0.38 0.31 0.07 0.36
Exports
Intermediate exports 0.20 0.46 0.05 -0.13 0.52 -0.03 0.13 0.74 0.10 -0.25 -0.07 -0.07 0.24
Total exports 0.17 0.43 0.02 -0.15 0.45 -0.06 0.04 0.65 0.05 -0.27 -0.05 -0.09 0.22
Other metals and minerals
Production
Quantity produced 0.03 0.34 0.02 -0.03 0.50 0.05 0.05 0.17 0.23 -0.33 0.07 0.00 0.07
Production cost 0.00 -0.16 0.00 -0.01 -0.17 0.01 -0.01 0.01 -0.09 0.07 -0.01 -0.02 -0.02
Production inputs
Domestic steel inputs -0.15 -0.56 -0.06 -0.50 0.64 -0.10 -0.16 0.33 0.19 -0.40 -0.14 -0.64 -0.25
Imported steel inputs 0.09 4.10 1.96 3.11 0.08 1.35 1.86 0.10 2.27 0.78 2.08 0.51 0.55
Total imported inputs 0.08 0.85 0.03 0.09 0.47 0.30 0.07 0.18 0.28 -0.12 0.11 0.05 0.12
Exports
Intermediate exports 0.01 0.60 -0.01 -0.01 0.78 -0.01 0.03 0.08 0.34 -0.39 0.08 0.00 0.07
Total exports 0.00 0.60 -0.01 -0.01 0.77 -0.01 0.02 0.07 0.34 -0.39 0.08 0.00 0.07
Rest of petroleum and coal products
Production
Quantity produced 0.01 0.75 0.00 -0.03 0.06 -0.01 0.03 0.28 0.47 0.08 -0.08 -0.06 0.00
Production cost 0.04 -0.04 0.01 0.01 0.12 0.02 0.02 -0.03 -0.21 -0.06 -0.01 0.03 0.03
Production inputs
Domestic steel inputs -0.13 0.76 -0.06 -1.02 -0.88 -0.39 0.03 0.47 0.41 0.08 -0.57 -4.12 -0.03
Imported steel inputs -5.00 2.24 1.93 51.72 19.38 18.77 1.87 0.23 0.49 -0.50 0.21 32.16 0.43
Total imported inputs 0.03 0.77 0.00 -0.05 0.47 0.57 0.03 0.30 0.25 -0.45 -0.12 -0.02 0.00
Exports
Intermediate exports 0.01 0.65 0.10 0.01 0.00 0.04 0.11 0.35 0.69 0.20 -0.08 -0.04 0.03
Total exports 0.01 0.63 0.10 0.01 0.00 0.04 0.10 0.35 0.69 0.20 -0.08 -0.04 0.02
Notes: (1) For the individual sector results, ‘exports’ refers to the commodity exports of the sector and ‘imports’ refers to total intermediate commodities imported to that sector. (2) In this table, ‘steel inputs’ relates to the use of steel and related raw materials as inputs into the production process in each sector. Source: OECD Trade Model.

106 – 3. EFFECTS OF REMOVING EXPORT TAXES ON STEEL AND STEEL-RELATED RAW MATERIALS
EXPORT RESTRICTIONS IN RAW MATERIALS TRADE: FACTS, FALLACIES AND BETTER PRACTICES © OECD 2014
Table 3.4. Simulated effects on major steel or related raw materials purchasing industries, percentage change from base (cont.)
ARG CHN JPN USA IND RUS KOR TUR BRA AUS ZAF EU ROW
Transport nec
Production Quantity produced 0.02 0.12 0.02 0.02 0.00 0.02 0.05 0.12 0.24 0.03 0.05 0.05 0.01
Production cost 0.01 -0.05 0.01 -0.01 0.02 0.00 0.01 -0.07 -0.23 0.01 -0.02 -0.02 0.01
Production inputs Domestic steel inputs -0.22 0.26 0.01 -6.39 -0.83 -0.20 0.06 0.67 -30.84 0.01 -7.45 -13.41 -0.28
Imported steel inputs 0.48 0.92 1.96 35.65 20.09 6.09 2.78 0.35 2.32 2.55 51.74 14.27 0.49
Total imported inputs 0.03 0.11 0.02 0.45 0.00 0.25 0.03 0.30 0.67 0.01 0.43 0.23 0.02 Exports
Intermediate exports 0.04 0.20 0.03 0.04 0.07 0.06 0.09 0.22 0.40 -0.01 0.03 0.08 0.04
Total exports 0.01 0.16 0.02 0.04 0.00 0.05 0.08 0.19 0.45 0.03 0.11 0.08 0.02
Construction
Production Quantity produced 0.00 0.01 0.00 0.01 -0.05 0.00 0.01 0.01 0.02 -0.02 0.01 0.01 0.01
Production cost -0.02 -0.16 -0.02 -0.01 -0.19 -0.01 -0.05 -0.10 0.01 0.00 -0.02 -0.01 -0.04
Production inputs Domestic steel inputs -0.13 0.04 -0.08 -0.51 0.09 -0.54 -0.42 0.56 -0.03 -0.47 -0.23 -0.41 -0.47
Imported steel inputs 0.25 0.92 1.96 2.57 0.17 3.33 1.88 -0.30 3.23 2.48 2.35 0.40 0.59
Total imported inputs 0.06 0.08 0.08 0.15 0.03 0.37 0.33 -0.07 0.16 0.19 0.10 0.07 0.11 Exports
Intermediate exports 0.04 0.24 0.02 0.00 0.24 0.02 0.09 0.19 0.06 -0.07 0.03 0.01 0.06
Total exports -0.08 0.21 -0.01 -0.03 0.21 0.00 0.06 0.15 -0.06 -0.12 -0.01 -0.01 0.03
Other manufacturing
Production Quantity produced 0.00 0.17 0.03 0.02 -0.06 0.00 0.11 0.07 0.15 0.07 0.06 0.03 0.02
Production cost 0.00 -0.01 -0.01 0.00 0.00 0.00 -0.01 0.00 -0.03 -0.02 -0.01 0.00 0.00
Production inputs Domestic steel inputs -0.15 -0.11 -0.05 -1.16 -0.15 -0.26 -0.04 0.45 0.03 -0.20 -0.16 -1.16 -0.50
Imported steel inputs 0.27 3.11 1.97 5.88 0.81 4.39 1.93 -0.35 2.46 2.46 1.86 1.34 0.51
Total imported inputs 0.03 0.16 0.06 0.10 0.03 0.13 0.10 0.07 0.15 0.11 0.08 0.06 0.04 Exports
Intermediate exports 0.03 0.17 0.06 0.02 0.01 0.00 0.15 0.09 0.18 0.07 0.04 0.02 0.04
Total exports 0.02 0.10 0.05 0.02 -0.02 0.00 0.13 0.05 0.17 0.09 0.05 0.03 0.03
Motor vehicles and transport equipment
Production Quantity produced 0.02 0.18 0.07 -0.01 0.09 0.03 0.19 0.29 0.13 0.08 0.07 0.02 0.06
Production cost -0.04 -0.12 -0.05 -0.02 -0.15 -0.05 -0.09 -0.10 -0.05 -0.01 -0.03 -0.03 -0.05
Production inputs Domestic steel inputs -0.12 0.21 -0.02 -0.57 0.11 -0.51 -0.27 0.80 -0.02 -0.42 -0.14 -0.35 -0.44
Imported steel inputs 0.40 0.27 2.02 2.50 0.33 3.21 2.04 -0.11 3.31 2.61 2.07 0.46 0.67
Total imported inputs 0.05 0.03 0.13 0.11 0.04 0.19 0.36 0.27 0.21 0.25 0.13 0.07 0.12 Exports
Intermediate exports 0.15 0.36 0.08 -0.03 0.44 0.09 0.27 0.46 0.19 -0.07 0.04 0.00 0.08
Total exports 0.04 0.30 0.06 -0.05 0.38 0.06 0.23 0.42 0.09 -0.07 0.00 0.00 0.07

3. EFFECTS OF REMOVING EXPORT TAXES ON STEEL AND STEEL-RELATED RAW MATERIALS – 107
EXPORT RESTRICTIONS IN RAW MATERIALS TRADE: FACTS, FALLACIES AND BETTER PRACTICES © OECD 2014
The shifting trade patterns due to the simultaneous and global removal of taxes on the exports of steel and its key raw material inputs causes production costs in the steel making industry to fall across all regions except Australia (where production costs increase by 0.01%), including the regions that are simulated to remove export restrictions on steel raw materials (Table 3.3). Once export taxes on steel inputs are lifted, global supply expands and prices fall. This enables the (downstream) steel industry to source its inputs more cheaply. In addition, steel producers in countries that abolish export taxes on steel benefit from higher sellers’ prices on the international market, while the lower buyers’ price boosts demand. They thus benefit from two sides: the multilateral elimination of export taxes on steel making raw materials reduces their inputs costs and the abolition of export taxes on the final product improves their position on international markets.
Users of steel and relevant raw materials
A major effect of export restrictions is the diversion of raw materials to domestic downstream industries. This motivates the use of these measures in many countries. The modelling results cast doubt on this strategy. A key insight is that the multilateral removal of export taxes will benefit even those industries downstream from raw material suppliers on whose exports taxes are currently imposed.
China, India and the Russian Federation are the three regions with the highest export taxes on steel. In these three regions, production in all industries downstream from steel increases when export taxes are removed, with the exception of construction in India. This means that the global removal of barriers to the exports of steel is eventually beneficial for downstream industries even where they were initially benefiting from input prices that were below those faced by foreign competitors. The reason is that the improved functioning of global markets for steel inputs (and associated fall in global prices) would more than offset the loss of that protection. This result underlines that the argument whereby export taxes help to develop downstream industries is based on the unlikely assumption of no retaliatory policies by other countries. It shows that the multilateral removal of all ‘copy-cat’ export taxes improves the working of international markets by increasing the volumes traded at lower prices for downstream producers across the world. The explanation of this result is that removing export taxes on a multilateral basis improves the working of international markets by increasing the volumes traded at lower prices for downstream producers across the world The same mechanisms that explain falling international prices of raw materials for steel making when export taxes on them are removed are at work in industries that use steel as an input. Removal of those taxes expands international supply, allows all countries to source their inputs more cheaply and reduces production costs in downstream industries. Almost all countries are found to increase imports of steel or raw material intermediate inputs in every industry.
In some countries, the effects on output in some downstream industries are found to be slightly negative. While these industries still benefit from lower input prices coming from the removal of export taxes on steel and steel-related raw materials, those inputs have less weight in their cost structure compared to other inputs such as services and capital. As a result, the relative cost reduction they experience from reduced raw material prices is insufficient to give them an advantage over competitors whose overall cost are more heavily dependent on the raw materials that are currently subject to export taxes.
Export restrictions are beggar-thy-neighbour policies that look attractive from a unilateral point of view only if it is assumed that other countries do not react when an export restriction is imposed. However, as argued in Chapter 2, there is an incentive for others to react by adopting similar policies so that export restrictions snowball. Using export taxes in an attempt to provide preferential market conditions to domestic suppliers ignores this implication. What this work shows is that when used multilaterally they, in fact, drive up domestic production costs and undercut the competitiveness of downstream industries. A concerted multilateral decision to abolish those measures can avoid this sub-optimal outcome, and indeed the results show that both upstream and downstream industries globally can be better off as long as all counties abolish simultaneously.

108 – 3. EFFECTS OF REMOVING EXPORT TAXES ON STEEL AND STEEL-RELATED RAW MATERIALS
EXPORT RESTRICTIONS IN RAW MATERIALS TRADE: FACTS, FALLACIES AND BETTER PRACTICES © OECD 2014
Furthermore, the simulation reported in Box 3.1 shows that even unilateral removal of an export tax can bring benefits to the global supply chain with minimal impacts on the downstream sectors of the country removing the restriction.
Box 3.1. Effects on global value chains from unilateral removal of India's export taxes on iron ore
The unilateral removal of India’s export taxes on iron ore would increase the returns to its iron ore exporters by 17%. Production responds by shifting resources into the iron ore industry with a 14% increase in production, 90% of which is directly exported, so that total iron ore exports rise by 31%. The Indian steel industry, as well as construction and other metals and minerals, are hardly affected as the model shows the iron ore price on the Indian market does not follow the price rise for exports. The extent of this imperfect price transmission depends to a certain degree on the cost structure of the iron ore industry. If production can expand at current marginal cost, prices do not have to rise on the domestic market. If, on the other hand, capacity constraints increase the cost of iron ore production, domestic prices could rise and export gains would be smaller. The majority of additional iron ore exports is sent to China. These exports flow specifically into its steel industry, and to other metals and minerals industries. Cheaper imports lower China’s production costs in these industries and allow for small increases in production (0.3% in steel making, 0.2% in other metals and minerals). Over 99% of the output in these two industries are inputs for further production.
The additional production is used domestically in China as well as exported. Apart from their own industries, the extra production is sold domestically to the metal products and machinery industries, and to the construction industry. As a result, production costs in these industries fall slightly. Externally, exports of Chinese steel increase by less than 1% and slightly smaller increases are observed for products that use steel as inputs. These exports are sent all round the world, but especially to the EU, the United States, Korea and Japan.
The effects of the unilateral tax removal filter through to all the inter-related industries in global value chains that draw on iron ore and steel. Overall, the model suggests that the unilateral removal of India’s export taxes increases global production in a range of inter-related sectors, including other metals and minerals, steel, and other manufacturing.
Source: OECD Trade Model.
3.3. Conclusions
This chapter has focussed on steel and steel-related raw materials because these commodities have a central place in all economies, and especially in emerging economies that are increasing the steel content of their investment. But export restrictions (as well as import restrictions) are creating major distortions and impeding full realization of the growth potential in those sectors.
Export taxes have been singled out in order to analyse the potential for improving the efficiency of global markets for steel and related raw materials. Domestically, export taxes punish upstream mining and raw materials sectors by making producers less able to exploit the opportunities that international markets offer. Internationally, export taxes drive up world market prices for raw materials and raise input costs for processing industries. The functioning of domestic as well as global value chains is hampered by these measures, and taxes and import duties can accumulate to raise the cost to final consumers. For example, Chinese importers of iron ore from India have to pay a price that includes an export tax, while the country itself levies an export tax on some finished steel items that are used for further processing by other countries.
The simulations reported in this chapter find that multilateral action to reduce and eventually remove such export taxes can benefit both the upstream and downstream industries, including in the countries that remove their export taxes. This finding runs counter to the expectation that export taxes, or other export restrictions, must necessarily benefit domestic downstream industries and enhance domestic value added.
This result occurs because, with multilateral removal of export taxes, international markets see increased volumes traded at lower prices. This enables downstream industries in all countries to source their inputs more cheaply. The corollary is that, when an export tax on the upstream industry is used without taking account of the effect on international markets or the possible reactions from other suppliers, it may well not have the desired outcome on the domestic economy.

3. EFFECTS OF REMOVING EXPORT TAXES ON STEEL AND STEEL-RELATED RAW MATERIALS – 109
EXPORT RESTRICTIONS IN RAW MATERIALS TRADE: FACTS, FALLACIES AND BETTER PRACTICES © OECD 2014
The efficiency gains resulting from the simulated removal of export restrictions should be considered a lower-bound estimate. The simulations reported here take into account ad valorem export taxes only, and ignore other instruments that restrain export activity. As Chapter 1 shows, besides export taxes, other policies including export bans, non-automatic export licensing requirements are applied to the main steelmaking materials (iron ore, steel scrap and coke) studied here. Moreover, the simulation focuses on the three main inputs into steelmaking, but there are a number of other minerals and metals that are also used in steelmaking, often to give steel specific performance or other characteristics. These raw materials also face export restrictions, which are not considered in this study.
Notes
1. Frank van Tongeren is Head of the Policies in Trade and Agriculture Division, James Messent is a Trade Policy Analyst, and Dorothee Flaig and Christine Arriola are statisticians in the OECD’s Trade and Agriculture Directorate. The authors are grateful for comments and inputs received from numerous colleagues. We would particularly like to mention Ken Ash, Anthony de Carvalho, Barbara Fliess, Jane Korinek and Susan Stone for their critical reviews during the various stages of production, and Dirk Kamps for collecting information on the cost structure of the steel industry. We would also like to thank delegations to the working party of the OECD Trade Committee for providing helpful comments on earlier drafts.
2. The OECD Trade Model is based on the GTAP database, version 8 with a base year of 2007. The region and industry aggregation, as well as other details of the model, are provided in Annex 3.A.
3. In the OECD Trade Model database, nearly 33% of Australia’s scrap production and just under 60% of its iron ore production is exported.
4. A number of other materials are used in connection with steel production, even if they are not necessarily incorporated into the steel itself. Both processes use fluorspar to lower the melting point of the iron ore or steel scrap and to help remove impurities from the molten steel. Zinc is frequently used to produce galvanized steel (steel with a thin coating of zinc that prevents oxidization). Tin is used as both an alloying agent and a coating. Because of its very high melting point, magnesium carbonate is a vital component of refractory bricks, which are used to line both basic oxygen and electric arc furnaces (Price and Nance, 2010). Manganese and nickel enhance the strength of steel while chromium is used for its corrosion and discoloration resistance.
5. Note that the OECD Trade Model records data in value terms. In volume terms (weight) the picture looks different. For example, the EAF share in steelmaking in India is very high, but the country uses more direct iron reduction as a feedstock; South Africa’s share of BOF is higher than that of EAF, which means that more iron ore is used in volume terms. The share of BOF in the European Union is above 60%, which means greater demand for iron ore than scrap, in volume terms.
6. Of the export restrictions on those materials, 35% are export licenses, followed by export taxes at 32%. ‘Quantifiable’ measures include: bans, quotas, taxes, and minimum export price requirements.
7. An alternative closure rule fixes the trade balance, while exchange rates fluctuate, with the euro acting as numeraire. This closure rule delivers similar macro-economic results to the base closure. Australia and South Africa experience slight currency depreciation, while the currencies in the other regions appreciate slightly. The countries with a depreciating currency increase their exports, while the countries with an appreciating currency increase their imports to keep the trade balance fixed.

110 – 3. EFFECTS OF REMOVING EXPORT TAXES ON STEEL AND STEEL-RELATED RAW MATERIALS
EXPORT RESTRICTIONS IN RAW MATERIALS TRADE: FACTS, FALLACIES AND BETTER PRACTICES © OECD 2014
References
de Melo, J. and S. Robinson (1989), “Product Differentiation and the Treatment of Foreign Trade in Computable General Equilibrium Models of Small Economies”, Journal of International Economics, Vol. 27, pp. 47-67.
Devarajan, S., J.D. Lewis and S. Robinson (1990), ‘Policy Lessons from Trade-Focused, Two-Sector Models’, Journal of Policy Modeling, Vol. 12, pp. 625-657.
Devarajan, S., D.S. Go, J.D. Lewis, S. Robinson and P. Sinko (1997), “Simple General Equilibrium Modelling”, in J.F. Francois and K.A. Reinert, (eds.), Applied Methods for Trade Policy Analysis, Cambridge University Press.
International Monetary Fund (2014), World Economic Outlook Database, April 2014, http://www.imf.org/external/pubs/ft/weo/2014/01/weodata/index.aspx.
McDonald, S., K.E. Thierfelder and T. Walmsley (2013), Globe v2: A SAM Based Global CGE Model using GTAP Data, Model documentation. Available at: http://www.cgemod.org.uk/.
Narayanan, B.G., A. Aguiar and R. McDougall (eds.), (2012). Global Trade, Assistance, and Production: The GTAP 8 Data Base, Center for Global Trade Analysis, Purdue University.
OECD (2005), Trade and Structural Adjustment: Embracing Globalisation, OECD Publishing, Paris, http://dx.doi.org/10.1787/9789264010970-en.
Price, A. and D. Nance (2010), "Export Barriers and the Steel Industry", in OECD, The Economic Impact of Export Restrictions on Raw Materials, OECD Publishing, Paris, http://dx.doi.org/10.1787/9789264096448-6-en.
Robinson, S., M.E. Burfisher, R. Hinojosa-Ojeda and K.E. Thierfelder (1993), “Agricultural Policies and Migration in a US-Mexico Free Trade Area: A Computable General Equilibrium Analysis”, Journal of Policy Modeling, Vol. 15, pp. 673-701.
Robinson, S., M. Kilkenny and K. Hanson (1990), USDA/ERS Computable General Equilibrium Model of the United States, Economic Research Services, USDA, Staff Report AGES 9049.
World Steel Association (2010a), Steel Statistics Yearbook 2010, www.worldsteel.org.
World Steel Association (2010b), World Steel in Figures 2009, www.worldsteel.org.

3. EFFECTS OF REMOVING EXPORT TAXES ON STEEL AND STEEL-RELATED RAW MATERIALS – 111
EXPORT RESTRICTIONS IN RAW MATERIALS TRADE: FACTS, FALLACIES AND BETTER PRACTICES © OECD 2014
Annex 3.A
OECD Trade Model
The quantitative analysis is performed with the OECD Trade Model,1 a computable general
equilibrium (CGE) model. As the name implies, CGE models require a complete specification of all economic activity and explicit recognition of inter-sectoral linkages. This approach is ideal for examining the economy-wide impact of a policy or other change.
The OECD Trade Model is derived from the CGE model GLOBE developed by McDonald, Thierfelder and Walmsley (2013).
2 GLOBE is a Social Accounting Matrix (SAM)-based model and a
direct descendant of an early US Department of Agriculture model (Robinson et al., 1990, Robinson et al., 1993). It follows trade principles deriving from the 1-2-3 model (de Melo and Robinson, 1989; Devarajan et al., 1990). The OECD’s SAM database starts from the GTAP V8 database (see Narayanan et al., 2012) and disaggregates imports according to use-categories based on OECD sources
3, as opposed to the widely used proportionality assumption. The database consists of all
57 GTAP sectors and 56 regions, for the purpose of this study it is aggregated as displayed in Annex Table 3.1.
The novelty and strength of the OECD Trade Model lies in the detailed trade structure and the differentiation of commodities by use. Commodities, and thus trade flows, are distinguished by use category as those designed for intermediate use, for use by households, for government consumption and as investment commodities.
Annex Table 3.1. Data aggregation: Regions, sectors and factors
Region Commodity/sector Factors
Argentina Ferrous waste and scrap Skilled labour
China Steel Unskilled labour
Japan Iron ore Capital
United States other minerals Land
Russia Coke Natural resources
Korea Rest of Petroleum and coal products
Turkey Construction
Brazil Oil and gas
Australia Motor vehicles and transport equipment
European Union Metal products and machinery
Rest of the World Other metals and minerals
Paddy rice
Wheat
Cereal grains nec
Oil seeds
Other agri and food products
Other manufacturing
Transport nec
Water and air transport
Other services

112 – 3. EFFECTS OF REMOVING EXPORT TAXES ON STEEL AND STEEL-RELATED RAW MATERIALS
EXPORT RESTRICTIONS IN RAW MATERIALS TRADE: FACTS, FALLACIES AND BETTER PRACTICES © OECD 2014
Like GLOBE, the underlying approach for the multi-region model is the construction of a series of single country CGE models that are linked through trade relationships. As is common in CGE models, the price system in the model is linearly homogeneous, which means that simulations generate relative, not absolute, price changes. Each region has its own numéraire, typically the Consumer Price Index (CPI), and a nominal exchange rate (an exchange rate index of reference regions serves as model numéraire). Thus, price effects inside a country are fed through the model as a change relative to the country’s numéraire, and prices between regions change relative to the reference region. The Model also contains a “dummy” region to allow for inter-regional transactions where full bilateral information is not available, i.e. data on trade and transportation margins.
The model distinguishes activities that produce commodities. Activities maximise profits and create output from primary inputs (i.e. land, natural resources, labour and capital), combined using constant elasticity of substitution (CES) technology, and intermediate inputs in fixed shares (Leontief technology). Households are assumed to maximise utility subject to a Stone-Geary utility function, which allows for the inclusion of a subsistence level of consumption. All commodity and activity taxes are expressed as ad valorem tax rates, and taxes are the only income source to the government. Government consumption is in fixed proportions to its income and government savings are defined as a residual. Closure rules for the government account allow for various fiscal specifications.
4 Total savings consist of savings from households, the internal balance on the
government account and the external balance on the trade account. The external balance is defined as the difference between total exports and total imports in domestic currency units. While income to the capital account is defined by several savings sources, expenditures by the capital account are based solely on commodity demand for investment.
Notes to Annex 3.A
1. A detailed model description is available in the “OECD Trade Model Documentation” (OECD internal document).
2. The original model and a detailed documentation are available at http://www.cgemod.org.uk/.
3. Shares for manufacturing and agricultural sectors derive from data underlying OECD BTDIXE 2013ed. Data on services derive from the OECD Inter-Country Input-Output Model (May 2013).
4. The default assumption for the government account is a fixed internal balance and fixed government expenditure. Income tax is variable to balance the government account. Similarly, any of the other tax rates could be set free to balance the government account. As an alternative to fixing the volume of government demand, the government’s share of final demand or the value of government expenditure could be fixed. Yet another setting could assume, for example, a flexible internal balance and fixed tax rates.

3. EFFECTS OF REMOVING EXPORT TAXES ON STEEL AND STEEL-RELATED RAW MATERIALS – 113
EXPORT RESTRICTIONS IN RAW MATERIALS TRADE: FACTS, FALLACIES AND BETTER PRACTICES © OECD 2014
Annex 3.B.
Sensitivity Analysis
Standard closure rules
The closure used for the base scenario of the modelling exercise assumes fixed exchange rates and trade balances are determined within the model, allowing for a better reflection of changes in trade patterns. The region-specific consumer price index serves as regional numéraire. In the capital market, the model setup follows the Keynesian approach with investment-driven savings, thus fixing the value of investment and adjusting the savings rate. Regional governments are assumed to maintain the internal balance by adjusting their expenditure, all tax rates remaining fixed. An alternative closure would keep the GDP share of government expenditure fixed by adjusting income tax. In factor markets, all production factors are assumed to be fully employed and mobile across sectors.
Closure sensitivity
The variability of the results when different closure assumptions are used was explored. Three variants of the standard closure rules were used. Annex Table 3.B1 shows the results of the sensitivity analysis. The first closure variant assumes wages remain fixed and unemployment of labour can occur, while all other standard closure assumptions are retained. With unemployment, labour supply can increase but wages remain fixed until full employment is reached. At that point, wages can adjust. Overall the effects, positive and negative, are greater compared to the case of the standard full employment closure. Annex Table 3.B1 shows that real GDP effects in most regions are enhanced (especially in China, Republic of Korea, Turkey and Brazil) and are smaller only in India. Trade effects are little affected by the unemployment assumption.
The second closure variant assumes a floating exchange rate regime and a fixed current account balance with full employment of all factors. The comparison between the base and this variant shows small effects on GDP. Unsurprisingly, the foreign exchange closure setup affects the results for trade flows: generally, the appreciation of the exchange rate, which occurs for most countries in the simulation, decreases export demand and increases import demand.
The third closure variant assumes fixed government income by allowing income taxes to adjust to compensate for revenue lost by the removal of export taxes. Comparing the base closure with the third variant 3 shows no significant changes to the macro-economic or trade outcomes of the model.

114 – 3. EFFECTS OF REMOVING EXPORT TAXES ON STEEL AND STEEL-RELATED RAW MATERIALS
EXPORT RESTRICTIONS IN RAW MATERIALS TRADE: FACTS, FALLACIES AND BETTER PRACTICES © OECD 2014
Annex Table 3.B1. Macroeconomic results with varying closure setups
ARG CHN JPN USA IND RUS KOR TUR BRA AUS ZAF EU ROW
% change real GDP
Base 0.00 0.00 0.00 0.00 0.00 0.00 0.01 0.02 0.01 -0.01 0.00 0.00 0.00
Variant 1: Unemployment 0.00 0.02 0.00 0.01 -0.04 0.01 0.02 0.06 0.11 0.02 0.02 0.01 0.01
Variant 2: Floating exchange rate
0.00 0.00 0.00 0.00 0.00 0.00 0.01 0.02 0.01 -0.01 0.00 0.00 0.00
Variant 3: Fixed government expenditure
-0.01 0.00 0.00 0.00 -0.01 0.00 0.01 0.02 0.01 -0.01 0.00 0.00 0.00
% change imports
Base 0.06 0.31 0.08 0.09 0.17 0.14 0.13 0.18 0.13 0.06 0.07 0.05 0.06
Variant 1: Unemployment 0.07 0.32 0.09 0.10 0.15 0.14 0.14 0.22 0.20 0.08 0.08 0.06 0.07
Variant 2: Floating exchange rate
0.11 0.42 0.06 0.03 0.40 0.21 0.13 0.24 0.08 -0.21 -0.07 0.02 0.09
Variant 3: Fixed government expenditure
0.05 0.31 0.07 0.09 0.17 0.12 0.13 0.18 0.13 0.05 0.06 0.05 0.06
% change exports
Base 0.12 0.56 0.00 -0.05 1.68 0.26 0.08 0.30 -0.24 -0.54 -0.29 -0.04 0.09
Variant 1: Unemployment 0.14 0.58 0.00 -0.05 1.66 0.27 0.08 0.30 -0.21 -0.53 -0.29 -0.04 0.09
Variant 2: Floating exchange rate
0.06 0.35 0.02 0.01 1.35 0.19 0.07 0.12 -0.18 -0.15 -0.07 0.00 0.05
Variant 3: Fixed government expenditure
0.11 0.50 0.01 -0.05 1.55 0.26 0.09 0.30 -0.24 -0.54 -0.29 -0.04 0.09

4. HOW EXPORT RESTRICTIVE MEASURES AFFECT TRADE IN AGRICULTURAL COMMODITIES – 115
EXPORT RESTRICTIONS IN RAW MATERIALS TRADE: FACTS, FALLACIES AND BETTER PRACTICES © OECD 2014
Chapter 4
HOW EXPORT RESTRICTIVE MEASURES AFFECT TRADE IN AGRICULTURAL COMMODITIES
Peter Liapis1
4.1 Introduction
Information on export taxes and other export restrictions as applied to trade in agricultural commodities has until recently been scattered across various sources and has not been systematically collected.
2 The second part of the OECD Inventory of Restrictions on Trade in Raw
Materials (see Chapter 1 of this volume) fills this gap for agricultural commodity trade. The first step in compiling this database was to identify those countries that used any export restriction during the time period of interest (that is, from a few years prior to the 2007/08 world market price spikes until the most recent year possible). This was done by examining the literature, including the popular press. A FAO survey of 105 countries found that, between 2007 and the end of March 2011, 33 countries restricted exports of at least one agricultural product (Sharma, 2011). Since our immediate purpose was to analyse the effect of export restrictions on world trade, the initial focus has been on major exporters whose export restrictions spill over onto international markets. Hence, some countries that imposed export restrictions are not included in the current database. However, all countries that notify an export restriction under Article 12 of the Uruguay Round Agreement on Agriculture (URAA) are included, irrespective of their relative importance in trade.
Once a country was identified for selection, information was collected from its official government sources. The Harmonized System (HS)
3 was adopted for classifying traded products, in
line with the first part of the Inventory dealing with industrial raw materials (Chapter 1). The information recorded matches the description given in official sources, at whatever HS-digit level that source uses. Since international comparisons are typically performed at the HS6 level, information recorded in the inventory (product codes and product descriptions) is also provided at this level of disaggregation. For those countries that classify their products at the more detailed HS8 level or higher, the HS6 codes were obtained simply by truncating at the 6-digit level. In those (less numerous) cases where the product description was provided at a more aggregated level, the information was disaggregated to HS6 level by assuming that the restrictive measure is applied uniformly to each HS6-digit product within the more aggregate category.
Information on export restrictions was collected from 16 countries: Argentina, Belarus, China, Former Yugoslav Republic of Macedonia (FYROM), Egypt, India, Indonesia, Kazakhstan, Kyrgyz Republic, Moldova, Myanmar, Pakistan, the Russian Federation, Tajikistan, Ukraine and Viet Nam. The information spans 2002 to 2012, depending on the country. For Argentina, Belarus, China, Egypt, Indonesia, India Kazakhstan, Myanmar, Pakistan, the Russian Federation, Ukraine and Viet Nam the information is from official national government sources. For Ukraine, this is supplemented by information from its WTO notifications under URAA Article 12. Data for the Russian Federation and Viet Nam are supplemented with information from their WTO accession treaties and from the FAO. WTO notifications are the source for the other countries in the inventory.
The database contains more than 3 800 lines of export restrictions used by the 16 countries during the relevant time period. The export restrictions cover the whole range of agricultural products as defined by the WTO, but grains, oilseeds and vegetable oils are among the most frequently targeted products.

116 – 4. HOW EXPORT RESTRICTIVE MEASURES AFFECT TRADE IN AGRICULTURAL COMMODITIES
EXPORT RESTRICTIONS IN RAW MATERIALS TRADE: FACTS, FALLACIES AND BETTER PRACTICES © OECD 2014
The inventory also collects information, when available, on the rationale given by each country for any export restrictions used. The most frequently offered rationales are concerns about food security, domestic price stability and curbing food inflation. Occasionally, promoting domestic value-added activities and access to input supplies by domestic producers are also mentioned. Unfortunately, not all countries provided this information for all their measures, so coverage is incomplete in this area.
The next section provides a brief overview of export restrictions in the context of the multilateral trading system as well as a breakdown of the agricultural products subject to export measures and the instruments employed by the countries in the database. Section 4.3 presents a summary of the timeline of restrictions used by individual countries from 2007 to 2011 for selected major commodities, followed in Section 4.4 by a discussion of market developments for these products. Sections 4.5 and 4.6 analyse the available data, using various techniques at different levels of disaggregation, in order to test the predictions of the theory in Chapter 2. These effects were sought at the level of total exports, aggregate exports of the countries using restrictions, and bilateral trade flows. Section 4.7 summarises the findings and concludes.
4
4.2. Export restrictions in the multilateral trading system
Overview
Export duties and taxes are not prohibited under WTO rules but, unlike their counterparts on the import side (import duties and tariffs), they are not bound or otherwise disciplined, and can therefore be unilaterally adjusted. For new WTO members, however, the accession process may impose disciplines, as was the case for China, Viet Nam and the Russian Federation. For example, in its accession agreement, China made a commitment to eliminate all export duties except for 84 specific items (Kim, 2010).
Article XI of GATT 1994, on the other hand, explicitly prohibits quantitative export restrictions whether by quotas, import or export licenses or other measures (see Chapter 5, section 5.3). Some exceptions to the general rule are nevertheless allowed, including “export prohibitions or restrictions temporarily applied to prevent or relieve critical shortages of foodstuffs or other products essential to the exporting contracting party” (paragraph 2(a)) and “import and export prohibitions or restrictions necessary to the application of standards or regulations for the classification, grading or marketing of commodities in international trade” (paragraph 2(b)). A further basis for imposing export restraints is found in Article XX, the “general exceptions” provision. Examples are paragraph (b) allowing an exemption from other GATT disciplines when deemed “necessary to protect human, animal or plant life or health”, and paragraph (i) granting an exemption to “ensure essential quantities” of (raw) material used in domestic processing (see Chapter 5 of this volume for more details).
Countries routinely apply export restrictions or bans under the exemption clauses as there is no agreement on how long “temporary” is, what is “critical”, or what is “essential” in determining whether the export ban is allowable. Moreover, since export taxes are not disciplined, a prohibitive export tax can be equivalent to an export ban.
Article 12 of the Uruguay Round Agreement on Agriculture (URAA) stipulates that in cases where countries institute new export prohibitions on foodstuffs in accordance with paragraph 2(a) of Article XI of GATT 1994, they must take into account the effects of such actions on importing members’ food security and should give notice in writing as far in advance as practicable to the WTO Committee on Agriculture indicating the nature and duration of the measure. They must also consult, upon request, with any other member having a substantial interest as an importer that may be affected by the measure in question. All relevant information must also be made available to that member if requested.
Paragraph 2 of Article 12 of the URAA then exempts developing countries from the notification and consultation requirements, unless the measure is taken by a developing country

4. HOW EXPORT RESTRICTIVE MEASURES AFFECT TRADE IN AGRICULTURAL COMMODITIES – 117
EXPORT RESTRICTIONS IN RAW MATERIALS TRADE: FACTS, FALLACIES AND BETTER PRACTICES © OECD 2014
member that is a net food- exporter of the specific foodstuff concerned. In any case, it seems that there are no penalties for failure to notify (Mitra and Josling, 2009).
Overview of targeted agricultural products
To provide a general overview of the agricultural products subject to export restraining measures, the products in the Inventory were divided into four broad categories: bulk, horticultural, processed and semi-processed.
5 Although data prior to 2007 and for 2012 are available for some
countries, the most complete set of information is for the period 2007 to 2011. The table contains information for each year, the number of countries that imposed export restrictions within that particular product category and the total number of distinct restrictions used. In order to quantify the number of restrictions used in a given year, an export restriction in force for more than six months is counted as 1, while those in force for less than six months count as 0.5. These ‘frequency counts’ are computed at the HS6 digit level.
6 Standardisation to the HS6 digit level, rather than counting
restrictions at the HS digit level at which they are defined, is necessary in order to make the figures comparable between countries.
7 Table 4.1 summarises the results.
Table 4.1. Frequency of export restrictions used for agricultural products
Bulk Horticulture Semi processed Processed
Year Countries Restrictions Countries Restrictions Countries Restrictions Countries Restrictions
2007 8 67.5 4 97.5 7 164.5 6 87.5
2008 11 85.5 2 48.0 7 120.5 6 82.5
2009 7 43.5 1 16.0 6 104.5 6 131
2010 11 46.5 0 0 10 70 5 14
2011 9 34.5 1 1 10 72 5 10.5
The results indicate that few countries took measures to restrain exports of horticultural products especially in the last two years. More countries restricted exports of bulk commodities such as grains and oilseeds compared to the others, and the number of countries using restrictions for bulk product exports fluctuated more from year to year. Across the broad spectrum of commodities, far more restrictions were in place during the first three years shown, with the number dropping substantially in the last two years for all groups except bulk commodities. Over the five year period as a whole, semi- processed products such as vegetable oils, live animals or hides and skins were targeted the most.
8
Overview of export restrictions on agricultural products
The export restrictive instruments used by the countries in the inventory include export duties (either ad valorem or specific, including variable duties whose rates change depending on specified conditions), tax rebates on exported goods, quotas, bans, licensing requirements, and minimum export price. At times, countries use a combination of these measures, either concurrently or sequentially. In certain cases, despite an export ban, some exports were allowed of more specialised products or to select trading partners.
In Table 4.2, each column shows which countries used a particular instrument at least once during the period, for at least one product. Each row shows which instruments were used by a particular country at least once during the period for at least one product. Thirteen of the 16 countries banned exports of at least one product in at least one of the five years between 2007 and 2011. Export taxes were used by nine countries while export quotas were used by eight.

118 – 4. HOW EXPORT RESTRICTIVE MEASURES AFFECT TRADE IN AGRICULTURAL COMMODITIES
EXPORT RESTRICTIONS IN RAW MATERIALS TRADE: FACTS, FALLACIES AND BETTER PRACTICES © OECD 2014
Table 4.2. Export restrictions used on agricultural products, 2007-2011
Export tax (including
variable tax)
Export quota
Export ban
Export licensing requirements*
Minimum export price
Tax rebates on exported
goods
Argentina Argentina Argentina Argentina
Belarus
China China China China
Egypt Egypt Egypt
FYROM
India India India
Indonesia Indonesia Indonesia Indonesia
Kazakhstan
Kyrgyz Republic
Republic of Moldova
Republic of the Union of Myanmar
Republic of the Union of Myanmar
Pakistan Pakistan Pakistan Pakistan
Russia Russia
Tajikistan
Ukraine Ukraine
Viet Nam Viet Nam Viet Nam Viet Nam
* To avoid double-counting, countries that use export licenses only to allocate export quotas (already shown in column 2) are not shown again in this column.
4.3. Timeline of restrictions used for selected major agricultural products
This section expands the broad overview given in Table 4.2, indicating the products targeted by export restrictions, the frequency or duration of the restraint, the importance of the restraining country in world markets, and the importing countries that may have been adversely impacted.
Major grains (maize, rice, wheat), oilseeds, (soybeans, sunflower seeds among others) and vegetable oils are products for which many of the measures listed in Table 4.2 have been used and to which most of the countries in the inventory applied them. These products also provide most of the calories consumed by developing country populations, either directly or indirectly via vegetable oils and livestock feed, and they were among the commodities whose shortages and high prices led to social discontent in some countries during the food price crisis of 2006-9. Furthermore, they are among the more traded agricultural products, in both value terms and the number of countries importing them. Additionally, rice, wheat, maize and soybeans are the products of interest to the Agricultural Market Information System (AMIS). Hence, the timeline summary below focuses on these products.
9 The reader is reminded that although generic commodity names like “rice” or
“wheat” are used below, countries targeted their interventions to very specific varieties, often at the HS8 or HS10 level. The presentation below is a summary of all the restriction placed on the specific varieties of each commodity.
Rice
Of the 16 countries in the inventory, eight restricted rice exports at least once during 2007-2011. The instruments they used included export taxes (at fixed or variable rates), export bans, export quotas, licensing and minimum export prices. Argentina was the only country using restrictions every year, levying a 10% export tax. India and Viet Nam ended restrictions in 2011 with

4. HOW EXPORT RESTRICTIVE MEASURES AFFECT TRADE IN AGRICULTURAL COMMODITIES – 119
EXPORT RESTRICTIONS IN RAW MATERIALS TRADE: FACTS, FALLACIES AND BETTER PRACTICES © OECD 2014
the other countries jumping in and out at various times. The export ban was among the most frequently used instruments, with India using it every year except 2011 (see Table 4.3 for more details). Using the count method described in the previous section, a total of 90 annual export restrictions actions were used in the international rice market during the five year period, with 2008 registering a total of 39 actions.
Wheat
More countries (11) placed restrictions on their wheat exports than on exports any of the other agricultural commodity in the inventory. Restrictions included export taxes, export quotas, licensing and outright bans. Export bans were the most frequently used instrument during the time period, with four countries adopting this measure in 2008, including traditionally significant traders, the Russian Federation, Pakistan and Kazakhstan. In fact, in each year from 2007 to 2011, wheat exports were banned by at least one country (see Table 4.3 for more details). As in the rice market, 2008 was the year with the most restrictions (16) based on the method of counting described above.
Table 4.3. Timeline of export measures on rice and wheat markets for selected countries
Rice Wheat
2007 2007
Argentina Export Tax (10%) Argentina Export Tax (20% increased to 28%)
Export Quota (15 000 for organic wheat and 20 000 for wheat in bags not exceeding 50 kg.)
India Export Ban (conditional on minimum export price (USD 500/ton) and with exceptions for country specific quotas)
India Export Ban
Viet Nam Export Ban Pakistan Export Ban (ban was lifted part of year allowed 800 000 tons to be exported
Russia Export Tax (10% but not less than EUR 22/ton increased to 40% but not less than EUR 105/ton)
Ukraine Export Quota (3 million mt)
2008 2008
Argentina Export Tax (10%) Argentina Export Tax (variable switched to 28% or 23% depending on variety at HS8 level)
China Export Tax (5%) Export Quota (4.4 million mt)
Egypt Export Tax (300 Egyptian pounds/t) Export Ban
China Export Tax (20%)
India Export Ban
India Export Ban (conditional on minimum export price and with exceptions for country specific quotas)
Kyrgyz Republic
Export Tax (15 LC/kg)
Indonesia Export License Kazakhstan Export Ban
Myanmar Export Ban
Pakistan Minimum Export Price (from USD 750/ton to USD 1 500/ton based on variety)
Pakistan Export Ban
Viet Nam Export Quota (4.5 million tons) and Minimum Export Price (from USD 360/ton to USD 800/ton depending on variety) Export Tax (variable rate from USD 30 to USD 175/ton based on FOB price)
Russia Export Ban
Ukraine Export Quota (3 million mt)

120 – 4. HOW EXPORT RESTRICTIVE MEASURES AFFECT TRADE IN AGRICULTURAL COMMODITIES
EXPORT RESTRICTIONS IN RAW MATERIALS TRADE: FACTS, FALLACIES AND BETTER PRACTICES © OECD 2014
Table 4.3. Timeline of export measures on rice and wheat markets for selected countries (cont.)
Rice Wheat
2009 2009
Argentina Export Tax (10%) Argentina Export Tax and exports with license requirement
China Export Tax (lowered to 3% then to 0%); Export License
China Export Tax (3% then to 0%); Export License
Egypt Export Tax (EGP 300/ton) converted to Export Ban , converted to Export Tax (EGP 2 000/ton)
India Export Ban (with exceptions for country specific quotas which for some countries would be revoked if minimum export price exceeds USD 1 200/ton)
India Export Ban replaced by Quota (900 000 tons and additional 300 000 tons allocated to three firms)
Indonesia Export License
Viet Nam Minimum export price (USD 350/ton on 25% broken rice
2010 2010
Argentina Export Tax (10%) Argentina Export Tax
China Export License China Export License
Egypt Export Quota (100 000 mt first part of year plus 128 000 second half) Export Ban (second half of year)
Egypt Special Export Procedure
India Export Ban
Indonesia Export License Pakistan Export Quota (1 million mt)
India Export Ban (with exceptions for country specific quotas)
Russia Export Ban
Viet Nam Minimum Export Price (USD 300 to USD 540/ton depending on variety)
Ukraine Export Quota (500 000 mt)
2011 2011
Argentina Export Tax (10%) Argentina Export Quota (1 million mt), Export Tax
China Export License China Export License
Egypt Export Ban Former Yugoslav Republic of Macedonia
Export Ban
Myanmar Export Ban Republic of Moldova
Export Ban
Russia Export Ban
Ukraine Export Quota (1 million mt), switched to Export Tax (9% but not less than EUR 17/mt)
Maize
Fewer countries restricted maize exports compared to rice and wheat in most years. In all, six countries applied restrictions at least once during the period studied. Instruments used included export taxes, export quotas, licensing and bans. Unlike the rice and wheat markets, where more governments restricted exports during 2007-2009, relatively more countries restricted maize exports in 2010 and 2011, but 2008 was the year with the most restrictions (6.5) as counted using the method described above. Table 4.4 summarises the timeline of the restrictions used by these countries in the period 2007-11.

4. HOW EXPORT RESTRICTIVE MEASURES AFFECT TRADE IN AGRICULTURAL COMMODITIES – 121
EXPORT RESTRICTIONS IN RAW MATERIALS TRADE: FACTS, FALLACIES AND BETTER PRACTICES © OECD 2014
Table 4.4. Timeline of export restrictions for maize and other coarse grains for selected countries, 2007-2011
Maize Other coarse grains
2007
2007
Argentina
Export Quota, Export Tax (20% raised to 25%)
Argentina Export Tax (20% on various coarse grains)
Export Ban Russia Export Tax (30% on barley)
2008
2008
Argentina Export Tax (variable rate, switched to 25%, lowered to 20%)
Argentina Export Tax (20% on various coarse grains)
China Export Tax (5%, then to 0%) China Export Tax (20% on rye, barley buckwheat and oats); (5% on grain sorghum, millet and others
India Export Ban Russia Export Tax (30% but not less than EUR 70/tons, on barley)
2009
2009
Argentina Export Tax, Export License Requirement
Argentina Export Tax (20% on various coarse grains)
China Export License Requirement China Export Tax (eliminated)
2010
2010
Argentina Export Tax Argentina Export Tax (20% on various coarse grains)
China Export License
Kyrgyz Republic
Export Tax (local currency 5/kg) Kazakhstan Export Ban (buckwheat)
Russia Export Ban Russia Export Ban (barley and rye)
Ukraine Export Quota (2 million tons) Ukraine Export Quota (barley 200,000 tons; buckwheat 1 000 tons; rye 1 000 tons)
2011
2011
Argentina Export Tax Argentina Export Tax (20% on various coarse grains)
China Export License
Russia Export Ban Russia Export Ban (barley and rye)
Ukraine Export Quota (3 million raised to 5 million tons)
Export Quota (barley 200,000 tons; buckwheat 1 000 tons; rye 1 000 tons)
Ukraine Export Quota (eliminated on barley) converted to Export Tax (14% but not less than EUR 23/tons)
Other coarse grains
This category includes barley, buckwheat, millet, oats, rye and sorghum; a number of varieties of these grains are treated differentially as export policies here tend to be defined at very detailed level. Although the category encompasses several different crops, they tend not to be widely traded and fewer countries applied export restrictions. The preferred instrument was an export tax, although quotas and bans were also used. Table 4.4 summarises the timeline for the period 2007-11.
Soybeans
Export restrictions for soybeans were less prevalent than for rice and wheat, with only four countries using them in one year or more between 2007 and 2011. Argentina applied restrictions in each of the five years with a second country (either China, Kazakhstan or the Russian Federation) doing so after 2007. Only two measures were used: an export tax (variable or fixed rate) and an export ban, with the tax used more often. Table 4.5 summarises the timeline of the export restrictions used for soybeans.

122 – 4. HOW EXPORT RESTRICTIVE MEASURES AFFECT TRADE IN AGRICULTURAL COMMODITIES
EXPORT RESTRICTIONS IN RAW MATERIALS TRADE: FACTS, FALLACIES AND BETTER PRACTICES © OECD 2014
Other oilseeds
This product group includes cottonseed, linseed, mustard seed, rapeseed and sunflower seed. Policies are specified for a large number of varieties at a very detailed level. As in the soybeans case, relatively few governments used export restrictions for these commodities. Although export quotas and bans were employed, the most frequently used instrument was an export tax. Table 4.5 summarises the timeline of these measures in the period 2007-2011.
Table 4.5. Timeline of export restrictions for soybeans and other oilseeds for selected countries, 2007-2011
Soybeans Other oilseeds
2007
2007
Argentina Export Tax (24% increased to 28%, increased to 35%; converted to Export Ban converted to, Export Tax)
Argentina Export Tax (linseed 24%; sunflower seed 24% raised to 32%; rapeseed and other oilseeds 10%)
2008
2008
Argentina Export Tax (variable rate switched to 35%)
Argentina Export Tax (linseed 24%; sunflower seed variable rate converted to 32%; rapeseed and other oilseeds 10%)
China Export Tax (5%) Kyrgyz Republic
Export Tax (sunflower seeds local currency 20/kg)
2009
2009
Argentina Export Tax Argentina Export Tax
China Export Tax (5%, then eliminated)
2010
2010
Argentina Export Tax Argentina Export Tax
Kazakhstan Export Ban Belarus Export Ban (rapeseed)
Kazakhstan Export Ban (sunflower seed cottonseed and others not elsewhere specified
2011
2011
Argentina Export Tax Argentina Export Tax
Belarus Export Ban (linseed and rapeseed)
Russia Export Tax (20% but not less than EUR 35/t)
Russia Export Tax (rapeseed and sunflower seed, 20% but not less than EUR 35/t, mustard seed 10% but not less than EUR 25/t)
Vegetable oils
This product category includes cottonseed oil, linseed oil, maize oil, rapeseed oil, soybean oil, sunflower seed oil, groundnut oil, coconut oil, palm kernel oil, palm oil, sesame oil and others, but the number of varieties specifically concerned is larger as export policies tend to be defined at a very detailed level.
Vegetable oils, like wheat and rice, are for human consumption – unlike coarse grains or oilseeds – which appears to make their domestic availability (and disruptions to their international markets) more sensitive issues. Nine countries restricted exports of at least one vegetable oil in at least one year. Two instruments, export taxes and export bans, were by far the most frequently used in these markets. According to the count methodology described above, 2007 was the most restrictive year with a total of 49.5 annual restrictions on the various vegetable oils. Argentina used an export tax for most or all oils for every year during 2007-11. During the first two years, there were several rate changes and switches between fixed and variable rates; for a period during 2007, Argentina replaced taxes by an export ban for the oils listed. From the end of 2008 onwards, Argentina’s taxes and rates remained unchanged. The Republic of Myanmar also maintained an export ban for groundnut and sesame oil throughout the period.
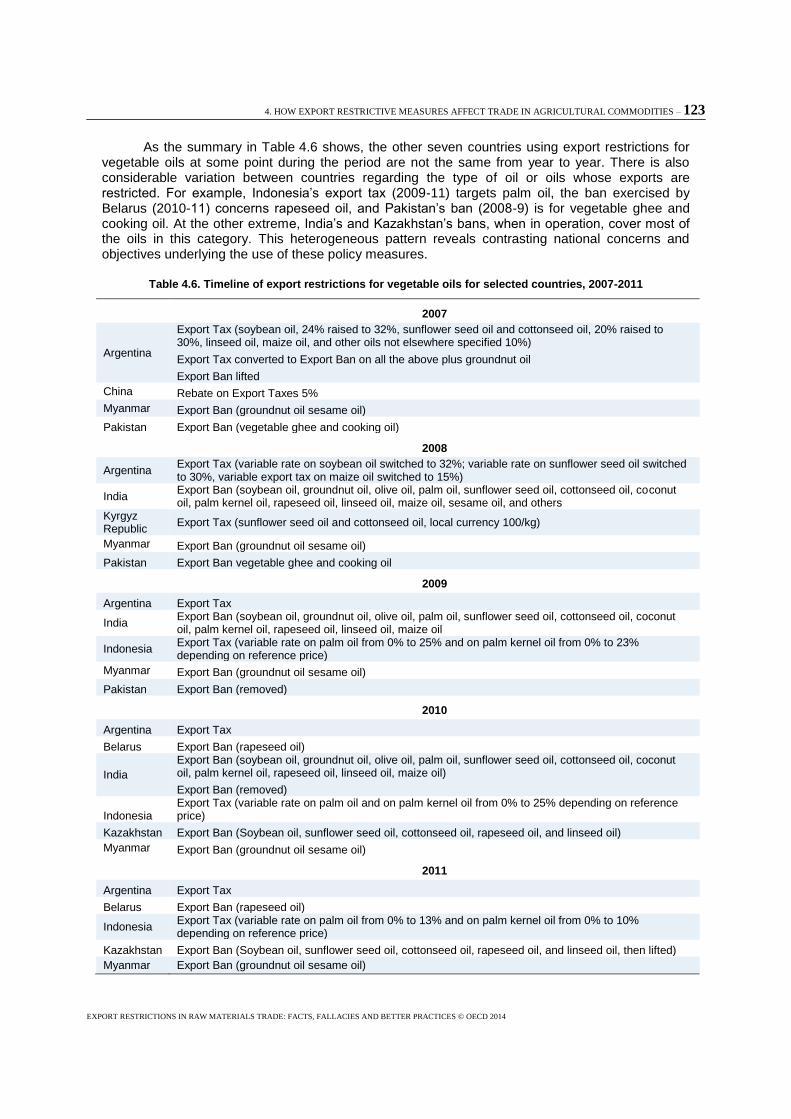
4. HOW EXPORT RESTRICTIVE MEASURES AFFECT TRADE IN AGRICULTURAL COMMODITIES – 123
EXPORT RESTRICTIONS IN RAW MATERIALS TRADE: FACTS, FALLACIES AND BETTER PRACTICES © OECD 2014
As the summary in Table 4.6 shows, the other seven countries using export restrictions for vegetable oils at some point during the period are not the same from year to year. There is also considerable variation between countries regarding the type of oil or oils whose exports are restricted. For example, Indonesia’s export tax (2009-11) targets palm oil, the ban exercised by Belarus (2010-11) concerns rapeseed oil, and Pakistan’s ban (2008-9) is for vegetable ghee and cooking oil. At the other extreme, India’s and Kazakhstan’s bans, when in operation, cover most of the oils in this category. This heterogeneous pattern reveals contrasting national concerns and objectives underlying the use of these policy measures.
Table 4.6. Timeline of export restrictions for vegetable oils for selected countries, 2007-2011
2007
Argentina
Export Tax (soybean oil, 24% raised to 32%, sunflower seed oil and cottonseed oil, 20% raised to 30%, linseed oil, maize oil, and other oils not elsewhere specified 10%)
Export Tax converted to Export Ban on all the above plus groundnut oil
Export Ban lifted
China Rebate on Export Taxes 5%
Myanmar Export Ban (groundnut oil sesame oil)
Pakistan Export Ban (vegetable ghee and cooking oil)
2008
Argentina Export Tax (variable rate on soybean oil switched to 32%; variable rate on sunflower seed oil switched to 30%, variable export tax on maize oil switched to 15%)
India Export Ban (soybean oil, groundnut oil, olive oil, palm oil, sunflower seed oil, cottonseed oil, coconut oil, palm kernel oil, rapeseed oil, linseed oil, maize oil, sesame oil, and others
Kyrgyz Republic
Export Tax (sunflower seed oil and cottonseed oil, local currency 100/kg)
Myanmar Export Ban (groundnut oil sesame oil)
Pakistan Export Ban vegetable ghee and cooking oil
2009
Argentina Export Tax
India Export Ban (soybean oil, groundnut oil, olive oil, palm oil, sunflower seed oil, cottonseed oil, coconut oil, palm kernel oil, rapeseed oil, linseed oil, maize oil
Indonesia Export Tax (variable rate on palm oil from 0% to 25% and on palm kernel oil from 0% to 23% depending on reference price)
Myanmar Export Ban (groundnut oil sesame oil)
Pakistan Export Ban (removed)
2010
Argentina Export Tax
Belarus Export Ban (rapeseed oil)
India
Export Ban (soybean oil, groundnut oil, olive oil, palm oil, sunflower seed oil, cottonseed oil, coconut oil, palm kernel oil, rapeseed oil, linseed oil, maize oil)
Export Ban (removed)
Indonesia Export Tax (variable rate on palm oil and on palm kernel oil from 0% to 25% depending on reference price)
Kazakhstan Export Ban (Soybean oil, sunflower seed oil, cottonseed oil, rapeseed oil, and linseed oil)
Myanmar Export Ban (groundnut oil sesame oil)
2011
Argentina Export Tax
Belarus Export Ban (rapeseed oil)
Indonesia Export Tax (variable rate on palm oil from 0% to 13% and on palm kernel oil from 0% to 10% depending on reference price)
Kazakhstan Export Ban (Soybean oil, sunflower seed oil, cottonseed oil, rapeseed oil, and linseed oil, then lifted)
Myanmar Export Ban (groundnut oil sesame oil)

124 – 4. HOW EXPORT RESTRICTIVE MEASURES AFFECT TRADE IN AGRICULTURAL COMMODITIES
EXPORT RESTRICTIONS IN RAW MATERIALS TRADE: FACTS, FALLACIES AND BETTER PRACTICES © OECD 2014
4.4. Market developments
Overall trade
The Inventory of Export Restrictions covers the period of the financial crisis and the subsequent recession, which affected economic activity generally in most countries, with implications for global food demand. The export policies recorded in the Inventory were not the only factors affecting agricultural supplies on world markets; in addition, several key agricultural markets were negatively affected by weather-related disturbances (droughts and floods) that reduced output in major producing regions. This section looks at the resulting effects on trade.
From 2004 to 2008, total merchandise trade increased by more than 80% from USD 6.9 trillion to USD 12.5 trillion.
10 The onset of the financial crisis and subsequent recession resulted in a
drop in trade of almost USD 3 trillion (-24%) in 2009. Although merchandise trade rebounded in 2010, the level was still below that of 2008.
The general economic climate affected the agricultural sector in a similar way. The trend in total agricultural trade followed quite closely that of total merchandise trade. Between 2004 and 2007, total agricultural exports (WTO definition) expanded by 80%, from USD 426 billion to USD 768 billion. Agricultural trade seems, however, to have been less vulnerable to the financial crisis—the magnitude of the fall in agricultural exports in 2009 was smaller, with a 13% drop in trade to USD 664 billion. Furthermore, the rebound in agricultural trade in 2010 was more robust, increasing by 18% and resulting in exports of USD 786 billion, USD 20 billion more than in 2008.
These trends are shown in Figure 4.1, where the left axis relates to total merchandise trade, and the right axis refers to agricultural commodity trade.
Figure 4.1. Total merchandise and agricultural trade, 2004-2010
Agricultural markets
World market price of selected products
Figure 4.1 provides a broad overview of developments in the volume of agricultural trade immediately before and during the period covered by the Inventory. Developments in world market agricultural and food prices provide another glimpse of market conditions during the period. These prices, just like those of other primary commodities, have been fluctuating considerably since the mid-2000s. Food prices, as captured by the IMF’s world market food price index,
11 after remaining
flat during the early 2000s, started rising in 2004—slowly at first, but then climbing quickly from the end of 2005 and reaching a peak in June 2008. After a steep fall to below the level suggested by
0
100
200
300
400
500
600
700
800
900
0
2000
4000
6000
8000
10000
12000
14000
2004 2005 2006 2007 2008 2009 2010
USD billionUSD billion
Total Agriculture (right axis)

4. HOW EXPORT RESTRICTIVE MEASURES AFFECT TRADE IN AGRICULTURAL COMMODITIES – 125
EXPORT RESTRICTIONS IN RAW MATERIALS TRADE: FACTS, FALLACIES AND BETTER PRACTICES © OECD 2014
the previous trend, prices began to climb again in 2009 reaching a new peak in April 2011 before once again retreating somewhat (Figure 4.2).
Figure 4.2. Monthly world market food price index, January 2000-January 2013
Source: IMF Primary Commodity Prices, monthly data.
The following discussion of world market prices concentrates on the major grains, oilseeds and vegetable oils, since they are products for which many countries have applied export restraining measures and that play a crucial role in global diets. The prices come from the IMF’s primary commodity price series and are benchmark prices that are representative of the respective global market.
Figure 4.3 shows monthly world market prices for the first four of these commodities since 2000.
12 The hike in prices from the beginning of 2007 was dramatic. Prices for rice, wheat and
soybeans more than doubled during this period, and within a few months of each other, each commodity reached record highs (in nominal terms). Wheat was the first commodity to reach its peak in March 2008, followed by rice in April 2008, while soybean prices reached a record high in July 2008. Prices for rice and wheat fell back from these peaks to pick up the trend they were following before 2006. The rise in the maize price was less extreme; it reached what was at the time a record high in June 2008, but after a short respite, its price continued increasing, reaching new heights in 2011 and in mid-2012. The soybean price also reached a new high in July 2012. The July 2012 price peaks for maize and soybeans are thought to reflect the severe drought in the United States during the spring/summer.
Figure 4.3 shows that prices not only exhibited an upward underlying trend during this period, but were also relatively volatile with large monthly price swings. For example, between March and April 2008, the rice price jumped almost 51%, only to retreat by 17% between May and June 2008. During the course of 2008, the rice price surged from USD 393/t in January to USD 1 015/ton in April, but was down to USD 551/ton in December. A contributing factor in this price fall was the Japanese government’s announcement that it would release rice from its stocks onto the market. In a similar way, the rapid price rises during 2007-08 are thought to have been fuelled partly by the news that some developing countries were suspending their grain exports.
Vegetable oil prices13
followed a similar pattern to that of crop prices. Prices for soybean and rapeseed oils reached new highs in June and July 2008, respectively (Figure 4.4). Since then, their prices have fallen back to what looks like their pre-2007 underlying trend. As for palm oil, its price reached what was a new high in March 2008, but after a steep decline later in 2008, its price began
0
50
100
150
200
250
April 2011

126 – 4. HOW EXPORT RESTRICTIVE MEASURES AFFECT TRADE IN AGRICULTURAL COMMODITIES
EXPORT RESTRICTIONS IN RAW MATERIALS TRADE: FACTS, FALLACIES AND BETTER PRACTICES © OECD 2014
to climb again, reaching an even higher peak in February 2011, after which it again fell to a level about twice that of the pre-2007 level.
Figure 4.3. International rice, wheat, maize and soybean prices: January 2000 to January 2013
Source: IMF Primary Commodity Prices, monthly data.
Several factors have been suggested for the surge in world prices during the 2007-2008 period (see, for example, McCalla (2009) and Trostle 2008), including export restrictions and other policy responses by various governments. According to some experts, export restrictions exacerbated the situation by causing severe disruptions and collapse in confidence on international markets (FAO, OECD, et al., 2011; Dollive, 2008; Mitra and Josling, 2009).
The first wave of rising food prices saw social unrest in several countries (Trostle, 2008). Their governments responded by instituting policies to insulate domestic markets from rising prices. The OECD surveyed the policy responses by ten developing or emerging economies for two basic food staples (wheat and rice) (Jones and Kwiecinski, 2010) and carried out scenario analysis to assess the impacts of three specific policy interventions – export taxes, consumption subsidies and public stockholding (Thompson and Tallard, 2010). The survey found that Argentina, China, India, Indonesia, the Russian Federation and Viet Nam introduced or increased export taxes or reduced export incentives, while Ukraine imposed export quotas to limit the rise in food prices. For the same
0
200
400
600
800
1000
1200
USD/tonRice
April 2008
0
50
100
150
200
250
300
350
400
450
500
USD/ton Wheat
March 2008
0
50
100
150
200
250
300
350
USD/tonMaize
July 2012
0
100
200
300
400
500
600
700
USD/tonSoybeans
July 2008
July 2012

4. HOW EXPORT RESTRICTIVE MEASURES AFFECT TRADE IN AGRICULTURAL COMMODITIES – 127
EXPORT RESTRICTIONS IN RAW MATERIALS TRADE: FACTS, FALLACIES AND BETTER PRACTICES © OECD 2014
set of countries, Thompson and Tallard (2010), using the Aglink-Cosimo model, examined three scenarios including each country imposing an export tax to prevent a surge in domestic prices. They found that while such a policy can have a large effect in curbing the increase of domestic consumer prices, it typically has a smaller effect on quantities consumed. They also found that such a response has a “beggar thy neighbour” effect as the trade measures introduced by some countries to offset rising international grain prices causes those prices to rise even more in other countries.
Figure 4.4. International soybean oil, rapeseed oil and palm oil prices: January 2000 to January 2013
Source: IMF Primary Commodity Prices, monthly data.
A variety of reasons, as already mentioned, motivate countries to impose export restrictions, including food security concerns, domestic food price stability and holding down input prices for downstream industries. But sudden export restrictions can contribute to spikes in international food prices. They thus exacerbate supply shocks for food buyers in the rest of the world. Typically, they are also not in the economic interests of the countries imposing them, as there are almost always more efficient ways to achieve the stated objectives of the restriction. Moreover, they are of concern to all trading nations because they reduce the stability and predictability of trade opportunities.
0
200
400
600
800
1000
1200
1400
1600
USD/tonSoybean oil
June 2008
0
200
400
600
800
1000
1200
1400
USD/tonPalm oil
February 2011
March 2008
0
200
400
600
800
1000
1200
1400
1600
1800
2000
USD/tonRapeseed oil
July 2008

128 – 4. HOW EXPORT RESTRICTIVE MEASURES AFFECT TRADE IN AGRICULTURAL COMMODITIES
EXPORT RESTRICTIONS IN RAW MATERIALS TRADE: FACTS, FALLACIES AND BETTER PRACTICES © OECD 2014
World production and consumption
During the period under review, underlying trends in global production and consumption of key food commodities both increased more or less in balance, with most annual fluctuations coming from the production side. During the 2004-11 period, rice consumption exceeded production only in 2004 with production greater than consumption in each of the following years. Years in which global demand exceeded supply for other commodities were: soybeans (2007, 2008), wheat (2006, 2007, and 2010), and maize (2005, 2006, 2010 and 2011). Thus, 2006 and 2010 were years in which international markets for both wheat and maize were under particular pressure.
14
Figure 4.5. Stocks-to-use ratio for selected commodities: 2004-2011
Source: USDA, FAS, PS&D.
Annual differences between global production and consumption are reflected in Inventory changes, with stocks increasing when production exceeds consumption and decreasing when the opposite occurs. Figure 4.5 shows the variability in the stocks-to-use ratio for the eight major commodities, which is considered a good indicator of the tightness of world supply. Some evidence suggests that an abnormally low level of this ratio for a particular commodity can unleash speculative activity in that market, which increases the pressure on price already caused by the excess of consumption over production.
0.1
0.15
0.2
0.25
0.3
0.35
2004 2005 2006 2007 2008 2009 2010 2011
Rice Wheat Maize Soybeans
0
0.02
0.04
0.06
0.08
0.1
0.12
0.14
0.16
0.18
2004 2005 2006 2007 2008 2009 2010 2011
Soybean oil Rapeseed oil Palm oil Sunflower oil

4. HOW EXPORT RESTRICTIVE MEASURES AFFECT TRADE IN AGRICULTURAL COMMODITIES – 129
EXPORT RESTRICTIONS IN RAW MATERIALS TRADE: FACTS, FALLACIES AND BETTER PRACTICES © OECD 2014
Global production of food crops is relatively concentrated. For example, the top ten rice or maize-producing countries provide 85-86% of world supply, while the ten largest wheat producers account for about 83% of global output. Soybean production is the most concentrated of the four crops, with the top ten producers providing almost 98% of the total. Some countries in the Inventory – Argentina, China, Kazakhstan, India, Pakistan, the Russian Federation, Ukraine and Viet Nam – are among the leading producers of one or more of these crops. Vegetable oil production is also heavily concentrated, with the ten leading producers providing about 93% of world supply for soybean and sunflower seed oil, and at least 96% of world supply for rapeseed and palm oil. Among the leading ten producers of one or more of these vegetable oils are Argentina, China, India, Indonesia, Pakistan, the Russian Federation and Ukraine.
World exports of selected products
Rice is the least traded of the four crops analysed here; rice tends to be consumed where it is produced and, on average during the eight-year period reviewed, only 7% of production (about 31 million tons) was traded annually. In volume terms, wheat is the most traded with an annual average of more than 125 million tons, or close to 20% of production. However, in terms of production share, soybeans were the most traded crop with on average 35% of global output entering the world market.
Export volumes for all eight commodities followed an upward trend, except for soybean oil which remained rather flat and ended the period slightly below its 2004 level. However, there were marked fluctuations around these trends. In particular, exports in 2008 were below 2007 levels for soybeans (2%), rice (nearly 9%) and maize (more than 14%). Wheat exports followed a somewhat different pattern, reaching a peak in 2008, falling in 2009 and 2010, and picking up thereafter.
Among the vegetable oils, palm oil is the most traded both in absolute terms and as a share of world production: about 75% of production is exported. Consumption of the other vegetable oils mainly occurs domestically but to different extents, with rapeseed oil the least traded. However, the exported share of rapeseed production increased substantially during the period, doubling from 8% in 2004 to 16% in 2011. The share of sunflower oil production traded also increased somewhat while that of soybean oil declined, with more output remaining in the domestic market.
Movements in the value of traded supplies depend on both price and volume changes. Data on the value of trade for selected commodities from the BACI database,
15 which is bilateral trade
data detailed at the HS6 digit level, and focusing on the total value of trade for the selected commodities, make it clear that the value of exports continued to rise for all four crops to reach a peak in 2008, followed by a significant fall. Thus, although the exported volumes of rice, maize and soybeans peaked a year earlier in 2007, their price peaks in 2008 were sufficient to fuel a continued rise in their total value. Wheat exports turn out to have the highest value up to 2008, but from 2009 onwards they are surpassed in value by soybeans.
The export values of the four vegetable oils all peak in 2008, fall in 2009, and then start to rise again. Palm oil is by far the most valuable exported vegetable oil; although its exported volumes are the smallest of the four oils, its total exported value dominates the three, consistently more than double that of soybean oil.
Exports are even more concentrated over exporting countries than production. The leading ten rice exporting countries shipped more than 90% of the total each year. Among the countries in the Inventory that imposed restrictions on rice exports during the period, India, Pakistan and Viet Nam are consistently among the ten largest exporting countries. China was in that group but dropped out in 2010 and 2011, whereas Argentina dropped out of the top ten exporting countries during 2007-9 but qualified for it again in 2010. Egypt was in this category during 2004-7 and again in 2009, whereas Myanmar was among the ten leading exporters in 2007-8 and again in 2010-11.
The world wheat market is also dominated by relatively few exporting countries. The ten leading wheat-exporting countries supplied about 94% of total wheat exports during the period. Among the countries in the Inventory with restrictions on wheat exports in any year during the

130 – 4. HOW EXPORT RESTRICTIVE MEASURES AFFECT TRADE IN AGRICULTURAL COMMODITIES
EXPORT RESTRICTIONS IN RAW MATERIALS TRADE: FACTS, FALLACIES AND BETTER PRACTICES © OECD 2014
period, Argentina, Kazakhstan and the Russian Federation figure in top ten exporting countries every year, as does Ukraine in every year except 2007. India was among the top ten exporters only in 2004, whereas China appeared in this group during 2005-7, as did Pakistan in 2007 and 2008.
The top ten maize-exporting countries supply 95-7% of the world market, depending on the year. Argentina and Ukraine were among the top ten in every year of the period, whereas India joined the group in 2005 only and the Russian Federation entered the ranks in 2008 and again in 2011. China was among the ten largest exporters until 2006, but since 2006 its maize exports have fallen sharply. As Table 44 shows, in 2007 and 2008, China was not restricting maize exports, but began doing so in 2009.
The ten largest soybean-exporting countries provide essentially 100% of exported volumes, with more than 95% supplied by the top four or five exporters. Given the very skewed distribution of exports over exporting countries for this commodity, a country can be among the leading ten exporting countries with a market share of less than one-tenth of a percent. Of the countries in the Inventory using export restrictions for soybeans, Argentina, China and Ukraine are among the ten leading soybean-exporting countries, but other than Argentina, they are not significant exporters; indeed, exports from China and Ukraine counted together often provide less than 1% of world total.
Vegetable oil exports are also very concentrated over source countries. In any year, the leading ten exporters of each of the four vegetable oils exported at least 95% of world volume. Of the countries in the Inventory with an export restriction during the period, Argentina was the leading exporter of soybean oil in each year with more than half of all exports. Rapeseed oil exports are dominated by one country, Canada, which supplies more than 60% of the volume traded in any year. Among countries in the Inventory, Belarus was placed in the top ten rapeseed oil exporters each year, despite providing only about 1% of world total, and this was also true of India in 2009 and 2010. Ukraine and Argentina head the list of exporters of sunflower seed oil, together providing more than 60% of world’s total in any given year. Other than Argentina, none of the main exporters of sunflower seed oil are in the Inventory of countries using export restrictions. Exports of palm oil are dominated by two countries – Indonesia and Malaysia – which together supply more than 80% of traded volume each year. Indonesia is the only country among the leading exporters that used export restrictions for palm oil (2009-11).
On the import side, the markets for these commodities are less concentrated, as importers are more numerous with smaller shares. Liapis (2012) calculated Hirschman-Herfindahl indexes using bilateral trade data from the BACI database so as to measure market concentration of exporters and importers of various products. Unsurprisingly, the results show that export markets are more concentrated than import markets. The implication is that many more countries rely on world markets for their imports compared to the number of exporters supplying their needs. Disruptions in the export supply from any provider therefore have the potential to affect adversely a large number of importers. This is more likely when several exporters restrict exports in the same year.
The data presented so far suggest that in most cases, total volumes exported did not shrink when export restrictions were in force. Most of these markets are dominated by a few major suppliers, many of whom did not restrict their exports. It may still be the case, however, that certain individual importers were adversely affected if their traditional supplier restricted its export supply.
4.5. Aggregated production and export share of countries with export restrictions
The picture of developments in world markets presented so far may mask relevant information about individual countries. Establishing links between the restrictions of an individual country and the world market, however, is not straightforward, since in most years, several countries applied export measures on the same commodity. Therefore, it is more useful to focus on the combined effects of these policies on their aggregated exports, while taking into account the countries’ domestic supply and by inference their potential export supply
16.

4. HOW EXPORT RESTRICTIVE MEASURES AFFECT TRADE IN AGRICULTURAL COMMODITIES – 131
EXPORT RESTRICTIONS IN RAW MATERIALS TRADE: FACTS, FALLACIES AND BETTER PRACTICES © OECD 2014
Table 4.7 reports for the selected commodities, the number of countries restricting exports in each year, the number of restrictions used in that year, the average shares of production and exports during the three year period before most countries began restricting exports (2004-2006) and the average share of those same countries in the year they used restrictions. A three-year average for production and exports is chosen to reduce climatic and other particularities of any one year. For the countries and commodities represented in Table 4.7, the period 2004 to 2006 is assumed to be representative of a “typical” year before the more frequent use of export restrictions during 2007-11. In 2004, other than Argentina’s export taxes, none of the countries in the Inventory imposed export restrictions on the products listed in Table 4.7. In 2005, Pakistan banned wheat exports, while in October 2006 Argentina banned maize exports and in November of the same year, Ukraine imposed a 3 million-ton export quota on wheat. These two measures were adopted late enough in the year that they probably did not materially affect their 2006 results.
For example, for the year 2008, eight countries took actions in their respective rice export market. On average, production by those eight countries in the base (2004-6) accounted for 71% of total production, and the share of rice production in 2008 for those 8 countries was also 71%. Table 4.7 also shows that exports from the eight countries averaged 52% of total trade in the base and it was 48% of total trade in 2008. It appears, therefore, that in 2008, these eight countries maintained their share of world production relative to the base but even though total rice exports were below the base, exports from the eight countries in 2008 fell even more leading to a four percentage point reduction in their export share.
Similarly, eight countries also intervened in their wheat market. In 2008, these eight countries accounted for 48% of world’s total wheat production, compared to 46% average share in the base. But, even with the interventions in their respective export market, the eight countries provided 33% of total exports in 2008, a three percentage point increase relative to their share in the base. Total wheat exports were higher in 2008 and yet the eight countries that imposed export measures had a higher share of the total, indicating that exports from these countries expanded disproportionately more than exports from other countries.
This is not the case for 2009, however. Production of the four countries17
that restricted their rice exports averaged 54% of world total in the base. In 2009, production share of these four countries fell slightly to 52% of world total. Their exports, however, were substantially lower in 2009 compared to their base average, falling some 12 percentage points from 25% of world total exports in the base to 13% in 2009. In contrast, total rice exports were higher (Figure 4.7). Given the small decline in relative production and the relatively large fall in export share, a casual inference is that the export restrictions may have contributed to the lower export share for these countries.
The wheat market was similarly affected in 2009. The three countries with export restraints in 2009 had a 34% share of world wheat production – four percentage points higher than in the base period—and total wheat exports in 2009 were actually lower than in the base period. The share of these three countries in the export market was 7 percentage points lower, falling to 5% of the export market in 2009. Given their higher share of world wheat production, the smaller share of world exports could well have been due to their export restraints.
The countries applying export restrictions in 2008 and 2009 were, collectively, large producers and traders during the pre-2007 period. But it is not clear what impact their actions had on their exports. In three of the four cases presented above, export share fell relative to the base, but in the other case, export share rose while production shares either increased or remained the same. Similarly, it is difficult to generalise on the effects of the interventions to other years or products given the data. Table 4.7 illustrates that in some years and for some products, the countries intervening in their export markets, collectively, produced a relatively large share of world total and provided a large share of world’s exports. In other years or for other commodities, the countries using restrictions were collectively relatively small producers and traders. During the five years 2007-11, countries with any kind of export restraint for the products shown in Table 4.7 experienced production declines in the year in which they took used a restriction of at least one percentage point compared to average 2004-6 production a total of eight times. In five of these

132 – 4. HOW EXPORT RESTRICTIVE MEASURES AFFECT TRADE IN AGRICULTURAL COMMODITIES
EXPORT RESTRICTIONS IN RAW MATERIALS TRADE: FACTS, FALLACIES AND BETTER PRACTICES © OECD 2014
Table 4.7. Number of countries, actions and collective share of production and exports
Number of countries
Number of restrictions
Average share of production 2004-2006
Share of production
Average share of exports 2004-2006
Share of exports
2007
Rice 3 13 0.27 0.28 0.34 0.31
Wheat 5 14 0.28 0.29 0.24 0.24
Maize 1 3 0.03 0.03 0.16 0.15
Other grains 2 4.5 0.09 0.08 0.18 0.18
Soybeans 1 1.5 0.19 0.21 0.13 0.18
Other oilseeds 1 9 0.05 0.07 0.03 0.03
Vegetable oils 3 49.5 0.29 0.29 0.44 0.43
2008
Rice 8 39 0.71 0.71 0.52 0.48
Wheat 8 16 0.46 0.48 0.30 0.33
Maize 3 6.5 0.25 0.28 0.23 0.16
Other grains 3 4.5 0.12 0.12 0.26 0.31
Soybeans 2 2 0.26 0.22 0.14 0.08
Other oilseeds 2 1.5 0.13 0.07 0.05 0.03
Vegetable oils 4 38 0.28 0.10 0.41 0.42
2009
Rice 5 17 0.54 0.52 0.25 0.13
Wheat 3 6 0.30 0.34 0.12 0.05
Maize 1 0.5 0.03 0.03 0.16 0.17
Other grains 2 0 0.05 0.05 0.19 0.21
Soybeans 2 0.5 0.26 0.27 0.14 0.14
Other oilseeds 1 1 0.05 0.04 0.03 0.03
Vegetable oils 3 38 0.11 0.10 0.14 0.09
2010
Rice* 6 19 0.28 0.28 0.38 0.31
Wheat 7 8 0.29 0.30 0.24 0.17
Maize 4 3 0.04 0.05 0.18 0.21
Other grains 4 3.5 0.14 0.12 0.37 0.34
Soybeans 2 0.5 0.19 0.19 0.13 0.10
Other oilseeds 3 3.5 0.04 0.05 0.01 0.03
Vegetable oils 5 17 0.27 0.30 0.41 0.40
2011
Rice* 3 4 0.04 0.04 0.05 0.05
Wheat 6 6.5 0.13 0.15 0.22 0.31
Maize 3 2 0.04 0.06 0.18 0.30
Other grains 3 4.5 0.14 0.16 0.37 0.50
Soybeans 2 1 0.19 0.19 0.13 0.10
Other oilseeds 4 7.5 0.09 0.10 0.04 0.03
Vegetable oils 4 9.5 0.22 0.27 0.41 0.40
Each HS6 code counts as 1 if a restriction lasts more than six months and .5 if it lasts less than 6 months. * Information for rice in 2010 and 2011 excludes China since it is not clear how China’s licenses were administered, and hence whether they were restrictive or not. In any year, average share of production or exports for 2004-2006 refers to countries with policies in that year
Data for other oilseeds include cottonseed, rapeseed, sunflower seed and palm kernel depending on the country and year
Data for vegetable oils include soybean oil, rapeseed oil, sunflower seed oil, coconut oil, palm kernel oil, palm oil, cottonseed oil depending on the country and year. Data are not available for all relevant commodities for all countries.

4. HOW EXPORT RESTRICTIVE MEASURES AFFECT TRADE IN AGRICULTURAL COMMODITIES – 133
EXPORT RESTRICTIONS IN RAW MATERIALS TRADE: FACTS, FALLACIES AND BETTER PRACTICES © OECD 2014
eight cases, their export share was lower in the year the action was taken compared to their 2004-06 average. In two cases, the export share was the same in both periods and in one, export share expanded somewhat. In 17 cases, average production of the countries using a restriction in that year was at least one percentage point above their 2004-06 average. In seven of those cases, however, even with higher production, their share of exports in the year was below their 2004-2006 average. In two cases, the export share was the same, with the remaining eight cases showing export shares above the 2004-2006 average.
In general, it is difficult to assert with any certainty that export restrictions used by countries in the Inventory lowered exports of the selected crops. Assuming that their 2004 to 2006 average market share represents their typical market share in the absence of export restrictions, Table 4.7 indicates that their collective export shares in any year were either higher, lower or the same as the average during 2004-2006 and the export shares seem unrelated to whether the collective production of the countries imposing restrictions was lower, higher or the same as in the base period. A possible exception concerns rice: Table 4.7 suggests a possible link between export restrictions and export volumes. This is examined in more detail below.
4.6. Impacts of export restrictions on world trade
Did export restrictions affect total exported volumes?
A country’s export potential in a given year largely depends on its levels of domestic production and consumption in the current year (“current surplus”). Use of export restrictions – if they are effective – means that, for a given level of current surplus, this potential is diminished (if taxes are used) or reduced to zero (in the case of an export ban). Therefore, in order to test whether export restrictions used by individual countries during the period 2004-11 in curbing their exports, regressions were run to determine whether the presence of restrictions in a given year had a dampening effect on the relationship between exports and current surplus. The regressions results are reported in Table 4.8.
Table 4.8. Effects of export restrictions on exports
Rice Wheat Maize
Current surplus 0.705*** 0.619*** 0.864***
(0.088) (0.058) (-0.066)
Export restrictions -624.952** 159.944 -75.449
(262.37) (631.96) (533.13)
Constant 753.436*** 1740.26*** 452.202
(271.12) (314.67) (338.49)
Adjusted R2 0.76 0.73 0.82
Number of observations 64 88 48
Robust standard errors in parentheses. *** p<0.01, ** p<0.05, * p<0.1
Three crops – rice, wheat and maize – were selected for this exercise. Export restrictions are represented by a dummy variable that takes the value of one when a country imposed any of the restrictive measures found in the database in that year for that crop, and zero otherwise.
18 This
zero-one dummy variable is a crude indicator as it does not discriminate among the various instruments or reflect the degree of restrictiveness of their settings, nor does it take into account the number of months during the year that the measures were in place. Regarding expected signs, exports should be positively related to current surplus and they should decrease, holding current surplus constant, when export restrictions are used.
Table 4.8 reports the regression results based on observations from the countries in the Inventory that applied at least one export restraint at least once during the period. The resulting number of observations ranges from 48 for maize to 88 for wheat. The explanatory power of the
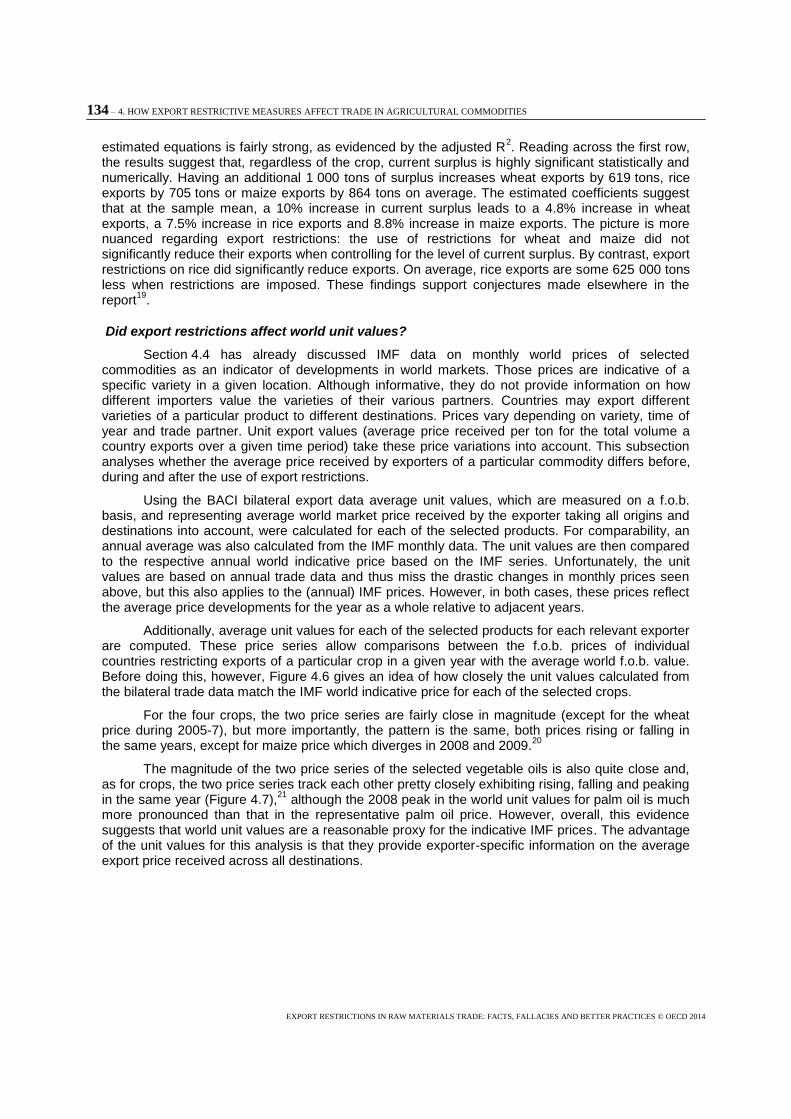
134 – 4. HOW EXPORT RESTRICTIVE MEASURES AFFECT TRADE IN AGRICULTURAL COMMODITIES
EXPORT RESTRICTIONS IN RAW MATERIALS TRADE: FACTS, FALLACIES AND BETTER PRACTICES © OECD 2014
estimated equations is fairly strong, as evidenced by the adjusted R2. Reading across the first row,
the results suggest that, regardless of the crop, current surplus is highly significant statistically and numerically. Having an additional 1 000 tons of surplus increases wheat exports by 619 tons, rice exports by 705 tons or maize exports by 864 tons on average. The estimated coefficients suggest that at the sample mean, a 10% increase in current surplus leads to a 4.8% increase in wheat exports, a 7.5% increase in rice exports and 8.8% increase in maize exports. The picture is more nuanced regarding export restrictions: the use of restrictions for wheat and maize did not significantly reduce their exports when controlling for the level of current surplus. By contrast, export restrictions on rice did significantly reduce exports. On average, rice exports are some 625 000 tons less when restrictions are imposed. These findings support conjectures made elsewhere in the report
19.
Did export restrictions affect world unit values?
Section 4.4 has already discussed IMF data on monthly world prices of selected commodities as an indicator of developments in world markets. Those prices are indicative of a specific variety in a given location. Although informative, they do not provide information on how different importers value the varieties of their various partners. Countries may export different varieties of a particular product to different destinations. Prices vary depending on variety, time of year and trade partner. Unit export values (average price received per ton for the total volume a country exports over a given time period) take these price variations into account. This subsection analyses whether the average price received by exporters of a particular commodity differs before, during and after the use of export restrictions.
Using the BACI bilateral export data average unit values, which are measured on a f.o.b. basis, and representing average world market price received by the exporter taking all origins and destinations into account, were calculated for each of the selected products. For comparability, an annual average was also calculated from the IMF monthly data. The unit values are then compared to the respective annual world indicative price based on the IMF series. Unfortunately, the unit values are based on annual trade data and thus miss the drastic changes in monthly prices seen above, but this also applies to the (annual) IMF prices. However, in both cases, these prices reflect the average price developments for the year as a whole relative to adjacent years.
Additionally, average unit values for each of the selected products for each relevant exporter are computed. These price series allow comparisons between the f.o.b. prices of individual countries restricting exports of a particular crop in a given year with the average world f.o.b. value. Before doing this, however, Figure 4.6 gives an idea of how closely the unit values calculated from the bilateral trade data match the IMF world indicative price for each of the selected crops.
For the four crops, the two price series are fairly close in magnitude (except for the wheat price during 2005-7), but more importantly, the pattern is the same, both prices rising or falling in the same years, except for maize price which diverges in 2008 and 2009.
20
The magnitude of the two price series of the selected vegetable oils is also quite close and, as for crops, the two price series track each other pretty closely exhibiting rising, falling and peaking in the same year (Figure 4.7),
21 although the 2008 peak in the world unit values for palm oil is much
more pronounced than that in the representative palm oil price. However, overall, this evidence suggests that world unit values are a reasonable proxy for the indicative IMF prices. The advantage of the unit values for this analysis is that they provide exporter-specific information on the average export price received across all destinations.

4. HOW EXPORT RESTRICTIVE MEASURES AFFECT TRADE IN AGRICULTURAL COMMODITIES – 135
EXPORT RESTRICTIONS IN RAW MATERIALS TRADE: FACTS, FALLACIES AND BETTER PRACTICES © OECD 2014
Figure 4.6. World unit values and world indicative price of selected crops
Source. Author's calculations from IMF and BACI.
2…2…2…2…2…2…2… World Unit Values IMF
0
50
100
150
200
250
300
350
2004 2005 2006 2007 2008 2009 2010
USD/ton
Wheat
0
100
200
300
400
500
600
700
800
2004 2005 2006 2007 2008 2009 2010
USD/ton
Rice
0
50
100
150
200
250
300
350
400
450
500
2004 2005 2006 2007 2008 2009 2010
USD/ton
Soybeans
0
50
100
150
200
250
2004 2005 2006 2007 2008 2009 2010
USD/ton
Maize

136 – 4. HOW EXPORT RESTRICTIVE MEASURES AFFECT TRADE IN AGRICULTURAL COMMODITIES
EXPORT RESTRICTIONS IN RAW MATERIALS TRADE: FACTS, FALLACIES AND BETTER PRACTICES © OECD 2014
Figure 4.7. World unit values and world indicative price of selected vegetable oils
Source: Author's calculations from IMF and BACI.
Did export restrictions affect country-specific commodity prices?
The theoretical analysis presented in Chapter 2 of this volume demonstrates that, when a country that is “large” relative to the world market restricts its exports, world prices are higher than they otherwise would be. When the restrictive instrument is an export tax or a binding export quota (equivalent to an export tax), a “large” exporter can benefit from improved terms of trade through higher prices. However, it is not clear a priori for any one country whether its export price should be above or below the world average as it depends on the demand for the exporter’s variety.
At the same time, domestic market prices in the country using the restriction should be lower than the world price, regardless of the country’s size. However, an export ban insulates the domestic market from developments in the world market; in this case, domestic price is set by supply and demand conditions within the country. Again, following the theory in Chapter 2, the producer price should be lower than the export (f.o.b.) price due to transport and other handling costs incurred between the farm gate and the ship’s hold, and to the payment of any taxes, including export taxes. In this section, for key exporting countries and each of the four grain crops,
0200020…20…20…20…20…20…20…
World Unit Values IMF
0
200
400
600
800
1000
1200
2004 2005 2006 2007 2008 2009 2010
USD/ton
Soybean oil
0
200
400
600
800
1000
1200
1400
2004 2005 2006 2007 2008 2009 2010
USD/ton
Palm oil
0
200
400
600
800
1000
1200
1400
1600
2004 2005 2006 2007 2008 2009 2010
USD/ton
Rapeseed oil

4. HOW EXPORT RESTRICTIVE MEASURES AFFECT TRADE IN AGRICULTURAL COMMODITIES – 137
EXPORT RESTRICTIONS IN RAW MATERIALS TRADE: FACTS, FALLACIES AND BETTER PRACTICES © OECD 2014
producer price (available from FAO) is compared with unit export values (see previous section), and the world average price.
Wheat
Among the countries in the Inventory that used export restrictions for wheat at any time during the relevant period, Argentina, China, Pakistan, the Russian Federation and Ukraine were relatively large exporters during at least one of the relevant years. Focusing on these larger exporters reduces the possibility of small shipments biasing the calculated average f.o.b. price.
Except in the case of Ukraine, whose unit value export price was consistently below the average world unit value, the unit value export price of the other countries was below or above the world average depending on the year. In 2007, all countries other than the Russian Federation had unit values below the world average. the Russian Federation’s export price, however, for the following three years was at least 10% below the world’s average. In 2008, the unit value export price of the relevant countries was anywhere from 8% below (Argentina), to 26% below (Ukraine) world average export price.
As for the producer price for wheat, this was below the country’s average export price and below the average world export price, as expected, for Argentina, the Russian Federation and Ukraine. Moreover, it follows the same short-term movement as the average export price. For China and Pakistan, however, this is not the case. The producer price is at times above the average export price (suggesting exports are subsidised) and producer price seem divorced from developments in world markets (Figure 4.8).
Rice
None of the selected rice-exporting countries met the expectation that their export price would be consistently below the world average unit value; moreover, India for all years and Pakistan except for the last two years had export prices greater than the world’s average. India’s average rice export price in 2009 was almost 80% above the world’s average while it was 56% above in 2010. In these years, India was operating an export ban for rice; however, in both years there were exceptions to the ban and specifically in 2009 the exceptions were conditional upon a high export price being reached (Table 4.3).
Data limitations prevent a comprehensive conclusion regarding producer price. The FAO’s producer price is for paddy rice, which is not strictly comparable to the export price; furthermore, FAOSTAT does not report producer price for Argentina, Pakistan and Viet Nam, and only up to 2008 for India. Nonetheless, although not comparable, it is still informative to examine the relationship between the producer and unit value export prices. For China, Egypt and India, the producer price is below the export price in every year, even if it does not necessarily move with the export price (Figure 4.9).
Maize
In 2004 (when there were few export restrictions) and again in 2008 (when restrictions were prevalent), the average export price for maize of each of the selected countries was above the average world export price. India’s export price persisted above the world average price throughout the time period examined, while China’s export price was below the world average price only in 2007 and the Russian Federation’s only in 2009.
The maize producer price in Argentina and Ukraine is, as expected, below the world average and the respective country’s export price, and seems to be linked to the international price. In India, the producer price is only available to 2008, and while it is less than the export price, it is above the world average price. The producer price in the Russian Federation is about the same as its export price in 2007 and 2009 and above it in 2008. China’s producer price is above the world average unit value each year, and it is greater than its own export price up to 2007. In the last two years, China’s producer price is about the same as the export price (Figure 4.10).

138 – 4. HOW EXPORT RESTRICTIVE MEASURES AFFECT TRADE IN AGRICULTURAL COMMODITIES
EXPORT RESTRICTIONS IN RAW MATERIALS TRADE: FACTS, FALLACIES AND BETTER PRACTICES © OECD 2014
Figure 4.8. Average world unit value, country-specific unit value and producer price of selected countries: Wheat, 2004-10
Source: IMF, BACI and FAO.
05002004 2005 2006 2007 2008 2009 2010World Unit Value Country-specific unit values pp
0
50
100
150
200
250
300
350
2004 2005 2006 2007 2008 2009 2010
USD/ton
Argentina
0
50
100
150
200
250
300
350
2004 2005 2006 2007 2008 2009 2010
USD/ton
China
0
50
100
150
200
250
300
350
2004 2005 2006 2007 2008 2009 2010
USD/ton
Pakistan
0
50
100
150
200
250
300
350
2004 2005 2006 2007 2008 2009 2010
USD/ton
Russia
0
50
100
150
200
250
300
350
2004 2005 2006 2007 2008 2009 2010
USD/ton
Ukraine

4. HOW EXPORT RESTRICTIVE MEASURES AFFECT TRADE IN AGRICULTURAL COMMODITIES – 139
EXPORT RESTRICTIONS IN RAW MATERIALS TRADE: FACTS, FALLACIES AND BETTER PRACTICES © OECD 2014
Figure 4.9. Average world unit value, country-specific unit value and producer price of selected countries: Rice 2004-10
Source: IMF, BACI and FAO.
2004 2005 2006 2007 2008 2009 2010World unit value Country-specific unit values
0
100
200
300
400
500
600
700
800
2004 2005 2006 2007 2008 2009 2010
USD/ton
China
0
100
200
300
400
500
600
700
800
2004 2005 2006 2007 2008 2009 2010
USD/ton
Egypt
0
200
400
600
800
1000
1200
2004 2005 2006 2007 2008 2009 2010
USD/ton
India
0
100
200
300
400
500
600
700
800
900
2004 2005 2006 2007 2008 2009 2010
USD/ton
Pakistan
0
100
200
300
400
500
600
700
2004 2005 2006 2007 2008 2009 2010
USD/ton
Viet Nam
0
100
200
300
400
500
600
700
2004 2005 2006 2007 2008 2009 2010
USD/ton
Argentina

140 – 4. HOW EXPORT RESTRICTIVE MEASURES AFFECT TRADE IN AGRICULTURAL COMMODITIES
EXPORT RESTRICTIONS IN RAW MATERIALS TRADE: FACTS, FALLACIES AND BETTER PRACTICES © OECD 2014
Figure 4.10. Average world unit value, country-specific unit value and producer price of selected countries: Maize 2004-10
Source: IMF, BACI and FAO.
World unit value Country-specific unit values pp
0
50
100
150
200
250
300
2004 2005 2006 2007 2008 2009 2010
USD/ton
Argentina
0
50
100
150
200
250
300
2004 2005 2006 2007 2008 2009 2010
USD/ton
China
0
50
100
150
200
250
300
2004 2005 2006 2007 2008 2009 2010
USD/ton
Russia
0
50
100
150
200
250
2004 2005 2006 2007 2008 2009 2010
USD/ton
Ukraine
0
50
100
150
200
250
300
350
2004 2005 2006 2007 2008 2009 2010
USD/ton
India
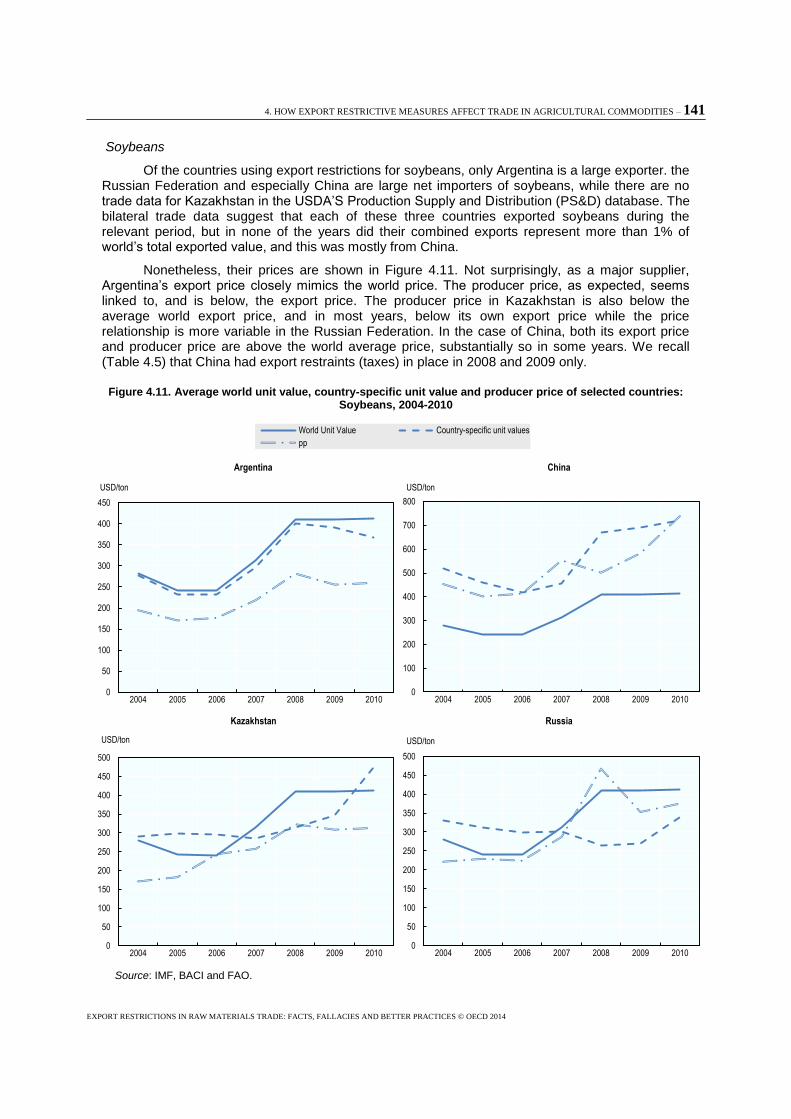
4. HOW EXPORT RESTRICTIVE MEASURES AFFECT TRADE IN AGRICULTURAL COMMODITIES – 141
EXPORT RESTRICTIONS IN RAW MATERIALS TRADE: FACTS, FALLACIES AND BETTER PRACTICES © OECD 2014
Soybeans
Of the countries using export restrictions for soybeans, only Argentina is a large exporter. the Russian Federation and especially China are large net importers of soybeans, while there are no trade data for Kazakhstan in the USDA’S Production Supply and Distribution (PS&D) database. The bilateral trade data suggest that each of these three countries exported soybeans during the relevant period, but in none of the years did their combined exports represent more than 1% of world’s total exported value, and this was mostly from China.
Nonetheless, their prices are shown in Figure 4.11. Not surprisingly, as a major supplier, Argentina’s export price closely mimics the world price. The producer price, as expected, seems linked to, and is below, the export price. The producer price in Kazakhstan is also below the average world export price, and in most years, below its own export price while the price relationship is more variable in the Russian Federation. In the case of China, both its export price and producer price are above the world average price, substantially so in some years. We recall (Table 4.5) that China had export restraints (taxes) in place in 2008 and 2009 only.
Figure 4.11. Average world unit value, country-specific unit value and producer price of selected countries: Soybeans, 2004-2010
Source: IMF, BACI and FAO.
World Unit Value Country-specific unit values
pp
0
50
100
150
200
250
300
350
400
450
2004 2005 2006 2007 2008 2009 2010
USD/ton
Argentina
0
100
200
300
400
500
600
700
800
2004 2005 2006 2007 2008 2009 2010
USD/ton
China
0
50
100
150
200
250
300
350
400
450
500
2004 2005 2006 2007 2008 2009 2010
USD/ton
Kazakhstan
0
50
100
150
200
250
300
350
400
450
500
2004 2005 2006 2007 2008 2009 2010
USD/ton
Russia

142 – 4. HOW EXPORT RESTRICTIVE MEASURES AFFECT TRADE IN AGRICULTURAL COMMODITIES
EXPORT RESTRICTIONS IN RAW MATERIALS TRADE: FACTS, FALLACIES AND BETTER PRACTICES © OECD 2014
Vegetable oils
Of the countries that applied at least one export restriction on the selected vegetable oils, in at least one year, only three – Argentina in the soybean oil and sunflower seed oil markets, Belarus in the rapeseed oil market and Indonesia in the palm oil market – are substantial exporters. Furthermore, of the relevant vegetable oils, the FAO reports producer price for palm oil only. Only Indonesia is relevant and the information from the FAO is only up to 2007. Given Argentina’s and Indonesia’s role in the soybean oil and palm oil markets respectively, it is not surprising that their export price is very close to and mimics the average world price.
The price information above suggests that causal inferences between export restrictions used and export or domestic prices are difficult to make. Clearly there were dramatic increases in monthly prices during the period, which coincided with several countries announcing restriction on their exports. Undoubtedly, such announcements affected the psychology of the markets creating panic and uncertainty.
Did export restrictions affect imported volumes?
This section examines the effects of export restrictions on bilateral trade between countries. The analysis is restricted to the three crops, maize, rice and wheat.
The Inventory contains annual information at the HS6 level for each exporter on its top five export destinations (when relevant) and each partner’s share of the exporter’s exports. These data offer insights into trade flows between individual exporting and importing countries covered in the Inventory. The BACI database provides bilateral trade information for all countries and is the data source for this section. Between 2004 and 2010, a wheat-importing country sourced its supply in any year from (on average) seven different exporters, whereas for a rice-importing country the average figure was 13 export sources and for maize-importing countries it was eight. There was a great deal of variation across countries in the number of suppliers to a specific destination, ranging from only one wheat supplier to a maximum of 27 different wheat suppliers, up to 36 different suppliers of maize imports, whereas 57 different sources supplied rice to one importer. The fact that countries use multiple import sources suggests a strategy of supply diversification to reduce the risk of exogenous supply shocks.
The analysis first addresses the question of whether export restrictions led importers to reduce their risks by expanding the number of trading partners they engaged with. To examine this question, the average number of trading partners per importer of each of the three crops pre- and post-2007 was computed and a Student t-test was used to test whether the two averages are significantly different. In general, for each of the three crops, the average importing country was supplied by one more exporter during the period 2007 to 2010, compared to the period 2004-6. Except for the rice market, however, the difference was not statistically significant at the 5% level.
22
This result suggests that importers slightly broadened the number of their import sources for rice, and together with the result in Table 4.8 indicates that the world rice market has been more severely affected by export restrictions than the other two markets.
In order to investigate whether export restrictions reduced the import demand for any of the three crops, a simple import demand function was estimated in which the volume bought by importing country i from exporting country j (where j encompasses all exporters and not only those with export restrictions) of product k (k= wheat, rice or maize) (X ij
k) is specified as a function of
country i’s income, country j’s production of crop k, the bilateral unit value of exporter j to importer i in product k (UVij
k) as a proxy for price, time, and the usual trade resistance variables such as
distance, whether or not a country is landlocked, whether or not partners share common border or common language etc., and a zero-one dummy to reflect whether the exporting trade partner used an export restriction during the year. All continuous variables (demand, unit values, production etc.) are in logarithmic form. The results of the estimated equations, controlling for exporter fixed effects,
23 are reported in Table 4.9.

4. HOW EXPORT RESTRICTIVE MEASURES AFFECT TRADE IN AGRICULTURAL COMMODITIES – 143
EXPORT RESTRICTIONS IN RAW MATERIALS TRADE: FACTS, FALLACIES AND BETTER PRACTICES © OECD 2014
Table 4.9. Estimated import demand for rice, wheat and maize
Variables Rice Wheat Maize
Log of importer income 0.152*** 0.071 0.326*** (0.048) (0.064) (0.073)
Log of production in exporting country 0.001 0.525*** 0.335
(0.165) (0.144) (0.212)
Log of unit value (USD/ton) -0.981*** -1.090*** -1.147***
(0.127) (0.151) (0.128)
Export restrictive measures (zero-one dummy) 0.066 0.118 0.146
(0.073) (0.232) (0.229)
Log of time (2004=1, 2005=2 etc.) 0.409*** 0.270** 0.352***
(0.056) (0.109) (0.077)
Log of distance (simple distance most populated cities KM) -0.445*** -0.311* -0.820***
(0.105) (0.159) (0.155)
Is importer landlocked? (zero-one dummy; yes = 1) -0.690*** -0.777*** -0.511**
(0.142) (0.228) (0.222)
Do trading partners share a common border (zero-one; yes=1) 0.816*** -0.144 0.047
(0.230) (0.251) (0.181)
Do trading partners share a common official language (zero-one; yes=1) 0.103 -0.430** -0.351
(0.120) (0.212) (0.217)
Was either trade partner in colonial relationship? (zero-one; yes=1) 1.056*** -0.516** 0.035
(0.271) (0.256) (0.207)
Did either partner share a common colonizer post 1945? (yes=1) 0.446** 0.044 0.609**
(0.189) (0.481) (0.275)
Constant 12.356*** 10.882*** 8.978***
(1.622) (2.202) (1.804)
Observations 9,045 4,430 6,026
Exporter fixed effects yes yes yes
Adjusted R-squared 0.139 0.114 0.286
Robust standard errors in parentheses. *** p<0.01, ** p<0.05, * p<0.1
The results suggest that import demand for rice and maize is positively related to income with a 10% rise in income resulting in a 1.5% increase in rice imports and a 3.3% rise in demand for imported maize. Demand for wheat is not responsive to income. Increased rice or maize production does not seem to influence bilateral import demand. For wheat however, a 10% increase in wheat production in exporting countries, increases bilateral imports by 5%. The upward trend in trade illustrated previously is evidenced also in the upward trend in bilateral trade with the positive and significant estimated coefficient on the time variable. Holding everything else constant, export restrictions do not significantly reduce bilateral trade once the changes in bilateral prices (which are undoubtedly affected by the restrictions) are taken into account. A 10% increase in the bilateral rice price results in a 9.8% reduction in bilateral rice imports while a 10% rise in either the bilateral wheat or maize price leads to about an 11% decline in bilateral imports. The relatively high elasticity suggests that importing countries are able to substitute relatively easily among suppliers. This may largely explain why export restrictions were not found to a significant influence on bilateral imported quantities over and above the effect working through price.
As for the variables from a typical gravity model, their effect on bilateral trade here depends on the crop. Transport and other trade costs (proxied by distance) dampen bilateral trade. A 10% increase in distance between trading partners lowers bilateral maize trade by 8.2%, rice trade by 4.5% and wheat trade by 3.1%. An importing country that is landlocked will engage in less (bilateral) trade, as indicated by the relatively large and statistically significant estimated coefficient for each crop. The average reductions in imports, compared to non-landlocked countries, are 40% (maize),

144 – 4. HOW EXPORT RESTRICTIVE MEASURES AFFECT TRADE IN AGRICULTURAL COMMODITIES
EXPORT RESTRICTIONS IN RAW MATERIALS TRADE: FACTS, FALLACIES AND BETTER PRACTICES © OECD 2014
50% (rice) and 54% (wheat). Unsurprisingly, sharing a border with the import source country increases bilateral imports by 126% on average, but this characteristic is irrelevant for maize and wheat trade. Proxies for similarities among trading partners (such as having a common official language or having being in a colonial relationship) have different effects on the bilateral trade of each crop. Having a common language is unimportant for rice or maize importing but surprisingly has a negative impact wheat imports. Having been under the same colonial power does not have a statistically significant effect on bilateral wheat trade but does facilitate trade in rice (+56%) and maize (+84%).
4.7. Summary and conclusions
To summarise, the Inventory data indicate that export restrictions are used for a large variety of agricultural products, but among the most often targeted are the major grains such as wheat, rice and maize, along with major oilseeds such as soybeans and vegetable oils. These are also the products that are widely traded with many counties, including some of the least developed, which depend on foreign sources for their nutritional needs.
The instruments reported cover export taxes (ad valorem or specific, and include variable levies that change depending on specified conditions), minimum export prices, tax rebates on exported goods, export quotas, licensing requirements and outright export bans. This list may not be cover all types of export restriction used for agricultural commodities, as not all countries with known export restraints are included in the Inventory. The instrument used most frequently by the countries in the Inventory is the export ban, followed by the export tax. At times, countries use a combination of instruments either concurrently or sequentially. Restraints that were initially intended to last a relatively short time can become prolonged well beyond their initially intended duration.
The Inventory stores data on the export restrictions used by the major actors in the various markets. The countries covered are Argentina, Belarus, China, Egypt, Former Yugoslav Republic of Macedonia, India, Indonesia, Kazakhstan, Kyrgyz Republic, Moldova, Myanmar, Pakistan, the Russian Federation, Tajikistan, Ukraine and Viet Nam. Although data prior to 2007 are included in the Inventory for some countries, most of the information is for the years from 2007 to 2011, and for some countries the information extends to 2012. Most countries in the Inventory used export restrictions on products for which they were net exporters, but in some cases they were used for products of which they were net importers.
Some (but not all) countries notified their export restrictions to the WTO as specified in Article 12 of the URAA. In some cases, interventions were temporary. GATT Article XI paragraph 2(a) permits export restrictions when they are temporary (without stipulating what this means) and if they are imposed to prevent or relieve critical food shortages. Nonetheless, since notifications are submitted retrospectively, they are hardly relevant for trading partners who cannot use this information to make forward plans. Furthermore, when temporary measures are invoked frequently within short periods of time, they probably contribute to market instability.
Undoubtedly, export restrictions create uncertainty in the domestic and international markets for the commodities affected. They can influence supply decisions domestically and raise concerns among import-dependent countries about supplier reliability that may last long beyond the duration of the policy.
World export supply for the primary agricultural products selected for analysis is very concentrated. On the import side, trade is less concentrated implying that many countries depend on a few exporters for their import needs. In these circumstances, it is theoretically possible that export restrictions by even one major exporter can disrupt the international market and this could be significantly magnified if several exporters restrict their exports at the same time. This chapter has used several approaches to examine empirical evidence available from the Inventory and elsewhere that might show whether such events occurred and, if so, to quantify the impact.
During the period 2007-11, many world agricultural markets were turbulent. Prices were relatively stable from 2000 to 2004 but thereafter they rose substantially, and became increasingly

4. HOW EXPORT RESTRICTIVE MEASURES AFFECT TRADE IN AGRICULTURAL COMMODITIES – 145
EXPORT RESTRICTIONS IN RAW MATERIALS TRADE: FACTS, FALLACIES AND BETTER PRACTICES © OECD 2014
volatile. Many peaked in April 2008 but after a period of modest declines, the world market food price index reached a new high in April 2011. Price developments for four crops (rice, wheat, maize and soybeans) and three vegetable oils (soybean, rapeseed and palm oil) exhibited similar characteristics, also peaking in 2008 (albeit in different months). The import bill for these commodities increased substantially. Although rising prices meant a boom for exporters, importing countries, especially less developed countries, came under strong pressure.
Total export values of each product trended upwards during the period. But, measured in physical units, rice, maize, soybeans and soybean oil exports dropped in 2008, while the drop in wheat occurred in 2009. The higher prices in 2008 resulted in export revenues that were considerably higher than previous years for all agricultural products including those that are the focus of this report. At this level of aggregation, the inference that export measures contributed to, if not caused, the price spikes may be reasonable. Exports have rebounded since then for all but soybean oil. Rising total exports in most years suggest that countries without export restrictions were able to make up for any potential shortfalls resulting from those measures, thereby reducing potential disruptions. However, it may still be the case that specific importers had trouble finding alternative suppliers, thereby increasing their costs and uncertainty.
These overall trends conceal developments for the countries that used export restraints. Since for some products in several years several countries restricted exports at the same time, we looked for a joint effect specifically concerning this group of countries. However, from their aggregate production and export data, it is difficult to discern a pattern between export measures and resulting export shares because changes in production confounded the effects.
At a more disaggregated level, data for individual countries and markets were examined for potential insights into the link between export restrictions and exports. Again the findings are inconclusive. For example, rice exports in Argentina and Viet Nam in 2008 were above 2007 levels despite their export restraints, although in China, Egypt and India, exports were below 2007 levels and there was virtually no difference between the two years for Pakistan. In China and Egypt, exportable surplus in 2008 was below 2007 suggesting tighter domestic market and less product available for export. Multiple regression shows that there is a strong positive correlation between exportable surplus and exports even with export restraints in place. On average, the presence of export restrictions significantly reduced the exports associated with a given level of surplus for rice, but not for wheat or maize. The effects of export restrictions on importers were also examined using a reduced form bilateral import demand for wheat, rice or maize. The results suggest that bilateral trade was not significantly affected by the export restraints used by the exporting party.
Undoubtedly, unless the export restrictions are totally ineffective, they constrain exports at least for a time, and they affect perceptions of market reliability and stability, contributing to market uncertainty possibly and quite possible exacerbating price volatility. And, it may be one of the reasons that rice importing countries increased the number of partners from whom they source their import needs. The frequent changes to the restrictions and in their degree of severity may have sparked panic buying to secure import needs compounding potential shortages in international markets possibly contributing to the large oscillations in monthly prices. The effect of interventions on market psychology is also a factor that should be considered in assessing their market impacts.
When examined from the somewhat longer perspective of a year, however, the annual data suggest that in most years total trade expanded as exports from countries without restrictive measures made up for potential shortfalls. Additionally, because of the type of measure or its short duration, annual exports from some countries using restrictions continued flowing and in some cases their exports were actually above previous year’s level. In other cases, however, exports from countries using restrictions were substantially reduced relative to their level in the previous year—although, in some of these countries, it was also the case that the domestic markets were tight suggesting lower available export supply. In sum, the presence of multiple causal factors makes it difficult to isolate the effect of restrictions alone. The strongest result is that, in the rice market, the restrictions appear to have lowered exports from the countries imposing them, but other suppliers must have filled the gap as total imports were not substantially lower.

146 – 4. HOW EXPORT RESTRICTIVE MEASURES AFFECT TRADE IN AGRICULTURAL COMMODITIES
EXPORT RESTRICTIONS IN RAW MATERIALS TRADE: FACTS, FALLACIES AND BETTER PRACTICES © OECD 2014
Export restrictive measures undoubtedly raised concerns among importers as to the reliability of their trade partners, and raised costs due to the need to identify new trade partners. Uncertainty about partner reliability may lead importers to contemplate pursuing costly policies toward self-sufficiency and to raise border protection in pursuit of that goal. The chapter does not investigate the effect of the restraints on domestic markets. Hence, it is not possible to ascertain whether or not the policies achieved their goals. Other OECD work (Jones and Kwiecinski, 2010, Thompson and Tallard, 2010) suggests that results were mixed depending on the country, the crop and the measure. But whether or not the goals were achieved, it is well known that policies targeted to specific objectives are more efficient than non-targeted policies like border measures.
Notes
1. Senior Agricultural Policy Analyst in the OECD’s Trade andf Agriculture Directorate. The original draft upon which this chapter is based benefited from useful comments and suggestions from delegates to the Joint Working Party on Agriculture and Trade. The author would also like to thank Christine Arriola for statistical assistance.
2. The Agricultural Market Information System (AMIS) will ameliorate this, starting with major world crops wheat, rice, maize and soybeans. AMIS is an inter-agency platform, set up in 2011 at the request of the Agriculture Ministers of the G20 to promote food market transparency and encourage coordination of policy action in response to market uncertainty.
3. The Harmonized System of tariff nomenclature (full name: Harmonized Commodity Description and Coding System) was set up in 1988, and is maintained by the World Customs Organization (WCO), an independent intergovernmental organisation.
4 This chapter draws heavily on Liapis (2013), which contains two annexes providing more detailed information on export restrictions and trade performance for individual countries.
5. See Liapis (2011) for the breakdown of the commodities into the various categories.
6 In cases where the restrictions are recorded in the Inventory at a more disaggregated level than HS6 and one or more export restrictions are applied within the HS6 category, the frequency is recorded at HS6 level as 0.5 or 1 (according to the duration), regardless of whether the restriction(s) apply/applies to one, several or all tariff lines within the corresponding HS6 category.
7 For example, at least since 2002, Argentina, has levied export duties at a uniform rate on all its agricultural products as defined at the HS8 digit level (except for selected products for which rates were product-specific). The inventory contains the information on the exceptional products (580 at the HS8 digit level) and the changes to their rates over the period.
8. This also reflects the fact that more goods are classified as semi-processed rather than bulk.
9. For additional information on each export-restricting country, and including broader commodity coverage, see Annex I in Liapis (2013).
10. Trade data exclude intra-EU trade.
11 Covering agricultural primary commodities for human consumption, see for example http://www.imf.org/external/np/res/commod/pdf/monthly/080114.pdf.
12 Wheat, No.1 Hard Red Winter, ordinary protein, FOB Gulf of Mexico, USD/ton; Rice, 5% broken milled white rice, Thailand nominal price quote, USD/ton; Maize (corn), US No.2 Yellow, FOB Gulf of Mexico, US price, USD/ton; Soybeans, US soybeans, Chicago Soybean futures contract (first contract forward) No.2 yellow and par, USD per ton.
13. Soybean Oil, Chicago Soybean Oil Futures (first contract forward) exchange approved grades, USD/ton; Palm oil, Malaysia Palm Oil Futures (first contract forward) 4-5% FFA, USD/ton; Rapeseed oil, crude, fob Rotterdam, USD/ton.
14. The source of the statistics in this paragraph is USDA (FAS).

4. HOW EXPORT RESTRICTIVE MEASURES AFFECT TRADE IN AGRICULTURAL COMMODITIES – 147
EXPORT RESTRICTIONS IN RAW MATERIALS TRADE: FACTS, FALLACIES AND BETTER PRACTICES © OECD 2014
15. Base pour l’Analyse du Commerce International. This database is maintained at CEPII (Centre d'Etudes Prospectives et d'Informations Internationales). It is starts with data from the UN COMTRADE database, which are then harmonised using an original procedure to reconcile the declarations of exporter and importer. See Gaulier and Zignago (2010).
16. Annex II of Liapis (2013) reports developments for individual countries in selected markets
17. Data for Indonesia are excluded because Indonesia is a large net rice importer and information indicating how or whether the licensing mechanism affected its exports is lacking.
18. Except in cases where the only restriction is licensing and information on whether this acted as a restriction or not is lacking. For the (few) cases of this kind, the restrictions dummy takes the value of zero.
19. Results (available on request) based on observations from all exporting countries, including those that never used export restrictions, found no impact of these restrictions on total exports of any of the three crops.
20. The simple correlation coefficients for the two price series are .78 for maize, .87 for wheat, .96 for soybeans and .97 for rice.
21. The simple correlation coefficients for the two price series is .84 for palm oil, .94 for rapeseed oil and .99 for soybean oil.
22. The computed t-statistic (degrees of freedom in parenthesis) that the two means are equal is 4.48 (209), 1.90 (181) and 1.42 (173) for rice, maize and wheat respectively.
23. This is equivalent to specifying a dummy variable for each exporter to capture unobserved effects peculiar to each exporter.

148 – 4. HOW EXPORT RESTRICTIVE MEASURES AFFECT TRADE IN AGRICULTURAL COMMODITIES
EXPORT RESTRICTIONS IN RAW MATERIALS TRADE: FACTS, FALLACIES AND BETTER PRACTICES © OECD 2014
References
Agricultural Market Information System (AMIS), (2012), “First Meeting of the Global Food Market Information Group: Abnormal Market Conditions and AMIS Indicators”, Rome, 9-10 February, http://www.amis-outlook.org/amis-events/gfmi-feb/en/.
Dollive, K. (2008), “The Impact of Export Restraints on Rising Grain Prices”, U.S. International Trade Commission, Office of Economics Working Paper N°2008-09-A, September.
FAO, OECD, IFAD, IMF, UNCTAD, WFP the World Bank, the WTO, IFPRI, and the UN HLTF, (2011), “Price Volatility in Food and Agricultural Markets: Policy Responses”, May. http://www.oecd.org/agriculture/pricevolatilityinfoodandagriculturalmarketspolicyresponses.htm.
Gaulier, G. and S. Zignago, (2010), “BACI International Trade Database at the Product Level: The 1994-2007 Version”, CEPII Working Paper N°2010-23.
http://www.cepii.fr/PDF_PUB/wp/2010/wp2010-23.pdf.
Jones, D. and A. Kwiecinski (2010), "Policy Responses in Emerging Economies to International Agricultural Commodity Price Surges", OECD Food, Agriculture and Fisheries Papers, N°34, OECD Publishing, Paris, http://dx.doi.org/10.1787/5km6c61fv40w-en.
Kim, J. (2010), "Recent Trends in Export Restrictions", OECD Trade Policy Papers, N°101, OECD Publishing, Paris, http://dx.doi.org/10.1787/5kmbjx63sl27-en.
Liapis, P. (2011), “Changing Patterns of Trade in Processed Agricultural Products”, OECD Food, Agriculture and Fisheries Working Papers, N°47, OECD Publishing, Paris. http://dx.doi.org/10.1787/5k9fp3zdc1d0-en.
Liapis, P. (2012), “Structural Changes in Commodity Markets: Have Agricultural Markets Become Thinner?”, OECD Food, Agriculture and Fisheries Working Papers, N°54, OECD Publishing, Paris, http://dx.doi.org/10.1787/5kgc3mq19s6d-en.
Liapis, P. (2013), “How Export Restrictive Measures Affect Trade of Agricultural Commodities”, OECD Food, Agriculture and Fisheries Papers, No63, OECD Publishing, Paris. http://dx.doi.org/10.1787/5k43mktw305f-en.
McCalla, A.F. (2009), “World Food Prices: Causes and Consequences”, Canadian Journal of Agricultural Economics, N°57, pages 23-34.
Mitra, S. and T. Josling (2009), “Agricultural Export Restrictions: Welfare Implications and Trade Disciplines”, International Policy Council Position Paper, Agricultural and Rural Development Policy Series, January.
Sharma, R. (2011), “Food Export Restrictions: Review of the 2007-2010 Experience and Considerations for Disciplining Restrictive Measures”, FAO Commodity and Trade Policy Research Working Paper No. 32.
Trostle, R. (20080, “Global Agricultural Supply and Demand: Factors Contributing to the Recent Increase in Food commodity Prices”, USDA, ERS, WRS-0801, July.
Thompson, W. and G. Tallard (2010), "Potential Market Effects of Selected Policy Options in Emerging Economies to Address Future Commodity Price Surges", OECD Food, Agriculture and Fisheries Papers, No. 35, OECD Publishing. http://dx.doi.org/10.1787/5km658j3r85b-en.

5. MULTILATERALISING REGIONALISM: DISCIPLINES ON EXPORT RESTRICTIONS IN REGIONAL TRADE AGREEMENTS – 149
EXPORT RESTRICTIONS IN RAW MATERIALS TRADE: FACTS, FALLACIES AND BETTER PRACTICES © OECD 2014
Chapter 5
MULTILATERALISING REGIONALISM: DISCIPLINES ON EXPORT RESTRICTIONS IN REGIONAL TRADE AGREEMENTS
Jane Korinek and Jessica Bartos1
5.1. Introduction
Some 489 regional trade agreements (RTAs) have been notified to the World Trade Organization (WTO) or its predecessor, the General Agreement on Tariffs and Trade (GATT), and 297 of those agreements are in force.
2 The proliferation of RTAs has been a relatively recent
phenomenon: in 1991 there were only 50 RTAs, whereas by 2005, 180 RTAs were in force, demonstrating the rapid spread of agreements in the last few years.
3
The proliferation of preferential trade agreements poses challenges for the multilateral trading system. Regional trade agreements may be trade-diverting or trade-creating. They may lead to entrenched preferential practices or, on the other hand, increased liberalization. Moreover, they specify rules of origin, standards and dispute settlement mechanisms that vary over agreements. The complexity of overlapping procedures increases transaction costs for businesses and investors, and makes enforcement and oversight difficult for governments (Inter-American Development Bank, 2007). But RTAs also allow countries to develop and strengthen trade disciplines beyond what is possible at the multilateral level.
4 At times, innovation in RTAs has paved the way for practices at
the multilateral level by exploring policy areas uncharted by multilateral disciplines such as environmental standards, investment and competition policy.
A key policy area where disciplines at the multilateral level are relatively undeveloped is export restraints. RTAs may provide lessons and good practice that could inform discussions on this issue in a more inclusive setting. An OECD survey of 93 regional trade agreements examined their provisions on export taxes and restrictions to see whether, and how, they go beyond the WTO provisions on these trade instruments. Comparison of the provisions in the two contexts reveals lessons that can be drawn from RTAs and uncovers some innovative approaches used in RTAs that strengthen their disciplines beyond those in the WTO.
Section 5.2 of this chapter defines export restrictions. Section 5.3 summarises the multilateral disciplines on export restrictions found in the WTO agreements and their current interpretations, as well as formal negotiating positions on export restraints within the Doha Round. Section 5.4 describes the sample of 93 RTAs surveyed. The key findings obtained by comparing the RTA disciplines to those in the WTO are then reported, with Section 5.5 analysing provisions on quantitative export restrictions and Section 5.6 analysing provisions on export taxes. Finally, Section 5.7 discusses certain approaches used in RTAs that may strengthen the WTO disciplines on export restraints, and Section 5.8 concludes.

150 – 5. MULTILATERALISING REGIONALISM: DISCIPLINES ON EXPORT RESTRICTIONS IN REGIONAL TRADE AGREEMENTS
EXPORT RESTRICTIONS IN RAW MATERIALS TRADE: FACTS, FALLACIES AND BETTER PRACTICES © OECD 2014
5.2. Defining export restrictions
The WTO’s Dispute Settlement Body has defined export restrictions, also called export restraints or export controls, in its Panel Report on Measures Treating Export Restraints as Subsidies as, “a border measure that takes the form of a government law or regulation which expressly limits the quantity of exports or places explicit conditions on the circumstances under which exports are permitted, or that takes the form of a government-imposed fee or tax on exports of the products calculated to limit the quantity of exports” (WTO, 2001c, p.75). Export restraints have also been defined more broadly by analysts as “measures instituted by exporting countries to supervise export flows” (Bonarriva et al., 2009).
Export restraint measures consist of quantitative restrictions (QRs), which restrict the volume of exports, and export taxes, which levy a tax on exports. The former group of measures includes export quotas, which define a maximum permitted volume of exports, and export bans, which prohibit exports of a certain product completely.
5 Restrictive export licensing, minimum export
prices, or export restrictive state-trading enterprises are other types of export restraint, even though they do not necessarily affect the volume of exports. Non-automatic export licensing allows only approved firms to export a good. Governments can restrain exports by refusing to approve new licenses or by not allowing new export contracts to be signed (Dollive, 2008). If export licenses are granted in a very restrictive fashion, thereby creating a discretionary distribution of scarce opportunities to export, they can encourage the formation of export cartels and other rent-seeking activities. An extreme form of export licensing is the state trading monopoly where a single firm, whose monopoly status is protected by national legislation, has the exclusive right to export a good. The monopoly can use its market power to influence domestic supply and prices, and possibly prices in export markets (Bonarriva et al., 2009).
The second category of export restraint is export taxes. Also called export duties, export charges, export tariffs, fees or export levies, export taxes have been imposed by 65 of the 128 countries reviewed by the WTO since 2003 (Kim, 2010). Their use has been more prevalent since 2003 than previously, and users are primarily developing countries, including least developed countries. There are two types of export tax: ad valorem taxes, which levy a percentage of the export value, and specific taxes, which levy a given monetary amount per unit or weight of the exported product. Export taxes can be progressive, implying a higher tax when the price of the good export is high and a lower tax when the price is low. Export taxes can also be differential, for example, charging a higher rate on the unprocessed export and a lower rate on the processed version of the export in order to encourage domestic processing (Bonarriva, Koscielski and Wilson, 2009). Taxes on exports are often easier to administer and collect than various other kinds of tax. Moreover, if the demand for a good is highly inelastic or the country controls a significant share of world exports, the burden of the export tax is largely borne by foreign consumers (Deese and Reeder, 2007).
6
5.3. Multilateral disciplines and negotiating positions regarding export restrictions
Export restrictions have not received as much attention in multilateral trade negotiations as the elimination of import barriers. The WTO generally prohibits quantitative export restrictions, but this ban is somewhat vitiated by broad and, at times, ambiguous exceptions. Moreover, the 1994 GATT does not include any direct disciplines on export taxes. Thus, there is a large “grey area” that can result in differing interpretations of international rules and obligations on export controls in the multilateral context.
WTO provisions and GATT/WTO official interpretations
The 1994 GATT deals with export restrictions in Articles XI and XX. Article XI:1 imposes a general ban on quantitative restrictions:
No prohibitions or restrictions other than duties, taxes or other charges, whether made effective through quotas, import or export licenses or other measures, shall be instituted or

5. MULTILATERALISING REGIONALISM: DISCIPLINES ON EXPORT RESTRICTIONS IN REGIONAL TRADE AGREEMENTS – 151
EXPORT RESTRICTIONS IN RAW MATERIALS TRADE: FACTS, FALLACIES AND BETTER PRACTICES © OECD 2014
maintained by any contracting party on the importation of any product of the territory of any other contracting party or on the exportation or sale for export of any product destined for the territory of any other contracting party (GATT, 1994).
However, Article XI:2(a) explicitly exempts from the general ban those export prohibitions or restrictions that are applied temporarily to prevent or relieve critical shortages of foodstuffs or other products essential to the exporting party. The GATT Analytical Index (1994, pp.326-327) specifies that Article XI:2(a) applies not only in the case of shortages in volumes of foodstuffs but also in the case of increases in their prices, whether caused by shortages on domestic markets or in third countries. The Index further clarifies that the question of which goods could be considered “products essential to the exporting contracting party” must be judged in a country-specific context.
Furthermore, the Uruguay Round Agreement on Agriculture stipulates that, when a country uses the GATT Article XI:2(a) exception to justify an export restriction on foodstuffs, it must give due consideration to the resulting impact on the food security of food-importing countries. In particular, members must notify the WTO Committee on Agriculture in writing of new export restrictions on foodstuffs and consult with affected member states when implementing them (Agreement on Agriculture, Article 12.1). This applies to developed countries and to developing countries that are net exporters of the foodstuff in question.
Nonetheless, GATT Article XI:2(a) is still somewhat ambiguous. Terms such as “temporarily”, “critical”, and “essential” are not defined. WTO case law has not clarified exactly what types of products are exempted from the general ban under this provision nor for how long, making it hard to determine whether a particular export restriction qualifies for this exception or not. For instance, during the food price increases of 2008, India imposed a ban on non-basmati rice exports because high prices had put pressure on domestic supplies. However, in July 2010, despite much improved harvests and less volatile world food prices, the government extended the ban for an additional six months for political reasons, fearing that a rise in food prices following a lifting of the ban would hurt consumers (Poole, 2010). This case illustrates how a temporary restriction, initially justified under XI:2(a), can outlive the circumstances that led to its use.
Article XI:2(b) exempts from the ban restrictions that are “necessary to the application of standards or regulations for the classification, grading, or marketing of commodities in international trade”. Paragraph 2(b) was interpreted in the 1988 Panel Report on the case Canada – Measures Affecting Exports of Unprocessed Herring and Salmon. The Panel’s conclusions clarified that the ban could apply only to volumes of the product concerned that fail to meet export quality standards. Moreover, the Panel report suggested that the exception for “marketing” only justified restrictions “designed to further the marketing of a commodity by spreading supplies of the restricted product over a longer period of time… but not of export restrictions on one commodity designed to promote sales of another commodity (GATT, 1988)”. In addition, the Panel report stated that XI:2(b)’s exception for marketing does not justify export restrictions “protecting a domestic industry and enabling it to sell abroad”.
7
Article XX contains further exceptions to the general prohibition of quantitative export restrictions. These provisions allow countries to use export restrictions to protect public morals, to protect human, animal, or plant life or health, to manage the import and export of gold and silver, to protect intellectual and industrial property, to protect national treasures of artistic, historic, or archaeological value, and to fulfil obligations of international commodity agreements.
The most important provisions affecting export restriction disciplines under Article XX are XX(g), (i), and (j). First, XX(g) allows for quantitative restrictions relating to conservation of exhaustible natural resources on the condition that “such measures are made effective in conjunction with restrictions on domestic production or consumption”. This exception was cited in the 1988 Canada herring and sockeye salmon case, as Canada claimed that its salmon and herring stocks were exhaustible natural resources and that its export restriction on unprocessed salmon and herring related to the conservation of those fish stocks. The Panel ruled that “relating to conservation” does not require the export restriction to be “necessary or essential” to the conservation of an exhaustible natural resource, but for the restriction to satisfy XX(g) such

152 – 5. MULTILATERALISING REGIONALISM: DISCIPLINES ON EXPORT RESTRICTIONS IN REGIONAL TRADE AGREEMENTS
EXPORT RESTRICTIONS IN RAW MATERIALS TRADE: FACTS, FALLACIES AND BETTER PRACTICES © OECD 2014
conservation must be its primary aim. The Panel ruled against Canada on this point. The Panel also ruled against Canada in relation to the requirement that trade measures under Article XX(g) be used “in conjunction with” restrictions on domestic production or consumption (GATT, 1988), since Canada limited the purchases of unprocessed fish only by foreign processers and consumers and not by domestic processers and consumers.
Another WTO Panel has ruled on using an exemption under GATT Article XX to justify an export restriction, namely in cases 394, 395, and 398: China – Measures Related to the Exportation of Various Raw Materials. Here, the European Union, Mexico and the United States challenged Chinese export restrictions on nine categories of industrial raw materials—bauxite, coke, fluorspar, magnesium, manganese, silicon metal, silicon carbide, yellow phosphorus, and zinc.
8 China had
imposed export quotas on bauxite, coke, fluorspar, silicon carbide, and zinc, as well as certain intermediate products incorporating some of these inputs.
9
Invoking the Article XX(g) exception, China argued that export duties and quotas were justified for some of the raw materials because they related to the conservation of exhaustible natural resources. The Panel, confirmed by the Appellate Body, found that China was not able to demonstrate that it imposed these restrictions in conjunction with restrictions on domestic production or consumption of the raw materials so as to conserve the raw materials, noting that “export restrictions are not an efficient policy to address environmental externalities, when these derive from domestic production rather than exports or imports … The pollution generated by the production of goods consumed domestically is not less than that of the goods consumed abroad” (WTO, 2011). Thus, both the Canadian and Chinese cases illustrate that export restrictions imposed for reasons of natural resource conservation must be part of a broader context of environmental regulatory change and include restrictions on domestic production or sales.
Another exception to the ban on quantitative export restrictions (Article XX(i)) permits the use of export restrictions on “domestic materials necessary to ensure essential quantities of such materials to a domestic processing industry during periods when the domestic price of such materials is held below the world price as part of a governmental stabilization plan”, providing such restrictions are non-discriminatory and do not “increase protection afforded to the domestic industry”. When it was first introduced in 1947 by New Zealand, this paragraph was intended to allow countries to maintain permanent policies of price stabilization across all sectors of the economy. It was, however, pointed out that the provision could only apply where countries, like New Zealand, already had internal price stabilization plans in place and could not be used to protect a domestic industry in a country that did not already have a price stabilization plan (GATT Analytical Index, 1994, p.593).
10 A 1950 Working Party Report, charged with investigating the protective use
of quantitative restrictions, concluded that “the Agreement does not permit the imposition of restrictions upon the export of a raw material in order to protect or promote a domestic industry, whether by price advantage to that industry for the purchase of its materials, or by reducing the supply of such materials available to foreign competitors, or by other means” (GATT Analytical Index, 1994, p.593). In the absence of further official interpretations of Article XX(i) or a WTO ruling on it, the paragraph remains ambiguous. It does not define what qualifies as a “domestic stabilisation plan” nor how long restrictions justified under such a plan can remain. Also, it gives no criteria by which to evaluate whether a domestic stabilization plan gives undue protection to domestic industry. This is especially problematic because export taxes and restrictions on raw materials are often used to indirectly subsidize domestic processing industries (Bouet and Laborde, 2010).
Finally, Article XX(j) allows restrictions that are “essential to the acquisition or distribution of products in general or local short supply”, qualifying that they must respect the principle that “all contracting parties are entitled to an equitable share of the international supply of such products”. This provision aims to allow countries to cope with shortages of non-agricultural raw materials, but could also be interpreted to justify restrictions on agricultural products (Mitra and Josling, 2009, p.13). When this paragraph was first introduced in 1951, the Geneva session of the Preparatory Committee indicated that it was meant to accommodate the use of differential internal taxes and mixing regulations, as well as quantitative restrictions, in the post-war transitional period in order to

5. MULTILATERALISING REGIONALISM: DISCIPLINES ON EXPORT RESTRICTIONS IN REGIONAL TRADE AGREEMENTS – 153
EXPORT RESTRICTIONS IN RAW MATERIALS TRADE: FACTS, FALLACIES AND BETTER PRACTICES © OECD 2014
distribute goods in short supply internationally (but not necessarily in all markets worldwide), to give effect to price controls based on shortages and to liquidate surplus stocks or uneconomic industries carried over wartime (see GATT Analytical Index, 1994 p.594).
This Article has not been involved in a challenge since 1949, when the US invoked it to justify measures taken under the European Recovery Program against a complaint by Czechoslovakia. The dispute was concluded in favour of the United States, as the Article stipulates that parties are only entitled to an “equitable” share of world supply, not a “non-discriminatory share.” It is not clear how this Article should be interpreted in light of contemporary conditions, neither what kind of products it might apply to nor what qualifies as “short supply”. As it stands, Article XX(j) could be interpreted to justify a wide range of export restrictions.
Other paragraphs relating to the multilateral disciplines on export restrictions are Article XXI, which details national security exceptions, and Article XIII, which stipulates that restrictions must be applied in a non-discriminatory manner (Bonarriva et al., 2009). The disciplines on export restrictions have been strengthened in the accession agreements of some new WTO members such as China, Ukraine, Mongolia, Viet Nam and Saudi Arabia. For instance, in its accession, China agreed to eliminate all export duties with the exception of 84 product lines (WTO, 2001b).
Aside from the cases of Canadian herring and salmon (1988) and Chinese industrial raw materials (2011) detailed above and which undoubtedly provide some relevant guidance and precedent, only a few cases have been raised with the WTO’s Dispute Settlement Body (DSB) in relation to the Article XI:1 ban on export restrictions.
11 On the whole, it may be considered that the
set of exceptions contained in Articles XI:2 and XX have provided strong cover for many export restrictions on raw materials or agricultural products (Mitra and Josling, 2009).
The structure of the WTO disciplines consists of a general ban on quantitative export restrictions plus a list of exceptions to that rule. Exceptions to the general ban are of two kinds: product-specific and situational. Product-specific exceptions exempt particular goods or categories of goods from the ban. An example is the exemption from the ban for products that are considered exhaustible natural resources.
12 By contrast, situational exceptions exempt the exporting country
from abiding by the ban on quantitative restrictions in certain contexts. Exceptions for shortages of foodstuffs or essential products, for a domestic stabilization plan, or for acquisition or distribution of products in short supply are all situational exceptions. These exceptions are contingent on particular circumstances of finite duration. By contrast, product-specific exceptions are not based on temporary conditions and are therefore permanent. This distinction between kinds of exceptions implies different best practice recommendations and strategies for disciplining export controls for each type.
Use of WTO texts on subsidies and anti-dumping measures to discipline export restrictions
Export restrictions that do not directly violate WTO rules, such as export duties, have at times been indirectly addressed in WTO in the context of other rules and agreements, such as those pertaining to subsidies and anti-dumping. One case has been brought for dispute settlement claiming that export restraints can give rise to “subsidies” as defined by the WTO Agreement on Subsidies and Countervailing Measures (SCM). The case, United States – Measures treating export restraints as subsidies, concerns “US measures that treat a restraint on exports of a product as a subsidy to other products made using or incorporating the restricted product if the domestic price of the restricted product is affected by the restraint” (WTO, 2001c).
The SCM allows countervailing duties to be levied on a specific sector or product to counteract subsidies that are awarded by a government, or entrusted or directed by a government, so as to confer a direct benefit to recipients. In this case, the Panel found that “an export restraint as defined in this dispute cannot constitute government-entrusted or government-directed provision of goods … and hence does not constitute a financial contribution in the sense of Article 1.1(a) of the SCM Agreement”, arguing that “explicit and affirmative action of delegation or command” would be required and that this goes beyond mere government intervention in a market that by itself leads to a particular result (WTO, 2001c).

154 – 5. MULTILATERALISING REGIONALISM: DISCIPLINES ON EXPORT RESTRICTIONS IN REGIONAL TRADE AGREEMENTS
EXPORT RESTRICTIONS IN RAW MATERIALS TRADE: FACTS, FALLACIES AND BETTER PRACTICES © OECD 2014
According to the WTO Anti-Dumping Agreement (ADA), anti-dumping duties may be imposed on imported products if they are dumped and cause injury to a domestic industry (Van Den Hende and Paterson, 2009). Dumping occurs if the exported price of a product is below its “normal value”, generally taken to be the domestic price with any appropriate adjustments. In the case of export restrictions on raw materials, it has been argued that the domestic price is distorted, in which case a calculation of an undistorted price or some proxy adjusted to reflect conditions in the domestic market, could be used.
13
Negotiations in the Doha Round
Export taxes and restrictions have been discussed in the Doha Round of multilateral negotiations by the Negotiating Group on Market Access (NAMA). In these negotiations, the EC initially proposed removing all quantitative export restrictions on raw materials (Deese and Reader, 2007). The EC’s revised proposal of 2008 proposed that the basic GATT disciplines should apply to “those situations where WTO members use export taxes for industrial or trade policy purposes with negative effects on other WTO members”, effectively eliminating the use of export taxes except in situations such as “financial crises, infant industry, environment (preservation of natural resources), and local short supply”. In the interests of predictability, the EC proposed that WTO members include export taxes on non-agricultural products in their Schedules of Concessions and that export taxes should be bound “at a level to be negotiated”. The proposal also stressed that there should be additional flexibility for small developing countries and least-developed countries, which would be required to schedule export taxes but could maintain some tariff lines unbound (developing countries) or without any bindings (least-developed countries). The proposal activated concerns over the current lack of notifications of export taxes and restrictions to the WTO, despite several mandates to do so such as the Ministerial Decision of 1993 (European Communities, 2008).
Transparency was also a central concern of the NAMA proposal on Enhanced Transparency on Export Licensing (co-sponsored by Chile; Costa Rica; Japan; Korea; Separate Customs territory of Chinese Taipei, Penghu, Kinmen and Matsu; Ukraine and the United States). Proposed notification requirements for existing measures on export licensing were defined, with changes to existing measures to be notified within 60 days of their effective date. Notifications should specify the products for which licenses are needed, procedures for submission of licensing requests, eligibility criteria, contact points, and so on. The co-sponsors argue that the resulting increase in transparency on export licensing measures would facilitate trade (WTO, 2009c).
Meanwhile, as food-importing countries, Japan and Switzerland expressed concern over the effect of export restrictions on their food security and proposed eliminating all export taxes and restrictions that hinder food security. In 2006, Japan proposed that the WTO publish the rules and administrative procedures for export restrictions, the notification procedures to the Committee, and the information relevant to the restrictions, such as domestic production levels (Deese and Reeder, 2007).
The US proposal on Long-Term Agricultural Trade Reform in 2000 suggested that the WTO “prohibit the use of export taxes, including differential export taxes, for competitive advantage or supply management purposes”. The differential taxes referred to here are export taxes that levy a higher rate on unprocessed products than on processed ones in order to encourage domestic processing. To promote food security, the United States urged the WTO to “strengthen substantially WTO disciplines on export restrictions to increase reliability of global food supply” (USDA, 2000). The 2002 US proposal on market access suggested that only developing countries be permitted to use export taxes for revenue purposes and required that such taxes be applied at a uniform rate on all agricultural exports for at least one year (Deese and Reeder, 2007).
Finally, the proposal from the Cairns Group (17 agriculture-exporting countries) in 2000 linked reductions in export taxes and restrictions to the elimination of import barriers and reduction in trade-distorting support for agricultural products, including tariff escalation. The aim of their proposal is to improve opportunities for developing countries to develop processing industries and to promote food security for developing-country net food-importers and least developed countries (Cairns Group Negotiating Proposal, 2000).

5. MULTILATERALISING REGIONALISM: DISCIPLINES ON EXPORT RESTRICTIONS IN REGIONAL TRADE AGREEMENTS – 155
EXPORT RESTRICTIONS IN RAW MATERIALS TRADE: FACTS, FALLACIES AND BETTER PRACTICES © OECD 2014
5.4. Sample of Regional Trade Agreements and methodology used in this study
The remaining sections of this chapter are based on a study of export restrictions in 93 regional trade agreements.
14,15 The sample of RTAs includes all major, large agreements such as
the North American Free Trade Agreement (NAFTA), the Association of South East Asian Nations (ASEAN), the Southern Common Market (MERCOSUR), the Commonwealth of Independent States (CIS), the Caribbean Common Market (CARICOM) and the European Union (EU). The sample covers all the RTAs in which the United States or the European Communities (EC) are participants, most of Canada’s RTAs, and most of the European Free Trade Area (EFTA)’s agreements. Seven of China’s RTAs are included, as are six of Japan’s. Five intra-African RTAs, including the Economic Community of West African States (ECOWAS), the Common Market for Eastern and Southern Africa (COMESA), the Southern African Development Community (SADC), the Southern Africa Customs Union (SACU) and the African Economic Community, are covered. Seventy of the 93 agreements involve at least one developing country. Twenty-seven are between developing countries. Forty-one agreements are cross-regional.
The sample aims for both geographic and income-level diversity. Agreements are included in the sample if they contain at least some provision on export restrictions, if they are a large or important RTA, or if they include a country that has recently imposed a major export restriction. For instance, the India-Thailand and India-Bangladesh RTAs are included in the sample largely because both India and Thailand banned rice exports during the food price crisis in 2008. At the same time, even though the Central American Common Market (CACM), ASEAN-China and the Andean Community contain no reference to export restrictions, they are included because they are far-reaching and well-known RTAs. In general, the quality and precision of RTAs vary widely. While some agreements are less than ten pages long and use non-specific language, others are hundreds of pages long and scrupulously detailed. This survey tends to select more detailed, substantive agreements with enforceable language over unclear ones. More recent agreements—generally entering into force from the 1990s onwards—are preferred to older ones, unless the older agreements are well-known or substantial, such as CARICOM (1973) or CACM (1961).
Based on how their export restrictions compare to existing WTO disciplines as outlined in Section 5.3, the RTAs under study here have been classified into four groups: agreements with no reference to export restrictions, and those that include provisions that are “WTO-minus”, “WTO-equal”, or “WTO-plus”. A WTO-equal RTA is an agreement that neither strengthens nor dilutes the WTO disciplines. A WTO-plus RTA forbids some export restrictions that are allowed by the WTO. A WTO-minus RTA allows export restrictions where the WTO does not. This classification is made twice: with respect to quantitative export restrictions and again with respect to export taxes. Annex 5.B reports the two classifications for each agreement.
In general, RTAs are found to maintain the GATT structure of a general prohibition of export restrictions plus a list of exceptions, which are either product-specific or situational. Some RTAs include, for example, a longer positive list
16 of product exemptions than are included in the WTO,
but eliminate some of the over-riding situational exemptions. Since these RTAs allow export restrictions on products that would not be allowed under WTO disciplines, they are classified here as “WTO-minus” which implies a stronger weighting of their broad exceptions for some types of goods than of their elimination of some WTO situational exceptions. WTO-equal agreements often include language that is taken directly from the WTO agreement, or is very similar. WTO-plus agreements are those that allow fewer exceptions to the general ban on export restrictions or establish tighter discipline on the imposition of export taxes. There are no hard-and-fast rules by which to classify agreements as WTO-minus, -equal or -plus. It is stressed that these classifications should not be regarded as normative or suggestive of a flawed or successful agreement. The purpose of the classifications is to understand better how some RTA disciplines innovate in comparison to those in the WTO.

156 – 5. MULTILATERALISING REGIONALISM: DISCIPLINES ON EXPORT RESTRICTIONS IN REGIONAL TRADE AGREEMENTS
EXPORT RESTRICTIONS IN RAW MATERIALS TRADE: FACTS, FALLACIES AND BETTER PRACTICES © OECD 2014
5.5. Quantitative export restrictions17
in the Regional Trade Agreements studied
Out of the sample of 93 RTAs, 15 agreements contain stronger language than the WTO quantitative export restriction disciplines (i.e. they are WTO-plus), while 38 are equal and 22 are weaker (i.e. WTO-minus). Eighteen agreements fail to mention quantitative export restrictions at all. There is a marked tendency towards WTO-plus provisions in more recently concluded RTAs. Out of the 22 WTO-minus agreements, seven were concluded before 1994 (i.e. the completion of the Uruguay Round) whereas only two of the 15 WTO-plus agreements were concluded prior to 1994.
18
RTAs with no provisions on quantitative export restrictions
Eighteen of the 93 RTAs surveyed either do not impose disciplines on quantitative export restrictions or omit mention of export restrictions entirely. This group includes some major agreements like ASEAN, MERCOSUR, ASEAN-China, ASEAN-India, the Central America Common Market, the Andean Community, the Common Market for Eastern and Southern Africa (COMESA), and ECOWAS. Some agreements, such as Thailand-India, stipulate that future negotiations will cover the topic of export quantitative restrictions, but say nothing about them in the actual agreement. ASEAN includes a clause on non-tariff barriers but defines quantitative restrictions as a separate kind of measure from non-tariff barriers. Other agreements mention export restrictions tangentially, but do not create actual disciplines. For instance, COMESA does not impose a general ban on either export duties or restrictions. It stipulates that the member states should exchange information on existing export restrictions and duties, and that they should coordinate the export and import of agricultural commodities. Despite these references to greater transparency and coordination in the implementation of export restrictions, the agreement lacks a precise discipline on the issue.
WTO-minus Agreements
Twenty-two agreements were found to be WTO-minus. An export restriction on a certain product that is not allowed by the WTO may nevertheless be permitted in a WTO-minus regional trade agreement. The fact that a WTO-minus category exists calls into question the conformity of such RTA disciplines with WTO rules on quantitative restrictions. The existence of a WTO-minus category suggests that some agreements allow trade measures that violate provisions of the WTO. This mis-match between RTA and WTO disciplines is one of the challenges that the proliferation of preferential trade agreements poses to the multilateral trading system.
These 22 agreements are weaker than the WTO because they allow signatories to impose export restrictions among themselves on goods for which restrictions are not allowed in the multilateral WTO context. WTO-minus agreements tend to allow countries to impose export restrictions on agricultural products such as coffee or copra, fuel-related products, and precious metals and stones. A distinction is made between agreements that simply do not cover all products or sectors, and those that explicitly allow export restrictions on certain products that would not be allowed under WTO. For example, many of the EC’s and EFTA’s bilateral agreements exclude agriculture from their coverage, and hence export restrictions on agricultural products are necessarily undisciplined by these agreements. However, since WTO rules apply explicitly or implicitly to products not covered in the RTA, they are not necessarily classified as WTO-minus. Some other agreements, however, ban export restrictions, often stipulating “as set by GATT 1994”, but include a positive list of goods to which the ban does not apply. If that positive list includes products that it would be difficult to classify within one of the exceptions specified in GATT 1994, e.g. coffee, precious stones and metals, etc., that agreement is considered WTO-minus.
No new situational exceptions were found in this category aside from re-export clauses in a few RTAs.
19 The addition of a re-export clause alone is not considered a WTO-minus situational
exception because as a multilateral agreement the WTO has no need for re-export clauses whereas preferential agreements between a limited number of signatories run the risk of re-export. Meanwhile, on specific products, there are new exceptions that are not allowed by the WTO. This

5. MULTILATERALISING REGIONALISM: DISCIPLINES ON EXPORT RESTRICTIONS IN REGIONAL TRADE AGREEMENTS – 157
EXPORT RESTRICTIONS IN RAW MATERIALS TRADE: FACTS, FALLACIES AND BETTER PRACTICES © OECD 2014
enables the identification of four sub-groups within the WTO-minus category, depending on the kind of goods on which the agreements allow members to use export restrictions.
Agreements with selected multi-sector exceptions
The first subgroup of 12 WTO-minus RTAs allows one or more of the members to impose export controls on a few specific goods. For instance, the US agreement with the Central American Free Trade Area and the Dominican Republic (US-CAFTA-DR) allows quantitative export restrictions to be imposed by Costa Rica on coffee, ethanol, and crude rhums, by Guatemala on coffee, and by Nicaragua (for up to one year and regardless of the circumstances) on a positive list of foodstuffs including beans, brown sugar, chicken meat, coffee, corn, corn flour, tortillas, powdered milk, rice, salt and vegetable oil. It appears from the WTO’s 2006 Trade Policy Review (TPR) of Nicaragua that Nicaragua has not taken advantage of these exceptions. Nicaragua maintains export restrictions only on caoba roundwood and spiny lobsters, as well as licensing on sawn wood exports (Kim, 2010). The US agreements in this subgroup also allow the United States to use export restrictions on logs of any type. The US agreements incorporate GATT Article XX in toto with all of its exceptions to the general ban on export restrictions. However, the US-Colombia and US-CAFTA-DR agreements eliminate the GATT Article XI:2(a) exception for foodstuffs and shortage, strengthening these disciplines somewhat.
Nicaragua has obtained similar exceptions to the general ban in its RTA with Chinese Taipei. As in the US-CAFTA-DR agreement, the Chinese Taipei-Nicaragua agreement allows Nicaragua to impose an export restriction for up to one year on a list of basic food products and bovine leather. Nicaragua can extend the restriction if Chinese Taipei consents. Moreover, the exception for shortages applies to all goods, not just to foodstuffs or “other products essential to the exporting party” as in the WTO text. Again, according to Nicaragua’s 2006 TPR, it had not used any of these exceptions to impose export restrictions.
The MERCOSUR agreements with Bolivia and Chile incorporate the general WTO elimination of quantitative export restrictions, but with exceptions to accommodate Paraguay’s law requiring domestic processing of raw petit grain before export and Uruguay’s state monopoly on the export of fuels. In addition, the MERCOSUR-Chile agreement eliminates the GATT Article XX exceptions for restrictions on natural resources, in the case of shortage, or for domestic stabilization plans. Aside from the exceptions for Paraguay and Uruguay, this makes the MERCOSUR-Chile discipline relatively strong compared to other WTO-minus RTA disciplines.
Some of the most singular export restriction disciplines found are those of CARICOM. While CARICOM generally prohibits any quantitative export restrictions, it makes an exception for “Schedule III: Development of the Oil and Fats Sub-sector” in both the original agreement and the Revised Treaty of Chaguaramas of 2001. The schedule defines “oils and fats” as coconut including seeds and copra, cottonseed, and oils and fats derived from coconut, copra and cottonseed. The stipulations of Schedule III essentially create an export cartel administered by a committee (the “Conference on Oils and Fats”), which sets CARICOM’s export price for copra, raw coconut oil and refined edible coconut oil annually. Member states cannot use more than 10% of their total copra production for liberalised exports destined for outside CARICOM, and any export liberalization must be notified to the Secretariat. CARICOM is the only RTA studied that sets up an export control agreement in this way.
Also in this subgroup, Canada’s RTAs with Israel, EFTA and Peru incorporate GATT Articles XI and XX entirely but add an exception allowing Canada to impose export restrictions on unprocessed fish. Not only are such restrictions not allowed by WTO rules, but also the 1988 GATT ruling specifically disallowed Canada’s export restriction on unprocessed herring and salmon under both Articles XI and XX. The fact that Canada makes an exception in three agreements for restrictions on a good that the WTO has ruled against in the past renders these RTAs WTO-minus for the purposes of this study.
158 – 5. MULTILATERALISING REGIONALISM: DISCIPLINES ON EXPORT RESTRICTIONS IN REGIONAL TRADE AGREEMENTS
EXPORT RESTRICTIONS IN RAW MATERIALS TRADE: FACTS, FALLACIES AND BETTER PRACTICES © OECD 2014
Agreements with exceptions for fuel-related products
This subgroup of agreements that are WTO-minus in terms of quantitative export restrictions consists of four agreements that exclude fuel-related products from the general ban on export restrictions. Three of them grant these exceptions to Mexico. For instance, the EC-Mexico agreement allows Mexico to “restrict export licenses for the sole purpose of reserving foreign trade to itself” for a list of goods including aromatic hydrocarbon mixtures, rubber extended oils, petroleum oils, aviation and motor fuel stocks, petroleum gases, paraffin wax, not calcined petroleum coke, petroleum bitumen, bitumen and asphalt natural, ethane, butane, pentanes, hexanes and heptanes (EC-Mexico, 2000).
20 The WTO Trade Policy Review of Mexico reports that
Mexico requires export licensing for 16 tariff headings on the basis of its rights to exploit and market non-renewable natural resources, presumably referring to petroleum and fuel-related products (Kim, 2010). The fact that this group of RTAs permits export restrictions on fuel-related products where the WTO disciplines do not renders them WTO-minus. The Japan-Mexico agreement, however, eliminates the WTO exceptions for natural resources, domestic stabilization plans, and for the acquisition of products in short supply from GATT Article XX(j). The EC-Mexico agreement also eliminates the Article XX(j) exception, while EFTA-Mexico incorporates Article XX entirely.
Agreements with exceptions for precious metals and stones
A subgroup of five WTO-minus RTAs (Southern African Development Community (SADC), Russia-Ukraine, Belarus-Ukraine, the Commonwealth of Independent States (CIS), and the African Economic Community), makes exceptions to the general prohibition of quantitative export restrictions for precious metals and stones. It is a very broad exception because no definition of “precious” is given and there is no universally acknowledged set of criteria for “precious” metals or stones. Thus, restrictions on many metals and stones may potentially be allowed. For instance, SADC member Tanzania currently maintains export bans on the waste and scrap of antimony, cobalt, copper, chromium, indium, manganese and nickel (Korinek and Kim, 2010). Depending on which metals and stones are defined as “precious”, and whether waste and scrap can be considered to belong in that category, many restrictions may go undisciplined within the SADC. Some precious stones and metals might be considered “exhaustible natural resources”. However, by adding a separate exception for precious metals and stones, these agreements allow restrictions on these products regardless of whether or not the restrictions are primarily aimed at environmental conservation or in conjunction with domestic conservation measures, as the WTO exception for natural resources demands. The Russia-Ukraine and Ukraine-Belarus agreements eliminate the GATT Article XX exceptions for exhaustible natural resources and domestic stabilization plans, but expand the shortage exception to apply to all goods where there is an “acute deficit of this product in the domestic market, until the market situation is stabilized”. Overall, despite the elimination of some WTO exceptions in these RTAs, the exemption for precious metals and stones allows a wider range of export restrictions relative to the WTO.
Agreements with other types of provisions
Finally, two WTO-minus RTAs include other types of WTO-minus provisions on export restrictions. The SACU agreement grants the Council of Ministers of SACU the authority to impose export restrictions for economic, social, cultural or other reasons, thereby giving that body broad powers to control exports. Moreover, it stipulates that any domestic law prohibiting or restricting exports takes precedence over the SACU agreement. The US-Israel agreement forbids new quantitative export restrictions but does not eliminate existing ones. This agreement, which dates from 1985, contains weaker language – probably because it was contracted before export restriction disciplines came to the fore. Indeed, the prohibition on new restrictions, also found in some other “older” agreements, is quite forward-looking for the time at which they were contracted.

5. MULTILATERALISING REGIONALISM: DISCIPLINES ON EXPORT RESTRICTIONS IN REGIONAL TRADE AGREEMENTS – 159
EXPORT RESTRICTIONS IN RAW MATERIALS TRADE: FACTS, FALLACIES AND BETTER PRACTICES © OECD 2014
WTO-equal Agreements
This survey of RTAs found 38 agreements that qualify as WTO-equal regarding quantitative export restrictions. Some of these agreements incorporate the relevant GATT Articles XI and XX or imitate the WTO language. Many follow the GATT structure of a general ban plus a list of situational and specific goods exceptions. For instance, the US trade agreements with Peru, Chile, Morocco, Korea, Singapore, Bahrain, Oman and Panama fully incorporate GATT Articles XI and XX. The only difference from the WTO is an exception for US quantitative restrictions on logs.
Some RTAs include a general ban on quantitative export restrictions, but exclude from the agreement itself certain categories of goods. For instance, the European Union’s RTAs with countries in the Balkans, including Albania, Bosnia, Croatia
21, Macedonia and Montenegro, impose
a ban on all quantitative export restrictions. However, these RTAs exclude from the ban the goods in HS chapters 1-24 as well as the list of products in Annex I of the WTO Agreement on Agriculture.
22 The EC-Turkey agreement follows the same structure but excludes a slightly different
list of agricultural goods. At the same time, however, the agreements eliminate the GATT Article XX exceptions for restrictions on exhaustible natural resources, for domestic stabilization plans, and the GATT XX(j) exception for “the acquisition or distribution of products in general or local short supply”. But the broad range of exempted goods nevertheless implies that these RTAs cannot be considered as WTO-plus.
Minor differences between some of these agreements and the WTO occur. For example, in EC-Mexico, a re-export clause allows export restrictions to prevent re-export to a third party against which the original exporter maintains restrictions. Re-export clauses serve a logical purpose in preferential agreements between a limited number of parties, but are redundant in a multilateral agreement like the WTO. Thus, this addition to EC-Mexico does not make it WTO-minus. Twenty-five of the 75 agreements with disciplines on export restrictions contain exceptions for restrictions to prevent re-export.
Some WTO-equal agreements disallow quantitative export restrictions through a clause eliminating all non-tariff barriers on export and import “consistent with the WTO”. Since quantitative export restrictions are a form of non-tariff barrier on exports, and since in each case the agreement specifies that non-tariff barriers are disciplined in accordance with the WTO disciplines, this kind of provision can be considered WTO-equal.
WTO-plus Agreements
Finally, 15 RTAs were found with quantitative export restriction provisions that are WTO-plus. They can be divided into two subgroups: agreements that impose conditions on the use of exceptions already accepted by the WTO, and those that allow fewer exceptions than the WTO.
Agreements that impose conditions on the use of exceptions
Three WTO-plus agreements constrain the use of exceptions: Canada-Chile, Canada-Costa Rica, and NAFTA. All three agreements incorporate GATT Articles XI and XX, but in order for a party to impose a quantitative export restriction justified under GATT XI:2(a), XX(g), XX(i), or XX(j), it must meet two conditions. First, the restriction must not reduce the proportion of total export shipments available to the other RTA parties relative to the total supply of the good from the party using the export restriction, as compared to the last 36 months. Thus, if a country wants to apply an export restriction, it must ensure that it can continue to supply the same share of exports to the other parties in the RTA. Second, the restriction cannot disrupt normal channels of supply or normal shares of other specific goods supplied to other RTA parties. In Canada-Chile, however, copper, Chile’s main export, is exempt from this Article.
These provisions aim to protect importers from any negative impacts of export restrictions, rather than eliminating export restrictions as a policy option. They ensure that export restrictions do not negatively affect the imports of RTA members since members are obliged to continue to supply the same proportion of the product in question to RTA members if they impose an export restriction.

160 – 5. MULTILATERALISING REGIONALISM: DISCIPLINES ON EXPORT RESTRICTIONS IN REGIONAL TRADE AGREEMENTS
EXPORT RESTRICTIONS IN RAW MATERIALS TRADE: FACTS, FALLACIES AND BETTER PRACTICES © OECD 2014
It should be noted, however, that these conditions only apply to trade within the RTA, not to all trade affected by the export restriction. Requiring parties to meet certain conditions when applying quantitative restrictions is an effective approach to disciplining their use.
Agreements with fewer exceptions than the WTO
There are 12 WTO-plus agreements that strengthen WTO disciplines by admitting fewer exceptions than the WTO. The agreements with the fewest exceptions are EC-South Africa, EFTA-Israel, EC-Israel, the EU and CEFTA 2006. Within this subgroup, there is no common pattern. For instance, all 12 agreements apart from EFTA-Chile eliminate GATT Article XX(j) allowing restrictions “essential to the acquisition or distribution of products in general or local short supply”, but only five eliminate the natural resources exception. Nine agreements drop the domestic stabilization plan exception. EC-CARIFORUM and EC-Côte d’Ivoire restrict the shortage clause to apply to foodstuffs only, rather than to both foodstuffs and other essential products as in the WTO. Interestingly, the EC-CARIFORUM agreement makes no mention of an exception for CARICOM’s policy of restricting the export of copra and coconut oil. EC-South Africa eliminates the shortage exception entirely, as does CEFTA 2006, the EFTA Convention, EFTA-Israel, the EU Convention and EFTA-Chile. The common element in this group of agreements is that they rule out one or more of the exceptions that are allowed by the WTO.
5.6. Provisions on export taxes in Regional Trade Agreements
The GATT does not include any direct disciplines on export taxes. Therefore, a regional trade agreement is considered to be WTO-equal with respect to export taxes if it makes no mention of them, or explicitly allows for them.
23 Twenty-seven of the 93 agreements studied contain no
reference to export duties and can thus be considered WTO-equal. The remaining 66 agreements are WTO-plus because they strengthen the WTO disciplines on export taxes. Fifty-five of the 66 RTAs with language on export taxes use the same approach used by the WTO for quantitative restrictions, namely a general prohibition followed by a list of exceptions.
24
WTO-plus: Agreements prohibiting new export taxes or increases on existing taxes
The first group of WTO-plus agreements consists of seven RTAs that allow existing export taxes to be maintained but prohibit the application of new taxes or increases in existing ones (i.e. standstill clause). For instance, in EC-Côte d’Ivoire, Côte d’Ivoire can maintain its export taxes, but may not impose new taxes or raise existing ones. However, the agreement makes an exception allowing Côte d’Ivoire to apply new, temporary duties to its exports to the EC on a limited number of traditional goods if it can justify the need for fiscal receipts, infant industry protection or environmental protection. The RTA also permits Côte d’Ivoire to apply new duties or increase existing export duties if necessary to ensure food security.
This type of export tax discipline is particularly prevalent in RTAs involving Argentina, where export taxes are used on a large number of goods. In the MERCOSUR-Chile and MERCOSUR-Bolivia agreements, Argentina reserves the right to increase export taxes on certain products up to a given percentage. Both agreements allow Argentina to impose export taxes up to 3.5% on soybeans and various types of oilseeds, and up to 15% on 13 types of hide and eight types of skin. The rate of 3.5% allowed by these RTAs for oilseeds is much lower than the third-party rate of 23.5% on those products reported for 2004 in the Trade Policy Review of Argentina. As of 2006, Argentina charges a 15% tax on all exports of hides and skins (WTO, 2007a, pp.70-72).
The MERCOSUR-Bolivia agreement permits Brazil to impose export taxes of up to 9% on bovine, equine and sheep skins and hides, and up to 40% on cane molasses, inverted sugars and honey in trade with Bolivia. According to Brazil’s WTO Trade Policy Review, Brazil levies a 9% export tax on leathers and skins destined for any country, including Bolivia and even within MERCOSUR. Brazilian domestic law allows for the application of an export tax of up to 150% on all products except coffee, sugar, and alcohol and related products (WTO, 2009b, pp.58-59).

5. MULTILATERALISING REGIONALISM: DISCIPLINES ON EXPORT RESTRICTIONS IN REGIONAL TRADE AGREEMENTS – 161
EXPORT RESTRICTIONS IN RAW MATERIALS TRADE: FACTS, FALLACIES AND BETTER PRACTICES © OECD 2014
The MERCOSUR-Peru agreement allows Argentina to use export taxes on 354 pages of product codes with potential levies ranging from 5% to 40%. This exception, which covers most products, completely vitiates the spirit of the RTA’s ban on new or increased export taxes. It is interesting to note, however, that Argentina has much more limited exceptions in the Chile and Bolivia agreements with MERCOSUR where new taxes are allowed only on oilseeds and skins. The reason for the difference in exceptions allowed between the MERCOSUR agreement with Peru and the agreements Bolivia and Chile is not clear.
This group of agreements is WTO-plus because it prohibits new or increased export taxes. It is still a “light” discipline, however, and the profusion of exceptions can undermine it further.
WTO-plus: Agreements imposing a general prohibition on export taxes
The remaining 55 WTO-plus RTAs prohibit the continuation or adoption of export taxes in the style of GATT Article XI’s general ban on quantitative export restrictions. Most of these agreements formulate the discipline on export taxes in the language of the WTO discipline on quantitative export restrictions, which is in many cases directly taken as a template for a general ban on export taxes. Then, like the WTO discipline on export QRs, the agreements add exceptions to the general prohibition.
The RTAs usually incorporate some or all of the WTO exceptions from Articles XI and XX. However, many RTAs include additional exceptions beyond those set out in Articles XI and XX. For instance, some RTAs add a situational exception for the case of a risk of re-export of a good to a country outside the RTA against which the exporting party maintains an export tax. Other RTAs add further product-specific exceptions to the ban on export taxes for agricultural products or for key export commodities like coffee or wood products.
Agreements with both situational and product-specific exceptions
RTAs with a general ban on export taxes may incorporate both product-specific exceptions and situational exceptions, or just one of these two types of exception. Forty-five of the 55 RTAs with a general prohibition of export taxes have both kinds of exceptions. As for quantitative export restrictions, there are further subdivisions among agreements with both product-specific and situational exceptions.
(a) Agreements with agricultural goods exceptions
Eleven agreements exempt broad categories of agricultural goods from the ban on export taxes. Four of these agreements are between the EC and its European neighbours Bosnia, Croatia, Macedonia and Montenegro. In these cases, the general ban on export taxes applies only to “industrial goods” in HS Chapters 25-97. Moreover, the agreements make exceptions for goods listed in Annex I of the GATT/WTO 1994 Agreement on Agriculture, which include essential oils, hides and skins, raw silk, raw fur skins, raw cotton, raw flax, wool and animal hair, and raw hemp. The goal in exempting these goods may be to support domestic processing of raw materials. In addition to these exceptions, the agreements include a paragraph stipulating that no provision of the RTA shall restrict the agricultural policies of the EC or the other contracting party.
Under these EC agreements, if a country wants to use a shortage or a threat of re-export to justify an export duty, the agreements provide for specific procedures to invoke these exceptions. The country is required initially to apply to the Interim Committee of the RTA to seek an agreement suitable to both parties for dealing with the circumstances. If no agreement is reached within 30 days, then the country may impose the export tax. Any export duties recovered must be notified to the Interim Committee, and periodic reviews and consultations will be held with a view to establishing a timetable for eliminating the tax as soon as circumstances permit. The procedures for informing and consulting with other parties before resorting to an export tax, and for pursuing joint efforts to phase out duties when the situation no longer justifies them, aim to increase transparency and communication between the parties when using situational exceptions. These four EC

162 – 5. MULTILATERALISING REGIONALISM: DISCIPLINES ON EXPORT RESTRICTIONS IN REGIONAL TRADE AGREEMENTS
EXPORT RESTRICTIONS IN RAW MATERIALS TRADE: FACTS, FALLACIES AND BETTER PRACTICES © OECD 2014
agreements exemplify how RTAs can promote transparency and cooperation in the context of export restriction disciplines.
The EC-Israel RTA, like the above EC agreements, prohibits export taxes but many agricultural products, listed in the annexes, are excluded from the ban. On the other hand, the agreement’s ban on export quantitative restrictions covers all products. This means that the parties have to resort to export taxes if they wish to control exports of agricultural goods. As of 2010, neither the EC nor Israel was using any export taxes, according to their most recent WTO Trade Policy Reviews (Kim, 2010).
The six agreements in this subgroup involving EFTA do not include unprocessed agricultural goods in HS chapters 1-24 in the general prohibition on export taxes. This exception allows RTA parties to maintain or increase their export taxes on any of those goods. For instance, Botswana and Namibia (members of SACU) who charge export taxes on cattle, are in accordance with the EFTA-SACU agreement (Kim, 2010). Despite the broad agricultural products exception, export taxes such as South Africa’s tax on wine are prohibited in trade within that RTA by a general ban (Kim, 2010).
(b) Agreements with multi-sector product-specific exceptions
Six agreements incorporating both types of exception single out only a few specific goods as exceptions to the export tax ban, in addition to natural resources. For instance, the US-Central America Free Trade Agreement-Dominican Republic agreement permits Costa Rica to apply export taxes on coffee, bananas and meat products, and the US-Colombia agreement allows Colombia to levy taxes on coffee and emeralds. Costa Rica uses its exceptions to impose an export tax of one USD/40 pounds on bananas and a tax of 1.5% on the value of coffee exports, which is used to finance Costa Rica’s national coffee administration, ICAFE (Kim, 2010). Colombia maintains a 5% ad valorem tax on mild coffee exports and a 1% tax on the export price of unset emeralds (Kim, 2010). Both of these US RTAs do not contain exceptions for shortages or threat of re-export, but do incorporate all the exceptions to the GATT export restriction ban in Article XX. The Canada-Israel RTA also falls into this group. Canada has exceptions for export taxes on unprocessed fish, logs and alcohol, while Israel has an exception for duties on exports of metal waste and scrap. Israel’s most recent WTO Trade Policy Review (2006) suggests it did not at that time levy taxes on scrap and waste metal exports (Kim, 2010).
The EFTA-Ukraine RTA, also in this group of agreements, was the first agreement between Ukraine and a country outside the post-Soviet Union. The agreement prohibits export taxes on all products covered by the agreement, thereby going far beyond the WTO framework. The general ban on export taxes does not apply for the Ukraine to exhaustible natural resources and to other specific products such as essential oils, lamb meat, fox, raw furskins, cotton, casein glues, mannitol, swine, goats, albuminates, dextrins, and modified starches. In practice, Ukraine applies export taxes on metals such as nickel, cobalt, copper, chromium (Korinek and Kim, 2009), on livestock, rawhide, and certain oilseeds (Deese and Reeder, 2007), and on maize, wheat, and barley (OECD, 2011b), some of which do not fall under the stated exceptions.
25 Upon entry into force of the RTA,
Ukraine will have to suppress export taxes on products outside the list of exceptions that are exported to EFTA countries. The agreement allows for some situational exceptions: in cases of a shortage of foodstuffs or “essential products”, domestic stabilization plans, and the GATT XX(j) exception for short supply, but not for the threat of re-export.
(c) Agreements with precious stones and metals exceptions
Four agreements have exceptions for “precious metals and stones”. As already mentioned, there is no definition in these agreements of what makes a stone or metal “precious” and a consensus definition does not exist. The CIS, Russia-Ukraine and Ukraine-Belarus RTAs all include this exception, possibly providing cover for Russia and Ukraine’s export taxes on minerals such as tungsten, titanium, molybdenum, cobalt, platinum, or palladium (Korinek and Kim, 2010). The SADC RTA also provides for this exception. One of SADC’s members, Tanzania, maintains export taxes

5. MULTILATERALISING REGIONALISM: DISCIPLINES ON EXPORT RESTRICTIONS IN REGIONAL TRADE AGREEMENTS – 163
EXPORT RESTRICTIONS IN RAW MATERIALS TRADE: FACTS, FALLACIES AND BETTER PRACTICES © OECD 2014
on strategic minerals such as tungsten, titanium, manganese, indium, chromium, cobalt and antimony (Korinek and Kim, 2010).
(d) Agreements whose only product-specific exception is for exhaustible natural resources
A subgroup of RTAs consists of 21 agreements with only “exhaustible natural resources” (GATT XX(g)) as a specific goods exception. Most of these agreements include the United States, Canada, EC or EFTA among their signatories. All the US agreements incorporate the GATT Article XX exceptions in toto but do not include any exceptions for shortages of food or essential products. Some agreements in this group allow for phase-out periods for existing export taxes on sensitive goods, particularly for developing country partners. For instance, the US-Morocco RTA allows Morocco five years to phase out its export tax on unprocessed phosphates and stipulates that the tax during that period may not exceed MAD 34 per ton. Similarly, the EC-CARIFORUM agreement gives Guyana three years to phase out its taxes on precious stones, bauxite, sugar, molasses and greenheart, and gives Suriname three years to eliminate its taxes on wood products. In this way, these agreements allow special and differential treatment by according longer phase-out periods for developing partners.
(e) Agreements that impose conditions on use of exceptions
Three agreements (NAFTA, Canada-Chile, and Canada-Costa Rica) take a more innovative approach to regulating export taxes. As well as incorporating a general prohibition on export taxes and the exceptions in GATT Articles XI:2(a) and XX, they require that countries meet certain conditions if they wish to impose an export tax justified under GATT XI:2(a), GATT XX(g), XX(i) or XX(j). The condition is that “the Party does not impose a higher price for exports of a good to the other Party than the price charged for such a good when consumed domestically, by means of any measure, such as licenses, fees, taxation, and minimum price requirements” (NAFTA, 1994). Canada’s agreements with Chile and Costa Rica use the same language. These are the only agreements any of the parties have made that adopt such language. This stipulation requires that if a country charges an export tax, then it must ensure that the export price charged to the other RTA parties is the same as the price charged domestically, essentially eliminating the parties’ ability to use export duties to create a price wedge between the domestic price and the export price. This condition on the use of export taxes prevents the negative impacts of export taxes on RTA partners rather than trying to eliminate their use as a policy instrument altogether. However, the provision does not apply to export prices charged to countries outside of the RTA where export taxes may still create price wedges.
NAFTA in particular is even more precise regarding exceptions of this type. For example, NAFTA’s shortage exception clause (applying to Mexico only) specifies that no export tax justified under this exception may last more than one year. Moreover, only basic foodstuffs may be subject to export taxes under this exception, and the agreement defines which foodstuffs may be taxed. The domestic stabilization plan exception applies to all parties but requires that export duties only last as long as necessary for the stabilization plan and may only be applied to foodstuff products from a positive list of goods. Identifying exactly which products can be taxed under the exception and defining time limits are effective ways of clarifying ambiguities that exist in other agreements such as the WTO.
Agreements with only product-specific exceptions
Four RTAs contain only product-specific exceptions to their general elimination of export taxes. The absence of situational exceptions means there are no GATT Article XI and XX exceptions for shortages, domestic stabilization plans, acquisition and distribution of products in short supply, or the risk of re-export to a third party. For instance, the EC-Albania agreement does not have an exception for export taxes on natural resources but does exempt all agricultural goods in HS Chapters 1-24 from the ban. In addition it exempts essential oils, glues, hides and skins, raw furskins, raw silk, wool and animal hair, raw cotton, carded/combed cotton, raw flax and raw hemp.

164 – 5. MULTILATERALISING REGIONALISM: DISCIPLINES ON EXPORT RESTRICTIONS IN REGIONAL TRADE AGREEMENTS
EXPORT RESTRICTIONS IN RAW MATERIALS TRADE: FACTS, FALLACIES AND BETTER PRACTICES © OECD 2014
Similarly, the EC-Turkey agreement allows Turkey to use export taxes on a wide range of agricultural products stipulated in a positive list but does not permit export taxes on exhaustible natural resources. Currently, Turkey imposes export taxes of USD 0.5/kg on raw skins, USD 0.04/kg on unshelled hazelnuts, and USD 0.08/kg on shelled hazelnuts (Kim, 2010). The tax on skins is not permissible in exports to the EC under the agreement. In 2009, 0.7% of the EC’s imports from Turkey fell under HS chapters 41-43, which cover raw hides and skins (European Commission, 2010a). There is no evidence, however, that the EC has challenged Turkey’s tax on skins, despite the fact that it seems to be in violation of the agreement.
Agreements with situational exceptions only
Six RTAs include situational exceptions only to their general elimination of export duties. Within the EU, there is a complete ban on export duties on all goods and in almost all situations, except to protect industrial or commercial property, to protect public morals, or to protect human, animal, and plant health and life. The Common Economic Zone (CEZ) of 2004 between Russia, Ukraine, Belarus and Kazakhstan also claims to incorporate a complete ban on export duties. But the brevity and vague language of this agreement may make it challenging to implement and enforce. For instance, in 2008, Russia imposed a 40% export tax on wheat. While initially the tax did not apply to exports destined within the customs union, within a month Russia declared that there was a threat of re-export by other parties to countries outside the CEZ. Consequently, Russia levied the tax also on exports within the CEZ, even though the text of the agreement does not provide an exception for the threat of re-export. Such breaches of the RTA suggest that enforcement of the agreement’s provisions is problematic.
Also in this group, the Chinese Taipei-Nicaragua agreement eliminates all export taxes except in the case of shortage or a domestic stabilization plan. However, here the shortage clause applies not only to shortages of foodstuffs or “other products essential to the exporting party”, as in GATT Article XI, but also to any good where supply is insufficient for domestic consumption. The Chinese Taipei-Nicaragua RTA also requires that any export charges be published on the internet and that duties imposed must not protect domestic industry, be intended for fiscal purposes, or exceed approximate costs of services rendered.
The Japan-Mexico discipline on export taxes is one of the strongest among the agreements studied. Like the other agreements, it contains a general ban on the use of export duties but it permits very few exceptions. There is no exception for shortages of any kind, for domestic stabilization plans, for the conservation of natural resources, or for products in short supply. Moreover, of the ten general exceptions in GATT XX, the Japan-Mexico RTA includes only four, with exceptions for protection of public morals, protection of human, animal, or plant life or health, protection of intellectual property, and restrictions relating to prison labour. The discipline between Japan and Mexico is therefore very strong. But while the discipline on export taxes in Japan-Mexico is very stringent, the quantitative export restrictions provision allows exceptions on 11 fuel-related products and for shortages of foodstuffs or essential products. Like the EC-Israel agreement, there is a discrepancy between the strength of the disciplines for taxes and quantitative restrictions.
In conclusion, less than one-third of the 93 RTAs studied have export tax provisions that are WTO-equal (that is, contain no reference to export taxes) and the rest are WTO-plus. However, the WTO-plus agreements go beyond the WTO to widely differing degrees. An agreement qualifies as WTO-plus merely by including some regulation on export taxes. Most RTAs model their export tax provisions after the WTO provisions for quantitative export restrictions: a general ban “softened” by various exceptions in the spirit of those set out in GATT Articles XI:2 and XX for quantitative restrictions. In addition, some RTAs stipulate exceptions for specific products that may be particularly important to one party’s economy such as coffee or hides, or exceptions for broad categories like agricultural goods.
The RTAs with the strongest disciplines on export taxes are Japan-Mexico, the European Union, EC-Jordan, EFTA, EFTA-Israel, CEFTA, NAFTA, Canada-Costa Rica and Canada-Chile. These agreements take different approaches to strengthening the WTO disciplines. Japan-Mexico, the European Union, EC-Jordan, EFTA, EFTA-Israel and CEFTA allow few exceptions to their

5. MULTILATERALISING REGIONALISM: DISCIPLINES ON EXPORT RESTRICTIONS IN REGIONAL TRADE AGREEMENTS – 165
EXPORT RESTRICTIONS IN RAW MATERIALS TRADE: FACTS, FALLACIES AND BETTER PRACTICES © OECD 2014
general prohibition on export taxes. Meanwhile, NAFTA, Canada-Chile and Canada-Costa Rica innovate with respect to WTO practices by requiring that parties meet certain conditions if they want to make use of exceptions to levy export taxes. Some best practices gleaned from the RTAs for designing export tax disciplines include: specifying time limits for temporary export taxes; providing positive lists of products that are considered “basic foodstuffs” or other essential products to which taxes may be applied during a shortage or stabilisation plan, instituting detailed procedures for requesting use of an exception, in some cases creating a body to regulate and coordinate their use, procedures for collaborating with the other parties to remove taxes when they are no longer justified, and publicly posting existing export charges and fees to increase transparency. The next section further explores lessons learned from the study of the RTA provisions and their potential implications for strengthening the WTO discipline.
5.7. Lessons learned from the study of export restrictions in RTAs
As already seen, export restraint disciplines tend to be formulated as a general ban on the measure plus a list of exceptions. This study identifies three approaches found in certain RTAs that improve this structure and take the provision beyond its WTO version. First, some RTAs refine the WTO exceptions by making them more transparent, more precise or limiting their scope. Second, some RTAs strengthen discipline by eliminating some WTO exceptions altogether, although in many RTAs this is accompanied by the addition of new exceptions for certain specific products. Third, three RTAs demand that countries meet certain conditions if they wish to use one of the major WTO exceptions to justify an export restraint. This approach creates some of the most stringent RTA disciplines.
Refining exceptions to the general prohibition of export restrictions
Refining situational exceptions
Procedures found in RTAs for refining situational exceptions include defining specific time periods for the duration of the restriction, narrowing the scope of exceptions and instituting procedures for consulting with other parties when implementing a restriction. Situational exceptions depend on circumstances that make taxes or restrictions desirable, like a shortage or a domestic stabilization plan. These situations – and hence the exceptions based on them – should be temporary. Often, however, export restrictions outlive the circumstances that necessitated their use. For instance, Argentina first imposed export taxes to raise federal government revenue during the currency crisis of 2002. While some export taxes may have been temporarily justifiable during the crisis, many of them are no longer needed for their initial purpose, yet Argentina continues to impose new taxes and increase existing ones.
Defining fixed time periods for restrictions or taxes imposed during a particular situation is one way that some RTAs have brought greater discipline in their implementation. Among the export taxes provisions studied, NAFTA specifies time limits for its situational exceptions. Under NAFTA, if a tax is imposed justified by the shortage exception, it can last for a maximum of one year. Chinese Taipei-Nicaragua also imposes a maximum time limit of one year for quantitative export restrictions imposed by Nicaragua for situational exceptions like shortages and stabilization plans, although they can be extended beyond one year if Chinese Taipei consents.
Some RTAs combine a positive list of eligible products with a situational exception, thereby increasing the precision of its use and reducing the scope for conflicting interpretations that could lead to future misunderstandings or disputes. This is illustrated by NAFTA’s provisions for a duty to be imposed on basic foodstuffs in the context of a domestic stabilization plan. A positive list of products, with their product codes, identifies which exported products may be taxed.
Other RTAs refine the situational exceptions by limiting their scope. For instance, some RTAs narrow the GATT XI:2(a) exception for “shortages of foodstuffs or other products essential to the exporting contracting party” so that only “shortages of foodstuffs” justify an exception. This makes for a more precise discipline because the phrase “other products essential” is ambiguous.

166 – 5. MULTILATERALISING REGIONALISM: DISCIPLINES ON EXPORT RESTRICTIONS IN REGIONAL TRADE AGREEMENTS
EXPORT RESTRICTIONS IN RAW MATERIALS TRADE: FACTS, FALLACIES AND BETTER PRACTICES © OECD 2014
RTAs restricting the shortage exception clause in this way are EC-Côte d’Ivoire, NAFTA, CARICOM, SADC and EC-CARIFORUM. These agreements cover various countries in different regions and at different levels of development, which may indicate this type of refinement is transferable to the greater global community.
A third way that some RTAs refine the situational exception clauses is by requiring parties to follow certain procedures requesting to use them. The procedures incite parties to consult with other RTA members to determine whether conditions justify the use of an export restriction and to cooperate in removing restrictions as circumstances change. Some EC agreements stipulate that before a member imposes a quantitative export restriction on the grounds of an exceptional situation, it must apply to the RTA’s governing committee and allow 30 days for the committee to seek an alternative solution that is acceptable to all parties.
26 If 30 days pass with no solution
through the committee, the member may implement export restraints but is obliged to select measures that are least disruptive to trade within the RTA. If there are “exceptional and critical circumstances requiring immediate action prior to information or examination”, the member may apply measures on exports necessary to deal with the situation before going to the committee. However, it must immediately inform the other RTA parties. Any export-restrictive measures that are imposed under the shortage or re-export exceptions are subject to periodic consultation between the parties within the RTA’s governing committee, with a view to “establishing a timetable for their elimination as soon as circumstances permit”.
Creating procedures like those described above for applying restrictions justified by situational exceptions creates more transparency and communication among RTA members. It also helps parties hold one another accountable for their use of quantitative export restrictions. The procedure requires that parties explain how the exceptional situation justifies their export restrictions and uses periodic review of restrictions to ensure that temporary measures do not outlive the circumstances that precipitated them.
The ability of signatories of an RTA to implement and comply with such procedures, however, assumes considerable institutional capacity. A functioning governing body, which itself requires expertise, funding and logistical support, is needed to organize and monitor the procedures for applying to use export restrictions and for consulting with RTA members. Not every RTA has achieved the level of institutional development necessary to make such procedures effective.
Refining product-specific exceptions
RTAs use various strategies to refine exceptions for specific goods. These practices include phase-out periods for sensitive goods, stipulating positive lists of exempt goods with product classification codes rather than exempting broad or vague categories of goods, and measures to make information about existing taxes or restrictions more transparent and accessible. First, some agreements allow members extra time to phase out the use of export taxes or restrictions on key products, thereby helping developing countries in particular to adjust to full elimination of export restraints. These measures can be regarded as special and differential treatment (SDT). There are many examples of this type of SDT. In EC-CARIFORUM, Guyana is granted three extra years to phase out taxes on the export of precious stones, bauxite, unrefined cane sugar, aquarium fish, molasses and greenheart. The US-Morocco agreement contains a very precise clause stipulating a maximum tax during the phase-out period, allowing Morocco to maintain an export duty of up to MAD 34/kg on unprocessed phosphates.
A second way specific goods exceptions can be improved is by providing positive lists of exempt products with their classification codes. Some RTAs, for example, exempt the broad category “precious and strategic metals and precious and semi-precious stones” from the general ban on export taxes, without even including definitions of key terms like “precious” or “strategic”. A list of the specific products to which the exception applies greatly improves its precision.
Product-specific exceptions can be made more precise and transparent by specifying a maximum level of tax or quantitative restriction. In MERCOSUR-Bolivia, for example, along with the product codes for goods that are excluded from the ban on new export taxes for both Argentina and

5. MULTILATERALISING REGIONALISM: DISCIPLINES ON EXPORT RESTRICTIONS IN REGIONAL TRADE AGREEMENTS – 167
EXPORT RESTRICTIONS IN RAW MATERIALS TRADE: FACTS, FALLACIES AND BETTER PRACTICES © OECD 2014
Brazil, the maximum export tax that can be charged in each case is given. In the MERCOSUR-Peru agreement, however, this best practice is taken beyond the point of usefulness by including thousands of product codes for items that are exempt items, ranging from live eagles to ballpoint pens. Taken to this degree, what is clearly a good practice loses its efficacy.
A more general way of improving specific goods exceptions is by increasing their transparency. Already, agreements such as Canada-Peru, Chinese Taipei-Nicaragua, China-Chile, China-New Zealand, China-Peru, and China-Pakistan include a clause requiring that a list of administrative fees and charges imposed on, or in connection, with exportation be posted on the internet. Although, according to GATT Article VIII on Administrative Fees and Formalities, export taxes are not technically considered an administrative fee or charge, nonetheless their transparency would be greatly enhanced if this kind of measure were applied to export taxes and quantitative restrictions as well as to administrative fees and charges on exports.
27
Fewer exceptions to general prohibitions of export restrictions or taxes
A second approach taken by the RTAs to strengthening the GATT discipline is to eliminate some of the key exceptions to the export restrictions ban. The more commonly eliminated exceptions are GATT XI:2(a) for shortages of foodstuffs and other essential products, XX(g) for exhaustible natural resources, XX(i) for domestic stabilization plans in which the price of materials necessary to domestic processing industries is held below world prices, and XX(j) for restrictions necessary to ensure acquisition or distribution of products in general or local short supply. Thirty-nine of the 76 RTAs that have some language on export taxes or restrictions eliminate at least one of these exceptions. Of those 39, 32 agreements eliminate GATT XX(j), indicating that this exception may be the most dispensable. Twenty-nine agreements eliminate exception XX(i) for domestic stabilisation plans. Only 19 RTAs eliminate exception XI:2(a) for shortages, and another 18 eliminate the exception for exhaustible natural resources. Annex 5.C shows which agreements eliminate which exceptions. While many RTAs eliminate at least one WTO exception, many add more product-specific exceptions at the same time. In some cases, if the added exceptions are significant enough, this can render the agreement WTO-minus. There seems to be a trade-off in some RTAs between including a very strong discipline with a long list of exceptions or, on the other hand, a weaker discipline with fewer exceptions.
Imposing conditions on use of exceptions to general prohibition of export restrictions or taxes
A third approach to strengthening the WTO discipline on export restrictions and taxes is to require parties to meet certain conditions if they implement a restriction justified under one of the key exceptions such GATT XI:2(a) or GATT XX(g, i, j). Only three agreements, all involving Canada, take this approach, Canada-Chile (1997), Canada-Costa Rica (2002), and NAFTA (1994).
28 In all three agreements, use of a quantitative restriction must not reduce the total share of
export shipments available to the RTA parties that the exporting country usually supplies, relative to the previous 36 months. Moreover, the restriction must not disrupt normal channels of supply or normal shares of other specific goods supplied to RTA parties. The exporting party is thus responsible for implementing the restriction in such a way as to continue providing similar shares of total supply to RTA members as in the past, and without negative effects on other imported supplies of RTA parties. This condition mitigates the negative effects of restrictions on RTA importers, rather than forbidding the use of restriction per se.
These agreements also require that parties meet conditions for taking advantage of exceptions to the general ban on export taxes. In this case, the export tax must not result in a higher price for the good when exported to RTA members than the price to domestic consumers. It seems unlikely that this condition could be met unless the country simultaneously levied domestic tax of equal magnitude on the product. Essentially, this condition eliminates the price wedge usually caused by an export tax between the domestic price and the export price when destined for countries within the RTA. All three agreements note that this condition does not apply to quantitative export restrictions, where a higher price may well result from restricting the volume of exports.

168 – 5. MULTILATERALISING REGIONALISM: DISCIPLINES ON EXPORT RESTRICTIONS IN REGIONAL TRADE AGREEMENTS
EXPORT RESTRICTIONS IN RAW MATERIALS TRADE: FACTS, FALLACIES AND BETTER PRACTICES © OECD 2014
This third approach is particularly noteworthy because it disciplines the negative effects of export taxes and restrictions on importing countries within the RTA, rather than completely eliminating export controls as a policy option.
5.8. Conclusions
Regional trade agreements offer the possibility of developing trade disciplines beyond WTO provisions and innovating in less developed policy areas like export taxes and restrictions. A number of different approaches to disciplining these policy instruments have been used in the 93 agreements surveyed.
Fifteen of the RTAs include quantitative export restriction disciplines that are stronger than those found in the WTO, while 22 agreements have weaker provisions in that they allow export restrictions on products that are not allowed under WTO disciplines. There is a marked tendency toward stronger provisions in more recently concluded RTAs. As for export duties, over two-thirds of the agreements restrict export duties beyond their permissive treatment in the WTO.
Comparison of export restraint disciplines in RTAs and those in the WTO reveals that some RTAs have used a number of strategies for strengthening disciplines. These can be summarised as follows.
Defining with greater precision the products on which export restrictions and taxes can be imposed, or the time period for which they may be applied.
Eliminating some exceptions to the general ban on export restrictions, or limiting the scope of ambiguous situational exceptions.
Applying conditions to the way exceptions are implemented in order that export restrictions and taxes do not endanger existing supply chains within the RTAs.
Ensuring greater transparency and accountability regarding measures to be put into place.
Defining procedures for consultation with affected parties before implementation of restraints.
Some RTAs allow restrictions already in place but do not allow new ones, nor do they permit an increase in existing levels of export taxes. This is a potentially significant way of disciplining export restraints in the longer term as situations change and restrictions on a given product are no longer desirable to the exporting country.
Some of the exception clauses in the GATT use vague language, which has often been carried over into RTA agreements. Disciplines could be strengthened by clarifying and defining some of the terms used. Sharma (2011) suggests a long list of terms that are used in the WTO and in many RTAs and that could be clarified, such as “foodstuffs”, what is meant by a “critical” shortage of foodstuffs as well as “preventing” or “relieving” a critical shortage of foodstuffs, etc. One important step towards tightening export restriction disciplines would be to make the WTO exception for “exhaustible natural resources” more precise by defining exactly which goods qualifies for this category.
Some RTAs increase transparency and improve communication among their members by instituting procedures or mandating institutions to oversee the implementation of export restraints. Requiring RTA parties to publish export charges on the internet and to inform RTA partners in advance of their application would further improve transparency and predictability. Some RTAs insist on formal procedures being followed when a member wishes to impose an export restriction. Signatories that are in an exceptional situation where imposition of an export restriction may be imminent must consult with other RTA members to determine whether conditions justify the use of an export restriction and to cooperate in removing restrictions as circumstances change. Some agreements establish procedures in which the RTA’s governing committee plays a significant role.
Many RTAs include provisions for special and differential treatment (SDT) in the area of export restrictions. Practices like phase-out periods for removing export taxes or reforming licensing

5. MULTILATERALISING REGIONALISM: DISCIPLINES ON EXPORT RESTRICTIONS IN REGIONAL TRADE AGREEMENTS – 169
EXPORT RESTRICTIONS IN RAW MATERIALS TRADE: FACTS, FALLACIES AND BETTER PRACTICES © OECD 2014
regimes for developing country partners are some examples. This may provide a precedent for use of SDT in strengthening export restriction disciplines more widely. Allowing developing and least-developed country partners to implement stronger disciplines gradually is important to prevent new disciplines from disrupting developing countries’ policy balance. Indeed, SDT for least-developing and developing countries was identified as a priority in the negotiating positions of the EC, the Cairns Group and the United States in the area of export taxes during the Doha Round.
Finally, an innovative approach found in a few RTAs requires that, if exceptions to the general ban are used, their use is conditional upon their implementation in a way designed to affect other RTA members less negatively than third-party countries. This kind of discipline attempts to mitigate the negative impacts of export restrictions on RTA importers rather than strengthening the ban on their use as a policy instrument altogether.
It is interesting to note that none of the 93 RTAs examined removed quantitative export restrictions completely. It would be possible to institute an export tax that has the same effect as a quantitative restriction in terms of reducing exports whilst creating more government revenue, and that is permitted within the WTO. There are examples in the RTAs examined where export taxes are allowed on a wider range of products than quantitative export restrictions. This could be used as a regulatory tool in order to favour the use of export taxes in situations where export restraint is desirable, rather than quantitative export restrictions. It seems, however, that there is no impetus within the RTAs studied for quantifying existing restrictions by replacing quotas with taxes and potentially negotiating ceilings for those export taxes. Proposals for disciplines such as a tax-rate quota system and a variable export tax scheme can be found in the policy literature (for example, Sharma, 2011).
More recently concluded RTAs have paid more attention to the issue of disciplining export restraints since this type of border measure, especially export taxes, has become a more widely used policy tool (Kim, 2010). Perhaps future RTAs will build on the more stringent provisions found in some agreements in this study to innovate in the use of substantive disciplines on export restrictions and taxes.
After examining export restraint provisions in the 93 RTAs selected for this study, one of the unanswered questions is why some parties sign different commitments with different partners, imposing the inclusion of exceptions in some cases and not in others. This is particularly true in the case of agreements that contain weaker or merely equivalent provisions compared with those of the WTO. One possible part of the explanation of why some parties sign different commitments with different partners on the specific issue of export restraints probably lies in the political economy domain. In the case of foodstuffs, for example, governments may not want to “tie their hands” with stringent export restraint provisions in case of price hikes and/or supply shortfalls in thin markets. If prices rise, however, and major agricultural producers of basic commodities restrict their exports, world price increases will be exacerbated and net food-importing countries’ welfare will be severely diminished. A commonly held view of the impact of export restrictions when agricultural prices rose steeply during 2008-9 is that they substantially diminished global welfare. In the case of some natural resources such as those coming from the extractive industries, resource-rich governments may come under pressure from downstream industries to protect them indirectly by restricting exports of primary products, or they may try to foster investment in higher value-added products rather than exporting raw materials. These are important concerns for the viability of future discussions on export restrictions.

170 – 5. MULTILATERALISING REGIONALISM: DISCIPLINES ON EXPORT RESTRICTIONS IN REGIONAL TRADE AGREEMENTS
EXPORT RESTRICTIONS IN RAW MATERIALS TRADE: FACTS, FALLACIES AND BETTER PRACTICES © OECD 2014
Notes
1. Jane Korinek is a Trade Policy Analyst and Jessica Bartos was an intern in the OECD’s Trade and Agriculture Directorate. This research was carried out under the direction of Frank van Tongeren, Head of the Policies in Trade and Agriculture Division. The authors wish to thank Jeonghoi Kim, Patrick Low and Evdokia Moïsé for helpful comments and discussions. The final report benefitted from discussions in the OECD Working Party of the Trade Committee, which has agreed to make the study more widely available through declassification on its responsibility.
2. wto.org/english/tratop_e/region_e/region_e.htm, accessed 17 August 2011. The number of RTAs is as of 15 May 2011 and account for goods and services notifications separately.
3. www.wto.org/english/thewto_e/whatis_e/tif_e/bey1_e.htm
4. Ibid.
5. Export bans governed by international agreements in areas such as protection of endangered species, prevention of the spread of dangerous materials or weapons, or for human rights reasons are not covered in this study. Examples of such agreements are the UN Convention on International Trade in Endangered Species of Wild Fauna and Flora (CITES), the UN Convention on the Development, Prohibition, Stockpiling, and Use of Chemical Weapons, and the UN Basel Convention on the Control of Transboundary Movements of Hazardous Wastes and Their Disposal, or the Kimberley Process certification system which documents the origin of rough diamonds so as to prevent groups in conflict areas from financing war through diamond sales (Kim, 2010).
6 For a detailed analysis of the distribution of welfare costs over different market participants, see Chapter 2 of this volume.
7. Canada also argued that these export restrictions were justified under Article XX(g) (see below). The Panel found that the measures maintained by Canada were contrary to GATT Article XI:1and were justified neither by Article XI:2(b) nor by Article XX(g).
8. The Panel Report was circulated to Members on 5 July, 2011. It was appealed, and the Appellate Body report was issued on 30 January, 2012. For a summary of this dispute, including the appeal, see: http://www.wto.org/english/tratop_e/dispu_e/cases_e/ds398_e.htm.
9. China imposes export duties on several raw materials and imposes other restrictions such as export fees. In its 2001 Accession agreement, China agreed to eliminate all taxes or charges on exports excluding products specifically listed in Annex 6 of the agreement. The products listed can only be subject to export duties, not QRs, with maximum rates fixed in the agreement's annex.
10. New Zealand has not used price stabilisation policies since 1990.
11. EC complaints against Pakistan in 1997 and India in 1998 concerning restrictions on the export of hides and skins did not advance beyond the consultation stage (WTO, 1997; WTO, 2000a). In 2000, the DSB decided against the EC in its case against Argentina over an Argentine law allowing representatives of the local tanning industry to be present at customs during the export of bovine hides. The Panel Report ruled that the EC had not proven that their presence had an inhibiting effect on exports, and therefore had not proven that Argentina’s law constitutes a violation of Article XI:1 (WTO, 2000b, paragraphs 11.28-11.34).
12. In fact, the natural resources exception is both product-specific and situational as illustrated by the findings of the two cases that have come up for dispute settlement. This exception cannot apply to manufactures or processed agricultural products.
13. The European Union placed a 20.6% anti-dumping duty on imports of aluminium car wheels from China in May 2010, further raised to 22.3% in October 2010 for a period of five years. The EU Commission Regulation indicates that major reasons for considering that dumping was occurring the export tax imposed on one of its main raw materials and a differential system of refunding VAT between raw materials and finished goods: “primary aluminium for export is subject to a 17 % VAT (while VAT on exports of finished goods is refunded) plus a 15 % export tax” (European Commission, 2010b).
14. Despite the fact that many of these preferential trade agreements are not necessarily between countries in the same geographic region, this paper will refer to them as “regional trade agreements” or RTAs.
15 Annex 5.A shows the agreements in the sample and their signatory states, by region and time period.

5. MULTILATERALISING REGIONALISM: DISCIPLINES ON EXPORT RESTRICTIONS IN REGIONAL TRADE AGREEMENTS – 171
EXPORT RESTRICTIONS IN RAW MATERIALS TRADE: FACTS, FALLACIES AND BETTER PRACTICES © OECD 2014
16 A “positive” list is one in which products are precisely identified by name, product code or both. By contrast, a “negative” list is the residual category of (unnamed) products, after specific items have been removed. A positive list is more precise and transparent than a negative one.
17. For the purpose of brevity, quantitative export restrictions will also be referred to as “export restrictions” in this section. The category containing both types of measure is referred to as “export restraints”.
18 The details of these RTAs’ provisions on quantitative export restrictions can be found in Korinek and Bartos (2012), Appendix C.
19. Re-export clauses are present in some RTAs in order to prevent exports that are subject to restrictions outside the RTA being exported through the RTA partner country in order to circumvent the general ban.
20. EFTA-Mexico also allows Mexico to restrict the granting of import and export licenses for the same products as EC-Mexico, while the Japan-Mexico agreement stipulates that “Mexico may maintain the measures specified below, provided that such measures do not accord more favourable treatment to any non-Party” on a similar list of products.
21. Croatia became the 28th
member state of the European Union on 1 July 2013; however their previous trade agreement has been included in the list of RTAs examined here.
22. These goods include mannitol, sorbitol, essential oils, albuminoidal substances, modified starches, glues, finishing agents, hides and skins, raw furskins, raw silk and silk waste, wood and animal hair, raw cotton and waste, cotton carded or combed, raw flax, and raw hemp. They are listed with their HS product codes.
23. Since the GATT does not prohibit or limit export taxes explicitly, no RTA can be considered “GATT-minus”.
24. Details of these RTAs’ provisions on export taxes can be found in Korinek and Bartos (2012), Appendix D.
25. As regards wheat, barley and maize, a quantitative restriction was in place following the 2010 drought in Ukraine, and this quota was replaced with an export tax on 1 July 2011 (OECD, 2011b, p. 271).
26. This includes EC’s agreements with Bosnia, Croatia, Chile, Côte d’Ivoire, Macedonia, Israel, Jordan, and Lebanon.
27. Various transparency mechanisms used in RTAs for other measures could also be used to promote the visibility and accountability of export restrictions. An overview of transparency measures in RTAs, concentrating on provisions of behind-the-border measures, can be found in Lejárraga (2013).
28. Canada’s most recent RTAs – such as Canada-Peru (2009), Canada-Jordan (2009), and Canada-Panama (2010) – do not use this approach in designing disciplines.

172 – 5. MULTILATERALISING REGIONALISM: DISCIPLINES ON EXPORT RESTRICTIONS IN REGIONAL TRADE AGREEMENTS
EXPORT RESTRICTIONS IN RAW MATERIALS TRADE: FACTS, FALLACIES AND BETTER PRACTICES © OECD 2014
References
Bonarriva, J., Koscielski, M., and Wilson, E. (2009), Export Controls: An Overview of their Use, Economic Effects, and Treatment in the Global Trading System, US International Trade Commission, Washington.
Bouet, A., and Laborde, D. (2010), Economics of Export Taxation: A Theoretical and CGE Approach Contribution, International Food Policy Research Institute, Washington.
Cairns Group Negotiating Proposal (2000), Export Restrictions and Taxes, World Trade Organization Ministerial Conference, WTO Negotiation on Agriculture.
China Daily (2009), China: Export Restrictions in Line with WTO Rules, www.chinadaily.com.cn/business/, November 5.
Crawford, J.-A., and Fiorentino, R.V. (2005), The Changing Landscape of Regional Trade Agreements,
World Trade Organization Secretariat, Geneva.
Deese, William and John Reeder (2007), Export Taxes on Agricultural Products: Recent History and Economic Modelling of Soybean Export Taxes in Argentina, US International Trade Commission, Washington.
Dollive, K. (2008), The Impact of Export Restraints on Rising Grain Prices, US International Trade Commission, Washington.
European Commission (2010a), Turkey: EU Bilateral Trade and Trade with the World, DG Trade, http://ec.europa.eu/trade/creating-opportunities/bilateral-relations/countries/turkey/.
European Commission (2010b), Commission Regulation (EU) No 404/2010 of 10 May 2010, Official Journal of the European Union, 11 May 2010.
European Communities (2008), Communication from the European Communities: Revised Submission on Export Taxes, TN/MA/W/101.
Export Controls Division (2007), A Guide to Canada’s Export Controls, Foreign Affairs and International Trade Canada, Ottawa, http://www.international.gc.ca/controls-controles/index.aspx.
GATT (1988), Canada – Measures affecting export of unprocessed herring and salmon: Report of the Panel, L/6268 - 35S/98, 22 March.
GATT (1994), Analytical Index, Guide to GATT Law and Practice.
Inter-American Development Bank (2007), Bridging RTAs in the Americas: The Case of Market Access, Background document prepared for the forum Iniciativa de la Cuenca del Pacifico, Cali, Colombia 29-30 January.
Karapinar, B. (2010), Export Restrictions and the WTO Law: “Regulatory Deficiency” or “Unintended Policy Space”, World Trade Institute, WTO World Trade Report 2010 website, http://www.wto.org/english/res_e/publications_e/wtr10_21may10_e.htm.
Kim, J. (2010), "Recent Trends in Export Restrictions on Raw Materials", in OECD, The Economic Impact of Export Restrictions on Raw Materials, OECD Publishing, Paris, http://dx.doi.org/10.1787/9789264096448-4-en.
Korinek, J. and J. Bartos (2012), "Multilateralising Regionalism: Disciplines on Export Restrictions in Regional Trade Agreements", OECD Trade Policy Papers, No. 139, OECD Publishing, Paris,
http://dx.doi.org/ 0.1787/5k962hf7hfnr-en.
Korinek J. and J. Kim (2010), "Export Restrictions on Strategic Raw Materials and Their Impact on Trade and Global Supply", in OECD, The Economic Impact of Export Restrictions on Raw Materials, OECD Publishing, Paris, http://dx.doi.org/10.1787/9789264096448-7-en.
Laird, S. (1999), “Export Policy and the WTO”, Journal of International Trade and Economic Development, Vol. 8 (1), pp.73-88.

5. MULTILATERALISING REGIONALISM: DISCIPLINES ON EXPORT RESTRICTIONS IN REGIONAL TRADE AGREEMENTS – 173
EXPORT RESTRICTIONS IN RAW MATERIALS TRADE: FACTS, FALLACIES AND BETTER PRACTICES © OECD 2014
Lejárraga, I. (2013), “Multilateralising Regionalism: Strengthening Transparency Disciplines in Trade”, OECD Trade Policy Working Papers, No 152. OECD Publishing, Paris. http://dx.doi.org/10.1787/5k44t7k99xzq-en.
Mitra, S., and T. Josling (2009), “Agricultural Export Restrictions: Welfare Implications and Trade Disciplines”, Agricultural and Rural Development Policy Series, International Food and Agricultural
Trade Policy Council, Washington.
OECD (2011), Agricultural Policy Monitoring and Evaluation 2011: OECD Countries and Emerging Economies, OECD Publishing, Paris, http://dx.doi.org/10.1787/agr_pol-2011-en.
Nogues, J.J. (2008), “The Domestic Impact of Export Restrictions: The Case of Argentina”, Agricultural and Rural Development Policy Series, International Food and Agricultural Trade Policy Council, Washington.
Piermartini, Roberta (2004), The role of export taxes in the field of primary commodities, WTO, Geneva.
Sharma, Ramesh (2011), “Food Export Restrictions: Review of the 2007-2010 Experience and Considerations for Disciplining Restrictive Measures”, FAO Commodity and Trade Policy Research Working Paper No. 32, FAO, Rome.
USDA (2000), Submission from the United States: Proposal for Comprehensive Long-Term Agricultural Trade Reform, http://www.fas.usda.gov/.
Van Den Hende, L. and J. Paterson (2009), “Export Restrictions on Raw Materials: WTO Rules and Remedies”, Herbert Smith LLP, Bloomberg Law Reports.
WTO (2011), China — Measures Related to the Exportation of Various Raw Materials, DS394, DS395, DS398, 5 July 2011.
WTO (2010a), Trade Policy Review of Albania, WT/TPR/S/229.
WTO (2010b), Trade Policy Review of Croatia, WT/TPR/S/227.
WTO (2009a), Trade Policy Review of Australia, WT/TPR/S/178.
WTO (2009b), Trade Policy Review of Brazil, WT/TPR/S/212.
WTO (2009c), Market Access for Non-Agricultural Products, Enhanced Transparency on Export Licensing, TN/MA/W/15/Add.4/Rev.4, 9 September 2009.
WTO (2007a), Trade Policy Review of Argentina, WT/TPR/S/176.
WTO (2007b), Trade Policy Review of Canada, WT/TPR/S/179.
WTO (2007c), Trade Policy Review of New Zealand, WT/TPR/S/216.
WTO (2001a), Protocol on the Accession of the People’s Republic of China, WT/L/432.
WTO (2001b), Report of the Working Party on the Accession of China, WT/ACC/CHN/49.
WTO (2001c), United States - Measures Treating Export Restraints as Subsidies, Report of the Panel, WT/DS194/R, June 29, 2001.
WTO (2000a) India-Measures Affecting Export of Certain Commodities, DS120.
WTO (2000b) Argentina-Measures Affecting the Export of Bovine Hides and the Import of Finished Leather, Report of the Panel, DS155.
WTO (1997) Pakistan-Export Measures Affecting Hides and Skins, DS107.
Yen, G.C. (2006), EU, Japan propose new WTO treaties to prevent export Taxes, Third World Network, www.twnside.org.sg/.

174 – 5. MULTILATERALISING REGIONALISM: DISCIPLINES ON EXPORT RESTRICTIONS IN REGIONAL TRADE AGREEMENTS
EXPORT RESTRICTIONS IN RAW MATERIALS TRADE: FACTS, FALLACIES AND BETTER PRACTICES © OECD 2014
Annex 5.A
Regional Trade Agreements Included in the Sample, Total: 93
Before 1994 1994-1999 2000-2004 2005-
Africa African Economic Community (1991) (Algeria, Angola, Benin, Botswana, Burkina Faso, Burundi, Cameroon, Cape Verde, Central African Republic , Comoros, Congo, Côte d'Ivoire, Djibouti, Egypt, Ethiopia, Equatorial Guinea, Gabon, Gambia, Ghana, Guinea, Guinea Bissau, Kenya, Lesotho, Liberia, Libyan Arab Jamahiriya, Madagascar, Malawi, Mali, Mauritania, Mauritius, Mozambique, Namibia, Niger, Nigeria, Rwanda, Sahrawi, Sao Tome and Principe, Senegal, Seychelles, Sierra Leone, Somalia, Sudan, Swaziland, Tanzania, Chad, Togo, Tunisia, Uganda, Zaire, Zambia, Zimbabwe)
ECOWAS (1993) (Benin; Burkina Faso; Cape Verde; Côte d'Ivoire; Gambia; Ghana; Guinea; Guinea Bissau; Liberia; Mali; Niger; Nigeria; Senegal; Sierra Leone; Togo)
COMESA (1994) (Angola, Burundi, Comoros, Congo, Djibouti, Egypt, Eritrea, Ethiopia, Kenya, Madagascar, Malawi, Mauritius, Namibia, Rwanda, Seychelles, Sudan, Swaziland, Tanzania, Uganda, Zambia, Zimbabwe)
SADC (2000) (Angola, Botswana, Congo, Lesotho, Malawi, Mauritius, Mozambique, Namibia, Seychelles, South Africa, Swaziland, Tanzania, Zambia, Zimbabwe)
SACU (2004) (Botswana, Lesotho, Namibia, South Africa, Swaziland)

5. MULTILATERALISING REGIONALISM: DISCIPLINES ON EXPORT RESTRICTIONS IN REGIONAL TRADE AGREEMENTS – 175
EXPORT RESTRICTIONS IN RAW MATERIALS TRADE: FACTS, FALLACIES AND BETTER PRACTICES © OECD 2014
Before 1994 1994-1999 2000-2004 2005-
Asia Pacific PATCRA (1977) (Australia, Papua New Guinea)
SPARTECA (1982) (Australia, Cook Islands, Fiji, Kiribati, Nauru, New Zealand, Niue, Papua New Guinea, Solomon Islands, Tonga, Tuvalu, Western Samoa)
ANZCERTA (1983) (Australia, New Zealand)
ASEAN (1992) (Brunei Darussalam, Indonesia, Malaysia, Philippines, Singapore, Thailand)
Thailand-India (2003)
India-ASEAN (2004)
Australia-Thailand (2005)
India-Singapore (2005)
New Zealand-Thailand (2005)
India-Bangladesh (2006)
India-Chile (2007)
India-Korea (2009)
China Chile (1997) ASEAN (2003)
Hong Kong (2004)
Pakistan (2007)
New Zealand (2008)
Singapore (2009)
Peru (2010)
Japan India (1958) (renegotiated post-survey in 2011)
Mexico (2005) Chile (2007)
Indonesia (2008)
Switzerland (2009)
Viet Nam (2009)
Eastern Europe- Central Asia
Commonwealth of Independent States (1994) (Armenia, Azerbaijan, Belarus, Georgia, Kazakhstan, Kyrgyzstan, Moldova, Russian Federation, Tajikistan, Ukraine, Uzbekistan)
Russia-Ukraine (1994)
Common Economic Zone (2004) (Russia, Belarus, Ukraine, Kazakhstan)
Belarus-Ukraine (2006)
CEFTA 2006 (Albania, Bosnia and Herzegovina, Croatia, Macedonia, Moldova, Montenegro, Serbia, UNMIK/Kosovo)
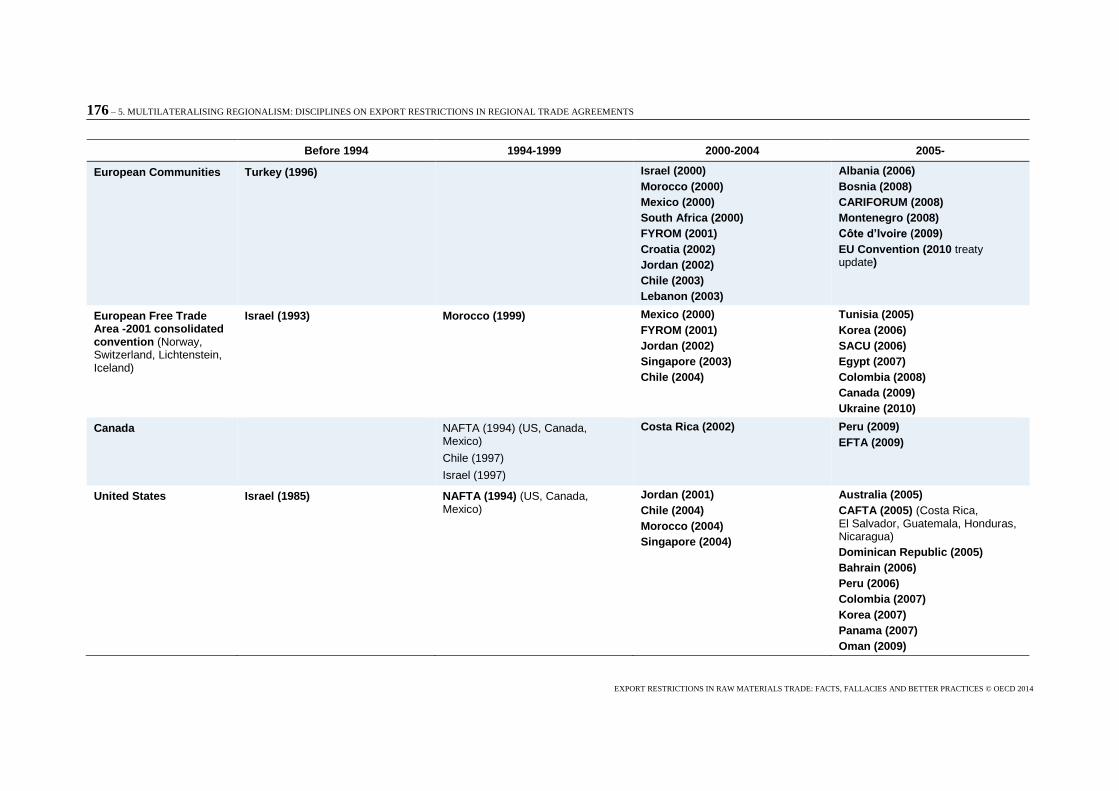
176 – 5. MULTILATERALISING REGIONALISM: DISCIPLINES ON EXPORT RESTRICTIONS IN REGIONAL TRADE AGREEMENTS
EXPORT RESTRICTIONS IN RAW MATERIALS TRADE: FACTS, FALLACIES AND BETTER PRACTICES © OECD 2014
Before 1994 1994-1999 2000-2004 2005-
European Communities Turkey (1996) Israel (2000)
Morocco (2000)
Mexico (2000)
South Africa (2000)
FYROM (2001)
Croatia (2002)
Jordan (2002)
Chile (2003)
Lebanon (2003)
Albania (2006)
Bosnia (2008)
CARIFORUM (2008)
Montenegro (2008)
Côte d’Ivoire (2009)
EU Convention (2010 treaty update)
European Free Trade Area -2001 consolidated convention (Norway, Switzerland, Lichtenstein, Iceland)
Israel (1993) Morocco (1999) Mexico (2000)
FYROM (2001)
Jordan (2002)
Singapore (2003)
Chile (2004)
Tunisia (2005)
Korea (2006)
SACU (2006)
Egypt (2007)
Colombia (2008)
Canada (2009)
Ukraine (2010)
Canada NAFTA (1994) (US, Canada, Mexico)
Chile (1997)
Israel (1997)
Costa Rica (2002) Peru (2009)
EFTA (2009)
United States Israel (1985) NAFTA (1994) (US, Canada, Mexico)
Jordan (2001)
Chile (2004)
Morocco (2004)
Singapore (2004)
Australia (2005)
CAFTA (2005) (Costa Rica, El Salvador, Guatemala, Honduras, Nicaragua)
Dominican Republic (2005)
Bahrain (2006)
Peru (2006)
Colombia (2007)
Korea (2007)
Panama (2007)
Oman (2009)
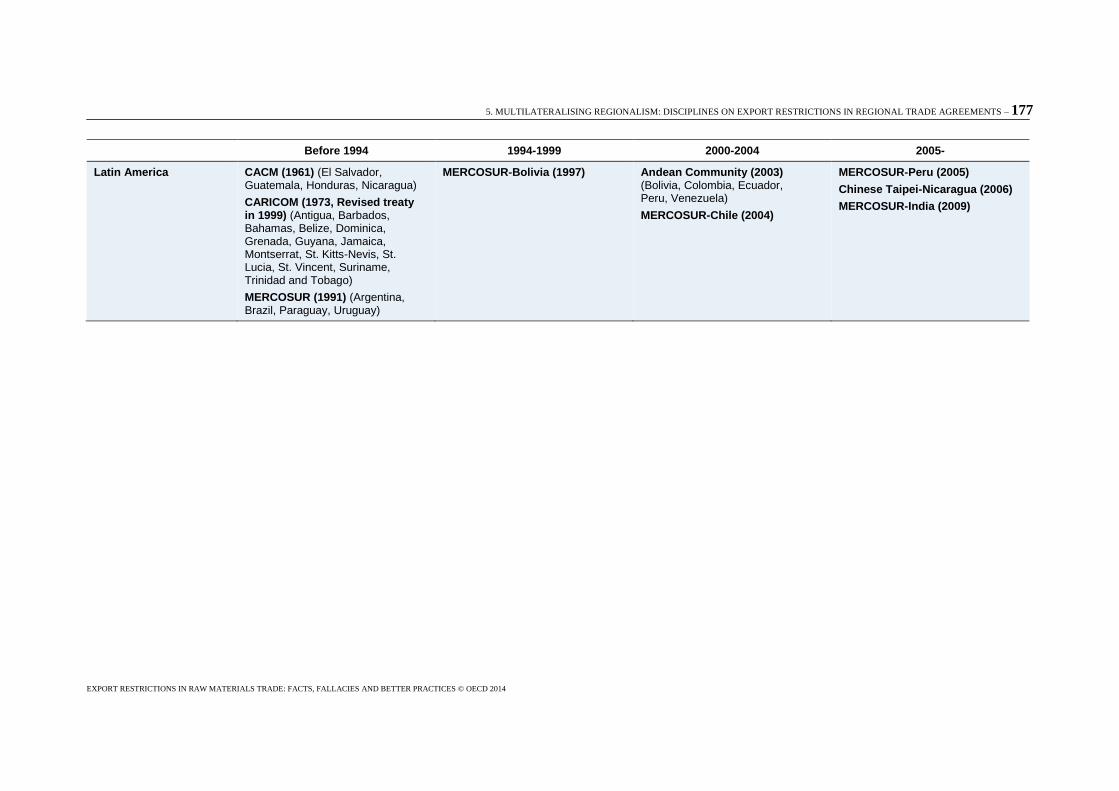
5. MULTILATERALISING REGIONALISM: DISCIPLINES ON EXPORT RESTRICTIONS IN REGIONAL TRADE AGREEMENTS – 177
EXPORT RESTRICTIONS IN RAW MATERIALS TRADE: FACTS, FALLACIES AND BETTER PRACTICES © OECD 2014
Before 1994 1994-1999 2000-2004 2005-
Latin America CACM (1961) (El Salvador, Guatemala, Honduras, Nicaragua)
CARICOM (1973, Revised treaty in 1999) (Antigua, Barbados, Bahamas, Belize, Dominica, Grenada, Guyana, Jamaica, Montserrat, St. Kitts-Nevis, St. Lucia, St. Vincent, Suriname, Trinidad and Tobago)
MERCOSUR (1991) (Argentina, Brazil, Paraguay, Uruguay)
MERCOSUR-Bolivia (1997) Andean Community (2003) (Bolivia, Colombia, Ecuador, Peru, Venezuela)
MERCOSUR-Chile (2004)
MERCOSUR-Peru (2005)
Chinese Taipei-Nicaragua (2006)
MERCOSUR-India (2009)

178 – 5. MULTILATERALISING REGIONALISM: DISCIPLINES ON EXPORT RESTRICTIONS IN REGIONAL TRADE AGREEMENTS
EXPORT RESTRICTIONS IN RAW MATERIALS TRADE: FACTS, FALLACIES AND BETTER PRACTICES © OECD 2014
Annex 5.B
Comparison between RTAs and WTO Disciplines1
Agreement Quantitative export restrictions Export taxes
ASEAN - =
African Economic Community - =
Andean Community NA =
ANZCERTA = =
ASEAN-China NA =
Australia-Thailand = =
Belarus-Ukraine - +
CACM NA =
Canada-Chile + +
Canada-Costa Rica + +
Canada-Israel - +
Canada-Peru = +
CARICOM - +
CEFTA 2006 + +
China Pakistan NA +
China-Chile NA +
China-Hong Kong NA =
China-New Zealand = +
China-Peru = +
China-Singapore = =
CIS - +
COMESA NA =
Common Economic Zone + +
EC-Jordan NA +
EC-South Africa + +
EC-Albania = +
EC-Bosnia = +
EC-CARIFORUM + +
EC-Côte d’Ivoire + +
EC-Croatia = +
EC-FYROM = +
EC-Israel + +
EC-Lebanon + +
EC-Mexico - +
EC-Montenegro = +
EC-Morocco NA =
EC-Turkey = +

5. MULTILATERALISING REGIONALISM: DISCIPLINES ON EXPORT RESTRICTIONS IN REGIONAL TRADE AGREEMENTS – 179
EXPORT RESTRICTIONS IN RAW MATERIALS TRADE: FACTS, FALLACIES AND BETTER PRACTICES © OECD 2014
Agreement Quantitative export restrictions Export taxes
ECOWAS NA =
EFTA Convention + +
EFTA-Canada = +
EFTA-Chile + +
EFTA-Colombia - +
EFTA-Egypt + +
EFTA-FYROM = +
EFTA-Israel + +
EFTA-Jordan = +
EFTA-Korea = +
EFTA-Mexico - +
EFTA-Morocco = +
EFTA-SACU - +
EFTA-Singapore = +
EFTA-Tunisia = +
EFTA-Ukraine - +
India-ASEAN NA =
India-Bangladesh NA =
India-Chile = =
India-Korea = =
India-Singapore = =
Japan - Switzerland = +
Japan-Viet Nam = =
Japan-Chile = +
Japan-Indonesia = =
Japan-Mexico - +
Japan-Thailand = =
MERCOSUR = =
MERCOSUR – Bolivia - +
MERCOSUR – Chile - +
MERCOSUR – India NA =
MERCOSUR – Peru - +
NAFTA + +
New Zealand – Thailand + =
PATCRA = +
Russia-Ukraine - +
SACU - =
SADC - +
SPARTECA NA =
Chinese Taipei-Nicaragua - +
Thailand-India NA =
Treaty on the EU + +
US-Singapore = +
US-Australia - +
US-Bahrain = +

180 – 5. MULTILATERALISING REGIONALISM: DISCIPLINES ON EXPORT RESTRICTIONS IN REGIONAL TRADE AGREEMENTS
EXPORT RESTRICTIONS IN RAW MATERIALS TRADE: FACTS, FALLACIES AND BETTER PRACTICES © OECD 2014
Agreement Quantitative export restrictions Export taxes
US-CAFTA-DR - +
US-Chile = +
US-Colombia - +
US-Israel - =
US-Jordan NA =
US-Korea = +
US-Morocco = +
US-Oman = +
US-Panama = +
US-Peru = +
1. Note that an equal (=) sign suggests the agreement is WTO-equal with regard to export taxes or quantitative restrictions, a minus (-) sign implies the agreement is WTO-minus and a plus (+) indicates the agreement is WTO-plus. A WTO-equal RTA is an agreement that neither improves upon nor regresses from the WTO disciplines. A WTO-minus RTA allows export restrictions where the WTO does not. A WTO-plus RTA forbids export restrictions where the WTO allows them. NA indicates that the agreement does not contain any language on quantitative export restrictions.
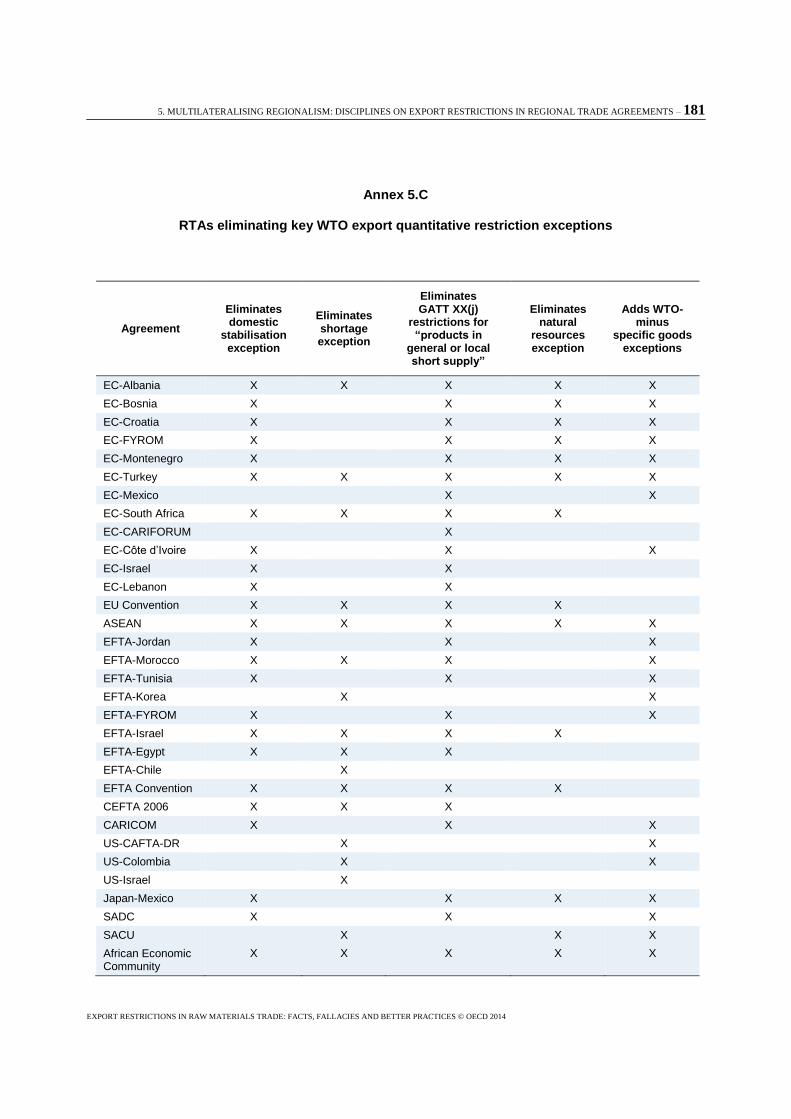
5. MULTILATERALISING REGIONALISM: DISCIPLINES ON EXPORT RESTRICTIONS IN REGIONAL TRADE AGREEMENTS – 181
EXPORT RESTRICTIONS IN RAW MATERIALS TRADE: FACTS, FALLACIES AND BETTER PRACTICES © OECD 2014
Annex 5.C
RTAs eliminating key WTO export quantitative restriction exceptions
Agreement
Eliminates domestic
stabilisation exception
Eliminates shortage exception
Eliminates GATT XX(j)
restrictions for “products in
general or local short supply”
Eliminates natural
resources exception
Adds WTO-minus
specific goods exceptions
EC-Albania X X X X X
EC-Bosnia X X X X
EC-Croatia X X X X
EC-FYROM X X X X
EC-Montenegro X X X X
EC-Turkey X X X X X
EC-Mexico X X
EC-South Africa X X X X
EC-CARIFORUM X
EC-Côte d’Ivoire X X X
EC-Israel X X
EC-Lebanon X X
EU Convention X X X X
ASEAN X X X X X
EFTA-Jordan X X X
EFTA-Morocco X X X X
EFTA-Tunisia X X X
EFTA-Korea X X
EFTA-FYROM X X X
EFTA-Israel X X X X
EFTA-Egypt X X X
EFTA-Chile X
EFTA Convention X X X X
CEFTA 2006 X X X
CARICOM X X X
US-CAFTA-DR X X
US-Colombia X X
US-Israel X
Japan-Mexico X X X X
SADC X X X
SACU X X X
African Economic Community
X X X X X
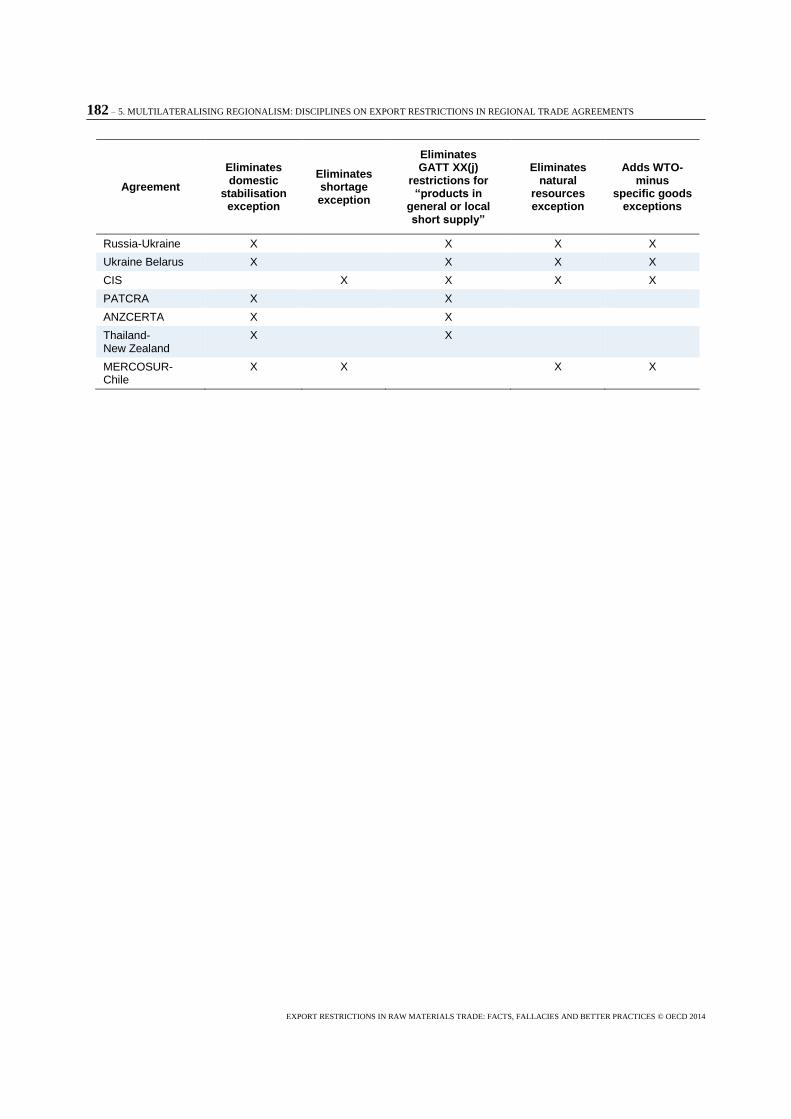
182 – 5. MULTILATERALISING REGIONALISM: DISCIPLINES ON EXPORT RESTRICTIONS IN REGIONAL TRADE AGREEMENTS
EXPORT RESTRICTIONS IN RAW MATERIALS TRADE: FACTS, FALLACIES AND BETTER PRACTICES © OECD 2014
Agreement
Eliminates domestic
stabilisation exception
Eliminates shortage exception
Eliminates GATT XX(j)
restrictions for “products in
general or local short supply”
Eliminates natural
resources exception
Adds WTO-minus
specific goods exceptions
Russia-Ukraine X X X X
Ukraine Belarus X X X X
CIS X X X X
PATCRA X X
ANZCERTA X X
Thailand- New Zealand
X X
MERCOSUR-Chile
X X X X

6. INCREASING THE TRANSPARENCY OF EXPORT RESTRICTIONS: BENEFITS, GOOD PRACTICES AND A PRACTICAL CHECKLIST – 183
EXPORT RESTRICTIONS IN RAW MATERIALS TRADE: FACTS, FALLACIES AND BETTER PRACTICES © OECD 2014
Chapter 6
INCREASING THE TRANSPARENCY OF EXPORT RESTRICTIONS:
BENEFITS, GOOD PRACTICES AND A PRACTICAL CHECKLIST
Barbara Fliess and Osvaldo R. Agatiello1
6.1. Introduction
Despite their increasing use, notably for minerals and other raw materials, international disciplines on the use of export restrictions
2 are less developed than those for import barriers. With
rare exceptions, most of these restrictions are not systematically monitored at the global level. Difficulty in obtaining accurate and timely information about this form of government intervention compounds the increasing uncertainties from other sources that are currently experienced by participants in markets for raw materials.
International markets for mineral resources and foodstuffs are subject to three systemic risks, widely identified as critical, which may lead to failures in global governance. One of these risks is technological or climatological in nature, namely supply vulnerability. The other two are economic: extreme volatility in energy and agriculture prices, and the (often unforeseen) negative consequences of trade-distorting regulations.
3
This chapter concentrates on transparency in the context of the third of these risks, focussing particularly on regulations that aim to restrict exports. It reviews relevant guidelines from the WTO and from other agreements or standards in order to identify the best practices currently in use to inform stakeholders and the general public about policies affecting them. From these transparency standards, a checklist of information elements is compiled.
The intention is not to advocate the use of export restrictions. On the contrary, regardless of whether they are applied for economic, social or political reasons, export restrictions always have economic costs for user countries that can easily outweigh achievable benefits. Moreover, export restrictions hurt trading partners and distort the global market. They raise the price of the products affected for foreign consumers and importers and potentially reduce global supply (see Chapter 2). Alternatives to the use of export restrictions that avoid these costs are available, which some governments have pursued with impressive results (see Chapter 7 for two examples).
Having said this, if export restrictions are in use, transparency can help mitigate some of their negative effects. The principles and standards of the checklist have been elaborated with the minerals sector in mind; however, they are applicable to all types of export restrictions,
in any goods sector.
4
The list can serve as a practical and pragmatic tool for self-evaluation by governments and for promoting better and more consistent transparency practices across countries. It is proposed without prejudice to transparency commitments that countries may have adopted in this regard through their membership in the WTO, regional or other preferential trade agreements.
The chapter is organised along the following lines. Section 6.2 outlines the concept of transparency. Section 6.3 explains how importing and exporting countries can each benefit when trade policies, including export restrictions in the raw materials sector, are transparent. Section 6.4 reviews applicable rules and commitments in GATT/WTO and elsewhere, showing the cumulative path over time towards greater transparency and distilling best-practice rules specifically aimed at the provision of information. Section 6.5 applies a checklist based on these standards to the study of

184 – 6. INCREASING THE TRANSPARENCY OF EXPORT RESTRICTIONS: BENEFITS, GOOD PRACTICES AND A PRACTICAL CHECKLIST
EXPORT RESTRICTIONS IN RAW MATERIALS TRADE: FACTS, FALLACIES AND BETTER PRACTICES © OECD 2014
information that governments from 33 countries using export restrictions in the minerals sector publish on governmental websites.
5 Section 6.6 goes one step further and expands the initial checklist to
cover the entire policy process, from the stage of planning an export restriction policy to the implementation of the measure once adopted. Section 6.7 concludes.
6.2. The concept of transparency
The meaning and purpose of transparency is not always understood. Nor is the term always clearly defined (Lejárraga, 2013). In public policy, transparency is about effective communication on policy matters between governments, businesses and other civil society stakeholders (OECD, 2003a, p.2). In the trade policy field, the WTO glossary refers to transparency as the “degree to which trade policies and practices, and the process by which they are established, are open and predictable.”
6 In
practice, this usually implies making relevant laws and regulations publicly available, letting concerned parties know when laws change, and ensuring uniform administration and application (Box 6.1). WTO/GATT and other trade agreements usually include general as well as measure-specific transparency rules to which members formally subscribe.
Box 6.1. Core transparency requirements of international trade agreements
[E]nsuring “transparency” in international commercial treaties typically involves three core requirements: (1) to make information on relevant laws, regulations and other policies publicly available; (2) to notify interested parties of relevant laws and regulations and changes to them; and (3) to ensure that laws and regulations are administered in a uniform, impartial and reasonable manner.
Source: WTO (2002a), Transparency. Note by the Secretariat. Working Group on the Relationship between Trade and Investment, WT/WGTI/W/109, 27 March, Geneva.
In a more advanced form, promoted inter alia by the OECD’s work on good public governance, transparency implies that rulemaking involves some form of public consultation and that procedures are in place that allow stakeholders to file complaints. Certain WTO agreements seeking to ensure that domestic regulation does not create unnecessary barriers to trade also use this enhanced definition (e.g. the TBT and SPS Agreements). In practice, in many areas of regulatory activity affecting international trade there has been a tendency over the past decade for national transparency procedures to become increasingly sophisticated. Systematic public consultation during the development of laws and regulations, the use of prior notice and comment procedures, and procedures that allow stakeholders to file complaints are all long-standing practice in many OECD countries and are becoming more widely used in non-OECD countries as well.
While openness to public scrutiny of rulemaking procedures is undoubtedly part of good economic governance in the trade policy arena, the focus of this chapter is on the provision of information. Transparency in this sense refers to the systematic availability and accessibility of information on trade policies or measures (here, export restrictions) for all interested parties. These terms are further explained in Box 6.2. This more limited focus has to do with data constraints. Examining national policy processes would require information going beyond the data on actual transparency practices of governments that were available from the OECD Inventory of Restrictions on Exports of Raw Materials.
Finally, it is important to note what transparency is not about. Transparency does not compromise governments’ “right to regulate” or to intervene in the economy or individual markets. It does not imply eliminating or watering down existing regulation. It does not prevent governments from pursuing multiple objectives. It does not aim at curtailing government discretion in policymaking, nor does it “lock in” policy regimes or regulatory regimes.
7 It simply seeks to enhance predictability.

6. INCREASING THE TRANSPARENCY OF EXPORT RESTRICTIONS: BENEFITS, GOOD PRACTICES AND A PRACTICAL CHECKLIST – 185
EXPORT RESTRICTIONS IN RAW MATERIALS TRADE: FACTS, FALLACIES AND BETTER PRACTICES © OECD 2014
Box 6.2. Making information available in accessible ways
Availability refers to the content and overall quality of the information that is disseminated. It means that the information is clear and comprehensive. This implies, for example, that the objective and rationale of a policy or measure is published and explained (including, where applicable, the nature of urgent problems and the reasons why rules are being changed). It also means that stakeholders have access to all relevant documents (decisions, decrees, legislation, regulation, administrative guidance) in order to fully understand government decisions and policies.
Accessibility refers to governments making information about their policies and practices, including laws, regulations and procedures, available to the public. Information should be provided in a timely manner and well in advance of the actual implementation of a policy, the information should be up-to-date, and national enquiry points should be available for obtaining information. The mechanisms themselves for disclosing information cannot be expected to be the same for all countries. Rather, the choice of channels depends on factors like the country’s capacity to implement information technology solutions and the characteristics of the political system (e.g. whether central or sub-central government authorities have jurisdiction). Another aspect of accessibility is that information is made available in a non-discriminatory manner. It is increasingly common for governments to publish the texts of trade-related laws, regulations and decrees on the internet. Dissemination on line has the advantage of universal availability to all (online) stakeholders, nationals and non-nationals alike, and regardless of geographic location. There are of course other delivery mechanisms. At a minimum, decisions taken by government authorities should be published in the government’s legal gazette.
6.3. On the benefits of transparency or costs of non-transparency
Availability of accurate and timely information is essential for markets to function effectively and efficiently. It enables market participants in the public and private sectors to base economic decisions on rational assessments of potential costs, risks and market opportunities. Consequently, making relevant information readily available is an important policy objective in its own right.
From a trade perspective, transparency is particularly valuable to foreign traders and firms, who tend to face greater difficulties than domestic market participants in obtaining information in a regulatory and business environment characterised by opacity, whether originated in government action or business sector practices. Transparent trade legislation, policies and practices also reduce the prospect of trade frictions with trading partners.
If mineral export restrictions are being used by national governments, stakeholders and economies benefit from greater transparency in the following ways:
Transparency lowers transaction costs in terms of both time and expense of obtaining information (‘search costs’), and reduces uncertainty about conditions of access to materials supplies by diminishing information asymmetry and hence high-risk premiums (OECD, 2009a).
Reducing information asymmetries, which create opportunities for discretionary behaviour, also allows hidden discrimination to be revealed and counteracted.
Last-minute, ad hoc or ex post disclosure of newly introduced measures makes it difficult for firms to react and adjust optimally to changes in rules and practices. For example, if a firm can anticipate a government’s decision to ban the export of a raw material, it can take preventive measures such as diversifying its sources of supply or recombining inputs.
Better information flows help to abate the extent and perniciousness of principal-agent problems in governments, firms and civil society institutions, revealing vested and conflicting interests (Bellver and Kaufmann, 2005).
While some of these benefits point to the more static aspect of information availability, others refer to the dynamic aspect of public consultation, emphasising due process and good governance. As Stoeckel and Fisher (2008, p.24) put it, “to develop better policies that serve the national interest it is necessary to assess the national interest. Good transparent review of policy does that”.

186 – 6. INCREASING THE TRANSPARENCY OF EXPORT RESTRICTIONS: BENEFITS, GOOD PRACTICES AND A PRACTICAL CHECKLIST
EXPORT RESTRICTIONS IN RAW MATERIALS TRADE: FACTS, FALLACIES AND BETTER PRACTICES © OECD 2014
Governments are more likely to be forthcoming with information about export restrictions if they see how it will help them meet their own policy objectives. Governments of exporting countries can benefit from transparent export rulemaking in the following ways:
Transparency of trade policies reduces trade-related uncertainty, which is associated with lower investment and lower growth, and with a resource shift towards non-tradables, lower value-added goods, and even rent-seeking activities by firms and individuals (Francois, 2001).
Transparency improves the stability of the business environment. Less transparent policy regimes pose higher risks for businesses, thereby incurring higher capital costs since investors demand a (higher) risk premium on funds invested in jurisdictions perceived to have economic or regulatory unpredictability.
Transparency regarding government action and local business practices, which creates an “enabling environment”, helps to attract foreign direct investment and reinvestment, which in turn means technology transfer and diffusion, and improved total factor productivity.
8 In the
mining sector, investments are long-term and capital-intensive, and there is often a strong need for foreign capital and technology participation. In these sectors, the risk assessment made by companies before committing investment funds looks at how frequently regulatory measures change, whether or not advance notice is given and whether opportunity for consultation exists. Business surveys rank transparency as a top priority for foreign investors (World Bank, 2012). The companies investing are often leading exporters of the extracted commodities as well, implying that transparency of national trade regulatory frameworks matters as much as transparent investment rules do.
Transparency can simplify and accelerate business procedures, lead to greater efficiency within government and avert corruption and similar criminal behaviours. The use of internet solutions multiplies administrative efficiency gains (OECD, 2009b).
Governments that engage in open policymaking can implement policies and regulations more easily. This is because compliance is facilitated when stakeholders have more information, especially when they have been consulted in advance. They are then better equipped and more willing to support implementation.
Transparent export policies can be strategically important for the national growth and development agendas of importing countries, especially when predictable access to raw materials is at stake. Shared transparency standards bring reciprocal benefits to trading countries. No economy in the world is self-sufficient in all the raw materials that are essential for manufacturing. Exporting countries that use export restrictions are invariably importers as well (see, for example, Chapter 1 of this volume, Table 1.6). If lack of transparency of their actions creates uncertainty for their trading partners, their own economies can also be harmed by opaque and erratic export policies that countries supplying them with needed raw materials might adopt. There would seem to be incentives for all countries to work towards shared transparency practices.
Of course, enhanced transparency entails costs and new challenges for governments. There are financial and human resource costs linked to establishing and operating efficient mechanisms for disseminating accessible information to all stakeholders, and these costs may seem daunting to some developing-country governments. Nevertheless, the trend seems inescapable. Well-planned stakeholder involvement consistently contributes to identifying ways aimed at reducing administrative burdens, generating savings and avoiding an uneven distribution of benefits (Möisé, 2011).
6.4. Transparency rules applicable to export restrictions
This section reviews GATT/WTO transparency provisions covering export restrictions. Because opacity has negative effects regardless of the direction of the trade flow, this review also includes transparency rules for some symmetric measures on the import side (for example, import tariffs). Besides multilateral rules, this stocktaking takes account of the findings of ongoing OECD

6. INCREASING THE TRANSPARENCY OF EXPORT RESTRICTIONS: BENEFITS, GOOD PRACTICES AND A PRACTICAL CHECKLIST – 187
EXPORT RESTRICTIONS IN RAW MATERIALS TRADE: FACTS, FALLACIES AND BETTER PRACTICES © OECD 2014
research on Regional Trade Agreements (RTAs).9 It also extends to some non-binding
recommendations or guidelines, notably the OECD Guiding Principles for Regulatory Quality and Performance of 2005 and the Recommendation of the OECD Council on Regulatory Policy and Governance of 2012, both of which treat transparency as one of the fundamental principles for ensuring the open market orientation of domestic regulation.
The goal is to learn from these different rules and recommendations about principles, standards and tools that are consistent with a high level of transparency. They will be used in Section 6.5 to assess actual practices in the use of export restrictions as recorded in the OECD Inventory of Restrictions on Exports of Raw Materials.
10 No attempt will be made to evaluate the
performance of existing transparency provisions in the WTO or elsewhere. Other substantive issues, such as the consistency of export restrictions with WTO agreements per se, or the question of actual restraints of export measures through WTO or other disciplines, also exceed the scope of this exercise.
Transparency mechanisms in the WTO framework
Many GATT and WTO agreements require governments to disclose their policies and practices in at least one of two ways: 1) by public divulgence within the country, which if done through publication in the official gazette or on the internet, means to everyone, nationally and internationally, or 2) by notifying members. In principle, while the publication of laws and regulations reinforces their generality and obligatoriness, notification may be more limited in reach and scope. However, the notification obligation is crucial when countries are parties to international agreements, including GATT/WTO. Notifications provide basic information regarding members’ adherence to relevant agreements. It is a guarantee of trust that members abide by the agreements they have entered into. Another benefit of notification is that it reduces many potentially costly disputes and their settlement since they make discussion possible at the appropriate WTO level or committee at an early stage. This in turn helps to clarify all aspects of the measure concerned and their interpretation, and to enhance understanding and dialogue. Information by notification also reduces uncertainty for traders, investors and service providers, and increases the predictability of trade policy when made publicly available.
There are various stipulations and guidelines regarding transparency embedded in the GATT texts and the various other agreements between WTO members. They are listed below.
1. General obligation to publish policy measures affecting trade
a. GATT Article X
GATT transparency disciplines, whose overarching tenets are found in GATT 1947 Article X, include the obligation to publish all regulations and subordinate measures, including judicial decisions, administrative guidelines and rulings of general application that affect trade in goods in a prompt manner so as to enable relevant parties to become acquainted with them. According to Article X:2, trade rules cannot be enforced before they have been officially published. Article X requires a party to 1) publish its trade-related laws, regulations, rulings and agreements promptly and in an accessible manner; 2) abstain from enforcing measures of general application before they are published; and 3) administer laws, regulations, rulings and agreements in a uniform, impartial and reasonable manner. Although the paramount objective of this article is transparency, it does not include specific notification obligations. Article X does, however, set out disciplines on the administration of the members’ regulatory framework, requiring uniformity, impartiality and reasonable administration, as well as the availability of an appeals or review mechanism. Besides the horizontal obligations set out in Article X, there are some measure-specific transparency rules, e.g. on quantitative restrictions (see below).
The Agreement on Trade Facilitation (WT/MIN(13)/36, WT/L/911, 7 December 2013) updates and strengthens the provisions of GATT 1947 Article X. These new disciplines require the prompt publication, in a non-discriminatory and easily accessible manner, of all import, export and transit procedures, the applicable duties and taxes, fees and charges, the norms on rules of origin, the

188 – 6. INCREASING THE TRANSPARENCY OF EXPORT RESTRICTIONS: BENEFITS, GOOD PRACTICES AND A PRACTICAL CHECKLIST
EXPORT RESTRICTIONS IN RAW MATERIALS TRADE: FACTS, FALLACIES AND BETTER PRACTICES © OECD 2014
import, export or transit restrictions or prohibitions, the penalties for breaches of import, export or transit formalities, the appeals procedures, the agreements reached with other countries relating to importation, exportation or transit, and the administrative procedures relating to the imposition of tariff quotas. Also, members are expected to make information available via the internet, in one of the official languages of the WTO, and to operate one or more enquiry points (EPs). The notification must identify the official place where the published information can be found, as well as of the website(s) of the EPs. Publication is expected to occur as early as possible prior to the entry into force of new or amended regulations. Traders and other interested parties should have opportunities, and a reasonable time period, to comment on such rule changes and the possibility to engage in regular consultations with border agencies, among other provisions.
The Uruguay Round Decision on Notification Procedures (1994) established the general framework in terms of notifications.
11 It established a Central Registry of Notifications (CRN) under the
responsibility of the WTO Secretariat, which cross-references its records by member and by obligation. CRN annually reminds members of their regular notification obligations for the following year and prompts them in case of noncompliance. CRN information is available upon request to any member entitled to receive the notification. An indicative list of measures subject to notification includes tariffs (including range and scope of bindings, GSP provisions, rates applied to members of free-trade areas/customs unions, other preferences), tariff rate quotas and surcharges, quantitative restrictions, including voluntary export restraints and orderly marketing arrangements affecting imports, other non-tariff measures such as licensing and mixing requirements, variable levies, rules of origin, technical barriers, safeguard actions, anti-dumping actions, countervailing actions, export taxes and subsidies, tax exemptions and concessionary export financing, export restrictions, including voluntary export restraints and orderly marketing arrangements, other government assistance, including subsidies, tax exemptions, and foreign exchange controls related to imports and exports.
2. Transparency provisions of specific WTO/GATT agreements
a. Quantitative restrictions (QRs)
While GATT 1947 Article XI rules out all prohibitions or restrictions on any imports or exports through quotas, import or export licences or other measures, it lists a number of exceptions, including those temporarily imposed to prevent or relieve critical shortages of foodstuffs or other essential products, those necessary to the application of standards or regulations for the classification, grading or marketing of commodities in international trade, and import restrictions on agricultural or fisheries products necessary to the enforcement of governmental measures under special circumstances.
The rules provide for QR notifications and reverse notifications.12
Implementation of the instructions issued in December 1995 by the WTO Council for Trade in Goods (WTO, G/L/59 of 10 January 1996) has generally been poor. One problem is that some members notify that they have no QRs, interpreting the obligation as relating only to WTO-inconsistent QRs, while other members have notified details of many existing QRs for transparency purposes, although these measures could be justified as exceptions under Articles XX (General exceptions) or XXI (Security exceptions) of GATT 1994. Similarly, the reverse notification procedure has rarely been used, suggesting an absence of interest among WTO members. Although information regarding notified QRs and reverse notifications is recorded in a WTO database and is available to WTO members, it could only be consulted upon request to the WTO. Thus, non-members and private parties could not access the information; the WTO Secretariat simply issued a list periodically of members having made a notification. This was in stark contrast to the Goods Schedules and most other notifications, which are openly available to the public through the WTO website.
When the Council for Trade in Goods revised the notification procedures for QRs in 2012 (WTO, G/L/59/Rev.1), it decided that availability of the overhauled database, which records notified QRs in force by 30 September 2012 and taken thereafter, should be extended to the public. Notifications have to be submitted in electronic form. If a notification lacks any of the information elements required, the Secretariat alerts the member, and developing and least-developed countries can request technical assistance in the preparation of their notifications.

6. INCREASING THE TRANSPARENCY OF EXPORT RESTRICTIONS: BENEFITS, GOOD PRACTICES AND A PRACTICAL CHECKLIST – 189
EXPORT RESTRICTIONS IN RAW MATERIALS TRADE: FACTS, FALLACIES AND BETTER PRACTICES © OECD 2014
The 2012 revisions generally seek to improve the reporting situation. Members are required to make complete notifications of all QRs in force at biennial intervals.
13 The information required since
the 2012 revisions includes a full description of the products and tariff lines, a precise indication of the type of restriction and the grounds for it, the WTO justification for it, a description of the national legal basis and entry into force and, where applicable, other information such as how a measure is administered and what modifications have been made to previously notified measures. The same information requirements apply to reverse notifications. Members shall also notify any changes made to QRs as soon as possible, but not later than six months after their inception. Notifications are circulated in a document series and automatically included in the agenda of the Committee on Market Access.
b. Export duties and price controls
Export duties and price controls are by and large not covered under the existing WTO notification obligations, with the exception of the Uruguay Round Ministerial Decision on Notification Procedures of 14 April 1994, which expressly mentions export taxes and restrictions as subject to notification. Both developed and developing countries use them to pursue economic and extra-economic objectives. According to WTO Trade Policy Review Mechanism (TPRM) data, export duties on agricultural products and raw materials are the most frequently used export restriction, and are predominantly imposed by small economies (Bonarriva et al., 2009). They are easy to administer and more certain in their operation than other restrictions (Devarajan et al., 1996). Governments can impose export price controls in the form of minimum export prices, often in conjunction with export duties. Sometimes minimum export prices are not binding but used as reference prices.
The issue of export taxes was raised by a proposal tabled in 2006 in the Non-Agricultural Market Access (NAMA) working group within the DDA negotiations, and subsequently amended. The draft text, which only received limited support among members, would have committed them to a process leading to the elimination of existing export taxes on non-agricultural products and to maintaining or introducing new export taxes only under specified circumstances, including the general and security exceptions of GATT Articles XX and XXI. As for transparency, export taxes would have to be recorded in members’ schedules of concessions, and be bound at a negotiated level. Any new export tax or increase thereof would have to be notified to the WTO Secretariat 60 days before entry into force. The notification format would include a description of the export taxes in question, the products involved, and the volume of trade likely to be affected. Other members would be able to request consultations and information on the reasons for the measure, its potential effects and on other matters of interest or concern. Also, a reasonable time between the adoption of the measure and its entry into force would have to be observed (WTO, 2008).
A number of regional trade agreements go beyond GATT/WTO provisions and include decisions to ban export taxes (Piermartini, 2004; Korinek and Bartos, 2012; and Chapter 4 of this volume).
d. Agricultural export restrictions
The WTO Agreement on Agriculture has been in force since 1995. Notification requirements are set out in Articles 12 and 18 of the Agreement. Members should notify the Committee on Agriculture before instituting a prohibition or restriction, and should consult with other members having a substantial interest as importers, providing them with necessary information. In addition, members should consult annually in the Committee on Agriculture as to their participation in the normal growth of world trade in agricultural products within the framework of the commitments on export subsidies. Members may make reverse notifications.
The notification requirements and formats have been developed in detail since 1995 (WTO, G/AG/2 and G/AG/2/Add.1). The Committee on Agriculture reports semi-annually on compliance with notification obligations. A comprehensive Handbook on Notification Requirements under the Agreement on Agriculture was published by the WTO Secretariat in May 2010.
14

190 – 6. INCREASING THE TRANSPARENCY OF EXPORT RESTRICTIONS: BENEFITS, GOOD PRACTICES AND A PRACTICAL CHECKLIST
EXPORT RESTRICTIONS IN RAW MATERIALS TRADE: FACTS, FALLACIES AND BETTER PRACTICES © OECD 2014
e. Pre-shipment inspection (PSI)
The WTO Agreement on Preshipment Inspection (PSI), in force since 1995, falls under the responsibility of the Committee on Customs Valuation. The Agreement covers all activities relating to verification of the quality, quantity, price, or customs classification of goods to be exported to a member. Both importers and exporters are required to publish all changes in their laws and regulations relating to PSI activities promptly, and no changes in the laws and regulations relating to pre-shipment inspection can be enforced until they have been officially published (Article 5). The Secretariat informs the members of the availability of this new information.
f. Import licensing
Import licensing is also subject to specific WTO disciplines since the Agreement on Import Licensing Procedures entered into force in 1995. It requires that import licensing be neutral in application and administered in a fair and equitable manner, and procedures kept as simple as possible. For example, governments have to publish sufficient information for traders to know how, and for what, licences are granted. It also describes how countries should notify the WTO when they introduce new import licensing procedures or change existing procedures. The agreement offers guidance on how governments should assess applications for licences.
Some licences are issued automatically. The Agreement sets criteria for automatic licensing so that the procedures do not restrict trade. Other licences are not issued automatically. Here, the Agreement tries to minimise the importers’ burden in applying for licences, so that the administrative work does not in itself restrict or distort imports. It stipulates that agencies handling licensing should not normally take more than 30 days to deal with an application.
Members must indicate where the rules and information concerning import-licensing procedures are published, submit copies of such publications, and notify the full texts of their relevant laws and regulations (Articles 1.4(a), 8.2(b)). They also have to notify the Committee within 60 days of publication of any laws or regulations pertaining to new or changed import licensing procedures, with specific information about the nature of the licensing procedures, its expected duration and the products affected, the contact point for information on eligibility, the administrative body to which applications are submitted, and so on. Members should also respond to the annual questionnaire on import licensing procedures (Article 7.3). The ad hoc WTO Committee on Import Licensing reports biennially on the implementation and operation of the Agreement and informs the WTO Council for Trade in Goods of developments during the period covered by the reviews.
A proposal on Enhanced Transparency on Export Licensing, tabled by a group of countries in the NAMA negotiations of the Doha Development round and revised to serve as a draft text for an Agreement on Increased Transparency on Export Restrictions merits mention here (see WTO, TN/MA/W/15/Add.4/Rev.1, 11 April 2008). The draft text defined export restrictions as “administrative procedures used for the operation of export restriction regimes requiring the submission of an application or other documentation (other than that required for customs purposes) to the relevant administrative body as a prior condition for exportation …”. The proposal, which its co-sponsors argued would better inform traders and facilitate trade but other members viewed as imposing a heavy administrative burden, sought to minimise harmful use of these administrative procedures through improved transparency. Members would have to notify existing export restriction procedures, and changes to existing measures within 60 days of the effective date of the new measure. This notification would contain information about the product(s) concerned, the procedures for submitting applications, the eligibility criteria and contact point for questions, the name of the authority for submission of application, the date and name of the publication where the procedures had been published, and any applicable exceptions or derogations from an export restriction requirement. The draft text also provided for a consultation process that other Members could use if a measure gave rise to concerns.

6. INCREASING THE TRANSPARENCY OF EXPORT RESTRICTIONS: BENEFITS, GOOD PRACTICES AND A PRACTICAL CHECKLIST – 191
EXPORT RESTRICTIONS IN RAW MATERIALS TRADE: FACTS, FALLACIES AND BETTER PRACTICES © OECD 2014
g. Import tariffs
All members file a schedule of tariff concessions when they join the WTO. The current schedules of each WTO member can be accessed on line.
15 The WTO website also allows for instant
analysis of members’ customs duty rates. One facility is Tariff Analysis Online, which draws on two databases (the Integrated Data Base, and the Consolidated Tariff Schedules) to offer tariff rates on products defined at a Harmonised System (HS) six-digit level (https://tariffanalysis.wto.org/). The other is the Tariff Download Facility, which provides standardised tariff statistics with the capacity to compare data between countries (http://tariffdata.wto.org/). The dissemination policy of the databases is the responsibility of the Committee on Market Access, since part of the information may be ‘provisional’, that is, not approved by the member and thus not available to the general public.
Members supply information each year on current market access conditions by 30 March (WTO,G/MA/IDB/1/Rev.1, 27 June 1997) and on the previous year’s imports by 30 September (WTO, G/MA/IDB/1/Rev.1/Add.1, 4 December 1997). Members know that when they provide this information to the Secretariat, it will eventually enter the public domain. In effect, the market access schedules they communicate to the Secretariat publicly announce their tariff rates.
h. TBT Agreement
The WTO Agreement on Technical Barriers to Trade is mentioned here because its transparency provisions deeply embed the principle in the policymaking process. In force since 1995, the agreement aims to prevent technical standards, testing and certification procedures from creating unnecessary obstacles to trade. Members introducing a technical regulation that may affect trade must justify it to any member on request. They should also publish a notice at an early stage to enable stakeholders in other member countries to become aware of it, notify members through the Secretariat of the products to be covered by it, provide information about it identifying deviations from international standards, and allow time for members to make comments in writing, discuss their comments, and take the comments and results of the discussions into account. All technical regulations adopted should be promptly published. The procedure applies to central and local governments as well as to conformity assessment procedures not in accordance with guides and recommendations issued by international standardizing bodies.
Members must designate a single central government authority responsible for the implementation of the notification procedures under the Agreement, and set up one or more enquiry points (EPs) to respond to enquiries on national or local technical regulations, standards and conformity assessment procedures, and on the member’s adherence to various other standardising bodies and conventions. Information about the location of EPs and their areas of competence is obligatory. Copies of the measures adopted should be made available at a fair and equitable price to both foreign and national stakeholders. Developed-country members should, upon request, provide translations in English, French or Spanish, of documents or summaries covered by a specific notification.
The Secretariat is responsible for disseminating the notifications it receives to all members and interested international standardising and conformity assessment bodies. To that end it administers the Technical Barriers to Trade Information Management System (TBT IMS, http://tbtims.wto.org), a public database that includes member notifications of technical regulations and conformity assessment procedures (including revisions, addenda, corrigenda, and supplements), notifications of bilateral or plurilateral agreements between members on TBT measures, notifications from standardising bodies in relation to the Code of Good Practice, contact information for members' TBT EPs and Notification Authorities, and information on specific trade concerns raised in the TBT Committee.
i. Decision on Reverse Notification of Non-Tariff measures
According to Decision G/L/60 of the WTO Council for Trade in Goods of 10 January 1996 on Reverse Notification of Non-Tariff Measures, members may notify specific non-tariff measures maintained by other members for the purpose of transparency insofar as such measures are neither

192 – 6. INCREASING THE TRANSPARENCY OF EXPORT RESTRICTIONS: BENEFITS, GOOD PRACTICES AND A PRACTICAL CHECKLIST
EXPORT RESTRICTIONS IN RAW MATERIALS TRADE: FACTS, FALLACIES AND BETTER PRACTICES © OECD 2014
subject to any existing WTO notification obligations nor to any other reverse notification possibilities under the WTO Agreement. All products are eligible for this form of cross-notification. A reverse notification should contain the following information: an indication of the precise nature of the measures, a full description of the products affected, a reference to the relevant WTO provisions and a statement on the trade effects of the measures. The member maintaining the measure is required to comment on each of the points contained in the notification. Hardly any reverse notification has ever been made.
16
j. WTO Accession protocols
WTO accession protocols include detailed requirements for notifications, along with instructions about to which WTO bodies such notifications must be made, within the context of the transitional accession protocol. Export restrictions must be notified to the Council for Trade in Goods. China, for example, has made extensive transparency commitments, including to enforce only those laws, regulations and other measures pertaining to trade in goods, services, TRIPS or the control of foreign exchange that it has published and made readily available to other WTO members, to establish an official journal dedicated to the publication of such regulations, to establish an EP where WTO members, businesses or individuals can obtain on request, and within a specified time period, information on the measures required to be published (WTO, Accession of the People’s Republic of China, WT/L/432, 23 November 2001). Similar WTO-plus export restriction limitations occur in the accession documents of the Ukraine and the Russian Federation, WTO members since 2008 and 2012 respectively (Karapinar, 2012).
The aim of trade policy reviews is to achieve greater transparency in, and understanding of, the trade policies and practices of WTO members. The process can provide useful information on specific trade policies, including export duties and measures affecting exports, which is not available through other WTO bodies. Export taxes are one such case. The review process is, however, infrequent – at intervals of two to four years for larger countries and more than six years for certain developing countries. It does not include notification obligations.
This chapter does not evaluate members’ notification performance except to note that there is no uniformity in performance, within agreements or across agreements. The record of notification varies across agreements. Developing countries’ difficulties in fully abiding by their notification obligations, due to lack of capacity and experience with the process, have been noted above. It has been suggested, inter alia in the Committee on Trade and Development, to give least developed countries (LDCs) more time, certain exemptions, and simplified procedures for notifications.
3. Transparency in Regional Trade Agreements (RTAs)
RTAs have progressively expanded transparency norms beyond those of the WTO, clearly recognising transparency procedures as public-good instruments. In some of these agreements, the flow of information is enhanced by adding detail to operational questions like what, how, when and for what information should be made available, who the recipients should be, and so on. Furthermore, by specifying certain parameters that operationalise these information flows, such as making regulations and other measures available on line and providing translations or summaries in English and other languages, RTAs institutionalise the modi operandi of transparency (Lejárraga, 2013; Lejárraga and Shepherd, 2013).
Most agreements have general provisions that call for the transparent administration of laws and regulations regarding all matters covered by the agreement. Where export restrictions are covered, these horizontal obligations apply to them as well. These provisions generally mirror Article X of GATT with the addition of notification provisions covering proposed or actual measures that might materially affect the operation of the agreement or otherwise substantially affect other parties’ interests under the agreement. There are also, and increasingly, best-endeavour commitments to hold public consultations (proposed laws and regulations should be published prior to their adoption and interested persons be given a reasonable opportunity to comment) (Moïsé, 2011).

6. INCREASING THE TRANSPARENCY OF EXPORT RESTRICTIONS: BENEFITS, GOOD PRACTICES AND A PRACTICAL CHECKLIST – 193
EXPORT RESTRICTIONS IN RAW MATERIALS TRADE: FACTS, FALLACIES AND BETTER PRACTICES © OECD 2014
Chapter 4 of this volume summarises recent OECD work examining 93 RTAs for provisions on export restrictions, finding that it is quite common for RTAs to impose disciplines on the use of some types of restrictions. Of the 93 agreements surveyed, only 18 do not address export restrictions at all. Export restrictions are a case where a substantial number of RTAs place conditions on their use. The terms are normally stricter than the rules of WTO/GATT. Some RTAs allow existing restrictions but do not allow new ones, or an increase in existing levels of export taxes. Some agreements require the parties to publish export charges on the internet and to inform RTA partners in advance of their application. In some RTAs, if a member wishes to impose an export restriction, other members must be consulted to determine whether conditions justify the use of such a measure.
As part of APEC’s trade policy dialogue on regional and free trade areas, and work on how best practice can improve their functioning, APEC trade ministers recently endorsed a Model Chapter on Transparency for RTAs/FTAs
17 derived from APEC members’ existing FTA Chapters, Article X of
GATT and Article III of GATS. This text, for voluntary use only, establishes WTO rules as the minimum standard for transparency provisions while adding certain standard elements that reflect the practices of APEC members. It aims to promote transparency and due process in policymaking, and to facilitate administration and information exchange among parties to an agreement.
The Model Chapter reaffirms the fundamental WTO obligations to notify and to publish promptly. Countries must not enforce a measure before its official publication, and ideally there should be a reasonable lapse of time between the date of publication and entry into force. Published information should include the purpose of and rationale for the adopted measure. Other agreements in which a country participates that are relevant to matters covered by the agreement to hand must also be published. Other principles of the Model Chapter relate to prior publication of draft measures and opportunities for stakeholders to comment.
The requirement to publish proposed and final measures can be satisfied by publication in an official journal intended for public circulation. Distribution through additional outlets, including an official website, is also encouraged. The Model Chapter also sets basic rules for countries to designate contact points and communicate them to the other parties to the agreement, and the contact points have to respond in a timely manner to requests for additional information on all matters covered by the agreement in question.
The extent to which these transparency provisions in RTAs are implemented by the parties is not known. Work by the OECD collecting information about export restrictions from government websites has not found that countries participating in one or more RTAs provide better information about export restrictions than those that do not. It should be noted that information provided by governments on their use of export measures rarely mentions how the measures taken relate to a country’s commitments or obligations under RTAs or the GATT/WTO regime.
Other transparency benchmarks and standards
OECD and APEC have undertaken important work leading to specific guidelines to help governments enhance the transparency of domestic regulatory frameworks.
The 2005 OECD Guiding Principles for Regulatory Quality and Performance (OECD, 2005) and the Recommendation of the OECD Council on Regulatory Policy and Governance of 2012 (OECD, 2012c) treat transparency as a fundamental principle of open government. Open government exposes policy proposals to public scrutiny as to their impacts and effectiveness. It helps keep officials accountable but also makes it easier to secure compliance by those who are affected by the final decision. Clearly, allowing for prior consultation, ensuring that regulations are drafted in plain language, are easily accessible on line and provide clear guidance on compliance promote more active engagement of relevant stakeholders in the regulation-making process.
The OECD Guiding Principles and Council Recommendation encourage OECD governments to articulate regulatory policy goals, strategies and benefits clearly, considering the impacts of regulation and regulatory processes on competitiveness and economic growth. Governments are encouraged to take into account relevant international regulatory settings and treaty obligations, and cooperate with other countries to promote good practices and innovations in regulatory policy and

194 – 6. INCREASING THE TRANSPARENCY OF EXPORT RESTRICTIONS: BENEFITS, GOOD PRACTICES AND A PRACTICAL CHECKLIST
EXPORT RESTRICTIONS IN RAW MATERIALS TRADE: FACTS, FALLACIES AND BETTER PRACTICES © OECD 2014
governance. These principles are derived from OECD country experiences with regulatory reform and observed public policy outcomes. This is work in progress. Governments are at different stages of incorporating regulatory quality into their domestic policymaking frameworks.
The desirability of integrating principles of good governance into trade and other public policies has also been recognised by APEC. One of the principles underpinning the broad action agenda for promoting free and open trade and investment in the Asia-Pacific region is that regulatory and administrative procedures affecting the flow of goods, services and capital among APEC member economies are transparent in all member economies. With APEC leaders agreeing in 2001 to implement a set of General Transparency Standards, the issue has received attention at the highest political level. These standards involve the following objectives: a) to publish or otherwise make available, for example by internet, all laws, regulations, and procedures and administrative rulings so as to enable interested persons and other economies to become acquainted with them, b) to regularly issue an official journal and publish any measures therein, making copies available to the public and promoting this practice also at regional and local level, c) to publish in advance any measure proposed, provide interested persons or another economy opportunity to comment, d) upon request, to endeavour to provide information and respond to questions about any actual or proposed measures promptly, e) when an administrative proceeding is initiated, to provide directly affected parties with reasonable notice and a description of the issue and policy context, allowing them a reasonable opportunity to present facts and arguments in support of their own positions prior to any final administrative action, and f) to establish appeals mechanisms for administrative decisions.
18
In 2003 and 2004, these General Standards were applied to specific trade policy areas, including market access, government procurement and customs procedures – but not to export policy or to export restrictions – and area-specific transparency standards were developed. Starting in 2005, the implementation of these standards by APEC countries has been the subject of self-assessment questionnaires and annual reports.
What can we learn?
Various milestones in the evolution of transparency standards since the 1940s are shown in Annex 6.A, starting with the disciplines contained in GATT 1947 Articles X, XI and XIII. Further developments with the GATT-WTO, and other international bodies, are acknowledged. With the proliferation of RTAs, more ambitious transparency standards are being introduced over and above the WTO disciplines (current and under negotiation) (Lejárraga, 2013,). A progressive, cumulative path towards greater transparency can be discerned.
Examples of growth points in this evolution are shown in Annex 6.A. A notable one is the advent of free access by the general public to complete legislative and regulatory databases via the internet, with increasingly user-friendly search facilities. Another one is the extension of transparency obligations to foreign stakeholders, so that they too are notified and given timely opportunity to comment on proposed new or changed policies that may affect them. Yet another is the obligation to make public the contact details of the authorities responsible for regulations and administrative procedures so that stakeholders can address their queries directly to them. A further one is the mandatory circulation of notified information in the three WTO official languages. These protocols are identified as “best practices” because they set new levels in transparency standards. However, some caveats apply. They should not be understood as “one-size-fits-all” prescriptions, as there is no single road to trade policy transparency. Rather, it is important to recognise that individual country transparency arrangements reflect their national values and culture, as well as their relative availability of resources.
A core objective of the transparency rules is to ensure that stakeholders and the general public are informed about policies that affect them directly or affect commitments made under international agreements. Table 6.1 compiles the best practices that address this objective. Again, the elements adopted as “best practice” constitute an incremental approach. They are a basis for comparing transparency practices at national level and across countries and will be taken into account in Section 6.5 when investigating actual practices of making information about export restrictions available.

6. INCREASING THE TRANSPARENCY OF EXPORT RESTRICTIONS: BENEFITS, GOOD PRACTICES AND A PRACTICAL CHECKLIST – 195
EXPORT RESTRICTIONS IN RAW MATERIALS TRADE: FACTS, FALLACIES AND BETTER PRACTICES © OECD 2014
Table 6.1. Best practices for making information available
Transparency feature
Content Source
Publication Laws, regulations, judicial decisions, administrative rulings of general application and international trade agreements.
GATT 1947, Article X
All import, export and transit procedures; the applicable duties and taxes, fees and charges; the norms on rules of origin; the import, export or transit restrictions or prohibitions; the penalties for breaches of import, export or transit formalities; the appeal procedures; the agreements celebrated with another country or countries relating to importation, exportation or transit; and the administrative procedures relating to the imposition of tariff quotas.
Agreement on Trade Facilitation, 2013
Information is to be published in a non-discriminatory and easily accessible manner in order to enable governments, traders and other interested parties to become acquainted with them.
Notification Measures subject to notification include quantitative restrictions, non-tariff measures, such as licensing and mixing requirements, export taxes and export restrictions.
WTO Decision on Notification Procedures, 1994
WTO members should notify the introduction of export taxes. Ministerial Decision on Procedures for the Facilitation of Solutions to Non-Tariff Barriers, 2008
Medium of publication
Proposed and final measures should be published in an official journal for public circulation, be it physical or online, encouraging their distribution through additional outlets, including an official website.
APEC Model Chapter on Transparency, 2012
A complete and up-to-date legislative and regulatory database should be freely available to the public in a searchable format through a user-friendly interface over the Internet.
OECD Recommendation, 2012
Time / form of publication
Promptly, to enable governments and traders to become acquainted with them.
GATT Article X, 1947
All information to be made available in English, Spanish and French. Publish new or amended laws and regulations as early as possible before entry into force and elicit comments from interested parties.
Technical Barriers to Trade, 1995 Agreement on Trade Facilitation, 2013
Enquiry points Establishment of one or more Enquiry Points to answer reasonable enquiries of governments, traders and other interested parties as well as to provide the required forms and documents.
Agreement on Trade Facilitation, 2013
Parties should notify each other details of contact points, including those that provide assistance to the other Party and its interested persons. Also they should notify each other promptly of any changes regarding how to reach the contact points.
APEC Model Chapter on Transparency, 2012

196 – 6. INCREASING THE TRANSPARENCY OF EXPORT RESTRICTIONS: BENEFITS, GOOD PRACTICES AND A PRACTICAL CHECKLIST
EXPORT RESTRICTIONS IN RAW MATERIALS TRADE: FACTS, FALLACIES AND BETTER PRACTICES © OECD 2014
Table 6.1. Best practices for making information available (continued)
Transparency feature
Content Source
Explanation and disclosure of the measure
Notifications of measures must contain an explanation of the measure’s intended purpose. Members introducing a technical regulation that may have a significant effect on international trade should explain to a requesting member the justification for its need.
Technical Barriers to Trade, 1995
Notifications should include, in the case of automatic import licensing procedures, their administrative purpose and, in the case of non-automatic import licensing procedures, indication of the measure being implemented through licensing. Governments should articulate regulatory policy goals, strategies and benefits clearly
Import Licensing, 1995 OECD Recommendation, 2012
6.5. National policies: Insights from the information collected for the OECD Inventory
This section reports on actual transparency practices. Based on the best practices identified in Table 6.1, a template of ‘best practice’ normative provisions was constructed to compare transparency practices at the national level and across countries. As the categories identified were too broad to operationalise for the purpose of the empirical study, the questions asked by selected WTO notifications were consulted, which give specificity to the standards of WTO agreements in respect to the provision of information.
Box 6.3 illustrates the scope and detail of the information sought by notifications. Some questions are standard items, others are tailored to learning about particular characteristics of the policies and measures to be reported. The template derived is shown in Table 6.2 in the format of a checklist.
The study uses information available on the government websites of 33 countries19
on three categories of export restriction used in the minerals sector in 2010: export taxes, export licensing requirements and quantitative export restrictions.
20
Most of the data come from the research undertaken for the OECD Inventory of Restrictions on Exports of Raw Materials. Official websites were searched for information about measures that restrict the export of industrial raw materials. The data offer a static snapshot of the information available in 2010-11. Extra data were collected subsequently to cover certain checklist items. Because of data constraints, the analysis concerns only two aspects of transparency, namely information availability and accessibility, and this only for export restrictions already in place. Measures that were still at the discussion or planning stage of the policymaking process, including questions related to prior consultation and public notice, could not be investigated.
A few caveats must be issued. Inevitably, judging whether website content meets the criteria of the checklist involves some subjectivity. Moreover, the search of websites may have overlooked some relevant information. While it is increasingly common practice for governments to make the text of trade-related laws, regulations and decrees available on line to the public, there are other, more traditional venues for doing so and the choice of channel depends on many factors, including information technology capacities. Finally, the group of countries included in this survey is small and excludes OECD members and other countries that in 2010-2011 appeared or were known not to restrict minerals exports. Thus, it would be inappropriate to generalise from the information policies of the countries studied about the quality of web-based information systems governments maintain in the field of trade policy.

6. INCREASING THE TRANSPARENCY OF EXPORT RESTRICTIONS: BENEFITS, GOOD PRACTICES AND A PRACTICAL CHECKLIST – 197
EXPORT RESTRICTIONS IN RAW MATERIALS TRADE: FACTS, FALLACIES AND BETTER PRACTICES © OECD 2014
Box 6.3. Content of notifications
While all notifications in WTO practice are set in a strict format, developed since the era of GATT, some agreements call for a more elaborate content. Some notifications are simple communications, like the responses to questionnaires about national legislation during accession negotiations, submitted to the corresponding working group for consultation. General and particular norms apply, depending on the nature of the measure.
In the case of quantitative restrictions, the notification should include full description of the products and tariff lines affected, their HS codes, a precise indication of the type of restriction used, a reference to and details about the domestic legal or administrative decision establishing the restriction, statements of the WTO justification for the measure, and a description of how the restriction is administered, including in the case of import quotas, information on the quantity of permissible imports and the degree of quota utilisation. An import tax notification must contain information on: the member notifying, title of the legal text establishing the tax, the date of entry into force and expiry; the products covered, their tariff headings, and the tax rate applied, and the source for additional information. In the case of import licensing the notification is more comprehensive and will contain information on the notifying member, the statute establishing the import licensing procedure; in case of changes to existing norms, the norms need to be identified, the products covered, together with their tariff headings and date of entry into force for each, identification of contact point for information on eligibility and publication of licensing procedures, whether the licensing procedure is automatic or not, and expected duration of the licensing procedure. In the case of the Agreement on TBT a typical notification of a technical regulation will contain information on: the notifying member (including local government, if applicable); the agency responsible, the agreement clauses that apply, the products covered, together with the tariff headings, identification of the measure (title, number of pages, language), the rationale for the measure, the documents relating to the measure, dates of adoption, entry into force and deadline for comments, if applicable, and where to find the text of the measure
Table 6.2. Information concerning export restrictions available on government websites
Checklist items
Countries meeting the
criterion Comments
Availability Information about policies and practices made public by government
Type of restriction is specified 33/33 At times, whether the export licensing requirement was ‘automatic’ or ‘non-automatic’ had to be inferred
If export tax, applicable rate is specified 17/19 19 of the 33 countries applied export taxes
If export quota, - quota is specified - allocation mechanism (eligibility criteria, procedure, etc.) is described
1/1 1/1
1 of the 33 countries used a quota
Products concerned are identified by name
29/33
HS product code is provided 8/33 Sometimes the HS code is mentioned for some products but not others, or for some type of restriction and not others
Date of entry into force of measure is specified
27/33 Sometimes not consistently for all types of restrictions reported
Duration of measure is specified 25/33

198 – 6. INCREASING THE TRANSPARENCY OF EXPORT RESTRICTIONS: BENEFITS, GOOD PRACTICES AND A PRACTICAL CHECKLIST
EXPORT RESTRICTIONS IN RAW MATERIALS TRADE: FACTS, FALLACIES AND BETTER PRACTICES © OECD 2014
Table 6.2. Information concerning export restrictions available on government websites (continued)
Checklist items
Countries meeting the
criterion Comments
Title of enabling law/regulation is specified
30/33
Rationale/purpose of measure is stated
13/33 Sometimes not consistently for all restrictions reported
Administrative procedures (eligibility criteria, document requirements, application procedures, etc.) relating to the measure are described (only for non-automatic export licensing, quota)
10/17 17 of the 33 countries required export licenses
Exemptions and derogations from the measure are specified
28/33
Authority in charge of administering the measure is identified
27/33
Accessibility Ease of finding and understanding the published information
Text of law/regulation is available on government website
25/33 This criterion is not met if only a summary of the law or regulation is provided.
Use of export restrictions is mentioned on government website
33/33
Information is available in language/s other than national
20/33
Enquiry point/contact details are provided
31/33
All information available is in one place / portal
8/33
The main authority publishing relevant information on its website is: - Trade /Industry Ministry - Mining / Natural Resources Ministry - Customs - Economy/Finance/Revenue Authority - Other
7 5 8
11 6
Where a government uses export taxes as well as export licensing, authorities are often not the same. The count therefore exceeds 33.
Availability of information
Although availability is a fundamental aspect of transparency, it must be emphasised that it is the content and overall quality that makes information valuable for users. All governments surveyed made some information available on their official websites. At a minimum, it was informally stated that exportation of a certain category of product was subject to export taxes, a quantitative restriction or permit. The vast majority of websites went further in the description of measures and products, often by referring to relevant official documents such as legal texts, decisions or formal announcements. These texts were usually accessible.

6. INCREASING THE TRANSPARENCY OF EXPORT RESTRICTIONS: BENEFITS, GOOD PRACTICES AND A PRACTICAL CHECKLIST – 199
EXPORT RESTRICTIONS IN RAW MATERIALS TRADE: FACTS, FALLACIES AND BETTER PRACTICES © OECD 2014
For countries applying more than one type of restriction, however, the different measures were not always reported with the same detail. Omission of reporting some measures could not be ruled out because when a specific measure was not used, this was not stated explicitly on the website.
References to products were, in a few cases, by broad categories only – for example, ‘all minerals’, ‘mineral ore’, ‘ferrous metals’ or ‘precious metals’. While in most cases products were mentioned by name, this was not always done consistently across different types of restriction. Clear identification of products is easier when codes of international product classification systems (notably HS) are used, but this was not common practice. It was difficult to determine, solely on the basis of the information available on line, whether a measure applied to a particular type of mineral or not.
There are some best practices for presenting consolidated detailed information about products and measures. They consist of listing goods under restrictions either as part of national tariff schedules or in the form of structured separate schedules, available on the internet. Besides listing products at the HS6 digit level or higher along with annotations specifying export taxes or other types of trade measures, these schedules can contain other useful information, for example about special requirements for particular products or about exemptions from application of the measure. Such schedules can be organised flexibly to report virtually any type of export measure. The actual schedules found on the websites of certain governments reported export taxes and export licensing requirements and situations where export was categorically prohibited (Box 6.4).
Such lists or schedules are useful only if they are actively managed and updated promptly when policy changes. In two instances the lists that were published on the websites were undated. It was therefore unclear when the list had been prepared and whether the information was still valid.
Box 6.4. Consolidated approaches of reporting export restrictions
The web portal (www.douanesguinee.gov.gn/tarif.htm) of the Customs authority of Guinea is a good example of initiatives to provide information about export and import duties in a single consolidated tariff schedule format for quick consultation. One can look up the rates of export and import tariffs as well as other types of taxes and monetary charges for any traded product, including minerals. The information is presented by HS chapters and the rates are shown at the four- and ten-digit level of product classification. The schedule showing the rates line by line is accompanied by detailed information on how products are classified. An explanation of the different types of taxes and fees is also provided. Finally, the taxes shown take into account Guinea’s membership of the West African Economic and Monetary Union (UEMOA), with identification of UEMOA external tariffs, where applicable. The information is provided only in French and how often the schedules are updated is not indicated. The portal of Customs furthermore refers to and provides the texts of laws, decisions and instructions relating to the measures shown in the tariff schedule. Under “documentation”, visitors can access the customs-related provisions of the Mining Code of Guinea.
A tariff schedule showing export tariffs can be consulted on a webpage maintained by Viet Nam’s Ministry of Finance (www.mof.gov.vn/portal/page/portal/mof_en/ld) and giving access to legal documents through a search engine. The schedule, issued together with the Finance Minister’s Decision No. 45/2002/QD-BTC of 10 April 2002, lists commodity groups and items by name and up to HS eight digits and provides the tax rate. This is not a searchable database, and only those items that are subject to an export tariff are shown. The Decision and the schedule itself are available in English. The website offers a search engine in English that, upon specifying ‘export tariffs’ as part of the document content, locates circulars (in English) on export tariff amendments and other export-tariff related information issued by the Ministry since 2002.
South Africa’s International Trade Administration Commission (ITAC), in charge of administering the International Trade Administration Act (Act 71 of 2003), maintains on its website (www.itac.org.za) a portal dedicated to ‘services’, through which one can access the text of applicable regulation, guidelines, answers to ‘frequently asked questions’ and contact details for export controls. An informal statement explains the legal and regulatory framework for export controls. The list of specific goods, identified by HS4, 6 or 8 tariff headings, which require export or import permits, along with the name, for different kinds of products concerned, of other agencies involved in the application processing process is also given. ITAC’s services do not include a facility allowing exporters to submit on-line applications for permits.
Although the vast majority of websites publish at least one major document, notably the enabling law, in many cases this was not enough to understand the measure. Important details were often missing, even when measures and products involved were well described. Although the date of

200 – 6. INCREASING THE TRANSPARENCY OF EXPORT RESTRICTIONS: BENEFITS, GOOD PRACTICES AND A PRACTICAL CHECKLIST
EXPORT RESTRICTIONS IN RAW MATERIALS TRADE: FACTS, FALLACIES AND BETTER PRACTICES © OECD 2014
introduction of the measure was almost always stated somewhere, clarity over whether the measure was temporary or of open-ended duration was less consistent. The most striking aspect was the low frequency of explanation regarding the objectives and rationale of the measure.
Information on the implementation of a measure, including the administrative steps a potential exporter has to take in order for his product to be able to enter a given jurisdiction, is an important aspect of high-level policy transparency – less so for the payment of export taxes, which are usually collected at customs points in a straightforward way, but crucial for meeting regulatory requirements like licensing and export quotas. The search therefore included any legal or subordinate texts or informal information explaining these administrative measures and what the procedures for applications are. As can be seen from the record in the table, such information was quite often not found for export licensing requirements. Even the specific nature of the licensing regime (automatic or non-automatic) was sometimes unclear. Very seldom did governments explain on their websites how long it normally takes to process applications for a license.
By contrast, there was strong consistency across websites, and for all measures reported, in naming the authority responsible for the measure’s implementation and administration.
Accessibility of information
Official government gazettes were available in searchable form for some countries; in others, individual announcements published in a gazette could be downloaded from websites. A recurring problem was that recent issues of the gazette could not be located on the internet. Making the law enabling the measure available is common practice. However, export restrictions were often not mandated by the legislature; rather, the actual decisions to apply these measures are delegated to high-level officials of the executive branch, who make them public on a case-by-case basis. The texts of these decisions were less consistently accessible.
Information uncertainty arose in situations where laws were old, amendments could not be tracked and no further explanation was offered. The text that was available may not have been the most recent version. This made it hard to determine what the situation was at the time of visiting the website.
Some agencies published guidance documents on their websites intended for businesses interested in import and export. This material usually provided an overview of the policy and mentioned the main regulatory mechanisms used, but usually not in detail. Thus, if export restrictions were mentioned at all, they were not explained in detail, since typically the thrust of the communication was aimed at promoting a country’s exports. Some basic information, such as policy statements and announcements, were usually available in at least one language other than the national language, notably English. It was less frequent to find official translations of the full texts of laws and regulations into a foreign language. Enquiry or contact points function as a useful complement to direct information provision. On websites where major information is provided, one finds typically contact details for further questions.
Trade ministries invariably play a role in disseminating information about national trade policy. However, when the subject is export restrictions on minerals, they are not necessarily the only, or even the leading, provider of information about these measures, as Table 6.2 shows. The regulation of mining and mineral resources usually falls under the responsibility of specialised ministries, which publish documents related to the regulatory framework on their own websites. It is here that one often finds the major documents related to export restrictions. Customs would seem a logical source for product-specific information about border-based export restrictions. Indeed, in some countries, customs agencies make comprehensive information available on export taxes, licensing requirements and bans. However, this is not always the case. For many countries, information about export restrictions is in fact scattered through the websites of several ministries or government agencies.
Various multilateral and regional trade agreements require governments to notify certain details about their trade policies, including any relating to the use of export restrictions. In no country did the trade ministry make its country’s notifications, including any on export restrictions, publicly

6. INCREASING THE TRANSPARENCY OF EXPORT RESTRICTIONS: BENEFITS, GOOD PRACTICES AND A PRACTICAL CHECKLIST – 201
EXPORT RESTRICTIONS IN RAW MATERIALS TRADE: FACTS, FALLACIES AND BETTER PRACTICES © OECD 2014
available on its national website. Nor did the national websites offer links to the electronic data portals for notifications and similar trade policy information that WTO and other supra-national trade fora maintain and offer for public consultation. In rare instances, government websites referenced and provided direct access to the WTO Trade Policy Review of the country.
Our survey of official websites also provides evidence on the issue of accessibility (how easily information can be found and understood). Of the 33 countries surveyed, two provided information about export restrictions satisfying all the checklist criteria, and several others came close. There is thus significant room for improving existing information accessibility relating to export restriction.
Use of dedicated sites or searchable databases that permit the relevant legal texts and other information required for the identification of a specific measure and the products affected to be consulted in a single place helps to deliver information comprehensively and efficiently. One-stop information hubs can be designed to promote both aspects of transparency, availability and accessibility, for all trade measures, including export restrictions. This is illustrated by the system used by Royal Malaysian Customs, described in Box 6.5. Such advanced information systems set a precedent but are not common practice. Other, less sophisticated approaches exist, as was illustrated in Box 6.4.
Improving existing information policies with respect to export restrictions is a challenge, but one that is more manageable compared to that of overhauling rulemaking systems, which requires more time. Information policies can be strengthened at reasonable time and resource cost because most governments already have more or less elaborate communication systems in place for keeping stakeholders and the public informed about trade policy matters.
Box 6.5. One-stop information platforms making detailed information easy to find
A searchable automated information system, the Official Customs HS-Explorer, (http://tariff.customs.gov.my/) has been developed by Royal Malaysian Customs, through which anyone can retrieve the texts of official documents (laws, regulations, administrative orders) defining Malaysia’s import and export policy as well as detailed information about specific measures. The search can be conducted by entering queries flexibly in the form of text or product codes. Entry of a word, for example ‘iron’, will generate for all products containing the term in their description the following information: import tariff rate, export tariff rate, rates of sales and excise taxes. Information on whether import and export prohibitions apply is also provided in the same output table. Products are described and presented using the HS product classification system. If a product is subject to a specific import or export measure, one can simultaneously obtain the title of the related act or order and the name of the agency in charge of the measure. But this is not all. Not only does this searchable data system provide a user-friendly way to find out about trade measures in force in Malaysia today and going back to 2005; one can also look up the tariff rates that Malaysia applies to imports (but not exports) from the partner countries of each of the regional trade agreements (RTAs) to which it is a party. In the case of RTAs, the output table even reports reductions in import tariffs that are scheduled to occur in future years. The search results from queries can be exported in Excel format. The site is in English, users can if they wish send instant electronic inquiries/feedback/suggestions to the information service desk, and customs contact names and telephone numbers are provided.
6.6. Checklist of good practice in transparency of export restrictions
The checklist developed in the previous section has a narrow focus. It was designed to take stock of the information available on the official websites of 33 governments that already apply export taxes, licensing requirements or quantitative restrictions in the minerals sector. Whether, and how much, information on these measures could be found was taken as an indication of how transparent governments are in this policy area. This exercise confirmed what was found by the OECD’s inventory of restrictions on exports of raw materials revealed: provision of information is very uneven across countries; what is published is often unclear about details and not up-to-date.
In this section, the research is expanded to incorporate additional good-practice elements in a final version of the checklist so that stakeholder information needs are satisfied at all stages of preparing, introducing and implementing export restrictions.

202 – 6. INCREASING THE TRANSPARENCY OF EXPORT RESTRICTIONS: BENEFITS, GOOD PRACTICES AND A PRACTICAL CHECKLIST
EXPORT RESTRICTIONS IN RAW MATERIALS TRADE: FACTS, FALLACIES AND BETTER PRACTICES © OECD 2014
Identifying other elements for inclusion in the final checklist
Full trade measure transparency requires national information policies to track these measures from development to application. The important first step of informing stakeholders is the publication of measures in advance of their enforcement. The next step, making information available when measures are still under consideration and not yet adopted, acquaints market participants with the state of play, helping them make better-informed decisions about the near future. Finally, the transparency of export restrictions is further improved if, once a measure is announced, information about the administrative procedures whereby it is being implemented is made publicly available.
The research proceeded by identifying additional items for inclusion in the list based on a review of relevant transparency norms and practices found in WTO and regional trade agreements and non-binding good-governance guidelines. This work was supplemented by a small business survey that the OECD Secretariat conducted jointly with the Business and Industry Advisory Committee to the OECD (BIAC) to get feedback on the content of the checklist. Firms directly or indirectly involved in trade were asked to review a list of questionnaire items (shown in Annex 6.B) and mark those items that in their view ought to be included in a checklist defining good information practice. Respondents were free to comment and add other information items they considered important.
21 The questionnaire along with the survey responses is reproduced in Annex 6.B.
The final version of the checklist is shown in Box 6.6. Key features of the list are the following:
The checklist sets out five general principles that cover all the important dimensions of transparency. Two of the principles specifically address the issue of information requirements with respect to draft and final measures, which the checklist subsequently develops in greater detail. The principles also take account of the transparency-enhancing role of public consultation and opportunities for stakeholder comments at the planning stage.
The information requirements listed differentiate between two stages of the policy process: when a measure is under development but not yet adopted, and after the measure is adopted. The items listed for each stage are not identical, reflecting the fact that transparency needs differ between the two stages and that they place different demands on government information policies.
Finally, as transparency is ultimately a function of the ways and means through which a government applies trade policy, the list incorporates standards relevant to the administration of export restrictions.
As designed, the checklist applies to all types of export restrictions; whether measure-specific items could be developed has not been considered. Also, the list is concerned with information policy at the national level and is proposed without prejudice to formal notification requirements that governments may have vis-à-vis other governments or other parties under various trade treaties with respect to specific measures restricting exports.
Box 6.6. Final Checklist of Good Transparency Practice for Export Restrictions
A. General principles of transparency
Provide and publish information about the final measure, including the texts of final laws, regulations, administrative rulings, decisions and policy statements of general application to export restrictions, a reasonable time ahead of entry into force. (This does not apply to emergency situations).
For draft measures, provide and publish information, and consult as appropriate with all interested parties* during the process of developing the measure and take their comments into account.
Administer the measure in a consistent, impartial and reasonable manner.
Make operational specific procedures for independent review and appeal of decisions.
Make information widely accessible and easy to find, by:

6. INCREASING THE TRANSPARENCY OF EXPORT RESTRICTIONS: BENEFITS, GOOD PRACTICES AND A PRACTICAL CHECKLIST – 203
EXPORT RESTRICTIONS IN RAW MATERIALS TRADE: FACTS, FALLACIES AND BETTER PRACTICES © OECD 2014
Publishing it on the internet.
Publishing draft and final measures in full text.
Providing information about the draft and final measure in at least one of the following languages: English, French and Spanish (the official languages of the WTO).
Operating enquiry point(s) that can be accessed by any interested party, national or foreign.
Considering use of central electronic sites or portals.
B. Information requirements
1. When a measure is under development and before it is adopted
When considering a new measure or modification of an existing measure, and before making a final decision, provide the following items of information:
The type of measure being considered.
Why the measure is being considered (objective, rationale).
What products are targeted (including HS information).
How the decision will be made, and the participating authority(ies).
Whether consultations with stakeholders are envisaged or have taken place, and with whom.
Date or timetable for adoption of the measure.
Draft text(s) of the measure.
Contact information for Enquiry Point through which any interested party* can obtain further information; about the proposed measure and the policy process.
2. After the measure is adopted
When a new or modified measure is adopted, and at the latest at the time when the measure enters into force, provide the following items of information:
The type of measure.
If applicable, the quantitative parameters of the measure (e.g. if an export tax, the rate of the tax; if an export quota, the amount of the quota).
Name of the product(s) to which the measure applies.
Harmonised System (HS) code(s) of the product(s).
Date of entry into force.
How long the measure will be in force.
The text of the final measure and information where it can be obtained (title, publication name and date).
The rationale or objective of the measure.
If the measure has been revised or amended, the reason for the revision/amendment.
Where applicable, information specifying exemptions from or derogations of the measure (e.g. when specific trading partners or entities are exempted).
Administrative rules and procedures used in the application of the measure, including:
Applicable procedures, decisions and rulings for applying the measure (e.g. the criteria and method employed in allocating quotas, or granting licenses, permits or other authorisations).
Application procedures and document requirements, appeals procedures.
Contact information for authority in charge of administration.
Contact information for Enquiry Point through which any interested party* can obtain further information about the measure and its application.
____________________________________
* Refers to domestic and foreign governments and private persons.

204 – 6. INCREASING THE TRANSPARENCY OF EXPORT RESTRICTIONS: BENEFITS, GOOD PRACTICES AND A PRACTICAL CHECKLIST
EXPORT RESTRICTIONS IN RAW MATERIALS TRADE: FACTS, FALLACIES AND BETTER PRACTICES © OECD 2014
Public access to information and specific information requirements
A core objective of transparency provisions in trade agreements and in guidelines for improving the performance of national regulatory systems and governance is to ensure that stakeholders and the public are informed about policies that materially affect them, or affect commitments made under international treaties. It is useful here to distinguish between the need of a stakeholder to access information that is available, and the scope and content of that information.
Accessibility of information
Accessibility of information implies publishing or otherwise making information publicly available. At issue is the ease with which interested individuals can learn about trade policy and understand the information. Transparency rules elaborated by multilateral and regional trade agreements, along with good governance guidelines commonly emphasize that information should be obtainable easily, at no or minimal additional cost, and in a timely and non-discriminatory manner to all stakeholders, domestic and foreign alike.
The survey asked business representatives for their opinion about practices and tools mentioned on the list. As can be seen from Section B of the questionnaire in Annex 6.B, all these items were confirmed by a majority of respondents and are retained as tools that facilitate stakeholder access to information. The checklist can be applied to information policy regardless of the medium used but identifies making information available through the internet as the preferred option.
Information published on the internet has the advantage of universal availability to all stakeholders regardless of their geographic location; it is a powerful tool against discrimination. Hence, use of this channel is fast becoming the ‘best publication practice.’ In the WTO, the TBT, SPS and Trade Facilitation Agreements stand out for promoting this practice, which is also advocated by the OECD Recommendation on Regulatory Policy and Governance (OECD, 2012c) and the APEC General Transparency Standards (APEC, 2012). Many new-generation RTAs also contain general or measure-specific internet-based publication obligations, including some for measures that affect exports. For example, RTAs between Canada and Peru, Chinese Taipei and Nicaragua, China and Chile, China and New Zealand, China and Peru, and China and Pakistan all include a clause committing the parties to post a list of administrative fees and charges incurred in connection with exporting on the internet (Korinek and Bartos, 2012). The use of electronic channels for communication was mentioned by some of the survey respondents as well.
Effective information policies also make use of enquiry points. Learning what trade measures are actually in force at any time requires access to up-to-date information. Moreover, trade policy often involves several government agencies and many countries do not have a single authority from which market operators can obtain all the rules and procedures that apply to their activity and products. To facilitate access to information, most WTO agreements require members to operate enquiry or contact points. These are increasingly being made available for use not only by governments but also other stakeholders (see the WTO, 2013, and recently concluded RTAs). The checklist registers this emerging good practice of wider access to contact points.
Survey respondents concurred that enquiry points to which questions about export restrictions in operation or under development could be addressed are important. Rapidly changing information technology provides several ways in which enquiry points can carry out their functions. One respondent suggested operating these contact points via electronic means (e-mail, chat, etc.).
Although not all survey respondents saw merit in arrangements that centralise the dissemination of information through dedicated portals or sites, this item has been retained on the checklist as a practice for governments to consider. The review in Section 6.5 of transparency policies of governments using mineral export restrictions showed that when information was available in some consolidated form on a site or portal (found at different levels of sophistication, e.g. in Malaysia, South Africa and Viet Nam), the time spent on collecting and collating information was significantly reduced.

6. INCREASING THE TRANSPARENCY OF EXPORT RESTRICTIONS: BENEFITS, GOOD PRACTICES AND A PRACTICAL CHECKLIST – 205
EXPORT RESTRICTIONS IN RAW MATERIALS TRADE: FACTS, FALLACIES AND BETTER PRACTICES © OECD 2014
Information requirements with respect to final measures
The checklist given in Section 6.5 specified the type of information that governments ought to make publicly available on export restrictions already in force. These items correspond to Section A of the questionnaire and were strongly and almost always unanimously endorsed by the survey respondents. Consequently, the final checklist retains them all as the reference list of information requirements once export restrictions have been adopted. The information pertains to the following:
The type of measure.
If applicable, the value of the measure (e.g. if export tax, the rate of the tax; if export quota, the amount of the quota).
Name of the product(s) to which the measure applies.
Harmonised System (HS) code(s) of the product(s).
Date of entry into force.
Duration of the measure in force.
Where the text of the final measure can be obtained (title, publication name and date).
The rationale or declared objective of the measure.
If the measure has been revised or amended, the reason/s for the revision/amendment.
Where applicable, information specifying exemptions from or derogations of the measure (e.g. when specific trading partners or entities are exempted).
The administrative rules and procedures by which the measure is being applied.
Contact information for enquiry point through which any interested party can inquire about the measure and its application.
Regarding timing, transparency is enhanced and the business environment is more predictable when information about a change of policy is available well in advance of its implementation. Last-minute disclosure of entry into force of a new policy makes stakeholders scramble to adjust to the changing situation, which can destabilise markets as well as trading and investment relationships.
All WTO agreements require governments to disclose their policies and practices publicly within the country and/or by notifying the WTO. The rules of specific agreements are modelled after the broad GATT disciplines, mainly found in Article X (Section 6.4 and Box 6.7).
Box 6.7 provides illustrations of relevant provisions found in trade agreements, which underline the importance of governments publicising new or changed trade measures in advance of their introduction. This is just a selection of the many agreements with such provisions. The standard is expressed in different formulations that usually do not specify timeframes. Exceptions exist but appear to be rare. The ASEAN Trade in Goods Agreement (2009) mandates a minimum of 60 days of prior publication. Under the WTO TBT and SPS Agreements, members must allow a “reasonable” interval between the publication of technical regulations and their entry into force; in this case, WTO members took the clarifying decision that “reasonable interval” shall normally mean a period of not less than six months (WTO, 2001b). Regulatory changes can require major changes in production methods and product, which take time to implement; hence it is important that market operators, and especially foreign suppliers less familiar with a market, are able to prepare well in advance.
The principle of prior publication was endorsed by the business survey respondents. In the checklist this is reflected in the first general principle (Part A). Respondents were invited to suggest a time period and most often mentioned 60 to 90 days. Keeping in mind that export restrictions are not a homogeneous group of trade measures and that the transparency provisions reviewed show a preference for non-specificity, the principle as stated by the checklist keeps with this standard and for

206 – 6. INCREASING THE TRANSPARENCY OF EXPORT RESTRICTIONS: BENEFITS, GOOD PRACTICES AND A PRACTICAL CHECKLIST
EXPORT RESTRICTIONS IN RAW MATERIALS TRADE: FACTS, FALLACIES AND BETTER PRACTICES © OECD 2014
adopted measures refers to “a reasonable time prior to their entry into force” in non-emergency situations.
Timely publication of information can be augmented further by other channels of pro-active government communication with interested stakeholders, like advance notification or alert services or newsletter mailings to which anyone interested can subscribe (also mentioned by survey participants).
Prior publication involves publishing the text of the measure but may also include other material, which is particularly useful when the text itself does not state the information that matters to exporters or importers (such as a precise description of the products that are affected by an export restriction).
Box 6.7. Norms related to prior publication / note for final measures
GATT 1994: Article X:1 – ‘Laws, regulations, judicial decisions and administrative rulings of general application, made effective by any contracting party, pertaining to the classification or the valuation of products for customs purposes, or to rates of duty, taxes or other charges, or to requirements, restrictions or prohibitions on imports or exports or on the transfer of payments therefor, or affecting their sale, distribution, transportation, insurance, warehousing inspection, exhibition, processing, mixing or other use, shall be published promptly in such a manner as to enable governments and traders to become acquainted with them.’
Agreement on Import licensing procedures (1995): Article 1.4 – ‘The rules and all information concerning procedures for the submission of applications…shall be published… in such a manner as to enable governments and traders to become acquainted with them. Such publication shall take place, whenever practicable; 21 days prior to the effective date of the requirement but in all events not later than such effective date. Any exception, derogations or changes in or from the rules concerning licensing procedures or the list of products subject to import licensing shall also be published in the same manner and within the same time periods as specified above.’
Agreement on Technical Barriers to Trade (1995): Article 2.11-12 – ’Members shall ensure that all technical regulations which have been adopted are published promptly or otherwise made available in such a manner as to enable interested parties in other Members to become acquainted with them…Except in …urgent circumstances…, Members shall allow a reasonable interval between the publication of technical regulations and their entry into force in order to allow time for producers in exporting Members, and particularly in developing country Members, to adapt their products or methods of production to the requirements of the importing Member.’
US-Australia FTA (2004): To the extent possible, each Party shall provide notice of the requirements of final regulations prior to their effective date.
Colombia - United States Trade Promotion Agreement (2006): Article 2.9 – Import Licensing: ‘Promptly after entry into force of this Agreement, each Party shall notify the other Parties of any existing import licensing procedures, and thereafter shall notify the other Parties of any new import licensing procedure and any modification to its existing import licensing procedures, within 60 days before it takes effect. …No Party may apply an import licensing procedure to a good of another Party unless it has provided notification …’
ASEAN Trade in Goods Agreement (2009): Article 75 – ‘Except in urgent circumstances, Member States shall allow at least six (6) months between the publication of technical regulations and their entry into force in order to provide sufficient time for producers in exporting Member States to adapt their products or methods of production to the requirements of importing countries.’
New Zealand – Malaysia (2009), Horizontal Chapter 14 on Transparency: …’Each Party shall ensure that its laws, regulations, procedures, and administrative rulings of general application with respect to any matter covered by this Agreement are promptly published or otherwise made available in such a manner as to enable interested persons of the other Party to become acquainted with them.’
APEC Model Chapter on Transparency for RTAs/FTAs (2012): Article 2.2 – ‘To the extent practicable, a Party shall provide a reasonable period of time between the date of publication of a measure of general application and its entry into force. Except in emergency situations, a Party shall not enforce a measure of general application before such measure has been officially published. This paragraph does not require a Party to ensure the prior publication of judicial decisions of general application if that is contrary to the domestic laws and procedures of that Party.’
Source: Based on a review of the texts of the agreements and guidelines found on the internet.

6. INCREASING THE TRANSPARENCY OF EXPORT RESTRICTIONS: BENEFITS, GOOD PRACTICES AND A PRACTICAL CHECKLIST – 207
EXPORT RESTRICTIONS IN RAW MATERIALS TRADE: FACTS, FALLACIES AND BETTER PRACTICES © OECD 2014
Transparency of measures under preparation
Transparency becomes an issue well before an export restriction enters into force. This is made plain by the WTO glossary’s definition of transparency as the ‘degree to which trade policies and practices, and the process by which they are established, are open and predictable’.
22 This
means that our checklist should also identify standards and rules that can meet stakeholders’ information needs at the planning stage of trade policymaking.
Two transparency issues arise when a policy or measure is being considered:
What information is publicly available about policy proposals and measures under preparation.
How open the process of developing a policy or measure is to participation by stakeholders.
The checklist develops the first issue in detail while simply acknowledging the importance of the second.
Information requirements at the planning stage
Trade agreements with strong transparency disciplines require governments to publish or notify information about a measure when it is still under consideration. A sample of these provisions is shown in Box 6.8. The business survey strongly endorsed the principle that information about measures that restrict exports ought to be available before such measures are decided.
Along with the text of a draft measure, what specific information ought to be made available when export restrictions are still on the drawing board? The business survey sought reactions to a short but amendable list of items shown in Section D of the questionnaire, covering the type of measure being considered, why the measure is being considered (declared objective, rationale), what products are targeted, the authority(ies) deciding the measure, the draft text of the measure, the date or timetable for final decision, and the enquiry or contact point
Box 6.8. Publication requirements covering draft measures
The APEC General Transparency Standards (2002) – That recommend that governments when possible publish in advance any measure proposed and give governments or other interested persons opportunity to comment.
CARICOM – Costa Rica Free Trade Agreement (2004), Article XII – As far as practicable, each of the Parties shall publish and notify the other Party of any measure (such as laws, regulations, judicial decisions, procedures and administrative regulations of general application which are related to the provisions of this Agreement) that it proposes to adopt, and shall provide the interested Party with a reasonable opportunity for making observations on the proposed measures.
ASEAN Trade in Goods Agreement (2009) – It requires Member States to notify planned measures and for the notification to provide information about the measure, the reasons for undertaking the measure, and the intended date of implementation and the duration of the measure.
New Zealand-Malaysia Free Trade Agreement, Horizontal (2009), Chapter 14 on Transparency: “... To the extent possible, each Party shall …publish in advance any measure…that it proposes to adopt; and … provide, where appropriate, interested persons and the other Party with a reasonable opportunity to comment on such proposed measures.”
APEC Model Chapter on Transparency for RTAs/FTAs (2012) – It encourages members on a best endeavour basis to publish timely proposed measures prior to their adoption and provide a reasonable period of time, defined as normally taking no less than 30 days for comments by other government or stakeholders.
Recommendation of the Council of the OECD on Regulatory Policy and Governance (2012) – When reviewing existing and developing new regulations, governments should “... [make] available to the public, as far as possible, all relevant material from regulatory dossiers including the supporting analysis, and the reasons for regulatory decisions as well as all relevant data; …”
Source: Based on a review of the texts of the agreements and guidelines found on the Internet

208 – 6. INCREASING THE TRANSPARENCY OF EXPORT RESTRICTIONS: BENEFITS, GOOD PRACTICES AND A PRACTICAL CHECKLIST
EXPORT RESTRICTIONS IN RAW MATERIALS TRADE: FACTS, FALLACIES AND BETTER PRACTICES © OECD 2014
Notification requirements in WTO and bilateral trade agreements typically expect members to make this information available to other members. Some items are explicitly required to be published, hence making not only governments but also other stakeholders and the general public aware of policies at the development stage. Once interested stakeholders are aware of a measure being developed, they can usually request further information as the initiative moves forward.
23 In this
regard, the role of enquiry points, which have long served the information needs and criteria of government authorities, is redefined in favour of open access and customer satisfaction. Moreover, to open up enquiry points to all interested parties, not just government authorities, is one of the ways in which recent RTAs seek to make trade policies more transparent (Lejárraga, 2013).
The items in section D of the questionnaire do not cover the content of notifications exhaustively; it should be noted that there are more ambitious levels of information disclosure (see, for example, Box 6.3). All or almost all participants of the business survey endorsed each of the items proposed. Survey participants were free to flag additional items and some offered comments on individual items. One survey respondent wanted governments to disclose whether stakeholders have been consulted. Comments calling for the checklist to take the decision process better into account were also received from OECD members during the framing of the checklist. Following the business survey, the checklist was amended concerning transparency in the decision-making process. The final version recognises the role of the policy process for transparent trade policies. This issue is discussed in the next section.
Transparency and public consultation
“An open and predictable process by which policies and practices are established” (WTO Glossary) is generally understood to mean having mechanisms in place that allow the public to scrutinise and participate in policymaking. Good practice here consists of policymakers engaging in some form of stakeholder or public consultation as they consider new policy or review existing policy (prior consultation).
Prior consultation provides a channel through which those who are engaged can obtain valuable information about draft proposals and how they will be affected, and through which they express their opinions and provide comments. Governments themselves benefit if this brings them useful information about the costs, benefits and practical implementation issues of proposed new or modified measures (including their impact on trade) and what other approaches to achieving the policy objectives might be available. Prior consultation also enhances the perceived legitimacy of government authorities and may nurture compliance with the policy once adopted (Iida and Nielson, 2001). Public consultation is a core element of good governance on which the OECD Council Recommendations on Regulatory Policy and Governance (2012) include detailed guidance. In international trade agreements, consultation is usually addressed through ‘prior notice and comment’ requirements for trade measures at the draft stage. Among WTO agreements, the TBT, SPS and GATS agreements apply prior notice and comments procedures, on which recent RTAs have expanded.
Prior consultation norms are evolving towards more inclusive stakeholder participation. Although most WTO agreements reserve consultation for governments, a few agreements (GATS, TBT, Antidumping Agreement, Agreement on Safeguards) have provisions giving private participatory rights and opportunities at national level. Such provisions are especially frequent in recently concluded RTAs, notably those involving OECD countries, which let private-sector stakeholders or the general public comment on draft measures, thus mainstreaming wide participation. Some RTAs also are applying these mechanisms horizontally across all sectors and measures covered by an agreement (Lejárraga, 2013) (see Box 6.9 for examples).
The final version of the checklist reflects the evolving norms in this area by referring to stakeholder consultation as a general principle for governments to adopt. The wording “all interested parties” in the statement reflects the understanding that the process should be open to governments and private persons, domestic and foreign, alike. In addition, the information

6. INCREASING THE TRANSPARENCY OF EXPORT RESTRICTIONS: BENEFITS, GOOD PRACTICES AND A PRACTICAL CHECKLIST – 209
EXPORT RESTRICTIONS IN RAW MATERIALS TRADE: FACTS, FALLACIES AND BETTER PRACTICES © OECD 2014
Box 6.9. Examples of provisions on stakeholder consultation
WTO Agreement on Agriculture (1995), Article 12(b) – “before any Member institutes an export prohibition or restriction, it …shall consult, upon request, with any other Member having a substantial interest as an importer with respect to any matter related to the measure in question. The Member instituting such export prohibition restriction shall provide, upon request, such a Member with necessary information.”
New Zealand–Malaysia Free Trade Agreement (2009), Chapter 14, Transparency (2009): – “To the extent possible, each Party shall (a) publish in advance any measure [laws, regulations, procedures, and administrative rulings of general application with respect to any matter covered by this Agreement] that it proposes to adopt; and (b) provide, where appropriate, interested persons and the other Party with a reasonable opportunity to comment on such proposed measures.”
Côte d’Ivoire–EC Stepping Stone Economic Partnership Agreement (2009), Article 16:1-2 – “No new customs duties on exports or charges with equivalent effect shall be introduced, nor shall those currently applied in trade between the Parties be increased from the date of entry into force of this Agreement. In exceptional circumstances, if the Ivorian Party can justify specific needs for income, protection for infant industry or environmental protection, it may, on a temporary basis and after consulting the EC Party, introduce customs duties on exports or charges with equivalent effect on a limited number of traditional goods or increase the incidence of those which already exist.”
Canada-Colombia Free Trade Agreement (2011), Article 1901 – “To the extent possible, each Party shall: (a) publish in advance any such measure that it proposes to adopt; and (b) provide interested persons and the other Party a reasonable opportunity to comment on such proposed measures.”
Recommendation of the OECD Council on Regulatory Policy and Governance (2012) – Recommendation 3: Governments should “consult with all significantly affected and potentially interested parties, whether domestic or foreign, where appropriate at the earliest possible stage while developing or reviewing regulations, ensuring that the consultation itself is timely and transparent, and that its scope is clearly understood …” – Recommendation 7.4: “Regulatory agencies should be required to follow regulatory policy including engaging with stakeholders ... when developing draft law or guidelines and other forms of soft law.”
APEC Model Chapter on Transparency for RTAs/FTAs (2012), Article 3 – “Each Party shall endeavour to make publicly available proposed measures of general application prior to their adoption and provide a reasonable period of normally not less than 30 days for the other Party and its interested persons to comment to the authority responsible for the development of the proposed measure.”
Agreement on Trade Facilitation (2013), Article 2.1 – “Each Member shall to the extent practicable and in a manner consistent its domestic laws and legal system, provide opportunities and an appropriate time period to traders and other interested parties to comment on the proposed introduction or amendment of laws and regulations of general application related to the movement, release and clearance of goods…”
Source: Based on a review of the texts of the agreements and guidelines found on the internet.
requirements for measures under development and not yet adopted has been amended to supply information with respect to both how the decision is made, and which authorities participate, and whether stakeholder consultations are envisaged or have taken place, and with whom.
The general principle retains the same degree of discretion as the consultation commitments found in WTO agreements, which are usually expressed as “best endeavours” encouraging rather than requiring that governments give interested parties a reasonable opportunity to comment. This is also true for RTAs, including those involving countries with a long tradition of stakeholder consultation (Moïsé, 2011). Where prior consultation is compulsory, it tends to be limited to specified situations. For example, the WTO Agreement on Agriculture makes consultation obligatory for export restrictions, but only when the government of another country requests it and is a major importer (Box 6.9). Consultation is also mandatory under the TBT and SPS Agreements, but only when a measure can affect trade significantly.
The issue of consultation could be developed further, but the checklist stops here. For example, it does not reflect that some trade agreements (often addressing TBT and SPS issues) specify how much time stakeholders should have to make comments. In general, translating the principle of prior consultation into practice is not straightforward and raises questions that have no easy answers. Should there be limits on consultation, in terms of types of instruments subject to

210 – 6. INCREASING THE TRANSPARENCY OF EXPORT RESTRICTIONS: BENEFITS, GOOD PRACTICES AND A PRACTICAL CHECKLIST
EXPORT RESTRICTIONS IN RAW MATERIALS TRADE: FACTS, FALLACIES AND BETTER PRACTICES © OECD 2014
consultations (legislative versus subordinate measures), or the level of government involved? In thecase of export restrictions, should consultation apply horizontally to all types of restriction, from export taxes to domestic content rules? Does prior consultation make sense only when the effect of export restrictions on trade is very significant, or when trading partners have a substantial interest as importers (as under the WTO Agreement on Agriculture)? Actual country experiences with developing export restrictions could help clarify if and where across policies the limit should be drawn. In general, studies of country experiences with consultation processes for export restrictions are not yet available.
24
Transparency in the application of measures
The importance of ensuring transparency regarding the law or regulation itself and the related administrative rules, procedures and decisions, is well understood. In addition, stakeholders must know the enforcement process, including the way it has been conducted in relevant decisions. Observance of these principles is a general requirement for WTO members. GATT Article X and GATS Article VI require administration of trade measures to be uniform, impartial and reasonable, and that stakeholders have access to review of action taken pursuant to these measures. More specific WTO agreements and also bilateral and regional trade agreements mirror these principles.
These principles are sometimes expressed in terms of the efficacy with which trade measures are applied to demonstrate procedural fairness and non-discrimination.
25 Transparent procedures are
a condition for procedural fairness: stakeholders need to know the rules of the game, i.e. how the administration of trade measures works, in order to be in a position to judge whether measures are applied fairly or not. An active mechanism for reviewing decisions, carried out by an independent authority and open to all parties affected by administrative decisions, reinforces the transparency of administrative and enforcement systems.
There have been efforts to embed transparency more deeply into the processes by which agencies administer trade-related laws and regulations. To increase regulatory certainty for all stakeholders, the OECD Council Recommendation of 2012 advocates the use of standard time periods for decisions in approval or infringement processes. Operating and publishing standard timeframes for handling applications is among the higher-standard transparency disciplines found in WTO agreements dealing with regulatory measures (see Box 6.10 for illustration). With respect to administrative decisions and actions, the TBT and SPS Agreements, and the Disciplines for the Accountancy Sector in the service sector, also provide for disclosure of the reasons for rejection of applications, non-discriminatory processing of submission of applications for domestic and foreign parties, avoidance of unnecessary information requirements for applications, and reasonable processing fees.
The final checklist states that governments should administer measures in a consistent, impartial and reasonable manner, and allow affected parties to have procedures reviewed and appealed. No attempt is made to develop this general statement further, for example by mentioning the practice illustrated in Box 6.10 of setting standard timeframes for applications. At that level of administrative detail, ways of incorporating the stated broad norms into the administrative process must often be tailored to the specific type of measure.
With respect to the issue of information availability, there are two kinds of discipline:
Rules requiring governments to publish sufficient information so that generally applicable procedures used for applying regulations and regulatory decisions are known to any stakeholder.
Rules for communicating with affected parties when specific issues of administrative decisions or actions arise (e.g. when an application for an export licence or authorisation is rejected, prompt, objective and impartial review upon request, and remedies).
The checklist covers only information intended for all stakeholders. The most important good-practice norm states that existing and forthcoming administrative procedures, rulings and interpretations of general application must be published. Examples of publishing requirements

6. INCREASING THE TRANSPARENCY OF EXPORT RESTRICTIONS: BENEFITS, GOOD PRACTICES AND A PRACTICAL CHECKLIST – 211
EXPORT RESTRICTIONS IN RAW MATERIALS TRADE: FACTS, FALLACIES AND BETTER PRACTICES © OECD 2014
are illustrated in Box 6.11 for trade procedures that can impose high time and money costs on businesses and may also be a source of administrative arbitrariness, discrimination, red tape and corruption. Transparency may require commitments that make it visible to stakeholders or the public exactly how agencies handle specific regulatory requirements and administrative formalities. Another general norm is that governments are expected to operate enquiry points; for this to be effective, the checklist includes the provision of contact information for the Enquiry Points so that interested parties can fully avail themselves of this service.
A majority of business survey respondents endorsed these items. One respondent suggested that a means of tracking the fill-rate of a quota (on exports) should be provided.
26 Clearly, information
needs, and the best ways of meeting them, could be tailored to each type of measure, which is not the aim of this checklist.
Box 6.10. Handling applications
Agreement on Technical Barriers to Trade (1995), Article 5 – In cases where a positive assurance of conformity with technical regulations and standards is required, Members shall ensure that ‘the standard processing period of each conformity assessment procedure is published or that the anticipated processing period is communicated to the applicant upon request…’ Article 7 states that Members shall take such reasonable measures as may be available to them to ensure compliance with this obligation also by local government bodies within their territories such bodies.
Agreement on Sanitary and Phytosanitary Measures (1995), Annex C (Control, Inspection and Approval Procedures) – Members shall ensure with respect to any procedure to check and ensure the fulfilment of sanitary and phytosanitary measures, that … ‘the standard processing period of each procedure is published or that the anticipated processing period is communicated to the applicant upon request …’
Decision on Disciplines Relating to the Accountancy Sector (1998), Article VII – “Licensing requirements (i.e. the substantive requirements, other than qualification requirements, to be satisfied in order to obtain or renew an authorization to practice) shall be pre-established, publicly available and objective.” Article XI (Licensing Procedures) – “Licensing procedures (i.e. the procedures to be followed for the submission and processing of an application for an authorisation to practise) shall be pre-established, publicly available and objective, and shall not in themselves constitute a restriction on the supply of the service.”
Source: Based on a review of the texts of the agreements and guidelines found on the internet.
Box 6.11. Publishing obligations with respect to administration
Agreement on Import Licensing Procedures (1995), Article 1.4(a) – “The rules and all information concerning procedures for the submission of applications, including the eligibility of persons, firms and institutions to make such applications, the administrative body(ies) to be approached, and the lists of products subject to the licensing requirement shall be published, in the sources notified to the Committee on Import Licensing… Such publication shall take place, whenever practicable; 21 days prior to the effective date of the requirement but in all events not later than such effective date. Any exception, derogations or changes in or from the rules concerning licensing procedures or the list of products subject to import licensing shall also be published in the same manner and within the same time periods as specified above.” Article 5 (b) – Members administering quotas by means of licensing shall publish the overall amount of quotas to be applied by quantity/or value, the opening and closing data of quotas, and any change thereof, within the time periods specified in paragraph 4 of Article 1 [above].’
Agreement on Trade Facilitation (2013), Article 1 – Publication and Availability of Information: Each Member shall promptly publish … in a non-discriminatory and easily accessible manner ... importation, exportation and transit procedures … penalty provisions … appeal procedures, … procedures relating to the administration of tariff quota. Article 3 – Advance Rulings: A Member shall publish at the minimum (a) the requirements for the application for an advance ruling, including the information to be provided and the format; (b) the time period by which it will issue an advance ruling; and (c) the length of time for which the advance ruling is valid…A Member shall endeavour to make publicly available any information on advance ruling which it considers to be of significant interest to other interested parties, taking into account the need to protect commercially confidential information.
Source: Based on a review of the texts of the agreements and guidelines found on the internet.

212 – 6. INCREASING THE TRANSPARENCY OF EXPORT RESTRICTIONS: BENEFITS, GOOD PRACTICES AND A PRACTICAL CHECKLIST
EXPORT RESTRICTIONS IN RAW MATERIALS TRADE: FACTS, FALLACIES AND BETTER PRACTICES © OECD 2014
For purposes of clarity, these items have been grouped in the final version of the checklist under the heading “Information about procedures and rules of administration”. They refer to publication of:
Applicable procedures, decisions and rulings for applying the measure (e.g. the criteria and methodology used to allocate quotas, or grant licenses, permits or other authorisations).
Application procedures and document requirements, appeals procedures, and the like.
Contact information for authority in charge of administration.
It is recalled that the information requirements do not extend to determinations or rulings made in administrative or judicial proceedings that apply to a particular person or a particular product in a specific case, or to rulings that adjudicate with respect to a particular act or practice. Such information is intended for individual stakeholders, is not automatically made available, and is not intended for the general public.
6.6. Conclusions
Transparency of export restrictions involves effective public communication, opportunity for stakeholder involvement in the decision process and procedural fairness of administration. This chapter presents the final version of a checklist covering transparency aspects at all stages of policy development, including the decision process leading up to adoption of a measure and making it operational. For transparency at the stage of discussing whether to introduce an export restriction, a government should publish sufficient information alerting stakeholders to the initiative and allowing them to react—by adjusting their decisions to the potential policy change, expressing their views to the government—and the government should take their views into consideration. Following enactment of an export restriction, information should be published well in advance of its entry into force. The measure should be implemented and enforced in a transparent manner assuring all stakeholders affected equal treatment and include a right to contest decisions and procedures.
From the business perspective, transparency is clearly important. Research on what governments publish online about export restrictions already in place suggests that there is considerable room for improvement. The checklist offers a blueprint for achieving a high level of ex ante and ex post transparency, elaborating information requirements for making measures public once taken at a high level of specificity that have been validated by a survey of business representatives. The result is a coherent framework of actions throughout the policy cycle and flow of information from which private operators and governments, and ultimately global markets, all can benefit.
The checklist can be used in various ways. It facilitates self-evaluation, serving as a diagnostic tool for governments to appraise their own transparency practices and take steps to address underlying weaknesses. It could also, however, support peer reviews and multi-stakeholder dialogue on transparency of policies that restrict exports.
Addressing underlying weaknesses requires resources that developing countries in particular may not have at their disposal. The checklist does not offer guidance on capacity building issues; however, governments can decide which parts of the transparency framework they wish to upgrade as a priority. A feasible starting point could be to close information gaps relative to the specific information requirements for publishing information. These requirements respond to concrete information needs of market operators and are formulated in clear terms that facilitate implementation. Efficiency gains through wider use of information technology are also low-hanging fruit for some countries.
Public consultation mechanisms, on the other hand, are decisions that governments usually take years to consider and implement. The appropriateness of any standards for consultations in the public policy field is not necessarily universally recognised. Some governments may not see value in open and transparent decision-making processes. Ex ante transparency therefore needs strong

6. INCREASING THE TRANSPARENCY OF EXPORT RESTRICTIONS: BENEFITS, GOOD PRACTICES AND A PRACTICAL CHECKLIST – 213
EXPORT RESTRICTIONS IN RAW MATERIALS TRADE: FACTS, FALLACIES AND BETTER PRACTICES © OECD 2014
advocates for it to be adopted. Governments using consultative mechanisms when considering export restrictions should publicise this widely and share their experience with trading partners that do not. As with their own practices, governments can use the criteria of the checklist to scrutinise how other countries handle transparency when they adopt export restrictions. The checklist could support the organisation of peer reviews where governments can learn from each other’s experiences.
The checklist could make a contribution to a range of ongoing activities. For example, the recently concluded WTO Agreement on Trade Facilitation requires members to make information available on a range of trade measures that include export restrictions. The principles and precise information requirements of the list could help members to operationalise these obligations. Other settings where the list could serve as a reference tool are the various bodies and fora which RTAs have set up to oversee and help signatory countries to implement the transparency rules of their treaties. Finally, the possibility that countries, with the aid of the checklist, negotiate and reach agreement on multilateral transparency disciplines for export restrictions over and above those currently applied under the WTO should not be ruled out.
Because the regulatory field of export restrictions is broad and the checklist applies to all goods sectors, the list may also be able to contribute to policy dialogues in WTO, APEC, OECD and other fora, especially at the regional level, that seek to promote greater transparency as part of better governance in public policy more generally and with an open market perspective firmly in mind.
Notes
1. Barbara Fliess is a Senior Trade Policy Analyst in the OECD’s Trade and Agriculture Directorate and Osvaldo R. Agatiello is Professor of International Economics and Governance, Geneva School of Diplomacy and International Relations. The authors wish to thank numerous colleagues in the OECD Trade and Agriculture Directorate and members of the Working Party of the OECD Trade Committee for helpful comments received at various stages of this work. Special thanks also to Gregory Bounds, formerly with the OECD Directorate for Public Governance and Territorial Development and Robert Wolfe of Queen’s University, Canada. Discussions by participants at the OECD Workshop in May 2012 on Regulatory Transparency in Trade in Raw Materials providing impetus for this study. The Business and Industry Advisory Committee to the OECD helped carry out the business survey.
2. Export restrictions are measures that raise export price, limit export quantity or place conditions on exporting. Examples are: export tax, fiscal tax on exports, export surtax, export quota, tariff rate quota, export prohibition, export licensing requirement, minimum export price/price reference scheme, dual pricing scheme, discriminatory VAT tax rebate regime, and domestic market obligation.
3. World Economic Forum, Global Risks 2012.
4. The OECD is contributing to greater ex post transparency of export restrictions that governments apply through its Inventory of measures that restrict the export of raw materials. The Inventory (see Chapter 1) provides a comprehensive account of export taxes, export quotas, export bans and other types of export restriction in the raw materials sector, including agricultural commodities (http://qdd.oecd.org/subject.aspx?subject=8F4CFFA0-3A25-43F2-A778-E8FEE81D89E2).
5. The issue of transparency has also been raised in other areas of the raw materials sector. For example, transparency surrounding mineral extraction and the use by governments of the related revenues is also advocated, for example by the Ethical Trading Initiative (ETI) and the Extractive Industries Transparency Initiative (EITI), among whose aims are to curb corruption and to enable citizens to hold their governments accountable for the use of raw materials revenues. Various initiatives also aim to promote adherence of the extractive industries to environmental and social minimum standards in countries where governance is weak. The OECD Directorate for Financial and Enterprise Affairs has developed specific guidance on responsible investment through enhanced due diligence for managing the supply chain of key minerals in conflict zones and fragile states. The Kimberley Process Certification Scheme (KPCS), established in 2003 to prevent diamond purchases from financing violence by rebel movements seeking to undermine legitimate governments (http://www.ethicaltrade.org/, www.kimberleyprocess.com/web/kimberley-process/kp-basics, Collins-Williams and Wolfe, 2010).
6. WTO Glossary (www.wto.org).

214 – 6. INCREASING THE TRANSPARENCY OF EXPORT RESTRICTIONS: BENEFITS, GOOD PRACTICES AND A PRACTICAL CHECKLIST
EXPORT RESTRICTIONS IN RAW MATERIALS TRADE: FACTS, FALLACIES AND BETTER PRACTICES © OECD 2014
7. Simon Evenett, “Transparency, information disclosure and trade policy”. Keynote speech at the OECD Workshop on Regulatory Transparency in Trade of Raw Materials, 10-11 May 2012 in Paris.
8. It seems that no matter how ‘investor friendly’ the inducements offered by a recipient country may be, there is a point on the transparency/opacity continuum beyond which most (serious) investors are unwilling to make FDI. The same logic applies to trade. See OECD (2002a), Chapter X, and pp. 176-184.
9. See Lejárraga, 2013; OECD, 2012a.
10. For further background information in respect to the collection of data for and the content of the Inventory, see Fliess and Mård, 2012.
11. This decision does not supersede those notification procedures sanctioned in other multilateral and plurilateral trade agreements.
12. A reverse notification is a notification by one member of a non-notified measure undertaken by another member.
13. Every two years after 30 September 2012. Decision on Notification Procedures for Quantitative Restrictions, WTO, G/L/59/Rev.1, 3 July 2012.
14. See WTO, G/AG/GEN/86/Rev.11, 10 September 2012. http://www.wto.org/english/tratop_e/agric_e/ag_notif_e.pdf.
15. See WTO, G/MA/W/23/Rev.8, 23 April 2012.
16. See Note by the Secretariat (WTO, G/MA/NTM/W/3/Rev1) on Notifications Under the Decision on Reverse Notification of Non-Tariff Measures (G/L/60), 23 January 2001.
17. APEC Ministerial Meeting, Vladivostok, Russia, 5-6 September 2012, Joint Statement Annex A: APEC Model Chapter on Transparency for RTAs/FTAs (www.mid.ru/bdomp/ns-dipecon.nsf/0/b2af77c62b39055c44257a71003d811c/$FILE/2012%20AMM%20Declaration%20Annex%20A.doc).
18. See Leaders’ statement to implement APEC transparency standards. Los Cabos, Mexico, 27 October 2002 (www.apec.org/Meeting-Papers/Leaders-Declarations/2002/2002_aelm/statement_to_implement1.aspx).
19. Algeria, Argentina, Benin, Botswana, Brazil, China, Colombia, Dominican Republic, Fiji, Gabon, Ghana, Guinea, India, Indonesia, Kazakhstan, Lesotho, Malaysia, Morocco, Namibia, Nigeria, Pakistan, Russian Federation, Senegal, Sierra Leone, South Africa, Sri Lanka, Syria, Ukraine, Uruguay, Venezuela, Viet Nam, Zambia and Zimbabwe.
20. These types of measure account for most of the export restrictions recorded and non-energy minerals represent the bulk of product entries. “Export taxes” comprise export tariffs, export royalties and fiscal taxes on exported goods. The quantitative restrictions consist of export quotas and prohibitions.
21. The survey was carried out in the summer and autumn of 2013. The completed questionnaire was returned by a total of 32 firms and associations from OECD and non-OECD countries, some of which apply export restrictions. BIAC emailed the survey to its member organisations and to its observer organisations based in non-OECD countries. Because the African region was not represented among the organisations approached, the OECD Secretariat also mailed the survey to major industry/business organisations based in Botswana, Kenya, Tanzania, Zimbabwe and South Africa for dissemination to their members. Countries represented by survey respondents include Brazil, Canada, Chile, Colombia, eight European countries, Japan, Russian Federation, South Africa and United States.
22. WTO Glossary (www.wto.org). Emphasis added. The IMF Code of Good Practices on Transparency in Monetary and Financial Policies of 2000 gives a similar definition: ‘Transparency refers to an environment in which the objectives of policy, its legal, institutional, and economic framework, policy decisions and their rationale, data and information related to monetary and financial policies, and the terms of agencies’ accountability, are provided to the public in a comprehensible, accessible, and timely manner’ (www.imf.org/external/np/mae/mft/sup/part1.htm#appendix_III).
23. Optimal transparency would be achieved through a combination of a well-functioning public consultation process and the systematic availability of information allowing anyone to follow the policy initiative as it moves forward.

6. INCREASING THE TRANSPARENCY OF EXPORT RESTRICTIONS: BENEFITS, GOOD PRACTICES AND A PRACTICAL CHECKLIST – 215
EXPORT RESTRICTIONS IN RAW MATERIALS TRADE: FACTS, FALLACIES AND BETTER PRACTICES © OECD 2014
24. Anecdotal evidence is slowly accumulating. For example, for an account of public consultations held by South Africa’s International Trade Administration Commission (ITAC), starting in early 2013, on a new proposal for controlling scrap metal exports, see ITAC website www.itac.org.za/search_page.asp?search=scrap.
25. See WTO (2002a, 2002b).
26. The information to which this comment refers appears to be available to governments through the WTO, since WTO procedures on notification of quantitative restrictions require Members to regularly report information about the degree of utilisation of quotas in force. This includes quantitative restrictions on the export side (G/MA/NTM/W/1/Rev.1 of 3 November 1995). However, this notification is retrospective.

216 – 6. INCREASING THE TRANSPARENCY OF EXPORT RESTRICTIONS: BENEFITS, GOOD PRACTICES AND A PRACTICAL CHECKLIST
EXPORT RESTRICTIONS IN RAW MATERIALS TRADE: FACTS, FALLACIES AND BETTER PRACTICES © OECD 2014
References
ASEAN Trade in Goods Agreement, 2009. www.fta.gov.sg/afta/atiga_asean%20trade%20in%20goods%20agreement%20cha-am%20thailand%2026%20february%202009.pdf.
APEC (Asia-Pacific Cooperation) (2012), Annex A – APEC Model Chapter on Transparency for RTAs/FTAs, Ministerial Statement, 2012 APEC Ministerial Meeting, Vladivostok, Russian Federation,
5-6 September, www.apec.org/Meeting-Papers/Ministerial-Statements/Annual/2012/2012_amm/annex-a.aspx.
APEC (Asia-Pacific Cooperation) (2002), Leaders’ Statement to Implement APEC Transparency Standards, Los Cabos, Mexico, 27 October. www.apec.org/Meeting-Papers/Leaders-Declarations/2002/2002_aelm/statement_to_implement1.aspx.
Bellver, A. and D. Kaufmann (2005), “Transparenting Transparency’: Initial Empirics and Policy Applications”, World Bank Discussion Paper presented at the IMF Conference on Transparency and Integrity, 6-7 July. Preliminary draft, September.
Bonarriva, J., M. Koscielski and E. Wilson (2009), ‘Export Controls: An Overview of their Use, Economic Effects, and Treatment in the Global Trading System’, Office of Industries Working Papers, No. ID-23, US International Trade Commission, Washington, D.C., August.
Canada–Colombia Free Trade Agreement, 2011. www.international.gc.ca/trade-agreements-accords-commerciaux/agr-acc/colombia-colombie/can-colombia-toc-tdm-can-colombie.aspx.
CARICOM–Costa Rica Free Trade Agreement 2004. www.sice.oas.org/Trade/crcrcom_e/crcrcomind_e.asp#EIF.
Collins-Williams, T. and R. Wolfe (2010), ‘Transparency as a Trade Policy Tool: The WTO’s Cloudy Windows’, World Trade Review, Vol. 9, No. 4, pp. 551-582.
Colombia United States Trade Promotion Agreement, 2006 www.sice.oas.org/Trade/COL_USA_TPA_e/Index_e.asp.
Côte d'Ivoire–European Community Stepping Stone Economic Partnership Agreement, 2009. eur-lex.europa.eu/LexUriServ/LexUriServ.do?uri=OJ:L:2009:059:0003:0273:EN:PDF.
Devarajan, S., Go, D., Schiff, M. and Suthiwart-Narueput, S. (1996), ‘The Whys and Why Nots of Export Taxes’, World Bank Policy Research Working Paper 1684, 1-25, January.
Evenett, Simon (2012), Transparency, information disclosure and trade policy, Keynote speech at the OECD Workshop on Regulatory Transparency in Trade of Raw Materials, 10-11 May 2012 in Paris. www.oecd.org/tad/non-tariffmeasures/50335357.pdf.
Fliess, B. and T. Mård, (2012), ‘Taking Stock of Measures Restricting the Export of Raw Materials: Analysis of OECD Inventory Data’, OECD Trade Policy Papers, No. 140, 5 October, OECD Publishing, Paris, http://dx.doi.org/0.1787/5k91gdmdjbtc-en.
Francois, J. (2001), ‘Trade Policy Transparency and Investor Confidence: The Implications of and Effective Trade Policy Review Mechanism’, Review of International Economics, Vol. 9, No. 2, pp. 303-16.
Iida, K. and J. Nielson (2001), Transparency in domestic regulation: Prior consultation, in OECD Trade in Services: Negotiating Issues and Approaches, OECD Publishing, Paris,
http://dx.doi.org/10.1787/9789264194960-en.
Karapinar, B. (2012), “Defining the Legal Boundaries of Export Restrictions: A Case Law Analysis”, Journal of International Economic Law, Vol. 15, No. 2, pp. 443-479.
Korinek, J. and J. Bartos (2012), ‘Multilateralising Regionalism: Disciplines on Export Restrictions in Regional Trade Agreements’, OECD Trade Policy Papers, No. 139, OECD Publishing, Paris,
http://dx.doi.org/0.1787/5k962hf7hfnr-en.
Lejárraga, I. (2013), “Multilateralising Regionalism: Strengthening Transparency Disciplines in Trade”, OECD Trade Policy Paper No. 152, OECD Publishing, Paris, http://dx.doi.org/10.1787/18166873.

6. INCREASING THE TRANSPARENCY OF EXPORT RESTRICTIONS: BENEFITS, GOOD PRACTICES AND A PRACTICAL CHECKLIST – 217
EXPORT RESTRICTIONS IN RAW MATERIALS TRADE: FACTS, FALLACIES AND BETTER PRACTICES © OECD 2014
Lejárraga, I. and Shepherd, B. (2013), “Quantitative evidence on transparency in Regional Trade Agreements”, OECD Trade Policy Paper No. 153. OECD Publishing, Paris. http://dx.doi.org/10.1787/5k450q9v2mg5-en.
Möisé, E. (2011), “Transparency Mechanisms and Non-Tariff Measures: Case Studies”, OECD Trade Policy Papers, No. 111, 18 March, OECD Publishing, Paris, http://www.oecd-
ilibrary.org/trade/transparency-mechanisms-and-non-tariff-measures_5kgf0rzzwfq3-en.
New Zealand–Malaysia Free Trade Agreement, 2009, www.mfat.govt.nz/Trade-and-Economic-Relations/2-Trade-Relationships-and-Agreements/Malaysia/index.php.
OECD (2012a), Inventory of Restrictions on Exports of Raw Materials (database),
http://qdd.oecd.org/Subject.aspx?subject=1189A691-9375-461C-89BC-48362D375AD5.
OECD (2012b), Recommendation of the Council on Regulatory Policy and Governance, OECD Publishing, Paris, http://www.oecd.org/gov/regulatory-policy/49990817.pdf.
OECD (2009a), Transparency in the Design of Non-Tariff Measures and the Cost of Market Entry: Conceptual Framework. 20 November, Paris (unpublished).
OECD (2005), Guiding Principles for Regulatory Quality and Performance, OECD Publishing, Paris. www.oecd.org/fr/reformereg/34976533.pdf.
OECD (2003), Stocktaking project on transparency: Background information and proposed work,
Unpublished, 14 March 2003.
OECD (2002a), Foreign Direct Investment for Development: Maximising benefits, minimising costs, OECD Publishing, Paris, http://dx.doi.org/10.1787/9789264199286-en.
Piermartini, R. (2004), “The Role of Export Taxes in the Field of Primary Commodities”, WTO Discussion Papers, No. 4, Geneva.
Stoeckel, A. and Fisher, H. (2008), Policy Transparency: Why Does It Work, Who Does It Best, Rural Industries Research and Development Corporation, Barton, A.C.T., Australia.
United States–Australia Free Trade Agreement (2004) http://www.sice.oas.org/Trade/US-AusFTAFinal/USAusind_e.asp.
World Bank (2012), ‘Doing business in a more transparent world’, in: Doing Business 2012. Washington, D.C.,www.doingbusiness.org/~/media/GIAWB/Doing%20Business/Documents/Annual-Reports/English/DB12-FullReport.pdf.
World Economic Forum (2012), Global Risks 2012. Seventh Edition. Cologny, Switzerland.
WTO Glossary (www.wto.org).
WTO, TBT Information Management System, http://tbtims.wto.org.
WTO (2013), Agreement on Trade Facilitation WT/MIN(13)/36, WT/L/911, 7 December, Geneva.
WTO (2012), Decision on Notification Procedures for Quantitative Restrictions. Adopted by the Council for
Trade in Goods on 22 June 2012. Revision. G/L/59/Rev.1, 3 July, Geneva.
WTO (2012), Draft Consolidated Negotiating Text. 2012, Fourteenth Revision. World Trade Organization, Negotiating Group on Trade Facilitation. TN/TF/W/165/Rev.14, 17 December 2012, Geneva.
WTO (2010), Handbook on Notification Requirements under the Agreement on Agriculture, May 2010,
Geneva.
WTO (2008), Draft Modalities for Non-Agricultural Market Access. 2008, Fourth Revision. World Trade Organization, Negotiating Group on Market Access, TN/MA/W/103/Rev.3, 6 December, Geneva.
WTO (2002a), Transparency. Note by the Secretariat. Working Group on the Relationship between Trade
and Investment, WT/WGTI/W/109, 27 March, Geneva.
WTO (2002b), Core principles, including transparency, non-discrimination and procedural fairness. Background Note by the Secretariat. Working Group on the Interaction between Trade and Competition Policy, WT/WGTCP/W/209, 19 September, Geneva.
WTO (2001a), Accession of the People’s Republic of China. Decision of 10 November 2001, WT/L/432, 23 November, Geneva.

218 – 6. INCREASING THE TRANSPARENCY OF EXPORT RESTRICTIONS: BENEFITS, GOOD PRACTICES AND A PRACTICAL CHECKLIST
EXPORT RESTRICTIONS IN RAW MATERIALS TRADE: FACTS, FALLACIES AND BETTER PRACTICES © OECD 2014
WTO (2001b), Decision on Implementation Related Issues and Concerns taken at the Fourth Ministerial Conference in Doha, Qatar (WT/MIN(01)17), 14 November, Geneva.
WTO (2001c), Notifications Under the Decision on Reverse Notification of Non-Tariff Measures (G/L/60), Note by the Secretariat, G/MA/NTM/W/3/Rev1, 23 January, Geneva.
WTO (1996), Decision on Notification Procedures for Quantitative Restrictions. Adopted by the Council for
Trade in Goods on 1 December 1995. G/L/59, 10 January, Geneva
WTO (1996), Information on Discussions Being Held in Various WTO Committees related to Topics Under Examination in the Working Group, Working Group on Notification Obligations and Procedures, G/NOP/W/13, 10 May 1996, Geneva.
WTO (1996), Information on Notifications Made Under the Agreements in Annex 1A of the WTO Agreement, Working Group on Notification Obligations and Procedures, G/NOP/W/14, 20 May 1996. G/L/112, 7 October 1996, Geneva.
WTO (1996), Report of the Working Group on Notification Obligations and Procedures, Working Group on
Notification Obligations and Procedures, G/L/112, 7 October, Geneva.
WTO (1994), Uruguay Round Decision on Notification Procedures. Adopted by the Trade Negotiations Committee on 14 April 1994, Geneva.

6. INCREASING THE TRANSPARENCY OF EXPORT RESTRICTIONS: BENEFITS, GOOD PRACTICES AND A PRACTICAL CHECKLIST – 219
EXPORT RESTRICTIONS IN RAW MATERIALS TRADE: FACTS, FALLACIES AND BETTER PRACTICES © OECD 2014
Annex 6.A.
Best Practices in Transparency
Examples of best practices in transparency contained in GATT-WTO Agreements, Regional Trade Agreements, and the OECD Recommendation on Regulatory Policy
What information needs to be published?
GATT Article X, 1947 - Original text
- Laws, regulations, judicial decisions and administrative rulings of general application as well as agreements affecting international trade policy that are in force between governments.
GATT Article XI, 1947 - Original text
- Any contracting party applying restrictions on the importation of any product should give public notice of the total quantity or value of the product permitted to be imported during a specified future period and of any change in such quantity or value.
GATT Article XIII, 1947 - Original text
- In applying import restrictions to any product, contracting parties should give notice of them. When fixing quotas, the contracting party applying the restrictions should give public notice of the total quantity or value of the product or products that will be permitted to be imported.
- When quotas are allocated among supplying countries, the contracting party applying the restrictions should promptly inform all other contracting parties having an interest in supplying the product concerned of the shares in the quota currently allocated, by quantity or value, to the various supplying countries and give public notice of them.
- This applies to any tariff quota instituted or maintained by any contracting party, as well as to other export restrictions.
WTO Members’ tariff schedules, ongoing Innovation: Introduces communication format that is compulsory for all Members.
- Each schedule contains the following information: tariff item number, description of the product, rate of duty, present concession established, initial negotiation rights (such as main suppliers of product), concession first incorporated in a GATT Schedule, INR on earlier occasions, other duties and charges. For agricultural products special safeguards may also be defined.
Uruguay Round Ministerial Decision on Notification Procedures, 19942 Innovation: Introduces exhaustive detail in Member notifications.
- The WTO Secretariat’s Central Registry of Notifications (CRN) cross-references its records of notifications by Member and obligation. An indicative list of measures subject to notification includes tariffs (including range and scope of bindings, GSP provisions, rates applied to members of free-trade areas/customs unions, other preferences), tariff quotas and surcharges, quantitative restrictions, including voluntary export restraints and orderly marketing arrangements affecting imports, other non-tariff measures such as licensing and mixing requirements; variable levies; rules of origin; technical barriers; safeguard actions; anti-dumping actions; countervailing actions; export taxes; export subsidies, tax exemptions and concessionary export financing; export restrictions, including voluntary export restraints and orderly marketing arrangements; other government assistance, including subsidies, tax exemptions; and foreign exchange controls related to imports and exports; and others.
Ministerial Decision on Procedures for the Facilitation of Solutions to Non-Tariff Barriers (TN/MA/W/103/Rev.1),8 2008 Innovation: Enhances specificity of notification requirements.
- WTO members should notify the introduction of export taxes. Also they should undertake to schedule export taxes on non-agricultural products in their Schedules of Concessions and bind the export taxes at a level to be negotiated, with some exceptions.
Japan - India CEPA, 201113
Innovation: Public identification of government authorities in charge of norms is mandated.
- Each Party shall make available to the public the names and addresses of the competent authorities responsible for laws, regulations, administrative procedures and administrative rulings.
OECD Recommendation, 2012 Innovation: Overarching transparency principle, implicitly encompassing foreign stakeholders.
- All regulations should be easily accessible by the public.

220 – 6. INCREASING THE TRANSPARENCY OF EXPORT RESTRICTIONS: BENEFITS, GOOD PRACTICES AND A PRACTICAL CHECKLIST
EXPORT RESTRICTIONS IN RAW MATERIALS TRADE: FACTS, FALLACIES AND BETTER PRACTICES © OECD 2014
When does it need to be published / notified?
GATT Article X, 1947 - Original text
- Promptly, to enable governments and traders to become acquainted with them.
Anti-dumping, 1957 Innovation: Stakeholders are given ample time and relevant information to act.
- All interested parties in an anti-dumping investigation shall be given notice of the information that the authorities require and ample opportunity to present in writing all evidence that they consider relevant. Exporters or foreign producers receiving questionnaires used in an anti-dumping investigation shall be given at least 30 days for reply.
Import Licensing, 1995 Innovation: Precise terms for applications and institution of procedures are sanctioned.
- The rules and all information concerning procedures for the submission of applications are to be published 21 days prior to the effective date of the requirement. Members that institute licensing procedures or changes should notify the Committee on Import Licensing within 60 days of publication.
OECD Recommendation, 2012 Innovation: A comprehensive, punctilious publication standard is introduced.
- A complete and up-to-date legislative and regulatory database should be freely available to the public in a searchable format through a user-friendly interface over the Internet.
Agreement on Trade Facilitation, 2013 Innovation: Article X disciplines are expanded and deepened.
- Information is to be published in a non-discriminatory and easily accessible manner in order to enable governments, traders and other interested parties to become acquainted with them.
- Information available through the internet.
- The duty of notification will comprise the identification of the official publication(s) and website(s) of the Enquiry Points.
- Publish information as early as possible before a new or amended law or regulation enters into force, and elicit comments from interested parties.
- Advance rulings in a reasonable, time bound manner will be provided to applicants submitting a written request prior to the importation of a good.
Technical Barriers to Trade, 19955 Innovation: WTO circulates relevant notified information in three official languages and operates database.
- The Secretariat is responsible for circulating to all members and interested international standardizing and conformity assessment bodies copies of the notifications it receives. To that end it administers the Technical Barriers to Trade Information Management System. All information is made available in English, Spanish and French.
ASEAN Trade in Goods Agreement, 2009 Innovation: Fixed term of minimum 60 days of prior publication is introduced.
- Member States should notify any action or measure that they intend to take which may nullify or impair any benefit to other Member States, directly or indirectly.
- They should notify the ASEAN Secretariat before effecting such action or measure, at least 60 days before it takes effect and provide adequate opportunity for prior discussion with Member States having an interest in it.
APEC Model Chapter on Transparency, 201214
Innovation: Regional transparency standard is introduced.
- Proposed and final measures should be published in an official journal for public circulation, be it physical or online, encouraging their distribution through additional outlets, including an official website.
- Enquiries may be addressed through enquiry or contact points or any other mechanism as appropriate and responded to within a reasonable period of time not exceeding 30 days.

6. INCREASING THE TRANSPARENCY OF EXPORT RESTRICTIONS: BENEFITS, GOOD PRACTICES AND A PRACTICAL CHECKLIST – 221
EXPORT RESTRICTIONS IN RAW MATERIALS TRADE: FACTS, FALLACIES AND BETTER PRACTICES © OECD 2014
Agreement on Agriculture, 1995 Innovation: Ex ante and cross-notification of restrictions is introduced.
- Members should notify the Committee on Agriculture before instituting a prohibition or restriction and consult with other Members having a substantial interest as importers, providing the necessary information. The Committee on Agriculture reviews the implementation of Members’ commitments on the basis of their notifications and the Secretariat’s documentation prepared to facilitate the review process. Also Members should notify promptly on new domestic support measures or modifications for which exemption from reduction is claimed. Members may bring to the attention of the Committee those measures that they deem should be notified by another Member.
Revised EC Submission on Export Taxes (TN/MA/W/101), 2008 Innovation: Widespread publicity of notifications to WTO bodies is mandated.
- Notifications pursuant to this Decision [on Procedures for the Facilitation of Solutions to Non-Tariff Barriers] should constitute regular items on the agenda of the relevant WTO Committees, giving adequate opportunity for an exchange of views amongst Members.
OECD Recommendation, 2012 Innovation: Active stakeholder engagement in rule making and consultation are mandated.
- Governments should actively engage all relevant stakeholders during the regulation-making process and designing consultation processes.
OECD Guiding Principles, 20059
Innovation: Stakeholders, actual and potential, national and international are encompassed.
- Consult with all significantly affected and potentially interested parties, whether domestic or foreign, where appropriate at the earliest possible stage while developing and reviewing regulations, ensuring that consultation itself is timely and transparent, and that its scope is clearly understood.
Canada-Colombia FTA, 200810
Innovation: Measure consultation and dialogue as well as transparency cooperation are mandated.
- Each Party should publish in advance the measure it proposes to adopt; and provide interested persons a reasonable opportunity to comment on it.
- Each Party should notify the other Party of any proposed or actual measure that the Party considers might materially affect the other Party’s interests.
- The Parties agree to cooperate in bilateral, regional and multilateral fora on means to promote transparency in respect of international trade and investment.
EFTA-Hong Kong FTA, 201111
Innovation: Procedures for preventative ad hoc consultations are introduced.
- The Parties should publish, make publicly available, or provide upon request, laws, regulations, judicial decisions, administrative rulings of general application as well as relevant international agreements.
- Parties agree to hold ad hoc consultations where a Party considers that another Party has taken measures that are likely to create an obstacle to trade, in order to find an appropriate solution in conformity with the SPS and TBT Agreements. Such consultations may be conducted in person or via videoconference, teleconference, or any other agreed method.
OECD Recommendation, 2012 Innovation: Comprehensive policy on consultation is mandatory.
- Governments should establish a clear policy identifying how open and balanced public consultation on the development of rules will be.
Agreement on Trade Facilitation, 2013 Innovation: Conditions for consultation of measures with stakeholders should be set out.
- Opportunities and a reasonable time period should be provided to traders and other interested parties to comment on the introduction or amendment of laws and regulations.
- Regular consultations between border agencies and traders or other stakeholders should be provided.
Technical Barriers to Trade, 1995 Innovation: Explanation and justification of measure are mandated.
- Notifications of measures subject to the rules of the TBT Agreement must contain an explanation of the measure’s intended purpose.
- Members introducing a technical regulation that may have a significant effect on international trade should explain to a requesting member the justification for its need.

222 – 6. INCREASING THE TRANSPARENCY OF EXPORT RESTRICTIONS: BENEFITS, GOOD PRACTICES AND A PRACTICAL CHECKLIST
EXPORT RESTRICTIONS IN RAW MATERIALS TRADE: FACTS, FALLACIES AND BETTER PRACTICES © OECD 2014
Import Licensing, 1995 Innovation: Notification of purpose and rationale of measure are mandated.
- Notifications of the institution of import licensing procedures should include, in the case of automatic import licensing procedures, their administrative purpose and, in the case of non-automatic import licensing procedures, indication of the measure being implemented through licensing.
EU - Korea FTA, 2010 12
Innovation: Regulatory cooperation and dialogue are mandated.
- The Parties should endeavour to consider the public interests before imposing an anti-dumping or countervailing duty.
- The Parties should strengthen their cooperation in the field of standards, technical regulations and conformity assessment procedures with a view to increasing the mutual understanding of their respective systems and facilitating access to their respective markets. To this end, they may establish regulatory dialogues at both the horizontal and sectoral levels.
OECD Recommendation, 2012 Innovation: Rationale and merit of measure should be made explicit.
- Governments should articulate regulatory policy goals, strategies and benefits clearly.
ASEAN Trade in Goods Agreement, 2009 Innovation: A multijurisdictional single reference point is open to the public online.
- An ASEAN Trade Repository (ATR, set for full operation by 2015) containing trade and customs laws and procedures of all Member States is established and made accessible to the public through the internet. It contains trade related information such as tariff nomenclature; MFN tariffs, preferential tariffs offered under this Agreement and other Agreements of ASEAN with its Dialogue Partners; rules of origin; non-tariff measures; national trade and customs laws and rules; procedures and documentary requirements; administrative rulings; best practices in trade facilitation applied by each Member State; and list of authorised traders of Member States.
APEC Model Chapter on Transparency, 2012 Innovation: Regional transparency standard is introduced.
- Parties should notify each other details of contact points, including those that provide assistance to the other Party and its interested persons. Also they should notify each other promptly of any changes regarding how to reach the contact points.
- Parties should assist each other in finding and obtaining copies, on a timely basis, of published measures of general application.
- Each Party should ensure that its contact points are able to coordinate and facilitate responses.
Agreement on Trade Facilitation, 2013 Innovation: Enquiry Points should respond to stakeholders at large.
- Establishment of one or more Enquiry Points to answer reasonable enquiries of governments, traders and other interested parties as well as to provide the required forms and documents.
1. Agreement on Trade Facilitation, WT/MIN(13)/36, WT/L/911, 7 December 2013.
2. Uruguay Round Ministerial Decision on Notification Procedures, 14 April 1994.
3. Recommendation of the OECD Council on Regulatory Policy and Governance, 22 March 2012.
4. Agreement on Import Licensing Procedures, 1 January 1995.
5. Agreement on Technical Barriers to Trade, 1 January 1995.
6. Agreement on Agriculture, 1 January 1995.
7. Agreement on Anti-dumping (Agreement on Implementation of Article VI of the General Agreement on Tariffs and Trade 1994), 1 January 1995.
8. NTB Textual Proposals, Draft Modalities for Non-Agricultural Market Access, Rev. 2, 20 May 2008.
9. OECD Guiding Principles for Regulatory Quality and Performance, 2005.
10. Canada-Colombia Free Trade Agreement, 2008.
11. European Free Trade Association States (Liechtenstein, Norway, Switzerland) - Hong Kong China Free Trade Agreement, 2011.
12. European Union - Republic of Korea Free Trade Agreement, 2010.
13. Comprehensive Economic Partnership Agreement between Japan and the Republic of India, 2011.
14. APEC Model Chapter on Transparency for RTAs/FTAs, APEC Ministerial Meeting, Vladivostok, Russia, 5-6 September 2012.

6. INCREASING THE TRANSPARENCY OF EXPORT RESTRICTIONS: BENEFITS, GOOD PRACTICES AND A PRACTICAL CHECKLIST – 223
EXPORT RESTRICTIONS IN RAW MATERIALS TRADE: FACTS, FALLACIES AND BETTER PRACTICES © OECD 2014
Annex 6.B.
Survey Questionnaire and Survey Responses
Questions / Items
Count of survey
respondents endorsing the item
Comments made (optional)
A. Availability of information
What kind of information should governments make publicly available about their policies/measures regulating the export of raw materials, once they have entered into force?
What the specific measure is 32
If the measure is an export tax, the rate of the tax 32
If the measure is an export quota, the amount of the quota 32 Some way of tracking the
consumption of the quota
If applicable to the measure, the eligibility criteria and procedures (e.g. if export quota, the method used for allocating the quota)
29
The name of the product(s) to which the measure/policy applies
32
The Harmonised System (HS) code of the product(s) 30
The date when the measure/policy entered into force 30
How long the measure/policy will be in force 30
The title of the enabling law/regulation 30 Publication name, date, source,
date coming into force, etc.
The rationale or objective of the measure/policy 30
If a measure has been changed, the reason for the change
30
A description of applicable administrative procedures (eligibility criteria, document requirements, application procedure, if relevant)
29
If exemptions or derogations from the measure/policy exist
29
Name of the authority in charge of administering the measure/policy
29
Any other information that should be made public about the measure or policy? (Optional)
Information about export bans
B. Accessibility of information
Making it easy to find and understand the information that is published
Make information available through the Internet (government website)
31

224 – 6. INCREASING THE TRANSPARENCY OF EXPORT RESTRICTIONS: BENEFITS, GOOD PRACTICES AND A PRACTICAL CHECKLIST
EXPORT RESTRICTIONS IN RAW MATERIALS TRADE: FACTS, FALLACIES AND BETTER PRACTICES © OECD 2014
Questions / Items
Count of survey
respondents endorsing the item
Comments made (optional)
Make the full text of the relevant law/regulation available
29 English (synopsis) version, too.
Publish information about the measure/policy in at least one of the official languages of the World Trade Organisation (English, French and Spanish)
32 Three respondents noted
English only
Provide enquiry point 29 By electronic means
(e-mail, chat, etc.)
Make relevant information accessible through a centralised place / portal
30
Any other features that would be helpful? (Optional)
RSS feed (news feed); a summary of measures in force
C. Learning about a policy/measure before it enters into force
Should information be made available in advance? 31 Notification service / newsletter
by email distribution list
If so, how long in advance of a measure’s entry into force, in a non-emergency situation? (please specify, e.g. 60 days)
- no answer (3 respondents)
- 15 days (1)
- 60 days (4)
- at least 60 days (15)
- 90 days (5)
- at least 90 days (1)
- at least 60-90 days (1)
- 6 months (2)
D. Learning about a policy / measure before it has been decided?
Should information be made available before a measure / policy is decided?
31
If so, what specific information should governments provide:
What measure/policy is being considered, and for what products
31 With HS information
Why the measure / policy is under consideration 28
Who decides the measure / policy 28
The date or time table set for a decision 30
An enquiry or contact point 30
Any other information that should be publicly available on a government’s website in advance of the entry into force of a measure / policy or before it has been decided? (Optional)
Whether stakeholders have been consulted
Notes: Sections A-B comprise the items of the tentative checklist developed in Section 6.5. The questions of Sections C-D cover additional items resulting from the expanded research described in Section 6.6. Survey results shown are for a total number of 32 respondents, not counting one respondent who sent an email message endorsing all items of the survey but did not return the completed survey itself.

7. MINERAL RESOURCE POLICIES FOR GROWTH AND DEVELOPMENT: GOOD PRACTICE EXAMPLES – 225
EXPORT RESTRICTIONS IN RAW MATERIALS TRADE: FACTS, FALLACIES AND BETTER PRACTICES © OECD 2014
Chapter 7
MINERAL RESOURCE POLICIES FOR GROWTH AND DEVELOPMENT: GOOD PRACTICE EXAMPLES
Jane Korinek1
7.1. Introduction2
Previous chapters have documented the nature, frequency and impact of restrictions on exports of minerals and metals. It has been shown that the mining sector is the context for a large number of the export restrictions currently in place. Moreover, exporting countries use export restrictions on industrial raw materials to achieve a variety of stated policy objectives, including:
3, 4
Increasing revenue, in particular government revenue coming from the extractive industries.
Offsetting exchange rate impacts caused by substantial exports of a small number of raw materials that are potentially volatile.
Fostering spillovers to other sectors, particularly in order to promote the development of downstream or upstream industries.
Controlling illegal exports or other activities, in response to concerns over lack of effective governance.
Enhancing environmental protection, or protection of citizens’ health.
Attempting to realise optimum mineral extraction levels, when conditions are deemed to create an incentive to extract too rapidly.
However, it was shown in Chapter 2 that export restrictions are not necessarily effective tools for achieving these stated policy goals and are in most cases not the most efficient way of doing so.
5 Many countries with large mining sectors and important natural resource reserves prefer
to regulate mining operations using alternative approaches that do not rely on border policies, but which seek to promote longer-term development and economic well-being by other means.
The extent of the task, however, should not be underestimated. Mineral resources present not only a formidable source of wealth but also a formidable policy challenge in order to maximise social welfare from their extraction. Some resource-rich countries have been very successful in developing their economies and managing their revenue streams effectively; others have faced major challenges in doing so. One hypothesis suggests that mineral resources are the cause of slower or biased growth rather than increased growth and development (see Box 7.1 on the resource curse debate). Some further hypotheses suggest that weaker institutions, lower spending on education or the volatility that comes with relying on exports of mineral resources, are the intermediate link between resource wealth and low growth in some countries, and that dealing with these factors could help to diminish the correlation between resource wealth and low growth.
Although there is some debate over the role of resource extraction in promoting or retarding growth, there is no debate about the importance of institutions and regulatory oversight to capitalise on the benefits of the mining sector for economy-wide growth and development. Natural resource

226 – 7. MINERAL RESOURCE POLICIES FOR GROWTH AND DEVELOPMENT: GOOD PRACTICE EXAMPLES
EXPORT RESTRICTIONS IN RAW MATERIALS TRADE: FACTS, FALLACIES AND BETTER PRACTICES © OECD 2014
Box 7.1. The resource curse debate
Resource abundance does not always bring sustained economic growth and development; it can have the opposite effect. There are a number of reasons for this, relating to the ways in which natural resource wealth differs from other sources of wealth. Unlike other sources of wealth, natural resources do not need to be produced. They simply need to be extracted, although there is often nothing simple about the extraction process (Humphreys et al., 2007, p.4). The generation of income from natural resources can therefore occur quite independently of other economic processes, without major linkages to the rest of economic activity and with low participation of the local labour force.
Resource-rich countries that experience a decline in previously buoyant sectors of the economy are said to suffer from the “Dutch disease”.1 The “disease” spreads in the economy as follows. A sudden rise in the value of natural resource exports produces an appreciation in the real exchange rate. This, in turn, makes exporting non-natural resource commodities more difficult and competing with imports across a wide range of commodities almost impossible. Foreign exchange earned through resource exports is used to buy cheaper imports, at the expense of domestic manufactures and agricultural products (the “spending effect”). Simultaneously, domestic resources like labour and materials move to the natural resource sector (the “resource pull” effect). Consequently, the cost of these resources on the domestic market rises, thereby increasing costs to competing sectors (Humphreys et al., 2007, p. 5). In this way, the extraction of natural resources sets in motion a dynamic that favours two domestic sectors – the natural resource sector and the non-tradable sector.
Many empirical studies have examined different aspects of the resource curse. In a pioneering study, Sachs and Warner (1995) find that resource-rich economies generally grow at a slower pace. Using a cross-section of 52 countries, they show that resource-rich countries had slower growth in manufacturing exports than those that were resource-poor, after holding constant the initial share of manufacturing exports in total exports. Stijns (2003) uses a gravity model to estimate the impact of a natural resources boom on real manufacturing exports and finds the resource curse hypothesis to be empirically relevant.2
The resource curse seems to be more damaging in some contexts than in others. In attempting to explain these differences, theories stressing political economy considerations such as rent-seeking behaviour and the importance of institutions have gained prominence. Studies suggest that resource abundance can hamper economic growth in the presence of weak institutions such as poorly defined property rights, poorly functioning legal systems, weak rule of law and autocracy (WTO, 2010, p. 93). Sala-i-Martin and Subramanian (2003) show that natural resource extraction has a strong negative effect on long-term growth through its weakening of political and social institutions. Mehlum et al. (2006) find that in countries with institutions of sufficient quality there is no resource curse. The most severe manifestation of the resource curse is the onset or continuation of civil conflict where warring groups fund their violent action with the proceeds of resource extraction, or through extortion of the resource extraction industry. This has led to various initiatives including the OECD Due Diligence Guidance for Responsible Supply Chains of Minerals from Conflict-Affected and High-Risk Areas.3
Another strain of the resource curse debate suggests that non-renewable resource rich countries that collect a substantial share of revenue from direct or indirect resource taxation may develop weaker non-resource tax systems. In some cases, this may be a rational choice whereby lower taxes are a means to share the wealth of natural resources with the current generation of taxpayers, but in others this may result from political economy considerations, in particular if the resource-extracting firms are small in number and incorporated abroad. It has been seen in some resource rich countries that personal income tax collected, for example, is lower than would be expected given the level of development and other factors (see, for example, Luong and Weinthal, 2006).
Some of the empirical work supporting the resource curse hypothesis has been called into question on grounds of endogeneity (Alexeev and Conrad, 2009, Wright and Czelusta, 2007) or omitted variables (Manzano and Rigobon, 2007). Endogeneity may be an issue due to the two-way relationship between a country’s economic growth and its natural resources exports. The omitted variable argument suggests that the GDP to debt ratio has not been properly accounted for and that the problem is public debt and risk management rather than resource abundance. Some opposition to the resource curse hypothesis comes from economic historians. Wright and Czelusta (2004, 2007) cite in evidence the development of the United States, which was for decades based on resource extraction. Similar cases can be made for Australia, Canada, Finland, Norway and the two countries examined in this chapter: Chile and Botswana.
Both proponents of the resource curse hypothesis and its detractors agree that the national context in which resources are extracted determines how and whether broader economic development takes place. The importance of strong institutions like balanced and enforced tax collection, oversight of the use of tax revenue, a climate of transparency and accountability, investment in education in order to allow economies to diversify, promotion of small and medium enterprise in order to foster backward and forward linkages, property rights including those of the natural resources, policy stability and political democracy cannot be overstated. _____________________________
1. This refers to the problem that beset the Netherlands in the 1970s after discovering natural gas in the North Sea. The Dutch manufacturing sector started performing more poorly than expect. 2. There is too much relevant literature for this section to be exhaustive. For a more in-depth review of the empirical studies in this area see, for example, Humphreys et al. (2007) or WTO (2010). 3. http://www.oecd.org/document/36/0,3746,en_2649_34889_44307940_1_1_1_1,00.html
7. MINERAL RESOURCE POLICIES FOR GROWTH AND DEVELOPMENT: GOOD PRACTICE EXAMPLES – 227
EXPORT RESTRICTIONS IN RAW MATERIALS TRADE: FACTS, FALLACIES AND BETTER PRACTICES © OECD 2014
wealth can benefit the countries in which it is found through appropriate taxation and use of tax revenue, linkages and spillovers into other sectors of the economy, and increasing investment flows. Understanding how some countries have managed to grow, in part thanks to their mineral resources sectors, can provide lessons for others.
6
It should be noted that this chapter is not a comprehensive overview of mining policies. It does not include many important aspects of mining regulation such as environmental policies, titling and allocation of natural resources, consultation with local communities, and health and safety requirements. This chapter includes some successful examples of policies in the mining sector that have been used to achieve the same objectives as those stated by users of export restrictions.
This chapter looks in more detail at two such countries, Chile and Botswana. Both countries have enormous mineral wealth, which contributes a substantial share of their exports, and both are known for their high level of regulatory quality and institutional rigour. Nonetheless, once we examine the detail of these countries’ experience, it is apparent that no approach can be applied as a one-size-fits-all solution and hence it is instructive to examine both these cases, to identify what they have in common and how they have adapted some general best-practice principles to their own national context.
Chile is a relatively small economy that has been growing swiftly for over two decades. Per capita growth was over 5% per year from 2010-13, well over the OECD average. The growth of the Chilean economy has been largely export driven and has in recent years been led by exports of mining products, mainly copper. Chile is the world’s leading copper producer and exporter with more than one third of the world’s copper production originating there. Chile accounts for 40% of total world copper trade.
Botswana is a large, landlocked, semi-arid country in Southern Africa. At the time of its independence in 1966, Botswana was also one of the poorest countries in the world, with almost no infrastructure and low indicators of health and education levels. It was declared a least developed country by the United Nations. The country`s ability to manage revenues from its vast deposits of natural resources has contributed greatly to its outstanding economic performance. The contribution of diamonds, copper and nickel to Botswana’s total exports is over 80%. Botswana’s prudent natural resource management has resulted in investment in infrastructure, health and education and accumulation of funds for future use (African Development Bank et al., 2013; Acemoglu et al., 2003). Botswana graduated from the list of least developed countries in 1995, one of only three countries to have done so (UN General Assembly resolution A/RES/49/133), and is now an upper-middle income country with per capita GDP about USD 9 537 in 2011.
The chapter is structured as follows. Section 7.2 contains a discussion of tax regimes and tax instruments in the context of the natural resource sector in both Chile and Botswana. Section 7.3 discusses how each country’s management of mineral resources tax revenue succeeds in stabilising the macro-economy, by offsetting the volatility that pervades global resources markets and dampening exchange rate impacts, and distributing the rents from their natural resources. Section 7.4 describes how both countries have sought to develop other sectors related to mining, capitalising on the comparative advantage in mining and creating additional jobs. Section 7.5 introduces the issue of illegal mining, another policy objective for which some countries use export restrictions. Section 7.6 summarises the main policy lessons to be drawn from the experience of each country.
7.2. Sharing the benefits of the mining sector through taxation
Considerations regarding taxation of the extractive industries
One of the main ways by which wealth from the mining sector is shared and can be used to promote growth throughout the economy is through taxation and subsequent investment and redistribution of tax revenue. An appropriate level of taxation implies that the government receives an equitable share of the profits from the mining sector while fostering a sustainable level of production and leaving room for sufficient investment in the sector. If the sector is taxed too heavily,

228 – 7. MINERAL RESOURCE POLICIES FOR GROWTH AND DEVELOPMENT: GOOD PRACTICE EXAMPLES
EXPORT RESTRICTIONS IN RAW MATERIALS TRADE: FACTS, FALLACIES AND BETTER PRACTICES © OECD 2014
investment and production are sub-optimal; if it is not taxed enough, an important source of budget revenue is needlessly foregone. When deciding the level and design of a tax system for the mineral resources sector, it is important to keep in mind the costs to mining sector firms in other mining countries that compete not only for market share but also for the allocation of investment funding. Tax costs are one of the factors determining the yield of any new investment, and firms will compare yields across countries and regions.
Natural resource taxation is particularly challenging, not only because of the potential for rent-seeking behaviour and political capture (see Box 7.1 for a reference to these issues in the context of the resource curse debate), but also because the extractive industries have certain characteristics that may make them more vulnerable to sub-optimal policies. Some of the relevant specificities of the resources sectors that must be borne in mind when reviewing taxation policy are given in the next paragraphs.
7
Extractive industries are characterised, firstly, by high sunk costs and long production periods. Exploration, development and exploitation of a mine can last decades and cost many hundreds of millions of dollars. Much of the investment occurs before any production has started. Once an enterprise has invested heavily, the investor has little choice should the tax regime change; as long as variable costs are covered, production is more profitable than ceasing activity. This problem of time consistency implies that investors in the extractive industries, wary of potential regulatory “hold up”, consider with particular importance the regulatory and political stability in host countries.
Revenue, and profits, in natural resource extraction industries differ greatly over the lifecycle of a project. It may seem reasonable to tax away a large share of the excess of revenue over operating costs. It must be remembered, however, that a resource project’s life is divided into three stages: exploration, development and extraction. The first two stages require substantial investment; the first stage also implies uncertainty about the size and existence of potential deposits. Taxable income only occurs in the third stage, but tax design needs to recognise the exploration and development costs of the project, as well as the substantial risk involved in the exploration stage. Part of what looks like rent in the third stage is the return on these earlier costs.
Even taking this into account, tax revenue can be substantial and can make a very significant contribution to government revenue. Given the sheer scale of potential government receipts, tax receipts are not simply a side benefit of resource extraction but one of the core benefits. Proper tax design is therefore even more important in the area of resource extraction than in other sectors.
Firms in extractive industries are often multinationals based outside the country where they are operating and have sizeable market power. The relative scarcity of technical skills, access to funding and the ability to assume risk over the long term implies that few firms worldwide are able to compete in large mining ventures. International firms often face tax liabilities in numerous jurisdictions and whether they can obtain tax credit in their home country for taxes paid in the country of operation affects the potential return on a project. The interactions between the various tax systems will impact the way in which multinational firms structure their operations.
One particular characteristic of the extractive industries is the exhaustibility of the non-renewable natural resources. Although new deposits continue to be found, there is inevitably a trade-off between present and future production and consumption, and optimal extraction rates calculated at present are a function of optimal extraction rates in future. The design of the tax system affects firm behaviour and incentives, and thereby impacts the balance of this inter-temporal trade-off.
In most countries, the mining sector is subject to a variety of different types of tax. What is important for motivating firm behaviour is their combined effect. Both the level and design of tax instruments influence mining firms’ decisions about future investments, the extent to which they undertake high-risk and high-reward exploration, the extent to which they develop operations, and exploitation decisions in the present and future.

7. MINERAL RESOURCE POLICIES FOR GROWTH AND DEVELOPMENT: GOOD PRACTICE EXAMPLES – 229
EXPORT RESTRICTIONS IN RAW MATERIALS TRADE: FACTS, FALLACIES AND BETTER PRACTICES © OECD 2014
Judging the optimal level of taxation (Otto et al., 2006) requires knowledge about current firm behaviour and potential trade-offs in future, as well as future revenue streams, which depend on future metal prices and production costs. Excessive taxes will dampen investment, resulting in sub-optimal levels of activity in any one or all of the three stages of the project. On the other hand, taxes that are too low represent foregone income for the government of the host country.
Box 7.2 summarises the different types of tax that are applied in the minerals sector. The optimal mix of these instruments involves finding a balance between advantages and disadvantages of each instrument with respect to economic efficiency, trade-offs between development at different stages of mining operations, and the optimal allocation of risks and rewards between the state and the exploiting enterprises. As for implementation of the tax regime, many other considerations come into play such as the ease of administration and the information gap between tax administrators and mining enterprise officials.
The choice and design of tax instruments affect firms’ decisions in many ways. An output-based royalty, for example, creates an incentive for firms to exploit mines that offer high-grade ore, but to stop exploitation once only lower-grade ores remain. Mining operations may therefore be closed sooner, and some mines be under-exploited, than if a profit-based tax is used. Depending on their structure, however, profit-based taxes can alter the economic attractiveness of new projects. They also give firms an incentive to avoid making any profit and have substantial compliance costs. Determining the basis on which to apply a profit-based royalty is more difficult than an output-based one.
The design of tax instruments, including royalties, affects the distribution of risk between firms and the state. Mining is a very risky activity: the probability of finding new, exploitable deposits at the exploration stage is low; metals prices are volatile and can make a seemingly good investment unprofitable. The development of new mines is a long-term activity that requires making judgements about a number of risky elements, including the investment and regulatory climate, future production costs and political and economic stability in the host country. Royalties are generally used to share risk between the public and private sectors since they are only paid when mining actually occurs, thus the public sector bears risk. Within the royalties structures, unit-based or value-based royalties shift more of the risk related to market prices to exploiting firms whereas profit-based corporate taxes shift a greater share of the risk to the state (Otto, 2000).
Different tax instruments affect mining operations along the life cycle of a project. Import duties on exploration and on development equipment tax mining firms before they are at the exploitation stage and therefore before they generate revenue. On the other hand, such taxes provide government revenue before the project reaches the exploitation stage. Revenue from unit- or value-based royalties commences as soon as operations enter the production stage. Profit-based royalties or corporate profit taxes provide revenue when exploitation is profitable. Each of these instruments offers different incentives for firms to invest and exploit deposits.
Tax regime stability is an important factor in firms’ decisions to invest in a mineral project. Firms that are considering investing hundreds of millions of dollars or more in a new mine are very wary of possible changes in the tax burden after their investment is made (Otto et al., 2006). Nonetheless, they are well aware of the difficulties of promising tax regime stability. First, a new government may be voted in once the project has started. Second, the bargaining power of mining firms is inevitably reduced once they have invested in the exploration and development stages as invested capital is sunk and cannot be withdrawn from the country. This phenomenon is captured in the so-called obsolescing bargain model (Vernon, 1974) and is well-documented with respect to the mining sector.
Tax stability may be somewhat easier to ensure if the fiscal regime includes an element of progressivity. “There may be circumstances – as with the very high oil and minerals prices of mid-2008, perhaps – in which outcomes are so extraordinary, relative to what might have been conceived when tax arrangements were entered into, that some renegotiation is seen even by investors as generally reasonable” (Boadway and Keen, 2010, p. 57). The very substantial profits

230 – 7. MINERAL RESOURCE POLICIES FOR GROWTH AND DEVELOPMENT: GOOD PRACTICE EXAMPLES
EXPORT RESTRICTIONS IN RAW MATERIALS TRADE: FACTS, FALLACIES AND BETTER PRACTICES © OECD 2014
Box 7.2. Most common taxes levied in the mining sector
Various different types of tax are levied on extracted minerals. Both the tax rate and the tax basis are important. Taxes are generally assessed either on the quantity of the mineral deposit or against the inputs or actions needed to exploit it, or on some definition of the net revenue extracted from the minerals, usually revenue minus qualifying costs (Otto et al., 2006).
Income tax: not specific to the mineral sector, the tax rate is commonly uniform for all tax payers, or for all tax payers at a given level of profit. In many countries, commercial tax payers are subject to a uniform tax rate; some countries have a progressive tax regime that imposes a higher rate to commercial entities with higher levels of profit. Tax policy often evolves through changes in the tax base rather than the tax rate.
Royalties: a payment made for use of a property or natural resource.1 This can be in the form of a tax on the amount of minerals extracted, either per physical unit of production – a specific royalty, or a percentage of the value of the mineral extracted – an ad valorem royalty. In some cases, the government collects a percentage of the value of production on a sliding scale based on price, i.e. a higher commodity price triggers a higher tax rate, which is referred to as a graduated price-based windfall tax. In the wider definition of profit-based royalties, the government taxes a share of the project’s profit (Hogan and Goldsworthy, 2010).
Surface rentals: in some countries, a fee is levied on economic activities like mineral extraction that use land. Such fees are often based on land area and are calculated by multiplying some standard rate for the type of activity by the land area being used. In some jurisdictions, this tax only applies to public land use (Otto, 2000).
Withholding taxes: many countries impose a withholding tax on remitted dividends. This generally takes the form of a percentage of remittances and can be a significant percentage. Although some governments define a high withholding tax rate, perhaps with the objective of promoting reinvestment, many enter into bilateral investment treaties or dual tax treaties of special arrangements with enterprises headquartered in key partner countries (Otto, 2000). Other types of withholding taxes are taxes paid on interest payments to foreign lenders and interest on payments for foreign services.
Import duties: Mining operations are capital intensive and the sophisticated machinery and equipment necessary for exploration, development and production are manufactured in few countries and generally imported. Import duties on such machinery have a direct impact on project feasibility in the early years of a mining project, i.e. before the exploitation stage.
Export taxes: In the middle of the last century, governments commonly imposed export duties on minerals in order to increase revenue and because their administrative reach did not allow estimates of profit or revenue (Otto, 2000). Export taxes have become more widely used, in particular on products of extractive industries, in recent years for a number of reasons (see Chapter 1).
Value-added taxes (VAT): Value-added tax is generally intended as a tax on final domestic consumption and should therefore have little impact on resource operations that are destined for export (Boadway and Keen, 2010, p. 44). In some countries, however, exported mining products are subjected to payment of VAT which is later reimbursed. Under some systems, VAT on inputs is also reimbursed. There have been cases of reimbursement that has not been done in a timely fashion, or cancelled for some products, which can be considered an indirect export restriction. ___________________
1. In most countries, minerals are owned by the state. Royalties are often placed on extractive industry firms since they exploit a non-renewable resource that they do not own. Alternatively, the minerals are owned by the landowner of the land where they are found. Royalties can be seen as a form of compensation for the exploitation of the property right.
that are made by firms, many of them multinationals, may bring a strong reaction from local populations for higher taxation. A progressive tax, or additional tax when profits are very high, may be one way of foreseeing such situations. Generating confidence in the stability of tax structures is very important for the sector, but is not always simple to achieve.
Transparency of taxation systems and requirements are of great importance in the sector, as are guarantees that tax revenue is used for government services. The Extractive Industries Transparency Initiative (EITI) is a multi-stakeholder effort to strengthen governance by improving transparency and accountability in the extractive sector. Firms agree to publish all payments they make to governments and governments reveal all revenue that they have collected from extractive firms (www.eiti.org). Payments and revenues are reconciled by an independent auditor. Such

7. MINERAL RESOURCE POLICIES FOR GROWTH AND DEVELOPMENT: GOOD PRACTICE EXAMPLES – 231
EXPORT RESTRICTIONS IN RAW MATERIALS TRADE: FACTS, FALLACIES AND BETTER PRACTICES © OECD 2014
initiatives are of particular importance in countries where governance has been challenged in the past.
8
The administrative capability of the tax authorities determines in part the optimal tax design. Even for well-performing tax administrations, some tax instruments can prove challenging due to asymmetric information regarding revenue, marginal and fixed costs, and so on. Profit- and income-based taxes are more difficult to implement than unit- and value-based royalties. In the case of profit-based taxes, auditors will be needed to confirm levels of revenue and of costs that can be deducted. Some of these procedures, such as assigning a value to depreciated capital, are complex, and require relevant competence on the part of the tax authorities.
Since extractive industries are often dominated by large multinational firms, they will make investment decisions concerning their global operations cognizant of differing tax policies in countries in which they operate. Although this is only one of many inputs into such decisions, some countries have chosen to coordinate their taxation of extractive industries on a regional level. The West African Economic and Monetary Union (WAEMU) has adopted a mining code that specifies some tax benefits that may serve to limit members’ ability to compete by offering stronger tax incentives (Boadway and Keen, 2010). There has been discussion of adopting common limits on tax benefits in the South African Development Community (SADC). A case for coordination could also be made for enforcing maximum common rates, rather than minimum requirements.
Taxation of the mining sector in Chile
The tax regime
Taxation of the mining sector in Chile falls into four main categories: tax on the profits of Codelco, the state-owned copper mining firm; corporate taxes on private mining firms; a mining tax instituted in 2006, from which the smallest firms are exempt; and a tax on copper exports of Codelco-owned mines that goes directly to the Ministry of Defence.
Codelco is entirely state-owned and finances a substantial share of the government budget. In addition to the corporate profit tax and the mining tax, paid by all or most firms, Codelco is subject to an extra profit tax of 40% and a 10% tax on exports. Finally, Codelco pays dividends to the government, normally set at 100% of profits. As a result, Codelco has had to rely on debt financing to fund a significant part of its capital needs. Although Codelco does not benefit from an explicit government guarantee, it has access to preferential rates due to its high credit rating. Its current large investment programme may, however, be incompatible with the zero retained earnings policy that has prevailed in the past.
9
Corporate taxes apply to mining firms as they do to other firms operating in Chile. The corporate tax rate is 20%. This was increased from 17% after the 2010 earthquake, applicable on income in 2011 (Ernst and Young, 2011).
10 The tax is applied to accrued income on a yearly basis.
It is paid on profit after acquittal of the specific mining tax. An additional tax of 35% is applied to income that is withdrawn, distributed as dividends or remitted abroad by non-resident individuals or legal entities. However, the legal entity receives a tax credit for the tax paid as corporate tax.
The tax base in Chile allows for deduction of accelerated depreciation and cumulative losses as well as interest payments in the total tax bill. Since the mining industry uses expensive capital inputs, the accelerated depreciation deduction is significant. This deduction allows capital-intensive enterprises to recoup a portion of their equipment costs by claiming large depreciation deductions in the early years of the expected life of the equipment. Allowing deductions for interest payments gives firms the incentive to finance projects with debt rather than equity.
The mining tax was instituted in 2006 and applies to metallic and non-metallic mining. Previously, there was no specific tax or royalty levied on the mining sector. The tax is progressive and is paid on profit, or operating income. The tax is between zero and 14% depending on the firm’s profit. This tax is not paid by “small” mining firms. The size categories of firms are defined according to the volume of their annual sales of refined copper: small mining firms have sales of 12 000 tons

232 – 7. MINERAL RESOURCE POLICIES FOR GROWTH AND DEVELOPMENT: GOOD PRACTICE EXAMPLES
EXPORT RESTRICTIONS IN RAW MATERIALS TRADE: FACTS, FALLACIES AND BETTER PRACTICES © OECD 2014
or less, medium-sized firms have between 12 000 and 50 000 tons per year, and large firms have annual sales of more than 50 000 tons.
The rate of the mining tax is progressive, ranging from 0.5 to 4.5% between 12 000 and 50 000 tons. For firms producing more than 50 000 tons of refined metal equivalent or more, the rate is 5% if their operating margin is less than or equal to 35%, and increases progressively. The tax is applied in to reach a maximum of 14% for firms whose operating margins exceed 85%. These rates for large firms apply since the 2010 mining tax law, before which (from 2006 to 2010), the tax rate varied from 4 to 9% depending on the firm’s profit share.
With the passage of the 2010 mining tax law (Ley no. 20.469), firms were allowed to continue with the previous tax rates for eight years. If they chose to apply the new tax rates immediately, however, they would pay the higher tax rate of 5% (in the lower profit margin bracket) for three years, and then revert to the previous sliding scale of 4-9% for the next eight years. This complicated arrangement is a compromise between Chile’s foreign investment statute,
11 which
guarantees (under certain conditions) that tax conditions remain invariable after a contract is signed, and the pressing need for government revenue after Chile’s disastrous earthquake in 2010.
Finally, the tax of 10% on Codelco’s exports is procured directly by the Ministry of Defence (see Box 7.3, and Marcel (2012) for its implications). After several years’ discussion over reform of this law, the Chilean Congress decided in June 2014 that part of the proceeds of this tax would be paid directly into the government budget, earmarked for the reconstruction of Valparaiso (recently devastated by fire) and of the northern region (also recently hit by earthquakes).
12
Box 7.3. Ley Reservada del Cobre1
The Chilean legal system includes some unpublished laws.2 One such law is No.13.196, the Ley Reservada del Cobre (LRC). The Ley Reservada commandeers 10% of Codelco’s sales abroad in foreign currency to be disbursed directly to the Ministry of Defence for use in financing equipment. In addition, the law establishes a minimum financial transfer of USD 180 million. If 10% of Codelco’s exports are not enough to cover this minimum threshold, the shortfall must be provided by the State.
The tax revenue, in US dollars, is deposited yearly in three separate accounts (used by the army, air force and navy) at the Central Bank of Chile. These accounts are maintained outside the treasury single account and are not subjected to congressional oversight.3
In the 20 years since the return to democracy in Chile, many congress delegates, political leaders and analysts have recognised the need to repeal or reform the Ley Reservada del Cobre. An initiative was proposed in 2009 which was to finance the armed forces on a yearly basis through the general budget but it was not approved. A new legal initiative was announced on 11 May 2011 to overturn this law and replace it with a multi-annual budget for the armed forces. In his 21 May 2012 public address, President Piñera pledged to repeal the law by the end of his term in office (www.gob.cl/destacados/2012/05/21/mensaje-presidencial-21-de-mayo-2012-chile-cumple-y-avanza-hacia-el-desarrollo.htm). _____________________________
1. Note that the information included in this box is the best available but cannot be confirmed due to the secret nature of the legislation described.
2. In August 2003, legislators introduced a bill that would declassify the secret decrees and laws enacted between 11 September 1973 and 10 March 1990. A year later, it was approved by the lower house and passed on to the Senate but has been held up in a Senate commission since that time. The bill however includes some exceptions to the declassification process, among them the Ley Reservada del Cobre. A somewhat puzzling section of the bill calls for declassifying these exceptions by 7 July 2014 (http://www.globalpost.com/dispatch/chile/090317/chiles-secret-laws?page=0,1).
3. A 2004 OECD publication indicated this practice was “highly inappropriate from a budgetary point of view”, while recognising that this is “a very sensitive area” (Blöndel and Curristine, 2004).
Chile’s taxation of the mining sector: International comparisons
Mining operations are often undertaken by large, multinational firms. In the headquarters of these firms, investment decisions regarding operations in their different subsidiaries are based on a comparative assessment of the availability and quality of the ore, future production costs, various

7. MINERAL RESOURCE POLICIES FOR GROWTH AND DEVELOPMENT: GOOD PRACTICE EXAMPLES – 233
EXPORT RESTRICTIONS IN RAW MATERIALS TRADE: FACTS, FALLACIES AND BETTER PRACTICES © OECD 2014
risk factors, and the regulatory environment, of which the tax system is one element. Firms try to compare potential projects in one jurisdiction with those in another, and they evaluate taxation alongside all the other factors that affect their estimate of potential returns from, and risks of, the various projects.
Comparing different countries’ and jurisdictions’ tax systems is a challenging undertaking. Tax rates in different countries are applied to different tax bases. Deductions can be substantial, particularly capital depreciation and interest payments. The amount of taxable income can depend on how much firms invest and how much they pay in dividends. Some taxes can be used as credit against others. The tax burden faced by a foreign firm may depend on the terms of a bilateral tax treaty between its home country and the country of operations.
Having said this, various estimates have been made of the effective tax rate in the mining sector. Korinek (2013) reports estimates based on private interviews with analysts and advisors to the industry in the range 25-35% of profits, depending on how much firms invest and the extent to which they distribute dividends. Interviews with representatives of mining firms suggested higher estimates of the effective tax rate, up to 39-40%.
Furthermore, these representatives stressed that some costs other than tax requirements (including energy,
13 water and labour) were considerably higher in Chile, which firms would offset
against a lower effective tax rate.14
Cochilco, Chile’s copper advisory body, reports the unit production cost of producing copper cathode in different regions using a similar methodology, finding that Chilean costs are indeed higher on average than those in other Latin American countries and Asia, but lower than those facing copper producers in North America, Oceania, Africa and Europe (see Korinek, 2013, Table 2, p.27).
Chile’s taxation of the mining sector: an appraisal
An overview of Chile’s system of taxation of its mining sector suggests that it is transparent, predictable, balanced and within a range acceptable to the firms with international reach that inhabit the sector. The corporate income tax rate of 20% currently applies to all firms in Chile. Firms are, however, allowed accelerated depreciation deductions, which are particularly important to the mining sector. The mining tax, although a tax on operating income, functionally replaces a royalty and applies only to the mining sector. The structure of this tax is progressive, including higher tax rates during times of very large profits (14% in cases where the profit margin is 85% or more of total revenue). This probably makes the tax more politically acceptable in times of very high copper prices, and forestalls political economy concerns when metals prices are high that the state, although the ultimate owner of the minerals, does not obtain a “fair share” of profits.
The mining tax is also progressive in that it does not apply to small mining firms, thus giving support to small firms that do not benefit from economies of scale, and may not hold concessions. These firms are also supported through technical assistance initiatives from ENAMI. One of the results of this support is that the mining sector (particularly the smaller less capital-intensive firms) offers employment opportunities in some remote regions of Chile where few job alternatives exist.
It is difficult to compare effective tax rates across countries. Firms, however, do not look at the tax system in isolation: they compare the whole package of production costs in the different jurisdictions where they operate. It seems that unit costs of production of copper mining firms in Chile are neither the most nor least onerous compared to those in other countries, but that higher costs may serve to offset potentially lower tax rates.
Suffice it to say that taxation of the mining sector, including the changes enacted in 2010, has not curtailed foreign investment in the sector. Mining received 38% of FDI entering the country in 2010, and significantly more than other countries in the region. Surveys of the mining industry confirm that Chile remains an attractive country in which to invest in mining. At the same time, the mining sector contributes significantly to government revenue, providing 21% of all tax revenue in 2010 (of which CODELCO contributed 13.1% of total government revenue), which is proportionately higher than its contribution to GDP The contribution of mining to government revenue is
234 – 7. MINERAL RESOURCE POLICIES FOR GROWTH AND DEVELOPMENT: GOOD PRACTICE EXAMPLES
EXPORT RESTRICTIONS IN RAW MATERIALS TRADE: FACTS, FALLACIES AND BETTER PRACTICES © OECD 2014
substantially higher than earlier: the mining sector contributed only 5.8% of government revenue on average during1995-2003.
Chile’s good governance is recognised globally. Quality of governance is probably enhanced by the overlapping institutional structure (see Annex 7A) where the Ministry of Mining and COCHILCO, the copper advisory body, are in close contact with private mining firms as well as ENAMI and SONAMI through the Mining Council. They are required to “have an ear to the ground” when decisions are made regarding the internal price of copper (at which ore is purchased by ENAMI, for example). The fact that the largest firm is state-owned, as well as the “invariability clause”, which implies certain tax stability, may facilitate the relatively consensual process undertaken by regulators of the Chilean mining sector. This approach is exemplified by the 2010 mining tax, which allows firms either to opt in to the tax changes voluntarily, or to continue with previous rates for a number of years.
One area where Chile’s tax collection procedures warrant review is the Ley Reservada del Cobre, where the state-owned enterprise awards 10% of its export earnings to the Ministry of Defence. The emergency modification to this law in 2014, referred to in the previous section, does not remove the need for it to be radically reformed in order to ensure the degree of oversight and public scrutiny of this income stream that would be expected in Chile’s present-day vibrant democracy.
Taxation of the mining sector in Botswana
The mining sector in Botswana is taxed through three separate instruments: a corporate profits tax, a royalty, and withholding tax on dividends. All private firms pay a corporate profits tax; mining firms, however, are subject to a specialised tax regime. The general corporate tax rate in Botswana has been 22% since 2011, whereas mining profits tax is calculated according to a formula: 70-1500/x, where x is the ratio of taxable income to gross income in percent (subject to a minimum of the general corporate tax rate). Mining firms may deduct capital expenditures made in the same year, with unlimited carry forward of losses. This formula effectively leads to a variable rate income tax, which increases with the profitability of the mining company. It is well designed, therefore, to capture mineral rents. It is also transparent and provides a degree of certainty to investors.
Royalties are calculated on the gross value of minerals as they leave the “mine gate”. Diamonds and other precious stones are subject to a 10% royalty rate; precious metals 5% and all other metals 3%. Payment of royalties commences when a mine goes into production, and, if the value of the goods produced is easily ascertained, this is a fairly straightforward tax to collect. There may be a problem, however, identifying the market price of rough diamonds as the market is very small and specialised and, within the De Beers network, quite firmly controlled. The issue of proper valuation of diamonds has been considered by the Botswana authorities and will be examined more fully later on in this paper.
Finally, investors pay withholding tax on dividends distributed to residents and non-residents of Botswana alike. Withholding tax is now 7.5% of the value of dividends.
In the case of Debswana, the joint venture between de Beers S.A. and the government of the Republic of Botswana (GRB), remaining profits are distributed equally between the GRB and De Beers SA within the terms of their joint venture (see Annex 7.B for a full description of the institutional structure of the mining sector). While the exact agreement between De Beers and the Government of Botswana is confidential, it is believed that the Government receives between 80 and 82% of the revenue after cost (including capital expenditure) of Debswana.
15 A very substantial
portion of the revenue from the diamond sector therefore goes to the GRB.
Botswana’s taxation of the mining sector: An appraisal
A major challenge facing many countries is proper implementation of their tax code. The tax system of some countries is very complex, and in some cases, contradictory. For example, high tax

7. MINERAL RESOURCE POLICIES FOR GROWTH AND DEVELOPMENT: GOOD PRACTICE EXAMPLES – 235
EXPORT RESTRICTIONS IN RAW MATERIALS TRADE: FACTS, FALLACIES AND BETTER PRACTICES © OECD 2014
rates and generous tax incentives often lead to low compliance and high administrative costs (Barma et al., 2012). A simplified tax code is therefore preferable. Botswana’s tax policy falls into this category: it is clear and relatively transparent, not least of all in its implementation.
16
Many lower-income, resource-dependent countries have weak tax-collecting capacity and face governance challenges with regard to their revenue administrations. Foreign firms or investors may have access to accounting and tax expertise that allows them to reduce their tax liability. One reason the GRB entered a joint mining venture with De Beers and, years later, obtained two seats on the Board of Directors of De Beers S.A., was to gain experience and understanding of the diamond mining industry in a globally competitive, state-of-the art setting. This knowledge has been of critical importance for Botswana and has allowed the country to benefit greatly through its understanding of the constraints and the potential of diamond mining in Botswana. Most important, however, for the purpose of this discussion, it has helped the GRB to design and revise its tax policy and more generally its minerals policy in a balanced fashion.
One of the most important issues facing mining investors is the stability and predictability of policies that affect them, including taxation policy. On this criterion, Botswana performs well: its tax code has remained stable and changes have been instituted in stages. Botswana benefits from a strong reputation for good governance and transparency so that changes in the tax regime when necessary can often be made without damage to investor confidence.
Generally, the business environment in Botswana is considered to be relatively free from corruption. Mining firms rank the legal process in Botswana highly in terms of fairness, transparency, absence of corruption, timeliness and efficiency.
17 In fact, Botswana’s legal system
outperforms those of two Canadian provinces (Quebec and Ontario), eight US states (Alaska, Montana, Minnesota, Idaho, Colorado, New Mexico, California and Washington) and several European countries (including Finland and France) as regards mining activities.
This issue is of prime importance as regards the extractive industries since investors are wary of making the substantial investments necessary up front without being relatively sure of future revenue. For investors, the extractive sector is risky: it is capital-intensive and long term, and with a high degree of uncertainty and unpredictability in demand and production, price volatility, and varying extraction costs as higher grade ores are exhausted. For host governments, exploration and extractions risks, as well as commodity price volatility, make the revenue flow highly variable and cyclical. Both investors and government, therefore, benefit from stable fiscal policies (Barma et al., 2012).
The De Beers-GRB joint venture has aligned the interests of the GRB and its private sector partner. It has allowed the GRB to benefit from global private sector expertise in all aspects of the management and strategy of the company while retaining ownership of the resources being extracted. There are, however, substantial risks involved in such public-private partnerships. The GRB assumes a large part of the risk by being an equal (or even minority) shareholder. For reasons of credibility, the government may not choose to let a mining firm in which it has equity fail. The GRB has opted for a 15% equity share in some mining firms in the past in accordance with its equity option that is available at the time of granting of mining licences. It has in the past stepped in and invested additional funds to ensure continuous operation in some of these cases. This sort of undertaking can quickly become very onerous; additionally, the government is probably not best placed to manage this type of operation.
Maintaining close contact with private sector ambitions and processes has also given the GRB the potential to influence its minerals policies to its advantage. One issue that has arisen regarding tax and royalty payments is correct valuation of rough diamonds. The value attributed to rough diamonds is of utmost importance for calculating the amount of royalty due, whereas within the De Beers system rough diamonds are valued through a controlled process using information from buyers under contract with DTC, its selling operation (see Annex 7.B for an overview of this process). Since the GRB has been closely involved in the overall management of the joint venture, and cognizant of the fact that valuation is of utmost importance to it, it has started to sell some of its rough diamonds through a parallel system outside the De Beers network. This new arrangement will

236 – 7. MINERAL RESOURCE POLICIES FOR GROWTH AND DEVELOPMENT: GOOD PRACTICE EXAMPLES
EXPORT RESTRICTIONS IN RAW MATERIALS TRADE: FACTS, FALLACIES AND BETTER PRACTICES © OECD 2014
be explored in more detail in a following section; its implications for royalty revenue are not negligible.
7.3. Sharing the benefits of the mining sector: Tax revenue management
General principles
It is commonly accepted that mineral production can either promote or hinder economic growth, depending in part on how governments manage and use the tax revenue they receive from the mineral sector (Otto et al., 2006). Therefore, although much of the public debate over mineral taxes focuses on the appropriate level of taxation, equally important for economies with rich natural resource endowments are the questions of tax revenue management and distribution. This section concentrates on revenue management, and principally on strategies to prevent revenues from the mining sector destabilising or distorting the country’s economy.
The main management challenges to economies relying on income from natural resource extraction stem from volatile metals prices and the presence of potentially substantial rents from mineral extraction. Volatile international prices for metals imply that profits from mineral extraction are subject to large fluctuations, with government tax revenue from the sector also cyclically linked to world market prices of metals. If high revenues in boom times allow governments to benefit from more favourable lending conditions on international markets, these revenue swings can be amplified. Surges in revenue create a strong incentive to increase government spending significantly, but money spent in this way is often poorly spent. Moreover, marked cycles in government expenditure can de-stabilise the economy as a whole, leading to greater consumption and over-heating during the boom, and low consumption and high unemployment during the bust. In general, the economic costs of such macroeconomic volatility are high (Humphreys et al., 2007, p.325). In order to dampen these cycles, strong mechanisms for revenue management are essential.
One way of countering these effects is for government to engage in counter-cyclical spending. This is facilitated by the use of a stabilization fund, which accumulates excess government revenue in boom periods and is drawn down to make up the shortfall in mining tax revenue in slack periods, thereby helping to smooth government expenditure. These funds might be held in foreign currencies (which avoids exacerbating the demand for local currency in boom periods) or other forms of shorter-term asset. If such funds are to be effective, however, “incentives need to be built in so that political leaders are not tempted to raid them” (Humphreys et al., 2007, p. 325).
Another risk that is strongly related to the threat of macroeconomic instability in economies that are heavily reliant on their metal exports is that their exchange rate may be strongly affected by substantial fluctuations in the value of their exports. When the international price of a metal increases steeply, the quantity of the metal demanded on the world market may fall, but if demand is inelastic, total export value increases. If these exports represent a major share of total export value, and they are valued in a reserve currency like the US dollar, the local currency will be affected, strengthening during the boom times and weakening during the bust. A strong local currency makes it more difficult to export other products, and therefore exports of sectors unrelated to the extractive industries will fall. This fall in demand, coupled with a potential rise in demand from the mining sector for additional services to fuel the boom means that other sectors of the economy are “crowded out” in the short term. When commodity prices fall and the national income generated from the extractive industries falls, fewer export sectors remain on which the economy can rely. In this way, rapid exchange-rate appreciation can set in motion the onset of “Dutch disease” (Box 7.1), permanently reducing the diversification of the domestic economy and leading to long-term distortions.
There are a number of ways that governments can counter-act exchange rate fluctuations, namely curbing excess spending and building up reserves in foreign currency (ideally in a stabilisation fund) or in other foreign assets during times of high commodity prices.
18 To attack

7. MINERAL RESOURCE POLICIES FOR GROWTH AND DEVELOPMENT: GOOD PRACTICE EXAMPLES – 237
EXPORT RESTRICTIONS IN RAW MATERIALS TRADE: FACTS, FALLACIES AND BETTER PRACTICES © OECD 2014
directly the effect of Dutch disease, government revenue can be invested “in alternative export sectors, in agriculture, and in education [to] help sustain growth and diversify risk” (Humphreys et al., 2007, p.325). However, engaging in strong expenditure domestically during the boom period can exacerbate the exchange problem, so investments need to be spread over time.
In all cases of tax revenue management, it is important to ensure that it is distributed with a high degree of transparency. This is particularly important where potential rents are very large. Better information on how the proceeds from extractive rents are distributed and according to what aims is of great importance, particularly when revenue falls again. The EITI, mentioned earlier in this chapter, gives guidelines for the reporting of revenue from the extractive industries and suggests how stakeholders can be more closely involved in the often contentious debate about their distribution.
Regarding the governance of funds established from government-owned financial assets or sovereign wealth funds (SWF) there are two sets of internationally sponsored principles, the Linaburg-Maduell Transparency Index and the Santiago Principles. The Linaburg-Maduell Transparency Index was developed by the Sovereign Wealth Fund Institute.
19 It awards one point
for compliance with each of ten principles. Currently, 51 funds are rated in terms of this index and the ratings are published, although not the details of which principles are met and which are not. The SWF Institute recommends a minimum rating of 8 in order to claim adequate transparency.
The Santiago Principles were developed by the International Working Group (IWG) on Sovereign Wealth Funds with the support of the IMF. The IWG agreed on a set of generally accepted principles and practices (GAPP) in 2008.
20 The IWG does not publish any assessment of
compliance of different SWFs with the Santiago Principles. However, the Oxford SWF project carried out an assessment of compliance in 2011.
Edwin Truman of the Peterson Institute of International Economics developed a scoreboard for SWFs. It uses 25 questions falling into four categories (1) structure, (2) governance, (3) transparency and accountability, and (4) behaviour, with the answers based on publicly available information. The rating was first carried out in 2007 (for the latest available update, see Bagnall and Truman (2013)). These different transparency indexes will be used in later sections.
Management of tax revenue in Chile
Chile adopted a structural balance rule in 2001, which involves estimating the fiscal income that would be obtained net of the impact of the economic cycle, and in particular of commodity price cycles, and spending only the amount that would be compatible with that level of income. In practice, this means saving during economic highs, when revenues known to be of a temporary nature are received, and spending the revenue in situations when fiscal income drops (Marcel et al., 2001, Rodríguez et al., 2007).
The 2006 Fiscal Responsibility Law (FRL) was an important step towards strengthening Chile’s fiscal framework (de Mello, 2008). The FRL created a legal framework for the structural balance rule, created a Pension Reserve Fund (PRF) to address pension-related contingencies; transformed the previous Copper Stabilization Fund into a broader sovereign wealth fund called the Economic and Social Stabilization Fund (ESSF) and introduced explicit, formal mechanisms for capitalizing the central bank. Responsibilities are allocated between the Ministry of Finance and the Central Bank of Chile: the former sets the investment policy for tax revenue with advice from a Financial Committee, and reports each month on the investments undertaken, return on investments, and the positions of the funds, whereas the latter is delegated as asset manager.
21
The structural balance indicator used in Chile calculates a measure of government revenue net of the cyclical impact of three variables: the level of economic activity and the prices of copper and molybdenum, a by-product in the production of copper. Thus, the structural balance reflects the tax revenue that would have accrued in a particular year if GDP were at its medium-term trend, and copper and molybdenum prices were on their longer-term (10-year horizon) trend level. These projections are determined by an independent rotating panel of 20 persons from the private sector

238 – 7. MINERAL RESOURCE POLICIES FOR GROWTH AND DEVELOPMENT: GOOD PRACTICE EXAMPLES
EXPORT RESTRICTIONS IN RAW MATERIALS TRADE: FACTS, FALLACIES AND BETTER PRACTICES © OECD 2014
and academia and (for the copper price) representatives of COCHILCO, the copper advisory agency, and CODELCO.
22
This rule imposes discipline on government expenditure in times of high revenue intake, providing for stable sources of revenue during periods of low government income. From 2001-07, successive governments held themselves to budget surpluses of 1% of GDP. In 2008, the surplus was 0.5% of GDP. In 2009, when the financial crisis was most strongly felt, the budget was in an actual deficit of about 4%.
23
The fiscal saving rule implies that government revenue is allocated to different funds, depending on the extent of the fiscal surplus. If the current fiscal surplus is 0.5% or less, it is allocated to the Pension Reserve Fund (PRF); surpluses from 0.5 to 1% could serve to re-capitalise the Central Bank of Chile (through 2011); revenue from surpluses above 0.5% are deposited in the ESSF since 2012 (Figure 7.1).
Figure 7.1. Chile: Allocation of fiscal savings by destination
% of GDP
Note that the recapitalisation of the Central Bank of Chile ended in 2011.
Source: Ministry of Finance of Chile.
The aim of the PRF is to provide back-up for the government’s guarantee of basic old-age and disability solidarity pensions and solidarity pension contributions. In other words, this fund acts as a supplementary source for funding future pension contingencies. The fund seeks to spread over time the future projected increases in these expenditures and explicitly incorporate this responsibility into state finances. No withdrawals of principal are allowed on the PRF before 2016 when it is estimated the capital accumulation will have reached sufficient levels.
24
The ESSF is intended to ensure that a part of the fiscal surplus is saved during times of high growth and strong commodity prices in order to finance the budget during times of lower than average growth and low commodity prices. In this way, the fund insulates social spending from the swings of the economic cycle and of the prices of copper and molybdenum, while harnessing public saving in order to strengthen the Chilean economy’s competitiveness (Rodriguez et al., 2007).
The ESSF was established in 2007 with an initial contribution of USD 2.58 billion, much of which came from its predecessor, the Copper Stabilisation Fund.
25 As of December 2012, the
market value of the ESSF was USD 15 billion. Contributions to the ESSF since its creation totalled USD 21.2 billion and withdrawals from the fund totalled USD 9.4 billion. The investments have generated additional resources for the total amount of USD 3.2 billion since the fund’s inception.
0
0.5
1
1.5
2
2.5
3
-0.5 0 0.2 0.5 1 1.5 2 2.5 3
Contributions
Effective fiscal balance
PRF Capitalisation BCCh ESSF

7. MINERAL RESOURCE POLICIES FOR GROWTH AND DEVELOPMENT: GOOD PRACTICE EXAMPLES – 239
EXPORT RESTRICTIONS IN RAW MATERIALS TRADE: FACTS, FALLACIES AND BETTER PRACTICES © OECD 2014
At the end of 2009, the two sovereign wealth funds represented around 48% of total financial assets held by the central government and were equivalent to about 125% of the country’s public debt (Marcel and Vega, 2010). Measuring the net position of government finances is key for the management of fiscal policy. Since 2003 Chile has used IMF’s 2001 Government Finance Statistics Manual (GFSM 2001). The GFSM 2001 integrates in a consistent manner stocks and flows, using the accrual basis criterion for assessing government transactions. It strengthens the methodology behind government accounting and increases consistency with private accounting practices and national accounts (Marcel and Vega, 2010).
Withdrawals from the ESSF to cover budget deficits in times of lower government revenue require approval from the Chilean Congress. Some withdrawals were made in 2009 to counter the negative effects of the financial crisis. Congress approves withdrawals and spending from the ESSF.
Until January 2012, the sovereign wealth funds (PRF and ESSF) were exclusively invested abroad in low-risk asset classes, similar to those used for international reserves. The strategic asset allocation for the ESSF is made up of 66.5% in sovereign bonds, 30% in money market instruments, and 3.5% in inflation-indexed sovereign bonds. As of 2012, the portfolio composition of the PRF is 15% in global stocks, 20% in global corporate bonds and 65% in global sovereign bonds. The currency composition of the funds is broken down as follows: 50% USD, 40% Euro, and 10% Japanese Yen.
26
It should be noted that revenue from the mining sector is not earmarked for the jurisdictions (municipalities, regional governments) of the territories where the mining industries are based, as is found in some other natural resource rich countries. The distribution of revenue at a national level in Chile may help to increase its efficiency, flexibility and strategic use.
In 2013, the ESSF was ranked third (with a score of 91) on the scoreboard of SWFs compiled by the Peterson Institute (Bagnall and Truman, 2013). In the second quarter of 2014, it shared top ranking with nine other SWFs according to the Linaburg-Maduell Transparency Index.
27
Lessons from Chile’s tax revenue management
By implementing its structural balance rule, Chile has stabilised its government expenditure, saving during boom years and spending its excess tax revenue during years of lower revenue. This makes expenditure more predictable over the medium term. Its success is a consequence of tying expenditure to structural rather than effective income which is far more volatile.
28 The benefit of the
stabilization fund was proven in 2009 when the Chilean government used part of the fund to cover its expenses due to lower tax income during the global financial crisis. The existence of the fund has ensured the financial sustainability of social policies, facilitating their long-term planning.
Curbing excess spending during boom years also helps to hold down the exchange rate of the peso which would tend to appreciate during such times. The sovereign wealth funds that receive excess tax revenue during times of high commodity prices are held in assets denominated in foreign currencies, thereby partially offsetting the upward pressure on the peso. This helps to avoid “crowding out” of other industries and exports that may have trouble competing globally if they undergo a high exchange rate. Investing in sovereign wealth funds abroad also helps to diversify risk.
29
The legal framework of the Fiscal Responsibility Law and the checks and balances that are in place help to ensure that the structural balance policies are followed. The Fiscal Responsibility Law institutes a formula, based on independent projections of GDP growth trend and long-term prices of copper and molybdenum, for determining a long-term sustainable level of government revenue and the corresponding sustainable level of government spending. During surplus years, excess tax revenue and profits from CODELCO are put into the two sovereign wealth funds.
These mechanisms encourage the sharing of political responsibilities and make it easier for policymakers to bear the political burden of not being able to meet social demands in a low-revenue environment and to limit the benefit of spending revenue windfalls in boom years (Arellano, 2006).

240 – 7. MINERAL RESOURCE POLICIES FOR GROWTH AND DEVELOPMENT: GOOD PRACTICE EXAMPLES
EXPORT RESTRICTIONS IN RAW MATERIALS TRADE: FACTS, FALLACIES AND BETTER PRACTICES © OECD 2014
By setting a formal budget target, the budget rule reduces discretion. The automatic nature of the rule has helped to lock counter-cyclical rigour into Chile’s finances.
“Chile’s SWFs are being managed transparently, and the government is committed to best practices in this area” (IMF, 2008, p.19). The authorities publish monthly reports on the size and portfolio composition of both funds, and more extensive quarterly reports discussing performance relative to financial market developments and established benchmarks. Moreover, both the Chilean authorities and their Financial Advisory Committee are committed to public discussion of the funds’ strategies, and all asset income and use of assets are included in the annual budget reports.
Chile’s counter-cyclical fiscal policy has reduced both uncertainty as to its medium-term performance and its need for foreign financing, as well as reducing the sovereign risk premium it has to pay when it does borrow on international markets. These are direct benefits that Chile has experienced from its sound management of tax revenue.
Chile’s counter-cyclical policies with respect to the exchange rate have helped to decrease volatility, especially during years when copper prices were high (Figure 7.2). Chile was rated highly (eight out of ten) in terms of currency stability in the Behre Dolbear 2011 ranking of countries for mining investment.
Figure 7.2. Chilean peso nominal exchange rate and copper prices
Source: IMF and OECD.
The stable, predictable, balanced policies put into place by Chile have been reflected in its high ranking in surveys of mining firms and investors. Chile received the highest score in the Behre Dolbear 2011 ranking of countries for mining investment, along with Canada and the United States. Chile was ranked number one out of 79 countries in terms of their absence of uncertainty concerning the administration, interpretation and enforcement of existing regulation by the Fraser Institute survey of mining companies in 2010/11.
Management of tax revenue in Botswana30
Fiscal institutions and policies in Botswana
Revenues from the minerals sector in Botswana are not institutionally segregated but are included in the general government revenue pool. Historically, the public expenditure policy framework specified that revenues derived from minerals, as they result from the sale of an asset, should be used to finance investment in other assets. The intention is twofold--both to preserve the country’s overall asset base, and to provide a basis for generating income that can replace mineral income when it eventually declines. A corollary to the asset replacement principle is that recurrent non-investment spending must be financed from recurrent, i.e. non-mineral, sources.
0
100
200
300
400
500
600
700
800
900
1000
0
1000
2000
3000
4000
5000
6000
7000
8000
9000
10000
Copper, grade A cathode, LME spot price, CIF European ports, USD per metric tonneCurrency exchange rate, CLP per USD (monthly average), nominal

7. MINERAL RESOURCE POLICIES FOR GROWTH AND DEVELOPMENT: GOOD PRACTICE EXAMPLES – 241
EXPORT RESTRICTIONS IN RAW MATERIALS TRADE: FACTS, FALLACIES AND BETTER PRACTICES © OECD 2014
The implementation of this principle has been monitored since 1994 by the Sustainable Budget Index (SBI), defined as the ratio of non-investment spending to recurrent revenues. An SBI value of more than one means that non-investment spending is being financed in part from mineral, or non-recurrent, revenues. If the SBI is less than one, mineral revenue is either being saved or spent on public investment, while recurrent spending is being financed from non-mineral (recurrent) sources; an SBI of one or less is therefore interpreted as being “sustainable”. In calculating the SBI, the normal budget classification of expenditure is adjusted slightly in that recurrent spending on education and health is classified as investment in human capital.
It should be noted, however, that the SBI has no statutory basis. Neither the SBI nor the principle underlying it are mentioned in the current National Development Plan, NDP 10, which spells out the general policy objectives for a six-year period (Government of Botswana, 2009). It turns out that, for most of the period since 1983/4, the SBI has been less than 1; however, it remained above 1 between 2001 and 2005, after having been on an upward trend for many years, indicating that part of the recurrent spending was financed by mineral revenues. Since 2006, the SBI has been well below 1, as the share of development, including health and education, spending in the budget rose sharply.
In recent years increased attention has been paid (particularly by the International Monetary Fund in Article IV reports and other economic assessments) to the non-mineral budget balance as an alternative indicator of sustainability. This indicator looks ahead to the post-mineral era. It rests on the Permanent Income Hypothesis, and implies that it is sustainable to run a non-mineral deficit the size of the permanent annuity that would be generated if mineral revenues were not spent but were invested so as to provide a permanent annuity income (Clausen, 2008).
Figure 7.3. Non-mineral primary budget balance, Botswana
% of non-mining GDP
Source: Korinek (2014), calculations based on data from MFDP.
The IMF estimates that, according to its methodology, the sustainable non-mineral primary balance is around 5% of non-mineral GDP (IMF, 2012a).
31 Figure 7.3 shows that the non-mineral
primary balance, as a percentage of non-mineral GDP, has been consistently and substantially above this level since the early 1980s.
32
An important institutional mechanism of public financial management in Botswana is the National Development Plan (NDP) process. NDPs establish general policy objectives and include all public investment projects over a six-year period and must be approved by Parliament. Box 7.4 describes the process whereby the content of each plan is established. Public funds cannot be spent on projects unless they are included in the NDP. The annual budget includes the provision of funds for recurrent spending for the year ahead, as well as the annual portion of development
-40%
-35%
-30%
-25%
-20%
-15%
-10%
-5%
0%

242 – 7. MINERAL RESOURCE POLICIES FOR GROWTH AND DEVELOPMENT: GOOD PRACTICE EXAMPLES
EXPORT RESTRICTIONS IN RAW MATERIALS TRADE: FACTS, FALLACIES AND BETTER PRACTICES © OECD 2014
project funding for projects in the NDP. This also has to be approved by Parliament. Public finance discipline is reasonably effective and historically there has been little off-budget spending, although the amount of off-budget spending financed by various off-budget “levies” and dedicated funds has been increasing in recent years.
33
There is an important legal restraint on the accumulation of public debt. Under the Stocks, Bonds and Treasury Bills act, Government borrowing is subject to a statutory limit of 40% of GDP with sub-limits of 20% of GDP for each of domestic and foreign debt and guarantees.
34 An
additional “fiscal rule” was introduced in the Mid-Term Review of NDP 9 in 2007, which sought to limit government spending to 40% of GDP on average throughout the economic cycle. It was, however, more of a guideline than an enforceable rule. According to sources in the MFDP, the 40% figure is to be brought down to 35% by the end of the NDP 10 cycle, and to 25% of GDP in the NDP 11.
Box 7.4. Assessing development priorities: From Kgotla to Parliament
The National Development Plan (NDP) establishes the policy objectives and outlines all public investment projects for the upcoming six-year period. Preparation of the NDP is overseen by a multi-sectoral Reference Group. This group consists of employees from the Ministry of Finance and Development Planning (MFDP), the Office of the President and representatives from the private sector, non-governmental organisations, the Vision Council and the Bank of Botswana.
The District Planners Handbook explains the National Development Planning process as “... a ‘bottom-up’ approach whereby the people express their needs, and these needs, in turn, should be the basis for district and, eventually, national planning...”. The most important step in the process is consultations with local communities by the 16 local authority administrations. These local authority administrations include 10 district councils, two city councils and four kgotla or town councils. Part of this consultative process is based on a traditional structure: in pre-colonial and colonial times, the kgotla was a public forum in which issues of public interest were discussed (Acemoglu et al., 2003). It is during these consultations that local issues are raised by the community and possible solutions are envisaged. In this process, all Batswana1, including those in remote areas, can have input in the NDP, at least theoretically. During consultations, workshops are held with the local Dikgosi (chiefs), Village Development Committee (VDC) members, Councillors, and representatives from the business community, religious groups, women’s organisations, youth, the disabled and farmers’ committees.
After episodes of consolidation and refinement, issues raised by the community during the different workshops are then included in the Local Authority Key Issues paper (LAKIP). Each of the 16 local authorities prepares a LAKIP, which then feeds into both the local administration’s Development Plan and the Sectoral Key Issues Paper (SKIP) of the Ministry of Local Government. The latter in turn feeds into the Macroeconomic Outline and Policy Framework of the next NDP. Proposed projects during the NDP planning process will, after screening, make up the Development Budget of the NDP.
The process of proposing projects for inclusion in the NDP is thus largely “bottom up”. However, not all projects proposed at the community or district level can be accepted for implementation. First, projects are screened to ensure that they comply with national policy guidelines. These mainly relate to the size of the local population and the type of facility proposed (e.g. a settlement or district with a small population may not get a full-scope secondary school or a tarred road, even if the community so desires, because the facility would be underused). Second, projects that meet policy guidelines are prioritised in accordance with the availability of financial resources at national level. Although detailed cost-benefit analyses are not carried out for some projects, this system has largely been driven by technical expertise and not political considerations (Pegg, 2010).
The tension between local desires and national policies has become more acute in recent years. Many of the main national infrastructure priorities have been met (roads, schools, hospitals, water, electricity, etc.), and much of the remaining demand comes from communities where further infrastructure provision may not be cost-effective. This is particularly a problem in Botswana which has large and sparsely populated rural areas. While some such projects do proceed, they are justified in social or political terms, and yield little economic return. It has been argued that the bottom-up process has led to too much emphasis on social projects and not enough on projects that support business (e.g. internet bandwidth).
However, not all projects included in the NDP are proposed by the community; some are “top-down” and driven by national policy needs (e.g. core utility and transport infrastructure such as the electricity grid and airports). Nevertheless, these “top-down” projects retain a democratic consensus because they are informed by national policies debated and passed in Parliament. ________________________________
1. Botswana’s people are called Batswana.

7. MINERAL RESOURCE POLICIES FOR GROWTH AND DEVELOPMENT: GOOD PRACTICE EXAMPLES – 243
EXPORT RESTRICTIONS IN RAW MATERIALS TRADE: FACTS, FALLACIES AND BETTER PRACTICES © OECD 2014
Public financial assets
From 1983/4 up to 1997/8, the budget of Botswana was in surplus every year, although since 1998/9, there have been budget deficits in eight of the 15 years, most notably in the three worst years of the financial crisis (2008/9 to 2010/11). Public finance decision-making has generally been cognizant of the limits imposed by absorptive capacity constraints, and the government has felt under no obligation to spend all mineral revenues when there were concerns about overheating of the economy or when suitable investment opportunities could not be found. Therefore, over the period as a whole, there has been considerable accumulation of financial assets. It is important to note that these assets are accumulated as a fiscal residual rather than through any process of targeting specific amounts of financial savings.
Historically the government has accumulated significant financial savings and undertaken very little borrowing. The government of Botswana’s net financial savings reached 88% of GDP in the late 1990s (Figure 7.4). These savings were then partially depleted in the early 2000s by the decision to establish a new pension fund for government employees, which involved financing the contingent liabilities accumulated under the previously unfunded government pension scheme. Net financial savings were partially rebuilt in the mid-2000s, recovering to around 40% of GDP, but were then substantially depleted during the deficit years of the global financial crisis, when the deficits were financed by a mixture of draw-downs of savings and new borrowing.
Figure 7.4. Botswana: Net public assets
Source: Authors’ calculations, based on data from MFDP and BoB.
Because financial assets are accumulated as a residual from the budget surpluses that result once spending decisions have been made, there are no rules regarding the payment of any mineral revenues into this fund, nor any rules regarding withdrawals. As a result, the fund could in principle be depleted quite quickly. Although no interest is paid on government savings balances, a nominal return is calculated and this is paid into the general government budget as a “dividend” from the Bank of Botswana.
The overall foreign exchange reserves are divided primarily into two parts: the Pula Fund and the Liquidity/Transactions Tranche. The latter is analogous to the foreign exchange reserves that central banks hold for the purposes of financing short-term foreign exchange needs for imports of goods and services, net income and capital outflows. The overall reserves change depending on balance of payment surpluses or deficits, and the size of the Pula Fund is determined as a residual once the Liquidity/Transactions portion of the reserves has been allocated, rather than through an
-20%
0%
20%
40%
60%
80%
100%
1997 1998 1999 2000 2001 2002 2003 2004 2005 2006 2007 2008 2009 2010 2011 2012
% of GDP
Gross Net of debt

244 – 7. MINERAL RESOURCE POLICIES FOR GROWTH AND DEVELOPMENT: GOOD PRACTICE EXAMPLES
EXPORT RESTRICTIONS IN RAW MATERIALS TRADE: FACTS, FALLACIES AND BETTER PRACTICES © OECD 2014
active policy of maintaining a specific level of assets. There are no other rules prescribing the level of payments into or withdrawals from the Pula Fund.
The Pula Fund is sometimes referred to as Botswana’s Sovereign Wealth Fund (SWF). It has some similarities with other SWFs in that it is managed for long-term investment returns rather than short-term liquidity purposes. However, unlike some other SWFs it is not an independent entity; although it was established in its present form under the Bank of Botswana Act 1996, the Pula Fund has no separate legal status or balance sheet of its own.
Although the GRB’s savings have fallen as a percentage of GDP, both Pula Fund reserves and total foreign exchange reserves of the GRB have risen steadily with the except in the 2001-2003 period, when a previously unfunded government pension liability was fully funded, and during the 2009 economic crisis (Figure 7.5).
Figure 7.5. Botswana: Pula Fund and total foreign reserves
Source: Bank of Botswana, authors’ calculations.
Although the Pula Fund is not a separate legal entity, a nominal Pula Fund Balance Sheet and an Income Statement are included in the Notes to the Bank of Botswana’s Annual Accounts. The accounts do not however explicitly present the rate of return on the Pula Fund.
The Bank of Botswana’s Annual Report and Accounts provides some information on the asset composition of the Fund, its notional balance sheet and an income statement. This information is provided annually, and the value of the Fund is published monthly as part of the Bank’s balance sheet. No reports are published specifically on the Pula Fund, and no information is provided on Fund transactions. As part of the foreign exchange reserves, the Pula Fund is invested entirely offshore. The detailed currency composition of investments is not published, but the Bank of Botswana uses an SDR benchmark for constructing the investment portfolio.
The bulk of the Pula Fund is invested in bonds, with the second largest share in equities. Over the past four years (2008-2012), the composition of the Pula Fund has averaged 71.5% bonds, 25.9% equities, and 2.6% other assets. Fund managers have moved to invest a slightly higher percentage in the last year in equities, bringing the share to 65% bonds and 35% equities.
No public information is provided on the identity of the Pula Fund managers or on their asset allocation, mandates or performance, or on detailed asset holdings. Half of the short- and long-term fixed income investment instruments of the liquidity portfolio and the Pula Fund are managed by the Bank and half are managed by its nine fund managers.
0
10000
20000
30000
40000
50000
60000
70000
80000
1996 1997 1998 1999 2000 2001 2002 2003 2004 2005 2006 2007 2008 2009 2010 2011 2012
P million
Pula Fund Fx Reserves

7. MINERAL RESOURCE POLICIES FOR GROWTH AND DEVELOPMENT: GOOD PRACTICE EXAMPLES – 245
EXPORT RESTRICTIONS IN RAW MATERIALS TRADE: FACTS, FALLACIES AND BETTER PRACTICES © OECD 2014
Regarding the transparency of the Fund’s management, the SWF Institute lists a total of 69 SWFs around the world as at mid-2013. Of these, a smaller number are rated in terms of the Linaburg-Maduell Transparency Index. The Pula Fund obtained a score of 6 in the second quarter of 2014, placing it joint 26th out of 51 rated funds. The SWF Institute recommends a minimum rating of 8 in order to claim adequate transparency. Although the International Working Group that developed the Santiago Principles does not publish any assessment of compliance of different SWFs with the Santiago Principles, the Oxford SWF project carried out an assessment of compliance with these principles in 2011. The Pula Fund was rated 22
nd out of 26 SWFs, with only
15% compliance.
The Revenue Watch Institute compiles a Resource Governance Index (RGI) which measures the quality of governance in the oil, gas and mining sector of 58 countries.
35 The RGI
incorporates various aspects, including an assessment of mineral revenue management and natural resource funds. Botswana’s overall assessment on the RGI was rated as “weak”, with a score of 47/100, in part because of the poor quality of reporting for the Pula Fund.
Botswana is not a member of the Extractive Industries Transparency Initiative (EITI) although De Beers S.A. is a member. The GRB’s reluctance to subscribe to the EITI reflects a number of factors, including the historical secrecy of the diamond industry, the confidentiality of the revenue sharing agreements with De Beers, and a desire not to give away confidential commercial information to competitors.
36
Public expenditure patterns37
Public expenditure in Botswana has generally been counter-cyclical relative to revenue streams. Botswana has therefore been able to smooth out government spending despite the volatility of natural resource revenues by accumulating reserves during periods of relatively high commodity prices and drawing them down when prices slacken (IMF, 2012c). Policies pursued in the context of the Medium Term Fiscal Framework are expected to enhance the certainty and stability of government expenditures from the volatile revenue streams.
Expenditure on the different classes of assets can easily be traced, reflecting policy priorities as laid out in NDPs and other policy documents. Total mineral revenues at 2010 prices over the period 1983/4 to 2012/13 were P 347 billion. These can, in principle, be apportioned between spending on the different types of assets, or on recurrent spending in the case that the SBI constraint has not been observed.
Figure 7.6. Botswana: Gross accumulated mineral revenues and public investment
Source: Authors’ calculations, based on data from MFDP.
0
50
100
150
200
250
300
350
400
1983/84 1985/86 1987/88 1989/90 1991/92 1993/94 1995/96 1997/98 1999/00 2001/02 2003/04 2005/06 2007/08 2009/10 2011/12
P billion (real, 2010 prices)
Education Health Infrastructure Mineral revenues acc

246 – 7. MINERAL RESOURCE POLICIES FOR GROWTH AND DEVELOPMENT: GOOD PRACTICE EXAMPLES
EXPORT RESTRICTIONS IN RAW MATERIALS TRADE: FACTS, FALLACIES AND BETTER PRACTICES © OECD 2014
Evidence presented in Korinek (2014) shows that, on average over the whole period, if not in individual years, mineral revenues were entirely devoted to investment in physical and human capital assets, and were not used to finance recurrent spending, which was financed by recurrent revenue (Figure 7.6). Public investment spending was allocated between physical assets (44%), education and training (42%) and health spending (14%).
Physical investment, excluding health and education facilities, has been undertaken across a range of assets with the three largest areas of investment being electricity and water (18%); housing and urban infrastructure (15%) and roads (13%).
Lessons from Botswana’s management of mineral revenues
Botswana has risen from least-developed country status to that of an upper-middle income country, in large part due to its handling of revenue from the minerals sector. The over-riding principle motivating expenditure from mineral sector revenues has been that these revenues result from the sale of an asset and should therefore be used to finance investment in other assets. An examination of the expenditure of minerals sector revenue in Botswana over the last three decades confirms that it has been spent in its entirety on human and capital investment and has not been used to finance recurrent spending. It is all the more remarkable that this has occurred without any formal partitioning of government revenue streams, or earmarking of mineral revenue for particular uses.
Use of mineral revenues for the purpose of investment in Botswana’s people and infrastructure has been monitored using Sustainable Budget Indicator (SBI). This has been the principal indicator of the use of revenue from mineral resources for investment in human and physical capital.
Public investment spending over the last three decades has been divided between spending on infrastructure, and on education and training (roughly equal shares) as well as on health. Investment on non-health and non-education related infrastructure has been undertaken across a range of assets with the three largest areas of investment being electricity and water, housing and urban infrastructure, and roads. Education expenditure has also been substantial. In addition to expenditure on local schools and the University of Botswana and other tertiary training, the GRB finances tertiary education overseas for many of its eligible citizens.
The decision-making process by which development priorities and expenditure on projects have been determined is an inclusive one. Expenditure on investment projects is determined within the National Development Plan process: no projects are financed outside the NDP process. The NDP process is bottom-up as well as top-down, and provides the forum where development projects are proposed and negotiated. Discussion about priorities takes place at all levels of government and civil society. Priorities and projects are proposed by inter-ministerial groups at the highest level of government; by local government authorities; by interest groups and representatives of different groups within the population; by the business community; and by local chiefs. Most of the projects retained in the six-year development plans come from bottom-up consultations, although not all projects proposed at that level can be accepted.
This broadly based consultative system with consultations from the village level to the highest levels of government is a more open process than in many other countries. Stakeholders generally, therefore, feel committed to the resultant plan, with its outline of priorities and retained projects.
As a result of these policies, Botswana improved its socio-economic performance considerably over the past three decades. Access to education, health services, sanitation, and clean water increased dramatically, despite a widely dispersed population and low initial levels. About 95% of the population had access to clean water by 2004. Virtually all Batswana children now attend junior-secondary school (as compared with only 100 secondary school graduates in total at independence) and the adult literacy rate is more than 85% (Maipose, 2008).

7. MINERAL RESOURCE POLICIES FOR GROWTH AND DEVELOPMENT: GOOD PRACTICE EXAMPLES – 247
EXPORT RESTRICTIONS IN RAW MATERIALS TRADE: FACTS, FALLACIES AND BETTER PRACTICES © OECD 2014
The GRB has felt no obligation to spend all mineral revenues when there were concerns about overheating of the economy or when suitable investment opportunities could not be found. Expenditure patterns in Botswana have generally been counter-cyclical or acyclical relative to revenue streams. Botswana has therefore been able to smooth out government spending despite the volatility of natural resource revenues by accumulating reserves during periods of relatively high commodity prices and drawing them down when prices slacken or demand for diamonds drops.
These tendencies have provided Botswana with relative macroeconomic stability and avoided the boom-slump cycles that characterise many mineral-based economies (Lewin, 2011). The periodic slowdowns in the diamond industry have thus by and large not been passed on to the rest of the economy.
In order to save some of the revenues from its minerals assets for future generations and for shorter-term stabilisation purposes, the GRB created a long-term investment facility called the Pula Fund. The Pula fund is managed for long-term investment rather than short-term liquidity purposes. As part of the foreign exchange reserves, the Pula Fund is invested entirely offshore. The Bank of Botswana uses an SDR benchmark for determining the currencies in which the Pula Fund is invested. Investing offshore in foreign-denominated assets helps prevent pressure being exerted on the local exchange rate, an essential factor in preventing the “Dutch disease” phenomenon that besets many minerals exporters. Having said that, the lack of transparency surrounding this SWF raises questions as to whether its management could be improved further.
7.4. Creating spillover effects: Development of mining-related activities
Leveraging comparative advantage in extractives
Beyond the direct impact on resources covered in the previous sections, the mining sector has the potential to create spillover effects by contributing to the development of mining-related activities that cater to domestic and international extraction firms, or by promoting the development and involvement of local firms in downstream, value-adding activity. There is an incentive to explore the scope for creating such spillovers in order to leverage a country’s comparative advantage in natural resources to expand into sectors that are vertically or horizontally close to the extractive industries.
Mining sector participants in Chile do not believe that Chile has a comparative advantage in promoting downstream industries, i.e. increasing its capacity for further refining of copper.
38 In these
industries, margins are lower, energy inputs are substantial, and further refining of products is thought to be undertaken more efficiently closer to final markets. Instead, Chile has opted for a strategy of supporting sectors that service its mining operations, both in terms of equipment and services.
Chile has, therefore, focused on upstream or horizontal activities, which typically results in what is called a mining cluster. There are various successful examples of such clusters in other countries that, starting with mineral wealth or wealth in other natural resources, have developed services, capital goods and intermediate goods industries that support mining activities. In the United States and Canada, for example, a mining equipment industry emerged. In Australia, mining technology services have developed: over 60% of software used in mining globally is provided by Australian firms. Finland has also leveraged its comparative advantage in mining to develop mining services by fostering close collaboration between producing firms, the public sector and universities (see Korinek (2014) for more information).
Botswana has chosen to concentrate on its processing sectors. The GRB has consistently, over the years, attempted to expand opportunities for Botswana firms down the diamond value-chain in order to extract greater value from its diamonds and to create jobs. It calls this process “beneficiation,” a word that is used most commonly in Southern Africa and most commonly in reference to the diamond industry. Beneficiation entails undertaking more and more processing within the country where diamonds are extracted.

248 – 7. MINERAL RESOURCE POLICIES FOR GROWTH AND DEVELOPMENT: GOOD PRACTICE EXAMPLES
EXPORT RESTRICTIONS IN RAW MATERIALS TRADE: FACTS, FALLACIES AND BETTER PRACTICES © OECD 2014
Developing mining-related goods and services in Chile39
Organisational change has made it more feasible than in the past to develop a cluster that serves local mining activities and exports goods and services to the global mining industry.
40 In
mining in particular, firms have become more focused on their core business and have outsourced their remaining activities. In the past, mining companies were self-sufficient and supplied the majority of intermediate goods and services that they required. Thirty years ago, Codelco, the state-owned copper enterprise, had one employee from a contracting company for every five employees. Currently, for every five Codelco employees, seven contracted employees provide services in company facilities. This is the same ratio found in large, private mining companies. The trend towards outsourcing in Chilean mining, and the role of service providers, is more pronounced than in other countries. In Chile, the proportion of contracted workers with respect to the total mining labour force is over 60%; in Australia and Canada, it is 24%, and in the United States, 8% (Fundación Chile, 2011). This evolution in mining companies’ organisation has allowed a number of Chilean companies specialising in the provision of services to develop competitively. Indeed, several of them have started to export their services.
Apart from changes in company organisation, the demand for new technologies and knowledge has been growing and will continue to do so. Exploited minerals are of a lower grade with a more complex mineralogy, and they are deeper and will require underground mining, which is increasingly operated remotely. Also, environmental sustainability requirements demand more efficient use of basic resources like water and energy, and better treatment of waste and emissions. This poses new challenges and requirements, and opens up vast potential for technological development and the provision of specialised services. These are knowledge-intensive services due to their highly specialised nature and because of the need for continuous innovation and incorporation of technologies in order to find new, more efficient solutions for mining operations (Urzua, 2007).
Using the size of the mining sector as an indication of the potential for exports of mining-related goods and services suggests that compared to Australia, the United States or Canada, Chilean exports of mining-related goods and services could significantly surpass current levels. If Chile attained the same level of mining-related activity exports as a percentage of total mining exports that Canada has achieved, this would imply an increase of more than ten times the current level.
Chile is in the process of developing its mining services industry. Historically, the first step was to substitute imports of intermediate goods and services.
41 The proportion of domestic
intermediate goods rose from less than 25% in the 1950s to around 60% towards the end of the century.
42 This expertise led to greater exports of mining sector supplies. In the last 12 years,
exports of products and equipment used in the extractive industries grew from less than five to almost USD 300 million. The main supplies currently exported are grinding rolls, machinery and equipment, spare parts for machinery, equipment for mineral processing, and machinery and tubes for perforation and drilling (source: National Customs Service).
Exports of engineering services, which were approaching USD 10 million at the beginning of the 21
st century, exceeded USD 200 million in 2011. Growth is even greater if we consider the
previous import substitution of these services, which has fallen over the same period. The engineering of large mining projects built in the 1980s and 1990s was carried out abroad, while in the last 15 years, it has been carried out primarily in Chile. The activity of engineering companies, measured in person-hours, increased by 20% between 1992 and 2003, and between 2003 and 2011 grew by 115%. The main growth by far has been seen in mining-contracted engineering, which represented more than 50% of the total in 2011.
43
According to a recent study of engineering services in the Americas by a team from Duke University, “[the] Chilean engineering sector is strongly positioned within the Americas to take advantage of new opportunities emerging in the region. Chilean engineers are widely recognised by leading global firms for their excellent technical skills and they are considered to be world leaders in engineering for mining” (Fernandez-Stark et al., 2010a and 2010b). Chile is host to a

7. MINERAL RESOURCE POLICIES FOR GROWTH AND DEVELOPMENT: GOOD PRACTICE EXAMPLES – 249
EXPORT RESTRICTIONS IN RAW MATERIALS TRADE: FACTS, FALLACIES AND BETTER PRACTICES © OECD 2014
number of global Centres of Excellence and firms draw on their Chilean staff to make decisions on projects around the world. Starting in the 1990s, several international firms began subcontracting local Chilean firms or forming joint ventures. Fluor, Bechtel, SNC Lavalin, AMEC and SKM Minmetals are among the firms that established greenfield operations in Chile and grew their offices organically. Currently, there are around 16 000 professionals working in the engineering consulting industry in the country, 70% of them in mining projects.
Developing a qualified workforce for the sector
The level of qualification of the workforce is a critical factor in explaining the different degrees of success that countries have had in increasing the impact of mining on their development. A recent study of human resource needs commissioned by the association of large mining companies concludes that “the gaps (or projected deficits) of the qualified labour force constitutes probably the greatest challenge that Chilean large-scale mining is facing for the 2011-2020 decade” (Fundación Chile, 2011). It is estimated that mining companies and large-scale mining contractors will have to increase their resources by 53% between 2012 and 2020, considering only extraction, processing and maintenance operations, a situation that becomes especially critical at specific levels and positions.
Although Chile saw significant development in higher education during the 20th century,
insufficient numbers of young people are enrolled in technological fields, and particularly in programmes related to mining, metallurgy and geology. This is a potentially serious limitation for the cluster's development and may even prove to be a limitation for existing mining operations. Chilean engineers are well qualified but insufficient in number to fulfil domestic and international demand. When Bechtel decided to hire extensively in 2007, for example, the labour pool for engineers in the mining sector did not meet the demand. Another factor is the international deficit in this area and the fact that many foreign companies recruit professionals in Chile.
There is a clear need for higher education institutions to work in close contact with the industry to increase enrolment in this area. In order to increase the impact on the development of its mining resources, it will become necessary to raise one or two consortia of Chilean universities to a high level of excellence, bringing in the best students from Chile and from abroad. Master's and Doctoral programs related to mining increased from 14 in 2002 to 27 in 2006. However, this substantial increase was marked by an excessive multiplication of programmes and a fragmentation of efforts. It would be advisable to have one or two world-class programmes drawing both Chilean and foreign students.
44
Public-private initiatives for mining development
In Chile, the government and the production sector have only recently begun promoting initiatives to foster the development of the mining cluster. During the first decade of the 21
st century,
a series of diagnostic studies were conducted on the current state and potential of this cluster and how to best promote it. A low level of cooperation among stakeholders was observed, as was the absence of a shared vision of how best to develop the sector (Boston Consulting Group, 2007). Moreover, it was considered that without the active participation of large mining firms the cluster is unlikely to develop (Meller and Lima, 2003). These studies suggest that export and development opportunities can be found in niches of the value-chain that are not being served by the large, global firms that currently supply the core goods for the mining industry. It was estimated that exports of such niche goods and services, if they were to be exploited by new or existing Chilean firms, could more than triple in five years to reach USD 1 billion (Boston Consulting Group, 2007).
A substantial share of the innovation undertaken by Chilean firms is adaptive.45,46
Local firms, working closely with teams in the large mining firms, solve the challenges they face during their operations on the ground. Such innovation by proximity is a niche that global firms that manufacture mining equipment cannot fill. A partnership between BHP-Billiton, Codelco and Chilean equipment and services providers is building on these opportunities. These two large mining concerns partner with smaller firms that offer goods or services that they need and that are chosen for their ability to find innovative solutions to well-identified problems facing the industry.

250 – 7. MINERAL RESOURCE POLICIES FOR GROWTH AND DEVELOPMENT: GOOD PRACTICE EXAMPLES
EXPORT RESTRICTIONS IN RAW MATERIALS TRADE: FACTS, FALLACIES AND BETTER PRACTICES © OECD 2014
These partnerships are expected to develop local providers into world-class suppliers (see Box 7.5, for more details).
Another example where proximity and adaptive innovation have synergised is in responding to challenges created by the specific geography or geology of each mine. For example, Codelco operates the El Teniente mine, which is by far the largest underground copper mine in the world. This has given Codelco comparative advantage in state-of-the-art technological expertise needed to operate such a large underground mine, and it has developed local research and development capacity in that area. Codelco signed an agreement with Rio Tinto, a leading international mining group, three years ago to invest jointly in such development to solve some common challenges.
Box 7.5. BHP-Billiton, Codelco programme to develop world-class suppliers*
This programme, originally designed by BHP-Billiton, aims to increase the capacity of domestic suppliers and contribute to Chilean economic development, while increasing the competitiveness of its own mining operations. World-class suppliers are defined by their ability to export knowledge-intensive services and technology to other mining countries and sectors of the Chilean economy.
The programme brings together suppliers with development potential in order to solve, together with the mining firm, the problems that have been previously identified and prioritised by mining operational areas. In this way the programme seeks to create development opportunities in local firms, encouraging and preparing them to compete globally.
After identifying needs for specific innovative solutions and selecting participants from among the potential providers, the programme provides a framework to test ideas within real-time operations. In addition, it provides external consulting to give suppliers advice and training on competencies required to achieve world-class business performance, and promote links with local research centres and universities.
BHP-Billiton started this programme in 2008. Early in 2010, Codelco joined the programme. At the beginning of 2012, more than 60 suppliers were participating in the programme. By 2020, the programme aims to have developed more than 250 world-class suppliers.
The 60 projects on which the suppliers are currently working address various kinds of challenges. These include: dust reduction and management, water, energy, equipment maintenance, human resources, and leaching. Nine of these projects are defined by the leaders of the programme as "disruptive", i.e. with a high level of complexity; the other 53 are classified as "incremental", implying a medium level of complexity.
The programme builds on the commitment of mining firms to use their strong purchasing capacity to leverage the development of local providers, transforming or developing them into world-class suppliers. In order to do this the mining companies have had to partially modify their usual procurement process which is designed to obtain the lowest-cost goods and services efficiently and on a highly reliable basis. This system was not designed to purchase new solutions with less standardised specifications. It tended to avoid less well-known and less predictable suppliers, as may initially be the case with the providers that the programme aims to promote. These changes in procurement processes require commitment and trust from the leaders of the mining firms.
Thus the programme aims to achieve a win-win result for the mining firm itself and for the development of the domestic economy. It seeks not merely to draw on the existing competences of suppliers but to strengthen both their innovative and wider business capacities. This process should enable these firms to capture a larger share of the rising demand for knowledge-intensive goods and services both in Chile and internationally.
It is too early to evaluate the results of the programme. However, it is noteworthy that the programme is underway with 60 suppliers working with two of the world's largest mining firms using a methodology that was specially designed and successfully tested to identify specific demands and to select and support the potential suppliers. It is expected that other mining firms will take part in the programme as sponsors, and some of the large international providers of mining equipment could also sponsor part of this initiative. This process has required the collaboration of the mining firms’ operations teams, both in the production and procurement processes and has involved the participation of universities and technological centres. Also participating was a team of external advisers, mainly from Fundación Chile (a public- private institution that promotes innovation), which has developed capacity to support the new suppliers. __________________
* Osvaldo Urzua, who has led this programme, provided information about the progress made during the last two years. A policy note written by Barnett and Bell (2011) provides valuable information.
7. MINERAL RESOURCE POLICIES FOR GROWTH AND DEVELOPMENT: GOOD PRACTICE EXAMPLES – 251
EXPORT RESTRICTIONS IN RAW MATERIALS TRADE: FACTS, FALLACIES AND BETTER PRACTICES © OECD 2014
One rationale for the mining royalty when it was introduced in 2005 was to increase the resources needed to foster innovation, research and development in order to increase competitiveness and diversify the productive base. Eyzaguirre et al. (2005) outlines the strategy for encouraging innovation using the royalties collected. A large-scale effort to promote innovation was suggested, including an increase in spending in this area to 2.4% of GDP. The Chilean government has sought to encourage innovation at the start-up level with a view to attracting entrepreneurs worldwide that are keen to expand from a base within Chile. One example is Start-Up Chile, a programme created in 2010 by the Chilean Government to promote innovation throughout the Chilean economy.
47 The pilot programme brought 22 start-up firms from 14 countries to Chile,
providing them with USD 40 000 of equity-free capital and a one-year visa to develop their projects.
Another area where the government can play a decisive role in helping the industry is by promoting the introduction of common standards. Common standards can reduce the transaction costs for providers of equipment and services to the mining sector, with underlying benefits for mining firms. In the case of procurement, for example, the safety and security requirements defined by different mines could be further standardised and thus reduce the costs of access to the sites by contractors.
48 In the case of information technologies, common standards facilitate software
developers’ work with different companies. A collaborative approach is needed here: even if it were possible to take these steps independently by start-up or developing firms, it would be very expensive and slow. Thus, there is a clear role for government in promoting collaboration among mining firms and their local providers in setting standards in order to reduce transaction costs.
Lessons from Chile: Fostering growth from the mining sector
In line with its comparative advantage, Chile has adopted a strategy of supporting sectors that service its mining operations, both in terms of equipment and services. This strategy has been facilitated by a gradual change in the organisation of Chile’s mining industry. The last three decades have seen the mining sector develop from an industry of vertically-integrated operations that import all necessary inputs to one of a multitude of specialised contractors that contribute a specific good or service. In this way, contracted firms innovate and compete in their specialised, narrowly defined areas of expertise. This can strengthen their performance, encouraging them to become more efficient in their core businesses.
There is some recent evidence of successful partnerships (such as the BHP-Billiton-Codelco initiative) between large mining firms and specialised, contracted firms who partner with smaller firms that offer goods or services that they need. These partnerships are expected to develop local providers into world-class suppliers. There is a large, untapped potential for export of these adaptive technologies that build on Chile’s comparative advantage of proximity to mining operations.
The demand for new technologies and adaptation of existing ones has grown and will continue to do so. Environmental sustainability requirements, the need to drill deeper to get to new deposits, and exploitation of more complex or lower-grade minerals pose new challenges and open up vast potential for technological development and the provision of specialised, knowledge-intensive services.
A potential public good can be created by cooperation between government and private mining firms and their contractors with an aim to foster common standards. Two areas where common standards could be enhanced are safety and security, and information technologies for the mining industry.
A strong need has been identified for internationally competitive, well-trained engineers and technicians. The need for high quality professionals is a known bottleneck in the global mining industry, and Chile is no exception. A large number of new educational programmes has been started to train professionals for a career in mining. It remains to consolidate the programmes to produce one or two recognised, world-class institutions with international links to other mining programs.

252 – 7. MINERAL RESOURCE POLICIES FOR GROWTH AND DEVELOPMENT: GOOD PRACTICE EXAMPLES
EXPORT RESTRICTIONS IN RAW MATERIALS TRADE: FACTS, FALLACIES AND BETTER PRACTICES © OECD 2014
Further development of the mining sector, and the potential for creating spillovers into the wider economy, will need to be catalysed through a common vision of the sector. In a country like Chile where the linkages between private, public and regulatory bodies are close and overlapping, such a sector vision should focus energies on medium-term needs and priorities on which each of the market participants can then concentrate. Even more important than the predictive aspect of this vision is the process of its preparation and development.
Moving down the value-chain in Botswana
The Government of Botswana is cognizant of the fact that its diamond reserves, albeit the largest in the world, will not last indefinitely. The peak of production from Botswana’s diamond mines has passed, given all known reserves, and will decline further after 2030 when Botswana’s two largest mines move underground implying lower production levels at higher cost. It is considered unlikely that new diamond deposits will be found.
49
It has been seen above that the mining sector does not employ many people, compared to its share in the country’s GDP. The Botswana Core Welfare Indicators Survey 2009/10 conducted by the Central Statistical Office (CSO) of Botswana, recorded an unemployment rate of 17.8%.
50
The rate among secondary school graduates is higher. The CSO has estimated that in 2010, 19.3% of Batswanas were living below the poverty line
51, and in its review of the Botswana’s economic
outlook in 2013, the African Development Bank reports significant income inequality (a Gini coefficient of 0.61).
52 Thus, despite the country’s successful path of economic growth, which is at
least in part due to Botswana’s tax policies vis-à-vis the mining sector and its judicious use of revenue from the sector, large challenges remain. The GRB’s consistent efforts over the years to create employment downstream in the diamond value-chain are a response to the employment challenge. The following paragraphs review some of these initiatives, stage by stage of the value-chain.
Sorting, valuing, aggregation
A view of the diamond industry value chain is given in Figure 7.7. Botswana entered the diamond industry value chain at the Mining and Recovery stage when it started production in 1971. In 2004, the renewal of two 25-year mining licences for the Jwaneng and Orapa mines with De Beers provided the forum for the GRB to negotiate the opening of sorting and valuing operations in Gaborone. In 2008, the Botswana Diamond Trading Company (DTCB) expanded operations in Gaborone to sort and value the entirety of Botswana’s diamond production and started selling a portion of its production locally. DTCB is the world’s largest sorting and valuing facility and employs 400 people. It has opened a Diamond Academy to train sorters and valuing staff. Diamond sorters have as a minimum a secondary school education, and receive six months training in the Diamond Academy followed by 18 months training “on the floor”. Salaries and benefits in the sector are high.
53
Aggregation is the process by which sorted diamonds are combined according to specifications of rough diamond buyers. In the De Beers selling operations, rough diamond buyers are under contract for three years. Their contracts specify what types of diamonds they wish to purchase, and how many. They are then offered a set of diamonds that conform to the specifications of their contract in buying sessions that are held ten times per year. The aggregation process prepares these “boxes” of diamonds for potential buyers. Aggregation of diamonds started in the Gaborone facilities at the beginning of 2013.
54

7. MINERAL RESOURCE POLICIES FOR GROWTH AND DEVELOPMENT: GOOD PRACTICE EXAMPLES – 253
EXPORT RESTRICTIONS IN RAW MATERIALS TRADE: FACTS, FALLACIES AND BETTER PRACTICES © OECD 2014
Figure 7.7. The diamond industry value chain
Source: DTC Botswana.
Selling rough
The GRB has recently negotiated a further move down the diamond value-chain. In a 10-year contract signed in 2011 governing the marketing arrangements between Debswana, DTCB and DTCI, the GRB obtained that the entire De Beers rough diamond selling operation be transferred to Gaborone by the end of 2013. This is the longest selling contract reached between the GRB and De Beers; previous contracts were for five years. By end 2013, all De Beers’ rough diamonds will be sold to all contracted rough buyers (Sightholders in De Beers terminology) in Botswana. All 81 Sightholders, or their brokers, comprising 200-300 diamantaires, travel to Gaborone ten times per year to view and purchase diamonds.
De Beers has thereby moved its entire selling operation from London to Gaborone. Eighty-four DTCI employees and their families have been relocated. Additionally, a number of new positions have been filled. The first Sightholders meeting was held in Botswana in November 2013. It is notable that despite the change in venue for Sightholders from London to Gaborone, not one of the 81 Sightholders has revoked its status. They will therefore travel from Europe, India, Israel and the United States in their majority to view diamonds in the small Southern African capital.
Other diamond mines have obtained licences in recent years as a condition that they market their diamonds in Botswana. For example, the Boteti Mining Company conducts rough diamond viewing in both Gaborone and Antwerp, and the GRB expects them to relocate the sales function fully to Botswana by 2015.
The GRB aims to create a “diamond hub” in Botswana before its diamond reserves diminish. Moving De Beers selling operations to Gaborone is a big step in this process. The GRB hopes the move will encourage other mining companies to sell their rough diamonds in Botswana. It also hopes the increased travel to Botswana and increased visibility will develop related industries such as tourism, financial services, business services, transport and security.
Sorting
and
valuing
RetailJewellery
manu-
facturing
Polished
trading
Cutting and
polishingMining and
recoveryProspecting Aggregation

254 – 7. MINERAL RESOURCE POLICIES FOR GROWTH AND DEVELOPMENT: GOOD PRACTICE EXAMPLES
EXPORT RESTRICTIONS IN RAW MATERIALS TRADE: FACTS, FALLACIES AND BETTER PRACTICES © OECD 2014
The 2011 contract negotiation for Debswana also specified that 10-15% of Debswana’s rough diamond production would be sold outside the De Beers Sightholder system. The GRB has established the Okavango Diamond Company to sell diamonds in a live, sealed-bid auction in Botswana to a selected cross-section of buyers. Okavango has also developed an online auction site through which to sell its diamonds. Up to 12% of Debswana’s diamonds will be sold to Okavango in 2013, rising by one percentage point per year to equal 15% of Debswana’s production by 2016. A pilot auction took place in Gaborone in June 2013 ahead of the launch in September 2013. The sale of diamonds outside the controlled De Beers selling operation will provide the GRB with an alternative independent mechanism for valuing its diamonds and will offer an opportunity to obtain greater insight into diamond market trends.
There may be a number of reasons why this initiative was not taken in the past. Rough diamond marketing has traditionally been done in a controlled environment among market participants that have long-standing relationships; it is a business based on trust. Part of the explanation for the way the diamond industry works is that it is based on the premise, established many years ago by De Beers, that diamonds are the materialization of love.
55 Underlying this
premise is the idea that price is a secondary criterion in the choice of a diamond. De Beers has traditionally kept the diamond price stable but rising, and has discouraged speculative behaviour in the market as this would go against the concept of a purchased diamond as an heirloom (Spar, 2006). It was quite natural that the GRB should market its diamonds through the stable, if somewhat opaque, marketing channels of its joint venture partner and industry leader, De Beers.
However, by selling its diamonds exclusively through the De Beers network, the GRB has foregone access to some market information regarding the value of its product. This has become more of an issue as diamonds have come on stream from firms outside the De Beers network that necessarily have different marketing and selling strategies. Until the end of the 1980s, De Beers controlled 90% of rough diamond sales; today the figure is 36%. Although it is still the market leader, many other selling strategies exist that may prove superior in maximising gains from the sale of diamonds. One study suggests that BHP-Billiton and some other market participants have obtained higher prices for their diamonds since 2010, generally through auction sales (Cramton et al, 2012). These results merit further study, however, since the sellers concerned have a smaller share in the rough diamond market and their prices are less stable than those for De Beers’ diamonds.
Another reason the De Beers Sightholder or Supplier of Choice system exists is to ensure stability of the supply of diamonds as a heterogeneous good. An example of this follows. Suppose a jewellery firm such as Tiffany and Co. wishes to market a heart-shaped diamond ring or necklace. A marketing campaign will be undertaken to create the demand for this unusually-shaped stone. The firm will contract to buy a substantial number of heart-shaped stones over the coming months and years. However, the proportion of rough diamonds that can efficiently be cut into heart-shaped polished stones is small. In order to be sure of obtaining a sufficient quantity of such stones, a firm like Tiffany and Co. would need to be part of a large network of rough diamond buyers that can ensure an adequate supply of these uncommonly shaped stones.. An auction or on-the-spot system could not do so, nor could a diamond mining firm that does not sell a substantial share of global rough diamonds.
Therefore, the success (or otherwise) of the Okavango Diamond Co. will be of great interest to the GRB, as well as to the rest of the industry, as an indicator of the value of Botswana diamonds in an alternative market structure.
Cutting and polishing
Knowing that diamond mining has brought substantial financial gain to Botswana but not high levels of employment, the GRB has attempted to develop the diamond processing industry further down the value-chain. It should be noted that, according to industry participants, the greatest gains in the diamond industry are upstream and downstream, in other words in mining on the one hand and in retail sales on the other (Figure 7.7). Value added is small in the sorting, aggregation, cutting and polishing stages. These intermediate stages of processing do, however, require
7. MINERAL RESOURCE POLICIES FOR GROWTH AND DEVELOPMENT: GOOD PRACTICE EXAMPLES – 255
EXPORT RESTRICTIONS IN RAW MATERIALS TRADE: FACTS, FALLACIES AND BETTER PRACTICES © OECD 2014
employment of semi-skilled labour. Moreover, they do not require the substantial long-term capital investments necessary in the upstream portion of the value chain (mining and recovery) nor the network of retail outlets and industry-specific commercial knowledge of the downstream (retail) portion of the value chain.
The GRB has been encouraging cutting and polishing firms to set up factories in Botswana using commercial access as leverage. In the 2006 negotiations for the five-year renewal of DTC Botswana’s contract, the GRB obtained the contractual agreement to sell a percentage of its diamonds in-country. Since 2007, a portion of Debswana’s production has been sold to local Sightholders, outside the central De Beers Sightholders system, that have set up cutting and polishing operations in Botswana. New three-year contracts for these Sightholders were signed in March 2012, raising the number of local Sightholders from 16 to 21.
56 Consequently, more of
Debswana’s production is sold locally: in 2012 it amounted to USD 800 million, up from USD 550 million in 2008. All 21 local buyers have opened cutting and polishing facilities in Botswana.
The cutting and polishing facilities now operating in Botswana employ 3 500 Batswana. Most firms are subsidiaries of larger firms that also cut and polish diamonds elsewhere: most of the global cutting and polishing industry is located in India with higher-end facilities in Tel Aviv or New York. Not all diamonds are efficiently processed in Botswana. Very small diamonds are still more efficiently processed in India due to lower labour costs and lower value-added of very small stones. Very large or unusual stones are generally cut and polished in facilities with deep experience given the value of the good and the substantial financial loss in case of error.
In order to maximise the quantity of stones actually processed in each facility located in Botswana, while allowing for some flexibility in the processing of very large or very small stones, local Sightholders are allowed to process up to 20% of their stones bought locally in their facilities outside Botswana. DTC Botswana checks cutting and polishing facilities periodically to ensure conformity with this requirement.
Firms that buy locally in Botswana do so partly because there is less competition for stones than in the general De Beers/DTC system. They have a better chance of obtaining the quantity and kind of stones that they desire by purchasing directly in Botswana and opening a cutting and polishing facility there. Local Sightholders are chosen according to a number of criteria, one of which is how much training and transfer of knowledge and technology that they are willing to undertake.
Lessons from Botswana: Beneficiation in the diamond value-chain
The Government of Botswana has been successful in leveraging its position as global leader in diamond reserves to move operations in the diamond value-chain gradually to Botswana. Whereas in the 1980s and early 1990s, it extracted more value from the mining and recovery stage of production, negotiations since the late 1990s have concentrated on creating facilities domestically with a view to creating a Diamond Hub. This has been done step by step, starting with the creation of sorting and valuing facilities. Botswana now successfully sorts and values its own diamond production in its entirety.
Aggregation of Botswana’s diamonds started at the beginning of 2013 and by year-end, all of De Beers selling operations were moved to Gaborone, Botswana’s capital. This move seems unprecedented. Approximately 30-35% of the world’s rough diamonds are now sold in Gaborone at ten Sightholders’ meetings each year.
Diamonds are not exchanged in an open consumer-driven market for reasons of history, heterogeneity of the product, the basis on which they are bought (sentiment as opposed to need), and the necessity of stability of supply for some types of stones. In order to verify the value of Botswana’s diamonds, and to sell a portion of its asset through alternative auction-based channels, the GRB negotiated to be able to sell up to 15% of its production through a parallel firm, the Okavango Diamond Company. That firm had its first formal auction in October 2013.

256 – 7. MINERAL RESOURCE POLICIES FOR GROWTH AND DEVELOPMENT: GOOD PRACTICE EXAMPLES
EXPORT RESTRICTIONS IN RAW MATERIALS TRADE: FACTS, FALLACIES AND BETTER PRACTICES © OECD 2014
Moving further down the value-chain, Botswana has welcomed 21 diamond cutting and polishing firms that have created 3 500 jobs for Batswana. Although this may seem a small number, it is significant on the scale of Botswana (population 2 million with a substantial share of young people) and compared to the entire mining sector which employs 12 000 directly. Cutting and polishing firms have been drawn to Gaborone in part due to the easier access to sought-after types of stones.
Without an in-depth study that estimates the number of additional jobs that have been generated due to the increase in local downstream activity, via normal multiplier processes, it is not clear whether this strategy—concentrated on the diamond value-chain—has had a greater impact on the economy as a whole than could have been made with a more diversified programme of employment creation. On the face of it, the strategy is astute and promising, as it plays to the country’s strengths as a recognised world player in the diamond business, and draws on the long-term investment Botswana has made in its successful private-public partnership with De Beers.
7.5. Avoiding the worst: Constraining illegal mining practices
Thus far, this chapter has outlined the policy context and the specific policies undertaken in two countries that have been successful in leveraging their raw materials endowments for wider development. Both Chile and Botswana have developed their extractive industries and fostered activities in upstream and downstream sectors without resorting to export restrictions.
57 The
preceding sections have outlined how Chile and Botswana have successfully implemented a tax system and used its revenue to respond to societal objectives. They have also been somewhat successful in fostering development in adjacent sectors such as mining services or processing industries. These policies have aimed to respond to societal objectives that some other countries try to achieve through use of export restrictions.
There are, however, other reasons given by countries using export restrictions on industrial raw materials; one of these is to control illegal exports of minerals products. The OECD inventory of export restrictions contains some cases where control of illegal exports is cited as rationale for imposing export restrictions (see Chapter 1).
The informal sector is large in many non-OECD countries. Although the share of the economy that is informal is by nature difficult to pinpoint, some estimates exist. For example, in the case of Colombia, the majority of economic activity takes place in the informal sector. The 2010-2014 National Development Plan noted that in Colombia in 2009, over 60% of workers did not contribute to social security and were thus considered part of the informal sector.
58 In Peru, one
estimate suggests that 60% of economic activity takes place in the informal economy there. CEPLAN, a Peruvian think tank, estimates that 74% of employment is in the informal economy.
59
Non-registered mining is prevalent in some areas of Latin America, including in Colombia and Peru (Box 7.6). Informal sector mining has brought a number of challenges to both countries. The foregone revenue to governments can be substantial; processes used can be dangerous for both humans and the environment; and illegal and informal mining have brought on a variety of social problems and even problems of basic human rights. There has been a push toward formalisation in both Colombia and Peru in order to reduce the size and scope of the informal mining sector. Although this is a difficult problem, some progress has been made. There has also been a concerted effort to tackle criminal mining in both countries, in an attempt to stop the most egregious practices present in the sector. Given the degree of informality and the corresponding foregone government revenue, export restrictions could be seen as a policy alternative to appropriate some of the rents from the informal mining activity. Colombia and Peru are avoiding this approach, however, and have adopted a multi-pronged strategy to tackle informal, illegal and criminal mining with a push towards formalization.
60
Informal and illegal mining present many challenges. It has been estimated that 87% of gold mining worldwide takes place informally. Firms are not registered, exploitation and environmental permits have not been issued, safety regulations are not enforced, taxes and social security
7. MINERAL RESOURCE POLICIES FOR GROWTH AND DEVELOPMENT: GOOD PRACTICE EXAMPLES – 257
EXPORT RESTRICTIONS IN RAW MATERIALS TRADE: FACTS, FALLACIES AND BETTER PRACTICES © OECD 2014
contributions are not paid and labour, environmental and even basic human rights legislation is not adhered to. According to a Mining Census undertaken by the Ministry of Mines and Energy in Colombia in 2010-11, 63% of mining firms operate without a mining title. Sixty-five percent of mining firms do not pay royalties, most of them operating without a mining title. In Peru, 70% of informal miners have taken a first step toward formalization of their activity.
There are a number of reasons for implementing a process of formalization. One is that informal miners generally do not pay taxes, royalties or social security contributions. In Colombia, according to the 2010-11 Mining Census, 65% of mining firms (or “units of production”) do not pay royalties. Among informal miners, the figure is 81%. The contribution to the collection of royalties by the mining sector is therefore taken from only 35% of mining firms. In Peru, the tax office has estimated that foregone revenue from unpaid taxes and royalties equals USD 930 million.
There have been many well-documented incidences of environmental damage due to illegal mining operations. Eighty per cent of gold mining in Colombia takes place outside the formal sector and virtually all use mercury to extract the gold from the rock or sand (Box 7.7). Gold extraction using mercury in an uncontrolled environment, as is the case in most of the illegal mining sites in Colombia and Peru, is a serious threat to the health of communities in the area and to the environment on a potentially large scale. In Colombia, 75% of mining operations do not have environmental permits; among operations that do not hold a mining title, the figure is 93%. In Peru, it has been estimated that 30 000-40 000 hectares of forest have been destroyed due to illegal mining. Alluvial mining is particularly hazardous for the environment as chemicals and waste are carried downstream.
Illegal mining is a multi-dimensional problem that affects the entire Andean region. There has been some cooperation among Andean Community members in the area of illegal mining and illegal trade in minerals.
Box 7.6. Activities outside the formal sector: informal, illegal and criminal mining
In much of the Andean community, mining is a traditional activity in some regions. Many countries are mineral-rich and minerals are found in some remote areas where there is little other economic activity. Traditional mining is generally done in small family-owned or community operations. Gold mining is particularly prevalent in traditional mining activities. With the recent sharp increase in the price of gold, however, many non-traditional actors have invested in the sector. The non-traditional miners are using more highly mechanized production processes. There is also a criminal element to some of the gold mining operations since, according to Colombia’s Ministry of Defence, it has become more lucrative to mine for gold than to grow cocaine.
Three types of mining activity can be distinguished outside the formal sector. Although some categories of formal and informal and illegal mining overlap, the following typology is generally used among Andean Community members.
Informal mining refers to artisanal or traditional production units, generally families or small groups. They often live on or nearby their area of activity. They do not have an accounting structure, are not incorporated and do not keep inventory. Many do not possess the mining title for the land on which they mine. They are very lightly mechanized.
Illegal mining refers to the fact that production units are operating outside a legal framework. They may be larger-scale operations and may use heavy machinery. They may employ substantial numbers of people. They do not own a mining title, are not registered as miners, generally do not pay royalties or taxes and have not registered in the ongoing process of formalization. Many illegal mining operations are undertaken in restricted areas or in riverbeds where mining is prohibited.
Criminal mining has been a problem in many countries of the Andean Community. It can take many forms. On the one hand, gold mining has been used in money laundering of drug profits. A potentially more common form of criminal mining results from extortion of small or medium-sized mining firms. Armed operatives demand a share of mining profits under threat of violence. Another form of criminal mining involves organized crime groups operating production units. Workers are sometimes threatened or coerced into mining for local organized units; in this case, a wide variety of labour and human rights are not respected. Some criminal mining operations control access to inputs or machinery used in the mining operations. In Colombia, much of the criminal mining is thought to be controlled by organized groups like the FARC, ELN or Bacrim. The extensive network of these groups exacerbates the problem of criminal mining.

258 – 7. MINERAL RESOURCE POLICIES FOR GROWTH AND DEVELOPMENT: GOOD PRACTICE EXAMPLES
EXPORT RESTRICTIONS IN RAW MATERIALS TRADE: FACTS, FALLACIES AND BETTER PRACTICES © OECD 2014
Box 7.7. Substance use in gold mining
In much of the Andean region trace quantities of gold can be found in rivers or extracted from rock. Gold mining lends itself to small-scale and artisanal mining since the requirements for large machinery and capital are lower than for other types of mining. It is a traditional economic activity in many countries. There are three ways used to extract gold: gravimetric (physical) methods to separate loose alluvial gold deposits; using mercury, either on the ore or on concentrated mineral; and cyanide. The traditional activity of panning for gold has been transformed by the use of mercury to extract gold and silver from ore. In Colombia, mercury is used in virtually all small-scale informal sector gold mining. In many cases, mercury is used on the ore deposits, as opposed to the concentrated mineral, so large amounts of mercury are required and the outcome extracts less gold from the deposit. Cyanide used in mineral extraction can be fatal in case of human contact but dissolves in conjunction with ultra-violet rays. Using cyanide to extract the mineral is more efficient and less environmentally harmful therefore but requires formality, larger scale operations and an initial capital outlay. It has been estimated that informal mercury use recovers 30% of the gold contained in the ore whereas cyanide processes recover 70% of the gold content.
Mercury has devastating consequences for human health and for the environment. Mercury—also known as quicksilver – is an element found in nature in various forms. Because it is an element, mercury does not break down in the environment. Instead, it cycles between the atmosphere, land and water and can travel large distances from the original source. Mercury can also build up in humans and animals and become highly concentrated in the food chain. This is a problem since low levels of mercury exposure can build up over time until concentrations are high enough to be harmful. The United Nations Industrial Development Organization (UNIDO) suggests that 100% of mercury used in artisanal and small-scale gold mining is released into the atmosphere. Using mercury in a controlled environment on concentrated mineral, as opposed to the less processed ore, can reduce emissions by 70-90%. The controlled environment suggests greater formality, acceptance of safety standards, and initial capital outlays which suggests larger scale operations than the traditional ASM unit of production.
The Minamata Convention on Mercury, a global treaty signed on 19 January 2013, was named after the Minamata disease, a neurological syndrome first discovered in Japan. The Minamata disease, first discovered in 1956, was caused by the release of mercury in industrial wastewater from a chemical factory. The local chemical and plastics firm, Chisso Corporation, dumped an estimated 27 tons of methylmercury into the Minamata Bay over a period of 37 years. The highly toxic chemical bioaccumulated in fish and shellfish in the Minamata Bay and when eaten by the local population resulted in mercury poisoning. Pollution was so heavy at the mouth of the plant’s wastewater canal that a figure of 2 kg of mercury per ton of sediment was measured, a level that would be economically viable to mine. The high contamination levels in the people of Minamata led to severe neurological damage and malformations and killed more than 900 people. An estimated 2 million people from the area suffered health problems or were left permanently disabled from the contamination.
The Minamata Convention on Mercury aims to protect human health and the global environment from the adverse effects of mercury. It includes a ban on new mercury mines, the phase-out of existing ones, control measures on air emissions, and the international regulation of mercury use in ASM gold mining. The Convention calls for the elimination of mercury use in ASM mining in 20 years
7.6. Policy lessons from the case studies
General remarks
None of the countries whose mineral resources policies have been described in detail in this chapter has resorted to trade instruments such as export restrictions to manage its minerals sector. Instead, they have relied on a combination of balanced taxation, good management of tax revenue, stable investment policies, a push toward formalisation of all mining activities, and initiatives aimed at promoting spillovers from the minerals extraction sector to other related sectors and to develop the economy as a whole for the benefit of their citizens.
The introduction to this chapter listed a number of policy objectives that resource-rich countries using export restrictions on their minerals exports often cite to justify the use of these trade measures. The debate surrounding the “resource curse” was also invoked, and the question was posed as to whether economies with a buoyant and profitable natural resource sector, which is responsible for the greater share of export revenue and whose rate of growth outstrips that of other economic sectors, have difficulty in achieving sustained economic growth and development.
Many policy lessons can be drawn from the successful experiences of countries such as Chile and Botswana, and these have been underlined in the preceding sections. This section focuses primarily on examining the issues raised in the introduction against the evidence provided

7. MINERAL RESOURCE POLICIES FOR GROWTH AND DEVELOPMENT: GOOD PRACTICE EXAMPLES – 259
EXPORT RESTRICTIONS IN RAW MATERIALS TRADE: FACTS, FALLACIES AND BETTER PRACTICES © OECD 2014
by the two case studies. Needless to say, the experiences of these countries have to be seen in their specific contexts, taking into account the complex web of interacting institutions in the public and private sectors, their stages of development, and other societal objectives.
Policy lessons from Chile
One of the most characteristic features of the mining industry is that it is highly capital-intensive and necessarily demands long term investments; once investments have been made, they are not transportable. Potential investors therefore attach great value to political and regulatory stability. Chile has been quite exemplary in this area: its trade and investment policies have been open and predictable. The tax environment has also been relatively stable. When the tax system was revised in 2010, consultation was undertaken and firms could opt in to the new system or retain the previous levels of tax rate for a given time. As is documented earlier in the chapter, Chile has succeeded over the years in drawing substantial foreign investment into its mining sector and its wider economy.
61 Surveys of the perceptions of potential overseas investors regarding the
investment climate and potential in Chile regularly give the country a rating that is more than satisfactory.
The tax structure applied to the Chilean minerals sector includes tax rates that are progressive according to two parameters: volume of production and, within each volume class, the size of the profit margin. This system is flexible enough so that, in boom times when world market prices are high, a substantial share of the surplus is captured as tax revenue without resorting to border measures.
Chile’s progressive profits-based mining tax implies that risk is shared between the government and private firms. Implementing this type of tax is beneficial in many ways but demands a high level of institutional capacity. In particular, it is necessary to be able to ascertain potential operating margins and provide oversight for payment of appropriate amounts of tax.
One characteristic of the mining sector is that it is made up of large firms with sizable market power, many of which are multinationals based outside the producing country. Their investment decisions are made by weighing all potential costs against the potential benefit of extraction. In this way, governments need to be mindful of tax liabilities facing firms in third countries that they will be paying, but also that they will be considering with respect to future investment. Chile continues to attract significant investment – more than other countries in the region – including to the mining sector, yet a significant proportion of its tax revenue comes from copper mining.
In order to benefit the country as a whole, the management and investment of tax revenue must be sound and counter-cyclical. The Chilean fiscal expenditure policy is based on long-term copper revenues and growth forecasts, and the tax revenue is invested in sovereign wealth funds. This policy has been so successful that the two sovereign wealth funds sustained from tax revenue run to billions of US dollars and exceed the national debt. The fact that the counter-cyclical and formula-based approach is embedded in the Fiscal Responsibility Law provides maximum insurance against mismanagement of funds. Spending of the ESSF requires Congressional approval. This also ensures against potential spending of the funds for short-term gain, which has been a downfall of such funds in some other cases.
The counter-cyclical investment in SWFs and expenditure from them also helps to dampen the adverse effects of changes in the prices of copper and molybdenum on the exchange rate. Tax revenue is invested in dollar-, euro- or yen-denominated securities, thereby offsetting the pressure on the Chilean peso when mineral prices are high. When they are low, the foreign-invested funds are drawn upon, thereby lessening exchange volatility. This is a major issue for countries such as Chile that are heavily dependent on export earnings from their minerals sector and are, at the same time, mindful of “crowding out” other sectors by a strong or volatile exchange rate.
The Chilean government is aware of the importance of fostering linkages between mining and mining-related sectors that create employment in knowledge-intensive industries with strong future potential. The proximity to mines gives Chilean small and medium-sized firms supplying

260 – 7. MINERAL RESOURCE POLICIES FOR GROWTH AND DEVELOPMENT: GOOD PRACTICE EXAMPLES
EXPORT RESTRICTIONS IN RAW MATERIALS TRADE: FACTS, FALLACIES AND BETTER PRACTICES © OECD 2014
equipment and services to the mining industry a strong comparative advantage in developing and exporting. The need for technological solutions to challenges posed to the sector by environmental regulations, the need to drill deeper for deposits and increasingly complex mineralogy can potentially be filled by Chilean firms. Partnerships between large mining firms and smaller suppliers are key to responding to these challenges.
Development of the mining and mining-related sectors means appropriate investment in people. Lack of qualified engineers and, in particular skilled technicians, is a bottleneck found in the mining sector in many countries. The Chilean education system provides a labour force of sufficient quality but insufficient number. Educational programmes to prepare students for employment in the mining sector have been expanded although coordination has not been fully adequate to propel such programs to the level of international renown.
In conclusion, there is much to be learned from the Chilean policy experience vis-à-vis its mining sector. This study has shown that Chile is able to achieve policy objectives through targeted domestic policies without recourse to export restrictions. Equally, however, some things remain to be done: one example is the management of information on potentially exploitable mineral deposits which could be consolidated. Another area that warrants reform is the unpublished Ley Reservada del Cobre. The purpose of this paper is to identify best policy practice in mining, however, and there is much on which to expound in the case of Chile.
Policy lessons from Botswana
It has been seen that Botswana’s strong economic growth in the past four decades, and formidable advances in terms of education, access to clean water, infrastructure and well-being of its people, are in large part due to effective management of its mineral resources. Although the economic situation in Botswana has its specificities (e.g. small population, low population density, substantial mineral reserves), many of the policy priorities and their implementation can be regarded as models for other minerals-rich countries. In particular, Botswana has achieved a strong but balanced system of mineral taxation, effective management of revenue, strong investment in its people and its infrastructure and policies to encourage the creation of a diamond hub, in a climate of stability with limited corruption.
The Government of Botswana has managed extraction of its main mineral resource, diamonds, through a joint venture with De Beers, the largest private firm in the industry. The GRB receives 80-82% of the revenue minus costs from its joint venture. It has conducted its relationship with De Beers strategically. In the early days of Botswana’s diamond production, the 1970s and 1980s, negotiations concentrated on obtaining a greater share of the revenue from its natural resource. In the late 1980s and 1990s, the GRB took advantage of its leverage in the joint venture to increase its management capacity, including by obtaining a share in De Beers and two seats on the Board of Directors of the global firm. It thereby obtained access to the highest levels of experience and strategic business acumen in the industry. Since the late 1990s, the GRB has used its leverage to advance its priority of creating a diamond hub in its capital, Gaborone.
In this way, the Government of Botswana has invested heavily in its relationship with De Beers and has managed that relationship well, using its leverage to obtain important advances for its population. Given its low levels of capacity at the start of this relationship, this is all the more commendable. It suggests that it may be easier for a country with low levels of capacity to manage one or a small number of relationships rather than putting into place the governance structures that are necessary to regulate many small firms. It also suggests that the capacity-building aspects of the joint management structure have been substantial.
Through its relationship with the private sector, the GRB has aligned its interests in terms of production levels and rates of extraction, and management policies of its largest joint venture. This may have had a restraining effect on any inclination to over-tax or over-regulate the industry, which has been observed in some other mineral-rich countries. A greater understanding of the constraints and the enormous potential of the mining sector has served the GRB well.
7. MINERAL RESOURCE POLICIES FOR GROWTH AND DEVELOPMENT: GOOD PRACTICE EXAMPLES – 261
EXPORT RESTRICTIONS IN RAW MATERIALS TRADE: FACTS, FALLACIES AND BETTER PRACTICES © OECD 2014
The Government of Botswana has, through its relationship with De Beers and its development policy over past decades, emphasised the need to build internal capacity within the country in order to undertake contract negotiations with foreign investors on an equal footing, and implement its minerals policy. The internal capacity building in the diamond industry has been an important element of Botswana’s success in obtaining and managing the revenue from the minerals sector.
Not only has the GRB successfully leveraged its position as the global leader in diamond reserves to extract substantial revenue from its resources, but even more crucially it has generally been quite exemplary concerning the way in which its revenue is spent. One of the main problems mineral exporters face is the tendency for public expenditure to follow the cyclical patterns of revenue generated from mineral resources. The GRB has overall resisted the impulse to spend the entirety of its revenue from the mining sector and has generally avoided both overheating the economy and investing in unsound projects. As was seen in the Chilean case, Botswana’s expenditure of mineral revenues has generally been counter-cyclical or acyclical.
Botswana’s overriding development strategy and its main expenditure projects are decided in a very inclusive process every six years that results in a national development plan. The content of each six-year plan is generated by a consultative process that touches all levels of state and local government, interest groups, traditional chiefs and business owners; this procedure is derived from traditional practices but has been refined in the current context. All development projects that are undertaken are retained through this consultative process. Projects are selected largely according to technical criteria and in line with established priorities, and not according to political considerations.
One of the cornerstones of Botswana’s revenue management strategy has been that revenues from its mineral assets are invested in their entirety in other assets – health and education of its citizens or its infrastructure. Recurrent expenses have been financed entirely from non-mineral revenues. The substantial advances in social indicators are probably largely due to this policy. Currently, this breakdown of revenue use has not been actively targeted, and is not enshrined in any constitutional or legal framework. Investment expenditure over the last three decades, largely financed from minerals revenues, has been largely on infrastructure and education and training, with health spending in third place. Today, virtually all Batswana have access to clean water, and virtually all Batswana children attend junior secondary school.
At the same time, the GRB has not felt compelled to spend all the tax revenue it collects, and has built up a substantial sovereign wealth fund. The Pula (“Rain”) Fund was established in the mid-1990s. It has been described both as an inter-generational fund and a stabilisation mechanism. The Pula Fund is invested offshore in foreign currencies which furthermore avoids putting pressure on the national currency.
Although Botswana’s mining sector provides a substantial share of government revenue, it continues to draw investors. The mining sector accounts for a large share of FDI stocks. Botswana has made concerted efforts to attract FDI into export-oriented manufacturing and services, so as to reduce reliance on diamond exports and to diversify its supply-side capacities. The Ministry of Trade and Investment of Botswana has partnered with the OECD in undertaking a comprehensive review of its investment policies to identify areas that need further reform in order to attract more diversified and sustainable investment, both domestic and foreign.
Particularly important to potential investors in the mining sector is Botswana’s political and regulatory stability.
62 Because mining is a highly capital-intensive industry that demands long-term
investments, potential investors value such stability very highly. Botswana’s tax system, in particular, can be qualified as very stable. Countries like Botswana that have achieved high levels of perceived governance overall are in a much better position, if changes are needed, to mitigate their impact on investment.
Botswana’s minerals sector has been the engine of its development strategy and efforts have been made to ensure its continued development and presence in the country. Early on, with the help of development assistance funds, good quality, detailed geological information was

262 – 7. MINERAL RESOURCE POLICIES FOR GROWTH AND DEVELOPMENT: GOOD PRACTICE EXAMPLES
EXPORT RESTRICTIONS IN RAW MATERIALS TRADE: FACTS, FALLACIES AND BETTER PRACTICES © OECD 2014
collected to obtain a comprehensive view of the country’s resources. Such information is of prime importance for minerals-rich countries wishing to attract investment. The geological information has been refined and more detailed data collected over time. Information collected by prospectors complements existing sources and is, in principle, made available when a prospector releases his right to explore or retain the concession. Evidence from surveys confirms that this information increases a jurisdiction’s attractiveness to overseas investment.
In an effort to retain diamond activity in the country, and aware of the non-renewability of its main mineral resource, Botswana has made sustained efforts to become involved in other stages of the diamond value-chain. The first step was investing in capacity to sort and value the country’s diamonds in Botswana itself, creating local jobs and increasing the level of local expertise. At the beginning of 2013, aggregation, a further step in the value-chain, was commenced locally. Since November 2013, the entire selling operation of the De Beers group, i.e. the largest market for diamonds worldwide, takes place in Gaborone. This seems unprecedented and is the result of the GRB using its leverage within the De Beers group to further its aim of creating a Southern African diamond hub in its capital. Further down the value-chain, the GRB has leveraged its relationship with potential rough diamond purchasers to encourage a diamond cutting and processing industry that has created 3 500 jobs.
With the aim of obtaining as much value from its natural resource as possible, while retaining incentives for investment and leaving open space for competing enterprises, the GRB now sells a share of its diamonds on an alternative auction-based platform. This initiative will provide additional information about the value of its diamonds moving forward, and may provide insights into the trade-off in diamond revenue between volatility and price levels. Correctly valuing diamonds is of primary importance to the GRB, not least of all in order to calculate the royalties due from diamond extraction. This represents a clear understanding and good use of market mechanisms to extract maximum gain from its resource.
Challenges to Botswana’s regulatory model
Botswana has been very successful in bringing itself to the level of an upper-middle income country. Further advances, however, may prove more challenging, particularly faced with falling diamond revenues. Consensus may break down somewhat as priorities in terms of access to electricity, basic and secondary education, clean water, basic health services and transportation have largely been met. It will be increasingly difficult to choose between competing priorities if more sophisticated systems for undertaking cost-benefit analysis and monitoring and evaluation are not in place.
Botswana’s expenditure of its mineral sector revenues on health, education and infrastructure may have been the single most important factor in its phenomenal performance. In the past few years, however, these expenses have grown substantially and will likely be unsustainable in the face of falling mineral revenues. The Pula Fund has been used in recent years to top up such expenditure: investments in human and infrastructure capital have continued to be heavily funded as opposed to financial investments for future generations, despite the fact that basic infrastructure investments have been accomplished. It has been suggested that the returns to some of these investments have fallen.
The rules that have governed the allocation and expenditure of Botswana’s revenue have worked well until now but they have no statutory basis. This implies that it would be possible to spend accumulated assets indiscriminately. Although there is no history of this in Botswana, a more structured legal framework for the different budget and fiscal rules would make it even less likely.
63
In addition, there are no explicit rules regarding the accumulation of financial savings from minerals. Agreement on certain rules or targets for public asset accumulation would add to Botswana’s policy portfolio as would more transparency in management of public assets.
64 Greater transparency in
public expenditure is also more appropriate as Botswana’s labour force has accessed higher education. Greater oversight, including that of outside, independent bodies, will be increasingly desirable.

7. MINERAL RESOURCE POLICIES FOR GROWTH AND DEVELOPMENT: GOOD PRACTICE EXAMPLES – 263
EXPORT RESTRICTIONS IN RAW MATERIALS TRADE: FACTS, FALLACIES AND BETTER PRACTICES © OECD 2014
Furthermore
Examination of the policy environment in Chile and Botswana underlines many areas of good practice in the regulation of their minerals sectors without resorting to distortive trade policies. There are many instances of other minerals-rich countries using export restrictions to try to regulate their minerals sectors. Users of export restrictions indicate that they do so in an attempt to foster spillovers to other sectors, particularly in order to promote the development of downstream or upstream industries; to increase government revenue coming from the extractive industries; to offset exchange rate impacts; to control illegal exports or other activities; and to protect the environment or citizens’ health, among others.
The cases of Chile and Botswana suggest alternatives to export restrictions that have been successful in responding to many of these policy objectives in varied, and often innovative, ways. One area that has not been covered in the two case studies is controlling illegal export of mining products and illegal mining activities. This is a substantial problem in some minerals-exporting countries. Different types of activity can be distinguished: informal activity, where small-scale, traditional miners carry out their occupation; illegal mining which is larger-scale and involves heavy machinery; and criminal mining which includes the worst forms of extortion, threats, violence and money-laundering. These are particularly difficult problems but some policies are being put into place in minerals-rich countries such as Peru and Colombia.
One of the over-riding and most generalizable lessons from the natural resource curse debate is that “institutions matter”. This is well illustrated by the case studies presented in this chapter. Strong institutions enable resource-rich countries to reap the benefits of exploiting their mineral resources while fostering sustainable rates of extraction. As with other economic activities, it is important to develop and maintain a governance framework based on the rule of law and supporting institutions that provide an environment in which firms have incentives to invest in productive activities (UNCTAD, 2007).
Notes
1. Jane Korinek is a Trade Policy Analyst in the OECD’s Trade and Agriculture Directorate. This research was undertaken in the Policies for Trade and Agriculture Division of OECD’s Trade and Agriculture Directorate under the management of Frank van Tongeren. Research on the current economic situation was provided by Tarja Mård, statistician at OECD. The chapter on “Creating spillover effects: Development of mining-related activities in Chile” was prepared by consultant José Pablo Arellano of the Corporation of Studies for Latin America (CIEPLAN), formerly CEO of Chile’s state-owned copper mining firm. The author wishes to thank the Chilean Delegation to the OECD and the Directorate for International Economic Relations in the Ministry of Foreign Affairs of Chile for their help in facilitating this research. The author is grateful for comments on earlier drafts received by staff from the following Chilean bodies: Ministry of Mining; Ministry of Finance; COCHILCO, the copper advisory body; and the following OECD colleagues: Mario Marcel, Deputy Director of Public Governance and Territorial Development; Aida Caldera Sanchez of the Economics Department; James Green from the Center for Tax Policy; Kathryn Gordon of the Investment Division of the Directorate for Financial and Enterprise Affairs; Yunhee Kim of the Trade and Agriculture Directorate as well as many OECD Delegations.
The chapter on management of mineral revenues in Botswana was provided by Keith Jefferis, Managing Director of econsult Botswana, former Deputy Governor of the Bank of Botswana. The author wishes to thank individuals in the following Botswana administrations and OECD Directorates who provided comments on earlier drafts: Ministry of Minerals, Energy and Water Resources; Ministry of Finance and Development Planning; Jean-Philippe Stijns of the OECD Development Centre; Lee Corrick of the Centre for Tax Policy and Carole Biau of the Investment Division of the Directorate for Financial and Enterprise Affairs, as well as many OECD Member country delegations. This report benefitted from discussions in the OECD Working Party of the Trade Committee, which agreed to make the study more widely available through declassification on its responsibility.
2. This chapter draws heavily on Korinek (2013) and Korinek (2014).
3. See Chapter 1, Table 1.6 for an exhaustive list.

264 – 7. MINERAL RESOURCE POLICIES FOR GROWTH AND DEVELOPMENT: GOOD PRACTICE EXAMPLES
EXPORT RESTRICTIONS IN RAW MATERIALS TRADE: FACTS, FALLACIES AND BETTER PRACTICES © OECD 2014
4. The policies discussed in this chapter respond to the first three of the objectives listed here. Other policies to address issues such as controlling illegal exports, environmental protection and the protection of citizens’ health, and managing mineral extraction rates will be covered by additional OECD case studies in the future.
5. See, in addition, Korinek and Kim (2010) or the WTO World Trade Report 2010, p. 123-130.
6. For example, Peru has partially modelled its regulation of the mining sector on that of Chile. Some West African countries are re-working their Mining Codes and have called on the West African Economic and Monetary Union (WAEMU) to help in this task and to harmonise their treatment of foreign mining interests.
7. This section draws substantially on the work of Boadway and Keen (2010).
8. In practice, few OECD countries have signed on to the initiative. At present, among OECD countries, only Norway is EITI compliant.
9. In recent years, however, the Chilean government has authorised Codelco to capitalise profits in order to finance new projects.
10. In September 2012, Congress approved a permanent increase in the corporate tax to 20% in order to finance the education system, supporting pre-schools and providing better funding for university students.
11. The Decree Law 600 regulating investment has been in force since the 1970s and ensures non-discriminatory treatment and tax invariability, through a contract between the foreign investor and the State of Chile. The investment regime has been seen as a guarantee of stability for foreign investors and one of the reasons Chile has been a leader in attracting foreign investment, including in the mining sector.
12. See http://www.camara.cl/prensa/noticias_detalle.aspx?prmid=100806.
13 This is a very pertinent issue for the mining industry in Chile since energy inputs in the sector are extensive.
14 For more details, see Korinek (2013), pp.26-27.
15. Although De Beers only receives 18-20% of before tax profit, the company makes more profit in Botswana than anywhere else in the world. This reflects the very large scale and very high profitability of diamond mining in Botswana (Jefferis, 2009).
16. The tax policy vis-à-vis diamond mining firms is, in principle, subject to negotiation. In practice, however,
according to industry executives, a similar rate and tax base is used in that industry as in other mining industries.
17. Fraser Institute Survey of Mining Companies 2013, http://www.fraserinstitute.org/uploadedFiles/fraser-ca/Content/research-news/research/publications/mining-survey-2013.pdf.
18. There is some debate over whether or not tax revenue from natural resources should be invested abroad or within the country of extraction. The Natural Resource Charter, a set of principles for governments and societies on how to best harness the opportunities created by extractive resources for development, suggest that wealth created from taxation of mineral rents should be invested in the country, not in sovereign wealth funds (www.naturalresourcecharter.org).
19. See http://www.swfinstitute.org/statistics-research/linaburg-maduell-transparency-index/. Also Korinek (2014), footnote 29.
20. There are 24 GAPPs, grouped into three broad categories: i) Legal Framework, Objectives, and Coordination with Macroeconomic Policies; ii) Institutional Framework and Governance Structure; iii) Investment and Risk Management Framework. See http://www.iwg-swf.org/pubs/eng/santiagoprinciples.pdf for details.
21. Detailed information about the Chilean SWFs can be found at www.hacienda.cl/fondos-soberanos.html.
22. For a detailed overview of the conceptual issues underlying the structural balance policy and the formula used to determine the structural balance indicator, see Arellano (2006), Marcel and Vega (2010) and Rodríguez et al. (2007).
23. Fiscal policy is continually open to debate and review in Chile. A report has been released by the Corbo Commission that assisted the current government in reviewing the fiscal rule. A discussion of some of the possible refinements can be found in Corbo Commission’s Report: Towards a Better Fiscal Policy
(Libertad y Desarrollo, www.lyd.org, 8 July 2011). The review was commissioned in part because the counter-cyclical nature of the current fiscal rule was found to be insufficient in the face of a large crisis such as that in 2008 and 2009.

7. MINERAL RESOURCE POLICIES FOR GROWTH AND DEVELOPMENT: GOOD PRACTICE EXAMPLES – 265
EXPORT RESTRICTIONS IN RAW MATERIALS TRADE: FACTS, FALLACIES AND BETTER PRACTICES © OECD 2014
24. As of December 2012, the market value of the PRF was USD 5.1 billion.
25. See Ministry of Finance, www.hacienda.cl/english/sovereign-wealth-funds/economic-and-social-stabilization-fund.html
26. Ministry of Finance, www.hacienda.cl/english/sovereign-wealth-funds/investment-policy.html.
27. http://www.swfinstitute.org/statistics-research/linaburg-maduell-transparency-index/.
28. It is not possible to shield the economy entirely from commodity export volatility. The commodity boom brought higher costs, particularly in wages, and strong investment inflows. The economy showed signs of overheating in 2008. When world trade and commodity prices collapsed, the investment boom came to a halt (OECD, 2010). The OECD Economic Survey of Chile 2010 (pp.44-50) includes further suggestions for further insulating the economy from such shocks while introducing additional flexibility.
29 Given Chile’s decision to invest PRF funds abroad, another option would be for the fund to invest in fixed-income securities denominated in currencies that evolve with the peso, such as those of other natural resource exporters (IMF, 2008).
30 This section draws heavily on work prepared by Keith Jefferis, Managing Director of econsult Botswawa, formerly Deputy Governor of the Bank of Botswana.
31. The percentage non-mineral primary balance is computed as the difference between non-mineral revenue and expenditure (excluding interest receipts and interest payments), expressed as a percentage of non-mineral GDP.
32. This difference is substantial and has hence motivated the GRB to adopt policies in a number of areas, including the prioritised accelerated development of its vast coal reserves for export.
33. Some examples include a levy on alcoholic drinks to fund alcohol awareness and various youth empowerment schemes; a levy on electricity bills to fund rural electrification; and a fuel levy to finance the Motor Vehicle Accident Fund. The expenditures from these funds are not subject to the normal parliamentary scrutiny for budget expenditures.
34. The limits are set out in Section 20 of the Stocks, Bonds and Treasury Bills Act, 2005 (Chapter 56:07).
35. http://www.resourcegovernance.org/.
36. http://collections.europarchive.org/tna/20070701080507/; http://www.dfid.gov.uk/pubs/files/eitidraftreportbotswana.pdf
37. More details can be found in Korinek (2014).
38. See a full account of this debate in Chile in Meller (2002) "Dilemas y Debates en torno al Cobre" in particular the article by the same author, "El cobre chileno y la política minera".
39. This section was authored by José Pablo Arellano, former CEO of Codelco, presently at the Corporation of Studies for Latin America (CIEPLAN).
40. Porter's definition of a cluster is a group of geographically concentrated, interconnected companies, universities and other related entities, arising as a result of externalities in the industry. Ramos (1999) discusses the advantages of clusters around natural resources.
41. From the 1950s until the mid-1970s, when the economy opened to imports, international trade policies sought to promote this substitution, with varying results. See the account by Ffrench-Davis, “Integración de la gran minería a la economía nacional: el rol de las políticas públicas” in Ffrench-Davis and Tironi (1974).
42. See Ramos (1999), Lagos and Blanco (2010).
43. This is based on the Activity index of the engineering consulting sector 2011, constructed by the Association of Engineering Services from a sample of mining firms.
44. This is the trend elsewhere; an example is the programme of six university schools for mining in Europe (Federation of European Mining Programs, FEMP), which offers a joint Master’s from these schools in four other European countries, the European Mining, Minerals and Environmental Program (EMMEP).
45. This is the case in many emerging markets. BRIC countries, for example, produce highly educated researchers but do not generally have sufficiently large and satisfactory research structures in order to generate major new innovations. They too are concentrating on incremental, as opposed to radical, innovation (Les Rencontres Économiques conference, session on innovation, 6-8 July 2012).

266 – 7. MINERAL RESOURCE POLICIES FOR GROWTH AND DEVELOPMENT: GOOD PRACTICE EXAMPLES
EXPORT RESTRICTIONS IN RAW MATERIALS TRADE: FACTS, FALLACIES AND BETTER PRACTICES © OECD 2014
46. This policy has been recognised in Chile for some time: Eyzaguirre et al. (2005) suggested that too much of Chile’s research and innovation funding was going to basic research, and that the innovation effort in Chile should rather concentrate on adopting and adapting foreign technologies, which is a strategy that comes at a lower cost.
47. CORFO, the Chilean Economic Development Agency that manages Start Up Chile has financed several SME projects with applications for the mining industry. It has also promoted, jointly with the Ministry of Mining, several programmes to enhance innovation in the mining industry, including by attracting foreign research centres.
48. The 2011 Law of Mine Security establishes some standards in this area.
49. The last substantial diamond deposit discovery dates from 1973 and, as has been seen in a previous section, geological information available in the country is quite comprehensive.
50. http://www.cso.gov.bw/index.php/summary-statistics/53-key-indicators2/116-unemployment-rate-is-17-8-percent-as-per-the-botswana-core-welfare-indicators-survey-2009-10.
51. Statistics Botswana (2014), Vision 2016 and Millenium Development Goals Indicators Report,
http://www.cso.gov.bw/attachments/article/113/Vision_2016_Millenium_Development_Goals_Indicators.pdf
52. http://www.afdb.org/en/countries/southern-africa/botswana/botswana-economic-outlook/
53. As an example, in addition to salary, DTC Botswana covers 60% of employees’ mortgages.
54. In order to undertake further aggregation, De Beers opened 26 part-time Gaborone-based positions requiring a University degree. Applications were received from 11 000 applicants.
55. The majority of gem diamonds are purchased as engagement rings. De Beers’ early advertising was very successful in securing the engagement ring market for its product. Its advertising slogan “A Diamond is Forever” was given the Advertising Age award for “slogan of the century”.
56. http://www.dtcbotswana.com/about_us.php.
57. Similar studies to Chile and Botswana are underway in OECD looking into the minerals policy practices in Colombia and Peru. Colombia and Peru have revised their system of taxation of extractive industries and both countries have reformed their systems of distribution of the tax revenue. A close examination of those policies will complement the practices outlined in this chapter in the areas of taxation of the mining sector and distribution of extractive tax revenue.
58. http://www.irc.gov.co/irc/en/fiscalinformation/National%20Development%20Plan%202011-2014.pdf, p.13.
59. http://www.ceplan.gob.pe/sites/default/files/Documentos/mipyme_productividad_e_informalidad-fredy.pdf.
60. Two upcoming studies will examine the policies undertaken by Colombia and Peru in the area of formalization of informal-sector mining, including administrative, environmental, economic and security initiatives in the area.
61. Investment policy is an area that was not covered in detail in the two studies from which the material in this chapter is drawn (Korinek, 2013, 2014). One reason for this is so as not to overlap with similar studies such as one by UNCTAD (UNCTAD, 2011). There is much good practice in this area in Chile as well, in particular as regards the implementation of Decree-Law 600 for attracting foreign capital, as can be gleaned from UNCTAD (2011).
62. Success in attracting FDI is partly due to the favourable perceptions of the country’s good level of governance. Botswana’s policies and regulation in the mining sector were ranked 25th best out of 112 jurisdictions by managers and executives in the mining industries in 2013, higher than Chile (in 30th position), and ahead of various North American states and provinces, some Australian states, Turkey, Portugal and Spain (Fraser Institute Survey of Mining Companies, 2013).
63. See the policy lesson from Chile on this point, discussed earlier in this chapter.
64. A certain lack of transparency in the management of the Pula Fund has resulted in relatively low ratings according to SWF management indicators.
http://www.cso.gov.bw/attachments/article/113/Vision_2016_Millenium_Development_Goals_Indicators.pdf

7. MINERAL RESOURCE POLICIES FOR GROWTH AND DEVELOPMENT: GOOD PRACTICE EXAMPLES – 267
EXPORT RESTRICTIONS IN RAW MATERIALS TRADE: FACTS, FALLACIES AND BETTER PRACTICES © OECD 2014
References
Acemoglu, D., S. Johnson and J.A. Robinson (2003), “An African Success Story: Botswana”, in D. Rodrik (ed.), In Search of Prosperity: Analytical Narrative on Economic Growth, Princeton University Press.
African Development Bank (AfDB), OECD, UNDP, UNECA, African Economic Outlook, 2012 and 2013.
Alexeev, M. and R. Conrad (2009), “The elusive curse of oil” in The Review of Economics and Statistics 91(3), p. 586-598.
Arellano, J. (2006), "Structural Change in Chile: From Fiscal Deficits to Surpluses", in OECD, Challenges to Fiscal Adjustment in Latin America: The Cases of Argentina, Brazil, Chile and Mexico, OECD Publishing, Paris. DOI: http://dx.doix.org/10.1787/9789264022089-6-en.
Bagnall, A.E. and E.M. Truman (2013), Progress on Sovereign Wealth Fund Transparency and Accountability: An Updated SWF Scoreboard, Policy Brief PB13-19, Peterson Institute for International Economics,
Barma, N.H., K. Kaiser, T. Minh Le, and L. Vinuela, (2012) Rents to Riches? The Political Economy of Natural Resource-led Development, World Bank, Washington, D.C.
Behre Dolbear (2012), Ranking of Countries for Mining Investment – Where `not to invest’ at http://www.dolbear.com/news-resources/documents
Blöndel, J. and T. Curristine (2004), “Budgeting in Chile”, OECD Journal on Budgeting, vol. 4/2,
www.oecd.org/chile/40139802.pdf.
Boadway, R. and M. Keen (2010), “Theoretical perspectives on resource taxation design”, in Daniel, P., Keen, M., McPherson, C., (eds.) The Taxation of Petroleum and Minerals: Principles, Problems and Practice, Routledge and the International Monetary Fund, London and New York.
Boston Consulting Group (2007), Estudios de Competitividad en Clusters de la Economía Chilena, del Consejo Nacional de Innovación para la Competitividad. www.bligoo.com/media/users/3/182374/files/18813/Documento%20de%20Referencia%20Mineria.pdf
Clausen, J.R. (2008), Calculating sustainable non-mineral balances as benchmarks for fiscal policy: the case of Botswana, IMF Working Paper WP/08/117, Washington.
Comisión Chilena del Cobre (2011), Yearbook: Copper and Other Mineral Statistics 1991-2010.
Cramton, P., S. Dinkin and R. Wilson (2012), “Auctioning Rough Diamonds: A Competitive Sales Process for BHP Billiton’s Ekati Diamonds”, 27 November 2012 in the Handbook of Market Design, Z. Neeman, A. Roth and N. Vulkan, eds., Oxford University Press.
Ernst and Young (2011). Doing Business in Chile 2011, http://emergingmarkets.ey.com/wp-
content/uploads/downloads/2012/03/doing-business-2011.pdf.
Evan-Zohar, C. (2002), From Mine to Mistress: Corporate Strategies and Government Policies in the International Diamond Industry, Mining Journal Books.
Eyzaguirre, N., M. Marcel, J. Rodríguez, J. and M. Tokman (2005), Hacia la economía del conocimiento: el camino para crecer con equidad en el largo plazo, Estudios Públicos, 97.
Fernandez-Stark K., P. Bamber and G. Gereffi (2010b), “Engineering services in Chile: opportunities and challenges”, addendum to the full report entitled Engineering Services in the Americas.

268 – 7. MINERAL RESOURCE POLICIES FOR GROWTH AND DEVELOPMENT: GOOD PRACTICE EXAMPLES
EXPORT RESTRICTIONS IN RAW MATERIALS TRADE: FACTS, FALLACIES AND BETTER PRACTICES © OECD 2014
Fernandez-Stark, K., P. Bamber and G. Gereffi (2010a), Engineering services in the Americas ,
Center on Globalization, Governance & Competitiveness, Duke University , Study commissioned by the Inter-American Development Bank & the Chilean Economic Development Agency (CORFO), www.cggc.duke.edu/pdfs/CGGCIDB_CORFO_Engineering_Services_in_the_Americas_July_1_2010.pd
Fraser Institute Survey of Mining Companies (2013), http://www.fraserinstitute.org/uploadedFiles/fraser-ca/Content/research-news/research/publications/mining-survey-2013.pdf.
Ffrench Davis, R. and E . Tironi (1974), El Cobre en el Desarrollo Nacional, Ceplan Universidad Católica.
Fundacion Chile (2011), Fuerza laboral en la gran minería chilena diagnóstico y recomendaciones, 2011–2020,
www.consejominero.cl/doc_home/Fuerza_Laboral_Diagnostico_y_desafios12_ene.pdf.
Goldin, C., “The Human Capital Century and American Leadership: virtues of the past”, Economic History Association Presidential Address 2000. NBER working Paper 8239.
Government of Botswana (2009), 10th National Development Plan at http://www.finance.gov.bw/templates/mfdp/file/File/NDP%2010%20final%2016th%20Dec%202009%20edit%20in%2019%20Jan%202010.pdf
Hancock, T. (2011), Minerals sector revenues to aid economic diversification: Mining Weekly. (Accessed April 12, 2012, at http://www.miningweekly.com/print-version/mineral-sector-revenues-to-aid-ecoomic-diversification-2011-02-25.
Hogan, L. and B. Goldsworthy (2010), “International mineral taxation: experience and issues”, in P. Daniel, M. Keen and C. McPherson (eds.) The Taxation of petroleum and Minerals: Principles, Problems and Practice, Routledge, Oxford.
Humphreys, M., J. Sachs and J.E. Stiglitz (2007) Escaping the Resource Curse, Columbia University Press, New York.
Iimi, A. (2007), Escaping from the Resource Curse: Evidence from Botswana and the Rest of the World, IMF Staff Papers, Vol. 54, No. 4.
International Monetary Fund (2012a), Botswana Article IV Report, 2012, Country Report 12/234, Appendix III – Long Term Fiscal Sustainability Benchmarks.
International Monetary Fund (2012c), Macroeconomic Policy Frameworks for Resource-rich Developing countries – Background paper 1, supplement 1, August 24.
International Monetary Fund (2008), “Chile: Selected Issues Paper”, IMF Country Report
no. 08/239, July.
ISFWF (International Forum of Sovereign Wealth Funds) (2011), IFSWF Members’ Experiences in the Application of the Santiago Principles, Report prepared by IFSWF Sub-Committee 1 and the Secretariat in collaboration with the Members of the IFSWF, at http://www.ifswf.org/pst/stp070711.pdf.
Jefferis, K. (2009), “The role of TNCs in the extractive industry of Botswana”, in Transnational Corporations, United Nations Conference on Trade and Development.
Korinek, J. (2013), “Mineral Resource Trade in Chile: Contribution to Development and Policy Implications”, OECD Trade Policy Papers, No. 145, OECD Publishing. http://dx.doi.org/10.1787/5k4bw6twpf24-en.
Korinek, J. (2014), “Export Restrictions on Raw Materials: Experience with Alternative Policies in Botswana”, OECD Trade Policy Papers, No. 163, OECD Publishing, Paris.
http://dx.doi.org/10.1787/5jzb6v86kz32-en.
Korinek, J., and J. Kim, (2010) “"Export Restrictions on Strategic Raw Materials and Their Impact on Trade", OECD Trade Policy Papers, No. 95, OECD Publishing, Paris. DOI: http://dx.doi.org/10.1787/5kmh8pk441g8-en.
7. MINERAL RESOURCE POLICIES FOR GROWTH AND DEVELOPMENT: GOOD PRACTICE EXAMPLES – 269
EXPORT RESTRICTIONS IN RAW MATERIALS TRADE: FACTS, FALLACIES AND BETTER PRACTICES © OECD 2014
Lagos, G. and E. Blanco (2010), “Mining and development in the region of Antofagasta”, Resources Policy, Vol. 35.
Land, B. (2007), “Capturing a fair share of fiscal benefits in the extractive industry”. Background paper prepared for UNCTAD. London: Commonwealth Secretariat, mimeo.
Lewin, M. (2011), “Botswana’s Success: Good Governance, Good Policies and Good Luck”, Chapter 4 in World Bank’s Yes, Africa Can, Washington D.C.
Luong, P.J. and E. Weinthal, Rethinking the Resource Curse: Ownership, Structure, Institutional Capacity and Domestic Constraints, Annual Review of Political Science, Vol. 9, June 2006, p. 241-63.
Maipose, G.S. (2008), Policy and Institutional Dynamics of Sustained Development in Botswana, Working Paper No. 35, World Bank, Washington, D.C.
Manzano, O. and R. Rigobon (2007), “Resource curse or debt overhang?” in Lederman, D. and Maloney, W.F. (eds), Natural Resources: Neither Curse nor Destiny, Stanford University Press
and the World Bank.
Marcel (2012), “Es posible derogar la Ley Reservada del Cobre? Alternativas para el financiamiento de las adquisiciones militares en Chile”, mimeo.
Marcel, M. and A. Vega (2010), “Los Fondos Soberanos y la Polítíca Físcal en Chíle 2006-2010”, Documento de Trabajo CIEPLAN, November; www.cieplan.org/media/publicaciones/archivos/314/Paper.pdf
Marcel, M., M. Tokman, R. Valdes, and S. Benavides (2001), “Balance estructural: Labase de la nueva regla de policita fiscal chilena”, Economia Chilena, Vol. 4,3.
Matshediso, I.B. (2005), “A review of mineral development and investment policies of Botswana”, Resources Policy, No. 30.
Mehlum, H., K. Moene and R. Torvid (2006), “Institutions and the resource curse”, Economic Journal, Vol. 116 (508), p. 1-20.
Meller, P. and M. Lima (2003), Análisis y evaluación de un cluster minero en Chile, Consejo Minero.
OECD (2010), OECD Economic Surveys: Chile 2010, OECD Publishing, Paris. http://dx.doi.org/10.1787/eco_surveys-chl-2010-en.
OECD (2005), Knowledge Intensive Service Activities in the Mining Technology Services Industry in Australia, www.oecd.org/dataoecd/11/41/34570991.pdf.
Olson, D.W. (2012), Gemstones: U.S. Geological Survey Mineral Commodity Summaries 2012, p. 62–63.
Otto, J. (2000), Mining Taxation in Developing Countries, study prepared for UNCTAD, http://r0.unctad.org/infocomm/diversification/cape/pdf/otto.pdf.
Otto, J., C. Andrews, F. Cawood, M. Doggett, P. Guj, F. Stermole, J. Stermole and J. Tilton (2006). Mining Royalties: A Global Study of Their Impact on Investors, Government, and Civil Society,
World Bank, Washington, D.C.
Pegg, S. (2010), Is there a Dutch disease in Botswana?, Resources Policy, vol. 35.
Ramos J. (1998), “Una estrategia de desarrollo a partir de los complejos productivos en torno a los recursos naturales”, Revista de la Cepal, No. 66 December.
Rodríguez C.J., R.C. Tokman, C.A. Vega (2007), Structural Balance Policy in Chile, Gobierno de Chile, Ministerio de Hacienda, Dirección de Presupuestos, Studies in Public Finance, December.
Sachs, J.D. and A. Warner (1995), “Natural resource abundance and economic growth”, NBER Working Paper, No. 5398.
Sala-i-Martin, X. and A. Subramanian (2003), “Addressing the natural resource curse: an illustration from Nigeria”, NBER Working Paper, No. 9804, Cambridge, Massachusetts.

270 – 7. MINERAL RESOURCE POLICIES FOR GROWTH AND DEVELOPMENT: GOOD PRACTICE EXAMPLES
EXPORT RESTRICTIONS IN RAW MATERIALS TRADE: FACTS, FALLACIES AND BETTER PRACTICES © OECD 2014
Sarraf, M. and M. Jiwanji (2001), “Beating the resource curse: The case of Botswana”, Environment Department Working Paper No. 83, October, World Bank, Washington, D.C.
Stijns, J.-P. (2003), “An empirical test of the Dutch disease hypothesis using a gravity model of trade”, International Trade No. 0305001, EconWPA.
UNCTAD (2007), World Investment Report: Transnational Corporations, Extractive Industries and Development, Geneva.
UNCTAD (2012), “Country fact sheet: Botswana” in The World Investment Report 2012 (WIR12), New York.
UNCTAD (2011), “Best Practices in Investment for Development, How to Attract and Benefit from FDI in Mining: Lessons from Canada and Chile”, Investment Advisory Series B, No. 7, New York and Geneva.
UNCTAD (2008), World Investment Directory, Volume X, Africa, Geneva.
Urzua, O. (2007), “Emergence and Development of Knowledge-Intensive Mining Services (KIMS)”, UNCTAD report.
Vernon, R. (1974) Sovereignty at Bay, Basic Books, New York.
World Trade Organization (WTO) (2010), World Trade Report 2010: Trade in Natural Resources.
WTO (2009), Trade Policy Review: Botswana, WTO, Geneva.
Wright, G. and J. Czelusta (2004), “Why Economies Slow: The Myth of the Resource Curse”, Challenge, Vol. 47, No.2, March/April 2004, pp. 6-38.
Wright, G. and J. Czelusta (2007), “Resource-Based Growth Past and Present” in Natural resources, neither curse nor destiny by D. Lederman and W.F. Maloney, Stanford University
Press and the World Bank, 2007.
7. MINERAL RESOURCE POLICIES FOR GROWTH AND DEVELOPMENT: GOOD PRACTICE EXAMPLES – 271
EXPORT RESTRICTIONS IN RAW MATERIALS TRADE: FACTS, FALLACIES AND BETTER PRACTICES © OECD 2014
Annex 7.A.
Institutions framing the mining sector in Chile
Beyond the overall governance framework and sound macroeconomic policies and institutions, countries need institutions and policies geared specifically to the extractive industries. Key elements of a specific policy mix for extractive industries should include (UNCTAD, 2007; Otto et al., 2006):
A knowledge base of a country’s mineral endowments through geological surveys.
A legal framework governing the exploration and exploitation of mineral resources that establishes mineral ownership rights.
An administrative framework for the extraction of mineral resources. This involves the issuing of licenses, defining under what conditions exploration or extraction may take place and developing mining-right cadastres (i.e. compilations of current exploration and mining activities in the country and their ownership).
Policies relating to the production of minerals that regulate the activities of industrial and artisanal mining.
A system of revenue management. This concerns the sharing and distribution of the rents from mineral extraction.
Policies related to the health and safety of workers, protection of the environment and the rights of local communities.
The frameworks described above are administered, regulated, managed, and subject to oversight by a number of different entities from various arms of government, regulatory agencies, industry associations and public and private sector firms. There is no single way of doing this. The allocation of responsibilities between entities and the complex web of relationships between them is often in part a function of historical evolution. The resulting institutional context, however, often determines whether the necessary frameworks are in place to provide oversight without stifling the enterprise of productive actors. A view of the different institutions with a decision-making role in the mining sector in Chile, and an overview of their interactions, is shown in the following chart.
A large share of Chile’s copper production (82% in 2010) is carried out by the five largest enterprises: Codelco (state-owned), BHP-Billiton, Anglo-American, Antofagasta Minerals and Collahuasi (a joint venture between Xstrata, Anglo-American and Mitsui Corp). All these firms, except Codelco, are incorporated outside Chile. Antofagasta Minerals, a Chilean-based company, is listed on the London Stock Exchange. This is typical even among smaller firms: only three out of over 200 companies involved in mining in Chile are listed in the country. One reason for this is the small number of Chilean firms that incorporate: most exist under limited liability or natural persons status.
The smallest firms are supported by the Empresa Nacional de Minería (ENAMI). ENAMI´s mission is to promote small and medium-sized private sector mining in Chile, and to correct for market failures affecting its performance, by providing a range of services that firms require in order to be competitive.
1 ENAMI’s Board of Directors consists of the Minister of Mining, a representative
of the Minister of Finance, a representative of the President, a representative of COCHILCO, the copper advisory agency, and SONAMI, an industry association comprising small, medium-sized and

272 – 7. MINERAL RESOURCE POLICIES FOR GROWTH AND DEVELOPMENT: GOOD PRACTICE EXAMPLES
EXPORT RESTRICTIONS IN RAW MATERIALS TRADE: FACTS, FALLACIES AND BETTER PRACTICES © OECD 2014
large copper producers (Figure 7.A1). Its efforts are concentrated on 2000 small private-sector firms. ENAMI buys unprocessed copper from small mining firms at a rate negotiated with SONAMI. Small firms thereby profit from ENAMI’s buying and selling on a larger scale. ENAMI buys unprocessed copper and refines it for sale on the international market. It is the sixth largest copper exporter in Chile. ENAMI also provides financing to small mining firms and provides technical assistance.
An important element in the framework of mining operations is the ownership of resources and the permission to prospect and exploit them. In Chile as in many countries, mineral resources are owned by the state and this ownership is established in the Chilean Constitution. Concessions for exploration and exploitation are granted by the court rather than a government agency which is thought to limit potential administrative discretion. Exploration permits are granted for a period of two years, renewable for another two years. Holders of exploration permits are given priority in transforming to an exploitation concession (UNCTAD, 2011). Once a permit has been granted for exploitation, the owner can keep it as long as a small annual fee is paid, regardless of whether exploitation is actually undertaken. Exploitation can be sub-contracted by the permit holder. It has been suggested that this situation may induce rent-seeking behaviour or sub-optimal extraction levels since a permit holder has no incentive to relinquish the permit. It is commonly thought that almost all potential areas have been staked.
2
Figure 7.A1. Decision-making institutions in the Chilean mining sector and their interactions

7. MINERAL RESOURCE POLICIES FOR GROWTH AND DEVELOPMENT: GOOD PRACTICE EXAMPLES – 273
EXPORT RESTRICTIONS IN RAW MATERIALS TRADE: FACTS, FALLACIES AND BETTER PRACTICES © OECD 2014
Mining development is best managed when it is supported by substantial and reliable geological information regarding the size and quality of potential deposits. In some resource-rich countries, there is a wealth of publicly available information.
3 Chile’s geological service,
Sernageomin, holds information on the claims that have been staked for exploration and exploitation. Sernageomin does not, however, consolidate detailed information on the size and quality of deposits. Since Sernageomin has no obligation to provide such information, a comprehensive picture of the size, location and grade of deposits is not available in the public domain. This is one area where the institutional structure of Chile’s mining sector could be improved. Indeed, a survey by the Fraser Institute of 690 mining companies ranked Chile 32
nd out of
112 countries in terms of the quality of and access to geological data. Three per cent of respondents indicated that the lack of such data was a strong deterrent to investment in the sector, and 11% indicated that it was a mild deterrent.
4 There have been some recent moves to strengthen
the public availability of information. In particular, a law on mine closure financing, the Ley de Cierre de Faenas (Mine Closure Act), published in November 2011, includes some provisions for sharing information on exploitation plans.
Notes to Annex 7.A.
1. See www.enami.cl/english-overview/english-overview.html.
2. The lack of publicly-available information regarding the concessions granted means that there are different views concerning the distribution of these concessions, although there seems to be consensus that most potentially viable claims have been staked either by Codelco or BHP-Billiton. Certainly, Codelco holds more claims than it has the capacity to exploit and has signed agreements with several companies (including Antofagasta Minerals and Rio Tinto) to exploit some of its concessions.
3. An excellent example is the United States Geological Service (USGS).
4. http://www.fraserinstitute.org/uploadedFiles/fraser-ca/Content/research-news/research/publications/mining-survey-2013.pdf.

274 – 7. MINERAL RESOURCE POLICIES FOR GROWTH AND DEVELOPMENT: GOOD PRACTICE EXAMPLES
EXPORT RESTRICTIONS IN RAW MATERIALS TRADE: FACTS, FALLACIES AND BETTER PRACTICES © OECD 2014
Annex 7.B.
Institutions framing the mining sector in Botswana
Diamond production in Botswana started in 1971. Botswana has since become the world’s largest producer of diamonds from the most profitable diamond mines in existence, producing 25-30% of the world’s gem-quality diamonds. Diamonds mined in 2011 represented about USD 4.5-5 billion and 23 million carats.
1 In Botswana, as is generally the case globally, all minerals belong to
the State.
From the outset, the Government of the Republic of Botswana (GRB) has been involved in a joint venture with the world’s largest private diamond-producing firm, De Beers. In 1969, the De Beers Botswana Mining Co. was established to develop the country’s diamond deposits. At the time, the Botswana government held a 15% share in the company (Evan-Zohar, 2002). This was increased to 50% in 1975 once production was underway and the joint venture firm was named Debswana. Production originally took place in Botswana’s Orapa location. A few smaller diamond deposits were discovered at a second location near Letlhakane, and production was started there in 1977. The world’s most profitable diamond mine, Jwaneng, started production in 1982. Botswana’s diamonds currently represent about 72% of De Beers’ total production in value, and about 42% in volume.
2,3
Botswana has established a number of institutional structures for the management of mineral revenues. The high-level Minerals Policy Committee sets the framework for taxation and revenue-raising in the mining sector, and takes a lead role in negotiations with mining firms.
4 This group has
been particularly important in the context of negotiations with De Beers over the distribution of revenues from Debswana. Botswana has negotiated astutely, using its leverage to win concessions that have resulted in a favourable revenue-sharing formula. This leverage was first used in the 1970s during negotiations for additional mining licences, which were used to increase the GRB’s share in Debswana from 15% to 50%. It was used again to increase the GRB’s overall revenue share when the original mining licences came up for renewal in the 2000s. In 2011, negotiations for the renewal of the Debswana marketing contract were used to win concessions regarding the building of downstream diamond industry activities and the establishment of an independent marketing channel outside the De Beers Diamond Trading Company (DTC) marketing structure. (This issue is examined more closely in a later section of this chapter). Botswana’s leverage arises from its role as the world’s largest producer of rough diamonds, and its dominant position as the largest single contributor to De Beers’ sales and profits. The GRB has invested substantially in its relationship with De Beers in this regard.
Debswana, the firm licensed to extract the vast majority of Botswana’s diamonds, is therefore a 50-50 joint venture between the GRB (GRB) and De Beers S.A., the largest diamond-producing firm worldwide. Debswana’s Board of Directors is comprised of six members appointed by the GRB and six by De Beers S.A, as well as one ex-officio member, its Managing Director.
In addition, through Debswana the GRB has owned a 15% share in the De Beers global group since the late 1980s. During the 1980s, when diamond prices were low, Debswana stockpiled a substantial quantity of rough diamonds. When the market recovered in 1986, this stockpile was sold to De Beers and Debswana was paid partly in cash and partly in shares in De Beers. The GRB also obtained the right to appoint two directors to the global De Beers firm’s board.
5 In this way, the
GRB obtained access to high-level information regarding the operation of the global diamond industry (Jefferis, 2009).

7. MINERAL RESOURCE POLICIES FOR GROWTH AND DEVELOPMENT: GOOD PRACTICE EXAMPLES – 275
EXPORT RESTRICTIONS IN RAW MATERIALS TRADE: FACTS, FALLACIES AND BETTER PRACTICES © OECD 2014
At present, De Beers is owned jointly by Anglo-American (85%) and the GRB through Debswana (15%). Debswana also holds shares in Anglo-American which equalled 2% of Anglo-American’s value in the early 2000s although half its shares were sold in 2004 (Evan-Zohar, 2002).
Responsibility for regulating the diamond-mining industry, and for minerals policies generally, lies with the Ministry for Mineral, Energy and Water Resources (MMEWR). The MMEWR regulates all mining, prospecting and exploration activities as well as mineral processing activities; collects and disseminates geological information; and is responsible for all financial, commercial and administrative issues arising in those mineral sector companies in which the GRB is a shareholder. The Permanent Secretary of the MMEWR sits on the Board of Debswana, the Botswana Diamond Trading Company (DTCB), the selling arm of the De Beers network, and De Beers S.A. The Ministry of Finance and Development Planning oversees revenue collection including that of the minerals sector among other responsibilities. The Permanent Secretary sits on the Board of Debswana and of De Beers S.A. Other Debswana Board Members appointed by the GRB are the Governor of the Bank of Botswana, Attorney General, and the Permanent Secretary of the Office of the President.
Availability of geological information
The quality of geological information available in Botswana is generally good. Three-quarters of investors said the quality of geological information available encourages investment (21%) or does not deter investment (52%). Six per cent of respondents indicated that geological information was a strong deterrent to mining investment in Botswana while for 24 per cent it was a mild deterrent (Fraser Institute, 2013). In terms of the quality of geological information, Botswana ranks 48 out of 112 mining jurisdictions surveyed. It is ranked third-highest among non-OECD jurisdictions (after South Africa and Namibia) according to this criterion.
A good, consolidated database of all available geological information is a strong public good, providing vital information to potential investors and to policymakers. An aero-magnetic study of the entire country was completed in the late 1970s and early 1980s supported by development assistance. In 1993, a study was undertaken to provide more information at a higher level of resolution (1:125 000). Geochemical maps are also used.
Best practice, according to MMEWR officials, would involve the updating of geological databases regularly with information that is obtained quarterly from prospectors once their licences lapse. Although there is a substantial effort in this area, it is still incomplete. Nonetheless, the availability of up-to-date and easily accessible geological information from the Geological Survey department has made it quicker, easier and less costly for exploration firms to get started (Matshediso, 2005).
Legal framework for mining operations: Licensing
The legal framework for mining operations is based on the Mines and Minerals Act of 1999 which determines, inter alia, the process by which licences are granted. Firms wishing to undertake mineral exploration in Botswana must obtain a prospecting licence, which is valid for three years, renewable for two two-year periods (i.e. potentially seven years in total). The granting of a prospecting licence involves a commitment to a minimum level of expenditure over the licence period. When applying for renewal, prospecting firms must submit reports regarding their exploration activities and information on existing deposits to the Geological Survey of the MMEWR. If the prospecting licence does not lead to an application for a retention or mining license, the information submitted to the MMEWR can be made available to other companies that apply for a prospecting licence in the same area.
When prospectors find significant deposits that are not economically viable to mine under present conditions, they can apply for a retention licence. The retention licence is granted for a period of three years, renewable for three years, whose cost is substantially higher than that of the prospecting licence, and increases annually. The relatively high cost of the retention licence and its

276 – 7. MINERAL RESOURCE POLICIES FOR GROWTH AND DEVELOPMENT: GOOD PRACTICE EXAMPLES
EXPORT RESTRICTIONS IN RAW MATERIALS TRADE: FACTS, FALLACIES AND BETTER PRACTICES © OECD 2014
increase over time aims to give an incentive to firms to release concessions that they do not intend to mine.
When a mineral deposit is found to be economically viable during the prospecting phase, the holder of the prospecting licence has a preferential right to apply for a mining licence. Mining licences are granted for up to 25 years and are issued only to firms registered in Botswana. Mining licences can be automatically renewed subject to the fulfilment of certain conditions that are specified in the Mines and Minerals Act. Licence applicants must show proof of technical competence and access to adequate financial resources. A mining licence costs 100 Pula (USD 12) per square km. The granting of a mining licence automatically gives the investor a lease on the land covered by the licence (Jefferis, 2009).
All applicants for a mining or retention licence must carry out an Environmental Impact Assessment (EIA) as part of the feasibility study that accompanies the licence application. At the end of the mining operation, the holder of the mineral concession has to restore the topsoil of affected areas and restore the land to a substantial degree to its former condition (Jefferis, 2009). The environmental impact of diamond mining activity in Botswana is relatively small compared to other kinds of mining operation, as the diamond mines are open cast and processing generally involves washing and sorting rather than chemical processes. The main environmental impact comes from extracting underground water.
Debswana’s 25-year licence for mining diamonds was renewed in September 2004 (Iimi, 2007). There are no legislated restrictions prohibiting other companies from mining and marketing diamonds (WTO, 2009). A number of firms are presently prospecting and mining diamonds in Botswana. According to Botswana legislation, diamond mining licences are subject to negotiated settlement regarding terms and conditions, including taxes and royalties. For all other minerals, however, the terms are not subject to negotiation and the tax and royalty regimes are fixed in the legislation.
6 Korinek (2014) reports that, based on the author’s personal contacts, all new diamond
mining firms appear in practice to be subject to the same terms as other mining firms and there is scarce potential for negotiation. That all firms are subject to similar terms contributes to good practice. It would be more transparent, however, if this were clearly stated in appropriate legislation.
At the moment of issuing a mining licence, the GRB has the option of acquiring up to 15% working interest participation in any mining company (Matshediso, 2005). This practice, however, has not been exercised recently, for several reasons. First, recently licensed mining operations have been relatively small, which affects the balance of costs and benefits from the GRB exercising a shareholder function. Second, the GRB considers that the existing tax system is quite efficient at capturing mineral rents and there would be little additional revenue to be gained. Third, the 15% shareholding has to be paid for (at cost), but perhaps more importantly, the GRB as shareholder would be obliged to provide the relevant share of future capital expenditure requirements for mine development.
An amendment has been proposed to the Mines and Minerals Act whereby the 15% working interest participation, in particular in foreign entities, is opened to Botswana citizens, if the GRB does not exercise its right to minority participation. The idea is to facilitate the participation of Batswana in such ventures. As the details of such a policy are important to its outcome, it will be important to follow the evolution of such an amendment.
Institutions surrounding the processing and selling of diamonds7
After extraction, diamonds are sorted and valued according to four basic criteria, called the “four C’s”: carat, colour, clarity and cut.
8 Diamond valuation is complex, and no two diamond experts
will give the same value to a given diamond. Hence, diamonds are not a “commodity” since each one is different and valuation is a complex and imperfect process. This is one of the major differences between diamonds and most other products of the extractive industries. Rough (uncut) diamonds (i.e. those sold by Debswana) are valued according to their carat, clarity, colour and the cut that can be made most efficiently and the amount of the stone that will potentially be lost in the cutting process. Rough (uncut and unpolished) diamonds are not sold on the retail market and it is

7. MINERAL RESOURCE POLICIES FOR GROWTH AND DEVELOPMENT: GOOD PRACTICE EXAMPLES – 277
EXPORT RESTRICTIONS IN RAW MATERIALS TRADE: FACTS, FALLACIES AND BETTER PRACTICES © OECD 2014
against the law to hold rough diamonds without a licence under strict penalty (Mines and Minerals Act, 1999).
Once diamonds are sorted and valued according to the characteristics outlined above, they are “aggregated”. “Aggregation” is the process by which stones are combined in order to be sold as a package to licensed buyers of rough diamonds, who then cut and polish them. Polished stones are sold to jewellery manufacturers who supply design and production of jewellery. The end of the value-chain is the retail sellers who specialise in commercial operations and marketing.
The sorting and valuation stages in the diamond value-chain in Botswana are done exclusively by the Diamond Trading Company Botswana (DTCB). The DTCB is a 50-50 joint venture between the GRB and De Beers. Its Board of Directors is made up of ten people, in equal measure nominated by the GRB and by De Beers. The DTCB puts together “packages” of diamonds to be sold to licensed Botswana Sightholders in sales held ten times per year. The diamonds that are not sold to Botswana Sightholders are sold to Diamond Trading Company International (DTCI).
9 DTCI is a subsidiary of De Beers, and handles the aggregation of rough
stones, combining diamonds from Botswana with those from other mines in the De Beers group, specifically Namibia, South Africa and Canada.
The creation of the DTCB was a major step in Botswana’s push to increase its value addition in the diamond industry and increase the number and skill level of the industry participants. DTCB is the largest diamond sorting and valuing facility in the world, and uses state of the art technology. It employs 400 people and includes an in-house diamond academy to train new recruits in sorting and valuing techniques.
Until 2013, Debswana was under contract to sell all its output to DTCI and DTCB. DTCI and DTCB, however, are not obliged to buy all of Debswana’s production. This particular contractual agreement arose in part due to competition policies in final goods markets. In accordance with US antitrust legislation and EU competition directives, DTCI cannot hold excess inventory.
10 So as not
to allow the price of diamonds to fall, and as diamond sales are based on a three-year contract, DTCI does not buy diamonds it cannot sell in a reasonable amount of time. Since Debswana’s contractual agreement with De Beers does not allow it to sell its production elsewhere, it halts production when demand falls sharply or for an extended period. This happened in 2009 when global demand for diamonds fell: Debswana, the largest private sector employer in Botswana, halted all production of diamonds for several months, sending several thousand of its 5 510 permanent employees home on extended leave with full pay while cutting 580 jobs.
11
De Beers agreed, in its last contractual discussions with the GRB to move all its aggregation and rough diamond sales operations for all diamonds sold within the De Beers network to Botswana’s capital, Gaborone. This is part of the GRB’s and De Beers’ local “beneficiation” strategy to generate more benefits in diamond-producing countries through the development of downstream activities in the diamond industry, ranging from sorting and valuing diamonds, to cutting and polishing, to the manufacture of jewellery.
Notes to Annex 7.B.
1. The exact figure in value is not published in a transparent fashion. This was calculated by combining De Beers company totals with shares for Botswana’s production that were communicated by in-country regulators and executives.
2. www.debeersgroup.com/ImageVaultFiles/id_2067/cf_5/2012_OFR_Performance_Statistics.PDF.
3. De Beers also has mining operations in South Africa, Namibia and Canada.
4. The Minerals Policy Committee is comprised of the Permanent Secretary, Ministry of Minerals, Energy and Water Resources (MMEWR); the Permanent Secretary, Ministry of Finance and Development Planning (MFDP); the Permanent Secretary to the President; the Governor of the Bank of Botswana; and the Attorney General.

278 – 7. MINERAL RESOURCE POLICIES FOR GROWTH AND DEVELOPMENT: GOOD PRACTICE EXAMPLES
EXPORT RESTRICTIONS IN RAW MATERIALS TRADE: FACTS, FALLACIES AND BETTER PRACTICES © OECD 2014
5. www.debeersgroup.com/en/About-Us/Governance/Board-Of-Directors/.
6. Mines and Minerals Act and the Income Tax Act.
7. For more details of the processes in downstream in the diamond value-chain, see Korinek (2014).
8. The carat refers to the weight of the diamond. Diamonds are found in a range of colours, the rarest being colourless or fancy colours such as red, blue or green. Clarity is graded according to the visibility of inclusions or blemishes under tenfold magnification. The cut of a diamond is the only element that is determined by human intervention. No two diamonds are the same. The value of a particular diamond takes all these characteristics into account, some of which have a subjective element.
9. DTCI has recently been renamed De Beers Global Sightholder Services.
10. In 2001, several law suits were filed in US courts alleging that De Beers “unlawfully monopolised the supply of diamonds, conspired to fix, raise, and control diamond prices, and issued false and misleading advertising”. After multiple appeals, in 2012 the US Supreme Court denied final petition for review, and a settlement in the amount of USD 295 million with an agreement to “refrain from engaging in certain conduct that violates federal and state antitrust laws” was finalised.
11. The Telegraph, “De Beers to suspend work at Botswana diamond mine as sales slide, 23 February 2009, www.telegraph.co.uk/finance/financialcrisis/4789233/De-Beers-to-suspend-work-at-Botswana-diamond-mines-as-sales-slide.html