THIS REPORT CONTAINS ASSESSMENTS OF COMMODITY AND … · a/ includes wheat flour exports, but...
21
THIS REPORT CONTAINS ASSESSMENTS OF COMMODITY AND TRADE ISSUES MADE BY USDA STAFF AND NOT NECESSARILY STATEMENTS OF OFFICIAL U.S. GOVERNMENT POLICY Date: GAIN Report Number: Approved By: Prepared By: Report Highlights: The Korean government announced that it will seek to mitigate overproduction of rice through measures including reduction of area for rice cultivation to 711,000 Ha by 2018, planting of other crops in paddy land, releasing of stocks for use in animal feed, and promotional activities to increase consumption. Meanwhile, US rice tenders reached a record 38 percent of the WTO-mandated TRQ in 2015, representing 157,117 MT (milled basis) worth $142.6 million. MY 2015/16 wheat imports are revised up to 4.3 million tons, as competitively-priced feed grade wheat replaces corn. Meanwhile, MY 2015/16 corn imports remain unchanged at 10 million tons, however, U.S. corn exports are revised Sunchul Choi//Mark A. Myers Ross G. Kreamer January Update 2016 Grain and Feed Update Korea - Republic of KS1602 1/28/2016 Required Report - public distribution
Transcript of THIS REPORT CONTAINS ASSESSMENTS OF COMMODITY AND … · a/ includes wheat flour exports, but...

THIS REPORT CONTAINS ASSESSMENTS OF COMMODITY AND TRADE ISSUES MADE BY
USDA STAFF AND NOT NECESSARILY STATEMENTS OF OFFICIAL U.S. GOVERNMENT
POLICY
Date:
GAIN Report Number:
Approved By:
Prepared By:
Report Highlights:
The Korean government announced that it will seek to mitigate overproduction of rice through
measures including reduction of area for rice cultivation to 711,000 Ha by 2018, planting of other crops
in paddy land, releasing of stocks for use in animal feed, and promotional activities to increase
consumption. Meanwhile, US rice tenders reached a record 38 percent of the WTO-mandated TRQ in
2015, representing 157,117 MT (milled basis) worth $142.6 million. MY 2015/16 wheat imports are
revised up to 4.3 million tons, as competitively-priced feed grade wheat replaces corn. Meanwhile, MY
2015/16 corn imports remain unchanged at 10 million tons, however, U.S. corn exports are revised
Sunchul Choi//Mark A.
Myers
Ross G. Kreamer
January Update 2016
Grain and Feed Update
Korea - Republic of
KS1602
1/28/2016
Required Report - public distribution

down to 3 million tons due to a greater supply of competitively-priced South American corn.
Post:
Commodities:
Author Defined:
WHEAT
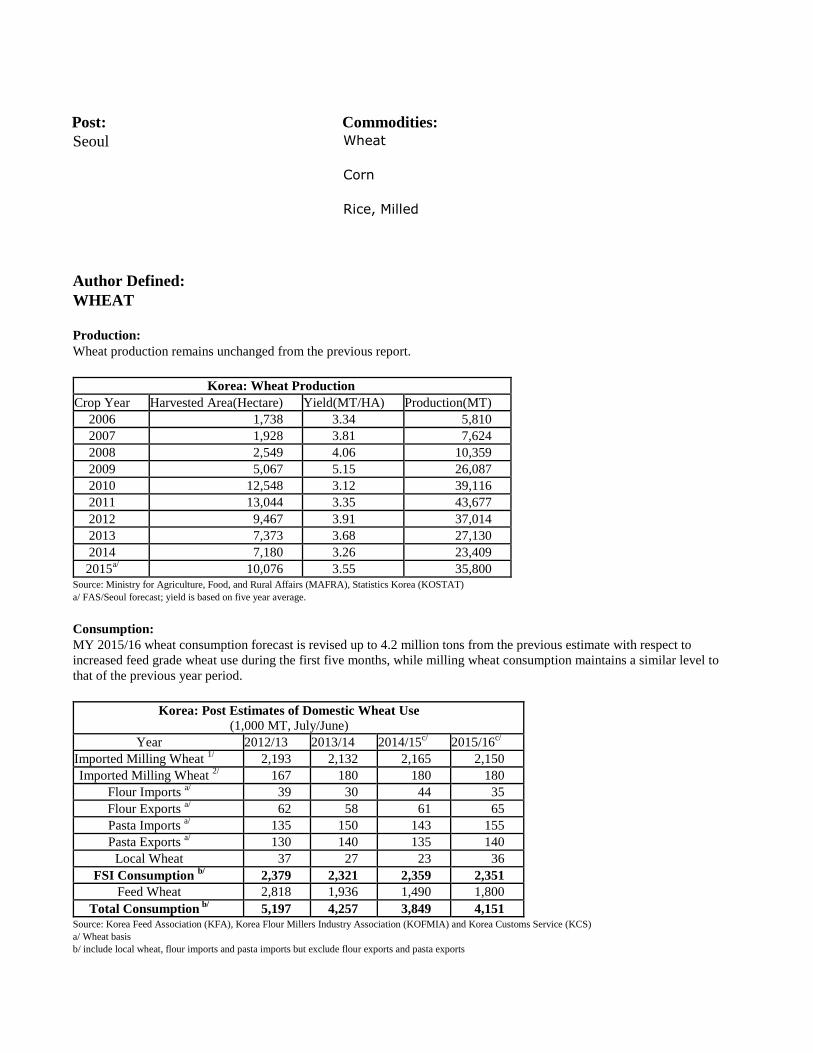
Production: Wheat production remains unchanged from the previous report.
Korea: Wheat Production
Crop Year Harvested Area(Hectare) Yield(MT/HA) Production(MT)
2006 1,738 3.34 5,810
2007 1,928 3.81 7,624
2008 2,549 4.06 10,359
2009 5,067 5.15 26,087
2010 12,548 3.12 39,116
2011 13,044 3.35 43,677
2012 9,467 3.91 37,014
2013 7,373 3.68 27,130
2014 7,180 3.26 23,409
2015a/ 10,076 3.55 35,800
Source: Ministry for Agriculture, Food, and Rural Affairs (MAFRA), Statistics Korea (KOSTAT) a/ FAS/Seoul forecast; yield is based on five year average.
Consumption: MY 2015/16 wheat consumption forecast is revised up to 4.2 million tons from the previous estimate with respect to
increased feed grade wheat use during the first five months, while milling wheat consumption maintains a similar level to
that of the previous year period.
Korea: Post Estimates of Domestic Wheat Use (1,000 MT, July/June)
Year 2012/13 2013/14 2014/15c/ 2015/16
c/
Imported Milling Wheat 1/
2,193 2,132 2,165 2,150
Imported Milling Wheat 2/ 167 180 180 180
Flour Imports a/ 39 30 44 35
Flour Exports a/ 62 58 61 65
Pasta Imports a/ 135 150 143 155
Pasta Exports a/ 130 140 135 140
Local Wheat 37 27 23 36
FSI Consumption b/ 2,379 2,321 2,359 2,351
Feed Wheat 2,818 1,936 1,490 1,800
Total Consumption b/ 5,197 4,257 3,849 4,151
Source: Korea Feed Association (KFA), Korea Flour Millers Industry Association (KOFMIA) and Korea Customs Service (KCS) a/ Wheat basis b/ include local wheat, flour imports and pasta imports but exclude flour exports and pasta exports
Rice, Milled
Corn
Wheat Seoul

c/ FAS/Seoul forecast 1/ KOFMIA members 2/ non- KOFMIA member
Korea: Monthly Wheat Use (1,000 MT)
Month Feed Wheat Milling Wheat a/
MY 2013/14 MY 2014/15 MY 2015/16 MY 2013/14 MY 2014/15 MY 2015/16
July 235 129 124 176 183 181
August 219 121 119 173 175 170
September 226 126 124 156 166 178
October 245 134 151 185 179 182
November 205 130 140 180 172 169
Subtotal 1,130 640 658 870 875 880
December 159 143 na 180 186 na
January 125 123 na 184 194 na
February 100 103 na 161 152 na
March 101 116 na 176 183 na
April 100 120 na 180 176 na
May 108 119 na 177 172 na
June 114 125 na 175 177 na
Total 1,936 1,490 na 2,102 2,115 na Source: KFA and KOFMIA a/ includes wheat flour exports, but excludes the portion used in soy-sauce production
Wheat Trade:
MY 2015/16 wheat imports are revised up to 4.3 million tons from the initial projection of 4 million tons due to increased
feed grade wheat imports, while 2.5 million tons for milling wheat (including flour and pasta imports on a wheat equivalent
basis) is unchanged. Milling wheat for flour processing is expected to remain at around 2.3 million tons.
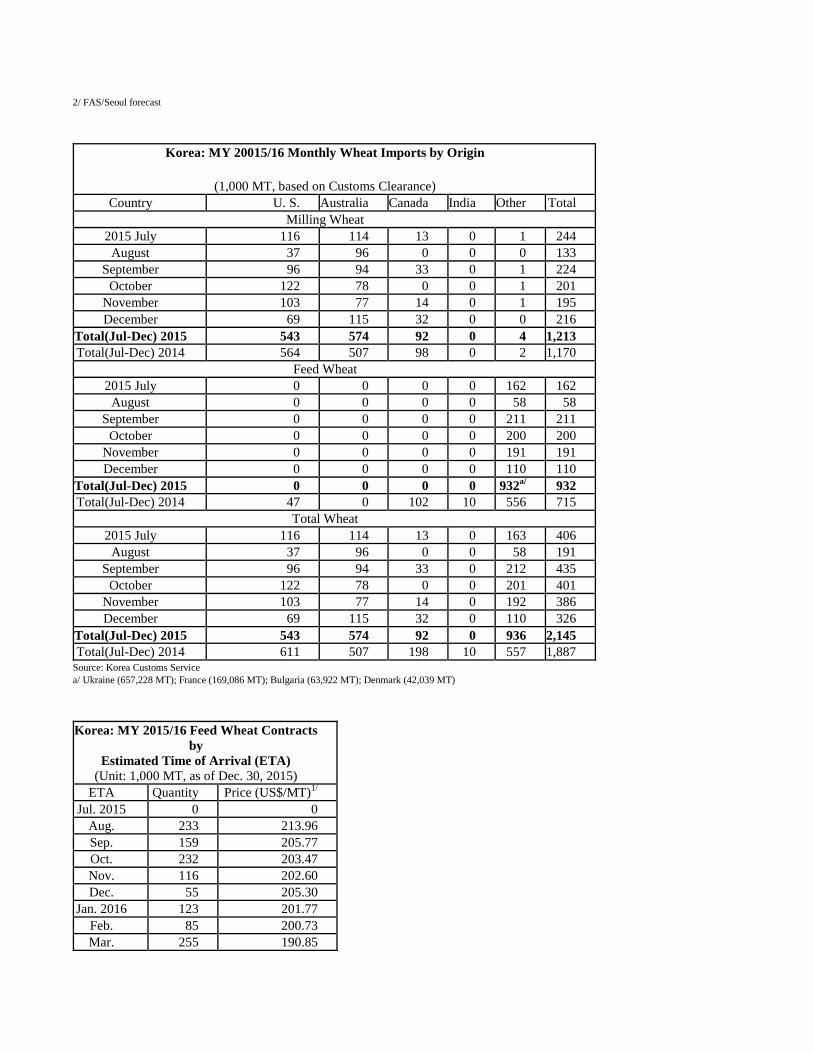
As of early January 2016, Korean feed millers have completed contracts for delivery of feed grade wheat for the first ten
months of MY 2015/2016 (Jul/Jun) at approximately 1.5 million tons, as feed grade wheat has become competitive with feed
corn as the price disparity between them in the global markets has narrowed. As such, feed millers are expected to contract
further amounts of feed wheat for the remainder of the marketing year.
Korea: Wheat Imports (1,000 MT, Customs Cleared Basis)
Marketing Year (July/June)
Feed Wheat Milling Wheat Flour Imports 1/
Pasta Import 1/
Total
05/06 1,536 2,220 41 101 3,898
06/07 976 2,298 69 108 3,451
07/08 565 2,317 105 117 3,104
08/09 1,151 2,058 69 105 3,383
09/10 2,164 2,071 127 119 4,481
10/11 2,075 2,520 63 123 4,781
11/12 2,868 2,169 42 122 5,201
12/13 2,820 2,461 39 135 5,455
13/14 1,948 2,181 30 150 4,309
14/15 1,391 2,370 44 143 3,948
15/162/ 1,800 2,300 40 160 4,300
Source: Korea Customs Service 1/ Wheat basis
2/ FAS/Seoul forecast
Korea: MY 20015/16 Monthly Wheat Imports by Origin
(1,000 MT, based on Customs Clearance) Country U. S. Australia Canada India Other Total
Milling Wheat
2015 July 116 114 13 0 1 244
August 37 96 0 0 0 133
September 96 94 33 0 1 224
October 122 78 0 0 1 201
November 103 77 14 0 1 195
December 69 115 32 0 0 216
Total(Jul-Dec) 2015 543 574 92 0 4 1,213
Total(Jul-Dec) 2014 564 507 98 0 2 1,170
Feed Wheat
2015 July 0 0 0 0 162 162
August 0 0 0 0 58 58
September 0 0 0 0 211 211
October 0 0 0 0 200 200
November 0 0 0 0 191 191
December 0 0 0 0 110 110
Total(Jul-Dec) 2015 0 0 0 0 932a/ 932
Total(Jul-Dec) 2014 47 0 102 10 556 715
Total Wheat
2015 July 116 114 13 0 163 406
August 37 96 0 0 58 191
September 96 94 33 0 212 435
October 122 78 0 0 201 401
November 103 77 14 0 192 386
December 69 115 32 0 110 326
Total(Jul-Dec) 2015 543 574 92 0 936 2,145
Total(Jul-Dec) 2014 611 507 198 10 557 1,887 Source: Korea Customs Service a/ Ukraine (657,228 MT); France (169,086 MT); Bulgaria (63,922 MT); Denmark (42,039 MT)
Korea: MY 2015/16 Feed Wheat Contracts by
Estimated Time of Arrival (ETA) (Unit: 1,000 MT, as of Dec. 30, 2015)
ETA Quantity Price (US$/MT)1/
Jul. 2015 0 0
Aug. 233 213.96
Sep. 159 205.77
Oct. 232 203.47
Nov. 116 202.60
Dec. 55 205.30
Jan. 2016 123 201.77
Feb. 85 200.73
Mar. 255 190.85

Apr. 160 190.25
May 69 182.75
Total 1,490 Source: Local Grain Traders 1/ CNF on Weighted Average
Production, Supply and Demand Data Statistics:
Wheat PS&D
Wheat 2013/2014 2014/2015 2015/2016
Market Begin Year Jul 2013 Jul 2014 May 2015
Korea, Republic of USDA Official New Post USDA Official New Post USDA Official New Post
Area Harvested 7 7 7 7 10 10
Beginning Stocks 1521 1521 1437 1402 1411 1328
Production 27 27 23 23 36 36
MY Imports 4288 4309 3942 3948 4200 4300
TY Imports 4288 4309 3942 3948 4200 4300
TY Imp. from U.S. 1409 1220 1160 1234 0 1300
Total Supply 5836 5857 5402 5373 5647 5664
MY Exports 144 198 153 196 150 200
TY Exports 144 198 153 196 150 200
Feed and Residual 1936 1936 1479 1490 1500 1800
FSI Consumption 2319 2321 2359 2359 2351 2351
Total Consumption 4255 4257 3838 3849 3851 4151
Ending Stocks 1437 1402 1411 1328 1646 1313
Total Distribution 5836 5857 5402 5373 5647 5664
(1000 HA) ,(1000 MT)
CORN
Production: Post’s corn production estimate remains unchanged from the previous report.
Korea: Corn Production
Crop Year Area (HA) Yield (MT/HA) Production (MT)
2006 13,661 4.73 64,623
2007 16,981 4.82 83,513
2008 18,366 5.05 92,830
2009 15,326 5.02 76,975
2010 15,528 4.79 74,339
2011 15,823 4.65 73,612
2012 17,001 4.89 83,210
2013 15,905 5.06 80,465
2014 15,839 5.18 82,008
2015a/ 15,800 4.91 77,640
Source: Ministry for Agriculture, Food, and Rural Affairs (MAFRA), Statistics Korea (KOSTAT) a/ FAS/Seoul projection based on five-year average yield
Consumption:

MY 2015/16 corn consumption forecast remains unchanged at 10.1 million tons from the previous report, which is composed
of 8 million tons for feed, and 2.1 million tons for food, seed and industrial (FSI) purpose. However, demand for feed corn
may be affected by a competitively-priced feed grade wheat supply in the global market. In MY 2015/16, compound feed
production remains at 18.9 million tons as projected in our initial forecast. However, a recent recurrence of foot and mouth
disease (FMD) may affect the level of compound feed production later.
MY 2014/15 corn consumption was estimated at a record 10.2 million tons due to greater demand for feed and food
processing purposes, which was composed of 8.0 million tons for feed, and 2.2 million tons for food, seed and industrial
(FSI), up three percent from the previous marketing year.
MY 2014/15 compound feed production was a record 19 million tons, 0.8 percent higher than the previous marketing year,
due to strong demand from the poultry sector which partly offset weaker demand from the cattle sector. Poultry compound
feed production increased by 8.7 percent from the previous marketing year, while compound feed production for cattle
declined by 6.4 percent.
The corn inclusion rate in total compound feed production grew to 42.3 percent in MY 2014/15, up 1.1 percent point from
the previous year with feed wheat use declining.
In MY 2014/15, processing corn consumption increased by four percent to more than 2.1 million tons from 2.0 million tons
in MY 2013/14. Wet millers consumed 96.3 percent of total processing corn with the remainder for dry millers. Major corn
processors have continued using traditional corn imported from Serbia, Ukraine, Russia, Hungary, Romania, Bulgaria,
Australia and Brazil, and non-GM corn imported from the United States for food. Many Korean food processing companies
are reluctant to use ingredients sourced from biotech corn.
Korea: Total Corn Utilization (Oct./Sept., 1,000 MT)
Marketing Year
Feed Processing a/
Food b/
Total
2008/09 6,368 1,418 108 7,894
2009/10 6,362 1,928 92 8,382
2010/11 6,074 2,051 89 8,214
2011/12 5,690 2,036 89 7,815
2012/13 6,483 1,900 98 8,481
2013/14 7,762 2,034 95 9,891
2014/15 c/ 8,035 2,118 97 10,250
2015/16 d/ 8,000 2,000 95 10,095
Source: Korea Feed Association (KFA), Korea Corn Processing Industry Association (KOCPIA) a/ Used for wet and dry milling process based on imported corn. b/ For on-farm human consumption (on-the-cob) or snack food consumed on-the-cob, as puffed kernels or as corn tea. Imported white corn for popping has been
included since MY 2004. c/ based on the imports for the first eleven months. d/ FAS Seoul forecast
Korea: Monthly Corn Use (1,000 MT)
Month Feed Corn Processing Corn
MY 2012/13 MY 2013/14 MY 2014/15 MY 2012/13 MY 2013/14 MY 2014/15
October 508 588 676 174 175 180
November 512 596 620 169 165 178
December 559 687 707 160 163 169
January 580 703 675 158 161 170
February 513 632 602 137 148 155
March 533 653 668 140 180 187

April 572 664 679 158 171 178
May 574 669 679 161 177 183
June 522 646 703 153 176 181
July 553 659 701 173 184 183
August 528 626 655 163 175 181
September 529 639 670 156 159 173
Total 6,483 7,762 8,035 1,900 2,034 2,118 Source: Korea Feed Association (KFA), Korea Corn Processing Industry Association (KOCPIA)
Korea: Feed Ingredient Use for Compound Feed Production (October/September, 1,000 MT)
Items MY 2012/13 MY 2013/14 MY 2014/15 MY 2015/16a/
Sub. Total Grains and Grain Substitutes 12,115 12,080 12,046 12,300
- Wheat 2,710 1,633 1,480 1,800
- Corn 6,483 7,762 8,035 8,000
- Other Grains and Grain Substitute b/ 2,992 2,685 2,531 2,500
Others c/ 6,698 6,758 6,951 6,600
Grand Total 18,883 18,838 18,997 18,900 Source: Korea Feed Association (KFA) a/ FAS Seoul forecast b/ includes Tapioca, bran and gluten feed. c/ includes vegetable protein meal, animal protein, minerals/additives, tallow, DDGS and molasses.
Korea: Compound Feed Production by Species (October/September, 1,000 MT)
Species MY 2012/13 MY 2013/14 MY 2014/15 MY 2015/16a/
Poultry 4,726 5,107 5,551 5,500
Swine 6,100 6,015 6,049 6,200
Cattle 6,572 6,388 5,978 5,800
Others b/ 1,483 1,314 1,388 1,400
Total 18,881 18,824 18,967 18,900 Source: Ministry for Agriculture, Food, and Rural Affairs (MAFRA) a/ FAS/Seoul forecast b/ include ducks, rabbit, horse, sheep, deer, quail etc
Korea: Compound Feed Production Comparison by Species for
the First Two Months (October/November, 1,000 MT)
Species MY 2014/15 MY 2015/16 Change
Poultry 845 933 +10.4
Swine 1,040 1,076 +3.5
Cattle 1,029 985 -4.3
Others 218 242 +11.0
Total 3,133 3,247 +3.6 Source: Ministry for Agriculture, Food, and Rural Affairs (MAFRA)
Korea: Feed Ingredients Use for MY2013-MY2014 (1,000 MT, October/September)

INGREDIENT MY2013/2014 MY2014/2015
TOTAL DOM 1/ % TOTAL DOM
1/ %
GRAINS:
CORN 7,762 - 41.2 8,035 1 42.3
SORGHUM - - - - - 0.0
WHEAT 1,633 - 8.7 1,480 1 7.8
BARLEY 28 2 0.1 28 2 0.1
RYE 0 0 - 0 0 0.0
OATS 3 1 - 3 1 0.0
GSP/BROKEN GRAIN 88 88 0.5 96 96 0.5
TAPIOCA 284 - 1.5 257 0 1.4
LUPIN SEED 131 6 0.7 134 14 0.7
OTHERS 173 167 0.9 173 168 0.9
SUB TOTAL 10,102 264 53.6 10,206 283 53.7
GRAIN BY-PRODUCTS:
WHEAT BRAN 599 393 3.2 562 391 3.0
RICE BRAN 187 187 1.0 193 190 1.0
BARLEY BRAN - - - - - 0.0
CORN BRAN 2 2 - 1 1 0.0
GLUTEN FEED 848 374 4.5 766 366 4.0
OTHERS 342 266 1.8 318 233 1.7
SUB TOTAL 1,978 1,222 10.5 1,840 1,181 9.7
ANIMAL PROTEIN:
FISH MEAL 18 12 0.1 18 12 0.1
MEAT & BONE MEAL 22 21 0.1 24 23 0.1
OTHERS 146 143 0.8 147 145 0.8
SUB TOTAL 186 176 1.0 189 180 1.0
VEGETABLE PROTEIN:
SOYBEAN MEAL 2,079 411 11.0 2,272 560 12.0
RAPESEED MEAL 530 6 2.8 489 1 2.6
SESAMESEED MEAL 23 23 0.1 33 33 0.2
PERILLA SEED MEAL 3 3 - 1 1 0.0
CORN GLUTEN MEAL 81 73 0.4 82 74 0.4
DDGS 536 158 2.8 654 215 3.4
COTTONSEED MEAL 1 0 - 1 0 0.0
PARM KERNEL MEAL 760 8 4.0 686 9 3.6
COPRA MEAL 399 2 2.1 403 0 2.1
OTHERS 262 216 1.4 246 205 1.3
SUB TOTAL 4,674 900 24.8 4,867 1,098 25.6
ADDITIVES/MINERALS:
CALCIUM PHOSPHATE 67 54 0.4 72 57 0.4
LIMESTONE 480 480 2.5 503 503 2.6
SALT 67 67 0.4 67 66 0.4
OTHER 291 289 1.5 276 272 1.5
SUB TOTAL 905 890 4.8 918 898 4.9
OTHER INGREDIENTS:
TALLOW 316 312 1.7 329 319 1.7
MOLASSES 461 383 2.4 426 345 2.2
UREA 2 2 - 2 2 0.0
OTHER 214 192 1.1 220 190 1.2
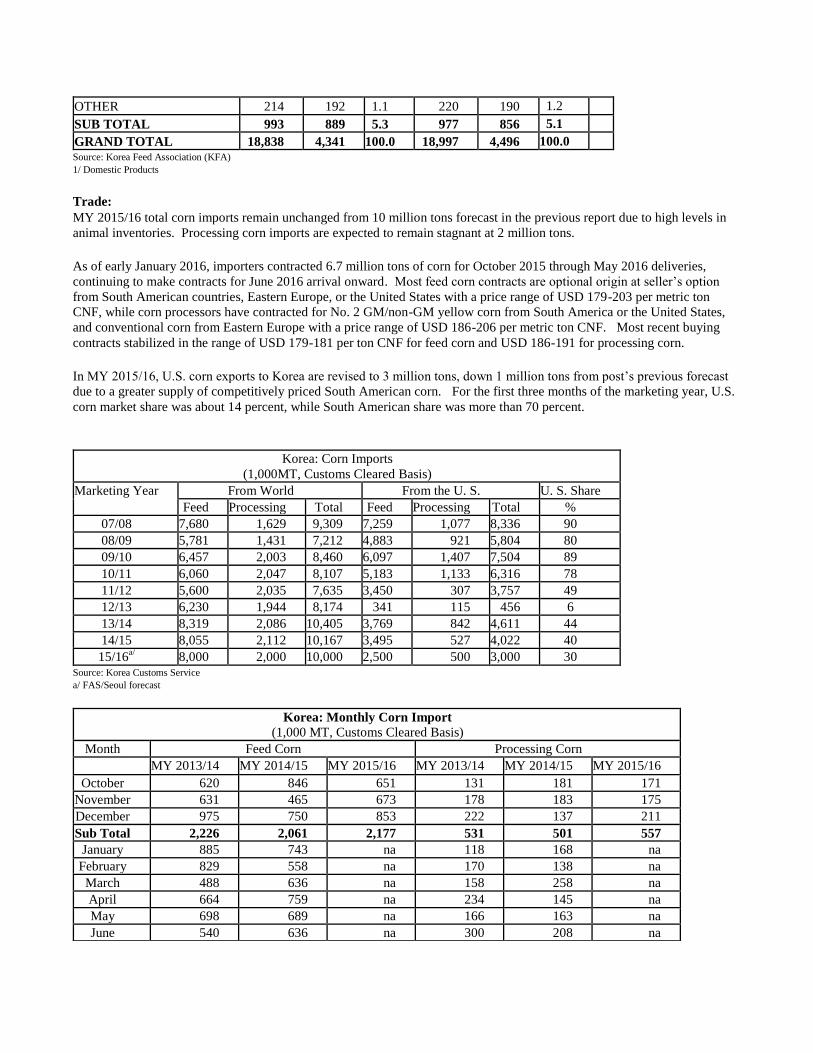
SUB TOTAL 993 889 5.3 977 856 5.1
GRAND TOTAL 18,838 4,341 100.0 18,997 4,496 100.0 Source: Korea Feed Association (KFA) 1/ Domestic Products
Trade: MY 2015/16 total corn imports remain unchanged from 10 million tons forecast in the previous report due to high levels in
animal inventories. Processing corn imports are expected to remain stagnant at 2 million tons.
As of early January 2016, importers contracted 6.7 million tons of corn for October 2015 through May 2016 deliveries,
continuing to make contracts for June 2016 arrival onward. Most feed corn contracts are optional origin at seller’s option
from South American countries, Eastern Europe, or the United States with a price range of USD 179-203 per metric ton
CNF, while corn processors have contracted for No. 2 GM/non-GM yellow corn from South America or the United States,
and conventional corn from Eastern Europe with a price range of USD 186-206 per metric ton CNF. Most recent buying
contracts stabilized in the range of USD 179-181 per ton CNF for feed corn and USD 186-191 for processing corn.
In MY 2015/16, U.S. corn exports to Korea are revised to 3 million tons, down 1 million tons from post’s previous forecast
due to a greater supply of competitively priced South American corn. For the first three months of the marketing year, U.S.
corn market share was about 14 percent, while South American share was more than 70 percent.
Korea: Corn Imports (1,000MT, Customs Cleared Basis)
Marketing Year From World From the U. S. U. S. Share
Feed Processing Total Feed Processing Total %
07/08 7,680 1,629 9,309 7,259 1,077 8,336 90
08/09 5,781 1,431 7,212 4,883 921 5,804 80
09/10 6,457 2,003 8,460 6,097 1,407 7,504 89
10/11 6,060 2,047 8,107 5,183 1,133 6,316 78
11/12 5,600 2,035 7,635 3,450 307 3,757 49
12/13 6,230 1,944 8,174 341 115 456 6
13/14 8,319 2,086 10,405 3,769 842 4,611 44
14/15 8,055 2,112 10,167 3,495 527 4,022 40
15/16a/ 8,000 2,000 10,000 2,500 500 3,000 30
Source: Korea Customs Service a/ FAS/Seoul forecast
Korea: Monthly Corn Import (1,000 MT, Customs Cleared Basis)
Month Feed Corn Processing Corn
MY 2013/14 MY 2014/15 MY 2015/16 MY 2013/14 MY 2014/15 MY 2015/16
October 620 846 651 131 181 171
November 631 465 673 178 183 175
December 975 750 853 222 137 211
Sub Total 2,226 2,061 2,177 531 501 557
January 885 743 na 118 168 na
February 829 558 na 170 138 na
March 488 636 na 158 258 na
April 664 759 na 234 145 na
May 698 689 na 166 163 na
June 540 636 na 300 208 na
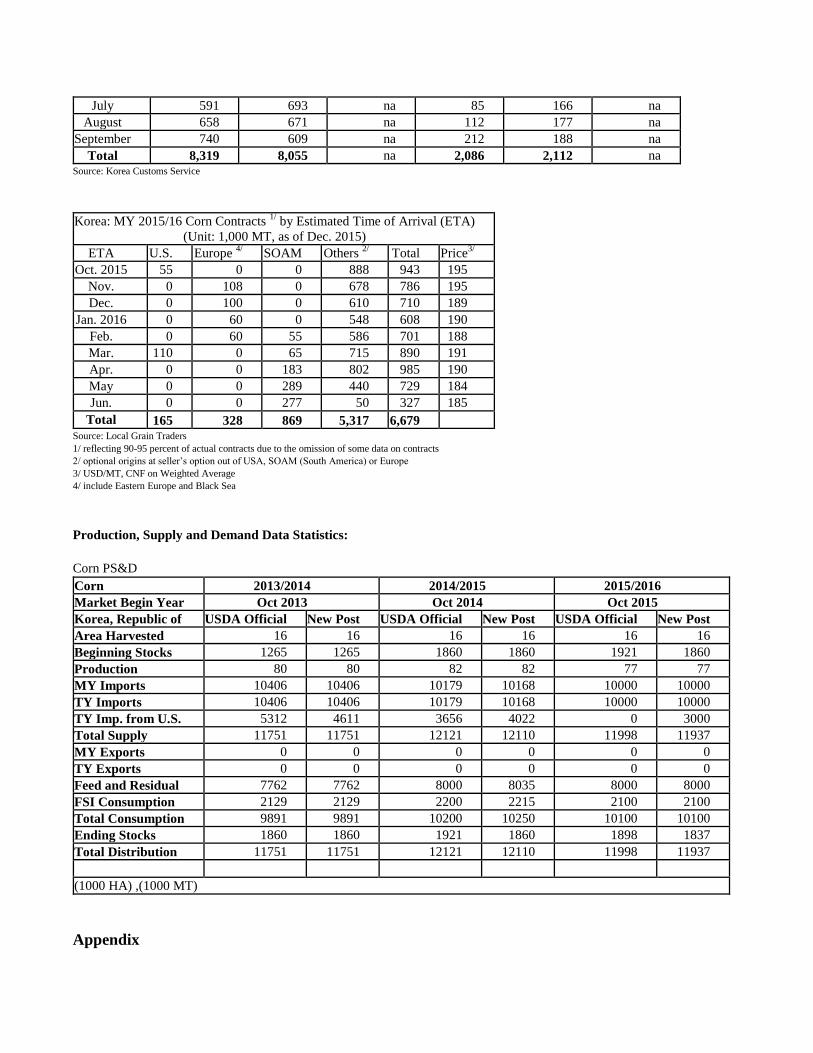
July 591 693 na 85 166 na
August 658 671 na 112 177 na
September 740 609 na 212 188 na
Total 8,319 8,055 na 2,086 2,112 na Source: Korea Customs Service
Korea: MY 2015/16 Corn Contracts 1/
by Estimated Time of Arrival (ETA) (Unit: 1,000 MT, as of Dec. 2015)
ETA U.S. Europe 4/ SOAM Others
2/ Total Price3/
Oct. 2015 55 0 0 888 943 195
Nov. 0 108 0 678 786 195
Dec. 0 100 0 610 710 189
Jan. 2016 0 60 0 548 608 190
Feb. 0 60 55 586 701 188
Mar. 110 0 65 715 890 191
Apr. 0 0 183 802 985 190
May 0 0 289 440 729 184
Jun. 0 0 277 50 327 185
Total 165 328 869 5,317 6,679 Source: Local Grain Traders 1/ reflecting 90-95 percent of actual contracts due to the omission of some data on contracts 2/ optional origins at seller’s option out of USA, SOAM (South America) or Europe 3/ USD/MT, CNF on Weighted Average 4/ include Eastern Europe and Black Sea
Production, Supply and Demand Data Statistics:
Corn PS&D
Corn 2013/2014 2014/2015 2015/2016
Market Begin Year Oct 2013 Oct 2014 Oct 2015
Korea, Republic of USDA Official New Post USDA Official New Post USDA Official New Post
Area Harvested 16 16 16 16 16 16
Beginning Stocks 1265 1265 1860 1860 1921 1860
Production 80 80 82 82 77 77
MY Imports 10406 10406 10179 10168 10000 10000
TY Imports 10406 10406 10179 10168 10000 10000
TY Imp. from U.S. 5312 4611 3656 4022 0 3000
Total Supply 11751 11751 12121 12110 11998 11937
MY Exports 0 0 0 0 0 0
TY Exports 0 0 0 0 0 0
Feed and Residual 7762 7762 8000 8035 8000 8000
FSI Consumption 2129 2129 2200 2215 2100 2100
Total Consumption 9891 9891 10200 10250 10100 10100
Ending Stocks 1860 1860 1921 1860 1898 1837
Total Distribution 11751 11751 12121 12110 11998 11937
(1000 HA) ,(1000 MT)
Appendix

Korea: Animal Inventory
(1,000 Head, 1,000 Birds, as of December 2015)
Animal Year March June September December
Beef Cattle 2012 2,940 3,109 3,143 3,059
2013 2,966 3,064 3,043 2,918
2014 2,811 2,879 2,820 2,759
2015 2,659 2,748 2,753 2,676
2016 2,580c/ na na na
Dairy Cattle 2012 404 410 417 420
2013 420 419 422 424
2014 428 424 429 431
2015 425 418 418 411
2016 415c/ na na na
Swine 2012 8,852 9,432 9,937 9,916
2013 10,107 10,181 10,188 9,912
2014 9,698 9,680 9,966 10,090
2015 9,971 10,018 10,332 10,187
2016 10,100c/ 10,300c/ na na
Layer a/ 2010 62,524 61,586 60,095 61,700
2011 61,025 60,723 61,212 62,425
2012 63,200 61,953 61,326 61,344
2013 62,340 60,610 62,674 64,824
2014 64,572 62,851 65,263 67,674
2015 68,878 67,907 72,090 71,877
Broiler b/ 2010 72,692 101,690 71,271 77,871
2011 69,932 110,122 71,038 76,435
2012 69,387 97,750 68,540 76,130
2013 71,938 95,898 64,505 76,487
2014 77,879 103,593 75,846 77,746
2015 82,749 110,489 81,184 81,851 Source: Korea Statistics (KOSTAT) and Korea Rural Economic Institute (KREI) a/ Excluding breeders. b/ Excluding multi-use broilers c/ KREI forecast
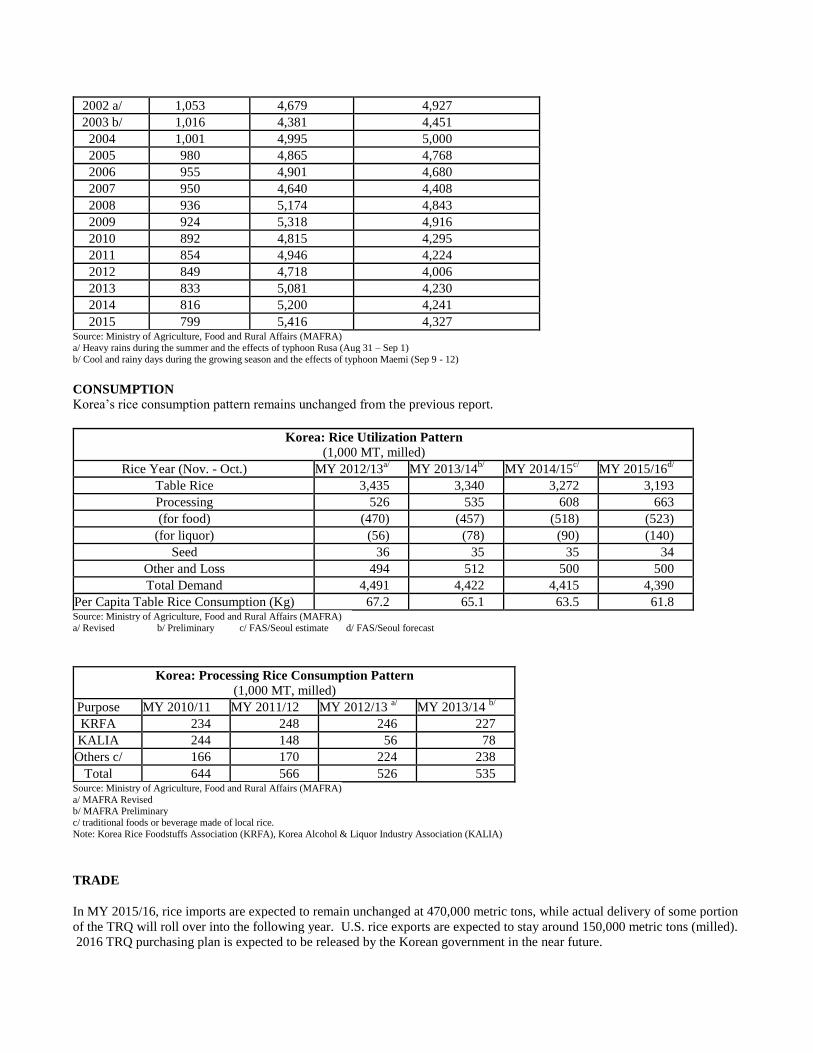
RICE PRODUCTION Higher than normal average yield for the past few years led the Korean government to seek a balance between rice supply
and demand by 2018 through a gradual reduction in area and promotional activities to expand consumption.
The Ministry of Agriculture, Food and Rural Affairs (MAFRA) recently released its plan to reduce arable land for rice
cultivation to 711,000 hectares by 2018, significantly smaller than the 749,000 hectares of paddies that would be reached
without any action taken.
In line with the rice reduction scheme, the government plans to introduce the Production Adjustment Program which will
encourage rice farmers to cultivate other crops in their paddy lands, up to 30,000 hectares across the nation in CY 2017.
Korea: Rice Area, Yield and Production
Crop Year Area (1,00HA) Yield (KG/HA) Production (Milled, 1,000 MT)
2002 a/ 1,053 4,679 4,927
2003 b/ 1,016 4,381 4,451
2004 1,001 4,995 5,000
2005 980 4,865 4,768
2006 955 4,901 4,680
2007 950 4,640 4,408
2008 936 5,174 4,843
2009 924 5,318 4,916
2010 892 4,815 4,295
2011 854 4,946 4,224
2012 849 4,718 4,006
2013 833 5,081 4,230
2014 816 5,200 4,241
2015 799 5,416 4,327 Source: Ministry of Agriculture, Food and Rural Affairs (MAFRA) a/ Heavy rains during the summer and the effects of typhoon Rusa (Aug 31 – Sep 1) b/ Cool and rainy days during the growing season and the effects of typhoon Maemi (Sep 9 - 12) CONSUMPTION Korea’s rice consumption pattern remains unchanged from the previous report.
Korea: Rice Utilization Pattern (1,000 MT, milled)
Rice Year (Nov. - Oct.) MY 2012/13a/ MY 2013/14
b/ MY 2014/15c/ MY 2015/16
d/
Table Rice 3,435 3,340 3,272 3,193
Processing 526 535 608 663
(for food) (470) (457) (518) (523)
(for liquor) (56) (78) (90) (140)
Seed 36 35 35 34
Other and Loss 494 512 500 500
Total Demand 4,491 4,422 4,415 4,390
Per Capita Table Rice Consumption (Kg) 67.2 65.1 63.5 61.8 Source: Ministry of Agriculture, Food and Rural Affairs (MAFRA) a/ Revised b/ Preliminary c/ FAS/Seoul estimate d/ FAS/Seoul forecast
Korea: Processing Rice Consumption Pattern (1,000 MT, milled)
Purpose MY 2010/11 MY 2011/12 MY 2012/13 a/ MY 2013/14
b/
KRFA 234 248 246 227
KALIA 244 148 56 78
Others c/ 166 170 224 238
Total 644 566 526 535 Source: Ministry of Agriculture, Food and Rural Affairs (MAFRA) a/ MAFRA Revised b/ MAFRA Preliminary c/ traditional foods or beverage made of local rice. Note: Korea Rice Foodstuffs Association (KRFA), Korea Alcohol & Liquor Industry Association (KALIA)
TRADE
In MY 2015/16, rice imports are expected to remain unchanged at 470,000 metric tons, while actual delivery of some portion
of the TRQ will roll over into the following year. U.S. rice exports are expected to stay around 150,000 metric tons (milled).
2016 TRQ purchasing plan is expected to be released by the Korean government in the near future.
In MY 2014/15, Korea’s rice imports were 464,892 MT, consisting of 217,855 MT imported under the 2014 MMA quota
and 247,037 MT imported under 2015 TRQ, respectively. In CY 2015, U.S. exports to Korea amounted to 142,806 MT,
which is composed of 34,114MT imported under 2014 MMA quota and 108,682 MT imported under 2015 TRQ,
respectively.
2015 TRQ Tendering Results:
The Korean government submitted a draft containing modifications and rectifications to “Schedule LX - Republic of Korea”
to the WTO on September 30, 2014, which allowed Korea to implement ordinary customs duties on rice beginning January
1, 2015. However, five countries reserved their positions with respect to the proposed rectification and modification of the
Republic of Korea’s tariff schedule concerning rice market access. Korea continues to engage in bilateral discussions with
the concerned countries for settlement of the issue. The United States is working closely with Korea to urge it to ensure that
the new arrangement takes appropriate account of our strong trading relationship in this commodity.
As agreed in the special treatment, Korea continued to import the mandatory import volume of 408,700 metric tons from
Most Favored Nation (MFN) countries at the current duty level of 5 percent under the tariff rate quota (TRQ) regime in 2015
and beyond. Korea deleted provisions about usage purpose, such as the ratio of table rice (30 percent) and guaranteed access
to the domestic market.
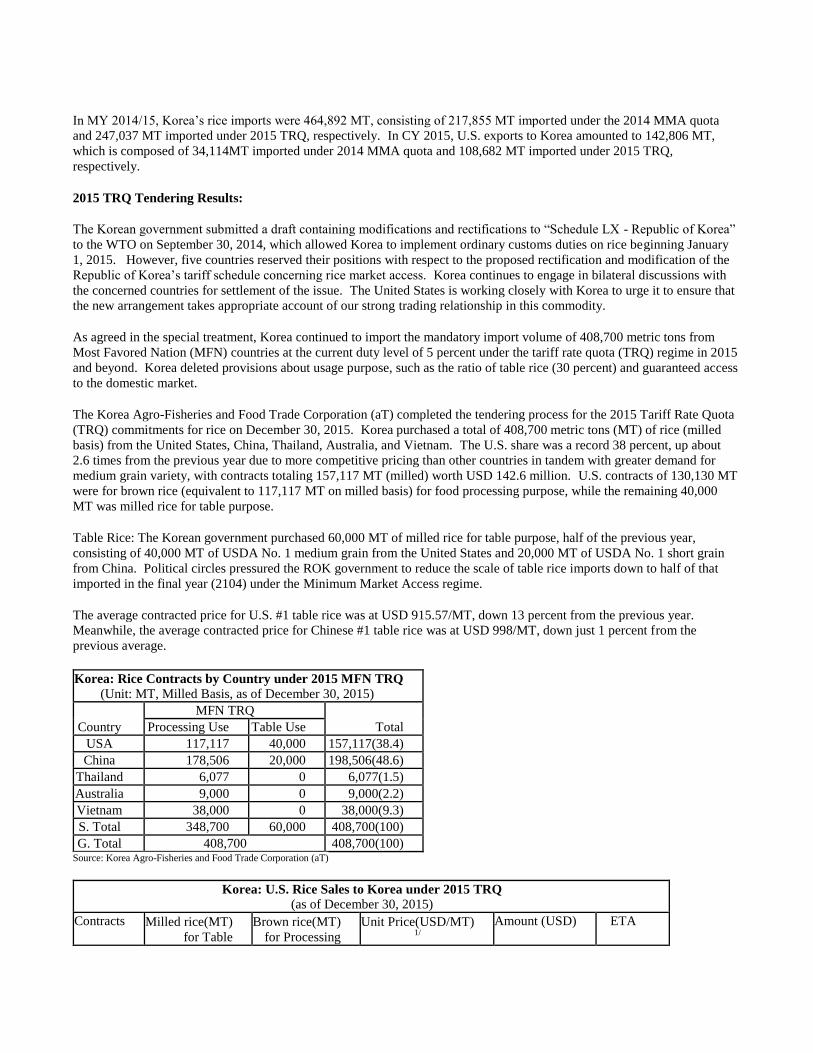
The Korea Agro-Fisheries and Food Trade Corporation (aT) completed the tendering process for the 2015 Tariff Rate Quota
(TRQ) commitments for rice on December 30, 2015. Korea purchased a total of 408,700 metric tons (MT) of rice (milled
basis) from the United States, China, Thailand, Australia, and Vietnam. The U.S. share was a record 38 percent, up about
2.6 times from the previous year due to more competitive pricing than other countries in tandem with greater demand for
medium grain variety, with contracts totaling 157,117 MT (milled) worth USD 142.6 million. U.S. contracts of 130,130 MT
were for brown rice (equivalent to 117,117 MT on milled basis) for food processing purpose, while the remaining 40,000
MT was milled rice for table purpose.
Table Rice: The Korean government purchased 60,000 MT of milled rice for table purpose, half of the previous year,
consisting of 40,000 MT of USDA No. 1 medium grain from the United States and 20,000 MT of USDA No. 1 short grain
from China. Political circles pressured the ROK government to reduce the scale of table rice imports down to half of that
imported in the final year (2104) under the Minimum Market Access regime.
The average contracted price for U.S. #1 table rice was at USD 915.57/MT, down 13 percent from the previous year.
Meanwhile, the average contracted price for Chinese #1 table rice was at USD 998/MT, down just 1 percent from the
previous average.
Korea: Rice Contracts by Country under 2015 MFN TRQ (Unit: MT, Milled Basis, as of December 30, 2015)
Country
MFN TRQ
Total Processing Use Table Use
USA 117,117 40,000 157,117(38.4)
China 178,506 20,000 198,506(48.6)
Thailand 6,077 0 6,077(1.5)
Australia 9,000 0 9,000(2.2)
Vietnam 38,000 0 38,000(9.3)
S. Total 348,700 60,000 408,700(100)
G. Total 408,700 408,700(100) Source: Korea Agro-Fisheries and Food Trade Corporation (aT)
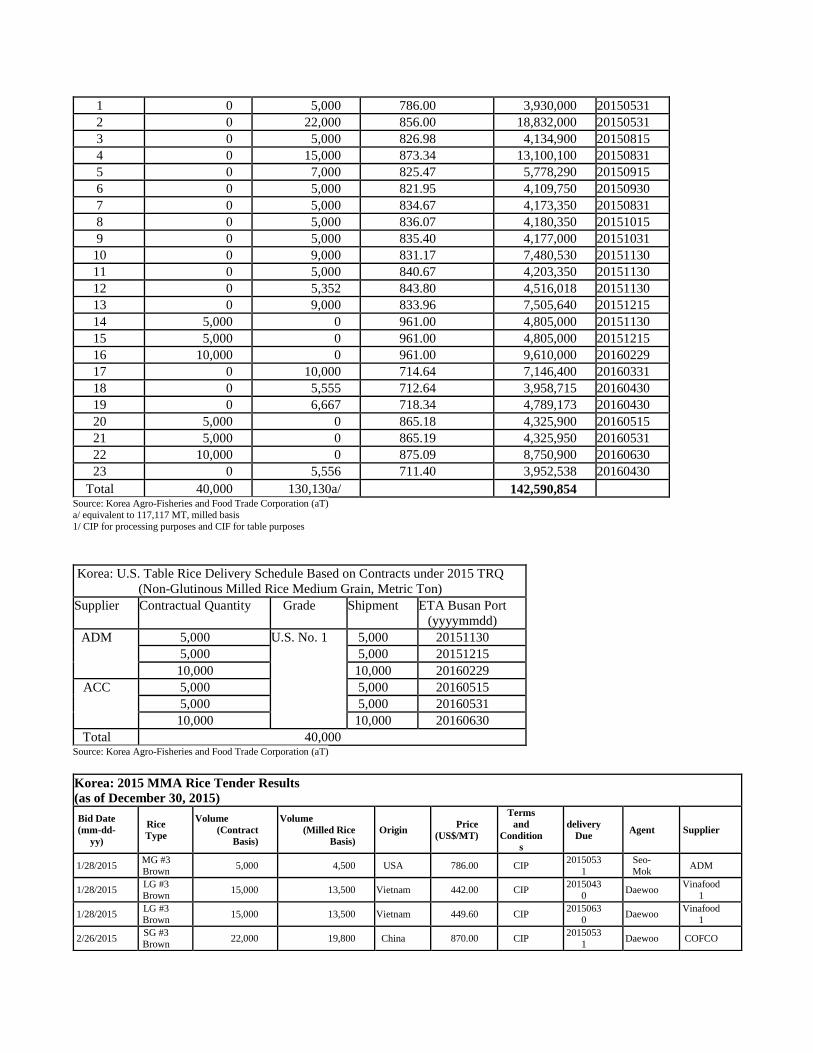
Korea: U.S. Rice Sales to Korea under 2015 TRQ (as of December 30, 2015)
Contracts
Milled rice(MT)
for Table Brown rice(MT)
for Processing Unit Price(USD/MT)
1/
Amount (USD)
ETA
1 0 5,000 786.00 3,930,000 20150531
2 0 22,000 856.00 18,832,000 20150531
3 0 5,000 826.98 4,134,900 20150815
4 0 15,000 873.34 13,100,100 20150831
5 0 7,000 825.47 5,778,290 20150915
6 0 5,000 821.95 4,109,750 20150930
7 0 5,000 834.67 4,173,350 20150831
8 0 5,000 836.07 4,180,350 20151015
9 0 5,000 835.40 4,177,000 20151031
10 0 9,000 831.17 7,480,530 20151130
11 0 5,000 840.67 4,203,350 20151130
12 0 5,352 843.80 4,516,018 20151130
13 0 9,000 833.96 7,505,640 20151215
14 5,000 0 961.00 4,805,000 20151130
15 5,000 0 961.00 4,805,000 20151215
16 10,000 0 961.00 9,610,000 20160229
17 0 10,000 714.64 7,146,400 20160331
18 0 5,555 712.64 3,958,715 20160430
19 0 6,667 718.34 4,789,173 20160430
20 5,000 0 865.18 4,325,900 20160515
21 5,000 0 865.19 4,325,950 20160531
22 10,000 0 875.09 8,750,900 20160630
23 0 5,556 711.40 3,952,538 20160430
Total 40,000 130,130a/ 142,590,854 Source: Korea Agro-Fisheries and Food Trade Corporation (aT) a/ equivalent to 117,117 MT, milled basis 1/ CIP for processing purposes and CIF for table purposes
Korea: U.S. Table Rice Delivery Schedule Based on Contracts under 2015 TRQ
(Non-Glutinous Milled Rice Medium Grain, Metric Ton)
Supplier Contractual Quantity Grade Shipment ETA Busan Port (yyyymmdd)
ADM 5,000 U.S. No. 1 5,000 20151130
5,000 5,000 20151215
10,000 10,000 20160229
ACC 5,000 5,000 20160515
5,000 5,000 20160531
10,000 10,000 20160630
Total 40,000 Source: Korea Agro-Fisheries and Food Trade Corporation (aT)
Korea: 2015 MMA Rice Tender Results (as of December 30, 2015)
Bid Date
(mm-dd-
yy)
Rice
Type
Volume
(Contract
Basis)
Volume
(Milled Rice
Basis) Origin Price
(US$/MT)
Terms
and
Condition
s
delivery
Due Agent Supplier
1/28/2015 MG #3
Brown 5,000 4,500 USA 786.00 CIP 2015053
1 Seo-
Mok ADM
1/28/2015 LG #3
Brown 15,000 13,500 Vietnam 442.00 CIP 2015043
0 Daewoo Vinafood
1
1/28/2015 LG #3
Brown 15,000 13,500 Vietnam 449.60 CIP 2015063
0 Daewoo Vinafood
1
2/26/2015 SG #3
Brown 22,000 19,800 China 870.00 CIP 2015053
1 Daewoo COFCO

2/26/2015 MG #3 Brown 22,000 19,800 USA 856.00 CIP 2015053
1 Seo-Mok ADM
3/24/2015 SG #3
Brown 12,000 10,800 China 879.85 CIP 2015063
0 Singson
g Jilin
Grain
3/24/2015 SG #3
Brown 10,000 9,000 China 879.95 CIP 2015063
0 Singson
g Jilin
Grain
3/24/2015 SG #3
Brown 11,897 10,707 China 890.00 CIP 2015093
0 Daewoo COFCO
4/21/2015 SG #3
Brown 20,000 18,000 China 893.50 CIP 2015081
5 Daewoo COFCO
4/21/2015 SG #3
Brown 10,000 9,000 China 890.00 CIP 2015083
1 Singson
g Jilin
Grain
4/21/2015 SG #3
Brown 10,000 9,000 China 890.00 CIP 2015091
5 Singson
g Jilin
Grain
4/21/2015 SG #3
Brown 10,000 9,000 Australi
a 872.90 CIP 2015091
5 D&B Sun Rice
4/21/2015 SG #3
Brown 5,000 4,500 USA 826.98 CIP 2015081
5 Singson
g ACC
4/21/2015 MG #3
Brown 5,000 4,500 USA 834.67 CIP 2015083
1 Seo-
Mok ADM
4/21/2015 MG #3
Brown 15,000 13,500 USA 873.34 CIP 2015083
1 Seo-
Mok ADM
4/21/2015 MG #3
Brown 7,000 6,300 USA 825.47 CIP 2015091
5 Singson
g ACC
4/21/2015 MG #3
Brown 5,000 4,500 USA 821.95 CIP 2015093
0 Singson
g ACC
5/21/2015 SG #3 Brown 10,000 9,000 China 860.00 CIP 2015101
5 Singson
g Jilin
Grain
5/21/2015 SG #3 Brown 17,026 15,323 China 890.00 CIP 2015103
1 Daewoo COFCO
5/21/2015 MG #3
Brown 5,000 4,500 USA 836.07 CIP 2015101
5 Singson
g ACC
5/21/2015 MG #3
Brown 5,000 4,500 USA 835.40 CIP 2015103
1 Singson
g ACC
5/21/2015 MG #3
Brown 9,000 8,100 USA 831.17 CIP 2015113
0 Singson
g ACC
7/3/2015 SG #3
Brown 15,000 13,500 China 893.00 CIP 2015113
0 Daewoo COFCO
7/3/2015 MG #3
Brown 18,000 16,200 China 849.00 CIP 2015103
1 Daewoo COFCO
7/3/2015 MG #3
Brown 5,000 4,500 USA 840.67 CIP 2015113
0 Seo-
Mok ADM
7/3/2015 MG #3
Brown 5,352 4,817 USA 843.80 CIP 2015113
0 D&B Sun Rice
7/3/2015 MG #3
Brown 9,000 8,100 USA 833.96 CIP 2015121
5 Daewoo FRC
7/3/2015 LG #3
Brown 6,752 6,077 Thailand 438.34 CIP 2015103
1 Hyolim Chiameng
7/31/2015 SG #1
Milled 10,000 10,000 China 998.78 CIF 2016013
1 Daewoo COFCO
7/31/2015 MG #1
Milled 5,000 5,000 USA 961.00 CIF 2015113
0 Seo-
Mok ADM
7/31/2015 MG #1
Milled 5,000 5,000 USA 961.00 CIF 2015121
5 Seo-
Mok ADM
7/31/2015 MG #1 Milled 10,000 10,000 USA 961.00 CIF 2016022
9 Seo-Mok ADM
7/31/2015 #4
Brewer'
s Milled 11,000 11,000 Vietnam 384.40 CIP 2015113
0 Daewoo Vinafood1
12/9/2015 SG #3 Brown 10,000 9,000 China
888.00 CIP 20160430 Daewoo COFCO
12/9/2015 SG #3 Brown 12,000 10,800 China
889.9
8 CIP 2016043
0 Singson
g Jilin
Grain
12/9/2015 SG #3 Brown 11,333 10,200 China
890.00 CIP 20160430 Daewoo COFCO
12/9/2015 MG #3 Brown 10,000 9,000 USA
714.64 CIP 20160331 Philasun ADM
12/9/2015 MG #3
Brown 5,555 5,000 USA
712.64 CIP 2016043
0 Philasun ADM

12/9/2015 MG #3 Brown 6,667 6,000 USA
718.34 CIP 20160430 Philasun ADM
12/30/201
5 SG #1
Milled 10,000 10,000 China
998.00 CIF 2016063
0 Singson
g Jilin
Grain 12/30/201
5 MG #1
Milled 5,000 5,000 USA
865.18 CIF 2016051
5 Singson
g ACC
12/30/201
5 MG #1
Milled 5,000 5,000 USA
865.19 CIF 2016053
1 Singson
g ACC
12/30/201
5 MG #1
Milled 10,000 10,000 USA
875.09 CIF 2016063
0 Singson
g ACC
12/30/201
5 SG #3
Brown 9,083 8,176 China
890.00 CIP 2016033
1 Daewoo COFCO
12/30/201
5 MG #3
Brown 5,556 5,000 USA
711.40 CIP 2016043
0 Singson
g ACC
Total 446,221 408,700 Source: Korea Agro-Fisheries and Food Trade Corporation (aT) Note: Milling rate for milled rice is applicable at 90 percent of brown rice, and vice versa. LG denotes long grain, SG short grain and MG medium grain, respectively. CIP: Carriage and insurance Paid to—Commodity + Ocean Freight + Insurance + Unloading Charge + Customs Clearance Fee CIF: Cost, Freight and Insurance Auctions for Imported Table Rice: Korea Agro-Fisheries & Food Trade Corporation (aT) sells table rice shipments through a public auction system, while the
Ministry of Agriculture, Food and Rural Affairs (MAFRA) distributes processing rice to end-users such as food processors
and alcoholic beverage producers at a set price throughout the year.
In response to more favorable consumer confidence in U.S. medium grain milled rice, greater demand for U.S. milled rice
made auctions of USDA No. 1 higher than other origins. Ongoing auctions of U.S. medium grain milled rice (USDA No. 1)
account for more than 50 percent while Chinese short grain milled rice are less than 40 percent. The overall progress of
auctioning has been comparably slower than normal in order to prop up domestic rice prices caused by the recent record
harvest of the new crop.
Korea: Status of Rice Auction for Table Rice under 2014 CSQ (Unit: metric tons, milled basis, as of January 10, 2016)
Commodity USDA Grade
Total Table Rice
CSQ Auctioned
Off Balance
Auctioned Off (%)
U.S. Medium Grain #1 40,056 21,501 18,555 54
#3 4,451 4,450 1 100 (as of June 3, 2015)
Chinese Short Grain #1 47,965 18,164 29,801 38
#3 21,433 173 21,260 1
Australian Medium
Grain #1 2,697 0 2,697 0
#3 2,698 0 2,698 0
Thai Long Grain #1 3,220 1,323 1,897 41
Thai Jasmine Rice #1 90 90
0 100 ( as of Aug. 26,
2015)
Total 122,610 45,701 76,909 37 Source: Korea Agro-Fisheries and Food Trade Corporation (aT)
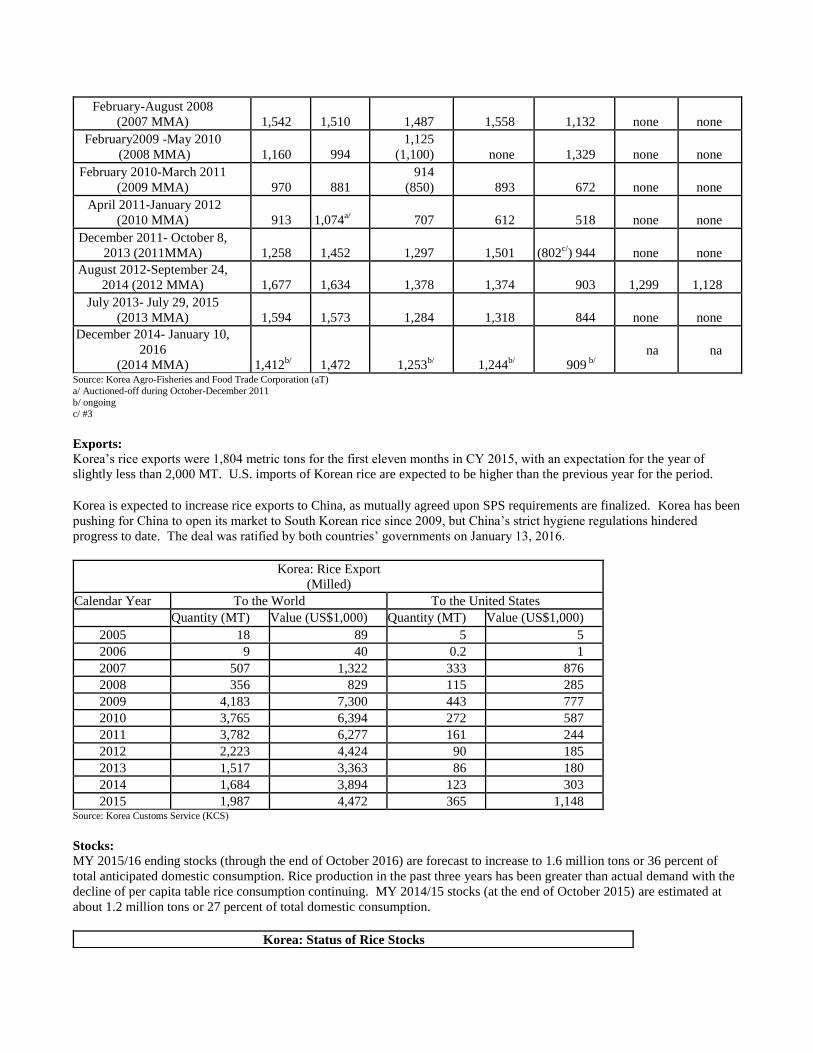
Korea: Auctioned-Off Prices of Imported Table Rice (Unit: Korean Won per Kg on Average)
Auctioning-off Period
U.S. Medium
Grain Chinese Short Grain
(Medium Grain) Thai Long
Grain Australian Medium
Grain
#1 #3 #1 #3 #1 #1 #3
April-September 2006 (2005 MMA) 1,138 991 1,274 1,133 555
none
none
March-August 2007 (2006 MMA) 1,363 1,211 1,357 1,303 953
none
none
February-August 2008 (2007 MMA) 1,542 1,510 1,487 1,558 1,132
none
none
February2009 -May 2010 (2008 MMA) 1,160 994
1,125 (1,100) none 1,329
none
none
February 2010-March 2011 (2009 MMA) 970 881
914 (850) 893 672
none
none
April 2011-January 2012 (2010 MMA) 913 1,074
a/ 707 612 518
none
none
December 2011- October 8,
2013 (2011MMA) 1,258 1,452 1,297 1,501 (802c/) 944
none
none
August 2012-September 24, 2014 (2012 MMA) 1,677 1,634 1,378 1,374 903 1,299 1,128
July 2013- July 29, 2015 (2013 MMA) 1,594 1,573 1,284 1,318 844
none
none
December 2014- January 10,
2016 (2014 MMA) 1,412
b/ 1,472 1,253b/ 1,244
b/ 909 b/
na
na
Source: Korea Agro-Fisheries and Food Trade Corporation (aT) a/ Auctioned-off during October-December 2011 b/ ongoing c/ #3 Exports: Korea’s rice exports were 1,804 metric tons for the first eleven months in CY 2015, with an expectation for the year of
slightly less than 2,000 MT. U.S. imports of Korean rice are expected to be higher than the previous year for the period.
Korea is expected to increase rice exports to China, as mutually agreed upon SPS requirements are finalized. Korea has been
pushing for China to open its market to South Korean rice since 2009, but China’s strict hygiene regulations hindered
progress to date. The deal was ratified by both countries’ governments on January 13, 2016.
Korea: Rice Export (Milled)
Calendar Year To the World To the United States
Quantity (MT) Value (US$1,000) Quantity (MT) Value (US$1,000)
2005 18 89 5 5
2006 9 40 0.2 1
2007 507 1,322 333 876
2008 356 829 115 285
2009 4,183 7,300 443 777
2010 3,765 6,394 272 587
2011 3,782 6,277 161 244
2012 2,223 4,424 90 185
2013 1,517 3,363 86 180
2014 1,684 3,894 123 303
2015 1,987 4,472 365 1,148 Source: Korea Customs Service (KCS) Stocks: MY 2015/16 ending stocks (through the end of October 2016) are forecast to increase to 1.6 million tons or 36 percent of
total anticipated domestic consumption. Rice production in the past three years has been greater than actual demand with the
decline of per capita table rice consumption continuing. MY 2014/15 stocks (at the end of October 2015) are estimated at
about 1.2 million tons or 27 percent of total domestic consumption.
Korea: Status of Rice Stocks

(Milled rice, 1,000 MT, as of end October)
Rice Year (Nov.-Oct.) 2010/11 2011/12 2012/13a/ 2013/14b/ 2014/15c/ 2015/16c/
Total 1,034 730 755 899 1,188 1,591
Government Stock 984 730 755 899 1,188 1,591
-Domestic Rice 696 487 na na na na
-Imported Rice 288 243 na na na na
Civil Stock 50 0 0 0 0 0 Source: FAS/Seoul Estimate based on MAFRA data a/ MAFRA Preliminary b/ FAS/Seoul Preliminary c/ FAS/Seoul forecast
Production, Supply and Demand Data Statistics:
Rice PS&D
Rice, Milled 2013/2014 2014/2015 2015/2016
Market Begin Year Nov 2013 Nov 2014 Nov 2015
Korea, Republic of USDA
Official New
Post USDA
Official New
Post USDA
Official New
Post
Area Harvested 833 833 816 816 799 799
Beginning Stocks 780 780 899 899 1140 1188
Milled Production 4230 4230 4241 4241 4327 4327
Rough Production 5632 5632 5638 5638 5771 5771
Milling Rate (.9999) 7511 7511 7522 7522 7498 7498
MY Imports 313 313 450 465 470 470
TY Imports 379 379 370 372 410 410
TY Imp. from U.S. 38 38 0 143 0 140
Total Supply 5323 5323 5590 5605 5937 5985
MY Exports 2 2 2 2 2 4
TY Exports 2 2 2 2 2 4
Consumption and
Residual 4422 4422 4448 4415 4355 4390
Ending Stocks 899 899 1140 1188 1580 1591
Total Distribution 5323 5323 5590 5605 5937 5985
(1000 HA) ,(1000 MT)
Korea: Import Trade Matrix of Rice
Country Korea, Republic of
Commodity Rice, Milled
Time Period Jan/Dec Units: 1,000MT
Imports for: 2014
2015
U.S. 38 U.S. 143
Others Others China 193 China 168
Thailand 71 Thailand 9
Australia 25 Australia 14
Myanmar 43 Vietnam 38
Vietnam 9
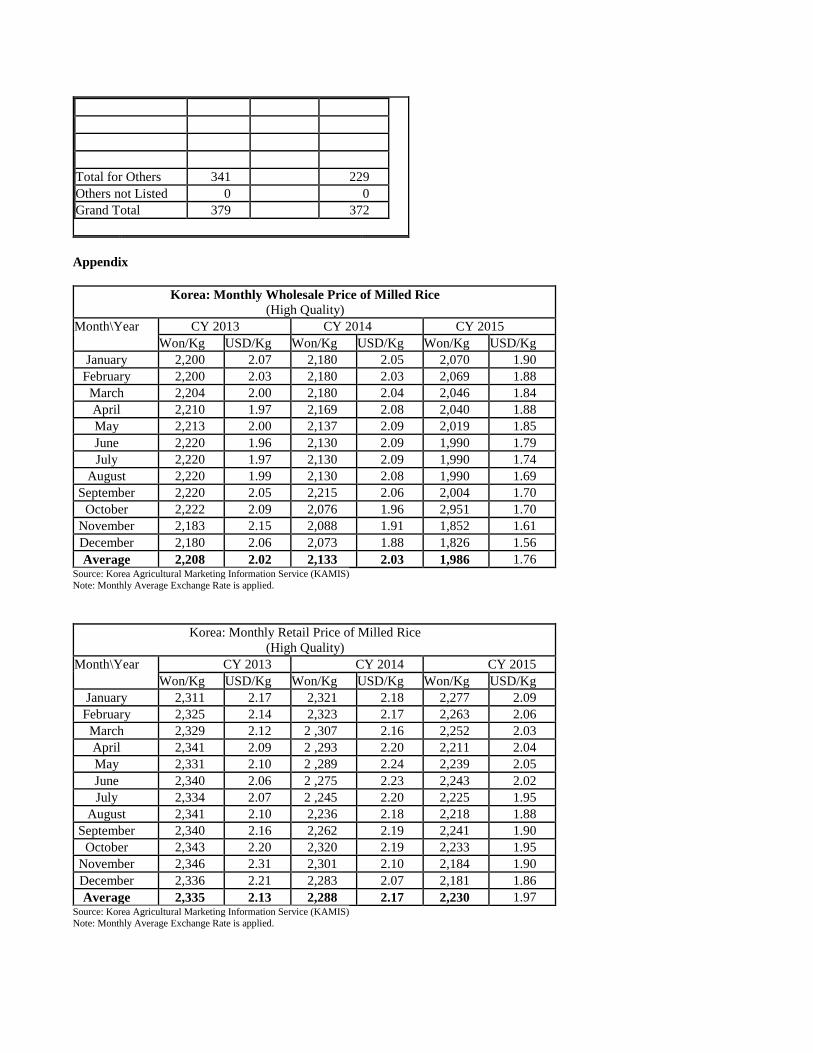
Total for Others 341
229
Others not Listed 0
0
Grand Total 379
372
Appendix
Korea: Monthly Wholesale Price of Milled Rice (High Quality)
Month\Year CY 2013 CY 2014 CY 2015
Won/Kg USD/Kg Won/Kg USD/Kg Won/Kg USD/Kg
January 2,200 2.07 2,180 2.05 2,070 1.90
February 2,200 2.03 2,180 2.03 2,069 1.88
March 2,204 2.00 2,180 2.04 2,046 1.84
April 2,210 1.97 2,169 2.08 2,040 1.88
May 2,213 2.00 2,137 2.09 2,019 1.85
June 2,220 1.96 2,130 2.09 1,990 1.79
July 2,220 1.97 2,130 2.09 1,990 1.74
August 2,220 1.99 2,130 2.08 1,990 1.69
September 2,220 2.05 2,215 2.06 2,004 1.70
October 2,222 2.09 2,076 1.96 2,951 1.70
November 2,183 2.15 2,088 1.91 1,852 1.61
December 2,180 2.06 2,073 1.88 1,826 1.56
Average 2,208 2.02 2,133 2.03 1,986 1.76 Source: Korea Agricultural Marketing Information Service (KAMIS) Note: Monthly Average Exchange Rate is applied.
Korea: Monthly Retail Price of Milled Rice
(High Quality)
Month\Year CY 2013 CY 2014 CY 2015
Won/Kg USD/Kg Won/Kg USD/Kg Won/Kg USD/Kg
January 2,311 2.17 2,321 2.18 2,277 2.09
February 2,325 2.14 2,323 2.17 2,263 2.06
March 2,329 2.12 2 ,307 2.16 2,252 2.03
April 2,341 2.09 2 ,293 2.20 2,211 2.04
May 2,331 2.10 2 ,289 2.24 2,239 2.05
June 2,340 2.06 2 ,275 2.23 2,243 2.02
July 2,334 2.07 2 ,245 2.20 2,225 1.95
August 2,341 2.10 2,236 2.18 2,218 1.88
September 2,340 2.16 2,262 2.19 2,241 1.90
October 2,343 2.20 2,320 2.19 2,233 1.95
November 2,346 2.31 2,301 2.10 2,184 1.90
December 2,336 2.21 2,283 2.07 2,181 1.86
Average 2,335 2.13 2,288 2.17 2,230 1.97 Source: Korea Agricultural Marketing Information Service (KAMIS) Note: Monthly Average Exchange Rate is applied.

Korea: Foreign Exchange Rate (Korean Won against USD)
Month CY 2013 CY 2014 CY 2015
January 1,065 1,065 1,087
February 1,086 1,072 1,099
March 1,102 1,070 1,112
April 1,121 1,044 1,086
May 1,109 1,024 1,091
June 1,135 1,019 1,112
July 1,126 1,020 1,143
August 1,116 1,025 1,177
September 1,084 1,034 1,182
October 1,065 1,059 1,146
November 1,016 1,095 1,151
December 1,056 1,102 1,172
Average 1,094 1,052 1,130 Source: Global Financial Service