![Investigating Global Labor and Pro t Sharesgermangutierrezg.com/Gutierrez_LaborAndProfitShares_2017.pdfin the bargaining power of labor [Blanchard and Giavazzi,2003]. 1 declines are](https://static.fdocuments.in/doc/165x107/6125eaa65958fb656b12e154/investigating-global-labor-and-pro-t-sh-in-the-bargaining-power-of-labor-blanchard.jpg)
This PDF is a selection from an out-of-print volume from ... · Chapter Author: Francesco Giavazzi,...
49
This PDF is a selection from an out-of-print volume from the National Bureau of Economic Research Volume Title: NBER Macroeconomics Annual 1990, Volume 5 Volume Author/Editor: Olivier Jean Blanchard and Stanley Fischer, editors Volume Publisher: MIT Press Volume ISBN: 0-262-02312-1 Volume URL: http://www.nber.org/books/blan90-1 Conference Date: March 9-10, 1990 Publication Date: January 1990 Chapter Title: Can Severe Fiscal Contractions Be Expansionary? Tales of Two Small European Countries Chapter Author: Francesco Giavazzi, Marco Pagano Chapter URL: http://www.nber.org/chapters/c10973 Chapter pages in book: (p. 75 - 122)
Transcript of This PDF is a selection from an out-of-print volume from ... · Chapter Author: Francesco Giavazzi,...

This PDF is a selection from an out-of-print volume from the NationalBureau of Economic Research
Volume Title: NBER Macroeconomics Annual 1990, Volume 5
Volume Author/Editor: Olivier Jean Blanchard and Stanley Fischer, editors
Volume Publisher: MIT Press
Volume ISBN: 0-262-02312-1
Volume URL: http://www.nber.org/books/blan90-1
Conference Date: March 9-10, 1990
Publication Date: January 1990
Chapter Title: Can Severe Fiscal Contractions Be Expansionary? Talesof Two Small European Countries
Chapter Author: Francesco Giavazzi, Marco Pagano
Chapter URL: http://www.nber.org/chapters/c10973
Chapter pages in book: (p. 75 - 122)

Francesco Giavazzi and Marco Pagano UNIVERSITA DI BOLOGNA, CEPR, AND NBER/UNIVERSITA DI NAPOLI AND CEPR
Can Severe Fiscal Contractions Be
Expansionary? Tales of Two Small
European Countries*
1. Budget cuts in Europe: contractionary or expansionary? In most European countries, the high real interest rates of the early 1980s combined with the large stock of public debt inherited from the 1970s to create a potentially explosive debt problem. As governments started to tackle the problem with contractionary fiscal policies, public officials and economists voiced different beliefs about the likely effects of these mea- sures. In Denmark, for example, while the Parliament was discussing a
package of severe budget cuts in January 1983, the Ministry of Finance
anticipated that the fiscal contraction would "dampen private consump- tion," in truly Keynesian fashion:
Curtailing domestic demand will lead to a temporary increase in unemploy- ment . . . and will have a dampening effect on business fixed investment. . . . It is to be expected that the Government's policy will secure a marked reduction in the deficit on the current account of the balance of payments. (Danish Ministry of Finance, 1983)
The German Council of Economic Experts, on the contrary, proposed the view that the impact of budget deficits on demand was predominantly negative (Sachverstandigenrat 1981), so that fiscal retrenchment should
*We wish to thank Olivier Blanchard, Allan Drazen, Alberto Alesina, Vittorio Grilli, Tullio Jappelli, Mervyn King, Luigi Spaventa, Niels Thygesen, and participants to the 1990 NBER Macroeconomics Annual Conference for helpful suggestions and advice. Anders Moller Chris- tensen and Dan Knudsen of Danmarks Nationalbank have provided a wealth of data and illuminating discussions on the Danish economy. Michael Moore of the Central Bank of Ireland has spent long hours discussing with us the Irish experience. We also thank Gianluca Squassi for providing competent and enthusiastic research assistance.

76 * GIAVAZZI & PAGANO
be seen as the premise for an expansion, rather than a recession. In their
retrospective account of the German fiscal consolidation, Fels and Froehlich (1986, pp. 184-85) summarize this anti-Keynesian view:
Fiscal consolidation had a benign impact on expectations . .. [An] important explanation is the way fiscal consolidation was actually brought about. Rather than raising taxes, the deficit was reduced by keeping a lid on expenditure growth . . . By absorbing a smaller share of GNP, the public sector made room
for the private sector to expand.
In a later reappraisal of that experience, Hellwig and Neumann (1987, pp. 137-38) take an eclectic stance, merging the Keynesian and the "Ger- man" views on budget cutting:
According to conventional wisdom, any policy of consolidation is likely to con- tract real aggregate demand in the shorter run. This Keynesian conclusion, however, is misleading as it neglects the role of expectations. A more adequate analysis differentiates between the direct demand effect of cutting the growth of government expenditure and the indirect effect of an induced change in expecta- tions. The direct demand impact of slower public expenditure growth is clearly negative . . . The indirect effect on aggregate demand of the initial reduction in
expenditure growth occurs through an improvement in expectations if the mea- sures taken are understood to be part of a credible medium-run program of consolidation, designed to permanently reduce the share of government in GDP . . . [and thus] taxation in the future.
Only the empirical evidence can clarify which of these two contending views about fiscal policy is more appropriate-or, in Hellwig and Neu- mann's terms, how often the contractionary Keynesian effect of a spend- ing cut prevails on its expansionary expectational effect. The aim of this
paper is precisely to bring new evidence to bear on this issue: we draw on some of the data generated by the European exercise in fiscal recti- tude of the 1980s, and focus on its two most extreme cases-Denmark and Ireland.
The European experience is especially rich, not only because the sever-
ity of budget cutting varied widely across countries, but because the relative contributions of taxes and spending to the final outcome were
quite different. Figure 1 shows that some countries were able to imple- ment a very substantial turnaround of the budget over the years 1981 to 1989 (for the United Kingdom, that was an "early starter," the interval is 1979-89). In Ireland, Denmark, Sweden, Belgium, and the United King- dom, the budgetary position of the public sector improved by amounts
Can Severe Fiscal Contractions Be Expansionary? ? 77
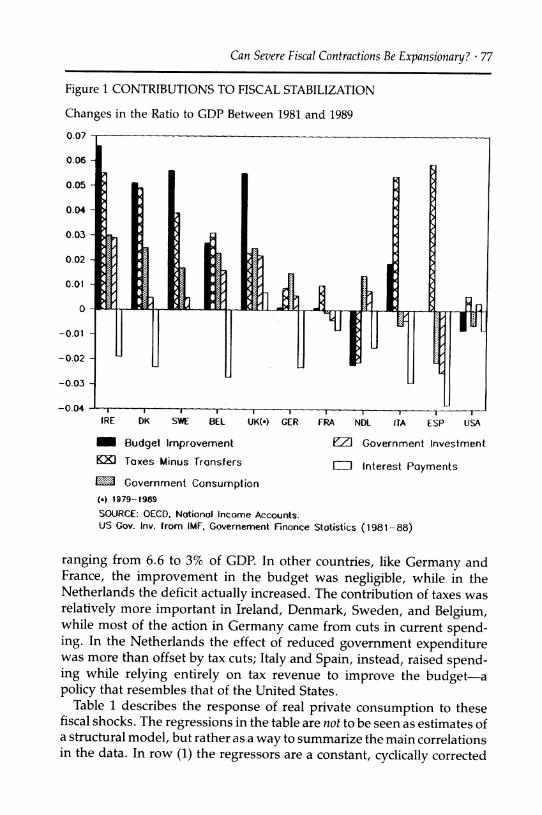
Figure 1 CONTRIBUTIONS TO FISCAL STABILIZATION
Changes in the Ratio to GDP Between 1981 and 1989
IRE DK SWE BEL UK(*) GER FRA NDL ITA ESP USA
_ Budget Improvement EZ1 Governmei
X] Taxes Minus Transfers Cr Interest P
'2l Government Consumption (*) 1979-1989 SOURCE: OECD. Notional Income Accounts. US Gov. Inv. from IMF, Governement Finance Statistics (1981-88)
nt Investment
ayments
ranging from 6.6 to 3% of GDP. In other countries, like Germany and France, the improvement in the budget was negligible, while in the Netherlands the deficit actually increased. The contribution of taxes was relatively more important in Ireland, Denmark, Sweden, and Belgium, while most of the action in Germany came from cuts in current spend- ing. In the Netherlands the effect of reduced government expenditure was more than offset by tax cuts; Italy and Spain, instead, raised spend- ing while relying entirely on tax revenue to improve the budget-a policy that resembles that of the United States.
Table 1 describes the response of real private consumption to these fiscal shocks. The regressions in the table are not to be seen as estimates of a structural model, but rather as a way to summarize the main correlations in the data. In row (1) the regressors are a constant, cyclically corrected
0.07
0.06
0.05
0.04
0.03
0.02
0.01
0
-0.01
-0.02
-0.03
-0.04

78 * GIAVAZZI & PAGANO
Table 1 EFFECTS OF FISCAL CONSOLIDATION ON PRIVATE CONSUMPTIONa (regression on stacked data for 10 countries, 1973-89)
Lagged Durbin's h C/Y* T*/Y* G/Y' M/Y* R2 sign. level
Constrained estimates
(1) .86** -.08* -.23** .93 .3E-6 (2) .81** -.08* -.18* .08** .94 .2E-5
Unconstrained estimates:
(3) .72** .95 .17 Belgium .01 .59 .11 Denmark -.56** -.17 .53** France -.20 -.37 -.42 Germany -.34 -.12 .01 Ireland -.01 -.49** .26** Italy -.41 3.43 .03* Netherl. -.63* -2.00* -.21* Spain .02 -.44* .27** Sweden .25 -.43 .15 U.K. -.48 -1.66* .02
a All regressions use 170 observations. In each regression the dependent variable is real private con- sumption C as a share of potential output Y* (obtained by fitting an exponential trend on 1973-89 real GDP). T* are cyclically corrected taxes net of transfers and subsidies, G is public consumption. In regressions (2) and (3) the regressors include also real money (M2) as a share of potential output, (MIP)I Y*: in (2) its coefficient is constrained to be the same for all countries; in (3) it is left unconstrained across countries. In addition, each regression includes a constant, a proxy for the international cycle (devia- tions of OECD growth from trend) and country dummies on these two regressors. The corresponding estimates are not reported to save space. One (two) asterisk(s) indicates that the regressor is signifi- cantly different from zero at the 10% (5%) level. Data sources: OECD National Income Accounts, except for T*, which was provided by the EC.
taxes net of transfers and subsidies,1 government consumption, and a
proxy for the international cycle; in regressions (2) and (3) real money balances are also added to the list of regressors. All variables (except for the international cycle proxy) are measured relative to potential GDP.
Taxes appear to correlate negatively with private consumption: in re-
gressions (1) and (2), where the coefficients on the policy variables are constrained to be the same across countries, the coefficient on taxes is
negative and significant; and it is generally negative (though often impre- cisely estimated) also in regression (3), where it is left unconstrained across countries. Real money balances are positively correlated with private consumption and are often significant.
1. The cyclical correction of net taxes is intended to eliminate most of the endogeneity of taxes. Figures for cyclically corrected taxes were provided by the EC; their construction is described in European Economy, 1984, no. 22, (chapter 6).

Can Severe Fiscal Contractions Be Expansionary? * 79
So far, the data are consistent with the predictions of a Keynesian textbook. Increases in government spending, however, display a nega- tive relationship with consumption. This result hides considerable cross-
country variation; the unconstrained estimates in regression (3), show that this negative correlation is strong and significant in some of the countries where, according to Figure 1, there were sharp cuts in public spending-Ireland, the United Kingdom, and the Netherlands. In no
country is the coefficient of public spending positive and significant. Figure 2 provides an alternative way to describe the relationship be-
tween spending cuts and private domestic demand. The figure plots yearly changes in the sum of private consumption and investment
against changes in public spending, both measured relative to potential GDP. Data referring to the early and late 1980s are displayed separately,
Figure 2 PRIVATE DEMAND AND PUBLIC CONSUMPTION
Changes Relative to Potential Output
n3
ra 1
O C.)
1.4
<a b) -2
IR2 C 52
D2 S2
UK1 0 A f
N20 1K 9 G 2
81 O, S1 N1
D El
IR
-1.20 -0.80 -0.40 0.00 0.40
Average Change in Public Consumption
0.80 1.20
A: Austria (1980-84, 1987-89) B: Bolgium (1980-84, 1985-89) 0: Weet Germany (1980-83, 1987-89) OK: Oenmark (1983-84) E: Spain (1980-84, 1985-89) F: Fronce (1980-84, 1985-89) G; Greece (1980-84, 1985-89) r: toaly (1980-84, 1985-89)
SOURCE: OECO, Notional Income Account
lM: Ireland (1981-84, 1987-89) N: Netherlands (1980-84, 1985-89) NO: Norway (1980-83, 1984-89) S: Sweden (1980-83, 1986-89) J: Japan (1980-84, 1985-S9) UK: United Kingdom (1980-83, 1985-89) US; United Stotes (1980-83, 984-89)
-4
46
x

80 * GIAVAZZI & PAGANO
since in many countries the two subperiods have coincided with two distinct waves of spending cuts. Dates vary somewhat across countries to capture the years when fiscal action was more evident. Figure 2 shows that the recession of the early 1980s was equally severe in countries that cut public spending and those that did not. The only exception is Den- mark, where the ratio of public spending to potential output fell dramati-
cally in 1983-84, but private domestic demand grew vigorously. Instead, in the recovery of the late 1980s, there seems to be a negative relation- ship between private domestic demand and public consumption: all the observations for this subperiod lie in the second and fourth quadrants of the figure (with the only exceptions of Spain and the United States). Among these, Ireland stands out as the most prominent example of an
expansionary cut in public spending. This negative correlation between private and public spending can
hardly be credited to an endogenous response of public spending to the
cyclical behavior of income; our spending variable is defined as pur- chases of goods and services by the public sector, and does not include such cyclical components as transfers and subsidies. In addition, most accounts of the spending cuts that have occurred in Europe in the 1980s point to an exogenous shift in policy, often associated with a change in
government, rather than to an endogenous response of policymakers to an improved economic performance.
This suggests that the "German view" of negative fiscal multipliers cannot be easily dismissed-at least for the countries where spending cuts were sharpest. According to this view, however, what should make a difference is not only the magnitude of current spending cuts, but their expected persistence; only reductions in spending that are expected to persist can yield permanently lower taxes (Barro 1979, 1981, Feldstein 1982). To assess the expected persistence of spending cuts, we have fitted rolling univariate ARIMA processes to real government consump- tion series of Denmark, Ireland, and Germany; the forecasts have been used to compute the present discounted value (PDV) of predicted public consumption, that provides a measure of "permanent spending."2 The results are reported in Figure 3. For all three countries the spending cuts
2. The ARIMA processes were selected on the basis of a standard Box-Jenkins identifica- tion search. After analysing the correlation and partial autocorrelation functions of the series, we discriminated among the models on the basis of the adjusted R2, of the Q- statistics for the first ten lags of the residuals, and of in-sample predictive efficiency. This search was repeated for each year, after adding the corresponding observation. We have then used each estimated process to generate dynamic forecasts of public consumption for 150 steps (years) ahead at each date, and then computed the PDV of this flow using a 5% discount rate. A similar procedure is followed in Ahmed (1987). See also Seater and Mariano (1985).

Can Severe Fiscal Contractions Be Expansionary? ? 81
Figure 3 PDV OF PREDICTED PUBLIC SPENDING
1.6
1.5
1.4
1.3
1.2
1.1
1
0.9
0.8
0.7
0.6
0.5
0.4
0.3
CONSTANT PRICES, 1979 = 1
1979 1980 1981 1982 1983 1984 1985 1986 1987 1988 1989
- ....... Denmork
Ireland ............ Germ ny
SOURCE: OECD, Notionol Income Accounts
of the 1980s are associated with lower permanent spending. The drop is more sudden in Germany and in Denmark, where it is concentrated in 1981 and in 1982-84 respectively; it is rnore gradual in Ireland, where it spreads almost over the entire decade.
This evidence consistently points to the experiences of Denmark and Ireland as the two most striking cases of "expansionary stabilizations" in
Europe. In Denmark, the fiscal turnaround of 1982 was accompanied by an unusually strong expansion in the subsequent four years. In Ireland a similar outcome occurred during the 1987 to 1989 stabilization, although a previous attempt in the early 1980s had plunged the economy in a severe recession.
Denmark and Ireland, thus, offer a good testing ground to sort out the issues. Why does the experience of Denmark so sharply contradict the Keynesian prediction about the effects of a fiscal contradiction? What accounts for the early failure and later success of the Irish stabilization?

82 * GIAVAZZI & PAGANO
The challenge posed by these experiences goes beyond the interpreta- tion of "what really happened" in each of these countries. It offers an
opportunity to identify the conditions under which severe fiscal contrac- tions can be expansionary. This opportunity is all the more valuable because, in spite of all the discussion about the German view of fiscal
policy, so far, to our knowledge, no evidence has been brought to bear on its empirical relevance.
We begin, in Section 2, by reviewing the key facts about the Danish and Irish experiments, highlighting the importance of the monetary and
exchange rate policies that accompanied the fiscal stabilization. Next, in Section 3, we discuss how the surge of private consumption can be related to these policy shocks. We attack this problem in two steps. In the first step, we investigate to what extent the increase in consumption can be explained by the direct effects of policy shifts, acting via changes in current taxes, spending, and asset prices. The three channels we exam- ine are: (1) the fall in disposable income due to the increase in current taxes; (2) the wealth effect due to the fall in nominal and real interest rates; (3) the reduced provision of public services to consumers. In the second step we consider if the portion of the surge in consumption left
unexplained by the change in current variables can be attributed to
changes in expectations about future fiscal policy, along the lines of the German view. Finally, in Section 4, we discuss to what extent the extraor-
dinary performance of private investment in Denmark can be related to the stabilization package.
2. Tales of two expansionary contractions The similarity among the stabilization policies adopted by Denmark and Ireland in the 1980s does not reside only in the sheer magnitude of the fiscal turnaround. In both cases, cuts in spending and tax increases were
accompanied by a shift in the balance of political power, and by comple- mentary monetary and exchange rate policies; after an initial devaluation, both countries pegged their currencies to the German mark, inducing a
sharp monetary disinflation, and liberalized capital flows. Each of these complementary policy moves had an important role in
determining the final outcome of the stabilization; the effects of the fiscal turnaround cannot be understood if they are not placed against the
backdrop of the accompanying monetary and exchange rate policies. In the 1970s, these countries had experienced not only large budget deficits but high rates of inflation and currency depreciation. In the stabiliza- tions of the 1980s, monetary tightening was invariably the first step of the plan: Central Banks moved first, while political parties were still

Can Severe Fiscal Contractions Be Expansionary? ? 83
wrangling to gather enough social consensus to cut spending and raise taxes. The monetary contraction did not take place by reducing money supply growth, as in the United States and Britain in 1979-80, but by using the exchange rate vis-a-vis the German mark as a nominal anchor.
The sudden disinflation led to a deterioration of the financial position of the public sector, through the loss of seigniorage and the increase in the real cost of servicing fixed-rate debt issued when nominal interest rates were high. This heightened the sense of urgency about the need for a fiscal correction. Prompt fiscal action was required also for the success of the monetary stabilization itself, since, for the currency to be success-
fully pegged to the mark, the danger of future monetization of public debt had to be ruled out. A sharp reduction of the deficit could contrib- ute to the long-run credibility of the exchange rate, providing a signal that the government would meet its obligations via tax revenue or spend- ing cuts, and dispense with seigniorage.
2.1 DENMARK
In 1982 Danish public debt was growing rapidly (from 29% of GDP at the
beginning of 1980 to 65% at the end of 1982), fueled by high real interest rates and large primary deficits (3.1% of GDP). The deficit was the result of the government's attempt to boost demand in the middle of the world recession of the early 1980s. Despite the stimulus to aggregate demand, unemployment was 4.2 percentage points higher relative to 1979, and the current account had worsened, bringing external debt from 17.5% to 33% of GDP over the same interval. In October 1982 long-term interest rates reached 22%, while inflation was only 10%; in the presence of such astronomical real interest rates, the public started questioning the sus-
tainability of public debt, while S&P added a "credit watch" to the AAA
rating of Danish foreign debt. At that time, a Conservative coalition formed a new government, and
adopted a draconian program of fiscal retrenchment. Within four years, the turnaround in the full-employment primary budget was as large as 10% of GDP, of which 2.8% was accounted for by a fall in government consumption, 0.4% by cuts in government investment, and the rest by discretionary increases in taxes net of transfers.'The improvement in the actual primary budget was an even more dramatic 15.4%. As a result, the debt-GDP ratio started declining.
In the monetary area, the fiscal package was accompanied by the announcement that the exchange rate of the Danish kroner versus the German mark would henceforth be fixed. The credibility of the commit- ment to a fixed parity was enhanced by the gains of competitiveness that Denmark had attained since the inception of the EMS through a se-

84 * GIAVAZZI & PAGANO
quence of devaluations. The new government strengthened the credibil- ity of its announcement with two signals. A few months after coming to office (in March 1983) there was a general EMS realignment; for the first time since joining the system, the Danish authorities refrained from devaluing the kroner, and thus effectively abandoned the "weak curren- cies camp" (see Christensen 1986 and Andersen and Risager 1987). At the same time, they removed exchange controls; restrictions on capital inflows were abolished immediately, and controls on outflows were phased out over the subsequent two years (Thygesen 1985).
The term structure of Danish interest rates around the announcement of the stabilization, shown in Figure 4, offers some evidence on the credibility of the new policy. When the government passed the test of the March 1983 realignment, the long-term interest rate fell sharply-by 5.5% in two months. (The gap with German rates, however, did not actually close; as late as 1986, the differential was still 4.6%.)
As mentioned in Section 1, rather than reducing aggregate demand and income, the severe Danish contraction was accompanied by an aver- age growth of 3.6% in real GDP over the years from 1983 to 1986. Growth was driven by domestic demand; private consumption increased rapidly
Figure 4 DENMARK: THE TERM STRUCTURE 1982-83
22
21
20
19
18
17
16
15
14
13
12
11
10
9
8 7
6
5
0
- ",,, Oct 82
Mar 8383
vern 3 months 2 years 5 yeors 10 years 20 yeors 30 years
SOURCE: Danmorks Nationalbonk, Monetory Review

Can Severe Fiscal Contractions Be Expansionary? ? 85
in spite of the reduction of disposable income due to higher taxes, and investment boomed spectacularly (see Table 2).
In the econometric model of the Danish Central Bank, the increase in consumption appears to be remarkably well tracked by its correlation with wealth (Christensen 1988). In fact, as shown by Figure 5, consump-
Table 2 KEY STATISTICS ON THE DANISH AND IRISH STABILIZATIONSa (percentage values per year)
Denmark Ireland
1979-82 1983-86 1979-81 1982-84 1987-89
Government
Average growth rate of:
Public consumption Public investment
Average change in full-empl. net taxes as % of GDP
Average change in full-empl. deficit as % of GDP Public debt as % of GDP
Private sector
Average growth rate of:
Disposable income Consumption Business investment Exports GDP
4.0 0.9 4.0 0.7 -3.7
-9.4 -1.1 6.5 -6.0 -13.3
-.03 1.3 --0.5 4.1 0.4
1.8 -1.8
10.2
2.6 -0.8
-2.9 6.0 1.3
1.3 -1.8 -1.9
0.0 4.0 6.8 -0.8
-0.3 3.7
12.7 3.2 3.6
1.0 2.2
7.2 4.9 2.7
-1.2 -1.2
-4.7 6.7 10.8 11.0 0.0 3.7
Long-term interest rates (period averages) 1979-82
Nominal 19.6 Real (ex ante)b 6.7
1983-86 12.5 3.3
1979-81 15.3 0.5
1982-4 14.5
-0.3
1986-7 11.1 5.2
1988-9 8.9 4.4
a Source: All data are drawn from OECD National Income Accounts, except the cyclically adjusted budget balance, described in footnote 1, and for nominal interest rates, which for Denmark are average yields on long-term government bonds (from European Economy), and for Ireland are yields on five-year government bonds (from the Quarterly Bulletin of the Central Bank of Ireland). b The methodology used to construct ex-ante real rates is described in footnote 2.
3.1 3.6

86 * GIAVAZZI & PAGANO
Figure 5a DENMARK: WEALTH AND PRIVATE CONSUMPTION
170 - .
180 - / 160
150- W
140-
130 -
120-
100
90 1 T 11 I I J i I t 1 1 * I T I I I I T I T II III I II I 1 I f 1i III II I I VT l I rr 73 74 75 76 77 73 79 I0 91 32 U3 64 3 9 137 U
Indices 1972:4. 100
Figure 5b DENMARK: COMPONENTS OF REAL PRIVATE WEALTH
(Billions Kr. of 1971:1) 280 -
280 -
240 -
220 - , 200
180 \
140
120 -
100 -
80-
5 0-
40 0 o imwmt sonde 20 - ?O _,,,,,,,,t,.,zTrL,T..
71 72 73 74 75 76 77 78 79 80 81 82 83 84 85 86 87 88
Source: Danmarks Nationalbank

Can Severe Fiscal Contractions Be Expansionary? ? 87
tion and wealth reacted with striking simultaneity to the announcement of the stabilization plan in the fall of 1982. The increase in the market value of wealth3 was mostly due to the increase in house prices. Figures 6a and 6b suggest that the jump in the value of equity (houses and shares) was related to the sharp fall in real interest rates that occurred in
early 1983, at the time of the EMS realignment.4 As shown in Figure 5b, public debt also played a role in the increase of
households' wealth. As we show in Section 3, there were two reasons for the increase in the market value of debt: the fall in expected inflation raised the real value of the future interest payments on nominal debt, and the fall in the real interest rate decreased the discount rate applying to the real value of those interest payments. This was compounded by the fact that most of the outstanding debt had very long maturities: at the time of the stabilization, Treasury Bills accounted for 15% of the Danish domestic debt; 85% were fixed-rate bonds with maturities rang- ing from 3 to 20 years, mostly issued when nominal rates were high. As shown in Figure 7, the long maturity "froze" the average cost of debt
servicing at relatively high levels, even after its marginal cost-the yield on new issues-had fallen by over 10%.
At the same time asset prices jumped and consumption started to rise, there was a sharp turnaround in "consumer confidence" (Figure 6c).5 The rise in consumer confidence may have resulted partly from the increase in financial and real wealth, and partly from optimism about future income; it is impressive that this wave of consumer optimism occurred at a time when taxes were being dramatically raised, and public services curtailed.
2.2 IRELAND
The first Irish stabilization of the early 1980s provides instead an exam-
ple of the textbook case. In 1981 Irish public finances were in a much worse situation than those of Denmark. As a share of GDP, the primary full-employment budget deficit was 8.4%, debt service absorbed 8.3%, and total national debt was 87%. The current account deficit exceeded 10% of GDP. The first serious attempt at fiscal adjustment began in 1982:
3. The data for total wealth, houses, and government bonds, shown in Figures 5a and 5b, are all at market value and constant prices.
4. We constructed ex ante real rates by deflating nominal rates using the forecast for inflation from a VAR for inflation, short and long nominal interest rates on quarterly data from 1970 to 1988. The VAR used to compute the forecast was reestimated each year. The horizon over which the forecast is taken is synchronized with the maturity of the nominal interest rate.
5. This index is provided by the EC (European Economy, Supplement B). Consumers are asked their views on the "general situation of the economy." A similar picture is ob- tained by employing an index of their views on their own "financial situation."

88 * GIAVAZZI & PAGANO
Figure 6a DENMARK: REAL INTEREST RATE AND REAL SHARE PRICE
14 - .
13 - ' Reol Shore Prices
12 - . . .
t X - . ,..
10 - .i "
4-. .:
3-
1980 191 2 82 3 84 s 87 8a
SMARE PRICE 1980:t * 4
Figure 6b DENMARK: REAL INTEREST RATE AND REAL HOUSE PRICE
1 - ;
14 - Real Mous Price .. ... 15-3 _. /.........-.... .,, .
12 J'"%.. 10 *
9i~ - ......."\ .........
19 - '"
""**-..... "
5 4 '"
R ? at t n f f t~~ ~ ~ ~~~ ~ ~ ~ ~ ~ ~ ~~.-.t ^j
4 Real Interest Rate t*
1 I I [ ! ! f ! f ! F r !I ! ! r f ! I F I I I I I I I I r F
19 80 t11 82 83 84 a! a8 87 6
HOSE PRICC tS: (1972:4)/17 SOURCt: Shor Pnol IMF intrlttnoti FlnorofoW Stotltlos
Houe Perio JAy Dmonw i Niotnol

Can Severe Fiscal Contractions Be Expansionary? ? 89
Figure 6c DENMARK: INDEX OF CONSUMERS' CONFIDENCE
15
-5 -
-10 /
-20
74 75 76 77 78 79 8 0 81t 2 83 84 5 86
SOURCE: Europeon Economy, Supplement B
by 1984 the full-employment primary deficit had been reduced by more than 7 percentage points of GDP, most of it through higher discretion-
ary taxes (5.5 percentage points). At the same time, the monetary au- thorities embarked on a sharp disinflation plan, by pegging the value of the Irish punt within the EMS and, thus, relative to the German mark.
Although this resulted in a drop in both nominal and real interest rates, house and share prices declined, as shown in Figures 8a and
8b-contrary to what was happening in Denmark about the same time. The deflationary impact on domestic demand was tremendous; real
private consumption fell by 7.1% in 1982 and remained almost flat in the following two years. Business investment decreased dramatically from 1982 to 1984, despite the fall in real interest rates. The recession was in no way connected with a slowdown in external demand; as shown in Table 2, in the 1982-84 period Irish exports fared exception- ally well on international markets.
In spite of this early failure, the new government elected in February 1987, and led by Charles Haughey, decided to try again. In contrast with the failed stabilization of 1982, which had been carried out in the context

90 * GIAVAZZI & PAGANO
Figure 7 DENMARK: MARGINAL AND AVERAGE COST OF PUBLIC DEBT
(PERCENTAGE) 22
21
20
19
18
17
16
15
14
13
12
11
10
9 71 72 73 74 75 76 77 78 79 80 81 82 53 84 85 86 87 88
MARGINAL COST: nominal yield on governrment bonds on the market AVERAGE COST: nominal interest poyments divided by the stock of
public debt on the market
SOURCE: Doto provided by the European Commission
of a weak and quarrelsome coalition government, "Mr. Haughey flatly refused to enter deals with anyone, and launched his minority govern- ment on the toughest austerity program the country had witnessed."6 Within two years the full-employment primary deficit was cut by an additional 7% of GDP. Real growth resumed, and for the first time since the early 1970s the debt-income ratio started to decline.
This time, most of the cut in the primary budget came from lower
government consumption and goverment investment, rather than from the increase in discretionary taxes as in 1982 (see Table 2; see also McAleese and McCarthy 1989). Moreover, what increase in tax revenue did take place was obtained by widening the tax base via a fiscal reform
accompanied by a once-and-for-all tax amnesty; in contrast with the
6. Financial Times, Survey on Ireland, September 24, 1987. For an account of the second Irish stabilization see also McAleese (1990). Seidmann (1987) argues that because of the fragmentation of the opposition, the minority government that took office in 1987 was much stronger than the coalition governments of 1982-83.

Can Severe Fiscal Contractions Be Expansionary? * 91
Figure 8a IRELAND: REAL INTEREST RATE AND REAL SHARE PRICE
s
7-.
6-
4 i *- . . T?Reol Shore Price | \
-2 ?~
" ~\ / \) / \ / ~ ~Reol lterest Rote
-3 I I I I T TrI I I I I 1 1 r I T I r I T I I r T T I T
1960 1 11 192 1983 1984 198 t196 1987 198 196
SHARC PmC 1980;1 - 4
Figure 8b IRELAND: REAL INTEREST RATE AND REAL HOUSE PRICE
9 - ,.... . .......................... R ol House Price ............
2-
. /\.~ Reol !nterest Rate
0
-2 -
19e: 1ri 98are Prie IM 19Si s 1Pc b 19Bn 7 1of I
Source: Share Price IMF, International Financial Statistics House Price by Bank of Ireland

92 * GIAVAZZI & PAGANO
Figure 9 REAL EFFECTIVE INTRA-EMS EXCHANGE RATES
1.18
1.16
1.14
1.12
1.1
1.08
1.06
1,04
1.02
1
0.98
0.96
0.94
0.92
0.9
0.88
BASED ON WHOLESALE PRiCES, 1979:1 = 1
1979 1980 1981 1982 1983 1984 1985 1986 1987 1988 1989
Source: Data provided by the Bank of Italy
experience of the early 1980s, marginal tax rates did not increase, and
actually fell slightly.7 Another difference with the 1982 experiment stems from the accompanying exchange rate policy; the 1987 stabilization was
preceded by a sharp devaluation, while the earlier attempt had occurred at a trough of Irish competitiveness. The behavior of the real exchange rate relative to other EMS currencies is illustrated in Figure 9.
The exchange rate policy eased the stabilization, however, not so much via its direct effect on external demand, but via its indirect effect on interest rates and domestic demand. The devaluation stimulated domestic de- mand by enhancing the credibility of the new parity and thus producing a fall in interest rates; nominal and real rates dropped 5 and 3.4 percentage points respectively in the course of 1987 (see Figure 8)-an indication of
"credibility effects in asset markets" (Dornbusch 1989). Export growth, on the contrary, was the same as during stabilization (see Table 2).
7. The marginal tax rate for a typical married employee with two children had been raised from 39.5% in 1980 to 43.5% in 1983; it was reduced to 42.75% in 1988. Similarly, for a typical single employee the marginal tax rate went from 39.5% in 1980 to 68.5% in 1985, and declined to 65.75% in 1988. (Source: OECD Economic Surveys, Ireland 1988/1989, Table A9, p. 97).

Can Severe Fiscal Contractions Be Expansionary? ? 93
3. Is there a consumption puzzle? In Section 2 we documented the importance of the monetary and ex-
change rate policies that accompanied the fiscal stabilizations. By pegging the exchange rate to a low-inflation currency, the authorities induced a
sharp fall in nominal and real interest rates. This is because, once the
exchange rate was credibly fixed, domestic nominal interest rates moved toward the lower level of foreign nominal rates. The convergence of nomi- nal rates occurred faster than the convergence of inflation-as price sticki- ness prevented the goods market from adjusting at the same speed as financial markets, where the response to foreign interest rates had been accelerated by the removal of capital controls. The result was that real rates of interest fell along with nominal rates.8
Households were thus subjected to two simultaneous policy shocks: a cut in current disposable income, due to the increase in current taxes, and a wealth effect, due to the unanticipated fall in nominal and real interest rates. These changes in disposable income and wealth, and their relative importance, appear as the natural explanations for the observed behavior of consumption. The consumption boom that accompanied the Danish and the second Irish stabilizations could have been produced by an increase in wealth large enough to overcome any possible contrac-
tionary effect stemming from the cut in current disposable income. Con-
versely, the drop in private consumption that occurred during the first Irish stabilization could be due the absence of a wealth effect, as the fall in interest rates failed to translate into an increase in asset prices.
If this interpretation were to be supported by the data, there would be no reason to resort to the German view of fiscal policy to account for our episodes of expansionary contractions. Consumption could be satisfacto-
rily explained by the direct effects of the policy package; there would be no
consumption puzzle to be solved by appealing to expectations, namely to the role of current policy shifts as signals of future policies.
3.1. THE DIRECT EFFECTS OF THE STABILIZATION
The fiscal and monetary policies described so far could in principle have affected consumption through four direct channels: (1) the increase in
8. This channel, that relies on price stickiness, is quite different from the reason a fiscal stabilization may be accompanied by a fall in real rates as explained in Drazen and Helpman (1989). In their model, the real rate is driven by the anticipated change in the marginal utility of consumption; if the fiscal stabilization occurs through a cut in public spending, the poststabilization level of private consumption will be higher (because of the implied fall in permanent taxes) and its marginal utility will be lower. In the presence of uncertainty about the exact date of the fiscal stabilization, households will not be able to avoid a jump in their consumption path when the stabilization occurs; accordingly, to forgo consumption prior to the stabilization they will require a higher real rate.

94 * GIAVAZZI & PAGANO
current taxes, (2) the fall in expected inflation, (3) the fall in real interest rates, and (4) the substitution of private consumption for services no
longer supplied by the government.
3.1.1. Taxes and wealth The first three channels are analyzed in the
appendix using the eclectic model of Blanchard (1985), that encompasses both a Ricardian and a non-Ricardian world as special cases. If house- holds have finite horizons, a temporary increase in taxes dampens private consumption; a fiscal consolidation designed to stop the growth of pub- lic debt by raising current taxes is contractionary because, even if the
present value of taxes remains the same, a larger share of it is paid for by the current generation. A fall in expected inflation can work in the opposite direction; if households have finite horizons and public debt consists of
long-term fixed-rate nominal bonds, a fall in expected inflation stimu- lates consumption. This is because the market value of debt goes up, but
only part of this capital gain is paid for by the current generation via
higher taxes.9 Finally, a fall in real interest rates raises wealth and consump- tion whether or not consumers regard public debt as net worth. If debt is considered as net worth and consists of long-term bonds, however, the
positive wealth effect on consumption works also through the capital gain on long-term debt that is not fully offset by a corresponding in- crease in future taxes.
Are these channels sufficient to explain the observed pattern of con-
sumption in Denmark and Ireland? To answer this question, we estimate conventional consumption functions for the two countries and inquire whether, depending on the structure of these relations and the observed
path of disposable income and wealth, we can track consumption during the stabilizations of the 1980s.
In the estimation of consumption functions we follow the specification proposed by Hayashi (1982): households' consumption of nondurables and services is a function of its own lagged value, of lagged after-tax labor earnings, of current and lagged wealth, and (to allow for the possi- bility that some consumers are liquidity-constrained) of current and
lagged disposable income. Public debt is introduced as a separate regres- sor, along with other forms of private wealth, to avoid imposing a restric- tion on the degree of tax discounting. The Appendix shows the deriva-
9. This suggests that debt maturity can have a peculiar effect on the budget in such circumstances. The conventional view of policymakers is that, when the maturity of public debt is long, rapid disinflation makes fiscal stabilization more difficult by raising the real burden of debt service. Thus, the longer the maturity of the debt, the larger the required turnaround in the primary deficit. This point, however, overlooks the fact that the wealth effect associated with the fall in inflation raises private consumption, and thus tax revenue, providing at least a partial offset to the increase in debt service.

Can Severe Fiscal Contractions Be Expansionary? * 95
tion of this consumption function, and the need to estimate it by nonlin- ear instrumental variables to account for the endogeneity of wealth and
disposable income while imposing the nonlinear restrictions implied by the model.
The results reported in Table 3 show that the model's restrictions are
always accepted at conventional significance levels. As far as Denmark is concerned, the magnitude of 0 and the precision of its estimate indicate that the path of wealth (net of public debt), A(t), significantly affects that of private consumption. For Ireland, instead, net wealth is significant only when disposable income is omitted from the regressors.
The coefficient on public debt, /3, is instead very imprecisely estimated for both countries. This casts doubt on the proposition that capital gains on public debt have driven consumption during the 1980s.?1 A warning, however, is in order: Here public debt should be measured at market value, particularly since we know there have been large capital gains on debt. Such a series is available only for Denmark. For Ireland we have no choice but to use data on public debt at book value, so that our estimates for this country should be viewed with some skepticism. Nevertheless, there is another piece of evidence suggesting that in Ireland capital gains on public debt may have no effect on consumption. We know that the
average maturity of Irish public debt is long (see Giavazzi and Pagano 1989), and that both stabilizations were accompanied by a sharp fall in nominal and real interest rates; the market value of Irish public debt must thus have jumped in both stabilizations. But the two fiscal correc- tions had opposite effects on consumption."
The estimates of the coefficient L show that, while in Ireland antici-
pated changes in current disposable income have a substantial effect on
consumption, in Denmark consumption and current disposable income seem completely decoupled. This difference between the two countries is consistent with the dissimilar response of consumption during the Danish and Irish stabilizations: in Denmark wealth effects sheltered con-
sumption from the fall in current disposable income; in Ireland, instead, during the first stabilization consumption took all the brunt of higher
10. Our results for Ireland appear to confirm the finding by Moore (1987) that public debt has no role in the Irish consumption function.
11. The only factor that could restore some credibility to the hypothesis that public debt affects consumption is the fact that Irish households hold directly only a negligible fraction of the outstanding debt; most of it is held in the portfolios of pensions funds, insurance companies, and other institutions, and households cannot easily liquidate their position in pension funds or borrow against their equity in insurance companies. These institutional constraints can dampen the size of wealth effects on consumption; the financial liberalization that has occurred in Ireland in the late 1980s could then go somewhat toward reconciling the different outcomes that the capital gain on public debt may have had in the two stabilizations.

96 * GIAVAZZI & PAGANO
Table 3 CONSUMPTION FUNCTION ESTIMATESa,b
Regression: C(t) = (1+8)C(t-1) + 6{A(t) - (1+8)[A(t-1) + w(t-1)]} + /[D(t) - (1+5)D(t-1)] + at[Y(t) - (1+8)Y(t-1)]
Constraints not rejected
8 1 f3 below:c R2
Denmark (1971-87), yearly data: 1. .050 .025 0.31 .003 75% .845
(1.60) (1.58) (.86) (.09) 2. .050 .025 .032 75% .856
(1.74) (1.64) (.90) 3. .053 .026 .005 75% .856
(1.86) (1.82) (.06) 4. .063 .032 50% .869
(2.27) (2.28)
Ireland (1961-87), yearly data: 5. .084 .035 .792 .191 25% .974
(1.53) (1.49) (.33) (1.42) 6. .108 .056 1.44 50% .966
(2.20) (2.94) (.82) 7. .081 .033 .230 50% .976
(1.49) (1.39) (1.80) 8. .110 .062 75% .966
(2.38) (3.25) a C is consumption of nondurables. For Denmark it is defined as total consumption minus rent, fuel and
power, furniture and household equipment, and personal transport equipment (source: OECD NIA). For Ireland it is total consumption minus clothing and footwear, durable household goods, and trans-
port equipment (source: Central Bank of Ireland, as in Moore 1987). Y is disposable income of the
private sector for Denmark (source: Central Bank of Denmark) and of the household sector for Ireland (source: Central Bank of Ireland). For both countries, A is beginning-of-period wealth, net of public debt D, of social security wealth, and of domestic assets held by foreigners; it includes houses at market
prices and business capital valued at replacement cost. For Denmark, wealth is constructed by subtract-
ing the entire stock of domestically held debt D from private sector wealth (we subtract also public debt held by banks to net out the portion of deposits that has public debt as counterpart on the balance sheet of banks). The variable w is labor income, after-tax for Denmark, and before-tax for Ireland (source: Central Bank of Denmark, and OECD NIA for Ireland). All variables are in real per capita terms (the deflator used is that for nondurables consumption). b The estimation method is NLIV, and the estimates reported in the table are obtained by imposing the nonlinear constraint on the coefficients of the equation. The instruments are a constant, a time trend and one lag of net wealth, disposable income, labor after-tax income, government consumption, govern- ment investment, real money, investment, and terms of trade (defined as the ratio of import prices to the deflator of consumption of nondurables). Source: OECD NIA. c The test refers to the nonlinear constraint on the coefficients of the equation; the test statistic is the quasi-likelihood ratio of Gallant and Jorgenson computed by TSP. The percentage value shown in the table is the significance level below which the constraints are accepted; a higher significance level is a tighter criterion on the null hypothesis, since it corresponds to a lower probability of a type-II error.

Can Severe Fiscal Contractions Be Expansionary? * 97
taxes, while the consumption boom of the late 1980s was helped by the rise in disposable income (see Table 2).
A significant value for the parameter L is evidence of a departure from the permanent income hypothesis that can be interpreted as a symptom of
liquidity constraints or of consumers' myopia. Additional evidence on this point can be obtained by estimating Euler equations for aggregate consumption of nondurables. As shown by Hall (1978) and Hayashi (1982), under suitable assumptions, the proportion of income accruing to
liquidity-constrained households can be measured by the excess sensitiv-
ity parameter in the Euler equation. Estimates of this equation are re-
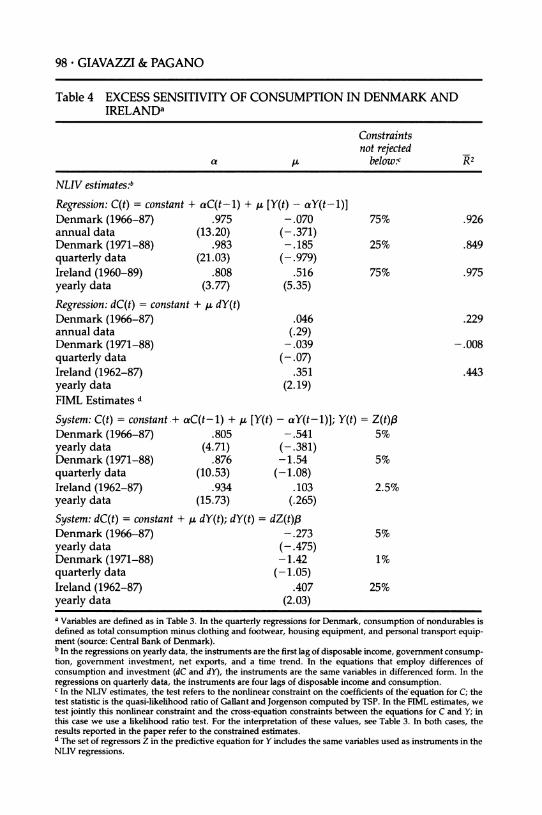
ported in Table 4. To correct for the endogeneity of current disposable income, the equations are estimated by nonlinear instrumental variables (NLIV). Since the constraint a = 1 in most cases is not rejected, we also re- estimate the equation by regressing the first differences of consumption on those of disposable income. In addition, we report the results obtained
by using full information maximum likelihood (FIML) to estimate the
consumption equation jointly with a predictive equation for disposable income, and imposing the relevant cross-equations restrictions. The re- sults confirm that consumption responds strongly to anticipated changes in current disposable income in Ireland, but not Denmark.12
It is natural to ask which structural differences between the two coun- tries lie behind these results. The answer may rest in the very different
functioning of credit markets in the two countries. In Denmark, lending to households plays a central role in financial intermediation, and there is no rationing in the market for credit to households. A survey con- ducted on behalf of the Central Bank since 1981 reveals that only 2% of households postpone purchases of consumer durables because they have received or believe they would receive a loan refusal (Kjaer 1987).13 In Ireland, instead, credit to households has traditionally been less plenti- ful. Only in the late 1980s has this started to change, as the mortgage market, formerly the preserve of building societies, has been opened to
competition by commercial banks. A reflection of this institutional difference between the two countries
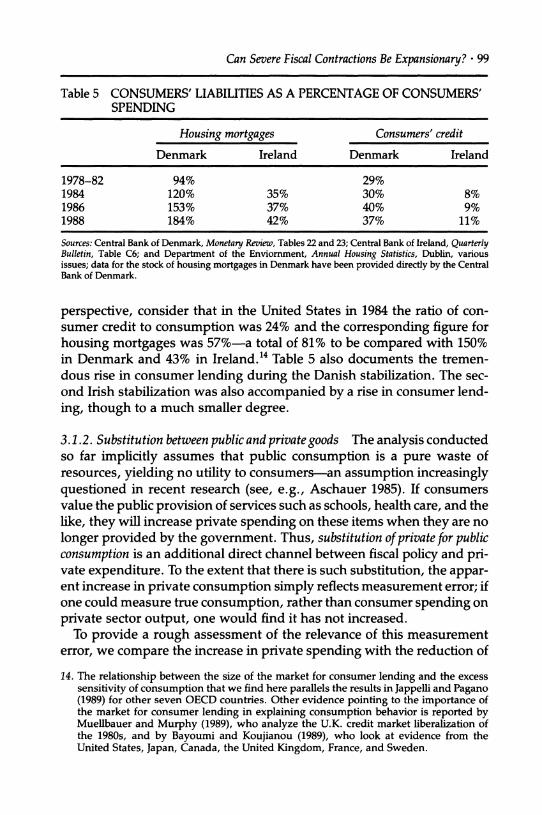
can be found in the different size of the market for consumer loans documented in Table 5; in Denmark total lending to consumers (the sum of consumer credit and housing mortgages) is about 3 times as large as in Ireland, as a percentage of total consumption. To put these numbers in
12. The only regression for Ireland that does not display excess sensitivity is that estimated with FIML without imposing the constraint a = 1. In this case, however, the other con- straints on the model are rejected by the data at the conventional 5% significance level.
13. These data are based on the "omnibus survey," conducted by Danmarks Statistik on a sample of 1,400 wage- and salary-earning households, three times a year.
98 * GIAVAZZI & PAGANO
Table 4 EXCESS SENSITIVITY OF CONSUMPTION IN DENMARK AND IRELANDa
Constraints not rejected
a below:c R2
NLIV estimates:b
Regression: C(t) = constant + aC(t-l) + , [Y(t) - aY(t-1)] Denmark (1966-87) .975 -.070 75% .926 annual data (13.20) (-.371) Denmark (1971-88) .983 -.185 25% .849 quarterly data (21.03) (-.979) Ireland (1960-89) .808 .516 75% .975 yearly data (3.77) (5.35)
Regression: dC(t) = constant + la dY(t) Denmark (1966-87) .046 .229 annual data (.29) Denmark (1971-88) -.039 -.008 quarterly data (-.07) Ireland (1962-87) .351 .443 yearly data (2.19) FIML Estimates d
System: C(t) = constant.+ aC(t-l) + , [Y(t) - aY(t-1)]; Y(t) = Z(t)/3 Denmark (1966-87) .805 -.541 5% yearly data (4.71) (-.381) Denmark (1971-88) .876 -1.54 5% quarterly data (10.53) (-1.08) Ireland (1962-87) .934 .103 2.5% yearly data (15.73) (.265)
System: dC(t) = constant + ,l dY(t); dY(t) = dZ(t)f3 Denmark (1966-87) -.273 5% yearly data (-.475) Denmark (1971-88) -1.42 1% quarterly data (-1.05) Ireland (1962-87) .407 25% yearly data (2.03) a Variables are defined as in Table 3. In the quarterly regressions for Denmark, consumption of nondurables is defined as total consumption minus clothing and footwear, housing equipment, and personal transport equip- ment (source: Central Bank of Denmark). b In the regressions on yearly data, the instruments are the first lag of disposable income, government consump- tion, government investment, net exports, and a time trend. In the equations that employ differences of consumption and investment (dC and dY), the instruments are the same variables in differenced form. In the regressions on quarterly data, the instruments are four lags of disposable income and consumption. c In the NLIV estimates, the test refers to the nonlinear constraint on the coefficients of the equation for C; the test statistic is the quasi-likelihood ratio of Gallant and Jorgenson computed by TSP. In the FIML estimates, we test jointly this nonlinear constraint and the cross-equation constraints between the equations for C and Y; in this case we use a likelihood ratio test. For the interpretation of these values, see Table 3. In both cases, the results reported in the paper refer to the constrained estimates. d The set of regressors Z in the predictive equation for Y includes the same variables used as instruments in the NLIV regressions.
Can Severe Fiscal Contractions Be Expansionary? * 99
Table 5 CONSUMERS' LIABILITIES AS A PERCENTAGE OF CONSUMERS' SPENDING
Housing mortgages Consumers' credit
Denmark Ireland Denmark Ireland
1978-82 94% 29% 1984 120% 35% 30% 8% 1986 153% 37% 40% 9% 1988 184% 42% 37% 11%
Sources: Central Bank of Denmark, Monetary Review, Tables 22 and 23; Central Bank of Ireland, Quarterly Bulletin, Table C6; and Department of the Enviorment, Annual Housing Statistics, Dublin, various issues; data for the stock of housing mortgages in Denmark have been provided directly by the Central Bank of Denmark.
perspective, consider that in the United States in 1984 the ratio of con- sumer credit to consumption was 24% and the corresponding figure for
housing mortgages was 57%-a total of 81% to be compared with 150% in Denmark and 43% in Ireland.14 Table 5 also documents the tremen- dous rise in consumer lending during the Danish stabilization. The sec- ond Irish stabilization was also accompanied by a rise in consumer lend-
ing, though to a much smaller degree.
3.1.2. Substitution between public and private goods The analysis conducted so far implicitly assumes that public consumption is a pure waste of resources, yielding no utility to consumers-an assumption increasingly questioned in recent research (see, e.g., Aschauer 1985). If consumers value the public provision of services such as schools, health care, and the like, they will increase private spending on these items when they are no
longer provided by the government. Thus, substitution of private for public consumption is an additional direct channel between fiscal policy and pri- vate expenditure. To the extent that there is such substitution, the appar- ent increase in private consumption simply reflects measurement error; if one could measure true consumption, rather than consumer spending on
private sector output, one would find it has not increased. To provide a rough assessment of the relevance of this measurement
error, we compare the increase in private spending with the reduction of
14. The relationship between the size of the market for consumer lending and the excess sensitivity of consumption that we find here parallels the results in Jappelli and Pagano (1989) for other seven OECD countries. Other evidence pointing to the importance of the market for consumer lending in explaining consumption behavior is reported by Muellbauer and Murphy (1989), who analyze the U.K. credit market liberalization of the 1980s, and by Bayoumi and Koujianou (1989), who look at evidence from the United States, Japan, Canada, the United Kingdom, France, and Sweden.

100 * GIAVAZZI & PAGANO
Table 6 DENMARK: CHANGES IN PUBLIC AND PRIVATE CONSUMPTION, SELECTED CLASSESa (at constant prices, percentage changes per year, 1983-84)
Changes in government consumption Changes in private consumption
Total -0.2 3.0 Total
Classes: Classes: Medical personal services -0.9 2.5 Physicians and dentists
Hospitals 0.3 5.8 Hospital care Education -0.4 3.4 Education Entertainment and cul- -2.5 4.8 Entertainment and cul- tural services tural services
Transportation, net of spend- -6.4 3.1 Transportation, net of spend- ing on roads and waterways ing on personal transport
equipment All these classes -0.9 3.4 All these classes
14.9 Contribution to change in pri- vate consumption
a Source: Danish Statistical Yearbook. Public spending in each class is deflated by the deflator of private consumption in the corresponding class.
public spending on the items for which substitution is most likely. Table 6 shows that in 1983-84 the Danish government slashed spending on health care, education, entertainment, and provision of public transpor- tation proportionately more than other spending. Danish households increased private spending on these services by more than their total
consumption expenditure; this is particularly evident in the case of edu- cation, entertainment, and cultural services. While this constitutes evi- dence in favor of the substitution hypothesis, the empirical magnitude of this factor seems modest relative to the total surge in consumption: the contribution of spending on these classes of services to the total increase in consumption in those two years is only 14.9%.
3.2. THE CONSUMPTION PUZZLE AND THE ROLE OF EXPECTATIONS ABOUT FUTURE POLICY
Once we control for changes in disposable income and wealth, does a
large fraction of the observed changes in consumption remain to be explained? And do the forecast errors coincide with the years of the fiscal contractions? For Denmark, we have used the consumption func- tion reported in line 1 of Table 3 to construct out-of-sample dynamic forecast errors for the years 1984-87. The equation significantly un- derpredicts consumption from 1985 onward:

Can Severe Fiscal Contractions Be Expansionary? * 101
DYNAMIC FORECAST ERRORS AS OF 1983 (PERCENT OF THE FORECAST, YEARLY DATA)
1984 1985 1986 1987
-0.03% 1.90% 3.36% 3.53%
To appreciate the magnitude of these numbers, consider, for example, that the error of 3.36% in 1986 implies a predicted growth rate of real per capita consumption of 1.8%, while the actual growth rate in that year was 4.1%. Using quarterly data we can repeat this exercise with an added gain in accuracy; owing to the larger number of observations, we can estimate the same regression with data up to 1983:1, so that the structure of the model reflects only information available at the time of the forecast.15 For comparability with the forecast errors obtained on
yearly data, we report averages of the quarterly errors:
DYNAMIC FORECAST ERRORS AS OF 1983:1 (PERCENT OF THE FORECAST, QUARTERLY DATA)
1983 1984 1985 1986 1987 1988
0.04% 0.90% 3.00% 5.80% 6.10% 3.20%
For Ireland, we have replicated this procedure only on yearly data. We have computed dynamic forecasts from a regression for total consump- tion, rather than for nondurable consumption (data for the latter were not available for 1988, the first year of the successful stabilization). The regressors are the same as in line 5 of Table 3.16 In 1988 the growth rate of real per capita consumption was 2.65%, while that forecasted by our regression is 0.6%.
Since these forecasts are computed by conditioning on the actual real- izations of the exogenous variables, including wealth, these errors can- not be attributed to the increase in wealth due to the fall in interest rates and jump in asset prices documented in Figures 6 and 8. There is indeed a consumption puzzle.
15. The equation used to produce the forecast uses the same variables and instruments as that reported in line 1 of Table 3, but does not impose the nonlinear restriction across parameters (using quarterly data, these restrictions are rejected at the 10% significance level).
16. Also in this case, the forecasting equation was estimated without imposing the restric- tions maintained in Table 3.
102 * GIAVAZZI & PAGANO
Can the German view of fiscal policy help resolve it? As discussed above, this view turns on the idea that fiscal consolidation can be read by the private sector as a signal that the share of government consumption in GDP is going to be reduced permanently, so that taxes also will be
permanently lower. This would lead households to revise upward the estimate of their human capital (the discounted value of after-tax labor income), and to raise current and planned consumption. In the Appen- dix we show that the effect of permanent spending cuts on private consumption is positive whether consumers have infinite horizons or not (although the quantitative significance of the effect depends on the
length of their horizon, among other things). For this view to be consistent with the data, it must be true that
households perceived the spending cuts as permanent, and the concomi- tant tax increases as temporary. On the first point, we already know from Figure 3 that, on the one hand, our proxy for permanent govern- ment consumption has declined after the inception of the stabilization
plans. On the other hand, actual taxes have started to come down in Denmark after 1986 and in Ireland after 1987, although they are still well above the level of the 1970s (see Figure 10, which shows cyclically cor- rected taxes, net of transfers, and subsidies).17
A more refined test of the expectations view turns on the following point. Under rational expectations, the error term of the consumption function reflects innovations in permanent disposable income. Now, sup- pose announcements of spending cuts are indeed read as "good news" about future disposable income, i.e., as a signal that the government is about to reduce taxes accordingly further in the future. Then one should find a negative correlation between consumption surprises and sur-
prises in permanent spending by the government (see Appendix). We ran a simple OLS regression between the in-sample residuals of our
consumption function for Denmark (line 1, Table 3) and changes in
government consumption, as proxy for the surprises in permanent pub- lic spending. The relationship is negative, but it is significant (at the 10% level) only when the regressor is the lagged change in public spending, not its current value:
0.197E-3 lagged change in gov- consumption residual = constant - 0 -3 - (1.705) ernment consumption
R2= 0.11 DW= 2.36
17. Figure 10 displays cyclically adjusted taxes, net of interest, and subsidies, as a percent- age of potential output. This cyclical correction should eliminate most the endogeneity of this variable.

Can Severe Fiscal Contractions Be Expansionary? * 103
Figure 10 CYCLICALLY CORRECTED NET TAXES
AS PERCENT. OF POTENTIAL GDP 36
34 -
32 -
30 - DENMARK
28 -
26-
24 -
22 -
20 -
18 -
16 -
4v ̂ ^^^/ _ >~IRElAND 14 -
12 -
10
6 , , , I J i I I ! i I I
1973 1974 1975 1976 1977 1978 1979 1980 1981 1982 1983 1984 1985 1986 1987 1988 1989
Source: OECD, National Income Accounts and European Commission
This lagged response may reflect the institutional delay in the release of revised figures for government spending, so that it is reasonable to
suppose people update their estimate of permanent spending with a lag. In Ireland, instead, no significant correlation is found between con-
sumption residuals and changes in government spending. This may be due to the presence of liquidity constraints, which we have documented in the previous section; the positive impact on consumption of a fall in
permanent taxes can be dampened if consumers are unable to borrow
freely against their human capital or their equity
3.3. SUMMING UP
It may be useful at this point to summarize our findings about the con-
sumption puzzle. For Denmark, there is considerable evidence in favor of the view that the consumption boom of 1984-86 cannot be fully explained by the fall in interest rates and the implied wealth effects, and that the
unexplained component of the boom is related to cuts in public spending. This is consistent with the view that cuts in current government consump- tion were seen as a signal of lower taxes further in the future.
For Ireland, instead, the main finding is that consumption is driven

104 * GIAVAZZI & PAGANO
primarily by disposable income-probably a reflection of the importance of liquidity constraints in the Irish economy. This may explain the con-
tractionary effects of the first Irish stabilization, when the reduction in
disposable income translated directly into a corresponding drop in con-
sumption. What then explains the consumption boom that accompanied the second Irish stabilization? Probably a combination of two factors: first, the axe of the new government fell more heavily on public spend- ing than on households' disposable income, unlike a few years before, and the increase in tax revenue was obtained while reducing marginal tax rates; second, the liberalization of the Irish credit markets in the late 1980s may have increased the ability of households to borrow in anticipa- tion of higher future incomes. It is tempting to relate the large forecast error of the Irish consumption function in 1988 with these factors, and to conclude that the German view may have something to say also for the second Irish stabilization.
4. Real interest rates and investment In Section 3 we have argued that part of the expansionary effects associ- ated with the fiscal stabilization in our two "test countries" may actually stem from the fall in real interest rates associated with the concomitant
monetary and exchange rate policies. Obviously, a fall in the long-term real rate of interest stimulates investment. Nevertheless, this appears not to be enough to explain the investment boom in Denmark in 1985- 86; when we estimate a simple reduced form equation for business in- vestment, which includes one lag of investment and of the real cost of
capital, and two lags of real GDP, we find that its dynamic forecasts
significantly underpredict investment in these years:'8
I(t) = constant + .41 I(t-l) + .37 Y(t-1) - .27 T(t-2) - .10 UC(t-1) (1.85) (2.61) (2.13) (1.81)
Forecast errors as of 1983 (percentage of the forecast):
1984 1985 1986 1987 1988
-0.83% 3.2% 10.0% -1.1% 3.5%
18. Investment, I, is defined as gross business investment; Y is real GDP (Source: OECD, National Income Accounts). The user cost of capital is defined as UC = [(l+i)*(1-t)]/ (1- T') where i is the Danish bank loan rate, t is the corporation tax rate, and T is expected inflation over a five-year horizon, built using the same methodology de- scribed in footnote 2. The regression is estimated on yearly data from 1971 to 1988, and has a corrected R2 of .732, and a Durbin-Watson value of 2.33. Very similar results were obtained using data from 1961, but omitting the user cost of capital, which was not available before 1971.

Can Severe Fiscal Contractions Be Expansionary? ? 105
This evidence is consistent with two alternative explanations. As in the case of consumption, investment decisions may reflect an increase in
profitability associated with the anticipated cut in future taxes. An alterna- tive explanation is suggested by the observation that the decision to peg the exchange rate and remove capital controls was accompanied by mas- sive capital inflows; foreign borrowing by private enterprises, in 1984 and 1985, accounted for 42% and 51% respectively of gross business invest- ment expenditure.19 The reason is probably that although, as we know, nominal interest rates fell considerably at the announcement of the stabili- zation, they remained higher than German rates. In the presence of a credibly fixed exchange rate, borrowing abroad became a very convenient proposition: domestic firms suddenly faced lower real rates-equal to the German nominal rate minus the domestic inflation rate. In this context, the removal of controls on capital inflows by the Danish authorities was
equivalent to a positive demand shock.
5. What have we learned?
We started this paper by asking whether the European exercise in fiscal rectitude in the 1980s sheds any light on two contending views about the effects of a fiscal contraction: the Keynesian view, that focuses on its direct effects on aggregate demand, and the "expectations" view-also known in Europe as the German view-that stresses the role of current changes in taxes or government spending as signals of possible future
changes. We have learned that there are cases in which the German view has a serious claim to empirical relevance. The Danish experience shows that cuts in government spending can be associated with increases in consumption even after controlling for wealth and income, and even in the presence of a substantial increase in current taxes. The Irish case, however, highlights the potential importance of liquidity constraints for the operation of this mechanism. When current disposable income effec- tively constrains consumption, Keynesian textbook propositions seem to recover their predictive power, as witnessed by the 7% drop in real consumption in 1982 during the first Irish stabilization.
We have also found that part of the expansionary effects of the fiscal contractions analyzed here must be attributed to the concomitant mone- tary disinflation, which in these countries operated via the switch to fixed exchange rates with a low-inflation currency (the German mark), and the liberalization of capital flows. This produced a sharp fall of nominal inter- est rates; in the presence of inflation inertia, the latter translated into a
19. OECD (1987).

106 * GIAVAZZI & PAGANO
corresponding drop of real rates and a rise in aggregate demand. This
expansionary effect, however, crucially hinged on the credibility of the fixed parity chosen by the monetary authorities. It is remarkable that in both our cases of "expansionary contractions" the shift in fiscal and ex-
change rate policy was preceded by a sizable devaluation.
REFERENCES
Ahmed, S. 1987. Government spending, the balance of trade and the terms of trade in British history. Journal of Monetary Economics 20 (2): 195-220.
Andersen, T.M., and O. Risager. 1987. The role of credibility for the effects of a change in exchange rate policy. Seminar paper no. 377. Stockholm University, Institute for International Economic Studies.
Aschauer, D. A. 1985. Fiscal policy and aggregate demand. American Economic Review 75 (1): 117-27.
Barro, R. 1979. On the determination of public debt. Journal of Political Economy 87 (5): 940-71.
Barro, R. 1981. Output effects of government purchases. Journal of Political Econ- omy 89 (6): 1086-121.
Bayoumi, T., and P. Koujianou. 1989. The effects of financial deregulation on consumption. IMF Working Paper 89/88, October.
Blanchard, O: J. 1985. Debt, deficits and finite horizons. Journal of Political Econ- omy 93 (2): 223-47.
Christensen, A. M. 1988. Indkomst, formue og privatforbrug. Mimeo., Central Bank of Denmark.
Christensen, M. 1986. Policy credibility and the Lucas critique: Some new tests with an application to Denmark. University of Aarhus, Institute of Economics. Memo 1987-88.
Danish Ministry of Finance. 1983. Government finances in Denmark. Depart- ment of the Budget, Smatryk 32.
Dornbusch, R. 1989. Credibility, debt and unemployment: Ireland's failed stabili- zation. Economic Policy 8 (April) 173-210.
Drazen, A., and E. Helpman. 1989. Inflationary consequences of anticipated macroeconomic policies. The Review of Economic Studies 57(1): 147-64.
Feldstein, M. 1982. Government deficits and aggregate demand. Journal of Mone- tary Economics 9 (1): 1-20.
Fels, G., and H. P. Froelich. 1986. Germany and the world economy: a German view. Economic Policy 4 (April): 178-95.
Giavazzi, E, and M. Pagano. 1989. Confidence crises and public debt manage- ment. NBER Working Paper No. 2926.
Hall, R. E. 1978. Stochastic implications of the life-cycle permanent income hy- pothesis. Journal of Political Economy 86 (6): 971-87.
Hayashi, F 1982. The permanent income hypothesis: Estimation and testing by instrumental variables. Journal of Political Economy 90 (5): 895-916.
Hellwig, M., and M. J. M. Neumann. 1987. Economic policy in Germany: Was there a turnaround? Economic Policy 5 (October): 105-40.
Jappelli, T., and M. Pagano. 1989. Consumption and capital market imperfections: An international comparison. American Economic Review 79 (5): 1088-1105.
Kjaer, J. H. 1987. Consumer Lending. Monetary Review. Danmarks Nationalbank.

Can Severe Fiscal Contractions Be Expansionary? * 107
McAleese, D. 1990. Ireland's economic recovery. The Irish Banking Review. Summer. McAleese, D., and F. D. McCarthy. 1989. Adjustment and external shocks in
Ireland. World Bank, International Economics Department, WPS 262, August. Moore, J. M. 1987. The Irish consumption function and Ricardian equivalence.
The Economic and Social Review 19 (1): 43-60. Muellbauer, J., and A. Murphy. 1989. Why has UK personal saving collapsed?
Mimeo. OECD (1987) Economic Survey of Denmark, p. 52. Sachverstandigenrat zur Begutachtung der Gesamtwirtschaftlichen Entwicklung.
1981. Vor kurskorrekturen-Zur finanzpolitischen und waehrungspolitischen situation im sommer 1981. Special Report of July 4, 1981.
Seater, J. J., and R. S. Mariano. 1985. New tests of the life cycle and tax discount- ing hypothesis. Journal of Monetary Economics 15 (2): 195-215.
Seidman, D.J. 1987. The distribution of power in Dail Eireann. The Economic and Social Review 19 (1) 61-68.
Thygesen, N. 1985. The phasing-out of exchange controls in Denmark. Skandi- naviska Enskilda Banken Quarterly Review 3: 59-65.
APPENDIX
1. The response of private consumption to fiscal and monetary policy
Consider the consumption function proposed by Blanchard (1985):
C(t) = (p+O) [H(t) + K(t) + D(t)], (1)
where 1/p is the horizon index (p -> 0 being the Ricardian case of infinite horizon consumers), H(t) is human capital, K(t) is private wealth net of government debt, and D(t) is the market value of government debt, measured in units of consumption goods. Human capital is the present discounted value of aftertax labor income, discounted at the subjective rate of the representative household, p+ 0:
H(t)= f Y(s)e-(r+p)(s- ds - T(s)e-r+p)(s-ds (2)
where the real interest rate r is assumed to be constant. To highlight the role of a long maturity of the debt, we assume that
public debt consists of B consols, each paying 1 dollar per period. Using the government budget constraint, the real value of debt, i.e., the dis-

108 * GIAVAZZI & PAGANO
counted value of the flow of coupons on the B consols (measured in units of consumption), equals the discounted value of future real budget surpluses:
D(t) = e-r(s-)(Be--t))ds= [T(s)-G(s)]e-r(s-)ds. (3)
Using these three equations, we can analyze the response of consump- tion to changes in current taxes T(t), the inflation rate Tr, the real interest rate r, and permanent spending Gp(t), defined as the annuity value of the future discounted flow of real government spending:
GP(t) = r G(s)e-r(s-t)ds. (4)
As shown by Blanchard (1985), if the horizon of consumers is finite (p >
0) consumption falls when, for given GP(t), the government raises taxes
temporarily, offsetting such an increase by a tax cut at some future date t+4T,:
8C(t) = - (p+O) (1-e-Pr) < 0. (5) 8T(t)
In both equations (5) and (6) the effect on consumption is an increasing function of p: the shorter the horizon of consumers, the larger the fall in
consumption in response to higher transitory taxes or inflation. With
incomplete tax discounting and long-term nominal debt, an increase in inflation also reduces consumption, since higher inflation decreases the market value of nominal debt D(t) by more than it increases human
capital H(t). Assuming that the increase in rr is permanent and that the
corresponding reduction in taxes will be concentrated at some future date t+ i, the effect is:
8C(t) B -= (p+O) (1-e- ) < 0. (6)
ST ' (r+ 7T)2
The effect of an increase in the real interest rate r, instead, is always negative, whether the horizon of consumers is infinite (p = O) or not. In the presence of finite horizons, however, the negative effect of a rise in r also works through the capital loss on the market value of long-term debt, which is not fully offset by a corresponding increase in human

Can Severe Fiscal Contractions Be Expansionary? * 109
capital (due to the fall in future taxes). Assuming that real government spending and real taxes are constant in levels G and T respectively, and that pretax labor and capital income are also fixed at a level Y, the effect of a permanent rise in the real rate of interest is:
8C(t) Y-G Tp (2r+p) =- (p+6) - (P+6 ) <0, (7) 8r (r+p)2 r2 (r+p)2
where the term corresponding to the capital loss on long-term debt is the second one, and vanishes for p = 0.
Finally, consider the effect of a change in current spending G(t). If this is perceived as temporary, i.e., permanent spending GP(t) remains un-
changed, it can be shown that consumption will not change, irrespective of the value of p. This is because a temporary change in current spending does not affect the path of taxes. If, however, households regard the
change in current spending as a signal of a change in permanent spend- ing, their consumption will be affected. Suppose, for instance, that per- manent spending increases and in each future period s taxes T(s) are
going to be changed by an amount equal to the change in permanent spending Gp(t). Then current consumption C(t)falls:
8C(t) p+ = - < 0. (8) 8GP(t) r+p
Vice versa, a cut in permanent spending has an expansionary effect on current consumption. The effect of consumers' horizon (l/p) is ambigu- ous: on the one hand, a long horizon implies that the consumer will be around longer to enjoy lower taxes; on the other hand, she will have to spread the increase in her permanent income over a longer ex-
pected lifetime. If the individual consumption path is flat (0 = r), these two effects cancel out, and the increase in consumption exactly matches the fall in permanent spending. A longer horizon makes the
spending cut more expansionary if individual consumption is declin-
ing over time (0 > r), and less expansionary if it is increasing over time (0 < r). If 0 > r, an increase in permanent disposable income translates more into higher wealth accumulation than higher current
consumption; if 0 < r, the reverse happens.
2. Derivation of the equation estimated in Table 3 The equation is derived along the lines of Hayashi (1982). Aggregate consumption behavior is characterized by the consumption function:

110 * GIAVAZZI & PAGANO
C(t) = 0 [A(t) + H(t)] + / D(t) + - Y(t) + u(t) (9)
where A(t) is real and financial wealth net of public debt, H(t) is human
capital, gross of taxes, that is, the P.V.D. of pre-tax labor income, D(t) is
public debt, Y(t) is personal disposable income, and u(t) is a white noise disturbance that captures transitory consumption shocks arising from
preference shifts and measurement errors. The parameter f3 on public debt can be smaller than the parameter 0 on other forms of wealth to reflect the degree of tax discounting by the private sector (8/ = 0 in the Ricardian case). The parameter , measures the share of income accruing to consumers who do not behave according to the permanent income
hypothesis, due to liquidity constraints or myopia, and simply consume all their disposable income.
The law of motion of human capital is:
H(t) = (1+5) [H(t-l) - w(t-l)] + e(t) (10)
where 8 is the discount rate that consumers apply to their future after-tax labor income w(t), and e(t) is the revision of the value of human capital- a white noise error under rational expectations. An unexpected fall in
permanent taxes at time t leads to a revision of the PDV of future after- tax earnings H(t) and thus to a positive realization of e(t).
Equation (10) can be used in (9) to substitute out the unobservable H(t), obtaining the equation estimated in Table 3:
C(t) = (1+5)C(t-1) + 6{A(t) - (1+6)[A(t-1) + w(t-1)]} + 3[D(t) - (l+8)D(t-1)] + /[Y(t) - (l+8)Y(t-1)] + v(t). (11)
The error term v(t) = u(t) - (l+8)u(t-1) + Oe(t) reflects current and
lagged shocks to transitory consumption, u(t), and revisions of human
capital and permanent taxes, e(t). Due to the nonlinear restrictions
among the coefficients and to the correlation between A(t), Y(t), and v(t), the equation must be estimated with NLIV, using variables in the infor- mation set of consumers at time t-1 as instruments. The MA(1) compo- nent involving u(t) can lead to serial correlation in the error term, which in turn can make these instruments endogenous (see Hayashi 1982); however, in our estimates this problem can be neglected, since the sam-
ple autocorrelation of the residuals is not significantly different from zero.
To the extent that a reduction in current spending is perceived by households as permanent, it will translate into an unexpected increase in their human capital, H(t), and thus into a positive e(t). We therefore

Can Severe Fiscal Contractions Be Expansionary? ? 111
expect changes in spending, if permanent, to correlate negatively with the estimated consumption residual v(t) via its component e(t).
Comment OLIVIER JEAN BLANCHARD
Europe in the 1980s will have provided more than its share of challeng- ing macroeconomic facts. The paper by Giavazzi and Pagano adds an- other one to the list. In a number of countries, most notably Denmark and Ireland, fiscal contraction on a scale that would make U.S. policy- makers faint was associated with a strong output performance-an out- come that surprised even the governments that had implemented the consolidation.
Giavazzi and Pagano do a superb job of documenting the facts. They also do a convincing job of showing that, while fiscal consolidation was
part of a package and other factors were at work, fiscal policy surely did not work in the way suggested by the Keynesian textbook. Sometimes, the German view of the effects of fiscal policy appears to be right, and a decrease in spending or an increase in taxes indeed increases consump- tion, demand and output. The questions are that of when and how. I shall use my comments to sketch a simple model that complements the
analysis of Giavazzi and Pagano and that I have found helpful to think about these issues.
I shall focus on the questions of whether and when a permanent increase in taxes may, given government spending, increase consump- tion. Closely related questions, which would fit better the experience of Ireland in the late 1970s are whether and when a large decrease in public spending can increase aggregate demand. It will be obvious that the answers to the first question apply equally well to the second.
When a government consolidates its budget position through an in- crease in taxes, it affects expectations and thus consumption in two
ways. First, the intertemporal redistribution of taxes from the future to the present is likely to increase the tax burden of current taxpayers and reduce their consumption. This effect is the conventional one, and its
strength depends on how much the economy departs from the bench- mark of Ricardian equivalence. But, second, by taking measures today, the government eliminates the need for larger, maybe much more disrup- tive adjustments in the future and this may in turn increase consump- tion. These are the two effects I want to model; in doing so I make four
assumptions.

112 * GIAVAZZI & PAGANO
First, higher taxes decrease output. If t is the tax rate, I assume there is a critical value of t, call it T, such that if t exceeds T, output is lower by some amount or
for t<T, y = y, and for t>T, y = y-or.
This is a crude formalization for a complex array of effects. The higher the tax rate required by a fiscal consolidation, the larger the permanent distor- tions it will imply, but also the larger the transitory disruptions coming from the adjustment itself. What is important for the results below is that the marginal resource cost of taxation increases with the tax rate.
Second, the longer the government waits to consolidate; the higher the required tax increase when it does. This is not, strictly speaking, an
assumption so much as a straightforward implication of the government dynamic budget constraint, which I write as:
db/ds = rb - ty,
where b is government debt, r is the interest rate, and s denotes time (as t is already used for the tax rate). For notational simplicity, I take govern- ment spending to be equal to zero.
I assume that before consolidation, the government is running a defi- cit, so that b is increasing. I take consolidation to mean an increase in taxes such that debt is stabilized at a constant value forever. (Given the struc- ture of the model, the optimal consolidation would be to increase taxes even more, allowing for a reduction of debt and a lower-tax rate later. I
ignore that possibility). The tax rate, t*, implied by the consolidation is thus given by:
t*(b) = rb/y.
so that given y, t* increases with b and thus increases with time.
Together, these two assumptions imply that there is a critical level of debt, B, such that, once it is reached, consolidation requires a tax rate which in turn implies a low level of output, y-oa. (There is also a Laffer- like interval of values for debt for which consolidation is associated with two tax rates-one low and associated with high output, the other high and associated with low output. It is reasonable to assume the govern- ment chooses the low tax rate when it has the choice). This critical level of debt is given by:
B = yT/r

Can Severe Fiscal Contractions Be Expansionary? * 113
At any point in time-say time zero-given the current tax rate, to, and the current level of debt, b0, one can compute the time, call it v, that it would take for debt to reach its critical value B, were no consolidation to take place between now and then. v is given by:
v = (llr)ln((T- to)l(t*(bo)- to)); t*(bo) = rbdy.
Thus, how close the economy is to the brink-more formally, how much time is left before consolidation requires a tax rate that leads to a large output loss-depends on three sets of variables. The lower the gap between the critical and current tax rates, (T-to), the smaller is v. The
larger the gap between the tax rate required for consolidation and the current tax rate, (t*(bo)-to), the smaller is v. Finally, a higher value of r decreases v through two channels, by increasing the rate of debt accumu- lation, and increasing the size of the increase in the tax rate required when consolidation takes place.
It is clear how consolidation may then improve perceptions of future
output, and through them, consumption. Consolidation, if it takes place before B has been reached, removes the danger of low output and is therefore good news. This formalization focuses on the effects of consoli- dation on the expected level of output; there is another, probably equally important implication of consolidation that this formalization does not
capture-the effect of consolidation on uncertainty. Consolidation may be associated, at least after a while, with a substantial decrease in uncer-
tainty, leading to a decrease in precautionary savings, to a decrease in the option value of waiting by consumers to buy durables and by firms to take investment decisions. The large positive residuals in the invest- ment equation for Denmark found by Giavazzi and Pagano are strongly suggestive of the presence of such effects. While the level and uncer-
tainty effects work in the same direction, it would be interesting to introduce the uncertainty effect formally. But it is hard work and I shall not do so here.
How much good news the consolidation actually is depends on how
unexpected it is; this motivates the third assumption, that consolidation is a stochastic event, with constant instantaneous probability 8. The
parameter 8 captures how people perceived the resolve of the govern- ment before consolidation occurs. If 8 is low, consolidation comes largely as a surprise, and is therefore major news. But if 8 is high, consolidation is widely expected, and thus not much of a surprise when it actually happens.
It is traditional and reasonable to impose a no-Ponzi game condition

114 * GIAVAZZI & PAGANO
on the government in this context. Fiscal policy should be such that, at
any point, the expected value of debt does not grow asymptotically faster than the interest rate. This in turn implies here that the probability of consolidation must be sufficiently high, or more precisely that 8 be
greater than r. If 8 were less than r, then although consolidation would
eventually take place with probability equal to one in the limit, the
expected value of debt would grow faster than the interest rate, an issue reminiscent of stochastic bubbles. Assuming 8 greater than r excludes this possibility.
Finally, one last but crucial assumption is needed regarding the specifi- cation of how consumers react to expectations of future output and taxes, the specification of the consumption function. As in all issues relating to
intertemporal reallocations of taxes, what matters most is the horizon of consumers. For those purposes, the model of aggregate consumption based on consumers with constant probability of death-which I have
developed elsewhere and is used by Giavazzi and Pagano-does the job nicely, and I shall rely on it. This motivates the last assumption that consumers are optimizing and forward looking, with subjective dis- count rate 0, and myopia coefficient (or probability of death) p. p is an index of how non-Ricardian the economy is; if p=O, Ricardian equiva- lence holds. If p is positive, intertemporal reallocations of taxes affect
consumption. These assumptions imply the following aggregate con-
sumption function:
C = (p+ )[b + (other wealth) + E(f y(l-t)exp(-(r+p)s)ds)].
The marginal propensity to consume out of wealth is equal to (p+O). Wealth is equal to the sum of nonhuman wealth and human wealth. Nonhuman wealth includes government debt and other assets. Human wealth is the expected present discounted value of after tax income, with the discount rate equal to r+p. I make no distinction between labor income and total income; it would be easy to introduce it. The discount rate depends on the degree of myopia, p. The need to have an expecta- tion operator comes from the uncertainty about the sequence of after-tax income introduced by the uncertainty about the timing of consolidation.
It is now a simple matter of algebra to derive the effects on consump- tion of a consolidation, say, at time zero. Two effects are in general at work. The first is that consolidation may save the economy from
catastrophies in the future. It is present if two conditions are met. The output cost of high taxation, or, is positive, and consolidation happens before it is too late: the tax rate after consolidation is less than the critical

Can Severe Fiscal Contractions Be Expansionary? * 115
tax rate. The second effect is the traditional one, as consolidation in- creases current taxes, decreasing consumption. It will be present so long as consumers are not Ricardian. I consider the two effects in turn.
The first effect (and the only one if consumers are Ricardian, in which case p=0 in the expressions below) is given by:
Ac = (p+ 0)[ -change in expected present value of output]
= (p+ O)[ exp(- 8s)8((a/r)exp(- (r+p)s)ds]
= (p+ )[ (acr)(8/(8+r+p))exp(-(8+r+p) v)] where v = (l/r)ln((T- to)/(t*(bo) - t)); t*(bo)= rb/y.
Before consolidation actually occurs, there is a risk that consolidation
may come so late as to imply reduced output. Current consolidation eliminates this danger. The gain from consolidation is thus equal to minus the expected present value of output losses that people expected preconsolidation.
The term in brackets in the second expression for Ac gives the present value of the output loss preconsolidation. exp (-8s)8 is the probability that consolidation takes place at time s. (a/r)exp(-(r+p)s) is the present value at time zero of the output loss if consolidation takes place at time s>v, requiring a high tax rate and leading to low output. (p+O) is the
marginal propensity to consume out of wealth. This expression for the output effect on consumption allows for charac-
terization of the role of the various parameters. Obviously the larger the
output loss, or, the larger the gain from consolidation. The smaller v, the closer the economy is to the brink, the larger the gain from consolida- tion. Thus, the higher bo or the higher to, the larger the gain from consoli- dation. The effects of 8 are ambiguous: on the one hand, a low 8 means consolidation was not widely expected and comes largely as a surprise; on the other hand a low 8 also implies that people did not expect the consolidation and thus the output loss to happen anytime soon.
The second effect, which is present only if consumers are myopic, comes from the front-loading of taxes that comes with the consolidation. While the present value of taxes remains the same, consolidation in- creases current taxes and this, if consumers are myopic, decreases con-
sumption. This effect is given by:
Ac = (p+ 0)[-change in the expected present value of taxes] = (p+ )[-(l/(r+p))(p/(5+p))(rbo-yt).

116 * GIAVAZZI & PAGANO
This expression for the tax effect on consumption also shows the role of the various parameters of the model. The decrease in consumption is an
increasing function of p, the degree of myopia. If p=0, then Ac=0. The current increase in taxes is then exactly offset in the people's budget constraint by the decrease in expected future taxes. If p is positive, front-
loading of taxes decreases consumption, and the effect is increasing in p. The decrease in consumption is an increasing function of rbo-yt, the increase in taxes required by the consolidation. The decrease in con-
sumption is a decreasing function of 8. The lower 8, the further in the future consumers expect the tax increase to happen, the larger the in- crease in the tax burden implied by the consolidation.
Having sketched the model, let me now return to the real world and use it. When would we expect a fiscal consolidation to increase rather than decrease consumption? When the first effect dominates the second one. This, the model suggests, is more likely under two conditions.
The first condition is when people exhibit little'myopia, leading to small effects of intertemporal tax reallocation, so that output effects dominate. If one sticks to the interpretation of p as the probability of death, this does not seem a promising way of explaining differences across countries. But under a more generous interpretation of p as reflect-
ing in particular the development of credit markets and the ability to borrow against future income, this is definitely more promising. In that
regard, Giavazzi and Pagano provide interesting evidence about the
importance of consumer credit in Denmark. One would expect the re-
sponse of consumers to be distinctly less Ricardian in countries where the credit system is much less developed.
(2) The second condition is when the economy is closer to the brink, which in turn depends on the distance between the critical tax rate and the current tax rate as well as the level of debt. In this respect, both Ireland and Denmark were indeed strong candidates for a strong output effect. The marginal tax rate (total, for average production worker) in Denmark in 1983 was equal to 71.2%, compared, for example, to 48.6% in the United States, and gross debt was equal to 65% of GNP. In Ireland, the corre-
sponding number for the tax rate in 1983 was 70.2% and, in 1987, the year of the second fiscal consolidation, the debt to GNP ratio stood at 135%. Under those conditions, it would indeed have been reasonable for people to assume that if consolidation was not coming soon, it later would have to be achieved at punitive tax rates and substantial disruptions, and thus for the first effect to be quite strong. One would not, however, expect effects of the same strength for milder, run-of-the-mill consolidations, starting from either lower tax rates and lower debt to GNP ratios.

Can Severe Fiscal Contractions Be Expansionary? ? 117
Comment ALLAN DRAZEN
Francesco Giavazzi and Marco Pagano present two cases where a sharp fiscal contraction meant to stabilize an inflationary economy led not
simply to a significant increase in private consumption and investment, but to an expansion rather than a contraction of output. There are oth- ers, such as the economic expansion in Israel in 1986-1987 in wake of the
July 1985 stabilization. What mechanisms can explain this "perverse" effect of fiscal contractions on output? Though contradictory to basic textbook aggregate demand models of economic activity, it has gained many adherents in Europe, coming to be known as the "German view" of the effect of fiscal policy.
The possible explanations can be put into two basic categories: those which rely primarily on changes in current variables, such as interest rates or wealth (which Giavazzi and Pagano term direct effects); and those which rely primarily on expectations of changes in variables in the
future-specifically, changes in the current deficit induce expectations of future changes in fiscal policy. Giavazzi and Pagano consider various direct mechanisms empirically to see how much of the "perverse" effects that can explain. They reject the direct mechanisms, I think correctly, as
providing a full explanation, suggesting the need to concentrate on pol- icy expectations effects.
In these comments I want to do three things. First, I want to highlight what struck me as "regularities" in these episodes, with an eye toward
differentiating possible explanations. Second, I will review their evi- dence on the explanatory power of the direct, current variable effects, adding further evidence that rejects these as the full explanation. Finally, I want to look at the policy expectations view more closely and suggest what type of model might explain some of the regularities from these
episodes. Basically, I want to formalize slightly the notion of process switching, which I think is inherent in the policy expectations view.
1. What Is to Be Explained? Table 1 and Figure 2 in the paper consider the prevalence of expansion- ary effects of fiscal policy. Taking these data, the episodic description of the Danish and Irish cases, as well as other episodes, two regularities struck me. First, the effect of a fiscal contraction depends on whether we

118 - GIAVAZZI & PAGANO
are considering an increase in taxes or a cut in government spending. The first has the standard depressing effect on consumption and output; only the second gives the perverse effect. The two Irish episodes tell the same story. The first stabilization attempt in which the government defi- cit was cut via higher taxes was contractionary; the second, where the deficit was cut via cuts in government consumption and investment
spending was highly expansionary. Considering the effect on consumption and output of government
spending cuts, the results are mixed. Though the signs of the coefficients in Table 1 are consistent with a perverse effect across countries, the effect is statistically significant in only a few cases. Figure 2 tells a similar
story-the evidence in favor of an expansionary effect of government spending cuts is quite mixed. Denmark and Ireland would appear to be outliers. My reading of the episodes here, and of the case of Israel, which experienced a consumption and investment boom in 1986-87
following a sharp fiscal contraction in 1985, is that there may be a nonlin-
earity. Perverse effects may come from very large fiscal contractions, but are less likely to result from small ones. A model should explain why there may be a difference, and, I will argue below, a model of process switching may do just that. Moreover, the mixed evidence and the possi- ble nonlinearity suggests that the German view that fiscal contractions are in general expansionary is on weak footing.
2. Explanations Based on Current Variables Giavazzi and Pagano first consider explanations based on the effects of
changes in current variables and argue that these don't provide a full
explanation. To begin with, there is the argument that decreases in real interest rates induce capital gains on public debt to finitely lived consum- ers, this wealth effect raising consumption. As Giavazzi and Pagano point out, this explanation has problems. One problem is that debt enters insignificantly in the consumption function for both countries; another is that other episodes suggest this effect is neither sufficient nor
necessary for a consumption boom. There was also a fall in interest rates and increase in wealth in the first Irish episode, with no consumption boom, while the Israeli boom occurred in a situation where real interest rates rose sharply. Giavazzi and Pagano further similarly demonstrate that lower interest rates are not sufficient to explain the observed in- creases in private investment spending.
A second line of explanation concerns substitution of private consump- tion for government consumption. Here too the magnitudes are too small.

Can Severe Fiscal Contractions Be Expansionary? ? 119
There are two other possibilities effects that I mention because they played an important role in the Israeli case. The first is relative price effects from a temporarily overvalued real exchange rate. Immediately following the stabilization of July 1985, there was a sharp fall in consump- tion. Starting in 1986, however, expenditures on durable consumption and investment goods, which are largely imported, jumped sharply (Razin and Sadka 1990). This increase largely explains the consumption boom. What accounted for this sharp increase in durable expenditure? The 1985 stabilization was accompanied by a sharp devaluation, fol- lowed by a period of fixed exchange rates. During the period in which the nominal exchange rate was fixed, inflation continued, implying a real appreciation and an overvalued exchange rate. The real appreciation engendered expectations of a devaluation, leading people to move up their purchases of imported durables. Hence, the consumption boom was related to the timing of exchange rate movements.
The data suggest a similar pattern for the second Irish stabilization. There is a sharp devaluation and an improvement in exports in 1987.
Consumption really rises somewhat later, in 1988-89. The figures in the
paper are for nondurable consumption. It would be interesting to see data on consumption of durables and on real exchange rates to see if there was a timing effect in the Irish case.
The other affect seen in Israel is a sharp increase in productivity and reallocation of resources out of the financial sector as inflation dropped sharply. Were such effects present in Denmark or Ireland?
In short, theories that are based on direct effects of changes in cur- rent variables may contribute to an understanding of the expansionary effects of fiscal contractions, but do not in themselves give an adequate explanation.
3. The Policy Expectations View A more promising line of argument is that the effects of current macro- economic policy depend on what expectations of future policy they in- duce. "Perverse" effects of policy, whereby government spending cuts can be expansionary are due not to some exotic theory, but to a very orthodox theory combined with the view that fiscal contraction today will signal, enable, or force an expansionary change in fiscal policy to- morrow. Applied to inflation this is the Sargent and Wallace "Unpleasant Monetarist Arithmetic" (1981) argument that a cut in the rate of growth of the money supply today implies faster growth of government debt and higher debt service tomorrow, implying a need to raise the rate of monetary growth tomorrow.

120 * GIAVAZZI & PAGANO
Giavazzi and Pagano endorse this view, arguing that the consumption booms in the Danish and second Irish case reflect the expectation that future taxes and government spending will be cut. How then do we
explain the absence of a boom in the first Irish stabilization? I found their
argument on liquidity constraints due to the structure of credit markets
unconvincing. The figures in Table 5 do not suggest that credit markets in Ireland looked so different in 1988 than they did in 1984. Moreover, the level of borrowing is endogenous, so that any increase may be the result, rather than the cause, of a consumption boom.
How can one put some structure on the policy expectations view in order to explain different reactions to current deficit changes? One way is to concentrate on the importance of the government's intertemporal budget constraint, as in the Sargent and Wallace case or in my work with
Helpman (1990) on anticipated future policy switches. A cut in the defi- cit today means government debt grows less fast, so that a given level of
government spending tomorrow is consistent with lower taxes. This
expected future tax decrease has current expansionary effects, especially if it is distortionary taxes that are cut.
Though feasibility of future policy changes must form the basis of the
policy expectations view, simple feasibility according to the government budget constraint doesn't yield a complete explanation. There are sev- eral reasons. First, simple feasibility allows a cut in government spend- ing today to be followed by an increase tomorrow. Why are expectations of a move in a specific direction engendered? Second, feasibility doesn't
explain why large fiscal changes may have quite different effects than smaller changes. Third, a message of Table 1 was that deficit reductions due to tax increases are contractionary, in contrast to deficit reductions to
government spending cuts. Simple feasibility says they should have similar effects.
The second way to link current and expected future fiscal variables is to argue that a cut in government spending today may signal that the government is able to cut its spending and distortionary taxes tomor- row in a way not previously thought possible, given political con- straints. Hence, the issue is not simply what is economically feasible, but what is politically feasible. The high deficit policies that character- ized Denmark, Ireland, and Israel prior to their stabilizations were fol- lowed because agreement could not be reached on policy changes that would significantly reduce the deficit. Such agreement may be delayed due to the distributional consequences of fiscal changes. Alesina and I (1989) have used such a model to explain the timing of policy changes and specifically why stabilizations that all agents see the need for are
delayed. In the Danish and Irish cases, a sharp cut in government

Can Severe Fiscal Contractions Be Expansionary? ? 121
spending may thus indicate a change in the process by which fiscal
policy is made. I think a model of process switching is implicitly what proponents of
the German view have in mind. The idea is suggested at least informally in the Giavazzi and Pagano paper, but its implications are not really drawn out. I think it can explain a number of the empirical observations that the earlier feasibility story could not. I also think it is a more convinc-
ing explanation than liquidity constraints of why two Irish experiences differed so much from one another.
Let me sketch what a simple model might look like. Suppose an agree- ment to cut spending in a sustainable way implies a large change in the unobservable mean level of spending. For simplicity's sake, suppose there are only two mean spending levels, y2 and yV, significantly less than 72, where the political process of choice of government spending implies that each mean level of spending is highly persistent. Denote
Pr(yt = yilyt-1 = yi) by Pi, so that pi is close to one for i = 1,2. Observed
spending is g, where gt = yt + Et. Again for simplicity, assume the stochastic part of spending Et is uniformly distributed over [:, -:].
Now, suppose last period's government spending gt_- was high, so that pr(^yt_ = y2) is one. A value gt < gt-l of current period government spending is observed. Has the process switched, implying a persistently lower level of average government spending? Using l-p2 as our prior, we can use Bayes' rule to compute the posterior probability that yt = y, conditional on our observation of gt. From this we can compute the
expected present discounted value of future government spending. The basic question that Giavazzi and Pagano ask in terms of policy expecta- tions is how does this change for a given observed change in current
government spending, gt? If gt > 7i + 6, the process definitely hasn't changed. If y2 - : < gt 7i +
s, the probability that the process has changed is low as long as P2 is close to one. But if gt < y2 - 5, the process has changed with probability one. Hence, small cuts in government spending signal no change in the pres- ent discounted value of future government spending; slightly larger changes signal large changes in expected future government spending. So the process switch model yields a nonlinearity. A large deficit reduc- tion via a tax increase with no observed change in gt implies the probabil- ity that y = y2 remains high, and the tax cut is seen as unsustainable. The effects of a deficit reduction via a tax increase therefore, are quite differ- ent than via a cut in government spending. Note further that the process switch model suggests a more sophisticated way of forecasting future
government spending than a simple ARIMA model. In fact, if the persis- tence of states is very high, an ARIMA will give very biased forecasts.

122 * GIAVAZZI & PAGANO
REFERENCES
Alesina, A., and A. Drazen. 1989. Why are stabilizations delayed? Working paper, Princeton University, September.
Drazen, A., and E. Helpman. 1990. Inflationary consequences of anticipated macroeconomic policies. The Review of Economic Studies 57 (1989): January, 147-84.
Razin, A., and E. Sadka. 1990. Post-stabilization recession-Monetary factors. Tel-Aviv University, January.
Discussion
Robert Gordon noted that the Keynesian predictions for the effects of fiscal policy depend on the degree to which government spending and
private spending are substitutes and on the path of monetary policy, both of which the paper should focus more on. He also suggested consid-
ering more foreign variables, particularly in the investment equation. Giavazzi replied that differences in foreign circumstances cannot explain the different outcomes in the two Irish stabilizations and that Denmark
emerged from the recession in Europe before the rest of the countries so it was unlikely that foreign demand was responsible.
Julio Rotemberg suggested that the decrease in government spending may have reoriented the economy to the world economy and thus af- fected consumption. Giavazzi responded that it could affect investment as well.
Stanley Fischer asked what component of GNP rose to replace the decline in government spending. Franco Modigliani asked what hap- pened to savings after the decrease in government spending. Giavazzi
replied that since output fell and consumption rose, saving must have fallen.
Lawrence Summers suggested looking closer at the supply-side re-
sponse to the change in spending since government policies could have
large effects on individuals' confidence about the future.


![Angina Pectoris Obstruction Decrease of blood irrigation Acute Myocardial Infarction (almost) Total occlusion Cellular necrosis [1] [1] Thygesen K, Alpert.](https://static.fdocuments.in/doc/165x107/56649e7e5503460f94b8103d/angina-pectoris-obstruction-decrease-of-blood-irrigation-acute-myocardial-infarction.jpg)