
This paper is published as part of a PCCP themed issue ...devries/groupsite/pub/guanine...
11
This paper is published as part of a PCCP themed issue series on biophysics and biophysical chemistry : Biomolecular Structures: From Isolated Molecules to Living Cells Guest Editors: Seong Keun Kim, Jean-Pierre Schermann and Taekjip Ha Editorial Biomolecular Structures: From Isolated Molecules to the Cell Crowded Medium Seong Keun Kim, Jean-Pierre Schermann, Taekjip Ha, Phys. Chem. Chem. Phys., 2010 DOI: 10.1039/c004156b Perspectives Theoretical spectroscopy of floppy peptides at room temperature. A DFTMD perspective: gas and aqueous phase Marie-Pierre Gaigeot, Phys. Chem. Chem. Phys., 2010 DOI: 10.1039/b924048a Communications Dynamics of heparan sulfate explored by neutron scattering Marion Jasnin, Lambert van Eijck, Michael Marek Koza, Judith Peters, Cédric Laguri, Hugues Lortat-Jacob and Giuseppe Zaccai, Phys. Chem. Chem. Phys., 2010 DOI: 10.1039/b923878f Papers Infrared multiple photon dissociation spectroscopy of cationized methionine: effects of alkali-metal cation size on gas-phase conformation Damon R. Carl, Theresa E. Cooper, Jos Oomens, Jeff D. Steill and P. B. Armentrout, Phys. Chem. Chem. Phys., 2010 DOI: 10.1039/b919039b Structure of the gas-phase glycine tripeptide Dimitrios Toroz and Tanja van Mourik, Phys. Chem. Chem. Phys., 2010 DOI: 10.1039/b921897a Photodetachment of tryptophan anion: an optical probe of remote electron Isabelle Compagnon, Abdul-Rahman Allouche, Franck Bertorelle, Rodolphe Antoine and Philippe Dugourd, Phys. Chem. Chem. Phys., 2010 DOI: 10.1039/b922514p A natural missing link between activated and downhill protein folding scenarios Feng Liu, Caroline Maynard, Gregory Scott, Artem Melnykov, Kathleen B. Hall and Martin Gruebele, Phys. Chem. Chem. Phys., 2010 DOI: 10.1039/b925033f Vibrational signatures of metal-chelated monosaccharide epimers: gas-phase infrared spectroscopy of Rb + -tagged glucuronic and iduronic acid Emilio B. Cagmat, Jan Szczepanski, Wright L. Pearson, David H. Powell, John R. Eyler and Nick C. Polfer, Phys. Chem. Chem. Phys., 2010 DOI: 10.1039/b924027f Stepwise hydration and evaporation of adenosine monophosphate nucleotide anions: a multiscale theoretical study F. Calvo and J. Douady, Phys. Chem. Chem. Phys., 2010 DOI: 10.1039/b923972c Reference MP2/CBS and CCSD(T) quantum-chemical calculations on stacked adenine dimers. Comparison with DFT-D, MP2.5, SCS(MI)-MP2, M06-2X, CBS(SCS-D) and force field descriptions Claudio A. Morgado, Petr Jure ka, Daniel Svozil, Pavel Hobza and Jiří Šponer, Phys. Chem. Chem. Phys., 2010 DOI: 10.1039/b924461a Photoelectron spectroscopy of homogeneous nucleic acid base dimer anions Yeon Jae Ko, Haopeng Wang, Rui Cao, Dunja Radisic, Soren N. Eustis, Sarah T. Stokes, Svetlana Lyapustina, Shan Xi Tian and Kit H. Bowen, Phys. Chem. Chem. Phys., 2010 DOI: 10.1039/b924950h Sugar–salt and sugar–salt–water complexes: structure and dynamics of glucose–KNO 3 –(H 2 O) n Madeleine Pincu, Brina Brauer, Robert Benny Gerber and Victoria Buch, Phys. Chem. Chem. Phys., 2010 DOI: 10.1039/b925797g Hydration of nucleic acid bases: a Car–Parrinello molecular dynamics approach Al ona Furmanchuk, Olexandr Isayev, Oleg V. Shishkin, Leonid Gorb and Jerzy Leszczynski, Phys. Chem. Chem. Phys., 2010 DOI: 10.1039/b923930h Conformations and vibrational spectra of a model tripeptide: change of secondary structure upon micro- solvation Hui Zhu, Martine Blom, Isabel Compagnon, Anouk M. Rijs, Santanu Roy, Gert von Helden and Burkhard Schmidt, Phys. Chem. Chem. Phys., 2010 DOI: 10.1039/b926413b Peptide fragmentation by keV ion-induced dissociation Sadia Bari, Ronnie Hoekstra and Thomas Schlathölter, Phys. Chem. Chem. Phys., 2010 DOI: 10.1039/b924145k Structural, energetic and dynamical properties of sodiated oligoglycines: relevance of a polarizable force field David Semrouni, Gilles Ohanessian and Carine Clavaguéra, Phys. Chem. Chem. Phys., 2010 DOI: 10.1039/b924317h
Transcript of This paper is published as part of a PCCP themed issue ...devries/groupsite/pub/guanine...

This paper is published as part of a PCCP themed issue series on biophysics and biophysical chemistry: Biomolecular Structures: From Isolated Molecules to Living Cells Guest Editors: Seong Keun Kim,
Jean-Pierre Schermann and Taekjip Ha
Editorial
Biomolecular Structures: From Isolated Molecules to the Cell Crowded Medium Seong Keun Kim, Jean-Pierre Schermann, Taekjip Ha, Phys. Chem. Chem. Phys., 2010 DOI: 10.1039/c004156b
Perspectives
Theoretical spectroscopy of floppy peptides at room temperature. A DFTMD perspective: gas and aqueous phase Marie-Pierre Gaigeot, Phys. Chem. Chem. Phys., 2010 DOI: 10.1039/b924048a
Communications
Dynamics of heparan sulfate explored by neutron scattering Marion Jasnin, Lambert van Eijck, Michael Marek Koza, Judith Peters, Cédric Laguri, Hugues Lortat-Jacob and Giuseppe Zaccai, Phys. Chem. Chem. Phys., 2010 DOI: 10.1039/b923878f
Papers
Infrared multiple photon dissociation spectroscopy of cationized methionine: effects of alkali-metal cation size on gas-phase conformation Damon R. Carl, Theresa E. Cooper, Jos Oomens, Jeff D. Steill and P. B. Armentrout, Phys. Chem. Chem. Phys., 2010 DOI: 10.1039/b919039b
Structure of the gas-phase glycine tripeptide Dimitrios Toroz and Tanja van Mourik, Phys. Chem. Chem. Phys., 2010 DOI: 10.1039/b921897a
Photodetachment of tryptophan anion: an optical probe of remote electron Isabelle Compagnon, Abdul-Rahman Allouche, Franck Bertorelle, Rodolphe Antoine and Philippe Dugourd, Phys. Chem. Chem. Phys., 2010 DOI: 10.1039/b922514p
A natural missing link between activated and downhill protein folding scenarios Feng Liu, Caroline Maynard, Gregory Scott, Artem Melnykov, Kathleen B. Hall and Martin Gruebele, Phys. Chem. Chem. Phys., 2010 DOI: 10.1039/b925033f
Vibrational signatures of metal-chelated monosaccharide epimers: gas-phase infrared spectroscopy of Rb+-tagged glucuronic and iduronic acid Emilio B. Cagmat, Jan Szczepanski, Wright L. Pearson, David H. Powell, John R. Eyler and Nick C. Polfer, Phys. Chem. Chem. Phys., 2010 DOI: 10.1039/b924027f
Stepwise hydration and evaporation of adenosine monophosphate nucleotide anions: a multiscale theoretical study F. Calvo and J. Douady, Phys. Chem. Chem. Phys., 2010 DOI: 10.1039/b923972c
Reference MP2/CBS and CCSD(T) quantum-chemical calculations on stacked adenine dimers. Comparison with DFT-D, MP2.5, SCS(MI)-MP2, M06-2X, CBS(SCS-D) and force field descriptions Claudio A. Morgado, Petr Jure ka, Daniel Svozil, Pavel Hobza and Jiří Šponer, Phys. Chem. Chem. Phys., 2010 DOI: 10.1039/b924461a
Photoelectron spectroscopy of homogeneous nucleic acid base dimer anions Yeon Jae Ko, Haopeng Wang, Rui Cao, Dunja Radisic, Soren N. Eustis, Sarah T. Stokes, Svetlana Lyapustina, Shan Xi Tian and Kit H. Bowen, Phys. Chem. Chem. Phys., 2010 DOI: 10.1039/b924950h
Sugar–salt and sugar–salt–water complexes: structure and dynamics of glucose–KNO3–(H2O)n Madeleine Pincu, Brina Brauer, Robert Benny Gerber and Victoria Buch, Phys. Chem. Chem. Phys., 2010 DOI: 10.1039/b925797g
Hydration of nucleic acid bases: a Car–Parrinello molecular dynamics approach Al ona Furmanchuk, Olexandr Isayev, Oleg V. Shishkin, Leonid Gorb and Jerzy Leszczynski, Phys. Chem. Chem. Phys., 2010 DOI: 10.1039/b923930h
Conformations and vibrational spectra of a model tripeptide: change of secondary structure upon micro-solvation Hui Zhu, Martine Blom, Isabel Compagnon, Anouk M. Rijs, Santanu Roy, Gert von Helden and Burkhard Schmidt, Phys. Chem. Chem. Phys., 2010 DOI: 10.1039/b926413b
Peptide fragmentation by keV ion-induced dissociation Sadia Bari, Ronnie Hoekstra and Thomas Schlathölter, Phys. Chem. Chem. Phys., 2010 DOI: 10.1039/b924145k
Structural, energetic and dynamical properties of sodiated oligoglycines: relevance of a polarizable force field David Semrouni, Gilles Ohanessian and Carine Clavaguéra, Phys. Chem. Chem. Phys., 2010 DOI: 10.1039/b924317h

Studying the stoichiometries of membrane proteins by mass spectrometry: microbial rhodopsins and a potassium ion channel Jan Hoffmann, Lubica Aslimovska, Christian Bamann, Clemens Glaubitz, Ernst Bamberg and Bernd Brutschy, Phys. Chem. Chem. Phys., 2010 DOI: 10.1039/b924630d
Sub-microsecond photodissociation pathways of gas phase adenosine 5 -monophosphate nucleotide ions G. Aravind, R. Antoine, B. Klærke, J. Lemoine, A. Racaud, D. B. Rahbek, J. Rajput, P. Dugourd and L. H. Andersen, Phys. Chem. Chem. Phys., 2010 DOI: 10.1039/b921038e
DFT-MD and vibrational anharmonicities of a phosphorylated amino acid. Success and failure Alvaro Cimas and Marie-Pierre Gaigeot, Phys. Chem. Chem. Phys., 2010 DOI: 10.1039/b924025j
Infrared vibrational spectra as a structural probe of gaseous ions formed by caffeine and theophylline Richard A. Marta, Ronghu Wu, Kris R. Eldridge, Jonathan K. Martens and Terry B. McMahon, Phys. Chem. Chem. Phys., 2010 DOI: 10.1039/b921102k
Laser spectroscopic study on (dibenzo-24-crown-8-ether)–water and –methanol complexes in supersonic jets Satoshi Kokubu, Ryoji Kusaka, Yoshiya Inokuchi, Takeharu Haino and Takayuki Ebata, Phys. Chem. Chem. Phys., 2010 DOI: 10.1039/b924822f
Macromolecular crowding induces polypeptide compaction and decreases folding cooperativity Douglas Tsao and Nikolay V. Dokholyan, Phys. Chem. Chem. Phys., 2010 DOI: 10.1039/b924236h
Electronic coupling between cytosine bases in DNA single strands and i-motifs revealed from synchrotron radiation circular dichroism experiments Anne I. S. Holm, Lisbeth M. Nielsen, Bern Kohler, Søren Vrønning Hoffmann and Steen Brøndsted Nielsen, Phys. Chem. Chem. Phys., 2010 DOI: 10.1039/b924076d
Photoionization of 2-pyridone and 2-hydroxypyridine J. C. Poully, J. P. Schermann, N. Nieuwjaer, F. Lecomte, G. Grégoire, C. Desfrançois, G. A. Garcia, L. Nahon, D. Nandi, L. Poisson and M. Hochlaf, Phys. Chem. Chem. Phys., 2010 DOI: 10.1039/b923630a
Insulin dimer dissociation and unfolding revealed by amide I two-dimensional infrared spectroscopy Ziad Ganim, Kevin C. Jones and Andrei Tokmakoff, Phys. Chem. Chem. Phys., 2010 DOI: 10.1039/b923515a
Six conformers of neutral aspartic acid identified in the gas phase M. Eugenia Sanz, Juan C. López and José L. Alonso, Phys. Chem. Chem. Phys., 2010 DOI: 10.1039/b926520a
Binding a heparin derived disaccharide to defensin inspired peptides: insights to antimicrobial inhibition from gas-phase measurements Bryan J. McCullough, Jason M. Kalapothakis, Wutharath Chin, Karen Taylor, David J. Clarke, Hayden Eastwood, Dominic Campopiano, Derek MacMillan, Julia Dorin and Perdita E. Barran, Phys. Chem. Chem. Phys., 2010 DOI: 10.1039/b923784d
Guanine–aspartic acid interactions probed with IR–UV resonance spectroscopy Bridgit O. Crews, Ali Abo-Riziq, Kristýna Pluhá ková, Patrina Thompson, Glake Hill, Pavel Hobza and Mattanjah S. de Vries, Phys. Chem. Chem. Phys., 2010 DOI: 10.1039/b925340h
Investigations of the water clusters of the protected amino acid Ac-Phe-OMe by applying IR/UV double resonance spectroscopy: microsolvation of the backbone Holger Fricke, Kirsten Schwing, Andreas Gerlach, Claus Unterberg and Markus Gerhards, Phys. Chem. Chem. Phys., 2010 DOI: 10.1039/c000424c
Probing the specific interactions and structures of gas-phase vancomycin antibiotics with cell-wall precursor through IRMPD spectroscopy Jean Christophe Poully, Frédéric Lecomte, Nicolas Nieuwjaer, Bruno Manil, Jean Pierre Schermann, Charles Desfrançois, Florent Calvo and Gilles Grégoire, Phys. Chem. Chem. Phys., 2010 DOI: 10.1039/b923787a
Two-dimensional network stability of nucleobases and amino acids on graphite under ambient conditions: adenine, L-serine and L-tyrosine Ilko Bald, Sigrid Weigelt, Xiaojing Ma, Pengyang Xie, Ramesh Subramani, Mingdong Dong, Chen Wang, Wael Mamdouh, Jianguo Wang and Flemming Besenbacher, Phys. Chem. Chem. Phys., 2010 DOI: 10.1039/b924098e
Importance of loop dynamics in the neocarzinostatin chromophore binding and release mechanisms Bing Wang and Kenneth M. Merz Jr., Phys. Chem. Chem. Phys., 2010 DOI: 10.1039/b924951f
Structural diversity of dimers of the Alzheimer Amyloid-(25-35) peptide and polymorphism of the resulting fibrils Joan-Emma Shea, Andrew I. Jewett, Guanghong Wei, Phys. Chem. Chem. Phys., 2010 DOI: 10.1039/c000755m

Guanine–aspartic acid interactions probed with IR–UV resonance
spectroscopyw
Bridgit O. Crews,a Ali Abo-Riziq,a Kristyna Pluhackova,b Patrina Thompson,c
Glake Hill,cPavel Hobza
bdand Mattanjah S. de Vries*
a
Received 1st December 2009, Accepted 26th February 2010
First published as an Advance Article on the web 8th March 2010
DOI: 10.1039/b925340h
Double resonance spectroscopy of clusters of guanine with aspartic acid reveals geometries similar
to patterns exhibited in DNA base pairs. In the spectral region of 32 800 cm�1 to 35 500 cm�1
we observe five isomers of guanine–aspartic acid clusters and assign their structures based on
IR–UV hole-burning spectra and wave function theory calculations at the MP2/cc-pVDZ and
MP2/cc-pVTZ levels. The calculations employed both harmonic and one-dimensional scan
anharmonic approximations. Three of the isomers are similar, assigned to structures containing
three hydrogen bonds and 9-enolguanine. We assign the fourth isomer to a structure containing a
9-keto tautomer of guanine and forming a triply bonded structure similar to a base pairing
interaction. The fifth isomer dissociates with proton transfer upon excitation or ionization. This is
the first set of experiments and high-level ab initio calculations of the isolated, microscopic
interactions of an amino acid and a nucleobase, the building blocks of nucleic acids and proteins.
Introduction
The details of the interactions between proteins and DNA and
the resulting recognition mechanisms are not understood in
detail at the molecular level. The non-covalent forces that
appear to govern such interactions are weak, and yet binding
to certain sequences can be very specific. In fact, binding to
specific sites can sometimes be orders of magnitude stronger
than binding to random sites. The interaction between
proteins and RNA is even more complex and less well understood
because of the many structural motifs that RNA can adopt.
Recognition can employ a combination of ‘‘direct readout’’—
involving functional groups, exposed in the major groove—or
‘‘indirect readout’’ influenced by structural differences between
sequences.1–3
Although the complex of guanine with aspartic acid (Asp)
might seem to be small or artificial in fact it is a real model
system of interactions between a base pair and an amino acid.
Both guanine and aspartic acid can be part of much larger
system but still remain in the same structural complex with
each other. We have found isomers in which aspartic acid
binds to the Watson–Crick edge of guanine while the terminal
COOH and NH2 groups of aspartic acid remain available to
form peptide bonds with other amino acids. This is possible
because only the CQO part of the C-terminus COOH group
participates in hydrogen bonding to guanine while the most
important binding group appears to be the COOH group in
the side-chain. In the protein data bank (www.pdb.org) there
are 2318 structures containing a protein and a nucleic acid.
Among these there are 208 contacts between guanine and
aspartic acid within 3 A. 47.1% of these contacts are between
aspartic acid and phosphate groups; in 34.6% cases Asp is
bound to the Watson–Crick edge of guanine, 11.5% of the
Asp is in contact with a sugar, 5.3% of Asp are bound to the
sugar edge of guanine, 1% to the Hoogsteen edge of guanine
and 0.5% are in a stacked orientation with guanine.
When calculating frequencies, the complex of guanine with
aspartic acid needs to be treated in an anharmonic way
because as we have found for guanine,4 distinguishing among
the tautomers is impossible with the harmonic approximation.
The same is true for the guanine–cytosine base pair where the
three hydrogen bonds exhibit strongly anharmonic character.5
Generally, rotational spectroscopic techniques provide spectra
that are very difficult to unravel for larger systems and
vibrational spectroscopic techniques do not usually provide
enough structural information. Problems arise from nonlinear
dependence of the complexity of the molecular dynamical
problems on the number of actual vibrational degrees of
freedom and from conformational complexity. A popular
way of overcoming these problems is empirical scaling of the
calculated harmonic frequencies. However, in the case of
vibrational motions opposed by strongly anharmonic potentials
(motions involved in hydrogen bonding) the approach is no
longer reliable.6 A possible solution is an adiabatic separation
of the probing molecular modes. Being only few dimensional
the resulting dynamical problems are tractable in a numerically
exact way for practically any shape of the corresponding
effective potentials.7
aDepartment of Chemistry and Biochemistry, University of CaliforniaSanta Barbara, CA 93106-9510, USA.E-mail: [email protected]
b Institute of Organic Chemistry and Biochemistry, Academy ofSciences of the Czech Republic and Center for Biomolecules andComplex Molecular Systems, Flemingovo nam. 2, 160 10 Prague 6,Czech Republic
c Department of Chemistry, Jackson State University,Jackson MS 39217-0510, USA
dDepartment of Physical Chemistry, Palacky University,771 46 Olomouc, Czech Republic
w Electronic supplementary information (ESI) available: Fig. S1–S3.See DOI: 10.1039/b925340h
This journal is �c the Owner Societies 2010 Phys. Chem. Chem. Phys., 2010, 12, 3597–3605 | 3597
PAPER www.rsc.org/pccp | Physical Chemistry Chemical Physics

Our current observations suggest that molecules other than
nucleobases, such as amino acids, may also affect the excited
state potential energy surface of the guanine nucleobase by
clustering in geometries very similar to the geometry exhibited
in base pairing. The fact that amino acids form complexes with
guanine in base pair like structural motifs also highlights the
idea that these interactions may serve to distinguish among
bases in protein–nucleic acid interactions.2,8
Experimental method
The experimental set-up is described in detail elsewhere.9 We
laser desorb a mixture of pure compound from a graphite
substrate with a Nd:YAG laser (1064 nm, B10 ns pulse
duration, less than 1 mJ/pulse), after which the molecules
become entrained into a pulsed supersonic jet of argon
(backing pressure 6 atm). Using mass-selected spectroscopy
we measure resonant two-photon ionization spectra (R2PI) by
detecting positive ions in a reflectron time-of-flight mass
spectrometer. In UV–UV double resonance experiments, two
laser pulses are separated in time by 200 ns. Ionization laser
intensities are approximately 3 mJ/pulse and are attenuated to
avoid saturation. The first pulse serves as a ‘‘burn’’ pulse,
which removes ground state population and causes depletion
in the ion signal of the second ‘‘probe’’ pulse provided both
lasers are tuned to a resonance of the same isomer. In IR–UV
double resonance spectra the burn laser operates in the
near-IR region. IR frequencies ranging from 3100 cm�1 to
3800 cm�1 are produced in an OPO setup (LaserVision)
pumped by a Nd:YAG laser operating at its fundamental
frequency.10,11 Typical IR intensities in the burn region are
8–10 mJ pulse�1 with a bandwidth of 3 cm�1. The resulting
ion-dip spectra are ground-state IR spectra that are
optically selected by means of the probe laser R2PI wave-
length and mass selected by virtue of the mass spectrometer
detection.
Theoretical method
We model candidate structures for higher level calculations
using the AMBER force field and perform simulated annealing
as implemented in the Amber 7 program suite.12,13 To create
isolated gas-phase aspartic acid we started with a non-hydrogen
bound form of aspartic acid, then modified the default
zwitterionic amino and carboxylic termini to their neutral
(gas-phase) forms, and generated new charges using antechamber.
For the naming of the clusters we have tried to remain
consistent with that previously published on the structure of
the isolated nucleobase guanine.14 Keto clusters refer to any
cluster in which guanine is in its ‘keto’ form, identified by a
keto oxygen on carbon ‘‘6’’ of the purine ring structure. Enol
structures refer to clusters in which guanine is in its ‘enol’
form, identified by an hydroxyl group on carbon ‘‘6’’ of the
purine ring structure, and ‘oxo-imino’ forms are identified by a
keto oxygen on carbon ‘‘6’’ of the purine ring structure
combined with an imino nitrogen group on carbon ‘‘2’’ of
the purine ring structure. The number which precedes the keto,
enol, or oxo-imino refers to the placement of the mobile
protons which attach to different atoms of the purine ring
structure to form the multiple tautomers of guanine. The
clusters we describe in most detail in the following discussion
involve the 7,9-keto and 7,9-enol tautomers of guanine. These
are clusters in which guanine is in the keto or enol form and a
mobile proton is attached to either nitrogen ‘‘7’’ or nitrogen
‘‘9’’ of the purine ring structure.
We ran clusters of guanine–aspartic acid with guanine in
each of its five lowest energy forms: 7, 9-keto, 7, 9-enol and
7-oxo-imino. We performed simulated annealing by running at
a high temperature (800 K) for 30 ps followed by 10 ps of
stepwise cooling and energy minimization. We imposed a
distance restraint between guanine and aspartic acid during
simulated annealing and removed it during energy minimization.
The location of the restraint was varied in three rounds of
annealing with 500 iterations of heating and stepwise cooling.
We sorted the resulting structures according to energy, then
optimized and calculated theoretical harmonic frequencies for
unique structures. The resulting structures were re-optimized
using B3LYP/6-31G to weed out high energy structures and
minimize the number of structures to be calculated at a
higher basis set; however, we found that guanine tautomerizes
from enol to keto forms in this basis. When we ran
identical structures in the 6-31+G* basis set, the enol forms
did not tautomerize into the keto forms. We calculated
B3LYP/6-31+G* energies and harmonic frequencies for
approximately 30 clusters of each tautomer of guanine.
Because the calculation of the spectra must be done with the
best possible geometries and most accurate method for
comparison with the experimental data we re-optimized
the lowest energy B3LYP structures by means of the
MP2/cc-pVTZmethod.15,16 According to our previous experience
this is the most suitable approach for hydrogen bonded as well
as for stacked complexes of this size. We used the resolution
of identity approximation for all MP2 calculations.17 Each
MP2/cc-pVTZ structure was then re-optimized using the
MP2/cc-pVDZ method with tough convergence criteria
(TURBOMOLE convergence criteria were set as scfconv
o1e�8, denconv o1e�8 and gcart = 4) so that the structures
were optimally minimized and frequency analysis could be
done at the same level of theory. In addition to calculating
interaction energies and interaction enthalpies at MP2/cc-pVDZ
and MP2/cc-pVTZ levels we also included unscaled zero-point
vibration energies (ZPVE) at the cc-pVDZ level of theory from
harmonic vibrational frequency calculations and evaluated
interaction and relative interaction enthalpies at both levels
of theory.
For calculation of harmonic vibrational frequencies and IR
spectra we used method NumForce as implemented in the
TURBOMOLE 5.8 package program.18 This method is based
on knowledge of the molecular Hessian, matrix of second
derivatives of total energies. Because very fast tautomerization
processes exist in the complex we were interested in the
anharmonicity of the individual vibrational modes. Therefore
we also calculated one-dimensional anharmonic Hamiltonians
and potential energy functions evaluated by means of the
MP2/cc-PVDZ method. A typical stretch grid was constructed
in the following way: hydrogen bonds were shortened by up to
0.25 A with 0.025 A steps and elongated by 1 A with 0.05 A
steps up to 2 A. This approach allowed good sampling of the
3598 | Phys. Chem. Chem. Phys., 2010, 12, 3597–3605 This journal is �c the Owner Societies 2010

potential in all regions and smoothing by fitting to poly-
nomials expressed in terms of the Morse variable y.
y = 1 � e�a(R–Re)
Here a is a free parameter and R and Re are the actual and
equilibrium bond length, respectively.
The methodology for assigning spectra was as follows. First
we calculated unscaled MP2/cc-pVDZ infrared spectra using a
harmonic approximation for all complexes, for keto and enol
forms of guanine and for normal and protonated aspartic acid.
Next we calculated one-dimensional potential energy scans of
relevant hydrogens for protonated aspartic acid and for the
most stable complexes in each of four structural groups: two
keto and two enol complexes, each time one being triply and
one doubly hydrogen bonded. After fitting these scans we
obtained both harmonic and anharmonic frequencies of
these vibrations. By comparing harmonic frequencies from
one-dimensional scans and standard harmonic spectra we
concluded how much each individual mode is coupled with
other modes in the molecule. After comparing the harmonic
and anhamormonic frequencies we obtained the amount of
anharmonicity in each mode and calculated suitable scaling
factors for each vibration. These we then applied to standard
harmonic spectra. The resulting spectra therefore account for
both anharmonicity and mode coupling. The intensities were
taken directly from standard harmonic spectra because
they are not as strongly influenced by anharmonicity as the
vibrational frequencies themselves. Finally the spectra were
compared to the experimental ones and if needed shifted by a
constant to minimize the differences.
Results and discussion
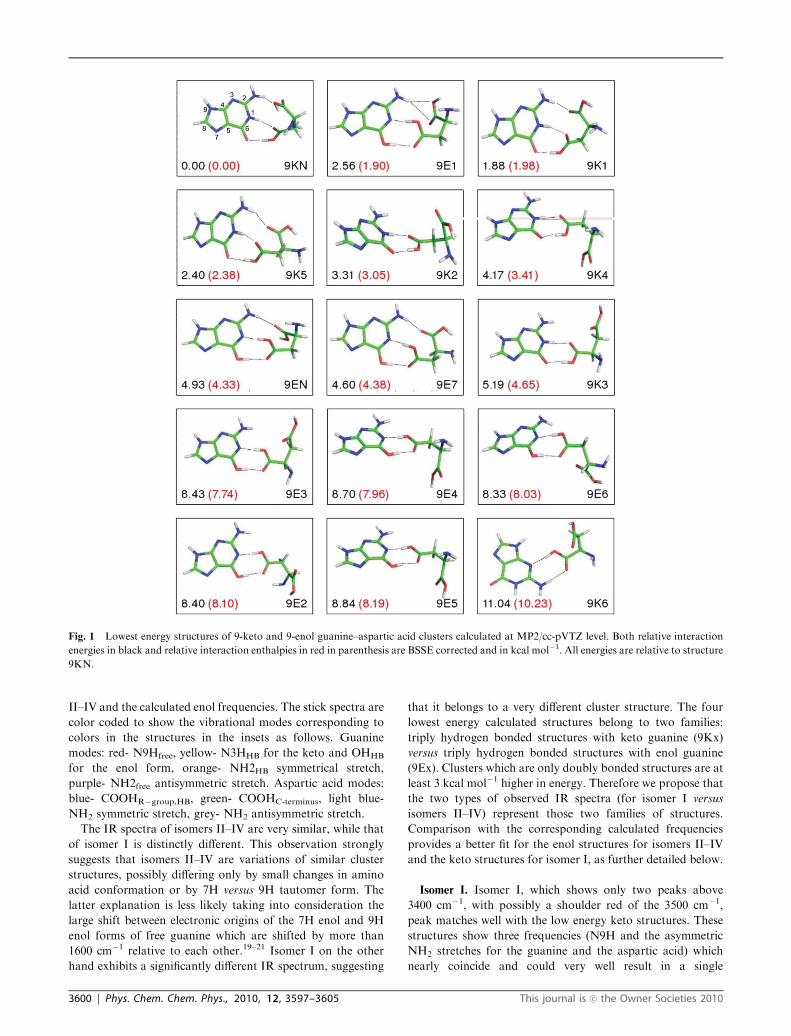
Calculated structures
Fig. 1 shows the lowest energy structures found at the
MP2/cc-pVTZ level for the clusters involving 9-keto and
9-enol tautomers of guanine. The calculations at B3LYP/
6-31+G* level predicted a very similar set of structures for
the clusters with 7-keto and 7-enol tautomers; however, in
every case 7-keto containing structures are 2–3 kcal mol�1
higher in energy than their analogous 9-keto counterparts with
virtually indistinguishable theoretical IR, the 7-enol tautomers
being even higher in energy than 7-keto tautomers. For these
reasons we show the structures and theoretical IR only for
9-keto structures. The B3LYP calculations also predict that
clusters containing oxo-imino tautomers of guanine are more
than 8 kcal mol�1 higher in energy than clusters containing
keto tautomers. Additionally, IR frequencies of clusters
involving oxo-imino tautomers do not match any of the
experimental IR spectra.
The structures in Fig. 1 are labeled according to tautomeric
form and relative energy calculated at the B3LYP/6-31+G*
level. 9E1 is the lowest energy cluster found with guanine in
9-enol form, 9K2 is the second lowest energy cluster found for
guanine in 9-keto form, etc. Structures 9EN and 9KN were
not predicted by B3LYP/6-31+G* to be in the set of the most
stable structures but they appeared after re-optimization at the
MP2/cc-pVTZ level of theory, whereby the 9KN structure
emerged as the global minimum. Relative interaction electronic
energies and enthalpies (in parentheses) are given in kcal mol�1
and are relative to the lowest energy cluster we found,
9KN. The lowest energy structure contains 9-keto guanine in
a ‘base pairing’ type configuration in which aspartic acid binds
to the base pairing site of guanine through three hydrogen
bonds. 9K1 and 9K5 have a similar type of interaction, slightly
higher in energy by 1.88 and 2.40 kcal mol�1, respectively. The
9-enol guanine structures 9EN and 9E7 are analogous but
higher in energy by 4.93 and 4.60 kcal mol�1, respectively.
Structure 9E1 exhibits a bifurcated hydrogen bond between
both oxygens of the COOH group of aspartic acid and
hydrogen in the NH2 group of guanine. This structure is
only 2.56 kcal mol�1 higher in energy than the most stable
structure, 9KN. However, this binding motif is quite unique
for the isolated molecules because when aspartic acid is part of
a protein the COOH group is part of a peptide bond and it is
likely that this type of interaction cannot occur. Complexes
with two H-bonds are less stable than complexes with three
H-bonds and the 9-keto complexes generally are lower in
energy than 9-enol complexes. Structure 9K6 is shown for
comparison as it presents the only structure where aspartic
acid is bonded to the sugar edge of guanine. However this
complex has only two H-bonds and is 11.04 kcal mol�1 higher
in energy. All of the clusters involve hydrogen bonds with the
side-chain of aspartic acid.
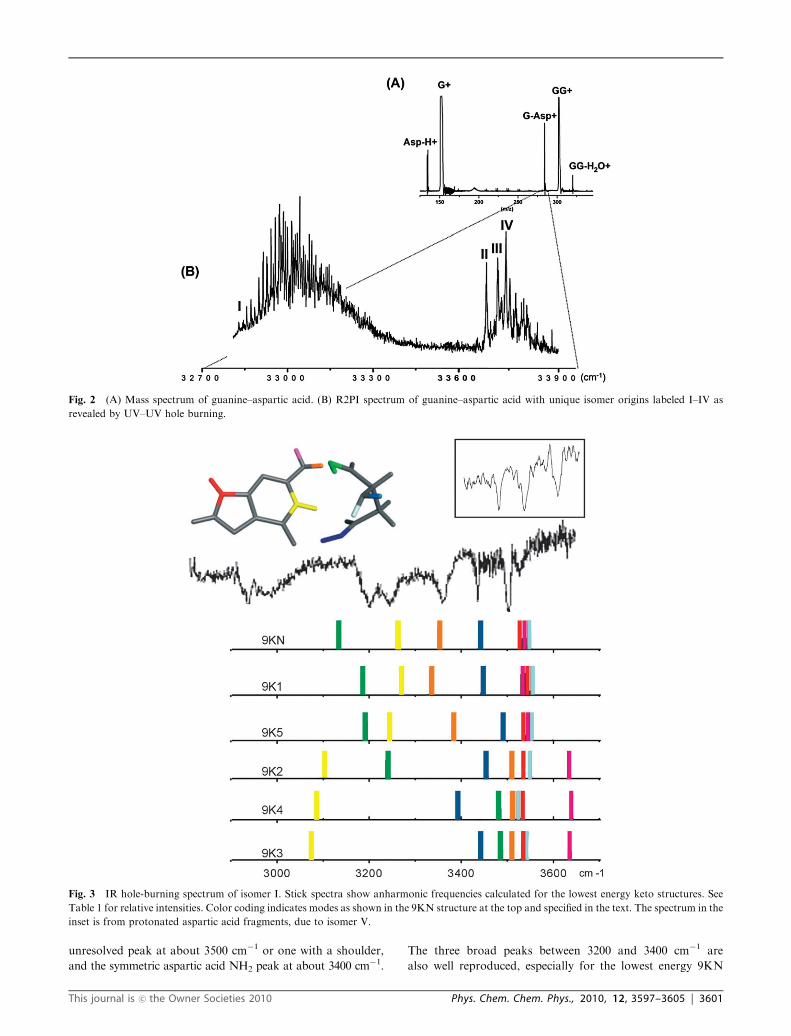
UV spectra
Fig. 2 shows the mass spectrum and the R2PI spectrum from
32 800 cm�1 to 33 900 cm�1. Upon scanning to 35 500 cm�1 we
observed no additional peaks. We performed UV–UV double
resonance spectroscopy to determine that the R2PI spectrum
consists of four isomers. The origins of these isomers are
labeled I–IV in Fig. 2. The R2PI spectrum of isomer I is much
broader than those of isomers II–IV and red-shifted by almost
1000 cm�1 relative to isomers II–IV. Because the R2PI spectrum
of isomer I is broad, without the sharp peaks exhibited
by isomers II–IV, we cannot exclude that this part of the
spectrum consists of overlapping contributions from more
than one isomer, as will be discussed below.
We also observe a peak for protonated aspartic acid in the
mass spectrum. Since aspartic acid does not absorb at any of
the UV wavelengths in these experiments, the only possibility
is that this peak arises from an excited or ionized guanine–
aspartic acid cluster that undergoes proton transfer and
dissociation to form protonated aspartic acid. This cluster
corresponds to isomer V as determined by double resonance
spectroscopy, described below.
IR spectra
Figs. 3 and 4 show the experimental IR–UV hole-burning
spectra in comparison with calculated anharmonic frequencies,
displayed as stick spectra. In both figures the calculated spectra
are ordered from top to bottom according to increasing relative
energy of their respective structures. The relative calculated
intensities appear in Table 1. Fig. 3 shows the experimental
data for isomer I together with the calculated frequencies for
the keto structures, while Fig. 4 shows the data for isomers
This journal is �c the Owner Societies 2010 Phys. Chem. Chem. Phys., 2010, 12, 3597–3605 | 3599
II–IV and the calculated enol frequencies. The stick spectra are
color coded to show the vibrational modes corresponding to
colors in the structures in the insets as follows. Guanine
modes: red- N9Hfree, yellow- N3HHB for the keto and OHHB
for the enol form, orange- NH2HB symmetrical stretch,
purple- NH2free antisymmetric stretch. Aspartic acid modes:
blue- COOHR�group,HB, green- COOHC-terminus, light blue-
NH2 symmetric stretch, grey- NH2 antisymmetric stretch.
The IR spectra of isomers II–IV are very similar, while that
of isomer I is distinctly different. This observation strongly
suggests that isomers II–IV are variations of similar cluster
structures, possibly differing only by small changes in amino
acid conformation or by 7H versus 9H tautomer form. The
latter explanation is less likely taking into consideration the
large shift between electronic origins of the 7H enol and 9H
enol forms of free guanine which are shifted by more than
1600 cm�1 relative to each other.19–21 Isomer I on the other
hand exhibits a significantly different IR spectrum, suggesting
that it belongs to a very different cluster structure. The four
lowest energy calculated structures belong to two families:
triply hydrogen bonded structures with keto guanine (9Kx)
versus triply hydrogen bonded structures with enol guanine
(9Ex). Clusters which are only doubly bonded structures are at
least 3 kcal mol�1 higher in energy. Therefore we propose that
the two types of observed IR spectra (for isomer I versus
isomers II–IV) represent those two families of structures.
Comparison with the corresponding calculated frequencies
provides a better fit for the enol structures for isomers II–IV
and the keto structures for isomer I, as further detailed below.
Isomer I. Isomer I, which shows only two peaks above
3400 cm�1, with possibly a shoulder red of the 3500 cm�1,
peak matches well with the low energy keto structures. These
structures show three frequencies (N9H and the asymmetric
NH2 stretches for the guanine and the aspartic acid) which
nearly coincide and could very well result in a single
Fig. 1 Lowest energy structures of 9-keto and 9-enol guanine–aspartic acid clusters calculated at MP2/cc-pVTZ level. Both relative interaction
energies in black and relative interaction enthalpies in red in parenthesis are BSSE corrected and in kcal mol�1. All energies are relative to structure
9KN.
3600 | Phys. Chem. Chem. Phys., 2010, 12, 3597–3605 This journal is �c the Owner Societies 2010
unresolved peak at about 3500 cm�1 or one with a shoulder,
and the symmetric aspartic acid NH2 peak at about 3400 cm�1.
The three broad peaks between 3200 and 3400 cm�1 are
also well reproduced, especially for the lowest energy 9KN
Fig. 2 (A) Mass spectrum of guanine–aspartic acid. (B) R2PI spectrum of guanine–aspartic acid with unique isomer origins labeled I–IV as
revealed by UV–UV hole burning.
Fig. 3 IR hole-burning spectrum of isomer I. Stick spectra show anharmonic frequencies calculated for the lowest energy keto structures. See
Table 1 for relative intensities. Color coding indicates modes as shown in the 9KN structure at the top and specified in the text. The spectrum in the
inset is from protonated aspartic acid fragments, due to isomer V.
This journal is �c the Owner Societies 2010 Phys. Chem. Chem. Phys., 2010, 12, 3597–3605 | 3601

structure. Once again the R group carbonyl would be red-
shifted outside the experimental window. This leaves the broad
peaks around 3000 cm�1 unassigned. One possibility is that
this peak corresponds to the hydrogen bound COOH group of
aspartic acid, which is predicted by harmonic approximation
to be at 2833 cm�1. As noted before it is quite possible that
multiple related structures overlap in this UV region that
cannot be separated by the probe laser due to the broad UV
spectrum. Once again, the 7H analogous structures would
produce similar IR signatures. They would be slightly higher
in energy and, especially given the broad UV spectrum for this
isomer (or family of isomers) they may be present as well.
Isomers II–IV. The IR spectra of isomers II–IV are
characterized by five peaks in the range of 3400–3600 cm�1
with an additional two broad peaks between 2800 cm�1 and
3100 cm�1. This pattern is very well reproduced by the enol
structures, particularly two of the three lowest energy ones,
9E1 and 9E7. 9E3 shows an unlikely fit to the experimental
data, both in absolute frequency and spacing. 9EN is similar
but the C terminus OH mode is not shifted as much as in the
other two cases, presumably because it is hydrogen bonding
less with the N terminus. This OH mode interacts with the
electron pair N-terminus nitrogen and this small hydrogen
bonding interaction modifies both the OH and the NH2
frequencies involved. The three lowest energy enol structures
differ mostly in the conformation of the C terminus which
would be expressed in subtle shifts in the frequencies of those
two modes. The top two experimental traces in Fig. 4 are very
similar while the NH2 is slightly blue-shifted in the bottom
trace. In all enol structures the R group carbonyl, where the
R group corresponds to the side-chain of aspartic acid, is
engaged in strong hydrogen bonding with the guanine and red-
shifted to below 2000 cm�1, outside the experimental range.
The 7H analogous structures would be slightly higher in energy
and would produce essentially the same IR signatures, however
by analogy with the monomer guanine spectrum we would
expect them to be significantly shifted in the UV. If this
analysis is correct they may still remain to be observed at a
different UV wavelength range.
Isomer V. Fig. 3 and 4 show in an inset at the top the IR–UV
hole-burning spectrum measured at the mass of protonated
aspartic acid (Asp-H+). Since this species does not absorb in
the given UV range it has to be a cluster fragment, formed
either in the excited state or in the ionic state. Therefore this
IR spectrum must belong to the originating cluster. Since
additional free IR bands would appear in the IR spectrum if
Asp-H+ originated from a more complex cluster, it is unlikely
that this peak originates from a higher order cluster, such as
guanine dimer–aspartic acid, and therefore it is likely that it is
a dissociation product of G-Asp clusters. This portion of the
Fig. 4 IR hole-burning spectrum of isomers II–IV. Stick spectra show anharmonic frequencies calculated for the lowest energy enol structures.
See Table 1 for relative intensities. Color coding indicates modes as shown in the 9EN structure at the top and specified in the text. The spectrum in
the inset is from protonated aspartic acid fragments, due to isomer V.
3602 | Phys. Chem. Chem. Phys., 2010, 12, 3597–3605 This journal is �c the Owner Societies 2010
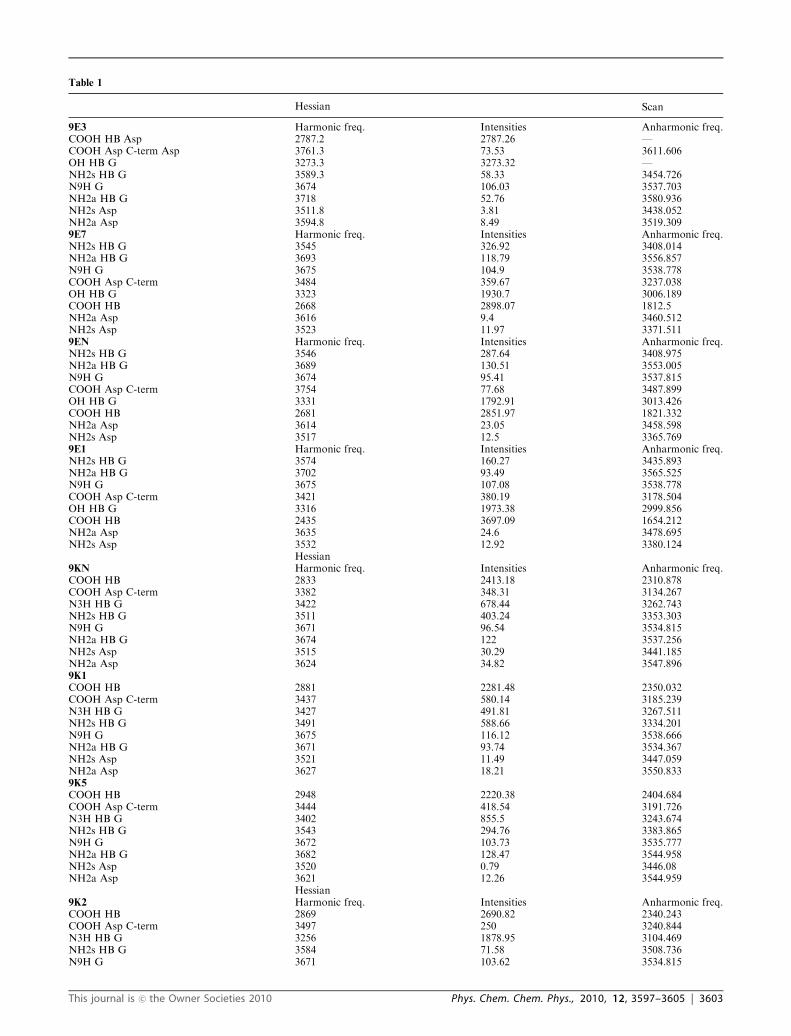
Table 1
Hessian Scan
9E3 Harmonic freq. Intensities Anharmonic freq.COOH HB Asp 2787.2 2787.26 —COOH Asp C-term Asp 3761.3 73.53 3611.606OH HB G 3273.3 3273.32 —NH2s HB G 3589.3 58.33 3454.726N9H G 3674 106.03 3537.703NH2a HB G 3718 52.76 3580.936NH2s Asp 3511.8 3.81 3438.052NH2a Asp 3594.8 8.49 3519.3099E7 Harmonic freq. Intensities Anharmonic freq.NH2s HB G 3545 326.92 3408.014NH2a HB G 3693 118.79 3556.857N9H G 3675 104.9 3538.778COOH Asp C-term 3484 359.67 3237.038OH HB G 3323 1930.7 3006.189COOH HB 2668 2898.07 1812.5NH2a Asp 3616 9.4 3460.512NH2s Asp 3523 11.97 3371.5119EN Harmonic freq. Intensities Anharmonic freq.NH2s HB G 3546 287.64 3408.975NH2a HB G 3689 130.51 3553.005N9H G 3674 95.41 3537.815COOH Asp C-term 3754 77.68 3487.899OH HB G 3331 1792.91 3013.426COOH HB 2681 2851.97 1821.332NH2a Asp 3614 23.05 3458.598NH2s Asp 3517 12.5 3365.7699E1 Harmonic freq. Intensities Anharmonic freq.NH2s HB G 3574 160.27 3435.893NH2a HB G 3702 93.49 3565.525N9H G 3675 107.08 3538.778COOH Asp C-term 3421 380.19 3178.504OH HB G 3316 1973.38 2999.856COOH HB 2435 3697.09 1654.212NH2a Asp 3635 24.6 3478.695NH2s Asp 3532 12.92 3380.124
Hessian9KN Harmonic freq. Intensities Anharmonic freq.COOH HB 2833 2413.18 2310.878COOH Asp C-term 3382 348.31 3134.267N3H HB G 3422 678.44 3262.743NH2s HB G 3511 403.24 3353.303N9H G 3671 96.54 3534.815NH2a HB G 3674 122 3537.256NH2s Asp 3515 30.29 3441.185NH2a Asp 3624 34.82 3547.8969K1
COOH HB 2881 2281.48 2350.032COOH Asp C-term 3437 580.14 3185.239N3H HB G 3427 491.81 3267.511NH2s HB G 3491 588.66 3334.201N9H G 3675 116.12 3538.666NH2a HB G 3671 93.74 3534.367NH2s Asp 3521 11.49 3447.059NH2a Asp 3627 18.21 3550.8339K5
COOH HB 2948 2220.38 2404.684COOH Asp C-term 3444 418.54 3191.726N3H HB G 3402 855.5 3243.674NH2s HB G 3543 294.76 3383.865N9H G 3672 103.73 3535.777NH2a HB G 3682 128.47 3544.958NH2s Asp 3520 0.79 3446.08NH2a Asp 3621 12.26 3544.959
Hessian9K2 Harmonic freq. Intensities Anharmonic freq.COOH HB 2869 2690.82 2340.243COOH Asp C-term 3497 250 3240.844N3H HB G 3256 1878.95 3104.469NH2s HB G 3584 71.58 3508.736N9H G 3671 103.62 3534.815
This journal is �c the Owner Societies 2010 Phys. Chem. Chem. Phys., 2010, 12, 3597–3605 | 3603

IR spectrum does not match any of the other IR spectra so we
conclude that the parent cluster must be a different isomer.
Unfortunately the signal-to-noise ratio did not permit mea-
surement of a larger range of the spectrum or of a well-
resolved UV spectrum. Since spectral assignment on the basis
of three peaks is tenuous at best, identification of this fifth, UV
unstable, isomer must await additional data.
Fig. S3 of the ESIw shows one-dimensional potential hydrogen
scans of five hydrogens (COOHHB,Asp, COOHAsp–C terminus,
N9HG, N3HHB,G and NH2–s,HB,G). The colors of individual
curves correspond to those in Fig. 3. The hydrogens involved
in hydrogen bonds exhibit strongly anharmonic behavior and
cannot be correctly described by harmonic potentials. The
calculated spectra in Fig. 3 and 4 include the anharmonic
correction. An even more complete correction would require
two-dimensional scans for the NH2 group as well as inclusion
of the movement of heavy atoms along the hydrogen bond
coordinate.
Energetics alone are not enough to make an assignment, as
previously demonstrated by the lack of observation of the
lowest energy guanine monomers in R2PI experiments.22 We
do note an intriguing similarity between the origins of the
R2PI spectra of isomer I and the guanine–cytosine base pair,
suggesting that the electronic configuration of guanine is
similar in these two clusters, which we expect if the structure
and bonding pattern of guanine is very similar in the two
clusters. This observation, illustrated in Fig. 5, suggests that
guanine in isomer I has a similar electronic configuration and
structure to that of guanine in the Watson–Crick base pair
which originates from a keto tautomer, and is simulated by
9-substituted guanine and 1-substituted cytosine in place of
the DNA backbone.23,24 The spectra are similar in the
frequencies of their electronic origins. The R2PI spectra of
both guanine–aspartic acid and guanine–cytosine base pairs
begin near 32 800 cm�1 and continue as broad spectra for
several hundred wavenumbers. Guanine–aspartic acid isomers
II–IV, which are assigned as 9-enol containing tautomers and
9-enol guanine monomer have electronic origins far blue-
shifted, near 33 700 cm�1 and 34 800 cm�1, respectively. The
guanine dimer is also suspected to contain 9-keto guanine in a
similar base pairing configuration. Its R2PI spectrum is
slightly less red-shifted and not as broad; however, a lower
energy symmetric structure has, so far, not been observed in
the gas phase, presumably due to a short excited state lifetime.
Conclusion
UV and IR double-resonance spectra in the region 32 800 cm�1
to 35 500 cm�1 reveal five isomers of guanine–aspartic acid.
Guanine–aspartic acid isomer I contains three hydrogen bonds
and involves the 9-keto tautomer of guanine. The binding
motif in this complex is similar to a Watson–Crick motif seen
in the guanine–cytosine base pair. The UV spectrum of this
isomer is broad and it is possible that it consists of overlapping
spectra of a family of overlapping and very similar structures.
These additional structures could involve subtle differences in
amino acid conformations or 7H guanine tautomers. Three of
the isomers (II–IV) fit calculated structures with two hydrogen
bonds between a 9-enol tautomer of guanine and aspartic acid.
While 9-keto guanine is not observed in R2PI experiments on
guanine monomers, the electronic origin of guanine–aspartic
acid isomer I is red-shifted approximately 1000 cm�1 relative
to the three 9-enol clusters and is near the electronic origin of
previously measured 9-keto containing guanine clusters
including the Watson–Crick guanine–cytosine base pair
suggesting that this specific bonding geometry makes it possible
to observe the keto form of guanine whereas under identical
conditions free guanine is unobservable as a keto form likely
due to a shortened excited state lifetime. A fifth isomer is
observed but not assigned, as it appears as protonated aspartic
acid fragments. This is the first set of experiments and high
level ab initio calculations of the isolated, microscopic inter-
actions of an amino acid and a nucleobase, the building blocks
of nucleic acids and proteins.
Table 1 (continued )
Hessian Scan
NH2a HB G 3712 60.93 3634.048NH2s Asp 3530 38.21 3455.87NH2a Asp 3628 29.62 3551.8129K3
COOH HB 2989 1949.07 2438.127COOH Asp C-term 3762 72 3486.432N3H HB G 3224 2349.25 3073.958NH2s HB G 3585 67.32 3509.715N9H G 3671 103.3 3534.815NH2a HB G 3714 57.53 3636.006NH2s Asp 3517 4.16 3443.143NH2a Asp 3610 7.98 3534.199K4
COOH HB 2915 2491.1 2377.766COOH Asp C-term 3757 71.71 3481.799N3H HB G 3237 2111.26 3086.353NH2s HB G 3587 69.52 3511.673N9H G 3671 104.93 3534.815NH2a HB G 3717 60.8 3638.943NH2s Asp 3513 3.98 3439.227NH2a Asp 3601 10.21 3525.379
3604 | Phys. Chem. Chem. Phys., 2010, 12, 3597–3605 This journal is �c the Owner Societies 2010

Acknowledgements
This work was supported by the Ministry of Education, Youth
and Sports of the Czech Republic (Grants No. LC512 and
MSM 6198959216) and by the Grant Agency of the Academy
of Sciences of the Czech Republic (A400550510); it was also
part of the research project No. Z4 055 0506. The support of
the Praemium Academiae of the Academy of Sciences of
the Czech Republic, awarded to P. H. in 2007, is also
acknowledged. The experimental work was supported by the
National Science Foundation under CHE-0911564.
References
1 P. A. Rice and C. C. Corell, Protein–Nucleic Acid Interactions,Royal Society of Chemistry, Cambridge, 2008.
2 N. C. Seeman, J. M. Rosenberg and A. Rich, Proc. Natl. Acad. Sci.U. S. A., 1976, 73, 804.
3 J. L. Battiste, M. Hongyuan, N. Sambasiva Rao, T. Ruoying,D. R. Muhandiram, L. E. Kay, A. D. Frankel andJ. R. Williamson, Science, 1996, 273, 1547.
4 D. Nachtigallova, P. Hobza and V. Spirko, J. Phys. Chem. A, 2008,112, 1854.
5 B. Brauer, R. B. Gerber, M. Kabelac, P. Hobza, J. M. Bakker,A. G. A. Riziq and M. S. de Vries, J. Phys. Chem. A, 2005, 109,6974.
6 K. Giese, M. Petkovic, H. Naundorf and O. Kuhn, Phys. Rep.,2006, 430, 211.
7 W. P. Kraemer, V. Spirko and O. Bludsky, J. Mol. Spectrosc.,1994, 164, 500.
8 A. C. Cheng and A. D. Frankel, J. Am. Chem. Soc., 2004, 126,434.
9 G. Meijer, M. S. de Vries, H. E. Hunziker and H. R. Wendt, Appl.Phys. B: Photophys. Laser Chem., 1990, 51, 395.
10 R. N. Pribble, A. W. Garrett, K. Haber and T. S. Zwier, J. Chem.Phys., 1995, 103, 531.
11 M. Schmitt, H. Muller and K. Kleinermanns, Chem. Phys. Lett.,1994, 218, 246.
12 D. A. Case, T. E. Cheatham, T. Darden, H. Gohlke, R. Luo,K. M. Merz, A. Onufriev, C. Simmerling, B. Wang andR. J. Woods, J. Comput. Chem., 2005, 26, 1668.
13 D. A. Case, D. A. Pearlman, J. W. Caldwell, T. E. Cheatham,W. S. Ross, C. L. Simmerling, T. A. Darden, K. M. Merz,R. Stanton, A. L. Cheng, J. J. Vincent, M. Crowley, V. Tsui,H. Gohlke, R. J. Radmer, Y. Duan, J. Pitera, I. Massova,G. L. Siebel, U. C. Singh and P. K. Weiner, AMBER, 7th edn,University of California, 2002.
14 M. Mons, F. Piuzzi, I. Dimicoli, L. Gorb and J. Leszczynski,J. Phys. Chem. A, 2006, 110, 10921.
15 C. Møller and M. S. Plesset, Phys. Rev., 1934, 46, 618.16 R. A. Kendall, T. H. Dunning and R. J. Harrison, J. Chem. Phys.,
1992, 96, 6796.17 M. Feyereisen, G. Fitzgerald and A. Komornicki, Chem. Phys.
Lett., 1993, 208, 359.18 R. Ahlrichs, M. Bar, M. Haser, H. Horn and C. Kolmel, Chem.
Phys. Lett., 1989, 162, 165.19 W. Chin, M. Mons, I. Dimicoli, F. Piuzzi, B. Tardivel and
M. Elhanine, Eur. Phys. J. D, 2002, 20, 347.20 M. Mons, I. Dimicoli, F. Piuzzi, B. Tardivel and M. Elhanine,
J. Phys. Chem. A, 2002, 106, 5088.21 E. Nir, C. Janzen, P. Imhof, K. Kleinermanns and M. S. de Vries,
J. Chem. Phys., 2001, 115, 4604.22 K. Seefeld, R. Brause, T. Haber and K. Kleinermanns, J. Phys.
Chem. A, 2007, 111, 6217.23 A. Abo-Riziq, B. Crews, L. Grace and M. S. de Vries, J. Am.
Chem. Soc., 2005, 127, 2374.24 A. Abo-Riziq, L. Grace, E. Nir, M. Kabelac, P. Hobza and
M. S. de Vries, Proc. Natl. Acad. Sci. U. S. A., 2005, 102, 20.
Fig. 5 R2PI spectra of guanine–aspartic acid structure 9KN (A), guanine-9-ethyl-cytosine-1-methyl, forming the Watson–Crick base pair (B), the
guanine dimer (C), guanine–aspartic acid structure 9E1 (D) and 9-enol guanine monomer (E).
This journal is �c the Owner Societies 2010 Phys. Chem. Chem. Phys., 2010, 12, 3597–3605 | 3605