
This page intentionally left blank. - Ohio Auditor of State · This page intentionally left blank....
41
Transcript of This page intentionally left blank. - Ohio Auditor of State · This page intentionally left blank....


This page intentionally left blank.
To the residents, elected officials, management, and stakeholders of the Beaver Local School District,
In consultation with the Ohio Department of Education, the Auditor of State’s Ohio Performance Team conducted a performance audit of the District to provide an independent assessment of operations and management. Functional areas selected for review were identified with input from District administrators and were selected due to strategic and financial importance to the District. Where warranted, and supported by detailed analysis, this performance audit report contains recommendations to enhance the District’s overall efficiency and effectiveness. This report has been provided to the District and its contents have been discussed with the appropriate elected officials and District management.
The District has been encouraged to use the management information and recommendations contained in the performance audit report. However, the District is also encouraged to perform its own assessment of operations and develop alternative management strategies independent of the performance audit report. The Auditor of State has developed additional resources to help Ohio governments share ideas and practical approaches to improve accountability, efficiency, and effectiveness.
SkinnyOhio.org: This website, accessible at http://www.skinnyohio.org/, is a resource for smarter streamlined government. Included are links to previous performance audit reports, information on leading practice approaches, news on recent shared services examples, the Shared Services Idea Center, and other useful resources such as the Local Government Toolkit. The Shared Services Idea Center is a searchable database that allows users to quickly sort through shared services examples across the State. The Local Government Toolkit provides templates, checklists, sample agreements, and other resources that will help local governments more efficiently develop and implement their own strategies to achieve more accountable, efficient, and effective government.
This performance audit report can be accessed online through the Auditor of State’s website at http://www.ohioauditor.gov and choosing the “Search” option. Sincerely, Dave Yost Auditor of State November 29, 2016
rakelly
Yost_signature

This page intentionally left blank.
Beaver Local School District Performance Audit
Table of Contents Executive Summary ........................................................................................................................ 1
Purpose and Scope of the Audit .................................................................................................. 1
Performance Audit Overview ..................................................................................................... 1
Audit Methodology ..................................................................................................................... 1
Summary of Recommendations .................................................................................................. 4
Background ..................................................................................................................................... 6
Recommendations ........................................................................................................................... 8
R.1 Improve strategic planning and budgeting practices ........................................................ 8
R.2 Follow ODE guidelines for EMIS reporting .................................................................... 9
R.3 Eliminate 1.0 FTE general education teacher position .................................................... 9
R.4 Eliminate 2.0 FTE ESP positions ................................................................................... 10
R.5 Renegotiate collective bargaining agreement provisions ............................................... 11
R.6 Revise certificated salary schedules ............................................................................... 12
R.7 Establish formal open enrollment operating guidelines ................................................. 15
R.8 Complete T-2 Forms as prescribed by ODE .................................................................. 16
R.9 Right-size the active bus fleet ........................................................................................ 17
R.10 Develop a bus replacement plan................................................................................... 19
R.11 Procure fuel using the DAS cooperative purchasing program ..................................... 20
R.12 Implement performance metrics to improve food service contract monitoring ........... 21
R.13 Reduce 9.3 food service labor hours ............................................................................ 22
Appendix A: Scope and Objectives .............................................................................................. 23
Appendix B: Additional Comparisons .......................................................................................... 25
Appendix C: Five-Year Financial Forecasts ................................................................................. 29
Client Response ............................................................................................................................ 32

Beaver Local School District Performance Audit
This page intentionally left blank.
Beaver Local School District Performance Audit
Page 1
Executive Summary Purpose and Scope of the Audit In consultation with the Ohio Department of Education (ODE), the Auditor of State (AOS) determined that it was appropriate to conduct a performance audit of Beaver Local School District (BLSD or the District) pursuant to Ohio Revised Code § 3316.042. The purpose of this performance audit was to improve BLSD’s financial condition through an objective assessment of the economy, efficiency, and/or effectiveness of the District’s operations and management. (See Background for a full explanation of the District’s financial condition and the Five Year Forecasts in Appendix C.) In consultation with the District, the Ohio Performance team (OPT) selected the following scope areas for detailed review and analysis: Financial Management; Human Resources; Facilities; Transportation; and Food Service. See Appendix A: Scope and Objectives for detailed objectives developed to assess operations and management in each scope area. Performance Audit Overview Performance audits provide objective analysis to assist management and those charged with governance and oversight to improve program performance and operations, reduce costs, facilitate decision making by parties with responsibility to oversee or initiate corrective action, and contribute to public accountability. The United States Government Accountability Office develops and promulgates Government Auditing Standards that establish a framework for performing high-quality audit work with competence, integrity, objectivity, and independence to provide accountability and to help improve government operations and services. These standards are commonly referred to as Generally Accepted Government Auditing Standards (GAGAS). OPT conducted this performance audit in accordance with GAGAS. These standards required that OPT plan and perform the audit to obtain sufficient, appropriate evidence to provide a reasonable basis for findings and conclusions based on the audit objectives. OPT believes that the evidence obtained provides a reasonable basis for our findings and conclusions based on the audit objectives. Audit Methodology To complete this performance audit, auditors gathered data, conducted interviews with numerous individuals associated with the areas of District operations included in the audit scope, and reviewed and assessed available information. Assessments were performed using criteria from a number of sources, including:
• Peer districts; • Industry standards;
Beaver Local School District Performance Audit
Page 2
• Leading practices; • Statutes; and • Policies and procedures.
In consultation with the District, three sets of peer groups were selected for comparisons contained in this report. A “Primary Peers” set was selected for general, District-wide comparisons. This peer set was selected from districts with a similar poverty index to that of BLSD, but then refined to include only those districts with relatively lower per pupil spending and higher academic performance. A “Local Peers” set was selected for a comparison of compensation, benefits, and collective bargaining agreements, where applicable. This peer set was selected specifically to provide context for local labor market conditions. Finally, a “Transportation Peers” set was selected for transportation operating and spending comparisons. This peer set was selected specifically for transportation operational comparability and included only those districts with a similar size in square miles and population density; two significant factors that impact transportation efficiency. Table 1 shows the Ohio school districts included in these peer groups.
Table 1: Peer Group Definitions Primary Peers
• Bellevue City School District (Huron County) • Buckeye Local School District (Jefferson County) • Carrolton Exempted Village School District (Carroll County) • Claymont City School District (Tuscarawas County) • Clear Fork Valley Local School District (Richland County) • Eaton Community City School District (Preble County) • Grand Valley Local School District (Ashtabula County) • Indian Valley Local School District (Tuscarawas County) • La Brae Local School District (Trumbull County) • West Holmes Local School District (Holmes County)
Local Peers (Compensation, Benefits, and Bargaining Agreements) • Crestview Local School District (Columbiana County) • East Liverpool City School District (Columbiana County) • East Palestine City School District (Columbiana County) • Lisbon Exempted Village School District (Columbiana County) • Southern Local School District (Columbiana County) • Wellsville Local School District (Columbiana County)
Transportation Peers • Buckeye Local School District (Jefferson County) • Colonel Crawford Local School District (Crawford County) • Eaton Community City School District (Preble County) • Grand Valley Local School District (Ashtabula County) • Indian Valley Local School District (Tuscarawas County)
Where reasonable and appropriate, peer districts were used for comparison. However, in some operational areas industry standards or leading practices were used for primary comparison. Sources of industry standards or leading practices used in this audit include: American Association of School Administrators (AASA), Government Finance Officers Association (GFOA), National Association of State Directors of Pupil Transportation Services (NASDPTS),
Beaver Local School District Performance Audit
Page 3
Ohio Department of Administrative Services (DAS), Ohio Department of Education (ODE), and the Ohio State Employment Relations Board (SERB). District policies and procedures as well as pertinent laws and regulations contained in the Ohio Administrative Code (OAC) and the Ohio Revised Code (ORC) were also assessed. The performance audit involved information sharing with the District, including drafts of findings and recommendations related to the identified audit areas. Periodic status meetings throughout the engagement informed the District of key issues impacting selected areas, and shared proposed recommendations to improve operations. The District provided verbal and written comments in response to various recommendations, which were taken into consideration during the reporting process. During the course of the audit, there were delays in the District providing certain requested information. Although all planned analyses were still able to be completed; doing so required more time and resources than necessary. These delays have been reported to District management as well as AOS staff for consideration in future audit engagements. AOS and OPT express their appreciation to the elected officials, management, and employees of the Beaver Local School District for their cooperation and assistance throughout this audit.

Beaver Local School District Performance Audit
Page 4
Summary of Recommendations The following table summarizes performance audit recommendations and financial implications, where applicable.
Table 2: Summary of Recommendations Recommendations Savings
R.1 Improve strategic planning and budgeting practices N/A R.2 Follow ODE guidelines for EMIS reporting N/A R.3 Eliminate 1.0 FTE general education teacher positions $44,000 R.4 Eliminate 2.0 FTE ESP positions $120,000 R.5 Renegotiate collective bargaining agreement provisions N/A R.6 Revise certificated salary schedules N/A R.7 Establish a formal open enrollment capacity policy and operating guidelines N/A R.8 Complete T-2 Forms as prescribed by ODE N/A R.9 Right-size the active bus fleet $117,700 R.10 Develop a bus replacement plan N/A R.11 Procure fuel using the DAS cooperative purchasing program $8,600 R.12 Implement performance metrics to improve food service contract monitoring N/A R.13 Reduce 9.3 food service labor hours $24,800 Total Cost Savings from Performance Audit Recommendations $315,100 Table 3 shows the District’s ending fund balances as projected in the October 2016 five-year forecast. Included are annual savings identified in this performance audit and the estimated impact that implementation of the recommendations will have on the ending fund balances.
Table 3: Financial Forecast with Performance Audit Recommendations FY 2016-17 FY 2017-18 FY 2018-19 FY 2019-20 FY 2020-21
Original Ending Fund Balance $558,380 $800,028 $667,187 $606,260 $789,598 Cumulative Balance of Performance Audit Recommendations N/A $315,100 $630,200 $945,300 $1,260,400 Revised Ending Fund Balance $558,380 $1,115,128 $1,297,387 $1,551,560 $2,049,998 Source: BLSD, ODE, and performance audit recommendations Note: Although the District should seek to implement recommendations as soon as practicable there may be a reasonable delay in doing so. As a result, cost savings have been applied to fiscal year (FY) 2017-18 through FY 2020-21 only. As shown in Table 3, implementing the performance audit recommendations would allow the District to maintain a positive fund balance in the forecast period. It is possible that in pursuing the options necessary to balance the budget and achieve fiscal stability, the District could face the unintended consequence of reductions in future federal aid and/or the need to repay federal funds previously received, due to inability to meet federal maintenance of effort (MOE) requirements. Federal funding is designed to supplement local operations within specific program areas such as Title I, Title II, and IDEA Part B. Because this
Beaver Local School District Performance Audit
Page 5
funding is meant to be supplemental, MOE requirements are put into place to ensure that all schools maintain an acceptable level of local spending rather than shifting to an over-reliance on federal funding, also referred to as supplanting. Federal funds are supplemental to District operations and pursuit of these supplemental funds does not alleviate the obligation to maintain a balanced budget. In exercising the responsibility to maintain a balanced budget, the District will need to critically evaluate the potential impact of planned changes on program expenditures and/or census/enrollment (i.e., the two major inputs used to calculate MOE). ODE is charged with monitoring school districts’ compliance with MOE requirements and is also in a position of working with districts to facilitate seeking a waiver from the US Department of Education, where available within the grant guidelines, when certain conditions are evident.1 Two such conditions specific to Title I include:
• An exceptional or uncontrollable circumstance such as natural disaster; and • A precipitous decline in financial resources (e.g., due to enrollment or loss of tax
revenue). The District should pursue necessary steps to balance, achieve, and maintain long-term fiscal stability while working with ODE to minimize any unnecessary, unforeseen consequences, including seeking a waiver of MOE requirements, if available.
11 IDEA Part B does not have a MOE waiver option.

Beaver Local School District Performance Audit
Page 6
Background Table 4 shows the District’s total revenues, total expenditures, results of operations, beginning and ending cash balances, and ending fund balances as projected in its October 2015 five-year forecast. This information is an important measure of the financial health of the District and serves as the basis for identification of fiscal distress conditions, possibly leading to formal designation by AOS and ODE.
Table 4: Financial Condition Overview (October 2015)
FY 2015-16 FY 2016-17 FY 2017-18 FY 2018-19 FY 2019-20
Total Revenue $18,070,750 $18,064,163 $18,338,719 $17,731,376 $17,357,171 Total Expenditure $18,084,725 $18,610,172 $19,044,044 $19,590,313 $19,953,223 Results of Operations ($13,975) ($546,009) ($705,325) ($1,858,937) ($2,599,052) Beginning Cash Balance $240,487 $226,512 ($319,497) ($1,024,822) ($2,883,759) Ending Cash Balance $226,512 ($319,497) ($1,024,822) ($2,883,759) ($5,482,811) Outstanding Encumbrances $25,000 $25,000 $25,000 $25,000 $25,000 Ending Fund Balance $201,512 ($344,497) ($1,049,822) ($2,908,759) ($5,507,811) Source: BLSD and ODE As shown in Table 4, expenditures outpace revenue beginning in FY 2015-16, resulting in an ending fund balance deficit of $344,497 in FY 2016-17 and increasing to over $5.5 million in FY 2019-20. In March 2016, the District submitted a financial recovery plan to ODE to address the projected deficits, which included cost-controlling efforts such as reductions to staffing and building-level budgets. The District also successfully sold the Calcutta Elementary property during FY 2015-16, which helped to offset the projected deficits. Given the additional cost saving measures planned or already implemented, the District has proactively sought to correct its deficit. During the May 2016 five-year forecast update, the District’s financial condition had slightly improved due to increased property tax collections, decreased health insurance costs, and the sale of the Calcutta Elementary property. While the combination of these changes reduced the severity of the projected operational losses for FY 2017-18 through FY 2019-20, the ending fund balances continued to worsen, which led to the need for additional cost saving measures planned for FY 2016-17 and FY 2017-18. Specifically, BLSD created an additional cost savings plan in September 2016 that is estimated to save approximately $116,350 for FY 2016-17 and an additional $240,400 for FY 2017-18 by reducing the summer maintenance budget by $81,000, as well as reducing 2.0 full-time equivalent (FTE) office/clerical positions, one six-hour cafeteria position, and 2.0 FTE teaching positions. Table 5 shows the District’s total revenues, total expenditures, results of operations, beginning and ending cash balances, and ending fund balances as projected in its October 2016 five-year forecast.

Beaver Local School District Performance Audit
Page 7
Table 5: Financial Condition Overview (October 2016)
FY 2016-17 FY 2017-18 FY 2018-19 FY 2019-20 FY 2020-21
Total Revenue $18,880,780 $18,899,500 $18,287,017 $17,904,460 $18,497,332 Total Expenditure $18,748,499 $18,657,852 $19,019,811 $19,165,293 $19,513,900 Results of Operations $132,281 $241,648 ($732,794) ($1,260,833) ($1,016,568) Beginning Cash Balance $451,099 $583,380 $825,028 $92,234 ($1,168,599) Ending Cash Balance $583,380 $825,028 $92,234 ($1,168,599) ($2,185,167) Outstanding Encumbrances $25,000 $25,000 $25,000 $25,000 $25,000 Ending Fund Balance without Renewal Levy $558,380 $800,028 $67,234 ($1,193,599) ($2,210,167)
Cumulative Balance of Renewal Levy N/A N/A $599,953 $1,799,859 $2,999,765 Ending Fund Balance with Renewal Levy $558,380 $800,028 $667,187 $606,260 $789,598 Source: BLSD and ODE As shown in Table 5, the District’s October 2016 five-year forecast included a deficit of over $1.1 million in FY 2019-20. This deficit condition was a direct result of expenditures continuing to outpace revenues, increasing the negative ending cash balances over the forecast period. Left unaddressed, and excluding the impact of renewal/replacement levies, these conditions were projected to result in a cumulative deficit of over $2.2 million by FY 2020-21. However, if the renewal levy passes, the deficits are projected to be eliminated. If the financial condition would deviate from the forecasted information, additional cost reduction measures might be necessary. Revenue is not directly controlled by school districts, but instead by federal and State laws, and support from local residents. ODE uses the Local Tax Effort Index to compare means-adjusted taxpayer support between school districts in Ohio. This index reflects the extent of effort the residents of a school district make in supporting public elementary and secondary education in relation to their ability to pay. A local tax effort of 1.0 represents the statewide average of all school districts. The District’s local tax effort was 0.8005 for FY 2014-15 while the primary peer average was 0.9696, signifying that the District receives 17 percent less means-adjusted local taxpayer support than its primary peers. However, the District’s local tax effort was higher than the Columbiana County average of 0.7212 and was the sixth highest in the County in FY 2014-15. Eliminating future deficits can be accomplished by decreasing expenditures, increasing revenue, or a combination of both. Management control over operating decisions can directly affect expenditures. Consequently, the District's management, operations, and resulting expenses were examined by OPT in an effort to identify areas of potential cost savings.

Beaver Local School District Performance Audit
Page 8
Recommendations R.1 Improve strategic planning and budgeting practices The District does not have a formal, comprehensive strategic plan that would serve to guide long-term operational and programming decisions. Establishment of Strategic Plans (GFOA, 2005) recommends that governments develop a strategic plan in order to provide a long-term perspective for service delivery and budgeting. The strategic plan should establish logical links between spending and goals. In addition, the focus of the strategic plan should be on aligning organizational resources to bridge the gap between present conditions and the envisioned future. The GFOA recommends the following steps when developing a strategic plan:
• Initiate the strategic planning process; • Prepare a mission statement; • Identify and assess environmental factors and critical issues; • Agree on a small number of goals and develop strategies and action plans to achieve
them; • Develop measurable objectives and incorporate performance measures; • Approve, implement, and monitor the plan; and • Reassess the strategic plan annually.
In addition to enhancing its strategic planning efforts, the District’s annual budgeting practices could be further enhanced by including all relevant stakeholders to the budget development process. Although building principals and department supervisors are provided with monthly budget reports, budget development is carried out exclusively by the Treasurer on an informal basis, without formal involvement from building principals or director-level operations personnel. Best Practices in School Budgeting (GFOA, 2014) indicates that a strategic budgeting process should involve key participants, such as executive leaders from different functions within a district. Further, a shared effort between the finance department and the instructional departments will help ease the task of analyzing the comparative worth of different goals or programs. BLSD should develop a strategic plan that links its stated goals and objectives to financial resources. BLSD should also improve its budgeting process by increasing stakeholder involvement. In doing so, the ability of the strategic plan to guide program and funding decisions will be enhanced. Without a goal and resource oriented strategic plan based on input from key financial, operational, and instructional participants, the District is at risk of not fully evaluating the relationship between its spending decisions and program outcomes. This, in turn, increases the risk of inefficiently and/or ineffectively addressing District needs.
Beaver Local School District Performance Audit
Page 9
R.2 Follow ODE guidelines for EMIS reporting In order to ensure the accuracy of the FY 2015-16 student enrollment and staffing data used throughout the course of the audit, OPT tested the District's information as reported in the Education Management Information System (EMIS). While the data was found to be sufficiently reliable and appropriate for use in this audit, after adjustments and reconciliations were made, some deficiencies related to the District’s staffing values reported in EMIS were identified.2 Specifically, the District counted all employees who work two or more hours per day as 1.0 full-time equivalent (FTE). As a result of this practice, the District counted a portion of its employees who worked fewer hours than other employees assigned to the same position code, and that were reported as 1.0 FTE, as the same value. According to ODE EMIS Manual, Staff Employment Record (ODE, 2015), full-time equivalency is defined and appropriately accounted for as follows:
“Full-time equivalency (FTE) is the ratio between the amount of time normally required to perform a part-time assignment and the time normally required to perform the same assignment full-time. The number 1.0 represents one full-time assignment. One (1.0) FTE is equal to the number of hours in a regular working day for that position, as defined by the district.”
The District’s EMIS reporting practices resulted in overstatement of the total number of FTEs working in the District in FY 2015-16. In particular, the District EMIS report indicated that it employed a total of 208.0 FTEs; however, after prorating the District’s EMIS report in accordance with the guidelines established by ODE, the District actually employed a total of 201.7 FTEs. In order to effectively monitor staffing levels and workload metrics in the future, the District should assign FTE status in accordance with the policies and procedures detailed in the ODE EMIS Manual.
R.3 Eliminate 1.0 FTE general education teacher position General education teachers instruct students in a regular classroom environment. OAC 3301-35-05 requires the district-wide ratio of general education teachers to students to be at least 1.0 FTE classroom teacher for every 25 regular students. This category excludes teaching staff in other areas such as gifted, special education, and educational service personnel (ESP). Table 6 shows a general education staffing comparison based on the District’s FY 2015-16 students to teacher ratio. It is important to compare staffing to both the peer average and State minimum requirements to provide a full picture of staffing efficiency.
2 As part of the data reliability process, all employees reported in EMIS were reconciled with the District. Positions that were overstated were subsequently corrected for use in the staffing analyses and use in the District. Additionally, all retirements and resignations were taken into account. The verified staffing counts were then used in the analyses and subsequent recommendations contained in this report.

Beaver Local School District Performance Audit
Page 10
Table 6: General Education Teacher Staffing Comparison General Education FTEs 83.0 Regular Student Population 1,553.6 Staffing Ratio (Students: Teachers) 18.7
Staffing Ratio by Option
(Students: Teachers)
Proposed Staffing for
Each Option
Difference Above/ (Below)
Proposed Reduction
for this Option
Annual Savings
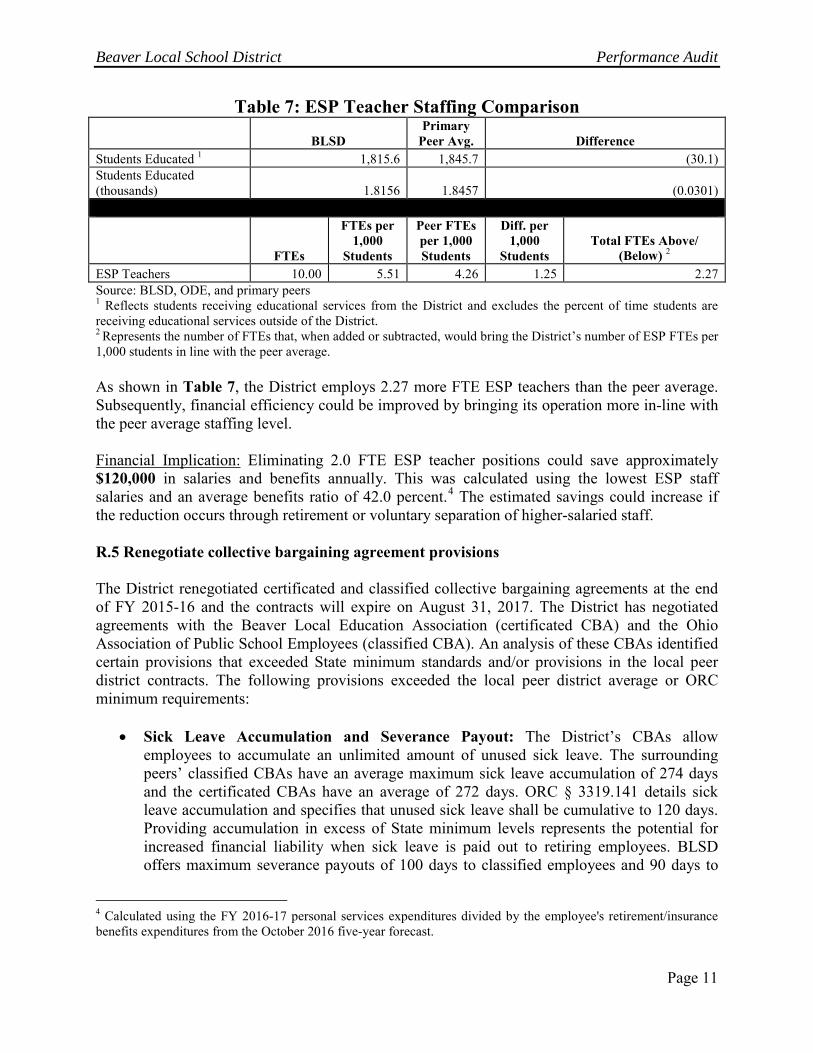
Option 1: Peer Average 19.0:1 81.8 1.2 1.0 $43,968 Option 2: 10% Above State Minimum 22.5:1 69.0 14.0 14.0 $722,799 Option 3: State Minimum 25.0:1 62.1 20.9 20.5 $1,122,322 Source: BLSD, ODE, and primary peers Note: Regular student enrollment is based on the percent of time student enrollment information obtained from ODE for FY 2014-15. As shown in Table 6, the District's general education teacher staffing level is 1.2 FTEs above the primary peer average. Financial Implication: Eliminating 1.0 FTE general education teacher position could save approximately $44,000 in salaries and benefits, annually. This savings was calculated using the lowest full-time general education teacher salaries and an average benefits ratio of 42.0 percent.3 The estimated savings could increase if the reduction occurs through retirement or voluntary separation of higher-salaried staff. R.4 Eliminate 2.0 FTE ESP positions Educational service personnel (ESP) teacher positions include K-8 art, music, and physical education teachers. In FY 2015-16, the District employed 10.0 FTE ESP teachers, which included 3.0 FTE art teachers, 3.0 FTE music teachers, and 4.0 FTE physical education teachers. Effective April 24, 2015, OAC 3301-35-05 was revised to state, "The local board of education shall be responsible for the scope and type of educational services in the district. The district shall employ educational service personnel to enhance the learning opportunities for all students." This revision eliminated State minimum staffing levels for ESP staffing. Table 7 shows the District's ESP staffing on a per 1,000 students basis as compared to the peer average for FY 2015-16. Comparing ESP staffing in relation to student population normalizes the effect of district size between BLSD and the peers.
3 Calculated using the FY 2016-17 personal services expenditures divided by the employee's retirement/insurance benefits expenditures from the October 2016 five-year forecast.
Beaver Local School District Performance Audit
Page 11
Table 7: ESP Teacher Staffing Comparison
BLSD Primary
Peer Avg. Difference Students Educated 1 1,815.6 1,845.7 (30.1) Students Educated (thousands) 1.8156 1.8457 (0.0301)
FTEs
FTEs per 1,000
Students
Peer FTEs per 1,000 Students
Diff. per 1,000
Students Total FTEs Above/
(Below) 2 ESP Teachers 10.00 5.51 4.26 1.25 2.27 Source: BLSD, ODE, and primary peers 1 Reflects students receiving educational services from the District and excludes the percent of time students are receiving educational services outside of the District. 2 Represents the number of FTEs that, when added or subtracted, would bring the District’s number of ESP FTEs per 1,000 students in line with the peer average. As shown in Table 7, the District employs 2.27 more FTE ESP teachers than the peer average. Subsequently, financial efficiency could be improved by bringing its operation more in-line with the peer average staffing level. Financial Implication: Eliminating 2.0 FTE ESP teacher positions could save approximately $120,000 in salaries and benefits annually. This was calculated using the lowest ESP staff salaries and an average benefits ratio of 42.0 percent.4 The estimated savings could increase if the reduction occurs through retirement or voluntary separation of higher-salaried staff. R.5 Renegotiate collective bargaining agreement provisions The District renegotiated certificated and classified collective bargaining agreements at the end of FY 2015-16 and the contracts will expire on August 31, 2017. The District has negotiated agreements with the Beaver Local Education Association (certificated CBA) and the Ohio Association of Public School Employees (classified CBA). An analysis of these CBAs identified certain provisions that exceeded State minimum standards and/or provisions in the local peer district contracts. The following provisions exceeded the local peer district average or ORC minimum requirements:
• Sick Leave Accumulation and Severance Payout: The District’s CBAs allow employees to accumulate an unlimited amount of unused sick leave. The surrounding peers’ classified CBAs have an average maximum sick leave accumulation of 274 days and the certificated CBAs have an average of 272 days. ORC § 3319.141 details sick leave accumulation and specifies that unused sick leave shall be cumulative to 120 days. Providing accumulation in excess of State minimum levels represents the potential for increased financial liability when sick leave is paid out to retiring employees. BLSD offers maximum severance payouts of 100 days to classified employees and 90 days to
4 Calculated using the FY 2016-17 personal services expenditures divided by the employee's retirement/insurance benefits expenditures from the October 2016 five-year forecast.

Beaver Local School District Performance Audit
Page 12
certificated employees, which are higher than both the local peer averages and the ORC minimum requirement. On average, the local peer district severance payouts are 59 days for certificated employees and 56 days for classified employees, while ORC § 124.39 allows a school employee to be paid for 30 days (25 percent of 120 days) of unused sick leave at retirement. Allowing employees to receive a payout in excess of State minimums becomes costly at employee retirement.5
• Vacation: The District’s classified CBA allows employees to accrue 485 vacation days
over the course of a 30-year career. While this is less than the local peer average, it is higher than the ORC § 3319.084 minimum requirement of 460 days. A reduction would increase the number of available work hours at no additional cost to the District.
• Paid Holidays: The District’s classified CBA allows 11-month and 12-month employees
to accrue 11 paid holidays per year and 9-month and 10-month employees to accrue 8 paid holidays per year. While this is aligned with the local peer average, it is higher than required under ORC § 3319.087. ORC § 3319.087 requires that all 11-month and 12- month non-teaching employees accrue seven paid holidays per year and all 9-month and 10-month non-teaching employees accrue six paid holidays per year. A reduction would increase the number of available work hours at no additional cost to the District.
The District should seek to renegotiate its costly collective bargaining agreement provisions. Provisions within CBAs that provide benefits beyond what is required or typically offered in other school districts can create an unnecessary financial burden on the District and limit management’s ability to control costs. R.6 Revise certificated salary schedules BLSD teachers are paid according to schedules included in the certificated CBA that are based on factors such as education level and years of service. Specific compensation levels include: bachelor’s degree (BA), BA plus 150 service credit hours, and master’s degree (MA). The certificated CBA is valid through August 31, 2017. Chart 1 shows a comparison of BLSD’s BA salary schedule to the local peer district average for FY 2016-17. It is important to examine all steps in the schedule to identify the cause of the variation relative to the local peer districts.
5 The District was unable to provide severance payout information (see R.2). Subsequently a financial impact regarding a reduction in severance payouts was not able to be calculated.

Beaver Local School District Performance Audit
Page 13
Chart 1: BLSD BA Salary Schedule Comparison
Source: BLSD and local peers As shown in Chart 1, BA certificated employee salaries are higher relative to the local peer average throughout the step schedule beginning in year nine. In total, the District’s BA salary schedule exceeds the local peer average by $30,772, or 2.2 percent, over the course of a 30-year career. Chart 2 shows a comparison of BLSD’s BA +150 salary schedule to the local peer district average for FY 2016-17.
$30,000
$35,000
$40,000
$45,000
$50,000
$55,000
$60,000
0 5 10 15 20 25
Sala
ry
Years
Beaver LSD
Peer Average

Beaver Local School District Performance Audit
Page 14
Chart 2: BLSD BA+150 Salary Schedule Comparison
Source: BLSD and local peers As shown in Chart 2, BA +150 certificated employee salaries are higher relative to the local peer average throughout the step schedule beginning in year nine. In total, the District’s BA+150 salary schedule exceeds the local peer average by $63,366, or 4.3 percent, over the course of a 30-year career. Chart 3 shows a comparison of BLSD’s MA salary schedule to the local peer district average for FY 2016-17.
Chart 3: BLSD MA Salary Schedule Comparisons
Source: BLSD and local peers
$30,000
$35,000
$40,000
$45,000
$50,000
$55,000
$60,000
$65,000
0 5 10 15 20 25
Sala
ry
Years
Beaver LSD
Peer Average
$35,000
$40,000
$45,000
$50,000
$55,000
$60,000
$65,000
0 5 10 15 20 25
Sala
ry
Years
Beaver LSD
Peer Average

Beaver Local School District Performance Audit
Page 15
As shown in Chart 3, MA certificated employee salaries are higher relative to the local peer average throughout the step schedule beginning in year nine. In total, the District’s MA salary schedule exceeds the local peer average by $55,094, or 3.4 percent, over the course of a 30-year career. Aligning salaries to a level that more closely match the local peer averages requires the District to negotiate new salary schedules. Potential approaches include:
• Freeze salaries – The District could negotiate to freeze steps for several years. As the local peer average compensation increases, BLSD’s compensation will align.
• Modify salaries – The District could negotiate to modify the existing salary schedule to a level consistent with the local peer average.
• Modify salaries for newly hired certificated staff- If the District determines that the immediate reduction is not necessary, then it should, at a minimum, implement a revised salary schedule for new hires.
During the course of the audit, the District did not provide a list of where tenured certificated employees were located on each of the corresponding salary schedules (see R.2). As a result, the potential savings of implementing the aforementioned salary reduction measures could not be quantified. R.7 Establish formal open enrollment operating guidelines Open enrollment was passed into law by the Ohio General Assembly as part of the Omnibus Educational Reform Act of 1989, Senate Bill 140. Initially, students were only allowed to enroll into adjacent school districts. However, in July 1998, the General Assembly passed House Bill 497 which permitted students to enroll in any school district in the State and eliminated the authorization for a school district to object to the enrollment of a district student in another school district that allows open enrollment. ORC § 3313.98 requires all school districts to adopt a resolution establishing a policy that either entirely prohibits open enrollment into their district, permits open enrollment of all students, or permits open enrollment of students only from adjacent districts. Further, ORC § 3313.98 requires school districts with an open enrollment policy permitting the enrollment of students from all districts to have additional procedures. These include:
• “Application procedures, including deadlines for application and for notification of students and the superintendent of the applicable district whenever an adjacent or other district student’s application is approved.
• Procedures for admitting adjacent or other district applicants free of any tuition obligation to the district’s schools, including, but not limited to:
• The establishment of district capacity limit by grade level, school building, and education programs;
• A requirement that all native students wishing to be enrolled in the district will be enrolled and that any adjacent or other district students previously enrolled in the district shall receive preference over first-time applicants; [and]

Beaver Local School District Performance Audit
Page 16
• Procedures to ensure that an appropriate racial balance is maintained in the district schools.”
BLSD’s open enrollment policy states that “The Board of Education shall permit the enrollment of students from any Ohio district in a school or program of this District, provided each enrollment is in accordance with laws and regulations of the State concerning Inter-District Open Enrollment, the provisions of this policy, and the administrative guidelines established to implement this policy.” The policy includes definitions for the home district, open enrollment, district student, other district, other district student, tuition student, program, program size, racially isolated building, and racial balance and how to maintain it. Although the District’s open enrollment policy conforms to the Board requirements in ORC § 3313.98, it has not established formal operating guidelines to ensure that the open-enrollment policies can be carried out in a cost-effective manner. Hubbard Exempted Village School District (HEVSD) created administrative guidelines to define its open enrollment policy. Specifically, HEVSD requires each building principal to “notify the Superintendent by March 1st [of] the programs and classrooms which have space available for students from another Ohio district and for tuition students.” Further, the “number of openings in a particular program for students from other Ohio districts will be determined by optimum size for a particular program, classroom/school building, or grade level which is the number of students that can be accommodated without increasing District expenditures for staff or equipment.” HEVSD posts on its website the grades for which it is accepting open enrollment applications. Having and following a policy and guidelines similar to HEVSD would help BLSD to predetermine, annually, the number of open enrollment students to accept based on openings in each grade level, school building, and educational program, and will help the District ensure that it continues to benefit from the reasonable influx of open enrolled students. Further, it would help the District define staffing levels and space availability without increasing expenditures. R.8 Complete T-2 Forms as prescribed by ODE In accordance with ORC § 3327.012 and OAC 3301-83-01, school districts in Ohio are required to submit annual T-1 and T-2 Forms to ODE. The T-1 Form certifies the actual number and type of pupils transported, daily miles traveled, and buses used in the transportation program. School districts are required to complete the T-1 Form by recording the average number of pupils enrolled and regularly transported to school as well as the average daily miles traveled for pupil transportation (excluding non-routine and extra-curricular miles) during the first full week of October. The T-1 Form is then used for calculation of the pupil transportation payment pursuant to ORC § 3327.012. Cost data is reported via the T-2 Form, which serves to certify the actual expenses incurred in the transportation of eligible pupils reported on the corresponding T-1 Form. ODE provides detailed instructions for completing both the T-1 and T-2 forms. In particular, it provides guidelines detailing how a district should properly code its students, mileage, and buses on the T-1 Form and the manner in which transportation related expenditures should be recorded on the T-2 Form.

Beaver Local School District Performance Audit
Page 17
BLSD’s Transportation Supervisor is responsible for collecting transportation expenditure information from the Treasurer’s office and other relevant departments to complete the T-2 form. The T-2 Report is then forwarded to the Treasurer and the Superintendent for review and approval prior to submission to ODE. Table 8 shows the District’s transportation expenditures as reported on the T-2 in comparison to the District’s actual expenditures for pupil transportation from FY 2012-13 through FY 2014-15. This analysis is important because it provides context for the District’s historical reporting accuracy.
Table 8: T-2 Report & Actual Expenditures Comparison T-2 Expenditures Actual Expenditures Difference % Difference
FY 2014-15 $1,301,273 $1,208,563 $92,710 7.7% FY 2013-14 $1,446,038 $1,251,141 $194,897 15.6% FY 2012-13 $1,346,912 $1,248,736 $98,179 7.9% Source: BLSD, ODE As shown in Table 8, T-2 expenditures exceeded actual expenditures in each year from FY 2012-13 through FY 2014-15. Expenditures reported on the T-2 should not exceed actual transportation expenditures recorded because not all transportation related expenditures are included in the T-2 Reports. According to ODE T-2 Form instructions, all expenditures related to capital outlay are to be excluded from the T-2 reports. Additionally, expenditures for non-routine use of school buses, such as summer school, after school events, athletic trips, and educational field trips, should not be included on the T-2 Report. Further analysis revealed that if capital outlay was deducted from the T-2 expenditure totals, the variance between the T-2 Report and actual expenditures was $2,732 (0.2%) in FY 2014-15, $2,457 (0.2%) in FY 2013-14, and $342 (0.0%) in FY 2012-13. The District should adhere to the ODE guidelines when completing the T-2 Reports. Failure to accurately report this information could result in incorrect calculations of State pupil transportation payments to the District. Creating and adhering to policies and procedures governing T-2 Form data collection will help to ensure the District’s expenditures are accurately reported. R.9 Right-size the active bus fleet In FY 2014-15, BLSD transported 1,278 regular needs riders with its regular needs fleet of 23 active buses. In attempting to maximize the efficient utilization of its buses, BLSD had employed manual routing, cluster stops, multi-tiered routing, and staggered bell schedules. Although the District made efforts toward improving utilization, it is important to note that the District had previously purchased routing software; however, it did not begin using the software until FY 2016-17.
Beaver Local School District Performance Audit
Page 18
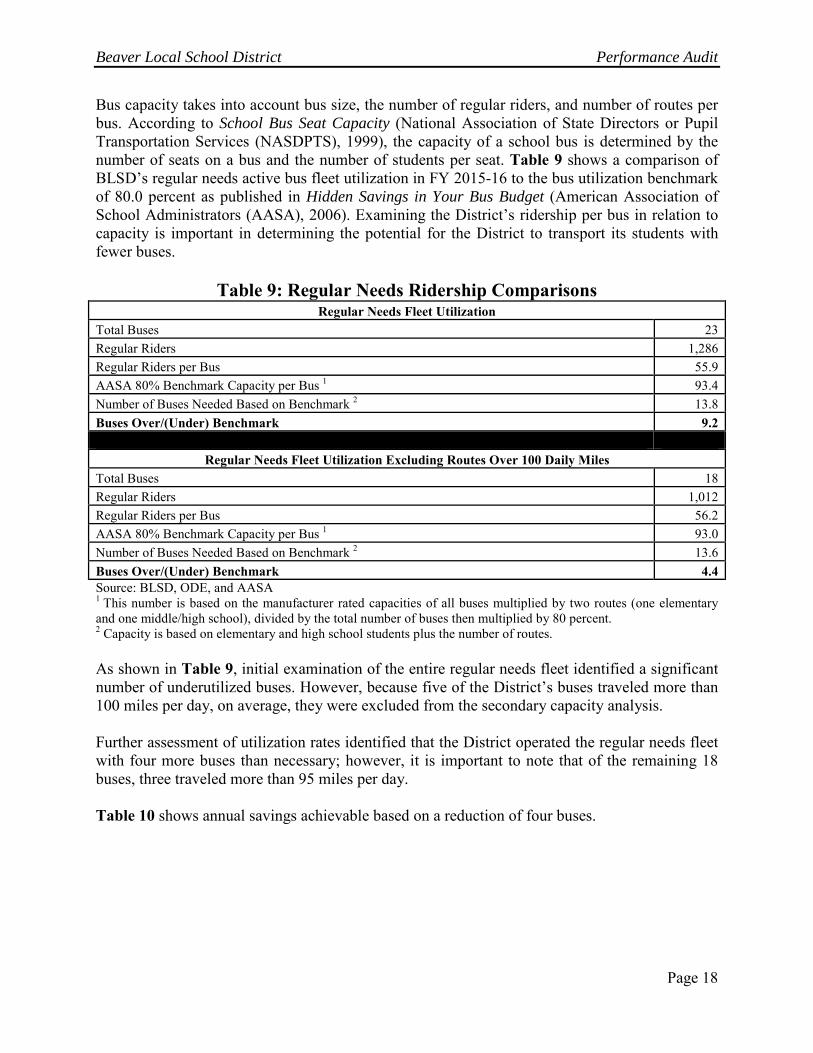
Bus capacity takes into account bus size, the number of regular riders, and number of routes per bus. According to School Bus Seat Capacity (National Association of State Directors or Pupil Transportation Services (NASDPTS), 1999), the capacity of a school bus is determined by the number of seats on a bus and the number of students per seat. Table 9 shows a comparison of BLSD’s regular needs active bus fleet utilization in FY 2015-16 to the bus utilization benchmark of 80.0 percent as published in Hidden Savings in Your Bus Budget (American Association of School Administrators (AASA), 2006). Examining the District’s ridership per bus in relation to capacity is important in determining the potential for the District to transport its students with fewer buses.
Table 9: Regular Needs Ridership Comparisons Regular Needs Fleet Utilization
Total Buses 23 Regular Riders 1,286 Regular Riders per Bus 55.9 AASA 80% Benchmark Capacity per Bus 1 93.4 Number of Buses Needed Based on Benchmark 2 13.8 Buses Over/(Under) Benchmark 9.2
Regular Needs Fleet Utilization Excluding Routes Over 100 Daily Miles Total Buses 18 Regular Riders 1,012 Regular Riders per Bus 56.2 AASA 80% Benchmark Capacity per Bus 1 93.0 Number of Buses Needed Based on Benchmark 2 13.6 Buses Over/(Under) Benchmark 4.4 Source: BLSD, ODE, and AASA 1 This number is based on the manufacturer rated capacities of all buses multiplied by two routes (one elementary and one middle/high school), divided by the total number of buses then multiplied by 80 percent. 2 Capacity is based on elementary and high school students plus the number of routes. As shown in Table 9, initial examination of the entire regular needs fleet identified a significant number of underutilized buses. However, because five of the District’s buses traveled more than 100 miles per day, on average, they were excluded from the secondary capacity analysis. Further assessment of utilization rates identified that the District operated the regular needs fleet with four more buses than necessary; however, it is important to note that of the remaining 18 buses, three traveled more than 95 miles per day. Table 10 shows annual savings achievable based on a reduction of four buses.

Beaver Local School District Performance Audit
Page 19
Table 10: Bus Reduction Cost Savings Number of Buses to be Reduced 4
Driver Salaries $55,500 Retirement $17,800 Workers’ Compensation $500 Employee Insurance $40,100 Bus Insurance $3,800 Total Annual Savings $117,700 Source: BLSD As shown in Table 10, the District could achieve savings through bus reductions. The District should continue to utilize its routing software and determine if such a reduction is feasible based on the District’s needs. By transporting more students per bus, a district can reduce both the number of buses it uses and the costs associated with operating those buses. Financial Implication: Reducing four active buses could save approximately $117,700 based on FY 2014-15 operating data. R.10 Develop a bus replacement plan Beaver LSD does not have a formal bus replacement plan. Instead, the District replaces buses on an as needed basis according to immediate fleet needs. An analysis of the District’s fleet revealed that the average age of the District’s active bus fleet was 12 years old. According to the National Association of State Directors of Pupil Transportation Services (NASDPTS) in School Bus Replacement Considerations (NASDPTS, 2002), the replacement of school buses should be a planned process. The plan should incorporate the maintenance data collected by the District into the decision making process for bus replacements. The plan should also allow the District to establish its priorities with regard to safety and emissions features. Additionally, the publication recommends a combined approach to school bus replacement that considers both age and mileage in which replacement thresholds are set between 12 and 15 years, or 150,000 to 200,000 miles, respectively. The District should develop a formal bus replacement plan. Doing so would allow the District to communicate to its leadership and to the public about the needs of its bus fleet. Additionally, it would allow the District to communicate its progress in meeting its schedule of replacement and any risks posed by the current state of the fleet. Adopting a plan could reduce overall operating costs and help to avoid the need to replace a major portion of the fleet at the same time.

Beaver Local School District Performance Audit
Page 20
R.11 Procure fuel using the DAS cooperative purchasing program The District did not participate in a cooperative purchasing program for diesel fuel in FY 2014-15, but instead directly purchased bus fuel from a local vendor. The DAS Cooperative Purchasing Program (CPP) offers political subdivisions, including school districts, the benefits and cost savings of procuring goods and services through State contracts. Chart 4 shows a comparison between the District’s cost per gallon for diesel fuel and the price offered through the CPP on the same dates during FY 2014-15. This comparison provides insight into what the District paid for fuel and what it could have paid through cooperative purchasing.
Chart 4: DAS Diesel Fuel Price per Gallon Comparison
Source: BLSD and DAS As shown in Chart 4, the District consistently paid more per gallon for diesel fuel compared to the CPP contract in FY 2014-15. ORC § 125.04(C) states, "A [school district] may purchase supplies or services from another party, including a political subdivision, instead of through participation in contracts described in division (B) of this section if the [school district] can purchase those supplies or services from the other party upon equivalent terms, conditions, and specifications but at a lower price than it can through those contracts." Accordingly, the District should continue to price shop for fuel through the CPP and procure fuel from DAS when its prices are lower than other local vendors. Financial Implication: The District could save approximately $8,600, annually, by purchasing diesel fuel through the DAS cooperative purchasing program. These savings are based on the average difference between the District’s diesel fuel expenditures and DAS contract prices, multiplied by the District’s total fuel expenditures for FY 2014-15.
$0.00
$0.50
$1.00
$1.50
$2.00
$2.50
$3.00
$3.50
$4.00
Fuel
Pri
ce p
er G
allo
n
Date Fuel Purchased
Beaver LSD(Cost per gallon) DAS (Cost per gallon)
Beaver Local School District Performance Audit
Page 21
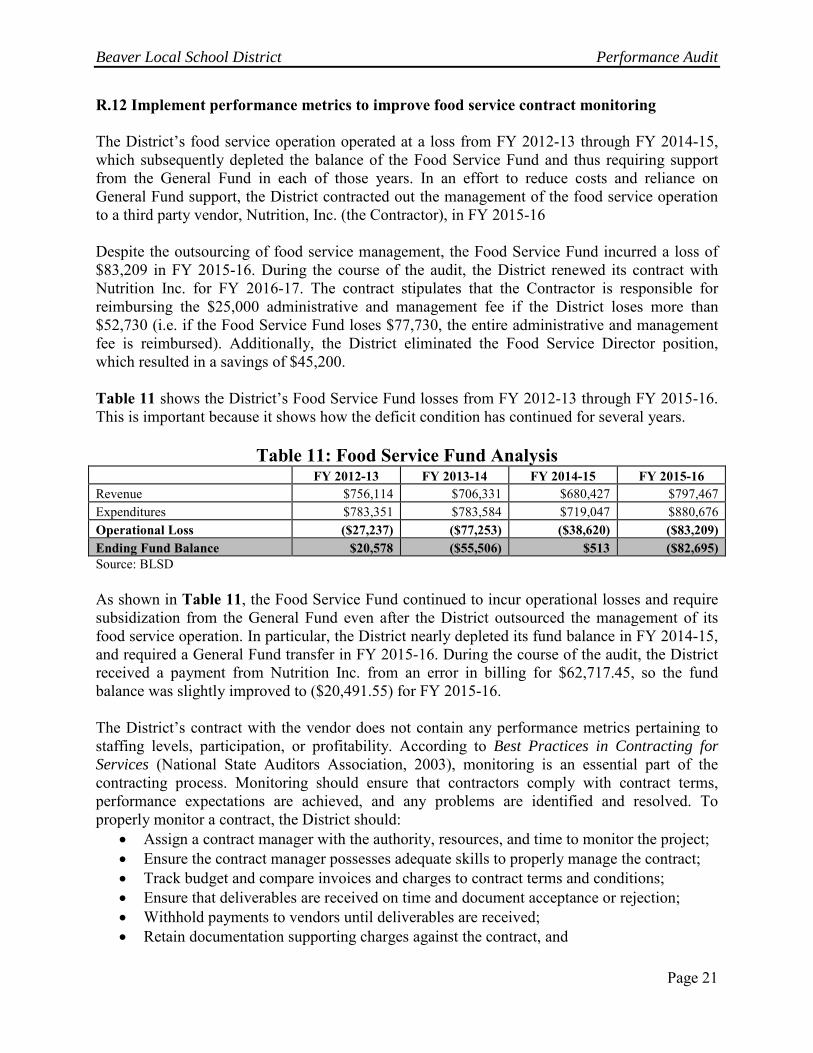
R.12 Implement performance metrics to improve food service contract monitoring The District’s food service operation operated at a loss from FY 2012-13 through FY 2014-15, which subsequently depleted the balance of the Food Service Fund and thus requiring support from the General Fund in each of those years. In an effort to reduce costs and reliance on General Fund support, the District contracted out the management of the food service operation to a third party vendor, Nutrition, Inc. (the Contractor), in FY 2015-16 Despite the outsourcing of food service management, the Food Service Fund incurred a loss of $83,209 in FY 2015-16. During the course of the audit, the District renewed its contract with Nutrition Inc. for FY 2016-17. The contract stipulates that the Contractor is responsible for reimbursing the $25,000 administrative and management fee if the District loses more than $52,730 (i.e. if the Food Service Fund loses $77,730, the entire administrative and management fee is reimbursed). Additionally, the District eliminated the Food Service Director position, which resulted in a savings of $45,200. Table 11 shows the District’s Food Service Fund losses from FY 2012-13 through FY 2015-16. This is important because it shows how the deficit condition has continued for several years.
Table 11: Food Service Fund Analysis FY 2012-13 FY 2013-14 FY 2014-15 FY 2015-16 Revenue $756,114 $706,331 $680,427 $797,467 Expenditures $783,351 $783,584 $719,047 $880,676 Operational Loss ($27,237) ($77,253) ($38,620) ($83,209) Ending Fund Balance $20,578 ($55,506) $513 ($82,695) Source: BLSD As shown in Table 11, the Food Service Fund continued to incur operational losses and require subsidization from the General Fund even after the District outsourced the management of its food service operation. In particular, the District nearly depleted its fund balance in FY 2014-15, and required a General Fund transfer in FY 2015-16. During the course of the audit, the District received a payment from Nutrition Inc. from an error in billing for $62,717.45, so the fund balance was slightly improved to ($20,491.55) for FY 2015-16. The District’s contract with the vendor does not contain any performance metrics pertaining to staffing levels, participation, or profitability. According to Best Practices in Contracting for Services (National State Auditors Association, 2003), monitoring is an essential part of the contracting process. Monitoring should ensure that contractors comply with contract terms, performance expectations are achieved, and any problems are identified and resolved. To properly monitor a contract, the District should:
• Assign a contract manager with the authority, resources, and time to monitor the project; • Ensure the contract manager possesses adequate skills to properly manage the contract; • Track budget and compare invoices and charges to contract terms and conditions; • Ensure that deliverables are received on time and document acceptance or rejection; • Withhold payments to vendors until deliverables are received; • Retain documentation supporting charges against the contract, and

Beaver Local School District Performance Audit
Page 22
• Evaluate the contract against established criteria. The District should proactively monitor its food service contract and develop performance metrics to ensure that it is making the necessary adjustments needed to achieve fund solvency. Improved contract monitoring will allow BLSD to maintain quality services and ensure that costs are reasonable and expectations are being met. Implementing performance metrics into the contract would provide the ability to ensure that the Contractor is meeting the goals the District has for its Food Service Fund. R.13 Reduce 9.3 food service labor hours The District employed a total of 14 food service employees and contracted one food service administrator in FY 2015-16. Table 12 shows the District’s meals per labor hour compared to benchmark data outlined in School Food and Nutrition Service Management for the 21st Century (Pannell-Martin and Boettger, 2014). This analysis is important in determining staffing efficiency, as staffing costs have direct and significant impact on the Food Service Fund.
Table 12: Food Service Workload Comparison
BLSD Meal Equivalents Served per Day
BLSD Daily Labor Hours
Benchmark Required Daily Labor
Hours Difference 1,408 73.3 64.0 9.3
Source: BLSD and Pannell-Martin and Boettger As shown in Table 12, the District’s daily labor hours exceeded the benchmark by 9.3 labor hours in FY 2014-15. In order to align with the benchmark, the District would need to reduce the number of daily labor hours to 64.0, or the equivalent of three part-time food service employees. During the course of the audit, the District reduced one-eight hour position due to attrition thereby implementing this recommendation. Financial Implication: If the District were to reduce labor hours to align with industry benchmarks it would realize an annual cost savings of $24,800. This is based on employee salaries, employer paid SERS contributions, and employer paid Medicare taxes. Savings tied to employee benefits were not included in the financial savings calculation due to the fact that some food service employees hold multiple positions within the District.
Beaver Local School District Performance Audit
Page 23
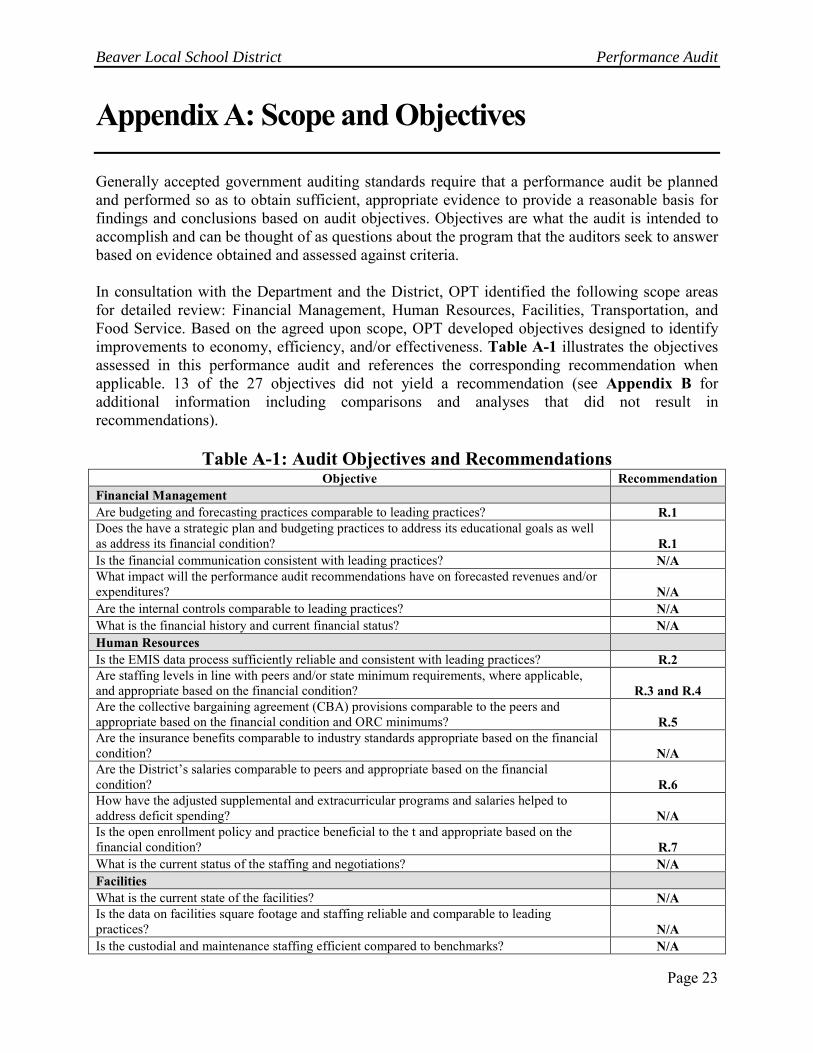
Appendix A: Scope and Objectives Generally accepted government auditing standards require that a performance audit be planned and performed so as to obtain sufficient, appropriate evidence to provide a reasonable basis for findings and conclusions based on audit objectives. Objectives are what the audit is intended to accomplish and can be thought of as questions about the program that the auditors seek to answer based on evidence obtained and assessed against criteria. In consultation with the Department and the District, OPT identified the following scope areas for detailed review: Financial Management, Human Resources, Facilities, Transportation, and Food Service. Based on the agreed upon scope, OPT developed objectives designed to identify improvements to economy, efficiency, and/or effectiveness. Table A-1 illustrates the objectives assessed in this performance audit and references the corresponding recommendation when applicable. 13 of the 27 objectives did not yield a recommendation (see Appendix B for additional information including comparisons and analyses that did not result in recommendations).
Table A-1: Audit Objectives and Recommendations Objective Recommendation
Financial Management Are budgeting and forecasting practices comparable to leading practices? R.1 Does the have a strategic plan and budgeting practices to address its educational goals as well as address its financial condition? R.1 Is the financial communication consistent with leading practices? N/A What impact will the performance audit recommendations have on forecasted revenues and/or expenditures? N/A Are the internal controls comparable to leading practices? N/A What is the financial history and current financial status? N/A Human Resources Is the EMIS data process sufficiently reliable and consistent with leading practices? R.2 Are staffing levels in line with peers and/or state minimum requirements, where applicable, and appropriate based on the financial condition? R.3 and R.4 Are the collective bargaining agreement (CBA) provisions comparable to the peers and appropriate based on the financial condition and ORC minimums? R.5 Are the insurance benefits comparable to industry standards appropriate based on the financial condition? N/A Are the District’s salaries comparable to peers and appropriate based on the financial condition? R.6 How have the adjusted supplemental and extracurricular programs and salaries helped to address deficit spending? N/A Is the open enrollment policy and practice beneficial to the t and appropriate based on the financial condition? R.7 What is the current status of the staffing and negotiations? N/A Facilities What is the current state of the facilities? N/A Is the data on facilities square footage and staffing reliable and comparable to leading practices? N/A Is the custodial and maintenance staffing efficient compared to benchmarks? N/A

Beaver Local School District Performance Audit
Page 24
Objective Recommendation Are the facilities expenditures comparable to peers? N/A Transportation Are the T Report procedures accurate and consistent with leading practices? R.8 Does the make efficient use of routing for its fleet? R.9 Is the fleet size efficient compared to leading practices? R.9 Are the bus replacement practices consistent with leading practices? R.10 Is the fuel purchasing practice resulting in efficient pricing? R.11 What is the current state of the transportation operations? N/A Food Service Is the Food Service Fund self-sufficient and consistent with leading practices? R.12 Are the food service staffing levels efficient compared to peers and / or leading practices? R.13 What is the current state of the food service operations? N/A
Beaver Local School District Performance Audit
Page 25
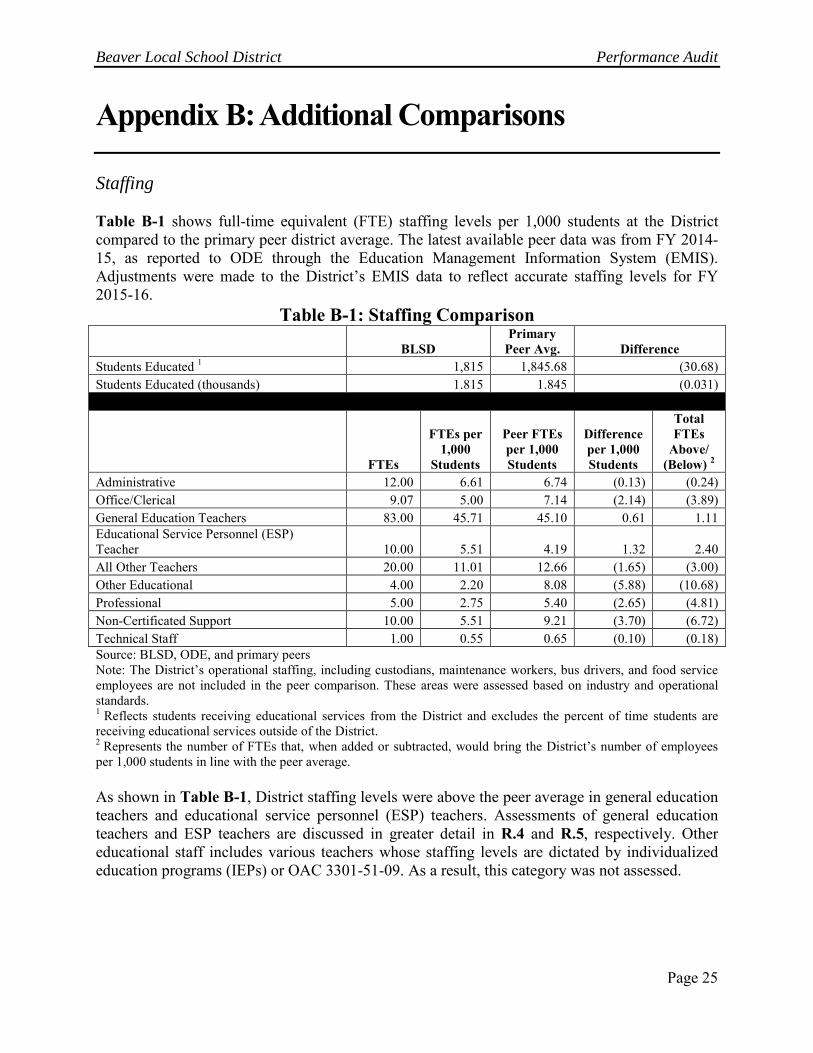
Appendix B: Additional Comparisons Staffing Table B-1 shows full-time equivalent (FTE) staffing levels per 1,000 students at the District compared to the primary peer district average. The latest available peer data was from FY 2014-15, as reported to ODE through the Education Management Information System (EMIS). Adjustments were made to the District’s EMIS data to reflect accurate staffing levels for FY 2015-16.
Table B-1: Staffing Comparison
BLSD Primary
Peer Avg. Difference Students Educated 1 1,815 1,845.68 (30.68) Students Educated (thousands) 1.815 1.845 (0.031)
FTEs
FTEs per 1,000
Students
Peer FTEs per 1,000 Students
Difference per 1,000 Students
Total FTEs
Above/ (Below) 2
Administrative 12.00 6.61 6.74 (0.13) (0.24) Office/Clerical 9.07 5.00 7.14 (2.14) (3.89) General Education Teachers 83.00 45.71 45.10 0.61 1.11 Educational Service Personnel (ESP) Teacher 10.00 5.51 4.19 1.32 2.40 All Other Teachers 20.00 11.01 12.66 (1.65) (3.00) Other Educational 4.00 2.20 8.08 (5.88) (10.68) Professional 5.00 2.75 5.40 (2.65) (4.81) Non-Certificated Support 10.00 5.51 9.21 (3.70) (6.72) Technical Staff 1.00 0.55 0.65 (0.10) (0.18) Source: BLSD, ODE, and primary peers Note: The District’s operational staffing, including custodians, maintenance workers, bus drivers, and food service employees are not included in the peer comparison. These areas were assessed based on industry and operational standards. 1 Reflects students receiving educational services from the District and excludes the percent of time students are receiving educational services outside of the District. 2 Represents the number of FTEs that, when added or subtracted, would bring the District’s number of employees per 1,000 students in line with the peer average. As shown in Table B-1, District staffing levels were above the peer average in general education teachers and educational service personnel (ESP) teachers. Assessments of general education teachers and ESP teachers are discussed in greater detail in R.4 and R.5, respectively. Other educational staff includes various teachers whose staffing levels are dictated by individualized education programs (IEPs) or OAC 3301-51-09. As a result, this category was not assessed.
Beaver Local School District Performance Audit
Page 26
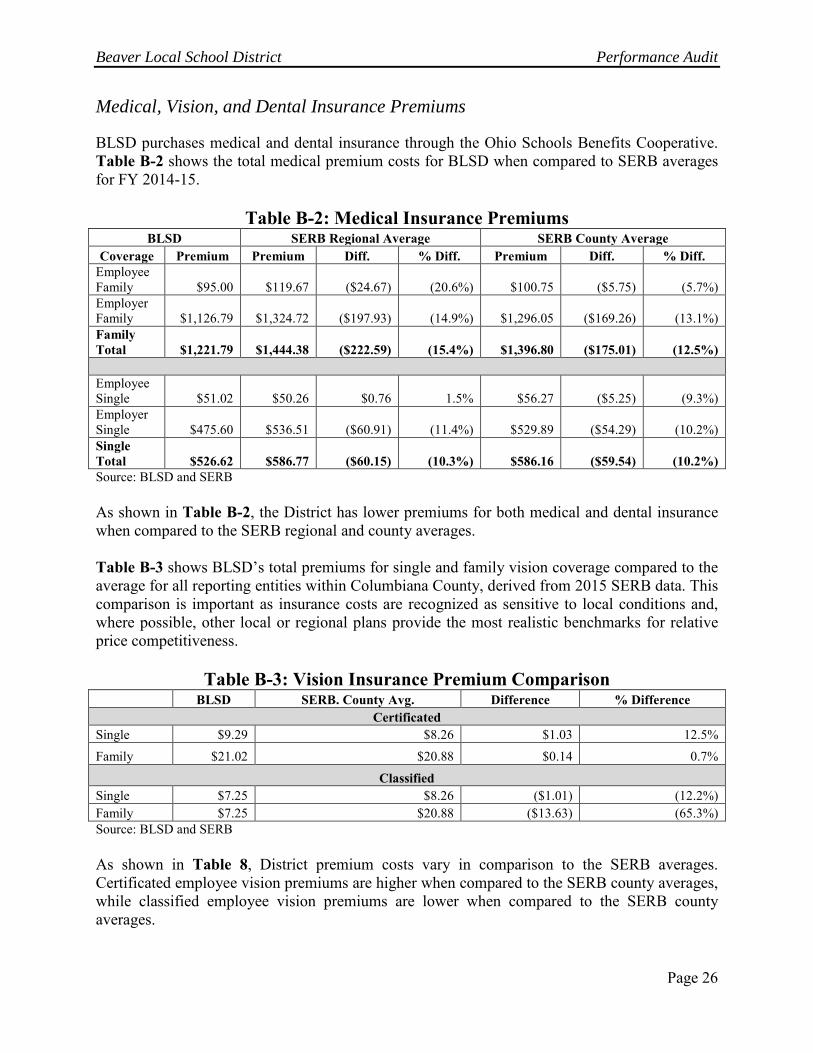
Medical, Vision, and Dental Insurance Premiums
BLSD purchases medical and dental insurance through the Ohio Schools Benefits Cooperative. Table B-2 shows the total medical premium costs for BLSD when compared to SERB averages for FY 2014-15.
Table B-2: Medical Insurance Premiums BLSD SERB Regional Average SERB County Average
Coverage Premium Premium Diff. % Diff. Premium Diff. % Diff. Employee Family $95.00 $119.67 ($24.67) (20.6%) $100.75 ($5.75) (5.7%) Employer Family $1,126.79 $1,324.72 ($197.93) (14.9%) $1,296.05 ($169.26) (13.1%) Family Total $1,221.79 $1,444.38 ($222.59) (15.4%) $1,396.80 ($175.01) (12.5%)
Employee Single $51.02 $50.26 $0.76 1.5% $56.27 ($5.25) (9.3%) Employer Single $475.60 $536.51 ($60.91) (11.4%) $529.89 ($54.29) (10.2%) Single Total $526.62 $586.77 ($60.15) (10.3%) $586.16 ($59.54) (10.2%) Source: BLSD and SERB As shown in Table B-2, the District has lower premiums for both medical and dental insurance when compared to the SERB regional and county averages. Table B-3 shows BLSD’s total premiums for single and family vision coverage compared to the average for all reporting entities within Columbiana County, derived from 2015 SERB data. This comparison is important as insurance costs are recognized as sensitive to local conditions and, where possible, other local or regional plans provide the most realistic benchmarks for relative price competitiveness.
Table B-3: Vision Insurance Premium Comparison
BLSD SERB. County Avg. Difference % Difference
Certificated Single $9.29 $8.26 $1.03 12.5% Family $21.02 $20.88 $0.14 0.7%
Classified Single $7.25 $8.26 ($1.01) (12.2%) Family $7.25 $20.88 ($13.63) (65.3%) Source: BLSD and SERB As shown in Table 8, District premium costs vary in comparison to the SERB averages. Certificated employee vision premiums are higher when compared to the SERB county averages, while classified employee vision premiums are lower when compared to the SERB county averages.
Beaver Local School District Performance Audit
Page 27
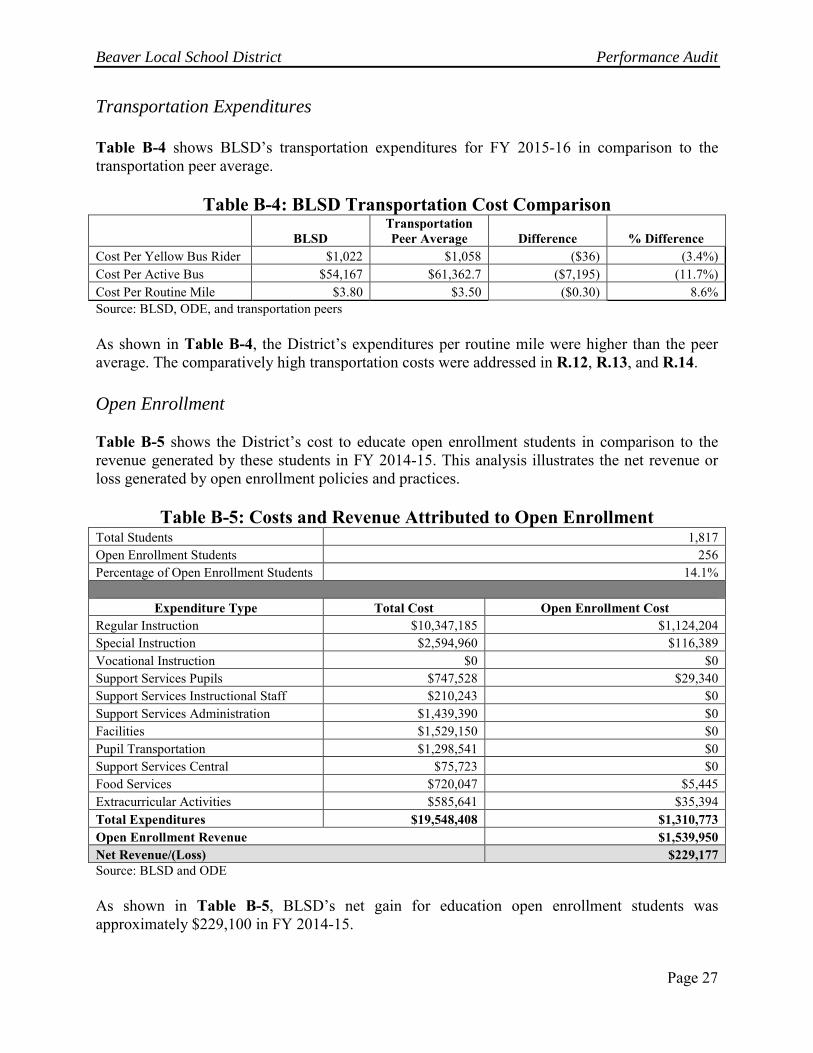
Transportation Expenditures Table B-4 shows BLSD’s transportation expenditures for FY 2015-16 in comparison to the transportation peer average.
Table B-4: BLSD Transportation Cost Comparison
BLSD
Transportation Peer Average Difference % Difference
Cost Per Yellow Bus Rider $1,022 $1,058 ($36) (3.4%) Cost Per Active Bus $54,167 $61,362.7 ($7,195) (11.7%) Cost Per Routine Mile $3.80 $3.50 ($0.30) 8.6% Source: BLSD, ODE, and transportation peers As shown in Table B-4, the District’s expenditures per routine mile were higher than the peer average. The comparatively high transportation costs were addressed in R.12, R.13, and R.14. Open Enrollment Table B-5 shows the District’s cost to educate open enrollment students in comparison to the revenue generated by these students in FY 2014-15. This analysis illustrates the net revenue or loss generated by open enrollment policies and practices.
Table B-5: Costs and Revenue Attributed to Open Enrollment Total Students 1,817 Open Enrollment Students 256 Percentage of Open Enrollment Students 14.1%
Expenditure Type Total Cost Open Enrollment Cost
Regular Instruction $10,347,185 $1,124,204 Special Instruction $2,594,960 $116,389 Vocational Instruction $0 $0 Support Services Pupils $747,528 $29,340 Support Services Instructional Staff $210,243 $0 Support Services Administration $1,439,390 $0 Facilities $1,529,150 $0 Pupil Transportation $1,298,541 $0 Support Services Central $75,723 $0 Food Services $720,047 $5,445 Extracurricular Activities $585,641 $35,394 Total Expenditures $19,548,408 $1,310,773 Open Enrollment Revenue $1,539,950 Net Revenue/(Loss) $229,177 Source: BLSD and ODE As shown in Table B-5, BLSD’s net gain for education open enrollment students was approximately $229,100 in FY 2014-15.

Beaver Local School District Performance Audit
Page 28
Extracurricular Activities Table B-6 shows a comparison of the District’s FY 2014-15 student extracurricular activity net cost per pupil to the local peer average. This comparison is important for determining whether the District’s net cost for student extracurricular activity programs was consistent with similar districts in the region.
Table B-6: Student Extracurricular Activity Net Cost Comparison
BLSD Local Peer
Average Difference % Difference Student Extracurricular Activities Net Cost $251,040 $394,316 ($143,276) (36.3%) Number of Pupils 1,815.6 1,845.7 (30.1) (1.7%) Net Cost per Pupil $138.27 $213.64 ($75.37) (35.3%) Source: BLSD and local peers As shown in Table B-6, the District’s student extracurricular activity net cost per pupil was lower than the local peer average. It is common for school districts in Ohio to subsidize extracurricular costs with General Fund money; however, while the District subsidizes a lower per pupil amount relative to the peers, the existence of a net cost places a burden on the General Fund equal to the amount of the net cost.
Beaver Local School District Performance Audit
Page 29
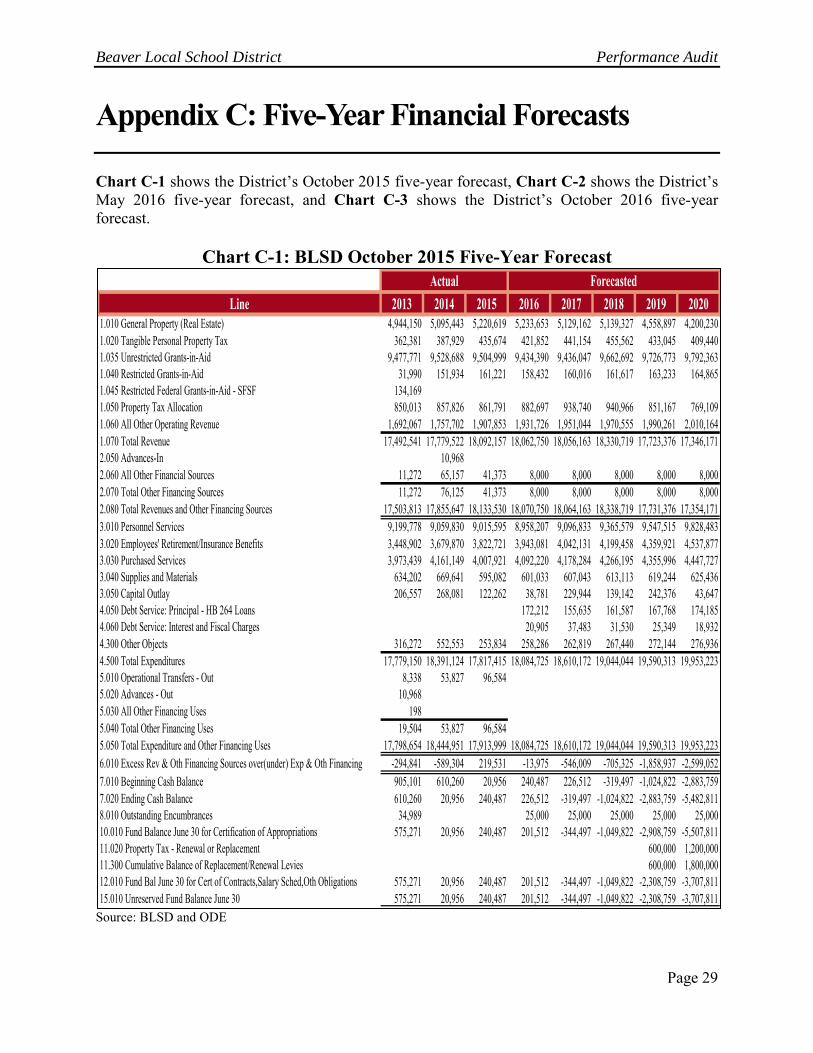
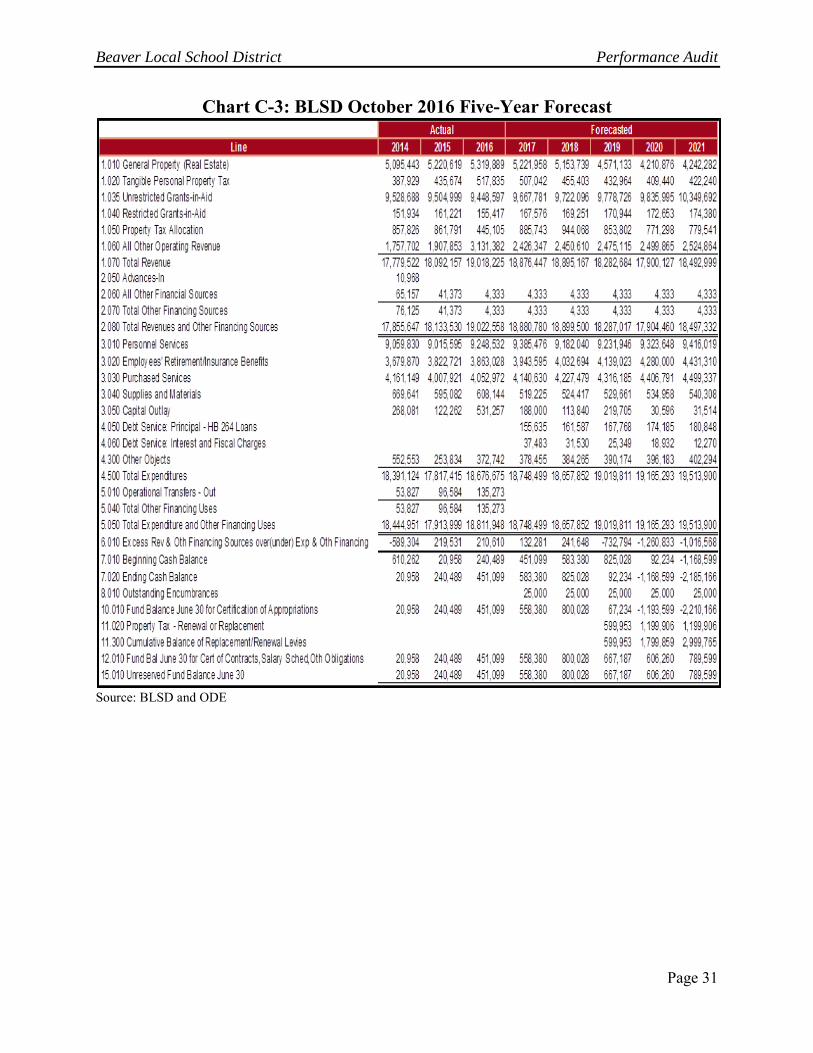
Appendix C: Five-Year Financial Forecasts Chart C-1 shows the District’s October 2015 five-year forecast, Chart C-2 shows the District’s May 2016 five-year forecast, and Chart C-3 shows the District’s October 2016 five-year forecast.
Chart C-1: BLSD October 2015 Five-Year Forecast
Source: BLSD and ODE
Line 2013 2014 2015 2016 2017 2018 2019 20201.010 General Property (Real Estate) 4,944,150 5,095,443 5,220,619 5,233,653 5,129,162 5,139,327 4,558,897 4,200,2301.020 Tangible Personal Property Tax 362,381 387,929 435,674 421,852 441,154 455,562 433,045 409,4401.035 Unrestricted Grants-in-Aid 9,477,771 9,528,688 9,504,999 9,434,390 9,436,047 9,662,692 9,726,773 9,792,3631.040 Restricted Grants-in-Aid 31,990 151,934 161,221 158,432 160,016 161,617 163,233 164,8651.045 Restricted Federal Grants-in-Aid - SFSF 134,1691.050 Property Tax Allocation 850,013 857,826 861,791 882,697 938,740 940,966 851,167 769,1091.060 All Other Operating Revenue 1,692,067 1,757,702 1,907,853 1,931,726 1,951,044 1,970,555 1,990,261 2,010,1641.070 Total Revenue 17,492,541 17,779,522 18,092,157 18,062,750 18,056,163 18,330,719 17,723,376 17,346,1712.050 Advances-In 10,9682.060 All Other Financial Sources 11,272 65,157 41,373 8,000 8,000 8,000 8,000 8,0002.070 Total Other Financing Sources 11,272 76,125 41,373 8,000 8,000 8,000 8,000 8,0002.080 Total Revenues and Other Financing Sources 17,503,813 17,855,647 18,133,530 18,070,750 18,064,163 18,338,719 17,731,376 17,354,1713.010 Personnel Services 9,199,778 9,059,830 9,015,595 8,958,207 9,096,833 9,365,579 9,547,515 9,828,4833.020 Employees' Retirement/Insurance Benefits 3,448,902 3,679,870 3,822,721 3,943,081 4,042,131 4,199,458 4,359,921 4,537,8773.030 Purchased Services 3,973,439 4,161,149 4,007,921 4,092,220 4,178,284 4,266,195 4,355,996 4,447,7273.040 Supplies and Materials 634,202 669,641 595,082 601,033 607,043 613,113 619,244 625,4363.050 Capital Outlay 206,557 268,081 122,262 38,781 229,944 139,142 242,376 43,6474.050 Debt Service: Principal - HB 264 Loans 172,212 155,635 161,587 167,768 174,1854.060 Debt Service: Interest and Fiscal Charges 20,905 37,483 31,530 25,349 18,9324.300 Other Objects 316,272 552,553 253,834 258,286 262,819 267,440 272,144 276,9364.500 Total Expenditures 17,779,150 18,391,124 17,817,415 18,084,725 18,610,172 19,044,044 19,590,313 19,953,2235.010 Operational Transfers - Out 8,338 53,827 96,5845.020 Advances - Out 10,9685.030 All Other Financing Uses 1985.040 Total Other Financing Uses 19,504 53,827 96,5845.050 Total Expenditure and Other Financing Uses 17,798,654 18,444,951 17,913,999 18,084,725 18,610,172 19,044,044 19,590,313 19,953,2236.010 Excess Rev & Oth Financing Sources over(under) Exp & Oth Financing -294,841 -589,304 219,531 -13,975 -546,009 -705,325 -1,858,937 -2,599,0527.010 Beginning Cash Balance 905,101 610,260 20,956 240,487 226,512 -319,497 -1,024,822 -2,883,7597.020 Ending Cash Balance 610,260 20,956 240,487 226,512 -319,497 -1,024,822 -2,883,759 -5,482,8118.010 Outstanding Encumbrances 34,989 25,000 25,000 25,000 25,000 25,00010.010 Fund Balance June 30 for Certification of Appropriations 575,271 20,956 240,487 201,512 -344,497 -1,049,822 -2,908,759 -5,507,81111.020 Property Tax - Renewal or Replacement 600,000 1,200,00011.300 Cumulative Balance of Replacement/Renewal Levies 600,000 1,800,00012.010 Fund Bal June 30 for Cert of Contracts,Salary Sched,Oth Obligations 575,271 20,956 240,487 201,512 -344,497 -1,049,822 -2,308,759 -3,707,81115.010 Unreserved Fund Balance June 30 575,271 20,956 240,487 201,512 -344,497 -1,049,822 -2,308,759 -3,707,811
Actual Forecasted
Beaver Local School District Performance Audit
Page 30
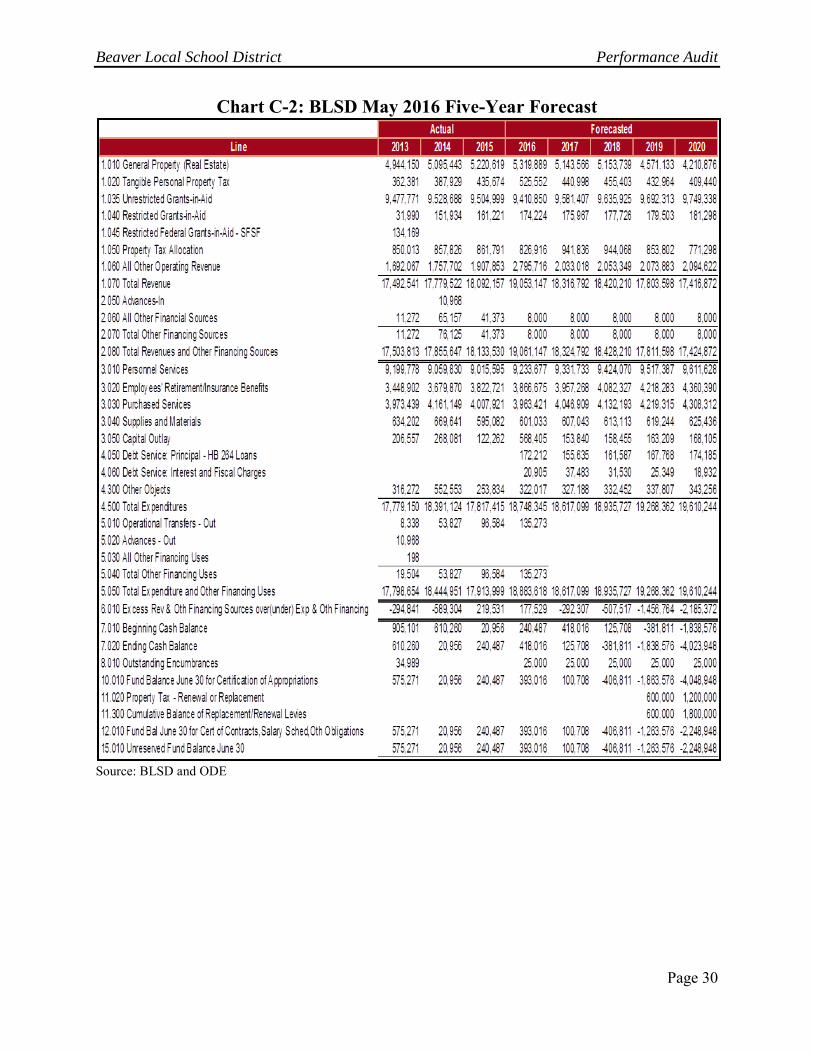
Chart C-2: BLSD May 2016 Five-Year Forecast
Source: BLSD and ODE
Beaver Local School District Performance Audit
Page 31
Chart C-3: BLSD October 2016 Five-Year Forecast
Source: BLSD and ODE
Beaver Local School District Performance Audit
Page 32
Client Response The letter that follows is the District’s official response to the performance audit. Throughout the audit process, staff met with District officials to ensure substantial agreement on the factual information presented in the report. When the District disagreed with information contained in the report, and provided supporting documentation, revisions were made to the audit report.
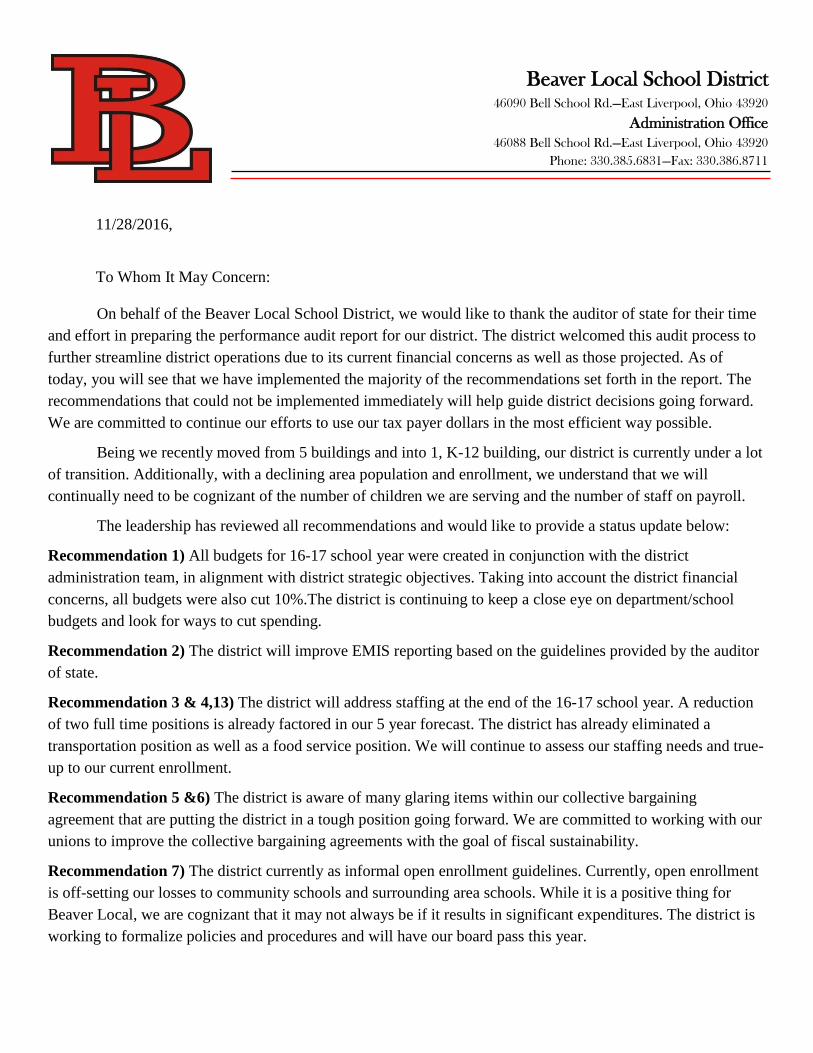
11/28/2016,
To Whom It May Concern:
On behalf of the Beaver Local School District, we would like to thank the auditor of state for their time
and effort in preparing the performance audit report for our district. The district welcomed this audit process to
further streamline district operations due to its current financial concerns as well as those projected. As of
today, you will see that we have implemented the majority of the recommendations set forth in the report. The
recommendations that could not be implemented immediately will help guide district decisions going forward.
We are committed to continue our efforts to use our tax payer dollars in the most efficient way possible.
Being we recently moved from 5 buildings and into 1, K-12 building, our district is currently under a lot
of transition. Additionally, with a declining area population and enrollment, we understand that we will
continually need to be cognizant of the number of children we are serving and the number of staff on payroll.
The leadership has reviewed all recommendations and would like to provide a status update below:
Recommendation 1) All budgets for 16-17 school year were created in conjunction with the district
administration team, in alignment with district strategic objectives. Taking into account the district financial
concerns, all budgets were also cut 10%.The district is continuing to keep a close eye on department/school
budgets and look for ways to cut spending.
Recommendation 2) The district will improve EMIS reporting based on the guidelines provided by the auditor
of state.
Recommendation 3 & 4,13) The district will address staffing at the end of the 16-17 school year. A reduction
of two full time positions is already factored in our 5 year forecast. The district has already eliminated a
transportation position as well as a food service position. We will continue to assess our staffing needs and true-
up to our current enrollment.
Recommendation 5 &6) The district is aware of many glaring items within our collective bargaining
agreement that are putting the district in a tough position going forward. We are committed to working with our
unions to improve the collective bargaining agreements with the goal of fiscal sustainability.
Recommendation 7) The district currently as informal open enrollment guidelines. Currently, open enrollment
is off-setting our losses to community schools and surrounding area schools. While it is a positive thing for
Beaver Local, we are cognizant that it may not always be if it results in significant expenditures. The district is
working to formalize policies and procedures and will have our board pass this year.
Beaver Local School District 46090 Bell School Rd.—East Liverpool, Ohio 43920
Administration Office
46088 Bell School Rd.—East Liverpool, Ohio 43920
Phone: 330.385.6831—Fax: 330.386.8711

Recommendation 8) The district has new employees performing the T-2 reporting and has already sought to
improve this process by attending local and state wide trainings. The district is confident in the T-2 reporting
process going forward.
Recommendation 9) Upon utilization of the aforementioned routing software, it was determined that the
software was of no use to our needs. In some cases the software actually doubled the travel time of an existing
route. Given the geographic lay out of our district (122 square miles), the district does not see it feasible at this
time to eliminate any bus route and still be able to achieve our goal of no more than an hour per route.
Recommendation 10) For fiscal year 16-17 BLSD has adopted a 2-1-2 bus replacement schedule. Prior to
school starting for 16-17 BLSD has purchased 2 new and one used bus to help update the fleet.
Recommendation 11) For fiscal year 16-17 BLSD has entered into an agreement with a new supplier which
installed all new equipment (fuel tanks and pumps) , and are going to maintain said pumps with no charge to the
district. This coupled with a guarantee of state minimum fuel prices should reduce the expenses on the district.
Recommendation 12) Food service contracts are negotiated annually and the district will continue to evaluate
and reassess the food service contract based on recommendations.
As a result of the Audit, the leadership team will continue to monitor finances and use this document to
help make informed decisions in regards to the financial future of our district. Once again, we thank you for
your time and effort on behalf of Beaver Local Schools.
Regards,
Stacy Williams
Treasurer
Beaver Local School District

88EastBroadStreet,FourthFloor,Columbus,Ohio43215‐3506Phone:614‐466‐4514or800‐282‐0370Fax:614‐466‐4490
www.ohioauditor.gov
BEAVER LOCAL SCHOOL DISTRICT
COLUMBIANA COUNTY
CLERK’S CERTIFICATION This is a true and correct copy of the report which is required to be filed in the Office of the Auditor of State pursuant to Section 117.26, Revised Code, and which is filed in Columbus, Ohio.
CLERK OF THE BUREAU CERTIFIED NOVEMBER 29, 2016
![[PAGE INTENTIONALLY LEFT BLANK]€¦ · inogen, inc. fiscal 2015 annual report. [page intentionally left blank]](https://static.fdocuments.in/doc/165x107/603dd78a05f41851485839e0/page-intentionally-left-blank-inogen-inc-fiscal-2015-annual-report-page-intentionally.jpg)


