This page intentionally left blank. - CalHFA NNUA iNANCiA EPOR H iSCA EAR NDE UN 30 2017 N UN 30...
176
-
Upload
trinhhuong -
Category
Documents
-
view
216 -
download
0
Transcript of This page intentionally left blank. - CalHFA NNUA iNANCiA EPOR H iSCA EAR NDE UN 30 2017 N UN 30...


This page intentionally left blank.
Fiscal Services, Finance
and Marketing Divisions
Prepared by: CALIFORNIA HOUSING FINANCE AGENCY
P.O. Box 4034 Sacramento, CA 95812-4034
877.9.CalHFA (877.922.5432) www.calhfa.ca.gov

CALIFORNIA HOUSING FINANCE AGENCY, A COMPONENT UNIT OF THE STATE OF CALIFORNIA
This page intentionally left blank.

iCOMPREHENSIVE ANNUAL FINANCIAL REPORT FOR THE FISCAL YEARS ENDED JUNE 30, 2017 AND JUNE 30, 2O16
Table of Contents
Section I: Introductory SectionMembers of the Board of Directors ....................................................................................................3
CalHFA Senior Staff ................................................................................................................................4
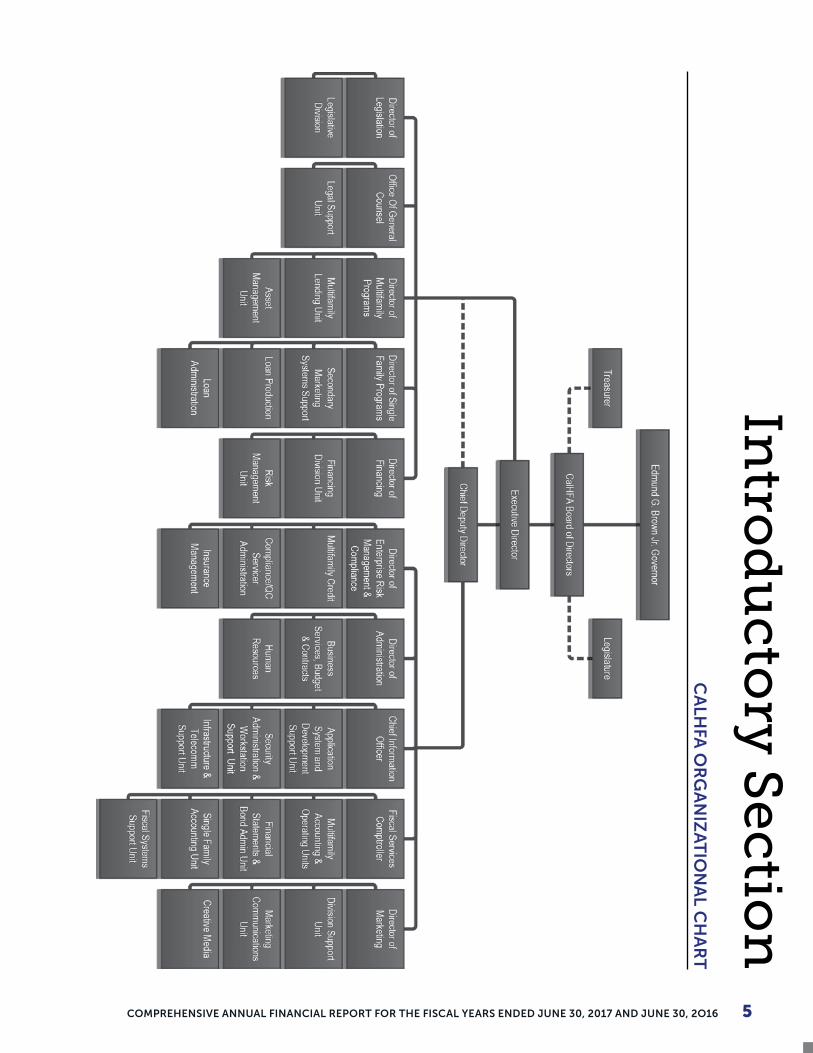
CalHFA Organization Chart ..................................................................................................................5
Letter of Transmittal ..............................................................................................................................6
Section II: Financial SectionCALIFORNIA HOUSING FINANCE FUND
Independent Auditors’ Report ........................................................................................................... 13
Management Discussion and Analysis ............................................................................................. 16
Financial Statements:
Statements of Net Position.................................................................................................................27
Statements of Revenues, Expenses and Changes in Net Position ..............................................28
Statements of Cash Flows ..................................................................................................................29
Notes to Financial Statements ........................................................................................................... 31
Required Supplementary Information
Schedule of the Fund’s Proportionate Share of the Net Pension Liability ................................ 69
Schedule of Fund Contribution .........................................................................................................70
Supplemental Combining Program Information:
Homeownership Programs, Multifamily Rental Housing Programs and Other Programs and Accounts with Combining Totals
Combining Statements of Net Position ...........................................................................................72
Combining Statements of Revenues, Expenses and Changes in Net Position .........................73
Combining Statements of Cash Flows ............................................................................................. 74
Homeownership Programs with Combining Totals
Statements of Net Position.................................................................................................................75
Statements of Revenues, Expenses and Changes in Net Position ..............................................76
Statements of Cash Flows ..................................................................................................................77
Multifamily Rental Housing Programs with Combining totals
Statements of Net Position.................................................................................................................78
Statements of Revenues, Expenses and Changes in Net Position ............................................. 80
Statements of Cash Flows ..................................................................................................................82
Other Programs and Accounts with Combining totals
Statements of Net Position................................................................................................................ 84
Statements of Revenues, Expenses and Changes in Net Position ............................................. 86
Statements of Cash Flows ................................................................................................................. 88
CALIFORNIA HOUSING FINANCE AGENCY
Comprehensive Annual Financial Report of the California Housing Finance Fund
for the Years Ended June 30, 2017 and June 30, 2016
CALIFORNIA HOUSING FINANCE AGENCY, A COMPONENT UNIT OF THE STATE OF CALIFORNIAii
Section III: Statistical SectionStatistical Summary .............................................................................................................................93
Condensed Schedules of Net Position ........................................................................................... 94
Condensed Schedules of Revenues, Expenses and Changes in Fund Net Position ............... 96
Debt Service Capacity ........................................................................................................................ 98
Outstanding Indebtedness ............................................................................................................... 116
California Industry Number of Employees by Size Category .....................................................130
California Demographics and Economic Information ................................................................ 131
CalHFA Demographics and Economics .........................................................................................132
TABLE OF CONTENTS (CONT.)
Statutory RequirementsStatistical Narrative ............................................................................................................................143
Table I-1: Summary of Single Family Lending Activity (Securitizations) ...................................152
Table I-2: Single Family Loans by Sales Price (Old Sales Price Range) .....................................153
Table I-2A: Single Family Loans by Sales Price (Revised Sales Price Range) ............................153
Table I-3: Single Family Loans by Borrower Income (Old Income Range) ..............................154
Table I-3A: Single Family Loans by Borrower Income (Revised Income Range) .....................154
Table I-4: Single Family Loans by Ethnicity ...................................................................................155
Table I-5: Single Family Loans by Household Size .......................................................................155
Table II-1: Multifamily Programs ......................................................................................................156
Table II-2–II-5: Multifamily Geographic and Financing Data ..................................................... 157
Table II-6: Multifamily Occupancy ..................................................................................................162
Table II-7: Multifamily Summary ......................................................................................................164
Table III-1: Use of Revenue Bonding Authority .............................................................................165
Table IV-1–IV-3: Summary - Multifamily Loans in Portfolio at Year End ..................................166
Table IV-4: Regulatory Agreement End Date ................................................................................169

INTRODUCTORY SECTION
COMPREHENSiVE ANNUALFiNANCiAL REPORTFOR THE YEARS ENDED JUNE 30, 2017 AND JUNE 30, 2016
IT’S AMAZING WHAT WE CAN ACCOMPLISH WHEN WE’REIN IT TOGETHER.– ESSIE MORMEN -

CALIFORNIA HOUSING FINANCE AGENCY, A COMPONENT UNIT OF THE STATE OF CALIFORNIA2
This page intentionally left blank.

Introductory Section
3COMPREHENSIVE ANNUAL FINANCIAL REPORT FOR THE FISCAL YEARS ENDED JUNE 30, 2017 AND JUNE 30, 2O16
MEMBERS OF THE BOARD OF DIRECTORS
Janet FalkCALHFA BOARD CHAIR
Ben MetcalfDIRECTOR, DEPARTMENT OFHOUSING AND COMMUNITYDEVELOPMENT, STATE OFCALIFORNIA
Jonathan C. HunterCONSULTANT, JCHUNTERCONSULTING
Tiena Johnson-HallSVP, COMMUNITYDEVELOPMENT FINANCEMANAGER, BBVA COMPASS
Alexis PodestaSECRETARY, BUSINESS, CONSUMER SERVICES AND HOUSING AGENCY, STATE OF CALIFORNIA
Eileen GallagherMANAGING DIRECTOR, STIFELSAN FRANCISCO PUBLICFINANCE OF CALIFORNIA
Ken Alex*
DIRECTOR, OFFICE OF PLANNING AND RESEARCH, STATE OF CALIFORNIA
Preston PrinceCEO AND EXECUTIVE DIRECTOR,FRESNO HOUSING AUTHORITY
Tia Boatman Patterson*
EXECUTIVE DIRECTOR,CALIFORNIA HOUSINGFINANCE AGENCY
Stephen RussellEXECUTIVE DIRECTOR, SAN DIEGO HOUSING FEDERATION
Dalila SoteloPRINCIPAL, THE SOTELO GROUP
AnaMarie Avila FariasHOUSING AUTHORITY OF CONTRA COSTA COUNTY
Michael A. GunningVICE PRESIDENT, PERSONALINSURANCE FEDERATIONOF CALIFORNIA
Michael J. Cohen*
DIRECTOR, DEPARTMENT OF FINANCE, STATE OF CALIFORNIA
Dr. Vito ImbascianiSECRETARY, DEPARTMENT OFVETERANS AFFAIRS, STATE OFCALIFORNIA
John ChiangSTATE TREASURER,STATE OF CALIFORNIA
* NON-VOTING

CALIFORNIA HOUSING FINANCE AGENCY, A COMPONENT UNIT OF THE STATE OF CALIFORNIA4
CALHFA SENIOR STAFF
Tia Boatman PattersonEXECUTIVE DIRECTOR,CALIFORNIA HOUSINGFINANCE AGENCY
Liane W. RhodesCHIEF INFORMATION OFFICER
Lori HamahashiCOMPTROLLER
Diane RichardsonDIRECTOR OF LEGISLATION
Donald CavierCHIEF DEPUTY DIRECTOR
Kathy PhillipsDIRECTOR OF MARKETING
Timothy HsuDIRECTOR OF FINANCING
Anthony SertichDIRECTOR OF MULTIFAMILY PROGRAMS
5COMPREHENSIVE ANNUAL FINANCIAL REPORT FOR THE FISCAL YEARS ENDED JUNE 30, 2017 AND JUNE 30, 2O16
Intro
du
ctory
Se
ction
CA
LHFA
OR
GA
NIZ
AT
ION
AL C
HA
RT

CALIFORNIA HOUSING FINANCE AGENCY, A COMPONENT UNIT OF THE STATE OF CALIFORNIA6
LETTER OF TRANSMITTAL
Introductory Section
7COMPREHENSIVE ANNUAL FINANCIAL REPORT FOR THE FISCAL YEARS ENDED JUNE 30, 2017 AND JUNE 30, 2O16
LETTER OF TRANSMITTAL
CALIFORNIA HOUSING FINANCE AGENCY, A COMPONENT UNIT OF THE STATE OF CALIFORNIA8
LETTER OF TRANSMITTAL

Introductory Section
9COMPREHENSIVE ANNUAL FINANCIAL REPORT FOR THE FISCAL YEARS ENDED JUNE 30, 2017 AND JUNE 30, 2O16
LETTER OF TRANSMITTAL

CALIFORNIA HOUSING FINANCE AGENCY, A COMPONENT UNIT OF THE STATE OF CALIFORNIA10
LETTER OF TRANSMITTAL

FINANCIAL SECTION
DOESN’T MATTER IF IT’S PERSONAL OR PROFESSIONAL, A GOOD PARTNERSHIP TAKES WORK.– BRIAN K. VAUGHAN -
COMPREHENSiVE ANNUALFiNANCiAL REPORTFOR THE YEARS ENDED JUNE 30, 2017 AND JUNE 30, 2016

CALIFORNIA HOUSING FINANCE AGENCY, A COMPONENT UNIT OF THE STATE OF CALIFORNIA12
This page intentionally left blank.

13

14

15

CALIFORNIA HOUSING FINANCE FUND
Management Discussion and Analysis (Unaudited)
June 30, 2017 and 2016
OVERVIEW OF THE FINANCIAL STATEMENTS
Management of the California Housing Finance Agency is pleased to offer readers of the Agency’s financial statements this narrative overview and analysis of its basic financial statements for the fiscal years ended June 30, 2017, 2016, with comparative data from the year ended June 30, 2015. Because the intent of this management discussion and analysis (“MD&A”) is to look at financial performance as a whole, we suggest that the readers should review the MD&A section in conjunction with the Letter of Transmittal, the Agency’s financial statements and notes to the financial statements to further enhance their understanding of the Agency’s financial performance. The basic financial statements of California Housing Finance Fund (“Fund”) have been prepared in accordance with U.S. generally accepted accounting principles (“GAAP”). GAAP requires the inclusion of three basic financial statements: the statement of net position (balance sheet); the statement of revenues, expenses and changes in net position (income statement); and the statement of cash flows. These required statements offer short-term and long-term financial information about the Fund.
The following MD&A applies only to the activities of the Fund. Operations of the Fund include the issuance of Agency bonds and notes to fund loans to qualified borrowers for single family houses and multifamily developments. The drastic meltdown of the U.S. housing market created an environment of historically low mortgage rates to such a degree that the Fund cannot produce a competitive mortgage rate through the traditional tax-exempt bond market. The Agency issues its own bonds and uses other available monies to provide the funding for loan programs but only if it is determined to be the most economically feasible choice. Recent bond issuances have only been executed for refunding purposes in which the Agency reissues new debt at a lower coupon rate to refund the older, higher-interest debt. Any interest paid to bondholders is generally exempt from both state and federal tax; however, the Agency also issues federally-taxable bonds. The Agency is entirely self-funded and does not draw upon the general taxing authority of the State.
The multifamily conduit issuances of the Agency are designed to facilitate both for-profit and non-profit developers in accessing tax-exempt and taxable bonds for the financing of family and senior affordable and mixed-income housing developments. The goals of the program are to increase and preserve the supply of affordable rental housing, maintain a quality living environment, leverage private sector funds to the greatest extent possible, and to cooperate with local jurisdictions to advance affordable housing goals. Conduit issuances are limited obligations of the Agency, payable solely from the revenues and other funds and money pledged and assigned under the applicable indenture, series indenture, master pledge and assignment, or funding loan agreement. Neither the Agency or the State, nor any political subdivision thereof is obligated in any manner for repayment of the debt. Accordingly, these bonds and notes are not reported as liabilities in the Agency’s financial statements. See Note 6 – Long and Short-term Liabilities – Bonds, Notes and Loans Payable and Associated Interest Rate Swaps for more information.
The financial statements present the totals of the programs and accounts of the Fund. The supplemental combining information of the Fund is organized by the following major categories: Homeownership Programs, Multifamily Rental Housing Programs, and Other Programs and Accounts. This supplemental information and additional information for specific programs and accounts is reported after the notes to the financial statements.
Historically, the Homeownership Programs provided low cost mortgage capital through the issuance of home mortgage revenue bonds to a network of approved lenders from whom the Fund purchases previously funded and closed loans secured by single family homes purchased by individual borrowers. Homeownership Programs only include the bond activities of Home Mortgage Revenue Bonds and Residential Mortgage Revenue Bonds. More recently, however, Homeownership Programs has achieved enormous success by participating in the To Be Announced (“TBA”) Market Rate Program which does not require the issuance of bonds to fund single family loans. Therefore, the TBA Market Rate Program activities are not recorded within Homeownership Programs but within the Other Programs and Accounts category.
The Multifamily Rental Housing Programs are typically used to directly fund loans to developers and housing sponsors for the construction or acquisition of multifamily rental housing developments. Within the Multifamily Rental Housing Programs, only the bond activities of the Mortgage Loan Purchase Bonds, Multifamily Housing Revenue Bonds III, Affordable Multifamily Housing Revenue Bonds, Multifamily Residential Mortgage Revenue Bonds, and Multifamily Special/Limited Obligation Bonds are recorded. Historically, the Multifamily Housing Revenue Bonds III indenture has participated in the FHA-HFA Multifamily Risk-Sharing Program with the U.S. Department of Housing and Urban Development (“HUD”). This year, the Agency entered into an agreement with the Federal Financing Bank (“FFB”) to provide capital for the multifamily loans under the FHA-HFA Multifamily Risk-Sharing Program at a reduced rate without having to issue multifamily housing revenue bonds for the
16

Overview of Financial Statements (continued)
permanent loan. Therefore, this year’s Multifamily Risk-Sharing Program activities with FFB are not recorded within Multifamily Programs but within the Other Programs and Accounts category.
The Other Programs and Accounts category includes all other non-bond related activities of the Fund. Within this category, the activities of Housing Assistance Trust (“HAT”), Contract Administration Programs (“CAP”), Federal Programs, Loan Servicing and other accounts are reported.
HAT is a source of funding used to assist in the development of single and multifamily projects through various low-interest loan and technical assistance programs and support the Agency’s business operations. Within HAT, the TBA Market Rate Program activities are being reported along with other remaining investments or loans from fully redeemed bond series or loans previously funded by HAT. The TBA Market Rate Program allows for the easy trade of eligible mortgage-backed securities (“MBS”) while supporting well-priced, long-termed, fixed-rate mortgages with or without a subordinate loan. The TBA market allows for the sale of securities before they have been finalized or before the mortgages that back the securities have been identified. Because the loans can be sold to investors prior to being finalized, the TBA market allows lender to offer borrowers a predetermined interest rate or rate lock in advance of their loan closing. This protects the borrower from a rate increase while they finalize their loan. The TBA market ensures a steady supply of capital for long-term fixed rate mortgages because the program is viable for lenders, affordable to consumers and attractive for investors. Under the TBA Market Rate Program, there is no balance sheet risk as the Fund does not hold any whole loans mortgages under this program. Once the mortgages are pooled into an MBS, the Fund purchases the MBS pool, immediately sells them to investors that same day and records a gain on sale of securities for the transaction along with other revenues and expenses of the program. Additionally, the Agency uses a credit facility from the Federal Home Loan Bank of San Francisco to purchase a select portfolio of Fannie Mae and Ginnie Mae MBS composed of loans it has originated for low to moderate income homebuyers.
Historically, CAP included various State-funded programs (Proposition 46 loan programs, Proposition 1C loan programs, Mental Health Services Act Housing Program (“MHSA”), Special Needs Housing Program (“SNHP”) and HOME Tenant Based Rental Assistance (“HOME TBRA”)), administered for the State or another State Department on a contract basis. Beginning July 1, 2016, only MHSA, SNHP and HOME TBRA remained under CAP. All other programs previously administered for the State were transferred out of the Fund to the State’s Home Purchase Assistance Fund (“HPA”) and are no longer reported by the Fund. The consolidation of multiple State loan programs into only one fund will help facilitate the operation of downpayment assistance programs in the future. The Agency will continue to perform the loan servicing on all loans transferred into HPA and continue as the administering agency for HPA.
Federal Programs includes Section 8 Housing Assistance Program, Section 811 Supportive Housing for Person with Disabilities and National Foreclosure Mitigation Counseling Program, and HOME Tenant-Based Rental Assistance Program, a program administered in collaboration with the Department of Housing and Community Development.
Other accounts maintained by the Agency provide security for the issuance of bonds, identify credit or loan agreements, emergency contingencies and report in-house loan servicing operations. Operating expenses of the Agency’s loan and bond programs are paid from an Operating Account. The Agency’s programs are operated to be self-supporting.
FINANCIAL HIGHLIGHTS
Effective July 1, 2016, per Senate Bill 837, various housing finance assistance programs previously administered by the Fund and reported under Contract Administration Programs, are no longer included in the financial reporting of the Fund. The bill transferred all obligated amounts for the programs discontinued by the bill, and any loan receivables, interest, or other amount accruing to the Agency pursuant to those programs to HPA. The effect of this transfer is explained throughout the MD&A and Notes to the Financial Statements.
The assets and deferred outflows of resources of the Fund exceeded its liabilities and deferred inflows of resources at the close of the fiscal year by $1.4 billion (net position). The $190.8 million decrease in net position was primarily due to the transfer out of $374.4 million in assets and liabilities related to Senate Bill 837 offset by the changes in net position prior to the transfer which was $150.2 million. A decrease in net position can indicate that the financial status of the Fund is deteriorating. However, this decrease in net position was a result of a legislative change and not a result of the financial operations of the Fund.
17
Financial Highlights (continued)
Total assets decreased by $667.6 million to $4.07 billion. The decrease was primarily due to the transfers of $381 million in assets related to Senate Bill 837 and increased bond redemption activities. Total liabilities decreased by $489.3 million to $2.68 billion primarily as result of bond redemption activities offset by bond issuance activities.
Operating income was $110.2 million for FY 2017 compared to $73.9 million for FY 2016, an increase of $36.3 million which is primarily due to the $54.2 million increase of realized gain on the sale of $1.86 billion in Single Family MBS related to the TBA Market Rate Program and $23.7 million decrease in program loans interest -net. See Condensed Schedule of Revenues, Expenses and Changes in Net Position for more information.
The Fund’s single family first loan portfolio was 10,842 loans as of June 30, 2017 compared to 12,423 loans as of June 30, 2016. Overall, the single family loan portfolio declined by 1,581 loans (or 12.7%). The overall delinquency ratio of the Fund’s single family first loan portfolio improved and is 6.2% (670 delinquent loans) as of June 30, 2017. By comparison, the delinquency ratio for the Agency’s single family portfolio was 6.6% (814 delinquent loans) as of June 30, 2016.
FINANCIAL ANALYSIS
Statement of Net Position
The Statement of Net Position can give readers a snapshot of the fiscal condition of the Fund as of a certain point in time as over time increases or decreases in the Fund’s net position are one indicator of whether its financial status is improving, stable, or deteriorating. There are also other indicators that should be considered when reviewing the operational results of the Fund, such as changes in the interest rate environment, bond market, state and federal laws governing the Fund’s programs, the tax code, and the real estate market in the State.
18

Statement of Net Position (continued)
Following is a comparison of the Fund’s condensed Statement of Net Position as of June 30 (dollars in thousands):
2017 2016 2015 2017/2016 2016/2015ASSETSCurrent Assets
Cash and investments $ 1,089,121 $ 1,304,336 $ 1,180,663 $ (215,215) 123,673$ Program loans receivable-net 145,639 163,299 131,059 (17,660) 32,240 Other 49,635 68,559 80,408 (18,924) (11,849)
Total Current assets 1,284,395 1,536,194 1,392,130 (251,799) 144,064 Noncurrent Assets
Investments 277,722 247,183 288,083 30,539 (40,900) Program loans receivable-net 2,500,208 2,944,550 3,292,045 (444,342) (347,495) Capital assets 652 587 754 65 (167) Other noncurrent assets 5,652 7,680 14,944 (2,028) (7,264) Total Noncurrent Assets 2,784,234 3,200,000 3,595,826 (415,766) (395,826)
Total Assets 4,068,629 4,736,194 4,987,956 (667,565) (251,762)
DEFERRED OUTFLOWS OF RESOURCES Deferred Outflows of Resources 25,123 37,995 28,302 (12,872) 9,693
LIABILITIESCurrent Liabilities
Bonds payable-net 77,762 54,592 53,733 23,170 859 Notes payable 320 1,371 2,048 (1,051) (677) Loans payable 79,595 - - 79,595 - Other current liabilities 271,586 294,827 279,752 (23,241) 15,075 Total current liabilities 429,263 350,790 335,533 78,473 14,398
Noncurrent Liabilities Bonds payable-net 2,018,112 2,529,360 2,860,893 (511,248) (331,533) Notes payable 33,037 33,616 52,532 (579) (18,916) Other noncurrent liabilities 203,993 259,959 241,443 (55,966) 18,516 Total Noncurrent Liabilities 2,255,142 2,822,935 3,154,868 (567,793) (331,933)
Total Liabilities 2,684,405 3,173,725 3,490,401 (489,320) (316,676)
DEFERRED INFLOWS OF RESOURCES Deferred Inflows of Resources 8,833 9,164 8,230 (331) 934
NET POSITIONNet investment in capital assets 652 587 754 65 (167) Restricted net position 1,399,862 1,590,713 1,516,873 (190,851) 73,840 TOTAL NET POSITION $ 1,400,514 $ 1,591,300 $ 1,517,627 $ (190,786) $ 73,673
Condensed Statement of Net Position$ Change
19
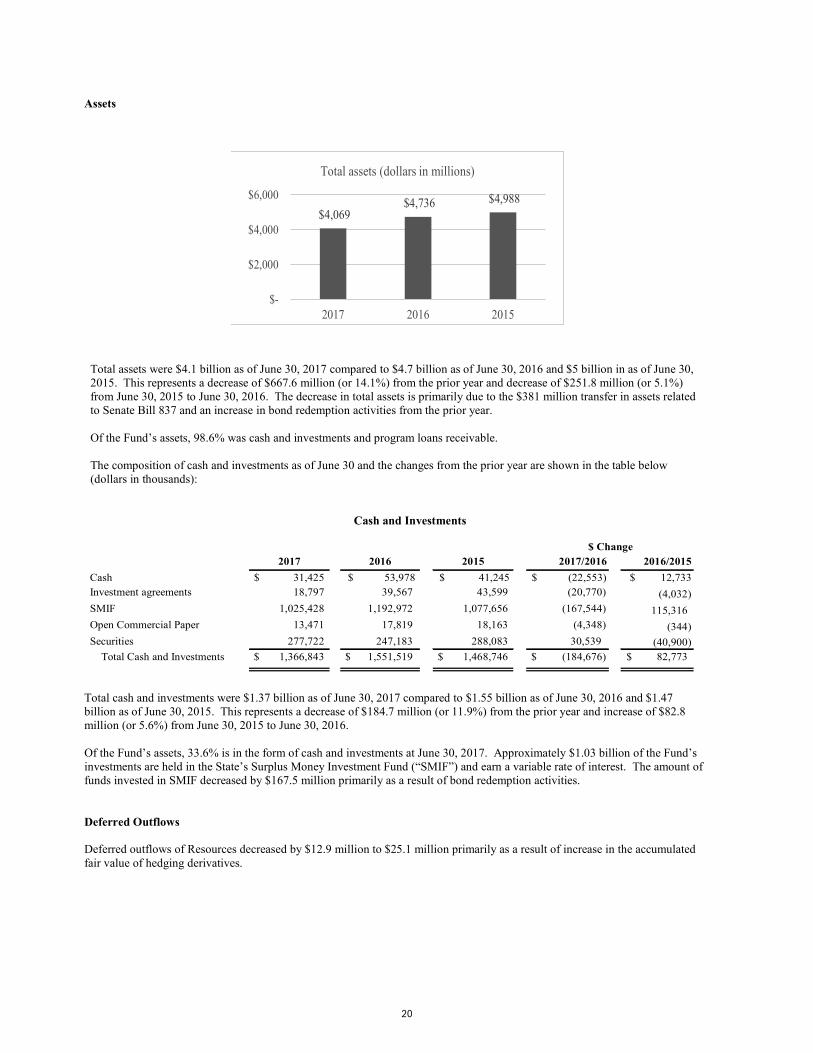
Assets
Fiscal year 2017 2016 2015Total assets (dollar in million 4,069$ 4,736$ 4,988$
$4,069 $4,736 $4,988
$-
$2,000
$4,000
$6,000
2017 2016 2015
Total assets (dollars in millions)
Total assets were $4.1 billion as of June 30, 2017 compared to $4.7 billion as of June 30, 2016 and $5 billion in as of June 30, 2015. This represents a decrease of $667.6 million (or 14.1%) from the prior year and decrease of $251.8 million (or 5.1%) from June 30, 2015 to June 30, 2016. The decrease in total assets is primarily due to the $381 million transfer in assets related to Senate Bill 837 and an increase in bond redemption activities from the prior year.
Of the Fund’s assets, 98.6% was cash and investments and program loans receivable.
The composition of cash and investments as of June 30 and the changes from the prior year are shown in the table below (dollars in thousands):
Cash and Investments
2017 2016 2015 2017/2016 2016/2015 Cash $ 31,425 $ 53,978 $ 41,245 $ (22,553) $ 12,733 Investment agreements 18,797 39,567 43,599 (20,770) (4,032) SMIF 1,025,428 1,192,972 1,077,656 (167,544) 115,316 Open Commercial Paper 13,471 17,819 18,163 (4,348) (344) Securities 277,722 247,183 288,083 30,539 (40,900)
Total Cash and Investments $ 1,366,843 $ 1,551,519 $ 1,468,746 $ (184,676) 82,773$
$ Change
Total cash and investments were $1.37 billion as of June 30, 2017 compared to $1.55 billion as of June 30, 2016 and $1.47 billion as of June 30, 2015. This represents a decrease of $184.7 million (or 11.9%) from the prior year and increase of $82.8 million (or 5.6%) from June 30, 2015 to June 30, 2016.
Of the Fund’s assets, 33.6% is in the form of cash and investments at June 30, 2017. Approximately $1.03 billion of the Fund’s investments are held in the State’s Surplus Money Investment Fund (“SMIF”) and earn a variable rate of interest. The amount of funds invested in SMIF decreased by $167.5 million primarily as a result of bond redemption activities.
Deferred Outflows
Deferred outflows of Resources decreased by $12.9 million to $25.1 million primarily as a result of increase in the accumulated fair value of hedging derivatives.
20
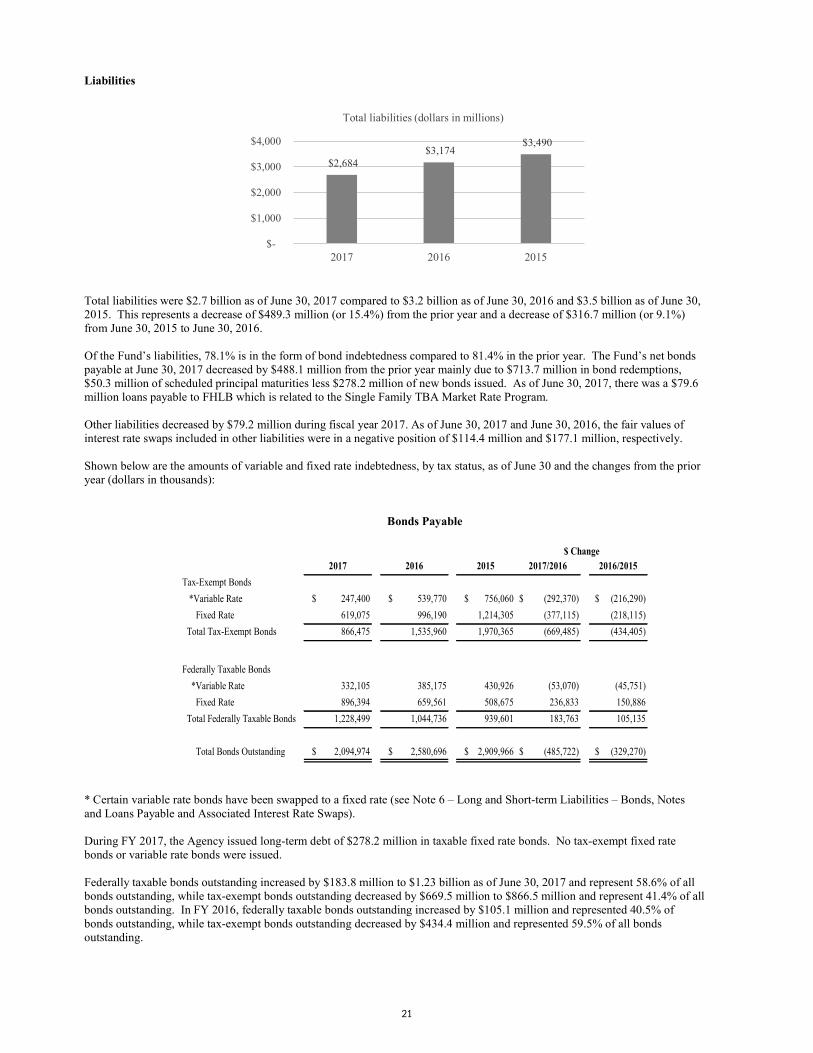
Liabilities
Fiscal year 2017 2016 2015
Total liabilities (dollar in millions) 2,684$ 3,174$ 3,490$
$2,684 $3,174
$3,490
$-
$1,000
$2,000
$3,000
$4,000
2017 2016 2015
Total liabilities (dollars in millions)
Total liabilities were $2.7 billion as of June 30, 2017 compared to $3.2 billion as of June 30, 2016 and $3.5 billion as of June 30, 2015. This represents a decrease of $489.3 million (or 15.4%) from the prior year and a decrease of $316.7 million (or 9.1%) from June 30, 2015 to June 30, 2016.
Of the Fund’s liabilities, 78.1% is in the form of bond indebtedness compared to 81.4% in the prior year. The Fund’s net bonds payable at June 30, 2017 decreased by $488.1 million from the prior year mainly due to $713.7 million in bond redemptions, $50.3 million of scheduled principal maturities less $278.2 million of new bonds issued. As of June 30, 2017, there was a $79.6 million loans payable to FHLB which is related to the Single Family TBA Market Rate Program.
Other liabilities decreased by $79.2 million during fiscal year 2017. As of June 30, 2017 and June 30, 2016, the fair values of interest rate swaps included in other liabilities were in a negative position of $114.4 million and $177.1 million, respectively.
Shown below are the amounts of variable and fixed rate indebtedness, by tax status, as of June 30 and the changes from the prior year (dollars in thousands):
Bonds Payable
2017 2016 2015 2017/2016 2016/2015Tax-Exempt Bonds
*Variable Rate $ 247,400 $ 539,770 $ 756,060 $ (292,370) $ (216,290)Fixed Rate 619,075 996,190 1,214,305 (377,115) (218,115)
Total Tax-Exempt Bonds 866,475 1,535,960 1,970,365 (669,485) (434,405)
Federally Taxable Bonds *Variable Rate 332,105 385,175 430,926 (53,070) (45,751)
Fixed Rate 896,394 659,561 508,675 236,833 150,886 Total Federally Taxable Bonds 1,228,499 1,044,736 939,601 183,763 105,135
Total Bonds Outstanding $ 2,094,974 $ 2,580,696 $ 2,909,966 $ (485,722) $ (329,270)
$ Change
* Certain variable rate bonds have been swapped to a fixed rate (see Note 6 – Long and Short-term Liabilities – Bonds, Notesand Loans Payable and Associated Interest Rate Swaps).
During FY 2017, the Agency issued long-term debt of $278.2 million in taxable fixed rate bonds. No tax-exempt fixed rate bonds or variable rate bonds were issued.
Federally taxable bonds outstanding increased by $183.8 million to $1.23 billion as of June 30, 2017 and represent 58.6% of all bonds outstanding, while tax-exempt bonds outstanding decreased by $669.5 million to $866.5 million and represent 41.4% of all bonds outstanding. In FY 2016, federally taxable bonds outstanding increased by $105.1 million and represented 40.5% of bonds outstanding, while tax-exempt bonds outstanding decreased by $434.4 million and represented 59.5% of all bonds outstanding.
21

Liabilities (continued)
Multifamily conduit bond issuances are not reported within the Fund. See Note 6 Long and Short-term Liabilities – Bonds, Notes and Loans Payable and Associated Interest Rate Swaps.
Net Position
Fiscal year 2017 2016 2015Net position (dollars in million) 1,401$ 1,591$ 1,518$
$1,401
$1,591 $1,518
$1,000 $1,100 $1,200 $1,300 $1,400 $1,500 $1,600 $1,700
2017 2016 2015
Net position (dollars in millions)
The Fund’s net position is either 1) restricted pursuant to trust agreements with bondholders and the Agency’s enabling legislation or 2) classified as net investment in capital assets. As of June 30, 2017, the total net position of the Fund is $1.4 billion, a decrease of $190.8 million from FY 2016 compared to an increase $73.7 million from FY 2015. The $190.8 million decrease in net position was primarily due to the transfer out of $374.4 million in assets and liabilities related to Senate Bill 837 offset by the changes in net position prior to the transfer which was $150.2 million. A decrease in net position can indicate that the financial status of the Fund is deteriorating. However, this decrease in net position was a result of a legislative change and not a result of the financial operations of the Fund.
Of the $1.4 billion in total net position, the Fund’s restricted net position is 99.95% of the total.
Capital Assets
Of the $1.4 billion in total net position, the Fund’s capital assets is .05% of the total. The policy of capitalizing assets is described in Note 5 – Capital Assets to the financial statements. The table below shows the Agency’s capital assets and accumulated depreciation as of June 30 and changes from the prior year.
2017 2016 2015 2017/2016 2016/2015
Data processing equipment 560$ 565$ 585$ (5)$ (20)$ Office furniture and equipment 726 684 961 42 (277) Total capital assets 1,286 1,249 1,546 37 (297) Less: Accumulated depreciation (634) (662) (792) 28 130
Total capital assets, net 652$ 587$ 754$ 65$ (167)$
$ Change
Net capital assets was $652 thousand as of June 30, 2017. The increase of $65 thousand from the prior year was primarily due to the addition of office furniture and equipment purchased during the year and accumulated depreciation of the remaining assets.
22

Statement of Revenues, Expenses, and Changes in Net Position
The statement of revenues, expenses, and changes in net position presents the revenues generated by the Fund, both operating and non-operating revenues, and the expenses incurred through operating and non-operating expenditures, and any other interfund transfers.
Following is a comparison of the Fund’s condensed Statement of Revenues, Expenses, and Changes in Fund Net Position for the fiscal years ended June 30 (dollars in thousands):
Condensed Statement of Revenues, Expenses, and Changes in Net Position
2017 2016 2015 2017/2016 2016/2015Operating Revenues:
Interest income - program loans. net $ 147,604 $ 171,278 $ 194,987 $ (23,674) $ (23,709)Interest income - Investment, net 14,296 14,436 17,507 (140) (3,071)Realized gain on sale of securities 93,765 39,549 9,471 54,216 30,078 Other loan fees 18,592 22,678 17,603 (4,086) 5,075 Other revenues (6,169) (28,529) (44,562) 22,360 16,033
Total Operating Revenues 268,088 219,412 195,006 48,676 24,406
Operating Expenses:Interest 64,123 72,288 89,960 (8,165) (17,672)Mortgage servicing fees 5,021 6,008 7,312 (987) (1,304)Salaries & general expenses 39,796 40,117 39,546 (321) 571Other expenses 48,989 27,118 13,230 21,871 13,888
Total Operating Expenses 157,929 145,531 150,048 12,398 (4,517)
Operating Income 110,159 73,881 44,958 36,278 28,923
Non-operating revenues and expensesInterest - Positive arbitrage (200) (189) (205) (11) 16 Change in fair value of investments (11,212) 7,768 (5,357) (18,980) 13,125 Investment SWAP revenue (fair value) 45,579 (10,625) 22,397 56,204 (33,022)Prepayment penalty 5,494 8,392 26,949 (2,898) (18,557)Other 409 (1,889) (449) 2,298 (1,440)Total Non-operating revenues and expenses 40,070 3,457 43,335 36,613 (39,878)
Change in net position before transfers 150,229 77,338 88,293 72,891 (10,955)Transfers out (341,015) (3,665) (432) (337,350) (3,233)Increase(decrease) in net position (190,786) 73,673 87,861 (264,459) (14,188)
Net position at beginning of year 1,591,300 1,517,627 1,478,594 73,673 39,033 Cumulative effect of adoption of GASB 68 - - (48,828) - 48,828
Net position at end of year 1,400,514$ 1,591,300$ 1,517,627$ (190,786)$ 73,673$
$ Change
23
Operating Revenues
Fiscal year 2017 2016 2015
Operating reven 268$ 219$ 195$ $268
$219 $195
$- $50
$100 $150 $200 $250 $300
2017 2016 2015
Operating revenues (dollars in millions)
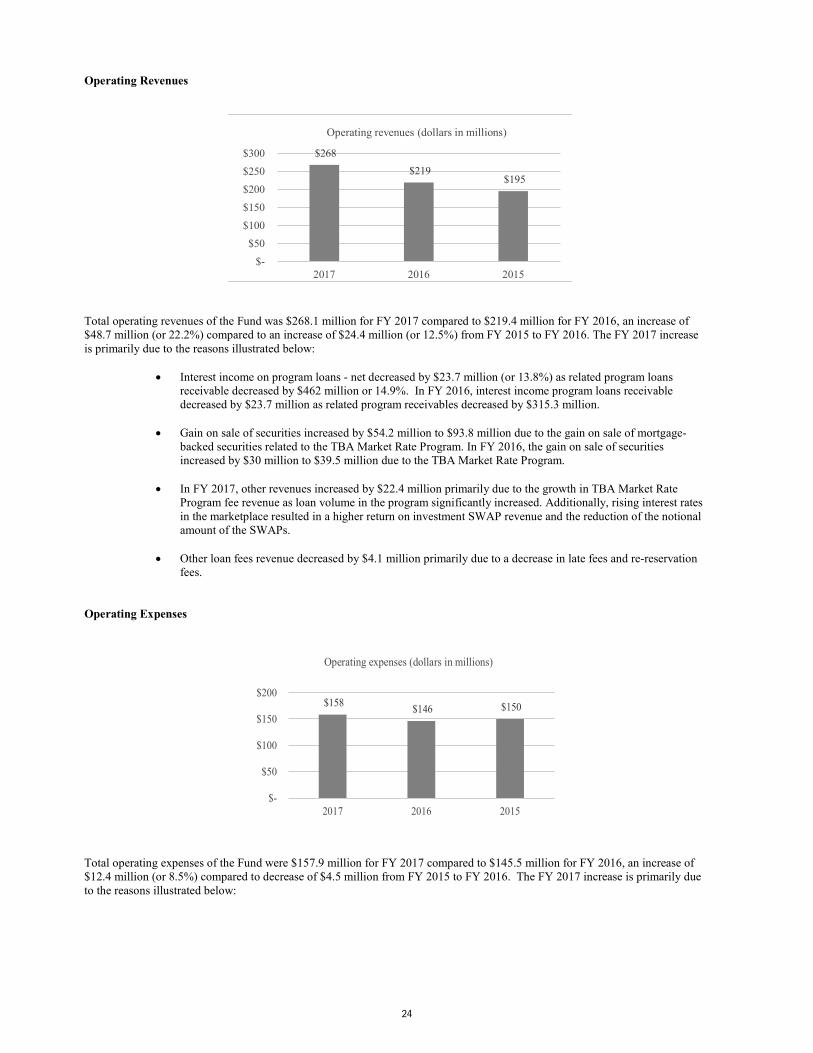
Total operating revenues of the Fund was $268.1 million for FY 2017 compared to $219.4 million for FY 2016, an increase of $48.7 million (or 22.2%) compared to an increase of $24.4 million (or 12.5%) from FY 2015 to FY 2016. The FY 2017 increase is primarily due to the reasons illustrated below:
Interest income on program loans - net decreased by $23.7 million (or 13.8%) as related program loans receivable decreased by $462 million or 14.9%. In FY 2016, interest income program loans receivable decreased by $23.7 million as related program receivables decreased by $315.3 million.
Gain on sale of securities increased by $54.2 million to $93.8 million due to the gain on sale of mortgage-backed securities related to the TBA Market Rate Program. In FY 2016, the gain on sale of securities increased by $30 million to $39.5 million due to the TBA Market Rate Program.
In FY 2017, other revenues increased by $22.4 million primarily due to the growth in TBA Market Rate Program fee revenue as loan volume in the program significantly increased. Additionally, rising interest rates in the marketplace resulted in a higher return on investment SWAP revenue and the reduction of the notional amount of the SWAPs.
Other loan fees revenue decreased by $4.1 million primarily due to a decrease in late fees and re-reservation fees.
Operating Expenses
Operating expenses (dollar in millions) 158$ 146$ 150$
$158 $146 $150
$-
$50
$100
$150
$200
2017 2016 2015
Operating expenses (dollars in millions)
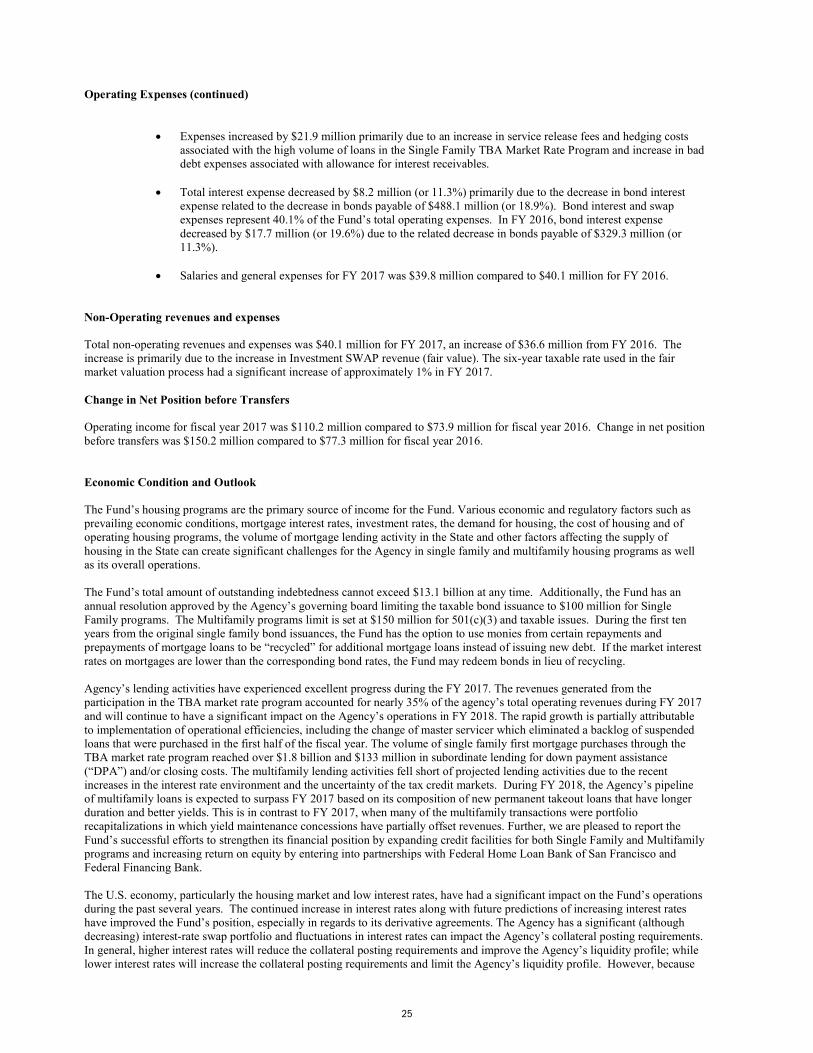
Total operating expenses of the Fund were $157.9 million for FY 2017 compared to $145.5 million for FY 2016, an increase of $12.4 million (or 8.5%) compared to decrease of $4.5 million from FY 2015 to FY 2016. The FY 2017 increase is primarily due to the reasons illustrated below:
24
Operating Expenses (continued)
Expenses increased by $21.9 million primarily due to an increase in service release fees and hedging costs associated with the high volume of loans in the Single Family TBA Market Rate Program and increase in bad debt expenses associated with allowance for interest receivables.
Total interest expense decreased by $8.2 million (or 11.3%) primarily due to the decrease in bond interest expense related to the decrease in bonds payable of $488.1 million (or 18.9%). Bond interest and swap expenses represent 40.1% of the Fund’s total operating expenses. In FY 2016, bond interest expense decreased by $17.7 million (or 19.6%) due to the related decrease in bonds payable of $329.3 million (or 11.3%).
Salaries and general expenses for FY 2017 was $39.8 million compared to $40.1 million for FY 2016.
Non-Operating revenues and expenses
Total non-operating revenues and expenses was $40.1 million for FY 2017, an increase of $36.6 million from FY 2016. The increase is primarily due to the increase in Investment SWAP revenue (fair value). The six-year taxable rate used in the fair market valuation process had a significant increase of approximately 1% in FY 2017.
Change in Net Position before Transfers
Operating income for fiscal year 2017 was $110.2 million compared to $73.9 million for fiscal year 2016. Change in net position before transfers was $150.2 million compared to $77.3 million for fiscal year 2016.
Economic Condition and Outlook
The Fund’s housing programs are the primary source of income for the Fund. Various economic and regulatory factors such as prevailing economic conditions, mortgage interest rates, investment rates, the demand for housing, the cost of housing and of operating housing programs, the volume of mortgage lending activity in the State and other factors affecting the supply of housing in the State can create significant challenges for the Agency in single family and multifamily housing programs as well as its overall operations.
The Fund’s total amount of outstanding indebtedness cannot exceed $13.1 billion at any time. Additionally, the Fund has an annual resolution approved by the Agency’s governing board limiting the taxable bond issuance to $100 million for Single Family programs. The Multifamily programs limit is set at $150 million for 501(c)(3) and taxable issues. During the first ten years from the original single family bond issuances, the Fund has the option to use monies from certain repayments and prepayments of mortgage loans to be “recycled” for additional mortgage loans instead of issuing new debt. If the market interest rates on mortgages are lower than the corresponding bond rates, the Fund may redeem bonds in lieu of recycling.
Agency’s lending activities have experienced excellent progress during the FY 2017. The revenues generated from the participation in the TBA market rate program accounted for nearly 35% of the agency’s total operating revenues during FY 2017 and will continue to have a significant impact on the Agency’s operations in FY 2018. The rapid growth is partially attributable to implementation of operational efficiencies, including the change of master servicer which eliminated a backlog of suspended loans that were purchased in the first half of the fiscal year. The volume of single family first mortgage purchases through the TBA market rate program reached over $1.8 billion and $133 million in subordinate lending for down payment assistance (“DPA”) and/or closing costs. The multifamily lending activities fell short of projected lending activities due to the recent increases in the interest rate environment and the uncertainty of the tax credit markets. During FY 2018, the Agency’s pipeline of multifamily loans is expected to surpass FY 2017 based on its composition of new permanent takeout loans that have longer duration and better yields. This is in contrast to FY 2017, when many of the multifamily transactions were portfolio recapitalizations in which yield maintenance concessions have partially offset revenues. Further, we are pleased to report the Fund’s successful efforts to strengthen its financial position by expanding credit facilities for both Single Family and Multifamily programs and increasing return on equity by entering into partnerships with Federal Home Loan Bank of San Francisco and Federal Financing Bank.
The U.S. economy, particularly the housing market and low interest rates, have had a significant impact on the Fund’s operations during the past several years. The continued increase in interest rates along with future predictions of increasing interest rates have improved the Fund’s position, especially in regards to its derivative agreements. The Agency has a significant (although decreasing) interest-rate swap portfolio and fluctuations in interest rates can impact the Agency’s collateral posting requirements. In general, higher interest rates will reduce the collateral posting requirements and improve the Agency’s liquidity profile; while lower interest rates will increase the collateral posting requirements and limit the Agency’s liquidity profile. However, because
25

Economic Condition and Outlook (continued)
of the significant decrease in the notional amount of the Agency’s interest-rate swap portfolio since the housing crisis, the fluctuations in the collateral postings, if any, would be minimal.
In addition to modifying the Agency’s lending activities to increase operational revenues, the Agency plans to continue to combat the challenges of the economy by actively reducing its debt costs through both refunding opportunities and early redemption of debt, especially with regards to its variable rate debt.
Another significant factor impacting the Agency’s operations is the trend in California home sale prices which continued to increase in FY 2015, FY 2016 and FY 2017. The upward trend in single family home prices has had a positive impact on the Agency’s profitability, although if prices trend too high, first-time homebuyers may be unable to afford homes in high-cost areas.
The Agency has primarily three credit ratings that impact its financial results:
o i) CalHFA’s issuer credit rating (S&P “A positive outlook”/Moody’s “A2 positive outlook”)
During FY 2017, CalHFA’s issuer credit rating with S&P remained “A positive outlook”, andMoody’s outlook improved from “A2 stable outlook” to “A2 positive outlook”.
o ii) Home Mortgage Revenue Bonds (S&P “AA- positive outlook”/Moody’s “A1 positive outlook”)
During FY 2017, CalHFA’s Home Mortgage Revenue Bonds S&P’s underlying rating’soutlook improved from “AA- stable outlook” to “AA- positive outlook” and Moody’sunderlying rating improved from “A2 stable outlook” to “A1 positive outlook”.
o iii) Multifamily Housing Revenue Bonds III (S&P “AA+ stable outlook”/Moody’s “A1 stable outlook”)
During FY 2017, CalHFA’s Multifamily Housing Revenue Bonds III rating remainedunchanged.
As the Fund moves into fiscal year 2018 and on into the future, the Fund will also continue to search for new methods to expand its Single Family and Multifamily lending activities consistent with State housing needs, work collaboratively with other housing entities and stakeholders to deliver effective innovative housing solutions and prevent avoidable foreclosures by providing assistance to eligible homeowners who have financial hardship and /or significant negative equity.
Request for Information
Questions concerning any of the information presented in this financial report or requests for additional information should be addressed to:
CalHFA Financing Division 500 Capitol Mall, Suite 1400 Sacramento, CA 95814 Phone: 916.326.8650 Fax: 916.322.1464 [email protected]
26

CALIFORNIA HOUSING FINANCE FUNDSTATEMENTS OF NET POSITIONJune 30, 2017 and June 30, 2016(Dollars in Thousands)
2017 2016Totals Totals
ASSETSCurrent assets: Cash and cash equivalents-- (Note 2) 31,425$ 53,978$ Investments-- (Note 2) 1,057,696 1,250,358 Current portion - program loans receivable, net of allowance-- (Note 3) 145,639 163,299 Interest receivable: Program loans, net 36,664 36,884 Investments 3,001 2,688 Accounts receivable 8,793 10,481 Other assets 1,177 18,506
Total current assets 1,284,395 1,536,194
Noncurrent assets: Investments-- (Note 2) 277,722 247,183 Program loans receivable, net of allowance-- (Note 3) 2,500,208 2,944,550 Capital assets 652 587 Other assets 5,652 7,680
Total noncurrent assets 2,784,234 3,200,000 Total assets 4,068,629 4,736,194
DEFERRED OUTFLOWS OF RESOURCES Accumulated decrease in fair value of hedging derivatives 10,051 27,441 Deferred loss on refunding 232 343 Unamortized difference & change related in pension-- (Note 9) 14,840 10,211
Total deferred outflows of resources 25,123 37,995
LIABILITIES Current liabilities: Bonds payable-- (Note 6) 77,762 54,592 Notes payable-- (Note 6) 320 1,371
Loans payable 79,595 - Interest payable 32,826 39,690 Due to other government entities, net 2,686 566 Compensated absences-- (Note 1) 2,877 3,473
Deposits and other liabilities 233,197 251,098 Total current liabilities 429,263 350,790
Noncurrent liabilities: Bonds payable-- (Note 6) 2,018,112 2,529,360 Notes payable-- (Note 6) 33,037 33,616
Due to other government entities, net 88,547 81,871 Other liabilities 114,353 177,054
Unearned revenues-- (Note 1) 1,093 1,034 Total noncurrent liabilities 2,255,142 2,822,935 Total liabilities 2,684,405 3,173,725
Commitments and contingencies (see notes 11 and 13)
DEFERRED INFLOWS OF RESOURCES Deferred gain on refunding 1,250 - Unamortized pension, net difference-- (Note 9) 7,583 9,164
Total deferred inflows of resources 8,833 9,164
NET POSITION Net investment in capital assets -- (Note 5) 652 587 Restricted by indenture 576,548 531,130 Restricted by statute 823,314 1,059,583
Total net position 1,400,514$ 1,591,300$
The accompanying notes are an intergral part of these financial statements.
27
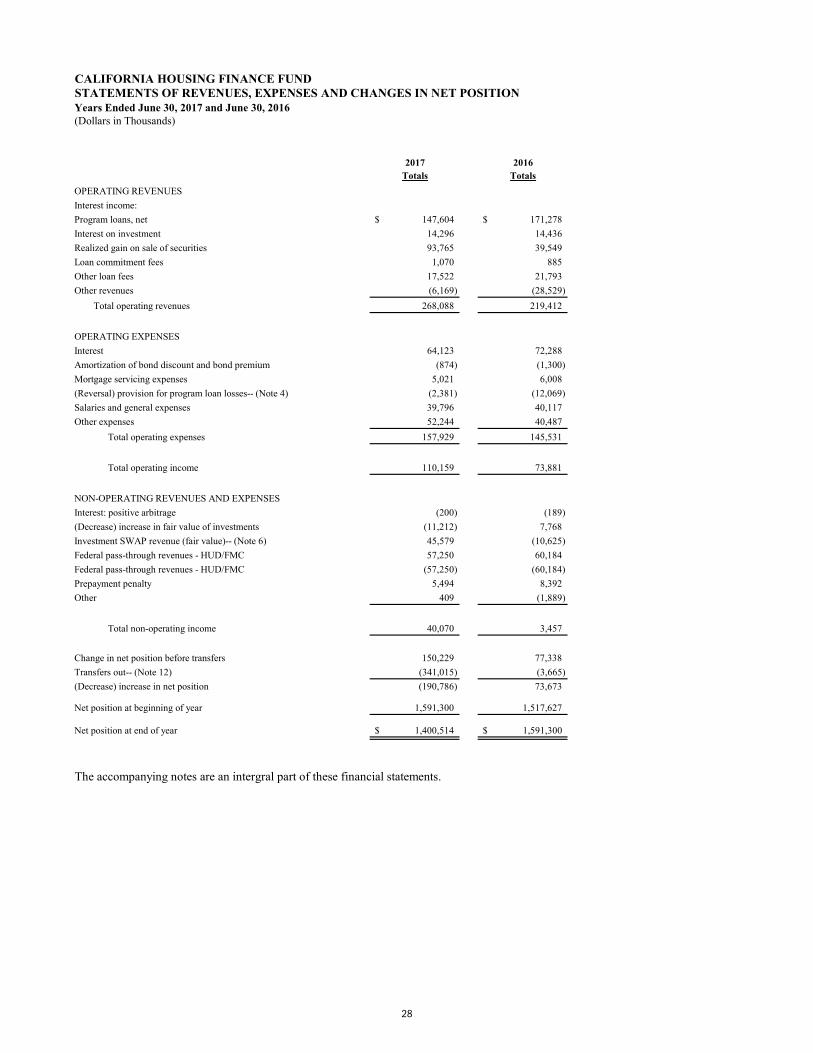
CALIFORNIA HOUSING FINANCE FUNDSTATEMENTS OF REVENUES, EXPENSES AND CHANGES IN NET POSITIONYears Ended June 30, 2017 and June 30, 2016(Dollars in Thousands)
2017 2016Totals Totals
OPERATING REVENUESInterest income:Program loans, net 147,604$ 171,278$ Interest on investment 14,296 14,436Realized gain on sale of securities 93,765 39,549Loan commitment fees 1,070 885Other loan fees 17,522 21,793Other revenues (6,169) (28,529)
Total operating revenues 268,088 219,412
OPERATING EXPENSESInterest 64,123 72,288Amortization of bond discount and bond premium (874) (1,300)Mortgage servicing expenses 5,021 6,008(Reversal) provision for program loan losses-- (Note 4) (2,381) (12,069)Salaries and general expenses 39,796 40,117Other expenses 52,244 40,487
Total operating expenses 157,929 145,531
Total operating income 110,159 73,881
NON-OPERATING REVENUES AND EXPENSESInterest: positive arbitrage (200) (189)(Decrease) increase in fair value of investments (11,212) 7,768Investment SWAP revenue (fair value)-- (Note 6) 45,579 (10,625) Federal pass-through revenues - HUD/FMC 57,250 60,184 Federal pass-through revenues - HUD/FMC (57,250) (60,184) Prepayment penalty 5,494 8,392 Other 409 (1,889)
Total non-operating income 40,070 3,457
Change in net position before transfers 150,229 77,338Transfers out-- (Note 12) (341,015) (3,665)(Decrease) increase in net position (190,786) 73,673
Net position at beginning of year 1,591,300 1,517,627
Net position at end of year 1,400,514$ 1,591,300$
The accompanying notes are an intergral part of these financial statements.
28

CALIFORNIA HOUSING FINANCE FUNDSTATEMENTS OF CASH FLOWSYears Ended June 30, 2017 and June 30, 2016(Dollars in Thousands)
2017 2016Totals Totals
CASH FLOWS FROM OPERATING ACTIVITIES Receipts from customers 147,702$ 168,400$ Payments to suppliers (14,849) (17,777)Payments to employees (32,362) (28,582)Other receipts 419,489 318,849
Net cash provided by operating activities 519,980 440,890
CASH FLOWS FROM NONCAPITAL FINANCING ACTIVITIES Due from (to) other government entities 12,778 7,275Other receipts (payments) non-operating 5,789 6,402
Net cash provided by (used for) noncapital financing activities 18,567 13,677
CASH FLOWS FROM CAPITAL AND RELATED FINANCING ACTIVITIES Proceeds from sales of bonds, notes, and loans 401,164 299,270Payment of bonds, notes, and loans principal (95,229) (67,758)Early bond redemptions (713,691) (580,374)Interest paid on debt (70,987) (80,779)Interfund transfers (341,015) (3,665)
Net cash used for capital and related financing activities (819,758) (433,306)
CASH FLOWS FROM INVESTING ACTIVITIES Proceeds from maturity and sale of investments 2,463,826 2,920,585 Purchase of investments (2,219,150) (2,943,307) Interest on investments, net 13,982 14,194
Net cash provided by (used for) investing activities 258,658 (8,528)
Net (decrease) increase in cash and cash equivalents (22,553) 12,733Cash and cash equivalents at beginning of year 53,978 41,245Cash and cash equivalents at end of year 31,425$ 53,978$
RECONCILIATION OF OPERATING INCOME TO NET CASH PROVIDED BY (USED FOR) OPERATING ACTIVITIES: Operating income 110,159$ 73,882$
Adjustments to reconcile operating income to net cash provided by operating activities: Interest expense on debt 64,123 72,288
Interest on investments (14,296) (14,436) Realized gain on sale of securities (93,765) (39,549) Amortization of bond discount 12 40 Amortization of bond premium (998) (1,444) Amortization of deferred losses on refundings of debt (11) 104
Loan commitment fees (1,070) (885) Depreciation 192 232
(Reversal) provision for program loan losses (2,381) (12,069) (Reversal) provision for yield reduction payments (4,067) (3,383) Effects of changes in operating assets and liabilities: Sale (purchase) of program loans, net 336,391 (171,840) Collection of principal from program loans, net 128,936 506,318 Interest receivable 220 (2,879) Accounts receivable 3,080 (764) Other assets 12,404 9,818 Compensated absences (596) (338) Pension liablity (1,581) 934 Deposits and other liabilities (17,901) 23,847 Unearned revenue 1,129 1,014
Net cash provided by operating activities 519,980$ 440,890$
SUPPLEMENTAL DISCLOSURE OF CASH FLOW INFORMATION Noncash transfer of program loan to REO 1,324$ 7,401$
The accompanying notes are an intergral part of these financial statements.
29

(THIS PAGE INTENTIONALLY LEFT BLANK)
30
CALIFORNIA HOUSING FINANCE FUND NOTES TO FINANCIAL STATEMENTS Fiscal Years Ended June 30, 2017 and 2016
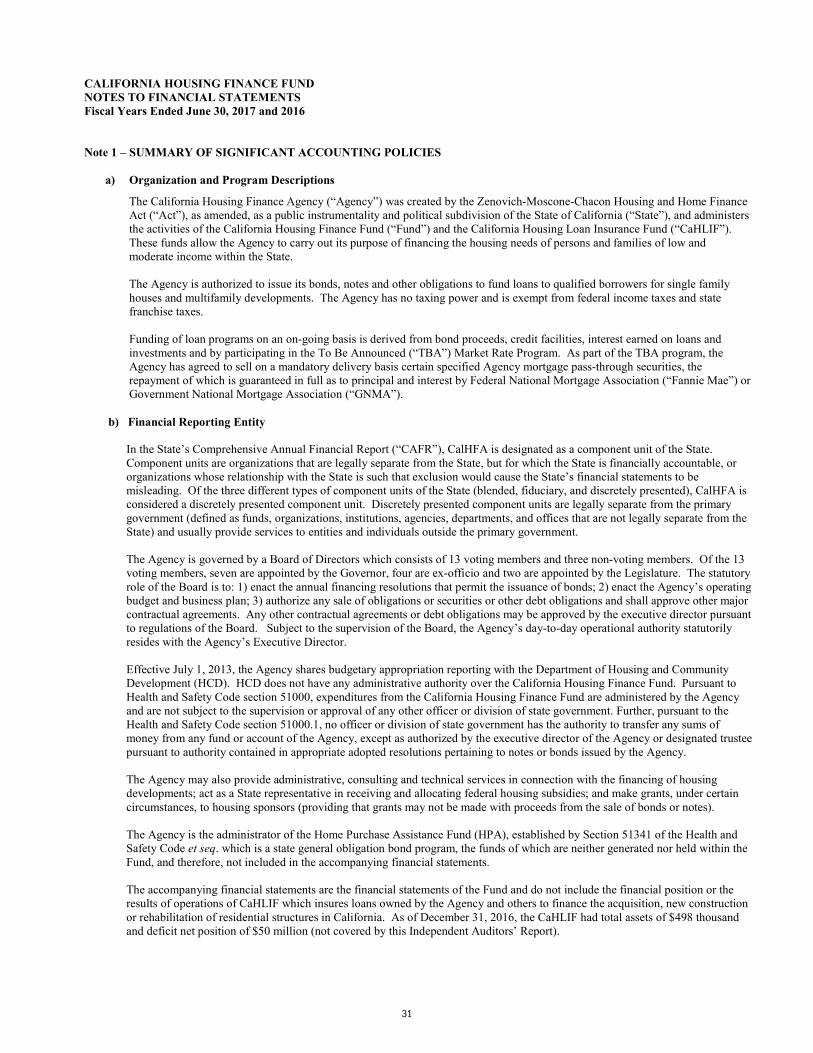
Note 1 – SUMMARY OF SIGNIFICANT ACCOUNTING POLICIES
a) Organization and Program Descriptions
The California Housing Finance Agency (“Agency”) was created by the Zenovich-Moscone-Chacon Housing and Home FinanceAct (“Act”), as amended, as a public instrumentality and political subdivision of the State of California (“State”), and administersthe activities of the California Housing Finance Fund (“Fund”) and the California Housing Loan Insurance Fund (“CaHLIF”).These funds allow the Agency to carry out its purpose of financing the housing needs of persons and families of low andmoderate income within the State.
The Agency is authorized to issue its bonds, notes and other obligations to fund loans to qualified borrowers for single familyhouses and multifamily developments. The Agency has no taxing power and is exempt from federal income taxes and statefranchise taxes.
Funding of loan programs on an on-going basis is derived from bond proceeds, credit facilities, interest earned on loans andinvestments and by participating in the To Be Announced (“TBA”) Market Rate Program. As part of the TBA program, theAgency has agreed to sell on a mandatory delivery basis certain specified Agency mortgage pass-through securities, therepayment of which is guaranteed in full as to principal and interest by Federal National Mortgage Association (“Fannie Mae”) orGovernment National Mortgage Association (“GNMA”).
b) Financial Reporting Entity
In the State’s Comprehensive Annual Financial Report (“CAFR”), CalHFA is designated as a component unit of the State.Component units are organizations that are legally separate from the State, but for which the State is financially accountable, ororganizations whose relationship with the State is such that exclusion would cause the State’s financial statements to bemisleading. Of the three different types of component units of the State (blended, fiduciary, and discretely presented), CalHFA isconsidered a discretely presented component unit. Discretely presented component units are legally separate from the primarygovernment (defined as funds, organizations, institutions, agencies, departments, and offices that are not legally separate from theState) and usually provide services to entities and individuals outside the primary government.
The Agency is governed by a Board of Directors which consists of 13 voting members and three non-voting members. Of the 13voting members, seven are appointed by the Governor, four are ex-officio and two are appointed by the Legislature. The statutoryrole of the Board is to: 1) enact the annual financing resolutions that permit the issuance of bonds; 2) enact the Agency’s operatingbudget and business plan; 3) authorize any sale of obligations or securities or other debt obligations and shall approve other majorcontractual agreements. Any other contractual agreements or debt obligations may be approved by the executive director pursuantto regulations of the Board. Subject to the supervision of the Board, the Agency’s day-to-day operational authority statutorilyresides with the Agency’s Executive Director.
Effective July 1, 2013, the Agency shares budgetary appropriation reporting with the Department of Housing and CommunityDevelopment (HCD). HCD does not have any administrative authority over the California Housing Finance Fund. Pursuant toHealth and Safety Code section 51000, expenditures from the California Housing Finance Fund are administered by the Agencyand are not subject to the supervision or approval of any other officer or division of state government. Further, pursuant to theHealth and Safety Code section 51000.1, no officer or division of state government has the authority to transfer any sums ofmoney from any fund or account of the Agency, except as authorized by the executive director of the Agency or designated trusteepursuant to authority contained in appropriate adopted resolutions pertaining to notes or bonds issued by the Agency.
The Agency may also provide administrative, consulting and technical services in connection with the financing of housingdevelopments; act as a State representative in receiving and allocating federal housing subsidies; and make grants, under certaincircumstances, to housing sponsors (providing that grants may not be made with proceeds from the sale of bonds or notes).
The Agency is the administrator of the Home Purchase Assistance Fund (HPA), established by Section 51341 of the Health andSafety Code et seq. which is a state general obligation bond program, the funds of which are neither generated nor held within theFund, and therefore, not included in the accompanying financial statements.
The accompanying financial statements are the financial statements of the Fund and do not include the financial position or theresults of operations of CaHLIF which insures loans owned by the Agency and others to finance the acquisition, new constructionor rehabilitation of residential structures in California. As of December 31, 2016, the CaHLIF had total assets of $498 thousandand deficit net position of $50 million (not covered by this Independent Auditors’ Report).
31

Note 1 – SUMMARY OF SIGNIFICANT ACCOUNTING POLICIES (continued)
The accompanying financial statements are the financial statements of the Fund and do not include the financial position or the results of operations of CalHFA Mortgage Assistance Corporation (“CalHFA MAC”) which is a nonprofit public benefit corporation and organized as an entity separate from CalHFA. As of September 30, 2016, CalHFA MAC had total assets of $257 million and a net position of $0 (not covered by this Independent Auditors’ Report).
c) Programs and accounts
The Fund has the following program and accounts:
Homeownership Programs
Home Mortgage Revenue Bonds: The Home Mortgage Revenue Bonds provided financing for the Agency’s Home MortgageProgram which purchases eligible mortgage loans, secured by trust deeds on newly constructed or existing single family homes,condominiums, planned unit developments and manufactured housing permanently attached to the land and originated andserviced by qualified lending institutions. All mortgage loans purchased under this program are insured either by the FederalHousing Administration (“FHA”), CaHLIF, the Department of Veterans Affairs (“VA”), a private mortgage guaranty insurancepolicy, or a combination thereof, covering a loss of up to fifty percent (50%), one hundred percent (100%) in the case of a FHA insured loan, of the outstanding principal amount of the mortgage loans. As of June 30, 2017 there were no bonds outstandingunder the program.
Residential Mortgage Revenue Bonds: The Residential Mortgage Revenue Bonds were issued by the Agency pursuant to anational initiative of the United States Treasury to assist state and local housing finance authorities by the Federal Program. TheBonds, issued as escrow bonds pursuant to the Indenture, were converted to long-term fixed-rate bonds. The Treasury agreed,through government-sponsored agencies, to purchase certain mortgage revenue bonds at rates lower than the prevailing marketintended to reduce the costs of funds to issuers to the making or financing of mortgage loans.
Multifamily Rental Housing Programs
Multifamily Loan Purchase Bonds: On July 26, 2000, the Agency purchased 278 Department of Housing and Urban Development (“HUD”) Section 236 loans with an aggregate unpaid principal balance of approximately $269 million. The purpose of this transaction was to enhance the ability of the Agency to assist affordable housing sponsors to refinance their projects and extend the period during which the units are offered at affordable rents to very-low-income and lower-income tenants. The Agency expects to provide the financing for many of these transactions. As of June 30, 2017, there was no balance for this bonds.
Multifamily Housing Revenue Bonds III: The Multifamily Housing Revenue Bonds III are fixed or variable rate bonds collateralized by GNMA mortgage-backed securities and/or FHA insured loans and/or uninsured loans. The bonds provide financing for multi-unit rental housing developments which are utilized for occupancy by persons and families of low and moderate income. The loans may provide acquisition, construction (both for new construction and rehabilitation), and permanent financing for developments.
Affordable Multifamily Housing Revenue Bonds: The Affordable Multifamily Housing Revenue Bonds were issued under the Indenture in connection with the New Issue Bond Program of the HFA Initiative pursuant to the Memorandum of Understanding dated October 19, 2009 among Treasury, the Federal Housing Finance Agency, Fannie Mae and Freddie Mac to facilitate financing for various state and local housing finance agencies to serve homebuyers and low and moderate income renters.
Multifamily Residential Mortgage Revenue Bonds: The Residential Mortgage Revenue Bonds were issued by the Agency pursuant to a national initiative of the United States Treasury to assist state and local housing finance authorities by the Federal Program. The Bonds, issued as escrow bonds pursuant to the Indenture, were converted to long-term fixed-rate bonds. The Treasury agreed, through government-sponsored agencies, to purchase certain mortgage revenue bonds at rates lower than the prevailing market intended to reduce the costs of funds to issuers to the making or financing of multifamily loans.
Special Obligation Multifamily Housing Revenue Bonds and Multifamily Housing Revenue Bonds: The Special Obligation Multifamily Housing Revenue Bonds and Multifamily Housing Revenue Bonds are secured by FHA risk-share insured mortgage loans. The bonds provide financing for the acquisition and rehabilitation of multifamily affordable residential rental development.
Other Programs and Accounts
Housing Assistance Trust: The Housing Assistance Trust (“HAT”) is comprised of remaining investments in mortgage loans from fully redeemed bond indentures, and funds to assist in the development of single and multifamily projects through various low-interest loan and technical assistance programs. Also, included within HAT are the TBA Market Rate Program and funds held in trust representing Earned Surplus and Financial Adjustment Factor (“FAF”) Savings from HUD Section 8 projects. Earned
32
Note 1 – SUMMARY OF SIGNIFICANT ACCOUNTING POLICIES (continued)
Surplus is to be used in lowering the rents for persons and families of low or moderate income in accordance with state law. FAF Savings are to be used in providing decent, safe, and sanitary housing, which is available for very-low income families and persons qualifying in accordance with federal law.
Contract Administration Programs: The Agency administers loan and grant programs for the Mental Health Services Act Housing Program, Special Needs Housing Program and HOME Tenant-Based Rental Assistance. Funding of these programs was appropriated by the legislature or provided by voter authorized State bond programs to other departments and agencies within the State that have contracted with the Agency for this purpose. All monies transferred in accordance with the agreements and for the purposes of the program are considered assets of the Fund. The Fund had net cash transfers out of $341 million and $3.7 million for fiscal year 2017 and 2016, respectively. Information regarding detailed transfers is reported in Note 12 – Transfers to Other Funds/Government Agencies.
Supplementary Bond Security Account: This account was established exclusively to secure issuances of bonds. This security may be accomplished by creating supplementary reserve accounts to provide for payment of the principal, interest, redemption premiums or sinking fund payments on bonds, or by insuring mortgage loans made with the proceeds of bond issues.
Emergency Reserve Account: This account was recently updated in Resolution 17-12 and the purpose of the account is to fund unforeseen expenditures for previously Board authorized obligations, fund necessary administrative and operating expenses for which funds may not otherwise be available and/or to fund the payment of any obligations or commitments previously approved by the Board which are necessary to protect the credit ratings of the Agency and the security interest of holders of the Agency’s bonds, notes or other debt instruments, including other financing instruments and obligations associated with the issuance of the Agency’s bonds, notes or other debt instruments. To the extent funds are available as determined by the Director of Financing, the Emergency Reserve Account shall be computed and shall be established and funded no later than each June 30th at not less than one hundred percent (100%) of the approved operating budget for the upcoming fiscal year, rounded to the nearest million.
Loan Servicing: The Agency services nearly all multifamily program loans, approximately 53.3% of the Agency’s homeownership program loans in first lien position (as of June 30, 2017), and all junior or subordinate lien homeownership program loans and certain other loans for the California State Teachers’ Retirement System and Fannie Mae. Loan servicing agreements require that the Agency hold and maintain escrow and reserve accounts, on behalf of borrowers, that are reported under “Deposits and Other Liabilities.”
Citigroup Global Markets: The Loan Agreements were made and entered into by and between the Agency and Citibank, N.A., as lender, under the Zenovich-Moscone-Chacon Housing and Home Finance Act. Pursuant to the Loan Agreements, the proceeds of the Agency Loans will be used to retire certain indebtedness of the Agency including to refund and redeem all or a portion of certain Multifamily Rental Housing Bonds of the Agency that were originally issued to finance the Projects, and for other valid purposes of the Agency under the Act. As of June 30, 2017, there were no outstanding loan agreements.
Federal Programs: The Agency administers loan and grant programs for HUD Section 8 Housing Assistance Payments, HUD Section 811 Supportive Housing for Persons with Disabilities and HUD National Foreclosure Mitigation Counseling.
Operating Account: The Operating Account was established for purposes of depositing funds available to the Agency for payment of operating and administrative expenses of the Agency and financing expenditures not associated with specific bond funds.
Federal Financing Bank: The Agency has entered into agreements with the U.S. Treasury and the Department of Housing and Urban Development in order to provide capital for multifamily loans at reduced rates otherwise unavailable in the current market. Under this program, the U.S. Treasury will use the Federal Financing Bank (FFB) to participate in multifamily loans insured under the Federal Housing Administration’s HFA Risk-Sharing Program. This program provides permanent financing at very competitive interest rates which helps preserve and increase affordable housing.
Federal Home Loan Bank: The Agency was approved for $100 million in financing availability form the Federal Home Loan Bank of San Francisco (FHLB) in June 2016. The Agency has access to FHLB secured credit line to fund a select portfolio of Fannie Mae and Ginnie Mae mortgage-backed securities composed of single family loans it has originated for low to moderate income homebuyers. The Agency believes that access to FHLB’s competitively priced funding will provide the Agency with flexibility in how the Agency raises capital for lending and will expand our lending capacity. It will help the Agency manage its liquidity and lower the costs of capital, which will ultimately help more Californians have a place to call home.
d) Basis of Presentation and Accounting
The Fund is accounted for as an enterprise fund. Accordingly, the accompanying financial statements have been prepared usingthe economic resources measurement focus and accrual basis of accounting as required by accounting principles generally
33
Note 1 – SUMMARY OF SIGNIFICANT ACCOUNTING POLICIES (continued)
accepted in the United States of America (hereinafter referred to as “Generally Accepted Accounting Principles”, GAAP). Measurement focus refers to what is being measured; basis of accounting refers to when revenues and expenses are recognized in the accounts and reported in the financial statements. Basis of accounting relates to the timing of the measurement made, regardless of the measurement focus applied. Under accrual basis of accounting, revenues are recorded when earned, and expenses are recorded when liabilities are incurred.
The Agency follows the business-type accounting requirements of GASB Statement 34, which provides the following sections be included in the annual financial report:
Management’s discussion and analysis Basic financial statements including a statement of net position, statement of revenues, expenses and changes in net
position, and a statement of cash flows. Notes to basic financial statements Required supplementary information including schedules related to pension and other postemployment benefits funding
e) Recently Adopted Accounting Pronouncements
In June 2015, GASB issued Statement No. 74, Financial Reporting for Postemployment Benefit Plans Other Than Pension Plans,effective for financial statements for fiscal years beginning after June 15, 2016. The objective of this Statement is to improve theusefulness of information about postemployment benefits other than pension (other postemployment benefits or OPEB). ThisStatement replaces Statements No. 43, Financial Reporting for Postemployment Benefit Plans Other Than Pension Plans, andGASB No. 57, OPEB Measurements by Agent Employers and Agent Multiple-Employer Plans. The Agency adopted GASB 74 forthe fiscal year ended June 30, 2017.
In March 2016, GASB also issued Statement No. 82, Pension Issues – An Amendment of GASB Statements No. 67, No. 68, andNo. 73, effective for reporting periods beginning after June 15, 2016. This statement address the issues regarding (1) thepresentation of payroll-related measures, (2) the selection of assumptions and treatment of deviations, and (3) the classification ofpayments made by employers. The Agency adopted GASB 82 for the fiscal year ended June 30, 2017.
f) New Accounting Pronouncements to be adopted in the future
In June 2015, GASB issued Statement No. 75, Accounting and Financial Reporting for Postemployment Benefits Other ThanPensions, effective for fiscal years beginning after June 15, 2017. The primary objective of this Statement is to improveaccounting and financial reporting by state and local governments for postemployment benefits other than pension (OPEB). TheAgency plans to adopt GASB 75 for the periods beginning July 1, 2017.
In November 2016, GASB issued Statement No. 83, Certain Asset Retirement Obligations, effective for reporting periodsbeginning after June 15, 2018. This Statement establishes criteria for determining the timing and pattern of recognition of aliability and a corresponding deferred outflow of resources for asset retirement obligations (AROs). This Statement requires thatrecognition occur when the liability is both incurred and reasonably estimable. The Agency plans to adopt GASB 83 for theperiods beginning July 1, 2018.
In January 2017, GASB issued Statement 84, Fiduciary Activities, effective for reporting periods beginning after December 15,2018. The objective of this Statement is to improve guidance regarding the identification of fiduciary activities for accounting andfinancial reporting purpose and how those activities should be reported. The Agency believes that GASB 84 will have no effecton the financial statement of the Fund.
In March 2017, GASB issued Statement 85, Omnibus 2017, effective for reporting period beginning after June 15, 2017. ThisStatement addresses a variety of topics including issues related to blending component units, goodwill, fair value measurementand application, and postemployment benefits. The Agency plans to adopt GASB 85 for reporting periods beginning July 1, 2017.
In June 2017, GASB issued Statement 86, Certain Debt Extinguishment Issues, effective for periods beginning after June 15,2017. The objective of this Statement is to improve consistency in accounting and financial reporting for in-substance defeasanceof debt by providing guidance for transactions in which cash and other monetary assets acquired with only existing resources areplaced in an irrevocable trust for the sole purpose of extinguishing debt. The Agency believes that GASB 86 will have no effecton the financial statement of the Fund.
In June 2017, GASB also issued Statement 87, Leases, effective for reporting periods beginning after December 15, 2019. ThisStatement increases the usefulness of governments’ financial statements by requiring recognition of certain lease assets andliabilities for leases that previously were classified as operating leases and recognized as inflows of resources or outflows ofresources based on the payment provisions of the contact. The Agency plans to adopt GASB 87 for the reporting periodsbeginning July 1, 2020.
34

Note 1 – SUMMARY OF SIGNIFICANT ACCOUNTING POLICIES (continued)
g) Use of Estimates
The preparation of financial statements in conformity with Generally Accepted Accounting Principles requires management tomake estimates and assumptions that affect the reported amounts of assets and liabilities and the disclosure of contingent liabilitiesat the date of the financial statements and the reported amounts of revenues and expenses during the reporting period. Significantestimates are used in determining the fair values of the interest rate swaps. The fair values of the swaps are based on factors suchas future interest rates and a discount rate. Actual results could differ materially from those estimates.
h) Cash and Cash Equivalents:
The Agency considers cash on hand, cash on deposit with financial institutions and cash held in money market funds to be cashand cash equivalents.
i) Investments:
Investment of funds is restricted by the California Code section 16430 – 16431, Agency’s Investment Policy, and various bondresolutions and indentures of the Agency.
GASB No. 72, Fair Value Measurement and Application (Statement No. 72), revises and establishes new financial reportingrequirements for governments related to fair value measurements. The Agency was already in compliance with the Statement’srequirement that investments be measured at fair value.
Investment securities, other than certain non-participating fixed interest investment contracts, are stated at fair value, which is theprice that would be received to sell an asset or paid to transfer a liability in an orderly transaction between two market participantsat the measurement date. Purchase and sale transactions are recorded on the trade date.
Any monies determined to be in excess of the Funds’ immediate needs are swept into the Surplus Money Investment Fund(SMIF), managed by the California State Treasurer for investment. All earnings derived from investments of SMIF areapportioned to the contributing funds as provided in the code. The value of each participating dollar equals the fair value dividedby the amortized cost of the SMIF. The funds of the SMIF are invested by the Pooled Money Investment Board. The SMIF is notrated.
j) Income from Investments
Income from investments is recognized when earned and includes interest, dividends and other income.
k) Interest Rate Swap Agreements
The Agency enters into interest rate swap agreements with swap counterparties to manage variable interest rate risk exposureresulting from the issuance of variable rate bonds. The interest rate swap agreements provide synthetic fixed rates of interest onthe underlying bonds and are accounted for as matched swaps in accordance with settlement accounting. An interest rate swap isconsidered to be a matched swap if it is linked through designation with an asset or liability that is on the statements of netposition, provided that it has the opposite interest characteristics of such Statements of net position item. Under settlementaccounting, periodic net cash settlements under the swap agreements are treated as an increase or decrease in interest expense ofthe related bond liability over the lives of the agreements. While these swap contracts hedge floating rate bonds issued within theHMRB indenture, hedging expenses are a general obligation of the Agency that is often reimbursed with excess revenue transfersfrom the HMRB indenture. The interest rate swap agreements allow the Agency to manage the interest rate risk associated withvariable rate debt.
l) Program Loans Receivable, net
Loans receivable are carried at their outstanding principal balances, less an allowance for loan losses.
m) Allowance for Program Loan Losses
The Agency’s policy is to charge expenses for estimated probable losses which are established as an allowance for loan losses.The allowance is an amount that management believes will be adequate to absorb losses inherent in existing loans based onevaluations of collectability and prior loss experience. Additional information regarding these calculations can be found in Note 4to the financial statements. While management uses the best information available to evaluate the adequacy of its allowance,future adjustments to the allowance may be necessary if actual experience differs from the factors used in making the evaluations.
35

Note 1 – SUMMARY OF SIGNIFICANT ACCOUNTING POLICIES (continued)
n) Capital Assets
The capital assets of the Agency includes data processing equipment and office furniture & equipment. Capital assets aredepreciated using straight-line method. Depreciation is charged as an expense against the Housing Finance Fund. Informationregarding capital assets and accumulated depreciation is reported in Note 5 – Capital Assets to the financial statements.
o) Other Real Estate Owned (“REO”)
Property acquired by the Agency through foreclosure is recorded at the lower of estimated fair value less estimated selling costs(fair value) or the carrying value of the related loan at the date of foreclosure and is included in “Other Assets” on theaccompanying financial statements. At the time the property is acquired, if the fair value is less than the loan amountsoutstanding, any difference is charged against the allowance for loan losses. After acquisition, valuations are periodicallyperformed and, if the carrying value of the property exceeds the current fair value, a valuation allowance is established by acharge to operations. Subsequent increases in the fair value may reduce or eliminate the allowance. Operating costs onforeclosed real estate are expensed as incurred. Costs incurred for physical improvements to foreclosed real estate are capitalizedif the value is recoverable through future sale.
p) Bonds Payable, Notes Payable and Loans Payable, net
Bonds Payable are carried at their outstanding principal balances plus unamortized bond premiums and less unamortized bonddiscounts. Notes and Loans Payable are carried at their outstanding principal balances.
q) Bond Issuance Costs, Premiums and Discounts
The costs and related fees associated with issuing bonds are recognized in the current period in accordance with GASB No. 65 inthe statements of revenues, expenses and changes in net position. Premium and discounts are amortized using straight linemethod. For debt refunding, the difference between the reacquisition price of the refunded bonds and the net carrying amount ofthe refunded bonds is deferred.
r) Compensated Absences
Agency employees accrue vacation or annual leave in varying amounts for each monthly period worked. Employees mayaccumulate leave time, subject to certain limitations, and upon retirement, termination, or death may be compensated for certainaccumulated amounts at their then current rates of pay. The Agency records an expense for all accumulated leave that theAgency would be required to pay if all employees terminated their employment.
s) Unearned Revenue
Unearned revenue represents the receipt of certain loan fees from lenders and borrowers, which is generally recognized asrevenue over the life of the associated loans.
t) Deferred Outflow and Deferred Inflow of Resources
Deferred outflow of resources is a consumption of net assets by the government that is applicable to a future reporting period,and deferred inflow of resources is an acquisition of net assets by the government that is applicable to future reporting period.The Fund’s deferred outflow of resources include accumulated decrease in fair value of hedging derivatives, deferred loss onrefunding, employer contribution difference for pensions, difference between expected and actual experience for pensions andnet difference between projected and actual earnings on investments for pensions. Accumulated increase in fair value of hedgingderivatives, deferred gain on refunding, net difference between projected and actual earnings on investments for pensions, andchange in assumptions for pensions are reported under the Fund’s deferred inflow of resources.
u) Net Position
Net Position is equal to assets plus deferred outflows of resources less the sum of liabilities plus deferred inflows of resources.Net position is classified as net investment in capital assets or restricted net position. Net investment in capital assets representsinvestments in office equipment and furniture net of depreciation. Restricted net position represents net position balances underthe lien of bond indentures that are therefore pledged to bondholders. State statutes further restrict other net position of the Fundsolely for purposes of the Agency and provide for a continuing appropriation of such assets for the benefit of bondholders.
v) Extinguishment of Debt
The Agency accounts for gains and losses associated with debt refundings by deferring such gains or losses and recognizing them as revenues or expenses over the shorter of the term of the bonds extinguished or the term of the refunding bonds. Gains orlosses associated with debt redemptions and maturing principal, other than refundings, are recognized as income or expense atthe date of the extinguishment.
36
Note 1 – SUMMARY OF SIGNIFICANT ACCOUNTING POLICIES (continued)
w) Operating Revenues and Expenses
The Fund’s operating revenues and expenses are activities classified as core business activities of the Fund. The Fund’s primaryoperating revenue is derived from the TBA Market Rate Program fee revenue and gain on sale of the TBA Market Ratesecurities, investment of bond proceeds in the loan programs and investment in securities. The Fund’s primary expense isinterest expense on bonds outstanding. Net interest income is an important measure of performance for the Fund. “Interestincome program loans” and “interest income investments-net” are shown as operating revenues in the statements of Revenue,Expenses and Changes in Net Position.
x) Non-Operating Revenues and Expenses
The Fund’s non-operating revenues and expenses include the reporting of HUD’s Section 8 Housing Assistance Program andSection 811 Project Rental Assistance Demonstration Program along with the Department of Treasury’s National ForeclosureMitigation Counseling Program within Other Programs and Accounts. Also included in this section are activities not classified ascore business activities of the Fund.
y) Pension
As part of the State, the primary government, the Fund contributes to the Miscellaneous Plan (the “Plan”) and it is administeredby the California Public Employees’ Retirement System (“CalPERS”). The Plan is included in the Public Employees’Retirement Fund A (“PERF A”). PERF is comprised of and reported as PERF A, PERF B, and PERF C for accounting purposes.PERF A is comprised of agent multiple-employer plans, which include State and most public agencies rate plans. For purposesof measuring the net pension liability, deferred outflows of resources and deferred inflows of resources related to pensions, andpension expense, information about the fiduciary net position of the Plan and additions to/deductions from the Plan’s fiduciary net position have been determined on the same basis as they are reported by the CalPERS Financial Office. For this purpose,benefit payments (including refunds of employee contributions) are recognized when due and payable in accordance with thebenefit terms. Investments are reported at fair value. Please see Note 9 - Pension to the financial statements for detailedinformation regarding Pensions.
z) Reclassification
A reclassification was made to prior year comparative information to conform to current year presentation. The reclassificationmoved items previously reported as operating revenues and expenses to non-operating revenues and expenses. Please refer toNote 1 – Summary of Significant Accounting Policies paragraphs w) Operating Revenues and Expenses and x) Non-OperatingRevenues and Expenses for more information. The reclassification did not affect the net position of changes therein.
Note 2 – CASH, CASH EQUIVALENTS AND INVESTMENTS
a) Cash and Cash Equivalents
The Fund utilizes a cash and investment pool maintained by the State Treasurer’s Office (STO). The Agency is allowed towithdraw funds from the investment pool, at any time, given that the Agency follows the standard claim schedule process. Eachprogram and account’s portion of this pool is included in investments on the statements of net position. In addition, other typesof investments are separately held by most of the programs and accounts.
Cash and Cash Equivalents: At June 30, 2017 and 2016, all cash and cash equivalents, totaling $31.4 million and $54.0 million,respectively, were covered by federal depository insurance or by collateral held by the Agency’s agent in the Agency’s name.
b) Investments
Investments: Investment of funds is restricted by the Act and the various bond resolutions and indentures of the Agency,generally, to certain types of investment securities, including direct obligations of the U.S. Government and its agencies, theState Treasurer’s Pooled Money Investment Account, long term investment agreements which are issued by institutions ratedwithin the top two ratings of a nationally recognized rating service, and other financial instruments. Investments of funds arealso made in accordance with the Agency’s Investment Policy.
The Agency entered into an U.S. Bank National Association Daily Liquid (open-ended) Commercial Paper (Open CP) agreementwith U.S. Bank in March, 2013. The Open CP agreements are unsecured promissory notes issued by U.S. Bank NationalAssociation. The Open CP is not insured by Federal Deposit Insurance Corporation (“FDIC”) or guaranteed by anygovernmental agency or authority, or by U.S. Bank. As of June 30, 2017 and 2016 the par value and market value of Open CPagreements were $13.5 million and $17.8 million, respectively.
37

Note 2 – CASH, CASH EQUIVALENTS AND INVESTMENTS (continued)
The Agency’s investment measured at amortized cost includes guaranteed investment contracts, investments in surplus money investment fund (SMIF) and Open CP, totaling $1.06 billion and $1.25 billion for the fiscal year ended June 30, 2017, and June 30, 2016, respectively.
The Agency is required to post collateral based on the Agency’s current Long Term Debt Ratings assigned by either Standard and Poor’s Rating Group or Moody’s Investor Service, Inc., as set forth in each International Swap Dealers Association, Inc. (“ISDA”) Master Agreement (see Note 6 - Long- and Short-term Liabilities – Bonds, Notes and Loans Payable and Associated Interest Rate Swaps). The total cash and fair market value of investment securities posted as collateral at June 30, 2017 and 2016 was $128.2 million and $32.8 million, respectively. As of June 30, 2017, the fair market value amount posted as collateral for Interest Rate SWAPS and FHLB was $35.7 million and $92.5 million, respectively.
The framework for measuring fair value provides a fair value hierarchy that prioritizes the inputs to valuation techniques used to measure fair value. The hierarchy gives the highest priority to unadjusted quoted prices in active markets for identical assets or liabilities (Level 1) and the lowest priority to unobservable inputs (Level 3). The three levels of the fair value hierarchy are described as follows:
Level 1 Inputs to the valuation methodology are unadjusted quoted prices for identical assets or liabilities in active markets that the Agency has the ability to access.
Level 2 Inputs other than quoted prices included within Level 1 that are observable for the asset or liability, either directly or indirectly such as:
- Quoted prices for similar assets or liabilities in active markets;- Quoted prices for identical or similar assets or liabilities in inactive markets;- Inputs other than quoted prices that are observable for the asset or liability;- Inputs that are derived principally from or corroborated by observable market data by correlation or other means.
Level 3 Inputs to the valuation methodology are unobservable and significant to the fair market value measurement.
Investments with Fair Value Measurement at June 30, 2017 and 2016 are as follows (dollars in thousands):
Fair Value Measurements Using6/30/17 6/30/16
6/30/17 Level 1 Level 2 Level 3 6/30/16 Level 1 Level 2 Level 3Investment by fair value levelU.S. Agency Securities --- GNMA's 128,042$ - 128,042$ - 117,308$ - 117,308$ - Federal Agency Securities 149,680 - 149,680 - 129,875 - 129,875 -
Total Investments by fair value level 277,722$ - 277,722$ - 247,183$ - 247,183$ -
The Agency measures and records its investments using fair value measurement guidelines established by general accepted accounting principles. As of June 30, 2017, all the securities were using quoted price from similar asset in active markets through Interactive Data Corp (IDC) and are classified in Level 2.
There are many factors that can affect the value of investments. Some, such as credit risk, custodial credit risk, and concentration of credit risk and interest rate risk, may affect both equity and fixed income securities. Equity and debt securities respond to such factors as economic conditions, individual company earnings performance and market liquidity, while fixed income securities are particularly sensitive to credit risks and changes in interest rates. It is the investment policy of the Agency to invest substantially all of its funds in fixed income securities, which limits the Agency’s exposure to most types of risk.
Credit Risk: Fixed income securities are subject to credit risk, which is the chance that an issuer will fail to pay interest or principal in a timely manner, or that negative perceptions of the issuer’s ability to make these payments will cause security prices to decline. Certain fixed income securities, including obligations of the U.S. government or those explicitly guaranteed by the U.S. government are not considered to have credit risk.
38

Note 2 – CASH, CASH EQUIVALENTS AND INVESTMENTS (continued)
The credit risk profile for fixed income securities including mortgage backed securities and rated investment agreements at June 30, 2017 and 2016 are as follows (dollars in thousands):
2017 2016Totals Totals
Fixed income securities:U.S. government guaranteed 277,722$ 247,183$ Guaranteed interest contracts:
Rated Aa1/AA- 13,471 17,819 Rated Aa2/AA+ - 799 Rated Aa2/A+ 696 2,486 Rated A1+/P1 - - Rated A1/AA+ - - Rated A1/AA- 3,560 16,519 Rated A2/A 14,541 19,763 Rated A3/NR - -
Total fixed income securities 309,990$ 304,569$
Custodial Credit Risk: Custodial credit risk is the risk that in the event of the failure of the custodian, the investments may not be returned. At June 30, 2017, the Agency did not have any investments exposed to custodial credit. All investments are held by the State of California or by pledging financial institutions in the name of the Agency.
Concentration of Credit Risk: Concentration of credit risk is the risk associated with a lack of diversification, such as having substantial investments in a few individual issuers, thereby exposing the Agency to greater risks resulting from adverse economic, political, regulatory, geographic, or credit developments. Investments issued or guaranteed by the U.S. government and investments in external investment pools, such as the commingled funds managed by the Agency are not considered subject to concentration of credit risk. At June 30, 2017, no investments in any one issuer exceed 5% of the net position, except for securities issued by the U.S. government or its agencies.
Interest Rate Risk: Interest rate risk is the risk that the value of fixed income securities will decline due to decreasing interest rates. The terms of a debt investment may cause its fair value to be highly sensitive to interest rate changes. At June 30, 2016, the Agency does not have any debt investments that are highly sensitive to changes in interest rates.
Effective duration is the approximate change in price of a security resulting from a 100 basis points (1 percentage point) change in the level of interest rates. It is not a measure of time. The guaranteed interest contracts are valued at par and therefore not subject to interest rate risk. The effective duration for U.S. government guaranteed fixed income securities at June 30, 2017 and 2016 are as follows:
2017 2016Fixed income securities:
U.S. government guaranteed 15.78 15.37
39
Note 3 – PROGRAM LOANS RECEIVABLE
Changes in program loans receivable for the years ended June 30, 2017 and 2016 are as follows (dollars in thousands):
2017 2016Totals Totals
Beginning of year balance 3,107,849$ 3,423,104$ Loans purchased/funded 140,254 175,121
Noncash transfers - REO (1,324) (7,401) Amortized principal repayments (129,523) (154,839) Prepayments (271,257) (344,078) Principal Reduction Program (1,218) (3,431) Chargeoffs (23,824) 241 Unamortized Mortgage Discount 146 150 Transfer to REO- net of write-down 944 7,154 Allowance for loan loss 26,205 11,828 Transfer to HPA - SB 837 (202,405) -
2,645,847$ 3,107,849$
Current portion 145,639$ 163,299$ Noncurrent portion 2,500,208 2,944,550 Total 2,645,847$ 3,107,849$
Program loans receivable decreased by $462 million during FY 2017. Decreases in program loans receivable were primarily due to the transfer of $202.4 million of program loan receivable to HPA as a result of SB 837, decreases in repayments and prepayments on program loans and $23.8 million in charge offs.
Loan prepayments decreased by $72.8 million to $271.3 million in FY 2017 compared to $344.1 million in FY 2016.
See Note 12 – Transfers to Other Funds/Government Agencies for detail information regarding SB 837.
Note 4 – ALLOWANCE FOR PROGRAM LOAN LOSSES
Single Family: The Agency’s policy takes into consideration a variety of factors using regression and Marko chain analysis for probable losses which are established as an allowance for loan losses on Single Family loans. These evaluations take into consideration loan status, borrower’s FICO score, current Loan-To-Value ratio (LTV), current FNMA 30/60 reservation rate, reinsurance percentage, housing price index (HPI), and California Seasonably Adjusted Unemployment Rate – as published by California Employment Development Department. As the California housing market and unemployment rates continued to improve in FY 2017, the Fund recorded a decrease of $8.9 million in allowance for loan loss reserve for Homeownership Programs in FY 2017.
Multi-Family: The Agency’s policy in setting loan loss reserves on the Multi-Family Portfolio is determined on a loan level basis. Loan loss reserve calculations take into consideration lien priority, Section 8 Units, Tax credit status, Loan-To-Value ratio (LTV), Debt Service Coverage Ratio (DSCR), occupancy percentage, FHA insurance or FHA-Risk Share Coverage, and delinquency status.
Changes in the allowance for program loan losses for the year ended June 30, 2017 and 2016 are as follows (dollars in thousands):
Homeownership Multifamily Other Program Rental Housing Program and 2017 2016
Program Accounts Total TotalBeginning of year balance 19,832$ 1,601$ 83,961$ 105,394$ 117,222$ Provision for program loan losses (7,816) (169) 5,604 (2,381) (12,069) Charge-offs (1,061) - (22,763) (23,824) 241 End of year balance 10,955$ 1,432$ 66,802$ 79,189$ 105,394$
Total allowance for loan loss reserve decreased $26.2 million to $79.2 million in FY 2017. The decrease is primarily due to a transfer of $22.4 million of allowance for loan loss reserve related to SB 837.
40
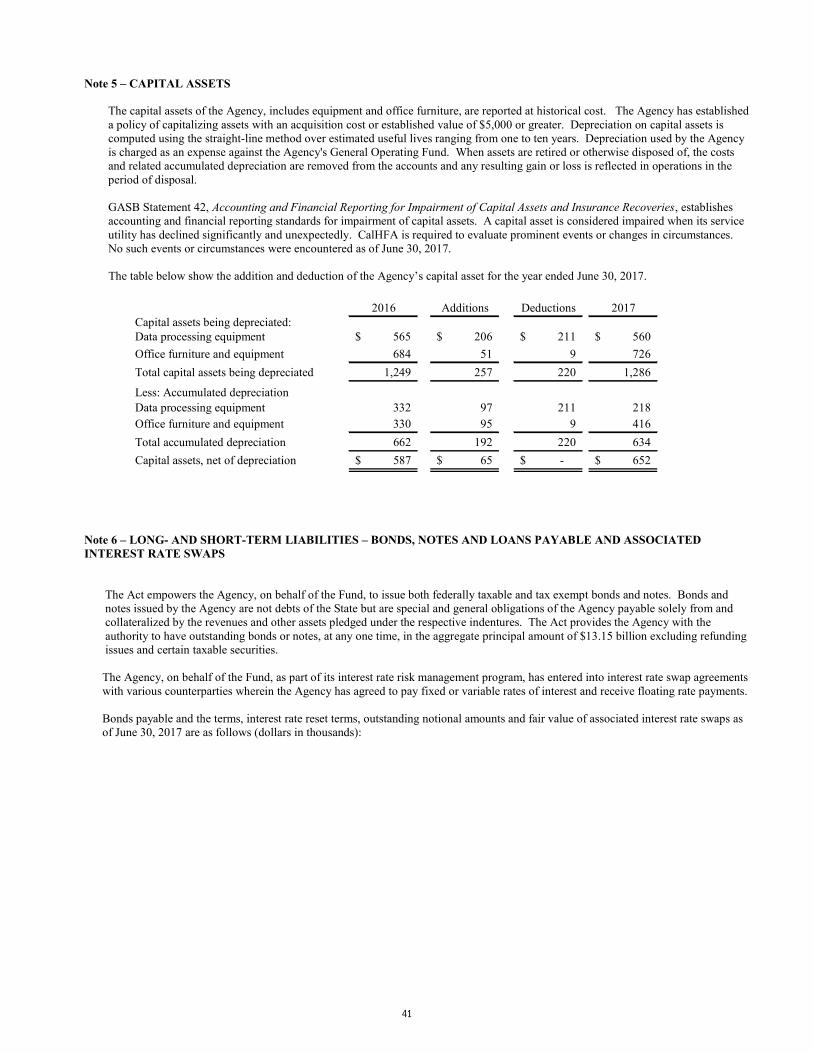
Note 5 – CAPITAL ASSETS
The capital assets of the Agency, includes equipment and office furniture, are reported at historical cost. The Agency has established a policy of capitalizing assets with an acquisition cost or established value of $5,000 or greater. Depreciation on capital assets is computed using the straight-line method over estimated useful lives ranging from one to ten years. Depreciation used by the Agency is charged as an expense against the Agency's General Operating Fund. When assets are retired or otherwise disposed of, the costs and related accumulated depreciation are removed from the accounts and any resulting gain or loss is reflected in operations in the period of disposal.
GASB Statement 42, Accounting and Financial Reporting for Impairment of Capital Assets and Insurance Recoveries, establishes accounting and financial reporting standards for impairment of capital assets. A capital asset is considered impaired when its service utility has declined significantly and unexpectedly. CalHFA is required to evaluate prominent events or changes in circumstances. No such events or circumstances were encountered as of June 30, 2017.
The table below show the addition and deduction of the Agency’s capital asset for the year ended June 30, 2017.
2016 Additions Deductions 2017Capital assets being depreciated:Data processing equipment 565$ 206$ 211$ 560$ Office furniture and equipment 684 51 9 726 Total capital assets being depreciated 1,249 257 220 1,286
Less: Accumulated depreciationData processing equipment 332 97 211 218 Office furniture and equipment 330 95 9 416 Total accumulated depreciation 662 192 220 634 Capital assets, net of depreciation 587$ 65$ -$ 652$
Note 6 – LONG- AND SHORT-TERM LIABILITIES – BONDS, NOTES AND LOANS PAYABLE AND ASSOCIATED INTEREST RATE SWAPS
The Act empowers the Agency, on behalf of the Fund, to issue both federally taxable and tax exempt bonds and notes. Bonds and notes issued by the Agency are not debts of the State but are special and general obligations of the Agency payable solely from and collateralized by the revenues and other assets pledged under the respective indentures. The Act provides the Agency with the authority to have outstanding bonds or notes, at any one time, in the aggregate principal amount of $13.15 billion excluding refunding issues and certain taxable securities.
The Agency, on behalf of the Fund, as part of its interest rate risk management program, has entered into interest rate swap agreements with various counterparties wherein the Agency has agreed to pay fixed or variable rates of interest and receive floating rate payments.
Bonds payable and the terms, interest rate reset terms, outstanding notional amounts and fair value of associated interest rate swaps as of June 30, 2017 are as follows (dollars in thousands):
41

Variable Final OriginalType Rate Reset Maturity Issuance Outstanding Outstanding
Bond Issue of Bond Type * Term Date Amount Fixed Variable Total
Home Mortgage Revenue Bonds:2000 Series J Tax-Exempt - - -$ -$ -$ -$ 2000 Series N Tax-Exempt 0.785% VRDO Weekly 2031 50,000 - 5,795 5,795 2000 Series X-2 Tax-Exempt - - - - - - - - 2000 Series Z Taxable 1.270% LIBOR 3 mo Quarterly 2031 102,000 - 28,950 28,950 2001 Series D Taxable 1.353% LIBOR 3 mo Quarterly 2022 112,000 - 35,505 35,505 2001 Series G Taxable 1.230% LIBOR 3 mo Quarterly 2029 105,000 - 28,290 28,290 2001 Series J Tax-Exempt - - - - - - - - 2001 Series K Taxable 1.327% LIBOR 3 mo Quarterly 2032 144,000 -$ 37,610 37,610 2001 Series N Tax-Exempt - - - - - - - - 2001 Series O Taxable - - - - - - - - 2001 Series S Taxable - - - - - - - - 2001 Series U Tax-Exempt - - - - - - - - 2002 Series B Tax-Exempt - - - - - - - - 2002 Series F Tax-Exempt - - - - - - - - 2002 Series H Taxable - - - - - - - - 2002 Series J Tax-Exempt - - - - - - - - 2002 Series M Tax-Exempt - - - - - - - - 2002 Series P Tax-Exempt - - - - - - - - 2003 Series I Taxable 1.267% LIBOR 3 mo Quarterly 2033 50,000 - 27,415 27,415 2003 Series N Taxable 1.297% LIBOR 3 mo Quarterly 2034 50,000 - 20,660 20,660 2004 Series A Tax-Exempt - - - - - - - - 2004 Series F Taxable 1.277% LIBOR 3 mo Quarterly 2035 50,000 - 33,675 33,675 2004 Series G Tax-Exempt - - - - - - - - 2004 Series I Tax-Exempt - - - - - - - - 2005 Series A Tax-Exempt 0.786% VRDO Weekly 2035 200,000 - 37,915 37,915 2005 Series B Tax-Exempt 0.785% VRDO Weekly 2035 200,000 - 40,075 40,075 2006 Series C Tax-Exempt 0.785% VRDO Weekly 2037 175,000 - 46,620 46,620 2007 Series A Taxable 5.720% - - 2032 90,000 71,180 - 71,180 2007 Series B Taxable 1.270% LIBOR 3 mo Quarterly 2042 40,000 - 40,000 40,000 2007 Series C Taxable 1.270% LIBOR 3 mo Quarterly 2042 20,000 - 20,000 20,000 2007 Series D Tax-Exempt 4.400% - - 2018 76,010 3,310 - 3,310 2007 Series E Tax-Exempt 4.75% - 4.800% - - 2042 193,990 64,650 - 64,650 2007 Series F Tax-Exempt 4.700% - - 2017 48,260 3,505 - 3,505 2007 Series G Tax-Exempt 4.95% - 5.500% - - 2029 201,740 65,615 - 65,615 2007 Series H Tax-Exempt - - - - - - - -2007 Series I Tax-Exempt 4.350% - - 2017 17,280 1,360 - 1,360 2007 Series K Tax-Exempt 0.793% VRDO Weekly 2038 50,000 - 19,875 19,875 2007 Series M Taxable 5.835% - - 2032 90,000 65,740 - 65,740 2007 Series N Taxable 1.267% LIBOR 3 mo Quarterly 2043 60,000 - 60,000 60,000 2008 Series A Tax-Exempt 4.25% - 4.500% - - 2020 43,475 13,030 - 13,030 2008 Series B Tax-Exempt 4.800% - - 2023 35,960 8,780 - 8,780 2008 Series C Tax-Exempt - - - - - - - -2008 Series C Tax-Exempt - - - - - - - -2008 Series C Tax-Exempt - - - - - - - -2008 Series C Tax-Exempt - - - - - - - -2008 Series D Tax-Exempt - - - - - - - -2008 Series D Tax-Exempt - - - - - - - -2008 Series D Tax-Exempt - - - - - - - -2008 Series D Tax-Exempt - - - - - - - -2008 Series D Tax-Exempt - - - - - - - -2008 Series F Tax-Exempt - - - - - - - -2008 Series H Taxable 4.950% - - 2020 100,000 31,475 - 31,475 2008 Series I Taxable - - - - - - - - 2008 Series K Tax-Exempt 5.3% - 5.450% - - 2028 220,475 46,060 - 46,060 2008 Series L Tax-Exempt 5.450% - - 2033 189,790 34,670 - 34,670 2016 Series A Taxable 1.35% - 3.8480% - - 2036 236,350 229,130 - 229,130 2017 Series A Taxable 1.475% - 3.6560% - - 2029 278,240 278,240 - 278,240
3,229,570 916,745 482,385 1,399,130
Interest Rate Range
Bonds / Notes
42
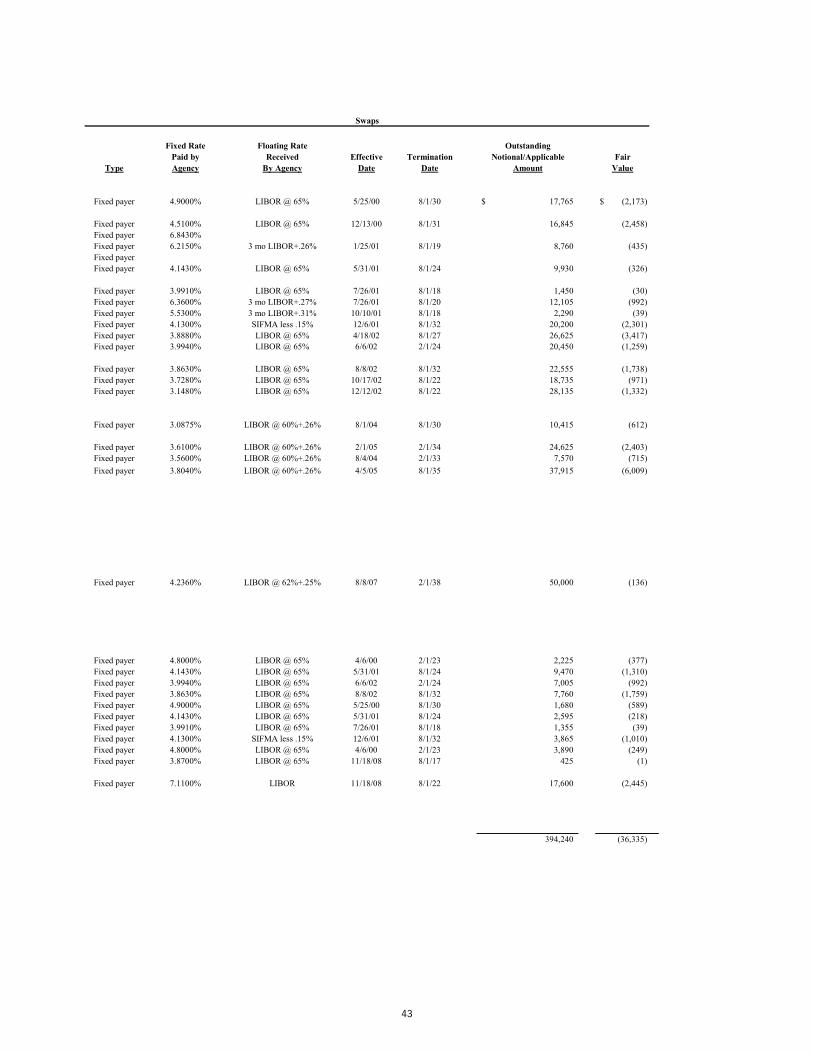
Fixed Rate Floating Rate OutstandingPaid by Received Effective Termination Notional/Applicable Fair
Type Agency By Agency Date Date Amount Value
Fixed payer 4.9000% LIBOR @ 65% 5/25/00 8/1/30 17,765$ (2,173)$
Fixed payer 4.5100% LIBOR @ 65% 12/13/00 8/1/31 16,845 (2,458) Fixed payer 6.8430%Fixed payer 6.2150% 3 mo LIBOR+.26% 1/25/01 8/1/19 8,760 (435) Fixed payerFixed payer 4.1430% LIBOR @ 65% 5/31/01 8/1/24 9,930 (326)
Fixed payer 3.9910% LIBOR @ 65% 7/26/01 8/1/18 1,450 (30) Fixed payer 6.3600% 3 mo LIBOR+.27% 7/26/01 8/1/20 12,105 (992) Fixed payer 5.5300% 3 mo LIBOR+.31% 10/10/01 8/1/18 2,290 (39) Fixed payer 4.1300% SIFMA less .15% 12/6/01 8/1/32 20,200 (2,301) Fixed payer 3.8880% LIBOR @ 65% 4/18/02 8/1/27 26,625 (3,417) Fixed payer 3.9940% LIBOR @ 65% 6/6/02 2/1/24 20,450 (1,259)
Fixed payer 3.8630% LIBOR @ 65% 8/8/02 8/1/32 22,555 (1,738) Fixed payer 3.7280% LIBOR @ 65% 10/17/02 8/1/22 18,735 (971) Fixed payer 3.1480% LIBOR @ 65% 12/12/02 8/1/22 28,135 (1,332)
Fixed payer 3.0875% LIBOR @ 60%+.26% 8/1/04 8/1/30 10,415 (612)
Fixed payer 3.6100% LIBOR @ 60%+.26% 2/1/05 2/1/34 24,625 (2,403) Fixed payer 3.5600% LIBOR @ 60%+.26% 8/4/04 2/1/33 7,570 (715) Fixed payer 3.8040% LIBOR @ 60%+.26% 4/5/05 8/1/35 37,915 (6,009)
Fixed payer 4.2360% LIBOR @ 62%+.25% 8/8/07 2/1/38 50,000 (136)
Fixed payer 4.8000% LIBOR @ 65% 4/6/00 2/1/23 2,225 (377) Fixed payer 4.1430% LIBOR @ 65% 5/31/01 8/1/24 9,470 (1,310) Fixed payer 3.9940% LIBOR @ 65% 6/6/02 2/1/24 7,005 (992) Fixed payer 3.8630% LIBOR @ 65% 8/8/02 8/1/32 7,760 (1,759) Fixed payer 4.9000% LIBOR @ 65% 5/25/00 8/1/30 1,680 (589) Fixed payer 4.1430% LIBOR @ 65% 5/31/01 8/1/24 2,595 (218) Fixed payer 3.9910% LIBOR @ 65% 7/26/01 8/1/18 1,355 (39) Fixed payer 4.1300% SIFMA less .15% 12/6/01 8/1/32 3,865 (1,010) Fixed payer 4.8000% LIBOR @ 65% 4/6/00 2/1/23 3,890 (249) Fixed payer 3.8700% LIBOR @ 65% 11/18/08 8/1/17 425 (1)
Fixed payer 7.1100% LIBOR 11/18/08 8/1/22 17,600 (2,445)
394,240 (36,335)
Swaps
43

Variable Final OriginalType Rate Reset Maturity Issuance Outstanding Outstanding
Bond Issue of Bond Type * Term Date Amount Fixed Variable Total
Residential Mortgage Revenue Bonds2009 Series A-5 Tax-Exempt 3.160% - - 2041 466,115 147,000.00 - 147,000.00 2009 Series A-6 (MFP) Tax-Exempt 3.270% - - 2030 69,950 48,440.00 - 48,440.00 2010 Series A Tax-Exempt 3.05% - 4.625% - - 2027 24,000 7,385.00 - 7,385.00 2011 Series A Tax-Exempt 2.85% - 4.750% - - 2028 72,000 15,260.00 - 15,260.00 2013 Series A Taxable 2.900% - - 2042 100,210 30,670.00 - 30,670.00 2013 Series B Taxable 2.900% - - 2042 33,550 15,779.00 - 15,779.00
765,825 264,534 - 264,534
Multifamily Housing Revenue Bonds III:2000 Series B Tax-Exempt - - - - 2000 Series D Tax-Exempt - - - - 2001 Series D Tax-Exempt - - - - 2001 Series E Tax-Exempt 0.770% VRDO Weekly 2036 78,735 - 13,970 13,970 2001 Series F Tax-Exempt 0.789% VRDO Weekly 2032 19,040 - 8,580 8,580 2001 Series G Tax-Exempt 0.818% VRDO Weekly 2025 73,975 - 2,275 2,275 2001 Series G Tax-Exempt 0.818% VRDO Weekly 2034 - - 8,745 8,745 2001 Series G Tax-Exempt 0.818% VRDO Weekly 2034 - - 6,940 6,940 2002 Series A Tax-Exempt - - - - - - - - 2002 Series A Tax-Exempt - - - - - - - - 2002 Series B Tax-Exempt - - - - - - - - 2002 Series C Tax-Exempt - - - - - - - - 2002 Series C Tax-Exempt - - - - - - - - 2002 Series D Tax-Exempt - - - - - - - - 2002 Series E Tax-Exempt - - - - - - - - 2002 Series E Tax-Exempt - - - - - - - - 2004 Series A Tax-Exempt - - - - - - - - 2004 Series B Tax-Exempt - - - - - - - - 2004 Series B Tax-Exempt - - - - - - - - 2004 Series B Tax-Exempt - - - - - - - - 2004 Series B Tax-Exempt - - - - - - - - 2004 Series C Tax-Exempt 2.268% Auction Weekly 2025 13,940 - 3,655 3,655 2005 Series A Tax-Exempt - - - - - - - - 2005 Series B Tax-Exempt - - - - - - - - 2005 Series B Tax-Exempt - - - - - - - - 2005 Series B Tax-Exempt - - - - - - - - 2005 Series D Tax-Exempt 0.819% VRDO Weekly 2038 91,225 - 14,375 14,375 2006 Series A Tax-Exempt - - - - - - - - 2006 Series A Tax-Exempt - - - - - - - - 2006 Series A Tax-Exempt - - - - - - - - 2007 Series B Tax-Exempt - - - - - - - - 2007 Series B Tax-Exempt - - - - - - - - 2007 Series C Tax-Exempt - - - - - - - - 2007 Series C Tax-Exempt - - - - - - - - 2008 Series A Tax-Exempt - - - - - - - - 2008 Series B Tax-Exempt 0.770% VRDO Weekly 2036 104,890 - 8,170 8,170 2008 Series B Tax-Exempt 0.770% VRDO Weekly 2038 - - 13,325 13,325 2008 Series C Tax-Exempt 0.780% VRDO Weekly 2038 33,390 - 4,950 4,950 2008 Series C Tax-Exempt 0.779% VRDO Weekly 2036 - - 11,395 11,395 2008 Series C Tax-Exempt 0.780% VRDO Weekly 2038 - - 740 740 2014 Series A Tax-Exempt 1.3% - 4.800% - - 2049 38,915 24,290 - 24,290 2015 Series A Taxable 2.379% - 4.050% - - 2030 174,180 174,180 - 174,180
628,290 198,470 97,120 295,590
Affordable Multifamily Housing Revenue Bonds:2009 Series A-21 Tax-Exempt 2.320% - - 2046 55,990 45,220 - 45,220 2009 Series A-22 Tax-Exempt 2.320% - - 2039 36,680 32,860 - 32,860
92,670 78,080 - 78,080
Bonds / Notes
Interest Rate Range
44
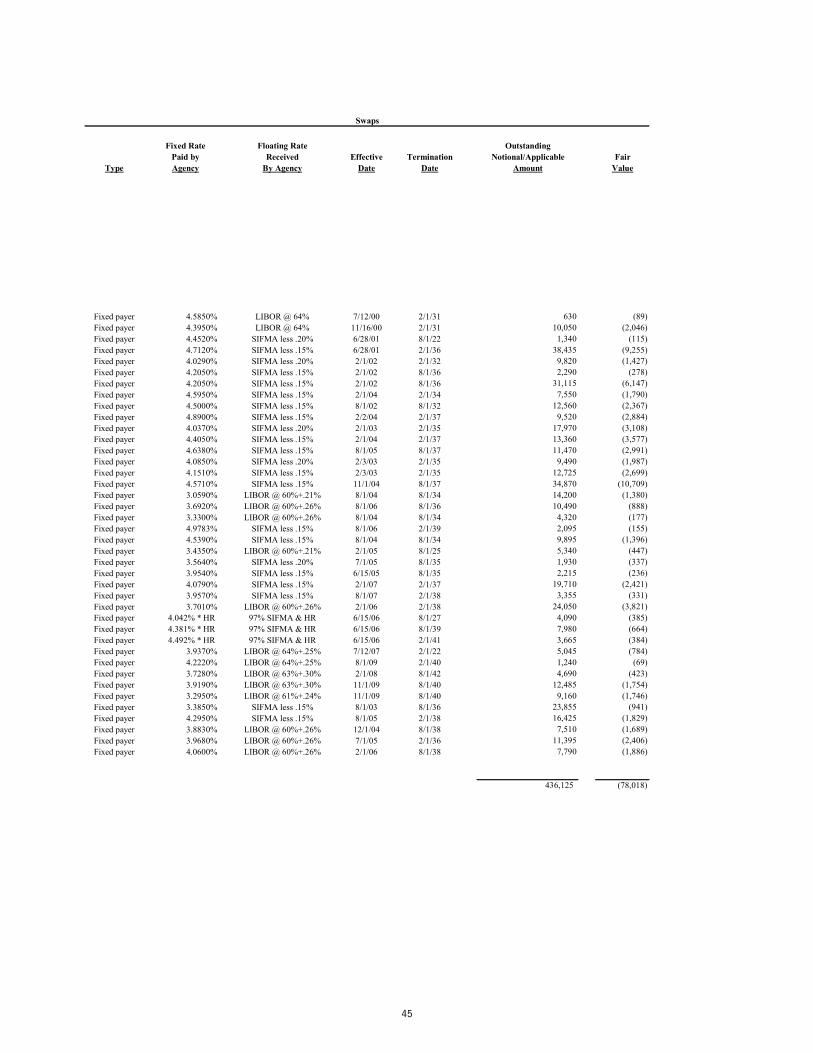
Fixed Rate Floating Rate OutstandingPaid by Received Effective Termination Notional/Applicable Fair
Type Agency By Agency Date Date Amount Value
Fixed payer 4.5850% LIBOR @ 64% 7/12/00 2/1/31 630 (89)Fixed payer 4.3950% LIBOR @ 64% 11/16/00 2/1/31 10,050 (2,046)Fixed payer 4.4520% SIFMA less .20% 6/28/01 8/1/22 1,340 (115)Fixed payer 4.7120% SIFMA less .15% 6/28/01 2/1/36 38,435 (9,255)Fixed payer 4.0290% SIFMA less .20% 2/1/02 2/1/32 9,820 (1,427)Fixed payer 4.2050% SIFMA less .15% 2/1/02 8/1/36 2,290 (278)Fixed payer 4.2050% SIFMA less .15% 2/1/02 8/1/36 31,115 (6,147)Fixed payer 4.5950% SIFMA less .15% 2/1/04 2/1/34 7,550 (1,790)Fixed payer 4.5000% SIFMA less .15% 8/1/02 8/1/32 12,560 (2,367)Fixed payer 4.8900% SIFMA less .15% 2/2/04 2/1/37 9,520 (2,884)Fixed payer 4.0370% SIFMA less .20% 2/1/03 2/1/35 17,970 (3,108)Fixed payer 4.4050% SIFMA less .15% 2/1/04 2/1/37 13,360 (3,577)Fixed payer 4.6380% SIFMA less .15% 8/1/05 8/1/37 11,470 (2,991)Fixed payer 4.0850% SIFMA less .20% 2/3/03 2/1/35 9,490 (1,987)Fixed payer 4.1510% SIFMA less .15% 2/3/03 2/1/35 12,725 (2,699)Fixed payer 4.5710% SIFMA less .15% 11/1/04 8/1/37 34,870 (10,709)Fixed payer 3.0590% LIBOR @ 60%+.21% 8/1/04 8/1/34 14,200 (1,380)Fixed payer 3.6920% LIBOR @ 60%+.26% 8/1/06 8/1/36 10,490 (888)Fixed payer 3.3300% LIBOR @ 60%+.26% 8/1/04 8/1/34 4,320 (177)Fixed payer 4.9783% SIFMA less .15% 8/1/06 2/1/39 2,095 (155)Fixed payer 4.5390% SIFMA less .15% 8/1/04 8/1/34 9,895 (1,396)Fixed payer 3.4350% LIBOR @ 60%+.21% 2/1/05 8/1/25 5,340 (447)Fixed payer 3.5640% SIFMA less .20% 7/1/05 8/1/35 1,930 (337)Fixed payer 3.9540% SIFMA less .15% 6/15/05 8/1/35 2,215 (236)Fixed payer 4.0790% SIFMA less .15% 2/1/07 2/1/37 19,710 (2,421)Fixed payer 3.9570% SIFMA less .15% 8/1/07 2/1/38 3,355 (331)Fixed payer 3.7010% LIBOR @ 60%+.26% 2/1/06 2/1/38 24,050 (3,821)Fixed payer 4.042% * HR 97% SIFMA & HR 6/15/06 8/1/27 4,090 (385)Fixed payer 4.381% * HR 97% SIFMA & HR 6/15/06 8/1/39 7,980 (664)Fixed payer 4.492% * HR 97% SIFMA & HR 6/15/06 2/1/41 3,665 (384)Fixed payer 3.9370% LIBOR @ 64%+.25% 7/12/07 2/1/22 5,045 (784)Fixed payer 4.2220% LIBOR @ 64%+.25% 8/1/09 2/1/40 1,240 (69)Fixed payer 3.7280% LIBOR @ 63%+.30% 2/1/08 8/1/42 4,690 (423)Fixed payer 3.9190% LIBOR @ 63%+.30% 11/1/09 8/1/40 12,485 (1,754)Fixed payer 3.2950% LIBOR @ 61%+.24% 11/1/09 8/1/40 9,160 (1,746)Fixed payer 3.3850% SIFMA less .15% 8/1/03 8/1/36 23,855 (941)Fixed payer 4.2950% SIFMA less .15% 8/1/05 2/1/38 16,425 (1,829)Fixed payer 3.8830% LIBOR @ 60%+.26% 12/1/04 8/1/38 7,510 (1,689)Fixed payer 3.9680% LIBOR @ 60%+.26% 7/1/05 2/1/36 11,395 (2,406)Fixed payer 4.0600% LIBOR @ 60%+.26% 2/1/06 8/1/38 7,790 (1,886)
436,125 (78,018)
Swaps
45

Variable Final OriginalType Rate Reset Maturity Issuance Outstanding Outstanding
Bond Issue of Bond Type * Term Date Amount Fixed Variable Total
Special Obligation Multifamily Housing Revenue Bonds (Virginia Terrace):2015 Issue A Tax-Exempt 0.97% - 4.170% - - 2057 5,245 3,855 - 3,855
5,245 3,855 - 3,855
Special Obligation Multifamily Housing Revenue Bonds (Ocean View Senior):2015 Issue B Tax-Exempt 1.12% - 4.170% - - 2058 18,075 18,075 - 18,075
18,075 18,075 - 18,075
Multifamily Housing Revenue Bonds (Maplewood - FHA Risk-Share):2016 Issue A Tax-Exempt 0.8% - 3.250% - - 2035 8,600 4,710 - 4,710
8,600 4,710 - 4,710
Multifamily Housing Revenue Bonds (Woodglen Vista - FHA Risk-Share):2016 Issue B Tax-Exempt 0.7% - 3.800% - - 2053 31,000 31,000 - 31,000
31,000 31,000 - 31,000
4,779,275$ 1,515,469$ 579,505$ 2,094,974$
Unamortized discount (83) Unamortized premium 983
Total Bonds 2,095,874$
* VRDO (Variable Rate Demand Obligations) - weekly remarketing
Bonds / Notes
Interest Rate Range
46

Fixed Rate Floating Rate OutstandingPaid by Received Effective Termination Notional/Applicable Fair
Type Agency By Agency Date Date Amount Value
Total Outstanding Notional and Fair Value 830,365$ (114,353)$
Swaps
47
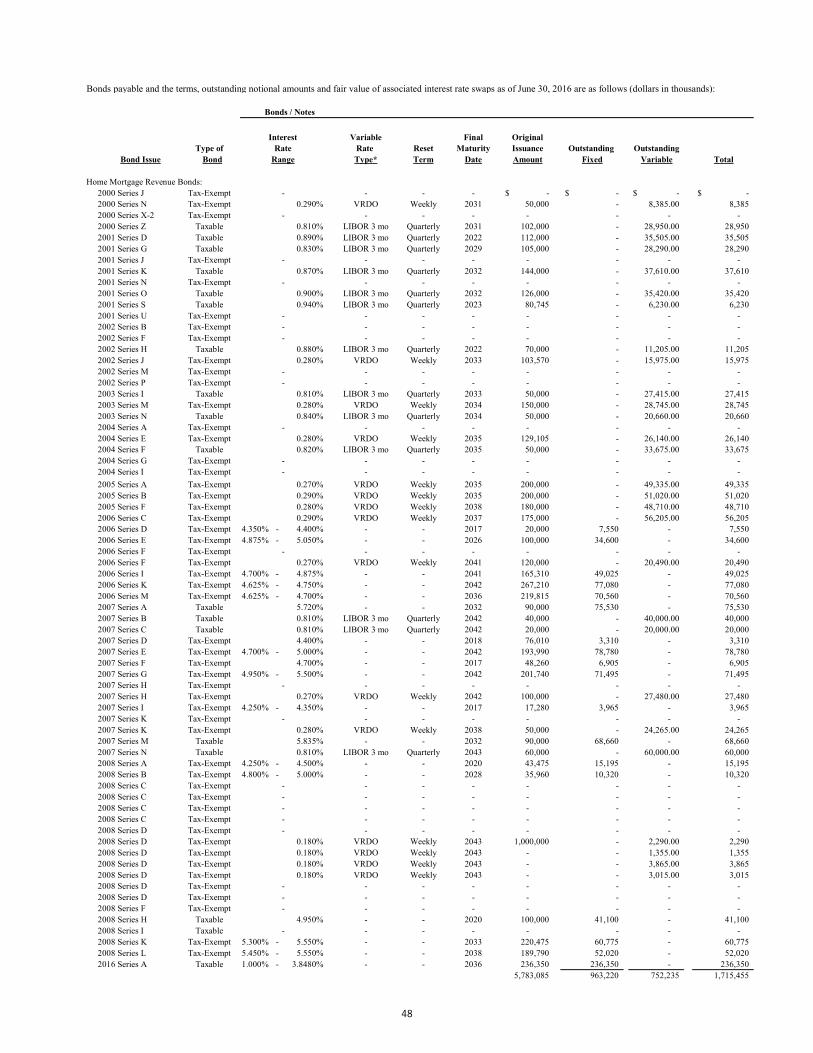
Bonds payable and the terms, outstanding notional amounts and fair value of associated interest rate swaps as of June 30, 2016 are as follows (dollars in thousands):
Bonds / Notes
Variable Final OriginalType of Rate Reset Maturity Issuance Outstanding Outstanding
Bond Issue Bond Type* Term Date Amount Fixed Variable Total
Home Mortgage Revenue Bonds:2000 Series J Tax-Exempt - - - - -$ -$ -$ -$ 2000 Series N Tax-Exempt 0.290% VRDO Weekly 2031 50,000 - 8,385.00 8,385 2000 Series X-2 Tax-Exempt - - - - - - - - 2000 Series Z Taxable 0.810% LIBOR 3 mo Quarterly 2031 102,000 - 28,950.00 28,950 2001 Series D Taxable 0.890% LIBOR 3 mo Quarterly 2022 112,000 - 35,505.00 35,505 2001 Series G Taxable 0.830% LIBOR 3 mo Quarterly 2029 105,000 - 28,290.00 28,290 2001 Series J Tax-Exempt - - - - - - - - 2001 Series K Taxable 0.870% LIBOR 3 mo Quarterly 2032 144,000 - 37,610.00 37,610 2001 Series N Tax-Exempt - - - - - - - - 2001 Series O Taxable 0.900% LIBOR 3 mo Quarterly 2032 126,000 - 35,420.00 35,420 2001 Series S Taxable 0.940% LIBOR 3 mo Quarterly 2023 80,745 - 6,230.00 6,230 2001 Series U Tax-Exempt - - - - - - - - 2002 Series B Tax-Exempt - - - - - - - - 2002 Series F Tax-Exempt - - - - - - - - 2002 Series H Taxable 0.880% LIBOR 3 mo Quarterly 2022 70,000 - 11,205.00 11,205 2002 Series J Tax-Exempt 0.280% VRDO Weekly 2033 103,570 - 15,975.00 15,975 2002 Series M Tax-Exempt - - - - - - - - 2002 Series P Tax-Exempt - - - - - - - - 2003 Series I Taxable 0.810% LIBOR 3 mo Quarterly 2033 50,000 - 27,415.00 27,415 2003 Series M Tax-Exempt 0.280% VRDO Weekly 2034 150,000 - 28,745.00 28,745 2003 Series N Taxable 0.840% LIBOR 3 mo Quarterly 2034 50,000 - 20,660.00 20,660 2004 Series A Tax-Exempt - - - - - - - - 2004 Series E Tax-Exempt 0.280% VRDO Weekly 2035 129,105 - 26,140.00 26,140 2004 Series F Taxable 0.820% LIBOR 3 mo Quarterly 2035 50,000 - 33,675.00 33,675 2004 Series G Tax-Exempt - - - - - - - - 2004 Series I Tax-Exempt - - - - - - - - 2005 Series A Tax-Exempt 0.270% VRDO Weekly 2035 200,000 - 49,335.00 49,335 2005 Series B Tax-Exempt 0.290% VRDO Weekly 2035 200,000 - 51,020.00 51,020 2005 Series F Tax-Exempt 0.280% VRDO Weekly 2038 180,000 - 48,710.00 48,710 2006 Series C Tax-Exempt 0.290% VRDO Weekly 2037 175,000 - 56,205.00 56,205 2006 Series D Tax-Exempt 4.350% - 4.400% - - 2017 20,000 7,550 - 7,5502006 Series E Tax-Exempt 4.875% - 5.050% - - 2026 100,000 34,600 - 34,6002006 Series F Tax-Exempt - - - - - - - -2006 Series F Tax-Exempt 0.270% VRDO Weekly 2041 120,000 - 20,490.00 20,490 2006 Series I Tax-Exempt 4.700% - 4.875% - - 2041 165,310 49,025 - 49,0252006 Series K Tax-Exempt 4.625% - 4.750% - - 2042 267,210 77,080 - 77,0802006 Series M Tax-Exempt 4.625% - 4.700% - - 2036 219,815 70,560 - 70,5602007 Series A Taxable 5.720% - - 2032 90,000 75,530 - 75,5302007 Series B Taxable 0.810% LIBOR 3 mo Quarterly 2042 40,000 - 40,000.00 40,0002007 Series C Taxable 0.810% LIBOR 3 mo Quarterly 2042 20,000 - 20,000.00 20,0002007 Series D Tax-Exempt 4.400% - - 2018 76,010 3,310 - 3,3102007 Series E Tax-Exempt 4.700% - 5.000% - - 2042 193,990 78,780 - 78,7802007 Series F Tax-Exempt 4.700% - - 2017 48,260 6,905 - 6,9052007 Series G Tax-Exempt 4.950% - 5.500% - - 2042 201,740 71,495 - 71,4952007 Series H Tax-Exempt - - - - - - - -2007 Series H Tax-Exempt 0.270% VRDO Weekly 2042 100,000 - 27,480.00 27,480 2007 Series I Tax-Exempt 4.250% - 4.350% - - 2017 17,280 3,965 - 3,9652007 Series K Tax-Exempt - - - - - - - -2007 Series K Tax-Exempt 0.280% VRDO Weekly 2038 50,000 - 24,265.00 24,265 2007 Series M Taxable 5.835% - - 2032 90,000 68,660 - 68,6602007 Series N Taxable 0.810% LIBOR 3 mo Quarterly 2043 60,000 - 60,000.00 60,0002008 Series A Tax-Exempt 4.250% - 4.500% - - 2020 43,475 15,195 - 15,1952008 Series B Tax-Exempt 4.800% - 5.000% - - 2028 35,960 10,320 - 10,3202008 Series C Tax-Exempt - - - - - - - -2008 Series C Tax-Exempt - - - - - - - -2008 Series C Tax-Exempt - - - - - - - -2008 Series C Tax-Exempt - - - - - - - -2008 Series D Tax-Exempt - - - - - - - -2008 Series D Tax-Exempt 0.180% VRDO Weekly 2043 1,000,000 - 2,290.00 2,290 2008 Series D Tax-Exempt 0.180% VRDO Weekly 2043 - - 1,355.00 1,355 2008 Series D Tax-Exempt 0.180% VRDO Weekly 2043 - - 3,865.00 3,865 2008 Series D Tax-Exempt 0.180% VRDO Weekly 2043 - - 3,015.00 3,015 2008 Series D Tax-Exempt - - - - - - - - 2008 Series D Tax-Exempt - - - - - - - - 2008 Series F Tax-Exempt - - - - - - - - 2008 Series H Taxable 4.950% - - 2020 100,000 41,100 - 41,1002008 Series I Taxable - - - - - - - -2008 Series K Tax-Exempt 5.300% - 5.550% - - 2033 220,475 60,775 - 60,7752008 Series L Tax-Exempt 5.450% - 5.550% - - 2038 189,790 52,020 - 52,0202016 Series A Taxable 1.000% - 3.8480% - - 2036 236,350 236,350 - 236,350
5,783,085 963,220 752,235 1,715,455
RateRange
Interest
48
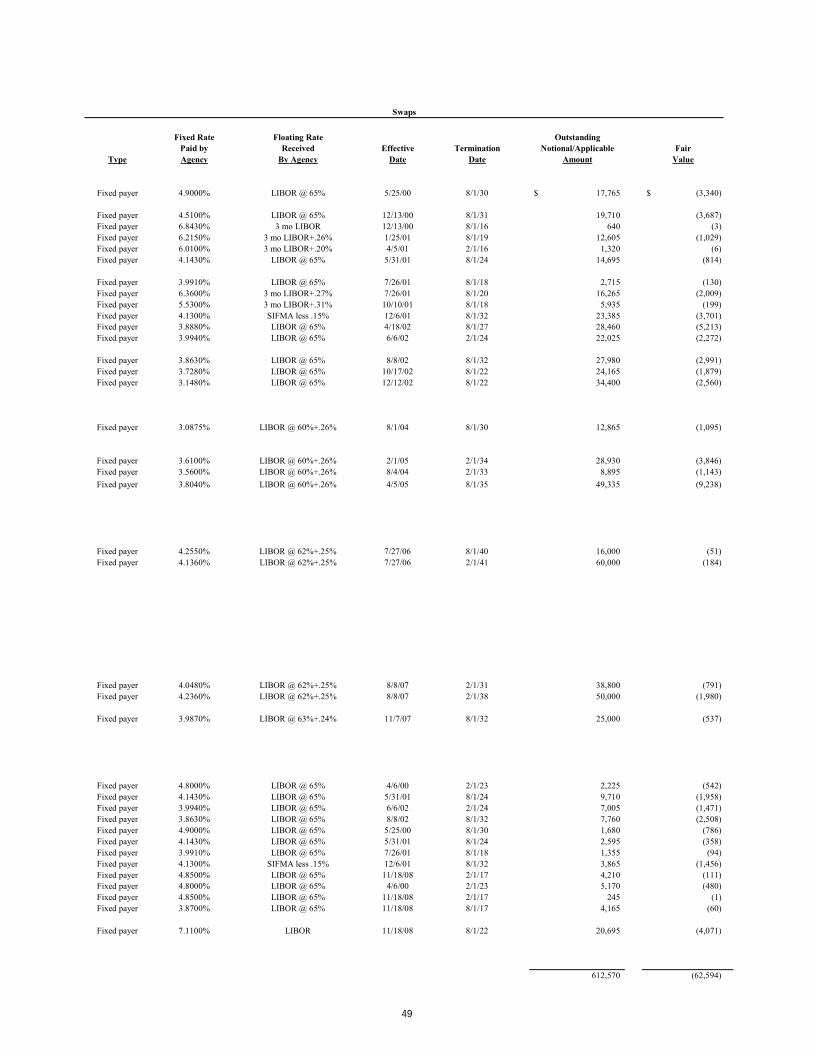
Fixed Rate Floating Rate OutstandingPaid by Received Effective Termination Notional/Applicable Fair
Type Agency By Agency Date Date Amount Value
Fixed payer 4.9000% LIBOR @ 65% 5/25/00 8/1/30 17,765$ (3,340)$
Fixed payer 4.5100% LIBOR @ 65% 12/13/00 8/1/31 19,710 (3,687) Fixed payer 6.8430% 3 mo LIBOR 12/13/00 8/1/16 640 (3) Fixed payer 6.2150% 3 mo LIBOR+.26% 1/25/01 8/1/19 12,605 (1,029) Fixed payer 6.0100% 3 mo LIBOR+.20% 4/5/01 2/1/16 1,320 (6) Fixed payer 4.1430% LIBOR @ 65% 5/31/01 8/1/24 14,695 (814)
Fixed payer 3.9910% LIBOR @ 65% 7/26/01 8/1/18 2,715 (130) Fixed payer 6.3600% 3 mo LIBOR+.27% 7/26/01 8/1/20 16,265 (2,009) Fixed payer 5.5300% 3 mo LIBOR+.31% 10/10/01 8/1/18 5,935 (199) Fixed payer 4.1300% SIFMA less .15% 12/6/01 8/1/32 23,385 (3,701) Fixed payer 3.8880% LIBOR @ 65% 4/18/02 8/1/27 28,460 (5,213) Fixed payer 3.9940% LIBOR @ 65% 6/6/02 2/1/24 22,025 (2,272)
Fixed payer 3.8630% LIBOR @ 65% 8/8/02 8/1/32 27,980 (2,991) Fixed payer 3.7280% LIBOR @ 65% 10/17/02 8/1/22 24,165 (1,879) Fixed payer 3.1480% LIBOR @ 65% 12/12/02 8/1/22 34,400 (2,560)
Fixed payer 3.0875% LIBOR @ 60%+.26% 8/1/04 8/1/30 12,865 (1,095)
Fixed payer 3.6100% LIBOR @ 60%+.26% 2/1/05 2/1/34 28,930 (3,846) Fixed payer 3.5600% LIBOR @ 60%+.26% 8/4/04 2/1/33 8,895 (1,143) Fixed payer 3.8040% LIBOR @ 60%+.26% 4/5/05 8/1/35 49,335 (9,238)
Fixed payer 4.2550% LIBOR @ 62%+.25% 7/27/06 8/1/40 16,000 (51) Fixed payer 4.1360% LIBOR @ 62%+.25% 7/27/06 2/1/41 60,000 (184)
Fixed payer 4.0480% LIBOR @ 62%+.25% 8/8/07 2/1/31 38,800 (791) Fixed payer 4.2360% LIBOR @ 62%+.25% 8/8/07 2/1/38 50,000 (1,980)
Fixed payer 3.9870% LIBOR @ 63%+.24% 11/7/07 8/1/32 25,000 (537)
Fixed payer 4.8000% LIBOR @ 65% 4/6/00 2/1/23 2,225 (542) Fixed payer 4.1430% LIBOR @ 65% 5/31/01 8/1/24 9,710 (1,958) Fixed payer 3.9940% LIBOR @ 65% 6/6/02 2/1/24 7,005 (1,471) Fixed payer 3.8630% LIBOR @ 65% 8/8/02 8/1/32 7,760 (2,508) Fixed payer 4.9000% LIBOR @ 65% 5/25/00 8/1/30 1,680 (786) Fixed payer 4.1430% LIBOR @ 65% 5/31/01 8/1/24 2,595 (358) Fixed payer 3.9910% LIBOR @ 65% 7/26/01 8/1/18 1,355 (94) Fixed payer 4.1300% SIFMA less .15% 12/6/01 8/1/32 3,865 (1,456) Fixed payer 4.8500% LIBOR @ 65% 11/18/08 2/1/17 4,210 (111) Fixed payer 4.8000% LIBOR @ 65% 4/6/00 2/1/23 5,170 (480) Fixed payer 4.8500% LIBOR @ 65% 11/18/08 2/1/17 245 (1) Fixed payer 3.8700% LIBOR @ 65% 11/18/08 8/1/17 4,165 (60)
Fixed payer 7.1100% LIBOR 11/18/08 8/1/22 20,695 (4,071)
612,570 (62,594)
Swaps
49

Bonds / Notes
Interest Variable Final OriginalType of Rate Reset Maturity Issuance Outstanding Outstanding
Bond Issue Bond Type* Term Date Amount Fixed Variable Total
Residential Mortgage Revenue Bonds2009 Series A-5 Tax-Exempt 3.160% - - 2041 466,115 202,755 - 202,7552009 Series A-6 (MFP) Tax-Exempt 3.270% - - 2030 69,950 49,410 - 49,410 2010 Series A Tax-Exempt 2.700% - 4.625% - - 2027 24,000 10,810 - 10,810 2011 Series A Tax-Exempt 2.450% - 4.750% - - 2028 72,000 23,100 - 23,100 2013 Series A Taxable 2.900% - - 2042 100,210 42,834 - 42,834 2013 Series B Taxable 2.900% - - 2042 33,550 20,907 - 20,907
765,825 349,816 - 349,816
Multifamily Loan Purchase Bonds:2000 Issue A Taxable Variable Pass-through Monthly 2017 269,024 - 215 215
269,024 - 215 215
Multifamily Housing Revenue Bonds III:2000 Series B Tax-Exempt - - - - - - - - 2000 Series D Tax-Exempt - - - - - - - - 2001 Series D Tax-Exempt - - - - - - - - 2001 Series E Tax-Exempt 0.281% VRDO Weekly 2036 78,735 - 27,195 27,195 2001 Series F Tax-Exempt 0.276% VRDO Weekly 2032 19,040 - 9,320 9,320 2001 Series G Tax-Exempt 0.280% VRDO Weekly 2025 73,975 - 2,490 2,490 2001 Series G Tax-Exempt 0.280% VRDO Weekly 2036 - - 9,115 9,115 2001 Series G Tax-Exempt 0.280% VRDO Weekly 2036 - - 7,215 7,215 2002 Series A Tax-Exempt - - - - - - - - 2002 Series A Tax-Exempt - - - - - - - - 2002 Series B Tax-Exempt - - - - - - - - 2002 Series C Tax-Exempt - - - - - - - - 2002 Series C Tax-Exempt - - - - - - - - 2002 Series D Tax-Exempt 0.276% VRDO Weekly 2033 12,760 - 3,515 3,515 2002 Series E Tax-Exempt 0.280% VRDO Weekly 2037 71,305 - 2,855 2,855 2002 Series E Tax-Exempt 0.280% VRDO Weekly 2037 - - 11,335 11,335 2003 Series C Tax-Exempt 1.098% Auction 35-day 2038 97,295 - 23,705 23,705 2004 Series A Tax-Exempt - - - - - - - - 2004 Series B Tax-Exempt - - - - - - - - 2004 Series B Tax-Exempt - - - - - - - - 2004 Series B Tax-Exempt - - - - - - - - 2004 Series B Tax-Exempt - - - - - - - - 2004 Series C Tax-Exempt 1.002% Auction Weekly 2025 13,940 - 4,000 4,000 2005 Series A Tax-Exempt - - - - - - - - 2005 Series B Tax-Exempt - - - - - - - - 2005 Series B Tax-Exempt - - - - - - - - 2005 Series B Tax-Exempt - - - - - - - - 2005 Series D Tax-Exempt 0.280% VRDO Weekly 2038 91,225 - 14,885 14,885 2006 Series A Tax-Exempt - - - - - - - - 2006 Series A Tax-Exempt - - - - - - - - 2006 Series A Tax-Exempt - - - - - - - - 2007 Series B Tax-Exempt - - - - - - - - 2007 Series B Tax-Exempt - - - - - - - - 2007 Series C Tax-Exempt 0.280% VRDO Weekly 2042 27,970 - 4,770 4,770 2007 Series C Tax-Exempt 0.280% VRDO Weekly 2040 - - 4,295 4,295 2008 Series A Tax-Exempt 0.268% VRDO Weekly 2040 11,370 - 7,115 7,115 2008 Series B Tax-Exempt 0.281% VRDO Weekly 2036 104,890 - 14,555 14,555 2008 Series B Tax-Exempt 0.275% VRDO Weekly 2038 - 8,525 8,525 2008 Series C Tax-Exempt 0.282% VRDO Weekly 2038 33,390 - 5,105 5,105 2008 Series C Tax-Exempt 0.282% VRDO Weekly 2036 - - 11,760 11,760 2008 Series C Tax-Exempt 0.282% VRDO Weekly 2038 - - 740 740 2014 Series A Tax-Exempt 0.850% - 4.800% - - 2049 38,915 24,965 - 24,965 2015 Series A Taxable 2.379% - 4.050% - - 2030 174,180 174,180 - 174,180
848,990 199,145 172,495 371,640
RateRange
50

Fixed Rate Floating Rate OutstandingPaid by Received Effective Termination Notional/Applicable Fair
Type Agency By Agency Date Date Amount Value
Fixed payer 4.5850% LIBOR @ 64% 7/12/00 2/1/31 765 (134)Fixed payer 4.3950% LIBOR @ 64% 11/16/00 2/1/31 10,575 (2,896)Fixed payer 4.4520% SIFMA less .20% 6/28/01 8/1/22 1,540 (195)Fixed payer 4.7120% SIFMA less .15% 6/28/01 2/1/36 39,980 (13,190)Fixed payer 4.0290% SIFMA less .20% 2/1/02 2/1/32 10,610 (2,195)Fixed payer 4.2050% SIFMA less .15% 2/1/02 8/1/36 2,505 (439)Fixed payer 4.2050% SIFMA less .15% 2/1/02 8/1/36 32,525 (9,054)Fixed payer 4.5950% SIFMA less .15% 2/1/04 2/1/34 7,855 (2,574)Fixed payer 4.5000% SIFMA less .15% 8/1/02 8/1/32 13,360 (3,506)Fixed payer 4.8900% SIFMA less .15% 2/2/04 2/1/37 9,820 (4,038)Fixed payer 4.0370% SIFMA less .20% 2/1/03 2/1/35 19,050 (4,669)Fixed payer 4.4050% SIFMA less .15% 2/1/04 2/1/37 11,815 (4,300)Fixed payer 4.6380% SIFMA less .15% 8/1/05 8/1/37 13,795 (5,040)Fixed payer 4.0850% SIFMA less .20% 2/3/03 2/1/35 9,835 (2,944)Fixed payer 4.1510% SIFMA less .15% 2/3/03 2/1/35 13,125 (3,966)Fixed payer 4.5710% SIFMA less .15% 11/1/04 8/1/37 35,665 (15,115)
Fixed payer 3.0590% LIBOR @ 60%+.21% 8/1/04 8/1/34 15,270 (2,230)Fixed payer 3.6920% LIBOR @ 60%+.26% 8/1/06 8/1/36 10,790 (1,425)Fixed payer 3.3300% LIBOR @ 60%+.26% 8/1/04 8/1/34 4,470 (338)Fixed payer 4.9783% SIFMA less .15% 8/1/06 2/1/39 10,360 (1,880)Fixed payer 4.5390% SIFMA less .15% 8/1/04 8/1/34 2,145 (237)Fixed payer 3.4350% LIBOR @ 60%+.21% 2/1/05 8/1/25 5,840 (728)Fixed payer 3.5640% SIFMA less .20% 7/1/05 8/1/35 1,990 (527)Fixed payer 3.9540% SIFMA less .15% 6/15/05 8/1/35 2,285 (321)Fixed payer 4.0790% SIFMA less .15% 2/1/07 2/1/37 20,590 (3,289)Fixed payer 3.9570% SIFMA less .15% 8/1/07 2/1/38 3,450 (623)Fixed payer 3.7010% LIBOR @ 60%+.26% 2/1/06 2/1/38 25,240 (5,669)Fixed payer 4.042% * HR 97% SIFMA & HR 6/15/06 8/1/27 4,665 (637)Fixed payer 4.381% * HR 97% SIFMA & HR 6/15/06 8/1/39 8,205 (1,212)Fixed payer 4.492% * HR 97% SIFMA & HR 6/15/06 2/1/41 3,755 (686)Fixed payer 3.9370% LIBOR @ 64%+.25% 7/12/07 2/1/22 1,475 (125)Fixed payer 4.2220% LIBOR @ 64%+.25% 8/1/09 2/1/40 5,230 (1,148)Fixed payer 3.7280% LIBOR @ 63%+.30% 2/1/08 8/1/42 4,955 (687)Fixed payer 3.9190% LIBOR @ 63%+.30% 11/1/09 8/1/40 12,755 (2,619)Fixed payer 3.2950% LIBOR @ 61%+.24% 11/1/09 8/1/40 9,375 (2,640)Fixed payer 3.3850% SIFMA less .15% 8/1/03 8/1/36 17,760 (3,023)Fixed payer 4.2950% SIFMA less .15% 8/1/05 2/1/38 24,540 (1,749)Fixed payer 3.8830% LIBOR @ 60%+.26% 12/1/04 8/1/38 7,705 (2,377)Fixed payer 3.9680% LIBOR @ 60%+.26% 7/1/05 2/1/36 11,760 (3,403)Fixed payer 4.0600% LIBOR @ 60%+.26% 2/1/06 8/1/38 8,000 (2,632)
455,430 (114,460)
Swaps
51
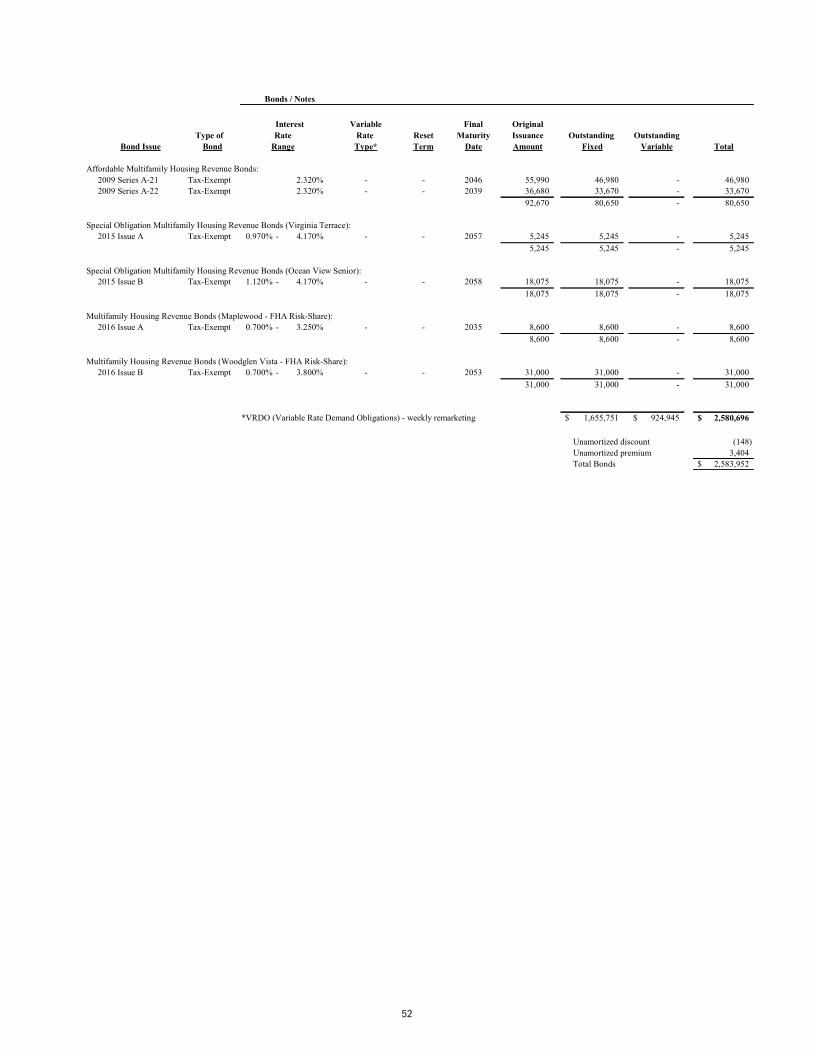
Bonds / Notes
Interest Variable Final OriginalType of Rate Reset Maturity Issuance Outstanding Outstanding
Bond Issue Bond Type* Term Date Amount Fixed Variable Total
Affordable Multifamily Housing Revenue Bonds:2009 Series A-21 Tax-Exempt 2.320% - - 2046 55,990 46,980 - 46,980 2009 Series A-22 Tax-Exempt 2.320% - - 2039 36,680 33,670 - 33,670
92,670 80,650 - 80,650
Special Obligation Multifamily Housing Revenue Bonds (Virginia Terrace):2015 Issue A Tax-Exempt 0.970% - 4.170% - - 2057 5,245 5,245 - 5,245
5,245 5,245 - 5,245
Special Obligation Multifamily Housing Revenue Bonds (Ocean View Senior):2015 Issue B Tax-Exempt 1.120% - 4.170% - - 2058 18,075 18,075 - 18,075
18,075 18,075 - 18,075
Multifamily Housing Revenue Bonds (Maplewood - FHA Risk-Share):2016 Issue A Tax-Exempt 0.700% - 3.250% - - 2035 8,600 8,600 - 8,600
8,600 8,600 - 8,600
Multifamily Housing Revenue Bonds (Woodglen Vista - FHA Risk-Share):2016 Issue B Tax-Exempt 0.700% - 3.800% - - 2053 31,000 31,000 - 31,000
31,000 31,000 - 31,000
*VRDO (Variable Rate Demand Obligations) - weekly remarketing 1,655,751$ 924,945$ 2,580,696$
Unamortized discount (148) Unamortized premium 3,404 Total Bonds 2,583,952$
RateRange
52

Fixed Rate Floating Rate OutstandingPaid by Received Effective Termination Notional/Applicable Fair
Type Agency By Agency Date Date Amount Value
Total Outstanding Notional and Fair Value 1,068,000$ (177,054)$
Swaps
53
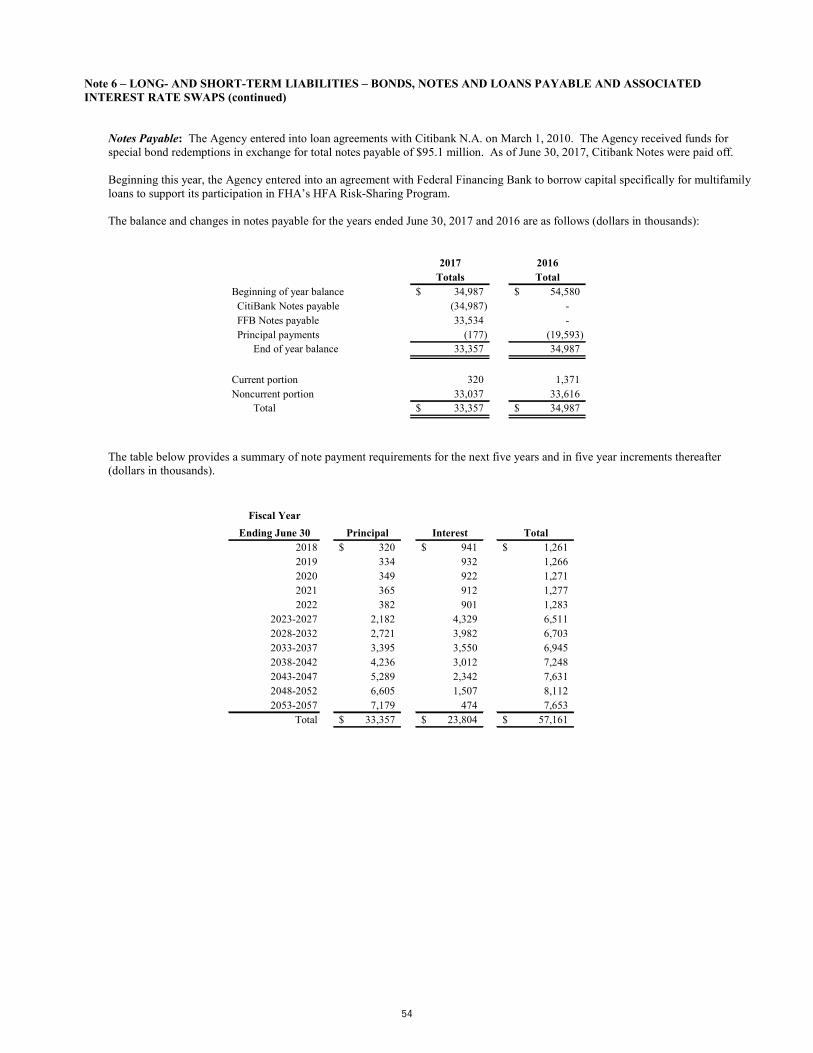
Note 6 – LONG- AND SHORT-TERM LIABILITIES – BONDS, NOTES AND LOANS PAYABLE AND ASSOCIATED INTEREST RATE SWAPS (continued)
Notes Payable: The Agency entered into loan agreements with Citibank N.A. on March 1, 2010. The Agency received funds for special bond redemptions in exchange for total notes payable of $95.1 million. As of June 30, 2017, Citibank Notes were paid off.
Beginning this year, the Agency entered into an agreement with Federal Financing Bank to borrow capital specifically for multifamily loans to support its participation in FHA’s HFA Risk-Sharing Program.
The balance and changes in notes payable for the years ended June 30, 2017 and 2016 are as follows (dollars in thousands):
2017 2016Totals Total
Beginning of year balance 34,987$ 54,580$ CitiBank Notes payable (34,987) -
FFB Notes payable 33,534 - Principal payments (177) (19,593)
End of year balance 33,357 34,987
Current portion 320 1,371 Noncurrent portion 33,037 33,616
Total 33,357$ 34,987$
The table below provides a summary of note payment requirements for the next five years and in five year increments thereafter (dollars in thousands).
Fiscal YearEnding June 30 Principal Interest Total
2018 320$ 941$ 1,261$ 2019 334 932 1,266 2020 349 922 1,271 2021 365 912 1,277 2022 382 901 1,283
2023-2027 2,182 4,329 6,511 2028-2032 2,721 3,982 6,703 2033-2037 3,395 3,550 6,945 2038-2042 4,236 3,012 7,248 2043-2047 5,289 2,342 7,631 2048-2052 6,605 1,507 8,112 2053-2057 7,179 474 7,653
Total 33,357$ 23,804$ 57,161$
54
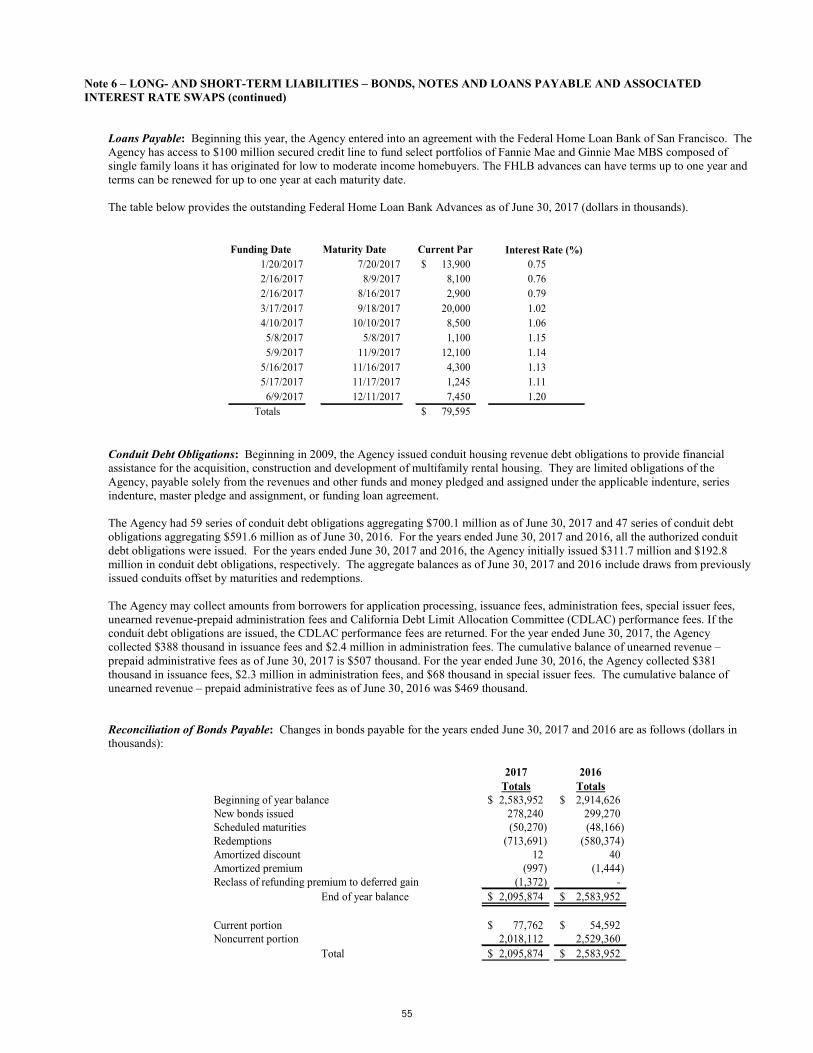
Note 6 – LONG- AND SHORT-TERM LIABILITIES – BONDS, NOTES AND LOANS PAYABLE AND ASSOCIATED INTEREST RATE SWAPS (continued)
Loans Payable: Beginning this year, the Agency entered into an agreement with the Federal Home Loan Bank of San Francisco. The Agency has access to $100 million secured credit line to fund select portfolios of Fannie Mae and Ginnie Mae MBS composed of single family loans it has originated for low to moderate income homebuyers. The FHLB advances can have terms up to one year and terms can be renewed for up to one year at each maturity date.
The table below provides the outstanding Federal Home Loan Bank Advances as of June 30, 2017 (dollars in thousands).
Funding Date Maturity Date Current Par Interest Rate (%)1/20/2017 7/20/2017 13,900$ 0.752/16/2017 8/9/2017 8,100 0.762/16/2017 8/16/2017 2,900 0.793/17/2017 9/18/2017 20,000 1.024/10/2017 10/10/2017 8,500 1.06
5/8/2017 5/8/2017 1,100 1.155/9/2017 11/9/2017 12,100 1.14
5/16/2017 11/16/2017 4,300 1.135/17/2017 11/17/2017 1,245 1.11
6/9/2017 12/11/2017 7,450 1.20Totals 79,595$
Conduit Debt Obligations: Beginning in 2009, the Agency issued conduit housing revenue debt obligations to provide financial assistance for the acquisition, construction and development of multifamily rental housing. They are limited obligations of the Agency, payable solely from the revenues and other funds and money pledged and assigned under the applicable indenture, series indenture, master pledge and assignment, or funding loan agreement.
The Agency had 59 series of conduit debt obligations aggregating $700.1 million as of June 30, 2017 and 47 series of conduit debt obligations aggregating $591.6 million as of June 30, 2016. For the years ended June 30, 2017 and 2016, all the authorized conduit debt obligations were issued. For the years ended June 30, 2017 and 2016, the Agency initially issued $311.7 million and $192.8 million in conduit debt obligations, respectively. The aggregate balances as of June 30, 2017 and 2016 include draws from previously issued conduits offset by maturities and redemptions.
The Agency may collect amounts from borrowers for application processing, issuance fees, administration fees, special issuer fees, unearned revenue-prepaid administration fees and California Debt Limit Allocation Committee (CDLAC) performance fees. If the conduit debt obligations are issued, the CDLAC performance fees are returned. For the year ended June 30, 2017, the Agency collected $388 thousand in issuance fees and $2.4 million in administration fees. The cumulative balance of unearned revenue – prepaid administrative fees as of June 30, 2017 is $507 thousand. For the year ended June 30, 2016, the Agency collected $381 thousand in issuance fees, $2.3 million in administration fees, and $68 thousand in special issuer fees. The cumulative balance of unearned revenue – prepaid administrative fees as of June 30, 2016 was $469 thousand.
Reconciliation of Bonds Payable: Changes in bonds payable for the years ended June 30, 2017 and 2016 are as follows (dollars in thousands):
2017 2016Totals Totals
Beginning of year balance 2,583,952$ 2,914,626$ New bonds issued 278,240 299,270 Scheduled maturities (50,270) (48,166) Redemptions (713,691) (580,374) Amortized discount 12 40 Amortized premium (997) (1,444) Reclass of refunding premium to deferred gain (1,372) -
End of year balance 2,095,874$ 2,583,952$
Current portion 77,762$ 54,592$ Noncurrent portion 2,018,112 2,529,360
Total 2,095,874$ 2,583,952$
55

Note 6 – LONG- AND SHORT-TERM LIABILITIES – BONDS, NOTES AND LOANS PAYABLE AND ASSOCIATED INTEREST RATE SWAPS (continued)
Variable Rate Debt and Debt Service Requirements: The Agency’s variable rate debt is typically related to remarketed rates or common indices such as the Securities Industry and Financial Markets Association (“SIFMA”) or the London Inter-Bank Offered Rate (“LIBOR”) and resets periodically. The interest calculations shown in the table below are based on the variable rate in effect at June 30, 2016, and may not be indicative of the actual interest expense that will be incurred by the Fund. As rates vary, variable rate bond interest payments and net swap payments will vary. The table below provides a summary of debt service requirements and net swap payments for the next five years and in five year increments thereafter (dollars in thousands).
Fiscal Year Interest RateEnding June 30 Principal Interest Principal Interest Swaps, Net Total
2018 69,595$ 57,052$ 8,165$ 1,334$ 27,518$ 163,664$ 2019 70,135 59,061 7,180 1,339 24,458 162,173 2020 69,910 57,074 7,425 1,255 22,030 157,694 2021 74,840 54,551 7,945 1,170 19,896 158,402 2022 72,960 52,384 7,985 1,080 17,933 152,342
2023-2027 463,560 216,353 27,305 4,336 68,119 779,673 2028-2032 658,095 121,149 35,660 3,070 42,713 860,687 2033-2037 265,600 42,528 40,985 868 15,352 365,333 2038-2042 145,809 22,464 2,775 28 1,144 172,220 2043-2047 34,320 7,055 - - 6 41,381 2048-2052 10,380 3,962 - - - 14,342 2053-2057 1,140 2,507 - - - 3,647 2058-2058 13,205 - - - - 13,205
Total 1,949,549$ 696,140$ 145,425$ 14,480$ 239,169$ 3,044,763$
Fixed/VariableUnswapped
VariableSwapped
As of June 30, 2017, the difference between the gross bonds payable and the net bonds payable was $0.9 million. This represented the aggregate of the unamortized bond premium and bond discount.
Letter of Credit Agreements: The Temporary Credit and Liquidity Program expired December 2015. In order to replace the liquidity provided by this program, the Agency entered into letter of credit agreements in November 2014, May 2015 and July 2015. For the years ended June 30, 2017 and 2016, the Agency had immediately reimbursed the full amount of all the draws on the agreements.
Objective of the Interest Rate Swaps: In order to protect against rising rates, the Agency primarily entered into swaps to establish synthetic fixed rates for a like amount of the Agency’s variable rate bond obligations. The majority of the Agency’s interest rate swap transactions are structured for the Agency to pay a fixed interest rate while receiving a variable interest rate (fixed payer swaps) and exceptions are listed under Basis Risk Associated with Interest Rate Swaps. Synthetic fixed rates provide the Agency with a significantly lower fixed cost of funds compared to issuing fixed-rate bonds; however, the increased risks related to the synthetic fixed rates have the effect of increasing costs to the Agency.
Terms, Fair Value and Credit Risk: The terms and fair values of the outstanding fixed payer swaps as of June 30, 2017 are summarized in the table at the beginning of this note. The terms and fair values of the outstanding basis swaps are summarized in the table under Basis Risk.
The fair value of the swaps is reported as “Derivative swap asset” within “Other assets” or as “Derivative swap liability” within “Other liabilities” in the statements of net position. The accumulated decrease or increase in the fair value of the effective swaps is reported as “Accumulated decrease in fair value of hedging derivatives” within “Deferred outflow of resources” or “Accumulated increase in fair value of hedging derivatives” within “Deferred inflow of resources” in the statements of net position. Alternatively, the gain or loss on the fair value of the ineffective swaps is reported as “Investment swap revenue” within “Other revenues” in the statements of revenues, expenses and changes in net position.
The Agency did not pay or receive any cash when swap transactions were initiated except for in-substance assignments. For the years ended June 30, 2017 and 2016, no additional swaps were considered investment derivatives because they no longer met the criteria for effectiveness. The following table summarizes the swap fair value activity in the statements of net position as of June 30, 2017 and 2016 and the statements of revenues, expenses and changes in net position for the years ended June 30, 2017 and 2016 (dollars in thousands):
56

Note 6 – LONG- AND SHORT-TERM LIABILITIES – BONDS, NOTES AND LOANS PAYABLE AND ASSOCIATED INTEREST RATE SWAPS (continued)
Statements of Net Position 2017 2016 Derivative swap asset 508$ 241$ Accumulated decrease in fair value of hedging derivatives 10,051 27,441
Derivative swap liability 114,353 177,054
Statements of Revenue, Expenses and Changes in Net position Investment swap revenue 45,579 (10,625)
Except as discussed under rollover risk, the Agency’s swap agreements contain scheduled reductions to outstanding notional amounts that are expected to approximately follow scheduled or anticipated reductions in the associated “bonds payable” category.
As of June 30, 2017, the Agency has interest rate swap agreements with 10 swap counterparties. All of the Agency’s interest rate swap agreements require the Agency to post collateral if its general obligation credit ratings, as issued by Moody’s and Standard and Poor’s fall below a certain level and if the fair value of the swaps breach a certain threshold. The collateral can be posted in several forms: cash, mortgage-backed securities, or treasury securities. If the Agency does not post collateral, the interest rate swap can be terminated by the counterparty. The cash collateral and securities collateral are reported as “Current assets: Other Assets” and “Noncurrent assets: Investments,” respectively, in the statements of net position. As of June 30, 2017, the Agency posted cash and fair value of mortgage-backed securities as collateral with swap counterparties in the amounts of $630 thousand and $35.1 million, respectively. As of June 30, 2016, the Agency posted cash and fair value of mortgage-backed securities as collateral in the amounts of $18.0 million and $14.8 million, respectively.
Because interest rates are generally lower than the rates in effect at inception of the swap agreements, the Agency’s fixed payer swap agreements had an aggregate negative fair value of $114.4 million as of June 30, 2017 and $177.1 million as of June 30, 2016. Fair values are as reported by the Agency’s dealer counterparties and are estimated using the zero-coupon method. This method calculates the future net settlement payments required by the swap, assuming that the current forward rates implied by the yield curve correctly anticipate future spot interest rates. These payments are then discounted using the spot rates implied by the current yield curve for hypothetical zero-coupon bonds due on the date of each future net settlement on the swaps. The swaps are classified in Level 2 of the fair value hierarchy. Level 2 is described in the Cash, Cash Equivalents and Investments note.
As of June 30, 2017, the Agency’s swap portfolio had an aggregate asset position of $508 thousand. This represents the maximum loss that would be reported at the reporting date if all counterparties failed to perform as contracted. However, this maximum exposure is eliminated by the applicable counterparty swap liabilities included in the $114.4 million total. Therefore, the Agency has no net exposure to credit risk.
The following table shows the number of fixed payer swaps and outstanding notional amounts by the counterparties’ respective credit ratings as of June 30, 2017 (dollars in thousands).
Standard & Outstanding Number of Moody's Poors Notional Amount Swap Transactions
Aa2 AA- 94,410$ 4Aa3 A+ 169,320 9Aa3 AA 370,440 31A1 A+ 9,820 1A1 A 24,625 1
Baa1 BBB+ 65,290 6Baa2 A- 87,300 7Baa3 BBB 9,160 1
830,365$ 60
Interest Rate Risk: The Agency is exposed to interest rate risk on its fixed payer swaps. As the LIBOR or the SIFMA swap index decreases, the Agency’s net payments on the swaps increase.
Basis Risk: All of the Agency’s interest rate swaps contain an element of basis risk, the risk that the floating rate component of the swap will not match the floating rate of the underlying bonds. This risk arises because floating rates paid by swap counterparties are based on indices, which consist of market-wide averages, while interest paid on the Agency’s variable rate bonds is specific to individual bond issues.
57

Note 6 – LONG- AND SHORT-TERM LIABILITIES – BONDS, NOTES AND LOANS PAYABLE AND ASSOCIATED INTEREST RATE SWAPS (continued)
Historically, the Agency’s variable rate tax-exempt bonds trade at a slight discount to the SIFMA index. For those swaps associated with tax-exempt bonds for which the Agency receives a variable rate payment based on a percentage of LIBOR, the Agency is exposed to basis risk should the relationship between SIFMA and LIBOR converge.
Multiple swap formulas have been used by the Agency. As of June 30, 2017, the formulas for the swap portfolio utilized the SIFMA, the 1 month LIBOR and the 3 month LIBOR rates. As of June 30, 2017, rates for the SIFMA, the 1 month LIBOR and the 3 month LIBOR were 0.91%, 1.224% and 1.299%, respectively. The swap formulas will continue to be monitored for its effectiveness in case the Agency chooses to enter into any future interest rate swaps. In addition, the Agency holds 6 basis swaps as a means to change the variable rate formula received for 112 million of swap notional amount. These basis swaps changed the variable rate formula received from counterparties from 65% of LIBOR to those described in the following table as of June 30, 2017 (dollars in thousands):
Variable Rate Floating Rate OutstandingPaid By Received By Effective Termination Notional/Applicable Fair
Bond Issue Agency Agency */** Date Date Amount ValueHome MortgageRevenue Bonds:
2000 Series J LIBOR @ 65% LIBOR @ 85%-0.019% 2/1/04 8/1/30 19,445 91 2000 Series X-2 LIBOR @ 65% LIBOR @ 85%-0.019% 2/1/04 8/1/31 16,845 77 2001 Series N LIBOR @ 65% LIBOR @ 85%-0.019% 2/1/04 8/1/18 2,805 4 2002 Series B LIBOR @ 65% LIBOR @ 85%-0.019% 2/1/04 8/1/27 26,625 151 2002 Series F LIBOR @ 65% LIBOR @ 85%-0.019% 2/1/04 2/1/24 27,455 121 2002 Series M LIBOR @ 65% LIBOR @ 85%-0.019% 2/1/04 8/1/22 18,735 64
111,910$ 508$
* The notional amount and the amortization of these swaps mirror the initial 65% of LIBOR swaps, basically overlaying the swaps sothat the effective rate received from the counterparties are the rates shown in the table above.
**The variable interest rate received by the counterparties is dependent on the LIBOR interest rate at the time of settlement. The rate shown in the table is the effective rate at June 30, 2017.
Termination Risk: Counterparties to the Agency’s interest rate swap agreements have ordinary termination rights that require settlement payments by the Agency or the counterparty based on the fair value of the swap at the date of termination.
Rollover Risk: The Agency is exposed to rollover risk on interest rate swaps that are hedges of debt that mature or may be terminated prior to the maturity of the hedged debt. When these swaps terminate, the Agency will be re-exposed to the risks being hedged by the swaps. The fixed payer interest rate swaps’ termination dates and associated debts’ maturities are listed in the previous bonds payable and interest rate swap table.
58

Note 6 – LONG- AND SHORT-TERM LIABILITIES – BONDS, NOTES AND LOANS PAYABLE AND ASSOCIATED INTEREST RATE SWAPS (continued)
Over Hedged Bonds: All notional amounts (or “applicable amounts”) of the fixed payer swaps match the principal amounts of the associated debt with the following exceptions as of June 30, 2017 (dollars in thousands):
Bond Issue Bonds Outstanding Swap Notional Amount Unmatched Swap Fair ValueHome Mortgage Revenue Bonds
2000 Series J * $ 17,765 $ 17,765 (2,082)$ 2000 Series X2 * 16,845 16,845 (2,381) 2001 Series J 9,930 9,930 (326)2001 Series N * 1,450 1,450 (25) 2001 Series O 12,105 12,105 (992)2002 Series S 2,290 2,290 (39)2001 Series U 20,200 20,200 (2,301)2002 Series B * 26,625 26,625 (3,267) 2002 Series F * 20,450 20,450 (1,138) 2002 Series J 22,555 22,555 (1,738)2002 Series M * 18,735 18,735 (907) 2002 Series P 28,135 28,135 (1,332)2004 Series A 10,415 10,415 (612)2004 Series G 24,625 24,625 (2,403)2004 Series I 7,570 7,570 (714)2007 Series H 50,000 50,000 (137)2007 Series H 2,225 2,225 (376)2008 Series C 9,470 9,470 (1,310)2008 Series C 7,005 7,005 (992)2008 Series C 7,760 7,760 (1,760)2008 Series C 3,890 3,890 (249)2008 Series D 1,680 1,680 (589)2008 Series D 2,595 2,595 (219)2008 Series D 1,355 1,355 (39)2008 Series D 3,865 3,865 (1,010)2008 Series F 425 425 (1)2008 Series I 17,600 17,600 (2,445)
Multifamily Housing Revenue Bonds III2000 Series B 630 630 (89)2000 Series D 10,050 10,050 (2,046)2001 Series D 1,340 1,340 (115)2001 Series E $ 13,970 38,435 24,465 (5,891)2001 Series F 8,580 9,820 1,240 (180)2001 Series G 11,020 33,405 22,385 (4,305)2001 Series G 6,940 7,550 610 (145)2002 Series A 12,560 12,560 (2,367)2002 Series A 9,520 9,520 (2,884)2002 Series B 17,970 17,970 (3,108)2002 Series C 13,360 13,360 (3,577)2002 Series C 11,470 11,470 (2,991)2002 Series D 9,490 9,490 (1,987)2002 Series E 12,725 12,725 (2,699)2002 Series E 34,870 34,870 (10,709)2004 Series A 14,200 14,200 (1,380)2004 Series B 10,490 10,490 (888)2004 Series B 4,320 4,320 (177)2004 Series B 2,095 2,095 (155)2004 Series B 9,895 9,895 (1,396)2004 Series C 3,655 5,340 1,685 (141)2005 Series A 1,930 1,930 (337)2005 Series B 2,215 2,215 (236)2005 Series B 19,710 19,710 (2,421)2005 Series B 3,355 3,355 (331)2005 Series D 14,375 24,050 9,675 (1,537)2006 Series A 4,090 4,090 (385)2006 Series A 7,980 7,980 (664)2006 Series A 3,665 3,665 (384)2007 Series B 5,045 5,045 (784)2007 Series B 1,240 1,240 (69)2007 Series C 4,690 4,690 (423)
59
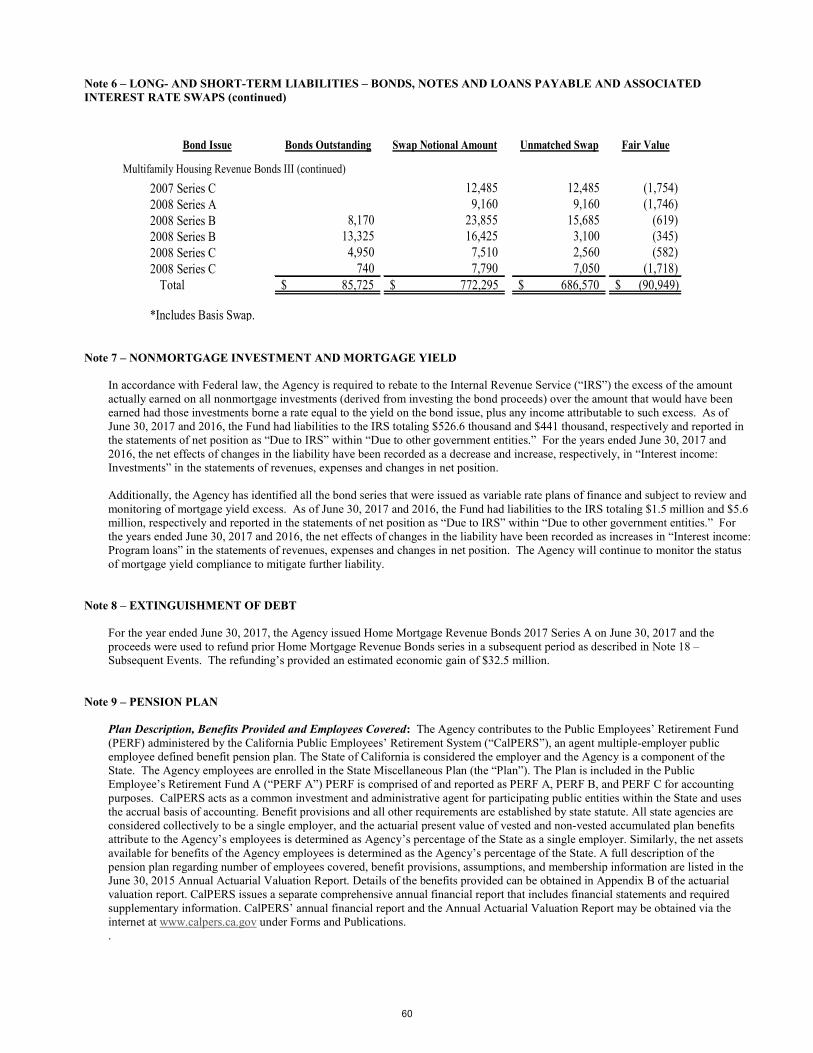
Note 6 – LONG- AND SHORT-TERM LIABILITIES – BONDS, NOTES AND LOANS PAYABLE AND ASSOCIATED INTEREST RATE SWAPS (continued)
Bond Issue Bonds Outstanding Swap Notional Amount Unmatched Swap Fair Value
Multifamily Housing Revenue Bonds III (continued)2007 Series C 12,485 12,485 (1,754)2008 Series A 9,160 9,160 (1,746)2008 Series B 8,170 23,855 15,685 (619)2008 Series B 13,325 16,425 3,100 (345)2008 Series C 4,950 7,510 2,560 (582)2008 Series C 740 7,790 7,050 (1,718)
Total 85,725$ 772,295$ 686,570$ (90,949)$
*Includes Basis Swap.
Note 7 – NONMORTGAGE INVESTMENT AND MORTGAGE YIELD
In accordance with Federal law, the Agency is required to rebate to the Internal Revenue Service (“IRS”) the excess of the amount actually earned on all nonmortgage investments (derived from investing the bond proceeds) over the amount that would have been earned had those investments borne a rate equal to the yield on the bond issue, plus any income attributable to such excess. As of June 30, 2017 and 2016, the Fund had liabilities to the IRS totaling $526.6 thousand and $441 thousand, respectively and reported in the statements of net position as “Due to IRS” within “Due to other government entities.” For the years ended June 30, 2017 and 2016, the net effects of changes in the liability have been recorded as a decrease and increase, respectively, in “Interest income: Investments” in the statements of revenues, expenses and changes in net position.
Additionally, the Agency has identified all the bond series that were issued as variable rate plans of finance and subject to review and monitoring of mortgage yield excess. As of June 30, 2017 and 2016, the Fund had liabilities to the IRS totaling $1.5 million and $5.6 million, respectively and reported in the statements of net position as “Due to IRS” within “Due to other government entities.” For the years ended June 30, 2017 and 2016, the net effects of changes in the liability have been recorded as increases in “Interest income: Program loans” in the statements of revenues, expenses and changes in net position. The Agency will continue to monitor the status of mortgage yield compliance to mitigate further liability.
Note 8 – EXTINGUISHMENT OF DEBT
For the year ended June 30, 2017, the Agency issued Home Mortgage Revenue Bonds 2017 Series A on June 30, 2017 and the proceeds were used to refund prior Home Mortgage Revenue Bonds series in a subsequent period as described in Note 18 – Subsequent Events. The refunding’s provided an estimated economic gain of $32.5 million.
Note 9 – PENSION PLAN
Plan Description, Benefits Provided and Employees Covered: The Agency contributes to the Public Employees’ Retirement Fund (PERF) administered by the California Public Employees’ Retirement System (“CalPERS”), an agent multiple-employer public employee defined benefit pension plan. The State of California is considered the employer and the Agency is a component of the State. The Agency employees are enrolled in the State Miscellaneous Plan (the “Plan”). The Plan is included in the Public Employee’s Retirement Fund A (“PERF A”) PERF is comprised of and reported as PERF A, PERF B, and PERF C for accounting purposes. CalPERS acts as a common investment and administrative agent for participating public entities within the State and uses the accrual basis of accounting. Benefit provisions and all other requirements are established by state statute. All state agencies are considered collectively to be a single employer, and the actuarial present value of vested and non-vested accumulated plan benefits attribute to the Agency’s employees is determined as Agency’s percentage of the State as a single employer. Similarly, the net assets available for benefits of the Agency employees is determined as the Agency’s percentage of the State. A full description of the pension plan regarding number of employees covered, benefit provisions, assumptions, and membership information are listed in the June 30, 2015 Annual Actuarial Valuation Report. Details of the benefits provided can be obtained in Appendix B of the actuarial valuation report. CalPERS issues a separate comprehensive annual financial report that includes financial statements and required supplementary information. CalPERS’ annual financial report and the Annual Actuarial Valuation Report may be obtained via the internet at www.calpers.ca.gov under Forms and Publications. .
60
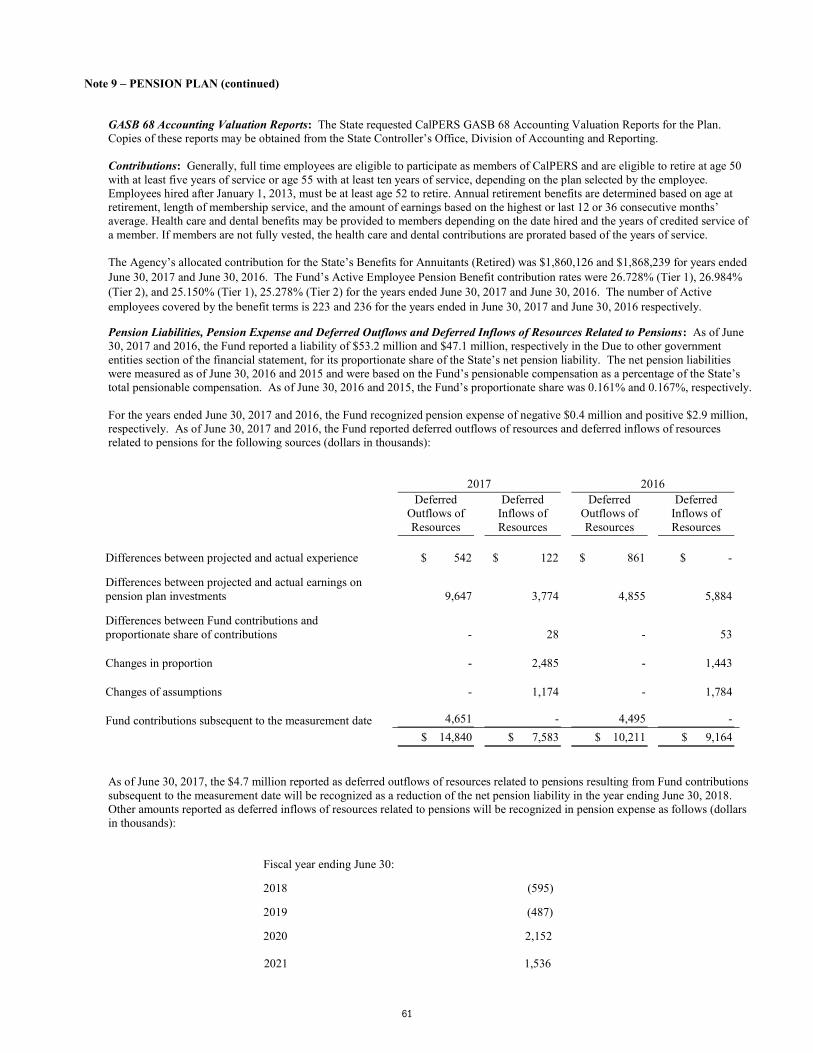
Note 9 – PENSION PLAN (continued)
GASB 68 Accounting Valuation Reports: The State requested CalPERS GASB 68 Accounting Valuation Reports for the Plan. Copies of these reports may be obtained from the State Controller’s Office, Division of Accounting and Reporting.
Contributions: Generally, full time employees are eligible to participate as members of CalPERS and are eligible to retire at age 50 with at least five years of service or age 55 with at least ten years of service, depending on the plan selected by the employee. Employees hired after January 1, 2013, must be at least age 52 to retire. Annual retirement benefits are determined based on age at retirement, length of membership service, and the amount of earnings based on the highest or last 12 or 36 consecutive months’ average. Health care and dental benefits may be provided to members depending on the date hired and the years of credited service of a member. If members are not fully vested, the health care and dental contributions are prorated based of the years of service.
The Agency’s allocated contribution for the State’s Benefits for Annuitants (Retired) was $1,860,126 and $1,868,239 for years ended June 30, 2017 and June 30, 2016. The Fund’s Active Employee Pension Benefit contribution rates were 26.728% (Tier 1), 26.984% (Tier 2), and 25.150% (Tier 1), 25.278% (Tier 2) for the years ended June 30, 2017 and June 30, 2016. The number of Active employees covered by the benefit terms is 223 and 236 for the years ended in June 30, 2017 and June 30, 2016 respectively.
Pension Liabilities, Pension Expense and Deferred Outflows and Deferred Inflows of Resources Related to Pensions: As of June 30, 2017 and 2016, the Fund reported a liability of $53.2 million and $47.1 million, respectively in the Due to other government entities section of the financial statement, for its proportionate share of the State’s net pension liability. The net pension liabilities were measured as of June 30, 2016 and 2015 and were based on the Fund’s pensionable compensation as a percentage of the State’s total pensionable compensation. As of June 30, 2016 and 2015, the Fund’s proportionate share was 0.161% and 0.167%, respectively.
For the years ended June 30, 2017 and 2016, the Fund recognized pension expense of negative $0.4 million and positive $2.9 million, respectively. As of June 30, 2017 and 2016, the Fund reported deferred outflows of resources and deferred inflows of resources related to pensions for the following sources (dollars in thousands):
2017 2016 Deferred
Outflows of Resources
Deferred Inflows of Resources
Deferred Outflows of Resources
Deferred Inflows of Resources
Differences between projected and actual experience $ 542 $ 122 $ 861 $ -
Differences between projected and actual earnings on pension plan investments 9,647 3,774 4,855 5,884
Differences between Fund contributions and proportionate share of contributions - 28 - 53
Changes in proportion - 2,485 - 1,443
Changes of assumptions - 1,174 - 1,784
Fund contributions subsequent to the measurement date 4,651 - 4,495 - $ 14,840 $ 7,583 $ 10,211 $ 9,164
As of June 30, 2017, the $4.7 million reported as deferred outflows of resources related to pensions resulting from Fund contributions subsequent to the measurement date will be recognized as a reduction of the net pension liability in the year ending June 30, 2018. Other amounts reported as deferred inflows of resources related to pensions will be recognized in pension expense as follows (dollars in thousands):
Fiscal year ending June 30:
2018 (595)
2019 (487)
2020 2,152
2021 1,536
61

Note 9 – PENSION PLAN (continued)
Actuarial Assumptions: For the measurement period ended June 30, 2016, the total pension liability was determined by rolling forward the June 30, 2015 total pension liability. The June 30, 2016 total pension liability was based on the following actuarial assumptions:
Inflation 2.75%
Salary increases Varies by entry age and service
Investment rate of return 7.65%
Post retirement benefit increase Contract COLA up to 2.75% until purchasing power protection allowance floor on purchasing power applies, 2.75% thereafter
For the measurement period ended June 30, 2015, the total pension liability was determined by rolling forward the June 30, 2014 total pension liability. The June 30, 2015 total pension liabilities were based on the following actuarial assumptions:
Inflation 2.75%
Salary increases Varies by entry age and service
Investment rate of return 7.65%, net of pension plan investment and administrative expenses; includes inflation
Post retirement benefit increase Contract COLA up to 2.75% until purchasing power protection allowance floor on purchasing power applies, 2.75% thereafter
For the measurement periods ended June 30, 2016 and 2015, the mortality tables were based on CalPERS’ specific data. The tables include 20 years of mortality improvements using Society of Actuaries Scale BB. For more details on this table, please refer to the 2015 experience study that can be obtained via the internet at www.calpers.ca.gov under Forms and Publications.
All other actuarial assumptions used in the June 30, 2015 and 2014 valuations were based on the results of an actuarial experience study for the period from 1997 to 2011, including updates to salary increases, mortality and retirement rates. The Experience Study report can be obtained via the internet at www.calpers.ca.gov under Forms and Publications.
The long term expected rate of return on pension plan investments was determined using a building-block method in which best-estimate ranges of expected future real rates of return (expected returns, net of pension plan investment expense and inflation) are developed for each major asset class.
In determining the long-term expected rate of return, CalPERS took into account both short-term and long-term market return expectations as well as the expected pension fund cash flows. Such cash flows were developed assuming that both members and employers will make their required contributions on time and as scheduled in all future years. Using historical returns of all of the funds’ asset classes, expected compound returns were calculated over the short-term (first 10 years) and the long-term (11-60 years) using a building-block approach. Using the expected nominal returns for both short-term and long-term, the present value of benefits was calculated for each fund. The expected rate of return was set by calculating the single equivalent expected return that arrived at the same present value of benefits for cash flows as the one calculated using both short-term and long-term returns. The expected rate of return was then set equivalent to the single equivalent rate calculated above and rounded down to the nearest one quarter of one percent.
62

Note 9 – PENSION PLAN (continued)
For the measurement period ended June 30, 2016, the rate of return was calculated using the capital market assumptions applied to determine the discount rate and asset allocation. The target allocations were adopted by CalPERS effective July 1, 2015. For the measurement period ended June 30, 2016, the following table reflects long-term expected real rate of returns by asset class:
Asset Class Target Allocation Real Return Years
1-101 Real Return Years
11+2
Global Equity 51% 5.25% 5.71%
Global Fixed Income 20 0.99 2.43
Private Equity 10 6.83 6.95
Real Estate 10 4.50 5.13
Inflation Sensitive 6 0.45 3.36
Infrastructure and Forestland 2 4.50 5.09
Liquidity 1 (0.55) (1.05)
100%
1An expected inflation of 2.5% used for this period 2An expected inflation of 3.0% used for this period
For the measurement period ended June 30, 2015, the rate of return was calculated using the capital market assumptions applied to determine the discount rate and asset allocation. The geometric rates of return are net of administrative expenses. For the measurement period ended June 30, 2015, the following table reflects long-term expected real rate of returns by asset class:
Asset Class Target Allocation Real Return Years
1-101 Real Return Years
11+2
Global Equity 51% 5.25% 5.71%
Global Fixed Income 19 0.99 2.43
Private Equity 10 6.83 6.95
Real Estate 10 4.50 5.13
Inflation Sensitive 6 0.45 3.36
Infrastructure and Forestland 2 4.50 5.09
Liquidity 2 (0.55) (1.05)
100%
1An expected inflation of 2.5% used for this period 2An expected inflation of 3.0% used for this period
Discount Rate: The discount rate used to measure the total pension liability for the measurement periods ended June 30, 2016 and 2015 was 7.65%. To determine whether the municipal bond rate should be used in the calculation of a discount rate for each plan, CalPERS stress tested plans that would most likely result in a discount rate that would be different from the actuarially assumed discount rate. Based on the testing, none of the tested plans run out of assets. Therefore, the discount rates used for the current and
63
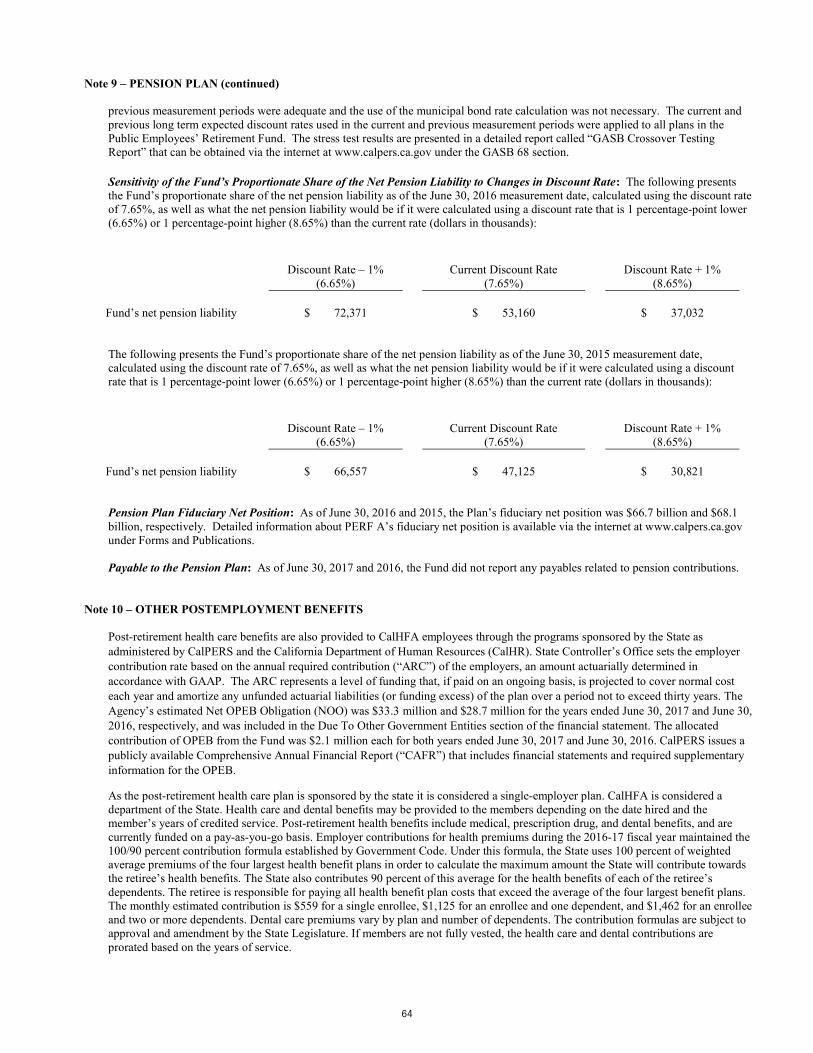
Note 9 – PENSION PLAN (continued)
previous measurement periods were adequate and the use of the municipal bond rate calculation was not necessary. The current and previous long term expected discount rates used in the current and previous measurement periods were applied to all plans in the Public Employees’ Retirement Fund. The stress test results are presented in a detailed report called “GASB Crossover Testing Report” that can be obtained via the internet at www.calpers.ca.gov under the GASB 68 section.
Sensitivity of the Fund’s Proportionate Share of the Net Pension Liability to Changes in Discount Rate: The following presents the Fund’s proportionate share of the net pension liability as of the June 30, 2016 measurement date, calculated using the discount rate of 7.65%, as well as what the net pension liability would be if it were calculated using a discount rate that is 1 percentage-point lower (6.65%) or 1 percentage-point higher (8.65%) than the current rate (dollars in thousands):
Discount Rate – 1% (6.65%)
Current Discount Rate (7.65%)
Discount Rate + 1% (8.65%)
Fund’s net pension liability $ 72,371 $ 53,160 $ 37,032
The following presents the Fund’s proportionate share of the net pension liability as of the June 30, 2015 measurement date, calculated using the discount rate of 7.65%, as well as what the net pension liability would be if it were calculated using a discount rate that is 1 percentage-point lower (6.65%) or 1 percentage-point higher (8.65%) than the current rate (dollars in thousands):
Discount Rate – 1% (6.65%)
Current Discount Rate (7.65%)
Discount Rate + 1% (8.65%)
Fund’s net pension liability $ 66,557 $ 47,125 $ 30,821
Pension Plan Fiduciary Net Position: As of June 30, 2016 and 2015, the Plan’s fiduciary net position was $66.7 billion and $68.1 billion, respectively. Detailed information about PERF A’s fiduciary net position is available via the internet at www.calpers.ca.gov under Forms and Publications.
Payable to the Pension Plan: As of June 30, 2017 and 2016, the Fund did not report any payables related to pension contributions.
Note 10 – OTHER POSTEMPLOYMENT BENEFITS
Post-retirement health care benefits are also provided to CalHFA employees through the programs sponsored by the State as administered by CalPERS and the California Department of Human Resources (CalHR). State Controller’s Office sets the employer contribution rate based on the annual required contribution (“ARC”) of the employers, an amount actuarially determined in accordance with GAAP. The ARC represents a level of funding that, if paid on an ongoing basis, is projected to cover normal cost each year and amortize any unfunded actuarial liabilities (or funding excess) of the plan over a period not to exceed thirty years. The Agency’s estimated Net OPEB Obligation (NOO) was $33.3 million and $28.7 million for the years ended June 30, 2017 and June 30, 2016, respectively, and was included in the Due To Other Government Entities section of the financial statement. The allocated contribution of OPEB from the Fund was $2.1 million each for both years ended June 30, 2017 and June 30, 2016. CalPERS issues a publicly available Comprehensive Annual Financial Report (“CAFR”) that includes financial statements and required supplementary information for the OPEB.
As the post-retirement health care plan is sponsored by the state it is considered a single-employer plan. CalHFA is considered a department of the State. Health care and dental benefits may be provided to the members depending on the date hired and the member’s years of credited service. Post-retirement health benefits include medical, prescription drug, and dental benefits, and are currently funded on a pay-as-you-go basis. Employer contributions for health premiums during the 2016-17 fiscal year maintained the 100/90 percent contribution formula established by Government Code. Under this formula, the State uses 100 percent of weighted average premiums of the four largest health benefit plans in order to calculate the maximum amount the State will contribute towards the retiree’s health benefits. The State also contributes 90 percent of this average for the health benefits of each of the retiree’s dependents. The retiree is responsible for paying all health benefit plan costs that exceed the average of the four largest benefit plans. The monthly estimated contribution is $559 for a single enrollee, $1,125 for an enrollee and one dependent, and $1,462 for an enrollee and two or more dependents. Dental care premiums vary by plan and number of dependents. The contribution formulas are subject to approval and amendment by the State Legislature. If members are not fully vested, the health care and dental contributions are prorated based on the years of service.
64
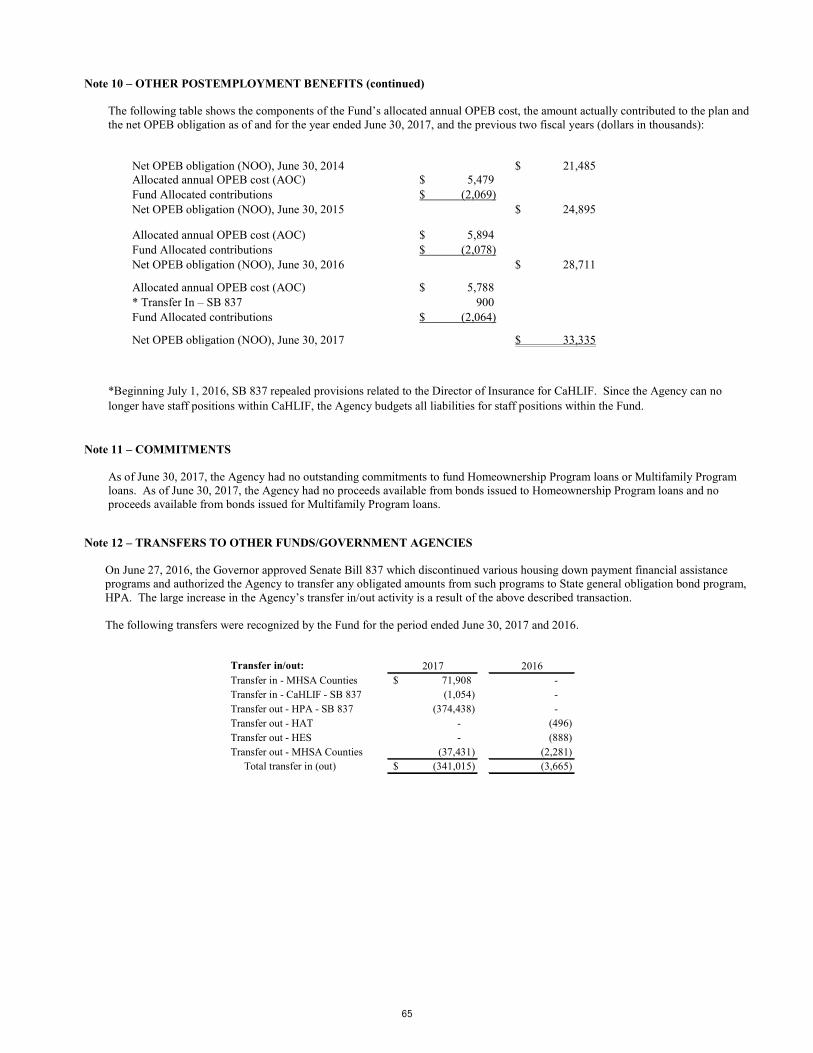
Note 10 – OTHER POSTEMPLOYMENT BENEFITS (continued)
The following table shows the components of the Fund’s allocated annual OPEB cost, the amount actually contributed to the plan and the net OPEB obligation as of and for the year ended June 30, 2017, and the previous two fiscal years (dollars in thousands):
Net OPEB obligation (NOO), June 30, 2014 $ 21,485 Allocated annual OPEB cost (AOC) $ 5,479 Fund Allocated contributions $ (2,069) Net OPEB obligation (NOO), June 30, 2015 $ 24,895
Allocated annual OPEB cost (AOC) $ 5,894 Fund Allocated contributions $ (2,078) Net OPEB obligation (NOO), June 30, 2016 $ 28,711
Allocated annual OPEB cost (AOC) $ 5,788 * Transfer In – SB 837 900 Fund Allocated contributions $ (2,064)
Net OPEB obligation (NOO), June 30, 2017 $ 33,335
*Beginning July 1, 2016, SB 837 repealed provisions related to the Director of Insurance for CaHLIF. Since the Agency can nolonger have staff positions within CaHLIF, the Agency budgets all liabilities for staff positions within the Fund.
Note 11 – COMMITMENTS
As of June 30, 2017, the Agency had no outstanding commitments to fund Homeownership Program loans or Multifamily Program loans. As of June 30, 2017, the Agency had no proceeds available from bonds issued to Homeownership Program loans and no proceeds available from bonds issued for Multifamily Program loans.
Note 12 – TRANSFERS TO OTHER FUNDS/GOVERNMENT AGENCIES
On June 27, 2016, the Governor approved Senate Bill 837 which discontinued various housing down payment financial assistance programs and authorized the Agency to transfer any obligated amounts from such programs to State general obligation bond program, HPA. The large increase in the Agency’s transfer in/out activity is a result of the above described transaction.
The following transfers were recognized by the Fund for the period ended June 30, 2017 and 2016.
Transfer in/out: 2017 2016Transfer in - MHSA Counties 71,908$ - Transfer in - CaHLIF - SB 837 (1,054) - Transfer out - HPA - SB 837 (374,438) - Transfer out - HAT - (496) Transfer out - HES - (888) Transfer out - MHSA Counties (37,431) (2,281)
Total transfer in (out) (341,015)$ (3,665)
65
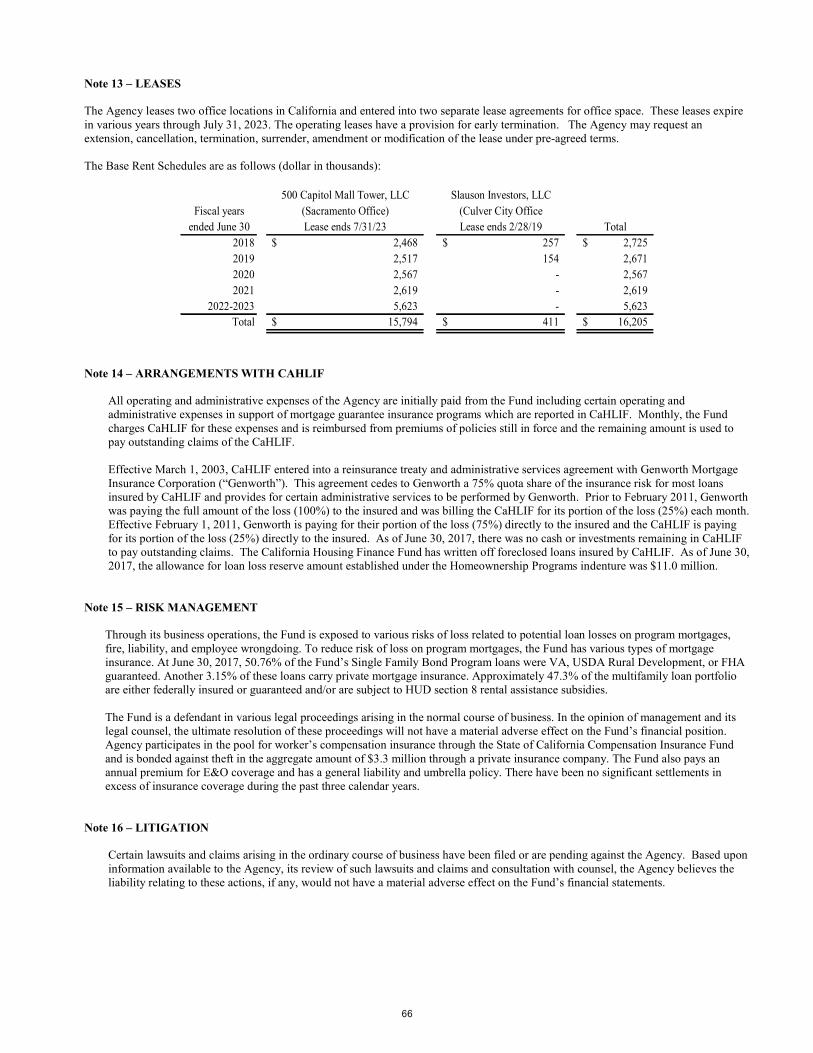
Note 13 – LEASES
The Agency leases two office locations in California and entered into two separate lease agreements for office space. These leases expire in various years through July 31, 2023. The operating leases have a provision for early termination. The Agency may request an extension, cancellation, termination, surrender, amendment or modification of the lease under pre-agreed terms.
The Base Rent Schedules are as follows (dollar in thousands):
500 Capitol Mall Tower, LLC Slauson Investors, LLCFiscal years (Sacramento Office) (Culver City Office
ended June 30 Lease ends 7/31/23 Lease ends 2/28/19 Total2018 2,468$ 257$ 2,725$ 2019 2,517 154 2,671 2020 2,567 - 2,567 2021 2,619 - 2,619
2022-2023 5,623 - 5,623 Total 15,794$ 411$ 16,205$
Note 14 – ARRANGEMENTS WITH CAHLIF
All operating and administrative expenses of the Agency are initially paid from the Fund including certain operating and administrative expenses in support of mortgage guarantee insurance programs which are reported in CaHLIF. Monthly, the Fund charges CaHLIF for these expenses and is reimbursed from premiums of policies still in force and the remaining amount is used to pay outstanding claims of the CaHLIF.
Effective March 1, 2003, CaHLIF entered into a reinsurance treaty and administrative services agreement with Genworth Mortgage Insurance Corporation (“Genworth”). This agreement cedes to Genworth a 75% quota share of the insurance risk for most loans insured by CaHLIF and provides for certain administrative services to be performed by Genworth. Prior to February 2011, Genworth was paying the full amount of the loss (100%) to the insured and was billing the CaHLIF for its portion of the loss (25%) each month. Effective February 1, 2011, Genworth is paying for their portion of the loss (75%) directly to the insured and the CaHLIF is paying for its portion of the loss (25%) directly to the insured. As of June 30, 2017, there was no cash or investments remaining in CaHLIF to pay outstanding claims. The California Housing Finance Fund has written off foreclosed loans insured by CaHLIF. As of June 30, 2017, the allowance for loan loss reserve amount established under the Homeownership Programs indenture was $11.0 million.
Note 15 – RISK MANAGEMENT
Through its business operations, the Fund is exposed to various risks of loss related to potential loan losses on program mortgages, fire, liability, and employee wrongdoing. To reduce risk of loss on program mortgages, the Fund has various types of mortgage insurance. At June 30, 2017, 50.76% of the Fund’s Single Family Bond Program loans were VA, USDA Rural Development, or FHA guaranteed. Another 3.15% of these loans carry private mortgage insurance. Approximately 47.3% of the multifamily loan portfolio are either federally insured or guaranteed and/or are subject to HUD section 8 rental assistance subsidies.
The Fund is a defendant in various legal proceedings arising in the normal course of business. In the opinion of management and its legal counsel, the ultimate resolution of these proceedings will not have a material adverse effect on the Fund’s financial position. Agency participates in the pool for worker’s compensation insurance through the State of California Compensation Insurance Fund and is bonded against theft in the aggregate amount of $3.3 million through a private insurance company. The Fund also pays an annual premium for E&O coverage and has a general liability and umbrella policy. There have been no significant settlements in excess of insurance coverage during the past three calendar years.
Note 16 – LITIGATION
Certain lawsuits and claims arising in the ordinary course of business have been filed or are pending against the Agency. Based upon information available to the Agency, its review of such lawsuits and claims and consultation with counsel, the Agency believes the liability relating to these actions, if any, would not have a material adverse effect on the Fund’s financial statements.
66

Note 17 – RELATED PARTY TRANSACTIONS
CalHFA MAC entered into an administrative agreement with CalHFA for support services, which include an allocation of CalHFA staff to provide program oversight, administrative and legal support and direct reimbursement for goods and services of outside vendors. Due to its status as a state governmental agency, CalHFA enjoys the benefit of discounts for goods and services with strategic business partners. The administrative agreement enables CalHFA MAC to leverage these discounts by providing for CalHFA to purchase goods and services during program implementation and ongoing operations. CalHFA MAC reimburses CalHFA for these items at the actual cost expended. CalHFA MAC had liabilities to CalHFA of $112 thousand and $124 thousand for the fiscal year ended June 30, 2017 and June 30, 2016, respectively. These amounts were comprised of accounts payable and accrued expenses resulting from unbilled vendor invoices for materials and services. Additionally, actual cash reimbursements paid to CalHFA totaled were $687 thousand and $689 thousand for fiscal years ended June 30, 2017 and June 30, 2016, respectively.
CalHFA MAC also leases office space from the CalHFA under an operating lease with a term of four years and five months that expires December 31, 2017.
Note 18 – SUBSEQUENT EVENTS
On August 1, 2017 the Agency used $278.24 million of the Home Mortgage Revenue Bonds 2017 Series a refunding bond proceeds to refund a like amount of prior Home Mortgage Revenue Bonds. The debt refundings resulted in a $519.7 thousand deferred gain. The refundings will decrease the debt service cash flow for the Homeownership Programs by an estimated $40.9 million. In addition, the refundings provided an estimated economic gain of $32.5 million.
In September 2017, the Board of Directors approved Resolution 17-21 which increased the secured credit line with Federal Home Loan Bank of San Francisco from $100 million to $200 million.
On November 1, 2017 the Agency will be transferring approximately 5,600 first mortgage loans previously serviced by the Agency’s Loan Servicing Division to a sub-servicer, Dovenmuehle Mortgage. The transfer will reduce risk, maximize revenues, and improve staffing efficiencies in the Single Family and Loan Servicing Divisions. As a result, the changes will require the realignment of staffing in the Agency.
* * * * * * *
67

(THIS PAGE INTENTIONALLY LEFT BLANK)
68
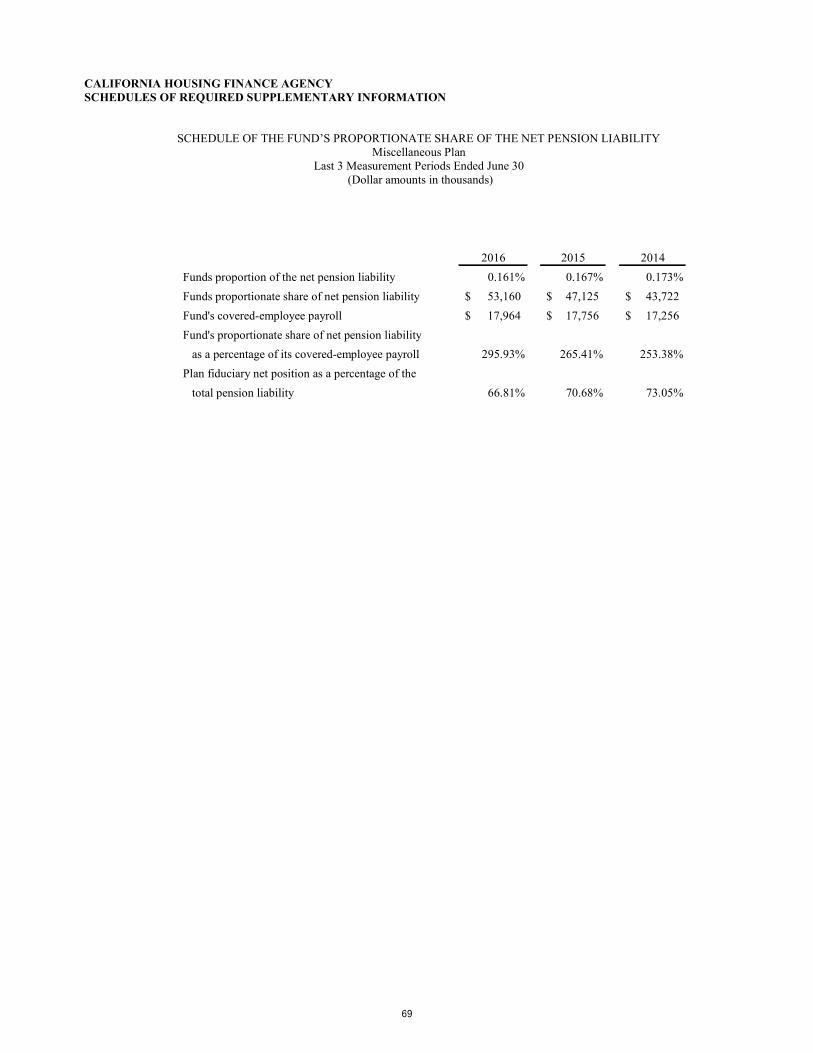
CALIFORNIA HOUSING FINANCE AGENCY SCHEDULES OF REQUIRED SUPPLEMENTARY INFORMATION
SCHEDULE OF THE FUND’S PROPORTIONATE SHARE OF THE NET PENSION LIABILITY Miscellaneous Plan
Last 3 Measurement Periods Ended June 30 (Dollar amounts in thousands)
2016 2015 2014Funds proportion of the net pension liability 0.161% 0.167% 0.173%Funds proportionate share of net pension liability 53,160$ 47,125$ 43,722$ Fund's covered-employee payroll 17,964$ 17,756$ 17,256$ Fund's proportionate share of net pension liability as a percentage of its covered-employee payroll 295.93% 265.41% 253.38%Plan fiduciary net position as a percentage of the
total pension liability 66.81% 70.68% 73.05%
69
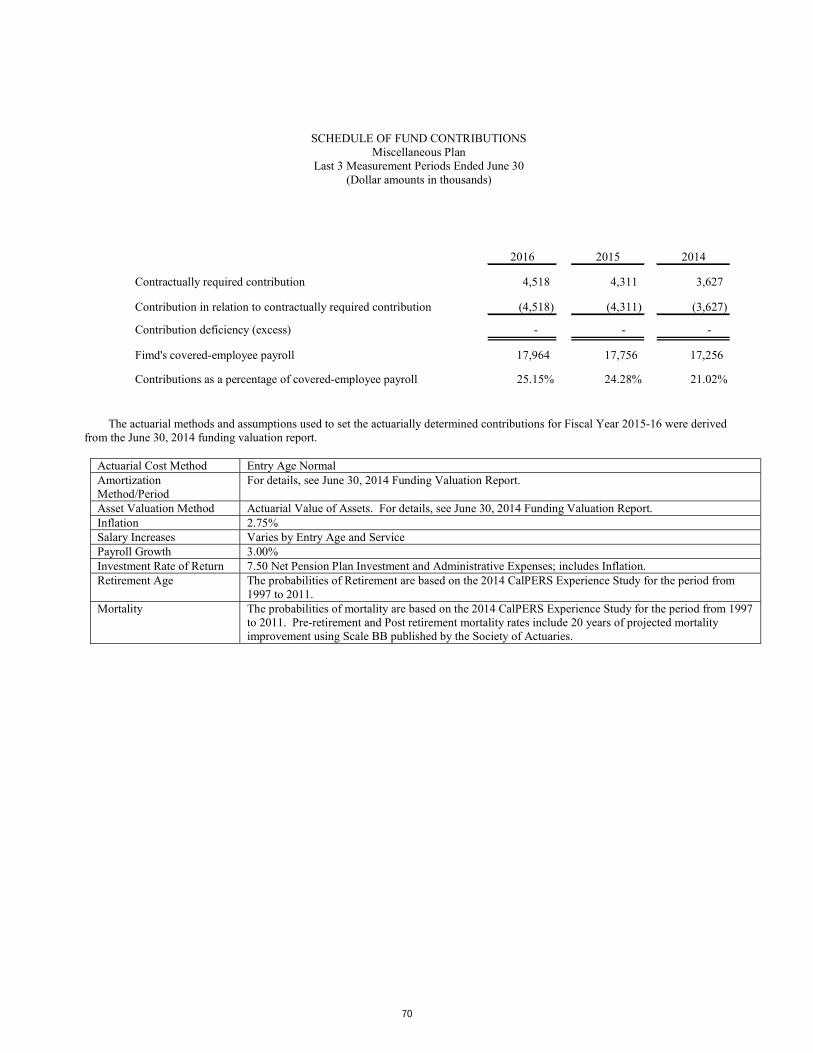
SCHEDULE OF FUND CONTRIBUTIONS Miscellaneous Plan
Last 3 Measurement Periods Ended June 30 (Dollar amounts in thousands)
2016 2015 2014
Contractually required contribution 4,518 4,311 3,627
Contribution in relation to contractually required contribution (4,518) (4,311) (3,627)
Contribution deficiency (excess) - - -
Fimd's covered-employee payroll 17,964 17,756 17,256
Contributions as a percentage of covered-employee payroll 25.15% 24.28% 21.02%
The actuarial methods and assumptions used to set the actuarially determined contributions for Fiscal Year 2015-16 were derived from the June 30, 2014 funding valuation report.
Actuarial Cost Method Entry Age Normal Amortization Method/Period
For details, see June 30, 2014 Funding Valuation Report.
Asset Valuation Method Actuarial Value of Assets. For details, see June 30, 2014 Funding Valuation Report. Inflation 2.75% Salary Increases Varies by Entry Age and Service Payroll Growth 3.00% Investment Rate of Return 7.50 Net Pension Plan Investment and Administrative Expenses; includes Inflation. Retirement Age The probabilities of Retirement are based on the 2014 CalPERS Experience Study for the period from
1997 to 2011. Mortality The probabilities of mortality are based on the 2014 CalPERS Experience Study for the period from 1997
to 2011. Pre-retirement and Post retirement mortality rates include 20 years of projected mortality improvement using Scale BB published by the Society of Actuaries.
70

CALIFORNIA HOUSING FINANCE FUND NOTES TO REQUIRED SUPPLEMENTARY INFORMATION
Note A – PENSION SCHEDULES
Changes in Assumptions: Both amounts reported in the measurement periods ended June 30, 2016 and 2015 reflect a discount rate of 7.65%.
71
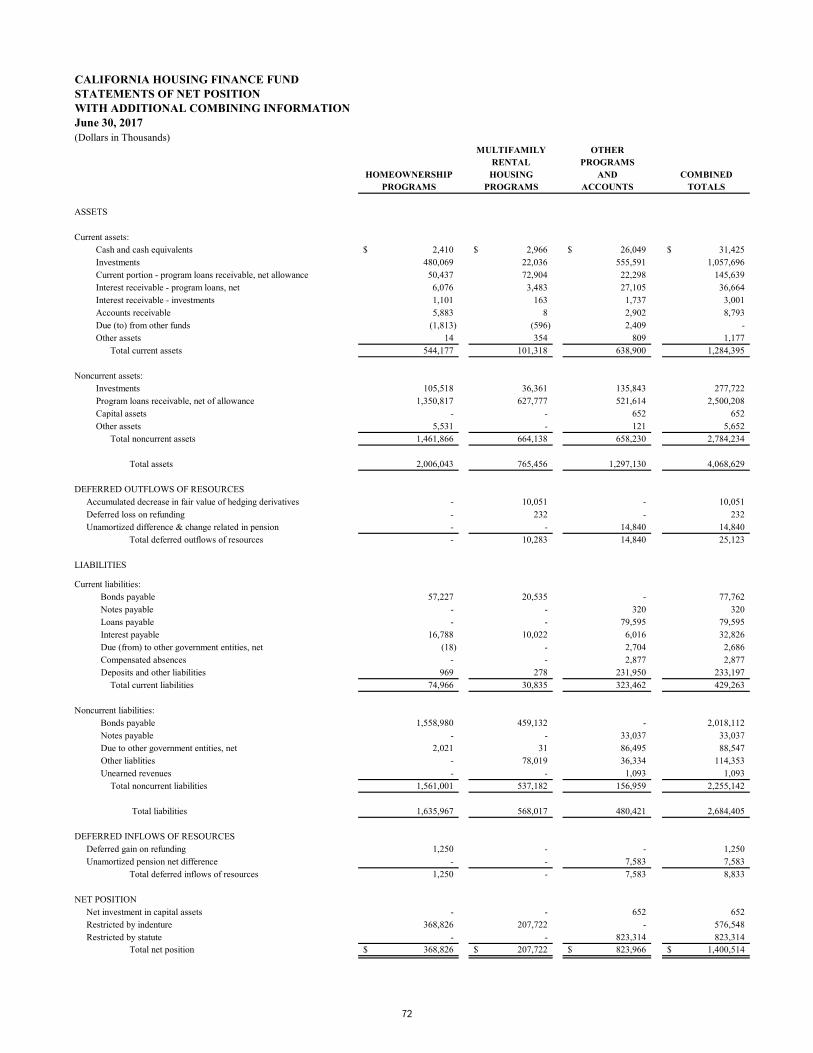
CALIFORNIA HOUSING FINANCE FUNDSTATEMENTS OF NET POSITIONWITH ADDITIONAL COMBINING INFORMATIONJune 30, 2017(Dollars in Thousands)
MULTIFAMILY OTHERRENTAL PROGRAMS
HOMEOWNERSHIP HOUSING AND COMBINEDPROGRAMS PROGRAMS ACCOUNTS TOTALS
ASSETS
Current assets: Cash and cash equivalents 2,410$ 2,966$ 26,049$ 31,425$
Investments 480,069 22,036 555,591 1,057,696 Current portion - program loans receivable, net allowance 50,437 72,904 22,298 145,639 Interest receivable - program loans, net 6,076 3,483 27,105 36,664 Interest receivable - investments 1,101 163 1,737 3,001
Accounts receivable 5,883 8 2,902 8,793 Due (to) from other funds (1,813) (596) 2,409 -
Other assets 14 354 809 1,177 Total current assets 544,177 101,318 638,900 1,284,395
Noncurrent assets: Investments 105,518 36,361 135,843 277,722 Program loans receivable, net of allowance 1,350,817 627,777 521,614 2,500,208
Capital assets - - 652 652 Other assets 5,531 - 121 5,652
Total noncurrent assets 1,461,866 664,138 658,230 2,784,234
Total assets 2,006,043 765,456 1,297,130 4,068,629
DEFERRED OUTFLOWS OF RESOURCES Accumulated decrease in fair value of hedging derivatives - 10,051 - 10,051 Deferred loss on refunding - 232 - 232 Unamortized difference & change related in pension - - 14,840 14,840
Total deferred outflows of resources - 10,283 14,840 25,123
LIABILITIES
Current liabilities: Bonds payable 57,227 20,535 - 77,762
Notes payable - - 320 320 Loans payable - - 79,595 79,595 Interest payable 16,788 10,022 6,016 32,826
Due (from) to other government entities, net (18) - 2,704 2,686 Compensated absences - - 2,877 2,877
Deposits and other liabilities 969 278 231,950 233,197 Total current liabilities 74,966 30,835 323,462 429,263
Noncurrent liabilities: Bonds payable 1,558,980 459,132 - 2,018,112
Notes payable - - 33,037 33,037 Due to other government entities, net 2,021 31 86,495 88,547
Other liablities - 78,019 36,334 114,353 Unearned revenues - - 1,093 1,093
Total noncurrent liabilities 1,561,001 537,182 156,959 2,255,142
Total liabilities 1,635,967 568,017 480,421 2,684,405
DEFERRED INFLOWS OF RESOURCES Deferred gain on refunding 1,250 - - 1,250 Unamortized pension net difference - - 7,583 7,583
Total deferred inflows of resources 1,250 - 7,583 8,833
NET POSITION Net investment in capital assets - - 652 652 Restricted by indenture 368,826 207,722 - 576,548 Restricted by statute - - 823,314 823,314
Total net position 368,826$ 207,722$ 823,966$ 1,400,514$
72
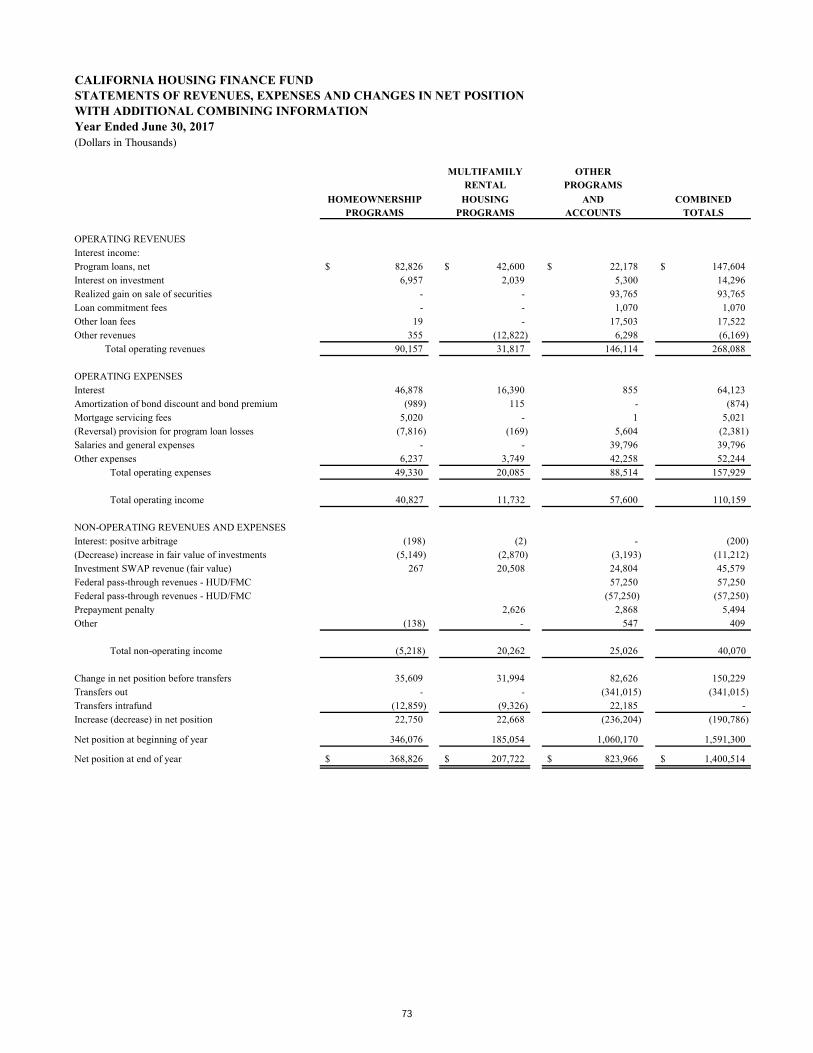
CALIFORNIA HOUSING FINANCE FUNDSTATEMENTS OF REVENUES, EXPENSES AND CHANGES IN NET POSITIONWITH ADDITIONAL COMBINING INFORMATIONYear Ended June 30, 2017(Dollars in Thousands)
MULTIFAMILY OTHERRENTAL PROGRAMS
HOMEOWNERSHIP HOUSING AND COMBINEDPROGRAMS PROGRAMS ACCOUNTS TOTALS
OPERATING REVENUESInterest income:Program loans, net 82,826$ 42,600$ 22,178$ 147,604$ Interest on investment 6,957 2,039 5,300 14,296 Realized gain on sale of securities - - 93,765 93,765 Loan commitment fees - - 1,070 1,070 Other loan fees 19 - 17,503 17,522 Other revenues 355 (12,822) 6,298 (6,169)
Total operating revenues 90,157 31,817 146,114 268,088
OPERATING EXPENSESInterest 46,878 16,390 855 64,123 Amortization of bond discount and bond premium (989) 115 - (874) Mortgage servicing fees 5,020 - 1 5,021 (Reversal) provision for program loan losses (7,816) (169) 5,604 (2,381) Salaries and general expenses - - 39,796 39,796 Other expenses 6,237 3,749 42,258 52,244
Total operating expenses 49,330 20,085 88,514 157,929
Total operating income 40,827 11,732 57,600 110,159
NON-OPERATING REVENUES AND EXPENSESInterest: positve arbitrage (198) (2) - (200) (Decrease) increase in fair value of investments (5,149) (2,870) (3,193) (11,212) Investment SWAP revenue (fair value) 267 20,508 24,804 45,579 Federal pass-through revenues - HUD/FMC 57,250 57,250 Federal pass-through revenues - HUD/FMC (57,250) (57,250) Prepayment penalty 2,626 2,868 5,494 Other (138) - 547 409
Total non-operating income (5,218) 20,262 25,026 40,070
Change in net position before transfers 35,609 31,994 82,626 150,229 Transfers out - - (341,015) (341,015) Transfers intrafund (12,859) (9,326) 22,185 - Increase (decrease) in net position 22,750 22,668 (236,204) (190,786)
Net position at beginning of year 346,076 185,054 1,060,170 1,591,300
Net position at end of year 368,826$ 207,722$ 823,966$ 1,400,514$
73
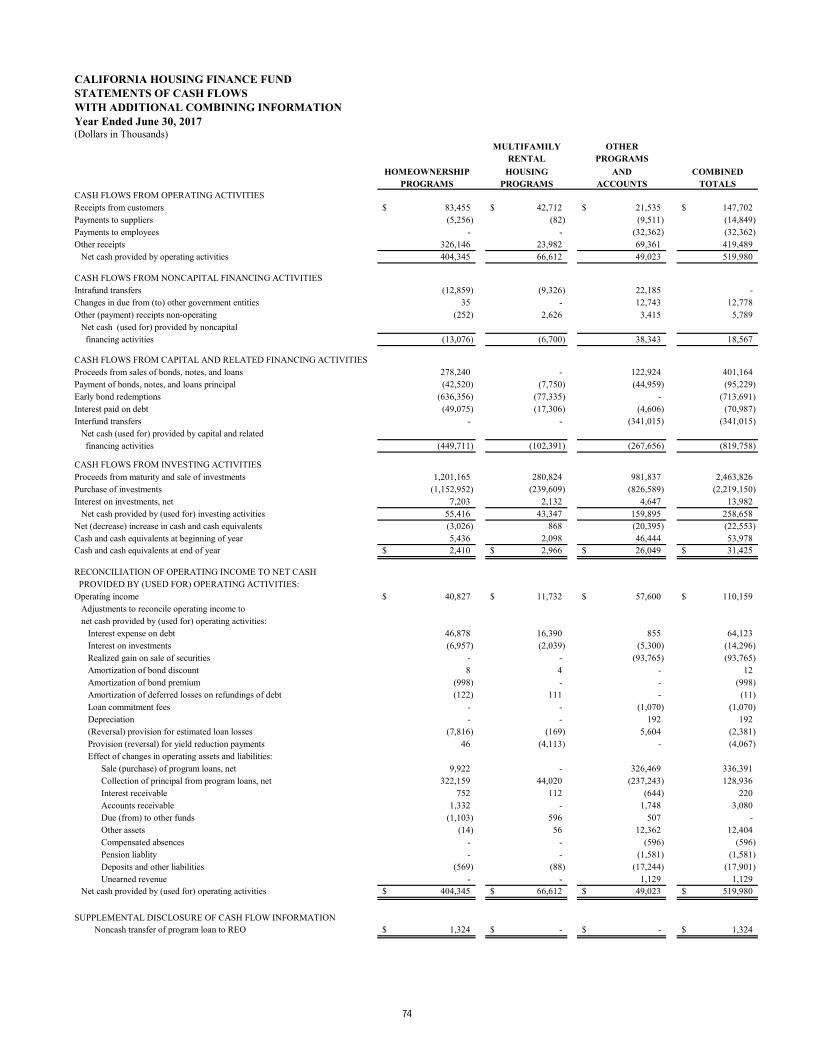
CALIFORNIA HOUSING FINANCE FUNDSTATEMENTS OF CASH FLOWSWITH ADDITIONAL COMBINING INFORMATIONYear Ended June 30, 2017(Dollars in Thousands)
MULTIFAMILY OTHERRENTAL PROGRAMS
HOMEOWNERSHIP HOUSING AND COMBINEDPROGRAMS PROGRAMS ACCOUNTS TOTALS
CASH FLOWS FROM OPERATING ACTIVITIESReceipts from customers 83,455$ 42,712$ 21,535$ 147,702$ Payments to suppliers (5,256) (82) (9,511) (14,849) Payments to employees - - (32,362) (32,362) Other receipts 326,146 23,982 69,361 419,489 Net cash provided by operating activities 404,345 66,612 49,023 519,980
CASH FLOWS FROM NONCAPITAL FINANCING ACTIVITIESIntrafund transfers (12,859) (9,326) 22,185 - Changes in due from (to) other government entities 35 - 12,743 12,778 Other (payment) receipts non-operating (252) 2,626 3,415 5,789 Net cash (used for) provided by noncapital
financing activities (13,076) (6,700) 38,343 18,567
CASH FLOWS FROM CAPITAL AND RELATED FINANCING ACTIVITIESProceeds from sales of bonds, notes, and loans 278,240 - 122,924 401,164 Payment of bonds, notes, and loans principal (42,520) (7,750) (44,959) (95,229) Early bond redemptions (636,356) (77,335) - (713,691) Interest paid on debt (49,075) (17,306) (4,606) (70,987) Interfund transfers - - (341,015) (341,015) Net cash (used for) provided by capital and related
financing activities (449,711) (102,391) (267,656) (819,758)
CASH FLOWS FROM INVESTING ACTIVITIESProceeds from maturity and sale of investments 1,201,165 280,824 981,837 2,463,826 Purchase of investments (1,152,952) (239,609) (826,589) (2,219,150) Interest on investments, net 7,203 2,132 4,647 13,982 Net cash provided by (used for) investing activities 55,416 43,347 159,895 258,658 Net (decrease) increase in cash and cash equivalents (3,026) 868 (20,395) (22,553) Cash and cash equivalents at beginning of year 5,436 2,098 46,444 53,978 Cash and cash equivalents at end of year 2,410$ 2,966$ 26,049$ 31,425$
RECONCILIATION OF OPERATING INCOME TO NET CASH PROVIDED BY (USED FOR) OPERATING ACTIVITIES:Operating income 40,827$ 11,732$ 57,600$ 110,159$ Adjustments to reconcile operating income to net cash provided by (used for) operating activities:
Interest expense on debt 46,878 16,390 855 64,123 Interest on investments (6,957) (2,039) (5,300) (14,296) Realized gain on sale of securities - - (93,765) (93,765) Amortization of bond discount 8 4 - 12 Amortization of bond premium (998) - - (998) Amortization of deferred losses on refundings of debt (122) 111 - (11) Loan commitment fees - - (1,070) (1,070) Depreciation - - 192 192 (Reversal) provision for estimated loan losses (7,816) (169) 5,604 (2,381) Provision (reversal) for yield reduction payments 46 (4,113) - (4,067) Effect of changes in operating assets and liabilities:
Sale (purchase) of program loans, net 9,922 - 326,469 336,391 Collection of principal from program loans, net 322,159 44,020 (237,243) 128,936 Interest receivable 752 112 (644) 220 Accounts receivable 1,332 - 1,748 3,080 Due (from) to other funds (1,103) 596 507 - Other assets (14) 56 12,362 12,404 Compensated absences - - (596) (596) Pension liablity - - (1,581) (1,581) Deposits and other liabilities (569) (88) (17,244) (17,901) Unearned revenue - - 1,129 1,129
Net cash provided by (used for) operating activities 404,345$ 66,612$ 49,023$ 519,980$
SUPPLEMENTAL DISCLOSURE OF CASH FLOW INFORMATION Noncash transfer of program loan to REO 1,324$ -$ -$ 1,324$
74
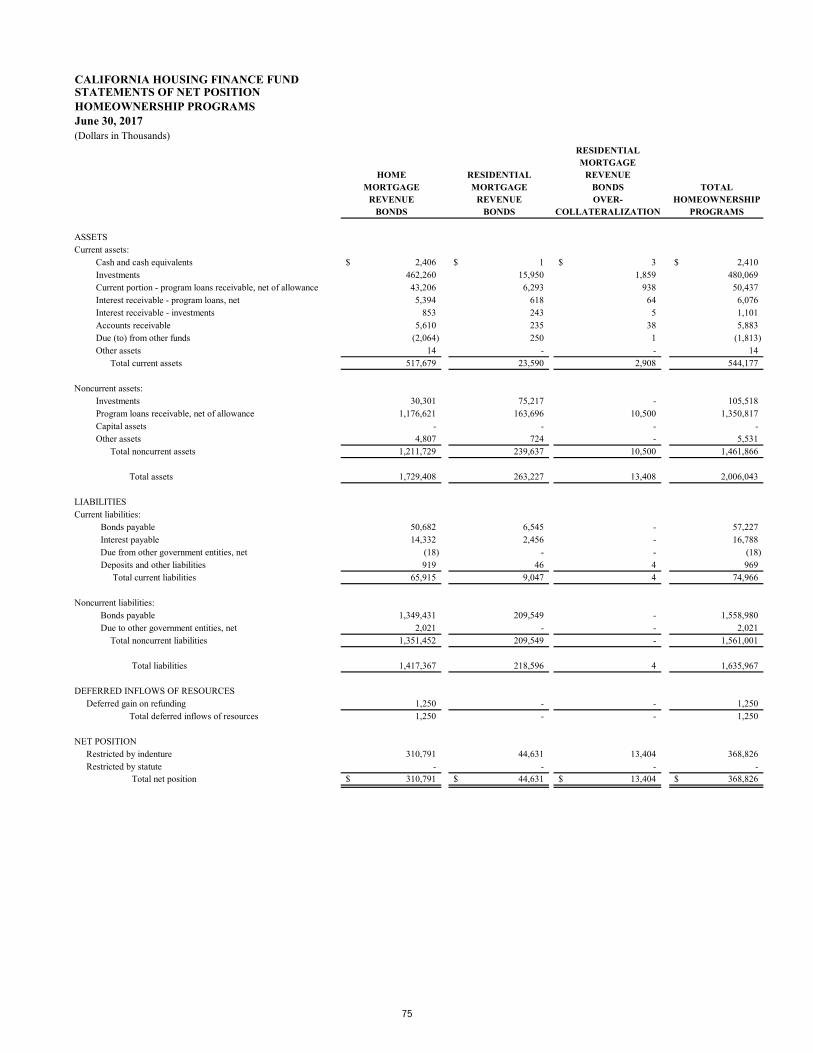
CALIFORNIA HOUSING FINANCE FUNDSTATEMENTS OF NET POSITIONHOMEOWNERSHIP PROGRAMSJune 30, 2017(Dollars in Thousands)
RESIDENTIALMORTGAGE
HOME RESIDENTIAL REVENUEMORTGAGE MORTGAGE BONDS TOTAL
REVENUE REVENUE OVER- HOMEOWNERSHIPBONDS BONDS COLLATERALIZATION PROGRAMS
ASSETSCurrent assets:
Cash and cash equivalents 2,406$ 1$ 3$ 2,410$ Investments 462,260 15,950 1,859 480,069 Current portion - program loans receivable, net of allowance 43,206 6,293 938 50,437 Interest receivable - program loans, net 5,394 618 64 6,076 Interest receivable - investments 853 243 5 1,101
Accounts receivable 5,610 235 38 5,883 Due (to) from other funds (2,064) 250 1 (1,813)
Other assets 14 - - 14 Total current assets 517,679 23,590 2,908 544,177
Noncurrent assets: Investments 30,301 75,217 - 105,518 Program loans receivable, net of allowance 1,176,621 163,696 10,500 1,350,817
Capital assets - - - - Other assets 4,807 724 - 5,531
Total noncurrent assets 1,211,729 239,637 10,500 1,461,866
Total assets 1,729,408 263,227 13,408 2,006,043
LIABILITIES Current liabilities:
Bonds payable 50,682 6,545 - 57,227 Interest payable 14,332 2,456 - 16,788
Due from other government entities, net (18) - - (18) Deposits and other liabilities 919 46 4 969
Total current liabilities 65,915 9,047 4 74,966
Noncurrent liabilities: Bonds payable 1,349,431 209,549 - 1,558,980
Due to other government entities, net 2,021 - - 2,021 Total noncurrent liabilities 1,351,452 209,549 - 1,561,001
Total liabilities 1,417,367 218,596 4 1,635,967
DEFERRED INFLOWS OF RESOURCES Deferred gain on refunding 1,250 - - 1,250
Total deferred inflows of resources 1,250 - - 1,250
NET POSITION Restricted by indenture 310,791 44,631 13,404 368,826 Restricted by statute - - - -
Total net position 310,791$ 44,631$ 13,404$ 368,826$
75

CALIFORNIA HOUSING FINANCE FUNDSTATEMENTS OF REVENUES, EXPENSES AND CHANGES IN NET POSITIONHOMEOWNERSHIP PROGRAMYear Ended June 30, 2017(Dollars in Thousands)
RESIDENTIALMORTGAGE
HOME RESIDENTIAL REVENUEMORTGAGE MORTGAGE BONDS TOTAL
REVENUE REVENUE OVER- HOMEOWNERSHIPBONDS BONDS COLLATERALIZATION PROGRAMS
OPERATING REVENUESInterest income:Program loans, net 73,174$ 8,310$ 1,342$ 82,826$ Interest on investment 3,378 3,453 126 6,957 Other loan fees 17 2 - 19 Other revenues 353 2 - 355 Total operating revenues 76,922 11,767 1,468 90,157
OPERATING EXPENSESInterest 37,394 9,484 - 46,878 Amortization of bond discount and bond premium (989) - - (989) Mortgage servicing fees 4,409 563 48 5,020 (Reversal) provision for program loan losses (6,989) (823) (4) (7,816) Other expenses 4,840 1,397 - 6,237 Total operating expenses 38,665 10,621 44 49,330
Total operating income 38,257 1,146 1,424 40,827
NON-OPERATING REVENUES AND EXPENSESInterest: positive arbitrage (198) - - (198) Increase in fair value of investments (1,336) (3,784) (29) (5,149) Investment SWAP revenue (fair value) 267 - - 267 Other (117) (21) (138)
Total non-operating income (1,384) (3,805) (29) (5,218)
Change in net position before transfers 36,873 (2,659) 1,395 35,609 Transfers intrafund (4,241) 13,586 (22,204) (12,859) Increase (decrease) in net position 32,632 10,927 (20,809) 22,750
Net position at beginning of year 278,159 33,704 34,213 346,076
Net position at end of year 310,791$ 44,631$ 13,404$ 368,826$
76
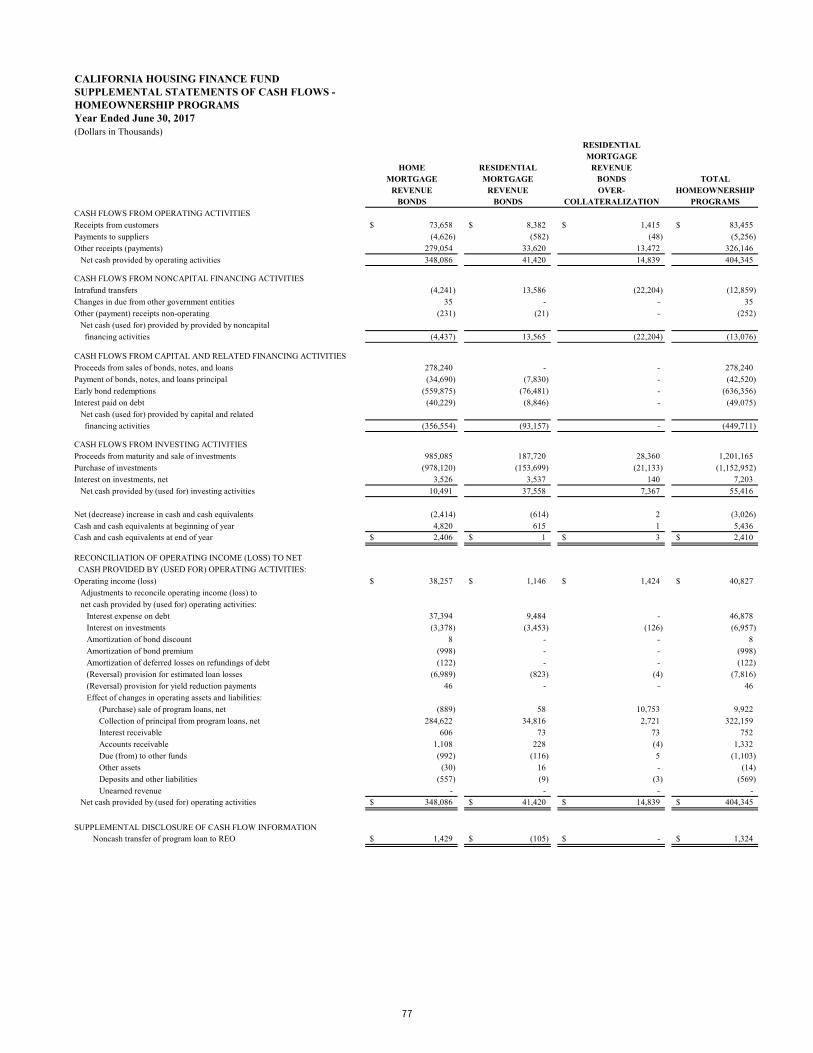
CALIFORNIA HOUSING FINANCE FUNDSUPPLEMENTAL STATEMENTS OF CASH FLOWS -HOMEOWNERSHIP PROGRAMSYear Ended June 30, 2017(Dollars in Thousands)
RESIDENTIALMORTGAGE
HOME RESIDENTIAL REVENUEMORTGAGE MORTGAGE BONDS TOTAL
REVENUE REVENUE OVER- HOMEOWNERSHIPBONDS BONDS COLLATERALIZATION PROGRAMS
CASH FLOWS FROM OPERATING ACTIVITIESReceipts from customers 73,658$ 8,382$ 1,415$ 83,455$ Payments to suppliers (4,626) (582) (48) (5,256) Other receipts (payments) 279,054 33,620 13,472 326,146 Net cash provided by operating activities 348,086 41,420 14,839 404,345
CASH FLOWS FROM NONCAPITAL FINANCING ACTIVITIESIntrafund transfers (4,241) 13,586 (22,204) (12,859) Changes in due from other government entities 35 - - 35 Other (payment) receipts non-operating (231) (21) - (252) Net cash (used for) provided by provided by noncapital financing activities (4,437) 13,565 (22,204) (13,076)
CASH FLOWS FROM CAPITAL AND RELATED FINANCING ACTIVITIESProceeds from sales of bonds, notes, and loans 278,240 - - 278,240 Payment of bonds, notes, and loans principal (34,690) (7,830) - (42,520) Early bond redemptions (559,875) (76,481) - (636,356) Interest paid on debt (40,229) (8,846) - (49,075) Net cash (used for) provided by capital and related
financing activities (356,554) (93,157) - (449,711)
CASH FLOWS FROM INVESTING ACTIVITIESProceeds from maturity and sale of investments 985,085 187,720 28,360 1,201,165 Purchase of investments (978,120) (153,699) (21,133) (1,152,952) Interest on investments, net 3,526 3,537 140 7,203 Net cash provided by (used for) investing activities 10,491 37,558 7,367 55,416
Net (decrease) increase in cash and cash equivalents (2,414) (614) 2 (3,026) Cash and cash equivalents at beginning of year 4,820 615 1 5,436 Cash and cash equivalents at end of year 2,406$ 1$ 3$ 2,410$
RECONCILIATION OF OPERATING INCOME (LOSS) TO NET CASH PROVIDED BY (USED FOR) OPERATING ACTIVITIES:Operating income (loss) 38,257$ 1,146$ 1,424$ 40,827$ Adjustments to reconcile operating income (loss) to net cash provided by (used for) operating activities:
Interest expense on debt 37,394 9,484 - 46,878 Interest on investments (3,378) (3,453) (126) (6,957) Amortization of bond discount 8 - - 8 Amortization of bond premium (998) - - (998) Amortization of deferred losses on refundings of debt (122) - - (122) (Reversal) provision for estimated loan losses (6,989) (823) (4) (7,816) (Reversal) provision for yield reduction payments 46 - - 46 Effect of changes in operating assets and liabilities:
(Purchase) sale of program loans, net (889) 58 10,753 9,922 Collection of principal from program loans, net 284,622 34,816 2,721 322,159 Interest receivable 606 73 73 752 Accounts receivable 1,108 228 (4) 1,332 Due (from) to other funds (992) (116) 5 (1,103)
Other assets (30) 16 - (14) Deposits and other liabilities (557) (9) (3) (569)
Unearned revenue - - - - Net cash provided by (used for) operating activities 348,086$ 41,420$ 14,839$ 404,345$
SUPPLEMENTAL DISCLOSURE OF CASH FLOW INFORMATION Noncash transfer of program loan to REO 1,429$ (105)$ -$ 1,324$
77

CALIFORNIA HOUSING FINANCE FUNDSTATEMENTS OF NET POSITIONMULTIFAMILY RENTAL HOUSING PROGRAMSJune 30, 2017(Dollars in Thousands)
MULTIFAMILY MULTIFAMILY AFFORDABLE MULTIFAMILYLOAN HOUSING MULTIFAMILY RESIDENTIAL
PURCHASE REVENUE HOUSING MORTGAGE BONDS BONDS III REVENUE BONDS REVENUE BONDS
ASSETSCurrent assets:
Cash and cash equivalents -$ 5$ -$ -$ Investments - 13,631 5,272 3,133 Current portion - program loans receivable, net of allowance - 21,912 1,201 634 Interest receivable - program loans, net - 2,774 231 206 Interest receivable - investments - 44 114 5 Accounts receivable - 8 - - Due to other funds - (596) - - Other assets - 252 44 23
Total current assets - 38,030 6,862 4,001
Noncurrent assets: Investments - - 36,361 - Program loans receivable, net of allowance - 521,411 49,262 48,638 Capital assets - - - - Other assets - - - -
Total noncurrent assets - 521,411 85,623 48,638
Total assets - 559,441 92,485 52,639
DEFERRED OUTFLOWS OF RESOURCES Accumulated decrease in fair value of hedging derivatives - 10,051 - - Deferred loss on refunding - 232 - -
Total deferred outflows of resources - 10,283 - -
LIABILITIES Current liabilities:
Bonds payable - 5,550 860 - Interest payable - 8,969 302 264 Deposits and other liabilities - 276 1 1 Total current liabilities - 14,795 1,163 265
Noncurrent liabilities: Bonds payable - 289,957 77,220 48,440 Due to other government entities, net - 31 - - Other liablities - 78,019 - - Unearned revenues - - - - Total noncurrent liabilities - 368,007 77,220 48,440
Total liabilities - 382,802 78,383 48,705
NET POSITION Net investment in capital assets - - - - Restricted by indenture - 186,922 14,102 3,934 Restricted by statute - - - -
Total net position -$ 186,922$ 14,102$ 3,934$
78
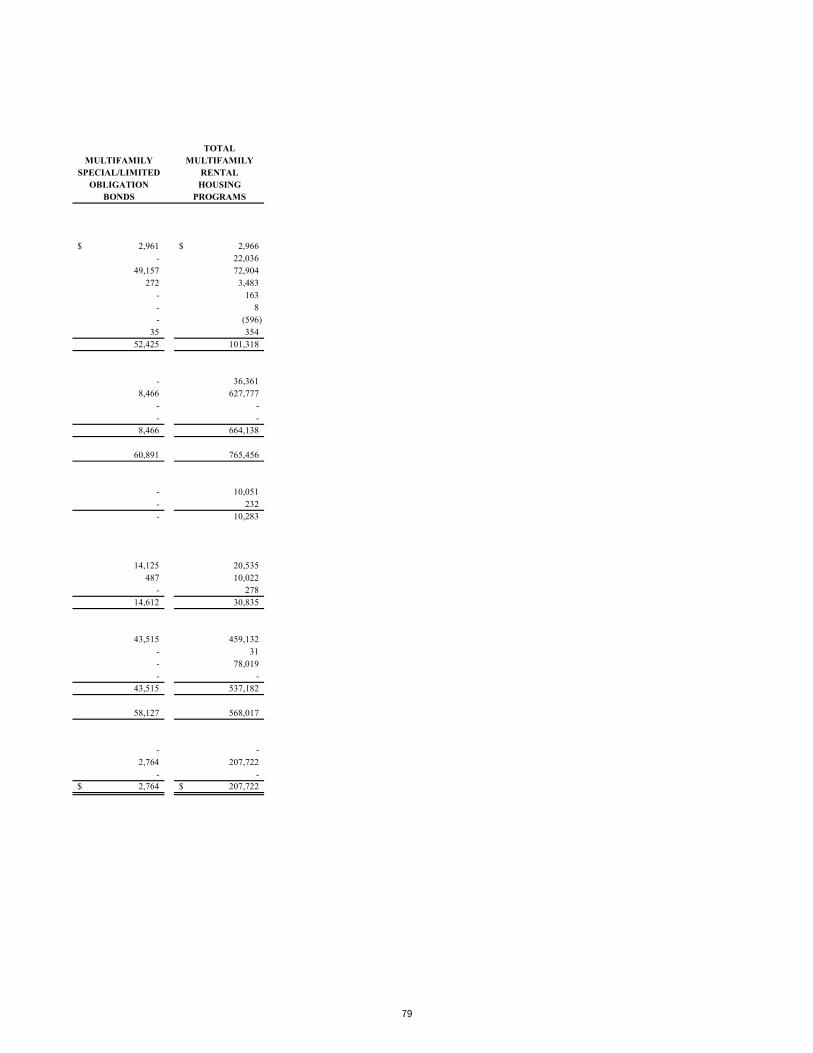
TOTALMULTIFAMILY MULTIFAMILY
SPECIAL/LIMITED RENTALOBLIGATION HOUSING
BONDS PROGRAMS
2,961$ 2,966$ - 22,036
49,157 72,904 272 3,483
- 163 - 8 - (596)
35 354 52,425 101,318
- 36,361 8,466 627,777
- - - -
8,466 664,138
60,891 765,456
- 10,051 - 232 - 10,283
14,125 20,535 487 10,022
- 278 14,612 30,835
43,515 459,132 - 31 - 78,019 - -
43,515 537,182
58,127 568,017
- - 2,764 207,722
- - 2,764$ 207,722$
79
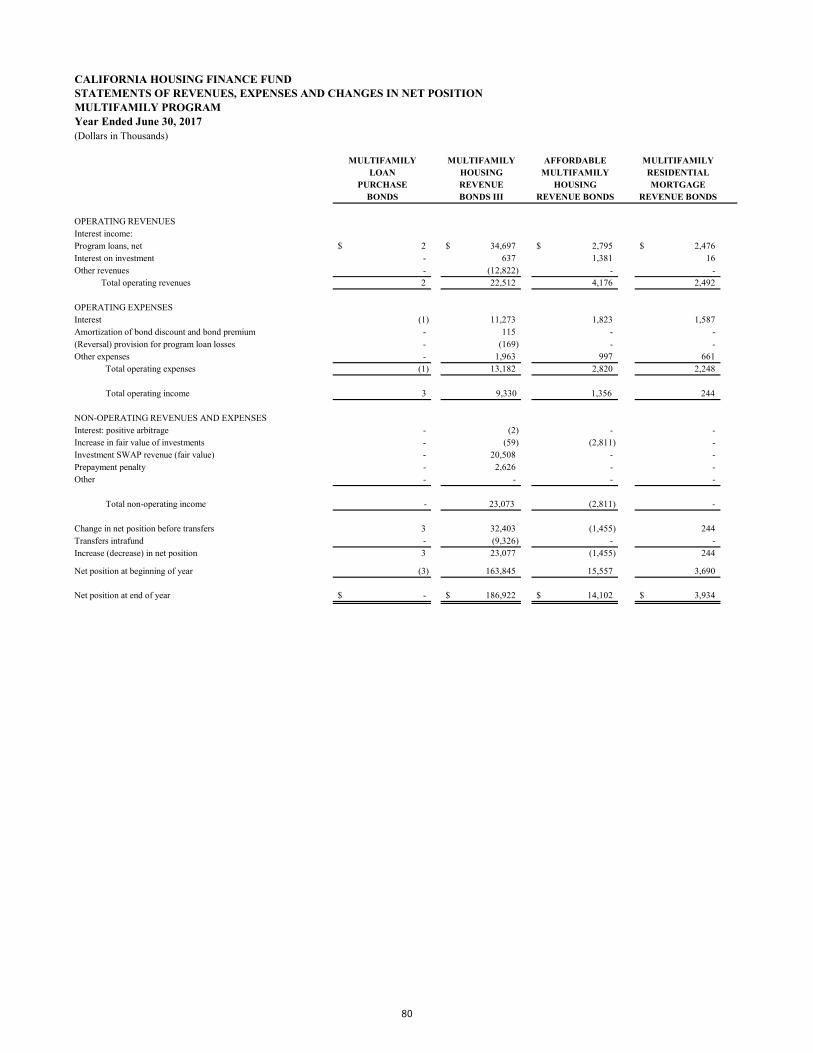
CALIFORNIA HOUSING FINANCE FUNDSTATEMENTS OF REVENUES, EXPENSES AND CHANGES IN NET POSITIONMULTIFAMILY PROGRAMYear Ended June 30, 2017(Dollars in Thousands)
MULTIFAMILY MULTIFAMILY AFFORDABLE MULITIFAMILYLOAN HOUSING MULTIFAMILY RESIDENTIAL
PURCHASE REVENUE HOUSING MORTGAGEBONDS BONDS III REVENUE BONDS REVENUE BONDS
OPERATING REVENUESInterest income:Program loans, net 2$ 34,697$ 2,795$ 2,476$ Interest on investment - 637 1,381 16 Other revenues - (12,822) - -
Total operating revenues 2 22,512 4,176 2,492
OPERATING EXPENSESInterest (1) 11,273 1,823 1,587 Amortization of bond discount and bond premium - 115 - - (Reversal) provision for program loan losses - (169) - - Other expenses - 1,963 997 661
Total operating expenses (1) 13,182 2,820 2,248
Total operating income 3 9,330 1,356 244
NON-OPERATING REVENUES AND EXPENSESInterest: positive arbitrage - (2) - - Increase in fair value of investments - (59) (2,811) - Investment SWAP revenue (fair value) - 20,508 - - Prepayment penalty - 2,626 - - Other - - - -
Total non-operating income - 23,073 (2,811) -
Change in net position before transfers 3 32,403 (1,455) 244 Transfers intrafund - (9,326) - - Increase (decrease) in net position 3 23,077 (1,455) 244
Net position at beginning of year (3) 163,845 15,557 3,690
Net position at end of year -$ 186,922$ 14,102$ 3,934$
80

TOTALMULITIFAMILY MULTIFAMILY
SPECIAL/LIMITED RENTALOBLIGATION HOUSING
BONDS PROGRAMS
2,630$ 42,600$ 5 2,039 - (12,822)
2,635 31,817
1,708 16,390 - 115 - (169)
128 3,749 1,836 20,085
799 11,732
- (2) - (2,870) - 20,508 - 2,626 - -
- 20,262
799 31,994 - (9,326)
799 22,668
1,965 185,054
2,764$ 207,722$
81
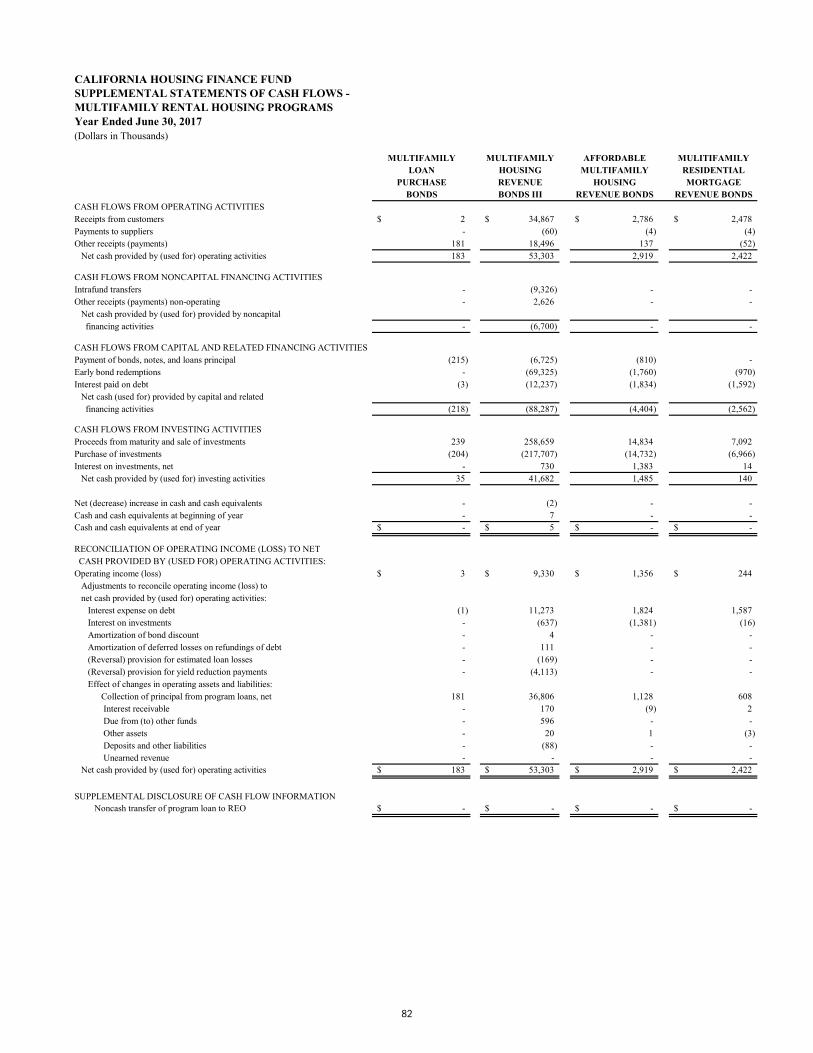
CALIFORNIA HOUSING FINANCE FUNDSUPPLEMENTAL STATEMENTS OF CASH FLOWS -MULTIFAMILY RENTAL HOUSING PROGRAMSYear Ended June 30, 2017(Dollars in Thousands)
MULTIFAMILY MULTIFAMILY AFFORDABLE MULITIFAMILYLOAN HOUSING MULTIFAMILY RESIDENTIAL
PURCHASE REVENUE HOUSING MORTGAGEBONDS BONDS III REVENUE BONDS REVENUE BONDS
CASH FLOWS FROM OPERATING ACTIVITIESReceipts from customers 2$ 34,867$ 2,786$ 2,478$ Payments to suppliers - (60) (4) (4) Other receipts (payments) 181 18,496 137 (52) Net cash provided by (used for) operating activities 183 53,303 2,919 2,422
CASH FLOWS FROM NONCAPITAL FINANCING ACTIVITIESIntrafund transfers - (9,326) - - Other receipts (payments) non-operating - 2,626 - - Net cash provided by (used for) provided by noncapital financing activities - (6,700) - -
CASH FLOWS FROM CAPITAL AND RELATED FINANCING ACTIVITIESPayment of bonds, notes, and loans principal (215) (6,725) (810) - Early bond redemptions - (69,325) (1,760) (970) Interest paid on debt (3) (12,237) (1,834) (1,592) Net cash (used for) provided by capital and related financing activities (218) (88,287) (4,404) (2,562)
CASH FLOWS FROM INVESTING ACTIVITIESProceeds from maturity and sale of investments 239 258,659 14,834 7,092 Purchase of investments (204) (217,707) (14,732) (6,966) Interest on investments, net - 730 1,383 14 Net cash provided by (used for) investing activities 35 41,682 1,485 140
Net (decrease) increase in cash and cash equivalents - (2) - - Cash and cash equivalents at beginning of year - 7 - - Cash and cash equivalents at end of year -$ 5$ -$ -$
RECONCILIATION OF OPERATING INCOME (LOSS) TO NET CASH PROVIDED BY (USED FOR) OPERATING ACTIVITIES:Operating income (loss) 3$ 9,330$ 1,356$ 244$ Adjustments to reconcile operating income (loss) to net cash provided by (used for) operating activities:
Interest expense on debt (1) 11,273 1,824 1,587 Interest on investments - (637) (1,381) (16) Amortization of bond discount - 4 - - Amortization of deferred losses on refundings of debt - 111 - - (Reversal) provision for estimated loan losses - (169) - - (Reversal) provision for yield reduction payments - (4,113) - - Effect of changes in operating assets and liabilities:
Collection of principal from program loans, net 181 36,806 1,128 608 Interest receivable - 170 (9) 2 Due from (to) other funds - 596 - - Other assets - 20 1 (3) Deposits and other liabilities - (88) - - Unearned revenue - - - -
Net cash provided by (used for) operating activities 183$ 53,303$ 2,919$ 2,422$
SUPPLEMENTAL DISCLOSURE OF CASH FLOW INFORMATION Noncash transfer of program loan to REO -$ -$ -$ -$
82
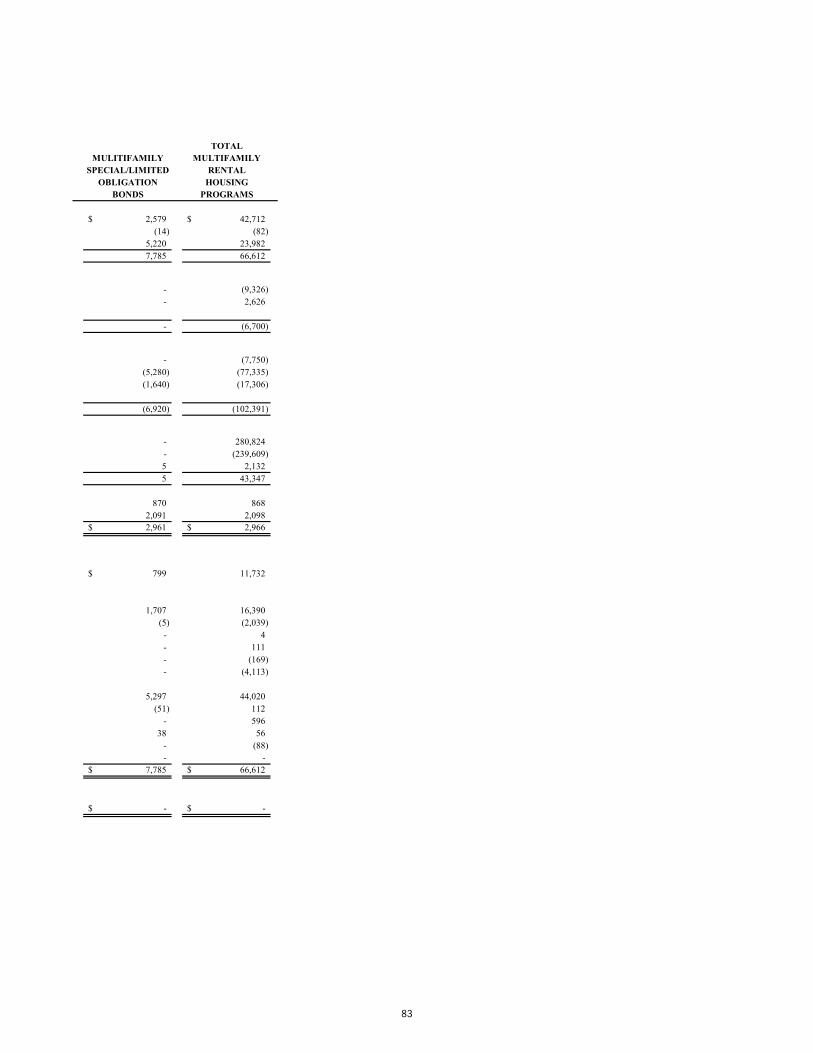
TOTALMULITIFAMILY MULTIFAMILY
SPECIAL/LIMITED RENTALOBLIGATION HOUSING
BONDS PROGRAMS
2,579$ 42,712$ (14) (82)
5,220 23,982 7,785 66,612
- (9,326) - 2,626
- (6,700)
- (7,750) (5,280) (77,335) (1,640) (17,306)
(6,920) (102,391)
- 280,824 - (239,609) 5 2,132 5 43,347
870 868 2,091 2,098 2,961$ 2,966$
799$ 11,732
1,707 16,390 (5) (2,039)
- 4 - 111 - (169) - (4,113)
5,297 44,020 (51) 112
- 596 38 56
- (88) - -
7,785$ 66,612$
-$ -$
83
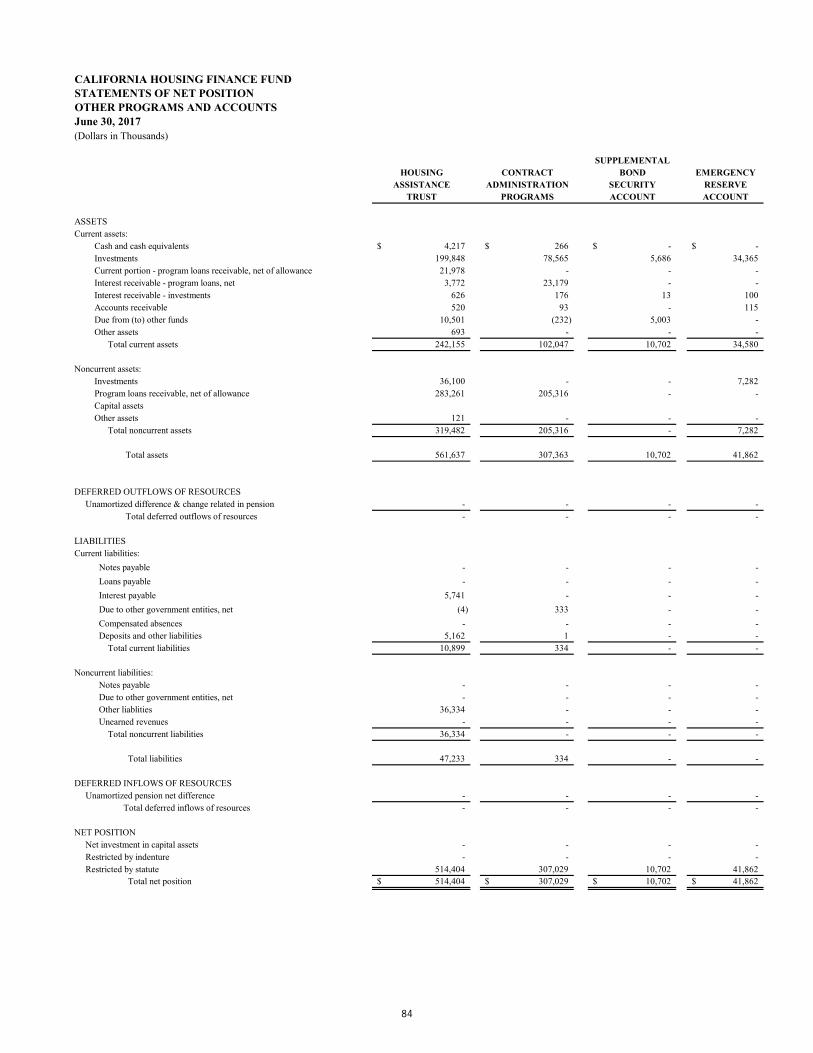
CALIFORNIA HOUSING FINANCE FUNDSTATEMENTS OF NET POSITIONOTHER PROGRAMS AND ACCOUNTSJune 30, 2017(Dollars in Thousands)
SUPPLEMENTALHOUSING CONTRACT BOND EMERGENCY
ASSISTANCE ADMINISTRATION SECURITY RESERVETRUST PROGRAMS ACCOUNT ACCOUNT
ASSETSCurrent assets:
Cash and cash equivalents 4,217$ 266$ -$ -$ Investments 199,848 78,565 5,686 34,365 Current portion - program loans receivable, net of allowance 21,978 - - - Interest receivable - program loans, net 3,772 23,179 - - Interest receivable - investments 626 176 13 100 Accounts receivable 520 93 - 115 Due from (to) other funds 10,501 (232) 5,003 - Other assets 693 - - -
Total current assets 242,155 102,047 10,702 34,580
Noncurrent assets: Investments 36,100 - - 7,282 Program loans receivable, net of allowance 283,261 205,316 - - Capital assets Other assets 121 - - -
Total noncurrent assets 319,482 205,316 - 7,282
Total assets 561,637 307,363 10,702 41,862
DEFERRED OUTFLOWS OF RESOURCES Unamortized difference & change related in pension - - - -
Total deferred outflows of resources - - - -
LIABILITIESCurrent liabilities:
Notes payable - - - - Loans payable - - - - Interest payable 5,741 - - - Due to other government entities, net (4) 333 - - Compensated absences - - - - Deposits and other liabilities 5,162 1 - - Total current liabilities 10,899 334 - -
Noncurrent liabilities: Notes payable - - - - Due to other government entities, net - - - - Other liablities 36,334 - - - Unearned revenues - - - - Total noncurrent liabilities 36,334 - - -
Total liabilities 47,233 334 - -
DEFERRED INFLOWS OF RESOURCES Unamortized pension net difference - - - -
Total deferred inflows of resources - - - -
NET POSITION Net investment in capital assets - - - - Restricted by indenture - - - - Restricted by statute 514,404 307,029 10,702 41,862
Total net position 514,404$ 307,029$ 10,702$ 41,862$
84
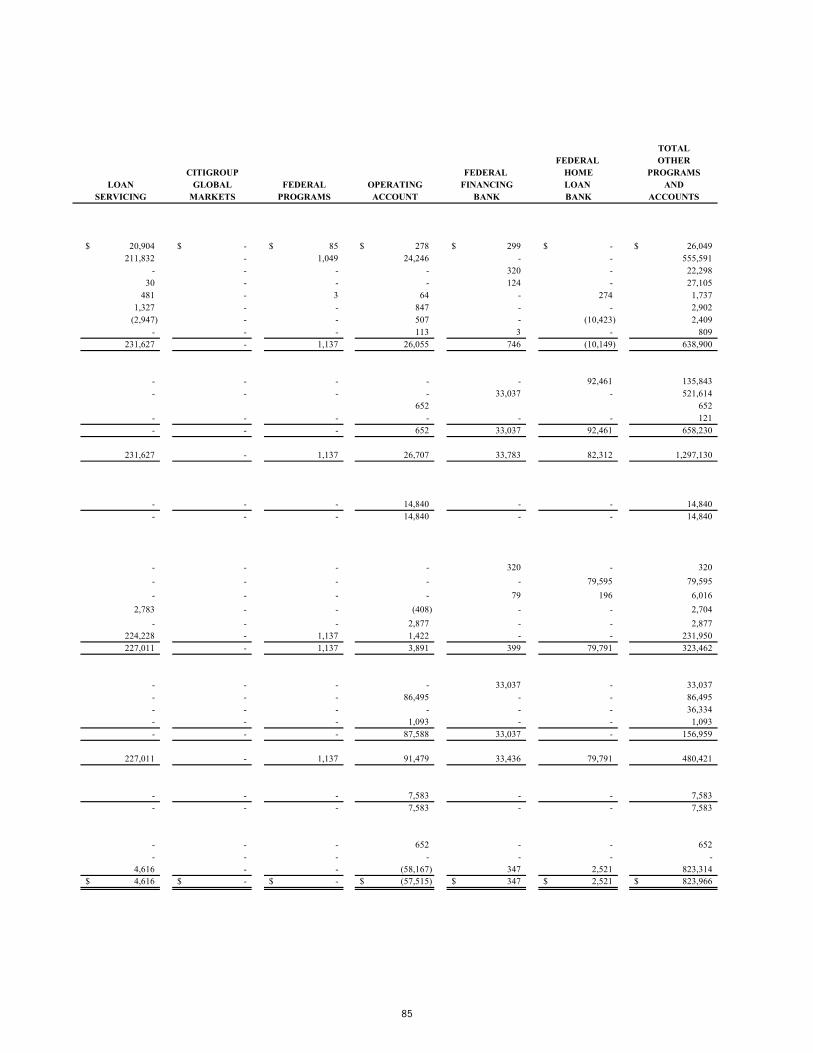
TOTALFEDERAL OTHER
CITIGROUP FEDERAL HOME PROGRAMSLOAN GLOBAL FEDERAL OPERATING FINANCING LOAN AND
SERVICING MARKETS PROGRAMS ACCOUNT BANK BANK ACCOUNTS
20,904$ -$ 85$ 278$ 299$ -$ 26,049$ 211,832 - 1,049 24,246 - - 555,591
- - - - 320 - 22,298 30 - - - 124 - 27,105
481 - 3 64 - 274 1,737 1,327 - - 847 - - 2,902
(2,947) - - 507 - (10,423) 2,409 - - - 113 3 - 809
231,627 - 1,137 26,055 746 (10,149) 638,900
- - - - - 92,461 135,843 - - - - 33,037 - 521,614
652 652 - - - - - - 121 - - - 652 33,037 92,461 658,230
231,627 - 1,137 26,707 33,783 82,312 1,297,130
- - - 14,840 - - 14,840 - - - 14,840 - - 14,840
- - - - 320 - 320 - - - - - 79,595 79,595 - - - - 79 196 6,016
2,783 - - (408) - - 2,704 - - - 2,877 - - 2,877
224,228 - 1,137 1,422 - - 231,950 227,011 - 1,137 3,891 399 79,791 323,462
- - - - 33,037 - 33,037 - - - 86,495 - - 86,495 - - - - - - 36,334 - - - 1,093 - - 1,093 - - - 87,588 33,037 - 156,959
227,011 - 1,137 91,479 33,436 79,791 480,421
- - - 7,583 - - 7,583 - - - 7,583 - - 7,583
- - - 652 - - 652 - - - - - - -
4,616 - - (58,167) 347 2,521 823,314 4,616$ -$ -$ (57,515)$ 347$ 2,521$ 823,966$
85

CALIFORNIA HOUSING FINANCE FUNDSTATEMENTS OF REVENUES, EXPENSES AND CHANGES IN NET POSITIONOTHER PROGRAMS AND ACCOUNTSYear Ended June 30, 2017(Dollars in Thousands)
SUPPLEMENTALHOUSING CONTRACT BOND EMERGENCY
ASSISTANCE ADMINISTRATION SECURITY RESERVETRUST PROGRAMS ACCOUNT ACCOUNT
OPERATING REVENUESInterest income:Program loans, net 14,754$ 6,738$ -$ -$ Interest on investment 2,780 571 150 287 Realized gain on sale of securities 93,765 - - - Loan commitment fees - - - - Other loan fees 436 - - - Other revenues 2,219 547 - -
Total operating revenues 113,954 7,856 150 287
OPERATING EXPENSESInterest - - - - Mortgage servicing fees 1 - - - Provision (reversal) for program loan losses 2,804 2,873 - - Salaries and general expenses - - - - Other expenses 26,005 13,471 - -
Total operating expenses 28,810 16,344 - -
Total operating income 85,144 (8,488) 150 287
NON-OPERATING REVENUES AND EXPENSESInterest: positive arbitrage - - - - Increase in fair value of investments (2,611) - - (619) Investment SWAP revenue (fair value) 24,804 - - - Federal pass-through revenues - HUD/FMC - - - - Federal pass-through revenues - HUD/FMC - - - - Prepayment penalty 2,868 - - - Other 522 - - -
Total non-operating income 25,583 - - (619)
Change in net position before transfers 110,727 - (8,488) 150 (332) - Transfers out 16 (339,977) - - Transfers intrafund 3,666 - (15,600) 9,711 Increase (decrease) in net assets 114,409 (348,465) (15,450) 9,379
Net position at beginning of year 399,995 655,494 26,152 32,483
Net position at end of year 514,404$ 307,029$ 10,702$ 41,862$
86

TOTALFEDERAL OTHER
CITIGROUP FEDERAL HOME PROGRAMSLOAN GLOBAL FEDERAL OPERATING FINANCING LOAN AND
SERVICING MARKETS PROGRAMS ACCOUNT ACCOUNT BANK ACCOUNTS
30$ -$ -$ -$ 656$ -$ 22,178$ 1 - - 223 - 1,288 5,300 - - - - - - 93,765 - - - 1,070 - - 1,070
3,285 - - 13,782 - - 17,503 697 - - 2,835 - - 6,298
4,013 - - 17,910 656 1,288 146,114
- - - - 622 233 855 - - - - - - 1 - (73) - - - - 5,604 - - - 39,796 - - 39,796
537 - - 2,223 20 2 42,258 537 (73) - 42,019 642 235 88,514
3,476 73 - (24,109) 14 1,053 57,600
- - - - - - - - - - - - 37 (3,193)
- - - - - - 24,804 - - 57,250 - - - 57,250 - - (57,250) - - - (57,250) - - - - - - 2,868 8 - - 17 - - 547
8 - - 17 - 37 25,026
3,484 73 - (24,092) 14 1,090 82,626 - - - (1,054) - - (341,015)
(4,500) (54) - 27,198 333 1,431 22,185 (1,016) 19 - 2,052 347 2,521 (236,204)
5,632 (19) - (59,567) - - 1,060,170
4,616$ -$ -$ (57,515)$ 347$ 2,521$ 823,966$
87
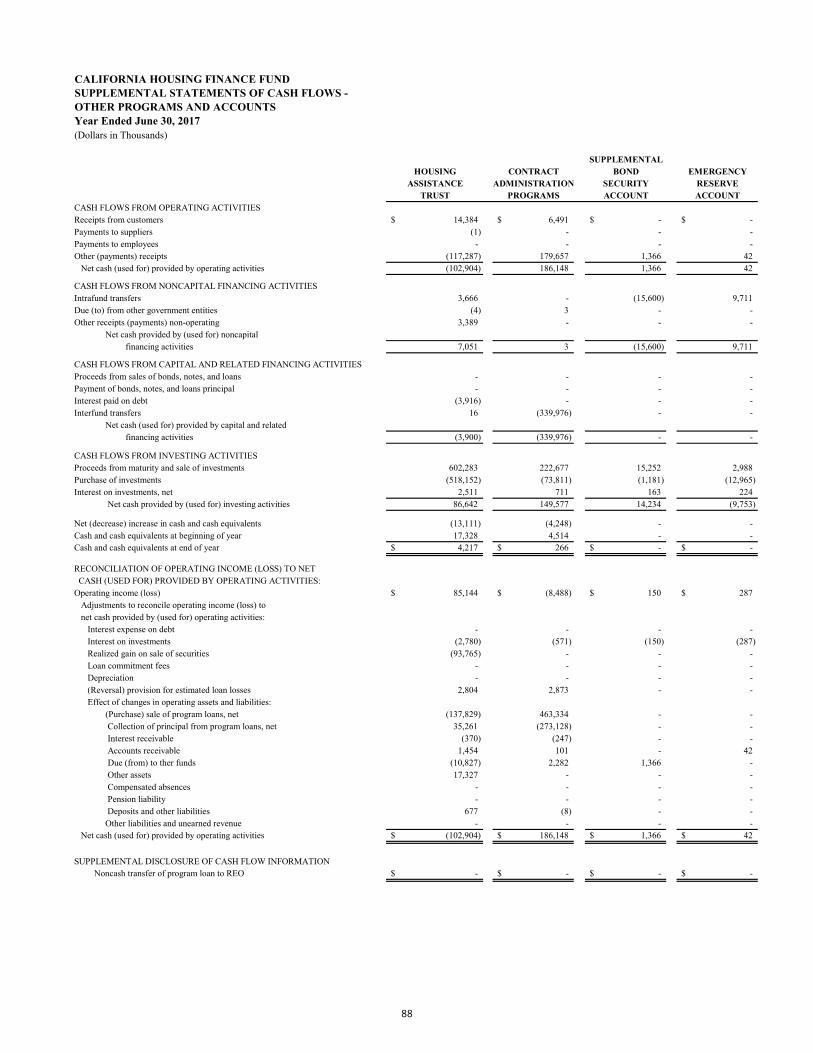
CALIFORNIA HOUSING FINANCE FUNDSUPPLEMENTAL STATEMENTS OF CASH FLOWS -OTHER PROGRAMS AND ACCOUNTSYear Ended June 30, 2017(Dollars in Thousands)
SUPPLEMENTALHOUSING CONTRACT BOND EMERGENCY
ASSISTANCE ADMINISTRATION SECURITY RESERVETRUST PROGRAMS ACCOUNT ACCOUNT
CASH FLOWS FROM OPERATING ACTIVITIESReceipts from customers 14,384$ 6,491$ -$ -$Payments to suppliers (1) - - -Payments to employees - - - -Other (payments) receipts (117,287) 179,657 1,366 42 Net cash (used for) provided by operating activities (102,904) 186,148 1,366 42
CASH FLOWS FROM NONCAPITAL FINANCING ACTIVITIESIntrafund transfers 3,666 - (15,600) 9,711 Due (to) from other government entities (4) 3 - -Other receipts (payments) non-operating 3,389 - - - Net cash provided by (used for) noncapital
financing activities 7,051 3 (15,600) 9,711
CASH FLOWS FROM CAPITAL AND RELATED FINANCING ACTIVITIESProceeds from sales of bonds, notes, and loans - - - -Payment of bonds, notes, and loans principal - - - -Interest paid on debt (3,916) - - -Interfund transfers 16 (339,976) - - Net cash (used for) provided by capital and related
financing activities (3,900) (339,976) - -
CASH FLOWS FROM INVESTING ACTIVITIESProceeds from maturity and sale of investments 602,283 222,677 15,252 2,988 Purchase of investments (518,152) (73,811) (1,181) (12,965)Interest on investments, net 2,511 711 163 224 Net cash provided by (used for) investing activities 86,642 149,577 14,234 (9,753)
Net (decrease) increase in cash and cash equivalents (13,111) (4,248) - -Cash and cash equivalents at beginning of year 17,328 4,514 - -Cash and cash equivalents at end of year 4,217$ 266$ -$ -$
RECONCILIATION OF OPERATING INCOME (LOSS) TO NET CASH (USED FOR) PROVIDED BY OPERATING ACTIVITIES:Operating income (loss) 85,144$ (8,488)$ 150$ 287$ Adjustments to reconcile operating income (loss) to net cash provided by (used for) operating activities: Interest expense on debt - - - - Interest on investments (2,780) (571) (150) (287) Realized gain on sale of securities (93,765) - - - Loan commitment fees - - - - Depreciation - - - - (Reversal) provision for estimated loan losses 2,804 2,873 - - Effect of changes in operating assets and liabilities: (Purchase) sale of program loans, net (137,829) 463,334 - - Collection of principal from program loans, net 35,261 (273,128) - - Interest receivable (370) (247) - - Accounts receivable 1,454 101 - 42 Due (from) to ther funds (10,827) 2,282 1,366 - Other assets 17,327 - - - Compensated absences - - - - Pension liability - - - - Deposits and other liabilities 677 (8) - - Other liabilities and unearned revenue - - - - Net cash (used for) provided by operating activities (102,904)$ 186,148$ 1,366$ 42$
SUPPLEMENTAL DISCLOSURE OF CASH FLOW INFORMATION Noncash transfer of program loan to REO -$ -$ -$ -$
88
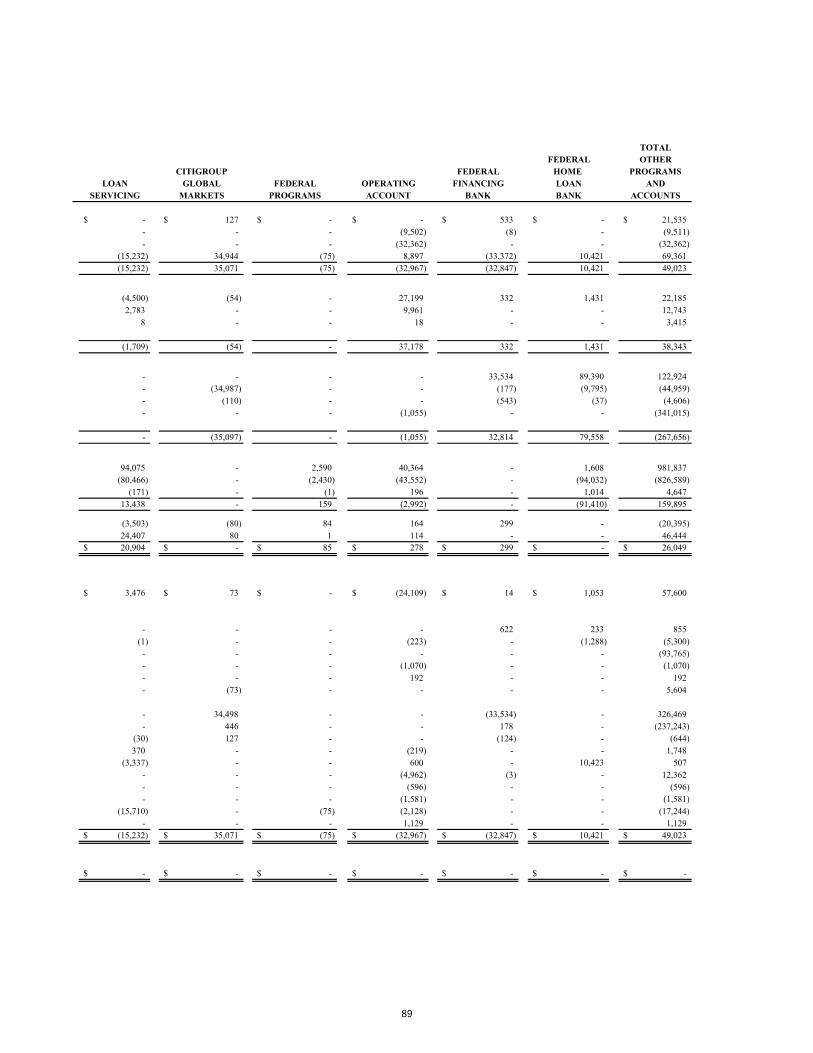
TOTALFEDERAL OTHER
CITIGROUP FEDERAL HOME PROGRAMSLOAN GLOBAL FEDERAL OPERATING FINANCING LOAN AND
SERVICING MARKETS PROGRAMS ACCOUNT BANK BANK ACCOUNTS
-$ 127$ -$ -$ 533$ -$ 21,535$ - - - (9,502) (8) - (9,511) - - - (32,362) - - (32,362)
(15,232) 34,944 (75) 8,897 (33,372) 10,421 69,361 (15,232) 35,071 (75) (32,967) (32,847) 10,421 49,023
(4,500) (54) - 27,199 332 1,431 22,185 2,783 - - 9,961 - - 12,743
8 - - 18 - - 3,415
(1,709) (54) - 37,178 332 1,431 38,343
- - - - 33,534 89,390 122,924 - (34,987) - - (177) (9,795) (44,959) - (110) - - (543) (37) (4,606) - - - (1,055) - - (341,015)
- (35,097) - (1,055) 32,814 79,558 (267,656)
94,075 - 2,590 40,364 - 1,608 981,837 (80,466) - (2,430) (43,552) - (94,032) (826,589)
(171) - (1) 196 - 1,014 4,647 13,438 - 159 (2,992) - (91,410) 159,895
(3,503) (80) 84 164 299 - (20,395) 24,407 80 1 114 - - 46,444 20,904$ -$ 85$ 278$ 299$ -$ 26,049$
3,476$ 73$ -$ (24,109)$ 14$ 1,053$ 57,600
- - - - 622 233 855 (1) - - (223) - (1,288) (5,300)
- - - - - - (93,765) - - - (1,070) - - (1,070) - - - 192 - - 192 - (73) - - - - 5,604
- 34,498 - - (33,534) - 326,469 - 446 - - 178 - (237,243)
(30) 127 - - (124) - (644) 370 - - (219) - - 1,748
(3,337) - - 600 - 10,423 507 - - - (4,962) (3) - 12,362 - - - (596) - - (596) - - - (1,581) - - (1,581)
(15,710) - (75) (2,128) - - (17,244) - - - 1,129 - - 1,129
(15,232)$ 35,071$ (75)$ (32,967)$ (32,847)$ 10,421$ 49,023$
-$ -$ -$ -$ -$ -$ -$
89

CALIFORNIA HOUSING FINANCE AGENCY, A COMPONENT UNIT OF THE STATE OF CALIFORNIA90
This page intentionally left blank.

STATISTICAL SECTION
IN PARTNERSHIP,THE RESULT IS HARMONY, RESPECT, LOVE, AND AN EXPLOSION OF JOY AND CREATIVITY.– MARC ALLEN -
COMPREHENSiVE ANNUALFiNANCiAL REPORTFOR THE YEARS ENDED JUNE 30, 2017 AND JUNE 30, 2016

CALIFORNIA HOUSING FINANCE AGENCY, A COMPONENT UNIT OF THE STATE OF CALIFORNIA92
This page intentionally left blank.

93COMPREHENSIVE ANNUAL FINANCIAL REPORT FOR THE FISCAL YEARS ENDED JUNE 30, 2017 AND JUNE 30, 2O16
Statistical SectionThis part of the California Housing Finance Agency’s Comprehensive Annual Financial Report presents detailed information as a context for understanding what the information in the financial statements and note disclosures says about CalHFA’s overall financial health.
FINANCIAL TRENDS/REVENUE CAPACITY
These schedules contain trend information to help the reader understand how the Fund’s financial performance and well-being have changed over time and how to assess the most significant revenue sources for Single Family and Multifamily Lending. Historical Net Positions show CalHFA’s financial health over a ten-year period.
DEBT CAPACITY INFORMATION
These schedules contain trend information to help the reader understand the Fund’s outstanding debt, the capacity to repay that debt, and the ability to issue additional debt in the future.
DEMOGRAPHIC AND ECONOMIC INFORMATION
These charts show demographic and economic indicators to help the reader understand the environment within which the Fund’s financial activities take place.
STATISTICAL SUMMARY
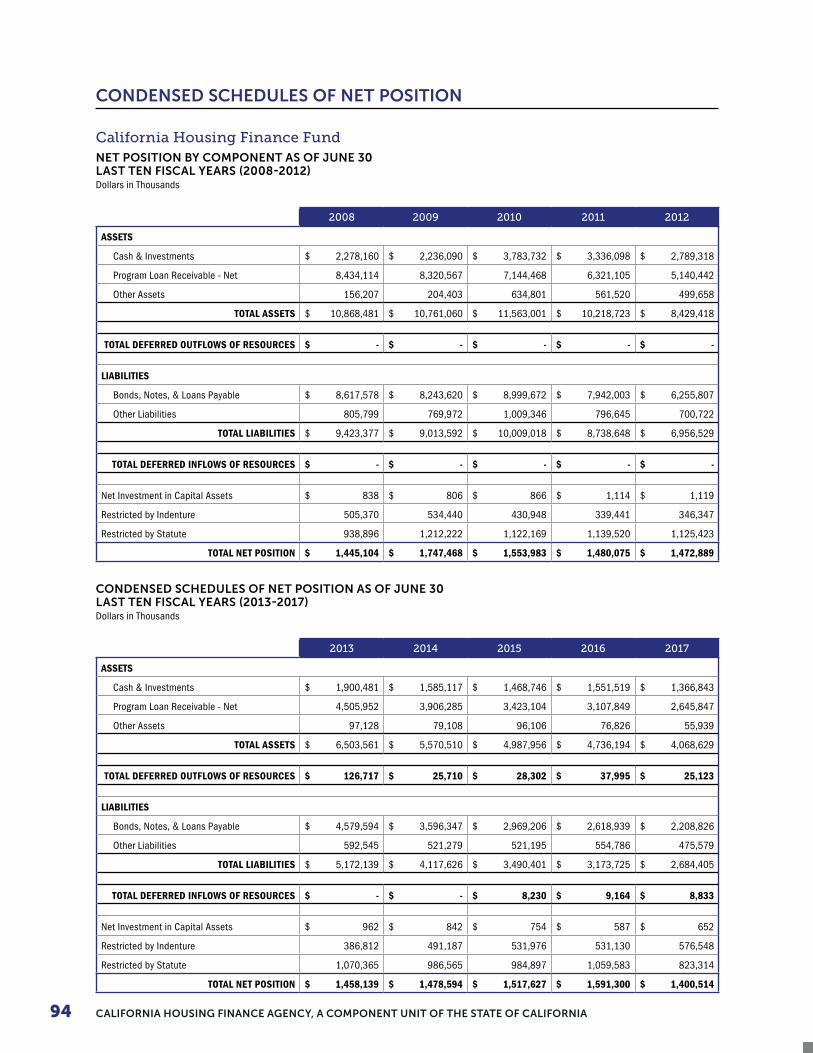
CALIFORNIA HOUSING FINANCE AGENCY, A COMPONENT UNIT OF THE STATE OF CALIFORNIA94
California Housing Finance FundNET POSITION BY COMPONENT AS OF JUNE 30LAST TEN FISCAL YEARS (2008-2012)Dollars in Thousands
2008 2009 2010 2011 2012
ASSETS
Cash & Investments $ 2,278,160 $ 2,236,090 $ 3,783,732 $ 3,336,098 $ 2,789,318
Program Loan Receivable - Net 8,434,114 8,320,567 7,144,468 6,321,105 5,140,442
Other Assets 156,207 204,403 634,801 561,520 499,658
TOTAL ASSETS $ 10,868,481 $ 10,761,060 $ 11,563,001 $ 10,218,723 $ 8,429,418
TOTAL DEFERRED OUTFLOWS OF RESOURCES $ - $ - $ - $ - $ -
LIABILITIES
Bonds, Notes, & Loans Payable $ 8,617,578 $ 8,243,620 $ 8,999,672 $ 7,942,003 $ 6,255,807
Other Liabilities 805,799 769,972 1,009,346 796,645 700,722
TOTAL LIABILITIES $ 9,423,377 $ 9,013,592 $ 10,009,018 $ 8,738,648 $ 6,956,529
TOTAL DEFERRED INFLOWS OF RESOURCES $ - $ - $ - $ - $ -
Net Investment in Capital Assets $ 838 $ 806 $ 866 $ 1,114 $ 1,119
Restricted by Indenture 505,370 534,440 430,948 339,441 346,347
Restricted by Statute 938,896 1,212,222 1,122,169 1,139,520 1,125,423
TOTAL NET POSITION $ 1,445,104 $ 1,747,468 $ 1,553,983 $ 1,480,075 $ 1,472,889
CONDENSED SCHEDULES OF NET POSITION AS OF JUNE 30LAST TEN FISCAL YEARS (2013-2017)Dollars in Thousands
2013 2014 2015 2016 2017
ASSETS
Cash & Investments $ 1,900,481 $ 1,585,117 $ 1,468,746 $ 1,551,519 $ 1,366,843
Program Loan Receivable - Net 4,505,952 3,906,285 3,423,104 3,107,849 2,645,847
Other Assets 97,128 79,108 96,106 76,826 55,939
TOTAL ASSETS $ 6,503,561 $ 5,570,510 $ 4,987,956 $ 4,736,194 $ 4,068,629
TOTAL DEFERRED OUTFLOWS OF RESOURCES $ 126,717 $ 25,710 $ 28,302 $ 37,995 $ 25,123
LIABILITIES
Bonds, Notes, & Loans Payable $ 4,579,594 $ 3,596,347 $ 2,969,206 $ 2,618,939 $ 2,208,826
Other Liabilities 592,545 521,279 521,195 554,786 475,579
TOTAL LIABILITIES $ 5,172,139 $ 4,117,626 $ 3,490,401 $ 3,173,725 $ 2,684,405
TOTAL DEFERRED INFLOWS OF RESOURCES $ - $ - $ 8,230 $ 9,164 $ 8,833
Net Investment in Capital Assets $ 962 $ 842 $ 754 $ 587 $ 652
Restricted by Indenture 386,812 491,187 531,976 531,130 576,548
Restricted by Statute 1,070,365 986,565 984,897 1,059,583 823,314
TOTAL NET POSITION $ 1,458,139 $ 1,478,594 $ 1,517,627 $ 1,591,300 $ 1,400,514
CONDENSED SCHEDULES OF NET POSITION
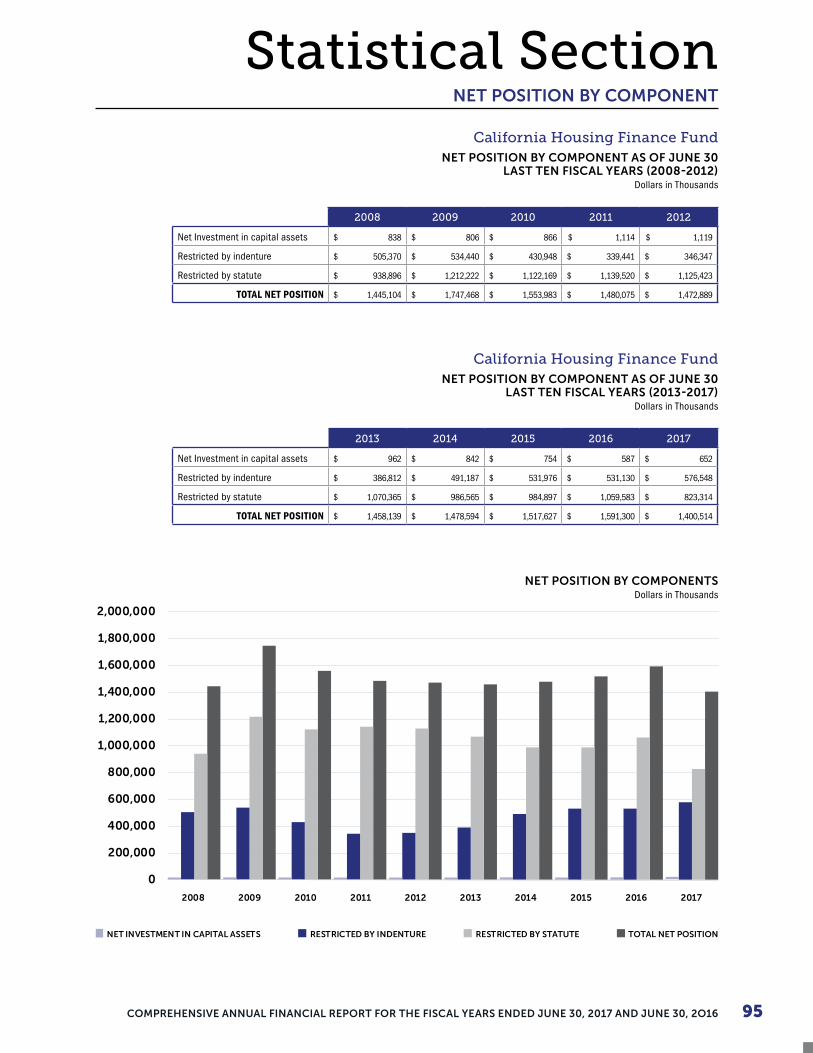
95COMPREHENSIVE ANNUAL FINANCIAL REPORT FOR THE FISCAL YEARS ENDED JUNE 30, 2017 AND JUNE 30, 2O16
Statistical SectionNET POSITION BY COMPONENT
0
200,000
400,000
600,000
800,000
1,000,000
1,200,000
1,400,000
1,600,000
1,800,000
2,000,000
RESTRICTED BY INDENTURE RESTRICTED BY STATUTE TOTAL NET POSITION
2008 2009 2010 2011 2012 2013 2014 2015 2016 2017
NET INVESTMENT IN CAPITAL ASSETS
NET POSITION BY COMPONENTSDollars in Thousands
California Housing Finance FundNET POSITION BY COMPONENT AS OF JUNE 30
LAST TEN FISCAL YEARS (2008-2012)Dollars in Thousands
2008 2009 2010 2011 2012
Net Investment in capital assets $ 838 $ 806 $ 866 $ 1,114 $ 1,119
Restricted by indenture $ 505,370 $ 534,440 $ 430,948 $ 339,441 $ 346,347
Restricted by statute $ 938,896 $ 1,212,222 $ 1,122,169 $ 1,139,520 $ 1,125,423
TOTAL NET POSITION $ 1,445,104 $ 1,747,468 $ 1,553,983 $ 1,480,075 $ 1,472,889
California Housing Finance FundNET POSITION BY COMPONENT AS OF JUNE 30
LAST TEN FISCAL YEARS (2013-2017)Dollars in Thousands
2013 2014 2015 2016 2017
Net Investment in capital assets $ 962 $ 842 $ 754 $ 587 $ 652
Restricted by indenture $ 386,812 $ 491,187 $ 531,976 $ 531,130 $ 576,548
Restricted by statute $ 1,070,365 $ 986,565 $ 984,897 $ 1,059,583 $ 823,314
TOTAL NET POSITION $ 1,458,139 $ 1,478,594 $ 1,517,627 $ 1,591,300 $ 1,400,514

CALIFORNIA HOUSING FINANCE AGENCY, A COMPONENT UNIT OF THE STATE OF CALIFORNIA96
CONDENSED SCHEDULE OF REVENUES, EXPENSES AND CHANGES IN FUND NET POSITION AS OF JUNE 30
California Housing Finance FundCHANGE IN NET POSITIONLAST TEN FISCAL YEARSDollars in Thousands
2008 2009 2010 2011 2012
OPERATING REVENUES
Interest income $ 492,670 $ 514,839 $ 432,190 $ 377,151 $ 323,806
Realized gain/Loss on sale of securities - - 10,503 1,623 -
Loan commiment fees 1,626 2,207 1,273 2,507 2,577
Administrative and other loan fees 12,626 13,196 27,589 28,233 26,092
Other revenues 2,657 3,178 (2,468) 25,906 (11,684)
TOTAL OPERATING REVENUES $ 509,579 $ 533,420 $ 469,087 $ 435,420 $ 340,791
OPERATING EXPENSES
Interest expense $ 392,647 $ 427,297 $ 318,021 $ 249,253 $ 190,884
Amortiziation of bond discount and premium (264) (461) (611) (3,297) (1,024)
Mortgage servicing fees 18,788 19,574 16,476 13,685 11,688
Provision for estimated loan losses 10,881 57,222 51,533 62,859 82,756
Salaries and General expenses 38,895 39,773 42,536 42,668 41,303
Other expenses 34,762 179,953 210,713 179,395 90,254
TOTAL OPERATING EXPENSES $ 495,709 $ 723,358 $ 638,668 $ 544,563 $ 415,861
Operating Income $ 13,870 $ (189,938) $ (169,581) $ (109,143) $ (75,070)
NON-OPERATING REVENUES AND EXPENSES
Interest: Positive arbitrage $ (2,084) $ 961 $ 1,022 $ 819 $ (423)
Changes in fair value of investments (3,746) 11,034 8,391 (6,475) 41,576
Investment SWAP revenue (fair value) 41 12 (26,815) (3,360) (44,741)
Investment gain/loss on termination SWAP - 30,697 (2,020) - -
Federal pass-through revenues 75,584 72,832 79,851 76,387 73,411
Federal pass-through expenses (75,584) (72,832) (79,851) (76,387) (73,411)
Prepayment penalty 1,357 934 255 589 1,287
Other 336 231 210 714 (4,957)
TOTAL NON-OPERATING REVENUES AND EXPENSES $ (4,096) $ 43,869 $ (18,957) $ (7,713) $ (7,258)
Income (loss) before transfers $ 9,774 $ (146,069) $ (188,538) $ (116,856) $ (82,328)
Transfers 42,417 448,433 14,350 42,948 75,142
Increase (decrease) in net position 52,191 302,364 (174,188) (73,908) (7,186)
GASB 53 (2010), GASB 68 & 71 (2015) - - (19,297) - -
NET POSITION AT BEGINNING OF YEAR $ 1,392,913 $ 1,445,104 $ 1,747,468 $ 1,553,983 $ 1,480,075
NET POSITION AT END OF YEAR $ 1,445,104 $ 1,747,468 $ 1,553,983 $ 1,480,075 $ 1,472,889
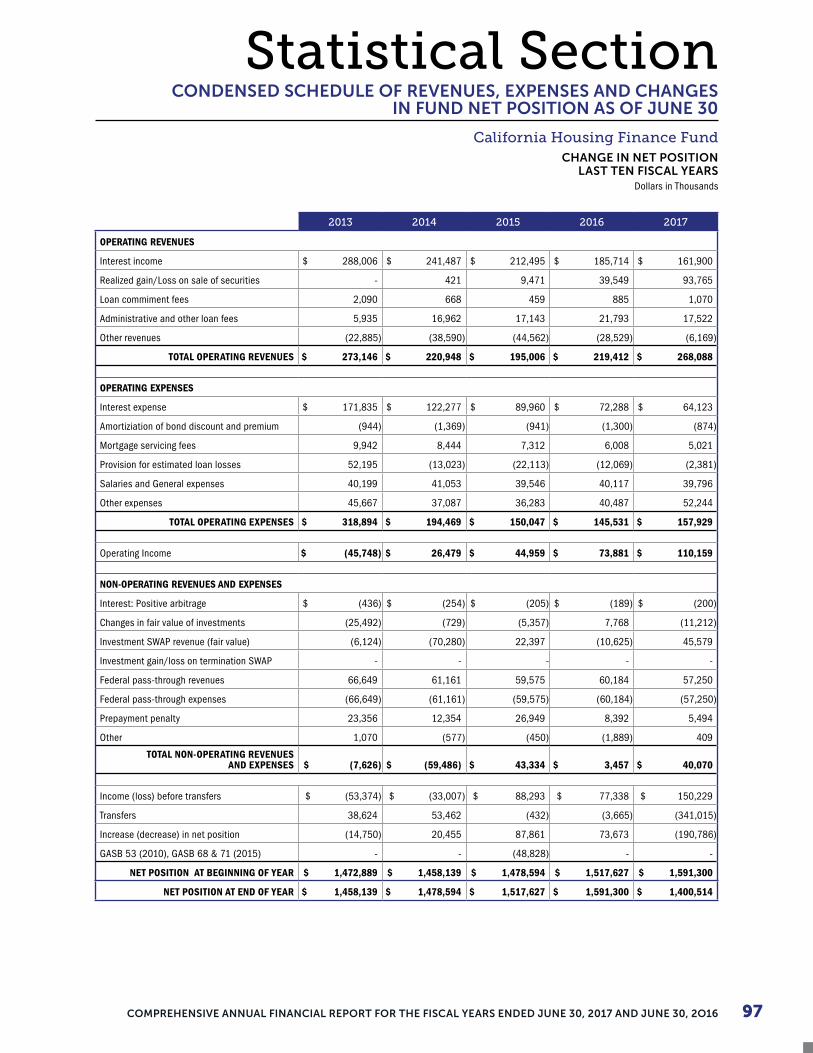
97COMPREHENSIVE ANNUAL FINANCIAL REPORT FOR THE FISCAL YEARS ENDED JUNE 30, 2017 AND JUNE 30, 2O16
Statistical SectionCONDENSED SCHEDULE OF REVENUES, EXPENSES AND CHANGES
IN FUND NET POSITION AS OF JUNE 30
California Housing Finance FundCHANGE IN NET POSITION
LAST TEN FISCAL YEARSDollars in Thousands
2013 2014 2015 2016 2017
OPERATING REVENUES
Interest income $ 288,006 $ 241,487 $ 212,495 $ 185,714 $ 161,900
Realized gain/Loss on sale of securities - 421 9,471 39,549 93,765
Loan commiment fees 2,090 668 459 885 1,070
Administrative and other loan fees 5,935 16,962 17,143 21,793 17,522
Other revenues (22,885) (38,590) (44,562) (28,529) (6,169)
TOTAL OPERATING REVENUES $ 273,146 $ 220,948 $ 195,006 $ 219,412 $ 268,088
OPERATING EXPENSES
Interest expense $ 171,835 $ 122,277 $ 89,960 $ 72,288 $ 64,123
Amortiziation of bond discount and premium (944) (1,369) (941) (1,300) (874)
Mortgage servicing fees 9,942 8,444 7,312 6,008 5,021
Provision for estimated loan losses 52,195 (13,023) (22,113) (12,069) (2,381)
Salaries and General expenses 40,199 41,053 39,546 40,117 39,796
Other expenses 45,667 37,087 36,283 40,487 52,244
TOTAL OPERATING EXPENSES $ 318,894 $ 194,469 $ 150,047 $ 145,531 $ 157,929
Operating Income $ (45,748) $ 26,479 $ 44,959 $ 73,881 $ 110,159
NON-OPERATING REVENUES AND EXPENSES
Interest: Positive arbitrage $ (436) $ (254) $ (205) $ (189) $ (200)
Changes in fair value of investments (25,492) (729) (5,357) 7,768 (11,212)
Investment SWAP revenue (fair value) (6,124) (70,280) 22,397 (10,625) 45,579
Investment gain/loss on termination SWAP - - - - -
Federal pass-through revenues 66,649 61,161 59,575 60,184 57,250
Federal pass-through expenses (66,649) (61,161) (59,575) (60,184) (57,250)
Prepayment penalty 23,356 12,354 26,949 8,392 5,494
Other 1,070 (577) (450) (1,889) 409
TOTAL NON-OPERATING REVENUES AND EXPENSES $ (7,626) $ (59,486) $ 43,334 $ 3,457 $ 40,070
Income (loss) before transfers $ (53,374) $ (33,007) $ 88,293 $ 77,338 $ 150,229
Transfers 38,624 53,462 (432) (3,665) (341,015)
Increase (decrease) in net position (14,750) 20,455 87,861 73,673 (190,786)
GASB 53 (2010), GASB 68 & 71 (2015) - - (48,828) - -
NET POSITION AT BEGINNING OF YEAR $ 1,472,889 $ 1,458,139 $ 1,478,594 $ 1,517,627 $ 1,591,300
NET POSITION AT END OF YEAR $ 1,458,139 $ 1,478,594 $ 1,517,627 $ 1,591,300 $ 1,400,514

CALIFORNIA HOUSING FINANCE AGENCY, A COMPONENT UNIT OF THE STATE OF CALIFORNIA98
HOME MORTGAGE REVENUE BONDS (HMRB) California Housing Finance Fund (2008-2012)*
AS OF JUNE 30 Dollars in Thousands
2008 2009 2010 2011 2012
HMRB FINANCIAL RATIOS
Total Asset $ 7,433,923 $ 7,240,691 $ 6,695,644 $ 5,567,246 $ 4,497,372
Total Liability $ 7,045,313 $ 6,813,322 $ 6,342,597 $ 5,299,855 $ 4,313,331
Net Position $ 3,886,010 $ 427,369 $ 353,047 $ 267,391 $ 184,041
Liability to Asset Ratio 94.77% 94.10% 94.73% 95.20% 95.91%
Net Position to Asset Ratio 5.23% 5.90% 5.27% 4.80% 4.09%
HMRB REVENUE BASE, REVENUE RATE AND PRINCIPAL PAYERS
Average Whole Loan Balance $ 5,758,408 $ 6,284,238 $ 5,779,279 $ 4,772,174 $ 4,102,135
Whole Loan Interest Earned $ 309,715 $ 328,874 $ 295,374 $ 259,982 $ 208,392
Average Loan Rate 5.38% 5.23% 5.11% 5.45% 5.08%
Single Family Whole Loans Percentage 100.00% 100.00% 100.00% 100.00% 100.00%
HMRB REVENUE BOND COVERAGE (DEBT SERVICE COVERAGE RATIO)(1)(2)
Total Debt Service $ 857,184 $ 680,720 $ 676,635 $ 1,229,577 $ 951,429
Net Revenue to Pay Debt Service(3) $ 841,628 $ 732,033 $ 614,816 $ 1,184,419 $ 950,125
Debt Service Coverage Ratio 98.19% 107.54% 90.86% 96.33% 99.86%
DEBT SERVICE CAPACITY LAST TEN FISCAL YEARS
HMRB Financial Ratios
0%
20%
40%
60%
80%
100%
120%
2009 2010 2011 2012 2013 2014 2015 2016 2017
LIABILITY TO ASSET RATIO NET POSITION TO ASSET RATIO

99COMPREHENSIVE ANNUAL FINANCIAL REPORT FOR THE FISCAL YEARS ENDED JUNE 30, 2017 AND JUNE 30, 2O16
Statistical SectionDEBT SERVICE CAPACITY LAST TEN FISCAL YEARS
80%
85%
90%
95%
100%
105%
110%
2009 2010 2011 2012 2013 2014 2015 2016 2017
HMRB Debt Service Coverage Ratio
HOME MORTGAGE REVENUE BONDS (HMRB)
California Housing Finance Fund (2013-2017)*
AS OF JUNE 30 Dollars in Thousands
2013 2014 2015 2016 2017
HMRB FINANCIAL RATIOS
Total Asset $ 3,216,506 $ 2,611,806 $ 2,157,574 $ 2,017,439 $ 1,729,408
Total Liability $ 3,060,832 $ 2,371,651 $ 1,895,843 $ 1,739,280 $ 1,417,367
Net Position $ 155,674 $ 240,155 $ 261,731 $ 278,159 $ 312,041
Liability to Asset Ratio 95.16% 90.81% 87.87% 86.21% 81.96%
Net Position to Asset Ratio 4.84% 9.19% 12.13% 13.79% 18.04%
HMRB REVENUE BASE, REVENUE RATE AND PRINCIPAL PAYERS
Average Whole Loan Balance $ 3,299,598 $ 2,491,724 $ 2,044,205 $ 1,683,898 $ 1,374,858
Whole Loan Interest Earned $ 160,548 $ 132,524 $ 117,098 $ 89,647 $ 73,220
Average Loan Rate 4.87% 5.32% 5.73% 5.32% 5.33%
Single Family Whole Loans Percentage 100.00% 100.00% 100.00% 100.00% 100.00%
HMRB REVENUE BOND COVERAGE (DEBT SERVICE COVERAGE RATIO)(1)(2)
Total Debt Service $ 1,329,237 $ 748,414 $ 524,914 $ 436,190 $ 634,665
Net Revenue to Pay Debt Service(3) $ 1,332,605 $ 768,984 $ 535,746 $ 440,285 $ 660,655
Debt Service Coverage Ratio 100.25% 102.75% 102.06% 100.94% 104.10%
* Special Obligation Indenture The debt service requirements information was obtained from Agency's debt service management system.(1) Coverage Ratio fluctuate significantly due to differences for collecting the revenue in earlier periods compared to the actual debt service payments.(2) Fiscal Years 2009 to 2012 may show greater than usual fluctuations and shortfalls due significant challenges brought on by global and California economic conditions as well as Agency's past financial decisions to enter into interest rate swap agreements and heavy use of variable rate bonds.(3) Sources of Revenue Include: Mortgage Loan Repayment, Mortgage Loan Interest Earnings, Mortgage Back Security Payments, and Investment Interest Earnings
Qualified mortgage revenue bonds are structured in such a way that both mortgage loan repayments and gross revenues are used for bond repayment. Accordingly, to achieve adequate debt service coverage, mortgage loan repayments must be considered. Due to the nature of qualified mortgage revenue bonds, the Fund's bond resolutions and indentures do not have required bond coverage percentages. The above information is provided for general information purposes only. Net position is netted with deferred inflows in the above information.

CALIFORNIA HOUSING FINANCE AGENCY, A COMPONENT UNIT OF THE STATE OF CALIFORNIA100
RESIDENTIAL MORTGAGE REVENUE BONDS (SINGLE FAMILY) - RMRBSF California Housing Finance Fund (2008-2017)*
AS OF JUNE 30 Dollars in Thousands
2010 2011 2012 2013 2014 2015 2016 2017
RMRBSF FINANCIAL RATIOS
Total Asset $ 1,017,475 $ 1,117,596 $ 929,672 $ 685,987 $ 563,753 $ 455,636 $ 370,202 $ 276,635
Total Liability $ 1,016,953 $ 1,115,380 $ 857,677 $ 625,627 $ 504,781 $ 392,423 $ 302,285 $ 218,600
Net Position $ 522 $ 2,216 $ 71,995 $ 60,360 $ 58,972 $ 63,213 $ 67,917 $ 58,035
Liability to Asset Ratio 99.95% 99.80% 92.26% 91.20% 89.54% 86.13% 81.65% 79.02%
Net Position to Asset Ratio 0.05% 0.20% 7.74% 8.80% 10.46% 13.87% 18.35% 20.98%
RMRBSF REVENUE BASE, REVENUE RATE AND PRINCIPAL PAYERS
Average Whole Loan Balance N/A N/A N/A $ 428,720 $ 357,311 $ 302,044 $ 253,470 $ 206,547
Whole Loan Interest Earned N/A N/A N/A $ 19,621 $ 18,334 $ 14,877 $ 11,828 $ 9,652
Average Loan Rate N/A N/A N/A 4.58% 5.13% 4.93% 4.67% 4.67%
Single Family Whole Loans Percentage N/A N/A N/A 96.16% 95.90% 95.75% 95.30% 97.23%
Multifamily Whole Loans Percentage(4) N/A N/A N/A 3.84% 4.10% 4.25% 4.70% 2.77%
RMRBSF REVENUE BOND COVERAGE (DEBT SERVICE COVERAGE RATIO)(1)(2)
Total Debt Service N/A $ 639 $ 15,016 $ 245,550 $ 145,929 $ 130,006 $ 103,010 $ 96,723
Net Revenue to Pay Debt Service(3) N/A $ 4,144 $ 65,014 $ 253,558 $ 146,776 $ 134,382 $ 106,496 $ 89,663
Debt Service Coverage Ratio N/A 648.02% 432.97% 103.26% 100.58% 103.37% 103.38% 92.70%
* Special Obligation Indenture, bonds did not originate until fiscal year ending 2010, whole loans not transferred until fiscal year ending 2013. The debt service requirements information was obtained from Agency's debt service management system.(1) Coverage Ratio fluctuate significantly due to differences for collecting the revenue in earlier periods compared to the actual debt service payments(2) Fiscal Years 2009 to 2012 may show greater than usual fluctuations and shortfalls due significant challenges brought on by global and California economic conditions as well as Agency's past financial decisions to enter into interest rate swap agreements and heavy use of variable rate bonds.(3) Sources of Revenue Include: Mortgage Loan Repayment, Mortgage Loan Interest Earnings, Mortgage Back Security Payments, and Investment Interest Earnings(4) Multifamily whole loans were placed in the RMRB (SF) indenture for over-collateralization purposes.
Qualified mortgage revenue bonds are structured in such a way that both mortgage loan repayments and gross revenues are used for bond repayment. Accordingly, to achieve adequate debt service coverage, mortgage loan repayments must be considered. Due to the nature of qualified mortgage revenue bonds, the Fund's bond resolutions and indentures do not have required bond coverage percentages. The above information is provided for general information purposes only. Net position is netted with deferred inflows in the above information.
DEBT SERVICE CAPACITY LAST TEN FISCAL YEARS
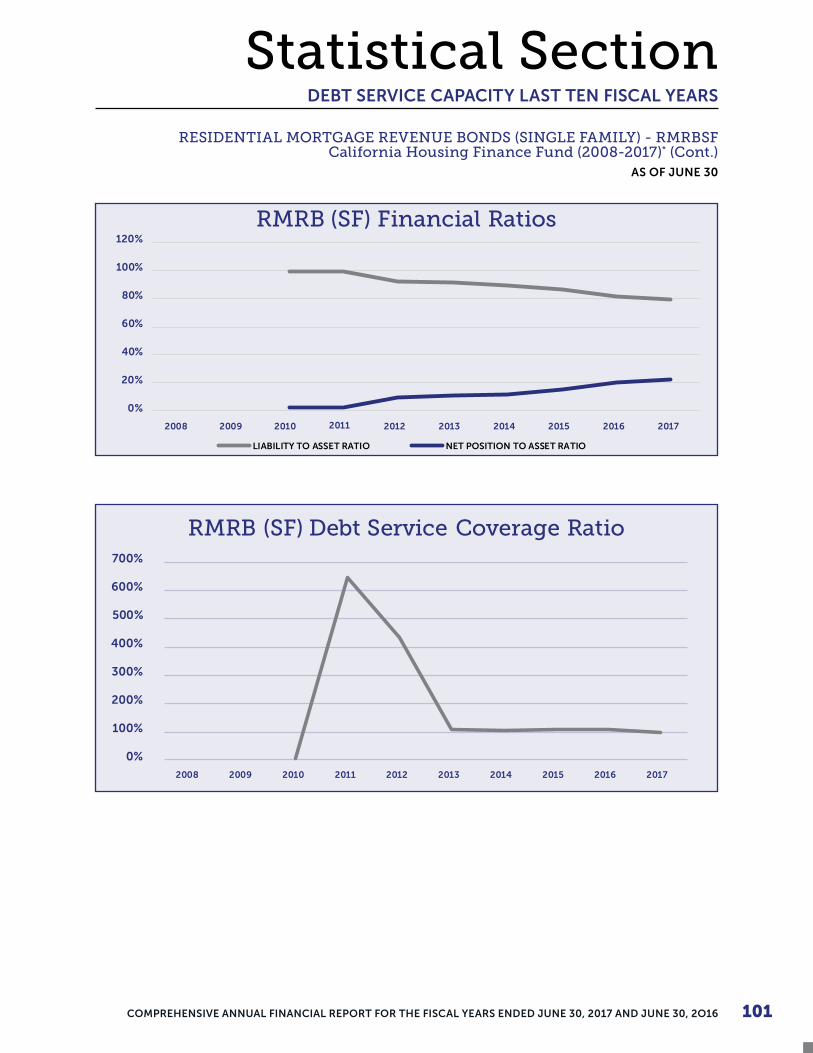
101COMPREHENSIVE ANNUAL FINANCIAL REPORT FOR THE FISCAL YEARS ENDED JUNE 30, 2017 AND JUNE 30, 2O16
Statistical Section
RMRB (SF) Financial Ratios120%
100%
80%
60%
40%
20%
0%
2008 2009 2010 2011 2012 2013 2014 2015 2016 2017
LIABILITY TO ASSET RATIO NET POSITION TO ASSET RATIO
RMRB (SF) Debt Service Coverage Ratio
0%
200%
100%
300%
400%
500%
600%
700%
2008 20172009 2010 2011 2012 2013 2014 2015 2016
DEBT SERVICE CAPACITY LAST TEN FISCAL YEARS
RESIDENTIAL MORTGAGE REVENUE BONDS (SINGLE FAMILY) - RMRBSF California Housing Finance Fund (2008-2017)* (Cont.)
AS OF JUNE 30
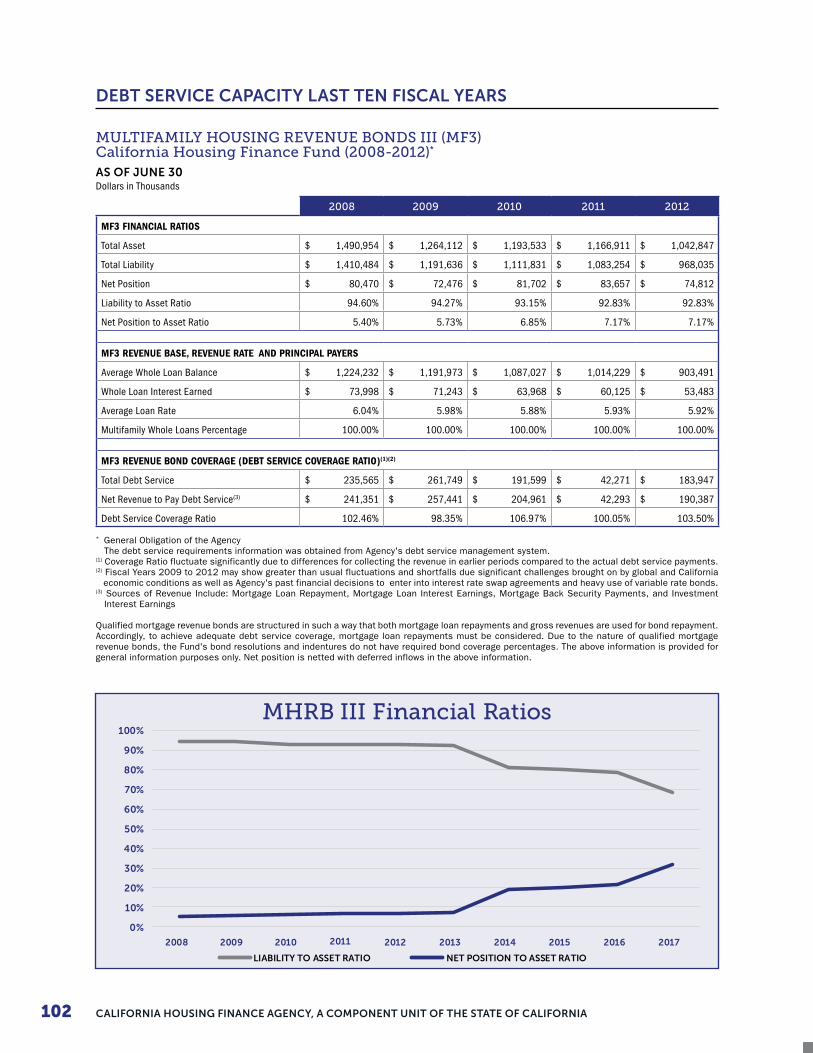
CALIFORNIA HOUSING FINANCE AGENCY, A COMPONENT UNIT OF THE STATE OF CALIFORNIA102
2008 2009 2010 2011 2012 2013 2014 2015 2016 2017
LIABILITY TO ASSET RATIO NET POSITION TO ASSET RATIO
MHRB III Financial Ratios
0%
10%
20%
30%
40%
50%
60%
70%
80%
90%
100%
MULTIFAMILY HOUSING REVENUE BONDS III (MF3) California Housing Finance Fund (2008-2012)*
AS OF JUNE 30 Dollars in Thousands
2008 2009 2010 2011 2012
MF3 FINANCIAL RATIOS
Total Asset $ 1,490,954 $ 1,264,112 $ 1,193,533 $ 1,166,911 $ 1,042,847
Total Liability $ 1,410,484 $ 1,191,636 $ 1,111,831 $ 1,083,254 $ 968,035
Net Position $ 80,470 $ 72,476 $ 81,702 $ 83,657 $ 74,812
Liability to Asset Ratio 94.60% 94.27% 93.15% 92.83% 92.83%
Net Position to Asset Ratio 5.40% 5.73% 6.85% 7.17% 7.17%
MF3 REVENUE BASE, REVENUE RATE AND PRINCIPAL PAYERS
Average Whole Loan Balance $ 1,224,232 $ 1,191,973 $ 1,087,027 $ 1,014,229 $ 903,491
Whole Loan Interest Earned $ 73,998 $ 71,243 $ 63,968 $ 60,125 $ 53,483
Average Loan Rate 6.04% 5.98% 5.88% 5.93% 5.92%
Multifamily Whole Loans Percentage 100.00% 100.00% 100.00% 100.00% 100.00%
MF3 REVENUE BOND COVERAGE (DEBT SERVICE COVERAGE RATIO)(1)(2)
Total Debt Service $ 235,565 $ 261,749 $ 191,599 $ 42,271 $ 183,947
Net Revenue to Pay Debt Service(3) $ 241,351 $ 257,441 $ 204,961 $ 42,293 $ 190,387
Debt Service Coverage Ratio 102.46% 98.35% 106.97% 100.05% 103.50%
* General Obligation of the Agency The debt service requirements information was obtained from Agency's debt service management system. (1) Coverage Ratio fluctuate significantly due to differences for collecting the revenue in earlier periods compared to the actual debt service payments.(2) Fiscal Years 2009 to 2012 may show greater than usual fluctuations and shortfalls due significant challenges brought on by global and California economic conditions as well as Agency's past financial decisions to enter into interest rate swap agreements and heavy use of variable rate bonds.(3) Sources of Revenue Include: Mortgage Loan Repayment, Mortgage Loan Interest Earnings, Mortgage Back Security Payments, and Investment Interest Earnings
Qualified mortgage revenue bonds are structured in such a way that both mortgage loan repayments and gross revenues are used for bond repayment. Accordingly, to achieve adequate debt service coverage, mortgage loan repayments must be considered. Due to the nature of qualified mortgage revenue bonds, the Fund's bond resolutions and indentures do not have required bond coverage percentages. The above information is provided for general information purposes only. Net position is netted with deferred inflows in the above information.
DEBT SERVICE CAPACITY LAST TEN FISCAL YEARS

103COMPREHENSIVE ANNUAL FINANCIAL REPORT FOR THE FISCAL YEARS ENDED JUNE 30, 2017 AND JUNE 30, 2O16
Statistical Section
MHRBIII Debt Service Coverage Ratio
0.00%
20.00%
40.00%
60.00%
80.00%
100.00%
120.00%
140.00%
160.00%
2008 2009 2010 2011 2012 2013 2014 2015 2016 2017
MULTIFAMILY HOUSING REVENUE BONDS III (MF3)
California Housing Finance Fund (2013-2017)*
AS OF JUNE 30 Dollars in Thousands
2013 2014 2015 2016 2017
MF3 FINANCIAL RATIOS
Total Asset $ 788,524 $ 737,181 $ 737,296 $ 637,971 $ 559,441
Total Liability $ 727,647 $ 597,379 $ 590,636 $ 500,454 $ 382,802
Net Position $ 60,877 $ 139,802 $ 146,660 $ 137,517 $ 176,639
Liability to Asset Ratio 92.28% 81.04% 80.11% 78.44% 68.43%
Net Position to Asset Ratio 7.72% 18.96% 19.89% 21.56% 31.57%
MF3 REVENUE BASE, REVENUE RATE AND PRINCIPAL PAYERS
Average Whole Loan Balance $ 755,389 $ 690,639 $ 653,403 $ 610,274 $ 563,157
Whole Loan Interest Earned $ 45,318 $ 40,444 $ 38,751 $ 35,687 $ 33,250
Average Loan Rate 6.00% 5.86% 5.93% 5.85% 5.90%
Multifamily Whole Loans Percentage 100.00% 100.00% 100.00% 100.00% 100.00%
MF3 REVENUE BOND COVERAGE (DEBT SERVICE COVERAGE RATIO)(1)(2)
Total Debt Service $ 201,087 $ 180,038 $ 190,439 $ 119,614 $ 84,241
Net Revenue to Pay Debt Service(3) $ 226,328 $ 259,600 $ 198,131 $ 131,289 $ 86,815
Debt Service Coverage Ratio 112.55% 144.19% 104.04% 109.76% 103.05%
The debt service requirements information was obtained from Agency's debt service management system. (1) Coverage Ratio fluctuate significantly due to differences for collecting the revenue in earlier periods compared to the actual debt service payments.(2) Fiscal Years 2009 to 2012 may show greater than usual fluctuations and shortfalls due significant challenges brought on by global and California economic conditions as well as Agency's past financial decisions to enter into interest rate swap agreements and heavy use of variable rate bonds.(3) Sources of Revenue Include: Mortgage Loan Repayment, Mortgage Loan Interest Earnings, Mortgage Back Security Payments, and Investment Interest Earnings
Qualified mortgage revenue bonds are structured in such a way that both mortgage loan repayments and gross revenues are used for bond repayment. Accordingly, to achieve adequate debt service coverage, mortgage loan repayments must be considered. Due to the nature of qualified mortgage revenue bonds, the Fund's bond resolutions and indentures do not have required bond coverage percentages. The above information is provided for general information purposes only. Net position is netted with deferred inflows in the above information.
DEBT SERVICE CAPACITY LAST TEN FISCAL YEARS
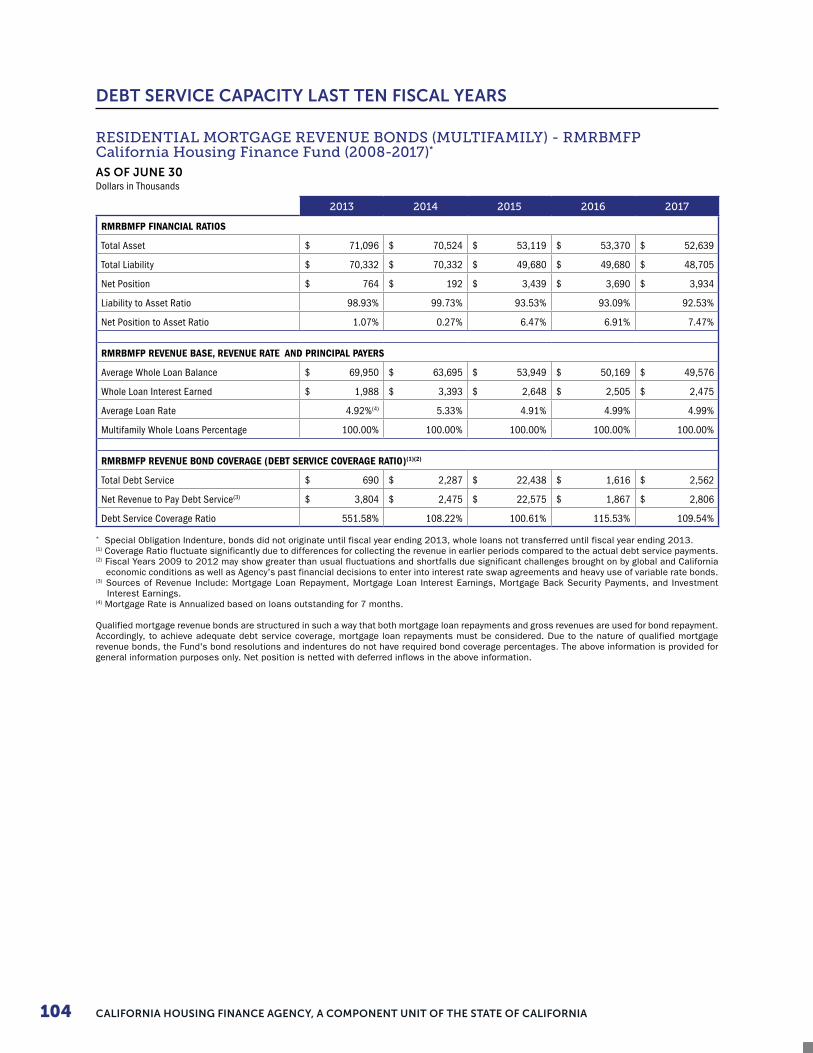
CALIFORNIA HOUSING FINANCE AGENCY, A COMPONENT UNIT OF THE STATE OF CALIFORNIA104
RESIDENTIAL MORTGAGE REVENUE BONDS (MULTIFAMILY) - RMRBMFP
California Housing Finance Fund (2008-2017)*
AS OF JUNE 30 Dollars in Thousands
2013 2014 2015 2016 2017
RMRBMFP FINANCIAL RATIOS
Total Asset $ 71,096 $ 70,524 $ 53,119 $ 53,370 $ 52,639
Total Liability $ 70,332 $ 70,332 $ 49,680 $ 49,680 $ 48,705
Net Position $ 764 $ 192 $ 3,439 $ 3,690 $ 3,934
Liability to Asset Ratio 98.93% 99.73% 93.53% 93.09% 92.53%
Net Position to Asset Ratio 1.07% 0.27% 6.47% 6.91% 7.47%
RMRBMFP REVENUE BASE, REVENUE RATE AND PRINCIPAL PAYERS
Average Whole Loan Balance $ 69,950 $ 63,695 $ 53,949 $ 50,169 $ 49,576
Whole Loan Interest Earned $ 1,988 $ 3,393 $ 2,648 $ 2,505 $ 2,475
Average Loan Rate 4.92%(4) 5.33% 4.91% 4.99% 4.99%
Multifamily Whole Loans Percentage 100.00% 100.00% 100.00% 100.00% 100.00%
RMRBMFP REVENUE BOND COVERAGE (DEBT SERVICE COVERAGE RATIO)(1)(2)
Total Debt Service $ 690 $ 2,287 $ 22,438 $ 1,616 $ 2,562
Net Revenue to Pay Debt Service(3) $ 3,804 $ 2,475 $ 22,575 $ 1,867 $ 2,806
Debt Service Coverage Ratio 551.58% 108.22% 100.61% 115.53% 109.54%
* Special Obligation Indenture, bonds did not originate until fiscal year ending 2013, whole loans not transferred until fiscal year ending 2013.(1) Coverage Ratio fluctuate significantly due to differences for collecting the revenue in earlier periods compared to the actual debt service payments.(2) Fiscal Years 2009 to 2012 may show greater than usual fluctuations and shortfalls due significant challenges brought on by global and California economic conditions as well as Agency's past financial decisions to enter into interest rate swap agreements and heavy use of variable rate bonds.(3) Sources of Revenue Include: Mortgage Loan Repayment, Mortgage Loan Interest Earnings, Mortgage Back Security Payments, and Investment Interest Earnings.(4) Mortgage Rate is Annualized based on loans outstanding for 7 months.
Qualified mortgage revenue bonds are structured in such a way that both mortgage loan repayments and gross revenues are used for bond repayment. Accordingly, to achieve adequate debt service coverage, mortgage loan repayments must be considered. Due to the nature of qualified mortgage revenue bonds, the Fund's bond resolutions and indentures do not have required bond coverage percentages. The above information is provided for general information purposes only. Net position is netted with deferred inflows in the above information.
DEBT SERVICE CAPACITY LAST TEN FISCAL YEARS

105COMPREHENSIVE ANNUAL FINANCIAL REPORT FOR THE FISCAL YEARS ENDED JUNE 30, 2017 AND JUNE 30, 2O16
Statistical Section
2008 2009 2010 2011 2012 2013 2014 2015 2016 2017
LIABILITY TO ASSET RATIO NET POSITION TO ASSET RATIO
RMRB (MFP) Financial Ratios
0%
20%
40%
60%
80%
100%
120%
RMRB (MFP) Debt Service Coverage Ratio
2008 2009 2010 2011 2012 2013 2014 2015 2016 2017
0.00%
100.00%
200.00%
300.00%
400.00%
500.00%
600.00%
DEBT SERVICE CAPACITY LAST TEN FISCAL YEARS
RESIDENTIAL MORTGAGE REVENUE BONDS (SINGLE FAMILY) - RMRBSF California Housing Finance Fund (2008-2017)* (Cont.)
AS OF JUNE 30
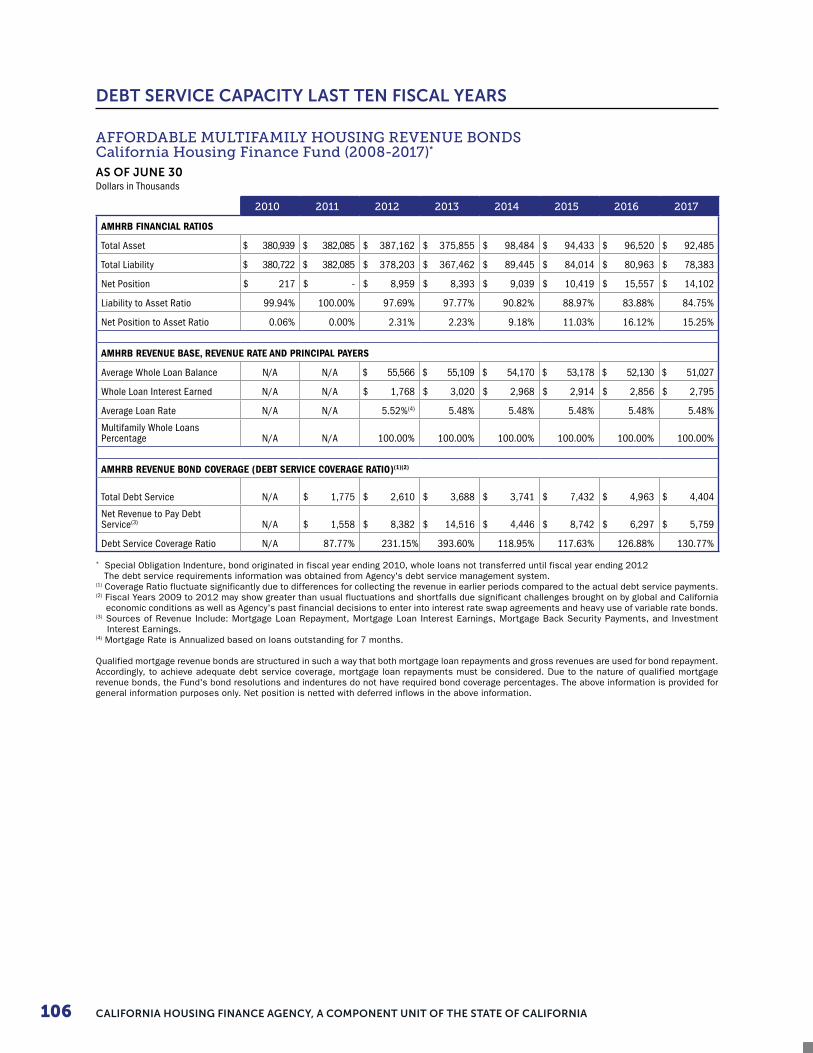
CALIFORNIA HOUSING FINANCE AGENCY, A COMPONENT UNIT OF THE STATE OF CALIFORNIA106
AFFORDABLE MULTIFAMILY HOUSING REVENUE BONDS California Housing Finance Fund (2008-2017)*
AS OF JUNE 30 Dollars in Thousands
2010 2011 2012 2013 2014 2015 2016 2017
AMHRB FINANCIAL RATIOS
Total Asset $ 380,939 $ 382,085 $ 387,162 $ 375,855 $ 98,484 $ 94,433 $ 96,520 $ 92,485
Total Liability $ 380,722 $ 382,085 $ 378,203 $ 367,462 $ 89,445 $ 84,014 $ 80,963 $ 78,383
Net Position $ 217 $ - $ 8,959 $ 8,393 $ 9,039 $ 10,419 $ 15,557 $ 14,102
Liability to Asset Ratio 99.94% 100.00% 97.69% 97.77% 90.82% 88.97% 83.88% 84.75%
Net Position to Asset Ratio 0.06% 0.00% 2.31% 2.23% 9.18% 11.03% 16.12% 15.25%
AMHRB REVENUE BASE, REVENUE RATE AND PRINCIPAL PAYERS
Average Whole Loan Balance N/A N/A $ 55,566 $ 55,109 $ 54,170 $ 53,178 $ 52,130 $ 51,027
Whole Loan Interest Earned N/A N/A $ 1,768 $ 3,020 $ 2,968 $ 2,914 $ 2,856 $ 2,795
Average Loan Rate N/A N/A 5.52%(4) 5.48% 5.48% 5.48% 5.48% 5.48%
Multifamily Whole Loans Percentage N/A N/A 100.00% 100.00% 100.00% 100.00% 100.00% 100.00%
AMHRB REVENUE BOND COVERAGE (DEBT SERVICE COVERAGE RATIO)(1)(2)
Total Debt Service N/A $ 1,775 $ 2,610 $ 3,688 $ 3,741 $ 7,432 $ 4,963 $ 4,404
Net Revenue to Pay Debt Service(3) N/A $ 1,558 $ 8,382 $ 14,516 $ 4,446 $ 8,742 $ 6,297 $ 5,759
Debt Service Coverage Ratio N/A 87.77% 231.15% 393.60% 118.95% 117.63% 126.88% 130.77%
* Special Obligation Indenture, bond originated in fiscal year ending 2010, whole loans not transferred until fiscal year ending 2012 The debt service requirements information was obtained from Agency's debt service management system.(1) Coverage Ratio fluctuate significantly due to differences for collecting the revenue in earlier periods compared to the actual debt service payments.(2) Fiscal Years 2009 to 2012 may show greater than usual fluctuations and shortfalls due significant challenges brought on by global and California economic conditions as well as Agency's past financial decisions to enter into interest rate swap agreements and heavy use of variable rate bonds.(3) Sources of Revenue Include: Mortgage Loan Repayment, Mortgage Loan Interest Earnings, Mortgage Back Security Payments, and Investment Interest Earnings.(4) Mortgage Rate is Annualized based on loans outstanding for 7 months.
Qualified mortgage revenue bonds are structured in such a way that both mortgage loan repayments and gross revenues are used for bond repayment. Accordingly, to achieve adequate debt service coverage, mortgage loan repayments must be considered. Due to the nature of qualified mortgage revenue bonds, the Fund's bond resolutions and indentures do not have required bond coverage percentages. The above information is provided for general information purposes only. Net position is netted with deferred inflows in the above information.
DEBT SERVICE CAPACITY LAST TEN FISCAL YEARS

107COMPREHENSIVE ANNUAL FINANCIAL REPORT FOR THE FISCAL YEARS ENDED JUNE 30, 2017 AND JUNE 30, 2O16
Statistical Section
2008 2009 2010 2011 2012 2013 2014 2015 2016 2017
LIABILITY TO ASSET RATIO NET POSITION TO ASSET RATIO
AMHRB Financial Ratios
0%
20%
40%
60%
80%
100%
120%
AMHRB Debt Service Coverage Ratio
2008 2009 2010 2011 2012 2013 2014 2015 2016 20170.00%
50.00%
100.00%
150.00%
200.00%
250.00%
300.00%
350.00%
400.00%
450.00%
DEBT SERVICE CAPACITY LAST TEN FISCAL YEARS
AFFORDABLE MULTIFAMILY HOUSING REVENUE BONDS California Housing Finance Fund (2008-2017)* (Cont.)
AS OF JUNE 30
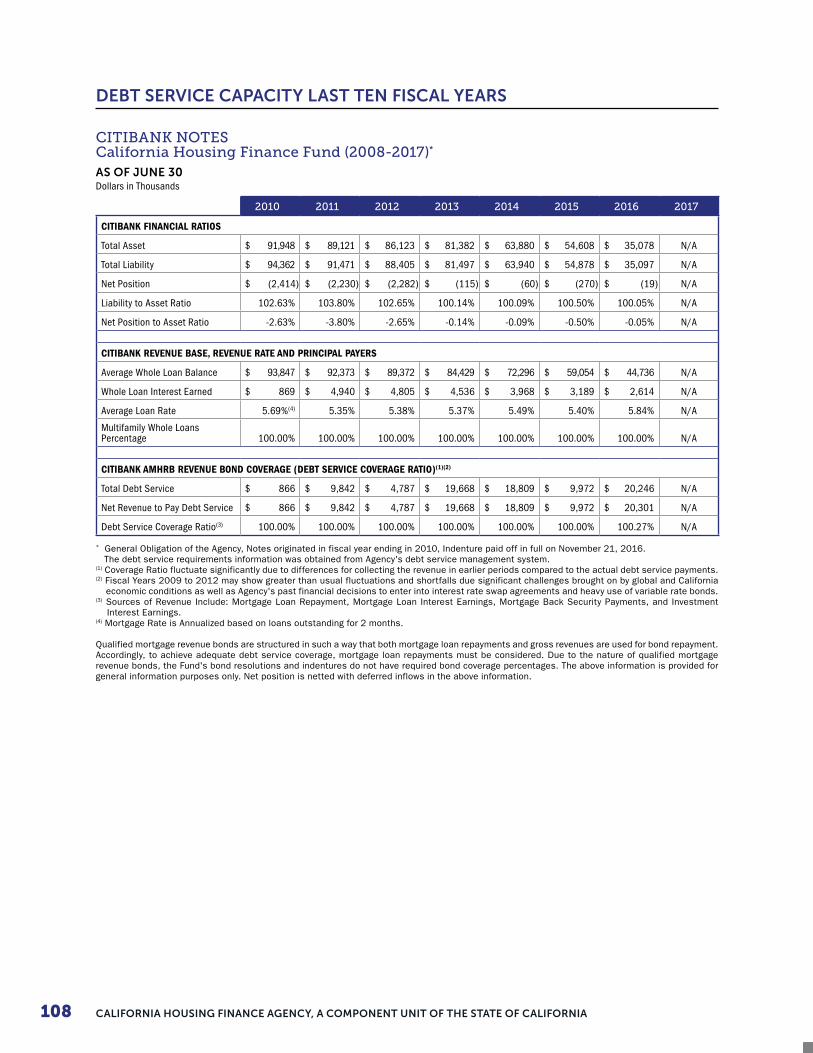
CALIFORNIA HOUSING FINANCE AGENCY, A COMPONENT UNIT OF THE STATE OF CALIFORNIA108
CITIBANK NOTES California Housing Finance Fund (2008-2017)*
AS OF JUNE 30 Dollars in Thousands
2010 2011 2012 2013 2014 2015 2016 2017
CITIBANK FINANCIAL RATIOS
Total Asset $ 91,948 $ 89,121 $ 86,123 $ 81,382 $ 63,880 $ 54,608 $ 35,078 N/A
Total Liability $ 94,362 $ 91,471 $ 88,405 $ 81,497 $ 63,940 $ 54,878 $ 35,097 N/A
Net Position $ (2,414) $ (2,230) $ (2,282) $ (115) $ (60) $ (270) $ (19) N/A
Liability to Asset Ratio 102.63% 103.80% 102.65% 100.14% 100.09% 100.50% 100.05% N/A
Net Position to Asset Ratio -2.63% -3.80% -2.65% -0.14% -0.09% -0.50% -0.05% N/A
CITIBANK REVENUE BASE, REVENUE RATE AND PRINCIPAL PAYERS
Average Whole Loan Balance $ 93,847 $ 92,373 $ 89,372 $ 84,429 $ 72,296 $ 59,054 $ 44,736 N/A
Whole Loan Interest Earned $ 869 $ 4,940 $ 4,805 $ 4,536 $ 3,968 $ 3,189 $ 2,614 N/A
Average Loan Rate 5.69%(4) 5.35% 5.38% 5.37% 5.49% 5.40% 5.84% N/A
Multifamily Whole Loans Percentage 100.00% 100.00% 100.00% 100.00% 100.00% 100.00% 100.00% N/A
CITIBANK AMHRB REVENUE BOND COVERAGE (DEBT SERVICE COVERAGE RATIO)(1)(2)
Total Debt Service $ 866 $ 9,842 $ 4,787 $ 19,668 $ 18,809 $ 9,972 $ 20,246 N/A
Net Revenue to Pay Debt Service $ 866 $ 9,842 $ 4,787 $ 19,668 $ 18,809 $ 9,972 $ 20,301 N/A
Debt Service Coverage Ratio(3) 100.00% 100.00% 100.00% 100.00% 100.00% 100.00% 100.27% N/A
* General Obligation of the Agency, Notes originated in fiscal year ending in 2010, Indenture paid off in full on November 21, 2016. The debt service requirements information was obtained from Agency's debt service management system.(1) Coverage Ratio fluctuate significantly due to differences for collecting the revenue in earlier periods compared to the actual debt service payments.(2) Fiscal Years 2009 to 2012 may show greater than usual fluctuations and shortfalls due significant challenges brought on by global and California economic conditions as well as Agency's past financial decisions to enter into interest rate swap agreements and heavy use of variable rate bonds.(3) Sources of Revenue Include: Mortgage Loan Repayment, Mortgage Loan Interest Earnings, Mortgage Back Security Payments, and Investment Interest Earnings.(4) Mortgage Rate is Annualized based on loans outstanding for 2 months.
Qualified mortgage revenue bonds are structured in such a way that both mortgage loan repayments and gross revenues are used for bond repayment. Accordingly, to achieve adequate debt service coverage, mortgage loan repayments must be considered. Due to the nature of qualified mortgage revenue bonds, the Fund's bond resolutions and indentures do not have required bond coverage percentages. The above information is provided for general information purposes only. Net position is netted with deferred inflows in the above information.
DEBT SERVICE CAPACITY LAST TEN FISCAL YEARS
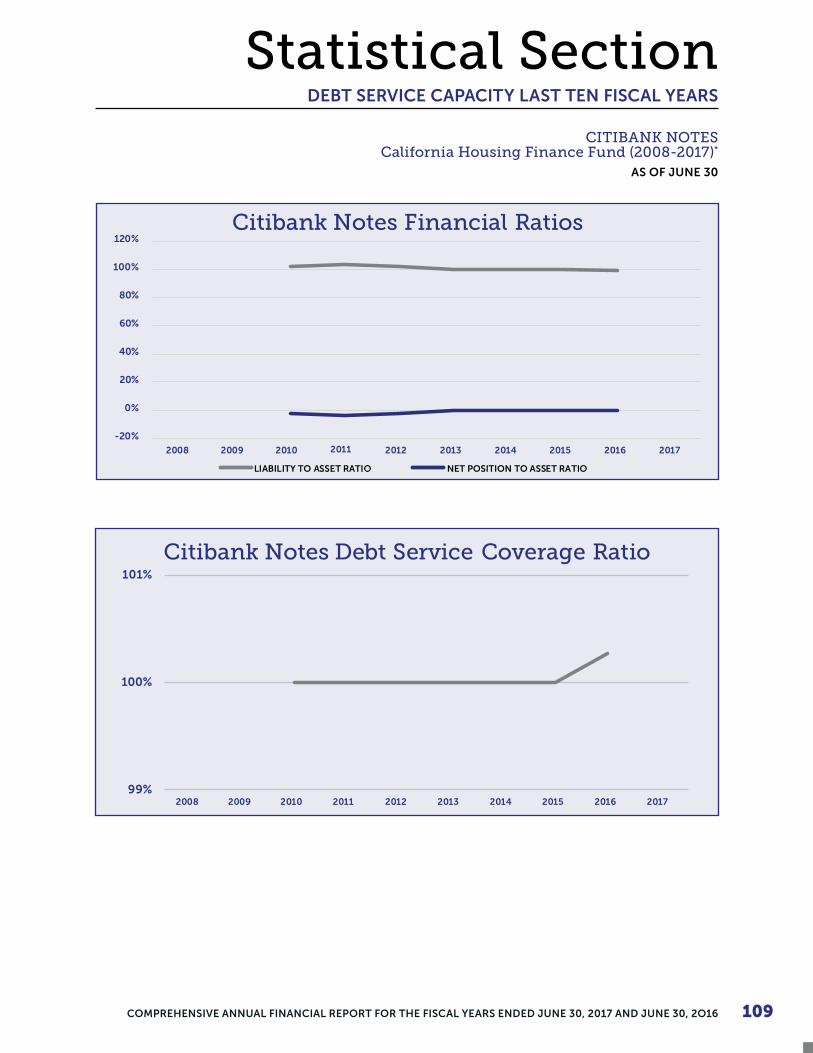
109COMPREHENSIVE ANNUAL FINANCIAL REPORT FOR THE FISCAL YEARS ENDED JUNE 30, 2017 AND JUNE 30, 2O16
Statistical Section
2008 2009 2010 2011 2012 2013 2014 2015 2016 2017
LIABILITY TO ASSET RATIO NET POSITION TO ASSET RATIO
Citibank Notes Financial Ratios120%
100%
80%
60%
40%
20%
0%
-20%
Citibank Notes Debt Service Coverage Ratio
2008 2009 2010 2011 2012 2013 2014 2015 2016 201799%
100%
101%
CITIBANK NOTES California Housing Finance Fund (2008-2017)*
AS OF JUNE 30
DEBT SERVICE CAPACITY LAST TEN FISCAL YEARS

CALIFORNIA HOUSING FINANCE AGENCY, A COMPONENT UNIT OF THE STATE OF CALIFORNIA110
2008 2009 2010 2011 2012 2013 2014 2015 2016 2017
LIABILITY TO ASSET RATIO NET POSITION TO ASSET RATIO
MLPB Financial Ratios120%
100%
80%
60%
40%
20%
0%
-20%
MULTIFAMILY LOAN PURCHASE BONDS (MLPB) California Housing Finance Fund (2008-2012)*
AS OF JUNE 30 Dollars in Thousands
2008 2009 2010 2011 2012
MLPB FINANCIAL RATIOS
Total Asset $ 75,626 $ 59,089 $ 45,184 $ 27,931 $ 16,189
Total Liability $ 75,629 $ 59,092 $ 45,187 $ 27,934 $ 16,192
Net Position $ (3) $ (3) $ (3) $ (3) $ (3)
Liability to Asset Ratio 100.00% 100.00% 100.00% 100.01% 100.02%
Net Position to Asset Ratio 0.00% 0.00% -0.01% -0.01% -0.02%
MLPB REVENUE BASE, REVENUE RATE AND PRINCIPAL PAYERS
Average Whole Loan Balance $ 83,971 $ 65,732 $ 50,643 $ 35,249 $ 21,083
Whole Loan Interest Earned $ 7,141 $ 5,055 $ 3,621 $ 2,566 $ 1,378
Average Loan Rate 8.50% 7.69% 7.15% 7.28% 6.54%
Multifamily Whole Loans Percentage 100.00% 100.00% 100.00% 100.00% 100.00%
MLPB REVENUE BOND COVERAGE (DEBT SERVICE COVERAGE RATIO)(1)(2)
Total Debt Service $ 27,117 $ 21,557 $ 17,298 $ 19,677 $ 12,600
Net Revenue to Pay Debt Service(3) $ 27,117 $ 21,557 $ 17,298 $ 19,677 $ 12,600
Debt Service Coverage Ratio 100.00% 100.00% 100.00% 100.00% 100.00%
* Limited Obligation Indenture, indenture contains no whole loans, and revenue is generated solely from investments and pass-through securities. Paid off in full on February 1, 2017. The debt service requirements information was obtained from Agency's debt service management system.(1) Coverage Ratio fluctuate significantly due to differences for collecting the revenue in earlier periods compared to the actual debt service payments.(2) Fiscal Years 2009 to 2012 may show greater than usual fluctuations and shortfalls due significant challenges brought on by global and California economic conditions as well as Agency's past financial decisions to enter into interest rate swap agreements and heavy use of variable rate bonds.(3) Sources of Revenue Include: Mortgage Loan Repayment, Mortgage Loan Interest Earnings, Mortgage Back Security Payments, and Investment Interest Earnings.
Qualified mortgage revenue bonds are structured in such a way that both mortgage loan repayments and gross revenues are used for bond repayment. Accordingly, to achieve adequate debt service coverage, mortgage loan repayments must be considered. Due to the nature of qualified mortgage revenue bonds, the Fund's bond resolutions and indentures do not have required bond coverage percentages. The above information is provided for general information purposes only. Net position is netted with deferred inflows in the above information.
DEBT SERVICE CAPACITY LAST TEN FISCAL YEARS

111COMPREHENSIVE ANNUAL FINANCIAL REPORT FOR THE FISCAL YEARS ENDED JUNE 30, 2017 AND JUNE 30, 2O16
Statistical SectionMULTIFAMILY LOAN PURCHASE BONDS (MLPB)
California Housing Finance Fund (2013-2017)*
AS OF JUNE 30 Dollars in Thousands
2013 2014 2015 2016 2017
MLPB FINANCIAL RATIOS
Total Asset $ 9,135 $ 3,776 $ 1,027 $ 216 N/A
Total Liability $ 9,138 $ 3,779 $ 1,030 $ 219 N/A
Net Position $ (3) $ (3) $ (3) $ (3) N/A
Liability to Asset Ratio 100.03% 100.09% 100.31% 101.49% N/A
Net Position to Asset Ratio -0.03% -0.08% -0.29% -1.39% N/A
MLPB REVENUE BASE, REVENUE RATE AND PRINCIPAL PAYERS
Average Whole Loan Balance $ 12,059 $ 6,039 $ 2,176 $ 550 N/A
Whole Loan Interest Earned $ 775 $ 369 $ 121 $ 26 N/A
Average Loan Rate 6.43% 6.11% 5.56% 4.73% N/A
Multifamily Whole Loans Percentage 100% 100% 100% 100% N/A
MLPB REVENUE BOND COVERAGE (DEBT SERVICE COVERAGE RATIO)(1)(2)
Total Debt Service $ 7,601 $ 5,581 $ 2,635 $ 763 N/A
Net Revenue to Pay Debt Service(3) $ 7,601 $ 5,581 $ 2,635 $ 763 N/A
Debt Service Coverage Ratio 100% 100% 100% 100% N/A
* Limited Obligation Indenture, indenture contains no whole loans, and revenue is generated solely from investments and pass-through securities. Paid off in full on February 1, 2017. The debt service requirements information was obtained from Agency's debt service management system. (1) Coverage Ratio fluctuate significantly due to differences for collecting the revenue in earlier periods compared to the actual debt service payments.(2) Fiscal Years 2009 to 2012 may show greater than usual fluctuations and shortfalls due significant challenges brought on by global and California economic conditions as well as Agency's past financial decisions to enter into interest rate swap agreements and heavy use of variable rate bonds.(3) Sources of Revenue Include: Mortgage Loan Repayment, Mortgage Loan Interest Earnings, Mortgage Back Security Payments, and Investment Interest Earnings.
Qualified mortgage revenue bonds are structured in such a way that both mortgage loan repayments and gross revenues are used for bond repayment. Accordingly, to achieve adequate debt service coverage, mortgage loan repayments must be considered. Due to the nature of qualified mortgage revenue bonds, the Fund's bond resolutions and indentures do not have required bond coverage percentages. The above information is provided for general information purposes only. Net position is netted with deferred inflows in the above information.
DEBT SERVICE CAPACITY LAST TEN FISCAL YEARS
MLPB Debt Service Coverage Ratio
2008 2009 2010 2011 2012 2013 2014 2015 2016 201799.00%
100.00%
101.00%
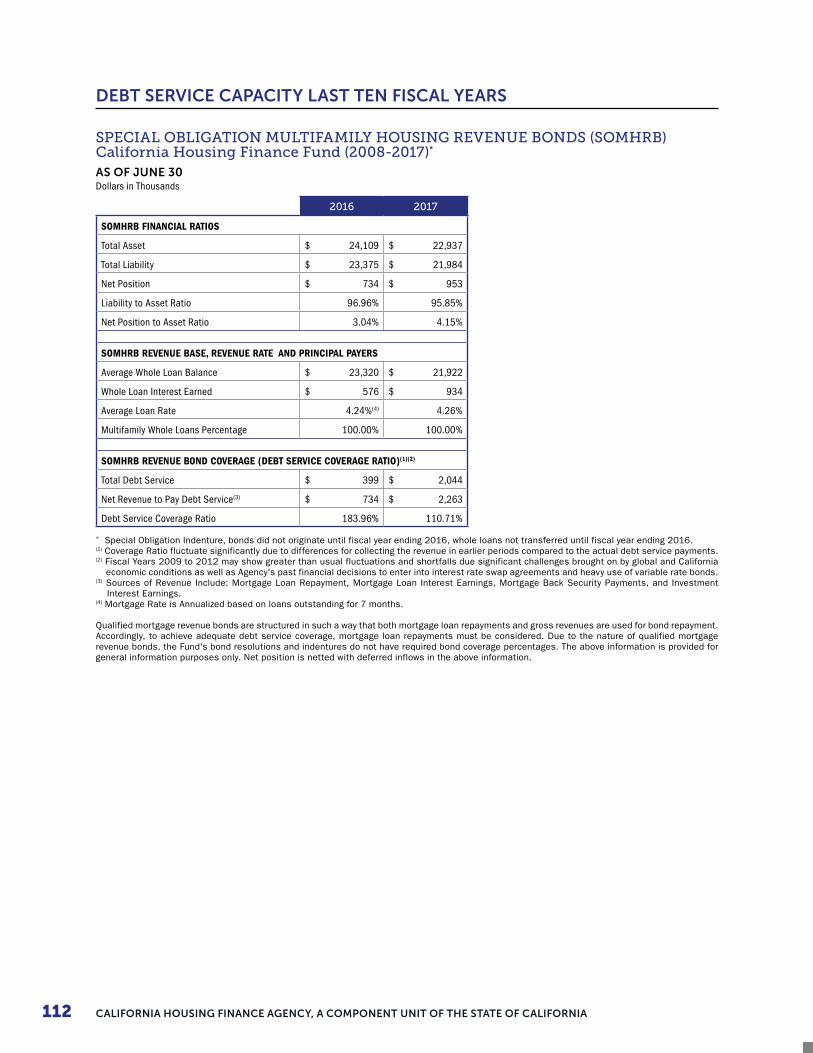
CALIFORNIA HOUSING FINANCE AGENCY, A COMPONENT UNIT OF THE STATE OF CALIFORNIA112
SPECIAL OBLIGATION MULTIFAMILY HOUSING REVENUE BONDS (SOMHRB)
California Housing Finance Fund (2008-2017)*
AS OF JUNE 30Dollars in Thousands
2016 2017
SOMHRB FINANCIAL RATIOS
Total Asset $ 24,109 $ 22,937
Total Liability $ 23,375 $ 21,984
Net Position $ 734 $ 953
Liability to Asset Ratio 96.96% 95.85%
Net Position to Asset Ratio 3.04% 4.15%
SOMHRB REVENUE BASE, REVENUE RATE AND PRINCIPAL PAYERS
Average Whole Loan Balance $ 23,320 $ 21,922
Whole Loan Interest Earned $ 576 $ 934
Average Loan Rate 4.24%(4) 4.26%
Multifamily Whole Loans Percentage 100.00% 100.00%
SOMHRB REVENUE BOND COVERAGE (DEBT SERVICE COVERAGE RATIO)(1)(2)
Total Debt Service $ 399 $ 2,044
Net Revenue to Pay Debt Service(3) $ 734 $ 2,263
Debt Service Coverage Ratio 183.96% 110.71%
* Special Obligation Indenture, bonds did not originate until fiscal year ending 2016, whole loans not transferred until fiscal year ending 2016.(1) Coverage Ratio fluctuate significantly due to differences for collecting the revenue in earlier periods compared to the actual debt service payments.(2) Fiscal Years 2009 to 2012 may show greater than usual fluctuations and shortfalls due significant challenges brought on by global and California economic conditions as well as Agency's past financial decisions to enter into interest rate swap agreements and heavy use of variable rate bonds.(3) Sources of Revenue Include: Mortgage Loan Repayment, Mortgage Loan Interest Earnings, Mortgage Back Security Payments, and Investment Interest Earnings.(4) Mortgage Rate is Annualized based on loans outstanding for 7 months.
Qualified mortgage revenue bonds are structured in such a way that both mortgage loan repayments and gross revenues are used for bond repayment. Accordingly, to achieve adequate debt service coverage, mortgage loan repayments must be considered. Due to the nature of qualified mortgage revenue bonds, the Fund's bond resolutions and indentures do not have required bond coverage percentages. The above information is provided for general information purposes only. Net position is netted with deferred inflows in the above information.
DEBT SERVICE CAPACITY LAST TEN FISCAL YEARS

113COMPREHENSIVE ANNUAL FINANCIAL REPORT FOR THE FISCAL YEARS ENDED JUNE 30, 2017 AND JUNE 30, 2O16
Statistical Section
2008 2009 2010 2011 2012 2013 2014 2015 2016 2017
LIABILITY TO ASSET RATIO NET POSITION TO ASSET RATIO
SOMHRB Financial Ratios
0%
20%
40%
60%
80%
100%
120%
SOMHRB Debt Service Coverage Ratio
2008 2009 2010 2011 2012 2013 2014 2015 2016 20170%
100%
200%
SPECIAL OBLIGATION MULTIFAMILY HOUSING REVENUE BONDS (SOMHRB) California Housing Finance Fund (2008-2017)*
AS OF JUNE 30
DEBT SERVICE CAPACITY LAST TEN FISCAL YEARS

CALIFORNIA HOUSING FINANCE AGENCY, A COMPONENT UNIT OF THE STATE OF CALIFORNIA114
MULTIFAMILY HOUSING REVENUE BONDS (MHRB)
California Housing Finance Fund (2008-2017)*
AS OF JUNE 30 Dollars in Thousands
2016 2017
MHRB FINANCIAL RATIOS
Total Asset $ 41,195 $ 37,954
Total Liability $ 39,965 $ 36,143
Net Position $ 1,230 $ 1,811
Liability to Asset Ratio 97.01% 95.23%
Net Position to Asset Ratio 2.99% 4.77%
MHRB REVENUE BASE, REVENUE RATE AND PRINCIPAL PAYERS
Average Whole Loan Balance $ 39,600 $ 35,701
Whole Loan Interest Earned $ 709 $ 1,696
Average Loan Rate 4.29%(4) 4.75%
Multifamily Whole Loans Percentage 100.00% 100.00%
MHRB REVENUE BOND COVERAGE (DEBT SERVICE COVERAGE RATIO)(1)(2)
Total Debt Service $ 364 $ 4,944
Net Revenue to Pay Debt Service(3) $ 1,230 $ 5,524
Debt Service Coverage Ratio 337.91% 111.73%
* Special Obligation Indenture, bonds did not originate until fiscal year ending 2016, whole loans not transferred until fiscal year ending 2016.(1) Coverage Ratio fluctuate significantly due to differences for collecting the revenue in earlier periods compared to the actual debt service payments.(2) Fiscal Years 2009 to 2012 may show greater than usual fluctuations and shortfalls due significant challenges brought on by global and California economic conditions as well as Agency's past financial decisions to enter into interest rate swap agreements and heavy use of variable rate bonds.(3) Sources of Revenue Include: Mortgage Loan Repayment, Mortgage Loan Interest Earnings, Mortgage Back Security Payments, and Investment Interest Earnings.(4) Mortgage Rate is Annualized based on loans outstanding for 5 months.
Qualified mortgage revenue bonds are structured in such a way that both mortgage loan repayments and gross revenues are used for bond repayment. Accordingly, to achieve adequate debt service coverage, mortgage loan repayments must be considered. Due to the nature of qualified mortgage revenue bonds, the Fund's bond resolutions and indentures do not have required bond coverage percentages. The above information is provided for general information purposes only. Net position is netted with deferred inflows in the above information.
DEBT SERVICE CAPACITY LAST TEN FISCAL YEARS
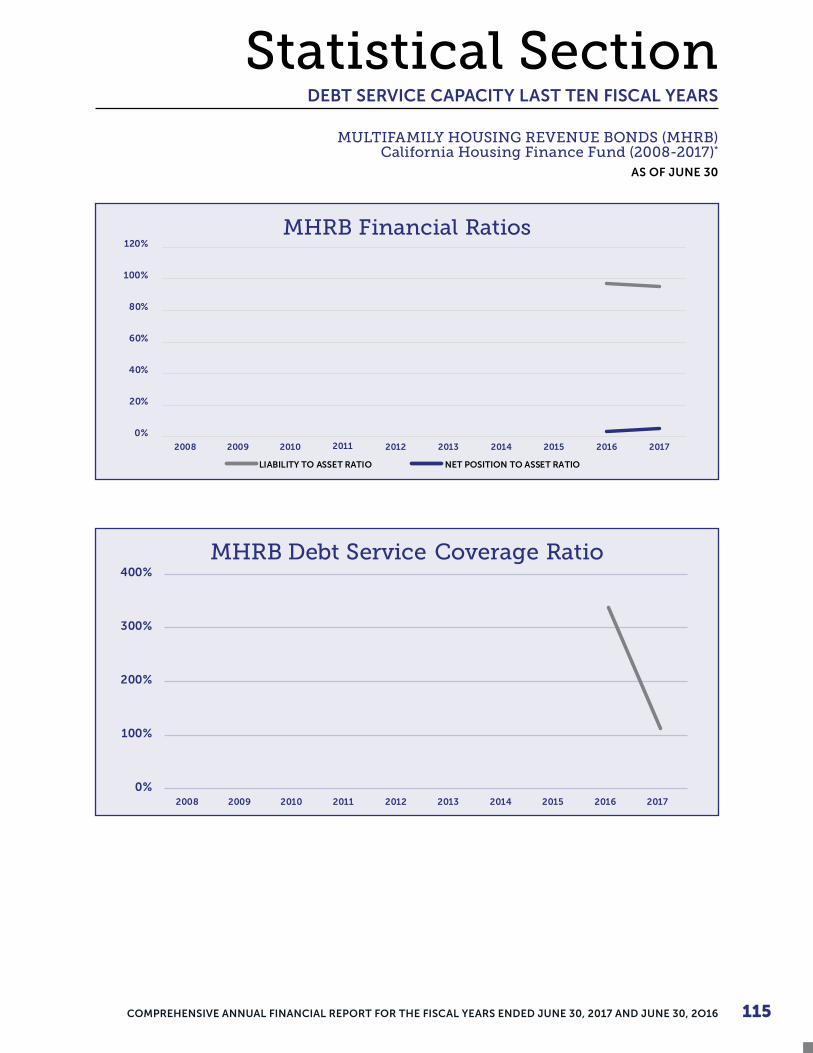
115COMPREHENSIVE ANNUAL FINANCIAL REPORT FOR THE FISCAL YEARS ENDED JUNE 30, 2017 AND JUNE 30, 2O16
Statistical Section
2008 2009 2010 2011 2012 2013 2014 2015 2016 2017
LIABILITY TO ASSET RATIO NET POSITION TO ASSET RATIO
MHRB Financial Ratios
0%
20%
40%
60%
80%
100%
120%
MHRB Debt Service Coverage Ratio
2008 2009 2010 2011 2012 2013 2014 2015 2016 2017
0%
100%
200%
300%
400%
MULTIFAMILY HOUSING REVENUE BONDS (MHRB) California Housing Finance Fund (2008-2017)*
AS OF JUNE 30
DEBT SERVICE CAPACITY LAST TEN FISCAL YEARS
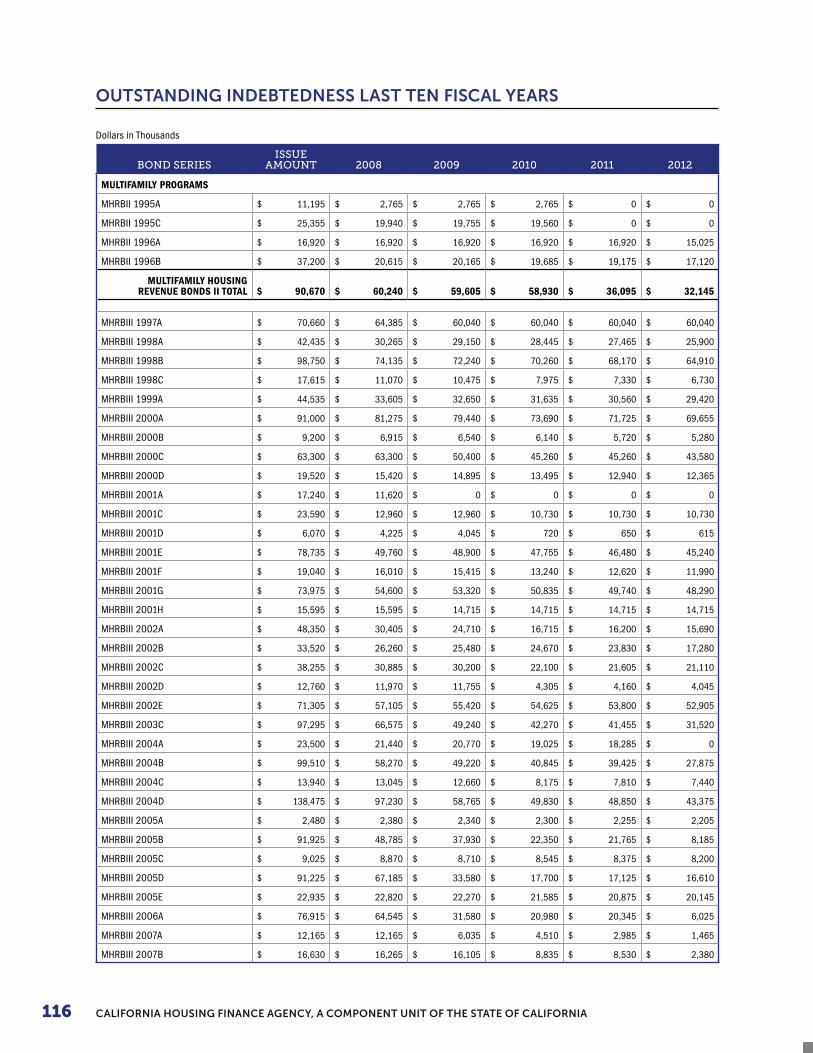
CALIFORNIA HOUSING FINANCE AGENCY, A COMPONENT UNIT OF THE STATE OF CALIFORNIA116
Dollars in Thousands
BOND SERIESISSUE
AMOUNT 2008 2009 2010 2011 2012
MULTIFAMILY PROGRAMS
MHRBII 1995A $ 11,195 $ 2,765 $ 2,765 $ 2,765 $ 0 $ 0
MHRBII 1995C $ 25,355 $ 19,940 $ 19,755 $ 19,560 $ 0 $ 0
MHRBII 1996A $ 16,920 $ 16,920 $ 16,920 $ 16,920 $ 16,920 $ 15,025
MHRBII 1996B $ 37,200 $ 20,615 $ 20,165 $ 19,685 $ 19,175 $ 17,120
MULTIFAMILY HOUSING REVENUE BONDS II TOTAL $ 90,670 $ 60,240 $ 59,605 $ 58,930 $ 36,095 $ 32,145
MHRBIII 1997A $ 70,660 $ 64,385 $ 60,040 $ 60,040 $ 60,040 $ 60,040
MHRBIII 1998A $ 42,435 $ 30,265 $ 29,150 $ 28,445 $ 27,465 $ 25,900
MHRBIII 1998B $ 98,750 $ 74,135 $ 72,240 $ 70,260 $ 68,170 $ 64,910
MHRBIII 1998C $ 17,615 $ 11,070 $ 10,475 $ 7,975 $ 7,330 $ 6,730
MHRBIII 1999A $ 44,535 $ 33,605 $ 32,650 $ 31,635 $ 30,560 $ 29,420
MHRBIII 2000A $ 91,000 $ 81,275 $ 79,440 $ 73,690 $ 71,725 $ 69,655
MHRBIII 2000B $ 9,200 $ 6,915 $ 6,540 $ 6,140 $ 5,720 $ 5,280
MHRBIII 2000C $ 63,300 $ 63,300 $ 50,400 $ 45,260 $ 45,260 $ 43,580
MHRBIII 2000D $ 19,520 $ 15,420 $ 14,895 $ 13,495 $ 12,940 $ 12,365
MHRBIII 2001A $ 17,240 $ 11,620 $ 0 $ 0 $ 0 $ 0
MHRBIII 2001C $ 23,590 $ 12,960 $ 12,960 $ 10,730 $ 10,730 $ 10,730
MHRBIII 2001D $ 6,070 $ 4,225 $ 4,045 $ 720 $ 650 $ 615
MHRBIII 2001E $ 78,735 $ 49,760 $ 48,900 $ 47,755 $ 46,480 $ 45,240
MHRBIII 2001F $ 19,040 $ 16,010 $ 15,415 $ 13,240 $ 12,620 $ 11,990
MHRBIII 2001G $ 73,975 $ 54,600 $ 53,320 $ 50,835 $ 49,740 $ 48,290
MHRBIII 2001H $ 15,595 $ 15,595 $ 14,715 $ 14,715 $ 14,715 $ 14,715
MHRBIII 2002A $ 48,350 $ 30,405 $ 24,710 $ 16,715 $ 16,200 $ 15,690
MHRBIII 2002B $ 33,520 $ 26,260 $ 25,480 $ 24,670 $ 23,830 $ 17,280
MHRBIII 2002C $ 38,255 $ 30,885 $ 30,200 $ 22,100 $ 21,605 $ 21,110
MHRBIII 2002D $ 12,760 $ 11,970 $ 11,755 $ 4,305 $ 4,160 $ 4,045
MHRBIII 2002E $ 71,305 $ 57,105 $ 55,420 $ 54,625 $ 53,800 $ 52,905
MHRBIII 2003C $ 97,295 $ 66,575 $ 49,240 $ 42,270 $ 41,455 $ 31,520
MHRBIII 2004A $ 23,500 $ 21,440 $ 20,770 $ 19,025 $ 18,285 $ 0
MHRBIII 2004B $ 99,510 $ 58,270 $ 49,220 $ 40,845 $ 39,425 $ 27,875
MHRBIII 2004C $ 13,940 $ 13,045 $ 12,660 $ 8,175 $ 7,810 $ 7,440
MHRBIII 2004D $ 138,475 $ 97,230 $ 58,765 $ 49,830 $ 48,850 $ 43,375
MHRBIII 2005A $ 2,480 $ 2,380 $ 2,340 $ 2,300 $ 2,255 $ 2,205
MHRBIII 2005B $ 91,925 $ 48,785 $ 37,930 $ 22,350 $ 21,765 $ 8,185
MHRBIII 2005C $ 9,025 $ 8,870 $ 8,710 $ 8,545 $ 8,375 $ 8,200
MHRBIII 2005D $ 91,225 $ 67,185 $ 33,580 $ 17,700 $ 17,125 $ 16,610
MHRBIII 2005E $ 22,935 $ 22,820 $ 22,270 $ 21,585 $ 20,875 $ 20,145
MHRBIII 2006A $ 76,915 $ 64,545 $ 31,580 $ 20,980 $ 20,345 $ 6,025
MHRBIII 2007A $ 12,165 $ 12,165 $ 6,035 $ 4,510 $ 2,985 $ 1,465
MHRBIII 2007B $ 16,630 $ 16,265 $ 16,105 $ 8,835 $ 8,530 $ 2,380
OUTSTANDING INDEBTEDNESS LAST TEN FISCAL YEARS
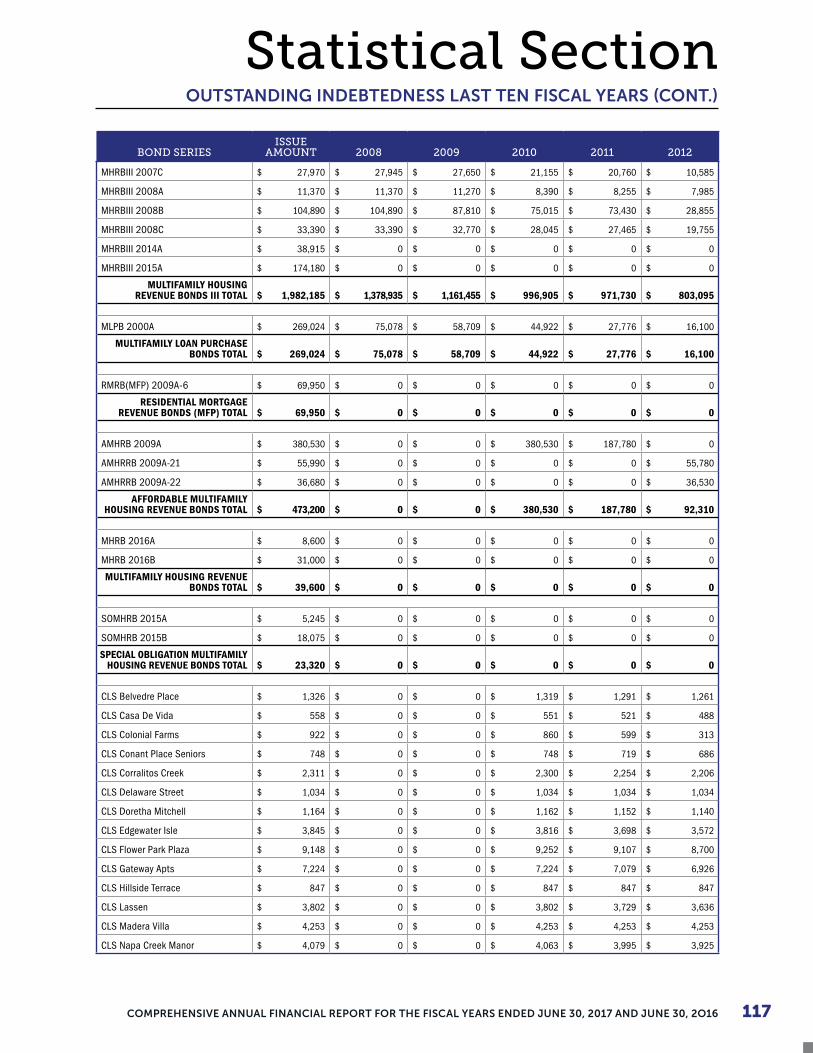
117COMPREHENSIVE ANNUAL FINANCIAL REPORT FOR THE FISCAL YEARS ENDED JUNE 30, 2017 AND JUNE 30, 2O16
Statistical Section
BOND SERIESISSUE
AMOUNT 2008 2009 2010 2011 2012
MHRBIII 2007C $ 27,970 $ 27,945 $ 27,650 $ 21,155 $ 20,760 $ 10,585
MHRBIII 2008A $ 11,370 $ 11,370 $ 11,270 $ 8,390 $ 8,255 $ 7,985
MHRBIII 2008B $ 104,890 $ 104,890 $ 87,810 $ 75,015 $ 73,430 $ 28,855
MHRBIII 2008C $ 33,390 $ 33,390 $ 32,770 $ 28,045 $ 27,465 $ 19,755
MHRBIII 2014A $ 38,915 $ 0 $ 0 $ 0 $ 0 $ 0
MHRBIII 2015A $ 174,180 $ 0 $ 0 $ 0 $ 0 $ 0
MULTIFAMILY HOUSING REVENUE BONDS III TOTAL $ 1,982,185 $ 1,378,935 $ 1,161,455 $ 996,905 $ 971,730 $ 803,095
MLPB 2000A $ 269,024 $ 75,078 $ 58,709 $ 44,922 $ 27,776 $ 16,100
MULTIFAMILY LOAN PURCHASE BONDS TOTAL $ 269,024 $ 75,078 $ 58,709 $ 44,922 $ 27,776 $ 16,100
RMRB(MFP) 2009A-6 $ 69,950 $ 0 $ 0 $ 0 $ 0 $ 0
RESIDENTIAL MORTGAGE REVENUE BONDS (MFP) TOTAL $ 69,950 $ 0 $ 0 $ 0 $ 0 $ 0
AMHRB 2009A $ 380,530 $ 0 $ 0 $ 380,530 $ 187,780 $ 0
AMHRRB 2009A-21 $ 55,990 $ 0 $ 0 $ 0 $ 0 $ 55,780
AMHRRB 2009A-22 $ 36,680 $ 0 $ 0 $ 0 $ 0 $ 36,530
AFFORDABLE MULTIFAMILY HOUSING REVENUE BONDS TOTAL $ 473,200 $ 0 $ 0 $ 380,530 $ 187,780 $ 92,310
MHRB 2016A $ 8,600 $ 0 $ 0 $ 0 $ 0 $ 0
MHRB 2016B $ 31,000 $ 0 $ 0 $ 0 $ 0 $ 0
MULTIFAMILY HOUSING REVENUE BONDS TOTAL $ 39,600 $ 0 $ 0 $ 0 $ 0 $ 0
SOMHRB 2015A $ 5,245 $ 0 $ 0 $ 0 $ 0 $ 0
SOMHRB 2015B $ 18,075 $ 0 $ 0 $ 0 $ 0 $ 0
SPECIAL OBLIGATION MULTIFAMILY HOUSING REVENUE BONDS TOTAL $ 23,320 $ 0 $ 0 $ 0 $ 0 $ 0
CLS Belvedre Place $ 1,326 $ 0 $ 0 $ 1,319 $ 1,291 $ 1,261
CLS Casa De Vida $ 558 $ 0 $ 0 $ 551 $ 521 $ 488
CLS Colonial Farms $ 922 $ 0 $ 0 $ 860 $ 599 $ 313
CLS Conant Place Seniors $ 748 $ 0 $ 0 $ 748 $ 719 $ 686
CLS Corralitos Creek $ 2,311 $ 0 $ 0 $ 2,300 $ 2,254 $ 2,206
CLS Delaware Street $ 1,034 $ 0 $ 0 $ 1,034 $ 1,034 $ 1,034
CLS Doretha Mitchell $ 1,164 $ 0 $ 0 $ 1,162 $ 1,152 $ 1,140
CLS Edgewater Isle $ 3,845 $ 0 $ 0 $ 3,816 $ 3,698 $ 3,572
CLS Flower Park Plaza $ 9,148 $ 0 $ 0 $ 9,252 $ 9,107 $ 8,700
CLS Gateway Apts $ 7,224 $ 0 $ 0 $ 7,224 $ 7,079 $ 6,926
CLS Hillside Terrace $ 847 $ 0 $ 0 $ 847 $ 847 $ 847
CLS Lassen $ 3,802 $ 0 $ 0 $ 3,802 $ 3,729 $ 3,636
CLS Madera Villa $ 4,253 $ 0 $ 0 $ 4,253 $ 4,253 $ 4,253
CLS Napa Creek Manor $ 4,079 $ 0 $ 0 $ 4,063 $ 3,995 $ 3,925
OUTSTANDING INDEBTEDNESS LAST TEN FISCAL YEARS (CONT.)

CALIFORNIA HOUSING FINANCE AGENCY, A COMPONENT UNIT OF THE STATE OF CALIFORNIA118
BOND SERIESISSUE
AMOUNT 2008 2009 2010 2011 2012
CLS Padre Apartments $ 2,451 $ 0 $ 0 $ 2,419 $ 2,285 $ 2,141
CLS Pickleweed Apts $ 1,550 $ 0 $ 0 $ 1,541 $ 1,502 $ 1,460
CLS Plaza Del Sol $ 7,528 $ 0 $ 0 $ 7,528 $ 7,528 $ 7,528
CLS Redwood Court $ 1,252 $ 0 $ 0 $ 1,246 $ 1,223 $ 1,197
CLS Redwood Oaks $ 1,585 $ 0 $ 0 $ 1,576 $ 1,538 $ 1,499
CLS South Delaware $ 752 $ 0 $ 0 $ 748 $ 735 $ 721
CLS Sullivan Manor $ 2,538 $ 0 $ 0 $ 2,514 $ 2,415 $ 2,307
CLS Via Del Mar $ 787 $ 0 $ 0 $ 787 $ 766 $ 744
CLS Villa Anaheim $ 3,176 $ 0 $ 0 $ 3,176 $ 3,176 $ 3,176
CLS Villa Cesar Chavez $ 2,811 $ 0 $ 0 $ 2,811 $ 2,714 $ 2,603
CLS Villa Madera $ 4,082 $ 0 $ 0 $ 4,053 $ 3,929 $ 3,799
CLS Warwick Square $ 13,357 $ 0 $ 0 $ 13,357 $ 13,357 $ 13,357
CLS Woodbridge $ 665 $ 0 $ 0 $ 652 $ 597 $ 537
TAX EXEMPT NOTE (CITIBANK N.A LOAN SALE) TOTAL $ 83,794 $ 0 $ 0 $ 83,638 $ 82,044 $ 80,057
ClS Conant Place Seniors T $ 758 $ 0 $ 0 $ 3 $ 0 $ 0
CLS Delaware Street T $ 1,243 $ 0 $ 0 $ 203 $ 176 $ 148
CLS Hillside Terrace T $ 922 $ 0 $ 0 $ 69 $ 46 $ 22
CLS Lassen T $ 4,181 $ 0 $ 0 $ 355 $ 334 $ 327
CLS lower Park Plaza T $ 335 $ 0 $ 0 $ 253 $ 0 $ 0
CLS Madera Villa T $ 330 $ 0 $ 0 $ 308 $ 218 $ 121
CLS Plaza Del Sol T $ 8,012 $ 0 $ 0 $ 465 $ 388 $ 306
CLS Redwood Court T $ 1,939 $ 0 $ 0 $ 683 $ 670 $ 656
CLS Thomas Pain $ 5,137 $ 0 $ 0 $ 5,137 $ 5,077 $ 4,951
CLS Thomas Pain T $ 6,087 $ 0 $ 0 $ 917 $ 839 $ 818
CLS Villa Anaheim T $ 346 $ 0 $ 0 $ 324 $ 229 $ 127
CLS Villa Cesar Chavez T $ 2,846 $ 0 $ 0 $ 9 $ 0 $ 0
CLS Warwick Square T $ 15,091 $ 0 $ 0 $ 1,489 $ 958 $ 395
CITIBANK N.A TAXABLE NOTE TOTAL $ 47,227 $ 0 $ 0 $ 10,215 $ 8,935 $ 7,870
SINGLE FAMILY PROGRAMS
HMRB 1982A $ 212,000 $ 1,825 $ 1,590 $ 1,325 $ 1,030 $ 0
HMRB 1982B $ 101,775 $ 575 $ 500 $ 415 $ 320 $ 0
HMRB 1983A $ 227,000 $ 17,844 $ 16,725 $ 15,406 $ 12,913 $ 0
HMRB 1983B $ 85,000 $ 3,816 $ 3,462 $ 3,066 $ 2,635 $ 0
HMRB 1984B $ 121,436 $ 527 $ 487 $ 443 $ 397 $ 0
HMRB 1985A $ 200,001 $ 834 $ 844 $ 767 $ 679 $ 0
HMRB 1985B $ 125,002 $ 3,475 $ 3,475 $ 3,475 $ 3,475 $ 0
HMRB 1994D $ 20,600 $ 7,350 $ 0 $ 0 $ 0 $ 0
HMRB 1995I $ 20,900 $ 12,350 $ 0 $ 0 $ 0 $ 0
HMRB 1997O $ 22,085 $ 6,335 $ 5,435 $ 3,875 $ 0 $ 0
HMRB 1998F $ 85,415 $ 13,680 $ 10,990 $ 8,110 $ 0 $ 0
OUTSTANDING INDEBTEDNESS LAST TEN FISCAL YEARS (CONT.)

119COMPREHENSIVE ANNUAL FINANCIAL REPORT FOR THE FISCAL YEARS ENDED JUNE 30, 2017 AND JUNE 30, 2O16
Statistical Section
BOND SERIESISSUE
AMOUNT 2008 2009 2010 2011 2012
HMRB 1998J $ 58,200 $ 2,830 $ 1,075 $ 480 $ 0 $ 0
HMRB 1998L $ 72,690 $ 4,335 $ 0 $ 0 $ 0 $ 0
HMRB 1998M $ 100,000 $ 10,015 $ 9,490 $ 9,175 $ 7,095 $ 0
HMRB 1998S $ 50,000 $ 2,910 $ 0 $ 0 $ 0 $ 0
HMRB 1999F $ 44,001 $ 4,369 $ 4,243 $ 3,429 $ 3,343 $ 0
HMRB 1999G $ 50,000 $ 10,400 $ 8,255 $ 5,090 $ 1,745 $ 0
HMRB 1999N $ 85,000 $ 19,504 $ 18,215 $ 13,540 $ 10,713 $ 0
HMRB 1999O $ 85,000 $ 18,820 $ 14,465 $ 8,830 $ 5,360 $ 0
HMRB 2000B $ 34,515 $ 2,280 $ 2,340 $ 2,119 $ 0 $ 0
HMRB 2000D $ 85,000 $ 32,660 $ 28,085 $ 26,060 $ 23,895 $ 0
HMRB 2000H $ 120,000 $ 28,080 $ 26,960 $ 26,960 $ 24,285 $ 20,680
HMRB 2000J $ 36,460 $ 26,365 $ 25,130 $ 15,800 $ 0 $ 0
HMRB 2000K $ 120,000 $ 62,550 $ 8,925 $ 0 $ 0 $ 0
HMRB 2000N $ 50,000 $ 29,915 $ 29,075 $ 28,190 $ 23,940 $ 20,500
HMRB 2000V $ 102,000 $ 49,035 $ 46,640 $ 46,350 $ 43,905 $ 35,895
HMRB 2000X1 $ 21,085 $ 3,975 $ 0 $ 0 $ 0 $ 0
HMRB 2000X2 $ 36,445 $ 32,280 $ 29,740 $ 23,190 $ 19,220 $ 11,150
HMRB 2000Z $ 102,000 $ 48,810 $ 40,915 $ 40,915 $ 40,915 $ 38,330
HMRB 2001C $ 12,070 $ 6,105 $ 0 $ 0 $ 0 $ 0
HMRB 2001D $ 112,000 $ 65,640 $ 64,700 $ 62,485 $ 59,040 $ 48,750
HMRB 2001G $ 105,000 $ 53,085 $ 51,310 $ 51,310 $ 48,945 $ 42,235
HMRB 2001J $ 86,300 $ 47,425 $ 45,400 $ 41,170 $ 38,135 $ 27,420
HMRB 2001K $ 144,000 $ 68,950 $ 67,105 $ 59,895 $ 53,190 $ 47,105
HMRB 2001N $ 19,835 $ 13,690 $ 0 $ 0 $ 0 $ 0
HMRB 2001O $ 126,000 $ 68,455 $ 65,535 $ 65,535 $ 65,535 $ 53,065
HMRB 2001R $ 25,280 $ 18,940 $ 0 $ 0 $ 0 $ 0
HMRB 2001S $ 80,745 $ 46,945 $ 44,895 $ 44,895 $ 44,320 $ 37,080
HMRB 2001U $ 116,050 $ 53,620 $ 52,350 $ 49,610 $ 47,325 $ 37,225
HMRB 2001V $ 66,000 $ 22,655 $ 16,345 $ 16,345 $ 16,345 $ 15,795
HMRB 2002A $ 33,000 $ 115 $ 0 $ 0 $ 0 $ 0
HMRB 2002B $ 49,500 $ 43,020 $ 40,950 $ 39,170 $ 37,705 $ 32,895
HMRB 2002C $ 82,500 $ 39,140 $ 37,225 $ 36,760 $ 32,735 $ 26,930
HMRB 2002D $ 88,000 $ 34,665 $ 33,350 $ 33,350 $ 32,095 $ 25,405
HMRB 2002F $ 70,000 $ 49,495 $ 48,045 $ 0 $ 0 $ 0
HMRB 2002H $ 70,000 $ 26,690 $ 23,935 $ 23,935 $ 22,610 $ 18,265
HMRB 2002J $ 103,570 $ 84,565 $ 81,415 $ 76,425 $ 72,695 $ 63,100
HMRB 2002L $ 59,500 $ 27,360 $ 24,710 $ 24,710 $ 24,710 $ 21,590
HMRB 2002M $ 95,680 $ 77,160 $ 75,995 $ 74,155 $ 66,630 $ 47,540
HMRB 2002O $ 56,000 $ 24,845 $ 23,550 $ 23,550 $ 21,370 $ 19,065
HMRB 2002P $ 61,000 $ 57,015 $ 0 $ 0 $ 0 $ 0
HMRB 2002Q $ 41,600 $ 20,415 $ 20,225 $ 12,975 $ 10,365 $ 5,030
HMRB 2002U $ 101,295 $ 77,340 $ 76,980 $ 69,160 $ 58,740 $ 52,260
OUTSTANDING INDEBTEDNESS LAST TEN FISCAL YEARS (CONT.)
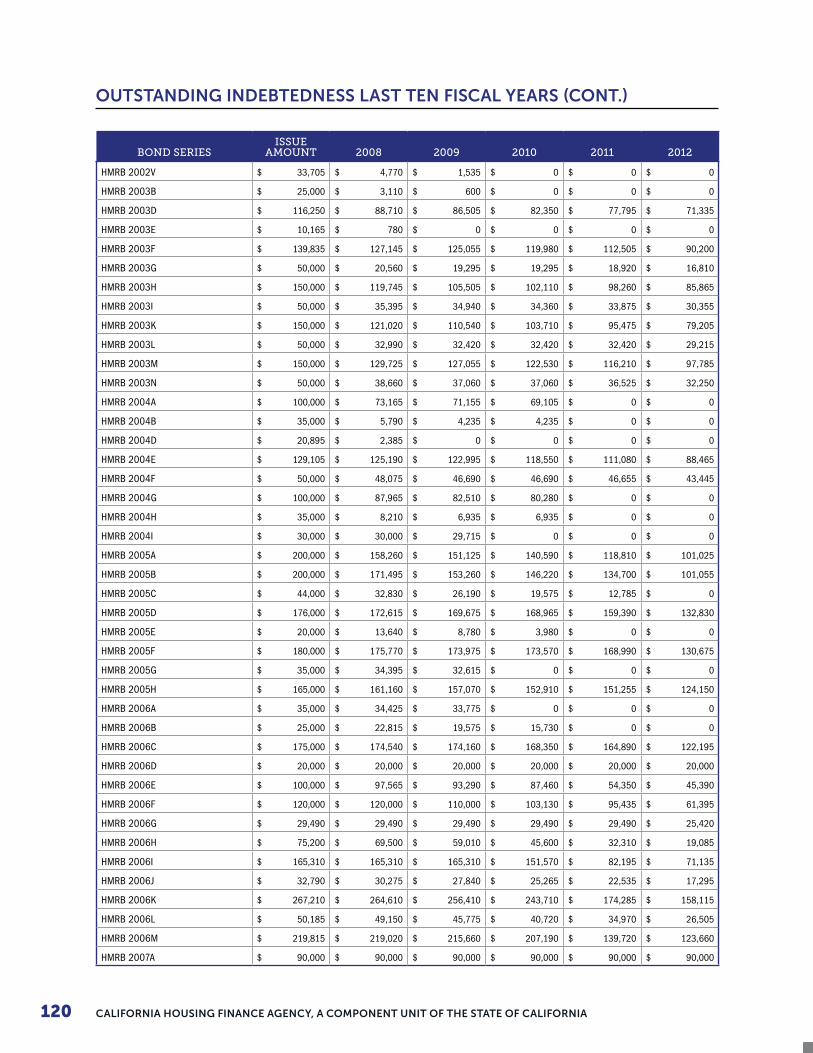
CALIFORNIA HOUSING FINANCE AGENCY, A COMPONENT UNIT OF THE STATE OF CALIFORNIA120
BOND SERIESISSUE
AMOUNT 2008 2009 2010 2011 2012
HMRB 2002V $ 33,705 $ 4,770 $ 1,535 $ 0 $ 0 $ 0
HMRB 2003B $ 25,000 $ 3,110 $ 600 $ 0 $ 0 $ 0
HMRB 2003D $ 116,250 $ 88,710 $ 86,505 $ 82,350 $ 77,795 $ 71,335
HMRB 2003E $ 10,165 $ 780 $ 0 $ 0 $ 0 $ 0
HMRB 2003F $ 139,835 $ 127,145 $ 125,055 $ 119,980 $ 112,505 $ 90,200
HMRB 2003G $ 50,000 $ 20,560 $ 19,295 $ 19,295 $ 18,920 $ 16,810
HMRB 2003H $ 150,000 $ 119,745 $ 105,505 $ 102,110 $ 98,260 $ 85,865
HMRB 2003I $ 50,000 $ 35,395 $ 34,940 $ 34,360 $ 33,875 $ 30,355
HMRB 2003K $ 150,000 $ 121,020 $ 110,540 $ 103,710 $ 95,475 $ 79,205
HMRB 2003L $ 50,000 $ 32,990 $ 32,420 $ 32,420 $ 32,420 $ 29,215
HMRB 2003M $ 150,000 $ 129,725 $ 127,055 $ 122,530 $ 116,210 $ 97,785
HMRB 2003N $ 50,000 $ 38,660 $ 37,060 $ 37,060 $ 36,525 $ 32,250
HMRB 2004A $ 100,000 $ 73,165 $ 71,155 $ 69,105 $ 0 $ 0
HMRB 2004B $ 35,000 $ 5,790 $ 4,235 $ 4,235 $ 0 $ 0
HMRB 2004D $ 20,895 $ 2,385 $ 0 $ 0 $ 0 $ 0
HMRB 2004E $ 129,105 $ 125,190 $ 122,995 $ 118,550 $ 111,080 $ 88,465
HMRB 2004F $ 50,000 $ 48,075 $ 46,690 $ 46,690 $ 46,655 $ 43,445
HMRB 2004G $ 100,000 $ 87,965 $ 82,510 $ 80,280 $ 0 $ 0
HMRB 2004H $ 35,000 $ 8,210 $ 6,935 $ 6,935 $ 0 $ 0
HMRB 2004I $ 30,000 $ 30,000 $ 29,715 $ 0 $ 0 $ 0
HMRB 2005A $ 200,000 $ 158,260 $ 151,125 $ 140,590 $ 118,810 $ 101,025
HMRB 2005B $ 200,000 $ 171,495 $ 153,260 $ 146,220 $ 134,700 $ 101,055
HMRB 2005C $ 44,000 $ 32,830 $ 26,190 $ 19,575 $ 12,785 $ 0
HMRB 2005D $ 176,000 $ 172,615 $ 169,675 $ 168,965 $ 159,390 $ 132,830
HMRB 2005E $ 20,000 $ 13,640 $ 8,780 $ 3,980 $ 0 $ 0
HMRB 2005F $ 180,000 $ 175,770 $ 173,975 $ 173,570 $ 168,990 $ 130,675
HMRB 2005G $ 35,000 $ 34,395 $ 32,615 $ 0 $ 0 $ 0
HMRB 2005H $ 165,000 $ 161,160 $ 157,070 $ 152,910 $ 151,255 $ 124,150
HMRB 2006A $ 35,000 $ 34,425 $ 33,775 $ 0 $ 0 $ 0
HMRB 2006B $ 25,000 $ 22,815 $ 19,575 $ 15,730 $ 0 $ 0
HMRB 2006C $ 175,000 $ 174,540 $ 174,160 $ 168,350 $ 164,890 $ 122,195
HMRB 2006D $ 20,000 $ 20,000 $ 20,000 $ 20,000 $ 20,000 $ 20,000
HMRB 2006E $ 100,000 $ 97,565 $ 93,290 $ 87,460 $ 54,350 $ 45,390
HMRB 2006F $ 120,000 $ 120,000 $ 110,000 $ 103,130 $ 95,435 $ 61,395
HMRB 2006G $ 29,490 $ 29,490 $ 29,490 $ 29,490 $ 29,490 $ 25,420
HMRB 2006H $ 75,200 $ 69,500 $ 59,010 $ 45,600 $ 32,310 $ 19,085
HMRB 2006I $ 165,310 $ 165,310 $ 165,310 $ 151,570 $ 82,195 $ 71,135
HMRB 2006J $ 32,790 $ 30,275 $ 27,840 $ 25,265 $ 22,535 $ 17,295
HMRB 2006K $ 267,210 $ 264,610 $ 256,410 $ 243,710 $ 174,285 $ 158,115
HMRB 2006L $ 50,185 $ 49,150 $ 45,775 $ 40,720 $ 34,970 $ 26,505
HMRB 2006M $ 219,815 $ 219,020 $ 215,660 $ 207,190 $ 139,720 $ 123,660
HMRB 2007A $ 90,000 $ 90,000 $ 90,000 $ 90,000 $ 90,000 $ 90,000
OUTSTANDING INDEBTEDNESS LAST TEN FISCAL YEARS (CONT.)
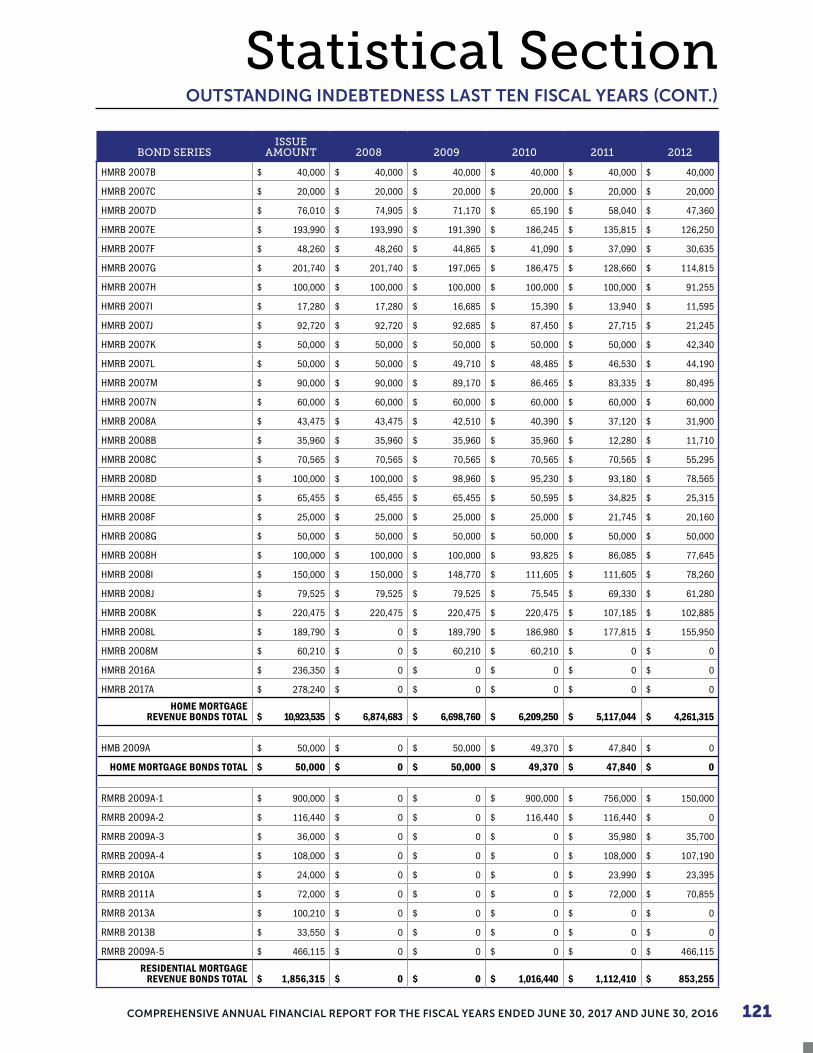
121COMPREHENSIVE ANNUAL FINANCIAL REPORT FOR THE FISCAL YEARS ENDED JUNE 30, 2017 AND JUNE 30, 2O16
Statistical Section
BOND SERIESISSUE
AMOUNT 2008 2009 2010 2011 2012
HMRB 2007B $ 40,000 $ 40,000 $ 40,000 $ 40,000 $ 40,000 $ 40,000
HMRB 2007C $ 20,000 $ 20,000 $ 20,000 $ 20,000 $ 20,000 $ 20,000
HMRB 2007D $ 76,010 $ 74,905 $ 71,170 $ 65,190 $ 58,040 $ 47,360
HMRB 2007E $ 193,990 $ 193,990 $ 191,390 $ 186,245 $ 135,815 $ 126,250
HMRB 2007F $ 48,260 $ 48,260 $ 44,865 $ 41,090 $ 37,090 $ 30,635
HMRB 2007G $ 201,740 $ 201,740 $ 197,065 $ 186,475 $ 128,660 $ 114,815
HMRB 2007H $ 100,000 $ 100,000 $ 100,000 $ 100,000 $ 100,000 $ 91,255
HMRB 2007I $ 17,280 $ 17,280 $ 16,685 $ 15,390 $ 13,940 $ 11,595
HMRB 2007J $ 92,720 $ 92,720 $ 92,685 $ 87,450 $ 27,715 $ 21,245
HMRB 2007K $ 50,000 $ 50,000 $ 50,000 $ 50,000 $ 50,000 $ 42,340
HMRB 2007L $ 50,000 $ 50,000 $ 49,710 $ 48,485 $ 46,530 $ 44,190
HMRB 2007M $ 90,000 $ 90,000 $ 89,170 $ 86,465 $ 83,335 $ 80,495
HMRB 2007N $ 60,000 $ 60,000 $ 60,000 $ 60,000 $ 60,000 $ 60,000
HMRB 2008A $ 43,475 $ 43,475 $ 42,510 $ 40,390 $ 37,120 $ 31,900
HMRB 2008B $ 35,960 $ 35,960 $ 35,960 $ 35,960 $ 12,280 $ 11,710
HMRB 2008C $ 70,565 $ 70,565 $ 70,565 $ 70,565 $ 70,565 $ 55,295
HMRB 2008D $ 100,000 $ 100,000 $ 98,960 $ 95,230 $ 93,180 $ 78,565
HMRB 2008E $ 65,455 $ 65,455 $ 65,455 $ 50,595 $ 34,825 $ 25,315
HMRB 2008F $ 25,000 $ 25,000 $ 25,000 $ 25,000 $ 21,745 $ 20,160
HMRB 2008G $ 50,000 $ 50,000 $ 50,000 $ 50,000 $ 50,000 $ 50,000
HMRB 2008H $ 100,000 $ 100,000 $ 100,000 $ 93,825 $ 86,085 $ 77,645
HMRB 2008I $ 150,000 $ 150,000 $ 148,770 $ 111,605 $ 111,605 $ 78,260
HMRB 2008J $ 79,525 $ 79,525 $ 79,525 $ 75,545 $ 69,330 $ 61,280
HMRB 2008K $ 220,475 $ 220,475 $ 220,475 $ 220,475 $ 107,185 $ 102,885
HMRB 2008L $ 189,790 $ 0 $ 189,790 $ 186,980 $ 177,815 $ 155,950
HMRB 2008M $ 60,210 $ 0 $ 60,210 $ 60,210 $ 0 $ 0
HMRB 2016A $ 236,350 $ 0 $ 0 $ 0 $ 0 $ 0
HMRB 2017A $ 278,240 $ 0 $ 0 $ 0 $ 0 $ 0
HOME MORTGAGE REVENUE BONDS TOTAL $ 10,923,535 $ 6,874,683 $ 6,698,760 $ 6,209,250 $ 5,117,044 $ 4,261,315
HMB 2009A $ 50,000 $ 0 $ 50,000 $ 49,370 $ 47,840 $ 0
HOME MORTGAGE BONDS TOTAL $ 50,000 $ 0 $ 50,000 $ 49,370 $ 47,840 $ 0
RMRB 2009A-1 $ 900,000 $ 0 $ 0 $ 900,000 $ 756,000 $ 150,000
RMRB 2009A-2 $ 116,440 $ 0 $ 0 $ 116,440 $ 116,440 $ 0
RMRB 2009A-3 $ 36,000 $ 0 $ 0 $ 0 $ 35,980 $ 35,700
RMRB 2009A-4 $ 108,000 $ 0 $ 0 $ 0 $ 108,000 $ 107,190
RMRB 2010A $ 24,000 $ 0 $ 0 $ 0 $ 23,990 $ 23,395
RMRB 2011A $ 72,000 $ 0 $ 0 $ 0 $ 72,000 $ 70,855
RMRB 2013A $ 100,210 $ 0 $ 0 $ 0 $ 0 $ 0
RMRB 2013B $ 33,550 $ 0 $ 0 $ 0 $ 0 $ 0
RMRB 2009A-5 $ 466,115 $ 0 $ 0 $ 0 $ 0 $ 466,115
RESIDENTIAL MORTGAGE REVENUE BONDS TOTAL $ 1,856,315 $ 0 $ 0 $ 1,016,440 $ 1,112,410 $ 853,255
OUTSTANDING INDEBTEDNESS LAST TEN FISCAL YEARS (CONT.)

CALIFORNIA HOUSING FINANCE AGENCY, A COMPONENT UNIT OF THE STATE OF CALIFORNIA122
BOND SERIESISSUE
AMOUNT 2008 2009 2010 2011 2012
SFMBII 1997A-1 $ 112,000 $ 6,730 $ 4,580 $ 0 $ 0 $ 0
SFMBII 1997B-1 $ 25,000 $ 3,060 $ 2,945 $ 0 $ 0 $ 0
SFMBII 1997B-3 $ 36,540 $ 7,750 $ 7,390 $ 0 $ 0 $ 0
SFMBII 1997C-1 $ 15,000 $ 1,230 $ 865 $ 0 $ 0 $ 0
SFMBII 1997C-2 $ 41,785 $ 2,260 $ 2,260 $ 0 $ 0 $ 0
SFMBII 1997C-3 $ 22,940 $ 680 $ 380 $ 0 $ 0 $ 0
SFMBII 1998A $ 15,220 $ 1,265 $ 1,180 $ 0 $ 0 $ 0
SFMBII 1998B $ 39,765 $ 540 $ 540 $ 0 $ 0 $ 0
SFMBII 1999A-2 $ 43,380 $ 7,120 $ 6,350 $ 0 $ 0 $ 0
SFMBII 1999A-3 $ 50,000 $ 1,410 $ 1,295 $ 0 $ 0 $ 0
SFMBII 1999D-2 $ 40,488 $ 1,060 $ 700 $ 0 $ 0 $ 0
SFMBII 1999D-3 $ 50,000 $ 2,785 $ 2,065 $ 0 $ 0 $ 0
SINGLE FAMILY MORTGAGE REVENUE BONDS TOTAL $ 492,118 $ 35,890 $ 30,550 $ 0 $ 0 $ 0
MULTIFAMILY/SINGLE-FAMILY PROGRAMS
HPB 2004A $ 50,000 $ 50,000 $ 31,500 $ 28,000 $ 28,000 $ 28,000
HPB 2006A $ 47,090 $ 47,090 $ 47,090 $ 47,090 $ 42,890 $ 42,890
HPB 2006B $ 61,110 $ 60,335 $ 60,335 $ 51,105 $ 51,105 $ 32,650
HOUSING PROGRAM BONDS TOTAL $ 158,200 $ 157,425 $ 138,925 $ 126,195 $ 121,995 $ 103,540
OTHER PROGRAMS AND ACCOUNTS
Federal Home Loan Bank Line of Credit $ 0 $ 0 $ 0 $ 0 $ 0 $ 0
Promissory Notes Payable - Federal Financing Bank $ 0 $ 0 $ 0 $ 0 $ 0 $ 0
Multifamily Housing Conduit Issuances(1) $ 0 $ 0 $ 10,945 $ 12,358 $ 27,985 $ 55,638
Affordable Multifamily Housing Conduit Issuances(1) $ 0 $ 0 $ 0 $ 0 $ 192,750 $ 286,000
OTHER PROGRAMS AND ACCOUNTS TOTAL $ 0 $ 0 $ 10,945 $ 12,358 $ 220,735 $ 341,638
Source: California Housing Finance Agency Debt Management System(1) Starting fiscal year 2013-14 the outstanding indebtedness does not include indebtedness associated with conduit deals.
OUTSTANDING INDEBTEDNESS LAST TEN FISCAL YEARS (CONT.)
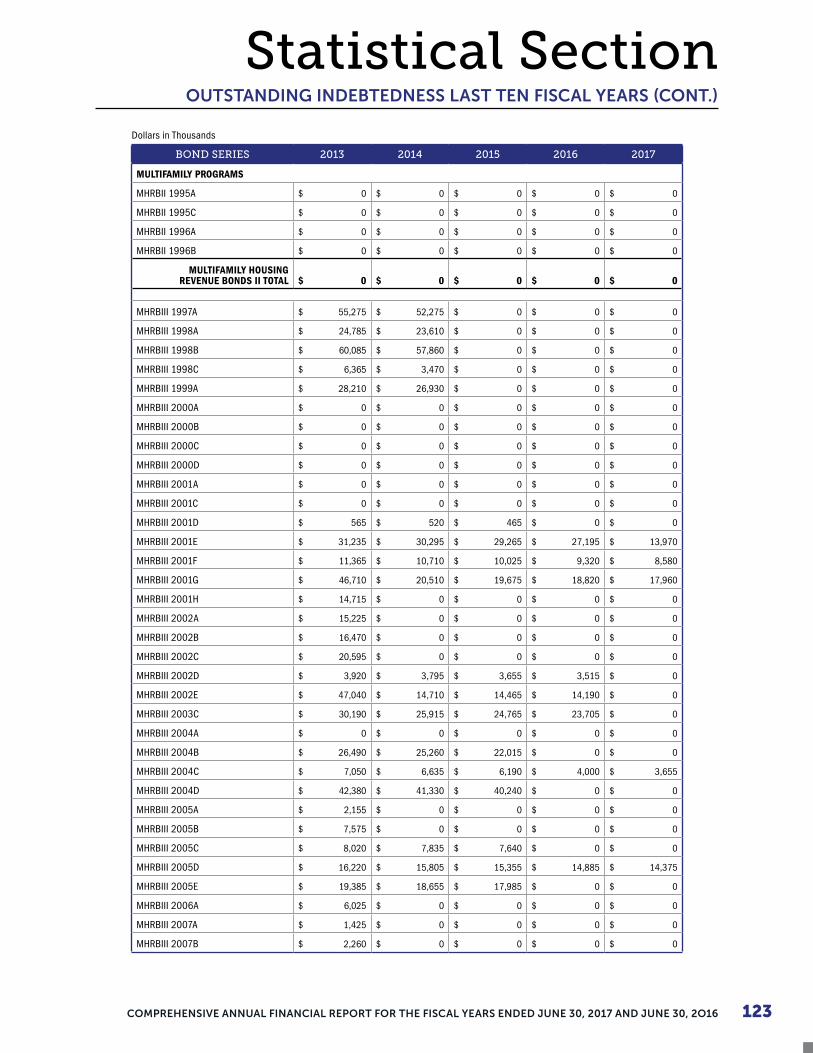
123COMPREHENSIVE ANNUAL FINANCIAL REPORT FOR THE FISCAL YEARS ENDED JUNE 30, 2017 AND JUNE 30, 2O16
Statistical SectionDollars in Thousands
BOND SERIES 2013 2014 2015 2016 2017
MULTIFAMILY PROGRAMS
MHRBII 1995A $ 0 $ 0 $ 0 $ 0 $ 0
MHRBII 1995C $ 0 $ 0 $ 0 $ 0 $ 0
MHRBII 1996A $ 0 $ 0 $ 0 $ 0 $ 0
MHRBII 1996B $ 0 $ 0 $ 0 $ 0 $ 0
MULTIFAMILY HOUSING REVENUE BONDS II TOTAL $ 0 $ 0 $ 0 $ 0 $ 0
MHRBIII 1997A $ 55,275 $ 52,275 $ 0 $ 0 $ 0
MHRBIII 1998A $ 24,785 $ 23,610 $ 0 $ 0 $ 0
MHRBIII 1998B $ 60,085 $ 57,860 $ 0 $ 0 $ 0
MHRBIII 1998C $ 6,365 $ 3,470 $ 0 $ 0 $ 0
MHRBIII 1999A $ 28,210 $ 26,930 $ 0 $ 0 $ 0
MHRBIII 2000A $ 0 $ 0 $ 0 $ 0 $ 0
MHRBIII 2000B $ 0 $ 0 $ 0 $ 0 $ 0
MHRBIII 2000C $ 0 $ 0 $ 0 $ 0 $ 0
MHRBIII 2000D $ 0 $ 0 $ 0 $ 0 $ 0
MHRBIII 2001A $ 0 $ 0 $ 0 $ 0 $ 0
MHRBIII 2001C $ 0 $ 0 $ 0 $ 0 $ 0
MHRBIII 2001D $ 565 $ 520 $ 465 $ 0 $ 0
MHRBIII 2001E $ 31,235 $ 30,295 $ 29,265 $ 27,195 $ 13,970
MHRBIII 2001F $ 11,365 $ 10,710 $ 10,025 $ 9,320 $ 8,580
MHRBIII 2001G $ 46,710 $ 20,510 $ 19,675 $ 18,820 $ 17,960
MHRBIII 2001H $ 14,715 $ 0 $ 0 $ 0 $ 0
MHRBIII 2002A $ 15,225 $ 0 $ 0 $ 0 $ 0
MHRBIII 2002B $ 16,470 $ 0 $ 0 $ 0 $ 0
MHRBIII 2002C $ 20,595 $ 0 $ 0 $ 0 $ 0
MHRBIII 2002D $ 3,920 $ 3,795 $ 3,655 $ 3,515 $ 0
MHRBIII 2002E $ 47,040 $ 14,710 $ 14,465 $ 14,190 $ 0
MHRBIII 2003C $ 30,190 $ 25,915 $ 24,765 $ 23,705 $ 0
MHRBIII 2004A $ 0 $ 0 $ 0 $ 0 $ 0
MHRBIII 2004B $ 26,490 $ 25,260 $ 22,015 $ 0 $ 0
MHRBIII 2004C $ 7,050 $ 6,635 $ 6,190 $ 4,000 $ 3,655
MHRBIII 2004D $ 42,380 $ 41,330 $ 40,240 $ 0 $ 0
MHRBIII 2005A $ 2,155 $ 0 $ 0 $ 0 $ 0
MHRBIII 2005B $ 7,575 $ 0 $ 0 $ 0 $ 0
MHRBIII 2005C $ 8,020 $ 7,835 $ 7,640 $ 0 $ 0
MHRBIII 2005D $ 16,220 $ 15,805 $ 15,355 $ 14,885 $ 14,375
MHRBIII 2005E $ 19,385 $ 18,655 $ 17,985 $ 0 $ 0
MHRBIII 2006A $ 6,025 $ 0 $ 0 $ 0 $ 0
MHRBIII 2007A $ 1,425 $ 0 $ 0 $ 0 $ 0
MHRBIII 2007B $ 2,260 $ 0 $ 0 $ 0 $ 0
OUTSTANDING INDEBTEDNESS LAST TEN FISCAL YEARS (CONT.)

CALIFORNIA HOUSING FINANCE AGENCY, A COMPONENT UNIT OF THE STATE OF CALIFORNIA124
BOND SERIES 2013 2014 2015 2016 2017
MHRBIII 2007C $ 9,790 $ 9,535 $ 9,275 $ 9,065 $ 0
MHRBIII 2008A $ 7,695 $ 7,415 $ 7,265 $ 7,115 $ 0
MHRBIII 2008B $ 27,500 $ 26,120 $ 24,605 $ 23,080 $ 21,495
MHRBIII 2008C $ 19,155 $ 18,655 $ 18,100 $ 17,605 $ 17,085
MHRBIII 2014A $ 0 $ 38,915 $ 38,915 $ 24,965 $ 24,290
MHRBIII 2015A $ 0 $ 0 $ 174,180 $ 174,180 $ 174,180
MULTIFAMILY HOUSING REVENUE BONDS III TOTAL $ 615,875 $ 486,760 $ 484,080 $ 371,640 $ 295,590
MLPB 2000A $ 9,087 $ 3,759 $ 1,022 $ 215 $ 0
MULTIFAMILY LOAN PURCHASE BONDS TOTAL $ 9,087 $ 3,759 $ 1,022 $ 215 $ 0
RMRB(MFP) 2009A-6 $ 69,950 $ 69,950 $ 49,410 $ 49,410 $ 48,440
RESIDENTIAL MORTGAGE REVENUE BONDS (MFP) TOTAL $ 69,950 $ 69,950 $ 49,410 $ 49,410 $ 48,440
AMHRB 2009A $ 0 $ 0 $ 0 $ 0 $ 0
AMHRRB 2009A-21 $ 54,880 $ 53,920 $ 49,250 $ 46,980 $ 45,220
AMHRRB 2009A-22 $ 35,870 $ 35,180 $ 34,440 $ 33,670 $ 32,860
AFFORDABLE MULTIFAMILY HOUSING REVENUE BONDS TOTAL $ 90,750 $ 89,100 $ 83,690 $ 80,650 $ 78,080
MHRB 2016A $ 0 $ 0 $ 0 $ 8,600 $ 4,710
MHRB 2016B $ 0 $ 0 $ 0 $ 31,000 $ 31,000
MULTIFAMILY HOUSING REVENUE BONDS TOTAL $ 0 $ 0 $ 0 $ 39,600 $ 35,710
SOMHRB 2015A $ 0 $ 0 $ 0 $ 5,245 $ 3,855
SOMHRB 2015B $ 0 $ 0 $ 0 $ 18,075 $ 18,075
SPECIAL OBLIGATION MULTIFAMILY HOUSING REVENUE BONDS TOTAL $ 0 $ 0 $ 0 $ 23,320 $ 21,930
CLS Belvedre Place $ 1,230 $ 1,197 $ 1,162 $ 1,124 $ 0
CLS Casa De Vida $ 452 $ 414 $ 374 $ 330 $ 0
CLS Colonial Farms $ 0 $ 0 $ 0 $ 0 $ 0
CLS Conant Place Seniors $ 650 $ 612 $ 571 $ 527 $ 0
CLS Corralitos Creek $ 2,154 $ 2,101 $ 2,044 $ 1,984 $ 0
CLS Delaware Street $ 1,034 $ 1,034 $ 1,034 $ 1,034 $ 0
CLS Doretha Mitchell $ 1,128 $ 1,115 $ 1,100 $ 0 $ 0
CLS Edgewater Isle $ 3,438 $ 3,295 $ 0 $ 0 $ 0
CLS Flower Park Plaza $ 8,319 $ 7,915 $ 7,486 $ 7,032 $ 0
CLS Gateway Apts $ 6,765 $ 6,595 $ 6,415 $ 0 $ 0
CLS Hillside Terrace $ 843 $ 815 $ 786 $ 755 $ 0
CLS Lassen $ 3,537 $ 3,431 $ 0 $ 0 $ 0
CLS Madera Villa $ 4,253 $ 4,161 $ 4,043 $ 0 $ 0
CLS Napa Creek Manor $ 3,850 $ 3,771 $ 3,688 $ 0 $ 0
OUTSTANDING INDEBTEDNESS LAST TEN FISCAL YEARS (CONT.)
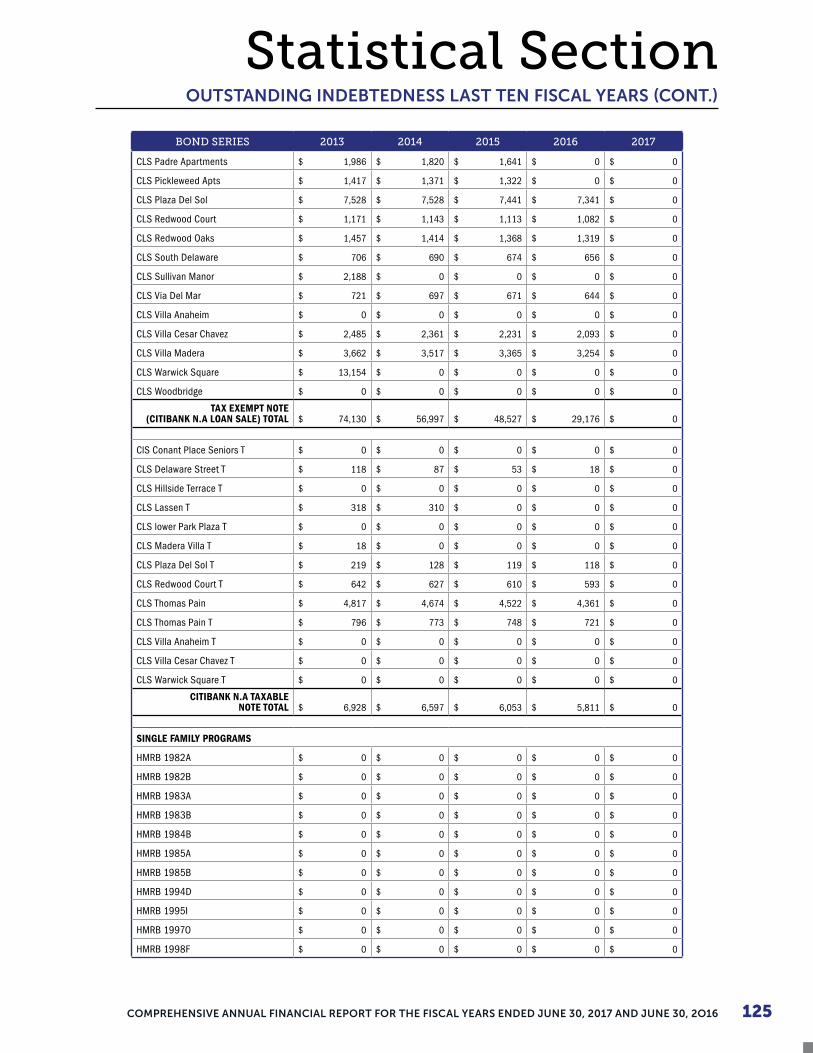
125COMPREHENSIVE ANNUAL FINANCIAL REPORT FOR THE FISCAL YEARS ENDED JUNE 30, 2017 AND JUNE 30, 2O16
Statistical Section
BOND SERIES 2013 2014 2015 2016 2017
CLS Padre Apartments $ 1,986 $ 1,820 $ 1,641 $ 0 $ 0
CLS Pickleweed Apts $ 1,417 $ 1,371 $ 1,322 $ 0 $ 0
CLS Plaza Del Sol $ 7,528 $ 7,528 $ 7,441 $ 7,341 $ 0
CLS Redwood Court $ 1,171 $ 1,143 $ 1,113 $ 1,082 $ 0
CLS Redwood Oaks $ 1,457 $ 1,414 $ 1,368 $ 1,319 $ 0
CLS South Delaware $ 706 $ 690 $ 674 $ 656 $ 0
CLS Sullivan Manor $ 2,188 $ 0 $ 0 $ 0 $ 0
CLS Via Del Mar $ 721 $ 697 $ 671 $ 644 $ 0
CLS Villa Anaheim $ 0 $ 0 $ 0 $ 0 $ 0
CLS Villa Cesar Chavez $ 2,485 $ 2,361 $ 2,231 $ 2,093 $ 0
CLS Villa Madera $ 3,662 $ 3,517 $ 3,365 $ 3,254 $ 0
CLS Warwick Square $ 13,154 $ 0 $ 0 $ 0 $ 0
CLS Woodbridge $ 0 $ 0 $ 0 $ 0 $ 0
TAX EXEMPT NOTE (CITIBANK N.A LOAN SALE) TOTAL $ 74,130 $ 56,997 $ 48,527 $ 29,176 $ 0
ClS Conant Place Seniors T $ 0 $ 0 $ 0 $ 0 $ 0
CLS Delaware Street T $ 118 $ 87 $ 53 $ 18 $ 0
CLS Hillside Terrace T $ 0 $ 0 $ 0 $ 0 $ 0
CLS Lassen T $ 318 $ 310 $ 0 $ 0 $ 0
CLS lower Park Plaza T $ 0 $ 0 $ 0 $ 0 $ 0
CLS Madera Villa T $ 18 $ 0 $ 0 $ 0 $ 0
CLS Plaza Del Sol T $ 219 $ 128 $ 119 $ 118 $ 0
CLS Redwood Court T $ 642 $ 627 $ 610 $ 593 $ 0
CLS Thomas Pain $ 4,817 $ 4,674 $ 4,522 $ 4,361 $ 0
CLS Thomas Pain T $ 796 $ 773 $ 748 $ 721 $ 0
CLS Villa Anaheim T $ 0 $ 0 $ 0 $ 0 $ 0
CLS Villa Cesar Chavez T $ 0 $ 0 $ 0 $ 0 $ 0
CLS Warwick Square T $ 0 $ 0 $ 0 $ 0 $ 0
CITIBANK N.A TAXABLE NOTE TOTAL $ 6,928 $ 6,597 $ 6,053 $ 5,811 $ 0
SINGLE FAMILY PROGRAMS
HMRB 1982A $ 0 $ 0 $ 0 $ 0 $ 0
HMRB 1982B $ 0 $ 0 $ 0 $ 0 $ 0
HMRB 1983A $ 0 $ 0 $ 0 $ 0 $ 0
HMRB 1983B $ 0 $ 0 $ 0 $ 0 $ 0
HMRB 1984B $ 0 $ 0 $ 0 $ 0 $ 0
HMRB 1985A $ 0 $ 0 $ 0 $ 0 $ 0
HMRB 1985B $ 0 $ 0 $ 0 $ 0 $ 0
HMRB 1994D $ 0 $ 0 $ 0 $ 0 $ 0
HMRB 1995I $ 0 $ 0 $ 0 $ 0 $ 0
HMRB 1997O $ 0 $ 0 $ 0 $ 0 $ 0
HMRB 1998F $ 0 $ 0 $ 0 $ 0 $ 0
OUTSTANDING INDEBTEDNESS LAST TEN FISCAL YEARS (CONT.)

CALIFORNIA HOUSING FINANCE AGENCY, A COMPONENT UNIT OF THE STATE OF CALIFORNIA126
BOND SERIES 2013 2014 2015 2016 2017
HMRB 1998J $ 0 $ 0 $ 0 $ 0 $ 0
HMRB 1998L $ 0 $ 0 $ 0 $ 0 $ 0
HMRB 1998M $ 0 $ 0 $ 0 $ 0 $ 0
HMRB 1998S $ 0 $ 0 $ 0 $ 0 $ 0
HMRB 1999F $ 0 $ 0 $ 0 $ 0 $ 0
HMRB 1999G $ 0 $ 0 $ 0 $ 0 $ 0
HMRB 1999N $ 0 $ 0 $ 0 $ 0 $ 0
HMRB 1999O $ 0 $ 0 $ 0 $ 0 $ 0
HMRB 2000B $ 0 $ 0 $ 0 $ 0 $ 0
HMRB 2000D $ 0 $ 0 $ 0 $ 0 $ 0
HMRB 2000H $ 16,255 $ 0 $ 0 $ 0 $ 0
HMRB 2000J $ 0 $ 0 $ 0 $ 0 $ 0
HMRB 2000K $ 0 $ 0 $ 0 $ 0 $ 0
HMRB 2000N $ 15,930 $ 13,475 $ 10,400 $ 8,385 $ 5,795
HMRB 2000V $ 26,675 $ 23,595 $ 10,140 $ 0 $ 0
HMRB 2000X1 $ 0 $ 0 $ 0 $ 0 $ 0
HMRB 2000X2 $ 4,805 $ 0 $ 0 $ 0 $ 0
HMRB 2000Z $ 30,840 $ 29,715 $ 29,715 $ 28,950 $ 28,950
HMRB 2001C $ 0 $ 0 $ 0 $ 0 $ 0
HMRB 2001D $ 39,135 $ 35,505 $ 35,505 $ 35,505 $ 35,505
HMRB 2001G $ 32,375 $ 28,290 $ 28,290 $ 28,290 $ 28,290
HMRB 2001J $ 18,485 $ 0 $ 0 $ 0 $ 0
HMRB 2001K $ 39,815 $ 37,610 $ 37,610 $ 37,610 $ 37,610
HMRB 2001N $ 0 $ 0 $ 0 $ 0 $ 0
HMRB 2001O $ 42,745 $ 35,420 $ 35,420 $ 35,420 $ 0
HMRB 2001R $ 0 $ 0 $ 0 $ 0 $ 0
HMRB 2001S $ 28,585 $ 25,070 $ 25,070 $ 6,230 $ 0
HMRB 2001U $ 27,945 $ 18,000 $ 0 $ 0 $ 0
HMRB 2001V $ 13,600 $ 13,600 $ 13,210 $ 0 $ 0
HMRB 2002A $ 0 $ 0 $ 0 $ 0 $ 0
HMRB 2002B $ 23,875 $ 0 $ 0 $ 0 $ 0
HMRB 2002C $ 22,665 $ 21,210 $ 0 $ 0 $ 0
HMRB 2002D $ 21,375 $ 0 $ 0 $ 0 $ 0
HMRB 2002F $ 0 $ 0 $ 0 $ 0 $ 0
HMRB 2002H $ 17,650 $ 15,875 $ 13,195 $ 11,205 $ 0
HMRB 2002J $ 45,940 $ 36,100 $ 25,605 $ 15,975 $ 0
HMRB 2002L $ 17,940 $ 17,940 $ 0 $ 0 $ 0
HMRB 2002M $ 28,920 $ 18,390 $ 0 $ 0 $ 0
HMRB 2002O $ 13,715 $ 0 $ 0 $ 0 $ 0
HMRB 2002P $ 0 $ 0 $ 0 $ 0 $ 0
HMRB 2002Q $ 0 $ 0 $ 0 $ 0 $ 0
HMRB 2002U $ 20,350 $ 0 $ 0 $ 0 $ 0
OUTSTANDING INDEBTEDNESS LAST TEN FISCAL YEARS (CONT.)

127COMPREHENSIVE ANNUAL FINANCIAL REPORT FOR THE FISCAL YEARS ENDED JUNE 30, 2017 AND JUNE 30, 2O16
Statistical Section
BOND SERIES 2013 2014 2015 2016 2017
HMRB 2002V $ 0 $ 0 $ 0 $ 0 $ 0
HMRB 2003B $ 0 $ 0 $ 0 $ 0 $ 0
HMRB 2003D $ 21,940 $ 0 $ 0 $ 0 $ 0
HMRB 2003E $ 0 $ 0 $ 0 $ 0 $ 0
HMRB 2003F $ 7,535 $ 0 $ 0 $ 0 $ 0
HMRB 2003G $ 12,695 $ 0 $ 0 $ 0 $ 0
HMRB 2003H $ 28,285 $ 16,650 $ 8,730 $ 0 $ 0
HMRB 2003I $ 27,415 $ 27,415 $ 27,415 $ 27,415 $ 27,415
HMRB 2003K $ 37,810 $ 25,005 $ 0 $ 0 $ 0
HMRB 2003L $ 20,850 $ 20,850 $ 0 $ 0 $ 0
HMRB 2003M $ 68,715 $ 51,665 $ 38,580 $ 28,745 $ 0
HMRB 2003N $ 20,660 $ 20,660 $ 20,660 $ 20,660 $ 20,660
HMRB 2004A $ 0 $ 0 $ 0 $ 0 $ 0
HMRB 2004B $ 0 $ 0 $ 0 $ 0 $ 0
HMRB 2004D $ 0 $ 0 $ 0 $ 0 $ 0
HMRB 2004E $ 72,150 $ 53,495 $ 40,690 $ 26,140 $ 0
HMRB 2004F $ 33,675 $ 33,675 $ 33,675 $ 33,675 $ 33,675
HMRB 2004G $ 0 $ 0 $ 0 $ 0 $ 0
HMRB 2004H $ 0 $ 0 $ 0 $ 0 $ 0
HMRB 2004I $ 0 $ 0 $ 0 $ 0 $ 0
HMRB 2005A $ 85,760 $ 72,440 $ 61,380 $ 49,335 $ 37,915
HMRB 2005B $ 85,585 $ 71,780 $ 59,490 $ 51,020 $ 40,075
HMRB 2005C $ 0 $ 0 $ 0 $ 0 $ 0
HMRB 2005D $ 42,930 $ 37,125 $ 0 $ 0 $ 0
HMRB 2005E $ 0 $ 0 $ 0 $ 0 $ 0
HMRB 2005F $ 102,745 $ 86,515 $ 73,980 $ 48,710 $ 0
HMRB 2005G $ 0 $ 0 $ 0 $ 0 $ 0
HMRB 2005H $ 29,545 $ 0 $ 0 $ 0 $ 0
HMRB 2006A $ 0 $ 0 $ 0 $ 0 $ 0
HMRB 2006B $ 0 $ 0 $ 0 $ 0 $ 0
HMRB 2006C $ 99,610 $ 81,505 $ 68,100 $ 56,205 $ 46,620
HMRB 2006D $ 20,000 $ 19,500 $ 10,920 $ 7,550 $ 0
HMRB 2006E $ 38,830 $ 34,600 $ 34,600 $ 34,600 $ 0
HMRB 2006F $ 44,020 $ 35,310 $ 26,090 $ 20,490 $ 0
HMRB 2006G $ 18,165 $ 9,470 $ 0 $ 0 $ 0
HMRB 2006H $ 14,195 $ 9,850 $ 6,030 $ 0 $ 0
HMRB 2006I $ 62,760 $ 53,105 $ 53,105 $ 49,025 $ 0
HMRB 2006J $ 12,710 $ 5,605 $ 0 $ 0 $ 0
HMRB 2006K $ 130,660 $ 107,380 $ 97,070 $ 77,080 $ 0
HMRB 2006L $ 18,880 $ 7,080 $ 1,450 $ 0 $ 0
HMRB 2006M $ 94,940 $ 84,775 $ 80,570 $ 70,560 $ 0
HMRB 2007A $ 88,340 $ 84,120 $ 79,840 $ 75,530 $ 71,180
OUTSTANDING INDEBTEDNESS LAST TEN FISCAL YEARS (CONT.)

CALIFORNIA HOUSING FINANCE AGENCY, A COMPONENT UNIT OF THE STATE OF CALIFORNIA128
BOND SERIES 2013 2014 2015 2016 2017
HMRB 2007B $ 40,000 $ 40,000 $ 40,000 $ 40,000 $ 40,000
HMRB 2007C $ 20,000 $ 20,000 $ 20,000 $ 20,000 $ 20,000
HMRB 2007D $ 39,315 $ 27,065 $ 16,050 $ 3,310 $ 3,310
HMRB 2007E $ 98,415 $ 88,810 $ 84,645 $ 78,780 $ 64,650
HMRB 2007F $ 25,370 $ 19,570 $ 13,420 $ 6,905 $ 3,505
HMRB 2007G $ 102,120 $ 90,870 $ 80,670 $ 71,495 $ 65,615
HMRB 2007H $ 59,415 $ 41,930 $ 34,975 $ 27,480 $ 0
HMRB 2007I $ 9,780 $ 7,580 $ 5,205 $ 3,965 $ 1,360
HMRB 2007J $ 15,210 $ 9,655 $ 4,580 $ 0 $ 0
HMRB 2007K $ 35,540 $ 29,710 $ 27,555 $ 24,265 $ 19,875
HMRB 2007L $ 0 $ 0 $ 0 $ 0 $ 0
HMRB 2007M $ 77,610 $ 74,455 $ 71,560 $ 68,660 $ 65,740
HMRB 2007N $ 60,000 $ 60,000 $ 60,000 $ 60,000 $ 60,000
HMRB 2008A $ 28,180 $ 26,015 $ 20,450 $ 15,195 $ 13,030
HMRB 2008B $ 11,710 $ 11,710 $ 11,710 $ 10,320 $ 8,780
HMRB 2008C $ 22,570 $ 11,070 $ 0 $ 0 $ 0
HMRB 2008D $ 40,055 $ 32,090 $ 23,200 $ 10,525 $ 0
HMRB 2008E $ 3,395 $ 0 $ 0 $ 0 $ 0
HMRB 2008F $ 14,305 $ 12,415 $ 11,925 $ 0 $ 0
HMRB 2008G $ 50,000 $ 50,000 $ 50,000 $ 0 $ 0
HMRB 2008H $ 69,235 $ 60,275 $ 50,695 $ 41,100 $ 31,475
HMRB 2008I $ 37,235 $ 0 $ 0 $ 0 $ 0
HMRB 2008J $ 45,525 $ 21,355 $ 0 $ 0 $ 0
HMRB 2008K $ 89,710 $ 81,720 $ 79,700 $ 60,775 $ 46,060
HMRB 2008L $ 130,995 $ 99,705 $ 74,040 $ 52,020 $ 34,670
HMRB 2008M $ 0 $ 0 $ 0 $ 0 $ 0
HMRB 2016A $ 0 $ 0 $ 0 $ 236,350 $ 229,130
HMRB 2017A $ 0 $ 0 $ 0 $ 0 $ 278,240
HOME MORTGAGE REVENUE BONDS TOTAL $ 3,016,715 $ 2,335,370 $ 1,866,915 $ 1,715,455 $ 1,399,130
HMB 2009A $ 0 $ 0 $ 0 $ 0 $ 0
HOME MORTGAGE BONDS TOTAL $ 0 $ 0 $ 0 $ 0 $ 0
RMRB 2009A-1 $ 0 $ 0 $ 0 $ 0 $ 0
RMRB 2009A-2 $ 0 $ 0 $ 0 $ 0 $ 0
RMRB 2009A-3 $ 0 $ 0 $ 0 $ 0 $ 0
RMRB 2009A-4 $ 0 $ 0 $ 0 $ 0 $ 0
RMRB 2010A $ 20,855 $ 17,420 $ 13,645 $ 10,810 $ 7,385
RMRB 2011A $ 63,600 $ 47,850 $ 33,370 $ 23,100 $ 15,260
RMRB 2013A $ 97,891 $ 79,631 $ 57,593 $ 42,834 $ 30,670
RMRB 2013B $ 33,273 $ 29,641 $ 24,807 $ 20,906 $ 15,779
RMRB 2009A-5 $ 408,160 $ 327,060 $ 260,535 $ 202,755 $ 147,000
RESIDENTIAL MORTGAGE REVENUE BONDS TOTAL $ 623,779 $ 501,602 $ 389,949 $ 300,405 $ 216,094
OUTSTANDING INDEBTEDNESS LAST TEN FISCAL YEARS (CONT.)
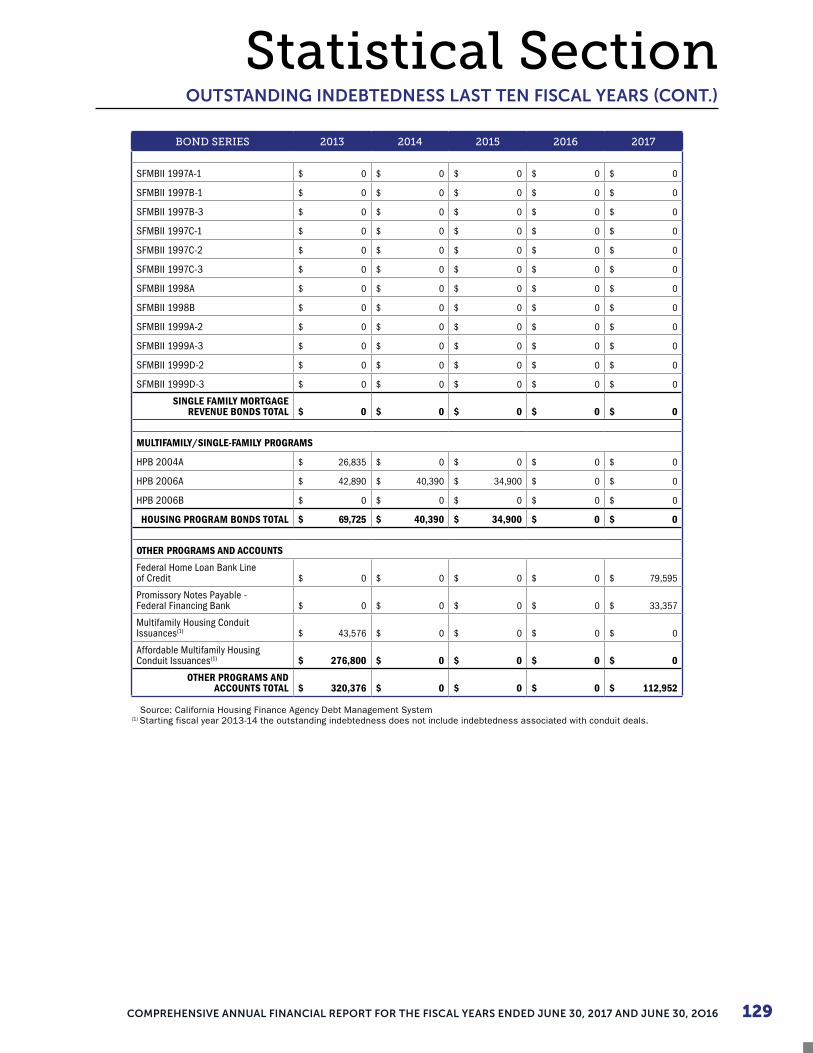
129COMPREHENSIVE ANNUAL FINANCIAL REPORT FOR THE FISCAL YEARS ENDED JUNE 30, 2017 AND JUNE 30, 2O16
Statistical Section
BOND SERIES 2013 2014 2015 2016 2017
SFMBII 1997A-1 $ 0 $ 0 $ 0 $ 0 $ 0
SFMBII 1997B-1 $ 0 $ 0 $ 0 $ 0 $ 0
SFMBII 1997B-3 $ 0 $ 0 $ 0 $ 0 $ 0
SFMBII 1997C-1 $ 0 $ 0 $ 0 $ 0 $ 0
SFMBII 1997C-2 $ 0 $ 0 $ 0 $ 0 $ 0
SFMBII 1997C-3 $ 0 $ 0 $ 0 $ 0 $ 0
SFMBII 1998A $ 0 $ 0 $ 0 $ 0 $ 0
SFMBII 1998B $ 0 $ 0 $ 0 $ 0 $ 0
SFMBII 1999A-2 $ 0 $ 0 $ 0 $ 0 $ 0
SFMBII 1999A-3 $ 0 $ 0 $ 0 $ 0 $ 0
SFMBII 1999D-2 $ 0 $ 0 $ 0 $ 0 $ 0
SFMBII 1999D-3 $ 0 $ 0 $ 0 $ 0 $ 0
SINGLE FAMILY MORTGAGE REVENUE BONDS TOTAL $ 0 $ 0 $ 0 $ 0 $ 0
MULTIFAMILY/SINGLE-FAMILY PROGRAMS
HPB 2004A $ 26,835 $ 0 $ 0 $ 0 $ 0
HPB 2006A $ 42,890 $ 40,390 $ 34,900 $ 0 $ 0
HPB 2006B $ 0 $ 0 $ 0 $ 0 $ 0
HOUSING PROGRAM BONDS TOTAL $ 69,725 $ 40,390 $ 34,900 $ 0 $ 0
OTHER PROGRAMS AND ACCOUNTS
Federal Home Loan Bank Line of Credit $ 0 $ 0 $ 0 $ 0 $ 79,595
Promissory Notes Payable - Federal Financing Bank $ 0 $ 0 $ 0 $ 0 $ 33,357
Multifamily Housing Conduit Issuances(1) $ 43,576 $ 0 $ 0 $ 0 $ 0
Affordable Multifamily Housing Conduit Issuances(1) $ 276,800 $ 0 $ 0 $ 0 $ 0
OTHER PROGRAMS AND ACCOUNTS TOTAL $ 320,376 $ 0 $ 0 $ 0 $ 112,952
Source: California Housing Finance Agency Debt Management System(1) Starting fiscal year 2013-14 the outstanding indebtedness does not include indebtedness associated with conduit deals.
OUTSTANDING INDEBTEDNESS LAST TEN FISCAL YEARS (CONT.)
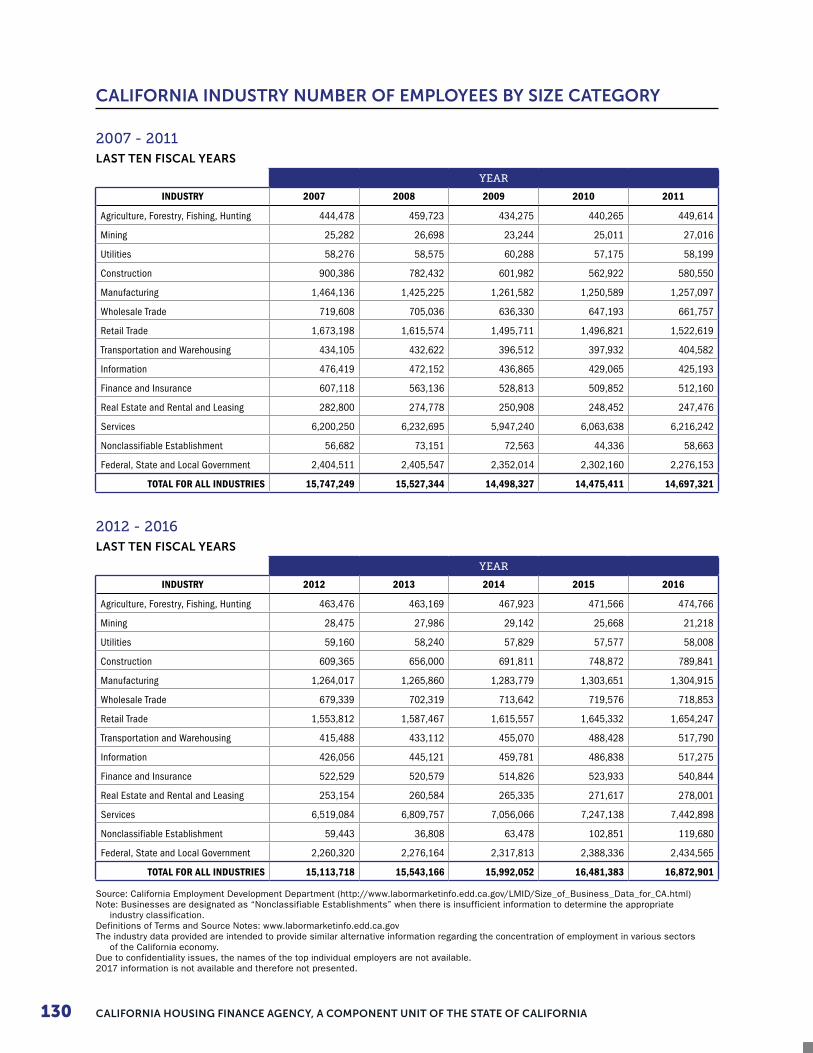
CALIFORNIA HOUSING FINANCE AGENCY, A COMPONENT UNIT OF THE STATE OF CALIFORNIA130
CALIFORNIA INDUSTRY NUMBER OF EMPLOYEES BY SIZE CATEGORY
2007 - 2011LAST TEN FISCAL YEARS
YEAR
INDUSTRY 2007 2008 2009 2010 2011
Agriculture, Forestry, Fishing, Hunting 444,478 459,723 434,275 440,265 449,614
Mining 25,282 26,698 23,244 25,011 27,016
Utilities 58,276 58,575 60,288 57,175 58,199
Construction 900,386 782,432 601,982 562,922 580,550
Manufacturing 1,464,136 1,425,225 1,261,582 1,250,589 1,257,097
Wholesale Trade 719,608 705,036 636,330 647,193 661,757
Retail Trade 1,673,198 1,615,574 1,495,711 1,496,821 1,522,619
Transportation and Warehousing 434,105 432,622 396,512 397,932 404,582
Information 476,419 472,152 436,865 429,065 425,193
Finance and Insurance 607,118 563,136 528,813 509,852 512,160
Real Estate and Rental and Leasing 282,800 274,778 250,908 248,452 247,476
Services 6,200,250 6,232,695 5,947,240 6,063,638 6,216,242
Nonclassifiable Establishment 56,682 73,151 72,563 44,336 58,663
Federal, State and Local Government 2,404,511 2,405,547 2,352,014 2,302,160 2,276,153
TOTAL FOR ALL INDUSTRIES 15,747,249 15,527,344 14,498,327 14,475,411 14,697,321
2012 - 2016LAST TEN FISCAL YEARS
YEAR
INDUSTRY 2012 2013 2014 2015 2016
Agriculture, Forestry, Fishing, Hunting 463,476 463,169 467,923 471,566 474,766
Mining 28,475 27,986 29,142 25,668 21,218
Utilities 59,160 58,240 57,829 57,577 58,008
Construction 609,365 656,000 691,811 748,872 789,841
Manufacturing 1,264,017 1,265,860 1,283,779 1,303,651 1,304,915
Wholesale Trade 679,339 702,319 713,642 719,576 718,853
Retail Trade 1,553,812 1,587,467 1,615,557 1,645,332 1,654,247
Transportation and Warehousing 415,488 433,112 455,070 488,428 517,790
Information 426,056 445,121 459,781 486,838 517,275
Finance and Insurance 522,529 520,579 514,826 523,933 540,844
Real Estate and Rental and Leasing 253,154 260,584 265,335 271,617 278,001
Services 6,519,084 6,809,757 7,056,066 7,247,138 7,442,898
Nonclassifiable Establishment 59,443 36,808 63,478 102,851 119,680
Federal, State and Local Government 2,260,320 2,276,164 2,317,813 2,388,336 2,434,565
TOTAL FOR ALL INDUSTRIES 15,113,718 15,543,166 15,992,052 16,481,383 16,872,901
Source: California Employment Development Department (http://www.labormarketinfo.edd.ca.gov/LMID/Size_of_Business_Data_for_CA.html)Note: Businesses are designated as “Nonclassifiable Establishments” when there is insufficient information to determine the appropriate industry classification.Definitions of Terms and Source Notes: www.labormarketinfo.edd.ca.govThe industry data provided are intended to provide similar alternative information regarding the concentration of employment in various sectors of the California economy.Due to confidentiality issues, the names of the top individual employers are not available.2017 information is not available and therefore not presented.

131COMPREHENSIVE ANNUAL FINANCIAL REPORT FOR THE FISCAL YEARS ENDED JUNE 30, 2017 AND JUNE 30, 2O16
Statistical SectionCALIFORNIA DEMOGRAPHICS AND ECONOMIC INFORMATION
2007 - 2016LAST TEN FISCAL YEARS
POPULATION PERSONAL INCOME PER CAPITA UNEMPLOYMENT
YEAR (IN THOUSANDS) (IN MILLIONS) PERSONAL INCOME RATE
2007 36,250 $1,583,852 $43,692 5.40%
2008 36,604 $1,604,113 $44,162 7.20%
2009 36,961 $1,572,650 $42,224 12.00%
2010 37,333 $1,590,279 $43,317 12.40%
2011 37,677 $1,645,138 $45,849 10.90%
2012 38,011 $1,768,039 $48,369 9.80%
2013 38,335 $1,817,010 $48,570 7.90%
2014 36,681 $1,944,369 $51,134 6.80%
2015 38,994 $2,103,669 $53,949 5.70%
2016 39,250 $2,197,492 $55,987 5.00%
Source: Bureau of Economic Analysis, U.S. Department of Commerce
Legend/Footnotes1 Census Bureau midyear population estimate. Estimates for 2010-2016 reflect Census Bureau midyear state population estimates available as of December 2016.2 Per capita personal income is total personal income divided by total midyear population.Note—All dollar estimates are in current dollars (not adjusted for inflation).Last updated: March 28, 2017—new estimates for 2016; revised estimates for 2010-2015.2017 information is not available and therefore not presented.
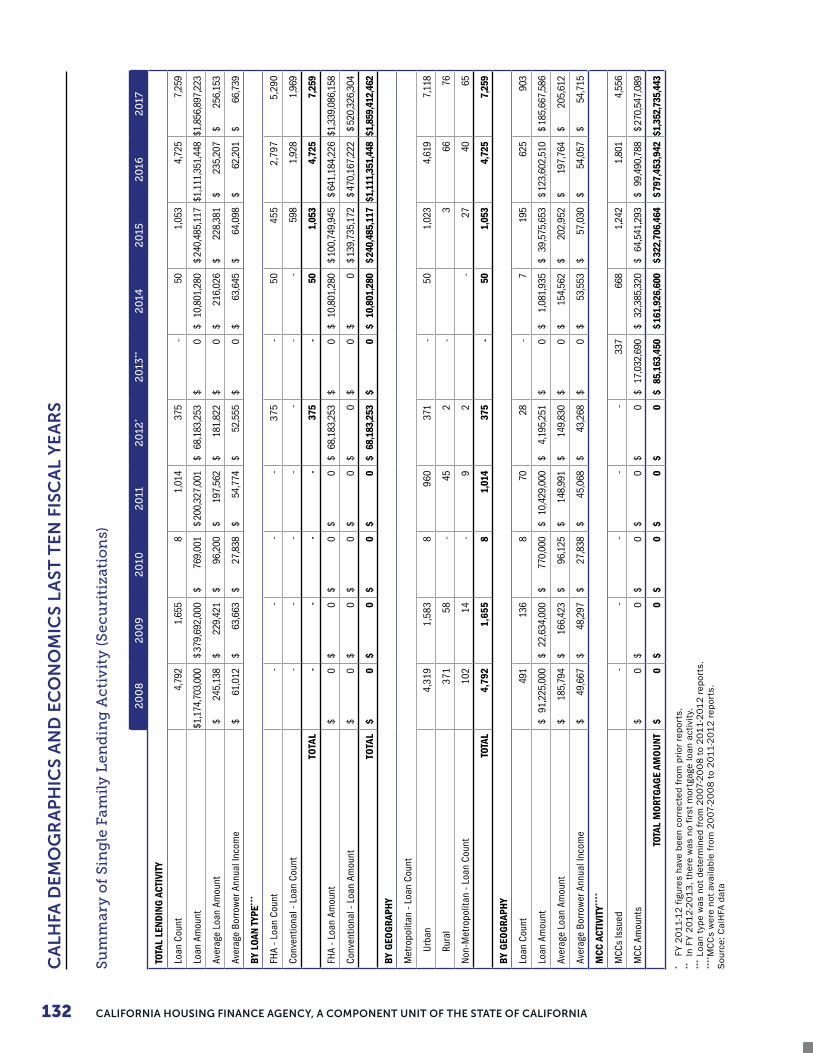
132 CALIFORNIA HOUSING FINANCE AGENCY, A COMPONENT UNIT OF THE STATE OF CALIFORNIA
Su
mm
ary
of
Sin
gle
Fa
mil
y L
end
ing
Ac
tiv
ity
(S
ec
uri
tiza
tio
ns)
20
08
20
09
20
102
011
20
12*
20
13**
20
142
015
20
162
017
TOTA
L LE
NDIN
G A
CTIV
ITY
Loan
Cou
nt4,
792
1,65
58
1,01
437
5 -
501,
053
4,72
57,
259
Loan
Am
ount
$ 1,1
74,7
03,0
00$
379,
692,
000
$ 76
9,00
1$
200,
327,
001
$ 68
,183
,253
$ 0
$ 10
,801
,280
$ 24
0,48
5,11
7$ 1
,111
,351
,448
$ 1,8
56,8
97,2
23
Aver
age
Loan
Am
ount
$ 24
5,13
8$
229,
421
$ 96
,200
$ 19
7,56
2$
181,
822
$ 0
$ 21
6,02
6$
228,
381
$ 23
5,20
7$
256,
153
Aver
age
Borr
ower
Ann
ual I
ncom
e$
61,0
12$
63,6
63$
27,8
38$
54,7
74$
52,5
55$
0$
63,6
45$
64,0
98$
62,2
01$
66,7
39
BY L
OAN
TYPE
***
FHA
- Loa
n Co
unt
--
--
375
- 50
455
2,79
75,
290
Conv
entio
nal -
Loa
n Co
unt
--
--
- -
- 59
81,
928
1,96
9
TOTA
L-
--
-37
5 -
501,
053
4,72
57,
259
FHA
- Loa
n Am
ount
$ 0
$ 0
$ 0
$ 0
$ 68
,183
,253
$ 0
$ 10
,801
,280
$ 10
0,74
9,94
5$
641,
184,
226
$ 1,3
39,0
86,1
58
Conv
entio
nal -
Loa
n Am
ount
$ 0
$ 0
$ 0
$ 0
$ 0
$ 0
$ 0
$ 13
9,73
5,17
2$
470,
167,
222
$ 52
0,32
6,30
4
TOTA
L$
0$
0$
0$
0$
68,1
83,2
53$
0$
10,8
01,2
80$
240,
485,
117
$ 1,1
11,3
51,4
48$ 1
,859
,412
,462
BY G
EOG
RAPH
Y
Met
ropo
litan
- Lo
an C
ount
Urba
n 4,
319
1,58
38
960
371
- 50
1,02
34,
619
7,11
8
Rura
l37
158
- 45
2 -
366
76
Non
-Met
ropo
litan
- Lo
an C
ount
102
14 -
92
- 27
4065
TOTA
L4,
792
1,65
58
1,01
437
5 -
501,
053
4,72
57,
259
BY G
EOG
RAPH
Y
Loan
Cou
nt49
113
68
7028
- 7
195
625
903
Loan
Am
ount
$ 91
,225
,000
$ 22
,634
,000
$ 77
0,00
0$
10,4
29,0
00$
4,19
5,25
1$
0$
1,08
1,93
5$
39,5
75,6
53$
123,
602,
510
$ 18
5,66
7,58
6
Aver
age
Loan
Am
ount
$ 18
5,79
4$
166,
423
$ 96
,125
$ 14
8,99
1$
149,
830
$ 0
$ 15
4,56
2$
202,
952
$ 19
7,76
4$
205,
612
Aver
age
Borr
ower
Ann
ual I
ncom
e$
49,6
67$
48,2
97$
27,8
38$
45,0
68$
43,2
68$
0$
53,5
53$
57,0
30$
54,0
57$
54,7
15
MCC
ACT
IVIT
Y****
MCC
s Is
sued
--
--
-33
766
81,
242
1,80
14,
556
MCC
Am
ount
s$
0$
0$
0$
0$
0$
17,0
32,6
90$
32,3
85,3
20$
64,5
41,2
93$
99,4
90,7
88$
270,
547,
089
TOTA
L M
ORTG
AGE
AMOU
NT$
0$
0$
0$
0$
0$
85,1
63,4
50$
161,
926,
600
$ 32
2,70
6,46
4$
797,
453,
942
$ 1,3
52,7
35,4
43
* FY
20
11-
12 f
igur
es h
ave
been
cor
rect
ed f
rom
prior
rep
orts
.**
In
FY
20
12
-20
13
, th
ere
was
no
firs
t m
ortg
age
loan
act
ivit
y.**
* Lo
an t
ype
was
not
det
erm
ined
fro
m 2
007-
20
08 t
o 2
01
1-2
01
2 r
epor
ts.
****
MC
Cs
wer
e no
t av
aila
ble
from
20
07-
20
08 t
o 2
01
1-2
01
2 r
epor
ts.
Sou
rce:
Cal
HFA
dat
a
CA
LHFA
DE
MO
GR
AP
HIC
S A
ND
EC
ON
OM
ICS
LA
ST
TE
N F
ISC
AL
YE
AR
S
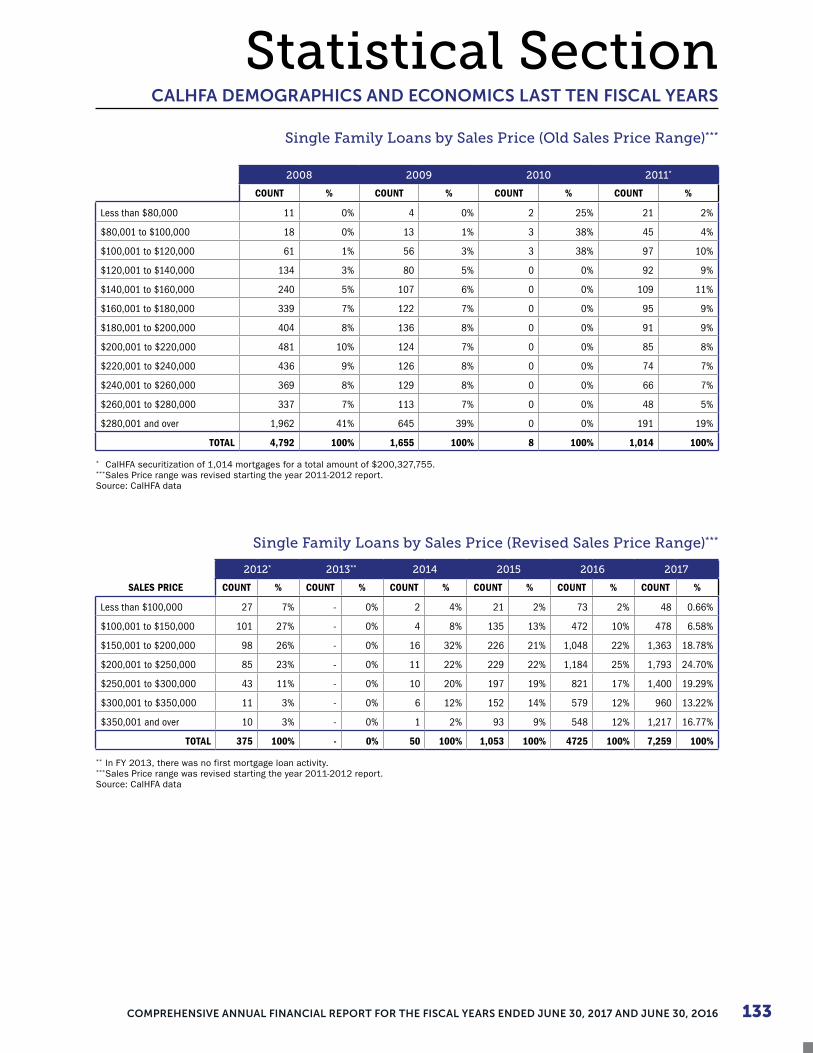
133COMPREHENSIVE ANNUAL FINANCIAL REPORT FOR THE FISCAL YEARS ENDED JUNE 30, 2017 AND JUNE 30, 2O16
Statistical Section
Single Family Loans by Sales Price (Revised Sales Price Range)***
2012* 2013** 2014 2015 2016 2017
SALES PRICE COUNT % COUNT % COUNT % COUNT % COUNT % COUNT %
Less than $100,000 27 7% - 0% 2 4% 21 2% 73 2% 48 0.66%
$100,001 to $150,000 101 27% - 0% 4 8% 135 13% 472 10% 478 6.58%
$150,001 to $200,000 98 26% - 0% 16 32% 226 21% 1,048 22% 1,363 18.78%
$200,001 to $250,000 85 23% - 0% 11 22% 229 22% 1,184 25% 1,793 24.70%
$250,001 to $300,000 43 11% - 0% 10 20% 197 19% 821 17% 1,400 19.29%
$300,001 to $350,000 11 3% - 0% 6 12% 152 14% 579 12% 960 13.22%
$350,001 and over 10 3% - 0% 1 2% 93 9% 548 12% 1,217 16.77%
TOTAL 375 100% - 0% 50 100% 1,053 100% 4725 100% 7,259 100%
** In FY 2013, there was no first mortgage loan activity.***Sales Price range was revised starting the year 2011-2012 report.Source: CalHFA data
CALHFA DEMOGRAPHICS AND ECONOMICS LAST TEN FISCAL YEARS
Single Family Loans by Sales Price (Old Sales Price Range)***
2008 2009 2010 2011*
COUNT % COUNT % COUNT % COUNT %
Less than $80,000 11 0% 4 0% 2 25% 21 2%
$80,001 to $100,000 18 0% 13 1% 3 38% 45 4%
$100,001 to $120,000 61 1% 56 3% 3 38% 97 10%
$120,001 to $140,000 134 3% 80 5% 0 0% 92 9%
$140,001 to $160,000 240 5% 107 6% 0 0% 109 11%
$160,001 to $180,000 339 7% 122 7% 0 0% 95 9%
$180,001 to $200,000 404 8% 136 8% 0 0% 91 9%
$200,001 to $220,000 481 10% 124 7% 0 0% 85 8%
$220,001 to $240,000 436 9% 126 8% 0 0% 74 7%
$240,001 to $260,000 369 8% 129 8% 0 0% 66 7%
$260,001 to $280,000 337 7% 113 7% 0 0% 48 5%
$280,001 and over 1,962 41% 645 39% 0 0% 191 19%
TOTAL 4,792 100% 1,655 100% 8 100% 1,014 100%
* CalHFA securitization of 1,014 mortgages for a total amount of $200,327,755.***Sales Price range was revised starting the year 2011-2012 report.Source: CalHFA data

CALIFORNIA HOUSING FINANCE AGENCY, A COMPONENT UNIT OF THE STATE OF CALIFORNIA134
CALHFA DEMOGRAPHICS AND ECONOMICS LAST TEN FISCAL YEARS
Single Family Loans by Borrower Income (Revised Income Range)***
2012 2013** 2014 2015 2016 2017
BORROWER INCOME COUNT % COUNT % COUNT % COUNT % COUNT % COUNT %
Less than $25,000 17 5% - 0% - 0% 15 1% 57 1% 64 0.88%
$25,001 to $40,000 79 21% - 0% 3 6% 97 9% 514 11% 620 8.54%
$40,001 to $55,000 124 33% - 0% 19 38% 264 25% 1,223 26% 1,646 22.68%
$55,001 to $70,000 91 24% - 0% 12 24% 283 27% 1,349 29% 1,952 26.89%
$70,001 to $85,000 48 13% - 0% 11 22% 230 22% 993 21% 1,542 21.24%
$85,001 to $100,000 11 3% - 0% 3 6% 122 12% 465 10% 925 12.74%
$100,001 and over 5 1% - 0% 2 4% 42 4% 124 3% 510 7.03%
TOTAL 375 100% - 0% 50 100% 1,053 100% 4,725 100% 7,259 100%
* FY 2011-12 figures have been corrected from prior reports.** In FY 2012-2013, there was no first mortgage loan activity.***Income range was revised starting the year 2011-2012 report.Source: CalHFA data
Single Family Loans by Borrower Income (Old Income Range)***
2008 2009 2010 2011*
COUNT % COUNT % COUNT % COUNT %
Less than $25,000 99 2% 24 1% 2 25% 43 4%
$25,001 to $30,000 118 2% 35 2% 3 38% 45 4%
$30,001 to $35,000 223 5% 57 3% 3 38% 60 6%
$35,001 to $40,000 265 6% 102 6% 0 0% 98 10%
$40,001 to $45,000 348 7% 134 8% 0 0% 101 10%
$45,001 to $50,000 426 9% 141 9% 0 0% 105 10%
$50,001 to $55.000 478 10% 149 9% 0 0% 106 10%
$55,001 to $60,000 525 11% 193 12% 0 0% 102 10%
$60,001 to $65,000 466 10% 148 9% 0 0% 69 7%
$65,001 to $70,000 411 9% 117 7% 0 0% 70 7%
$70,001 to $75,000 326 7% 88 5% 0 0% 55 5%
$75,001 to $80,000 275 6% 90 5% 0 0% 42 4%
$80,001 to $85,000 229 5% 74 4% 0 0% 39 4%
More than $85,001 603 13% 303 18% 0 0% 79 8%
TOTAL 4,792 100% 1,655 100% 8 100% 1,014 100%
* CalHFA securitization of 1,014 mortgages for a total amount of $200,327,755.***Income range was revised starting the year 2011-2012 report.Source: CalHFA data
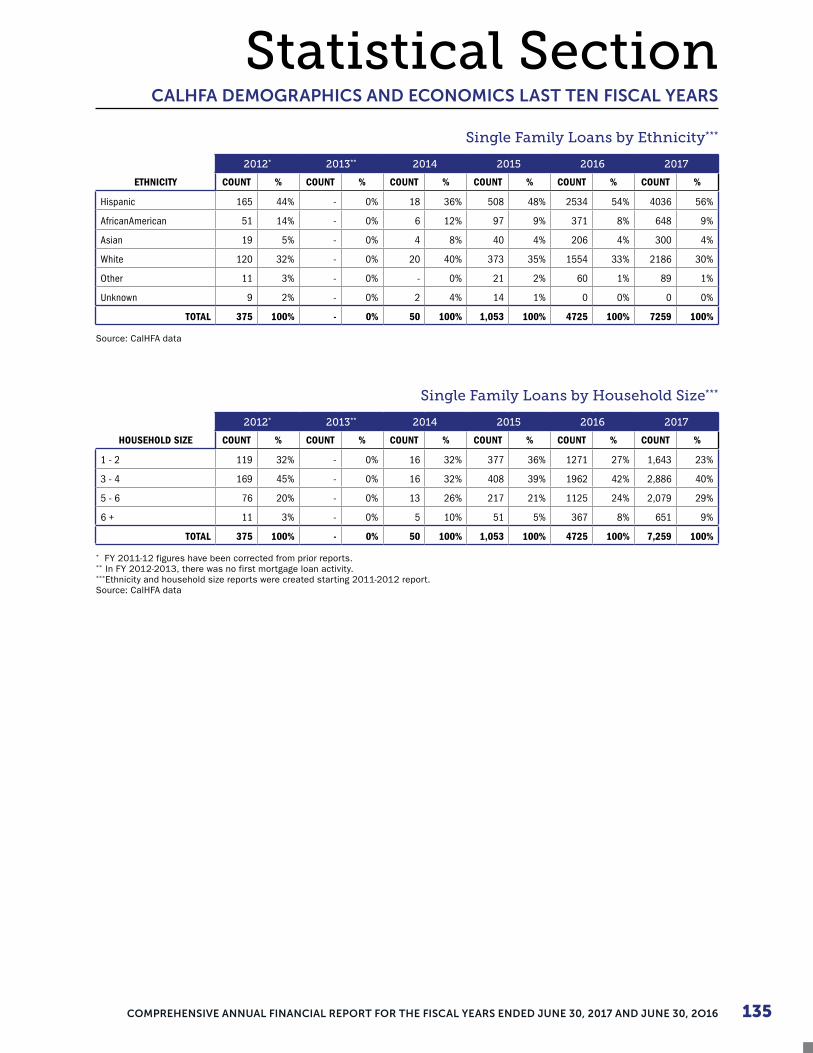
135COMPREHENSIVE ANNUAL FINANCIAL REPORT FOR THE FISCAL YEARS ENDED JUNE 30, 2017 AND JUNE 30, 2O16
Statistical SectionCALHFA DEMOGRAPHICS AND ECONOMICS LAST TEN FISCAL YEARS
Single Family Loans by Ethnicity***
2012* 2013** 2014 2015 2016 2017
ETHNICITY COUNT % COUNT % COUNT % COUNT % COUNT % COUNT %
Hispanic 165 44% - 0% 18 36% 508 48% 2534 54% 4036 56%
AfricanAmerican 51 14% - 0% 6 12% 97 9% 371 8% 648 9%
Asian 19 5% - 0% 4 8% 40 4% 206 4% 300 4%
White 120 32% - 0% 20 40% 373 35% 1554 33% 2186 30%
Other 11 3% - 0% - 0% 21 2% 60 1% 89 1%
Unknown 9 2% - 0% 2 4% 14 1% 0 0% 0 0%
TOTAL 375 100% - 0% 50 100% 1,053 100% 4725 100% 7259 100%
Source: CalHFA data
Single Family Loans by Household Size***
2012* 2013** 2014 2015 2016 2017
HOUSEHOLD SIZE COUNT % COUNT % COUNT % COUNT % COUNT % COUNT %
1 - 2 119 32% - 0% 16 32% 377 36% 1271 27% 1,643 23%
3 - 4 169 45% - 0% 16 32% 408 39% 1962 42% 2,886 40%
5 - 6 76 20% - 0% 13 26% 217 21% 1125 24% 2,079 29%
6 + 11 3% - 0% 5 10% 51 5% 367 8% 651 9%
TOTAL 375 100% - 0% 50 100% 1,053 100% 4725 100% 7,259 100%
* FY 2011-12 figures have been corrected from prior reports.** In FY 2012-2013, there was no first mortgage loan activity.***Ethnicity and household size reports were created starting 2011-2012 report.Source: CalHFA data

CALIFORNIA HOUSING FINANCE AGENCY, A COMPONENT UNIT OF THE STATE OF CALIFORNIA136
CALHFA DEMOGRAPHICS AND ECONOMICS LAST TEN FISCAL YEARS
Multifamily Occupancy
2008* 2009* 2010* 2011* 2012 2013 2014 2015 2016 2017
ACQ/REHABILITATION PROJECTS
Occupancy Type
Elderly 0 0 0 0 0 414 115 0 99 44
Non Elderly Handicapped 0 0 0 0 0 0 16 0 0 0
All Other 0 0 0 0 0 276 252 0 344 43
TOTAL 0 0 0 0 0 690 383 0 443 87
Number of Bedrooms
Studio - (Zero Bedroom) 0 0 0 0 0 1 0 0 0 20
One Bedroom 0 0 0 0 0 467 197 0 157 35
Two Bedrooms 0 0 0 0 0 209 165 0 194 10
Three Bedrooms 0 0 0 0 0 13 15 0 92 8
Four of More Bedrooms 0 0 0 0 0 0 6 0 0 14
TOTAL 0 0 0 0 0 690 383 0 443 87
PERMANENT CONVERSION PROJECTS
Occupancy Type
Elderly 0 0 0 0 109 0 50 364 114 0
Non Elderly Handicapped 0 0 0 0 0 0 0 0 16 0
All Other 0 0 0 0 0 0 100 176 253 155
TOTAL 0 0 0 0 109 0 150 540 383 155
Number of Bedrooms
Studio - (Zero Bedroom) 0 0 0 0 64 0 0 1 0 0
One Bedroom 0 0 0 0 45 0 64 403 197 13
Two Bedrooms 0 0 0 0 0 0 86 123 165 98
Three Bedrooms 0 0 0 0 0 0 0 13 15 44
Four of More Bedrooms 0 0 0 0 0 0 0 0 6 0
TOTAL 0 0 0 0 109 0 150 540 383 155
PERMANENT ONLY PROJECTS
Occupancy Type
Elderly 0 0 0 0 0 0 0 0 0 250
Non Elderly Handicapped 0 0 0 0 0 0 0 0 0 12
All Other 0 0 0 0 0 0 0 0 40 344
TOTAL 0 0 0 0 0 0 0 0 40 606
Number of Bedrooms
Studio - (Zero Bedroom) 0 0 0 0 0 0 0 0 0 22
One Bedroom 0 0 0 0 0 0 0 0 10 277
Two Bedrooms 0 0 0 0 0 0 0 0 24 232
Three Bedrooms 0 0 0 0 0 0 0 0 6 75
Four of More Bedrooms 0 0 0 0 0 0 0 0 0 0
TOTAL 0 0 0 0 0 0 0 0 40 606
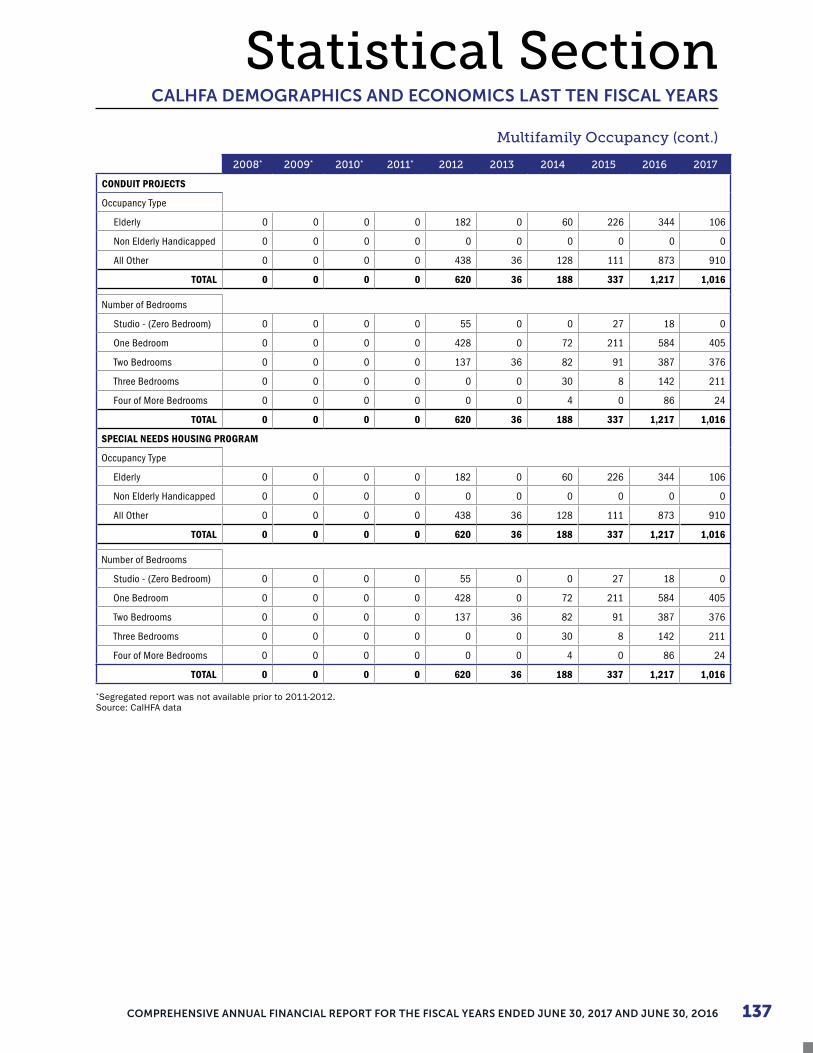
137COMPREHENSIVE ANNUAL FINANCIAL REPORT FOR THE FISCAL YEARS ENDED JUNE 30, 2017 AND JUNE 30, 2O16
Statistical SectionCALHFA DEMOGRAPHICS AND ECONOMICS LAST TEN FISCAL YEARS
Multifamily Occupancy (cont.)
2008* 2009* 2010* 2011* 2012 2013 2014 2015 2016 2017
CONDUIT PROJECTS
Occupancy Type
Elderly 0 0 0 0 182 0 60 226 344 106
Non Elderly Handicapped 0 0 0 0 0 0 0 0 0 0
All Other 0 0 0 0 438 36 128 111 873 910
TOTAL 0 0 0 0 620 36 188 337 1,217 1,016
Number of Bedrooms
Studio - (Zero Bedroom) 0 0 0 0 55 0 0 27 18 0
One Bedroom 0 0 0 0 428 0 72 211 584 405
Two Bedrooms 0 0 0 0 137 36 82 91 387 376
Three Bedrooms 0 0 0 0 0 0 30 8 142 211
Four of More Bedrooms 0 0 0 0 0 0 4 0 86 24
TOTAL 0 0 0 0 620 36 188 337 1,217 1,016
SPECIAL NEEDS HOUSING PROGRAM
Occupancy Type
Elderly 0 0 0 0 182 0 60 226 344 106
Non Elderly Handicapped 0 0 0 0 0 0 0 0 0 0
All Other 0 0 0 0 438 36 128 111 873 910
TOTAL 0 0 0 0 620 36 188 337 1,217 1,016
Number of Bedrooms
Studio - (Zero Bedroom) 0 0 0 0 55 0 0 27 18 0
One Bedroom 0 0 0 0 428 0 72 211 584 405
Two Bedrooms 0 0 0 0 137 36 82 91 387 376
Three Bedrooms 0 0 0 0 0 0 30 8 142 211
Four of More Bedrooms 0 0 0 0 0 0 4 0 86 24
TOTAL 0 0 0 0 620 36 188 337 1,217 1,016
*Segregated report was not available prior to 2011-2012.Source: CalHFA data
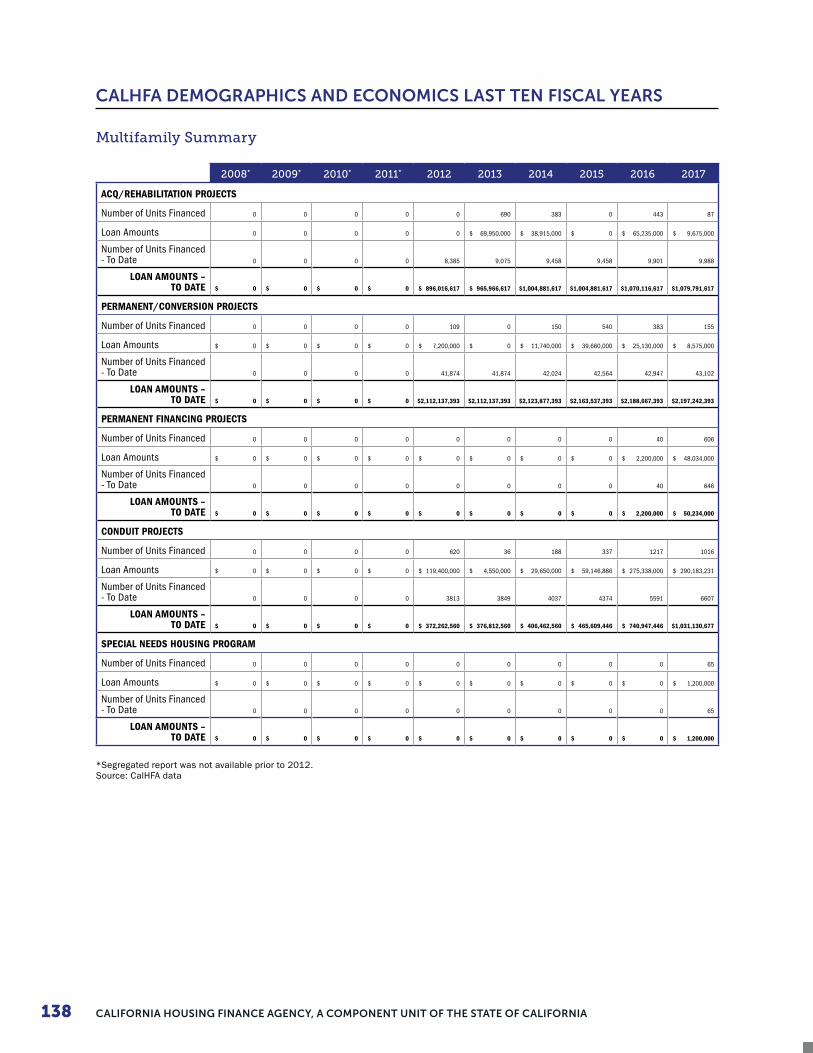
CALIFORNIA HOUSING FINANCE AGENCY, A COMPONENT UNIT OF THE STATE OF CALIFORNIA138
CALHFA DEMOGRAPHICS AND ECONOMICS LAST TEN FISCAL YEARS
Multifamily Summary
2008* 2009* 2010* 2011* 2012 2013 2014 2015 2016 2017
ACQ/REHABILITATION PROJECTS
Number of Units Financed 0 0 0 0 0 690 383 0 443 87
Loan Amounts 0 0 0 0 0 $ 69,950,000 $ 38,915,000 $ 0 $ 65,235,000 $ 9,675,000
Number of Units Financed - To Date 0 0 0 0 8,385 9,075 9,458 9,458 9,901 9,988
LOAN AMOUNTS – TO DATE $ 0 $ 0 $ 0 $ 0 $ 896,016,617 $ 965,966,617 $1,004,881,617 $1,004,881,617 $1,070,116,617 $1,079,791,617
PERMANENT/CONVERSION PROJECTS
Number of Units Financed 0 0 0 0 109 0 150 540 383 155
Loan Amounts $ 0 $ 0 $ 0 $ 0 $ 7,200,000 $ 0 $ 11,740,000 $ 39,660,000 $ 25,130,000 $ 8,575,000
Number of Units Financed - To Date 0 0 0 0 41,874 41,874 42,024 42,564 42,947 43,102
LOAN AMOUNTS – TO DATE $ 0 $ 0 $ 0 $ 0 $2,112,137,393 $2,112,137,393 $2,123,877,393 $2,163,537,393 $2,188,667,393 $2,197,242,393
PERMANENT FINANCING PROJECTS
Number of Units Financed 0 0 0 0 0 0 0 0 40 606
Loan Amounts $ 0 $ 0 $ 0 $ 0 $ 0 $ 0 $ 0 $ 0 $ 2,200,000 $ 48,034,000
Number of Units Financed - To Date 0 0 0 0 0 0 0 0 40 646
LOAN AMOUNTS – TO DATE $ 0 $ 0 $ 0 $ 0 $ 0 $ 0 $ 0 $ 0 $ 2,200,000 $ 50,234,000
CONDUIT PROJECTS
Number of Units Financed 0 0 0 0 620 36 188 337 1217 1016
Loan Amounts $ 0 $ 0 $ 0 $ 0 $ 119,400,000 $ 4,550,000 $ 29,650,000 $ 59,146,886 $ 275,338,000 $ 290,183,231
Number of Units Financed - To Date 0 0 0 0 3813 3849 4037 4374 5591 6607
LOAN AMOUNTS – TO DATE $ 0 $ 0 $ 0 $ 0 $ 372,262,560 $ 376,812,560 $ 406,462,560 $ 465,609,446 $ 740,947,446 $1,031,130,677
SPECIAL NEEDS HOUSING PROGRAM
Number of Units Financed 0 0 0 0 0 0 0 0 0 65
Loan Amounts $ 0 $ 0 $ 0 $ 0 $ 0 $ 0 $ 0 $ 0 $ 0 $ 1,200,000
Number of Units Financed - To Date 0 0 0 0 0 0 0 0 0 65
LOAN AMOUNTS – TO DATE $ 0 $ 0 $ 0 $ 0 $ 0 $ 0 $ 0 $ 0 $ 0 $ 1,200,000
*Segregated report was not available prior to 2012.Source: CalHFA data
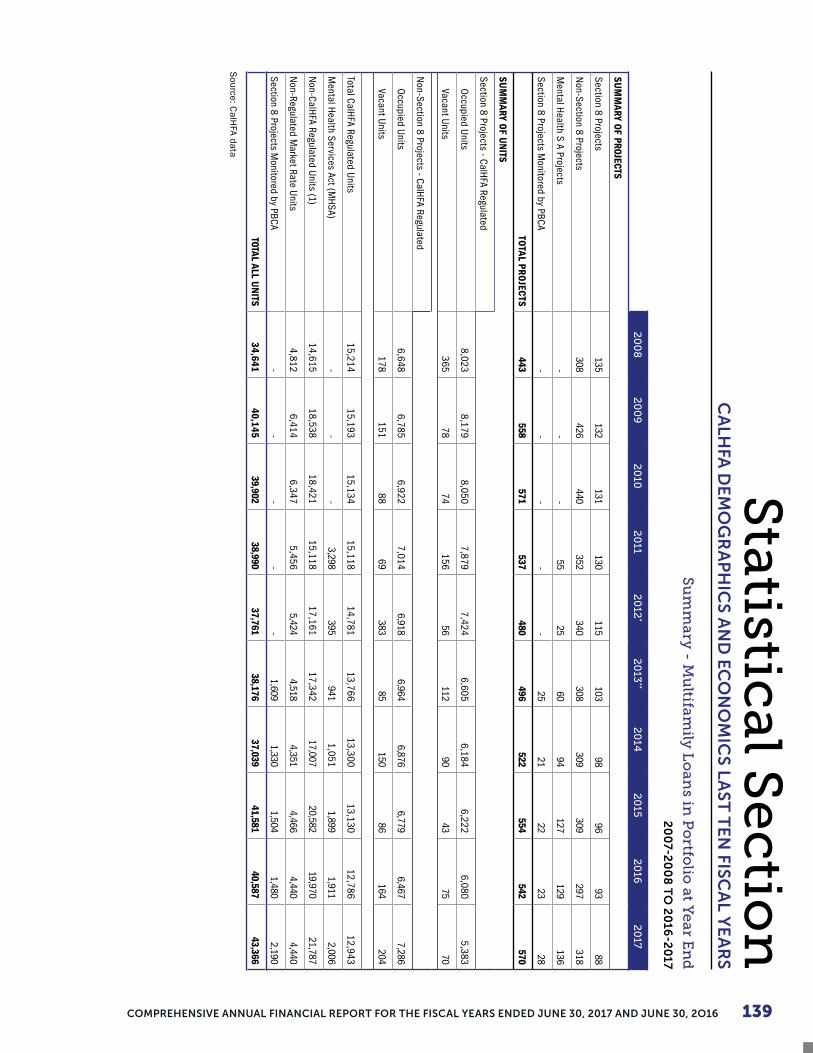
COMPREHENSIVE ANNUAL FINANCIAL REPORT FOR THE FISCAL YEARS ENDED JUNE 30, 2017 AND JUNE 30, 2O16 139
Sta
tistical S
ectio
nS
um
ma
ry - M
ultifa
mily
Lo
an
s in P
ortfo
lio at Y
ea
r En
d2
00
7-20
08
TO
20
16-2
017
20
08
20
09
20
102
011
20
12*
20
13**
20
142
015
20
162
017
SUM
MARY OF PROJECTS
Section 8 Projects135
132131
130115
10398
9693
88
Non-Section 8 Projects
308426
440352
340308
309309
297318
Mental Health S A Projects
--
-55
2560
94127
129136
Section 8 Projects Monitored by PBCA
--
--
-25
2122
2328
TOTAL PRO
JECTS
443558
571537
480496
522554
542570
SUM
MARY OF U
NITS
Section 8 Projects - CalHFA Regulated
Occupied Units
8,0238,179
8,0507,879
7,4246,605
6,1846,222
6,0805,383
Vacant Units365
7874
15656
11290
4375
70
Non-Section 8 Projects - CalHFA Regulated
Occupied Units
6,6486,785
6,9227,014
6,9186,964
6,8766,779
6,4677,286
Vacant Units178
15188
69383
85150
86164
204
Total CalHFA Regulated Units15,214
15,19315,134
15,11814,781
13,76613,300
13,13012,786
12,943
Mental Health Services Act (M
HSA)-
--
3,298395
9411,051
1,8991,911
2,006
Non-CalHFA Regulated Units (1)
14,61518,538
18,42115,118
17,16117,342
17,00720,582
19,97021,787
Non-Regulated M
arket Rate Units4,812
6,4146,347
5,4565,424
4,5184,351
4,4664,440
4,440
Section 8 Projects Monitored by PBCA
--
--
-1,609
1,3301,504
1,4802,190
TOTAL ALL UNITS
34,64140,145
39,90238,990
37,76138,176
37,03941,581
40,58743,366
Source: C
alHFA data
CA
LHFA
DE
MO
GR
AP
HIC
S A
ND
EC
ON
OM
ICS
LA
ST
TE
N FISC
AL Y
EA
RS

CALIFORNIA HOUSING FINANCE AGENCY, A COMPONENT UNIT OF THE STATE OF CALIFORNIA140
NUMBER OF CALHFA EMPLOYEES FOR THE LAST TEN FISCAL YEARS
2008 2009 2010 2011 2012 2013 2014 2015 2016 2017
Executive 9 6 6 7 6 7 7 6 7 7
General Counsel 21 20 20 18 18 18 20 19 16 12
Financing & Fiscal Services 61 56 56 56 58 58 57.5 55.5 50.5 45
Administration 18 17 17 20 17 22 19 17 18 16
Information Technology 19 17 17 17 16 19 18 20 18 18
Marketing 8 8 8 7 6 7 8 6 6 7
Loan Servicing 20 19 21 22 24 32 24 19 23 23
Multifamily & Asset Management 58 60 58 56 55 48 49 48 46.5 50
Single Family Lending 71 68 62 63 54 55 59 53 46 41
TOTAL 285 271 265 266 254 266 261.5 243.5 231 219
Source: CalHFA Administration DivisionNote: Staffing levels are based on actual number of employees as of June 30 of each year.

STATUTORY REQUIREMENTS
2016/17
WE RISE BY LIFTING OTHERS.– ROBERT INGERSOLL -

CALIFORNIA HOUSING FINANCE AGENCY, A COMPONENT UNIT OF THE STATE OF CALIFORNIA142
This page intentionally left blank.
143STATUTORY REQUIREMENTS FISCAL YEAR 2016-2017
Statutory RequirementsSTATISTICAL NARRATIVE
Section 51005 of the Health and Safety Code requires that the Agency provide certain information under the fifteen categories specified in Section 51005(b) as part of the Annual Report due under Section 51005(a).
Section 51005(a): the report shall ... include a statement of accomplishment during the previous year with respect to the agency's progress, priorities, and affirmative action efforts. The agency shall specifically include in its report on affirmative action goals, statistical data on the numbers and percentages of minority sponsors, developers, contractors, subcontractors, suppliers, architects, engineers, attorneys, mortgage bankers or other lenders, insurance agents, and managing agents.
Pursuant to Proposition 209 (also referenced as Article 1, Section 31 of the California Constitution), the California Housing Finance Agency (CalHFA) does not give preferences in awarding contracts based upon race or gender.
Pursuant to federal and state law, the Agency requires affirmative marketing for all housing developments to assure that housing opportunities generated by CalHFA provide attractive housing options in diverse locations for low income, disabled and senior households, and are open to all regardless of race, sex, sexual orientation, marital status, religion, national origin, ancestry, familial status or disability.
The following information is submitted in narrative form as it relates to the requirement of the referenced code sections [paragraph numbers correspond to the subparagraphs of Section 51005(b)]:
(1) The primary purpose of the agency in meeting the housing needs of persons and families of low and moderate income pursuant to Section 50950.
The Agency meets the housing needs of persons and families of low to moderate income to the extent that it satisfies its specific objectives as outlined in Section 50952:
(a) Acquisition of the maximum amount of funds available for subsidies for the benefit of persons and families of low to moderate income occupying units financed pursuant to the statute.
Multifamily – CalHFA has sought to acquire the maximum amount of funds available to it under the federal rental housing subsidy (Section 8) contract authority. CalHFA also encourages the sponsors to request and accept renewals on all rental housing subsidy contracts that are part of the approved financing on any given multifamily development. In addition, the Agency has combined its financing with participation and contributions from governmental entities utilizing federal, state, county and local resources including but not limited to FHA insurance, Low Income Housing Tax Credits (LIHTC), federally tax-exempt bonds, tax increment and agency funds, and State Department of Housing and Community Development funds.
Single Family Lending – Utilizing tax exempt authority available from the California Debt Limit Allocation Committee, the Agency created a Mortgage Credit Certificate (MCC) program in 2013. The program is offered in areas of the State not covered by locality MCC programs, or if the locality depleted their authority.

CALIFORNIA HOUSING FINANCE AGENCY, A COMPONENT UNIT OF THE STATE OF CALIFORNIA144
STATISTICAL NARRATIVE
Further assisting low to moderate homebuyers, CalHFA offers a variety of FHA, Conventional and down payment loan products that provide both first-time and non-first-time California homebuyers the opportunity to purchase a house with an affordable mortgage.
(b) Housing developments providing a socially harmonious environment by meeting the housing needs of both very low income households and other persons and families of low to moderate income and by avoidance of concentration of very low income households that may lead to deterioration of a development.
Multifamily – The present multifamily rental programs of the Agency integrate very low and low income housing opportunities with market rate rentals whenever possible. All of CalHFA's housing developments are planned and designed to visually and physically integrate all elements of a housing complex into a socially harmonious environment. There are no visual or physical differences between units to be occupied by the very low income, low income or market rate tenants. The Agency requires that asset management personnel ensure that developments maintain high quality rental units. Housing developments are required to distribute low or very low income units throughout the development.
Single Family Lending – The Agency’s loan programs are designed to provide funding models as market conditions permit, to meet housing needs throughout the state. The programs are designed to provide financing to low and moderate income homebuyers purchasing homes in all counties. Through the Agency's single family loan reservation system, lenders can reserve a loan without the loan being pre-approved. This encourages widespread utilization of funds.
(c) Emphasis on housing developments of superior design, appropriate scale and amenities, and on sites convenient to areas of employment, shopping, and public facilities.
Multifamily – CalHFA developments and amenities are visually (architecturally) reflective of comparable market projects within a locale, being indistinguishable as a low income project. In addition, local participation typically includes architectural design requirements that keep the design comparable to other apartment buildings in the neighborhood. Whenever market conditions allow, CalHFA has encouraged the development of larger units to accommodate larger low income and other families. Within a development, a proportionate share of all unit types is reserved for low income families.
Single Family Lending – The Single Family Lending Division provides mortgage products to low and moderate income borrowers throughout the State. This division continually provides additional funds to assist in financing the purchase of new and existing homes. It also ensures that affordable financing is available to assist low and moderate /income households to enjoy the amenities and benefits of homeownership in developments that meet their family need. All properties must be in good condition and satisfy lender requirements.
145STATUTORY REQUIREMENTS FISCAL YEAR 2016-2017
Statutory RequirementsSTATISTICAL NARRATIVE
(d) Increasing the range of housing choices for minorities in lower income households and other lower income households, rather than maintaining or increasing the impaction of low income areas, and cooperation in implementation of local and area wide housing allocation plans adopted by cities, counties, and joint powers entities made up of counties and cities.
Multifamily – In compliance with applicable laws, the Agency requires affirmative marketing and adequate placement for all projects to assure that housing opportunities assisted by CalHFA and other financing mechanisms provide attractive housing options in diverse locations for low income families, disabled, and senior households.
(e) Reducing the cost of mortgage financing for rental and cooperative housing to provide lower rent for persons and families of low or moderate income.
Multifamily – Through the sale of tax exempt bonds, voter initiatives and other financing mechanisms, the Agency delivers low-cost mortgages to developers who then pass along this benefit to lower income tenants through reduced rents. The Agency also uses available subsidy funds to lower the cost of preserving affordable rental developments. CalHFA has also entered into a partnership with HUD/FHA and the Federal Finance Bank under the Risk Share program to provide low cost 40 year fixed rate financing for affordable housing developments.
(f) Reducing the cost of mortgage financing for home purchase, in order to make homeownership feasible for persons and families of low or moderate income.
Single Family Lending – The Agency provides first time homebuyers down payment and/or closing cost assistance through various programs such as the Zero Interest Program (ZIP) and the MyHome Assistance Program. The result is a financing structure well suited for low to moderate homebuyers.
These programs complement first mortgage lending programs offered by CalHFA-approved lenders throughout the State.
(g) Identification of areas of low vacancy rates where construction is needed, of areas of substandard housing where rehabilitation is needed, and of areas of credit shortage where financing is needed for transfer of existing housing, so as to maximize the impact of financing activities on employment, reduction of housing costs, and maintenance of local economic activity.
Multifamily – Within every multifamily development the Agency ensures there are benefits derived from building the project, i.e., construction and related employment, etc. As part of its underwriting considerations, the Agency examines critical factors including vacancy rates, market demand and cost feasibility.
Single Family Lending – The Agency has identified federally designated targeted areas in need of mortgage credit, new housing construction or rehabilitation and community revitalization. Under federal tax laws, CalHFA is required to commit 20% of any tax-exempt bond issue to federally-designated targeted areas for 12 months.

CALIFORNIA HOUSING FINANCE AGENCY, A COMPONENT UNIT OF THE STATE OF CALIFORNIA146
STATISTICAL NARRATIVE
(h) A balance between urban metropolitan, non-metropolitan, and rural metropolitan housing developments, and between family housing and housing for the elderly and handicapped, in general proportion to the needs identified in the California Statewide Housing Plan.
Multifamily – The Agency is required by statute to use the Statewide Housing Plan for the allocation of Agency funds. A new draft Statewide Housing Plan 2015-2025 was issued by HCD in January 2017. CalHFA is reviewing the document and will use the data it includes to inform its program development. The Agency will align its goals with current, relevant data and policy.
Single Family Lending – It is CalHFA’s goal to meet the housing needs of low to moderate income homebuyers on a continuous basis by making financing available for the purchase of newly constructed and existing homes in every county of the state. Through the Homeownership Program, CalHFA develops loan programs and strategies to promote the equitable distribution of funds throughout California.
(i) Minimization of fees and profit allowances of housing sponsors so far as consistent with acceptable performance, in order to maximize the benefit to persons and families of low to moderate income occupying units financed by the Agency.
Multifamily – The Agency reviews development fees and verifies that the fees charged comply with the limitations of other state funding sources.
Single Family Lending – CalHFA limits the lender fees and points charged under our lending programs. In addition, Dodd-Frank also places detailed limits on any lender fees.
(j) Full utilization of federal subsidy assistance for the benefit of persons and families of low or moderate income.
Multifamily – See (a) on page 1 of this statistical section.
(k) Full cooperation and coordination with the local public entities of the State in meeting the housing needs of cities, counties, and Indian reservations and rancherias on a level of government that is as close as possible to the people it serves.
Multifamily and Single Family Lending – The Agency markets its programs in a manner which seeks out development projects and individual loan commitments that provide funds for the purchase of homes sponsored by local public entities and nonprofit or for profit developers working with cities and/or counties. The Agency has provided incentives for these developments. In addition, the Agency also works with local governmental entities, State agencies and non-profits that provide other sources of subsidy or financing to help make affordable housing available to low income families. CalHFA outreaches directly to cities and counties in an effort to acquaint relevant officials with programs offered by the Agency. The draft Statewide Housing Plan includes a separate study of Native American community housing needs and challenges and CalHFA will review the study as part of the overall plan review.

147STATUTORY REQUIREMENTS FISCAL YEAR 2016-2017
Statutory RequirementsSTATISTICAL NARRATIVE
(l) Promoting the recovery and growth of economically depressed business located in areas of minority concentration and in mortgage deficient areas.
Multifamily – CalHFA works in cooperation with local public entities, such as housing authorities, to coordinate financing to meet local housing needs and promote the revitalization of urban areas.
Single Family Lending – The homeownership programs promote the growth and recovery of business activity by assisting permanent mortgage financing in all areas of the State and in particular to federally designated targeted areas. CalHFA attempts to distribute all mortgage products on an equitable basis throughout the State, creating marketing plans to increase lending activity in under served areas.
(m) Revitalization of deteriorating and deteriorated urban areas by attracting a full range of income groups to central city areas to provide economic integration with persons and families of low or moderate income in those areas.
Multifamily – Development of CalHFA projects in central city areas has resulted in the replacement and our rehabilitation of substandard housing while increasing or preserving of the supply of housing units available. CalHFA projects have assisted with the revitalization of urban areas by providing visual activity of constructive neighborhood improvement, resulting in a wider range of housing opportunities and choices within depressed areas of the city and discouraging migration outside the inner city neighborhoods. This development has increased the quality of housing units available, provided the type of mixed income and market rate projects that have attracted a diversity of groups for a more dynamic economic integration and transformed vacant and/or blighted lots into useful housing infrastructure.
Single Family Lending – The Agency distributes to CalHFA lenders throughout the State the special Federal income and sales price limits established for federally designated targeted areas in order to encourage a range of income groups to buy homes. Competitive interest rates and the availability of CalHFA down payment assistance programs improve affordability for low to moderate income buyers in these areas. All of the above help to contribute to the revitalization of these targeted areas.
(n) Implementation of the goals, policies, and objectives of the California Statewide Housing Plan.
Multifamily and Single Family Lending – The above-referenced programs, through program design and marketing, are designed to meet the goals of the Plan.
(o) Location of housing in public transit corridors with high levels of service.
Multifamily – CalHFA works in partnership with local public agencies, many of which promote Transit Oriented development. Low Income Housing Tax Credits also provide incentives for development near transit. CalHFA multifamily lending products are compatible with Transit Oriented development.

CALIFORNIA HOUSING FINANCE AGENCY, A COMPONENT UNIT OF THE STATE OF CALIFORNIA148
STATISTICAL NARRATIVE
Single Family Lending – The amount of down payment assistance offered under the MyHome Assistance Program is 5% of the purchase price or the appraised value (whichever is less) for borrowers purchasing a newly constructed home in specific Transit Village Development Districts, Transit Oriented Development Plan Area or Infill Opportunity Zone, (eligible areas).
(p) Reducing the cost of mortgage financing for rental housing development in order to attract private and pension fund investment in such developments.
The Agency's low interest rate mortgage financing for rental housing developments attracts private equity investment, especially in those circumstances where the federal low income housing tax credit is available. Pension funds have not yet been equity investors in any Agency financed rental housing developments.
(q) Reducing the cost of mortgage financing for second unit rental housing, as defined by Section 65852.2 of the Government Code, in order to make rental housing more affordable for elderly persons and persons and families of low or moderate income.
As outlined in the Agency's June 23, 1993 Report to the Legislature, the Agency does not have a loan program for second units. Prior attempts to market such a program were not successful.
(2) The occupancy requirements for very low income households established pursuant to Sections 50951 and 51226.
Sections 50951, 51226 and 51226.5 contain various priority requirements for housing development financing. If adequate subsidies are available, certain percentages (which vary depending upon the type of financing and type of developments, and whether they are federally insured) of the total units financed must be made available to very low income households
This information is provided in Tables IV-2 and IV-3 on pages 167 and 168 of the statutory section.
(3) The elderly and orthopedic disability occupancy requirements established pursuant to Section 51230.
Section 51230. Percentage of units allocated for occupancy by elderly persons.
This information is provided in Table II-5 on page 161 of the statutory section.
Subsequent to Section 51230's enactment, the number of laws governing handicapped accessibility for multifamily rental housing have greatly increased. The Agency requires that the design of all newly constructed units comply with the applicable accessibility requirements.
(4) The use of surplus moneys pursuant to Section 51007.
Section 51007. Subject to any agreements with holders of particular bonds, all moneys available for carrying out the purposes of this part and declared by the agency to be surplus moneys which are not required to service or retire bonds issued on behalf of the agency, pay
149STATUTORY REQUIREMENTS FISCAL YEAR 2016-2017
Statutory RequirementsSTATISTICAL NARRATIVE
administrative expenses of the agency, accumulate necessary operating or loss reserves, or repay loans to the agency from the General Fund shall be used by the agency, with respect to existing housing developments, to provide special interest reduction programs, financial assistance for housing developments or subsidies for occupants or owners thereof, or counseling programs, as authorized by this division.
As of June 30, 2017, there were no funds derived from the issuance of bonds by the Agency, which can be declared surplus moneys. All moneys available to the Agency are, subject to agreement with the bondholders, required to service or retire bonds issued on behalf of the Agency, repay loans, pay administrative expenses of the Agency, and accumulate necessary operating reserves (including swap collateral posting and loan warehousing) or loan loss reserves.
(5) The metropolitan, non-metropolitan, and rural goals established pursuant to subdivision (h) of Section 50952.
This information is provided in Table I-1 on page 152, and the Tables I-2,3,4 on pages 153-155 and paragraph (h) on page 146 of the statutory section.
(6) The California Statewide Housing Plan, as provided by Section 50154.
See paragraph (h) on page 146. In general, CalHFA programs seek to implement the goals, policies and objectives of the Plan and attempt to meet the housing needs outlined in the Plan.
(7) The statistical and other information developed and maintained pursuant to Section 51610.
The California Housing Loan Insurance Fund (Fund) insures loans made by the Agency and other lenders which finance the acquisition of residential units in California. The Fund has requested to withdraw its ratings from both Standard and Poor’s and Moody’s rating agencies.
For 2016-2017, the Fund insured no new mortgages. At fiscal year-end, there were 1,576 active mortgage certificates for $417.1 million.
During this fiscal year, 66 claims were received, totaling $4.6 million. Claims are paid through a risk share reinsurance arrangement with Genworth Mortgage Insurance Inc. The Fund schedules its share of claim payments from premium funds as they are received.
At fiscal year-end, there were 77 insured loans reported delinquent 120+ days totaling $18.5 million.
(8) The number of manufactured housing units assisted by the agency.
Within the Home Mortgage Purchase program, the Agency has provided financing for 1,052 manufactured housing units since 1983. While the Agency periodically explores new innovations in the area of manufactured housing, seeking to apply this product type to CalHFA programs, the Agency purchased no loans for manufactured housing properties in Fiscal Year 2016-17.
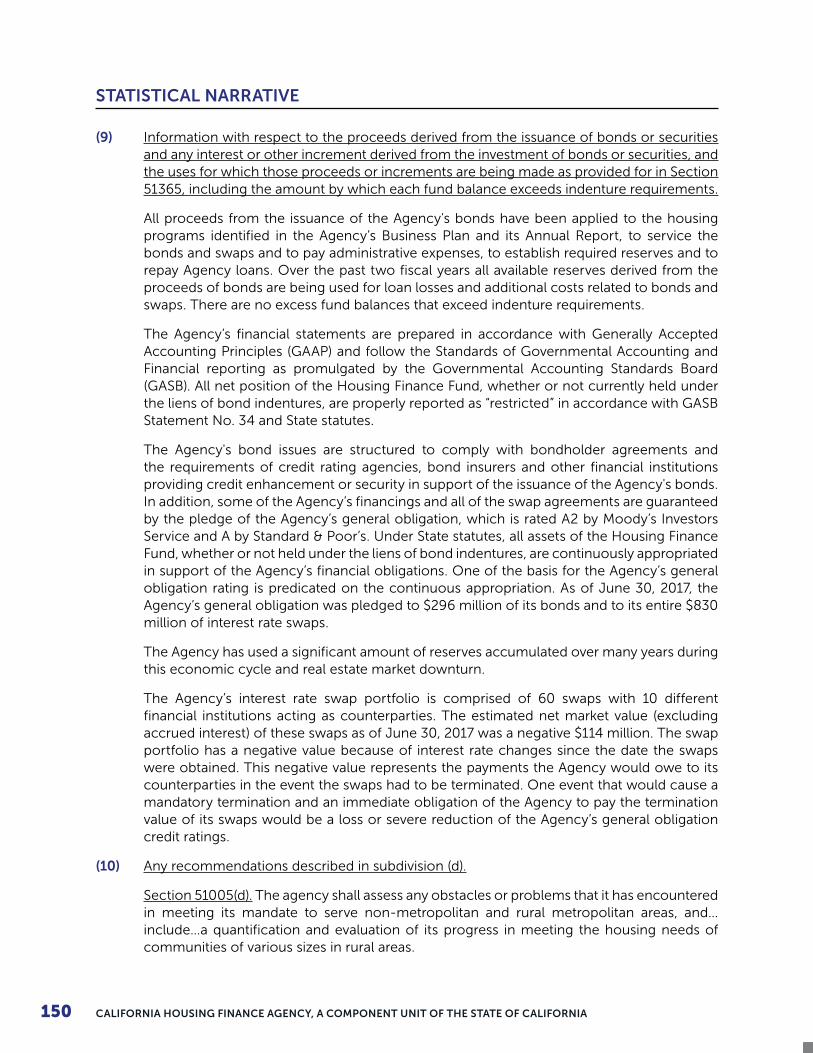
CALIFORNIA HOUSING FINANCE AGENCY, A COMPONENT UNIT OF THE STATE OF CALIFORNIA150
STATISTICAL NARRATIVE
(9) Information with respect to the proceeds derived from the issuance of bonds or securities and any interest or other increment derived from the investment of bonds or securities, and the uses for which those proceeds or increments are being made as provided for in Section 51365, including the amount by which each fund balance exceeds indenture requirements.
All proceeds from the issuance of the Agency's bonds have been applied to the housing programs identified in the Agency’s Business Plan and its Annual Report, to service the bonds and swaps and to pay administrative expenses, to establish required reserves and to repay Agency loans. Over the past two fiscal years all available reserves derived from the proceeds of bonds are being used for loan losses and additional costs related to bonds and swaps. There are no excess fund balances that exceed indenture requirements.
The Agency’s financial statements are prepared in accordance with Generally Accepted Accounting Principles (GAAP) and follow the Standards of Governmental Accounting and Financial reporting as promulgated by the Governmental Accounting Standards Board (GASB). All net position of the Housing Finance Fund, whether or not currently held under the liens of bond indentures, are properly reported as “restricted” in accordance with GASB Statement No. 34 and State statutes.
The Agency's bond issues are structured to comply with bondholder agreements and the requirements of credit rating agencies, bond insurers and other financial institutions providing credit enhancement or security in support of the issuance of the Agency's bonds. In addition, some of the Agency’s financings and all of the swap agreements are guaranteed by the pledge of the Agency’s general obligation, which is rated A2 by Moody’s Investors Service and A by Standard & Poor’s. Under State statutes, all assets of the Housing Finance Fund, whether or not held under the liens of bond indentures, are continuously appropriated in support of the Agency’s financial obligations. One of the basis for the Agency’s general obligation rating is predicated on the continuous appropriation. As of June 30, 2017, the Agency’s general obligation was pledged to $296 million of its bonds and to its entire $830 million of interest rate swaps.
The Agency has used a significant amount of reserves accumulated over many years during this economic cycle and real estate market downturn.
The Agency’s interest rate swap portfolio is comprised of 60 swaps with 10 different financial institutions acting as counterparties. The estimated net market value (excluding accrued interest) of these swaps as of June 30, 2017 was a negative $114 million. The swap portfolio has a negative value because of interest rate changes since the date the swaps were obtained. This negative value represents the payments the Agency would owe to its counterparties in the event the swaps had to be terminated. One event that would cause a mandatory termination and an immediate obligation of the Agency to pay the termination value of its swaps would be a loss or severe reduction of the Agency’s general obligation credit ratings.
(10) Any recommendations described in subdivision (d).
Section 51005(d). The agency shall assess any obstacles or problems that it has encountered in meeting its mandate to serve non-metropolitan and rural metropolitan areas, and…include…a quantification and evaluation of its progress in meeting the housing needs of communities of various sizes in rural areas.

151STATUTORY REQUIREMENTS FISCAL YEAR 2016-2017
Statutory RequirementsSTATISTICAL NARRATIVE
The MyHome Assistance Program provides down payment assistance and is available in rural areas throughout California.
Additional information is provided in Table I-1 on page 152, and the Tables I-2, 3, 4 on pages 153-155 of the statutory section.
(11) Section 51227. At the close of each fiscal year, the agency must ascertain that not less than 25 percent of the total units financed by mortgage loans during the preceding 12 months were made available to very low income households. In addition, at the close of each fiscal year the agency must ascertain that not less than 25 percent of all units financed by mortgage loans are occupied or available to very low income households.
Tables IV-2 and IV-3 on pages 167 and 168 of the statutory section.
(12) The revenue bonding authority plan adopted pursuant to Section 51004.5.
This information is provided in Table III-1 on page 165 of the statutory section.
(13) The statistical and other information required to be provided pursuant to Section 50156.
The California Housing Finance Agency shall provide to the Legislature and the Legislative Analyst, in each annual report required by Section 51005, information concerning all units produced, assisted, or insured using agency funds. This information shall include, but shall not be limited to, the sales prices of these units, the number of units within various price ranges or price classifications, the rents being charged for the units, the number of rental units within each price range, the number of households by income level purchasing the units, and the number by household income occupying the rental units.
This information is provided in the Tables in pages 156-164 of the statutory section.
(14) An analysis of the agency's compliance with the targeting requirements of subsection (d) of Section 142 of the Internal Revenue Code of 1986 (26 U.S.C. Sec. 142) with respect to any issue of bonds subject to those requirements under Section 103 of the Internal Revenue Code of 1986 (26 U.S.C. Sec. 103), including the numbers of rental units subject to this reporting requirement by categories based on the number of bedrooms per unit.
This information is provided in Table II-1 on page 156 of the statutory section.
(15) The statistical and other information relating to congregate housing for the elderly pursuant to Section 51218.
At the close of each fiscal year, commencing with the fiscal year ending June 30, 1988, the agency shall, as part of its annual report required to be prepared pursuant to Section 51005, report on its progress in implementing this article. The report shall contain a discussion of the affirmative steps the agency has taken to ensure that congregate housing for the elderly is developed. The report also shall contain recommendations for legislation or other action that would assist the agency in implementing this article.
Although the Agency continues to finance rental properties for seniors under other authority, no bonds or projects have been financed specifically as a result of Article 5.7. CalHFA continues to evaluate the financial viability of affordable assisted living projects.
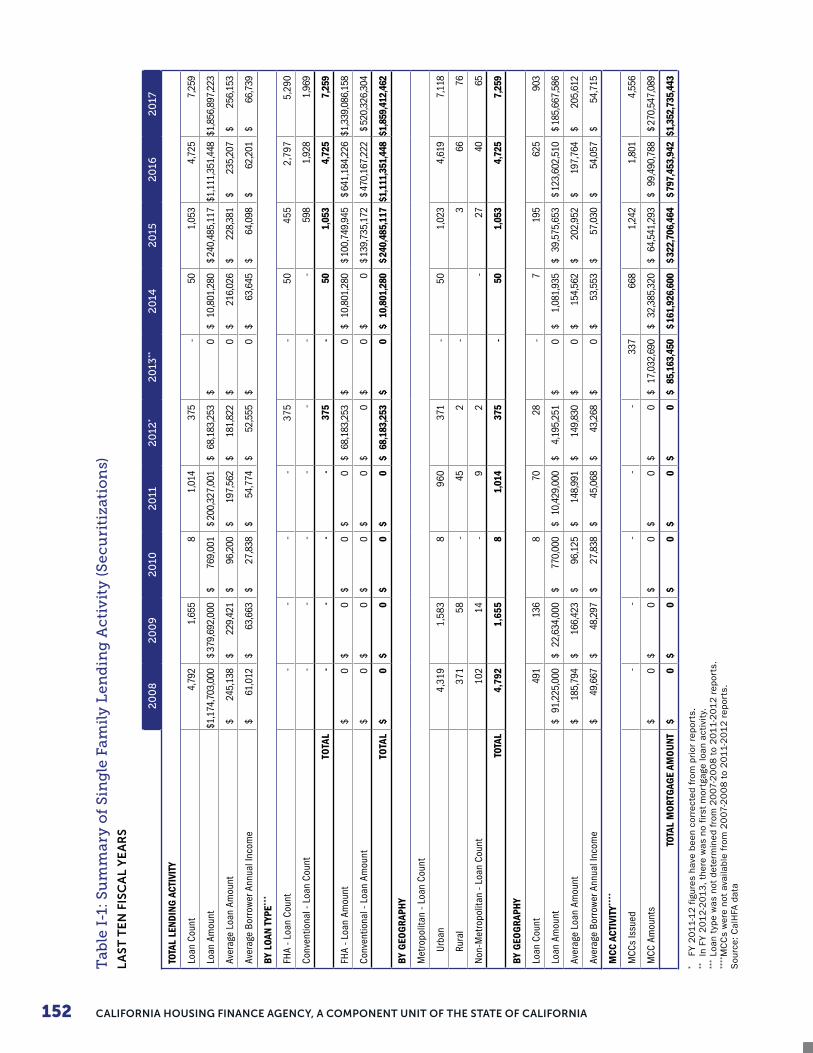
152 CALIFORNIA HOUSING FINANCE AGENCY, A COMPONENT UNIT OF THE STATE OF CALIFORNIA
Tab
le I
-1:
Su
mm
ary
of
Sin
gle
Fa
mil
y L
end
ing
Ac
tiv
ity
(S
ec
uri
tiza
tio
ns)
LA
ST
TE
N F
ISC
AL
YE
AR
S
20
08
20
09
20
102
011
20
12*
20
13**
20
142
015
20
162
017
TOTA
L LE
NDIN
G A
CTIV
ITY
Loan
Cou
nt4,
792
1,65
58
1,01
437
5 -
501,
053
4,72
57,
259
Loan
Am
ount
$ 1,1
74,7
03,0
00$
379,
692,
000
$ 76
9,00
1$
200,
327,
001
$ 68
,183
,253
$ 0
$ 10
,801
,280
$ 24
0,48
5,11
7$ 1
,111
,351
,448
$ 1,8
56,8
97,2
23
Aver
age
Loan
Am
ount
$ 24
5,13
8$
229,
421
$ 96
,200
$ 19
7,56
2$
181,
822
$ 0
$ 21
6,02
6$
228,
381
$ 23
5,20
7$
256,
153
Aver
age
Borr
ower
Ann
ual I
ncom
e$
61,0
12$
63,6
63$
27,8
38$
54,7
74$
52,5
55$
0$
63,6
45$
64,0
98$
62,2
01$
66,7
39
BY L
OAN
TYPE
***
FHA
- Loa
n Co
unt
--
--
375
- 50
455
2,79
75,
290
Conv
entio
nal -
Loa
n Co
unt
--
--
- -
- 59
81,
928
1,96
9
TOTA
L-
--
-37
5 -
501,
053
4,72
57,
259
FHA
- Loa
n Am
ount
$ 0
$ 0
$ 0
$ 0
$ 68
,183
,253
$ 0
$ 10
,801
,280
$ 10
0,74
9,94
5$
641,
184,
226
$ 1,3
39,0
86,1
58
Conv
entio
nal -
Loa
n Am
ount
$ 0
$ 0
$ 0
$ 0
$ 0
$ 0
$ 0
$ 13
9,73
5,17
2$
470,
167,
222
$ 52
0,32
6,30
4
TOTA
L$
0$
0$
0$
0$
68,1
83,2
53$
0$
10,8
01,2
80$
240,
485,
117
$ 1,1
11,3
51,4
48$ 1
,859
,412
,462
BY G
EOG
RAPH
Y
Met
ropo
litan
- Lo
an C
ount
Urba
n 4,
319
1,58
38
960
371
- 50
1,02
34,
619
7,11
8
Rura
l37
158
- 45
2 -
366
76
Non
-Met
ropo
litan
- Lo
an C
ount
102
14 -
92
- 27
4065
TOTA
L4,
792
1,65
58
1,01
437
5 -
501,
053
4,72
57,
259
BY G
EOG
RAPH
Y
Loan
Cou
nt49
113
68
7028
- 7
195
625
903
Loan
Am
ount
$ 91
,225
,000
$ 22
,634
,000
$ 77
0,00
0$
10,4
29,0
00$
4,19
5,25
1$
0$
1,08
1,93
5$
39,5
75,6
53$
123,
602,
510
$ 18
5,66
7,58
6
Aver
age
Loan
Am
ount
$ 18
5,79
4$
166,
423
$ 96
,125
$ 14
8,99
1$
149,
830
$ 0
$ 15
4,56
2$
202,
952
$ 19
7,76
4$
205,
612
Aver
age
Borr
ower
Ann
ual I
ncom
e$
49,6
67$
48,2
97$
27,8
38$
45,0
68$
43,2
68$
0$
53,5
53$
57,0
30$
54,0
57$
54,7
15
MCC
ACT
IVIT
Y****
MCC
s Is
sued
--
--
-33
766
81,
242
1,80
14,
556
MCC
Am
ount
s$
0$
0$
0$
0$
0$
17,0
32,6
90$
32,3
85,3
20$
64,5
41,2
93$
99,4
90,7
88$
270,
547,
089
TOTA
L M
ORTG
AGE
AMOU
NT$
0$
0$
0$
0$
0$
85,1
63,4
50$
161,
926,
600
$ 32
2,70
6,46
4$
797,
453,
942
$ 1,3
52,7
35,4
43
* FY
20
11-
12 f
igur
es h
ave
been
cor
rect
ed f
rom
prior
rep
orts
.**
In
FY
20
12
-20
13
, th
ere
was
no
firs
t m
ortg
age
loan
act
ivit
y.**
* Lo
an t
ype
was
not
det
erm
ined
fro
m 2
007-
20
08 t
o 2
01
1-2
01
2 r
epor
ts.
****
MC
Cs
wer
e no
t av
aila
ble
from
20
07-
20
08 t
o 2
01
1-2
01
2 r
epor
ts.
Sou
rce:
Cal
HFA
dat
a

153STATUTORY REQUIREMENTS FISCAL YEAR 2016-2017
Statutory Requirements
Table I-2A: Single Family Loans by Sales Price (Revised Sales Price Range)***
LAST TEN FISCAL YEARS
2011-2012* 2012-2013** 2013-2014 2014-2015 2015-2016 2016-2017
SALES PRICE COUNT % COUNT % COUNT % COUNT % COUNT % COUNT %
Less than $100,000 27 7% - 0% 2 4% 21 2% 73 2% 48 0.66%
$100,001 to $150,000 101 27% - 0% 4 8% 135 13% 472 10% 478 6.58%
$150,001 to $200,000 98 26% - 0% 16 32% 226 21% 1048 22% 1363 18.78%
$200,001 to $250,000 85 23% - 0% 11 22% 229 22% 1184 25% 1793 24.70%
$250,001 to $300,000 43 11% - 0% 10 20% 197 19% 821 17% 1400 19.29%
$300,001 to $350,000 11 3% - 0% 6 12% 152 14% 579 12% 960 13.22%
$350,001 and over 10 3% - 0% 1 2% 93 9% 548 12% 1217 16.77%
TOTAL 375 100% - 0% 50 100% 1,053 100% 4725 100% 7259 100%
***Sales Price range was revised starting the year 2011-2012 report.
Table I-2: Single Family Loans by Sales Price (Old Sales Price Range)***
LAST TEN FISCAL YEARS
2007-2008 2008-2009 2009-2010 2010-2011*
COUNT % COUNT % COUNT % COUNT %
Less than $80,000 11 0% 4 0% 2 25% 21 2%
$80,001 to $100,000 18 0% 13 1% 3 38% 45 4%
$100,001 to $120,000 61 1% 56 3% 3 38% 97 10%
$120,001 to $140,000 134 3% 80 5% 0 0% 92 9%
$140,001 to $160,000 240 5% 107 6% 0 0% 109 11%
$160,001 to $180,000 339 7% 122 7% 0 0% 95 9%
$180,001 to $200,000 404 8% 136 8% 0 0% 91 9%
$200,001 to $220,000 481 10% 124 7% 0 0% 85 8%
$220,001 to $240,000 436 9% 126 8% 0 0% 74 7%
$240,001 to $260,000 369 8% 129 8% 0 0% 66 7%
$260,001 to $280,000 337 7% 113 7% 0 0% 48 5%
$280,001 and over 1,962 41% 645 39% 0 0% 191 19%
TOTAL 4,792 100% 1,655 100% 8 100% 1,014 100%
* CalHFA securitization of 1,1014 mortgages for a total amount of $200,327,755.***Sales Price range was revised starting the year 2011-2012 report.

CALIFORNIA HOUSING FINANCE AGENCY, A COMPONENT UNIT OF THE STATE OF CALIFORNIA154
Table I-3A: Single Family Loans by Borrower Income (Revised Income Range)***
LAST TEN FISCAL YEARS
2011-2012 2012-2013** 2013-2014 2014-2015 2015-2016 2016-2017
BORROWER INCOME COUNT % COUNT % COUNT % COUNT % COUNT % COUNT %
Less than $25,000 17 5% - 0% - 0% 15 1% 57 1% 64 0.88%
$25,001 to $40,000 79 21% - 0% 3 6% 97 9% 514 11% 620 8.54%
$40,001 to $55,000 124 33% - 0% 19 38% 264 25% 1,223 26% 1,646 22.68%
$55,001 to $70,000 91 24% - 0% 12 24% 283 27% 1,349 29% 1,952 26.89%
$70,001 to $85,000 48 13% - 0% 11 22% 230 22% 993 21% 1,542 21.24%
$85,001 to $100,000 11 3% - 0% 3 6% 122 12% 465 10% 925 12.74%
$100,001 and over 5 1% - 0% 2 4% 42 4% 124 3% 510 7.03%
TOTAL 375 100% - 0% 50 100% 1,053 100% 4,725 100% 7,259 100%
* FY 2011-12 figures have been corrected from prior reports.** In FY 2012-2013, there was no first mortgage loan activity.***Income range was revised starting the year 2011-2012 report.
Table I-3: Single Family Loans by Borrower Income (Old Income Range)***
LAST TEN FISCAL YEARS
2007-2008 2008-2009 2009-2010 2010-2011*
COUNT % COUNT % COUNT % COUNT %
Less than $25,000 99 2% 24 1% 2 25% 43 4%
$25,001 to $30,000 118 2% 35 2% 3 38% 45 4%
$30,001 to $35,000 223 5% 57 3% 3 38% 60 6%
$35,001 to $40,000 265 6% 102 6% 0 0% 98 10%
$40,001 to $45,000 348 7% 134 8% 0 0% 101 10%
$45,001 to $50,000 426 9% 141 9% 0 0% 105 10%
$50,001 to $55.000 478 10% 149 9% 0 0% 106 10%
$55,001 to $60,000 525 11% 193 12% 0 0% 102 10%
$60,001 to $65,000 466 10% 148 9% 0 0% 69 7%
$65,001 to $70,000 411 9% 117 7% 0 0% 70 7%
$70,001 to $75,000 326 7% 88 5% 0 0% 55 5%
$75,001 to $80,000 275 6% 90 5% 0 0% 42 4%
$80,001 to $85,000 229 5% 74 4% 0 0% 39 4%
More than $85,001 603 13% 303 18% 0 0% 79 8%
TOTAL 4,792 100% 1,655 100% 8 100% 1,014 100%
* CalHFA securitization of 1,1014 mortgages for a total amount of $200,327,755.***Income range was revised starting the year 2011-2012 report.

155STATUTORY REQUIREMENTS FISCAL YEAR 2016-2017
Statutory RequirementsTable I-4: Single Family Loans by Ethnicity***
LAST TEN FISCAL YEARS
2011-2012* 2012-2013** 2013-2014 2014-2015 2015-2016 2016-2017
ETHNICITY COUNT % COUNT % COUNT % COUNT % COUNT % COUNT %
Hispanic 165 44% - 0% 18 36% 508 48% 2,534 54% 4,036 56%
AfricanAmerican 51 14% - 0% 6 12% 97 9% 371 8% 648 9%
Asian 19 5% - 0% 4 8% 40 4% 206 4% 300 4%
White 120 32% - 0% 20 40% 373 35% 1,554 33% 2,186 30%
Other 11 3% - 0% - 0% 21 2% 60 1% 89 1%
Unknown 9 2% - 0% 2 4% 14 1% 0 0% 0 0%
TOTAL 375 100% - 0% 50 100% 1,053 100% 4,725 100% 7,259 100%
Table I-5: Single Family Loans by Household Size***
LAST TEN FISCAL YEARS
2011-2012* 2012-2013** 2013-2014 2014-2015 2015-2016 2016-2017
HOUSEHOLD SIZE COUNT % COUNT % COUNT % COUNT % COUNT % COUNT %
1 - 2 119 32% - 0% 16 32% 377 36% 1271 27% 1,643 23%
3 - 4 169 45% - 0% 16 32% 408 39% 1962 42% 2,886 40%
5 - 6 76 20% - 0% 13 26% 217 21% 1125 24% 2,079 29%
6 + 11 3% - 0% 5 10% 51 5% 367 8% 651 9%
TOTAL 375 100% - 0% 50 100% 1,053 100% 4725 100% 7,259 100%
* FY 2011-12 figures have been corrected from prior reports.** In FY 2012-2013, there was no first mortgage loan activity.***Ethnicity and household size reports were created starting 2011-2012 report.
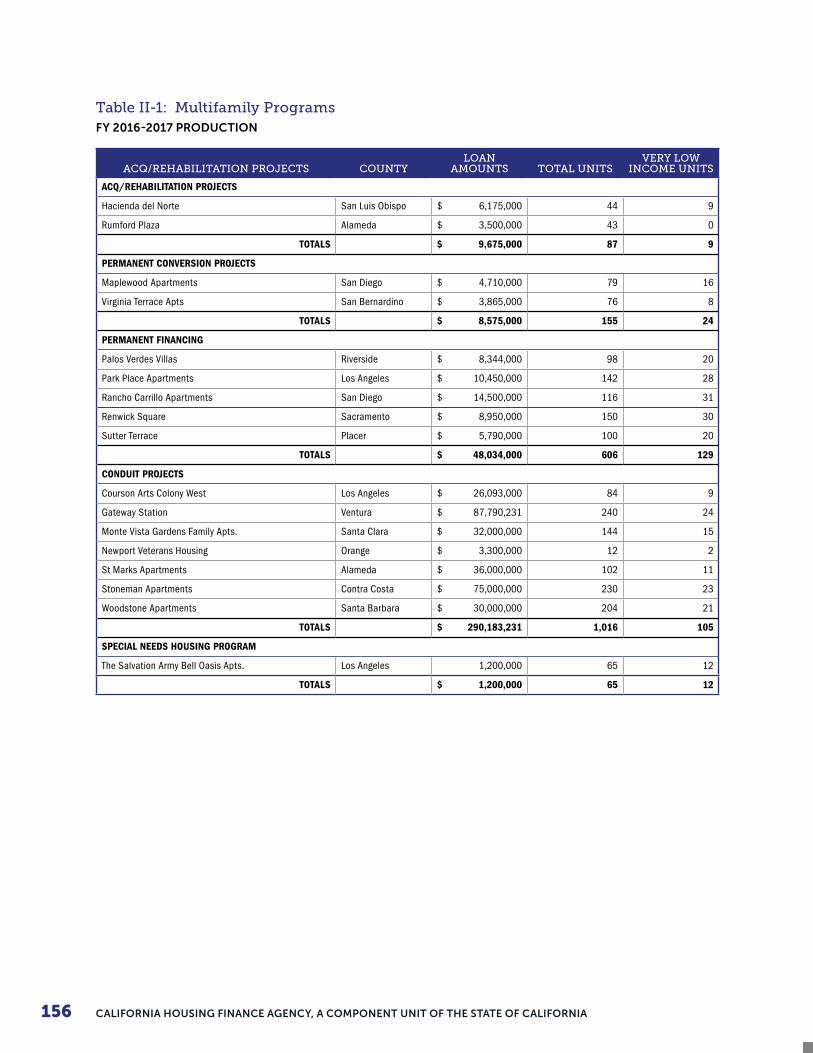
CALIFORNIA HOUSING FINANCE AGENCY, A COMPONENT UNIT OF THE STATE OF CALIFORNIA156
Table II-1: Multifamily ProgramsFY 2016-2017 PRODUCTION
ACQ/REHABILITATION PROJECTS COUNTYLOAN
AMOUNTS TOTAL UNITSVERY LOW
INCOME UNITS
ACQ/REHABILITATION PROJECTS
Hacienda del Norte San Luis Obispo $ 6,175,000 44 9
Rumford Plaza Alameda $ 3,500,000 43 0
TOTALS $ 9,675,000 87 9
PERMANENT CONVERSION PROJECTS
Maplewood Apartments San Diego $ 4,710,000 79 16
Virginia Terrace Apts San Bernardino $ 3,865,000 76 8
TOTALS $ 8,575,000 155 24
PERMANENT FINANCING
Palos Verdes Villas Riverside $ 8,344,000 98 20
Park Place Apartments Los Angeles $ 10,450,000 142 28
Rancho Carrillo Apartments San Diego $ 14,500,000 116 31
Renwick Square Sacramento $ 8,950,000 150 30
Sutter Terrace Placer $ 5,790,000 100 20
TOTALS $ 48,034,000 606 129
CONDUIT PROJECTS
Courson Arts Colony West Los Angeles $ 26,093,000 84 9
Gateway Station Ventura $ 87,790,231 240 24
Monte Vista Gardens Family Apts. Santa Clara $ 32,000,000 144 15
Newport Veterans Housing Orange $ 3,300,000 12 2
St Marks Apartments Alameda $ 36,000,000 102 11
Stoneman Apartments Contra Costa $ 75,000,000 230 23
Woodstone Apartments Santa Barbara $ 30,000,000 204 21
TOTALS $ 290,183,231 1,016 105
SPECIAL NEEDS HOUSING PROGRAM
The Salvation Army Bell Oasis Apts. Los Angeles 1,200,000 65 12
TOTALS $ 1,200,000 65 12

157STATUTORY REQUIREMENTS FISCAL YEAR 2016-2017
Statutory RequirementsTable II-2: Multifamily Geographic and Financing Data
ACQUISITION/REHABILITATION PROJECTS LAST TEN FISCAL YEARS
2007-2008*
2008-2009*
2009-2010*
2010-2011*
2011-2012*
2012-2013
2013-2014
2014-2015
2015-2016
2016-2017
Loans Closed Amount $ 0 $ 0 $ 0 $ 0 $ 0 $9,950,000 $38,915,000 $ 0 $65,235,000 $9,675,000
Number of Projects Financed 0 0 0 0 0 7 3 0 4 2
TOTAL UNITS FINANCED 0 0 0 0 0 690 383 0 443 87
CalHFA Regulated Low or Moderate Units 0 0 0 0 0 690 63 0 332 31
SOURCE OF FINANCING
CalHFA Revenue Bonds Funds $ 0 $ 0 $ 0 $ 0 $ 0 $69,950,000 $38,915,000 $ 0 $62,920,000 0
Housing Assistance Trust Funds $ 0 $ 0 $ 0 $ 0 $ 0 $ 0 $ 0 $ 0 $ 0 9,675,000
Other Financing $ 0 $ 0 $ 0 $ 0 $ 0 $ 0 $ 0 $ 0 $ 2,315,000 0
GEOGRAPHIC DISTRIBUTION OF UNITS FINANCED
NORTHERN CALIFORNIA METROPOLITAN COUNTIES
Urban Areas 0 0 0 0 0 100 100 0 100 43
Rural Areas 0 0 0 0 0 50 0 0 0 0
Northern California Non Metropolitan Counties 0 0 0 0 0 0 0 0 0 0
TOTAL NORTHERN CALIFORNIA 0 0 0 0 0 150 100 0 100 43
SOUTHERN CALIFORNIA METROPOLITAN COUNTIES
Urban Areas 0 0 0 0 0 540 283 0 264 44
Rural Areas 0 0 0 0 0 0 0 0 79 0
TOTAL SOUTHERN CALIFORNIA 0 0 0 0 0 540 283 0 343 44
Non Metropolitan Counties 0 0 0 0 0 0 0 0 0 0
TOTAL ALL COUNTIES 0 0 0 0 0 690 383 0 443 87
*Segregated report was not available prior to 2011-2012.

CALIFORNIA HOUSING FINANCE AGENCY, A COMPONENT UNIT OF THE STATE OF CALIFORNIA158
Table II-2A: Multifamily Geographic and Financing Data
PERMANENT CONVERSION PROJECTS LAST TEN FISCAL YEARS
2007-2008*
2008-2009*
2009-2010*
2010-2011*
2011-2012*
2012-2013
2013-2014
2014-2015
2015-2016
2016-2017
Loans Closed Amount $ 0 $ 0 $ 0 $ 0 $7,200,000 $ 0 $11,740,000 $39,660,000 $25,130,000 $8,575,000
Number of Projects Financed 0 0 0 0 1 0 2 5 3 2
TOTAL UNITS FINANCED 0 0 0 0 109 0 150 540 383 155
CalHFA Regulated Low or Moderate Units 0 0 0 0 22 0 150 430 111 55
SOURCE OF FINANCING
CalHFA Revenue Bonds Funds $ 0 $ 0 $ 0 $ 0 $7,200,000 $ 0 $11,740,000 $39,240,000 $24,460,000 $8,575,000
Housing Assistance Trust Funds $ 0 $ 0 $ 0 $ 0 $ 0 $ 0 $ 0 $ 0 $ 0 $ 0
Other Financing $ 0 $ 0 $ 0 $ 0 $ 0 $ 0 $ 0 $ 420,000 $ 670,000 $ 0
GEOGRAPHIC DISTRIBUTION OF UNITS FINANCED
NORTHERN CALIFORNIA METROPOLITAN COUNTIES
Urban Areas 0 0 0 0 109 0 100 0 100 0
Rural Areas 0 0 0 0 0 0 50 0 0 0
Northern California Non Metropolitan Counties 0 0 0 0 0 0 0 0 0 0
TOTAL NORTHERN CALIFORNIA 0 0 0 0 109 0 150 0 100 0
SOUTHERN CALIFORNIA METROPOLITAN COUNTIES
Urban Areas 0 0 0 0 0 0 0 540 283 76
Rural Areas 0 0 0 0 0 0 0 0 0 79
TOTAL SOUTHERN CALIFORNIA 0 0 0 0 0 0 0 540 283 155
Non Metropolitan Counties 0 0 0 0 0 0 0 0 0 0
TOTAL ALL COUNTIES 0 0 0 0 109 0 150 540 383 155
*Segregated report was not available prior to 2011-2012.
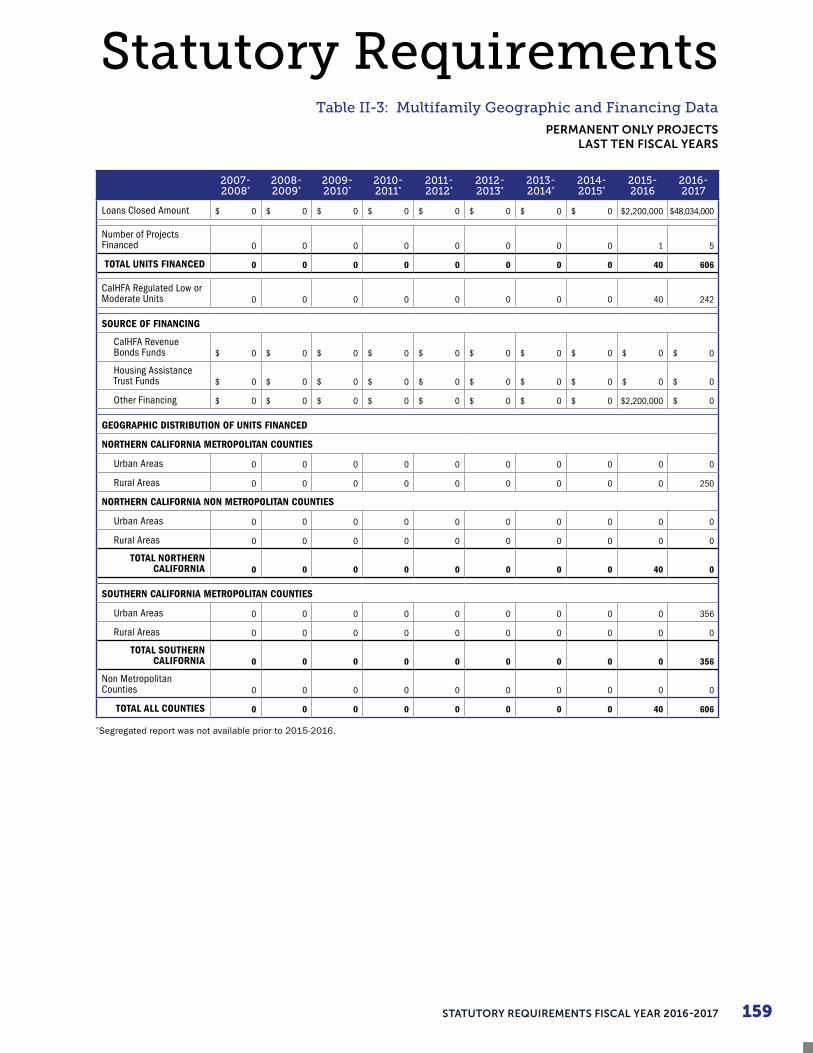
159STATUTORY REQUIREMENTS FISCAL YEAR 2016-2017
Statutory RequirementsTable II-3: Multifamily Geographic and Financing Data
PERMANENT ONLY PROJECTS LAST TEN FISCAL YEARS
2007-2008*
2008-2009*
2009-2010*
2010-2011*
2011-2012*
2012-2013*
2013-2014*
2014-2015*
2015-2016
2016-2017
Loans Closed Amount $ 0 $ 0 $ 0 $ 0 $ 0 $ 0 $ 0 $ 0 $2,200,000 $48,034,000
Number of Projects Financed 0 0 0 0 0 0 0 0 1 5
TOTAL UNITS FINANCED 0 0 0 0 0 0 0 0 40 606
CalHFA Regulated Low or Moderate Units 0 0 0 0 0 0 0 0 40 242
SOURCE OF FINANCING
CalHFA Revenue Bonds Funds $ 0 $ 0 $ 0 $ 0 $ 0 $ 0 $ 0 $ 0 $ 0 $ 0
Housing Assistance Trust Funds $ 0 $ 0 $ 0 $ 0 $ 0 $ 0 $ 0 $ 0 $ 0 $ 0
Other Financing $ 0 $ 0 $ 0 $ 0 $ 0 $ 0 $ 0 $ 0 $2,200,000 $ 0
GEOGRAPHIC DISTRIBUTION OF UNITS FINANCED
NORTHERN CALIFORNIA METROPOLITAN COUNTIES
Urban Areas 0 0 0 0 0 0 0 0 0 0
Rural Areas 0 0 0 0 0 0 0 0 0 250
NORTHERN CALIFORNIA NON METROPOLITAN COUNTIES
Urban Areas 0 0 0 0 0 0 0 0 0 0
Rural Areas 0 0 0 0 0 0 0 0 0 0
TOTAL NORTHERN CALIFORNIA 0 0 0 0 0 0 0 0 40 0
SOUTHERN CALIFORNIA METROPOLITAN COUNTIES
Urban Areas 0 0 0 0 0 0 0 0 0 356
Rural Areas 0 0 0 0 0 0 0 0 0 0
TOTAL SOUTHERN CALIFORNIA 0 0 0 0 0 0 0 0 0 356
Non Metropolitan Counties 0 0 0 0 0 0 0 0 0 0
TOTAL ALL COUNTIES 0 0 0 0 0 0 0 0 40 606
*Segregated report was not available prior to 2015-2016.

CALIFORNIA HOUSING FINANCE AGENCY, A COMPONENT UNIT OF THE STATE OF CALIFORNIA160
Table II-4: Multifamily Geographic and Financing Data
CONDUIT PROJECTS LAST TEN FISCAL YEARS
2007-2008*
2008-2009*
2009-2010*
2010-2011*
2011-2012
2012-2013
2013-2014
2014-2015
2015-2016
2016-2017
Loans Closed Amount $ 0 $ 0 $ 0 $ 0 $ 119,400,000 $ 4,550,000 $ 29,650,000 $ 59,146,886 $ 275,338,000 $ 290,183,231
Number of Projects Financed 0 0 0 0 2 2 3 4 15 7
TOTAL UNITS FINANCED 0 0 0 0 620 36 188 337 1,217 1,016
CalHFA Regulated Low or Moderate Units 0 0 0 0 107 15 76 97 264 408
SOURCE OF FINANCING
CalHFA Revenue Bonds Funds $ 0 $ 0 $ 0 $ 0 $ 119,400,000 $ 4,550,000 $ 29,650,000 $ 59,146,886 $ 275,338,000 $ 290,183,231
Housing Assistance Trust Funds $ 0 $ 0 $ 0 $ 0 $ 0 $ 0 $ 0 $ 0 $ 0 $ 0
Other Financing $ 0 $ 0 $ 0 $ 0 $ 0 $ 0 $ 0 $ 0 $ 0 $ 0
GEOGRAPHIC DISTRIBUTION OF UNITS FINANCED
NORTHERN CALIFORNIA METROPOLITAN COUNTIES
Urban Areas 0 0 0 0 182 0 0 142 1,073 476
Rural Areas 0 0 0 0 0 0 0 0 0 0
Northern California Non Metropolitan Counties 0 0 0 0 0 0 0 0 0 0
TOTAL NORTHERN CALIFORNIA 0 0 0 0 182 0 0 142 1,073 476
SOUTHERN CALIFORNIA METROPOLITAN COUNTIES
Urban Areas 0 0 0 0 438 36 188 195 144 540
Rural Areas 0 0 0 0 0 0 0 0 0 0
TOTAL SOUTHERN CALIFORNIA 0 0 0 0 438 36 188 195 144 540
Non Metropolitan Counties 0 0 0 0 0 0 0 0 0 0
TOTAL ALL COUNTIES 0 0 0 0 620 36 188 337 1,217 1,016
*Segregated report was not available prior to 2011-2012.
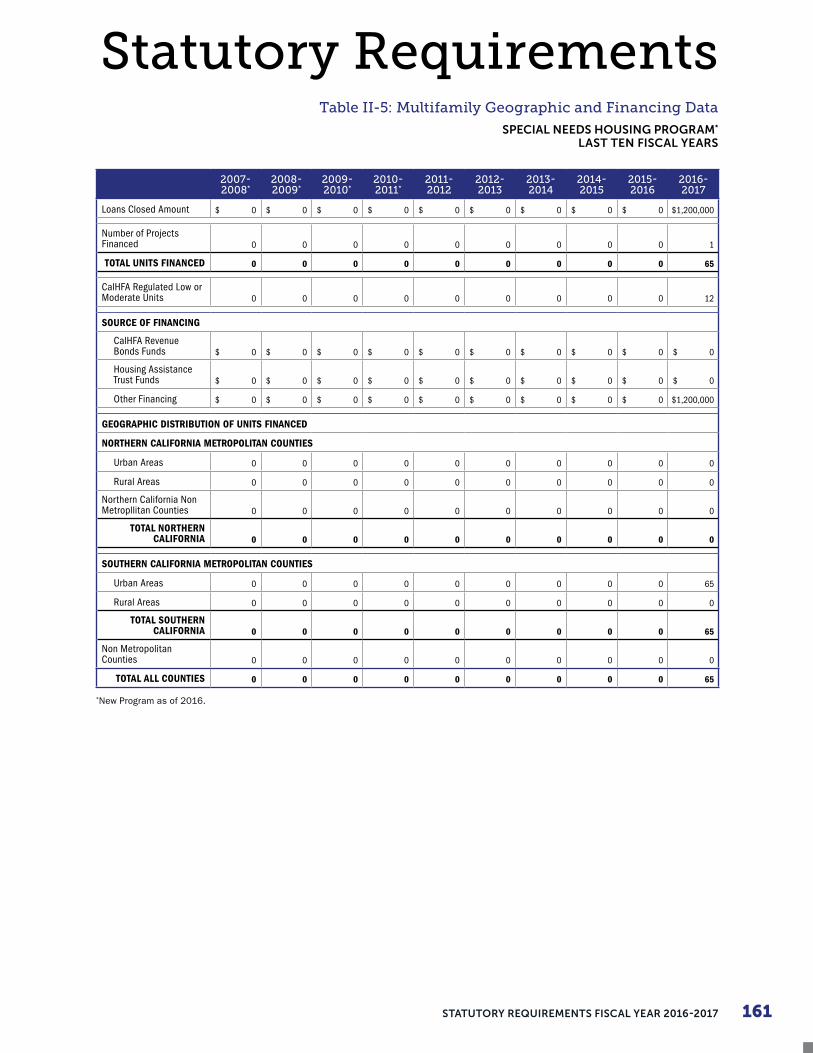
161STATUTORY REQUIREMENTS FISCAL YEAR 2016-2017
Statutory RequirementsTable II-5: Multifamily Geographic and Financing Data
SPECIAL NEEDS HOUSING PROGRAM*
LAST TEN FISCAL YEARS
2007-2008*
2008-2009*
2009-2010*
2010-2011*
2011-2012
2012-2013
2013-2014
2014-2015
2015-2016
2016-2017
Loans Closed Amount $ 0 $ 0 $ 0 $ 0 $ 0 $ 0 $ 0 $ 0 $ 0 $1,200,000
Number of Projects Financed 0 0 0 0 0 0 0 0 0 1
TOTAL UNITS FINANCED 0 0 0 0 0 0 0 0 0 65
CalHFA Regulated Low or Moderate Units 0 0 0 0 0 0 0 0 0 12
SOURCE OF FINANCING
CalHFA Revenue Bonds Funds $ 0 $ 0 $ 0 $ 0 $ 0 $ 0 $ 0 $ 0 $ 0 $ 0
Housing Assistance Trust Funds $ 0 $ 0 $ 0 $ 0 $ 0 $ 0 $ 0 $ 0 $ 0 $ 0
Other Financing $ 0 $ 0 $ 0 $ 0 $ 0 $ 0 $ 0 $ 0 $ 0 $1,200,000
GEOGRAPHIC DISTRIBUTION OF UNITS FINANCED
NORTHERN CALIFORNIA METROPOLITAN COUNTIES
Urban Areas 0 0 0 0 0 0 0 0 0 0
Rural Areas 0 0 0 0 0 0 0 0 0 0
Northern California Non Metropllitan Counties 0 0 0 0 0 0 0 0 0 0
TOTAL NORTHERN CALIFORNIA 0 0 0 0 0 0 0 0 0 0
SOUTHERN CALIFORNIA METROPOLITAN COUNTIES
Urban Areas 0 0 0 0 0 0 0 0 0 65
Rural Areas 0 0 0 0 0 0 0 0 0 0
TOTAL SOUTHERN CALIFORNIA 0 0 0 0 0 0 0 0 0 65
Non Metropolitan Counties 0 0 0 0 0 0 0 0 0 0
TOTAL ALL COUNTIES 0 0 0 0 0 0 0 0 0 65
*New Program as of 2016.
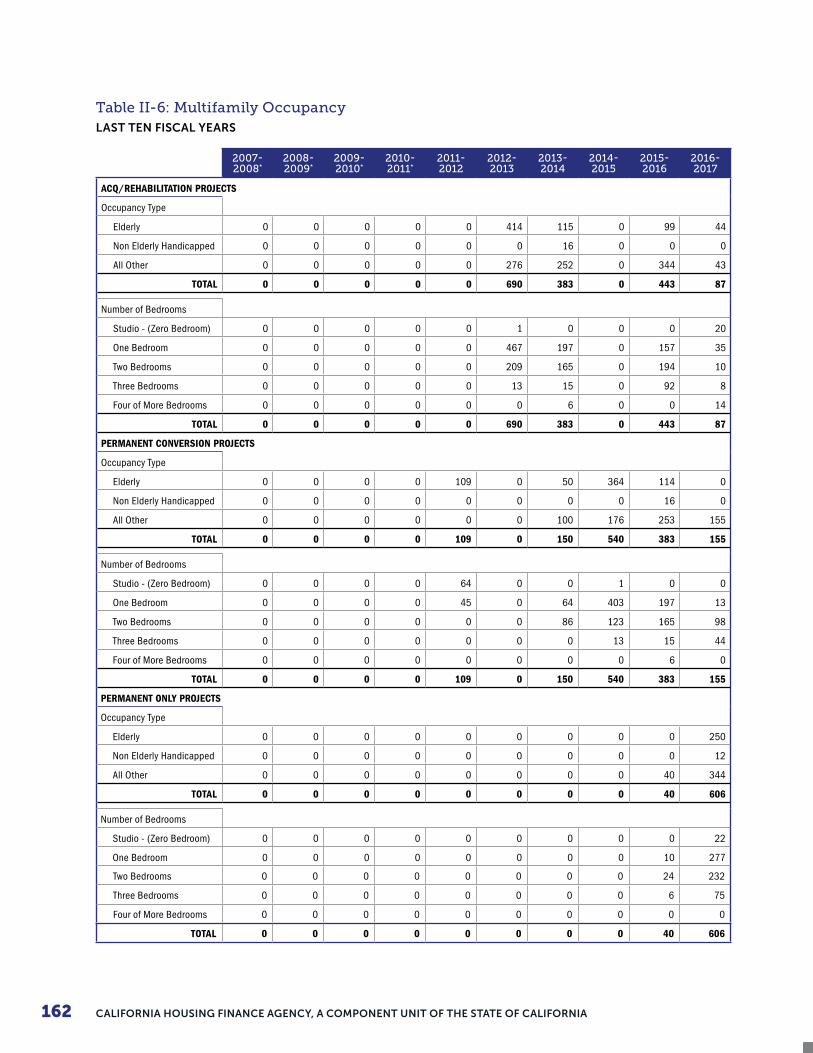
CALIFORNIA HOUSING FINANCE AGENCY, A COMPONENT UNIT OF THE STATE OF CALIFORNIA162
Table II-6: Multifamily OccupancyLAST TEN FISCAL YEARS
2007-2008*
2008-2009*
2009-2010*
2010-2011*
2011-2012
2012-2013
2013-2014
2014-2015
2015-2016
2016-2017
ACQ/REHABILITATION PROJECTS
Occupancy Type
Elderly 0 0 0 0 0 414 115 0 99 44
Non Elderly Handicapped 0 0 0 0 0 0 16 0 0 0
All Other 0 0 0 0 0 276 252 0 344 43
TOTAL 0 0 0 0 0 690 383 0 443 87
Number of Bedrooms
Studio - (Zero Bedroom) 0 0 0 0 0 1 0 0 0 20
One Bedroom 0 0 0 0 0 467 197 0 157 35
Two Bedrooms 0 0 0 0 0 209 165 0 194 10
Three Bedrooms 0 0 0 0 0 13 15 0 92 8
Four of More Bedrooms 0 0 0 0 0 0 6 0 0 14
TOTAL 0 0 0 0 0 690 383 0 443 87
PERMANENT CONVERSION PROJECTS
Occupancy Type
Elderly 0 0 0 0 109 0 50 364 114 0
Non Elderly Handicapped 0 0 0 0 0 0 0 0 16 0
All Other 0 0 0 0 0 0 100 176 253 155
TOTAL 0 0 0 0 109 0 150 540 383 155
Number of Bedrooms
Studio - (Zero Bedroom) 0 0 0 0 64 0 0 1 0 0
One Bedroom 0 0 0 0 45 0 64 403 197 13
Two Bedrooms 0 0 0 0 0 0 86 123 165 98
Three Bedrooms 0 0 0 0 0 0 0 13 15 44
Four of More Bedrooms 0 0 0 0 0 0 0 0 6 0
TOTAL 0 0 0 0 109 0 150 540 383 155
PERMANENT ONLY PROJECTS
Occupancy Type
Elderly 0 0 0 0 0 0 0 0 0 250
Non Elderly Handicapped 0 0 0 0 0 0 0 0 0 12
All Other 0 0 0 0 0 0 0 0 40 344
TOTAL 0 0 0 0 0 0 0 0 40 606
Number of Bedrooms
Studio - (Zero Bedroom) 0 0 0 0 0 0 0 0 0 22
One Bedroom 0 0 0 0 0 0 0 0 10 277
Two Bedrooms 0 0 0 0 0 0 0 0 24 232
Three Bedrooms 0 0 0 0 0 0 0 0 6 75
Four of More Bedrooms 0 0 0 0 0 0 0 0 0 0
TOTAL 0 0 0 0 0 0 0 0 40 606
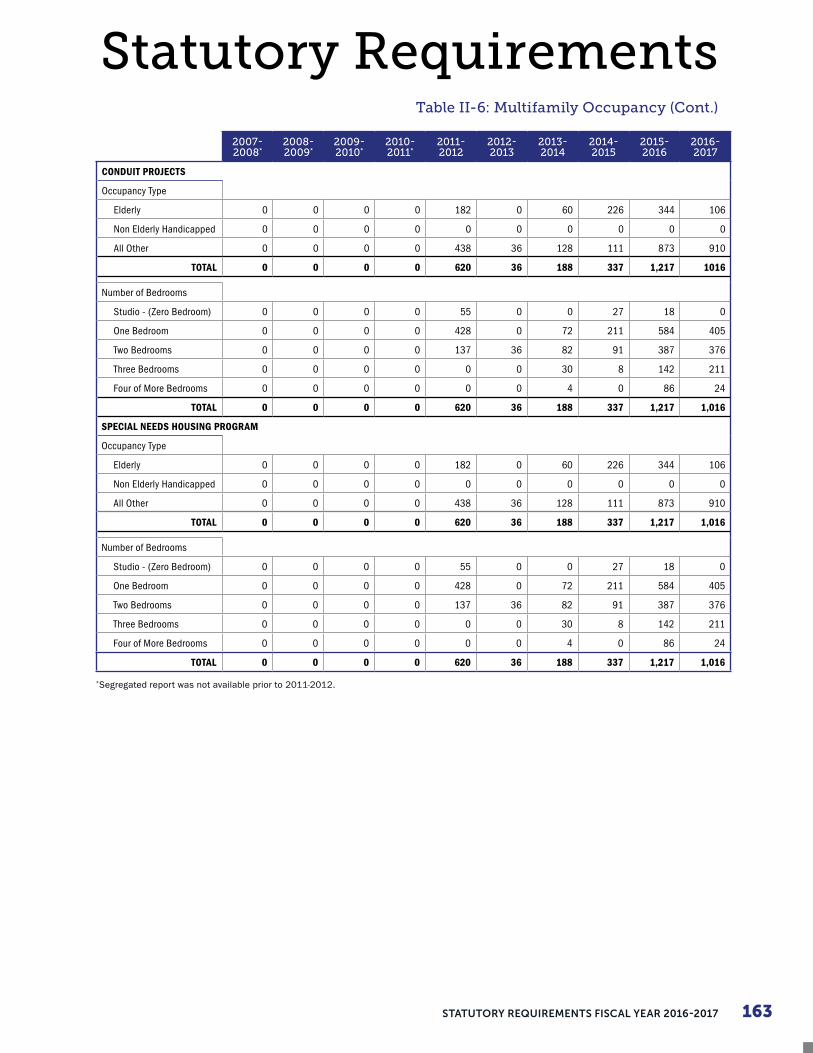
163STATUTORY REQUIREMENTS FISCAL YEAR 2016-2017
Statutory Requirements
2007-2008*
2008-2009*
2009-2010*
2010-2011*
2011-2012
2012-2013
2013-2014
2014-2015
2015-2016
2016-2017
CONDUIT PROJECTS
Occupancy Type
Elderly 0 0 0 0 182 0 60 226 344 106
Non Elderly Handicapped 0 0 0 0 0 0 0 0 0 0
All Other 0 0 0 0 438 36 128 111 873 910
TOTAL 0 0 0 0 620 36 188 337 1,217 1016
Number of Bedrooms
Studio - (Zero Bedroom) 0 0 0 0 55 0 0 27 18 0
One Bedroom 0 0 0 0 428 0 72 211 584 405
Two Bedrooms 0 0 0 0 137 36 82 91 387 376
Three Bedrooms 0 0 0 0 0 0 30 8 142 211
Four of More Bedrooms 0 0 0 0 0 0 4 0 86 24
TOTAL 0 0 0 0 620 36 188 337 1,217 1,016
SPECIAL NEEDS HOUSING PROGRAM
Occupancy Type
Elderly 0 0 0 0 182 0 60 226 344 106
Non Elderly Handicapped 0 0 0 0 0 0 0 0 0 0
All Other 0 0 0 0 438 36 128 111 873 910
TOTAL 0 0 0 0 620 36 188 337 1,217 1,016
Number of Bedrooms
Studio - (Zero Bedroom) 0 0 0 0 55 0 0 27 18 0
One Bedroom 0 0 0 0 428 0 72 211 584 405
Two Bedrooms 0 0 0 0 137 36 82 91 387 376
Three Bedrooms 0 0 0 0 0 0 30 8 142 211
Four of More Bedrooms 0 0 0 0 0 0 4 0 86 24
TOTAL 0 0 0 0 620 36 188 337 1,217 1,016
*Segregated report was not available prior to 2011-2012.
Table II-6: Multifamily Occupancy (Cont.)

CALIFORNIA HOUSING FINANCE AGENCY, A COMPONENT UNIT OF THE STATE OF CALIFORNIA164
Table II-7: Multifamily SummaryLAST TEN FISCAL YEARS
2007-2008*
2008-2009*
2009-2010*
2010-2011*
2011-2012
2012-2013
2013-2014
2014-2015
2015-2016
2016-2017
ACQ/REHABILITATION PROJECTS
Number of Units Financed 0 0 0 0 0 690 383 0 443 87
Loan Amounts 0 0 0 0 0 $ 69,950,000 $ 38,915,000 $ 0 $ 65,235,000 $ 9,675,000
Number of Units Financed - To Date 0 0 0 0 8,385 9,075 9,458 9,458 9,901 9,988
LOAN AMOUNTS – TO DATE $ 0 $ 0 $ 0 $ 0 $ 896,016,617 $ 965,966,617 $1,004,881,617 $1,004,881,617 $1,070,116,617 $1,079,791,617
PERMANENT/CONVERSION PROJECTS
Number of Units Financed 0 0 0 0 109 0 150 540 383 155
Loan Amounts $ 0 $ 0 $ 0 $ 0 $ 7,200,000 $ 0 $ 11,740,000 $ 39,660,000 $ 25,130,000 $ 8,575,000
Number of Units Financed - To Date 0 0 0 0 41,874 41,874 42,024 42,564 42,947 43,102
LOAN AMOUNTS – TO DATE $ 0 $ 0 $ 0 $ 0 $2,112,137,393 $2,112,137,393 $2,123,877,393 $2,163,537,393 $2,188,667,393 $2,197,242,393
PERMANENT FINANCING PROJECTS
Number of Units Financed 0 0 0 0 0 0 0 0 40 606
Loan Amounts $ 0 $ 0 $ 0 $ 0 $ 0 $ 0 $ 0 $ 0 $ 2,200,000 $ 48,034,000
Number of Units Financed - To Date 0 0 0 0 0 0 0 0 40 646
LOAN AMOUNTS – TO DATE $ 0 $ 0 $ 0 $ 0 $ 0 $ 0 $ 0 $ 0 $ 2,200,000 $ 50,234,000
CONDUIT PROJECTS
Number of Units Financed 0 0 0 0 620 36 188 337 1217 1016
Loan Amounts $ 0 $ 0 $ 0 $ 0 $ 119,400,000 $ 4,550,000 $ 29,650,000 $ 59,146,886 $ 275,338,000 $ 290,183,231
Number of Units Financed - To Date 0 0 0 0 3813 3849 4037 4374 5591 6607
LOAN AMOUNTS – TO DATE $ 0 $ 0 $ 0 $ 0 $ 372,262,560 $ 376,812,560 $ 406,462,560 $ 465,609,446 $ 740,947,446 $1,031,130,677
SPECIAL NEEDS HOUSING PROGRAM
Number of Units Financed 0 0 0 0 0 0 0 0 0 65
Loan Amounts $ 0 $ 0 $ 0 $ 0 $ 0 $ 0 $ 0 $ 0 $ 0 $ 1,200,000
Number of Units Financed - To Date 0 0 0 0 0 0 0 0 0 65
LOAN AMOUNTS – TO DATE $ 0 $ 0 $ 0 $ 0 $ 0 $ 0 $ 0 $ 0 $ 0 $ 1,200,000
*Segregated report was not available prior to 2011-2012.

165STATUTORY REQUIREMENTS FISCAL YEAR 2016-2017
Statutory RequirementsTable III-1: Use of Revenue Bonding Authority
2016-2017 ACTUAL—2017-2018 ESTIMATEDAGGREGATE PRINCIPAL AMOUNT OF CALHFA DEBT OUTSTANDING
AMOUNT AUTHORIZED BY STATUTE AS OF 6/30/2017
Authorized by Chapter 7 $ 13,150,000,000
Amount Outstanding (non-conduits) as of 6/30/17 $ 2,095,874,000
Amount Outstanding (conduits) as of 6/30/17* 700,113,264
TOTAL OUTSTANDING AS OF 6/30/2017 $ 2,795,987,264
Balance of Remaining Authority as of 6/30/2017 $ 10,354,012,736
ESTIMATED INCREASES IN AGGREGATE PRINCIPAL AMOUNT OF CALHFA BONDS OUTSTANDING DURING FY 2017-2018
New Single Family Bonds $ 0
New Multifamily Bonds $ 200,000,000
TOTAL NEW BONDS $ 200,000,000
ESTIMATED DECREASES DURING FY 2017-2018
(Retirement of Bonds Not Being Refunded) ($ 600,000,000)
Net decrease estimated for FY 2017-2018 $ 400,000,000
ESTIMATED REMAINING AUTHORITY AS OF 6/30/2018
Authorized by Chapter 7 $ 10,754,012,736

166 CALIFORNIA HOUSING FINANCE AGENCY, A COMPONENT UNIT OF THE STATE OF CALIFORNIA
Tab
le I
V-1
: S
um
ma
ry -
Mu
ltif
am
ily
Lo
an
s in
Po
rtfo
lio
at
Ye
ar
En
dL
AS
T T
EN
FIS
CA
L Y
EA
RS
2
00
7-2
00
8 T
O 2
016
-20
17
20
07-
20
08
20
08
-20
09
20
09
-20
102
010
-20
112
011
-20
122
012
-20
132
013
-20
142
014
-20
152
015
-20
162
016
-20
17
SUM
MAR
Y OF
PRO
JECT
S
Sect
ion
8 Pr
ojec
ts13
513
213
113
011
510
398
9693
88
Non
-Sec
tion
8 Pr
ojec
ts30
842
644
035
234
030
830
930
929
731
8
Men
tal H
ealth
S A
Pro
ject
s0
00
5525
6094
127
129
136
Sect
ion
8 Pr
ojec
ts M
onito
red
by P
BCA
00
00
025
2122
2328
TOTA
L PR
OJE
CTS
443
558
571
537
480
496
522
554
542
570
SUM
MAR
Y OF
UNI
TS
Sect
ion
8 Pr
ojec
ts -
CalH
FA R
egul
ated
Occ
upie
d Un
its8,
023
8,17
98,
050
7,87
97,
424
6,60
56,
184
6,22
26,
080
5,38
3
Vaca
nt U
nits
365
7874
156
5611
290
4375
70
Non
-Sec
tion
8 Pr
ojec
ts -
CalH
FA R
egul
ated
Occ
upie
d Un
its6,
648
6,78
56,
922
7,01
46,
918
6,96
46,
876
6,77
96,
467
7,28
6
Vaca
nt U
nits
178
151
8869
383
8515
086
164
204
Tota
l Cal
HFA
Regu
late
d Un
its15
,214
15,1
9315
,134
15,1
1814
,781
13,7
6613
,300
13,1
3012
,786
12,9
43
Men
tal H
ealth
Ser
vice
s Ac
t (M
HSA)
3,29
839
594
11,
051
1,89
91,
911
2,00
6
Non
-Cal
HFA
Regu
late
d Un
its (1
)14
,615
18,5
3818
,421
15,1
1817
,161
17,3
4217
,007
20,5
8219
,970
21,7
87
Non
-Reg
ulat
ed M
arke
t Rat
e Un
its4,
812
6,41
46,
347
5,45
65,
424
4,51
84,
351
4,46
64,
440
4,44
0
Sect
ion
8 Pr
ojec
ts M
onito
red
by P
BCA
00
00
01,
609
1,33
01,
504
1,48
02,
190
TOTA
L AL
L U
NITS
34,6
4140
,145
39,9
0238
,990
37,7
6138
,176
37,0
3941
,581
40,5
8743
,366

STATUTORY REQUIREMENTS FISCAL YEAR 2016-2017 167
Sta
tuto
ry R
eq
uire
me
nts
Tab
le IV
-2: S
um
ma
ry - M
ultifa
mily
Lo
an
s in P
ortfo
lio at Y
ea
r En
dS
EC
TIO
N 8
- CA
LHFA
RE
GU
LA
TE
D U
NIT
ST
EN
AN
T FA
MILY
INC
OM
E A
ND
MO
NT
HLY
RE
NT
LA
ST
TE
N FIS
CA
L YE
AR
S 2
00
7-20
08
TO
20
16-2
017
20
07-2
00
82
00
8-2
00
92
00
9-2
010
20
10-2
011
20
11-20
122
012
-20
132
013
-20
142
014
-20
152
015
-20
162
016
-20
17
ANNUAL FAMILY INCOM
E
Less than $5,001440
528526
558625
581426
413387
319
$5,001 to 7,500419
569618
662511
424321
295273
266
7,501 to 10,000564
1,6212,899
3,0562,277
1,732407
377369
377
10,001 to 12,5003,428
2,5721,143
8841,429
1,5712,659
2,6482,555
2,195
12,501 to 15,000614
640698
637627
557507
493464
406
15,001 to 20,0001,415
1,3171,295
1,2471,145
1,0041,053
1,0891,053
916
More than $20,000
1,143932
871835
810736
811907
979904
TOTAL PRO
JECTS
8,0238,179
8,0507,879
7,4246,605
6,1846,222
6,0805,383
MONTH
LY TENANT RENT
Less than 51182
167152
146192
175463
410385
321
51 to 100221
224230
269263
266267
265237
233
101 to 150291
337397
401402
338276
270271
252
151 to 200496
457458
500364
308579
445435
434
201 to 2501,176
1,5052,782
2,9352,181
1,6391,981
1,9211,833
1,653
251 to 3002,649
2,381978
7241,291
1,419712
888863
655
301 to 400928
1,0141,069
976937
866732
710663
619
401 to 5001,077
1,1081,084
1,053962
836651
706711
587
More than $500
1,003986
900875
832758
523607
682629
TOTAL8,023
8,1798,050
7,8797,424
6,6056,184
6,2226,080
5,383

168 CALIFORNIA HOUSING FINANCE AGENCY, A COMPONENT UNIT OF THE STATE OF CALIFORNIA
Tab
le I
V-3
: S
um
ma
ry -
Mu
ltif
am
ily
Lo
an
s in
Po
rtfo
lio
at
Ye
ar
En
dN
ON
-SE
CT
ION
8 -
CA
LHFA
RE
GU
LA
TE
D U
NIT
ST
EN
AN
T F
AM
ILY
IN
CO
ME
AN
D M
ON
TH
LY R
EN
T2
00
7-2
00
8 T
O 2
016
-20
17
20
07-
20
08
20
08
-20
09
20
09
-20
102
010
-20
112
011
-20
122
012
-20
132
013
-20
142
014
-20
152
015
-20
162
016
-20
17
ANNU
AL F
AMIL
Y IN
COM
E
Less
than
$5,
001
224
226
254
270
310
815
254
255
239
258
$5,0
01 to
7,5
0018
119
020
122
118
919
519
618
014
615
2
7,50
1 to
10,
000
320
322
336
447
486
311
283
259
245
289
10,0
01 to
12,
500
1,38
81,
421
1,40
91,
348
1,25
91,
452
1,49
61,
435
1,34
61,
594
12,5
01 to
15,
000
529
558
593
559
548
504
509
518
458
506
15,0
01 to
20,
000
1,26
51,
259
1,30
51,
288
1,27
61,
133
1,21
31,
172
1,13
51,
202
Mor
e th
an $
20,0
002,
741
2,80
92,
824
2,88
12,
850
2,55
42,
925
2,96
02,
898
3,28
5
TOTA
L PR
OJE
CTS
6,64
86,
785
6,92
27,
014
6,91
86,
964
6,87
66,
779
6,46
77,
286
MON
THLY
TEN
ANT
RENT
Less
than
51
104
105
133
167
213
6417
815
513
814
8
51 to
100
9111
812
411
511
614
113
311
796
111
101
to 1
5011
414
113
715
616
314
114
912
612
214
1
151
to 2
0022
525
429
334
732
016
229
125
026
028
3
201
to 2
5061
458
665
766
570
456
368
264
760
070
5
251
to 3
0033
340
226
327
628
457
437
341
741
656
3
301
to 4
0047
349
154
559
955
049
053
848
347
556
8
401
to 5
0076
474
266
563
459
667
268
865
260
466
5
Mor
e th
an $
500
3,93
03,
946
4,10
54,
055
3,97
24,
157
3,84
43,
932
3,75
64,
102
TOTA
L6,
648
6,78
56,
922
7,01
46,
918
6,96
46,
876
6,77
96,
467
7,28
6

169STATUTORY REQUIREMENTS FISCAL YEAR 2016-2017
Statutory RequirementsTable IV-4: Regulatory Agreement End Date
UNITS AFFECTED
FISCAL YEAR SECTION 8 CALHFA OTHER LOW INCOME TOTAL
2016 - 2017 74 51 125
2017 - 2018 249 50 299
2018 - 2019 622 170 792
2019 - 2020 1,129 350 1,479
2020 - 2021 1,076 109 1,185
2021 - 2022 416 194 610
2022 - 2023 192 91 283
2023 - 2024 146 343 489
2024 - 2025 - 380 380
2025 - 2026 - 144 144
2026 - 2027 37 380 417
2027 - 2028 - 150 150
2028 - 2029 - 310 310
2029 - 2030 - 458 458
2030 - 2031 - 212 212
2031 - 2032 344 202 546
2032 - 2033 645 197 842
2033 - 2034 340 328 668
2034 - 2035 50 410 460
2035 - 2036 216 363 579
2036 - 2037 20 556 576
2037 - 2038 - 235 235
2038 - 2039 - 38 38
2039 - 2040 - 221 221
2040 - 2041 - 35 35
2041 - 2042 - 62 62
2042 - 2043 - 40 40
2043 - 2044 - 37 37
2044 - 2045 - 100 100
2045 - >>>> - 1,274 1,274
TOTAL 5,556 7,490 13,046

P.O. BOX 4034SACRAMENTO, CA
95812-4034(916) 326-8000
SACRAMENTO OFFiCE
100 CORPORATE POINTE, SUITE 250CULVER CITY, CA
90230(310) 342-5400
LOS ANGELES OFFiCE
COMPREHENSiVE ANNUALFiNANCiAL REPORT
FOR THE YEARS ENDED JUNE 30, 2017 AND JUNE 30, 2016
WWW.CALHFA.CA.GOV
A COMPONENT UNIT OF THE STATE OF CALIFORNIA