This is “Purchasing Power Parity”, chapter 6 from the...
36
This is “Purchasing Power Parity”, chapter 6 from the book Policy and Theory of International Finance (index.html) (v. 1.0). This book is licensed under a Creative Commons by-nc-sa 3.0 (http://creativecommons.org/licenses/by-nc-sa/ 3.0/) license. See the license for more details, but that basically means you can share this book as long as you credit the author (but see below), don't make money from it, and do make it available to everyone else under the same terms. This content was accessible as of December 29, 2012, and it was downloaded then by Andy Schmitz (http://lardbucket.org) in an effort to preserve the availability of this book. Normally, the author and publisher would be credited here. However, the publisher has asked for the customary Creative Commons attribution to the original publisher, authors, title, and book URI to be removed. Additionally, per the publisher's request, their name has been removed in some passages. More information is available on this project's attribution page (http://2012books.lardbucket.org/attribution.html?utm_source=header) . For more information on the source of this book, or why it is available for free, please see the project's home page (http://2012books.lardbucket.org/) . You can browse or download additional books there. i
Transcript of This is “Purchasing Power Parity”, chapter 6 from the...

This is “Purchasing Power Parity”, chapter 6 from the book Policy and Theory of International Finance(index.html) (v. 1.0).
This book is licensed under a Creative Commons by-nc-sa 3.0 (http://creativecommons.org/licenses/by-nc-sa/3.0/) license. See the license for more details, but that basically means you can share this book as long as youcredit the author (but see below), don't make money from it, and do make it available to everyone else under thesame terms.
This content was accessible as of December 29, 2012, and it was downloaded then by Andy Schmitz(http://lardbucket.org) in an effort to preserve the availability of this book.
Normally, the author and publisher would be credited here. However, the publisher has asked for the customaryCreative Commons attribution to the original publisher, authors, title, and book URI to be removed. Additionally,per the publisher's request, their name has been removed in some passages. More information is available on thisproject's attribution page (http://2012books.lardbucket.org/attribution.html?utm_source=header).
For more information on the source of this book, or why it is available for free, please see the project's home page(http://2012books.lardbucket.org/). You can browse or download additional books there.
i
www.princexml.com
Prince - Non-commercial License
This document was created with Prince, a great way of getting web content onto paper.

Chapter 6
Purchasing Power Parity
Purchasing power parity is both a theory about exchange rate determination and atool to make more accurate comparisons of data between countries. It is probablymore important in its latter role since as a theory it performs pretty poorly. Its poorperformance arises largely because its simple form depends on several assumptionsthat are not likely to hold in the real world and because the amount of foreignexchange activity due to importer and exporter demands is much less than theamount of activity due to investor demands. Nonetheless, the theory remainsimportant to provide the background for its use as a tool for cross-countrycomparisons of income and wages, which is used by international organizations likethe World Bank in presenting much of their international data.
219

6.1 Overview of Purchasing Power Parity (PPP)
LEARNING OBJECTIVES
1. Identify the conditions under which the law of one price holds.2. Identify the conditions under which purchasing power parity holds.
Purchasing power parity (PPP)1 is a theory of exchange rate determination and away to compare the average costs of goods and services between countries. Thetheory assumes that the actions of importers and exporters (motivated by cross-country price differences) induce changes in the spot exchange rate. In anothervein, PPP suggests that transactions on a country’s current account affect the valueof the exchange rate on the foreign exchange (Forex) market. This is in contrastwith the interest rate parity theory, which assumes that the actions of investors(whose transactions are recorded on the capital account) induce changes in theexchange rate.
PPP theory is based on an extension and variation of the “law of one price” asapplied to the aggregate economy. To explain the theory it is best to first review theidea behind the law of one price.
The Law of One Price (LoOP)
The law of one price says that identical goods should sell for the same price in twoseparate markets when there are no transportation costs and no differential taxesapplied in the two markets. Consider the following information about movie videotapes sold in the U.S. and Mexican markets.
Price of videos in U.S. market (Pv$ ) $20
Price of videos in Mexican market (Pvp ) p150
Spot exchange rate (Ep/$ ) 10 p/$
The dollar price of videos sold in Mexico can be calculated by dividing the videoprice in pesos by the spot exchange rate as shown:
Pvp
Ep/$ [ peso/videopeso/$
=pesovideo
×$
peso=
$
video ] =15010
= $15/video.
1. A theory of exchange ratedetermination based ontraders’ motivations that resultin a PPP exchange rate whenthere are no transportationcosts and no differential taxesapplied.
Chapter 6 Purchasing Power Parity
220
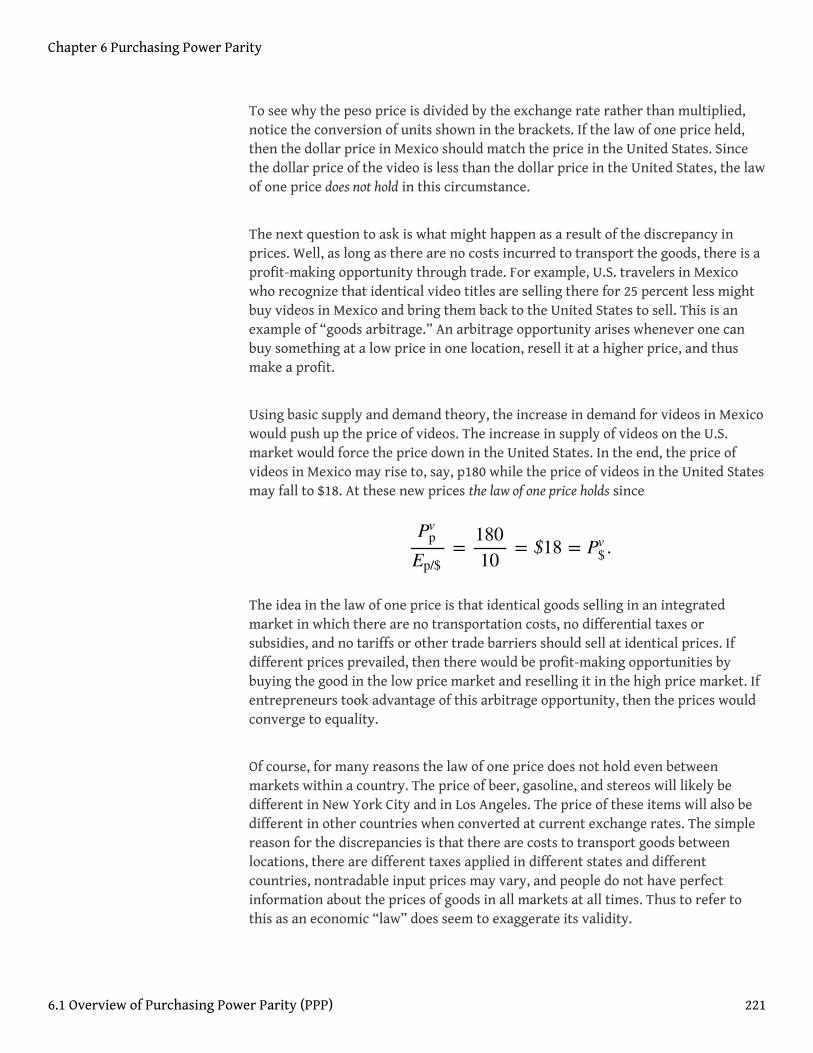
To see why the peso price is divided by the exchange rate rather than multiplied,notice the conversion of units shown in the brackets. If the law of one price held,then the dollar price in Mexico should match the price in the United States. Sincethe dollar price of the video is less than the dollar price in the United States, the lawof one price does not hold in this circumstance.
The next question to ask is what might happen as a result of the discrepancy inprices. Well, as long as there are no costs incurred to transport the goods, there is aprofit-making opportunity through trade. For example, U.S. travelers in Mexicowho recognize that identical video titles are selling there for 25 percent less mightbuy videos in Mexico and bring them back to the United States to sell. This is anexample of “goods arbitrage.” An arbitrage opportunity arises whenever one canbuy something at a low price in one location, resell it at a higher price, and thusmake a profit.
Using basic supply and demand theory, the increase in demand for videos in Mexicowould push up the price of videos. The increase in supply of videos on the U.S.market would force the price down in the United States. In the end, the price ofvideos in Mexico may rise to, say, p180 while the price of videos in the United Statesmay fall to $18. At these new prices the law of one price holds since
The idea in the law of one price is that identical goods selling in an integratedmarket in which there are no transportation costs, no differential taxes orsubsidies, and no tariffs or other trade barriers should sell at identical prices. Ifdifferent prices prevailed, then there would be profit-making opportunities bybuying the good in the low price market and reselling it in the high price market. Ifentrepreneurs took advantage of this arbitrage opportunity, then the prices wouldconverge to equality.
Of course, for many reasons the law of one price does not hold even betweenmarkets within a country. The price of beer, gasoline, and stereos will likely bedifferent in New York City and in Los Angeles. The price of these items will also bedifferent in other countries when converted at current exchange rates. The simplereason for the discrepancies is that there are costs to transport goods betweenlocations, there are different taxes applied in different states and differentcountries, nontradable input prices may vary, and people do not have perfectinformation about the prices of goods in all markets at all times. Thus to refer tothis as an economic “law” does seem to exaggerate its validity.
Pvp
Ep/$=
18010
= $18 = Pv$ .
Chapter 6 Purchasing Power Parity
6.1 Overview of Purchasing Power Parity (PPP) 221

From LoOP to PPP
The purchasing power parity theory is really just the law of one price applied in theaggregate but with a slight twist added. If it makes sense from the law of one pricethat identical goods should sell for identical prices in different markets, then thelaw ought to hold for all identical goods sold in both markets.
First, let’s define the variable CB$ to represent the cost of a basket of goods in the
United States denominated in dollars. For simplicity we could imagine using thesame basket of goods used in the construction of the U.S. consumer price index(CPI$). The consumer price index (CPI)2 uses a market basket of goods that are
purchased by an average household during a specified period. The basket isdetermined by surveying the quantity of different items purchased by manydifferent households. One can then determine, on average, how many units ofbread, milk, cheese, rent, electricity, and so on are purchased by the typicalhousehold. You might imagine it’s as if all products are purchased in a grocery storewith items being placed in a basket before the purchase is made. CB$ then
represents the dollar cost of purchasing all the items in the market basket. We willsimilarly define CBp to be the cost of a market basket of goods in Mexico
denominated in pesos.
Now if the law of one price holds for each individual item in the market basket,then it should hold for the market baskets as well. In other words,
Rewriting the right-hand side equation allows us to put the relationship in the formcommonly used to describe absolute purchasing power parity, which is
If this condition holds between two countries, then we would say PPP is satisfied.The condition says that the PPP exchange rate3 (pesos per dollar) will equal theratio of the costs of the two market baskets of goods denominated in local currency
units. Note that the reciprocal relationship EPPP$/p = CB$
CBpis also valid.
Because the cost of a market basket of goods is used in the construction of thecountry’s consumer price index, PPP is often written as a relationship between the
Pvp
Ep/$= Pv
$ ⇒CBp
Ep/$= CB$ .
EPPPp/$ =
CBp
CB$.
2. An index that measures theaverage level of prices of goodsand services in an economyrelative to a base year.
3. The exchange rate thatequalizes the cost of a marketbasket of goods between twocountries.
Chapter 6 Purchasing Power Parity
6.1 Overview of Purchasing Power Parity (PPP) 222

exchange rate and the country’s price indices. However, it is not possible merely tosubstitute the price index directly for the cost of the market basket used above. Tosee why, we will review the construction of the CPI in Chapter 6 "Purchasing PowerParity", Section 6.2 "The Consumer Price Index (CPI) and PPP".
KEY TAKEAWAYS
• The law of one price says that identical goods should sell for identicalprices in two different markets when converted at the current exchangerate and when there are no transportation costs and no differentialtaxes applied.
• The purchasing power parity theory is an aggregated version of the lawof one price.
• The purchasing power parity condition says that identical marketbaskets should sell for identical prices in two different markets whenconverted at the current exchange rate and when there are notransportation costs and no differential taxes applied.
Chapter 6 Purchasing Power Parity
6.1 Overview of Purchasing Power Parity (PPP) 223

EXERCISES
1. Jeopardy Questions. As in the popular television game show,you are given an answer to a question and you must respondwith the question. For example, if the answer is “a tax onimports,” then the correct question is “What is a tariff?”
a. The exchange rate value if toothpaste costs $2.50 in theUnited States and 30 pesos in Mexico and the law of oneprice holds.
b. The exchange rate value if a market basket costs $450 in theUnited States and 5,400 pesos in Mexico and purchasingpower parity holds.
c. The term used to describe a collection of goods and servicesconsumed by a typical consumer.
d. The term used to distinguish PPP based on price levels ratherthan inflation rates.
e. The term used to describe the economic principle thatidentical goods should sell at identical prices in differentmarkets.
2. Use the information in the table below to answer the followingquestion. Show your work.
The Economist Priceper Issue
Exchange Rate(December 2, 1999)
UnitedStates
$3.95 −
Canada C$ 4.95 1.47 C$/$
Japan ¥920 102 ¥/$
a. Calculate the implied purchasing power parity exchangerates between Canada and the United States and betweenJapan and the United States based on the price of theEconomist magazine.
Chapter 6 Purchasing Power Parity
6.1 Overview of Purchasing Power Parity (PPP) 224

6.2 The Consumer Price Index (CPI) and PPP
LEARNING OBJECTIVE
1. Learn the relationship between the consumer price index and the PPPexchange rate.
The consumer price index (CPI) is an index that measures the average level of pricesof goods and services in an economy relative to a base year. To track only whathappens to prices, the quantities of goods purchased is assumed to remain fixedfrom year to year. This is accomplished by determining—with survey methods—theaverage quantities of all goods and services purchased by a typical householdduring some period. The quantities of all of these goods together are referred to asthe average market basket. For example, the survey might find that the averagehousehold in one month purchases 10 gallons of gas, 15 cans of beer, 3.2 gallons ofmilk, 2.6 pounds of butter, and so on. The basket of goods would also contain itemslike health and auto insurance, housing services, utility services, and many otheritems. We can describe the market basket easily as a collection or set of quantities(Q1, Q2, Q3,…, Qn). Here Q1 may be the quantity of gasoline, Q2 the quantity of beer,
and so on. The set has n different quantity entries, implying that there are ndifferent items in the market basket.
The cost of the market basket is found by surveying the average prices for each ofthe n products in the market in question. This survey would yield a collection or setof prices (P1, P2, P3,…, Pn). The cost of the market basket is then found by summing
the product of the price and quantity for each item. That is, CB = P1Q1 + P2Q2 + P3Q3
+…+ PnQn, or
The first year in which the index is constructed is called the base year. Suppose1982 is the base year for the United States. Let CBYY represent the cost of the market
basket evaluated at the prices that prevail in the year (YY) (e.g., CB09 is the cost of a
market basket evaluated in 2009 prices). The CPI is derived according to thefollowing formula:
CB =∑i−1
n
PiQi.
Chapter 6 Purchasing Power Parity
225

where CPIYY is the CPI in the year (YY). The term is multiplied by 100 by convention,
probably because it reduces the need to use digits after a decimal point. Notice thatthe CPI in the base year is equal to 100—that is, CPI82 = 100—because CB82/CB82 = 1.
This is true for all indices—they are by convention set to 100 in the base year.
The CPI in a different year (either earlier or later) represents the ratio of the cost ofthe market basket in that year relative to the cost of the same basket in the baseyear. If in 1982 the cost of the market basket rises, then the CPI will rise above 100.If the cost of the market basket falls, then the CPI would fall below 100.
If the CPI rises, it does not mean that the prices of all the goods in the marketbasket have risen. Some prices may rise more or less. Some prices may even fall.The CPI measures the average price change of goods and services in the basket.
The inflation rate for an economy is the percentage change in the CPI during a year.Thus if CPI08 on January 1, 2008, and CPI09 on January 1, 2009, are the price indices,
then the inflation rate during 2008 is given by
PPP Using the CPI
The purchasing power parity relationship can be written using the CPI with somesmall adjustments. First, consider the following ratio of 2009 consumer priceindices between Mexico and the United States:
Given that the base year is 2008, the ratio is written in terms of the market basketcosts on the right-hand side and then rewritten into another form. The far right-hand side expression now reflects the purchasing power parity exchange rates in2009 divided by the PPP exchange rate in 2008, the base year. In other words,
CPIYY =CBYY
CB82× 100,
π08 =CPI09 − CPI08
CPI08× 100.
CPI 09p
CPI 09$=
CB09p CB08
p/CB09
$ CB08$/ =
CB09p
CB09$
CB08$
CB08p
=CB09
p CB09$/
CB08p CB08
$/ .
Chapter 6 Purchasing Power Parity
6.2 The Consumer Price Index (CPI) and PPP 226
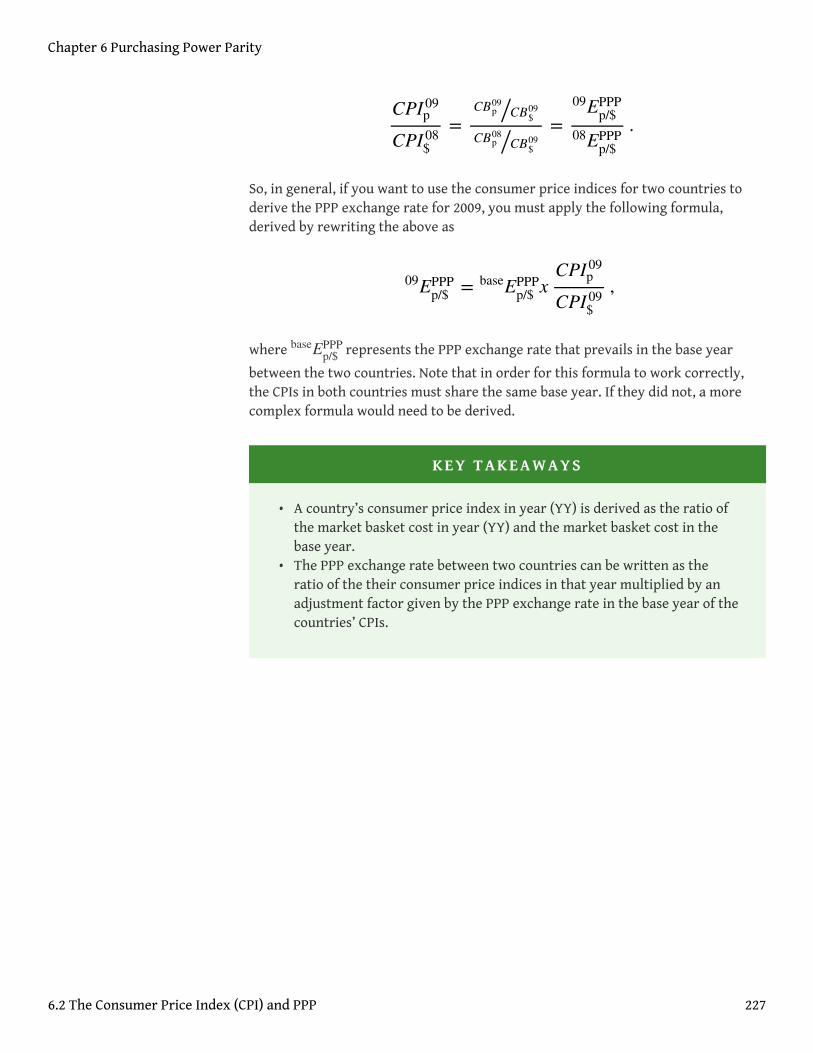
So, in general, if you want to use the consumer price indices for two countries toderive the PPP exchange rate for 2009, you must apply the following formula,derived by rewriting the above as
where Ebase PPPp/$ represents the PPP exchange rate that prevails in the base year
between the two countries. Note that in order for this formula to work correctly,the CPIs in both countries must share the same base year. If they did not, a morecomplex formula would need to be derived.
KEY TAKEAWAYS
• A country’s consumer price index in year (YY) is derived as the ratio ofthe market basket cost in year (YY) and the market basket cost in thebase year.
• The PPP exchange rate between two countries can be written as theratio of the their consumer price indices in that year multiplied by anadjustment factor given by the PPP exchange rate in the base year of thecountries’ CPIs.
CPI 09p
CPI 08$=
CB09p CB09
$/CB08
p CB09$/ =
E09 PPPp/$
E08 PPPp/$
.
E09 PPPp/$ = Ebase PPP
p/$ xCPI 09p
CPI 09$,
Chapter 6 Purchasing Power Parity
6.2 The Consumer Price Index (CPI) and PPP 227

EXERCISE
1. Suppose a consumer purchases the following products eachweek: ten gallons of gas, fifteen cans of beer, three gallons ofmilk, and two pounds of butter. Suppose in the initial week theprices of the products are $3 per gallon of gas, $2 per can of beer,$4 per gallon of milk, and $4 per pound of butter. Suppose oneyear later the prices of the same products are $2 per gallon ofgas, $3 per can of beer, $5 per gallon of milk, and $5 per pound ofbutter.
a. Calculate the cost of a weekly market basket in the initialbase period.
b. Calculate the cost of a market basket one year later.c. Construct the price index value for both years.d. What is the inflation rate between the two years?
Chapter 6 Purchasing Power Parity
6.2 The Consumer Price Index (CPI) and PPP 228

6.3 PPP as a Theory of Exchange Rate Determination
LEARNING OBJECTIVE
1. Learn how adjustment to equilibrium occurs in the PPP model.
The purchasing power parity (PPP) relationship becomes a theory of exchange ratedetermination by introducing assumptions about the behavior of importers andexporters in response to changes in the relative costs of national market baskets.Recall the story of the law of one price, when the price of a good differed betweentwo countries’ markets and there was an incentive for profit-seeking individuals tobuy the good in the low price market and resell it in the high price market.Similarly, if a market basket containing many different goods and services costsmore in one market than another, we should likewise expect profit-seekingindividuals to buy the relatively cheaper goods in the low-cost market and resellthem in the higher-priced market. If the law of one price leads to the equalizationof the prices of a good between two markets, then it seems reasonable to concludethat PPP, describing the equality of market baskets across countries, should alsohold.
However, adjustment within the PPP theory occurs with a twist compared toadjustment in the law of one price story. In the law of one price story, goodsarbitrage in a particular product was expected to affect the prices of the goods inthe two markets. The twist that’s included in the PPP theory is that arbitrage,occurring across a range of goods and services in the market basket, will affect theexchange rate rather than the market prices.
PPP Equilibrium Story
To see why the PPP relationship represents an equilibrium, we need to tell anequilibrium story. An equilibrium story in an economic model is an explanation ofhow the behavior of individuals will cause the equilibrium condition to be satisfied.The equilibrium condition is the PPP equation written as
EPPPp/$ =
CBp
CB$.
Chapter 6 Purchasing Power Parity
229

The endogenous variable in the PPP theory is the exchange rate. Thus we need toexplain why the exchange rate will change if it is not in equilibrium. In generalthere are always two versions of an equilibrium story, one in which the endogenousvariable (Ep/$ here) is too high and one in which it is too low.
PPP equilibrium story 1. Let’s consider the case in which the exchange rate is toolow to be in equilibrium. This means that
where Ep/$ is the exchange rate that prevails on the spot market. Since it is less
than the ratio of the market basket costs in Mexico and the United States, it is alsoless than the PPP exchange rate. The right side of the expression is rewritten toshow that the cost of a market basket in the United States evaluated in pesos (i.e.,CB$Ep/$) is less than the cost of the market basket in Mexico also evaluated in pesos.
Thus it is cheaper to buy the basket in the United States, or in other words, it ismore profitable to sell items in the market basket in Mexico.
The PPP theory now suggests that the cheaper basket in the United States will leadto an increase in demand for goods in the U.S. market basket by Mexico. As aconsequence, it will increase the demand for U.S. dollars on the foreign exchange(Forex) market. Dollars are needed because purchases of U.S. goods require U.S.dollars. Alternatively, U.S. exporters will realize that goods sold in the United Statescan be sold at a higher price in Mexico. If these goods are sold in pesos, the U.S.exporters will want to convert the proceeds back to dollars. Thus there is anincrease in U.S. dollar demand (by Mexican importers) and an increase in pesosupply (by U.S. exporters) on the Forex. This effect is represented by a rightwardshift in the U.S. dollar demand curve in Figure 6.1 "Forex Adjustment When ". Atthe same time, U.S. consumers will reduce their demand for the pricier Mexicangoods. This will reduce the supply of dollars (in exchange for pesos) on the Forex,which is represented by a leftward shift in the U.S. dollar supply curve in the Forexmarket.
Ep/$ <CBp
CB$⇒ CB$Ep/$ < CBp ,
Chapter 6 Purchasing Power Parity
6.3 PPP as a Theory of Exchange Rate Determination 230

Figure 6.1 Forex Adjustment When Ep/$ Is Low
Both the shift in demand and supply will cause an increase in the value of the dollarand thus the exchange rate (Ep/$) will rise. As long as the U.S. market basket
remains cheaper, excess demand for the dollar will persist and the exchange ratewill continue to rise. The pressure for change ceases once the exchange rate risesenough to equalize the cost of market baskets between the two countries and PPPholds.
PPP equilibrium story 2. Now let’s consider the other equilibrium story (i.e., thecase in which the exchange rate is too high to be in equilibrium). This implies that
The left-side expression says that the spot exchange rate is greater than the ratio ofthe costs of market baskets between Mexico and the United States. In other words,the exchange rate is above the PPP exchange rate. The right-side expression saysthat the cost of a U.S. market basket, converted to pesos at the current exchangerate, is greater than the cost of a Mexican market basket in pesos. Thus, on average,
Ep/$ >CBp
CB$⇒ CB$Ep/$ > CBp .
Chapter 6 Purchasing Power Parity
6.3 PPP as a Theory of Exchange Rate Determination 231
U.S. goods are relatively more expensive while Mexican goods are relativelycheaper.
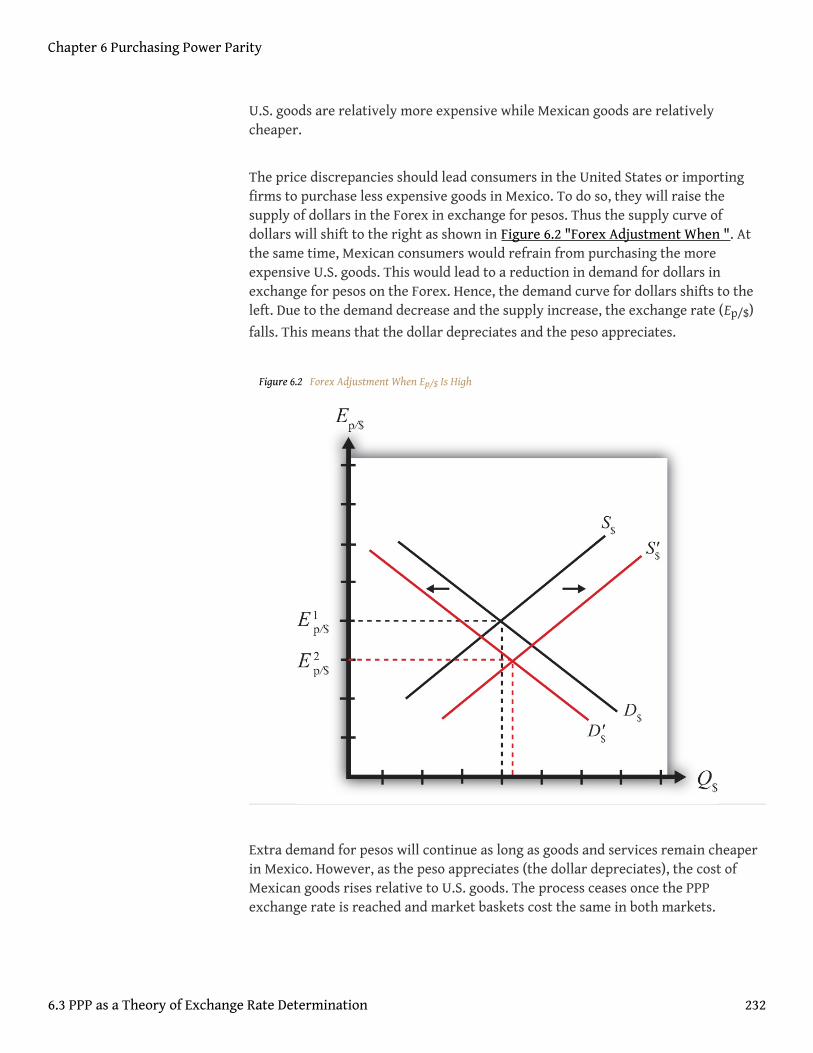
The price discrepancies should lead consumers in the United States or importingfirms to purchase less expensive goods in Mexico. To do so, they will raise thesupply of dollars in the Forex in exchange for pesos. Thus the supply curve ofdollars will shift to the right as shown in Figure 6.2 "Forex Adjustment When ". Atthe same time, Mexican consumers would refrain from purchasing the moreexpensive U.S. goods. This would lead to a reduction in demand for dollars inexchange for pesos on the Forex. Hence, the demand curve for dollars shifts to theleft. Due to the demand decrease and the supply increase, the exchange rate (Ep/$)
falls. This means that the dollar depreciates and the peso appreciates.
Figure 6.2 Forex Adjustment When Ep/$ Is High
Extra demand for pesos will continue as long as goods and services remain cheaperin Mexico. However, as the peso appreciates (the dollar depreciates), the cost ofMexican goods rises relative to U.S. goods. The process ceases once the PPPexchange rate is reached and market baskets cost the same in both markets.
Chapter 6 Purchasing Power Parity
6.3 PPP as a Theory of Exchange Rate Determination 232

Adjustment to Price Level Changes under PPP
In the PPP theory, exchange rate changes are induced by changes in relative pricelevels between two countries. This is true because the quantities of the goods arealways presumed to remain fixed in the market baskets. Therefore, the only waythat the cost of the basket can change is if the goods’ prices change. Since pricelevel changes represent inflation rates, this means that differential inflation rateswill induce exchange rate changes according to the theory.
If we imagine that a country begins with PPP, then the inequality given inequilibrium story 1, CB$Ep/$ < CBp ,can arise if the price level rises in Mexico(peso inflation), if the price level falls in the United States (dollar deflation), or ifMexican inflation is more rapid than U.S. inflation. According to the theory, thebehavior of importers and exporters would now induce a dollar appreciation and apeso depreciation. In summary, an increase in Mexican prices relative to the changein U.S. prices (i.e., more rapid inflation in Mexico than in the United States) willcause the dollar to appreciate and the peso to depreciate according to thepurchasing power parity theory.
Similarly, if a country begins with PPP, then the inequality given in equilibriumstory 2, CB$Ep/$ > CBp ,can arise if the price level rises in the United States(dollar inflation), the price level falls in Mexico (peso deflation), or if U.S. inflationis more rapid than Mexican inflation. In this case, the inequality would affect thebehavior of importers and exporters and induce a dollar depreciation and pesoappreciation. In summary, more rapid inflation in the United States would causethe dollar to depreciate while the peso would appreciate.
KEY TAKEAWAYS
• An increase in Mexican prices relative to the change in U.S. prices (i.e.,more rapid inflation in Mexico than in the United States) will cause thedollar to appreciate and the peso to depreciate according to thepurchasing power parity theory.
• More rapid inflation in the United States would cause the dollar todepreciate while the peso would appreciate.
Chapter 6 Purchasing Power Parity
6.3 PPP as a Theory of Exchange Rate Determination 233

EXERCISE
1. Jeopardy Questions. As in the popular television game show,you are given an answer to a question and you must respondwith the question. For example, if the answer is “a tax onimports,” then the correct question is “What is a tariff?”
a. Of increase, decrease, or no change, the effect on the demandfor euros in the foreign exchange market if a market basketcosts more in the United States than it does in Germany.
b. Of increase, decrease, or no change, the effect on the supply ofdollars in the foreign exchange market if a market basketcosts more in the United States than it does in Germany.
c. Of increase, decrease, or no change, the effect on the U.S. dollarvalue according to the PPP theory if a market basket costs$300 in the United States and €200 in Germany and theexchange rate is E$/€ = 1.30.
d. Of increase, decrease, or no change, the effect on the euro valueaccording to the PPP theory if a market basket costs €200 inGermany and ¥22,000 in Japan and the exchange rate is E¥/€ =115.
e. Of increase, decrease, or no change, the effect on the euro valueaccording to the PPP theory if a market basket costs €200 inGermany and ¥22,000 in Japan and the exchange rate is E¥/€ =100.
Chapter 6 Purchasing Power Parity
6.3 PPP as a Theory of Exchange Rate Determination 234

6.4 Problems and Extensions of PPP
LEARNING OBJECTIVES
1. Identify the reasons why the PPP condition is rarely satisfied betweentwo countries.
2. Learn the dynamic version of PPP.
Problems with the PPP Theory
The main problem with the purchasing power parity (PPP) theory is that the PPPcondition is rarely satisfied within a country. There are quite a few reasons that canexplain this and so, given the logic of the theory, which makes sense, economistshave been reluctant to discard the theory on the basis of lack of supportingevidence. Below we consider some of the reasons PPP may not hold.
Transportation costs and trade restrictions. Since the PPP theory is derived from thelaw of one price, the same assumptions are needed for both theories. The law of oneprice assumes that there are no transportation costs and no differential taxesapplied between the two markets. These mean that there can be no tariffs onimports or other types of restrictions on trade. Since transport costs and traderestrictions do exist in the real world, this would tend to drive prices for similargoods apart. Transport costs should make a good cheaper in the exporting marketand more expensive in the importing market. Similarly, an import tariff woulddrive a wedge between the prices of an identical good in two trading countries’markets, raising it in the import market relative to the export market price. Thusthe greater transportation costs and trade restrictions are between countries, theless likely for the costs of market baskets to be equalized.
Costs of nontradable inputs. Many items that are homogeneous nevertheless sell fordifferent prices because they require a nontradable input in the production process.As an example, consider why the price of a McDonald’s Big Mac hamburger sold indowntown New York City is higher than the price of the same product in the NewYork suburbs. Because the rent for restaurant space is much higher in the citycenter, the restaurant will pass along its higher costs in the form of higher prices.Substitute products in the city center (other fast food restaurants) will face thesame high rental costs and thus will charge higher prices as well. Because it wouldbe impractical (i.e., costly) to produce the burgers at a cheaper suburban location
Chapter 6 Purchasing Power Parity
235

and then transport them for sale in the city, competition would not drive the pricestogether in the two locations.
Perfect information. The law of one price assumes that individuals have good, evenperfect, information about the prices of goods in other markets. Only with thisknowledge will profit seekers begin to export goods to the high price market andimport goods from the low-priced market. Consider a case in which there isimperfect information. Perhaps some price deviations are known to traders butother deviations are not known, or maybe only a small group of traders know abouta price discrepancy and that group is unable to achieve the scale of trade needed toequalize the prices for that product. (Perhaps they face capital constraints and can’tborrow enough money to finance the scale of trade needed to equalize prices.) Ineither case, traders without information about price differences will not respond tothe profit opportunities and thus prices will not be equalized. Thus the law of oneprice may not hold for some products, which would imply that PPP would not holdeither.
Other market participants. Notice that in the PPP equilibrium stories, it is thebehavior of profit-seeking importers and exporters that forces the exchange rate toadjust to the PPP level. These activities would be recorded on the current account ofa country’s balance of payments. Thus it is reasonable to say that the PPP theory isbased on current account transactions. This contrasts with the interest rate paritytheory in which the behavior of investors seeking the highest rates of return oninvestments motivates adjustments in the exchange rate. Since investors aretrading assets, these transactions would appear on a country’s capital account of itsbalance of payments. Thus the interest rate parity theory is based on capitalaccount transactions.
It is estimated that there are approximately $1–2 trillion dollars worth of currencyexchanged every day on international foreign exchange (Forex) markets. That’sone-eighth of U.S. GDP, which is the value of production in the United States in anentire year. In addition, the $1–2 trillion estimate is made by counting only one sideof each currency trade. Thus that’s an enormous amount of trade. If one considersthe total amount of world trade each year and then divides by 365, one can get theaverage amount of goods and services traded daily. This number is less than $100billion dollars. This means that the amount of daily currency transactions is morethan ten times the amount of daily trade. This fact would seem to suggest that theprimary effect on the daily exchange rate must be caused by the actions of investorsrather than importers and exporters. Thus the participation of other traders in theForex market, who are motivated by other concerns, may lead the exchange rate toa value that is not consistent with PPP.
Chapter 6 Purchasing Power Parity
6.4 Problems and Extensions of PPP 236

Relative PPP
There is an alternative version of the PPP theory called the “relative PPP theory4.”In essence this is a dynamic version of the absolute PPP theory. Since absolute PPPsuggests that the exchange rate may respond to inflation, we can imagine that theexchange rate would change in a systematic way given that a continual change inthe price level (inflation) is occurring.
In the relative PPP theory, exchange rate changes over time are assumed to bedependent on inflation rate differentials between countries according to thefollowing formula:
Here the percentage change in the dollar value between the first period and thesecond period is given on the left side. The right side gives the differences in theinflation rates between Mexico and the United States that were evaluated over thesame time period. The implication of relative PPP is that if the Mexican inflationrate exceeds the U.S. inflation rate, then the dollar will appreciate by thatdifferential over the same period. The logic of this theory is the same as in absolutePPP. Importers and exporters respond to variations in the relative costs of marketbaskets so as to maintain the law of one price, at least on average. If prices continueto rise faster in Mexico than in the United States, for example, price differencesbetween the two countries would grow and the only way to keep up with PPP is forthe dollar to appreciate continually versus the peso.
KEY TAKEAWAYS
• Purchasing power parity (PPP) will not be satisfied between countrieswhen there are transportation costs, trade barriers (e.g., tariffs),differences in prices of nontradable inputs (e.g., rental space), imperfectinformation about current market conditions, and when other Forexmarket participants, such as investors, trade currencies for otherreasons.
• Relative PPP is a dynamic version of the theory that relates currencyappreciation or depreciation to differences in country inflation rates.
E2p/$ − E1
p/$
E1p/$
= πp − π$ .
4. A dynamic version of the PPPtheory that relates currencyappreciation or depreciation todifferences in inflation ratesbetween countries.
Chapter 6 Purchasing Power Parity
6.4 Problems and Extensions of PPP 237

EXERCISE
1. Jeopardy Questions. As in the popular television game show,you are given an answer to a question and you must respondwith the question. For example, if the answer is “a tax onimports,” then the correct question is “What is a tariff?”
a. The name for the PPP theory based on relative inflation ratesbetween countries.
b. A type of trade cost whose presence is likely to causedeviations in the law of one price and PPP.
c. The term used to describe a kind of production input, ofwhich office rental is one type.
d. Traders need to have information about this in othermarkets in order to take advantage of arbitrageopportunities.
Chapter 6 Purchasing Power Parity
6.4 Problems and Extensions of PPP 238
6.5 PPP in the Long Run
LEARNING OBJECTIVE
1. Interpret the PPP theory as a projection of long-term tendencies inexchange rate values.
In general, the purchasing power parity (PPP) theory works miserably when appliedto real-world data. In other words, it is rare for the PPP relationship to hold truebetween any two countries at any particular point in time. In most scientificdisciplines, the failure of a theory to be supported by the data means the theory isrefuted and should be thrown out or tossed away. However, economists have beenreluctant to do that with the PPP theory. In part this is because the logic of thetheory seems particularly sound. In part it’s because there are so many “frictions”in the real world, such as tariffs, nontariff barriers, transportation costs,measurement problems, and so on that it would actually be surprising for thetheory to work when applied directly to the data. (It is much like expecting anobject to follow Newton’s laws of motion while sitting on the ground.)
In addition, economists have conceived of an alternative way to interpret or applythe PPP theory to overcome the empirical testing problem. The trick is to think ofPPP as a “long-run” theory of exchange rate determination rather than a short-runtheory. Under such an interpretation, it is no longer necessary for PPP to hold atany point in time. Instead, the PPP exchange rate is thought to represent a targettoward which the spot exchange rate is slowly drawn.
This long-run interpretation requires an assumption that importers and exporterscannot respond quickly to deviations in the cost of market baskets betweencountries. Instead of immediate responses to price differences between countries byengaging in arbitrage—buying at the low price and selling high—traders respondslowly to these price signals. Some reasons for the delay include imperfectinformation (traders are not aware of the price differences), long-term contracts(traders must wait till current contractual arrangements expire), and/or marketingcosts (entry to new markets requires research and setup costs). In addition, werecognize that the exchange rate is not solely determined by trader behavior.Investors, who respond to different incentives, might cause persistent deviationsfrom the PPP exchange rate even if traders continue to respond to the pricedifferences.
Chapter 6 Purchasing Power Parity
239

When there is a delayed response, PPP no longer needs to hold at a particular pointin time. However, the theory does imagine that traders eventually will adjust to theprice differences (buying low and selling high), causing an eventual adjustment ofthe spot exchange rate toward the PPP rate. However, as adjustment occurs, it isquite possible that the PPP exchange rate also continues to change. In this case, thespot exchange rate is adjusting toward a moving target.
How long will this adjustment take? In other words, how long is the long run? Theterm itself is generally used by economists to represent some “unspecified” longperiod of time; it might be several months, years, or even decades. Also, since thetarget, the PPP exchange rate, is constantly changing, it is quite possible that it isnever reached. The adjustment process may never allow the exchange rate to catchup to the target even though it is constantly chasing it.
Perhaps the best way to see what the long-run PPP theory suggests is to considerFigure 6.3 "Hypothetical Long-Term Trend". The figure presents constructed data(i.e., made up) between two countries, A and B. The dotted black line shows theratio of the costs of market baskets between the two countries over a long period, acentury between 1904 and 2004. It displays a steady increase, indicating that priceshave risen faster in country A relative to country B. The solid blue line shows a plotof the exchange rate between the two countries during the same period. If PPP wereto hold at every point in time, then the exchange rate plot would lie directly on topof the market basket ratio plot. The fact that it does not means PPP did not hold allthe time. In fact, PPP held only at times when the exchange rate plot crosses themarket basket ratio plot; on the diagram this happened only twice during thecentury—not a very good record.
Figure 6.3 Hypothetical Long-Term Trend
Chapter 6 Purchasing Power Parity
6.5 PPP in the Long Run 240
Nonetheless, despite performing poorly with respect to moment-by-moment PPP,the figure displays an obvious regularity. The trend of the exchange rate betweenthe countries is almost precisely the trend in the market basket ratio; both moveupward at about the same “average” rate. Sometimes the exchange rate is below themarket basket ratio, even for a long period of time, but at other times, the exchangerate rises up above the market basket ratio.
The idea here is that lengthy exchange rate deviations from the market basket ratio(i.e., the PPP exchange rate) mean long periods of time in which the cost of goods ischeaper in one country than in another. Eventually, traders will respond to theseprice discrepancies and begin to import more from the less expensive country. Thiswill lead to the increase in demand for that country’s currency and cause theexchange rate to move back toward the market basket ratio. However, in the long-run version of the theory, this will take time, sometimes a considerable amount oftime, even years or more.
To see how this relationship works in one real-world example, consider Figure 6.4"U.S./UK Long-Term Trends". It plots the exchange rate (E$/£) between the U.S.
dollar and the British pound between 1913 and 2004 together with an adjusted ratioof the countries’ consumer price indices (CPIs) during the same period.A technicalpoint: The ratio of CPIs is adjusted because the ratio of CPIs must be multiplied bythe PPP exchange rate that prevailed in the base year for the two countries.However, the CPI series used has 1967 as the base year in the United Kingdom and1974 as the base year in the United States. This would mean the CPI ratio should bemultiplied by the ratio of the cost of a market basket in the United States in 1974divided by the market basket cost in the United Kingdom in 1967. Unsurprisingly, Idon’t have that information. Thus I’ll assume a number (1.75) that is somewhatgreater than the actual exchange rate that prevailed at the time. The highernumber may account for the fact that prices rose considerably between 1967 and1974. In any case, it remains a guess. The adjusted ratio represents an estimate ofthe ratio of the costs of market baskets between the two countries.
Chapter 6 Purchasing Power Parity
6.5 PPP in the Long Run 241
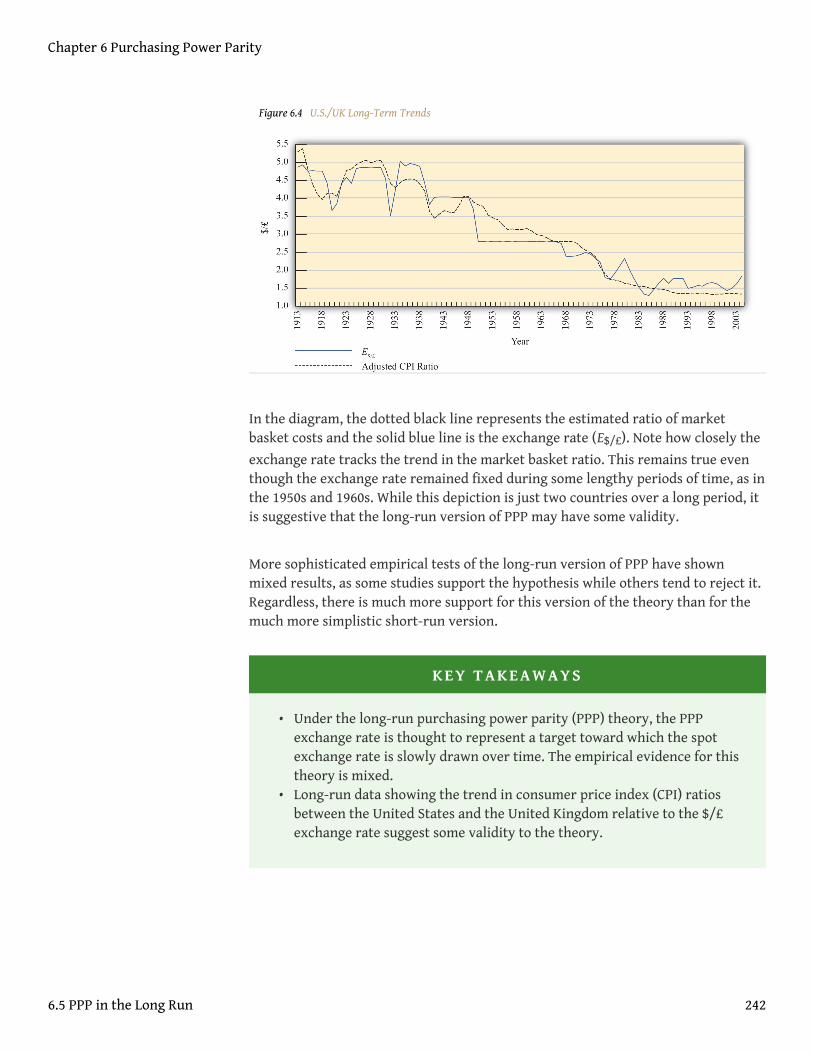
Figure 6.4 U.S./UK Long-Term Trends
In the diagram, the dotted black line represents the estimated ratio of marketbasket costs and the solid blue line is the exchange rate (E$/£). Note how closely the
exchange rate tracks the trend in the market basket ratio. This remains true eventhough the exchange rate remained fixed during some lengthy periods of time, as inthe 1950s and 1960s. While this depiction is just two countries over a long period, itis suggestive that the long-run version of PPP may have some validity.
More sophisticated empirical tests of the long-run version of PPP have shownmixed results, as some studies support the hypothesis while others tend to reject it.Regardless, there is much more support for this version of the theory than for themuch more simplistic short-run version.
KEY TAKEAWAYS
• Under the long-run purchasing power parity (PPP) theory, the PPPexchange rate is thought to represent a target toward which the spotexchange rate is slowly drawn over time. The empirical evidence for thistheory is mixed.
• Long-run data showing the trend in consumer price index (CPI) ratiosbetween the United States and the United Kingdom relative to the $/£exchange rate suggest some validity to the theory.
Chapter 6 Purchasing Power Parity
6.5 PPP in the Long Run 242

EXERCISE
1. Jeopardy Questions. As in the popular television game show,you are given an answer to a question and you must respondwith the question. For example, if the answer is “a tax onimports,” then the correct question is “What is a tariff?”
a. The term used by economists to denote an unspecified pointin time in the distant future.
b. The term used by economists to denote an unspecified pointin time in the near future.
c. The term used to describe the general path along which avariable is changing.
d. Under this version of the PPP theory, the PPP exchange raterepresents a target toward which the spot exchange rate isslowly drawn over time.
Chapter 6 Purchasing Power Parity
6.5 PPP in the Long Run 243

6.6 Overvaluation and Undervaluation
LEARNING OBJECTIVE
1. Recognize how the terms overvalued and undervalued exchange rates aredefined, applied, and interpreted.
It is quite common to hear people claim that a country’s exchange rate isovervalued or undervalued. The first question one should ask when someone claimsthe exchange rate is overvalued is “overvalued with respect to what?” There aretwo common reference exchange rates often considered. The person may mean theexchange rate is overvalued with respect to purchasing power parity (PPP), or hemay mean the exchange rate is overvalued relative to the rate presumed Needed tobalance the current account (CA).
The mere use of these terms suggests immediately that there is some “proper”value for the exchange rate. However, one should refrain from accepting thisimplication. As was previously discussed, PPP is unlikely to hold, even over verylong periods, for a variety of very good reasons. Also, there is no reason to thinkthat current account balance represents some equilibrium or goal for an economy:countries can run trade deficits or surpluses for an extended period and suffer no illeffects. Thus overvaluation or undervaluation of an exchange rate, for either reason(PPP or current account balance) should be thought of simply as something thathappens. Of more interest is what it means when it happens.
Over- and Undervaluation with Respect to PPP
First let’s consider over- and undervaluation with respect to PPP. The PPP exchangerate is defined as the rate that equalizes the cost of a market basket of goodsbetween two countries. The PPP exchange rate between the Mexican peso and theU.S. dollar would be written as
which represents the PPP value of the U.S. dollar in terms of pesos.
EPPPp/$ =
CBp
CB$,
Chapter 6 Purchasing Power Parity
244

If the U.S. dollar is overvalued with respect to the Mexican peso, then the spotexchange rate exceeds the PPP exchange rate:
This will also mean the exchange rate exceeds the ratio of market basket costs:
therefore, the following will hold:
The left side (LS) of this expression represents the cost of a U.S. market basketconverted to pesos at the current spot exchange rate. The right side (RS) is the costof the basket in Mexico also evaluated in pesos. Since LS > RS, goods and servicescost more on average in the United States than in Mexico at the current exchangerate. Thus for the U.S. dollar to be overvalued with respect to the peso means thatgoods and services are relatively more expensive in the United States than inMexico. Of course, it also implies that goods and services are relatively cheaper inMexico.
A simple guide to judge whether a currency is overvalued is to consider it from theperspective of a tourist. When the U.S. dollar is overvalued, a U.S. tourist travelingto Mexico will find that many products seem cheaper than in the United States,after converting at the spot exchange rate. Thus an overvalued currency will buymore in other countries.
An undervalued currency works in the opposite direction. When the U.S. dollar isundervalued, the cost of a basket of goods in the United States is lower than the costin Mexico when evaluated at the current exchange rate. To a U.S. tourist, Mexicangoods and services would seem more expensive on average. Thus an undervaluedcurrency will buy less in other countries.
Finally, if the U.S. dollar is overvalued with respect to the Mexican peso, it followsthat the peso is undervalued with respect to the dollar. In this case, since the U.S.tourists would find Mexican goods comparatively cheap, Mexican tourists wouldfind U.S. goods to be comparatively expensive. If the U.S. dollar were undervalued,then the peso would be overvalued.
Ep/$ > EPPPp/$ .
Ep/$ >CBp
CB$;
Ep/$CB$ > CBp .
Chapter 6 Purchasing Power Parity
6.6 Overvaluation and Undervaluation 245
Is overvaluation or undervaluation good or bad? That depends on what a person istrying to achieve. For example, if the U.S. dollar is overvalued with respect to thepeso, then a U.S. tourist traveling to Mexico will be very happy. In fact, the moreovervalued the dollar is, the better. However, for an exporter of U.S. goods toMexico, its price in peso terms will be higher the more overvalued is the dollar.Thus an overvalued dollar will likely reduce sales and profits for these U.S. firms.
Over- and Undervaluation with Respect to Current AccountBalance
The second way over- and undervaluation is sometimes applied is in comparison toan exchange rate presumed necessary to induce trade balance, or balance on thecurrent account. If one imagines that a trade deficit, for example, arises primarilybecause a country imports too much or exports too little (rather than being drivenby financial decisions tending to cause a financial account surplus), then one mayalso look for ways to either reduce imports or raise exports. A change in theexchange rate offers one viable method to affect trade flows.
Suppose the United States has a trade deficit (which it indeed has had for more thanthirty years prior to 2010). If the U.S. dollar value were to fall—a dollardepreciation—then foreign goods would all become relatively more expensive toU.S. residents, tending to reduce U.S. imports. At the same time, a dollardepreciation would also cause U.S. goods to become relatively cheaper to foreignresidents tending to raise U.S. exports.
Sometimes economists make numerical estimations as to how much the dollar valuewould have to fall to bring trade into balance. These estimations are enormouslydifficult to make for several reasons and should be interpreted and used with greatcaution, if at all. The primary reason is that many different factors on both thetrade side and the financial side influence a country’s trade imbalance besides justthe exchange rate. The exchange rate that balances trade would depend on thevalues taken by all the other factors that also influence the trade balance. Differentvalues for all the other variables would mean a different exchange rate needed tobalance trade. Thus there isn’t one exchange rate value that will balance trade.Instead, there is a different exchange rate value that will balance trade in each andevery alternative circumstance. Indeed, even the current exchange rate—whateverthat is—can balance trade if other factors change appropriately.
Despite these cautions, many observers will still contend that a country’s currencyneeds to depreciate by some percentage to eliminate a trade deficit, or needs toappreciate to eliminate a trade surplus. When it is believed a depreciation of thecurrency is needed to balance trade, they will say the currency is overvalued. When
Chapter 6 Purchasing Power Parity
6.6 Overvaluation and Undervaluation 246

it is believed an appreciation of the currency is needed to balance trade, they willsay the currency is undervalued. However, in a floating exchange rate system, it ishard to argue that the exchange rate is at the “wrong” value since—withcompetition in the market—it will always be at the rate that equalizes supply anddemand. In other words, the “proper” value for the exchange rate can be said to benot the one that will satisfy PPP or not the one that will generate trade balance butrather whatever rate currently prevails. Under this notion, a currency can never beover- or undervalued in a floating exchange rate system. Instead, the spot exchangerate is always at the “proper” value.
In a fixed exchange rate system, a government can sometimes intervene tomaintain an exchange rate that is very different from what would arise if allowed tofloat. In these cases, large trade surpluses can arise because the governmentmaintains an artificially low value for its currency. Calls for a revaluation(appreciation) of the currency, to promote a reduction in a trade surplus, aresomewhat more appropriate in these cases since the market does not determine theexchange rate. Similarly, large deficits could be reduced with a devaluation(depreciation) of the currency.
KEY TAKEAWAYS
• A currency can be overvalued or undervalued with respect to tworeference values: (1) the value that would satisfy purchasing powerparity (PPP) or (2) the value that would generate current accountbalance.
• Use of the terms overvaluation and undervaluation suggests that there is a“proper” value for the exchange rate. However, there are often validreasons why exchange rates will not conform to PPP or why tradeimbalances will persist.
• In a floating exchange rate system, the “proper” exchange rate can besaid to be the rate that equalizes supply and demand for currencies inexchange. Under this notion, there can never be an over- orundervalued exchange rate.
Chapter 6 Purchasing Power Parity
6.6 Overvaluation and Undervaluation 247

EXERCISES
1. Use the information in the table below to answer the question,“Is the U.S. dollar overvalued or undervalued with respect to theCanadian dollar and the Japanese yen in terms of purchases ofthe Economist?” State why it is overvalued or undervalued. Showyour work.
The Economist Priceper Issue
Exchange Rate(December 2, 1999)
UnitedStates
$3.95 −
Canada C$4.95 1.47 C$/$
Japan ¥920 102 ¥/$
2. Use the information in the table below to answer the followingquestions:
Big MacPrice
Exchange Rate (June 4,1998)
United States(dollar)
$2.53 −
South Korea (won) W 2,600 1,475 W/$
Israel (shekel) sh 12.50 3.70 sh/$
Poland (zloty) zl 5.30 3.46 zl/$
a. Calculate whether the won, shekel, and zloty are overvaluedor undervalued with respect to the U.S. dollar in terms of BigMac purchases. Explain what it means to be overvalued orundervalued.
b. What would the exchange rates have to be in order toequalize Big Mac prices between South Korea and the UnitedStates, Israel and the United States, and Poland and theUnited States?
c. If in the long run the exchange rate moves to satisfy Big Macpurchasing power parity (PPP), will the won, shekel, and
Chapter 6 Purchasing Power Parity
6.6 Overvaluation and Undervaluation 248

zloty appreciate or depreciate in terms of dollars? Explainthe logic.
3. Use the information about the hourly wage for a high schoolprincipal and exchange rates to answer the following questions:
WageActual Exchange
RatePPP Exchange
Rate
UnitedStates
$25/hour − −
MexicoP220/hour
10.9 p/$ 7.5 p/$
Japan¥3,000/
hour110 ¥/$ 132 ¥/$
a. Calculate the hourly wage rate in dollars in Mexico and Japanusing the actual exchange rates.
b. Calculate the hourly wage rate in dollars in Mexico and Japanusing the PPP exchange rates.
c. Based on the information above, in which country is it bestto be a high school principal? Which country is second best?Which is third best?
d. In terms of PPP, is the U.S. dollar overvalued or undervaluedwith respect to the peso and with respect to the yen?
e. According to the PPP theory, given the conditions above,would the dollar be expected to appreciate or depreciatewith respect to the peso and with respect to the yen?
Chapter 6 Purchasing Power Parity
6.6 Overvaluation and Undervaluation 249

6.7 PPP and Cross-Country Comparisons
LEARNING OBJECTIVE
1. Learn why using PPP exchange rates to convert income data to acommon currency is a better method for making cross-countrycomparisons.
Probably the most important application of purchasing power parity (PPP)exchange rates is in making cross-country comparisons of income, wages, or grossdomestic product (GDP). Suppose that we would like to compare per capita GDPbetween two countries—say, the United States and China. In 2004, GDP in the UnitedStates was approximately $12 trillion; in China GDP was about ¥16 trillion. With apopulation in the United States of 290 million people, per capita U.S. GDP works outto $41,400 per person. China’s population was approximately 1.3 billion people in2004, so its GDP per capita works out to 11,500 yuan (¥) per person. However, wecan’t compare these two per capita figures since they are in different units—dollarsand yuan. Thus we need to convert units, either turn dollars into yuan or yuan intodollars.
The simplest approach to make this conversion is to use the spot exchange rate thatprevailed in 2004, which was 8.28 yuan per dollar. Converting yuan to dollars yieldsa per capita GDP for China of $1,390. Note that at $41,400 per person, U.S. per capitaGDP was almost thirty times higher than China’s.
However, there is a problem using this method. One thing that is quickly recognizedby Americans when they travel in and around China is that many goods andservices seem considerably cheaper than they are in the United States. From aChinese traveler’s perspective, many U.S. goods would seem considerably moreexpensive. The implication is that although U.S. GDP per person is thirty timeshigher, that income may not purchase thirty times more goods and services in theU.S. because the prices of U.S. goods and services are so much higher whenconverted at the current exchange rate. Since presumably we are comparing percapita GDPs to compare how “well-off” people are in one country relative toanother, these per capita figures will not accurately reflect these differences.
A solution is found in the purchasing power parity theory (PPP). When prices forsimilar goods differ as described in the previous paragraph, we would say the U.S.dollar is overvalued with respect to the yuan and with respect to PPP. At the same
Chapter 6 Purchasing Power Parity
250

time, we would say the yuan is undervalued vis-à-vis the dollar. One way to reachcomparable (or equalized) values of goods and services between the countries is toapply the PPP exchange rate in the conversion. The PPP exchange rate is thatexchange rate that would equalize the value of comparable market baskets of goodsand services between two countries.
For example, the estimated PPP exchange rate between the U.S. dollar and yuan in2004 was 1.85 ¥/$. If this exchange rate had prevailed between the countries, theprices of U.S. goods would seem, on average, to be approximately equal to the pricesthat prevailed in China. Now, if we use this exchange rate to make the conversion todollars of GDP per capita in China, then we will get a number that reflects thepurchasing power of Chinese income in terms of the prices that prevail in theUnited States—that is, in terms of prices that are equalized between the countries.
Thus if we take China’s GDP per capita of ¥11,500 and convert to dollars with thePPP exchange rate, we get $6,250 per person. The units derived in this expressionwould typically be called “international dollars.” What this means is that ¥11,500will buy a bundle of goods and services in China that would cost $6,250 if purchasedin the United States at U.S. prices. In other words, ¥11,500 is equal to $6,250 whenthe prices of goods and services are equalized between countries.
The PPP method of conversion is a much more accurate way of making cross-country comparisons of values between countries. In this example, although China’sper capita GDP was still considerably lower than in the United States ($6,250 vs.$41,400), it is nonetheless four and a half times higher than using the spot exchangerate ($6,250 vs. $1,390). The higher value takes account of the differences in pricesbetween the countries and thus better reflects the differences in purchasing powerof per capita GDP.
The PPP conversion method has become the standard method used by the WorldBank and others in making cross-country comparisons of GDP, GDP per capita, andaverage incomes and wages. For most comparisons concerning the size ofeconomies or standards of living, using PPP is a more accurate method and canfundamentally change our perception of how countries compare. To see how,consider Table 6.1 "GDP Rankings (in Billions of Dollars), 2008", constructed fromWorld Bank data. It shows a ranking of the top ten countries in total GDP convertingto dollars using both the current exchange rate method and the PPP method.
Chapter 6 Purchasing Power Parity
6.7 PPP and Cross-Country Comparisons 251
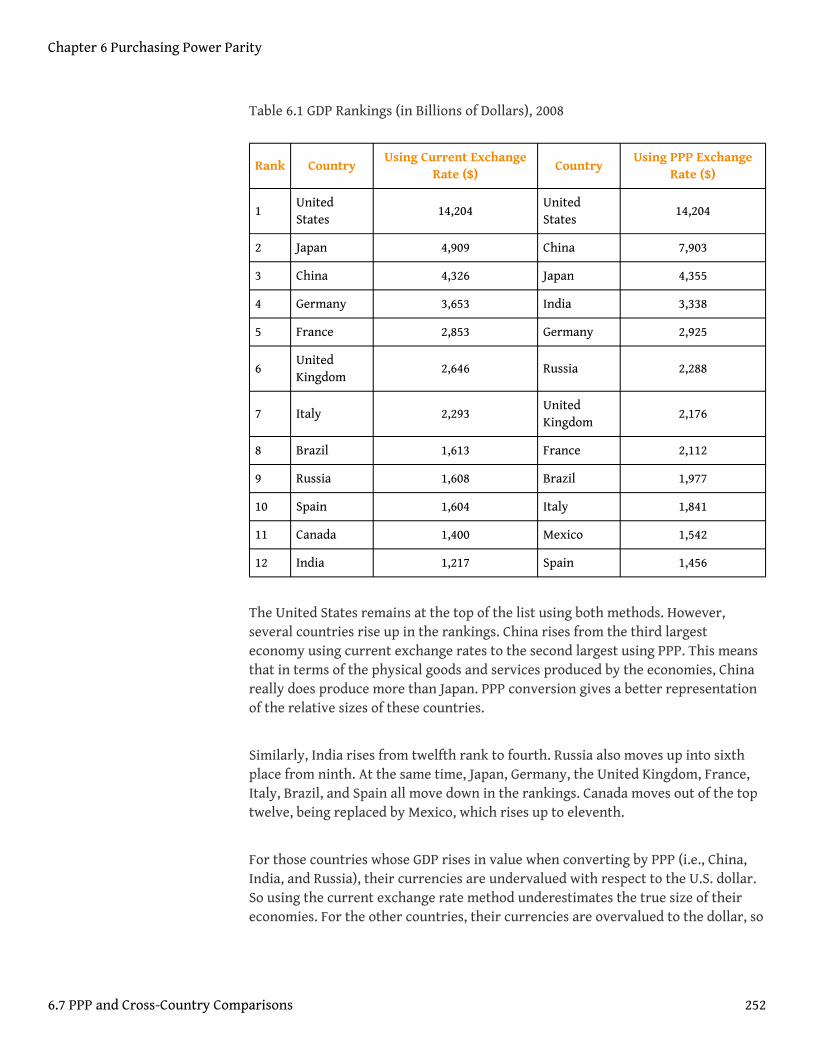
Table 6.1 GDP Rankings (in Billions of Dollars), 2008
Rank CountryUsing Current Exchange
Rate ($)Country
Using PPP ExchangeRate ($)
1UnitedStates
14,204UnitedStates
14,204
2 Japan 4,909 China 7,903
3 China 4,326 Japan 4,355
4 Germany 3,653 India 3,338
5 France 2,853 Germany 2,925
6UnitedKingdom
2,646 Russia 2,288
7 Italy 2,293UnitedKingdom
2,176
8 Brazil 1,613 France 2,112
9 Russia 1,608 Brazil 1,977
10 Spain 1,604 Italy 1,841
11 Canada 1,400 Mexico 1,542
12 India 1,217 Spain 1,456
The United States remains at the top of the list using both methods. However,several countries rise up in the rankings. China rises from the third largesteconomy using current exchange rates to the second largest using PPP. This meansthat in terms of the physical goods and services produced by the economies, Chinareally does produce more than Japan. PPP conversion gives a better representationof the relative sizes of these countries.
Similarly, India rises from twelfth rank to fourth. Russia also moves up into sixthplace from ninth. At the same time, Japan, Germany, the United Kingdom, France,Italy, Brazil, and Spain all move down in the rankings. Canada moves out of the toptwelve, being replaced by Mexico, which rises up to eleventh.
For those countries whose GDP rises in value when converting by PPP (i.e., China,India, and Russia), their currencies are undervalued with respect to the U.S. dollar.So using the current exchange rate method underestimates the true size of theireconomies. For the other countries, their currencies are overvalued to the dollar, so
Chapter 6 Purchasing Power Parity
6.7 PPP and Cross-Country Comparisons 252

converting their GDPs at current exchange rates gives an overestimate of the truesize of their economies.
KEY TAKEAWAYS
• Using purchasing power parity (PPP) exchange rates to convert incomedata to a common currency is a better way to make internationalcomparisons because it compensates for the differential costs of living.
• “International dollars” is the term used for the units for data convertedto U.S. dollars using the PPP exchange rate.
• International rankings can vary significantly between data convertedusing actual versus PPP exchange rates.
EXERCISES
1. In February 2004, the Mexican peso–U.S. dollar exchange ratewas 11 p/$. The price of a hotel room in Mexico City was 1,000pesos. The price of a hotel room in New York City was $200.
a. Calculate the price of the Mexican hotel room in terms ofU.S. dollars.
b. Calculate the price of the U.S. hotel room in terms ofMexican pesos.
c. Now suppose the exchange rate rises to 12 p/$. What doesthe exchange rate change indicate has happened to the valueof the U.S. dollar relative to the value of the Mexican peso?
d. Does the currency change benefit the U.S. tourist traveling toMexico City or the Mexican tourist traveling to New YorkCity? Explain why.
2. In 2008, Brazil’s per capita income in nominal terms was $8,295 while itsper capita income in purchasing power parity (PPP) terms was $10,466.Based on this information, if you were an American traveling in Brazil,would Brazilian products seem expensive or inexpensive relative to U.S.products?
3. In 2008, Germany’s per capita income in nominal terms was $44,729while its per capita income in PPP terms was $35,539. Based on thisinformation, if you were a German traveling in the United States, wouldU.S. products seem expensive or inexpensive relative to Germanproducts?
Chapter 6 Purchasing Power Parity
6.7 PPP and Cross-Country Comparisons 253