This document was provided, as is, to the California ... · 692.526 SeMoes provided by KIPP Bay...
7
This document was provided, as is, to the California Department of Education (CDE) by KIPP East Side High School. This document is posted to the CDE Web site to meet the legal requirements of California Education Code Section 33009.5. For more information regarding the content of this material, please contact the Charter Schools Division by phone at 916-322-6029 or by e-mail at [email protected].
Transcript of This document was provided, as is, to the California ... · 692.526 SeMoes provided by KIPP Bay...

This document was provided, as is, to the California Department of Education (CDE) by KIPP East Side High School. This document is posted to the CDE Web site to meet the legal requirements of California Education Code Section 33009.5.
For more information regarding the content of this material, please contact the Charter
Schools Division by phone at 916-322-6029 or by e-mail at [email protected].

KIPP East Side High School Budget and Financial Projections
accs-feb18item09 Attachment 4
Page 1 of 6
Multiyear Financial ProjectionsPrepared on December 1, 2016
KIPP BAY AREA SCHOOLSEast Side High SchoolINCOME STATEMENT 2018-19 2019-20 2020-21 2021-22 2022-23 2023-24 2024-25 Notes
REVENUE
State & Local ADA RevenueGeneral Purpose / LCFF Funding 1,253,517 2,516,298 3,785,062 5,049,572 5,173,836 5,301,260 5,431,844Lottery 0 50,201 75,513 100,743 103,221 105,760 108,362
Subtotal State & Local ADA 1,253,517 2,566,499 3,860,575 5,150,314 5,277,057 5,407,021 5,540,206Federal Revenue
Title I 40,411 81,122 122,024 162,794 166,798 170,902 175,106Title II (Teacher Quality) 586 1,176 1,770 2,361 2,419 2,478 2,539Title III (LEP) 0 1,079 1,107 2,218 3,331 4,444 4,553
Subtotal Federal Revenue 40,997 83,377 124,900 167,372 172,548 177,824 182,198Donations & Grants
Regional Philanthropy 1,315,015 562,061 315,623 53,207 0 0 0Subtotal Donations & Grants 1,315,015 562,061 315,623 53,207 0 0 0
Student ChargesUniform Sales 4,980 9,993 15,007 20,021 20,513 21,018 21,535
Subtotal Student Charges 4,980 9,993 15,007 20,021 20,513 21,018 21,535
TOTAL REVENUE 2,614,510 3,221,931 4,316,105 5,390,914 5,470,118 5,605,862 5,743,938
EXPENDITURES
SALARIES AND BENEFITS
Teacher SalariesSubtotal Teacher Salaries 604,482 988,340 1,346,684 1,688,842 1,730,388 1,772,955 1,816,570
Administrative SalariesSubtotal Administrative Salaries 396,369 568,432 705,743 807,949 827,825 848,189 869,055
Employee BenefitsPayroll Taxes
Subtotal Payroll Taxes 82,424 127,990 168,729 204,893 209,591 214,406 219,338Health Benefits
Subtotal Health Benefits 101,206 161,163 222,582 276,632 290,096 304,224 319,050Workers Compensation
Subtotal Workers Compensation 12,911 20,082 26,476 32,209 33,001 33,813 34,645Retirement
Subtotal Retirement 37,532 58,379 76,966 93,630 95,933 98,293 100,711Professional Development & Other Personnel Benefits
Staff Appreciation 4,343 6,769 9,134 11,092 11,365 11,644 11,931Professional Development 25,594 22,562 30,447 64,938 37,882 38,814 69,445 Cyclicality due to triennial major PDSubtotal PD & Other Personnel 29,937 29,330 39,581 76,029 49,247 50,458 81,376
Subtotal Employee Benefits 264,010 396,945 534,333 683,392 677,868 701,194 755,120Total Personnel Expenses 1,264,860 1,953,718 2,586,761 3,180,184 3,236,081 3,322,339 3,440,745
INSTRUCTIONAL EXPENSES
Instructional Materials & SuppliesUniforms 7,968 14,990 19,509 23,024 20,513 21,018 21,535Health Supplies 291 548 713 842 750 768 787Assessment material 12,136 22,830 29,713 35,067 31,243 32,012 32,799Student Supplies (General) 69,102 129,996 169,187 199,671 177,898 182,274 186,758Science 4,854 9,132 11,885 14,027 12,497 12,805 13,120Enrichment Program 3,641 6,849 8,914 10,520 9,373 9,603 9,840Music 7,282 13,698 17,828 21,040 18,746 19,207 19,679Art 3,398 6,393 8,320 9,819 8,748 8,963 9,184Athletics 14,563 27,396 35,656 42,080 37,492 38,414 39,359College Readiness 8,252 15,525 20,205 23,845 21,245 21,768 22,303
Subtotal Instructional Materials 131,487 247,357 321,929 379,934 338,505 346,832 355,364Field Trips
Field Trips (General) 32,524 61,185 79,631 93,979 83,731 85,791 87,902Subtotal Field Trips 32,524 61,185 79,631 93,979 83,731 85,791 87,902
Other Contract ServicesSpecial Education Encroachment 48,035 96,427 145,045 193,506 198,267 203,144 208,141 Most costs reside in Regional Support Office P&LStudent Transportation 7,573 14,246 18,541 21,882 19,496 19,975 20,467Substitute Teachers 8,835 16,621 21,631 25,529 22,745 23,304 23,878
Subtotal Other Contract Services 64,443 127,293 185,217 240,917 240,507 246,424 252,486Total Instructional Expenses 228,454 435,836 586,778 714,830 662,743 679,047 695,751
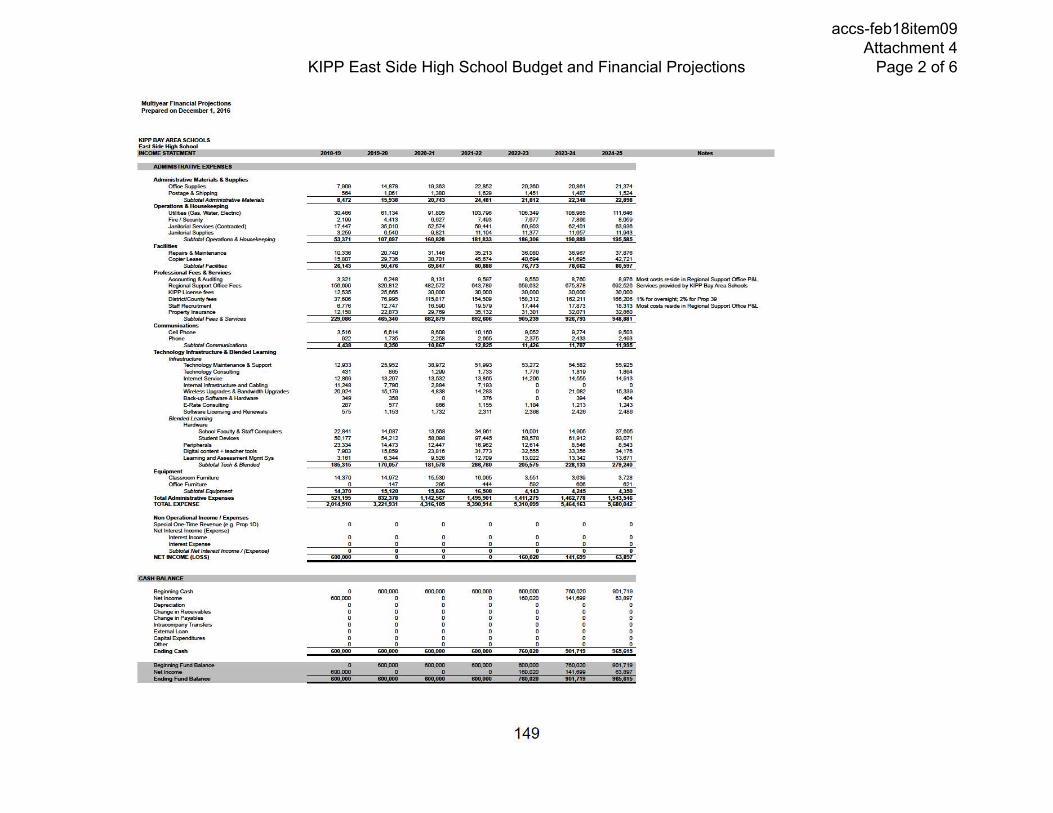
KIPP East Side High School Budget and Financial Projectionsaccs-feb18item09Attachment 4
Page 2 of 6
Multiyear Financial Projections Prepared on December 1, 2016
KIPP BAY AREA SCHOOLS East Side High School -
149
KIPP East Side High School Budget and Financial Projections
accs-feb18item09 Attachment 4
Page 2 of 6
INCOE STATEMENT 2018-19 201- 2020-21 2021-22 2022-23 ~ 202A-25
~TRATIVE EXPENSES
Administrative Materials & SIJl>Pies Office Supples 7,90Q 14.878 19.363 22.852 20.360 20,861 2 1.374 Postage & Shipping 564 1.061 1,380 1,629 1,451 1.487 1.524
SUbtotal Adrrmistrabve Materials Operations & Housekeeping
a14n 15~38 20,743 24,481 21,812 22,348 22,898
Utilities (Gas. Water. EJeccric) 30,466 6 1.134 9 1.805 103.796 106.349 108.965 111.646 Fire I Security 2.199 4.4 13 6,627 7.493 7.6n 7.866 8 ,059 JaMorial Services (Cootracted) JaMorial Supplies
17,447 3,259
35.0 10 6,54-0
52.574 9,821
59,441 11.104
60,903 11.377
62.401 11,657
63,936 11.943
SUbtotal Operations & Housekeeping 53371 107 097 160 828 18 1 833 186 306 190889 195 585 Facilities
Repairs & Maintenance Copier l ease
10.336 15.807
20,740 29.736
3 1.146 38.701
35.2 13 45,674
36,080 40,694
36,967 41,695
37,876 42.721
SUbtotal Facilities 26,143 50,476 6918'7 80,888 7~p3 78,662 80,597 Professional Fees & Services
Aoccunting &Auciting Regional Support Office Fees
3.321 156.690
6.248 320.8 12
8.13 1 482,572
9,597 643,789
8,550 659,632
8,760 675.878
8 .976 Most costs reside in Regional Support Office P&l 692.526 SeMoes provided by KIPP Bay Plea Sdwxlls
KIPP license fees 12.535 25,665 30,000 30,000 30,000 30,000 30,000 Distric:tfCounty fees 37,606 76,985 115.817 154.509 158.3 12 162.2 11 166.206 1% for oversight: 2% for Prop 39 Staff Recruitment Property Cnswaooe
6.n6 12,158
12.747 22.873
16.590 29,769
19.579 35,132
17,444 31,301
17.873 32.071
18.3 13 32.860
Most costs reside in Regional Support Office P&l
Subtotal Fee8 & Set'\l'i::e.$ 229,086 465,340 682,879 89~606 905,239 926z793 948,881 Communications
Cel PhonE 3.5 16 6.6 14 8 ,608 10.160 9.052 9.274 9 ,503 PhonE 922 1.735 2.258 2.665 2,375 2.433 2.493
Subtotal Comm.inic.ations 4 438 8350 10867 12825 11426 11 707 11 9$5 T~ogy Infrastructure & Blended learning ~
Tec:hnobgy Maintenance & ~ 12.933 25.952 38,972 51.993 53.272 54.582 55,925 Tec:hnobgy Consutting 431 865 1.299 1.733 1.776 1.819 1.-lntemet Service 12.869 13.207 13.532 13.865 14.206 14 .555 14.9 13 lntemal lnfrast:nJc:Wte and Cab&lg 11.248 7.790 2.884 7.193 0 0 0 Wireless Upgrades & Bandwidth Upgrades 20.924 15.179 4,838 14,283 0 2 1.082 15.339 Badt~p Software & Hardware 349 358 0 376 0 394 404 E-Rate Consulting 287 5n 866 1.155 1.184 1.213 1.243 Softw.ve Licensing and Renewals 575 1.153 1.732 2.311 2.368 2.426 2.486
Blended Leaming Hardware
School Faculty & Staff Computers 22.841 14 .087 13.568 34.961 16.001 14.905 37,605 Student Devices 50.177 54.2 12 58,0Q8 97.445 58,578 6 1.9 12 93,071
Pef\?herals 23.334 14.473 12.447 16.962 12.614 8,546 8 ,543 Digital content + teacher tools 7.903 15.859 23.8 16 31.773 32.555 33,356 34.176 Leaming and Assessment Mgmt Sys 3,161 6,344 9 ,526 12,709 13,022 13.342 13.671
Subtotal Tech & ~ 185,315 170,057 181,578 28!!,760 205,575 228,133 279,240 Equipment
Classroom Fumitute 14,370 14,972 15.530 16.065 3.551 3,639 3,728 Office Furniture 0 147 295 444 592 606 621
Subtotal Equpnent 14 370 15826 16508 4143 245 350 Total Administrative Expenses 521195 11'2 567 1495901 1411275 1462778 1543 546 TOTAL EXPENSE 2,014,510 3, 4,316,105 5,390,914 5,310,099 5,464,163 5,680,042
Non Operational Income I Expenses Special One-Time Rewrue (e.g . Prop 10 ) Net Interest Income (Expense)
lnterest Income 0 0 0 0 lnterest Expense 0 0 0 0 Stbtotal Net lrteresl Income I (Expense) 0 0 0 0
NET .. COME {LOSS) 600 000 160 020 141 699 63897
Begn ning Cash 0 600,000 600,000 600,000 600,000 760,020 901.719 Net Income 600,000 0 0 0 160.020 141.699 63,897 Depreciation 0 0 0 0 0 0 0 Change in Receivables 0 0 0 0 0 0 0 Change in Payables 0 0 0 0 0 0 0 lntrac:ompany Transfers 0 0 0 0 0 0 0 External loan 0 0 0 0 0 0 0 Capital Expendhns 0 0 0 0 0 0 0 Other 0 0 0 0 0 0 0 Ending Cash 600 000 600 000 600 000 600 000 760020 901 719 965 615
Beginniog Flnf Balance 0 600,000 600,000 600,000 600,000 760,020 901.719 Net Income 600,000
!!!!.000 0
6001000 D
'°°•000
0 -.ooo 160,020 7!!.020
141.699 9011719
63,897 9651615

Multiyear Financial ProjectionsPrepared on December 1, 2016
KIPP BAY AREA SCHOOLSEast Side High SchoolINCOME STATEMENT 2018-19 2019-20 2020-21 2021-22 2022-23 2023-24 2024-25 Notes
ASSUMPTIONS
Student Demographics
Enrollment at Start-of-Year9 134 134 134 134 134 134 13410 0 128 128 128 128 128 12811 0 0 122 122 122 122 12212
Enrollment at SoY
ADA Ratios
0134
0262
0384
116500
116500
116500
116500
ADM as % of Enrollment @ SoY 98.2% 98.2% 98.2% 98.2% 98.2% 98.2% 98.2%ADA % 97.1% 97.1% 97.1% 97.1% 97.1% 97.1% 97.1%
ADA 127.8 249.8 366.2 476.8 476.8 476.8 476.8
FRLs, ELs, Unduplicateds
Free % 57% 57% 57% 57% 57% 57% 57%Reduced %
Free & Reduced %
EL %
19%76%
8%
19%76%
8%
19%76%
8%
19%76%
8%
19%76%
8%
19%76%
8%
19%76%
8%
FRLs 102 199 292 380 380 380 380ELs 11 21 31 40 40 40 40
LCFF Assumptions
School Unduplicated % 76.8% 76.8% 76.8% 76.8% 76.8% 76.8% 76.8%Local District Unduplicated % 52.8% 52.8% 52.8% 52.8% 52.8% 52.8% 52.8%% of LCFF Gap Closed 5.59% 26.60% 26.34% 25.06% 25.09% 25.10% 25.11%
Staffing
FTEsCore Teacher 7.0 11.0 14.0 18.0 18.0 18.0 18.0Elective Teacher 1.0 2.0 3.0 3.0 3.0 3.0 3.0College Counselor 1.0 2.0 3.0 3.5 3.5 3.5 3.5Social Worker 0.5 0.5 1.0 1.0 1.0 1.0 1.0Principal 1.0 1.0 1.0 1.0 1.0 1.0 1.0Assistant Principal 1.0 2.0 2.0 2.5 2.5 2.5 2.5Operations Manager 1.0 1.0 1.0 1.0 1.0 1.0 1.0Office Assistant 1.0 1.0 2.0 2.0 2.0 2.0 2.0Facilities & Food
Total
Payroll Taxes + Benefits
0.013.5
0.020.5
0.027.0
0.032.0
0.032.0
0.032.0
0.032.0
Employer OASDI (Payroll Taxes) 7.65% 7.65% 7.65% 7.65% 7.65% 7.65% 7.65%Unemploy Insurance (1st $7K only) 6.20% 6.20% 6.20% 6.20% 6.20% 6.20% 6.20%Medical Insurance Benefits 7,077 7,431 7,803 8,193 8,602 9,032 9,484Dental Benefits 349 358 367 376 385 395 405Vison Benefits 70 72 74 76 78 80 82Workmans Comp 1.29% 1.29% 1.29% 1.29% 1.29% 1.29% 1.29%
KIPP East Side High School Budget and Financial Projections
accs-feb18item09 Attachment 4
Page 3 of 6

accs-feb18item09Attachment 4
Page 4 of 6
KIPP East Side High School Budget and Financial Projections
accs-feb18item09 Attachment 4
Page 4 of 6

accs-feb18item09Attachment 4
Page 5 of 6
KIPP East Side High School Budget and Financial Projections
accs-feb18item09 Attachment 4
Page 5 of 6

accs-feb18item09 Attachment 4
Page 6 of 6
KIPP East Side High School Budget and Financial Projections
accs-feb18item09 Attachment 4
Page 6 of 6