
THIS DOCUMENT HAS BEEN REPRODUCED FROM ... down from the top of the column. The liquid flowing down...
14
N O T I C E THIS DOCUMENT HAS BEEN REPRODUCED FROM MICROFICHE. ALTHOUGH IT IS RECOGNIZED THAT CERTAIN PORTIONS ARE ILLEGIBLE, IT IS BEING RELEASED IN THE INTEREST OF MAKING AVAILABLE AS MUCH INFORMATION AS POSSIBLE https://ntrs.nasa.gov/search.jsp?R=19800015287 2018-06-25T10:46:51+00:00Z
Transcript of THIS DOCUMENT HAS BEEN REPRODUCED FROM ... down from the top of the column. The liquid flowing down...

N O T I C E
THIS DOCUMENT HAS BEEN REPRODUCED FROM MICROFICHE. ALTHOUGH IT IS RECOGNIZED THAT
CERTAIN PORTIONS ARE ILLEGIBLE, IT IS BEING RELEASED IN THE INTEREST OF MAKING AVAILABLE AS MUCH
INFORMATION AS POSSIBLE
https://ntrs.nasa.gov/search.jsp?R=19800015287 2018-06-25T10:46:51+00:00Z
DOE/NASA/2674-80/10NASA TM-81510
THE OPTIMIZATION OF AIRSEPARATION PLANTS FORCOM BINED CYCLE MHD-POWERPLANT APPLICATIONS o QQX p N
Helmut SpringmannLinde AGDivision TVT Muenchen
Ralph Greenberg J
Lotepro Corporation+-
HWand ax
Albert J. JuhaszH 7Rti
- xNational Aeronautics and Space Administration
En^ o
Lewis Research Center ^ ; Elwuo uto H
^a o aNaH w
Work performed for H ^
U.S. DEPARTMENT OF ENERGY ^N rFossil Energy °' a°Office of Magnetohydrodynamics 1 n sr, P4,^ H w" H H is' \
E rQ O' N•aas aoEn I00 Cww^eu
Prepared fors -sf^tix1J,
Seventh International Conference on yMHD Electrical Power Generation ^.;° ^ ` OrCambridge, Massachusetts, June 16-20, 1980 OV,
ri

NOTICE
,
i
r
1
This report was prepared to document work sponsored by
the United States Government. Neither the United States
nor its agent, the United States Department of Energy,
nor any Federal employees, nor any of their contractors,
subcontractors or their employees, makes any warranty,
express or implied, or assumes any legal liability or
responsibility for the accuracy, completeness, or useful-
ness of any information, apparatus, product or process
disclosed, or represents that its use would not infringe
privately -owned rights,
I
DOE/NASA/2674-80/10NASA TM-81510
THE OPTIMIZATION OF AIRSEPARATION PLANTS FORCOMBINED CYCLE MHD•POWERPLANT APPLICATIONS
Helmut SpringmannLinde AGDr. Carl-von-Linde-Str.Munich, West Germany
Ralph GreenbergLotepro Corporation1140 Avenue of the AmericasNew York, New York 10036
and
Albert J, JuhaszNational Aeronautics and Space AdministrationLewis Research CenterCleveland, Ohio 44135
+ Work performed forU.S. DEPARTMENT OF ENERGYFossil EnergyOffice of MagnetohydrodynamicsWashington, D.C. 20545Under Interagency Agreement EF-77-A-01-2674
Seventh International Conference onMHD Electrical Power GenerationCambridge, Massachusetts, June 16-20, 1980

THE OPTIMIZATION OF AIR SEPARATION PLANTS FOR
COMBINED CYCLE MHD-POWER PLANT APPLICATIONS**
by
Helmut Springmann Ralph GreenbergLinde AG Lotepro CorporationDivision TVT Muenchen 1140 Avenue of the Americas8023 Munich, Germany New York, New York 10036
Albert J. JuhaszNASA Lewis Research Center21000 Brookpark RoadCleveland, Ohio 44135
Summary
approaches being employeds during a currents DOE/NASAsupported study directed at developing an improvedair separation process for the production of oxygenenriched air for MHD combustion. The ultimateobjective of the study is to arrive at conceptualdesigns of air separation plants, optimized forminimum specific power consumption and capitalinvestment costs, for integration with MHD combinedcycle power plants. Final results will be publishedfollowing completion of the contract in mid-1980.
Introduction
The benefits of oxygen enrichment at lowoxidizer preheat temperatures on combined cycle MHDpower plant performance were discussed in references1 and 2. Medium purity oxygen plants with low powerconsumption (208 kW-hr/tonof equivalent pureoxygen) were identified. 2 The study was based ontechnology 3,4 9 5 used in a 60% purity oxygenplant, built by Linde AG for the Thyssen SteelWorks, Federal Republic of Germany; This plant hasbeen operating reliably since 1972, delivering a1.05 bar enriched air stream of 170,000 scfm with30% oxygen content at a specific power consumptionof 224 kWh per ton of equivalent pure oxygen.
Use of oxygen enrichment in combined cycle MHDplants eliminates the need for high temperature airheaters which are faced with severe corrosionproblems. As a result, the development time forcommercializing combined cycle MHD plants could bepotentially shortened.
For the production of the large quantities ofoxygen required by the MHD combined cycle plants, upto 6000 tons of oxygen/day for the baseload MHDcombustor ozidizer stream, the cryogenic airseparation process is the most economical and itwill remain so for the foreseeable future. For thisreason the study concentrates on furtherimprovements in cryogenic air separation plants bymeans of parametric tradeoff studies between thevarious process variables.
Basic Air Separation Plant
Air separation plants use rectification columnsconsisting of an upper, low pressure compartment(low pressure column) and a lower compartmentoperated at higher pressure (medium pressurecolumn). Such plants are referred to as "doublecolumn" plants. Figure 1 shows a schematic of aconventional double column plant. Its maincomponents are:
** Funded under NASA Contract DEN 3-165 as partof NASA /LeRC support of DOE/MHD underInteragency Agreement EF-77-A-01-2674.
-Air compressor, 'C"-Adsorbers for the removal of water and
carbon dioxide, (WS, MS1, MS2)-Expansion turbine for the production ofrefrigeration, (T)
-Heat exchangers for cooling the air toliquefaction temperature and warming theoxygen and nitrogen products to ambienttemperature, (E)
-Rectification columns for the separation ofair into 02 and N2 on the basis ofvapor-to-liquid heat exchange and masstransfer, (C1, C2)
In many plants the removal of water and carbondioxide is combined with the cooling of the air.This is done in reversing heat exchangers orregenerators. The flow paths of the air and productstreams can be traced on Figure 1. Filteredatmospheric air is compressed in compressor, CP, toa pressure which is determined by the requirementsof the particular process, ,:sually 4 to 6 bars. Itis then passed through the water separator, WS, andadsorbers, MS, to the heat exchangers, E, and cooledto about 100 K with the aid of expansion turbine,T. The cold air is injected as a saturated vaporinto the medium-pressure column, Cl, where it isseparated into a nitrogen fraction and the so-calledrich liquid fraction, which contains about 40%oxygen. The separation is obtained by contactingthe rising vapor with liquid nitrogen flowing downfrom the condensor-evaporator, K. This causes theliquid collecting in the kettle at the bottom of C1to become enriched in oxygen while the vapor, whichis condensed at the top of C1, is enriched innitrogen. Both fractions leave C1 in the liquidstate and flow through expansion valves to thelow-pressure column, C2. In C2 vapor formed in thecondensor-evaporator, K, rises while liquid nitrogenflows down from the top of the column. The liquidflowing down to the bottom of C2 is enriched inoxygen and the vapor rising to the top of C2 isenriched in nitrogen. Both fractions leave columnC2 in the gaseous state, then are heated in heatexchanger, E, and flow to the consumer. Note thatfor MHD power plant applications an atmosphericproduct stream will have to be compressed tocombustor operating pressure. Because of theincreased oxygen concentration in this stream,specially designed compressors will be required forthis purpose.
The physics of the separation process is based onthe fact that the vapor pressure of nitrogen ishigher than that of oxygen at the same temperature.Therefore, vapor which is in contact with liquid isricher in nitrogen than the liquid. To bring aboutthe heat and mass transfer between the vapor and
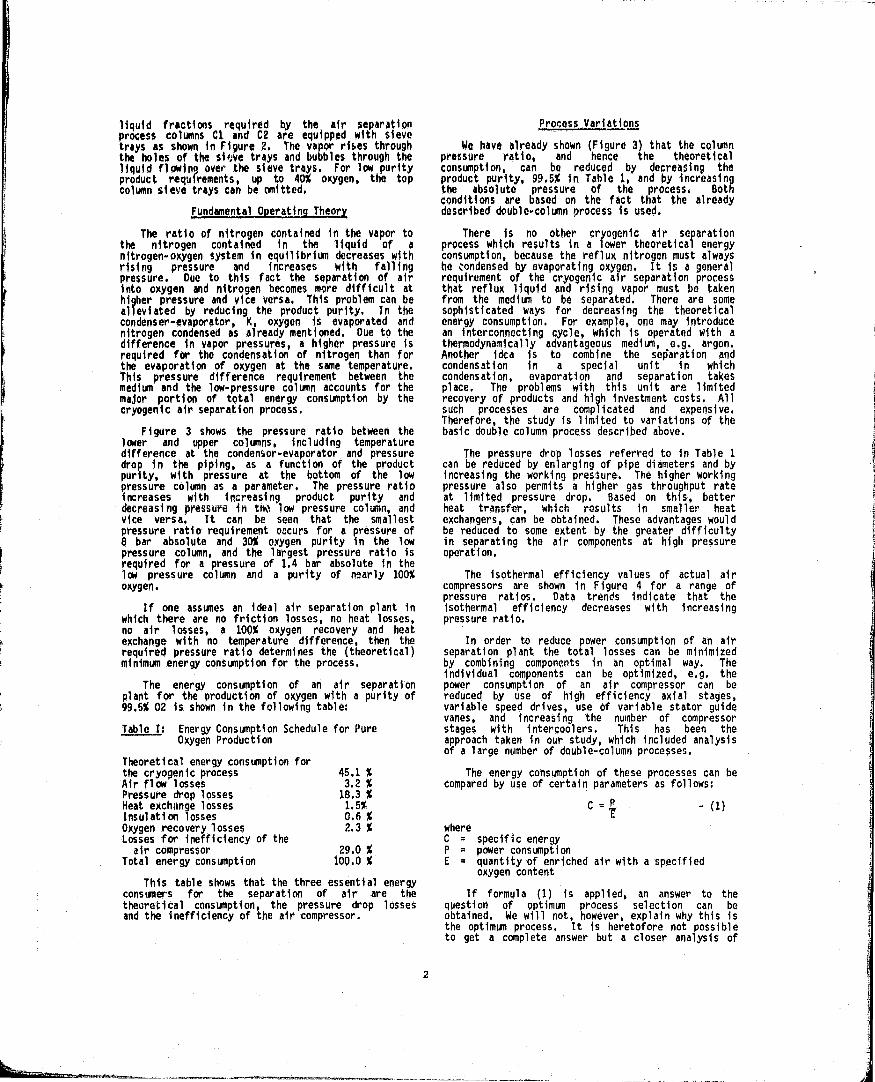
liquid fractions required by the air separationprocess columns C1 and C2 are equipped with sievetrays as shown in Figure 2. The vapor rises throughthe holes of the si r ve trays and bubbles through theliquid flowing over the sieve trays. For low purityproduct requirements, up to 40% oxygen, the topcolumn sieve trays can be omitted.
Fundamental Operating Theory
The ratio of nitrogen contained in the vapor tothe nitrogen contained in the liquid of anitrogen- oxygen system in equilibrium decreases withrising pressure and increases with fallingpressure. Due to this fact the separation of airinto oxygen and nitrogen becomes more difficult athigher pressure and vice versa. This problem can bealleviated by reducing the product purity. In thecondenser-evaporator, K. oxygen is evaporated andnitrogen condensed as already mentioned. Due to thedifference in vapor pressures, a higher pressure isrequired for the condensation of nitrogen than forthe evaporation of oxygen at the same temperature.This pressure difference requirement between themedium and the low-pressure column accounts for themajor portion of total energy consumption by thecryogenic air separation process.
Figure 3 shows the pressure ratio between thelower and upper columns, including temperaturedifference at the condensor-evaporator and pressuredrop in the piping, as a function of the productpurity, with pressure at the bottom of the lowpressure column as a parameter. The pressure ratioincreases with increasing product purity anddecreasing pressure in mi low pressure column, andvice versa. It can be seen that the smallestpressure ratio requirement occurs for a pressure of8 bar absolute and 30% oxygen purity in the lowpressure column, and the largest pressure ratio isrequired for a pressure of 1.4 bar absolute in thelow pressure column and a purity of nearly 100%oxygen.
If one assumes an ideal air separation plant inwhich there are no friction losses, no heat losses,no air losses, a 100% oxygen recovery and heatexchange with no temperature difference, then therequired pressure ratio determines the (theoretical)minimum energy consumption for the process.
The energy consumption of an air separationplant for the production of oxygen with a purity of99.5% 02 is shown in the following table:
Table I: Energy Consumption Schedule for PureOxygen Production
Theoretical energy consumption forthe cryogenic process 45.1 %Air flow losses 3.2 %Pressure drop losses 18,3 %Heat exchange losses 1,5%Insulation losses 0.6 %Oxygen recovery losses 2.3 %Losses for inefficiency of the
air compressor 29.0 %Total energy consumption 100.0 %
This table shows that the three essential energyconsumers for the separation of air are thetheoretical consumption, the pressure drop lossesand the inefficiency of the air compressor.
Process Variations
We have already shown (Figure 3) that the columnpressure ratio, and hence the theoreticalconsumption, can be reduced by decreasing theproduct purity, 99.5% in Table 1, and by increasingthe absolute pressure of the process. Bothconditions are based on the fact that the alreadydescribed double-column process is used,
There is no other cryogenic air separationprocess which results in a lower theoretical energyconsumption, because the reflux nitrogen must alwayshe .ondensed by evaporating oxygen. It is a generalrequirement of the cryogenic air separation processthat reflux liquid and rising vapor must be takenfrom the medium to be separated. There are somesophisticated ways for decreasing the theoreticalenergy consumption. For example, one may introducean interconnecting cycle, which is operated with athermodynamically advantageous medium, e.g. argon.Another idea is to combine the separation andcondensation in a special unit in whichcondensation, evaporation and separation takesplace. The problems with this unit are limitedrecovery of products and high investment costs. Allsuch processes are complicated and expensive.Therefore, the study is limited to variations of thebasic double column process described above.
The pressure drop losses referred to in Table 1can be reduced by enlarging of pipe diameters and byincreasing the working pressure. The higher workingpressure also permits a higher gas throughput rateat limited pressure drop. Based on this, betterheat transfer, which results in smaller heatexchangers, can be obtained. These advantages wouldbe reduced to some extent by the greater difficultyin separating the air components at high pressureoperation.
The isothermal efficiency values of actual aircompressors are shown in Figure 4 for a range ofpressure ratios. Data trends indicate that theisothermal efficiency decreases with increasingpressure ratio.
In order to reduce power consumption of an airseparation plant the total losses can be minimizedby combining components in an optimal way. Theindividual components can be optimized, e.g. thepower consumption of an air compressor can bereduced by use of high efficiency axial stages,variable speed drives, use of variable stator guidevanes, and increasing the number of compressorstages with intercoolers. This has been theapproach taken in our study, which included analysisof a large number of double-column processes.
The energy consumption of these processes can becompared by use of certain parameters as follows:
C = P
- ( 1)
whereC = specific energyP power consumptionE quantity of enriched air with a specified
oxygen content
If formula (1) is applied, an answer to thequestion of optimum process selection can beobtained. We will not, however, explain why this isthe optimum process. It is heretofore not possibleto get a complete answer but a closer analysis of

the formula will give some more information. Weseparate formula (1) into three factors as follows:
P a ,P̂ . , A . O (2
whereG R
P " power consumption p . power factor;
A • air flow A air factorU
0 P product oxygen flow 0 . product factor;
E = enriched air flow P . specific energy
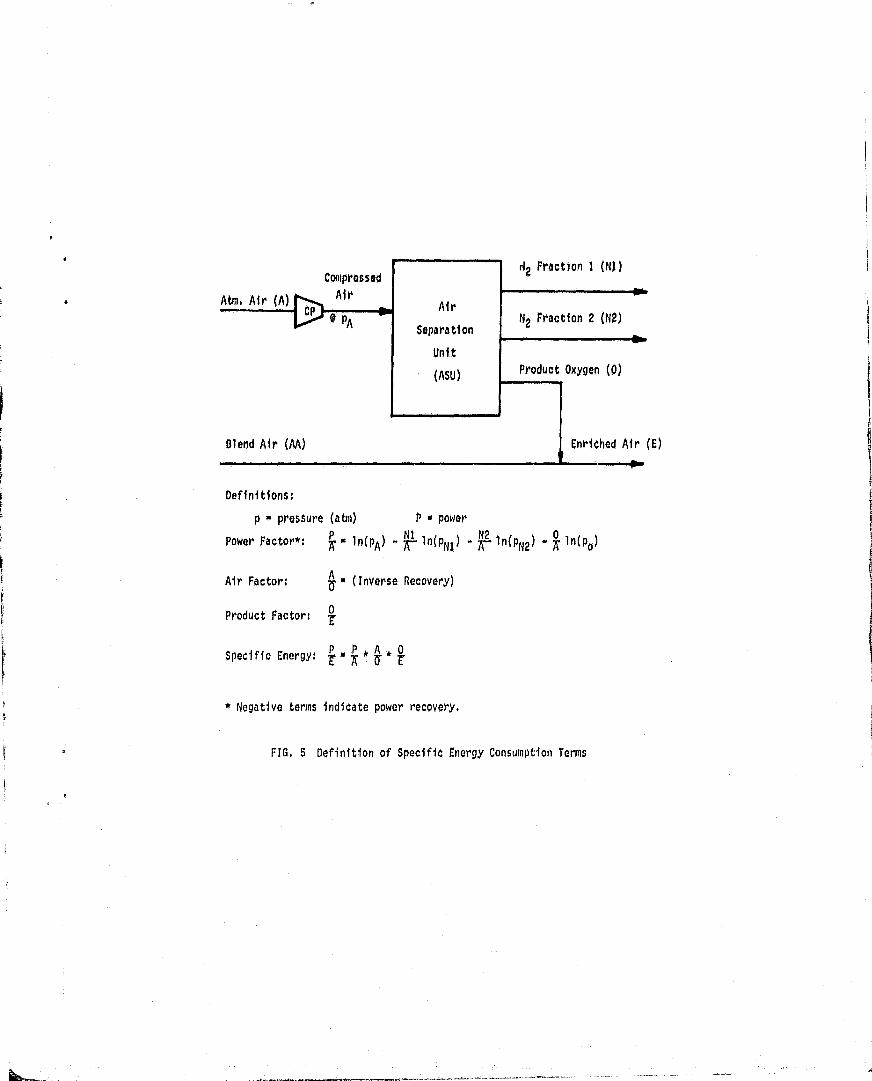
A more detailed understanding of the abovefactors may be obtained from Figure 5. This figureshows an air separation unit (ASU) as a black box.Air is fed in by the compressor, CP, at a certainpressure. Oxygen (0) leaves the black box as themain product, while two nitrogen streams (N1 and N2)are by-products, The power factor is defined on thebasis of the formula for isothermal compression, Anisothermal efficiency factor can be applied, butthis will not be done in this paper, since onlyrelative comparisons are desired. A bonus will begiven for the products leaving the black box atincreased pressure, as indicated by the negativeterms in the power factor expression, since powermay be recovered from these streams by expansionturbines. The air factor is the ratio of air flowto product oxygen flow. It represents the inverseof the oxygen recovery.
The product factor is the ratio of productoxygen flow to the flow of enriched air. It isobvious from Figure 5 that the oxygen concentrationof the product stream need not be the same as theoxygen concentration of the enriched air. Wetherefore have the possibility of optimizing the airseparation plant independently of the requirementsfor the MND-system. If the oxygen concentration ofthe product stream is higher than that of theenriched air we must add atmospheric air to obtainthe desired oxygen concentration.
The quantity of oxygen required in the enrichedair stream is determined by the desired 02concentration. Since we take a portion of thisoxygen quantity from atmospheric air, we can producea smaller amount of oxygen enriched product with theair separation plant. Moreover, the requiredquantity of product will decrease as product oxygenconcentration increases. By considering the mixingof air and product, it is not difficult to concludethat the ratio of product flow to enriched air flowmust be
0 e-0.2095 - (3)
where
e = oxygen concentration in the enriched airo = oxygen concentration in the product stream
from the ASU0.2095 = oxygen concentration in atmospheric air
Figures 6, 7, and 8 show the above describedfactors, each as a function of the product oxygenpurity. The power factor relationship is shown inFigure 6. The plotted power factor values werecalculated for several previously designeddouble-column plants. The various power , factors canbe connected by two parallel straight lines. The
upper line connects power factor values for plantswhich operate at near atmospheric pressure in thelow pressure column. lwo power factor values, oneat 70% and one at 95% product oxygen purity failbelow the line. The valise at 70% is for theimproved Linde/Lotepro process which uses a separateproduct evaporator and a reflex condenser. Thevalue at 95% purity represents the Linde/Lotepro twocolumn process discussed in reference 2. The lowerline in figure 6 approximately correlates powerfactor values for plants with low pressure columnpressures ranging from 5 to 9 bars. Since onlyrelative comparisons between the various processeswere desired, the power factors were computed on thebasis of isothermal compression. Absolute powerfactor values can be obtained by multiplying therelative values by the isothermal compressorefficiency.
Figure 7 shows the tine correlating calculatedair factor values for several double column plants.
The product factor is shown in Figure B. Thetwo curves were calculated by using formula (3).The lower curve shows that the product factor for anenriched air purity of 30.6% decreases from unity ata product purity of 30.6% oxygen to 0.1223 at 99.5%product purity. The upper curve shows the productfactor for an enriched air purity of 41%.
Figure 9 shows the specific energy, P/E, whichis the product of the three factors. There are twocurves. The upper one connects all double-columnplants with a pressure in the low-pressure column,near atmospheric. The eurve has a minimum at about70% oxygen purity. This result is surprising. Itis based on the strong decrease of the productfactor with the increasing power factor. Or, inother words, the quantity of air to be processed inan air separation plant decreases up to 70% oxygenpurity at a faster rate than the power expendituresincreases. The absolute specific energy _value ofthe 70% point corresponds to approximately 195 kW-hrper short ton of equivalent pure oxygen.
The lower curve connects specific energy valuesfor theoretical double column plants with a pressurein the low-pressure column between 5 and 9 bars.This curve has a minimum at 60% oxygen purity. Itis important to remember that these results wereobtained by assuming perfect isothermal compressionof the inlet air stream and perfect power recoveryfrom the pressurized nitrogen by-product stream.Actual turbomachinery efficiencies, when they becomeavailable for each case, are expected to raise thespecific energy values for medium pressure plants toor even above those for the best atmosphericplants. The points marked AN and AD in Figure 9will be discussed in connection with Figure 12.
Capital Costs
Figure 10 shows the capital cost of air, eparation plants as a function of the oxygen purityfor two levels of product pressure. These costs arebased on relative figures starting with a cost ratioof 1 for a normal plant which produces 99.5% of pureoxygen. The influence of the investment costsdepends on the depreciation period and the rate ofinterest. Generally the influence of the investmentcosts on the product oxygen costs are of minorimportance, if a depreciation period of about 20years is used. Minimum capital investment isrequired for a process producing low pressureproduct at 70% oxygen purity. In absolute terms,

the tutakey cost for a basal oad scale 70% purity airseparation plant would amount to about 15% of thetotal cost for the combined cycle MHD power plant.Note that capital costs are higher for plantsdelivering product streams at elevated pressure.
Peaking Operation
An air separation plant can be used as a peakshaving unit in order to reduce power consumptionduring periods of high electric power demand.Figure 11 shows the relative flow valuescorresponding to an alternating oxidizer flow demandand the steady product flow delivery from the airseparation plant. High demand is shown for weekdayoperation with low demand at night and on we:," ?rds,
In a standard air separation plant the varyingoxygen enriched product flow can be obtained byadapting the air separation plant to the demand,This method requires a power expenditureproportional to the product flow. Peak shaving isa way to vary the product flow without proportionalpower increase. This yields a power saving duringdaytime operation when unit power costs are high.Cryogenic air separation plants can be adapted forpeak shaving by producing and storing excess liquidoxyggen at night, evaporating it during the day andadding it to the main product flow.
There is another method of peak shaving whichinvolves compression of the excess oxygen producedduring periods of tow power demand to a highpressure and storage in pressure vessels. Duringthe day the stored oxygen can be withdrawn from thevessels and passed through an expansion turbine tothe MHD plant. This system will be reliable andefficient, but the cost of the pressure vessels andthe high pressure oxygen compressors is very high.
There is a third method, described below, whichis based on the alternating storage of liquid oxygenand liquid air. This method allows for conservationof the energy contained in stored liquid oxygen,which may range from 0.35 kWh/kg to 0.56 kWh/kg.The air separation plant supplies a steady oxygenflow which is the arithmetic mean of the oxygendemand during a one-week period as is shown inFigure 11. During periods of low demand the excessoxygen production (which is the difference betweenthe mean and actual product flow) is stored as aliquid. It is liquified by evaporation of liquidair which has been stored in a second tank. Duringthe day the difference between the peak product flowand the mean flow is supplied by evaporating oxygenwhich is taken from the oxygen tank. Gaseous air iscondensed by the evaporating oxygen and collected inthe liquid air tank.
Figure 12 shows the flow sheet of the airseparation plant combined with oxygen tank, TO,liquid air tank, TA, and the product condenser-evaporator, K2. The heat transfer between oxygenand air takes place in the condensor-evaporator,K2. During periods of low power demand this systemhas a higher power factor and a higher air factorthan a normal air separation plant. The converse isalso true. For the evaporation of the oxygen duringthe day an equivalent air stream has to be used andstored in the liquid state which results in anunbalanced flow through the heat exchanger. Thiscauses refrigeration losses which must be covered byan increased expansion turbine output. Theadditional insulation losses of the tanks must alsobe provided for.
The specific energy factors for this system havebeen plotted as shown in Figure 9. The symbolADshows the specific energy factor for daytimeoperation and AN shows the specific energy factorfor night time operation. These two factors arebased on an assumed relative product glow, to theMHD combustor, showr in Figure 11. A fictitiouspower consumption can be calculated by placing avalue on daytime and nighttime power. For example:if the nighttime power has a value of only 0.5compared to the daytime power, a saving of about7-9% can be obtained.
The system described above can be improved byvarying the mean flow rate, The plant can beoperated at reduced mean flow rate during highdemand periods and vice versa, Then the differencesbetween demand and supply flow rates will increase,requiring larger tanks. Based on the aboveassumptions an additional 5% power saving can beobtained.
The design of an alternating oxygen/liquid airstoring system must be optimized on a case-by-casebasis, according to actual conditions. For extremeconditions, such as high peaks for short periods theother methods of peak shaving such as high pressurestorage or liquid oxygen storage, without liquid airstorage must be investigated and compared.
Concluding Remarks
In this paper we have tried to interpret andexplain air separation plant performance and capitalcost trends resulting from parametric processvariations studies. They show that the purity ofthe product oxygen must be considered independentlyof the enriched air concentration required by theuser. High pressure systems seem to be more energyefficient than low pressure systems if powerrecovery from pressurized product streams can becarried out efficiently, However, capital costs ofhigh pressure process plants are higher than thoseof plants delivering product at essentiallyatmospheric pressure.
References
1. Plan, C, C. P.; Staiger, P. J.; and Seikel,G. R.: "MHD Performance Calculations withOxygen Enrichment", DOE/NASA/2674-7914 0 NASATM-79140. Presented at Eighteenth Symposium onEngineering Aspects of Magnetohydrodynamics,Butte, Montana, June 18-20, 1979.
2. Ebeling, R. W.; Burkhart, J. A.; and Cutting,John C.:"Oxygen-Enriched Air Production forMHD Applications - A Power and Cost Analysis".Presented at Eighteenth Symposium on EngineeringAspects of Magnetohydrodynamics, Butte, Montana,June 18-20, 1979.
3. Rueckborn, G.: "Oxygen Enrichment: Cost andEffectiveness". Cryogenics and Industrial Gases,July/August 1971, pp.27-31.
4. Springgmmann, H.: "Oxygen Production", HetIngenieursblad, 42e j aargang (1973), nr. 21,
5. Schoenpflug, E.: "The Blast-Furnace OxygenPlant at Schwelggern", Linde Reports on Scienceand Technology, l.8/1973.

CONSTRUCTION
a
AIR COttPREW AOSWUN COLD POWTION ` HCATEidHANOCR I RECTIFICATION COLUMNACHOWI Of ! CITANSIOy , AN SCfAROM
I Ht0 • Cot TUNK
cao sac
l ^a
H51 H;t
I ^,a t
T
I CP
All ^
WS
1
FIG.I AIR SEPARATION PLANT
The columns are vertical cylindrical vesselscontaining sieve trays. The diagram belowshows the basic constructional details of asieve tray column.
I
liquid
Outlet weir
Inlet weir
Gas Sieve tray
FIG, 2 RECTIFICATION COLUMN DETAILS
ORIGINAL PAGE IOF POOR QUALY'1''V
i

ILO
le V NZ
N WNQ^ W
ad 0,, jr U
Oa:z-0:CL gT
^o
N O
I': ti 1 (Mt ^ !§ ti t § 5O O O O O O O C^ O d
Wmm0Wifm
JOVJWm US Q Q QQQa N m m mmmm w O 0050_ N to V: t1f op
O O0
OO O
O^ O vcZJaa O Z
~0zaa^°
°zV
QaWm N
0
ZZW Wt9
ZQ
Yfx W Q
0 V a O^ OD M
0Oa
J NO
w
Compressedd2 Fraction 1 (NO
Atm. Air (A)Air
Gp AirQ
PAN2 Fraction 2 (N2)
Separation
Unit
(ASU)Product Oxygen (0)
Blend Air (AA)
Enriched Air (E)
Definitionst
p n pressure (atm) P n power
Power Factor*: P * in(PA) - ^ ln(pNI ) - ln(pN2 ) - ln(po)
Air Factor:A • (Inverse Recovery)
Product Factor:
Specific Energy: ^ T *U
* r
* Negative terms indicate power recovery.
FIG. 5 Definition of Specific Energy Consumption Terms
k

POWER FACTORPiA
1.8
117
1.6
1.5
1,4
1.3
1.2
1.0
0,9
0,8
0,7
0.6VOL.% Ot
0.5 I .I I I i I J, I > I I i, 1 1_
20 30 40 50 60 70 80 90 100PRODUCT OXYGEN PURITYFIG. 6 POWER FACTOR ASSUMING
ISOTHERMAL COMPRESSION
AIR FACTORA0
°' MOL.,% 011.0 r i 1 1 , A A 1 II 1 . ._
20 30 40 50 60 70 80 90 100
PRODUCT OXYGEN PURITY
FIG.7 AIR FACTOR

k
to
QI
PROD FACTORo_aw ^
1.0 ^ r
20 30 40 50 60 70 80 90 100
PRODUCT OXYGEN PURITY
FIG.8 PRODUCT FACTOR
SPECIFIC ENERGY1.6f E (ex .306)
1.5
1,4
13
12
1.1
1,0
t i
S•9M
0.4 MAD
r, ... ... , .. 0120 30 40 50 60 70 80 90 100
CONCENTRATION PRODUCT OXYGEN
FIG, 9 SPECIFIC ENERGY E

INVESTMENTFACTOR
1,6
1,5 NLOW PRESSURE
1,4
1.3 $•4 ATA1
1,2
11 •
I,0
— MEDIUb PRES!
A x
s
^' X ONVOL.t .,^Lo.
20 30 40 50 60 70 80 90 100
CONCENTRATION PRODUCT OXYGENFIG.10 INVESTMENT COSTS
PRODUCT FLOW (RELATIVE)
1.5IA1,31,2I'I
MEAN FLOW FROM ASU1.00.90.8 ACTUAL FLOW TO0,7 MHD COMBUSTOR0.60,5
0 24 48 72 96 120 144 168 HOURS PER
12 136 160 184 1108 132) 156.1 WEEK
MON TUE, WED. THUR FRI. SAT. SUN. DAYS
FIG. 11 ALTERNATING OXYGEN DEMAND AND PRODUCTION