Delineation of Brain Structures from Functional Positron - TamPub

This document has been downloaded from TamPub – The Institutional Repository of University of Tampere
Publisher's version
The permanent address of the publication is http://urn.fi/URN:NBN:fi:uta-201310241513
Author(s): Pradhapan, Paruti; Kuusela, Jukka; Viik, Jari; Aalto-Setälä, Katriina; Hyttinen, Jari
Title: Cardiomyocyte MEA Data Analysis (CardioMDA) – A Novel Field Potential Data Analysis Software for Pluripotent Stem Cell Derived Cardiomyocytes
Year: 2013 Journal Title: Plos ONE
Vol and number: 8 : 9
Pages: 1-11 ISSN: 1932-6203 Discipline: Medical biotechnology School /Other Unit: Institute of Biomedical Technology
Item Type: Journal Article Language: en DOI: http://dx.doi.org/10.1371/journal.pone.0073637 URN: URN:NBN:fi:uta-201310241513 URL: http://dx.doi.org/10.1371/journal.pone.0073637
All material supplied via TamPub is protected by copyright and other intellectual property rights, and duplication or sale of all part of any of the repository collections is not permitted, except that material may be duplicated by you for your research use or educational purposes in electronic or print form. You must obtain permission for any other use. Electronic or print copies may not be offered, whether for sale or otherwise to anyone who is not an authorized user.

Cardiomyocyte MEA Data Analysis (CardioMDA) – ANovel Field Potential Data Analysis Software forPluripotent Stem Cell Derived CardiomyocytesParuthi Pradhapan1,3., Jukka Kuusela2,3., Jari Viik1,3, Katriina Aalto-Setala2,3,4*, Jari Hyttinen1,3*
1 Department of Electronics and Communications Engineering, Tampere University of Technology, Tampere, Finland, 2 Institute of Biomedical Technology, University of
Tampere, Tampere, Finland, 3 BioMediTech, Tampere, Finland, 4 HeartCenter, TampereUniversityHospital, Tampere, Finland
Abstract
Cardiac safety pharmacology requires in-vitro testing of all drug candidates before clinical trials in order to ensure they arescreened for cardio-toxic effects which may result in severe arrhythmias. Micro-electrode arrays (MEA) serve as acomplement to current in-vitro methods for drug safety testing. However, MEA recordings produce huge volumes of dataand manual analysis forms a bottleneck for high-throughput screening. To overcome this issue, we have developed anoffline, semi-automatic data analysis software, ‘Cardiomyocyte MEA Data Analysis (CardioMDA)’, equipped with correlationanalysis and ensemble averaging techniques to improve the accuracy, reliability and throughput rate of analysing humanpluripotent stem cell derived cardiomyocyte (CM) field potentials. With the program, true field potential andarrhythmogenic complexes can be distinguished from one another. The averaged field potential complexes, analysedusing our software to determine the field potential duration, were compared with the analogous values obtained frommanual analysis. The reliability of the correlation analysis algorithm, evaluated using various arrhythmogenic andmorphology changing signals, revealed a mean sensitivity and specificity of 99.27% and 94.49% respectively, in determiningtrue field potential complexes. The field potential duration of the averaged waveforms corresponded well to the manuallyanalysed data, thus demonstrating the reliability of the software. The software has also the capability to create overlay plotsfor signals recorded under different drug concentrations in order to visualize and compare the magnitude of response ondifferent ion channels as a result of drug treatment. Our novel field potential analysis platform will facilitate the analysis ofCM MEA signals in semi-automated way and provide a reliable means of efficient and swift analysis for cardiomyocyte drugor disease model studies.
Citation: Pradhapan P, Kuusela J, Viik J, Aalto-Setala K, Hyttinen J (2013) Cardiomyocyte MEA Data Analysis (CardioMDA) – A Novel Field Potential Data AnalysisSoftware for Pluripotent Stem Cell Derived Cardiomyocytes. PLoS ONE 8(9): e73637. doi:10.1371/journal.pone.0073637
Editor: Aditya Bhushan Pant, Indian Institute of Toxicology Research, India
Received June 10, 2013; Accepted July 20, 2013; Published September 19, 2013
Copyright: � 2013 Pradhapan et al. This is an open-access article distributed under the terms of the Creative Commons Attribution License, which permitsunrestricted use, distribution, and reproduction in any medium, provided the original author and source are credited.
Funding: This work was supported by TEKES (http://www.tekes.fi/en/), Finnish Foundation for Cardiovascular Research (http://www.sydantutkimussaatio.fi) andPirkanmaa Hospital District (www.pshp.fi). The funders had no role in study design, data collection and analysis, decision to publish, or preparation of themanuscript.
Competing Interests: The authors have declared that no competing interests exist.
* E-mail: [email protected] (JH); [email protected] (KAS)
. These authors contributed equally to this work.
Introduction
Cardiac safety pharmacology testing is used to identify drug-
induced complications, such as prolongation of the QT interval,
due to several cardiac and non-cardiac drugs. The prolongation of
QT-interval has been linked with the occurrence of severe
arrhythmias which have often proved to be fatal [1] [2]. As a
result of cardio-toxic effects, many drugs have been withdrawn
from the market or advanced stages of preclinical drug develop-
ment. To avoid such undesired consequences regulatory author-
ities such as Food and Drug Administration (FDA) and European
Medicines Agency (EMEA) require in vitro testing for all drug
candidates to reveal potential risks of QT-interval prolongation
before clinical experiments.
In vitro preclinical testings have shown to reduce cost, time and
failed clinical trials [3] [4]. Multi-electrode arrays (MEAs) can be
used to study cellular electrophysiology of cardiomyocytes (CMs) at
the cell population level. The use of MEA is a well-accepted
technique for recording electrical signals from excitable cells and
tissues with high spatial and temporal resolution [5] [6]. The cell
culture dish with MEA has surface embedded electrodes that can
sense changes in the electrical activity of the cells. The signals
recorded are extracellular field potentials generated by the CMs [7].
Earlier studies have shown that the extracellular field potential
recordings can be used to determine characteristics of the cardiac
action potential such as the field potential duration (FPD), which
correlates closely with the QT-interval in the electrocardiogram
(ECG) [8] [9]. As a result, the MEA platform has been used
extensively in the study of human pluripotent stem cell (hPSC)
derived CMs [10–13] and in vitro electrophysiological drug testing
[14–17].
MEA recordings can generate large volumes of data as several
electrodes from each individual recording contain useful informa-
tion. Traditionally, data from MEA recordings have been analysed
manually which is labour-intensive, slow and often user depen-
dent. Manual data analysis forms a bottleneck for high-throughput
screening and can sometimes be unreliable due to poor quality of
the signals. Commercial software for CM MEA data analysis
PLOS ONE | www.plosone.org 1 September 2013 | Volume 8 | Issue 9 | e73637

(Cardio2D+, Multichannel Systems Reutlingen, Germany),generic
software (e.g. Spike2 – Cambridge electronic design, Labchart –
AdInstruments, ClampFit – Molecular devices) that can be utilized
for cardiomyocyte MEA data analysis or other assay services
(QTempo, Reprocell, Japan) are currently available for cardio
toxicity testing but most of them suffer certain drawbacks. For
example, the Cardio2D+ analysis software allows averaging of
multiple field potential complexes for data analysis but requires its
own specialized recording software. Moreover, it requires data to
be in its native format, thereby rendering data from other sources
incompetent. MATLAB (Mathworks, Inc., Natick, Massachusetts,
United States) based programs and some custom-made MATLAB
Figure 1. Flowchart representing the workflow of CardioMDA. On execution of the program, the graphical user interface (GUI) opens up. Inphase I, the user loads the data that is to be analysed. The program automatically pre-processes to remove noise and after peak detection, the user isprompted to select a template for analysis. During correlation analysis, the program checks for field potential complexes whose correlation coefficientsatisfies the user-defined correlation factor and produces an average waveform. In phase II, the program allows the user to define the onset andoffset, either automatically using the built-in algorithms, or manually by the user. The process is repeated for upto ten signals and the field potentialduration and other parameters are compared. The results can be saved for future reference.doi:10.1371/journal.pone.0073637.g001
CardioDAS – A Novel Data Analysis Software
PLOS ONE | www.plosone.org 2 September 2013 | Volume 8 | Issue 9 | e73637

toolboxes [19–22] have been developed for signal analysis but
these programs require MATLAB to run and, with the exception
of MEA-tools, they are not available in open source. MEA
recordings from three-dimensional CM aggregates exhibit varia-
tion in signal amplitude and shape due to distance and orientation
between the source and the electrode surface [18]. As a result, the
signal-to-noise ratio (SNR), depicting the quality of the recorded
signals, may vary between different cardiac cell populations.
Moreover, the detection of sporadically occurring arrhythmic
complexes also poses a challenge to researchers, who often have to
screen large volumes of data to identify such morphology changes
as a result of drug treatment.
The aim of the study was to develop a field potential analysis
software platform to facilitate evaluation of drug response in CMs and
compare the FPD prolongation against different drug concentrations.
Here, we present our offline, semi-automatic software ‘Cardiomyo-
cyte MEA Data Analysis (CardioMDA)’, which is designed to
improve the accuracy, reliability and throughput rate for drug
screening and analysis. We demonstrate the usability and capability
of the software using human induced pluripotent stem cell (iPS cell)
derived CMs. The software is validated by calculating the mean
sensitivity and specificity of true field potential detection using several
arrhythmogenic and morphology changing signals. In addition, the
software based analysis outcomes are compared to manual analysis
results to establish the reliability of the analysis software.
Material and Methods
Human iPS cell generation, cell culture and cardiacdifferentiation
The study was approved by the ethical committee of Pirkanmaa
Hospital District (R08070) and written informed consent was
obtained from all the participants. Human iPS cells were
generated as described earlier [23]. Control human iPS cells
(UTA.04602.WT) [24] were cultured in knockout serum-replace-
ment (KSR) medium using mouse embryonic fibroblasts (MEF;
Millipore, Billerica, MA) as feeders. The components of KSR
medium are: knockout (KO)-DMEM (Invitrogen) containing 20%
KO-serum replacement (KO-SR, Invitrogen), nonessential amino
acids (NEAA), Glutamax, penicillin/streptomycin, 0.1 mM 2-
mercaptoethanol and 4 ng/ml fibroblast growth factor 2 (FGF2)
(bFGF, R&D Systems Inc., Minneapolis, MN, USA). The medium
was refreshed three times a week and the human iPS cells were
passaged weekly using collagenase IV (Invitrogen). Human iPS
cells were differentiated into CMs in co-culture with mouse
visceral endoderm-like END-2 cells [25] (a kind gift from Christine
Mummery, Hubrecht Institute, Utrecht, The Netherlands). The
END-2 differentiation method has been described elsewhere [25].
In vitro field potential recordings and data analysisBeating aggregates of CMs were manually dissected and plated
on 6-well MEAs (6-well MEA 200/30iR-Ti-tcr, Multichannel
Systems, Reutlingen, Germany), which were first coated with fetal
bovine serum (FBS, Invitrogen) for 30 minutes at room temper-
ature and then with 0.1% gelatine (Sigma Aldrich) for 1 hour at
room temperature. The CM aggregates were cultured in EB-
medium: KO-DMEM with 20% FBS, NEAA, Glutamax and
penicillin/streptomycin. The field potentials of spontaneously
beating aggregates of CMs were recorded at +37uC with the MEA
platform (MEA1060-Inv-BC, Multichannel Systems, Reutlingen,
Germany) using 20 kHz sampling frequency and MC_Rack
(Multichannel Systems, Reutlingen, Germany) software. The
MEAs were covered with gas-permeable membranes (ALA
MEA-SHEET, ALA Scientific) during recordings. For drug tests,
Figure 2. Screenshot of the graphical user interface for CardioMDA. The screenshot presents the Load panel of the CardioMDA softwarewith its interactive interface options and basic signal information. Once the template has been selected, the user then moves to the Average panel toset and execute the correlation analysis. Compare, Analyze and Statistics panel are used to measure the field potential duration and compare it withother drug concentrations.doi:10.1371/journal.pone.0073637.g002
CardioDAS – A Novel Data Analysis Software
PLOS ONE | www.plosone.org 3 September 2013 | Volume 8 | Issue 9 | e73637
s

the CMs were cultured in 5% FBS containing EB medium. The
hERG channel blocker E-4031 (Sigma Aldrich), Sotalol (Sigma
Aldrich), JNJ303 (Tocris Bioscience) and Esmolol (Brevibloc,
Baxter) were diluted in culture medium for a concentration range
of 100–700 nM, 1.6–19.4 mM, 1–7.5 mM and 84–168 mM
respectively. Baseline conditions as well as drug effects were
recorded for 2 minutes after a 2 minute drug wash-in. The FPDs
and beating rates from the recordings were analysed offline by
ClampFit (Molecular Devices) and by our CardioMDA software
for comparison studies. Twenty five field potential complexes for
each individual recording from the raw data were analysed
manually and the mean FPDs were compared to the correspond-
ing averaged signal FPDs obtained using CardioMDA.
System requirements and data formatCardioMDA is available in the executable file format and
requires about 6 Mb of free hard disk space. The program will run
on any system running Matlab 7.13 (The MathWorks Inc., Natick,
Massachusetts, United States) or a system installed with the
Matlab Compiler Runtime version 7.16 (The MathWorks Inc.,
Natick, Massachusetts, United States). The current version has
been tested on Matlab R2011b running on Microsoft Windows 7
(Microsoft Inc., Seattle, United States) platform and is available in
both 32-BIT and 64-BIT file formats.
The signals of CMs recorded using MEA1060-Inv-BC amplifier
(Multichannel Systems Reutlingen, Germany) or similar, are in the
native. mcd format. The current version of the program will only
support files in the ASCII format, converted using the MC_Da-
taTool (Multichannel Systems, Reutlingen, Germany) software.
Figure 3. Unstable signal morphology as a result of drug treatment. Signal showing changing morphology as a result of drug treatment.Field potential complex I and field potential complex II have different signal properties in terms of amplitude and duration, thereby accentuating theneed for correlation analysis.doi:10.1371/journal.pone.0073637.g003
CardioDAS – A Novel Data Analysis Software
PLOS ONE | www.plosone.org 4 September 2013 | Volume 8 | Issue 9 | e73637

Signals from multiple electrodes can be recorded on a single
ASCII file with header lines containing information on the
available electrodes, which is essential during analysis.
Program descriptionThe flowchart of the CardioMDA module is shown in Fig. 1.
On execution of the program and opening of the graphical user
interface (GUI), the first step involves importing data that needs to
be examined. This can be performed at two different stages: Phase
I – for correlation analysis and averaging or Phase II – for
evaluation of FPDs.
In Phase I, raw signals are imported for analysis and the
available electrodes are indicated on the program interface to
assist the user in choosing electrodes that needs to be analysed.
After pre-processing and peak detection, a template, which is used
as a comparison standard all detected field potential complexes, is
selected for cross correlation analysis and ensemble averaging. In
phase II, signals that have already undergone Phase I processing
are imported for in-depth analysis and quantization of FPD
prolongation due to drug injection. Up to ten different signals can
be analysed simultaneously in the phase II stage.
Pre-processing. Low-pass Butterworth filter of order 5 with
a cut-off frequency of 200 Hz is implemented to attenuate noise
that may affect signal quality. For correlation analysis, it is
essential that all the field potential complexes in the signal are
detected accurately. A simple window-threshold based technique
has been adapted for our software.
Correlation analysis. Correlation analysis plays an integral
role in identifying arrhythmogenic or morphology changing
signals as a result of drug treatment. Correlation analysis is
performed to identify field potential complexes that closely
resemble the selected template [26] [27]. In our program, the
template can either be chosen as default, which denotes the
selection of the field potential complex positioned at the centre of
the total recording duration, or manually, allowing the user to
select a field potential complex that best reflects the effect of drug
on the cells. The cross correlation function then measures the
degree of similarity between the chosen template and all detected
field potential complexes. The correlation coefficient is computed
as the sum of the products of corresponding pairs of points from
the two complexes within a specified time window. The formula
for cross correlation is represented as:
Figure 4. Comparison of correlation analysis results with different values of correlation factor. An illustration of the correlation analysisprocedure for morphology changing (top row) and arrhythmogenic signals showing premature activation (bottom row) for different correlationfactors is shown. The field potential complexes in green have a correlation coefficient greater than correlation factor and are identified as true fieldpotential complexes (accepted for averaging) whereas those in red are identified as true negatives (rejected for averaging). The black line presentsthe morphology of averaged signal. In both cases, it can be seen that for lower value of correlation factor (0.93), a number of false positives occur,causing a significant change in the morphology of the averaged waveform. From the bottom row, it can be seen that a higher correlation factor (0.98)is more accurate in identifying the true field potential complexes.doi:10.1371/journal.pone.0073637.g004
CardioDAS – A Novel Data Analysis Software
PLOS ONE | www.plosone.org 5 September 2013 | Volume 8 | Issue 9 | e73637

c1,2(n)~1
Nx1
XN{1
j~0
x1(j)x2(jzn)
Where N represents the number of samples in the time window, n
is the overlap factor and x1 and x2 are the signals. The factor 1/N
is used to normalize the results based on the number of sample
points. The value of c1,2 determines the level of similarity between
the two signals. A user-defined correlation factor (CF) determines
the level of similarity required to pool the data for averaging. All
the field potential complexes whose correlation coefficients are
equal or greater than the pre-defined CF are ensemble averaged to
produce the representative field potential complex. The resulting
average waveform has been shown to represent a general
morphology of the field potential complexes present in the raw
signal [28] [29].
Field potential duration onset and offset detection. The
detection of the beginning and end-point of the FPD (onset and
offset points, respectively) is essential for reliable data analysis.
Here, automatic onset detection was formulated based on
amplitude changes at every sample point in the signal with respect
to subsequent amplitudes within a particular time frame.
Trapezium’s area method (TRA) proposed by Vazquez-Seisdedo-
setal.[30] to identify the end of T wave is adapted for offset
detection and is based on calculation of successive areas of a
rectangular trapezium with three fixed vertices and one moving
point vertex. The moving point vertex shifts from detected valley-
Table 1. Cross correlation results for normal, arrhythmogenic and morphology changing signals with different values ofcorrelation factors.
MEA recording from hiPSC-CMs CF TP FP TN FN PPV Sensitivity Specificity
Normal signal
Baseline 0.88 136 2 0 0 98.55% 100% –
0.93 136 2 0 0 98.55% 100% –
0.98 136 0 2 0 100% 100% 100%
Morphology changing signal
E-4031 400 nM + Esmolol – 84 mM 0.88 38 20 0 0 65.52% 100% –
0.93 38 6 14 0 86.36% 100% 70%
0.98 38 2 18 0 95% 100% 90%
Arrhythmogenic signal
E-4031 – 700 nM 0.88 59 27 0 0 68.61% 100% –
0.93 59 7 20 0 89.39% 100% 74.07%
0.98 59 3 24 0 95.16% 100% 88.89%
CF-Correlation factor, TP-True positive, FP-False positive, TN-True negative, FN-False negative, PPV-Positive predictive value.From the table, it can be seen that PPV and specificity show significant improvement with an increase in CF. Experimental results have shown that CF between theranges of 0.96–0.98 produce consistent results.doi:10.1371/journal.pone.0073637.t001
Table 2. Statistical measure of performance in accurately detecting true field potential complexes in arrhythmogenic andmorphology changing signals using cross correlation with CF = 0.98.
MEA recording from hiPSC-CMs TP FP TN FN PPV Sensitivity Specificity
Arrhythmogenic signals
E-4031 – 10 nM 141 0 9 0 100% 100% 100%
E-4031 – 100 nM 281 3 24 2 98.94% 99.34% 88.89%
E-4031 – 700 nM 59 3 24 0 95.16% 100% 88.89%
E-4031 – 700 nM 22 2 51 0 91.67% 100% 96.23%
Morphology changing signals
E-4031 400 nM + Esmolol 84 mM 38 2 18 0 95% 100% 90%
E-4031 – 700 nM + Esmolol 84 mM 37 2 71 2 94.87% 94.87% 97.26%
E-4031 – 700 nM + Esmolol 168 mM 37 1 167 0 97.36% 100% 99.41%
E-4031 – 1000 nM+ Esmolol 168 uM 44 1 20 0 97.78% 100% 95.24%
Average: 96.35% 99.27% 94.49%
CF-Correlation factor, TP-True positive, FP-False positive, TN-True negative, FN-False negative, PPV-Positive predictive value.Sensitivity, specificity and PPV show consistent results for different datasets of arrhythmogenic and morphology changing signals. Results indicate that the correlationanalysis is highly sensitive and specific in detecting field potential complexes. A mean PPV of 96.35% indicates that true field potential complexes are detected with ahigh degree of accuracy, irrespective of the type of signal being analysed.doi:10.1371/journal.pone.0073637.t002
CardioDAS – A Novel Data Analysis Software
PLOS ONE | www.plosone.org 6 September 2013 | Volume 8 | Issue 9 | e73637

point after the activation peak to the last available sample point
while the total trapezium area is computed and the point at which
the area is maximum can be defined as the offset. From the onset
and offset points, the program computes the FPD, corrected FPD
(cFPD) using Bazett’s equation and the area under the curve.
Bazett’s equation is used to normalize FPD measurements to the
beating rate of contracting cardiac cells [15].
Graphical User Interface (GUI)The interface is divided into five panels: The Load panel for data
and signal information, Average panel for the correlation analysis,
Analyze panel for onset and offset detection, Compare and Statistics
panels to study the properties and differences between drug
concentrations. Each panel has its own set of icon buttons to
perform different functions. The tool tip strings describe the basic
function of each user interface button, thereby assisting new users
for ease of operation. All analysis results and overlay plots can be
saved for future reference. Fig. 2 shows the screenshot of
CardioMDA GUI with the load panel on display.
Statistical analysisSensitivity and specificity analysis are used to evaluate the
performance of the correlation analysis technique used in this
study. In order to define these measures, it is essential to have a
fundamental understanding of the following terms: TP – number
of true positives (field potential complex resembles the selected
template and the correlation coefficient is equal or greater than
CF); FP – number of false positives (field potential complex does
not resemble the template selected but the correlation coefficient is
greater than or equal to CF); TN – number of true negatives (field
potential complex does not resemble the template and the
correlation coefficient is lesser than CF); and FN – number of
false negatives (field potential complex resembles the template but
the correlation coefficient is lesser than CF). Sensitivity is the
proportion of field potential complexes which satisfy the CF and
are correctly classified as those which adequately resemble the
selected template.
Sensitivity~TP
TPzFN
Specificity is the proportion of complexes which do not satisfy
the CF criterion and are correctly classified as dissimilar to the
template.
Figure 5. Illustration of smoothing effect after ensemble averaging. N denotes the number of ensembles used for averaging. The resultingwaveform from ensemble averaging is smoother when the number of ensembles being averaged is higher.doi:10.1371/journal.pone.0073637.g005
Table 3. Field potential duration prolongation with increased hERG channel blocker E-4031 drug concentrations.
Manual analysis of raw data Analysis using CardioMDA
Mean ± S.D. Mean
E-4031 drug concentration FPD (ms) BR (bpm) FPD (ms) BR (bpm)
Baseline 300.3468.81 12862.4 306 127
E-4031–100 nM 306.0569.84 13562.5 313.5 134
E-4031–300 nM 329.57610.30 13062.0 331.2 129
E-4031–500 nM 360.50610.7 12261.2 364.1 122
E-4031–700 nM 410.93614.0 11360.86 423.9 112
Abbreviations: FPD- field potential duration, BR-beating rate.Mean and S.D. of field potential durations from manually analysed field potential complexes (n = 25) were compared to those of corresponding averaged signals fromCardioMDA in a drug dataset depicting the effect of E-4031 on human iPSC-derived CMs. The field potential duration rises as a result of increasing drug concentration.From the results obtained using our software, it can be seen that the changes in field potential duration correspond well to values obtained from manual analysis.doi:10.1371/journal.pone.0073637.t003
CardioDAS – A Novel Data Analysis Software
PLOS ONE | www.plosone.org 7 September 2013 | Volume 8 | Issue 9 | e73637

Specificity~TN
TNzFPð Þ
The positive predictive value (PPV) signifies the proportion of
field potential complexes with a positive CF which actually
resemble the selected template.
Positive predictive value~TP
TPzFPð Þ
Results and Discussion
Cardiac drug safety screening is of big concern in the
pharmaceutical industry. The withdrawal of several unsafe drugs
from the market accentuates the need for systemic screening
during the drug development phase. Analysing methods include
organ models such as Langendorff heart and cell models such as
conventional electrophysiology with patch clamp systems on CM
and heterologous expression systems [8]. Traditionally, the patch
clamp technique has been regarded as the golden standard to
determine electrical properties of the cells but it needs highly
skilled operator and is time intensive, therefore making it
unsuitable for high-throughput screening [4]. Moreover, currently
available methods are not fully adequate to reveal adverse
repolarisation effects of potential new drug candidates [31] [32].
The MEA platform together with hPSC-derived CMs may serve
as a complement to current methods for screening new drugs. The
recent hardware development in the MEA-technology has led to
the capability of acquiring large volumes of data. For example,
hardware from Multichannel Systems (MCS, Germany) allows
recording of electrical activity from up to 252 electrodes (USB-
MEA256) and up to nine different cell populations (256–9 well
MEA) at once. Although the actual MEA recordings are relatively
simple and time-efficient, the development of software for data
analysis has fallen behind. The manual data analysis is demanding
and has been a bottleneck for high-throughput screenings. To
perform these screening tests in a time efficient and systemic
manner, we formulated the CardioMDA that is intended to be
useful for researchers working with CMs. The software is
interactive and requires no specific programming knowledge as
all the functions are available on the intuitive graphical user
interface.
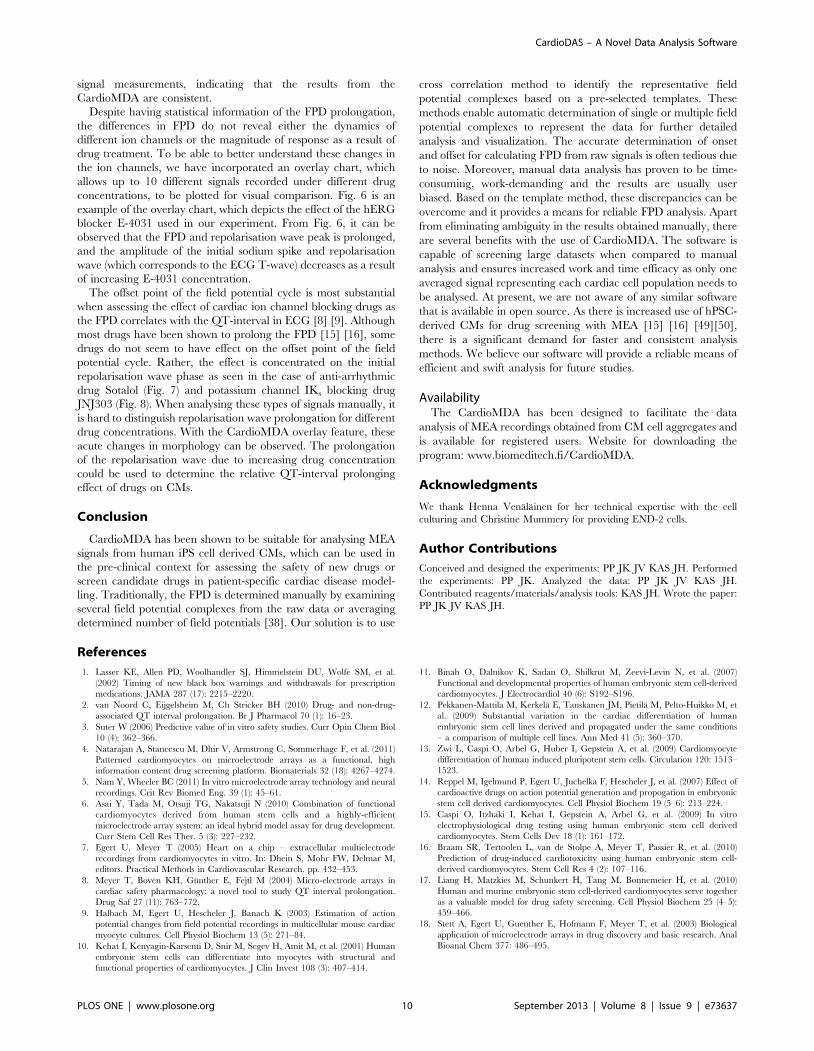
Figure 7. Overlay plot showing the effect of sotalol on fieldpotential duration and signal shape. As a result of drug treatment,the repolarisation wave peak, which corresponds ECG T-wave, isprolonged due to increasing concentration of Sotalol. However, theoffset point of field potential duration is similar between differentSotalol concentrations.doi:10.1371/journal.pone.0073637.g007
Figure 8. Overlay plot showing effect of IKs-blocker JNJ303 onfield potential duration and signal shape. Similar to Sotalol,JNJ303 prolongs the repolarisation wave peak but the field potentialduration offset point is similar between different JNJ303 concentrations.doi:10.1371/journal.pone.0073637.g008
Figure 6. Overlay plot showing the effect of hERG potassiumchannel blocker E-4031 on field potential duration. As a result ofE-4031 treatment, the increase in field potential duration is dependenton the concentration of the drug. The effect of the drug can mostprominently be seen at the repolarisation wave peak as a change ofsignal amplitude and the prolongation of the repolarisation wave peakcompared to baseline signal. The effect of the drug can also be seen asa prolongation of the offset point at the end of the field potential cycle.doi:10.1371/journal.pone.0073637.g006
CardioDAS – A Novel Data Analysis Software
PLOS ONE | www.plosone.org 8 September 2013 | Volume 8 | Issue 9 | e73637

Correlation analysis and ensemble averagingAlthough several studies have successfully adapted the correla-
tion technique for ECG beat detection and location of fiducial
points (landmarks of ECG such as onset of P wave) [27] [33] [34],
the correlation algorithm has not been tested on electrical activity
recorded from CMs plated on MEA. The significance of using this
method lies in its ability to accurately and consistently determine
true field potential complexes in morphology changing or
arrhythmogenic signals. Likewise, by choosing an arrhythmogenic
field potential complex as template, the incidence of arrhythmo-
genic behaviour in the recording can be determined. This greatly
simplifies the task of manually screening the datasets to identify
arrhythmogenic behaviour. Fig. 3 shows an example of how the
drug affects the morphology of the signal and the importance of
choosing an appropriate template for the analysis.
To evaluate the results of correlation analysis, stable, morphol-
ogy changing and arrhythmogenic signals were examined and
were subject to analysis with different values of correlation factors
(CFs). Arrhythmogenic signals showing premature activation were
obtained by applying a hERG potassium channel blocking drug E-
4031 to the CM aggregates. Morphology changing signals (see
example in Fig. 3) were obtained when E-4031 challenged CM
aggregates were treated with b-blocker Esmolol. The same
template was chosen each time for different signal set (normal,
morphology changing and arrhythmogenic signals) and analysed
using different CF values. Fig. 4 shows how the identification of
true field potential complexes is affected by CF. Sensitivity and
specificity of determining true field potential complexes were
calculated for these datasets, as shown in Table 1, to ensure the
results are consistent. It can be observed that with increasing CF,
there is a significant increase in positive predicted value (PPV) and
specificity, irrespective of the type of signal being analysed.
To ensure the algorithm produces consistent results, analysis
was performed on multiple datasets. Table 2 presents the outcome
from this study. The mean sensitivity and specificity for accurately
detecting true field potential complexes with CF set at 0.98 were
99.27% and 94.49%, respectively. The algorithm also exhibited a
mean PPV of 96.35%, which indicates that the detection
algorithm is accurate. However, extremely high CF may render
a very rigid selection criterion, greatly reducing the number of
ensembles available for averaging. Therefore, the CF should be
chosen prudently such that a right balance is achieved between
statistical performances and averaging. From experiments, it was
determined that CF values in the range of 0.96–0.98 were optimal
for correlation analysis. However, the user needs to consider the
degree of similarity that needs to be attained between the selected
template and field potential complexes to satisfy the selection
criterion. In some studies, the signal shape may prove to be trivial
and therefore a less stringent CF will suffice the study protocol.
Cross correlation has been used extensively for beat detection
and averaging ECG waveforms to remove artefacts [35–36].
Variations from the cross correlation algorithms in ECG have also
been successful and computationally efficient [37]. However, to
our knowledge these tools have not been used in MEA analysis.
The correlation interval is an important parameter to consider
while making correlation analysis. If the interval is too large, the
components of the adjacent field potential complex maybe
considered for correlation whereas, on the other hand, if the
interval is too small, the desired portions of the signal may not be
considered [27]. In order to ensure that such discrepancies are
avoided, we chose the smallest beat-beat duration as the
correlation interval.
Ensemble averaging has been shown to be effective for noise
attenuation [38]. Higher number of ensembles produces a better
SNR which conceives a smooth average of the field potential
complexes. For ensemble averaging, precise synchronization of
field potential complexes is vital. The averaging accuracy depends
on the accurate definition of fiducial points in the field potential
complexes and the constant time interval between the point and
signal being analyzed. In our study, the normal field potential
complexes were aligned with the window centred on the detected
QRS-like complex as the variability between beats was found to be
minimum. The smallest beat-to-beat interval was chosen as the
window length for the alignment. The number of ensembles
recorded during a period of 2 minutes from each cardiac
aggregate varied across different recordings. As illustrated in
Fig. 5, it was observed that the signal was smoother as the number
of ensembles increased. However, inaccurate alignment of the
ensembles could cause a low pass filtering effect [39] which might
suppress the high frequency components during averaging. Laciar
et al. [40] have shown that an alignment error of 1 millisecond
(ms) corresponds to a low pass filter of cut-off frequency 133 Hz for
ECG measurements. In order to avoid filtering effects of ensemble
averaging, it is ideal that the alignment errors are less than 0.5 ms
[40].
Field potential duration measurementsAlthough several approaches have claimed to be successful in
accurately determining the onset and offset of ECG [41–46], they
have limited utility in the MEA field potential analysis as the MEA
depolarisation and repolarisation phases may exhibit much more
diverse waveforms with narrow amplitude gradients and several
diverse morphological features: positive, negative, only upwards,
only downwards or biphasic waveforms. One source of variability
could be the three-dimensional CM aggregates used in MEA
analysis. These aggregates exhibit more variation in signal shape
between the recordings and between the different electrodes due to
their three-dimensional structure and spatial variability with
respect to the MEA electrodes. This constitutes a major challenge
in developing robust automated algorithms for the analysis of CM
MEA signals. Due to such inherent variability in geometry, the
onset and offset determined using our indigenously developed
automatic detection algorithms have been ambivalent. Another
possible cause for ambiguity could be due to differences in
perception. Different studies have shown that researchers have
chosen these fiducial points based on individual reasoning and
observation. For example, some studies have considered repolar-
isation wave peak as the offset whereas several other researchers
have chosen the absolute end of the repolarisation phase to
determine the FPD [17] [47] [48]. In order to overcome these
issues, the CardioMDA facilitates the use of operator’s discretion
to decide between automatic/manual determinations of the onset
and offset.
We investigated the reliability and efficiency of the CardioMDA
in determining the FPD of CMs by applying known hERG
potassium channel blocker E-4031 [41] to the human iPSC
derived CMs and comparing the results to the manual analysis. As
a result of hERG channel block, the FPD is prolonged due to
increasing concentration of the drug [15] [16]. The signals
recorded after every drug challenge were averaged and manually
annotated for onset and offset using our software. Concurrently,
the raw signal data for each drug concentration was analysed
manually and compared with the results obtained from the
averaged signal. Table 3 shows the comparison results between the
raw signal data and averaged data. The mean and standard
deviation (S.D.) of FPD from the raw signal data rises due to the
increasing E-4031 concentration. The FPD measurements ob-
tained from the averaged signal corresponded well with the raw
CardioDAS – A Novel Data Analysis Software
PLOS ONE | www.plosone.org 9 September 2013 | Volume 8 | Issue 9 | e73637
signal measurements, indicating that the results from the
CardioMDA are consistent.
Despite having statistical information of the FPD prolongation,
the differences in FPD do not reveal either the dynamics of
different ion channels or the magnitude of response as a result of
drug treatment. To be able to better understand these changes in
the ion channels, we have incorporated an overlay chart, which
allows up to 10 different signals recorded under different drug
concentrations, to be plotted for visual comparison. Fig. 6 is an
example of the overlay chart, which depicts the effect of the hERG
blocker E-4031 used in our experiment. From Fig. 6, it can be
observed that the FPD and repolarisation wave peak is prolonged,
and the amplitude of the initial sodium spike and repolarisation
wave (which corresponds to the ECG T-wave) decreases as a result
of increasing E-4031 concentration.
The offset point of the field potential cycle is most substantial
when assessing the effect of cardiac ion channel blocking drugs as
the FPD correlates with the QT-interval in ECG [8] [9]. Although
most drugs have been shown to prolong the FPD [15] [16], some
drugs do not seem to have effect on the offset point of the field
potential cycle. Rather, the effect is concentrated on the initial
repolarisation wave phase as seen in the case of anti-arrhythmic
drug Sotalol (Fig. 7) and potassium channel IKs blocking drug
JNJ303 (Fig. 8). When analysing these types of signals manually, it
is hard to distinguish repolarisation wave prolongation for different
drug concentrations. With the CardioMDA overlay feature, these
acute changes in morphology can be observed. The prolongation
of the repolarisation wave due to increasing drug concentration
could be used to determine the relative QT-interval prolonging
effect of drugs on CMs.
Conclusion
CardioMDA has been shown to be suitable for analysing MEA
signals from human iPS cell derived CMs, which can be used in
the pre-clinical context for assessing the safety of new drugs or
screen candidate drugs in patient-specific cardiac disease model-
ling. Traditionally, the FPD is determined manually by examining
several field potential complexes from the raw data or averaging
determined number of field potentials [38]. Our solution is to use
cross correlation method to identify the representative field
potential complexes based on a pre-selected templates. These
methods enable automatic determination of single or multiple field
potential complexes to represent the data for further detailed
analysis and visualization. The accurate determination of onset
and offset for calculating FPD from raw signals is often tedious due
to noise. Moreover, manual data analysis has proven to be time-
consuming, work-demanding and the results are usually user
biased. Based on the template method, these discrepancies can be
overcome and it provides a means for reliable FPD analysis. Apart
from eliminating ambiguity in the results obtained manually, there
are several benefits with the use of CardioMDA. The software is
capable of screening large datasets when compared to manual
analysis and ensures increased work and time efficacy as only one
averaged signal representing each cardiac cell population needs to
be analysed. At present, we are not aware of any similar software
that is available in open source. As there is increased use of hPSC-
derived CMs for drug screening with MEA [15] [16] [49][50],
there is a significant demand for faster and consistent analysis
methods. We believe our software will provide a reliable means of
efficient and swift analysis for future studies.
AvailabilityThe CardioMDA has been designed to facilitate the data
analysis of MEA recordings obtained from CM cell aggregates and
is available for registered users. Website for downloading the
program: www.biomeditech.fi/CardioMDA.
Acknowledgments
We thank Henna Venalainen for her technical expertise with the cell
culturing and Christine Mummery for providing END-2 cells.
Author Contributions
Conceived and designed the experiments: PP JK JV KAS JH. Performed
the experiments: PP JK. Analyzed the data: PP JK JV KAS JH.
Contributed reagents/materials/analysis tools: KAS JH. Wrote the paper:
PP JK JV KAS JH.
References
1. Lasser KE, Allen PD, Woolhandler SJ, Himmelstein DU, Wolfe SM, et al.
(2002) Timing of new black box warnings and withdrawals for prescription
medications. JAMA 287 (17): 2215–2220.
2. van Noord C, Eijgelsheim M, Ch Stricker BH (2010) Drug- and non-drug-
associated QT interval prolongation. Br J Pharmacol 70 (1): 16–23.
3. Suter W (2006) Predictive value of in vitro safety studies. Curr Opin Chem Biol
10 (4): 362–366.
4. Natarajan A, Stancescu M, Dhir V, Armstrong C, Sommerhage F, et al. (2011)
Patterned cardiomyocytes on microelectrode arrays as a functional, high
information content drug screening platform. Biomaterials 32 (18): 4267–4274.
5. Nam Y, Wheeler BC (2011) In vitro microelectrode array technology and neural
recordings. Crit Rev Biomed Eng. 39 (1): 45–61.
6. Asai Y, Tada M, Otsuji TG, Nakatsuji N (2010) Combination of functional
cardiomyocytes derived from human stem cells and a highly-efficient
microelectrode array system: an ideal hybrid model assay for drug development.
Curr Stem Cell Res Ther. 5 (3): 227–232.
7. Egert U, Meyer T (2005) Heart on a chip – extracellular multielectrode
recordings from cardiomyocytes in vitro. In: Dhein S, Mohr FW, Delmar M,
editors. Practical Methods in Cardiovascular Research. pp. 432–453.
8. Meyer T, Boven KH, Gunther E, Fejtl M (2004) Micro-electrode arrays in
cardiac safety pharmacology: a novel tool to study QT interval prolongation.
Drug Saf 27 (11): 763–772.
9. Halbach M, Egert U, Hescheler J, Banach K (2003) Estimation of action
potential changes from field potential recordings in multicellular mouse cardiac
myocyte cultures. Cell Physiol Biochem 13 (5): 271–84.
10. Kehat I, Kenyagin-Karsenti D, Snir M, Segev H, Amit M, et al. (2001) Human
embryonic stem cells can differentiate into myocytes with structural and
functional properties of cardiomyocytes. J Clin Invest 108 (3): 407–414.
11. Binah O, Dalnikov K, Sadan O, Shilkrut M, Zeevi-Levin N, et al. (2007)
Functional and developmental properties of human embryonic stem cell-derived
cardiomyocytes. J Electrocardiol 40 (6): S192–S196.
12. Pekkanen-Mattila M, Kerkela E, Tanskanen JM, Pietila M, Pelto-Huikko M, et
al. (2009) Substantial variation in the cardiac differentiation of human
embryonic stem cell lines derived and propagated under the same conditions
– a comparison of multiple cell lines. Ann Med 41 (5): 360–370.
13. Zwi L, Caspi O, Arbel G, Huber I, Gepstein A, et al. (2009) Cardiomyocyte
differentiation of human induced pluripotent stem cells. Circulation 120: 1513–
1523.
14. Reppel M, Igelmund P, Egert U, Juchelka F, Hescheler J, et al. (2007) Effect of
cardioactive drugs on action potential generation and propogation in embryonic
stem cell derived cardiomyocytes. Cell Physiol Biochem 19 (5–6): 213–224.
15. Caspi O, Itzhaki I, Kehat I, Gepstein A, Arbel G, et al. (2009) In vitro
electrophysiological drug testing using human embryonic stem cell derived
cardiomyocytes. Stem Cells Dev 18 (1): 161–172.
16. Braam SR, Tertoolen L, van de Stolpe A, Meyer T, Passier R, et al. (2010)
Prediction of drug-induced cardiotoxicity using human embryonic stem cell-
derived cardiomyocytes. Stem Cell Res 4 (2): 107–116.
17. Liang H, Matzkies M, Schunkert H, Tang M, Bonnemeier H, et al. (2010)
Human and murine embryonic stem cell-derived cardiomyocytes serve together
as a valuable model for drug safety screening. Cell Physiol Biochem 25 (4–5):
459–466.
18. Stett A, Egert U, Guenther E, Hofmann F, Meyer T, et al. (2003) Biological
application of microelectrode arrays in drug discovery and basic research. Anal
Bioanal Chem 377: 486–495.
CardioDAS – A Novel Data Analysis Software
PLOS ONE | www.plosone.org 10 September 2013 | Volume 8 | Issue 9 | e73637

19. Halbach M, Pillekamp F, Brockmeier K, Hescheler J, Muller-Ehmsen J, et al.
(2006) Ventricular slices of adult mouse hearts – a new multicellular in vitro
model for electrophysiological studues. Cell Physiol Biochem 18: 1–8.
20. Hannes T, Halbach M, Nazzal R, Frenzel L, Saric T, et al. (2008) Biological
pacemakers: characterization in an in vitro culture model. J Electrocardiol 41:
562–566.
21. Bussek A, Wettwer E, Christ T, Lohmann H, Camelliti P, et al. (2009) Tissue
slices from adult mammalian hearts as a model for pharmacological drug testing.
Cell Physiol Biochem 24: 527–536.
22. Liang H, Matzkies M, Schunkert H, Tang M, Bonnemeier H, et al. (2010)
Human and murine embryonic stem cell-derived cardiomyocytes serve together
as a valuable model for drug safety screening. Cell Physiol Biochem 25: 459–
466.
23. Takahashi K, Tanabe K, Ohnuki M, Narita M, Ichisaka T, et al. (2007)
Induction of pluripotent stem cells from adult human fibroblasts by defined
factors. Cell 131 (5): 861–872.
24. Kujala K, Paavola J, Lahti A, Larsson K, Pekkanen-Mattila M, et al. (2012) Cell
model of catecholaminergic polymorphic ventricular tachycardia reveals early
and delayed after depolarizations. PLoS One 7 (9): e44660. Available: http://
www.plosone.org/article/info:doi/10.1371/journal.pone.0044660. Accessed 24
February 2013.
25. Mummery C, Ward-van Oostward D, Doevendans P, Spijker R, van den Brink
S, et al. (2003) Differentiation of human embryonic stem cells to cardiomyocytes:
role of coculture with visceral endoderm-like cells. Circulation 107 (21): 2733–
2740.
26. Ifeachor EC, Jervis BW (1993) Digital Signal Processing: A Practical Approach
Wokingham, England: Addison-Wesley Publishing Company.
27. Last T, Nugent CD, Owens FJ (2004) Multi-component based cross correlation
beat detection in electrocardiogram analysis. Biomed Eng Online 3: 26.
28. Shahanaz A, Saini JP (2012) Abnormality detection in Indian ECG using
correlation techniques. Int J Comput App 58 (14): 33–38.
29. Dutta S, Chatterjee A, Munshi S (2010) Correlation technique and least square
support vector machine combine for frequency domain based ECG beat
classification. Med Eng Phys 32 (10): 1161–1169.
30. Vazquez-Seisdedos CR, Neto JE, Reyes EJM, Klautau A, de Oliveira RCL
(2011) New approach for T-wave end detection on electrocardiogram:
Performance in noisy conditions. Biomed Eng Online 10: 77.
31. Redfern WS, Carlsson L, Davis AS, Lynch WG, MacKenzie I, et al. (2003)
Relationships between preclinical cardiac electrophysiology, clinical QT interval
prolongation and torsade de pointes for a broad range of drugs: evidence for a
provisional safety margin in drug development. Cardiovasc Res 58: 32–45.
32. Lu M, Zhang Q, Deng M, Miao J, Guo Y, et al. (2008) An Analysis of Human
MicroRNA and Disease Associations. PLoS ONE 3 (10): e3420.
33. Abboud S, Sadeh D (1984) The use of cross-correlation function for the
alignment of ECG waveforms and rejection of extrasystoles. Comput Biomed
Res 17 (3): 258–266.
34. Govrin O, Sadeh S, Akselrod S, Abboud S (1985) Cross-correlation technique
for arrhythmia detection using PR and PP intervals. Comput Biomed Res 18 (1):
37–45.
35. Alperin N, Sadeh D (1986) An improved method for on-line averaging and
detecting of ECG waveforms. Comput Biomed Res 19 (3): 193–202.36. Abboud S, Barkai G, Mashiach S, Sadeh D (1990) Quantification of the fetal
electrocardiogram using averaging technique. Comput Biol Med 20 (3): 147–
155.37. Lindecrantz KG, Lilja H (1988) New software QRS detector algorithm suitable
for real time applications with low signal-to-noise ratios. J Biomed Eng 10 (3):280–284.
38. Kujala VJ, Jimenez ZC, Vaisanen J, Tanskanen JM, Kerkela E, et al. (2011)
Averaging in vitro cardiac field potential recordings obtained with microelec-trode arrays. Comput Methods Programs Biomed 104 (2): 199–205.
39. Rompelman O, Ros HH (1986) Coherent averaging technique: a tutorialreview. Part 1: noise reduction and the equivalent filter. Part 2: trigger, jitter,
overlapping responses and nonperiodic stimulation. J Biomed Eng 8: 24–35.40. Laciar E, Jane R, Brooks DH (2003) Improved alignment method for noisy high-
resolution ECG and Holter records using multiscale cross-correlation. IEEE
Trans Biomed Eng 50 (3): 344–353.41. Spector PS, Curran ME, Keating MT, Sanguinetti MC (1996) Class III
antiarrhythmic drugs block HERG, a human cardiac delayed rectifier K+channel. Open-channel block by metanesulfonanilides. Circ Res. 78 (3): 499–
503.
42. Joeng HK, Kim KK, Hwang SC, Lee MH (1989) A new algorithm for P-wavedetection in the ECG signal. Engineering in Medicine and Biology Society,
Proceedings of the Annual International Conference of the IEEE Engineering 1:42–43.
43. Escalona OJ, Gavidia L, Wright GTH (1996). A robust procedure for P-wavedetection and segmentation in high resolution 12-lead ECG. Engineering in
Medicine and Biology Society, Proceedings of the Annual International
Conference of the IEEE Engineering 4: 1365–1366.44. Vıtek M, Hrubes J, Kozumplık J (2010) A wavelet-based ECG delineation in
multilead ECG signals: evaluation of the CSE database. World Congress onMedical Physics and Biomedical Engineering, IFMBE Proceedings 25 (4): 177–
180.
45. Strumillo P (2002) Nested median filtering for detecting T-wave offset in ECGs.Electron Lett 38 (14): 682–683.
46. Laguna P, Thakor NV, Caminal P, Jane R, Yoon HR, et al. (1990) Newalgorithm for QT interval analysis in 24-hour Holter ECG: performance and
applications. Med Biol Eng Comput 28 (1): 67–73.47. Reppel M, Pillekamp F, Zhong JL, Halbach M, Brockmeier K, et al. (2004)
Microelectrode arrays: A new tool to measure embryonic heart activity.
J Electrocardiol 37 Suppl: 104–109.48. Reppel M, Pillekamp F, Brockmeier K, Matzkies M, Bekcioglu A, et al. (2005)
The electrocardiogram of human embryonic stem cell-derived cardiomyocytes. JElectrocardiol. 38 (4 Suppl): 166–170.
49. Yokoo N, Baba S, Kaichi S, Niwa A, Mima T, et al. (2009) The effects of
cardioactive drugs on cardiomyocytes derived from human induced pluripotentstem cells. Biochem Biophys Res Commun 387 (3): 482–488.
50. Tanaka T, Tohyama S, Murata M, Nomura F, Kaneko T, et al. (2009) In vitropharmacologic testing using human induced pluripotent stem cell-derived
cardiomyocytes. Biochem Biophys Res Commun 285 (4): 497–502.
CardioDAS – A Novel Data Analysis Software
PLOS ONE | www.plosone.org 11 September 2013 | Volume 8 | Issue 9 | e73637