This capstone paper is posted as an example of the … capstone internship project final paper...
73
AN ANALYSIS OF HUNTER PARTICIPATION TRENDS AND POTENTIAL FACTORS INFLUENCING HUNTER LICENSE PURCHASE BEHAVIOR IN NEW JERSEY- AN INTERNSHIP WITH NEW JERSEY DIVISION OF FISH AND WILDLIFE BY MELISSA A. WOERNER SPECIAL PROJECT REPORT Submitted in partial fulfillment of the requirements for the degree of Master of Science in Natural Resources and Environmental Sciences in the Graduate College of the University of Illinois at Urbana-Champaign, 2015 Urbana, Illinois Committee: Piper Hodson, NRES Online Program Director Richard Brazee, Associate Professor Robert J. Hudson, Associate Professor This capstone paper is posted as an example of the type of work and writing that meets the capstone internship project final paper requirement for the NRES non-thesis M.S. option. This should not be used as a guide for formatting. For format information, see http://www.grad.illinois.edu/thesis/format. The paper is posted with permission of the author and may not be reproduced or distributed without her explicit consent.
Transcript of This capstone paper is posted as an example of the … capstone internship project final paper...
AN ANALYSIS OF HUNTER PARTICIPATION TRENDS AND POTENTIAL FACTORS
INFLUENCING HUNTER LICENSE PURCHASE BEHAVIOR IN NEW JERSEY-
AN INTERNSHIP WITH NEW JERSEY DIVISION OF FISH AND WILDLIFE
BY
MELISSA A. WOERNER
SPECIAL PROJECT REPORT
Submitted in partial fulfillment of the requirements for the degree of Master of Science in Natural Resources and Environmental Sciences
in the Graduate College of the University of Illinois at Urbana-Champaign, 2015
Urbana, Illinois
Committee:
Piper Hodson, NRES Online Program Director Richard Brazee, Associate Professor Robert J. Hudson, Associate Professor
This capstone paper is posted as an example of the type of work and writing that meets the capstone internship project final paper requirement for the NRES non-thesis M.S. option. This should not be used as a guide for formatting. For format information, see http://www.grad.illinois.edu/thesis/format. The paper is posted with permission of the author and may not be reproduced or distributed without her explicit consent.
ii
ABSTRACT
The vast majority of funds for fish and wildlife management and habitat enrichment have been
from the sale of hunting and fishing licenses and from excise taxes on hunting and fishing equipment.
However, several studies have documented that hunting participation has been declining in the United
States, potentially creating revenue shortfalls that impact both hunting and non-hunting conservation
initiatives. State agencies are responsible for managing the harvest and hunting seasons for most game
species and are therefore largely responsible for managing hunter participation, recruitment, and
retention. This paper details the results of an internship with New Jersey Division of Fish and Wildlife
that aimed to identify trends in hunter recruitment, retention, and license purchase behavior to help
guide efforts to increase hunter participation in the state. The internship project was modeled after a
recent national study involving twelve state wildlife agencies, with the addition of a GIS component and
statistical analysis. Results indicate significant hunter retention issues in New Jersey and identify
segments of the hunting population that would have the most significant impact on license sales.
iii
ACKNOWLEDGMENTS
This project would not have been possible without the support of many people. I would like to
thank my advisor, Piper Hodson, for her guidance throughout my graduate tenure, as well as Renee
Gracon for her patience, encouragement, and committed assistance during my capstone internship
experience. I would also like to thank Dr. Tim Ellsworth for his constructive recommendations during
the preliminary stages of this project. I also wish to thank Tianyu Wang, Zhaoying (April) Tang, and
Qianyu Cheng from University of Illinois’ Statistics in the Community for their technical assistance with
statistical analysis and modeling.
I would like to thank several current and former employees of New Jersey Division of Fish and
Wildlife for contributing their knowledge and skills to this project. For initially suggesting a capstone
internship idea that would both satisfy the degree requirements and contribute valuable information to
New Jersey Division of Fish and Wildlife, I owe thanks to Jim Sciascia and Paul Ritter. For their help with
obtaining and processing data, I would like to thank Bob Longcor and Barb Stoff. For his invaluable
assistance organizing and analyzing data in Microsoft Access, I would like to thank Pete Winkler.
I also owe thanks to my husband and co-worker, Patrick Woerner, for his GIS guidance on this
project, but especially for always offering love and support while enduring this long process with me.
Finally, I wish to thank my parents for their endless encouragement and my daughter, Sarah Woerner,
who was born in the midst of my graduate career and always brought a smile to my face when I needed
it most.

iv
LIST OF ACRONYMS AND ABBREVIATIONS
ALS Automated Licensing System
CID Customer Identification number
GIS Geographic Information System
GLM Generalized Linear Model
LULC Land Use/Land Cover
M.S. Master of Science
NJDFW New Jersey Division of Fish and Wildlife
NRES Natural Resources and Environmental Sciences
StatCom Statistics in the Community
UIUC University of Illinois at Urbana-Champaign
v
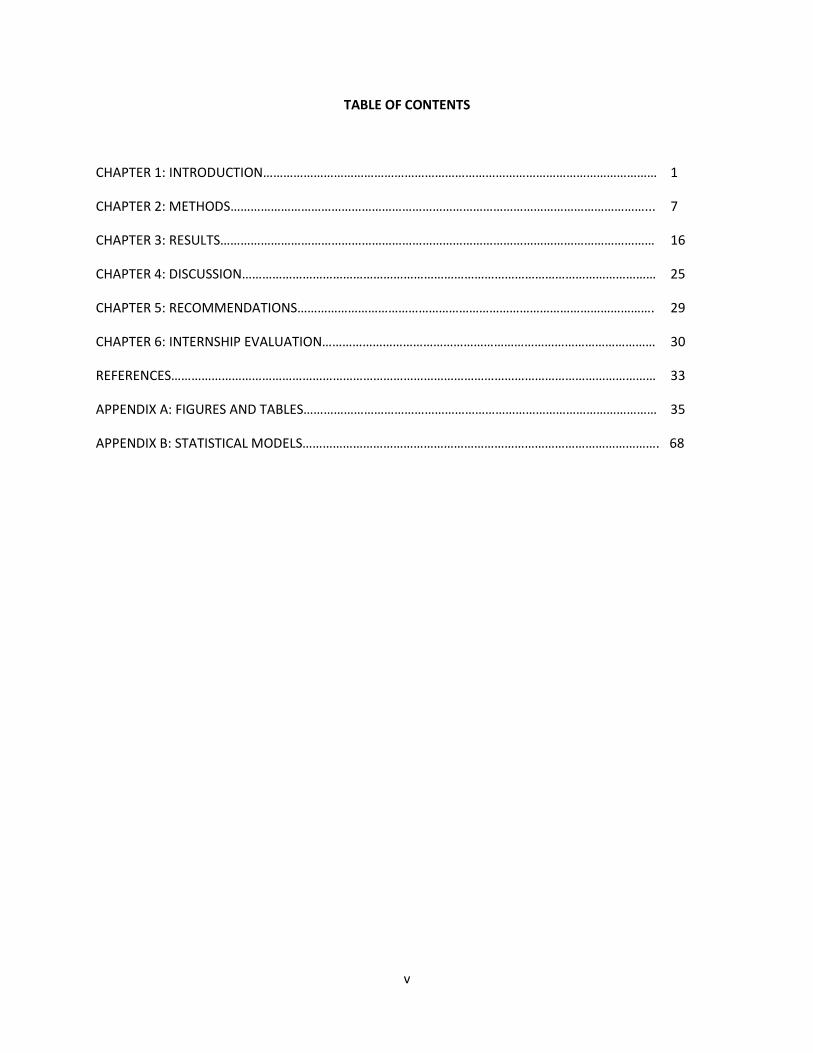
TABLE OF CONTENTS
CHAPTER 1: INTRODUCTION……………………………………………………………………………………………………… 1
CHAPTER 2: METHODS……………………………………………………………………………………………………………... 7
CHAPTER 3: RESULTS………………………………………………………………………………………………………………… 16
CHAPTER 4: DISCUSSION…………………………………………………………………………………………………………… 25
CHAPTER 5: RECOMMENDATIONS……………………………………………………………………………………………. 29
CHAPTER 6: INTERNSHIP EVALUATION……………………………………………………………………………………… 30
REFERENCES……………………………………………………………………………………………………………………………… 33
APPENDIX A: FIGURES AND TABLES…………………………………………………………………………………………… 35
APPENDIX B: STATISTICAL MODELS……………………………………………………………………………………………. 68
1
CHAPTER 1: INTRODUCTION
1.1 Internship experience and learning objectives
From March of 2014 to July of 2015, the author completed a capstone internship experience
with the New Jersey Department of Environmental Protection’s Division of Fish and Wildlife (NJDFW).
The internship was carried out in conjunction with the author’s current employment as a Senior
Biologist within the Information and Education Bureau’s Hunter Education Unit under the supervision of
Paul Ritter. The internship accounted for 180 hours with hours per week varying dependent on other
work responsibilities. Work was completed in the Central Region Office in Upper Freehold Township,
New Jersey. NJDFW is a state-government “environmental agency dedicated to the protection,
management and wise use of New Jersey's fish and wildlife resources” (NJDFW 2015a).
For the capstone internship experience, the author researched the gap between hunter
education graduates and hunting license sales. Although every prospective hunter in New Jersey is
required to complete a hunter education course, not every graduate goes on to buy a hunting license.
The aim of the capstone was to identify where intervention efforts may be helpful to increase hunting
participation and retention rates among new hunters in New Jersey. Learning objectives included
researching the role of hunting and license sales in wildlife and natural resource management,
identifying trends in license purchase behavior among different segments of the population, and
exploring potential factors that may influence hunter recruitment and retention. Hours dedicated to
completing the learning objectives were spent conducting literature reviews and gathering background
information; obtaining and processing data; analyzing data using Microsoft Access, ArcGIS, and
statistical modeling; collaborating with NJDFW employees; and preparing periodic reports and the final
capstone internship paper.
1.2 Literature Review
Hunting is a primary means of wildlife management (Carpenter 2000; Riley et al. 2003) and has
contributed greatly to the advancement of scientific knowledge and research techniques. For example,
recovered bands from harvested waterfowl allowed scientists to estimate North American waterfowl
populations and led to the mark-recapture method known as the Lincoln-Peterson index (Lincoln 1930;
White and Bishop 2010). Game harvest and subsequent manipulation of game populations facilitated
the development of survival estimation methods that have been extended to apply to nongame species
(Brownie et al. 1978), the effects of density dependence on population regulation (McCullough 1979),

2
and adaptive harvest management (White and Bishop 2010). Hunting is a means of balancing predator-
prey relationships (White and Bishop 2010) and controlling overabundant populations that can lead to
ecologic and economic damage (Kilpatrick and Walter 1999; Conover 2001; Côté et al. 2004).
Furthermore, the vast majority of funds for fish and wildlife management and habitat enrichment have
been from the sale of hunting and fishing licenses and from excise taxes on hunting and fishing
equipment (Mangun and Shaw 1984; Peterson 2004; White and Bishop 2010; Williams 2010).
In New Jersey, $116 million was spent on hunting expenditures in the year 2011 (United States
Department of the Interior 2013). New Jersey specifically manages more than 354,000 acres of state-
owned public open space to enhance wildlife populations and provide for wildlife-oriented recreation
opportunities such as hunting (NJDFW 2015b). In addition, New Jersey provides year-round hunting
opportunities, including seasons for small game, waterfowl, turkey, fox, coyote, white-tailed deer, and
black bear. However, hunter participation in New Jersey is primarily focused on white-tailed deer, with
95% of the state’s hunters participating in deer hunting (United States Department of the Interior 2013).
Hunting provides the primary means of controlling deer population sizes in the state, with 2014’s annual
harvest totaling 52,704 deer (NJDFW 2015c). In 2014, hunting license and permit revenue generated
$8.2 million and provided approximately 53% of the total wildlife conservation revenue for the state
(NJDFW, Robert Longcor, personal communication, August 4, 2015). Because these funds can be used
for the general administration of the state fish and wildlife agency, they can be spent on both hunting
and non-hunting related programs.
Several studies have documented that hunting rates have been declining in the United States
(Enck et al. 2000; Shultz et al. 2003; Zinn 2003). Between 2001 and 2011, New Jersey showed a 30%
decline in hunters (United States Department of the Interior 2013). State agencies, such as NJDFW, are
responsible for managing the harvest and hunting seasons for most game species. As such, they also are
largely responsible for managing hunter participation, recruitment, and retention. It is therefore critical
that state-specific trends are identified in order for states to develop strategies to maximize hunter
participation in their jurisdictions (Gude et al. 2012).
Recently, the National Shooting Sports Foundation funded a national study on hunter education
graduates’ proclivity to purchase a license (Southwick Associates 2013). The Southwick Associates
(2013) study analyzed hunter education and license sales data from twelve state wildlife agencies
throughout the country (Montana, Nevada, Utah, Washington, Michigan, Missouri, Nebraska, Georgia,
Kentucky, Virginia, Maine, and Vermont), profiling the hunter education class of 2006 and their
subsequent license buying habitats over the next six years (2006-2011). By cross-referencing each
3
hunter education graduate’s record in the graduate database to records in each state’s license sales
database, trends could be developed. The results were “intended to help the hunting community
understand if and where intervention efforts may be needed to maintain hunting participation among
newer hunters” (Southwick Associates 2013, p. iii). Their results showed that across the twelve states
analyzed, an average of 67.7% of hunter education graduates purchased at least one hunting license
from 2006 to 2011, indicating that a significant portion of graduates did not buy a license after
graduating. In addition, the number of graduates who bought a license from 2006 to 2011 decreased by
34.5%; only 44% of graduates bought a license after six years (Southwick Associates 2013).
In addition to identifying the percentage of graduates who purchased a license within six years,
the Southwick Associates (2013) study analyzed other factors that may contribute to license purchasing
behavior. Their results across the twelve states showed that individuals who graduated from a hunter
education class in June and the warmer months comprised the greatest percentage of graduates who
never purchased a license (Southwick Associates 2013). This indicates that the seasonality of hunter
education classes could affect license purchasing behavior and that future retention efforts may benefit
from minimizing classes in the summer months. They also found that in most states, graduates between
the ages of 16-24 were less likely to buy a license six years after graduating. In addition, college
students and those enlisted in the military were more likely to stop renewing their license within six
years of graduating. They also found that graduates from highly urbanized areas showed the greatest
drop-out rates (Southwick Associates 2013). These results could help direct future retention efforts by
targeting specific groups of graduates that are at greatest risk for dropping out of the system. In
addition to analyzing common trends across the study states, the Southwick Associates (2013) report
provided individual state data to help each state agency maximize hunter participation rates in the
future.
In addition to the Southwick Associates (2013) study, there are several other studies that have
explored trends in hunting license sales. Gude et al. (2012) also tracked hunter education graduates’
license purchase behavior over a six-year period to estimate hunter recruitment, participation, and
license purchasing probabilities in Montana. Using matrix population models, Gude et al. (2012) found
that males had greater recruitment rates, retention rates, and license purchasing probabilities than
females; the young adult age class (19-30 year olds) had the lowest purchasing probability; and that
trends in license sales in Montana were most influenced by middle-aged (31-42 year olds) and baby
boomer (43-59 year olds) male license purchase probabilities. Their results suggested that license sales
4
and hunter participation in Montana could be most greatly influenced by programs focused on
increasing recruitment and retention in older age class males.
Several other studies of hunter participation, recruitment, or retention have also made
comparisons among age classes (Mehmood et al. 2003; Zinn 2003; United States Department of the
Interior 2013). However, there is little consistency in the categorization of age classes among studies,
ranging from age classes corresponding to traditional life stages to classes divided into roughly equal
segments of years. While categorizing age into segments of roughly equal years (for example, 18-30, 31-
40, 41-50, 51-60, over 60) could facilitate more direct comparisons between classes, that methodology
may not accurately represent the lifestyles and behaviors characteristically associated with various life
stages. Since the author’s internship aimed to identify behavior differences among hunter education
graduates, it was important to account for important behaviors that could influence hunting
participation, such as leaving home for education or military pursuits, establishing careers and families,
or retiring, when selecting age classes for analysis.
There are several other demographic factors that have been analyzed in studies of hunter
participation and retention, including ethnicity (Mehmood et al. 2003; Zinn 2003; United States
Department of the Interior 2013), income (Mehmood et al. 2003; United States Department of the
Interior 2013), education (Zinn 2003; United States Department of the Interior 2013), and urbanization
(Zinn 2003; Southwick Associates 2013; United States Department of the Interior 2013). The author’s
research was limited by the available information associated with each hunter education graduate (age,
gender, address) but some extrapolations were made based on the graduate’s county of residence and
associated demographic characteristics.
1.3 Need for New Jersey hunter participation data
When the Southwick Associates (2013) report was released, NJDFW personnel realized they had
missed an opportunity to contribute data to a national survey that would generate state-specific
information and potentially help identify ways to increase hunter participation. As the author was
exploring capstone project ideas that could fulfill an internship experience, NJDFW personnel suggested
generating the same analysis for New Jersey as the Southwick Associates (2013) report produced for the
twelve participating state wildlife agencies. The Southwick Associates (2013) study therefore served as a
blueprint for this internship and many of the resulting tables were modeled after its results. However,
in order to also fulfill academic requirements for a Master of Science (M.S.) degree, a more rigorous
approach was adopted and additional analysis included statistical modeling, a Geographic Information
5
System (GIS) component, and inclusion of additional factors that may influence hunter participation
rates and license purchasing.
Prior to this internship, NJDFW did not have a comprehensive analysis of the composition of
New Jersey hunter education graduates, trends in hunter participation rates, or potential factors that
may influence license purchase behavior. The data generated by this internship experience will be
helpful in directing future hunter recruitment and retention efforts in New Jersey, which in turn could
increase license and permit revenue that will support wildlife conservation programs throughout the
state. In addition to financial benefits, maximizing hunter recruitment and retention in New Jersey is
important for a variety of other reasons, as well. Ecologically, increasing hunter participation can help
control overabundant wildlife populations, balance predator-prey relationships, and maintain forest
health. There are also multiple public safety issues in the state related to overabundant wildlife, such as
wildlife-vehicle collisions, the spread of Lyme disease and other tick-borne illnesses, and direct conflicts
with humans, which may be reduced through increased hunter participation. Furthermore, improving
recruitment and retention rates may help reduce property damage caused by overabundant wildlife.
Increasing hunter participation in New Jersey will also help expand the constituency of outdoor
enthusiasts in the state and foster a greater sense of environmental stewardship in generations of
residents to come.
1.4 New Jersey Hunting License and Permit Process
Anyone ten years or older may obtain a hunting license after completing a hunter education
course through NJDFW. The hunter education course consists of a free home-study DVD and workbook
that are available as an online download via the NJDFW website or can be picked up at specified vendors
and NJDFW field offices. Beginning in 2014, hunter education courses are offered in “Bow and Arrow”
and “Firearms”; previously, “Firearms” was separated into “Shotgun” and “Rifle/Muzzleloader” courses
(NJDFW 2015b). Once students have completed the home-study workbook, or alternatively completed
a fee-based online hunter education course that substitutes for completion of the home-study
workbook, they are required to attend a field session and pass a written exam. NJDFW offers field
sessions and exams in at least one location throughout New Jersey every weekend (excluding holiday
weekends) from March through November. For added convenience, sessions are also held on several
weekdays throughout the year. Additionally, bow hunters must pass a proficiency requirement with
their own equipment by placing at least three out of five arrows in the vital area of a 3-D deer target
from 15-20 yards. After students have passed the written exam and completed the field session (and
6
bow proficiency test if registered for the “Bow and Arrow” class), they are issued a course completion
certification from NJDFW. The hunter education certification is a lifetime credential with no expiration
date. Graduates can present the course certification to a license agent; graduates of 10 to 15 years of
age are issued a free Youth License while those ages 16 and older are eligible to purchase a license.
Youth licenses are valid from the time of purchase until the end of the calendar year in which the youth
turns 16. Youth hunters between 10 and 13 years old must be accompanied by a licensed adult 21 years
or older while hunting (NJDFW 2015b).
In addition to a Bow and Arrow license and a Firearms license, NJDFW also offers a Trapper
license for legal use of snares. Anyone 12 years or older who is interested in trapping in New Jersey
must pass a Trapper Education course and purchase a trapping license (NJDFW 2015d).
1.5 NJDFW hunting database systems
Beginning in 2006, NJDFW began incorporating the Automated Licensing System (ALS) to track
data on individual license purchasers and license types bought. The ALS is a computer-based, point-of-
sale software database system that captures information at the time of sale. The 2006 annual license
sales data for New Jersey was a combination of paper and electronic records as the ALS system was
being phased in. As of 2007, New Jersey license sales tracking efforts have been fully electronic through
the ALS. At the time of this analysis, NJDFW license year 2012 was the latest year for which ALS data
had been finalized.
In addition, NJDFW maintains records of hunter education graduates using a hunter education
database. From 2007 on, anyone who registers for a New Jersey hunter education course online is
automatically entered into the hunter education database and assigned a unique customer
identification number (CID). The CID can be used to cross-reference license buyers in the ALS system.
NJDFW also accepts walk-ins (participants who did not register online) at hunter education courses but
these records are not captured by the hunter education database nor manually entered after-the-fact.
Their data is only captured by the license vendor at the time of a license purchase. For the purposes of
this research, only hunter education graduates who registered online and were therefore added to the
hunter education database were included in the author’s analysis. Walk-ins account for 43.6% of
attendees on average at hunter education classes, with a range from 4% in June to 55% in November
(NJDFW, Nate Figley, personal communication).
7
CHAPTER 2: METHODS
2.1 Obtaining and preparing data
As modeled after the Southwick Associates (2013) study, and similar to Gude et. al (2012), this
project tracked the license purchase behavior of hunter education graduates over a six-year period.
Southwick Associates (2013) tracked the 2006 hunter education graduates’ license sales from 2006-
2011. As 2007 was the first complete year for the ALS system in New Jersey, this research tracked the
2007 hunter education graduates’ license sales from 2007-2012. Although the six-year study periods are
not identical, the author did not think this would inhibit direct comparisons to the results generated by
Southwick Associates for the other twelve state wildlife agencies.
Two NJDFW personnel assisted the author with obtaining records from the ALS system and
hunter education database. A text file containing all of the records of 2007 hunter education graduates
was provided to the author, along with four text files for each year’s license sales from 2007-2012,
representing Adult, Youth, Non-Resident, and Disabled Veteran transactions.
Before analysis could begin, the data had to be organized into a functional format. Most of the
data preparation was conducted in Microsoft Access, along with some intermediate tables generated in
Microsoft Excel. The 2007 hunter education database file contained one record for each certificate
awarded (total of 5159 records for 2007). Therefore, a single individual with the same CID may have had
multiple records in the database if they completed more than one certificate (for example, a person
completing Bow and Arrow, Firearms, and Trapping courses in 2007 would contain three records). In
order to link each hunter to their customer sales records in the ALS (a one-to-many relationship),
multiple records for the same CID in the hunter education database needed to be compressed into a
single record. After importing the text file into Microsoft Access, a “Unique Customer ID” table was
generated through a query process and then checked for duplicates, resulting in a new table containing
3768 records representing the unique individuals that graduated from a hunter education course in
2007.
The next step in preparing the data for analysis was to assign a hunting discipline to each hunter
education graduate record. In 2007, the Firearms certificate was divided into separate Rifle and
Shotgun certificates; for this analysis, any 2007 hunter education graduate who completed either a Rifle
or a Shotgun course was assigned to the Firearms discipline to reflect current license titles and facilitate
future comparisons. NJDFW also offers an All-Around Sportsman license for hunter education graduates
8
purchasing both a Firearm and Archery license (in addition to a fishing license). The following hunting
discipline categories were used for this analysis:
Firearms: Rifle and/or Shotgun
Archery
Trapping
Firearms-Trap: Firearms and Trapping
All-Around: Firearms and Archery
All-Around-Trap: Firearms, Archery, and Trapping
Each 2007 hunter education graduate was assigned to one of the above disciplines to reflect which
certificate(s) they completed and therefore which license(s) they were eligible to purchase.
Similarly, the license sales tables for 2007-2012 derived from the ALS also needed to be
modified into a different format before conducting analysis. First, all license sales data for a single year
(Adult, Youth, Non-Resident, and Disabled Veteran sales tables) needed to be imported into Microsoft
Access and appended into a single table. Next, a hunting discipline needed to be assigned to each sale.
Each license sale transaction in the ALS was already labeled with a “Privilege Code” that designated the
specific type of license sold. For example, privilege code 1 is an All-Around Sportsman license and was
therefore assigned to the All-Around discipline; privilege code 210 is a Rifle Permit and was assigned to
the Firearms discipline. This process was completed for all New Jersey license sales transactions from
2007-2012 in order to track sales by hunting discipline.
As objectives for this capstone project included analyzing license purchase behavior and trends
in relation to factors such as age and area of residency, it was necessary to attach additional information
to each hunter education graduate record. The hunter education database included a CID, name, street
address, county of residence, gender, and date of birth field for each record. Multiple records were
missing county of residence information and needed to be manually provided by looking up zip code
locations. The date of birth field was used to calculate age of the hunter education graduate in 2007.
Age classes were then created and assigned to reflect typical life stages and model the age classes used
by Southwick Associates (2013). Southwick Associates (2013) assigned hunter education graduates into
one of four age classes: 10-15 years old; 16-24 years old; 25-35 years old; and 35 and older. For this
capstone project, five age classes were assigned: 10-15 years old (representing youth hunters in New
Jersey); 16-24 years old (typical age range of college students and/or military personnel with transient
lifestyles); 25-35 years old (career- and/or family-focused individuals); 36-55 years old (stable/mid-life
lifestyle); and 56 years and older (retirees and/or seniors). In addition, an “Education Number” field
9
contained a 12-digit number that coded for the facility location, date, and discipline of the hunter
education course the customer was enrolled in. By analyzing digits in the Education Number, a field was
added to the hunter education database to assign data for the month of the year that the hunter
education course was taken. Once the hunter education database and license sales tables were
imported into Microsoft Access and appended with additional fields, they were linked via the CID and
able to be cross-referenced for analysis.
2.2 Microsoft Access Analysis
2.2.1 Southwick Associates Overall Study
Many of the internship objectives related to identifying license purchase behaviors among
different segments of the population were accomplished by creating new tables and running queries in
Microsoft Access. As the author was requested to generate data in accordance with the Southwick
Associates (2013) study, the first step was to generate queries to mimic their overall study results and
append their existing tables to include New Jersey as an additional state in the Northeast region.
Queries were designed and run to address the following questions posed by Southwick Associates
(2013), with the exception that this research followed the six-year period of 2007-2012 instead of 2006-
2011:
-Percentage of graduates who purchased at least a single hunting license from 2007-2012
-Percentage change of 2007 graduates purchasing a hunting license through 2012
-Percent of total sales potential reached from 2007 to 2012, as 100% sales potential for a state
defined by every graduate purchasing a license in all six years
-Age class with largest decrease in renewal rates from 2007 to 2012
-Age class with largest percent that never purchased a license from 2007 to 2012
-Month of graduation with highest percent of graduates who did not purchase a license within
six years
Once the above queries were run in Microsoft Access and data generated for New Jersey, the “Overall
Study Results” tables reported by Southwick Associates (2013) were recreated in Microsoft Excel to
include New Jersey and new study averages were calculated.
10
2.2.2 Individual State Analysis for New Jersey
Southwick Associates (2013) also conducted more detailed analysis for each of the individual
states participating in the study. The author created additional queries and tables for New Jersey to
simulate the following 2007 data generated for each state:
-Hunter education graduates who purchased a license, by year
-License purchase frequency by hunter education graduates following certification
-Hunter education graduates, by age class
-License purchase frequency by hunter education graduates following certification, by age
class
-Change in the percent of hunter education graduates who bought licenses from 2007 to
2012, by age class
-Hunter education graduates by month of course completion
Once the above queries were run in Microsoft Access and data generated for New Jersey, the “Individual
State Results” tables and figures reported by Southwick Associates (2013) were reproduced in Microsoft
Excel to display New Jersey’s results.
As objectives for this internship included exploring a variety of factors that may affect license
purchase behavior, additional queries and tables were generated beyond the Southwick Associates
(2013) analysis to help identify recruitment and retention issues. The author designed the following
queries for the New Jersey 2007 graduate class that were not included in the Southwick Associates
(2013) analysis:
-Percentage of graduates who purchased at least a single hunting license from 2007 to 2012, by
county of residence
-Percentage of graduates who purchased at least a single hunting license from 2007 to 2012, by
age class
-Percentage of graduates who purchased at least a single hunting license from 2007 to 2012, by
gender
-Hunter education graduates, by gender
-Hunter education graduates, by age class and gender
-License purchase frequency by hunter education graduates following certification, by
gender
-Change in the percent of hunter education graduates who bought licenses from 2007 to
2012, by gender
11
-Hunter education graduates who purchased a license, by year and hunting discipline
Once the above queries were run in Microsoft Access and data generated for New Jersey, associated
tables and figures were created in Microsoft Excel to display New Jersey’s results. The above queries
were intended to help shed light on how factors such as age class, gender, month of hunter education
graduation, and hunting discipline may influence license purchase behavior. Once the queries were
designed, data for other years could easily be input to provide an up-to-date analysis of current
behaviors and trends.
2.3 GIS Analysis
In order to help identify further trends in license purchase behavior among different segments
of the population, the author incorporated a GIS component into the capstone research to explore a
selection of geographic and demographic factors. As the results of this capstone internship were
intended to help drive hunter recruitment and retention efforts for a state agency, only New Jersey
residents were considered in the geographic analysis. Therefore, records of graduates that did not
reside in New Jersey were eliminated from the hunter education graduate database for this portion of
the analysis. There were a total of 72 out-of-state hunter education graduates from Pennsylvania (30),
New York (29), Delaware (1), Massachusetts (2), Maryland (2), Virginia (2), Florida (4), and Colorado (2).
Once these records were deleted, the resulting table was imported into ArcMap 10.2. The records were
then geocoded by both zip code and street address using the World Geocode Service (ArcGIS Online)
Address Locator and saved as separate layers.
To determine if proximity to public hunting lands may contribute to license purchasing behavior,
the distance of each graduate’s residence to the nearest public hunting land needed to be calculated.
However, a GIS layer of public hunting lands in New Jersey needed to be created since one did not
previously exist. First, a listing of public deer hunting lands in New Jersey was obtained from the most
recent edition (August 2014) of NJDFW’s “Hunting and Trapping Digest”. Next, all listed tracts of
hunting land were selected from existing GIS layers of federal-owned and state-owned land in New
Jersey and combined to create a single GIS layer of public deer hunting lands. There were additional
county-owned lands that were open to hunting in New Jersey but as each county park system maintains
their own map of available hunting lands, it was beyond the scope of this internship to try to include
those areas as well. In addition, in some cases only special areas of federal-owned or state-owned lands
were open to public hunting but the entire tract was included since delineated boundaries of those
areas within the tracts were not currently available through GIS.
12
Once the GIS layer of public hunting lands was created, the “Near” geo-processing tool in
ArcMap 10.2 was utilized to determine the straight-line distance from each hunter education graduate’s
house to the nearest public hunting land. Although the straight-line distance underestimated the actual
travel distance by road, the author felt it still provided a useful estimate of proximity for the purposes of
this analysis. Categories were then created to represent distances to public hunting lands (0-5 miles, 5-
10 miles, 10-15 miles, and 15-22 miles) and each hunter education graduate was assigned into one of
the categories. Microsoft Access was then used to create and run queries to determine the percent of
graduates that bought a license in 2007 and the change in percent of 2007 hunter education graduates
who bought licenses from 2007 to 2012 by proximity to public hunting lands, as was previously
completed for age class and gender.
The next step in the GIS analysis was to explore whether demographics may influence license
purchasing behavior. The 2010 census data for New Jersey was downloaded from the United States
Census Bureau’s website (U.S. Census Bureau 2015), imported into ArcMap 10.2, and linked to the
hunter education graduate table using the zip code field. One record was eliminated from this analysis
because the census data fields were blank. In addition, 23 records had to be manually linked because
the zip code fields between the two tables did not match. To investigate whether ethnicity may
influence license purchases, the census data fields “DP0080001: Total” and “DP0080003: White” which
provided the total population and the number of white residents per zip code, respectively, were
selected. Categories were then created to represent the “% White” population for each zip code (0-
20%, 20-40%, 40-60%, 60-80%, and 80-100%) and assigned to each hunter education graduate.
Microsoft Access was then used to create and run queries to determine the percent of graduates that
bought a license in 2007, the change in percent of 2007 hunter education graduates who bought
licenses from 2007 to 2012, and the population of New Jersey broken down by the “% White” categories
for comparison to the composition of hunters.
The author also wanted to consider income as a potential factor affecting license purchase
behavior. The U.S. Census Bureau data for New Jersey did not include income information but did
provide data on housing tenure. The author decided to use the field “DP0220001: Population in owner-
occupied housing units” as a way of representing income under the assumption that higher rates of
owner-occupied housing (versus renter-occupied) translated to higher income. Categories were created
to represent the “% Owner-Occupied” for each zip code (0-20%, 20-40%, 40-60%, 60-80%, and 80-100%)
and assigned to each hunter education graduate. Microsoft Access was then used to create and run
queries to determine the percent of graduates that bought a license in 2007, the change in percent of

13
2007 hunter education graduates who bought licenses from 2007 to 2012, and the population of New
Jersey broken down by the “% Owner-Occupied” categories for comparison to the composition of
hunters.
The final element in the GIS analysis was to investigate whether the level of urbanization of a
graduate’s residence affected license purchasing. In order to classify urbanization levels, the 2012 Land
Use/Land Cover (LULC) GIS data set was obtained through the New Jersey Department of Environmental
Protection. The LULC layer was produced by visually interpreting color infrared photography captured in
the spring of 2012 and then classifying the images into various land use/land cover categories, such as
agriculture, barren land, forest, urban, water, or wetlands (New Jersey Department of Environmental
Protection 2015). Once the 2012 LULC was brought into ArcMap 10.2, all of the polygons labeled as
“urban” were selected from the data set and saved as a separate GIS layer. The polygons were then
dissolved to facilitate further geo-processing actions. Next, the dissolved urban LULC 2012 layer was
intersected with the 2010 Census Bureau zip code layer. The “Calculate Geometry” function was then
used to determine the sum of acres in each urban LULC polygon and each zip code. The urbanization
level was then calculated by determining the percent of each zip code’s total acreage labeled as urban
(Figure 1). Finally, the “Join Field” tool was used to link the Census Bureau layer containing the new
“percent urban” field to the hunter education graduate table via the zip code field (Figure 2). There
were 24 records that needed to be manually linked because the zip codes did not match between the
two files. Categories were then created and assigned to each hunter education graduate to represent
the “% Urban” of their resident zip code (0-20%, 20-40%, 40-60%, 60-80%, and 80-100%). Microsoft
Access was then used to create and run queries to determine the percent of graduates that bought a
license in 2007 and the change in percent of 2007 hunter education graduates who bought licenses from
2007 to 2012 by the “% Urban” categories.
2.4 Statistical Modeling
The third component in the data analysis was to employ statistical modeling to identify which
factors have greater influence on hunting license sales. All statistical analysis was performed pro bono
by graduate student consultants from Statistics in the Community (StatCom) at the University of Illinois
at Urbana-Champaign. An Excel file containing a record for each hunter education graduate with fields
for CID, county of residence, gender, hunting discipline, age class, and license purchase data for 2007
through 2012 was provided to StatCom. Similar to Gude et al. (2012), mark-recapture data formatting
was used in which a graduate was coded as 1 if at least one hunting license was purchased in a given
14
year and 0 if no hunting licenses were purchased (Williams et al. 2002). Personal data (name, address,
and date of birth) were removed from the file before sending to StatCom to maintain confidentiality of
graduates.
The statistical modeling was performed to investigate how gender, age class, and hunting
discipline influenced hunter purchase probability, hunter retention probability, and hunter recruitment
probability. For this analysis, if a graduate bought a license in a certain year, they were counted as a
“hunter purchase” case once; if up to w licenses were purchased by a graduate from 2007 to 2012, they
were then counted w times. A “hunter retention” case was defined as a graduate who bought a license
in two successive years (1→1) and a “hunter recruitment” case defined as a graduate who went from
not purchasing a license in a given year to purchasing at least one the following year (0→1) (StatCom,
personal communication).
The main statistical analysis tool used for this project was RStudio, although SAS was also used
to process data. Generalized linear models (GLMs) were used, which extend traditional linear regression
by allowing for non-normal and discrete response distributions. The event whether a graduate would
buy a license was a binary variable (0 or 1) following a binomial distribution with parameter p,
representing purchase probability, retention probability, or recruitment probability. The odds of buying
a license was represented by θ=p/(1-p), which is the ratio of the probability of buying a license (p) over
the probability of not buying a license (1-p). Accordingly, as θ increases, the probability of purchasing a
license increases. As is typical with GLMs, it was assumed that logit (p) = log (p/1-p) was a linear
combination of predictors such as gender, age class, and discipline:
logit (p)=log (p/1-p)=β0 + β1year + β2gender + β3ageclass + β4discipline + … + ε
The response is therefore no longer whether to purchase a license but the log odds of purchasing a
license (StatCom, personal communication).
2.4.1 Transition Model Analysis
A transition model code was developed and run in RStudio to explore the effects of various
factors on hunting license purchase probability, hunter retention probability, and hunter recruitment
probability. As its name implies, a transition model is a special generalized linear model that explains
correlation by allowing past values to influence subsequent observations (Appendix B). Logistic
regression and mixed linear regression were unsuitable for this study as they ignore the potential
correlation among responses of the same graduate and previous license purchases, respectively. Twelve
15
transition models were fitted to describe the influence of gender, age class, and hunting discipline, as
well as their combined effect, on each of the probabilities listed above (4 predictors x 3 responses).
Before running the models, baseline predictors had to be selected since the model results
indicate the odds of a probability being higher or lower than the baseline. For the transition models
used in this research, the baseline predictors were defined as males, the 25-35 age class, and the
Archery hunting discipline. For each model, the coefficient of factor(s) and odds of probability were
determined. A negative coefficient value indicated that the odds of the predictor decreased compared
to the baseline. For example, a coefficient of “-0.68594” for the purchase probability of the gender
female meant that the odds of females purchasing a hunting license decreased in comparison to the
baseline gender of males. More specifically, the baseline predictor could be interpreted as exponential
(-0.68594) = 0.503; the odds of purchase probability reduced 49.7% and therefore the purchase
probability for females was 49.7% less than males for the particular model (StatCom, personal
communication).
2.4.2 Association Model Analysis
An association analysis using a one-way ANOVA model was conducted to further explore factors
influencing hunter recruitment and retention (Appendix B). Using descriptive statistics analysis and the
transition information generated in RStudio, charts were created that displayed age class, discipline, and
gender as predictors for recruitment and retention probability. In addition, Tukey’s multiple
comparisons of means were conducted for recruitment and retention using age class and discipline with
a 95% family-wise confidence level in order to compare means of predictors (Appendix B).
16
CHAPTER 3: RESULTS
3.1 Microsoft Access Analysis
3.1.1 Southwick Associates Overall Study
The addition of New Jersey to the Southwick Associates (2013) results raised the average
percent of hunter education graduates from all 13 states that purchased at least one hunting license
over the six-year study period from 67.7% to 69.4%. New Jersey had the highest percent of graduates
(89.3%) who purchased at least one license in the six possible years while Virginia had the lowest
(43.0%) (Table 1).
Twelve of the 13 study states showed a loss of graduates purchasing a license at the end of six
years, with an overall study average of a 35.3% decline (Table 2). In New Jersey, 45.2% of 2007 hunter
education graduates had stopped purchasing a license by 2012. Given that only 89.3% of New Jersey
graduates bought at least one license within six years of graduation and a 45.2% decrease was
experienced among this group, only 49% of New Jersey graduates were buying licenses by 2012.
Although New Jersey’s rate is slightly higher than the Southwick Associates (2013) overall study average
of 45%, it still indicates a significant retention issue within the state.
The average total sales potential reached across all 13 states was 43.0% (Table 3). The results
reported for the original 12 states were “adjusted to account for years when younger graduates were
not required to have a license to hunt, and only include years when graduates were of age when a
license is required” (Southwick Associates 2013, p. 4). New Jersey reached 54.1% of its total sales
potential between 2007 and 2012 (Table 4). Although youth hunters in New Jersey do not have to
renew their license until the end of the year in which they turn 16, they still have the potential to buy a
rifle permit every year and were therefore included in this analysis.
For most of the participating states, the younger age classes were more likely to drop out of the
hunting population over the six-year study period (Table 5). Eight of the 13 states had the largest
decrease in renewal rates among 16-24 year olds. Two states showed the highest decrease among 25-
35 year olds while two other states’ highest decreases were among 10-15 year olds, including New
Jersey with a 58.8% decrease. As stated above however, New Jersey youth hunters are not required to
renew their license every year unless they are purchasing a separate rifle permit.1
1 Washington was unable to provide date of birth information for the Southwick Associates (2013) study and was therefore not included in this calculation.
17
As with the decrease in renewal rates discussed above, the younger age classes were more likely
to have never purchased a license over the six-year study period. Of the 12 states that provided date of
birth information, five had the highest percentage of never purchasing a license among 16-24 year olds,
three states were in the 10-15 age class, and two were in the 25-35 age class (Table 6). New Jersey
joined Vermont as the only two states that experienced the largest percent who never purchased a
license in the 35 and older age range; for the purposes of inclusion in the overall study results, the 35
and older age class data reported for New Jersey was the total of the 36-55 and 56 and older age
classes.
Spring and summer hunter education graduates were less likely to purchase a license within six
years (Table 7). Nine of the 12 states providing necessary data had the highest percent of graduates
who did not purchase a license occurring between March and June. In New Jersey, April was the month
of graduation from a hunter education class that showed the lowest license purchase rates. Only three
states showed lower license purchasing rates among the fall/winter hunter education graduates.
3.1.2 Individual State Analysis for New Jersey
The 2007 hunter education class in New Jersey consisted of a total of 3768 graduates. Within
the six-year study period, the year that held the highest percentage of graduates purchasing a license
was in 2007 with 80.4% (Table 8, Figure 3). In each of the subsequent five years, a percentage of 2007
graduates would not renew their license. The largest year-to-year decrease occurred between 2007 and
2008 with a 31.8% decline in hunters purchasing a license. In total, over the course of the six years, the
number of graduates who continued to purchase a license decreased 45.2%. This points to a significant
hunter retention issue as nearly half of the graduates were not purchasing a hunting license within six
years of completing a hunter education course.
Most New Jersey graduates did not buy a license each year. In fact, only 26.9% bought a license
in all six years after graduating (Table 9, Figure 4). From the hunter education class of 2007, 89.3%
purchased at least one license during the six year period from 2007 through 2012, a higher rate than any
of the 12 states from the Southwick Associates (2013) study. Of those who did purchase a license in
New Jersey, nearly a third of them (30.1%) purchased all six years. This rate was higher than graduates
who purchased a license at least once but less than six years over the same period.
The percentage of graduates who purchased at least a single hunting license from 2007 to 2012
was also calculated by county of residence in New Jersey and by out-of-state residence. Of the 3768
hunter education graduates in 2007, 3696 were New Jersey residents at the time. On average, 90.0% of
18
the in-state residents purchased at least one hunting license in the six year study period (Table 10). The
percentage for the 21 counties in New Jersey ranged from 74.8% in Bergen County to 95.1% in
Cumberland County. The three lowest ranking counties (Bergen, Union, and Hudson) are all located in
northeastern New Jersey in a heavily urbanized area close to New York City. These three counties
combined also contain less than 1% of the state-owned open space.
There were 72 graduates with out-of-state addresses from eight different states, ranging north
to New York and Massachusetts, south to Florida, and west to Colorado. The average percent of out-of-
state graduates who purchased at least a single hunting license was 52.8% (Table 11), indicating a clear
(and expected) decrease in license purchasing as compared to in-state residents.
The percentage of New Jersey hunter education graduates who purchased at least a single
license from 2007-2012 was also examined by age class and gender. There were only slight differences
among the age categories, with the 36 to 55 age class showing the lowest rate of purchase at 86.6% and
the 10 to 15 age class showing the highest rate at 93.0% (Table 12). Similarly, there was little variation
among the rates between gender classes, with 90.0% of males purchasing at least a single license versus
83.0% of females (Table 13).
Southwick Associates (2013) classified each state’s hunter education graduates by age class. For
New Jersey, the author calculated that the 10 to 15 year old age class represented the largest portion of
2007 graduates, with 1232 graduates or 32.7% (Table 14). This finding is consistent with 11 of the 12
states that provided age data to Southwick Associates. The lowest percentage of New Jersey graduates
(3.9%) was comprised of the 56 and older age class, with an average of 61.2 years for that age range.
The author also calculated the same data for New Jersey by gender, with 90.8% of graduates identified
as male and 9.2% as female (Table 15). Although a majority of male graduates was expected, the
magnitude of the difference between genders was surprising and indicates a serious recruitment issue
with women. When the 2007 New Jersey hunter education graduate class was broken down by both
age and gender, the 10 to 15 age range still represented the largest portion of graduates for both
genders, followed by the 36 to 55 age class (Table 16, Figure 5). For both males and females, the 56 and
older age class had the lowest proportion of graduates.
When license purchase frequency is examined by age class, most graduates purchased a license
between three and six years (Table 17). Only the 10 to 15 age class had the highest percentage of
graduates purchasing one or two years, but youth licenses in New Jersey are valid from the time of
purchase until the end of the calendar year in which the youth turns 16. Therefore, they may only need
to purchase a license one time within the six year period depending on their initial age. Youth hunters
19
were included in the analysis though because they have the potential to purchase a rifle hunting permit
each year. Otherwise, there was little variation to license purchase frequency among the different age
classes.
License purchase frequency by gender showed a greater amount of variation. Males had the
highest percentage of graduates purchasing licenses between three and six years (58.2%) while females
had the highest percentage purchasing only one to two years (47.6%), indicating a retention issue with
female hunters (Table 18). Females also showed a higher percentage of graduates never purchasing a
license (17.0%) as compared to males (10.1%). Among all of the graduates, 10.7% never purchased a
license, 33.2% purchased a license one to two years, and 56.1% purchased between three and six years.
The rate at which graduates continued to purchase a hunting license varied from a 31.5%
decline in the 36 to 55 age class to a 58.8% decline in the 10 to 15 age class (Table 19, Figure 6). Again,
youth hunters are not required to purchase a license every year until they reach the end of the calendar
year in which they turn 16. Omitting the youth hunters, the age class with the largest decline in license
purchases was 16 to 24 year olds representing a 46.1% decrease from 2007 to 2012. This could
potentially be explained by graduates in that age range going away to college or pursuing military
positions or careers out of state. Overall, 1368 graduates that purchased a license in 2007 were not
purchasing a license by 2012, representing a 45.2% decline. Therefore, nearly half of the graduates
dropped out of the hunting population by the end of six years.
As with license purchase frequency discussed above, the change in percent of 2007 graduates
who bought licenses through 2012 showed a greater amount of variation by gender. At the end of six
years, 43.0% of male hunters had stopped purchasing a license versus 68.1% of females (Table 20),
highlighting a major retention issue among women.
The change in percent of graduates who bought licenses from 2007 to 2012 was also examined
by hunting discipline. Trapping showed the greatest decline in hunters, with a 71.4% loss of graduates
purchasing a license at the end of the six year study period (Table 21, Figures 7 and 8). Firearms showed
a 62.4% decline while archery had a 61.8% decline. Both Archery and Firearms lost the greatest
percentage of graduates in 2008 (32.0% decline from 2007 for Archery and 38.1% decline from 2007 for
Firearms), the second year that graduates would be eligible to purchase a license. Trapping lost the
greatest percentage of graduates in 2009 (31.6%).
The month with the highest rate of graduation for New Jersey’s hunter education course was
November with 747 graduates, or 19.8% (Table 22, Figures 9 and 10). Nearly 70% of graduates
completed the hunter education course between August and November. July had the lowest enrollment
20
for hunter education classes, with only 29 graduates or 0.77% of the 2007 class. Spring graduates
(March through June) tended to be slightly older than summer or fall graduates (July through
November). Graduates who never purchased a license were more likely to graduate in the spring and
early summer months (March through July).
3.2 GIS Analysis
The GIS analysis studied the 3696 in-state graduates from the 2007 hunter education class and
did not include the 72 out-of-state graduates. Nearly three-quarters (72.0%) of the 2007 hunter
education graduates lived within five miles of federal- or state-owned public hunting land (Table 23).
Proximity to public hunting land did not seem to be a factor in license renewal rates since further
distance did not equate to higher dropout rates at the end of the six years. The highest dropout rate (a
52.2% decline from 2007-2012) was seen in graduates living 10-15 miles from public hunting land (Figure
11). Although graduates living 0-5 miles from public hunting lands had the lowest decline in license
purchases over the six years (43.9%), there was not a wide range of variation across the distance
categories. However, proximity to public hunting lands may have more of an impact on whether
graduates initially purchase a license in their first eligible year. Of the graduates living within 5 miles of
public hunting lands, 83.1% bought a license in 2007 compared to 68.2% of graduates living 15-22 miles
away (Figure 12).
Compared to the entire New Jersey population, a disproportionate number of 2007 hunter
education graduates lived in zip codes that were predominately of white ethnicity. Nearly 94% of the
2007 hunter education graduates lived in zip codes that were 60-80% or 80-100% white as compared to
only 70.9% of the New Jersey population (Table 24). There was no clear correlation between the “%
White” classification and license renewal rates. Graduates living in zip codes that were 0-20% white
showed the largest decline in renewal rates, with a 71.4% decline after six years (Figure 13). However,
the decline was a loss of only 5 hunters. Graduates living in zip codes that were classified as 80-100%
white showed a 45.3% decline in renewal rates, or a loss of 941 hunters by 2012. There was also no
clear pattern between the “% White” categories and whether graduates initially purchased a license in
2007. The range across all categories in the rate of graduates who bought a license in 2007 was 72.9%
(20-40% white) to 87.5% (0-20% white).
Similarly, a disproportionate number of 2007 hunter education graduates lived in zip codes that
were dominated by owner-occupied dwellings. Over 91% of 2007 hunter education graduates lived in
zip codes that were 60-80% or 80-100% owner-occupied housing as compared to only 69.5% of the New
21
Jersey population (Table 25). Graduates living in predominately owner-occupied housing zip codes
showed slightly higher initial license purchase rates and lower dropout rates than those in zip codes with
0-20% or 20-40% owner-occupied housing (Figure 13).
Hunters that lived in zip codes classified as 0-20% urban made up the highest percentage
(28.2%) of the 2007 hunter education graduating class (Table 26). There did not appear to be a
relationship between the level of urbanization of a graduate’s resident zip code and license renewal
rates. The range in the change of percent of graduates purchasing a license from 2007 to 2012 across all
urbanization levels was a 47.8% decrease to a 42.8% decrease, or only a difference of 5% (Figure 13).
Graduates living in less urbanized zip codes did show higher percentage rates of initially purchasing a
license in 2007 than those in more urbanized areas.
3.3 Statistical Modeling
3.3.1 Transition Model Analysis
Four models were fitted to explore the effects of various predictors on purchase probability,
with year and previous purchase values remaining constant. When compared to the baseline male
gender, the odds of purchase probability for females decreased by exp (-0.68594) = 0.503 times, or a
significant 49.7% reduction (Table 27). When compared to the baseline hunting discipline of Archery,
three of the other disciplines produced significant results (Table 28). The coefficient for the All-Around
discipline was -0.13559; therefore, the odds of purchase probability for the All-Around discipline
decreased by exp (-0.13559) = 0.837 times, or a 12.7% reduction. Similarly, the odds of purchase
probability for the Firearms discipline decreased by exp (-0.3844) = 0.681 times, or a 31.9% reduction.
Trapping significantly increased purchase probability, as shown by the odds of purchase probability
increasing by exp (1.05230) = 1.112, or an 11.2% growth. The changes of odds of purchase probability
for All-Around-Trap and Firearms-Trap were not significant. When compared to the baseline age class of
25 to 35 year olds, the 36 to 55 year old age class increased purchase probability the most and the 10 to
15 year old age class significantly decreased purchase probability the most (Table 29). The coefficient of
“ageclass10to15” was -0.93483; therefore, the odds of purchase probability for the 10 to 15 year old age
class decreased by exp (-0.93483) = 0.393, or a significant 60.7% reduction. However, as noted before,
youth hunters only have to purchase a license one time before the end of the calendar year in which
they turn 16. The odds of purchase probability for the 36 to 55 year old age class was exp (0.15787)
=1.171, or a 17.1% growth. The change of odds of purchase probability for the 56 and older age class
was not significant. When gender, age class, and hunting discipline were simultaneously considered in
22
the transition model for purchase probability, the 36 to 55 age class with Trapping increased purchase
probability the most and females with the 10 to 15 age class and Firearms significantly decreased
purchase probability the most (Table 30). The 16 to 24 age class also showed a significant reduction in
the odds of purchase probability as compared to the baseline. The changes of odds of purchase
probability for all other age classes and disciplines were not significant. The results of the fourth model
for purchase probability (combined predictors) are plotted in Figure 14.
Similarly, four models were fitted to explore the effects of the predictors on retention
probability, with year remaining constant. When compared to the baseline male gender, the odds of
retention probability for females decreased by exp (-0.69676) = 0.498 times, or a significant 50.2%
reduction (Table 31). When compared to the baseline hunting discipline of Archery, three of the other
disciplines again produced significant results (Table 32). The coefficient for the All-Around discipline was
-0.20840; therefore, the odds of retention probability for All-Around decreased by exp (-0.20840) =
0.812 times, or an 18.8% reduction. Similarly, the odds of retention probability for the Firearms
discipline decreased by exp (-0.41901) = 0.658 times, or a 34.2% reduction. Trapping significantly
increased retention probability, as shown by the odds of retention probability increasing by exp
(1.43589) = 4.203, or a 320.3% growth. The changes of odds of retention probability for All-Around-Trap
and Firearms-Trap were not significant. When compared to the baseline age class of 25 to 35 year olds,
the 36 to 55 year old age class increased retention probability the most and the 10 to 15 year old age
class significantly decreased retention probability the most (Table 33). The coefficient of
“ageclass10to15” was -1.60958; therefore, the odds of purchase probability for the 10 to 15 year old age
class decreased by exp (-1.60958) = 0.120, or a significant 88.0% reduction. However, as noted before,
youth hunters only have to purchase a license one time before the end of the calendar year in which
they turn 16; therefore, a youth hunter who does not purchase a license every year does not necessarily
represent a retention case. The 16 to 24 age class also showed a significant reduction in the odds of
retention probability as compared to the baseline. The odds of retention probability for the 36 to 55
year old age class was exp (0.28015) =1.323, or a 32.3% growth. The change of odds of retention
probability for the 56 and older age class was not significant. When gender, age class, and hunting
discipline were simultaneously considered in the transition model for retention probability, the 36 to 55
age class with Trapping increased retention probability the most and females with the 10 to 15 age class
and Firearms significantly decreased retention probability the most (Table 34). The 16 to 24 age class
also showed a significant reduction in the odds of retention probability as compared to the baseline.
The changes of odds of purchase probability for all other age classes and disciplines were not significant.
23
The results of the fourth model for retention probability (combined predictors) are plotted in Figure 15.
Figure 15 also shows that purchase probability was tightly correlated with purchasing a license the
previous year.
Additionally, four models were fitted to explore the effects of the predictors on recruitment
probability, with year and previous purchase values remaining constant. When compared to the
baseline male gender, the odds of recruitment probability for females decreased by exp (-0.62629) =
0.534 times, or a significant 46.6% reduction (Table 35). When compared to the baseline hunting
discipline of Archery, one of the other disciplines produced significant results (Table 36). The coefficient
for the Firearms discipline was -0.33811; therefore, the odds of recruitment probability for Firearms
decreased by exp (-0.33811) = 0.713 times, or a 28.7% reduction. The changes of odds of retention
probability for All-Around, All-Around-Trap, Firearms-Trap, and Trapping were not significant. When
compared to the baseline age class of 25 to 35 year olds, none of the other age classes produced
significant results (Table 37). Therefore, none of the age classes would significantly increase or decrease
the recruitment probability over the 25 to 35 year old age class. When gender, age class, and hunting
discipline were simultaneously considered in the transition model for recruitment probability, females
with the Firearms discipline significantly decreased recruitment probability (Table 38). The changes of
odds of recruitment probability for all age classes and other disciplines were not significant. The results
of the fourth model for recruitment probability (combined predictors) are plotted in Figure 16.
3.3.2 Association Model Analysis
Among both males and females, graduates in the 10 to 15 age class comprised the largest group
recruited into the hunting population (Figure 17), with recruitment defined as going from a status of not
purchasing a license in one year to purchasing a license the next year (0→1). Graduates in the 56 and
older age class had the lowest amount of recruits. Examining gender alone, males were much more
likely to be recruited than females (Figure 18). When looking at the influence of hunting discipline on
recruitment, the Firearms discipline had the greatest amount of graduates in recruitment status (Figure
19). However, Tukey’s multiple comparisons of means for hunting discipline on recruitment status
showed that the Firearms discipline was significantly less likely to enter recruitment status than the All-
Around, Archery, and Trapping disciplines using a 95% family-wise confidence level (p-value ≤ 0.05)
(Table 39). Although the 10 to 15 age class comprised the largest group of recruits (Figure 20), the only
significant difference among age classes was that the 36 to 55 age class was less likely to enter
24
recruitment status than the 10 to 15 age class (Table 40). All other age class comparisons were not
significant.
Results of the influence of gender and age class on retention status showed that both males and
females in the 36 to 55 age class were most likely to enter retention status, with retention defined as
purchasing a license in two consecutive years (1→1) (Figure 21). Examining gender alone, males were
much more likely to be in retention status than females (Figure 22). When looking at the influence of
hunting discipline on retention, the Firearms discipline had the greatest amount of graduates in
retention status (Figure 23). However, Tukey’s multiple comparisons of means for hunting discipline on
retention status showed that the Firearms discipline was significantly less likely to enter retention status
than the All-Around, Archery, and Trapping disciplines using a 95% family-wise confidence level (p-value
≤ 0.05) (Table 41). Additionally, Trapping was also more likely to enter retention status than the All-
Around and Archery disciplines. As noted above, 36 to 55 year olds comprised the age class with the
greatest retention (Figure 24) while 10 to 15 year olds had the lowest. Tukey’s multiple comparisons of
means for age class on retention status showed that the 10 to 15 age class was significantly less likely to
enter retention status than all other age classes (Table 42). However, since youth hunting licenses
remain valid until the end of the calendar year in which the hunter turns 16, they are not required to
purchase a license every year. Even if a youth hunter does not purchase a license in two consecutive
years, they may still be an active member of the hunting population and therefore do not conform to
the same retention definition as the other age classes. Tukey’s multiple comparisons of means also
showed that 16 to 24 year olds were significantly less likely to enter retention status than graduates in
the 25 to 35, 36 to 55, and 56 and older age classes. Additionally, the 25 to 35 age class was significantly
less likely to be of retention status than the 36 to 55 age class.
25
CHAPTER 4: DISCUSSION
As noted in Gude et al. (2012), declining trends in hunter participation nationwide have been
documented in recent publications (Enck et al. 2000, Peterson 2004). Although New Jersey ranked
above all of the states that participated in the Southwick Associates (2013) study for the percentage of
graduates who purchased at least a single hunting license within six years of completing a hunter
education course (Table 1), there is ample evidence to suggest a need for improving hunter recruitment
and retention efforts in the state. For example, by the end of the six-year study period, New Jersey had
lost nearly half of the graduates who had purchased a license in 2007 (Table 2) and achieved only 54.1%
of its total sales potential (Table 4).
The results indicate that efforts designed to have the greatest impact on license sales in New
Jersey should be focused on males. Males had higher purchase probabilities (Table 27), greater
retention rates (Table 31, Figure 22), and were more likely to be recruited into the hunting population
than females (Table 35, Figure 18). As males comprised nearly 91% of the 2007 hunter education
graduate class (Table 15), smaller changes in male parameters would have larger absolute impacts on
hunter participation than correspondingly larger changes in female parameters (Gude et al. 2012).
Interpretation of results related to age class trends must be made with caution. Although the
10-15 age class was shown to decrease purchase probability the most (Table 29), was the least likely to
be retained (Table 33), and showed the largest decrease in renewal rates (Table 19), it must be noted
that youth licenses are valid from the time of purchase until the end of the calendar year in which the
youth turns 16. Therefore, they are not required to purchase a license every year to remain in retention
status, leading to difficulty in drawing direct comparisons to the other age classes. Further study that
includes tracking youth graduates’ license purchases after they have turned 16 could help identify any
changes in trends once hunters are required to purchase a license annually. However, youth hunters in
possession of a rifle while hunting or trapping must purchase a rifle permit annually and were therefore
included in the analysis as having the potential to purchase a license yearly. Although the 36-55 age
class contained the largest percentage of graduates that never purchased a license within the six-year
study period (Table 17), statistical analysis showed that they were most likely to increase purchase
probability (Table 29) and most likely to be retained (Table 33, Figure 24). Therefore, it may be
beneficial to focus intervention efforts on the 36-55 age class to have the greatest impact on license
sales. Although reasons for declines in age classes can only be speculated in the absence of follow-up
surveys, hunters in the 16-24 age class are likely more transient as they enroll in college, join the
military, or engage in other pursuits after high school. NJDFW currently has no way of tracking whether
26
graduates move out of state unless they are directly notified. Similarly, graduates in the 56 and older
age class may find that although they have more free time after retirement, a potential loss of steady
income and/or health issues brought on by progressing age may impede participation in hunting.
Statistical analysis indicated that the Firearms discipline would decrease purchase probability
the most (Table 28), was the least likely to be recruited (Tables 36 and 39), and least likely to be retained
(Tables 32 and 41). However, as with the trends in gender noted above, the Firearms discipline
contained the largest number of graduates and therefore smaller changes would likely lead to larger
impacts on hunter participation than correspondingly larger changes in other hunting disciplines.
Although Trapping showed the largest decline in renewal rates (Table 21), the percent change in license
purchases from 2007 to 2012 was similar across all disciplines. Additionally, statistical results indicated
that Trapping would increase purchase probability the most (Table 28) and was the discipline most likely
to enter retention status (Table 32). Ethical trapping requires an in-depth knowledge of equipment and
animal behavior and is a traditional pastime for many families. For these reasons, trappers may be more
likely to renew licenses once initially devoting efforts to learning the trade.
Proximity to public hunting lands did not seem to be a factor for hunter retention, as the decline
in renewal rates was relatively consistent across all of the distance categories (Table 23, Figure 11).
However, results did indicate that graduates that lived farthest from public hunting lands were least
likely to initially purchase a license in 2007. As nearly two-thirds of the graduates lived within 0-5 miles
of public hunting lands, access to places to hunt does not seem to be an issue for most graduates.
However, for the small percentage of graduates that live 15-22 miles away from federal- or state-owned
hunting lands, the distance may be enough of a deterrent to recruiting new hunters.
Similarly, urbanization level did not seem to be a factor for hunter retention, as the decline in
renewal rates was relatively consistent across all of the urbanization levels (Table 26, Figure 13).
However, similar to the trend noted above, graduates that lived in more heavily urbanized zip codes
were less likely to initially purchase a license in 2007. Additionally, hunters living in zip codes classified
as 0-20% urban comprised the largest group of graduates, indicating that New Jersey’s hunting
population tends to live in more rural areas that are in close proximity to hunting lands. The three
counties that had the lowest percentage of graduates purchasing at least a single hunting license from
2007 to 2012 (Table 10) are heavily urbanized counties in close proximity to New York City. These three
counties combined contain less than 1% of New Jersey’s state-owned open space.
As noted in the Results section, a disproportionate number of 2007 hunter education graduates
lived in zip codes that were dominated by owner-occupied dwellings as compared to the New Jersey
27
population at large (Table 25). Additionally, graduates living in predominately owner-occupied housing
zip codes showed slightly higher initial license purchase rates and lower dropout rates than those in zip
codes with 0-20% or 20-40% owner-occupied housing (Figure 13). By loosely associating home
ownership with higher incomes, results indicate that New Jersey’s 2007 hunter education class is largely
comprised of higher income residents that are more likely to have extraneous income to purchase
hunting equipment and annual licenses. These results are consistent with Southwick Associates (2013),
which also reported that graduates living in urban centers dominated by apartments had the highest
percent decrease in renewal rates in the majority of study states. Aside from representing income,
home ownership may be more amenable to hunting as it likely offers more storage space for hunting
stands, gun safes, and other hunting equipment. In addition, renters may be more wary to store guns or
butcher harvested game in a communal setting.
There were no clear trends between ethnicity, license renewal rates, and initial purchase
behavior. Although graduates living in zip codes that were 0-20% white showed the largest decline in
renewal rates, they only constituted 0.2% of the 2007 hunter education class (Table 24). Similar to
housing status discussed above, a disproportionate number of 2007 hunter education graduates lived in
zip codes that were predominately of white ethnicity as compared to the New Jersey population at
large. Nearly 94% of the 2007 hunter education graduates lived in zip codes that were 60-80% or 80-
100% white as compared to only 70.9% of the New Jersey population (Table 24). It is important to note
that the results generated in this analysis for “% Owner-Occupied” and “% White” queries were based
on U.S. Census Bureau data at the zip code level; specific data for these factors were not associated with
each hunter education graduate and therefore each graduate was assigned data based on the
characteristics of their zip code of residency.
Nearly 70% of graduates completed a hunter education course between August and November.
Graduates who never purchased a license were more likely to graduate in the spring and early summer
months (Table 22). Therefore, NJDFW staff time and resources should be focused on late summer/fall
classes. As fall classes also had the highest rates of walk-in attendees, efforts should be made to ensure
that all participants pre-register for hunter education classes online. Walk-in participants are currently
not entered into the hunter education database and are therefore not accounted for until they are
entered into the ALS system at a licensing agent. Because walk-in students are rarely turned away from
a class, hunter education classes often exceed capacity which makes preparing materials ahead of time
difficult and exacerbates group management issues.
28
Taking all of the above factors into account, New Jersey’s hunting population is comprised
mostly of white males living in less urbanized areas with higher incomes and deviates from the typical
composition of New Jersey’s population. If NJDFW is solely interested in increasing license sales,
focusing recruitment and retention efforts on white males in the 36-55 age class in rural areas of the
state would most heavily impact revenue with the least amount of effort.
Although increasing revenue was the driving force behind this internship, the results have
highlighted a separate issue that should be addressed by NJDFW. Focusing recruitment and retention
efforts on segments of the population that would have the greatest impact on license sales may
subsequently alienate subsets of hunters that are already underrepresented. For example, it would be
remiss to ignore efforts focused on increasing hunting participation among females. Female hunters
“may provide a strong voice for the future of hunting, not only through their individual participation but
also by serving as role models, hunting advocates, and social support with a range of influences
potentially larger than male counterparts” (Gude et al. 2012, p. 477). Therefore, although elevating
female hunter participation may have little influence on license revenue, it could have important social,
political, and cultural impacts.
Creating a more diverse and inclusive hunter population should be an equally important
objective for NJDFW, albeit one requiring a different approach than efforts dedicated to boosting
financial profits. Diversifying New Jersey’s hunting population would require targeting recruitment and
retention efforts at women, minorities, and low-income residents in urban areas. Broadening the base
of support for hunting activities could help a wide range of residents establish a valuable connection to
wildlife and potentially increase overall funding for wildlife conservation. Introducing typically
underrepresented segments of the population to hunting could also lead to an expanded constituency
of outdoor enthusiasts and help foster environmental stewardship in generations to come.
Therefore, in addition to efforts focused on increasing retention among the white male hunter
base, NJDFW should be looking ahead and developing strategies to recruit a diverse constituency of
hunters in the state. Pursuing this latter objective will require different strategies and allocation of
resources. NJDFW personnel will need to evaluate whether these two distinct objectives are best
pursued simultaneously or consecutively based on available funding, staff, and resources. Hopefully the
data generated from this internship will help guide NJDFW in their decision-making.
29
CHAPTER 5: RECOMMENDATIONS
Increasing revenue generated by hunting license sales in New Jersey is dependent on increasing
hunter participation in the state. Although hunter education classes are often filled to or above
capacity, many graduates are not recruited into the hunting population or retained as hunters over
multiple years. The methodology used in this analysis could serve as a foundation for more effective
monitoring and evaluation of recruitment and retention programs. The following is a list of
recommendations for NJDFW to help increase hunter participation in New Jersey:
Replicate this analysis every six years to monitor changes in trends and evaluate intervention
efforts. The Microsoft Access component of the methodology could be replicated fairly simply
with updated data given that queries and table structures have already been designed.
Continue to monitor youth graduates’ license purchase behavior after they turn 16 to identify
any changes that occur once they are required to purchase an annual license
Determine priority of objectives (increasing license sales versus expanding hunter constituency)
to help target appropriate segments of the population for recruitment and retention efforts
Eliminate or minimize walk-ins to hunter education classes by requiring pre-registration via
NJDFW’s website
Focus staff time and resources on conducting late summer/fall hunter education classes
Communicate with other state agencies that have conducted similar analysis to design methods
that might work in multiple jurisdictions
Conduct follow-up surveys to identify reasons why graduates fail to purchase a license and/or
hunters fail to renew licenses
Expand public interest and support for hunting through public relations and social media
campaigns
Implement programs that offer opportunities for women and minorities to develop outdoor
skills and foster enthusiasm for hunting (for example, reinstate Becoming an Outdoorswoman)

30
CHAPTER 6: INTERNSHIP EVALUATION
The capstone internship with NJDFW has been an educational experience and fulfilling
conclusion to the University of Illinois’ online M.S. degree program in Natural Resources and
Environmental Sciences (NRES). Prior to enrolling at the University of Illinois, Urbana-Champaign (UIUC),
I had diligently researched and compared a variety of online graduate degree programs in the
environmental science field. The structure of UIUC’s program offered enough variety of relevant
courses to be able to work around a full-time career, as well as flexibility in non-thesis capstone options
that could potentially allow me to craft a final project that would both satisfy degree requirements and
contribute to my current work responsibilities with NJDFW. The capstone internship experience through
UIUC indeed provided me the opportunity to complete degree requirements while simultaneously
generating valuable data to help NJDFW increase hunter recruitment and retention and license sales.
This internship required me to draw upon and enhance various skills and knowledge that had
been accrued prior to the capstone experience. Much of the data processing for this project was
conducted by generating tables and running queries in Microsoft Access. Although I had previously
worked in Microsoft Access to build simple databases and link tables, the complexity of this project
exceeded my prior knowledge of Microsoft Access and required assistance from a co-worker to help
organize the data and create queries to answer my learning objectives. I subsequently learned that
most of my co-workers were not familiar with Microsoft Access at all or only had a basic understanding
of the program. Over the course of my 180-hour internship, I developed a deeper knowledge of
Microsoft Access that now allows me to analyze data in a more efficient and complex manner than could
be performed in Microsoft Excel, which seems to be the default application for data analysis within
NJDFW. I believe the knowledge gained from this internship will therefore give me an advantage over
other colleagues when opportunities arise that require complex data analysis and will also help in future
research projects with NJDFW.
I do not know if UIUC offers any sort of data analysis course that includes instruction in
Microsoft Access but I think that would have been helpful knowledge to have coming into this
internship. All of the Microsoft Access knowledge I have has been gained through self-instruction or via
assistance from a colleague. Although my ability to analyze data in Microsoft Access has increased
tremendously from my capstone project, there are still functionality features that I am unfamiliar with
and would like to master. As Microsoft Access is a powerful program for building and analyzing
relationships across data, I think it would be a worthwhile skill for students in the NRES program to learn
and a valuable addition to a data management course syllabus.
31
Similarly, I had previous experience using GIS to map data points and perform basic geo-
processing steps such as buffering and intersecting features. However, this capstone internship
required me to take a more holistic approach to GIS analysis in terms of determining my output needs
and developing a methodical multi-step plan to accomplish them. Topics discussed and exercises
performed in “NRES 454: GIS in Natural Resource Management” and “NRES 455: Advanced GIS for
Natural Resource Planning” proved valuable to my capstone GIS component, including projections,
model building, geo-referencing, and geodatabases.
The ability to utilize GIS is a valuable asset for a NJDFW employee, as many wildlife and habitat
management projects benefit from its applications. For instance, GIS is used by NJDFW to map
endangered species sightings, model potential endangered species habitat to help guide land use
regulatory decisions, track land use changes over time, target patrol areas for conservation officers,
create driving routes for fish and game stocking, and map boundaries of wildlife management areas.
Currently, NJDFW has two GIS Specialists that are dedicated to the Endangered and Nongame Species
Program and who assist other bureaus as needed, but a handful of other employees have basic GIS skills
and can perform simple mapping functions. I believe that this capstone project has elevated my GIS
abilities above most other NJDFW employees, with the exception of the GIS Specialists, and the addition
of more advanced GIS techniques to my skill set will help with future career advancement opportunities.
In addition, the map of public hunting lands in New Jersey that was created during this capstone
internship is a tangible product that could be used by NJDFW to promote hunting and inform the public
of access areas.
Although the statistical analysis for my capstone internship was performed by StatCom
consultants, “CPSC 440: Applied Statistical Methods” provided me with a strong foundational knowledge
of statistical techniques and terminology. Course topics including descriptive statistics, p-values, Tukey
multiple comparisons of means, and exercises in R software were beneficial when reviewing the report
provided by StatCom and helped me identify significant results. I had previously taken a Biostatistics
course as an undergraduate at Penn State University but the course failed to leave me with a clear
understanding of statistical applications and only served to fill me with dread when enrolling in CPSC
440. However, CPSC 440 provided hands-on applications of statistics presented in a simplified manner
and provided me with confidence in understanding statistical applications going into this capstone
internship. Without previously taking CPSC 440, I think it would have been much more difficult and
time-consuming to make sense of StatCom’s results and subsequently present them in an informed
manner.
32
Two other courses taken as part of UIUC’s online M.S. degree program in NRES that were
beneficial during my capstone internship were “NRES 502: Research Methods in NRES” and “NRES 499:
Fundamentals of Applied Ecology”, specifically the “Discussion” portion of NRES 499. Both classes
provided knowledge and experience in reading and evaluating scientific literature and citing references,
which were crucial during the literature review process of my capstone. NRES 499 provided hands-on
experience with creating and displaying tables and graphs with proper labels, which was incredibly
useful when compiling the “Figures and Tables” chapter of this paper. Also, the reflection paper
assignment in NRES 502 provided the foundation for the “Introduction” chapter of this paper, as well as
an initial approach to the methodology and progression of completing my capstone objectives.
As the idea for this capstone internship stemmed from a request from NJDFW for specific data, I
had the Southwick Associates (2013) report to act as a template and provide a starting point. As such, I
thought the internship experience would be fairly straight forward albeit tedious. However, fulfilling
UIUC’s graduate degree requirements mandated a more in-depth analysis to meet the key goals
inherent to each capstone project. When designing my capstone project and writing my Graduate
Internship Approval Form, I had to explore ways to expand NJDFW’s data request that would both be a
worthwhile use of my time to NJDFW and achieve the key capstone goals. The inclusion of a GIS
component to help identify potential geographic and demographic factors to license purchase behavior,
as well as the addition of a statistical modeling component, elevated the initial data request to a more
complex and comprehensive analysis of hunter recruitment, retention, and license purchase trends in
New Jersey. It has been an educational and rewarding process to take what initially seemed like a
simple data-crunching process and develop it into a multi-faceted investigation able to muster the
standards of academic rigor.
I hope the results of my capstone internship will be utilized by NJDFW to identify hunter
recruitment and retention issues and generate approaches to improve license sales in New Jersey. I
plan to present my results and recommendations to the Director of NJDFW, Assistant Directors, and
fellow staff in the Hunter Education Unit. In my experience with NJDFW, it can often be difficult to see
tangible results of long-term conservation projects. However, I feel that the information provided by
this capstone internship could lead to perceptible improvements in hunter recruitment and retention as
well as a noticeable increase in revenue from license sales.
33
REFERENCES
Brownie C., Anderson D.R., Burnham K.P. and Robson D.S. (1978) Statistical inference from band recovery data a handbook. U. S. Fish and Wildlife Service, Resource Publication 131. Washington, D. C., USA. Carpenter L. H. (2000) Ecology and management of large mammals in North America. Prentice Hall, Upper Saddle River, New Jersey, USA.
Conover M.R. (2001) Effect of hunting and trapping on wildlife damage. Wildlife Society Bulletin 29(2), 521-532. Côté S.D., Rooney T.P., Tremblay J.P., Dussault C. and Waller D.M. (2004) Ecological impacts of deer overabundance. Annual Review of Ecology, Evolution, and Systematics 35, 113-147.
Enck J.W., Decker D.J., and Brown T.L. (2000) Status of hunter recruitment and retention in the United States. Wildlife Society Bulletin 28, 817–824.
Gude J.A., Cunningham, J.A., Herbert J.T. and Baumeister T. (2012) Deer and elk hunter recruitment,
retention, and participation trends in Montana. The Journal of Wildlife Management 76(3), 471-479.
Kilpatrick H.J. and Walter W.D. (1999) A controlled archery deer hunt in a residential community: Cost, effectiveness, and deer recovery rates. Wildlife Society Bulletin 27(1), 115-123. Lincoln F.C. (1930) Calculating waterfowl abundance on the basis of banding returns. U.S. Department of Agriculture, Bur. Biol. Survey, Circ. No. 118.
Mangun W.R. and Shaw W.W. (1984) Alternative mechanisms for funding nongame wildlife conservation. Public Administration Review 44(5), 407-413. McCullough D.R. (1979) The George Reserve deer herd. University of Michigan Press, Ann Arbor, Michigan, USA.
Mehmood S., Zhang D. and Armstrong J. (2003) Factors associated with declining hunting license sales in
Alabama. Human Dimensions of Wildlife: An International Journal 8(4), 243-262.
New Jersey Department of Environmental Protection (2015) NJDEP 2007 Land Use/Land Cover Update.
Available from URL: http://www.nj.gov/dep/gis/lulc07shp.html
New Jersey Division of Fish & Wildlife (2015a) NJDEP Division of Fish & Wildlife - About Us. Available
from URL: http://www.njfishandwildlife.com/about.htm
New Jersey Division of Fish & Wildlife (2015b) NJDEP Division of Fish & Wildlife – Hunting in New Jersey.
Available from URL: http://www.njfishandwildlife.com/hunting.htm

34
New Jersey Division of Fish & Wildlife (2015c) NJDEP Division of Fish & Wildlife - White-tailed Deer in
New Jersey. Available from URL: http://www.njfishandwildlife.com/deer.htm
New Jersey Division of Fish & Wildlife (2015d) NJDEP Division of Fish & Wildlife - Trapping in New Jersey.
Available from URL: http://www.njfishandwildlife.com/trapping_info.htm
Peterson M.N. (2004) An approach for demonstrating the social legitimacy of hunting. Wildlife Society Bulletin 32(2), 310-321. Riley S. J., Decker D.J., Enck J.W., Curtis P.D., Lauber B. and Brown T.L. (2003) Deer populations up, hunter populations down: implications of interdependence of deer and hunter population dynamics on management. Ecoscience 10, 455–461. Schultz J.H., Millspaugh J.J., Zekor D.T. and Washburn B.E. (2003) Enhancing sport-hunting opportunities for urbanites. Wildlife Society Bulletin 31, 565–573. Southwick Associates. (2013) NSSF Report: Hunter education graduates’ proclivity to purchase a license. Available from URL: http://www.southwickassociates.com/portfolio-view/nssf-report-hunter-education-graduates-proclivity-to-purchase-a-license/ U.S. Census Bureau. (2015) 2010 Census Data. Available from URL: http://www.census.gov/2010census/data/ United States Department of the Interior, U.S. Fish and Wildlife Service, and U.S. Department of Commerce, U.S. Census Bureau. (2013) National Survey of Fishing, Hunting, and Wildlife-Associated Recreation. Available from URL: http://www.census.gov/prod/2013pubs/fhw11-nj.pdf
White G.C. and Bishop, C.J. (2010) A bountiful harvest for science: How conservation science benefits from the study of game species. The Wildlife Professional, Fall 2010.
Williams S. (2010) Wellspring of wildlife funding: How hunter and angler dollars fuel wildlife conservation. The Wildlife Professional, Fall 2010. Williams B.K., Nichols J.D., and Conroy M.J. (2002) Analysis and management of animal populations. Academic Press, San Diego, California, USA. Zinn H.C. (2003) Hunting and sociodemographic trends: older hunters from Pennsylvania and Colorado. Wildlife Society Bulletin 31, 1004–1014.
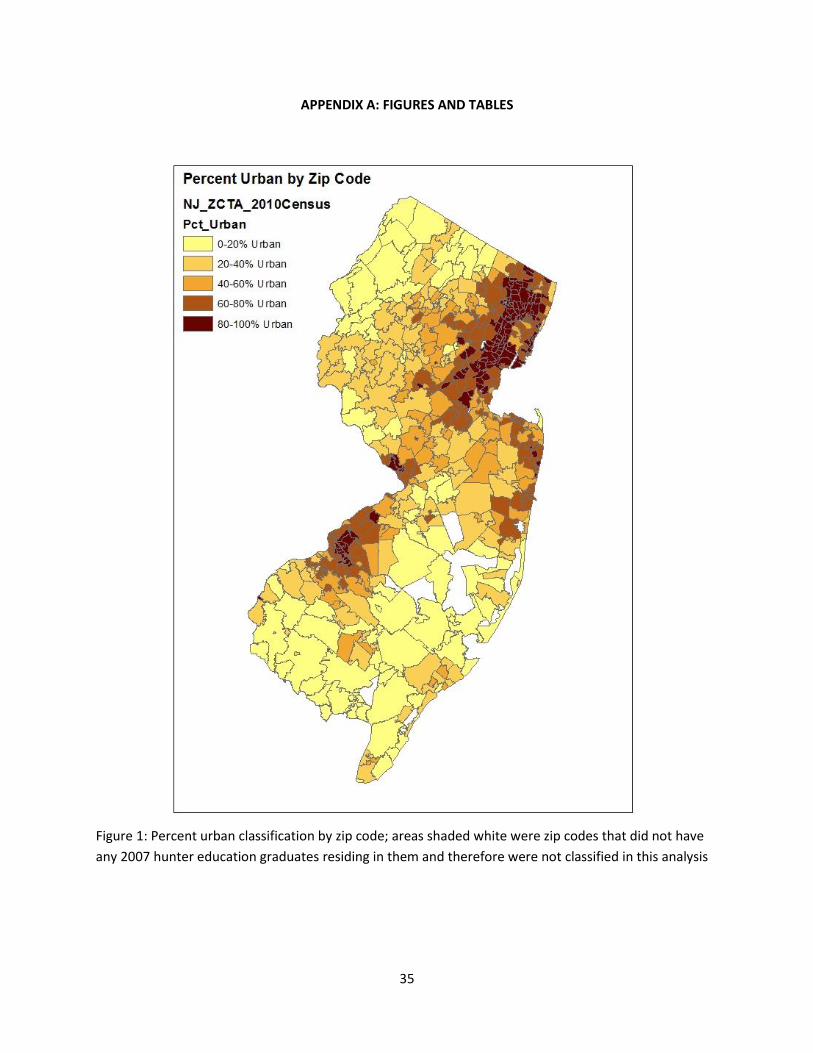
35
APPENDIX A: FIGURES AND TABLES
Figure 1: Percent urban classification by zip code; areas shaded white were zip codes that did not have
any 2007 hunter education graduates residing in them and therefore were not classified in this analysis
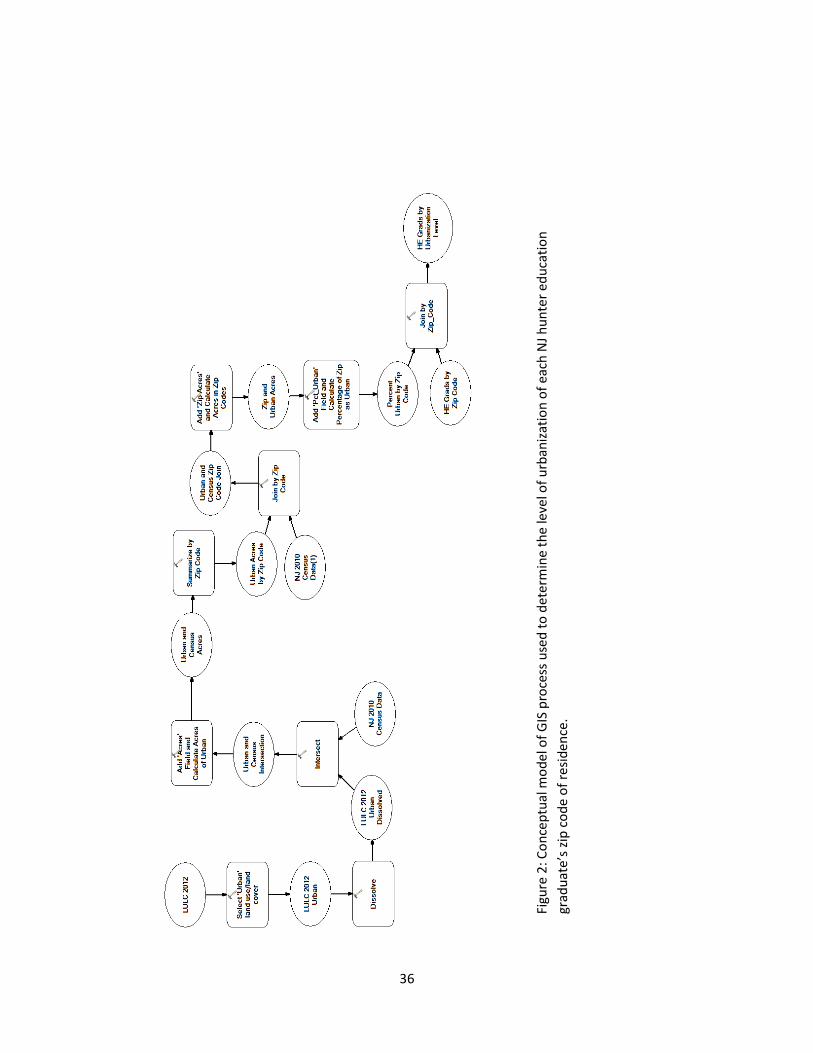
36
Figu
re 2
: Co
nce
ptu
al m
od
el o
f G
IS p
roce
ss u
sed
to
det
erm
ine
the
leve
l of
urb
aniz
atio
n o
f ea
ch N
J h
un
ter
edu
cati
on
grad
uat
e’s
zip
co
de
of
resi
den
ce.
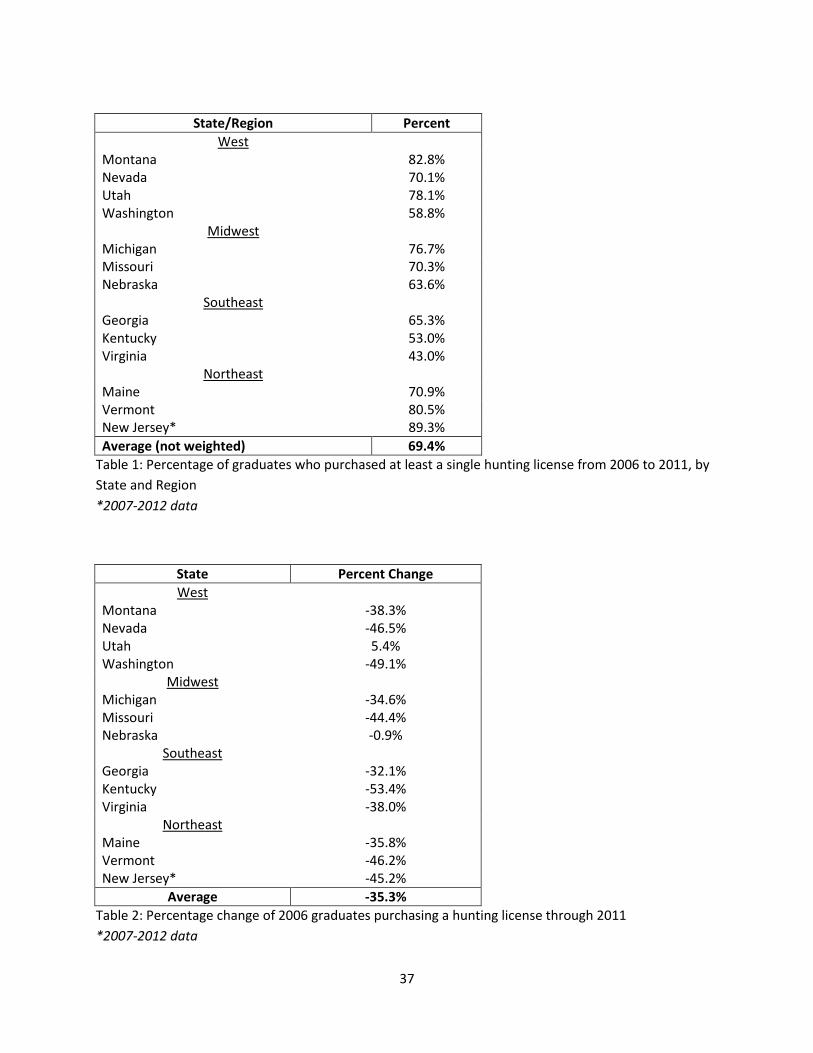
37
State/Region Percent
West Montana 82.8% Nevada 70.1% Utah 78.1% Washington 58.8%
Midwest Michigan 76.7% Missouri 70.3% Nebraska 63.6%
Southeast Georgia 65.3% Kentucky 53.0% Virginia 43.0%
Northeast Maine 70.9% Vermont 80.5% New Jersey* 89.3%
Average (not weighted) 69.4%
Table 1: Percentage of graduates who purchased at least a single hunting license from 2006 to 2011, by
State and Region
*2007-2012 data
State Percent Change
West Montana -38.3% Nevada -46.5% Utah 5.4% Washington -49.1%
Midwest Michigan -34.6% Missouri -44.4% Nebraska -0.9%
Southeast Georgia -32.1% Kentucky -53.4% Virginia -38.0%
Northeast Maine -35.8% Vermont -46.2% New Jersey* -45.2%
Average -35.3%
Table 2: Percentage change of 2006 graduates purchasing a hunting license through 2011
*2007-2012 data
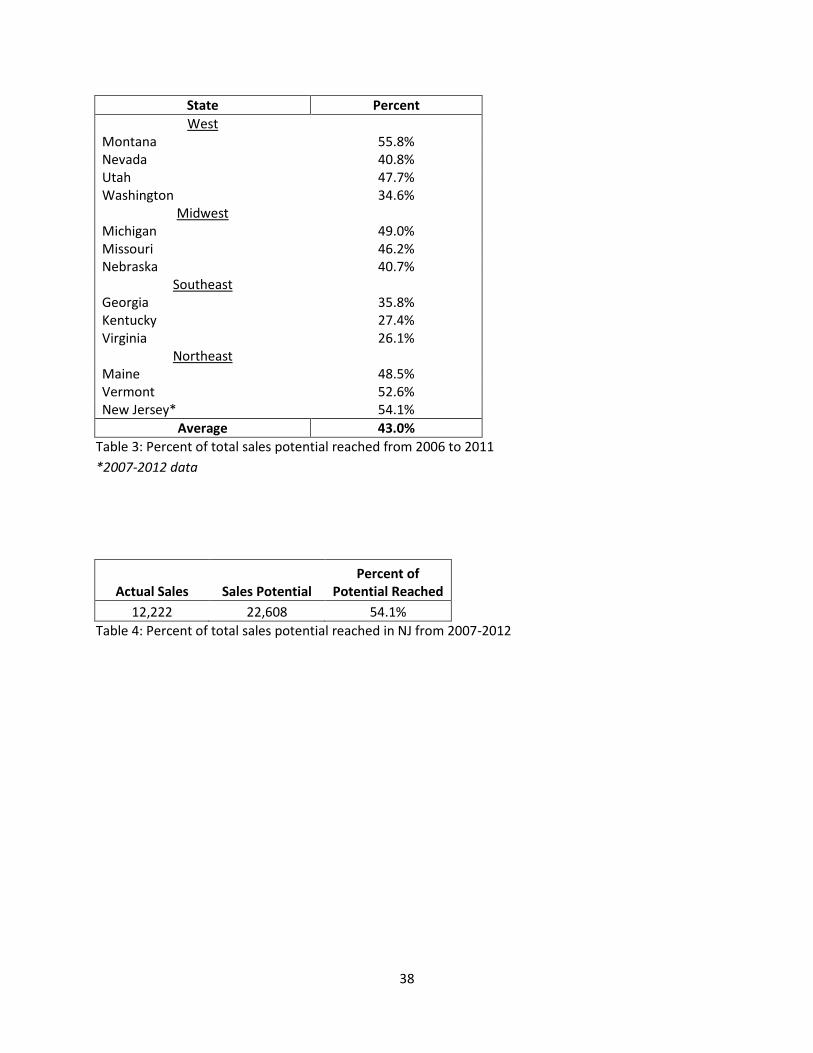
38
State Percent
West Montana 55.8% Nevada 40.8% Utah 47.7% Washington 34.6%
Midwest Michigan 49.0% Missouri 46.2% Nebraska 40.7%
Southeast Georgia 35.8% Kentucky 27.4% Virginia 26.1%
Northeast Maine 48.5% Vermont 52.6% New Jersey* 54.1%
Average 43.0%
Table 3: Percent of total sales potential reached from 2006 to 2011
*2007-2012 data
Actual Sales Sales Potential Percent of
Potential Reached
12,222 22,608 54.1%
Table 4: Percent of total sales potential reached in NJ from 2007-2012
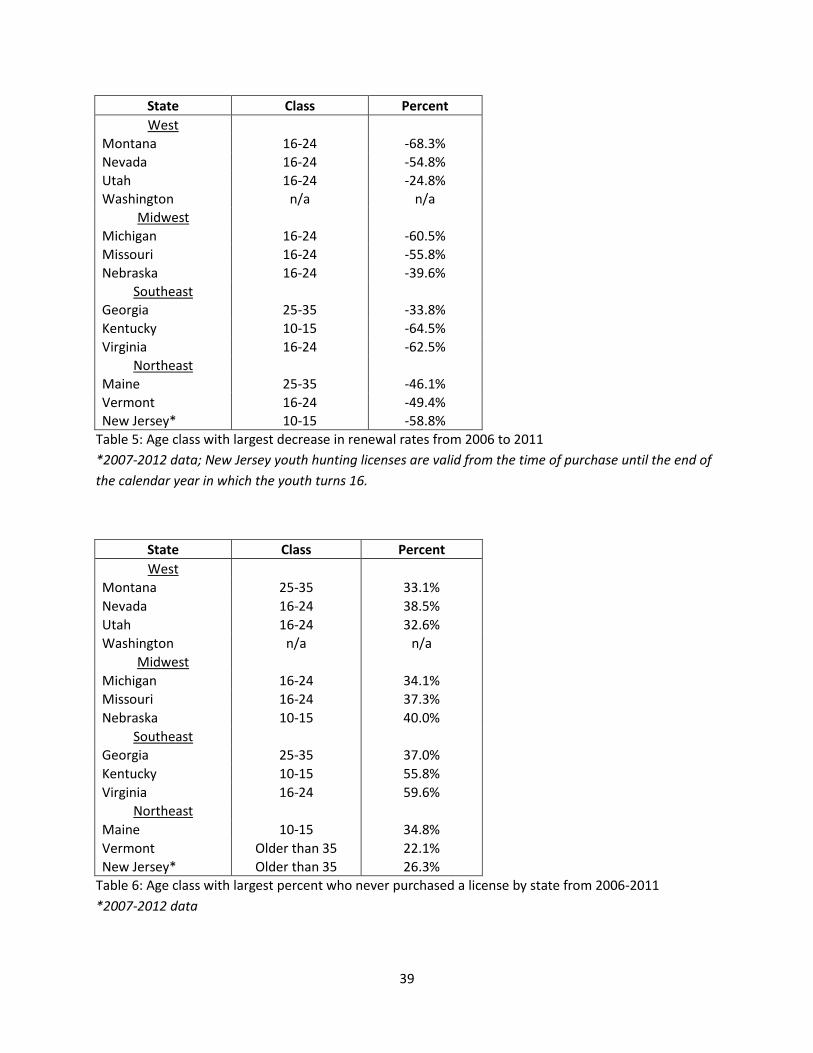
39
State Class Percent
West
Montana 16-24 -68.3%
Nevada 16-24 -54.8%
Utah 16-24 -24.8% Washington n/a n/a
Midwest
Michigan 16-24 -60.5%
Missouri 16-24 -55.8%
Nebraska 16-24 -39.6%
Southeast Georgia 25-35 -33.8%
Kentucky 10-15 -64.5%
Virginia 16-24 -62.5%
Northeast
Maine 25-35 -46.1%
Vermont 16-24 -49.4% New Jersey* 10-15 -58.8%
Table 5: Age class with largest decrease in renewal rates from 2006 to 2011
*2007-2012 data; New Jersey youth hunting licenses are valid from the time of purchase until the end of
the calendar year in which the youth turns 16.
State Class Percent
West
Montana 25-35 33.1%
Nevada 16-24 38.5%
Utah 16-24 32.6%
Washington n/a n/a
Midwest
Michigan 16-24 34.1%
Missouri 16-24 37.3%
Nebraska 10-15 40.0%
Southeast
Georgia 25-35 37.0%
Kentucky 10-15 55.8%
Virginia 16-24 59.6%
Northeast
Maine 10-15 34.8%
Vermont Older than 35 22.1%
New Jersey* Older than 35 26.3%
Table 6: Age class with largest percent who never purchased a license by state from 2006-2011
*2007-2012 data
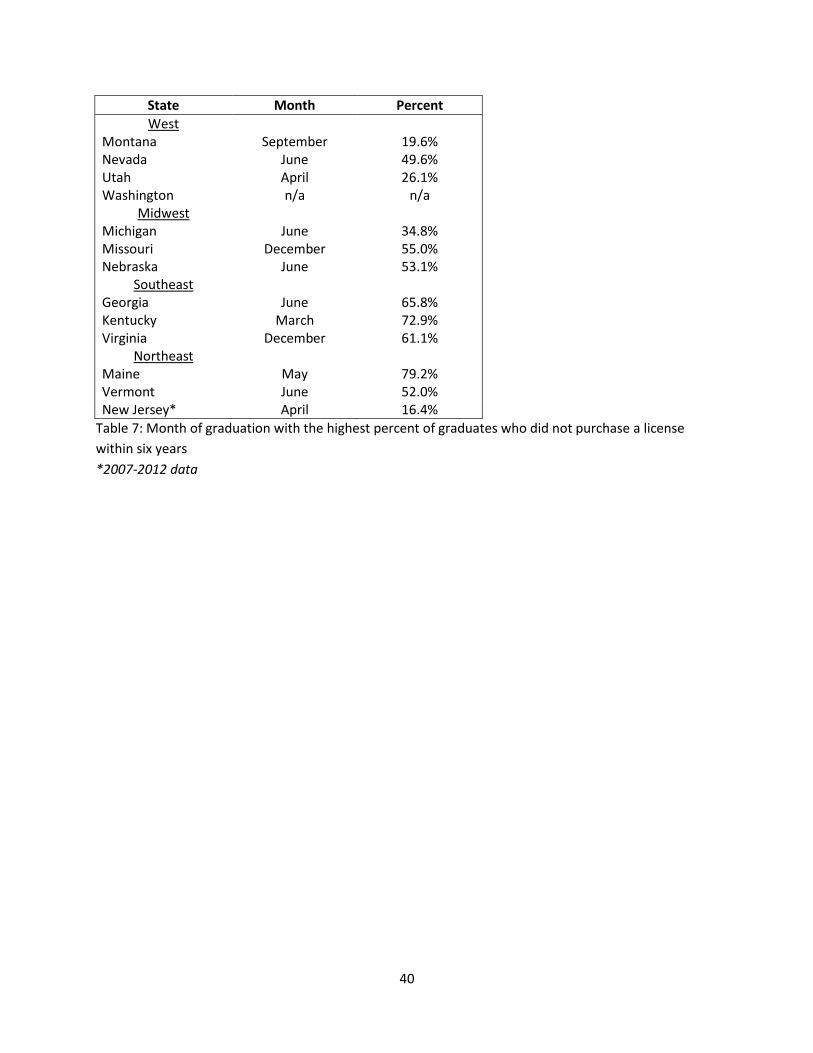
40
State Month Percent
West Montana September 19.6% Nevada June 49.6% Utah April 26.1% Washington n/a n/a
Midwest
Michigan June 34.8% Missouri December 55.0% Nebraska June 53.1%
Southeast
Georgia June 65.8% Kentucky March 72.9% Virginia December 61.1%
Northeast
Maine May 79.2% Vermont June 52.0% New Jersey* April 16.4%
Table 7: Month of graduation with the highest percent of graduates who did not purchase a license
within six years
*2007-2012 data
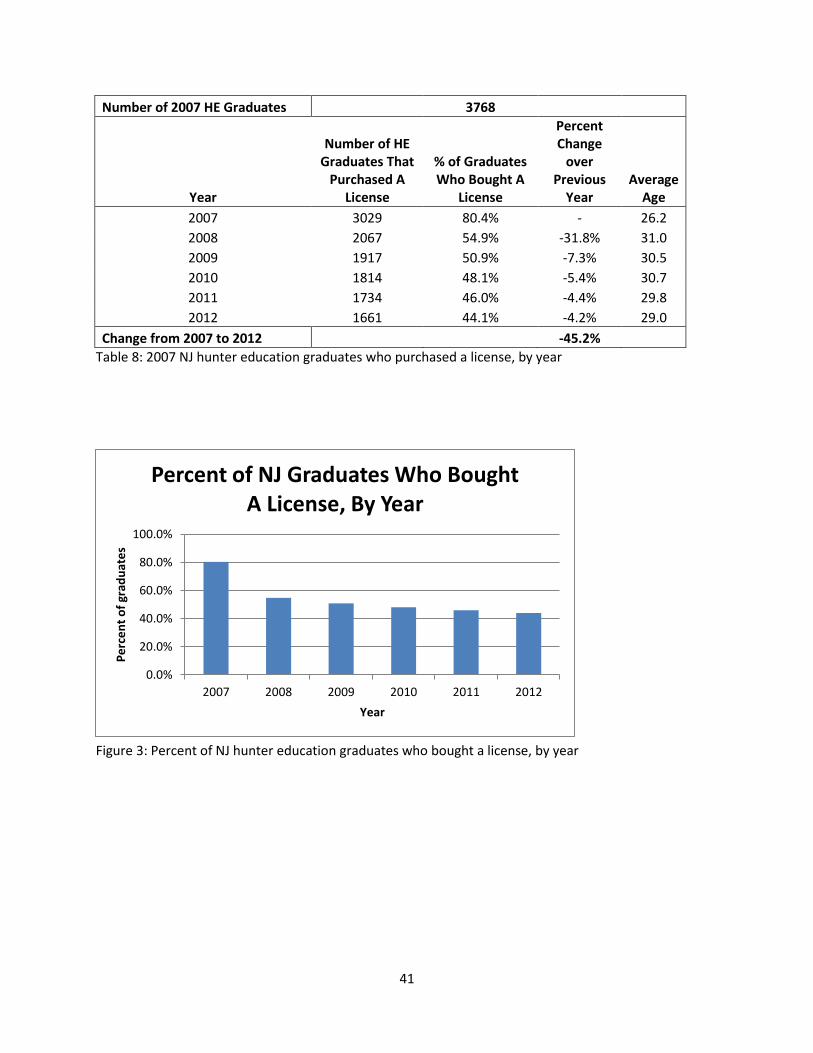
41
Number of 2007 HE Graduates 3768
Year
Number of HE Graduates That
Purchased A License
% of Graduates Who Bought A
License
Percent Change
over Previous
Year Average
Age
2007 3029 80.4% - 26.2
2008 2067 54.9% -31.8% 31.0
2009 1917 50.9% -7.3% 30.5
2010 1814 48.1% -5.4% 30.7
2011 1734 46.0% -4.4% 29.8
2012 1661 44.1% -4.2% 29.0
Change from 2007 to 2012 -45.2%
Table 8: 2007 NJ hunter education graduates who purchased a license, by year
Figure 3: Percent of NJ hunter education graduates who bought a license, by year
0.0%
20.0%
40.0%
60.0%
80.0%
100.0%
2007 2008 2009 2010 2011 2012
Pe
rce
nt
of
grad
uat
es
Year
Percent of NJ Graduates Who Bought A License, By Year
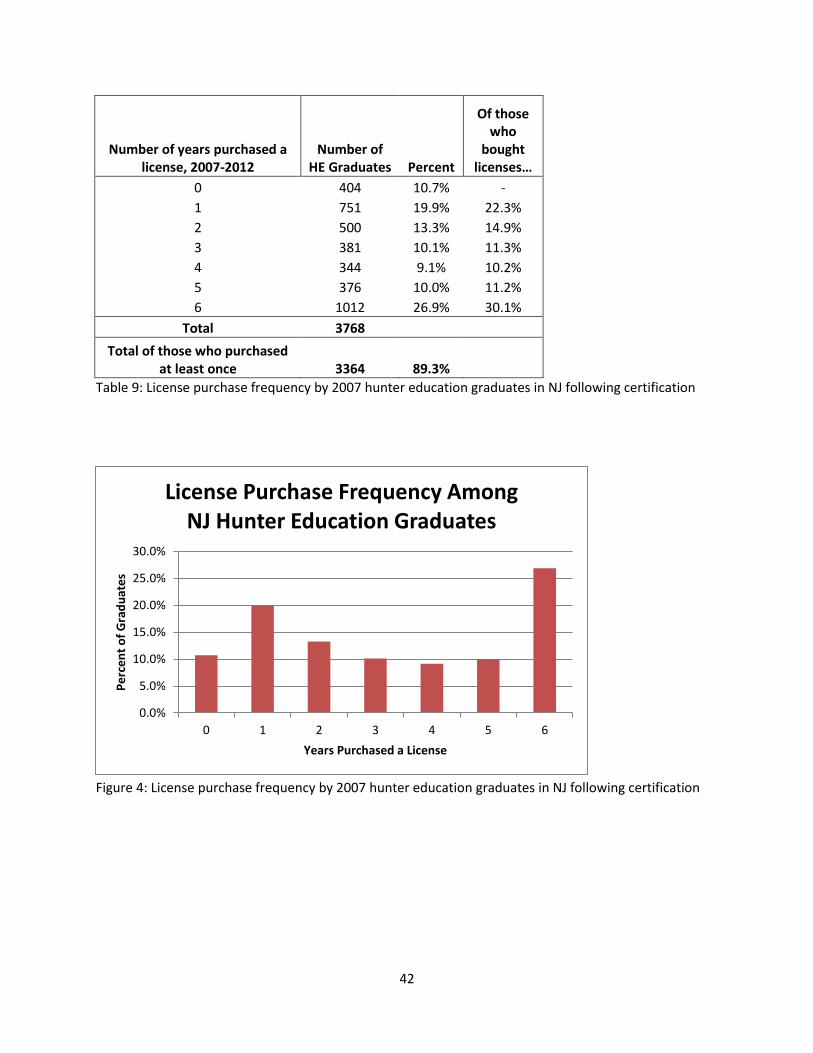
42
Number of years purchased a license, 2007-2012
Number of HE Graduates Percent
Of those who
bought licenses…
0 404 10.7% -
1 751 19.9% 22.3%
2 500 13.3% 14.9%
3 381 10.1% 11.3%
4 344 9.1% 10.2%
5 376 10.0% 11.2%
6 1012 26.9% 30.1%
Total 3768
Total of those who purchased at least once 3364 89.3%
Table 9: License purchase frequency by 2007 hunter education graduates in NJ following certification
Figure 4: License purchase frequency by 2007 hunter education graduates in NJ following certification
0.0%
5.0%
10.0%
15.0%
20.0%
25.0%
30.0%
0 1 2 3 4 5 6
Pe
rce
nt
of
Gra
du
ate
s
Years Purchased a License
License Purchase Frequency Among NJ Hunter Education Graduates
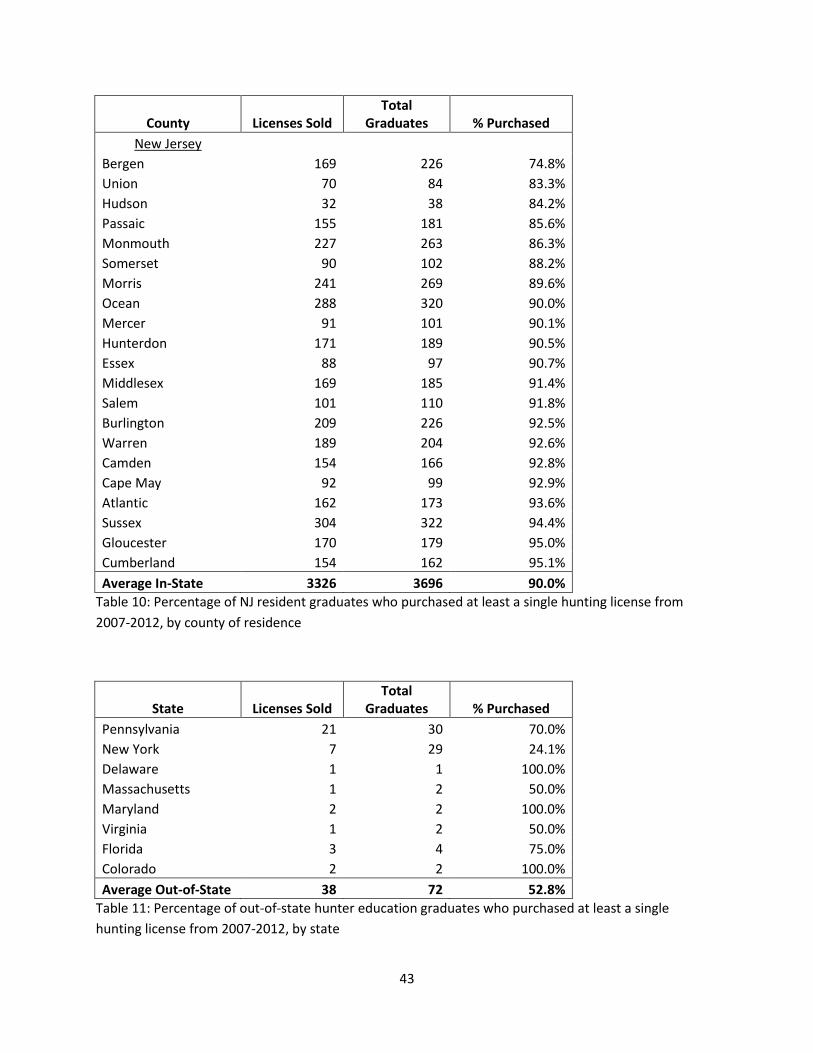
43
County Licenses Sold Total
Graduates % Purchased
New Jersey
Bergen 169 226 74.8%
Union 70 84 83.3%
Hudson 32 38 84.2%
Passaic 155 181 85.6%
Monmouth 227 263 86.3%
Somerset 90 102 88.2%
Morris 241 269 89.6%
Ocean 288 320 90.0%
Mercer 91 101 90.1%
Hunterdon 171 189 90.5%
Essex 88 97 90.7%
Middlesex 169 185 91.4%
Salem 101 110 91.8%
Burlington 209 226 92.5%
Warren 189 204 92.6%
Camden 154 166 92.8%
Cape May 92 99 92.9%
Atlantic 162 173 93.6%
Sussex 304 322 94.4%
Gloucester 170 179 95.0%
Cumberland 154 162 95.1%
Average In-State 3326 3696 90.0%
Table 10: Percentage of NJ resident graduates who purchased at least a single hunting license from
2007-2012, by county of residence
State Licenses Sold Total
Graduates % Purchased
Pennsylvania 21 30 70.0%
New York 7 29 24.1%
Delaware 1 1 100.0%
Massachusetts 1 2 50.0%
Maryland 2 2 100.0%
Virginia 1 2 50.0%
Florida 3 4 75.0%
Colorado 2 2 100.0%
Average Out-of-State 38 72 52.8%
Table 11: Percentage of out-of-state hunter education graduates who purchased at least a single
hunting license from 2007-2012, by state

44
AgeClass Percent
10 to 15 93.0%
16 to 24 88.5%
25 to 35 87.5%
36 to 55 86.6%
56 and older 87.1%
Table 12: Percentage of NJ graduates who purchased at least a single hunting license from 2007-2012,
by age class
Gender Percent
Male 90.0%
Female 83.0%
Table 13: Percentage of NJ graduates who purchased at least a single hunting license from 2007-2012,
by gender
Age Class Number of Graduates
Average Age %
10-15 1232 12.5 32.7%
16-24 794 19.3 21.1%
25-35 646 29.6 17.1%
36-55 949 43.9 25.2%
56 and older 147 61.2 3.9%
Total 3768 100.0%
Table 14: 2007 NJ hunter education graduates, by age class
Gender Number of Graduates %
Male 3421 90.8%
Female 347 9.2%
Total 3768 100.0%
Table 15: 2007 NJ hunter education graduates, by gender
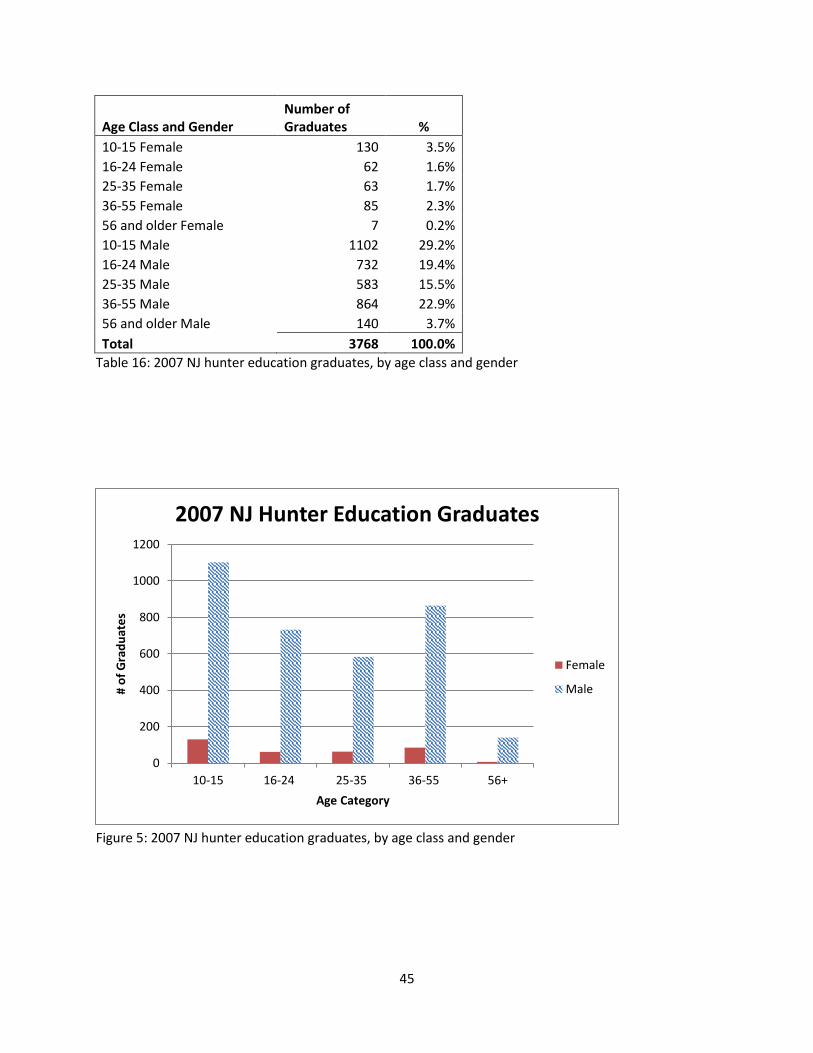
45
Age Class and Gender Number of Graduates %
10-15 Female 130 3.5%
16-24 Female 62 1.6%
25-35 Female 63 1.7%
36-55 Female 85 2.3%
56 and older Female 7 0.2%
10-15 Male 1102 29.2%
16-24 Male 732 19.4%
25-35 Male 583 15.5%
36-55 Male 864 22.9%
56 and older Male 140 3.7%
Total 3768 100.0%
Table 16: 2007 NJ hunter education graduates, by age class and gender
Figure 5: 2007 NJ hunter education graduates, by age class and gender
0
200
400
600
800
1000
1200
10-15 16-24 25-35 36-55 56+
# o
f G
rad
uat
es
Age Category
2007 NJ Hunter Education Graduates
Female
Male
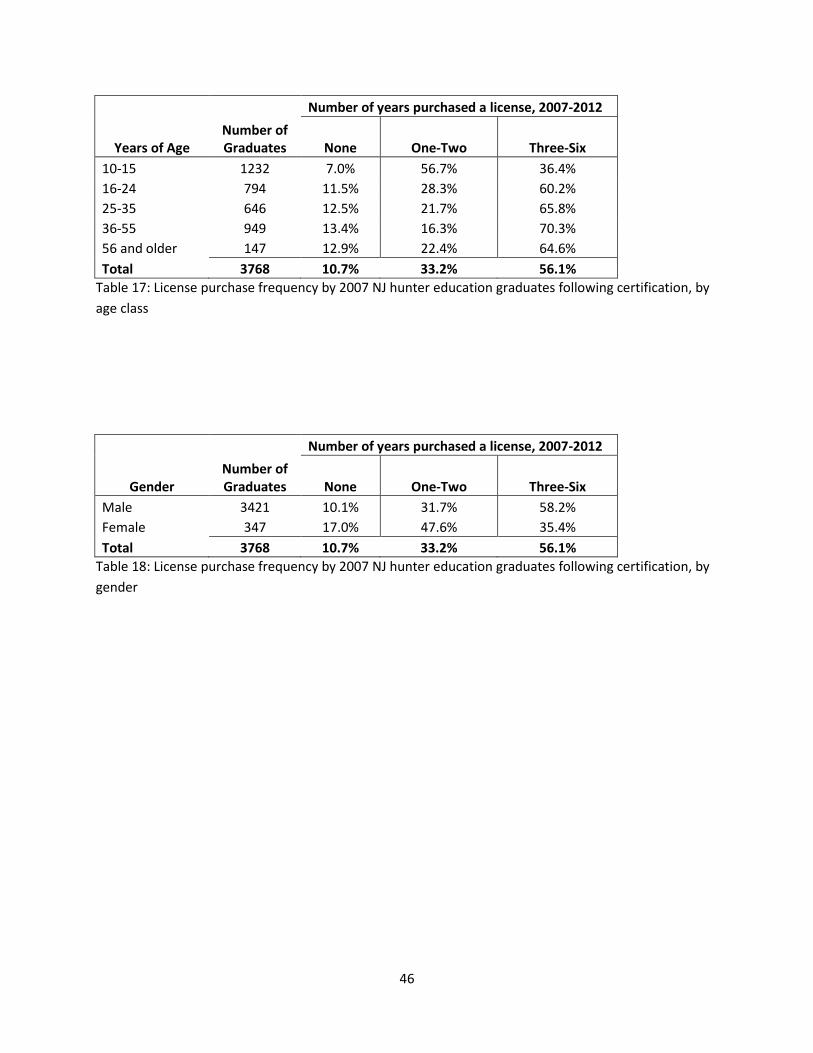
46
Number of years purchased a license, 2007-2012
Years of Age Number of Graduates None One-Two Three-Six
10-15 1232 7.0% 56.7% 36.4%
16-24 794 11.5% 28.3% 60.2%
25-35 646 12.5% 21.7% 65.8%
36-55 949 13.4% 16.3% 70.3%
56 and older 147 12.9% 22.4% 64.6%
Total 3768 10.7% 33.2% 56.1%
Table 17: License purchase frequency by 2007 NJ hunter education graduates following certification, by
age class
Number of years purchased a license, 2007-2012
Gender Number of Graduates None One-Two Three-Six
Male 3421 10.1% 31.7% 58.2%
Female 347 17.0% 47.6% 35.4%
Total 3768 10.7% 33.2% 56.1%
Table 18: License purchase frequency by 2007 NJ hunter education graduates following certification, by
gender
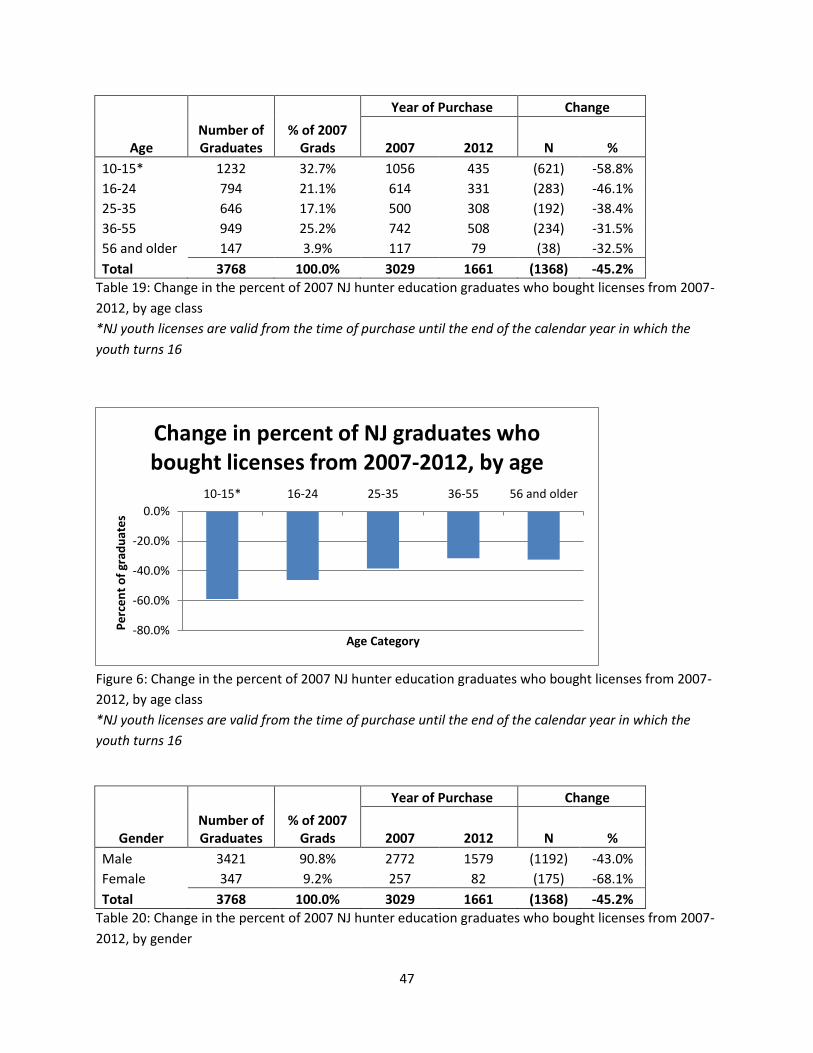
47
Year of Purchase Change
Age Number of Graduates
% of 2007 Grads 2007 2012 N %
10-15* 1232 32.7% 1056 435 (621) -58.8%
16-24 794 21.1% 614 331 (283) -46.1%
25-35 646 17.1% 500 308 (192) -38.4%
36-55 949 25.2% 742 508 (234) -31.5%
56 and older 147 3.9% 117 79 (38) -32.5%
Total 3768 100.0% 3029 1661 (1368) -45.2%
Table 19: Change in the percent of 2007 NJ hunter education graduates who bought licenses from 2007-
2012, by age class
*NJ youth licenses are valid from the time of purchase until the end of the calendar year in which the
youth turns 16
Figure 6: Change in the percent of 2007 NJ hunter education graduates who bought licenses from 2007-
2012, by age class
*NJ youth licenses are valid from the time of purchase until the end of the calendar year in which the
youth turns 16
Year of Purchase Change
Gender Number of Graduates
% of 2007 Grads 2007 2012 N %
Male 3421 90.8% 2772 1579 (1192) -43.0%
Female 347 9.2% 257 82 (175) -68.1%
Total 3768 100.0% 3029 1661 (1368) -45.2%
Table 20: Change in the percent of 2007 NJ hunter education graduates who bought licenses from 2007-
2012, by gender
-80.0%
-60.0%
-40.0%
-20.0%
0.0%
10-15* 16-24 25-35 36-55 56 and older
Pe
rce
nt
of
grad
uat
es
Age Category
Change in percent of NJ graduates who bought licenses from 2007-2012, by age
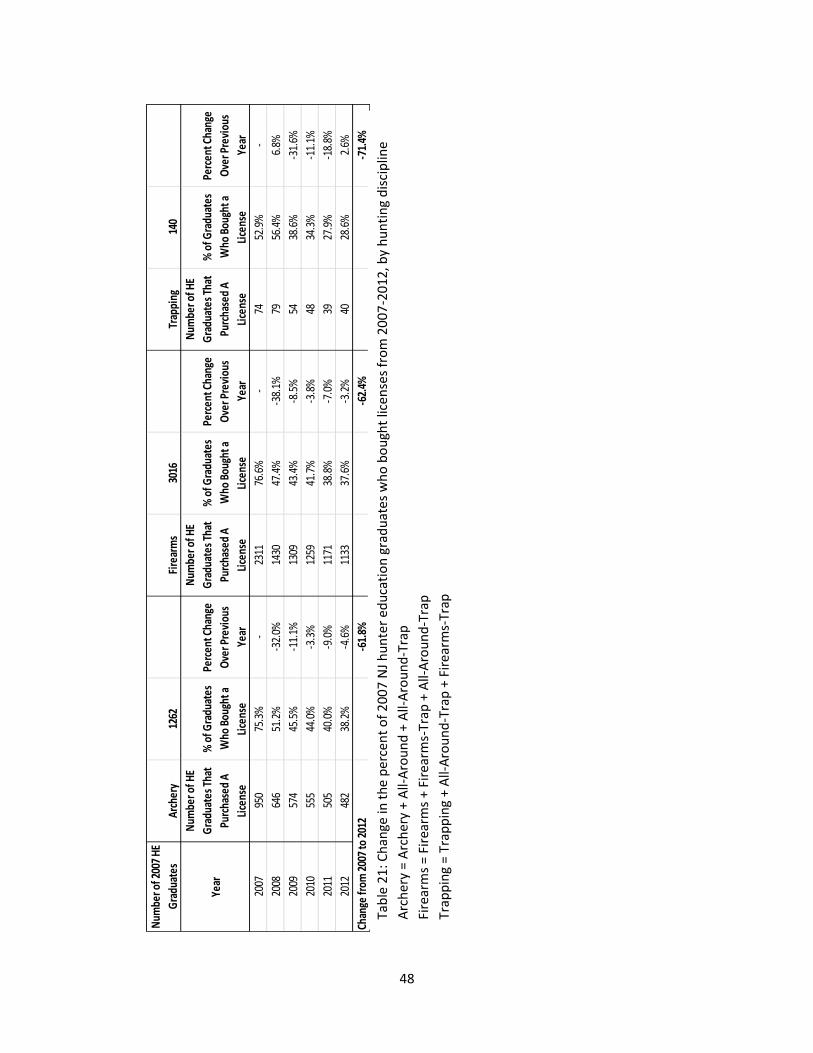
48
Num
ber o
f 200
7 HE
Gra
duat
esAr
cher
y12
62Fi
rear
ms
3016
Trap
ping
140
Year
Num
ber o
f HE
Gra
duat
es T
hat
Purc
hase
d A
Lice
nse
% o
f Gra
duat
es
Who
Bou
ght a
Lice
nse
Perc
ent C
hang
e
Ove
r Pre
viou
s
Year
Num
ber o
f HE
Gra
duat
es T
hat
Purc
hase
d A
Lice
nse
% o
f Gra
duat
es
Who
Bou
ght a
Lice
nse
Perc
ent C
hang
e
Ove
r Pre
viou
s
Year
Num
ber o
f HE
Gra
duat
es T
hat
Purc
hase
d A
Lice
nse
% o
f Gra
duat
es
Who
Bou
ght a
Lice
nse
Perc
ent C
hang
e
Ove
r Pre
viou
s
Year
2007
950
75.3
%-
2311
76.6
%-
7452
.9%
-
2008
646
51.2
%-3
2.0%
1430
47.4
%-3
8.1%
7956
.4%
6.8%
2009
574
45.5
%-1
1.1%
1309
43.4
%-8
.5%
5438
.6%
-31.
6%
2010
555
44.0
%-3
.3%
1259
41.7
%-3
.8%
4834
.3%
-11.
1%
2011
505
40.0
%-9
.0%
1171
38.8
%-7
.0%
3927
.9%
-18.
8%
2012
482
38.2
%-4
.6%
1133
37.6
%-3
.2%
4028
.6%
2.6%
Chan
ge fr
om 2
007
to 2
012
-61.
8%-6
2.4%
-71.
4%
Tab
le 2
1: C
han
ge in
th
e p
erce
nt
of
200
7 N
J h
un
ter
ed
uca
tio
n g
rad
uat
es w
ho
bo
ugh
t lic
ense
s fr
om
20
07
-20
12
, by
hu
nti
ng
dis
cip
line
Arc
her
y =
Arc
her
y +
All-
Aro
un
d +
All-
Aro
un
d-T
rap
Fire
arm
s =
Fir
earm
s +
Fir
earm
s-Tr
ap +
All-
Aro
un
d-T
rap
Trap
pin
g =
Trap
pin
g +
All-
Aro
un
d-T
rap
+ F
irea
rms-
Trap
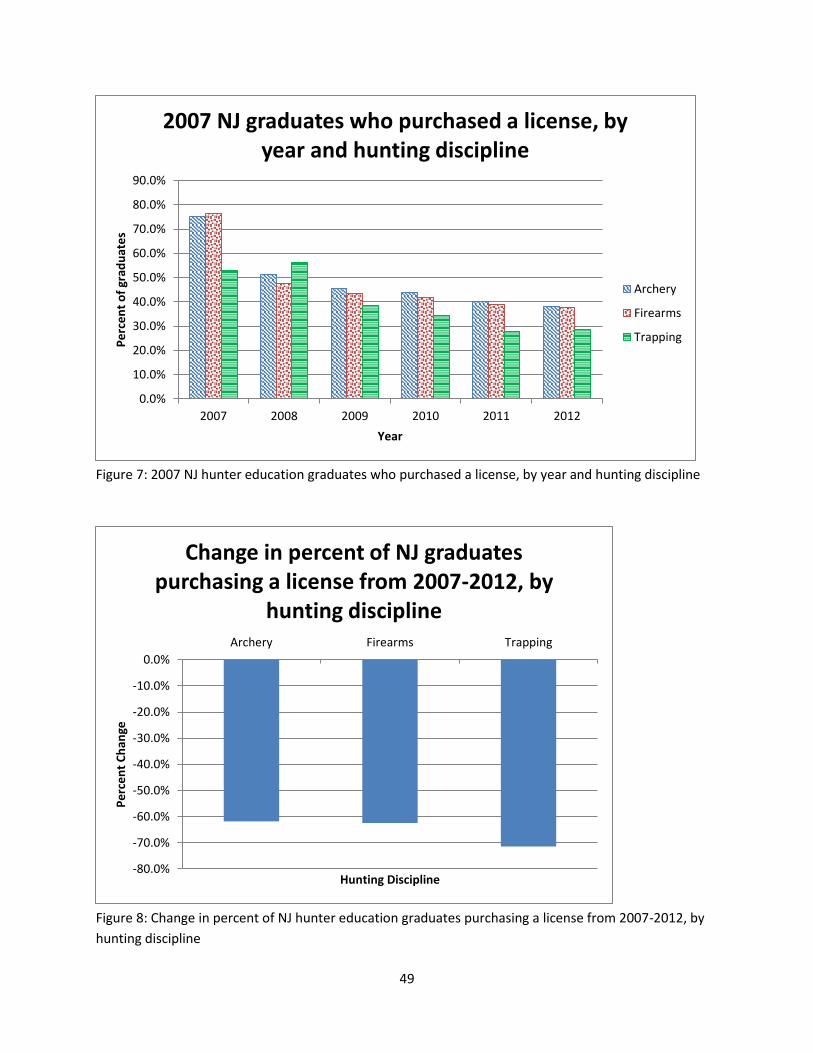
49
Figure 7: 2007 NJ hunter education graduates who purchased a license, by year and hunting discipline
Figure 8: Change in percent of NJ hunter education graduates purchasing a license from 2007-2012, by
hunting discipline
0.0%
10.0%
20.0%
30.0%
40.0%
50.0%
60.0%
70.0%
80.0%
90.0%
2007 2008 2009 2010 2011 2012
Pe
rce
nt
of
grad
uat
es
Year
2007 NJ graduates who purchased a license, by year and hunting discipline
Archery
Firearms
Trapping
-80.0%
-70.0%
-60.0%
-50.0%
-40.0%
-30.0%
-20.0%
-10.0%
0.0%
Archery Firearms Trapping
Pe
rce
nt
Ch
ange
Hunting Discipline
Change in percent of NJ graduates purchasing a license from 2007-2012, by
hunting discipline
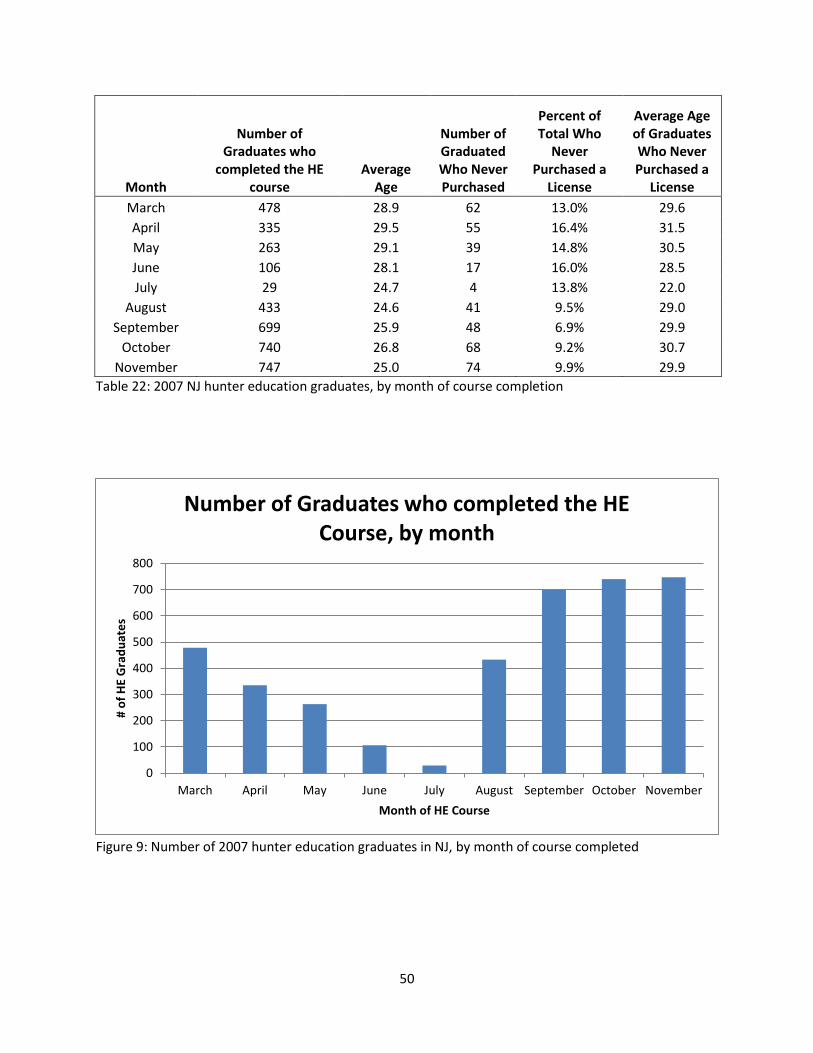
50
Month
Number of Graduates who
completed the HE course
Average Age
Number of Graduated Who Never Purchased
Percent of Total Who
Never Purchased a
License
Average Age of Graduates Who Never Purchased a
License
March 478 28.9 62 13.0% 29.6
April 335 29.5 55 16.4% 31.5
May 263 29.1 39 14.8% 30.5
June 106 28.1 17 16.0% 28.5
July 29 24.7 4 13.8% 22.0
August 433 24.6 41 9.5% 29.0
September 699 25.9 48 6.9% 29.9
October 740 26.8 68 9.2% 30.7
November 747 25.0 74 9.9% 29.9
Table 22: 2007 NJ hunter education graduates, by month of course completion
Figure 9: Number of 2007 hunter education graduates in NJ, by month of course completed
0
100
200
300
400
500
600
700
800
March April May June July August September October November
# o
f H
E G
rad
uat
es
Month of HE Course
Number of Graduates who completed the HE Course, by month
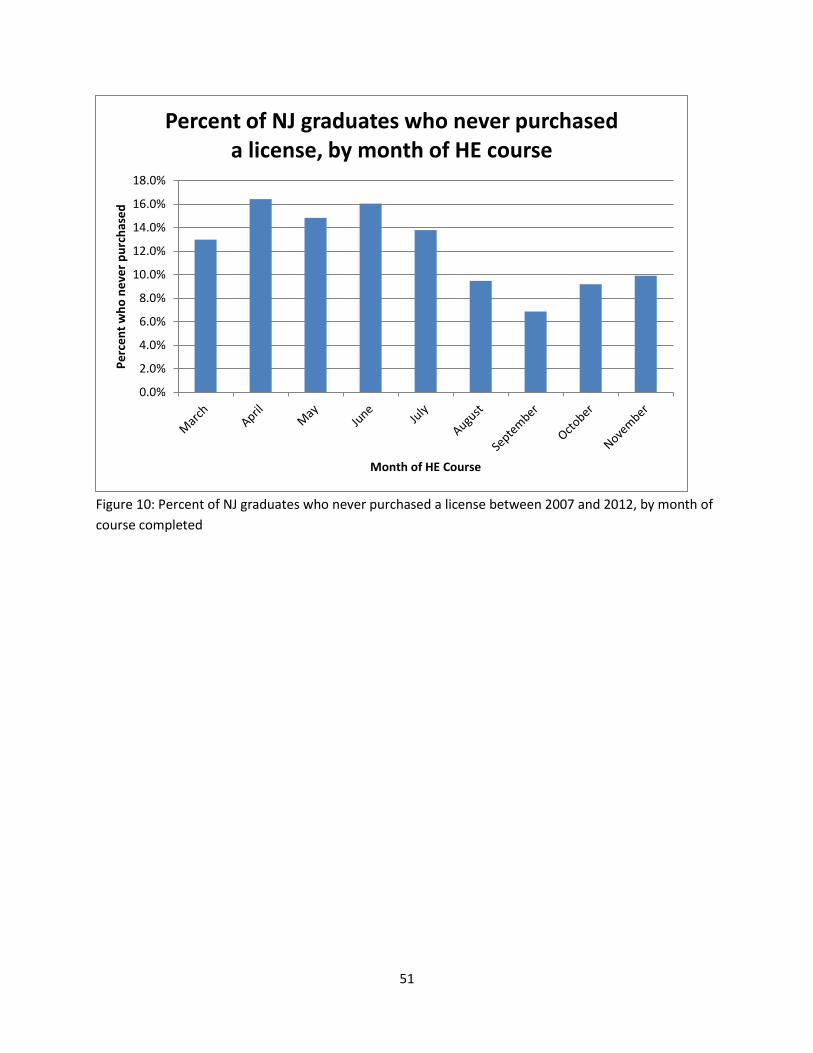
51
Figure 10: Percent of NJ graduates who never purchased a license between 2007 and 2012, by month of
course completed
0.0%
2.0%
4.0%
6.0%
8.0%
10.0%
12.0%
14.0%
16.0%
18.0%
Pe
rce
nt
wh
o n
eve
r p
urc
has
ed
Month of HE Course
Percent of NJ graduates who never purchased a license, by month of HE course
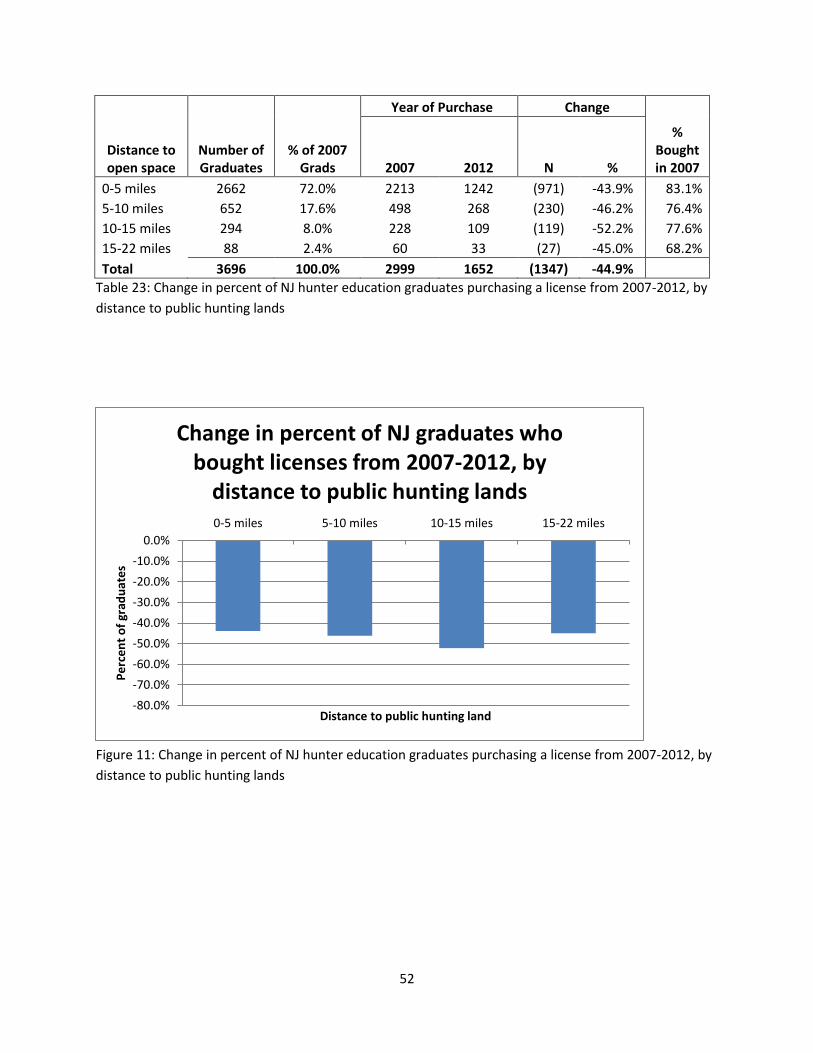
52
Year of Purchase Change
Distance to open space
Number of Graduates
% of 2007 Grads 2007 2012 N %
% Bought in 2007
0-5 miles 2662 72.0% 2213 1242 (971) -43.9% 83.1%
5-10 miles 652 17.6% 498 268 (230) -46.2% 76.4%
10-15 miles 294 8.0% 228 109 (119) -52.2% 77.6%
15-22 miles 88 2.4% 60 33 (27) -45.0% 68.2%
Total 3696 100.0% 2999 1652 (1347) -44.9%
Table 23: Change in percent of NJ hunter education graduates purchasing a license from 2007-2012, by
distance to public hunting lands
Figure 11: Change in percent of NJ hunter education graduates purchasing a license from 2007-2012, by
distance to public hunting lands
-80.0%
-70.0%
-60.0%
-50.0%
-40.0%
-30.0%
-20.0%
-10.0%
0.0%
0-5 miles 5-10 miles 10-15 miles 15-22 miles
Pe
rce
nt
of
grad
uat
es
Distance to public hunting land
Change in percent of NJ graduates who bought licenses from 2007-2012, by
distance to public hunting lands
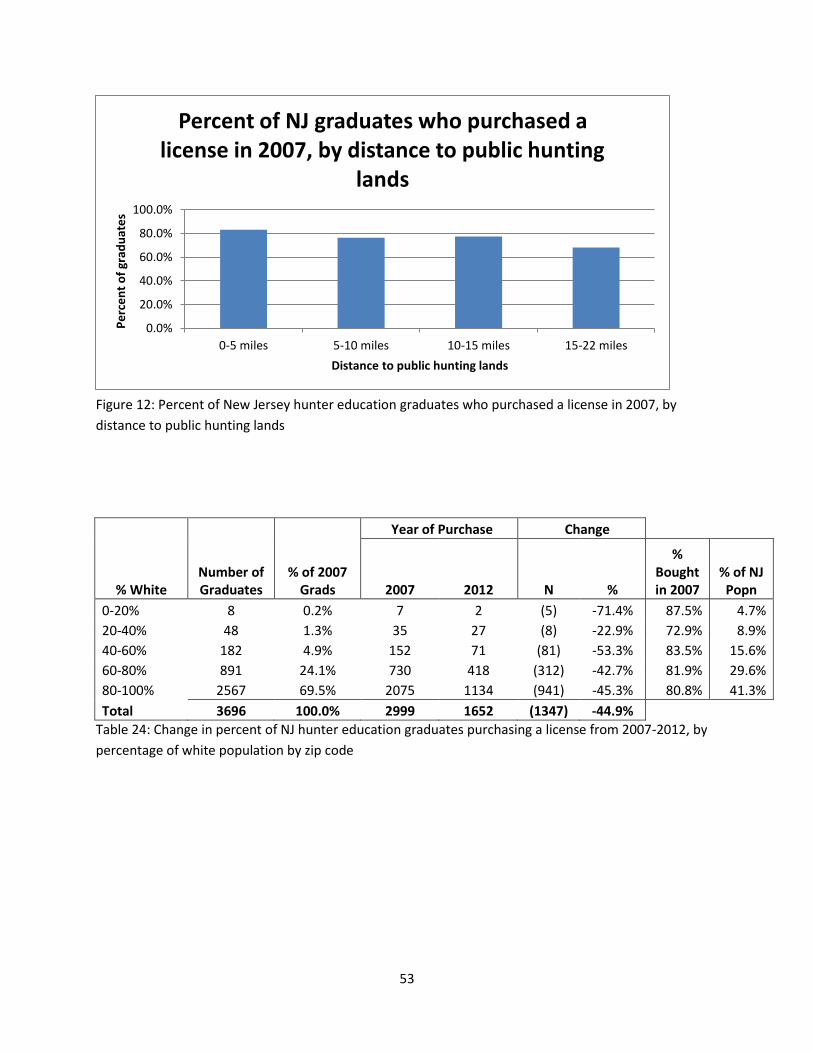
53
Figure 12: Percent of New Jersey hunter education graduates who purchased a license in 2007, by
distance to public hunting lands
Year of Purchase Change
% White Number of Graduates
% of 2007 Grads 2007 2012 N %
% Bought in 2007
% of NJ Popn
0-20% 8 0.2% 7 2 (5) -71.4% 87.5% 4.7%
20-40% 48 1.3% 35 27 (8) -22.9% 72.9% 8.9%
40-60% 182 4.9% 152 71 (81) -53.3% 83.5% 15.6%
60-80% 891 24.1% 730 418 (312) -42.7% 81.9% 29.6%
80-100% 2567 69.5% 2075 1134 (941) -45.3% 80.8% 41.3%
Total 3696 100.0% 2999 1652 (1347) -44.9% Table 24: Change in percent of NJ hunter education graduates purchasing a license from 2007-2012, by
percentage of white population by zip code
0.0%
20.0%
40.0%
60.0%
80.0%
100.0%
0-5 miles 5-10 miles 10-15 miles 15-22 miles
Pe
rce
nt
of
grad
uat
es
Distance to public hunting lands
Percent of NJ graduates who purchased a license in 2007, by distance to public hunting
lands
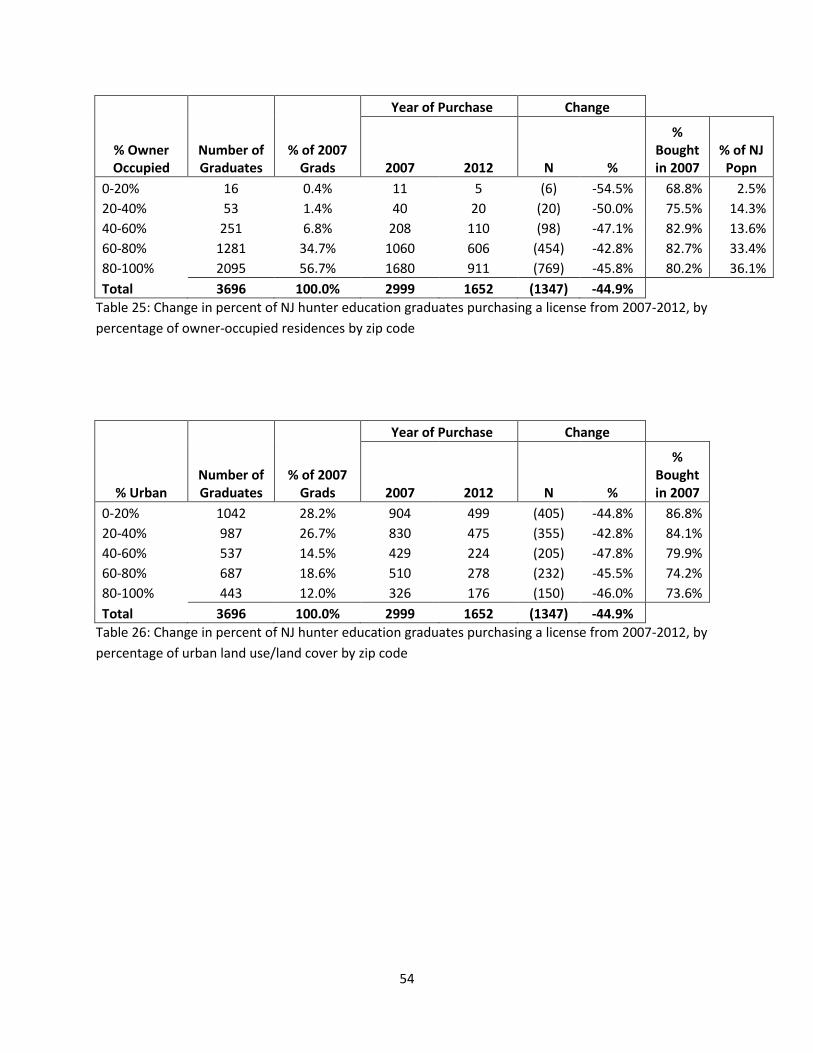
54
Year of Purchase Change
% Owner Occupied
Number of Graduates
% of 2007 Grads 2007 2012 N %
% Bought in 2007
% of NJ Popn
0-20% 16 0.4% 11 5 (6) -54.5% 68.8% 2.5%
20-40% 53 1.4% 40 20 (20) -50.0% 75.5% 14.3%
40-60% 251 6.8% 208 110 (98) -47.1% 82.9% 13.6%
60-80% 1281 34.7% 1060 606 (454) -42.8% 82.7% 33.4%
80-100% 2095 56.7% 1680 911 (769) -45.8% 80.2% 36.1%
Total 3696 100.0% 2999 1652 (1347) -44.9% Table 25: Change in percent of NJ hunter education graduates purchasing a license from 2007-2012, by
percentage of owner-occupied residences by zip code
Year of Purchase Change
% Urban Number of Graduates
% of 2007 Grads 2007 2012 N %
% Bought in 2007
0-20% 1042 28.2% 904 499 (405) -44.8% 86.8%
20-40% 987 26.7% 830 475 (355) -42.8% 84.1%
40-60% 537 14.5% 429 224 (205) -47.8% 79.9%
60-80% 687 18.6% 510 278 (232) -45.5% 74.2%
80-100% 443 12.0% 326 176 (150) -46.0% 73.6%
Total 3696 100.0% 2999 1652 (1347) -44.9% Table 26: Change in percent of NJ hunter education graduates purchasing a license from 2007-2012, by
percentage of urban land use/land cover by zip code
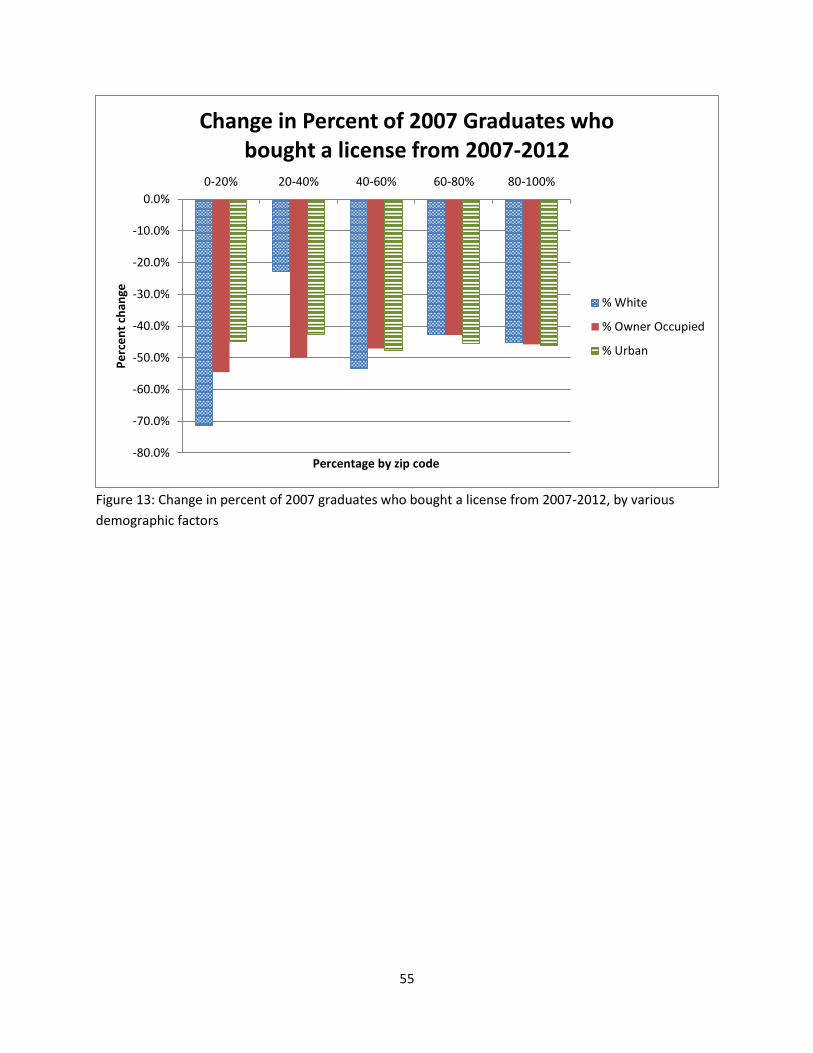
55
Figure 13: Change in percent of 2007 graduates who bought a license from 2007-2012, by various
demographic factors
-80.0%
-70.0%
-60.0%
-50.0%
-40.0%
-30.0%
-20.0%
-10.0%
0.0%
0-20% 20-40% 40-60% 60-80% 80-100%
Pe
rce
nt
chan
ge
Percentage by zip code
Change in Percent of 2007 Graduates who bought a license from 2007-2012
% White
% Owner Occupied
% Urban
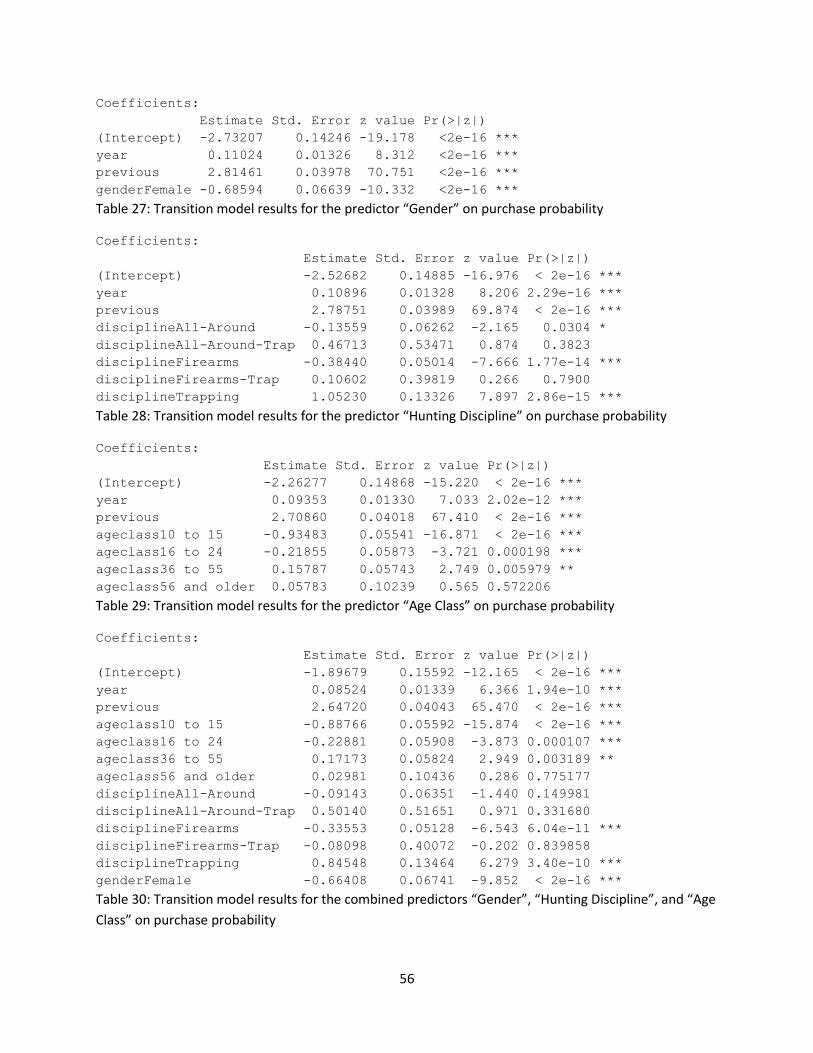
56
Coefficients:
Estimate Std. Error z value Pr(>|z|)
(Intercept) -2.73207 0.14246 -19.178 <2e-16 ***
year 0.11024 0.01326 8.312 <2e-16 ***
previous 2.81461 0.03978 70.751 <2e-16 ***
genderFemale -0.68594 0.06639 -10.332 <2e-16 ***
Table 27: Transition model results for the predictor “Gender” on purchase probability
Coefficients:
Estimate Std. Error z value Pr(>|z|)
(Intercept) -2.52682 0.14885 -16.976 < 2e-16 ***
year 0.10896 0.01328 8.206 2.29e-16 ***
previous 2.78751 0.03989 69.874 < 2e-16 ***
disciplineAll-Around -0.13559 0.06262 -2.165 0.0304 *
disciplineAll-Around-Trap 0.46713 0.53471 0.874 0.3823
disciplineFirearms -0.38440 0.05014 -7.666 1.77e-14 ***
disciplineFirearms-Trap 0.10602 0.39819 0.266 0.7900
disciplineTrapping 1.05230 0.13326 7.897 2.86e-15 ***
Table 28: Transition model results for the predictor “Hunting Discipline” on purchase probability
Coefficients:
Estimate Std. Error z value Pr(>|z|)
(Intercept) -2.26277 0.14868 -15.220 < 2e-16 ***
year 0.09353 0.01330 7.033 2.02e-12 ***
previous 2.70860 0.04018 67.410 < 2e-16 ***
ageclass10 to 15 -0.93483 0.05541 -16.871 < 2e-16 ***
ageclass16 to 24 -0.21855 0.05873 -3.721 0.000198 ***
ageclass36 to 55 0.15787 0.05743 2.749 0.005979 **
ageclass56 and older 0.05783 0.10239 0.565 0.572206
Table 29: Transition model results for the predictor “Age Class” on purchase probability
Coefficients:
Estimate Std. Error z value Pr(>|z|)
(Intercept) -1.89679 0.15592 -12.165 < 2e-16 ***
year 0.08524 0.01339 6.366 1.94e-10 ***
previous 2.64720 0.04043 65.470 < 2e-16 ***
ageclass10 to 15 -0.88766 0.05592 -15.874 < 2e-16 ***
ageclass16 to 24 -0.22881 0.05908 -3.873 0.000107 ***
ageclass36 to 55 0.17173 0.05824 2.949 0.003189 **
ageclass56 and older 0.02981 0.10436 0.286 0.775177
disciplineAll-Around -0.09143 0.06351 -1.440 0.149981
disciplineAll-Around-Trap 0.50140 0.51651 0.971 0.331680
disciplineFirearms -0.33553 0.05128 -6.543 6.04e-11 ***
disciplineFirearms-Trap -0.08098 0.40072 -0.202 0.839858
disciplineTrapping 0.84548 0.13464 6.279 3.40e-10 ***
genderFemale -0.66408 0.06741 -9.852 < 2e-16 ***
Table 30: Transition model results for the combined predictors “Gender”, “Hunting Discipline”, and “Age
Class” on purchase probability
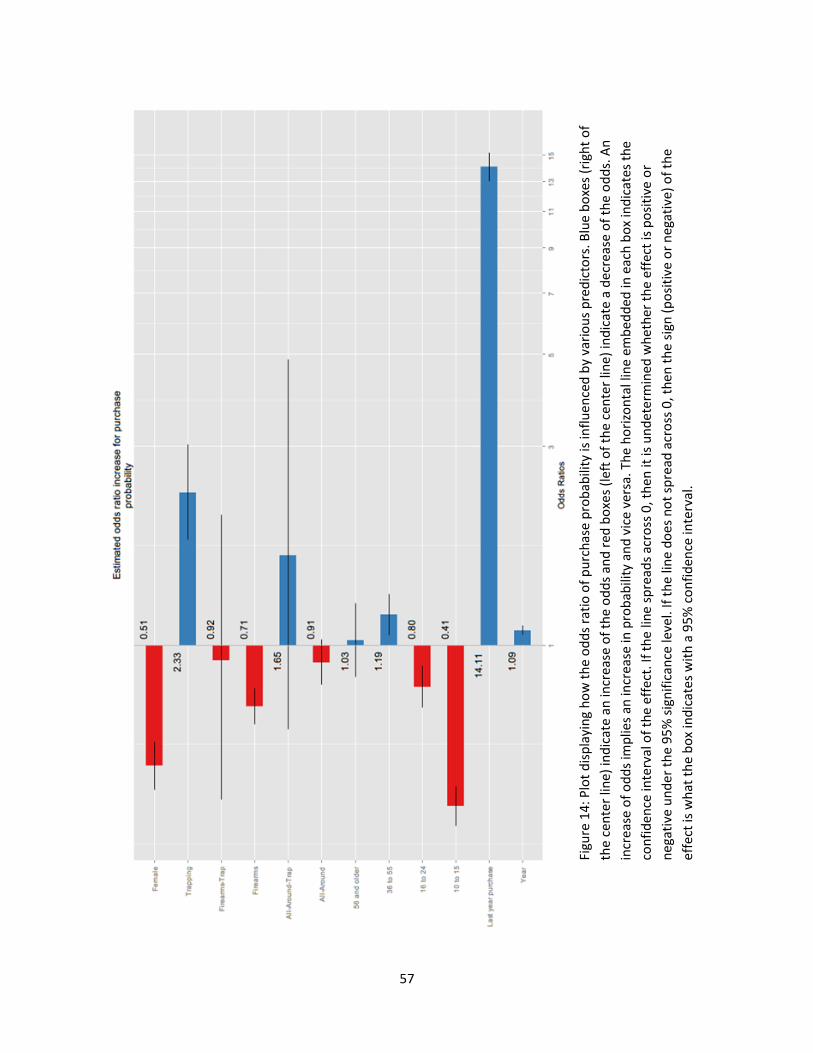
57
Figu
re 1
4: P
lot
dis
pla
yin
g h
ow
th
e o
dd
s ra
tio
of
pu
rch
ase
pro
bab
ility
is in
flu
ence
d b
y va
rio
us
pre
dic
tors
. Blu
e b
oxe
s (r
igh
t o
f
the
cen
ter
line)
ind
icat
e an
incr
ease
of
the
od
ds
and
red
bo
xes
(lef
t o
f th
e ce
nte
r lin
e) in
dic
ate
a d
ecre
ase
of
the
od
ds.
An
incr
ease
of
od
ds
imp
lies
an in
crea
se in
pro
bab
ility
an
d v
ice
vers
a. T
he
ho
rizo
nta
l lin
e em
bed
ded
in e
ach
bo
x in
dic
ates
th
e
con
fid
ence
inte
rval
of
the
effe
ct. I
f th
e lin
e sp
read
s ac
ross
0, t
hen
it is
un
det
erm
ined
wh
eth
er t
he
eff
ect
is p
osi
tive
or
neg
ativ
e u
nd
er t
he
95
% s
ign
ific
ance
leve
l. If
th
e lin
e d
oes
no
t sp
read
acr
oss
0, t
hen
th
e si
gn (
po
siti
ve o
r n
egat
ive)
of
the
effe
ct is
wh
at t
he
bo
x in
dic
ates
wit
h a
95
% c
on
fid
ence
inte
rval
.
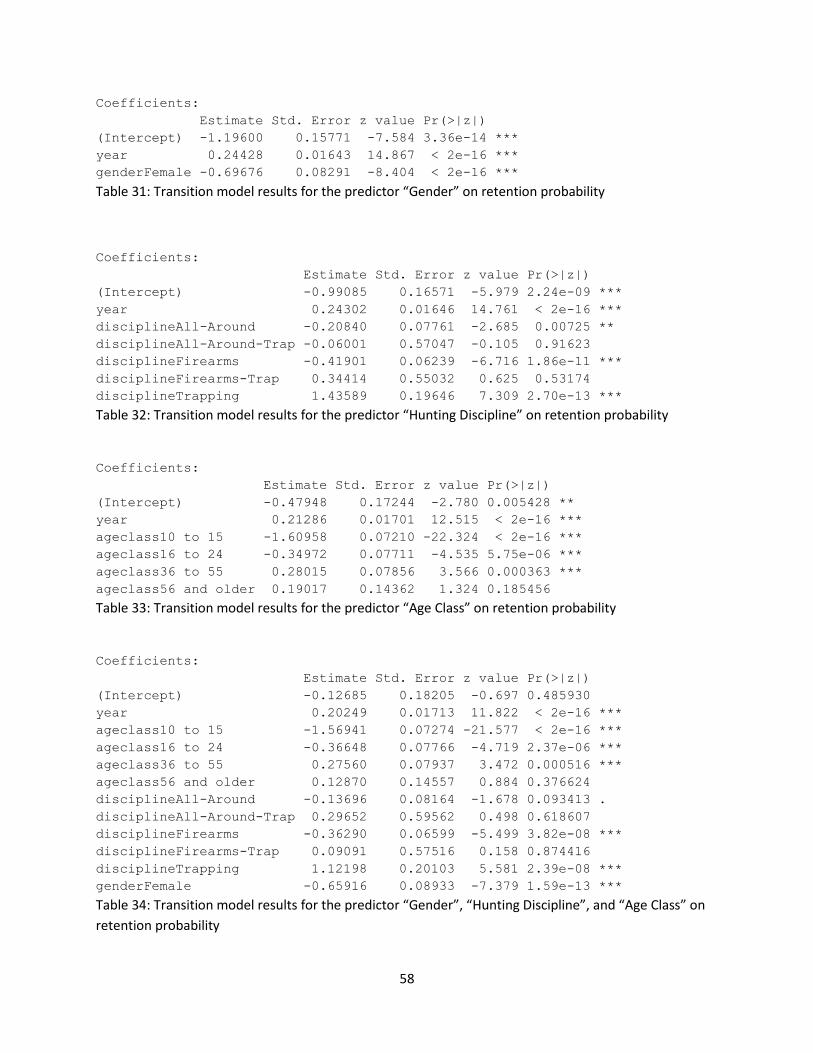
58
Coefficients:
Estimate Std. Error z value Pr(>|z|)
(Intercept) -1.19600 0.15771 -7.584 3.36e-14 ***
year 0.24428 0.01643 14.867 < 2e-16 ***
genderFemale -0.69676 0.08291 -8.404 < 2e-16 ***
Table 31: Transition model results for the predictor “Gender” on retention probability
Coefficients:
Estimate Std. Error z value Pr(>|z|)
(Intercept) -0.99085 0.16571 -5.979 2.24e-09 ***
year 0.24302 0.01646 14.761 < 2e-16 ***
disciplineAll-Around -0.20840 0.07761 -2.685 0.00725 **
disciplineAll-Around-Trap -0.06001 0.57047 -0.105 0.91623
disciplineFirearms -0.41901 0.06239 -6.716 1.86e-11 ***
disciplineFirearms-Trap 0.34414 0.55032 0.625 0.53174
disciplineTrapping 1.43589 0.19646 7.309 2.70e-13 ***
Table 32: Transition model results for the predictor “Hunting Discipline” on retention probability
Coefficients:
Estimate Std. Error z value Pr(>|z|)
(Intercept) -0.47948 0.17244 -2.780 0.005428 **
year 0.21286 0.01701 12.515 < 2e-16 ***
ageclass10 to 15 -1.60958 0.07210 -22.324 < 2e-16 ***
ageclass16 to 24 -0.34972 0.07711 -4.535 5.75e-06 ***
ageclass36 to 55 0.28015 0.07856 3.566 0.000363 ***
ageclass56 and older 0.19017 0.14362 1.324 0.185456
Table 33: Transition model results for the predictor “Age Class” on retention probability
Coefficients:
Estimate Std. Error z value Pr(>|z|)
(Intercept) -0.12685 0.18205 -0.697 0.485930
year 0.20249 0.01713 11.822 < 2e-16 ***
ageclass10 to 15 -1.56941 0.07274 -21.577 < 2e-16 ***
ageclass16 to 24 -0.36648 0.07766 -4.719 2.37e-06 ***
ageclass36 to 55 0.27560 0.07937 3.472 0.000516 ***
ageclass56 and older 0.12870 0.14557 0.884 0.376624
disciplineAll-Around -0.13696 0.08164 -1.678 0.093413 .
disciplineAll-Around-Trap 0.29652 0.59562 0.498 0.618607
disciplineFirearms -0.36290 0.06599 -5.499 3.82e-08 ***
disciplineFirearms-Trap 0.09091 0.57516 0.158 0.874416
disciplineTrapping 1.12198 0.20103 5.581 2.39e-08 ***
genderFemale -0.65916 0.08933 -7.379 1.59e-13 ***
Table 34: Transition model results for the predictor “Gender”, “Hunting Discipline”, and “Age Class” on
retention probability
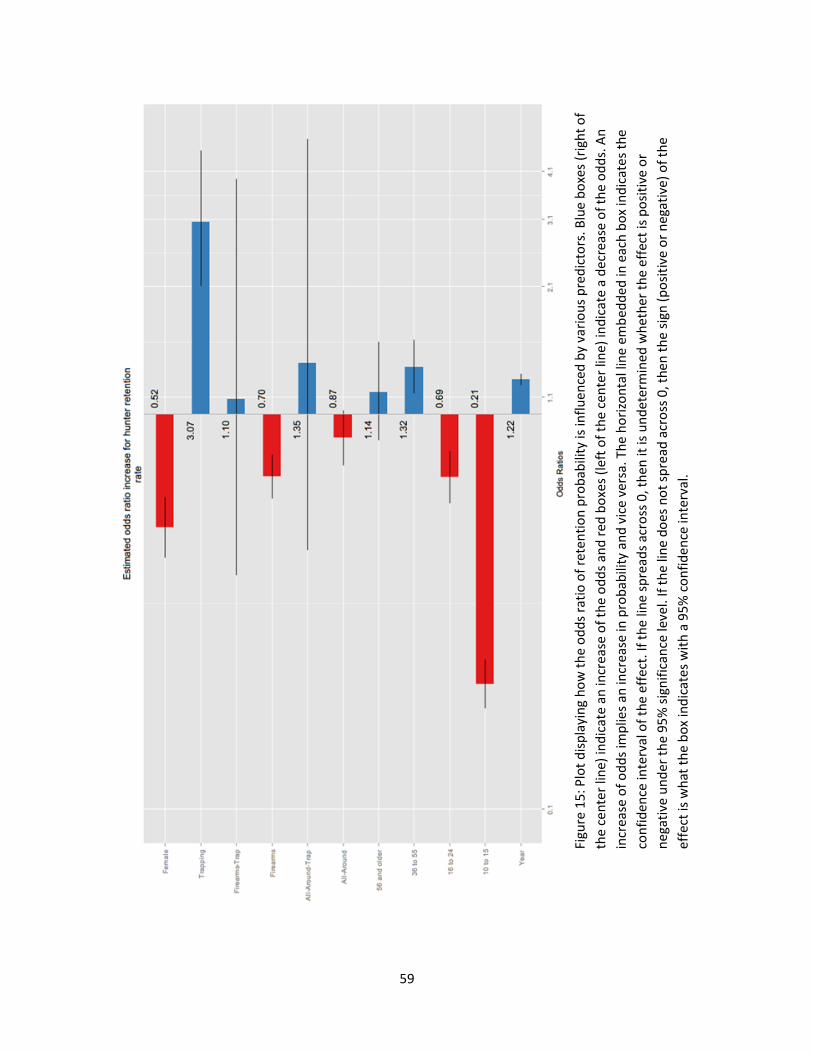
59
Figu
re 1
5: P
lot
dis
pla
yin
g h
ow
th
e o
dd
s ra
tio
of
rete
nti
on
pro
bab
ility
is in
flu
ence
d b
y va
rio
us
pre
dic
tors
. Blu
e b
oxe
s (r
igh
t o
f
the
cen
ter
line)
ind
icat
e an
incr
ease
of
the
od
ds
and
red
bo
xes
(lef
t o
f th
e ce
nte
r lin
e) in
dic
ate
a d
ecre
ase
of
the
od
ds.
An
incr
ease
of
od
ds
imp
lies
an in
crea
se in
pro
bab
ility
an
d v
ice
vers
a. T
he
ho
rizo
nta
l lin
e em
bed
ded
in e
ach
bo
x in
dic
ates
th
e
con
fid
ence
inte
rval
of
the
effe
ct. I
f th
e lin
e sp
read
s ac
ross
0, t
hen
it is
un
det
erm
ined
wh
eth
er t
he
eff
ect
is p
osi
tive
or
neg
ativ
e u
nd
er t
he
95
% s
ign
ific
ance
leve
l. If
th
e lin
e d
oes
no
t sp
read
acr
oss
0, t
hen
th
e si
gn (
po
siti
ve o
r n
egat
ive)
of
the
effe
ct is
wh
at t
he
bo
x in
dic
ate
s w
ith
a 9
5%
co
nfi
den
ce in
terv
al.
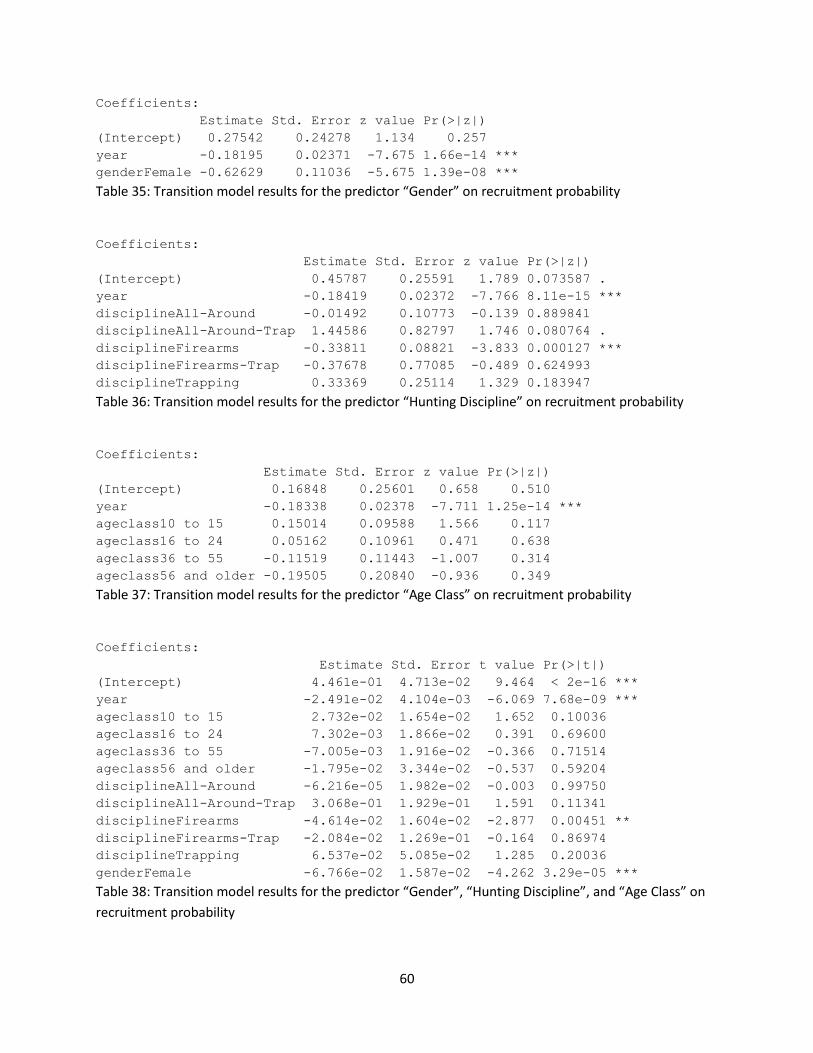
60
Coefficients:
Estimate Std. Error z value Pr(>|z|)
(Intercept) 0.27542 0.24278 1.134 0.257
year -0.18195 0.02371 -7.675 1.66e-14 ***
genderFemale -0.62629 0.11036 -5.675 1.39e-08 ***
Table 35: Transition model results for the predictor “Gender” on recruitment probability
Coefficients:
Estimate Std. Error z value Pr(>|z|)
(Intercept) 0.45787 0.25591 1.789 0.073587 .
year -0.18419 0.02372 -7.766 8.11e-15 ***
disciplineAll-Around -0.01492 0.10773 -0.139 0.889841
disciplineAll-Around-Trap 1.44586 0.82797 1.746 0.080764 .
disciplineFirearms -0.33811 0.08821 -3.833 0.000127 ***
disciplineFirearms-Trap -0.37678 0.77085 -0.489 0.624993
disciplineTrapping 0.33369 0.25114 1.329 0.183947
Table 36: Transition model results for the predictor “Hunting Discipline” on recruitment probability
Coefficients:
Estimate Std. Error z value Pr(>|z|)
(Intercept) 0.16848 0.25601 0.658 0.510
year -0.18338 0.02378 -7.711 1.25e-14 ***
ageclass10 to 15 0.15014 0.09588 1.566 0.117
ageclass16 to 24 0.05162 0.10961 0.471 0.638
ageclass36 to 55 -0.11519 0.11443 -1.007 0.314
ageclass56 and older -0.19505 0.20840 -0.936 0.349
Table 37: Transition model results for the predictor “Age Class” on recruitment probability
Coefficients:
Estimate Std. Error t value Pr(>|t|)
(Intercept) 4.461e-01 4.713e-02 9.464 < 2e-16 ***
year -2.491e-02 4.104e-03 -6.069 7.68e-09 ***
ageclass10 to 15 2.732e-02 1.654e-02 1.652 0.10036
ageclass16 to 24 7.302e-03 1.866e-02 0.391 0.69600
ageclass36 to 55 -7.005e-03 1.916e-02 -0.366 0.71514
ageclass56 and older -1.795e-02 3.344e-02 -0.537 0.59204
disciplineAll-Around -6.216e-05 1.982e-02 -0.003 0.99750
disciplineAll-Around-Trap 3.068e-01 1.929e-01 1.591 0.11341
disciplineFirearms -4.614e-02 1.604e-02 -2.877 0.00451 **
disciplineFirearms-Trap -2.084e-02 1.269e-01 -0.164 0.86974
disciplineTrapping 6.537e-02 5.085e-02 1.285 0.20036
genderFemale -6.766e-02 1.587e-02 -4.262 3.29e-05 ***
Table 38: Transition model results for the predictor “Gender”, “Hunting Discipline”, and “Age Class” on
recruitment probability
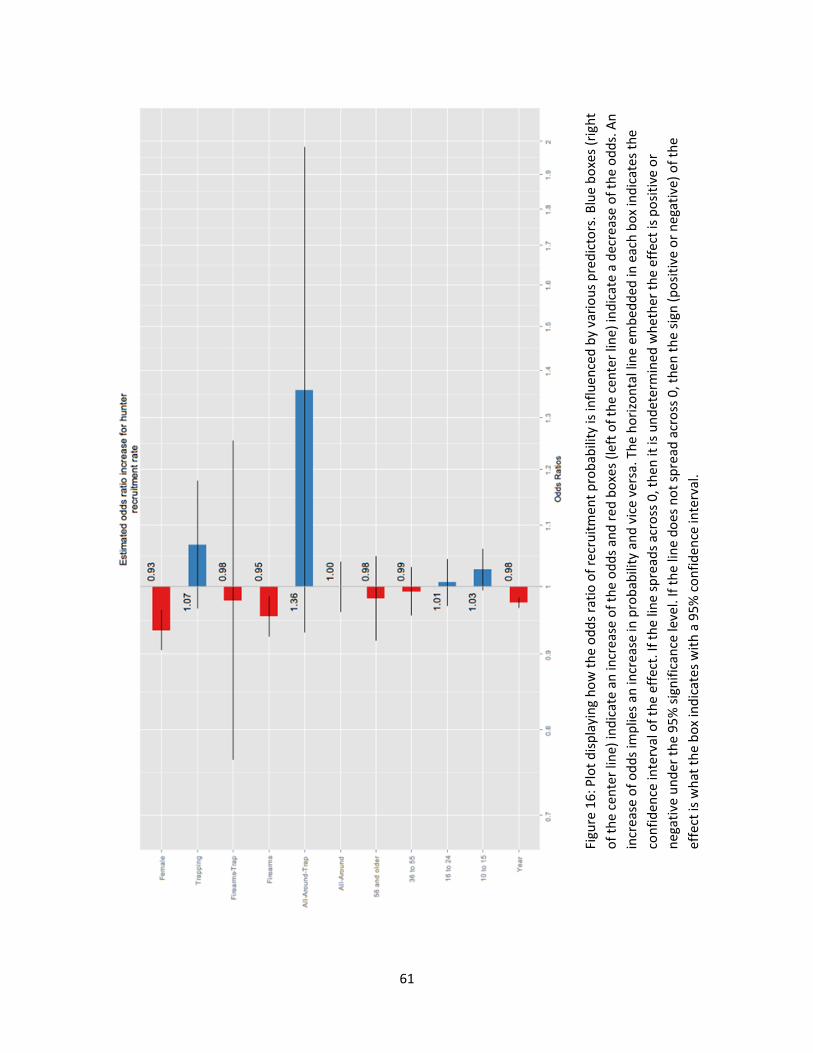
61
Figu
re 1
6: P
lot
dis
pla
yin
g h
ow
th
e o
dd
s ra
tio
of
recr
uit
men
t p
rob
abili
ty is
infl
uen
ced
by
vari
ou
s p
red
icto
rs. B
lue
bo
xes
(rig
ht
of
the
cen
ter
line)
ind
icat
e an
incr
ease
of
the
od
ds
and
re
d b
oxe
s (l
eft
of
the
cen
ter
line)
ind
icat
e a
dec
reas
e o
f th
e o
dd
s. A
n
incr
ease
of
od
ds
imp
lies
an in
crea
se in
pro
bab
ility
an
d v
ice
vers
a. T
he
ho
rizo
nta
l lin
e em
bed
ded
in e
ach
bo
x in
dic
ates
th
e
con
fid
ence
inte
rval
of
the
effe
ct. I
f th
e lin
e sp
read
s ac
ross
0, t
hen
it is
un
det
erm
ined
wh
eth
er t
he
eff
ect
is p
osi
tive
or
neg
ativ
e u
nd
er t
he
95
% s
ign
ific
ance
leve
l. If
th
e lin
e d
oes
no
t sp
read
acr
oss
0, t
hen
th
e si
gn (
po
siti
ve o
r n
egat
ive)
of
the
effe
ct is
wh
at t
he
bo
x in
dic
ate
s w
ith
a 9
5%
co
nfi
den
ce in
terv
al.
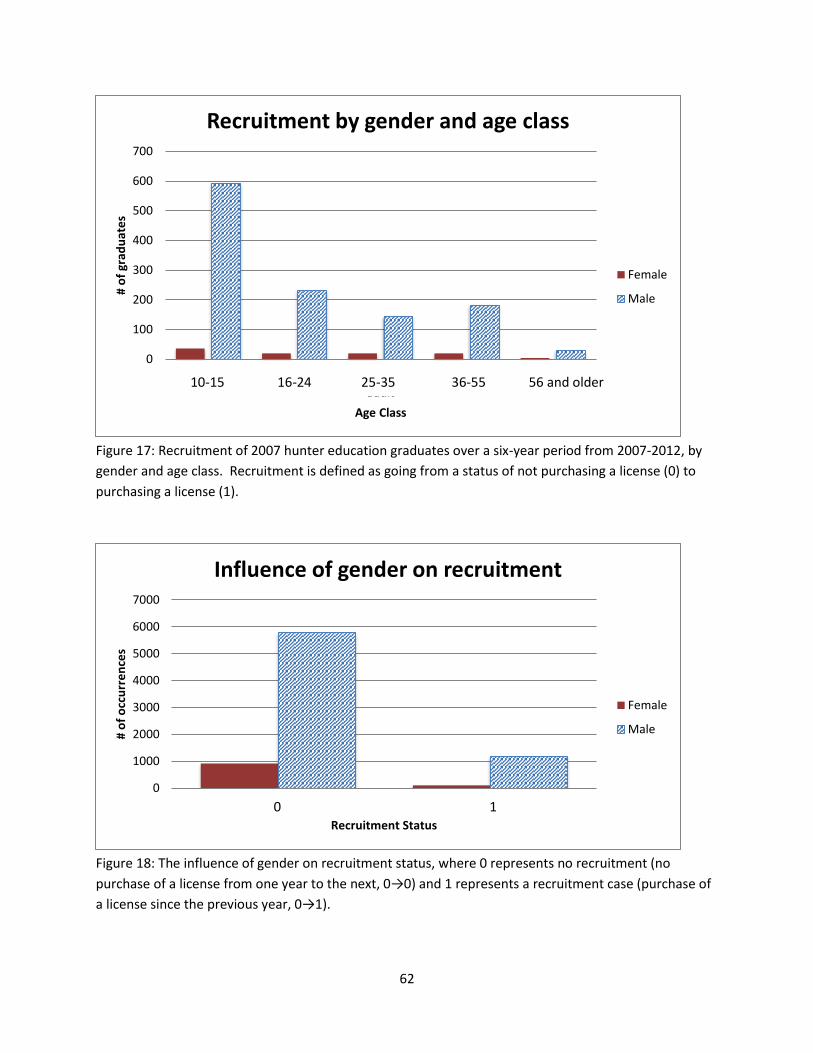
62
Figure 17: Recruitment of 2007 hunter education graduates over a six-year period from 2007-2012, by
gender and age class. Recruitment is defined as going from a status of not purchasing a license (0) to
purchasing a license (1).
Figure 18: The influence of gender on recruitment status, where 0 represents no recruitment (no
purchase of a license from one year to the next, 0→0) and 1 represents a recruitment case (purchase of
a license since the previous year, 0→1).
0
100
200
300
400
500
600
700
Minor Young Age Middle-agedadult
Baby boomer Senior
# o
f gr
adu
ate
s
Age Class
Recruitment by gender and age class
Female
Male
0
1000
2000
3000
4000
5000
6000
7000
0 1
# o
f o
ccu
rre
nce
s
Recruitment Status
Influence of gender on recruitment
Female
Male
10-15 16-24 25-35 36-55 56 and older
0 1
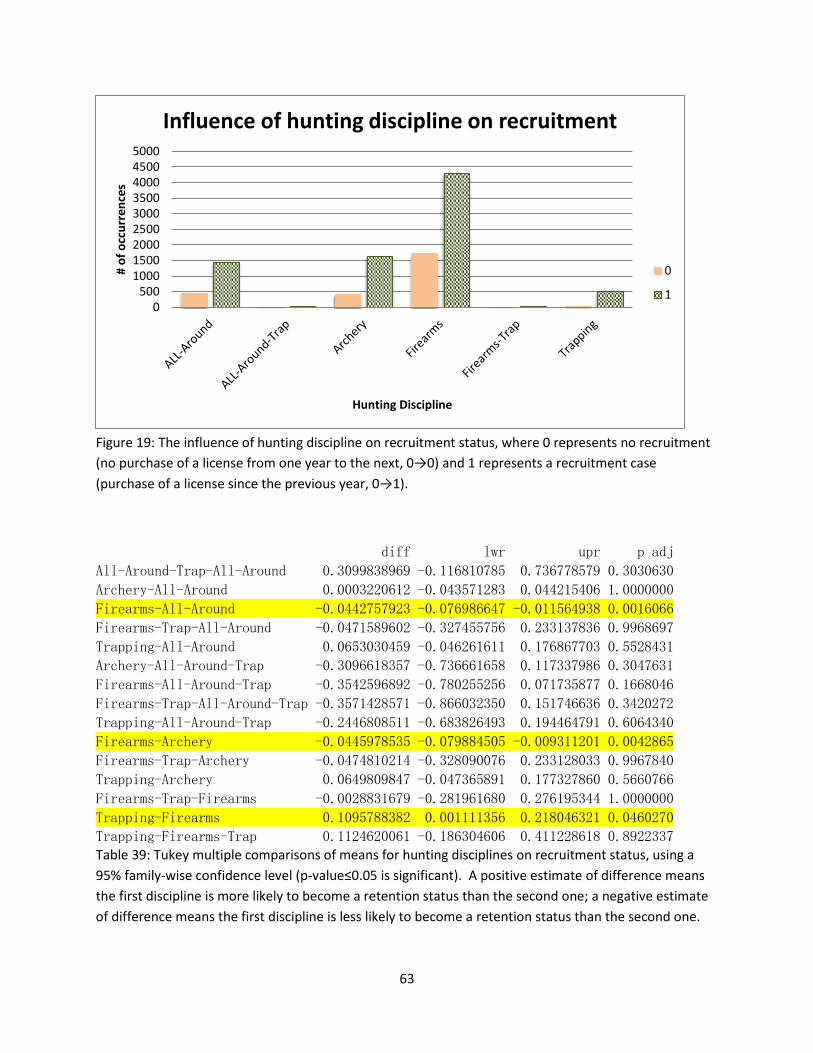
63
Figure 19: The influence of hunting discipline on recruitment status, where 0 represents no recruitment
(no purchase of a license from one year to the next, 0→0) and 1 represents a recruitment case
(purchase of a license since the previous year, 0→1).
diff lwr upr p adj
All-Around-Trap-All-Around 0.3099838969 -0.116810785 0.736778579 0.3030630
Archery-All-Around 0.0003220612 -0.043571283 0.044215406 1.0000000
Firearms-All-Around -0.0442757923 -0.076986647 -0.011564938 0.0016066
Firearms-Trap-All-Around -0.0471589602 -0.327455756 0.233137836 0.9968697
Trapping-All-Around 0.0653030459 -0.046261611 0.176867703 0.5528431
Archery-All-Around-Trap -0.3096618357 -0.736661658 0.117337986 0.3047631
Firearms-All-Around-Trap -0.3542596892 -0.780255256 0.071735877 0.1668046
Firearms-Trap-All-Around-Trap -0.3571428571 -0.866032350 0.151746636 0.3420272
Trapping-All-Around-Trap -0.2446808511 -0.683826493 0.194464791 0.6064340
Firearms-Archery -0.0445978535 -0.079884505 -0.009311201 0.0042865
Firearms-Trap-Archery -0.0474810214 -0.328090076 0.233128033 0.9967840
Trapping-Archery 0.0649809847 -0.047365891 0.177327860 0.5660766
Firearms-Trap-Firearms -0.0028831679 -0.281961680 0.276195344 1.0000000
Trapping-Firearms 0.1095788382 0.001111356 0.218046321 0.0460270
Trapping-Firearms-Trap 0.1124620061 -0.186304606 0.411228618 0.8922337 Table 39: Tukey multiple comparisons of means for hunting disciplines on recruitment status, using a
95% family-wise confidence level (p-value≤0.05 is significant). A positive estimate of difference means
the first discipline is more likely to become a retention status than the second one; a negative estimate
of difference means the first discipline is less likely to become a retention status than the second one.
0500
100015002000250030003500400045005000
# o
f o
ccu
rre
nce
s
Hunting Discipline
Influence of hunting discipline on recruitment
0
1
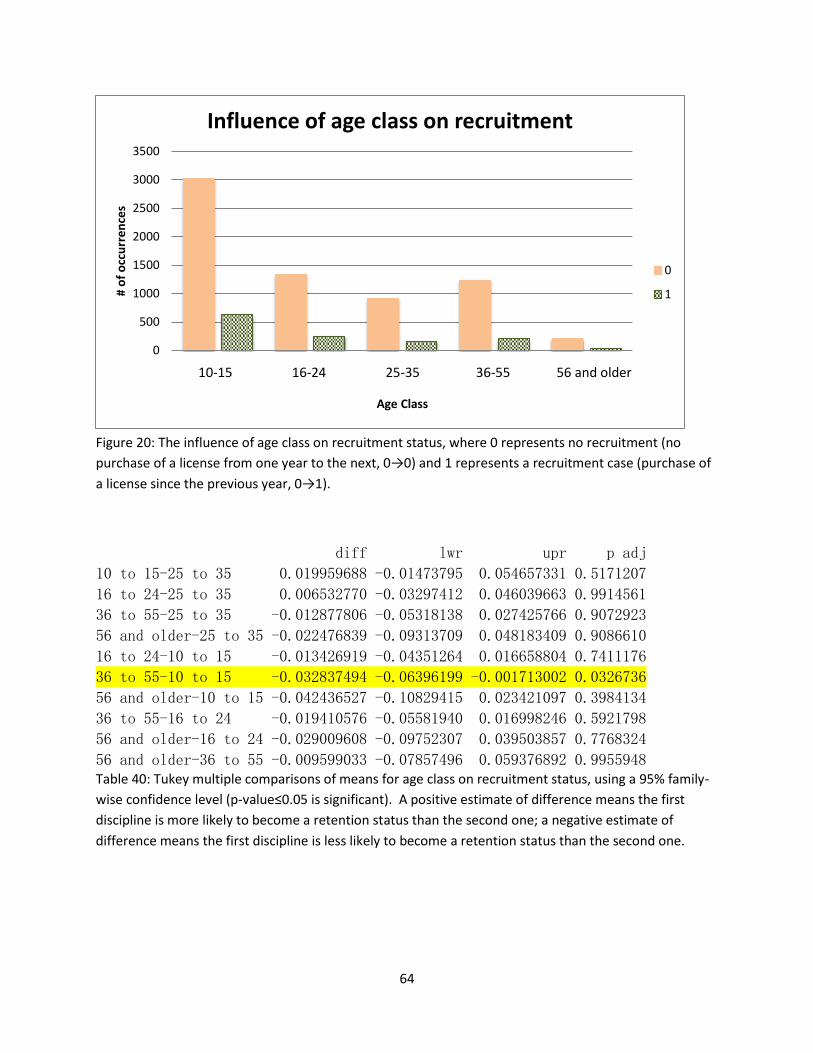
64
Figure 20: The influence of age class on recruitment status, where 0 represents no recruitment (no
purchase of a license from one year to the next, 0→0) and 1 represents a recruitment case (purchase of
a license since the previous year, 0→1).
diff lwr upr p adj
10 to 15-25 to 35 0.019959688 -0.01473795 0.054657331 0.5171207
16 to 24-25 to 35 0.006532770 -0.03297412 0.046039663 0.9914561
36 to 55-25 to 35 -0.012877806 -0.05318138 0.027425766 0.9072923
56 and older-25 to 35 -0.022476839 -0.09313709 0.048183409 0.9086610
16 to 24-10 to 15 -0.013426919 -0.04351264 0.016658804 0.7411176
36 to 55-10 to 15 -0.032837494 -0.06396199 -0.001713002 0.0326736
56 and older-10 to 15 -0.042436527 -0.10829415 0.023421097 0.3984134
36 to 55-16 to 24 -0.019410576 -0.05581940 0.016998246 0.5921798
56 and older-16 to 24 -0.029009608 -0.09752307 0.039503857 0.7768324
56 and older-36 to 55 -0.009599033 -0.07857496 0.059376892 0.9955948 Table 40: Tukey multiple comparisons of means for age class on recruitment status, using a 95% family-
wise confidence level (p-value≤0.05 is significant). A positive estimate of difference means the first
discipline is more likely to become a retention status than the second one; a negative estimate of
difference means the first discipline is less likely to become a retention status than the second one.
0
500
1000
1500
2000
2500
3000
3500
Minor Young adult Middle-agedadult
Baby boomer Senior
# o
f o
ccu
rre
nce
s
Age Class
Influence of age class on recruitment
0
1
10-15 16-24 25-35 36-55 56 and older
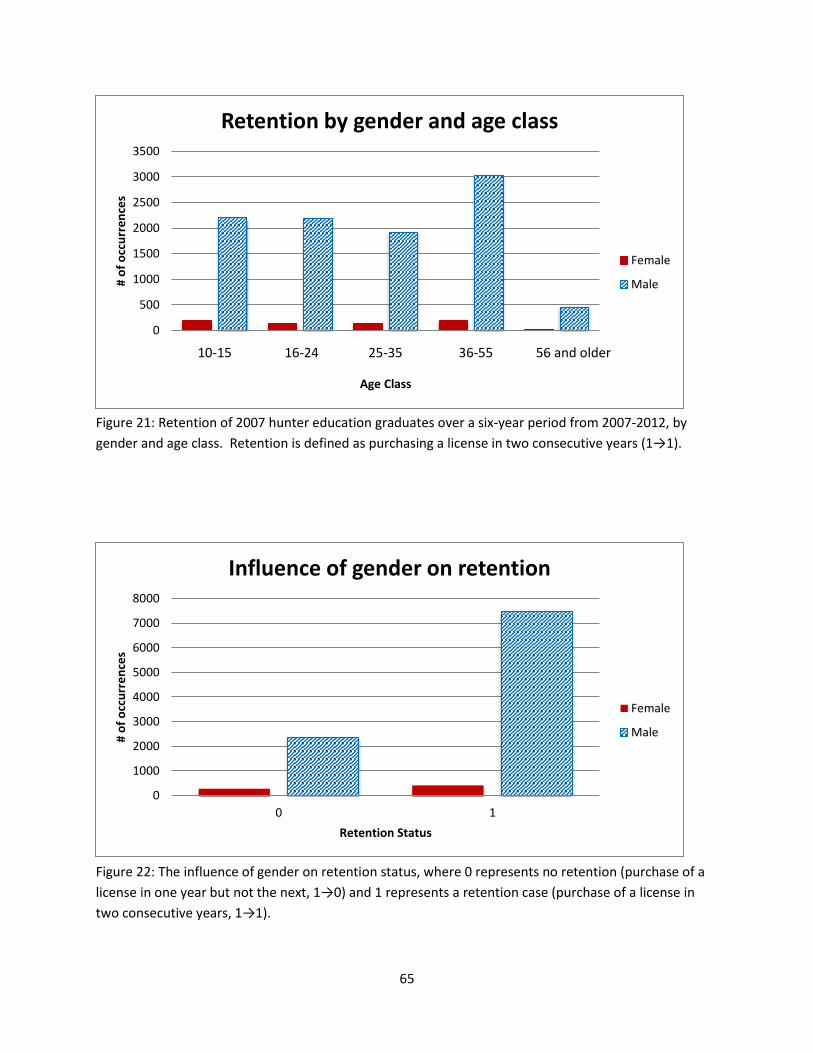
65
Figure 21: Retention of 2007 hunter education graduates over a six-year period from 2007-2012, by
gender and age class. Retention is defined as purchasing a license in two consecutive years (1→1).
Figure 22: The influence of gender on retention status, where 0 represents no retention (purchase of a
license in one year but not the next, 1→0) and 1 represents a retention case (purchase of a license in
two consecutive years, 1→1).
0
500
1000
1500
2000
2500
3000
3500
Minor Young Age Middle-agedadult
Baby boomer Senior
# o
f o
ccu
rre
nce
s
Age Class
Retention by gender and age class
Female
Male
0
1000
2000
3000
4000
5000
6000
7000
8000
0 1
# o
f o
ccu
rre
nce
s
Retention Status
Influence of gender on retention
Female
Male
10-15 16-24 25-35 36-55 56 and older
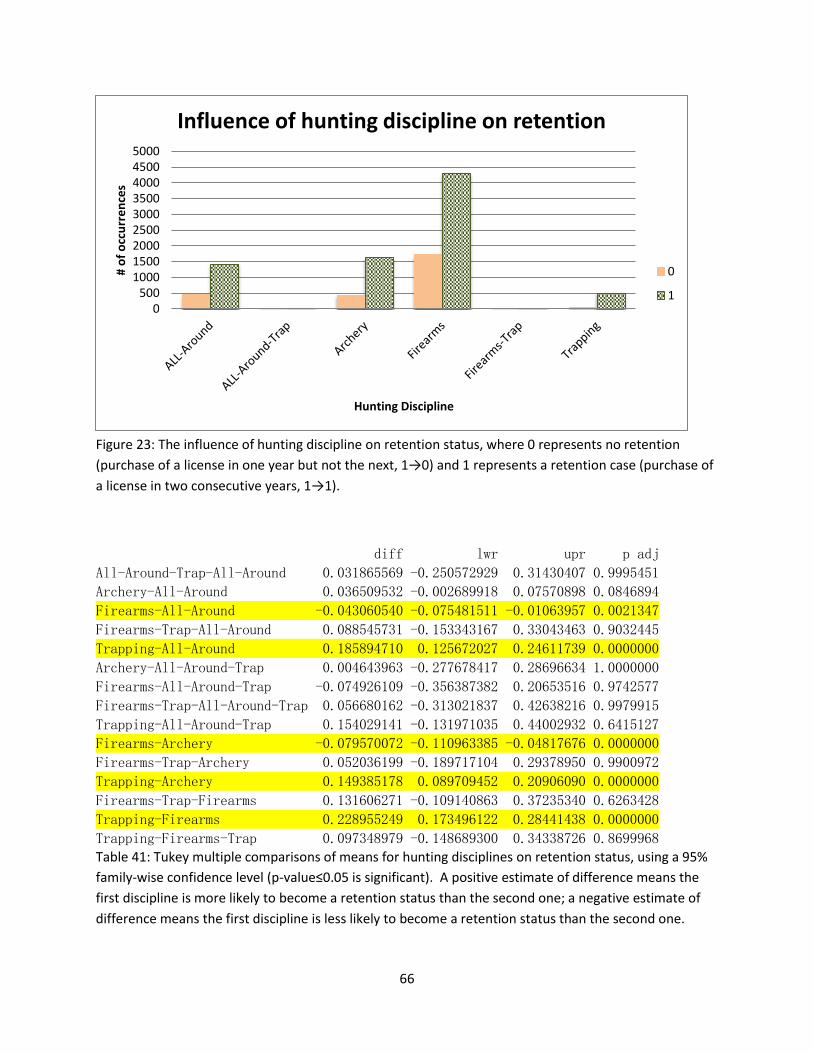
66
Figure 23: The influence of hunting discipline on retention status, where 0 represents no retention
(purchase of a license in one year but not the next, 1→0) and 1 represents a retention case (purchase of
a license in two consecutive years, 1→1).
diff lwr upr p adj
All-Around-Trap-All-Around 0.031865569 -0.250572929 0.31430407 0.9995451
Archery-All-Around 0.036509532 -0.002689918 0.07570898 0.0846894
Firearms-All-Around -0.043060540 -0.075481511 -0.01063957 0.0021347
Firearms-Trap-All-Around 0.088545731 -0.153343167 0.33043463 0.9032445
Trapping-All-Around 0.185894710 0.125672027 0.24611739 0.0000000
Archery-All-Around-Trap 0.004643963 -0.277678417 0.28696634 1.0000000
Firearms-All-Around-Trap -0.074926109 -0.356387382 0.20653516 0.9742577
Firearms-Trap-All-Around-Trap 0.056680162 -0.313021837 0.42638216 0.9979915
Trapping-All-Around-Trap 0.154029141 -0.131971035 0.44002932 0.6415127
Firearms-Archery -0.079570072 -0.110963385 -0.04817676 0.0000000
Firearms-Trap-Archery 0.052036199 -0.189717104 0.29378950 0.9900972
Trapping-Archery 0.149385178 0.089709452 0.20906090 0.0000000
Firearms-Trap-Firearms 0.131606271 -0.109140863 0.37235340 0.6263428
Trapping-Firearms 0.228955249 0.173496122 0.28441438 0.0000000
Trapping-Firearms-Trap 0.097348979 -0.148689300 0.34338726 0.8699968 Table 41: Tukey multiple comparisons of means for hunting disciplines on retention status, using a 95%
family-wise confidence level (p-value≤0.05 is significant). A positive estimate of difference means the
first discipline is more likely to become a retention status than the second one; a negative estimate of
difference means the first discipline is less likely to become a retention status than the second one.
0500
100015002000250030003500400045005000
# o
f o
ccu
rre
nce
s
Hunting Discipline
Influence of hunting discipline on retention
0
1

67
Figure 24: The influence of age class on retention status, where 0 represents no retention (purchase of a
license in one year but not the next, 1→0) and 1 represents a retention case (purchase of a license in
two consecutive years, 1→1).
diff lwr upr p adj
16 to 24-10 to 15 0.28937605 0.25710857 0.32164354 0.0000000
25 to 35-10 to 15 0.34632435 0.31293707 0.37971163 0.0000000
36 to 55-10 to 15 0.38373669 0.35382638 0.41364700 0.0000000
56 and older-10 to 15 0.37197424 0.31619516 0.42775332 0.0000000
25 to 35-16 to 24 0.05694830 0.02337036 0.09052623 0.0000369
36 to 55-16 to 24 0.09436064 0.06423766 0.12448362 0.0000000
56 and older-16 to 24 0.08259819 0.02670478 0.13849160 0.0005342
36 to 55-25 to 35 0.03741234 0.00609280 0.06873189 0.0098844
56 and older-25 to 35 0.02564989 -0.03089737 0.08219716 0.7293333
56 and older-36 to 55 -0.01176245 -0.06632901 0.04280411 0.9768870 Table 42: Tukey multiple comparisons of means for age class on retention status, using a 95% family-
wise confidence level (p-value≤0.05 is significant). A positive estimate of difference means the first
discipline is more likely to become a retention status than the second one; a negative estimate of
difference means the first discipline is less likely to become a retention status than the second one.
0
500
1000
1500
2000
2500
3000
Minor Young adult Middle-agedadult
Baby boomer Senior
# o
f o
ccu
rre
nce
s
Age Class
Influence of age class on retention
0
1
10-15 16-24 25-35 36-55 56 and older
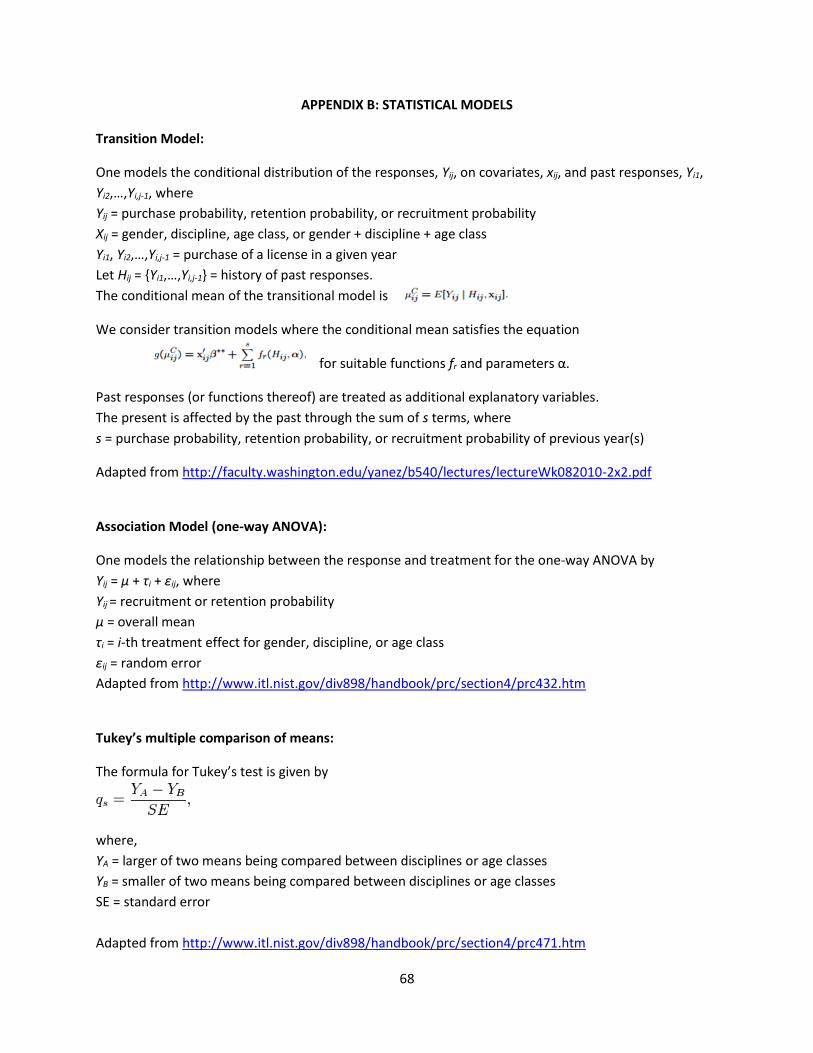
68
APPENDIX B: STATISTICAL MODELS
Transition Model:
One models the conditional distribution of the responses, Yij, on covariates, xij, and past responses, Yi1,
Yi2,…,Yi,j-1, where
Yij = purchase probability, retention probability, or recruitment probability
Xij = gender, discipline, age class, or gender + discipline + age class
Yi1, Yi2,…,Yi,j-1 = purchase of a license in a given year
Let Hij = {Yi1,…,Yi,j-1} = history of past responses.
The conditional mean of the transitional model is
We consider transition models where the conditional mean satisfies the equation
for suitable functions fr and parameters α.
Past responses (or functions thereof) are treated as additional explanatory variables.
The present is affected by the past through the sum of s terms, where
s = purchase probability, retention probability, or recruitment probability of previous year(s)
Adapted from http://faculty.washington.edu/yanez/b540/lectures/lectureWk082010-2x2.pdf
Association Model (one-way ANOVA):
One models the relationship between the response and treatment for the one-way ANOVA by
Yij = µ + τi + ɛij, where
Yij = recruitment or retention probability
µ = overall mean
τi = i-th treatment effect for gender, discipline, or age class
ɛij = random error
Adapted from http://www.itl.nist.gov/div898/handbook/prc/section4/prc432.htm
Tukey’s multiple comparison of means:
The formula for Tukey’s test is given by
where,
YA = larger of two means being compared between disciplines or age classes
YB = smaller of two means being compared between disciplines or age classes
SE = standard error
Adapted from http://www.itl.nist.gov/div898/handbook/prc/section4/prc471.htm