
This 2018 report is the FAA’s thirteenth provides staffing ranges for all of the FAA’s air...
60
Transcript of This 2018 report is the FAA’s thirteenth provides staffing ranges for all of the FAA’s air...


This 2018 report is the FAA’s thirteenth
annual update to the controller workforce
plan. The FAA issued the first comprehensive
controller workforce plan in December 2004.
It provides staffing ranges for all of the FAA’s
air traffic control facilities and actual on-
board controllers as of September 30, 2017.
Section (221) of Public Law (108-176)
(updated by Public Law 115-141) requires
the FAA Administrator to transmit a report
to the Senate Committee on Commerce,
Science and Transportation and the
House of Representatives Committee on
Transportation and Infrastructure that
describes the overall air traffic controller
workforce plan. It is due by March 31
of each fiscal year, otherwise the FAA’s
appropriation is reduced by $100,000 for
each day it is late.
2
3 Table of Contents
19 Air Traffic Staffing Standards Overview
10 FAA Air Traffic Control Facilities
9 Meeting the Challenge
22 Summary
24 Technological Advances
23 Air Traffic Scheduling Software Implementation
6 Chapter 1 | INTRODUCTION
21 TRACON Overview
12 Chapter 3 | STAFFING REQUIREMENTS
23 Air Traffic Controller Scheduling
27 Controller Loss Summary
4 EXECUTIVE SUMMARY
20 Tower Cab Overview
10 Chapter 2 | FACILITIES & SERVICES
27 Chapter 4 | LOSSES
6 Staffing to Traffic
22 En Route Overview
15 Staffing Ranges
10 Terminal and En Route Air Traffic Services
28 Actual Controller Retirements
29 Controller Workforce Age Distribution
28 Cumulative Retirement Eligibility
35 Total Controller Losses
33 Controller Losses Due to Resignations, Removals and Deaths
42 Chapter 6 | HIRING PROCESS
45 Time to Certification
31 Controller Retirement Pattern
38 Controller Hiring Profile
45 Designing and Delivering Effective Training
34 Academy Attrition
42 Recruitment
47 Chapter 8 | FUNDING STATUS
30 Controller Retirement Eligibility
37 Chapter 5 | HIRING PLAN
44 The Training Process
33 Developmental Attrition
42 Controller Hiring Sources
46 Investing for the Future
32 Controller Losses Due to Retirements
39 Trainee-to-Total-Controller Percentage
45 Infrastructure Investments
34 Controller Losses Due to Promotions and Other Transfers
43 Chapter 7 | TRAINING
48 Appendix | 2018 FACILITY STAFFING RANGES
TABLE OF CONTENTS
3 2018 Air Traffic Controller Workforce Plan

Executive SummarySafety is the top priority of the Federal Aviation Administration (FAA) as it manages America’s National Airspace System (NAS). The NAS is the common network of U.S. airspace — air navigation facilities, equipment and services; airports or landing areas; aeronautical charts, information and services; rules, regulations and procedures; technical information; and manpower and material. Thanks to the expertise of people and the support of technology, tens of thousands of aircraft are guided safely and expeditiously every day through the NAS to their destinations.
WORKLOADAn important part of managing the NAS involves actively aligning controller resources with demand. The FAA “staffs to traffic,” matching the number of air traffic controllers at its facilities with traffic volume and workload. The FAA’s staffing needs are dynamic due to the dynamic nature of the workload and traffic volume.
TRAFFICAir traffic demand has declined significantly since 2000, the peak year for traffic. For the purposes of this plan, air traf-fic includes aircraft that are controlled, separated and managed by air traffic controllers. This includes commercial pas-senger and cargo aircraft as well as general aviation and military aircraft. Since 2000, traffic volume has declined by 21 percent. Although traffic is expected to grow, it is not expected to return to those levels in the near term. While there have been decreases year over year for system-wide traffic counts, there are some facilities that have experienced traffic increases. The FAA’s staffing standards incorporate location-specific traffic counts and forecasts to account for these changes.
New on the horizon is the introduction of Unmanned Aircraft Systems (UAS). These are different from manned aircraft and introducing them safely into the nation’s airspace is challenging for both the FAA and the aviation community. The FAA is taking an incremental approach to safe UAS integration; this is aided by the FAA’s new compliance philosophy designed to help identify and correct potential hazards before they result in an incident or accident. The extent of UAS’ impact on air traffic control will most certainly evolve.
HEADCOUNTIn many facilities, the current Actual on Board (AOB) number may exceed the facility’s target staffing ranges. This is because many facilities’ current AOB (all controllers at the facility) numbers include many developmental controllers in training to offset expected future attrition. While the FAA strives to keep Certified Professional Controllers (CPCs) and Certified Professional Controllers in Training (CPC-ITs) within the range, individual facilities can be above the range due to advance hiring. The FAA hires and staffs facilities so that trainees are fully prepared to take over responsibilities when senior controllers leave.
RETIREMENTSThe long-anticipated wave of controller retirements peaked a decade ago, in 2007, at 828 retirements. Over the past five years, FAA has averaged 670 controller retirements per year. However, due to the shifting demographics of the workforce, controller retirements are expected to drop significantly over the next five years, before leveling off around 200–250 per year. In the last five years, 3,354 controllers have retired. Fiscal year 2017 retirements were lower than projected, and are expected to fall significantly for the next decade. Cumulative Retirement Eligibility has also fallen. Tens of thousands of controllers were hired after the 1981 strike and at the end of FY 2017 only 45 controllers remain from those who were hired before 1984. This clearly demonstrates that the controller retirement wave is over.
The FAA carefully tracks actual retirements and projects losses to ensure its recruitment and training keep pace.
4

HIRINGIn FY 2016, Public Law 114-190 – FAA Extension, Safety, and Security Act (FESSA) of 2016 was enacted. The law established three separate hiring pools.
FESSA requires that the first pool, which included individuals with previous air traffic control experience, be given priority consideration. It also increases the maximum hiring age to 35 for those meeting certain requirements. Over 1,400 applicants responded to the air traffic control experience vacancy announcement in May 2017. Over 900 were referred for employment consideration.
FESSA establishes a separate track that was then divided into two pools. The first pool includes graduates from Colle-giate Training Initiative (CTI) programs and also military veterans. The second pool is open to the general public. Only the second pool is required to pass a biographical assessment screen. FESSA mandates that there be no more than a 10 percent variance between those two pools in making final selections. Out of 1,100 applicants referred for employ-ment consideration from the CTI/Veteran pool, approximately 611 were selected. Out of 1,500 applicants referred for employment consideration from the general public pool, approximately 656 were selected.
Once applicants are notified of selection and have accepted the offer, they will then be required to attain medical and security clearances. Upon successful completion of clearances, the applicants will then be scheduled for FAA Air Traffic Academy training as agency needs are identified.
Over the past five years, the FAA has hired over 6,500 new air traffic controllers. We exceeded our hiring target in 2017, hiring 1,880 new controllers compared to a plan of 1,781.
TRAININGAs the FAA brings these new employees on board, training continues to be closely monitored at all facilities. We must carefully manage the process to ensure that our trainees are hired in the places we need them and progress in a timely manner to become CPCs. The FAA will also continue to take action at the facility level should adjustments become necessary due to changes in traffic volume, retirements or other attrition.
Ongoing hiring and training initiatives, as well as increased simulator use, are helping the FAA meet its goals. While the FAA is managing today’s air traffic, we must also integrate new technologies into air traffic operations. From state-of-the-art simulators to satellite technology, air traffic is evolving into a more automated system. The FAA is working diligently to ensure well-trained controllers continue to uphold the highest safety standards as we plan for the future.
The FAA’s goal is to ensure that the agency has the flexibility to match thenumber of controllers at each facility with traffic volume and workload. Staffing
to traffic is just one of the ways we manage America’s National Airspace System.
5 2018 Air Traffic Controller Workforce Plan
Chapter 1
IntroductionSTAFFING TO TRAFFICAir traffic controller workload and traffic volume are dynamic, and so are the FAA’s staffing needs. A primary factor affecting controller workload is the demand created by air traffic, encompassing both commercial and non-commercial activity. Commercial activity includes air carrier and commuter/air taxi traffic. Non-commercial activity includes general aviation and military traffic.
Unmanned Aircraft Systems (UAS) have operated on a limited basis in the National Airspace System (NAS) and mainly supported public operations, such as military and border security operations. In recent years, UAS and operations have significantly increased in number, technical complexity and application. The list of uses has rapidly expanded to encompass a broad range of activities, including aerial photography, surveying, communications and broadcast, as well as hobby and recreation. In December 2015, the FAA began registration of all UAS. As policy and technology updates allow widespread use of UAS for commercial applications, the impact on the air traffic control workload will be incorporated into our models and forecasts. Oversight of UAS is aided by the FAA’s new compliance philosophy which is designed to help identify and correct potential hazards before they result in an incident or accident.
Adequate numbers of controllers must be available to cover the peaks in traffic caused by weather and daily, weekly or seasonal variations, so we continue to “staff to traffic.” Although the FAA generally staffs to traffic counts, it is not a one-to-one relationship. Safety rules and hours of operation require watch schedules that establish staffing during low-volume periods or in facilities with low traffic counts. This practice gives us the flexibility throughout each day to match the number of controllers at each facility with traffic volume and workload.
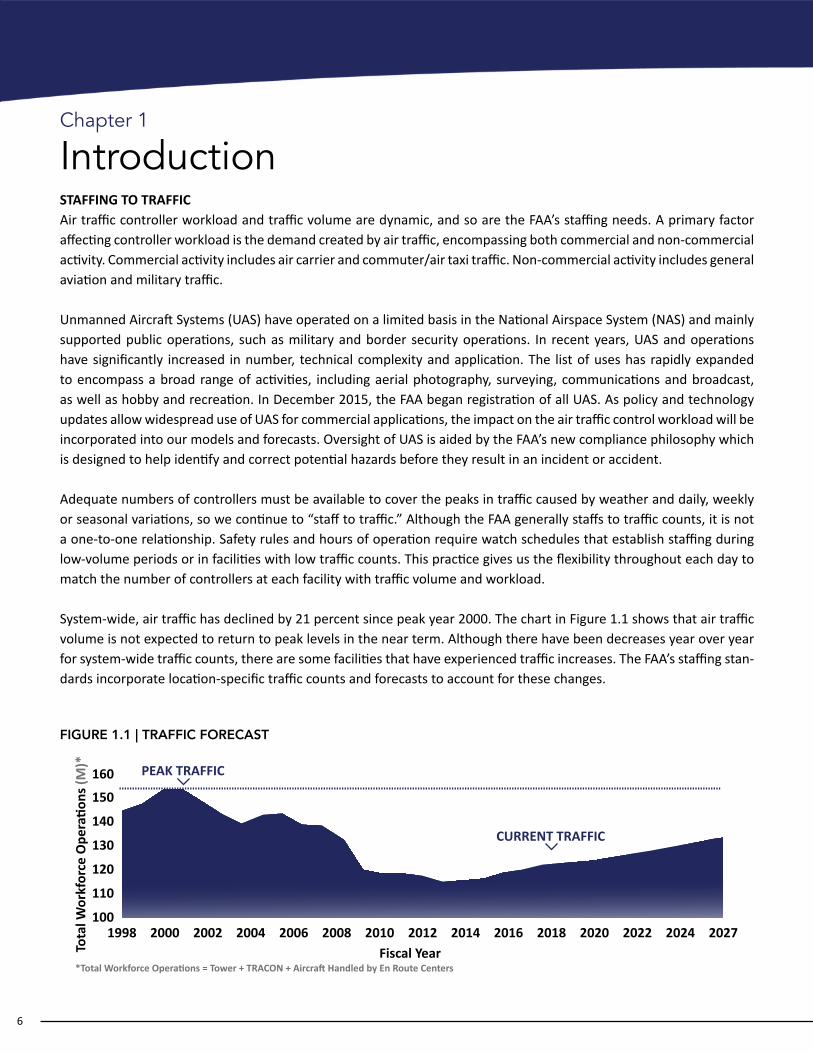
System-wide, air traffic has declined by 21 percent since peak year 2000. The chart in Figure 1.1 shows that air traffic volume is not expected to return to peak levels in the near term. Although there have been decreases year over year for system-wide traffic counts, there are some facilities that have experienced traffic increases. The FAA’s staffing stan-dards incorporate location-specific traffic counts and forecasts to account for these changes.
FIGURE 1.1 | TRAFFIC FORECAST
2006 2008 201020001998 2002 2004 2012 2014 2016Fiscal Year
*Total Workforce Operations = Tower + TRACON + Aircraft Handled by En Route Centers
Tota
l Wor
kfor
ce O
pera
tions
(M)*
2018 2020 2022 2024 2027
150
160
140
130
120
110
100
PEAK TRAFFIC
CURRENT TRAFFIC
6

Figure 1.2 shows system-wide controller staffing and traffic, indexed from FY 2000 and projected through FY 2027. In- dexing is a widely used technique which compares the change over time of two or more data series (in this case, total controller headcount, certified profession controllers (CPC) and certified professional controllers in training (CPC-IT) and traffic). The data series are set equal to each other (or indexed) at a particular point in time (in this case, FY 2000, a high mark for traffic) and measured relative to that index point in each successive year. This way we know how much growth or decline has occurred compared to the base value.
Staffing to traffic not only applies on a daily basis, but also means that we staff to satisfy expected needs two to three years in advance. We do this to ensure sufficient training time for new hires. Despite the decline in air traffic shown in Figure 1.2, “staffing to traffic” requires us to anticipate controller attrition, so that we plan and hire new controllers in advance of need. This is one reason that staffing remains well ahead of traffic. The gap between the blue line (Head- count) and the green line (CPC and CPC-IT staffing) is the advance hire trainee pipeline and is projected to close signifi-cantly by 2022. The headcount and CPC+CPCIT lines converge due to reduced retirements and other losses.
FIGURE 1.2 | SYSTEM - WIDE TRAFFIC AND TOTAL CONTROLLER TRENDS
7 2018 Air Traffic Controller Workforce Plan

8

MEETING THE CHALLENGEThe FAA’s hiring plan is designed to phase in new hires as needed over time. This will avoid creating another major spike in retirement eligibility in future years like the one resulting from the retirement of a large number of control-lers hired after the 1981 controller strike. Annual retirements are leveling off and still well below those experienced in 2007 when the long-anticipated wave of retirements peaked. Retirements are expected to continue to fall for the next decade.
The FAA hires to address all attrition, not just retirements.
We revised the hiring plan to increase FY 2016 through FY 2018 hiring to near-capacity levels so that we can catch up from a variety of challenges. They include: a nearly year-long hiring freeze resulting from sequestration in 2013 and effects from an Office of Personnel Management (OPM) security breach, which shut down the automated ability to process clearances to applicants for approximately one month. The combined impact of these issues disrupted the hiring pipeline and set us back in our staffing plans.
Hiring, however, is just one part of the challenge. Other challenges involve controller placement, controller training and controller scheduling. It is important that newly hired and transferring controllers are properly placed in the facilities where we will need them. Once they are placed, they need to be effectively and efficiently trained, and assigned to efficient work schedules.
To address these challenges, the FAA has:
• Updated the battery of tests collectively referenced as the Air Traffic Skills Assessment (ATSA). ATSA was test-ed, validated and introduced in 2016 to replace the Air Traffic Selection and Training (AT-SAT) battery.
• Revamped its placement process for air traffic controller trainees allowing increased flexibility for the agency and improved efficiency in both hiring and initial training of air traffic controllers.
• Introduced a new collaborative and centralized process to balance the controller ranks by revamping the em-ployee requests for reassignments, matching employee requests with the agency’s needs and establishing a national release policy aimed at expediting requests into facilities with the greatest staffing needs.
Effective and efficient training, as well as properly placing new and transferring controllers, are two important factors in the agency’s success.
Systematically replacing air traffic controllers where we need them, as well as ensuring the knowledge transfer
required to maintain a safe NAS, is the focus of this plan.
9 2018 Air Traffic Controller Workforce Plan

Chapter 2
Facilities and ServicesAmerica’s NAS is a network of people, procedures and equipment. Pilots, controllers, technicians, engineers, inspec-tors and supervisors work together to make sure millions of passengers move through the airspace safely every day.
More than 14,000 federal air traffic controllers in airport traffic control towers, terminal radar approach control facili- ties and air route traffic control centers guide pilots through the system. An additional 1,297 civilian contract control- lers and almost 9,900 military controllers also provide air traffic services for the NAS.
These controllers provide air navigation services to aircraft in domestic airspace, in addition to 24.6 million square miles of international oceanic airspace delegated to the United States by the International Civil Aviation Organization
TERMINAL AND EN ROUTE AIR TRAFFIC SERVICESController teams in airport towers and radar approach control facilities watch over all aircraft traveling through the Ter-minal airspace. Their main responsibility is to organize the flow of aircraft into and out of an airport. Relying on visual observation and radar, they closely monitor each aircraft to ensure a safe distance between all aircraft and to guide pilots during takeoff and landing. In addition, controllers keep pilots informed about changes in weather conditions.
Once airborne, the aircraft quickly departs the Terminal airspace surrounding the airport. At this point, controllers in the radar approach control notify En Route controllers, who take charge in the vast airspace between airports. There are 21 air route traffic control centers around the country. Each En Route center is assigned a block of airspace contain-ing many defined routes. Aircraft fly along these designated routes to reach their destination.
En Route controllers use surveillance methods to maintain a safe distance between aircraft. En Route controllers also provide weather advisory and traffic information to aircraft under their control. As an aircraft nears its destination, En Route controllers transition it to the Terminal environment, where Terminal controllers guide it to a safe landing.
FAA AIR TRAFFIC CONTROL FACILITIESAs of October 1, 2017, the FAA operated 315 air traffic control facilities, including the Air Traffic Control System Command Center. Table 2.1 lists the type and number of these FAA facilities. More than one type of facility may be collocated in the same building.
Each type of FAA facility has several classification levels based on numerous factors, including traffic volume, complexity and sustainability of traffic. To account for changes in traffic and the effect of investments that reduce complexity, as well as to compensate controllers that work the highest and most complex volume of traffic, facilities are monitored for downward and upward trends.
10

TABLE 2.1 | TYPES AND NUMBER OF FAA AIR TRAFFIC CONTROL FACILITIES
TOTAL FACILITIES
TYPE NUMBER OFFACILITIES DESCRIPTION
Tower 131An airport traffic control tower terminal that provides traffic advisories, spacing sequencing, and
Approach Control* 26
An air traffic control facility that provides approach and departure services to IFR and VFR
Tower and Approach Control 132
Combined Control Facility
4
An air traffic control facility that provides approach control services for one or more airports as well as en route air traffic control (center control) for a large area of airspace. Some may provide tower services along with approach control and en route services. Also includes Combined
Air Route Traffic Control Center (ARTCC)/En Route
21 flight plans within controlled airspace and principally during the en route phase of flight. When
Air Traffic Control System Command Center
1
315
The Air Traffic Control System Command Center is responsible for the strategic aspects of the
*These facilities are also known as Terminal Radar Approach Control or TRACON
11 2018 Air Traffic Controller Workforce Plan

The FAA issued the first comprehensive controller workforce plan in December 2004. “A Plan for the Future: 10-Year Strategy for the Air Traffic Control Workforce” detailed the resources needed to keep the controller workforce suffi-ciently staffed. This report is updated each year to reflect changes in traffic forecasts, retirements and other factors.
“Staffing to traffic” requires the FAA to consider many facility-specific factors. They include traffic volumes based on FAA forecasts and hours of operation, as well as individualized forecasts of controller retirements and other non-retire-ment losses. In addition, staffing at each location can be affected by unique facility requirements such as temporary airport runway construction, seasonal activity and the number of controllers currently in training. Staffing numbers will vary as the requirements of the location dictate.
Proper staffing levels also depend on the efficient scheduling of employees, so the FAA tracks a number of indicators as part of its continuous staffing review. Some of these indicators are overtime, time on position, leave usage and the number of trainees. Time on position is defined as the amount of cumulative time controllers spend while “plugged in” to their position controlling live traffic. When not on position, controllers are on periodic breaks, in training, or performing other assigned duties.
In FY 2017, the system average for overtime was 3.5 percent, a slight increase from the FY 2016 level. Meanwhile, cumulative average time on position per eight-hour shift was 4 hours and 8 minutes, the same rate for the past two fiscal years.
Staffing RequirementsChapter 3
12

Figure 3.1 shows the expected end-of-year total headcount (blue line), CPC & CPC-IT headcount (green line), new hires and losses (blue and yellow bars) by year through FY 2027.
Figures for FY 2017 represent actual end-of-year headcount, losses and hires. Losses include retirements, promotions and transfers, resignations, removals, deaths, developmental attrition and academy attrition. The FAA ended FY 2017 with 94 controllers below the 2017 headcount plan.
In general, the FAA strives to keep the number of CPCs and CPC-ITs near the middle of the calculated staffing range. Figure 3.1 shows that FY 2018 staffing values are within the calculated staffing range shown by the “min” and “max” dotted lines. However, a facility’s total staffing levels are often above the defined staffing range because new control- lers are typically hired two to three years in advance of expected attrition to allow for sufficient training time. The total expected end-of-year staffing number shown in Figure 3.1 reflects this projected advanced hiring.
FIGURE 3.1 | PROJECTED CONTROLLER TRENDS
The FAA hires and staffs facilities so that trainees are fullyprepared to take over responsibilities when senior controllers retire.
2017* 2019 2021 2025Fiscal Year
2018 2020 202420232022 2026 2027Fiscal Year
Head
coun
t
14,000
16,000
10,000
6,000
2,000
12,000
8,000
4,000
0
CPC + CPCIT NEW HIRES LOSSES (WITH ACADEMY ATTRITION)HEADCOUNT
MIN
MAX
*Actual
14,481 14,497 14,437 14,115 14,007 13,960 13,956 14,000 14,067 14,138 14,225
11,749 11,614 11,673 11,796 12,248 12,412 12,411 12,450 12,489 12,541 12,594
1,88
01,
848
1,70
11,
685
1,43
11,
491
927 1,24
9
942
1,05
0
946
993
931
935
947
903
971
904
978
907
999
912
13 2018 Air Traffic Controller Workforce Plan

14

STAFFING RANGESEach of the FAA’s air traffic facilities typically staffs open positions with a combination of certified controllers who are proficient, or checked out, in specific sectors or positions. Because traffic and other factors are dynamic at these fa-cilities, the FAA produces facility-level controller staffing ranges. These ranges are calculated to ensure that there are enough controllers to cover operating positions every day of the year.
Ensuring that we have enough controllers is not only important on a daily basis, but also means that we staff to satisfy expected needs two to three years in advance. We do this to ensure sufficient training time for new hires. The uptick caused by hiring two to three years ahead of time is one reason that staffing remains well ahead of traffic.
The FAA uses four data sources to calculate staffing ranges. Three are data driven; the other is based on field judgment. They are:
1. Staffing standards – output of mathematical models used to relate controller workload to air traffic activity.
2. Service unit input – the number of controllers requested to staff the facility, typically based on past position utilization and other unique facility operational requirements. The service unit input is provided by field management.
3. Past productivity – the headcount required to match the historical best productivity for the facility. Productivity is defined as operations per controller. Facility productivity is calculated using operations and controller data from the 10-year period of 2008 to 2017. If any annual point falls outside +/- 5 percent of the 2008 to 2017 average, it is eliminated from the analysis. From the remaining data points, the highest productivity year is then used.
4. Peer productivity – the headcount required to match peer group productivity. Like facilities are grouped by type, level and part-time or full-time status, and their corresponding productivity is calculated. If the facility being considered is consistently above or below the peer group, the peer group figure is not used in the overall average and analysis.
The average of this data is calculated, multiplied by +/- 10 percent and then rounded to determine the high and low points in the staffing range.
Exceptional situations or outliers are removed from the averages (for example, if a change in the type or level of a facility occurred over the period of evaluation). By analyzing the remaining data points, staffing ranges are generated for each facility.
15 2018 Air Traffic Controller Workforce Plan
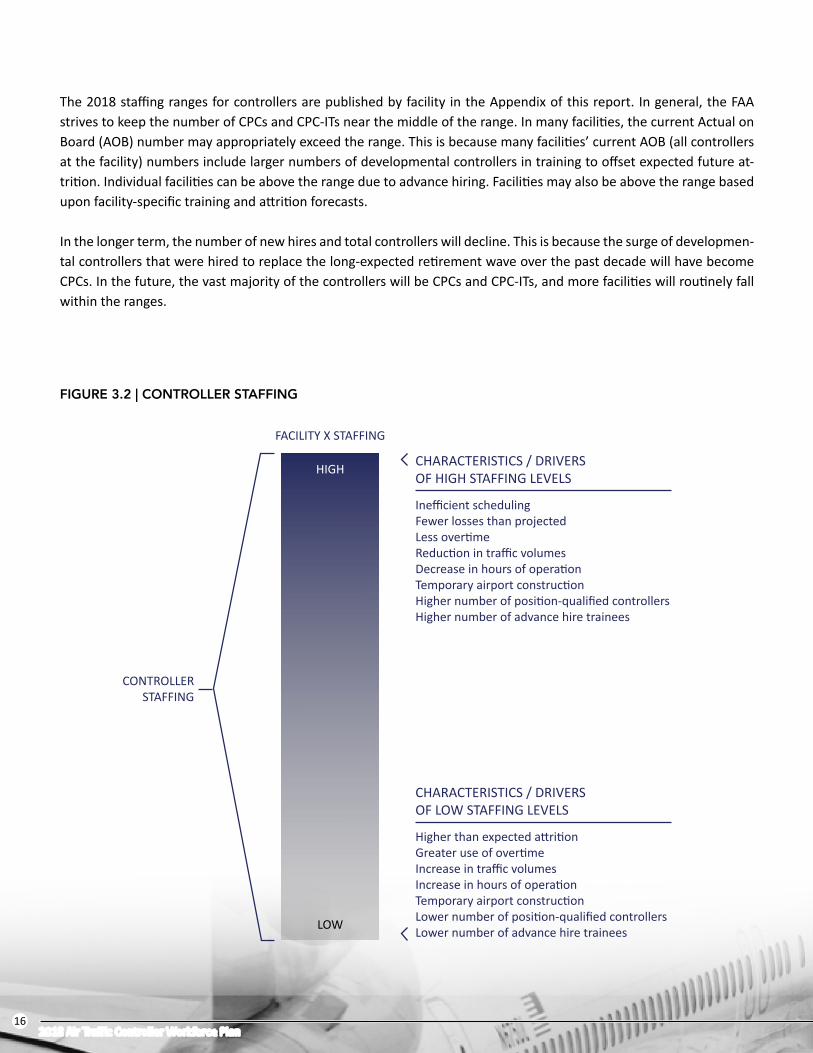
The 2018 staffing ranges for controllers are published by facility in the Appendix of this report. In general, the FAA strives to keep the number of CPCs and CPC-ITs near the middle of the range. In many facilities, the current Actual on Board (AOB) number may appropriately exceed the range. This is because many facilities’ current AOB (all controllers at the facility) numbers include larger numbers of developmental controllers in training to offset expected future at-trition. Individual facilities can be above the range due to advance hiring. Facilities may also be above the range based upon facility-specific training and attrition forecasts.
In the longer term, the number of new hires and total controllers will decline. This is because the surge of developmen-tal controllers that were hired to replace the long-expected retirement wave over the past decade will have become CPCs. In the future, the vast majority of the controllers will be CPCs and CPC-ITs, and more facilities will routinely fall within the ranges.
FIGURE 3.2 | CONTROLLER STAFFING
Inefficient schedulingFewer losses than projectedLess overtimeReduction in traffic volumesDecrease in hours of operationTemporary airport constructionHigher number of position-qualified controllersHigher number of advance hire trainees
CHARACTERISTICS / DRIVERSOF HIGH STAFFING LEVELS
FACILITY X STAFFING
HIGH
LOW
CONTROLLERSTAFFING
Higher than expected attritionGreater use of overtimeIncrease in traffic volumesIncrease in hours of operationTemporary airport constructionLower number of position-qualified controllersLower number of advance hire trainees
CHARACTERISTICS / DRIVERSOF LOW STAFFING LEVELS
16

Figure 3.3 depicts an example of a large Tower and Approach Control facility. This facility is one in which controllers work in the tower cab portion and in the approach control or radar room (also known as a TRACON). To be a CPC in these types of facilities, controllers must be checked out on all positions in both the tower and the TRACON.
Trainees are awarded “D1” status (and the corresponding increase in pay) after being checked out on several positions. The levels of responsibility (and pay) gradually increase as the trainees progress through training. Once developmental controllers are checked out at the D1 level, they can work several positions in the tower independently and without training supervision (Clearance Delivery, Ground Control and Local Control). Once checked out on the Runway Crossing Coordinator position, developmental controllers would be tower-certified and able to work any position in the tower cab independently and without training supervision. They would still not be a “D2” however, as there are also several positions in the TRACON to be checked out on (Arrival Data, Departure Data, Final Vector 1 and Final Vector 2). A con-troller in Figure 3.3 must be certified on all positions in the tower and TRACON to become a CPC.
NOTE: All air traffic control (ATC) facilities have individualized training progression to CPC based upon their type and level of complexity
FIGURE 3.3 | EXAMPLE OF CONTROLLER TRAINING PROGRESSION
17 2018 Air Traffic Controller Workforce Plan

The levels of responsibility continue to increase as one progresses toward CPC status, but trainees can and do con-trol traffic much earlier in the training process. Historically, the FAA has used these position-qualified controllers to staff operations and free up CPCs for more complex positions as well as to conduct training.
Having the majority of the workforce certified as CPCs makes the job of scheduling much easier at the facility. CPCs can cover all positions in their assigned area, whereas position-qualified developmentals require the manager to track who is qualified to work which positions independently. This task becomes much easier with a scheduling tool.
Trainees include both developmental controllers and certified pro-fessional controllers in training (CPC-IT). A CPC-IT is a controller who moves to another area within a facility or to a new facility and must be trained to the qualifications of that new environment. CPC-ITs are dif-ferent from developmentals in that developmentals have never been
fully checked out and certified as a CPC anywhere.
18

AIR TRAFFIC STAFFING STANDARDS OVERVIEWThe FAA has used air traffic staffing standards to help determine controller staffing levels since the 1970s and they are periodically updated to reflect changes in workload, equipment and procedures.
FAA facilities are currently identified and managed as either Terminal facilities where airport traffic control services are provided, including the immediate airspace around an airport, or En Route facilities where high-altitude sepa-ration services are provided using computer systems and surveillance technologies. Terminal facilities are further designated as tower cabs or TRACONs. These Terminal facilities may be collocated in the same building, but because of differences in workload, their staffing requirements are modeled separately. Figure 3.4 provides an overview of FAA facilities and air traffic control positions.
FIGURE 3.4 | AIR TRAFFIC CONTROL POSITION AND FACILITY OVERVIEW
19 2018 Air Traffic Controller Workforce Plan

The dynamic nature of air traffic controller workload coupled with traffic volume and facility staffing needs are all taken into account during the development of FAA staffing models and standards.
All FAA staffing models incorporate similar elements:
• Controller activity data is collected and processed quarterly, commensurate with the type of work being performed in the facilities.
• Models are developed that relate controller workload to air traffic activity. These requirements are entered into a scheduling algorithm.
• The modeled workload/traffic activity relationship is forecast for the 90th percentile (or 37th busiest) day for future years for each facility. Staffing based on the demands for the 90th percentile day assures that there are adequate numbers of controllers to meet traffic demands throughout the year.
• Allowances are applied for off-position activities such as vacation, training and additional supporting activities that must be accomplished off the control floor.
All staffing models go through similar development processes. Some components of the model-development phase vary as a function of the work being performed by the controllers. For example, a crew-based approach was used to model tower staffing requirements because the number and type of positions in a tower cab vary considerably as traffic changes, compared to those of a single sector in a TRACON or En Route center. All staffing models reflect the dynamic nature of staffing and traffic. Controller staffing requirements can vary throughout the day and throughout the year.
TOWER CAB OVERVIEWAir traffic controllers working in tower cabs manage traffic within a radius of a few miles of the airport. They instruct pilots during taxiing, takeoff and landing, and they grant clearance for aircraft to fly. Tower controllers ensure that aircraft maintain minimum separation distances between landing and departing aircraft, transfer control of aircraft to TRACON controllers when the aircraft leave their airspace, and receive control of aircraft for flights coming into their airspace.
• There are a variety of positions in the tower cab, such as Local Control, Ground Control, Flight Data, Coordinator, etc. Depending on the airport layout and/or size of the tower cabs (some airports have more than one tower), there can be more than one of the same types of position on duty.
• As traffic, workload and complexity increase, more or different positions are opened; as traffic, workload and complexity decrease, positions are closed or combined with other positions. In practice, minimum staffing levels may be determined by hours of operation and work rules.
Important factors that surfaced during the tower staffing model development included the availability, accessibility and increased reliability of traffic data and controller on-position reporting systems. The FAA is now able to analyze much larger quantities of tower data at a level of granularity previously unattainable. Staffing data and traffic volumes are collected for every facility.
The tower cab staffing models were updated in early 2008. The revised tower cab staffing models were developed using regression analysis as the primary method for modeling the relationship between staffing and workload drivers. The models relate observed, on-position controllers to the type and amount of traffic they actually handle. Regression analysis allows us to relate modeled controller staffing requirements with traffic activity and then use this relationship to predict future staffing requirements (standards) based on traffic projections.
20

TRACON OVERVIEWAir traffic controllers working in TRACONs typically manage traffic within a 40-mile radius of the primary airport; how-ever, this radius varies by facility. They instruct departing and arriving flights, and they grant clearance for aircraft to fly through the TRACON’s airspace. TRACON controllers ensure that aircraft maintain minimum separation distances between landing and departing aircraft, transfer control of aircraft to tower or En Route center controllers when the aircraft leave their airspace, and receive control of aircraft for flights coming into their airspace.
• TRACON airspace is divided into sectors that often provide services to multiple airports. Consolidated or large TRACONs in major metropolitan areas provide service to several primary airports. Their airspace is divided into areas of specialization, each of which contains groups of sectors.
• Controllers are assigned to various positions such as Radar, Final Vector, Departure Data, etc., to work traffic within each sector. These positions may be combined or de-combined based on changes in air traffic operations.
• As traffic, workload and complexity increase, the sectors may be subdivided (de-combined) and additional positions opened, or the sector sizes can be maintained with an additional controller assigned to an assistant position within the same sector.
• Similarly, when traffic, workload and complexity decline, the additional positions can be closed or the sectors recombined. In practice, minimum staffing levels may be determined by hours of operation and work rules.
Like the tower analysis, the FAA is able to analyze much larger quantities of TRACON data at a level of granularity pre-viously unattainable. Important factors surfaced during the TRACON staffing model review including the availability, accessibility and increased reliability of traffic data and controller on-position reporting systems. Staffing data and traffic volumes were collected for every facility.
The TRACON staffing models were updated in early 2009. These revised TRACON models were developed using regres-sion analysis as the primary method for modeling the relationship between staffing and workload drivers. The models relate observed, on-position controllers to the type and amount of traffic they actually handled. Regression allows us to relate modeled controller staffing requirements with traffic activity and then use this relationship to predict future staffing requirements (standards) based on traffic projections.
21 2018 Air Traffic Controller Workforce Plan

EN ROUTE OVERVIEWAir traffic controllers assigned to En Route centers guide aircrafts flying outside of Terminal airspace. They also provide approach control services to small airports around the country where no Terminal service is provided. As aircraft fly across the country, pilots talk to controllers in successive En Route centers.
• En Route center airspace is divided into smaller, more manageable blocks of airspace called areas and sectors.
• Areas are distinct, and rarely change based on changes in traffic. Within those areas, sectors may be combined or de-combined based on changes in air traffic operations.
• Controllers are assigned to positions within the sectors (e.g., Radar, Radar Associate, Tracker). As traffic increases, sectors can be de-combined and additional positions opened, or the sector sizes can be maintained but additional controllers added to assistant positions within the sectors.
• Similarly, when traffic declines, the additional positions can be closed or the sectors recombined. In practice, minimum staffing levels may be determined by hours of operation and work rules.
The FAA’s Federally Funded Research and Development Center, operated by the MITRE Corporation, developed a mod-el to generate data needed for the FAA’s staffing models. Like the tower and TRACON standards models, this approach incorporated actual traffic and more facility-specific data.
MITRE’s modeling approach reflects the dynamic nature of the traffic characteristics in a sector. It estimates the num-ber of controllers, in teams of one to three people, necessary to work the traffic for that sector in 15-minute intervals. Differences in traffic characteristics in a sector could require different numbers of controllers to handle the same volume of traffic. For example, at one time most traffic might be cruising through a sector toward another location requiring minimal controller intervention. At another time, traffic might be climbing and descending through the same sector, a more complex scenario requiring more controllers. The same modeling techniques were applied uniformly to all sectors, providing results based on a common methodology across the country.
During FY 2013 and FY 2014, MITRE collaborated with the FAA and the National Air Traffic Controllers Association (NATCA) to conduct an evaluation of the En Route on-position staffing model at the request of the National Academy of Sciences to validate its core assumptions and parameters via empirical data collection. The evaluation, completed in the field and in a controlled laboratory setting, established values for model parameters, identified additional control-ler tasks for coverage by the model, and informed other enhancements to the model. In FY 2015, these updates were made and the on-position staffing model was re-calibrated. The evaluation results were shared with the FAA, NATCA and the National Academy of Sciences. In FY 2016, the evaluation results were incorporated into the on-position staff-ing model.
SUMMARYThe FAA’s staffing models incorporate output provided by the Tower, TRACON and En Route workload models which is run through a shift scheduling algorithm. Next, factors are applied to cover vacation time, break time, training, etc. Lastly, traffic growth forecasts are applied to provide the annual staffing standards that are incorporated into the staff-ing ranges presented in this plan for each facility.
22

AIR TRAFFIC CONTROLLER SCHEDULINGOptimizing controller schedules is a critical aspect of efficient workforce planning, since inefficient facility schedules can lead to excess staffing and/or increased overtime. Currently, the FAA’s air traffic facilities do not have access to a standardized, automated tool to assist them in developing optimal schedules and analyzing long-term workforce planning requirements. FAA facilities currently use a variety of non-standard methods that do not fully incorporate the complex resource management requirements that exist in today’s environment.
To address this need, the FAA is in the process of implementing a widely used, commercially available “off-the-shelf” system that has been configured to FAA-specific requirements (e.g., national labor contract terms, FAA policy). The FAA’s Operational Planning and Scheduling (OPAS) tool will provide a common tool set for FAA facilities to effectively develop and maintain optimal schedules based on traffic, staffing, work rules and employee qualifications. Similar sys-tems are being used by air navigation service providers worldwide and are commonplace in best-practice companies.
AIR TRAFFIC SCHEDULING SOFTWARE IMPLEMENTATIONIn November 2017, FAA’s Air Traffic Organization (ATO) initiated air traffic managers training on OPAS at 35 facilities. Training completion is scheduled for May 2018. ATO is currently determining an implementation strategy for the re-maining air traffic facilities.
Air Navigation Service Providers “in other countries including Australia, Canada, and Germany have replaced their legacy scheduling tools with
sophisticated software capable of incorporating all constraints while generating efficient controller schedules.” – National Academy of Sciences
CompletionZMA MIAMI ARTCC 2/9/18ZHU HOUSTON ARTCC 2/9/18I90 HOUSTON TRACON 2/9/18ZJX JACKSONVILLE ARTCC 2/16/18F11 CENTRAL FLORIDA TRACON 2/16/18ZKC KANSAS CITY ARTCC 2/16/18ZME MEMPHIS ARTCC 3/2/18ZAN ANCHORAGE ARTCC 3/2/18ZTL ATLANTA ARTCC 3/9/18A80 ATLANTA TRACON 3/9/18ZAU CHICAGO ARTCC 3/9/18C90 CHICAGO TRACON 3/9/18ORD CHICAGO O’HARE TOWER 3/9/18ZAB ALBURQUEERQUE ARTCC 3/16/18ZID INDIANAPOLIS ARTCC 3/23/18ZDV DENVER ARTCC 3/23/18ZMP MINNEAPOLIS ARTCC 4/6/18
CompletionZFW FORT WORTH ARTCC 4/6/18D10 DALLAS-FORT WORTH TRACON 4/6/18ZLC SALT LAKE ARTCC 4/13/18ZDC WASHINGTON ARTCC 4/20/18PCT POTOMAC TRACON 4/20/18ZLA LOS ANGELES ARTCC 4/20/18LAX LOS ANGELES TOWER 4/20/18SCT SOUTHERN CALIFORNIA TRACON 4/20/18ZNY NEW YORK ARTCC 5/4/18ZOA OAKLAND ARTCC 5/4/18NCT NORTHERN CALIFORNIA TRACON 5/4/18N90 NEW YORK TRACON 5/11/18ZSE SEATTLE ARTCC 5/11/18HCF HONOLULU CONTROL FACILITY 5/11/18ZBW BOSTON ARTCC 5/18/18A90 BOSTON TRACON 5/18/18ZOB CLEVELAND ARTCC 5/18/18
23 2018 Air Traffic Controller Workforce Plan
TECHNOLOGICAL ADVANCESA new foundational infrastructure along with transformational programs continue to modernize the NAS as part of the Next Generation Air Transportation System (NextGen). These contribute to the NextGen goal of Trajectory Based Oper-ations (TBO), which will manage traffic with the knowledge of where an aircraft will be at critical points during its flight.
En Route Automation Modernization (ERAM), Automatic Dependent Surveillance– Broadcast (ADS-B) and System Wide Information Management (SWIM) are fully implemented and used by controllers. ERAM and SWIM will continue to evolve with technology refreshes and enhancements while the Standard Terminal Automation Replacement System (STARS), Terminal Flight Data Manager (TFDM), NAS Voice System (NVS) and Data Communications (Data Comm) are near full implementation or are anticipated in the years ahead.
Two examples of advances for terminal controllers come from the Data Comm and Terminal Automation Moderniza-tion and Replacement (TAMR) programs. Data Comm’s departure clearance service has been provided to the initial commitment of 55 airport towers and the program has been authorized to be installed at seven more airports. The TAMR program has completed, ahead of schedule, its installation of STARS at the 11 large Terminal Radar Approach Control (TRACON) facilities. TAMR continues to deploy and upgrade STARS at 39 of the 133 remaining TRACONs.
Data Comm provides a digital data communication link between air traffic controllers and pilots. About 36,000 flights per week used the departure clearance service in 2017. The FAA is realizing the benefits of reduced taxi-out delays, reduced gate delays, fewer communication errors, and improved pilot and controller efficiency credited to less time spent communicating over voice. According to one FAA analysis across two months of data collection at four airports, Data Comm on average resulted in taxi-out time savings between 0.2 and 8.5 minutes per rerouted flight.
With tower service in full operation, initial en route Data Comm is the next part to be implemented starting in 2019. Controllers will be able to reroute, hand off aircraft to the next center, and send messages to change altitude. Pilots also will be able to send requests to controllers using the data link. When full en route services are available beginning in 2022, additional messages will become possible, including full holding instructions, crossing restrictions, direct-to- fix messages, controller-initiated routes, and advisory messages. Data Comm also enables future NextGen services, including TBO.
TAMR upgrades multiple air traffic control technologies to a single, state-of-the-art platform: STARS. This platform along with the ERAM system form the FAA foundational technology supporting NextGen. They enable ADS-B and oth-er NextGen capabilities, giving air traffic controllers a more complete airspace picture that will be necessary for TBO.
STARS offers new features that make the system easier for controllers to use than the aging systems it is replacing. Keyboard backlighting can be adjusted to improve visibility for easier data entry while flat-panel LED displays increase the traffic picture quality. Controllers can assign a color to an aircraft to make it easier to follow, and with a recall ca-pability, workstation settings preferred by an individual controller can be saved and retrieved at the touch of a button.
Weather displays show six different levels of radar returns to provide a better view of storms for controllers as they work with pilots to steer aircraft around hazardous weather. Using multiple radars and ADS-B, STARS can track 1,300 aircraft in a 400-square-nautical-mile area to provide controllers with a clearer view of overall operations.
STARS also assists with terrain avoidance and conflict alerts. A minimum separation capability enables controllers to select two aircraft and ensure the required separation will be maintained, and a data block feature automatically lists the number of aircraft in a formation—a function that previously had to be performed manually.
24

Reliability should improve as STARS includes two redundant systems as a backup that can be activated with the flip of a switch, and an infrastructure that is easier for technicians to maintain because a common system will be present at all TRACONs.
ADS-B Out, which will be mandatory by January 1, 2020, for aircraft operating in most controlled U.S. airspace, has been integrated into automation platforms at all en route air traffic control facilities and major terminal radar facilities. Full TRACON deployment is expected to be completed by 2020. The FAA completed the nationwide deployment of ADS-B ground stations in 2014, and ADS-B traffic and weather broadcasts are available nationwide. As of January 2018, more than 42,000 aircraft have been equipped with ADS-B avionics.
NVS is the Voice over Intranet Protocol system that will carry the ground portion of voice communications digitally over the secure FAA Telecommunications Infrastructure (FTI). Once it’s deployed nationwide, NVS will serve all FAA air traffic control facilities. NVS software began testing in 2017. Deployment of NVS is expected to begin as early as 2020.
SWIM streamlines shared information for improved planning and execution. Airlines and other users are able to more efficiently access the most current information affecting their area than they were able to using legacy systems, there-by improving decision-making. The SWIM Visualization Tool (SVT) is used at 12 air traffic control facilities across the country and was enhanced to include traffic flow management data, specifically gate assignment information that airline partners started to publish into SWIM.
SVT deployment is supporting early implementation of TFDM. Another component of TFDM early implementation is the prototype Advanced Electronic Flight Strips (AEFS) system, which replaces traditional paper flight strips and manu-al tracking of incoming and outgoing flights with an electronic flight data display. The prototype AEFS was implemented in the Phoenix, Charlotte and Cleveland towers to provide feedback and lessons learned into the TFDM design and im-plementation. Phoenix is set to receive TFDM in January 2020, the first of 89 sites scheduled to receive the production electronic flight strip system along with additional surface management capabilities.
For other decision support systems, the FAA continues to develop future concepts for Traffic Flow Management System modeling and predicting capabilities, and a seven-day FAA Academy course for controllers at the FAA Mike Monroney Aeronautical Center in Oklahoma City, OK, has been effective in reducing the national Time Based Flow Management training shortfall. Most of the workforce has completed the training, which has improved the skills and knowledge level of our air traffic management staff. TBO is a time-based management system, so a solid understanding and use of TBFM in conjunction with Performance Based Navigation (PBN) are at the core of TBO’s success.
The NextGen Advisory Committee (NAC) identified a fifth focus area called the Northeast Corridor (NEC) in 2017. The NEC is looking to improve operations in the busy airspace between Washington, D.C., and Boston. This focus area joins the other high-priority, high-readiness NextGen capabilities identified in 2014 of increasing the use of PBN, making multiple runway operations more efficient, improving surface operations and data sharing, and implementing Data Comm. The FAA has met 157 of 161 planned commitments in the original four areas as of the end of fiscal year 2017.
Increased productivity and efficiency, and their ultimate impact on the size and composition of the FAA’s workforce, depend on many factors. The scope and precise impact of NextGen enhancements are unknown as they are still under development. Final impacts are still to be determined given the complex nature of the interaction of controllers and their tools.
The relationship between pilots and air traffic controllers as well as the relationship between controllers and automat- ed systems will evolve. These changes will occur gradually and require continued testing and analysis to ensure the safety of the NAS. Implementing TBO in the NAS will require the integration of multiple systems, training, and a culture change by controllers and pilots..
25 2018 Air Traffic Controller Workforce Plan

26

LossesIn total, the FAA expects to lose over 1,600 controllers due to retirements, promotions and other losses this fiscal year. Other controller losses include transfers, resignations, removals, deaths, developmental attrition and academy attrition.
The FAA hires and staffs facilities so that trainees are fully prepared to take over responsibilities when senior control-lers leave.
CONTROLLER LOSS SUMMARYTable 4.1 shows the total estimated number of controllers that will be lost, by category, over the period FY 2018 through FY 2027.
Chapter 4
FIGURE 4.1 | CONTROLLER LOSS SUMMARY
27 2018 Air Traffic Controller Workforce Plan

ACTUAL CONTROLLER RETIREMENTSFiscal year 2007 was correctly projected to be a peak year for retirements of controllers hired in the early 1980s. The long-anticipated retirement wave has passed. Annual retirements decreased for a few years then increased during fis-cal years 2010 to 2015, but still below the 2007 peak, and are leveling off. In the last five years, 3,354 controllers have retired. Fiscal year 2017 retirements were lower than projected, and future retirements are expected to fall over the next decade..
CUMULATIVE RETIREMENT ELIGIBILITYThe table below shows historical and forecasted Controller Retirement Eligibility from FY 2005 to FY 2027. Data shows a significant decline in the number of controllers eligible to retire from the peak in FY 2012 to FY 2025. At the end of fiscal year 2017, only 45 controllers remain from those who were hired before 1984. This clearly demonstrates that the controller retirement wave is over.
FIGURE 4.1A | ACTUAL CONTROLLER RETIREMENTS
FIGURE 4.1B | CUMULATIVE RETIREMENT ELIGIBILITY
2005 2007 2009 20132011 2021Fiscal Year
201920172015 2023 2025 2027Fiscal Year
Num
ber o
f Con
trol
lers
3,000
1,000
2,000
0
ACTUAL CUMULATIVE ELIGIBILITY FORECASTED CUMULATIVE ELIGIBILITY
THE NUMBER OF RETIREMENT ELIGIBLE CONTROLLERS IS RAPIDLY DROPPING
28
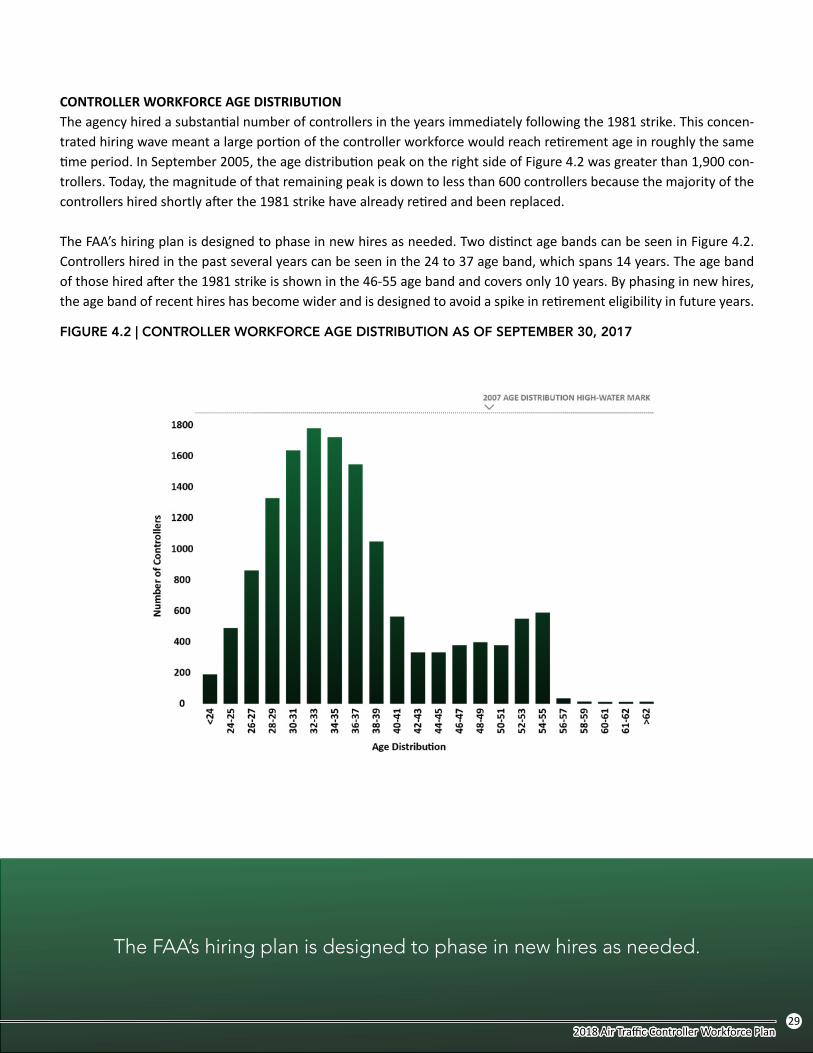
CONTROLLER WORKFORCE AGE DISTRIBUTIONThe agency hired a substantial number of controllers in the years immediately following the 1981 strike. This concen-trated hiring wave meant a large portion of the controller workforce would reach retirement age in roughly the same time period. In September 2005, the age distribution peak on the right side of Figure 4.2 was greater than 1,900 con-trollers. Today, the magnitude of that remaining peak is down to less than 600 controllers because the majority of the controllers hired shortly after the 1981 strike have already retired and been replaced.
The FAA’s hiring plan is designed to phase in new hires as needed. Two distinct age bands can be seen in Figure 4.2. Controllers hired in the past several years can be seen in the 24 to 37 age band, which spans 14 years. The age band of those hired after the 1981 strike is shown in the 46-55 age band and covers only 10 years. By phasing in new hires, the age band of recent hires has become wider and is designed to avoid a spike in retirement eligibility in future years.
FIGURE 4.2 | CONTROLLER WORKFORCE AGE DISTRIBUTION AS OF SEPTEMBER 30, 2017
The FAA’s hiring plan is designed to phase in new hires as needed.
29 2018 Air Traffic Controller Workforce Plan

CONTROLLER RETIREMENT ELIGIBILITYIn addition to normal civil service retirement criteria, controllers can become eligible under special retirement criteria for air traffic controllers (age 50 with 20 years of “good time” service or any age with 25 years of “good time” service). “Good time” is defined as service in a covered position, as defined in Public Law 92-297. Under Public Law 92-297, air traffic controllers are usually required to retire at age 56.
After computing eligibility dates using all criteria, the FAA assigns the earliest of the dates as the eligibility date. Eligibility dates are then aggregated into classes based on the fiscal year in which eligibility occurs.
Figure 4.3 shows the number of controllers who are currently retirement eligible as of September 2017 and those projected to become retirement-eligible each fiscal year through FY 2027. Agency projections show that an additional 115 controllers will become eligible to retire in FY 2018. The number of retirement-eligible controllers has been in decline in recent years from the peak and should continue to decline for the next few years.
Due to advance hiring, we have sufficient new hires in place to replace controllers currently eligible to retire when they do retire. The FAA strives to minimize retirement, hiring and training spikes through the process of examining trends and proactively planning years in advance of expected activity.
FIGURE 4.3 | RETIREMENT ELIGIBILITY
Num
ber o
f Con
trol
lers
1500
2000
500
1000
2500
3000
0
2012 ELIGIBILITY HIGH-WATER MARK
928 OF THE CURRENT CONTROLLERS ELIGIBILE FOR RETIREMENT WILL REACH MANDATORY RETIREMENT AGE WITHIN THE NEXT 3 YEARS.
CONTROLLERSELIGIBLE AT THEEND OF FISCAL
YEAR 2017
2018 2019 20212020 2025Fiscal Year
202420232022 2026 2027
1,727
928
799
115 123 149 149215 236
123189 272 323
30

CONTROLLER RETIREMENT PATTERNHistory shows that not all controllers retire when they first become eligible. In recent years, 16 percent of controllers who first became eligible actually retired.
The FAA has observed that many controllers delay retirement until they get closer to the mandatory retirement age of 56. Because most controllers are retirement eligible at the age of 50, they typically reach mandatory retirement age in their seventh year of eligibility.
These trends are seen in Figure 4.4 below, which shows fewer controllers are retiring earlier in their eligibility and are waiting until closer to their mandatory retirement age.
Despite the increased likelihood of delayed retirement, the majority of controllers still leave the controller workforce prior to reaching the mandatory age.
FIGURE 4.4 | PERCENT OF CONTROLLERS RETIRING IN THE NTH FISCAL YEAR OF THEIR ELIGIBILITY
31 2018 Air Traffic Controller Workforce Plan

CONTROLLER LOSSES DUE TO RETIREMENTSFor the current plan, the agency incorporated FY 2013 to FY 2017 retirement data into the retirement histogram used for future retirement.
As in prior years, the FAA projected future retirements by analyzing both the eligibility criteria of the workforce (Figure 4.3) and the pattern of retirement based on eligibility (Figure 4.4).
For each eligibility class (the fiscal year the controller first becomes eligible to retire), the agency applied the histogram percentage in Figure 4.3 to the retirement pattern in Figure 4.4 to estimate in Figure 4.5 the retirements for each class by year.
FIGURE 4.5 | RETIREMENT PROJECTION
FY 2007 provided the high-water mark for controller retirements.
Annual retirements are expected to continue to decline for the next decade.
500
600
300
200
100
400
700
800
0
2007 ACTUAL RETIREMENT HIGH-WATER MARK
20182017* 2019 20212020 2025Fiscal Year
202420232022 2026 2027
642
548
464
402
319
276232
207 205 215230
Num
ber o
f Con
trol
lers
*Actual
32

CONTROLLER LOSSES DUE TO RESIGNATIONS, REMOVALS AND DEATHSEstimated controller losses due to resignations, removals (excluding developmental attrition) and deaths are based on historical rates and shown in Table 4.2.
DEVELOPMENTAL ATTRITIONEstimated losses of trainees who terminate from the FAA while still in developmental status are shown in Table 4.3. Hiring from FY 2013 to FY 2015 was lower than projected, which caused the need for increased hiring at near-capacity levels from FY 2016 through FY 2018. Correspondingly, this plan incorporates a projected increase in developmental attrition for FY 2016 through FY 2020 as hires from these years progress through their training program.
TABLE 4.2 | CONTROLLER LOSSES DUE TO RESIGNATIONS, REMOVALS AND DEATHS
TABLE 4.3 | DEVELOPMENTAL ATTRITION
33 2018 Air Traffic Controller Workforce Plan

ACADEMY ATTRITIONEstimates of losses from new hires that are not successful in the FAA Academy training program are based on both historical rates and projections, and are shown in Table 4.4. The projected academy attrition in this plan is higher than the projections in prior plans. This was driven by observed higher failure rates at the FAA Academy recently. The FAA will continue to monitor academy failure rates moving forward for the impact of these changes and adjust future projections accordingly. In addition, hiring from FY 2013 to FY 2015 was lower than projected, which causes the need for increased hiring at near-capacity levels from FY 2016 through FY 2018. Correspondingly, this plan incorporates a projected increase in academy attrition for FY 2018 through FY 2019 as hires from these years progress through their training program.
CONTROLLER LOSSES DUE TO PROMOTIONS AND OTHER TRANSFERSThis section presents FAA estimates of controller losses due to internal transfers to other positions (staff support specialists, traffic management coordinators, etc.) and controller losses due to promotions to front line manager (FLM) or air traffic management/supervisory positions.
Over the past five years, we’ve observed an average of 155 net promotions each year from CPC to supervisory positions. The majority of these promotions replace retiring supervisors. We expect total net transfers and promotions to increase slightly, to peak at 357 in FY 2019 and to slightly fall in future years as seen in Figure 4.6.
TABLE 4.4 | ACADEMY ATTRITION
FIGURE 4.6 | CONTROLLER LOSSES DUE TO PROMOTIONS AND OTHER TRANSFERS
34

TOTAL CONTROLLER LOSSESThe FAA projects a total loss of 11,029 controllers over the next 10 years. Should losses outpace projections for FY 2018, the FAA will hire additional controllers to reach the end-of-year goal of 14,497 air traffic controllers on board.
FIGURE 4.7 | TOTAL CONTROLLER LOSSES
1500
1700
1900
1100
900
700
500
300
1300
0
100
2011*2009* 2013* 2017*2015* 2025Fiscal Year
202320212019 2027
907903 912
993
1,249
1,685
1,374
1,245
1,132
904935
1,050
1,491
1,848
1,532
1,302
1,1021,072
1,342
ACADEMY TRAINING ATTRITION DEVELOPMENTAL LOSSES PROMOTIONS AND TRANSFERS RESIGNATION, REMOVAL, AND DEATH RETIREMENT
Num
ber o
f Con
trol
lers
*Actual
35 2018 Air Traffic Controller Workforce Plan

36

Hiring PlanThe FAA safely operates and maintains the NAS because of the combined expertise of its people, the support of tech-nology and the application of standardized procedures. Every day tens of thousands of aircraft are guided safely and expeditiously through the NAS to their destinations.
Deploying a well-trained and well-staffed air traffic control workforce plays an essential role in fulfilling this respon-sibility. The FAA’s current hiring plan has been designed to phase in new hires as needed. To staff the right number of people in the right places at the right time, the FAA develops annual hiring plans that are responsive to changes in traffic and in the controller workforce.
The FAA hires new developmental controllers in advance of the agency’s staffing needs in order to have ample time to train them to offset future attrition, including retirements, promotions, etc. Proper execution of the hiring plan, while flexibly adapting to the dynamic nature of traffic and attrition, is critical to the plan’s success. If the new developmentals are not placed correctly or if CPCs are not transferred from other facilities, shortages could occur at individual facilities that may affect schedules, increase overtime usage or require the use of more developmentals on position.Staffing is and will continue to be monitored at all facilities throughout the year. The agency will continue to modify the hiring plan at the facility level should adjustments become necessary due to changes in traffic volume, retirements or other attrition.
The FAA continues to be able to attract large numbers of qualified controller candidates. Through a revised two-track controller hiring process, and use of the updated Employee Request Reassignment process, the FAA will attract and recruit a sufficient number of applicants to achieve this hiring plan
Chapter 5
37 2018 Air Traffic Controller Workforce Plan

CONTROLLER HIRING PROFILEThe controller hiring profile is shown in Figure 5.1. The FAA hired 1,880 controllers compared with the plan of 1,781 controllers in FY 2017. Missed hiring goals in prior years created a significant backlog and subsequently increased the need for new controller hiring for several fiscal years into the future. We currently plan to spread hiring through FY 2020, raising hiring projections in those years relative to last year’s plan. We spread the hiring to support better predictability at the academy and facilities, and to smooth out workload for our medical and security personnel. The number of controllers projected to be hired through FY 2027 is 10,773.
FIGURE 5.1 | CONTROLLER HIRING PROFILE
The FAA hired 1,680 controllers in FY 2016 and 1,880 in FY 2017.
2017* 2019 2021 2025Fiscal Year
2018 2020 202420232022 2026 2027Fiscal Year
Head
coun
t
1800
2000
800
1200
400
0
PLANNED HIRES ESTIMATED LOSSES
1,88
01,
848
1,70
11,
685
1,43
11,
491
927
1,24
9
942
1,05
0
946 99
3
931
935
947
903 97
190
4 978
907 99
991
2
*Actual
38

TRAINEE-TO-TOTAL-CONTROLLER PERCENTAGEThe hiring plan allows the FAA to maintain an appropriate number of trainees (developmental and CPC-IT) in the work-force. The percentage shown is calculated as the sum of CPC-ITs plus developmentals divided by all controllers. While the FAA strives to keep the trainee percentage below 35 percent for both Terminal and En Route controllers, it is not the only metric used by the agency to measure trainee progress.
Figure 5.2 shows the projected trainee-to-total-controller percentages for En Route and Terminal by year to 2027.
While Terminal facilities are showing a decline through 2022, there is a slight uptick in the En Route percentage for the next couple of years as controllers in the current developmental pipeline become fully certified. Note the trainee percentage for both En Route and Terminal is still well below 35 percent. In general, the En Route trainee ratio exceeds the Terminal ratio primarily because of the longer times to certify (on average) in En Route facilities.
FIGURE 5.2 | TRAINEE-TO-TOTAL-CONTROLLER PERCENTAGE
39 2018 Air Traffic Controller Workforce Plan
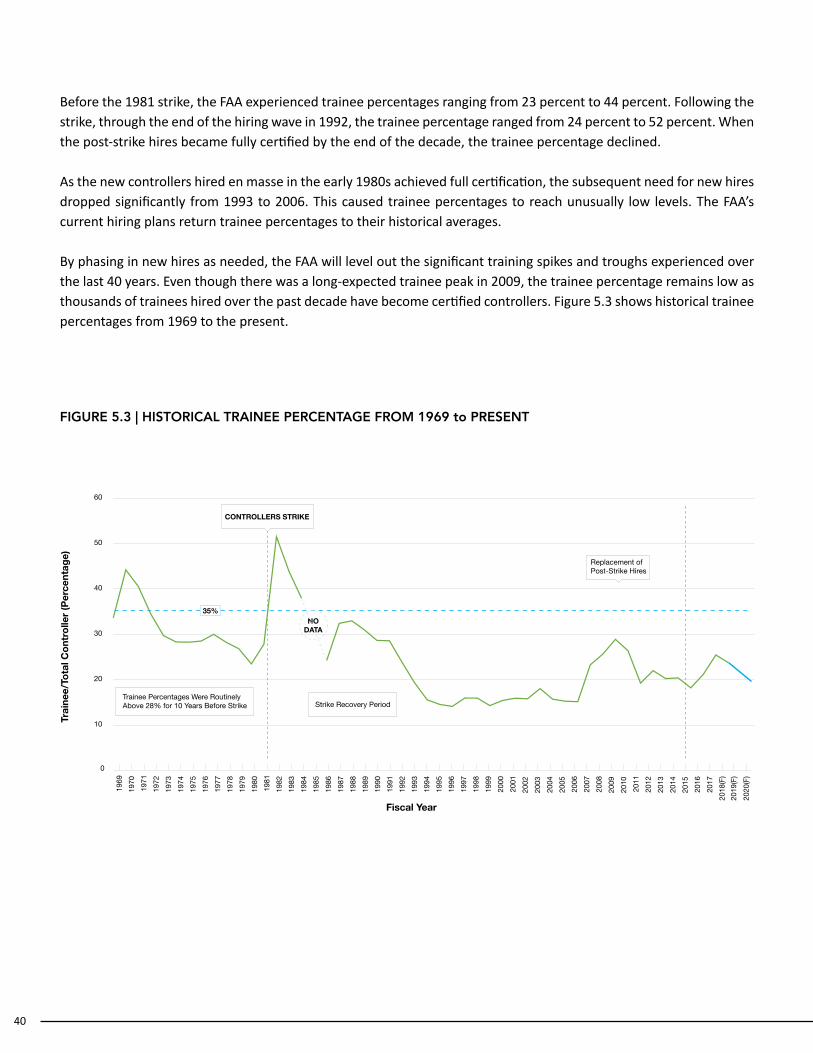
Before the 1981 strike, the FAA experienced trainee percentages ranging from 23 percent to 44 percent. Following the strike, through the end of the hiring wave in 1992, the trainee percentage ranged from 24 percent to 52 percent. When the post-strike hires became fully certified by the end of the decade, the trainee percentage declined.
As the new controllers hired en masse in the early 1980s achieved full certification, the subsequent need for new hires dropped significantly from 1993 to 2006. This caused trainee percentages to reach unusually low levels. The FAA’s current hiring plans return trainee percentages to their historical averages.
By phasing in new hires as needed, the FAA will level out the significant training spikes and troughs experienced over the last 40 years. Even though there was a long-expected trainee peak in 2009, the trainee percentage remains low as thousands of trainees hired over the past decade have become certified controllers. Figure 5.3 shows historical trainee percentages from 1969 to the present.
FIGURE 5.3 | HISTORICAL TRAINEE PERCENTAGE FROM 1969 to PRESENT
35%
Replacement ofPost-Strike Hires
CONTROLLERS STRIKE
NODATA
0
10
20
30
40
50
60
Fiscal Year
Trai
nee/
Tota
l Con
trol
ler (
Perc
enta
ge)
2018
(F)
2019
(F)
2020
(F)
2017
2016
2015
2014
2013
2012
2011
2010
2009
2008
2007
2006
2005
2004
2003
2002
2001
2000
1999
1998
1997
1996
1995
1994
1993
1992
1991
1990
1989
1988
1987
1986
1985
1984
1983
1982
1981
1980
1979
1978
1977
1976
1975
1974
1973
1972
1971
1970
1969
Trainee Percentages Were Routinely Above 28% for 10 Years Before Strike Strike Recovery Period
40

The FAA uses many metrics (e.g., 35 percent trainee to total controllers) to manage the flow of trainees while accomplishing daily operations. Facilities meter training to coincide with a number of dynamic factors, including technology upgrades, new runway construction and recurrent proficiency training for existing CPCs. Facility training is enabled by many factors. Examples include the use of contract instructors, access to simulators, scheduled overtime, and the seasonality and complexity of operations.
In itself, the actual number of trainees does not indicate the progress of each individual in the training program or the additional utility they provide that can help to supplement other on-the-job training instruction and support operations. A key facility measure of training performance is the measurement of trainee completion time against the goals. The goal ranges from one-and-a-half years at our lower-level Terminal facilities to three years at our En Route facilities
The FAA is striving to meet these goals by improving training and scheduling processes through increased use of simulators and better tracking of controller training using the FAA’s national training database.
The FAA will continue to closely monitor facilities to make sure trainees are progressing through each stage of training while also maintaining the safe and efficient operation of the NAS.
41 2018 Air Traffic Controller Workforce Plan

Hiring ProcessCONTROLLER HIRING SOURCESThe FAA has two primary categories of controller hiring sources.
• No prior air traffic control specialist (ATCS) experience: These individuals are not required to have prior air traffic control experience and may apply for vacancies announced by the FAA.
• Prior ATCS experience: These individuals have at least 52 weeks of certified air traffic control experience and may apply for vacancies announced by the FAA.
RECRUITMENTThe agency continues to attract and recruit high-quality applicants into the controller workforce to meet staffing requirements.
In FY 2014, the FAA instituted an interim change to the air traffic control hiring process. The changes allowed the FAA to more efficiently compare applicants across previous hiring sources to select those candidates most likely to succeed as air traffic control specialists. The new approach included: (1) single vacancy announcement for Collegiate Training Initiative (CTI)/veterans and general public applicants; (2) a single set of minimum qualifications/eligibility requirements; (3) a multi-hurdle selection process with increased efficiency; and (4) elimination of the Centralized Selection Panel process and interview.
In January 2015, the FAA modified the interim changes by establishing a two-track announcement process for hiring air traffic control specialists. The first track targeted candidates without operational air traffic control experience.
The second track included an announcement targeting applicants who have at least 52 weeks of certified air traffic control experience in either civilian or military air traffic control facilities. In December 2015, the FAA launched an ex- tended announcement for applicants with previous experience.
In 2016, Public Law 114-190 established three separate hiring pools.
FESSA requires that the first pool, which included individuals with previous air traffic control experience, be given priority consideration. It also increases the maximum hiring age to 35 for those meeting certain requirements. Over 1,400 applicants responded to the air traffic control experience vacancy announcement in May 2017. Over 900 were referred for employment consideration.
FESSA establishes a separate track that was then divided into two pools. The first pool includes graduates from CTI programs and also military veterans. The second pool is open to the general public. Only the second pool is required to pass a biographical assessment screen. FESSA mandates that there be no more than a 10 percent variance between those two pools in making final selections. Out of 1,100 applicants referred for employment consideration from the CTI/veteran pool, approximately 611 were selected. Out of 1,500 applicants referred for employment consideration from the general public pool, approximately 656 were selected.
Once applicants are notified of selection and have accepted the offer, they will then be required to attain medical and security clearances. Upon successful completion of clearances, the applicants will then be scheduled for FAA Air Traffic Academy training as agency needs are identified.
In FY 2018, the FAA will continue to recruit and hire air traffic control specialists to meet staffing requirements through the use of the two-track announcement process,
Chapter 6
42

TrainingThe FAA develops the national training curriculum and learning tools that increase the knowledge of its technical workforce who serve the world’s largest, most efficient and safest National Airspace System – today and for the future.
The cohort of air traffic professionals we hired in 2017 and continue to hire in 2018 are essential to the transition to the Next Generation Air Transportation System. Our controllers are increasingly using real-time information to direct air-craft more efficiently while reducing delays. Capabilities such as Performance Based Navigation and Data Communica-tions increase controller productivity while reducing communication errors. They must also, in coming years, effective-ly incorporate new entrants such as unmanned aircraft systems (UAS) and commercial space into routine operations.
We are meeting the challenge of training both new and experienced controllers by streamlining the training process, refreshing course content and modernizing our technologies used for learning. The training program, directed by FAA Order 3120.4, Air Traffic Technical Training, is reviewed annually to ensure its technical accuracy. We regularly review performance metrics and work with research centers to identify areas for improvement and innovation so the training program evolves with operations.
Chapter 7
43 2018 Air Traffic Controller Workforce Plan

THE TRAINING PROCESSNew hires with no previous air traffic control experience begin their federal career training at the FAA Academy, where they learn foundational aviation knowledge through classroom lectures, team exercises and computer-based instruction, and practice basic air traffic control skills using low-, medium- and high-fidelity simulation devices.
The academy lays the foundation for employee development by teaching common, fundamental air traffic control principles and procedures that are used at facilities throughout the country. After successfully completing training at the FAA Academy, developmental controllers are assigned to a field location, where they enter additional, site-specific qualification training and hone their technical abilities in the operational environment. This phase of training begins in the classroom, where students learn facility-specific equipment, rules and procedures. After students master initial learning objectives, the instruction transitions to simulators where learners can apply their knowledge and improve their skills in a hands-on, repetitive and safe environment. Finally, employees enter the on-the-job training phase working the control position, where their performance is carefully monitored by certified professional controllers who help trainees develop their techniques in a progressively more difficult live-traffic environment.
New hires with previous air traffic experience are selected directly for a field facility and usually begin their federal service in an accelerated training program customized for their prior aviation experience. They are able to bypass certain phases of training, but they are required to meet the same certification standards for each control position as new hires with no previous experience.
The goal of all new employees is to become a CPC, which is when they are finally considered to be at the full-performance level. Once developmental controllers are certified on control positions, they often work independently in those positions under the direction of a supervisor to gain experience and to supplement staffing.
All controllers are assigned periodic proficiency training and participate in both mandatory and optional supplemental training. One of the most successful uses of optional supplemental training is the Flight Deck Training (FDT) program. The program provides controllers real-time experience of air traffic control from the flight crew’s perspective by observing flight operations from the flight deck. The process for allocation of FDT was automated to allow more opportunities for this supplemental training.
The FAA’s recurrent training program is administered every six months as a combination of classroom and computer-based instruction for all operational personnel. It delivers evidence-based topics derived from a number of data sources. As contrasted with annually required refresher training on static topics, recurrent training delivers timely and relevant training based on safety trends and lessons learned from our analysis. Recurrent training is developed in collaboration with subject matter experts from the controller workforce.
44

DESIGNING AND DELIVERING EFFECTIVE TRAININGExperienced instructors, CPCs and contractors provide both classroom and simulation training at the FAA Academy and at many field locations. The FAA ensures everyone who instructs developmental controllers – whether they are federal employees or contractors – has the background and skills needed to train new employees.
The FAA completed a comprehensive update to three training courses for on-the-job-training field instructors to incorporate modern learning theory, human factors and process changes. It is especially important for field instructors to maintain proficiency on all of the latest skills, new procedures and technologies coming into the system through NextGen improvements, as well as prepare to instruct students who represent a new generation.
INFRASTRUCTURE INVESTMENTSThe FAA continues to expand accessibility of the high-fidelity Tower Simulator System (TSS), a training device that has provided an interactive, realistic environment for controller training. There are 58 simulators installed at 40 locations, and these systems support training for 195 airports using a “hub and spoke” arrangement where employees at remote facilities travel to central locations to use the simulator. The FAA started the upgrade of these systems to improve the scenario generation capabilities, screen resolution, software responsiveness, and access to the system.
The FAA completed the installation of eight U.S. Marine Corps small-footprint simulation systems in FY 2017.These systems complement the original procurement and provide us with a capability of installing a smaller-sized sim-ulator at locations where it would have been cost-prohibitive for the full-sized system.
TIME TO CERTIFICATIONThe FAA continues to meet its overall goals for time to certification and number of controllers certified. Implementation of foundational NextGen platforms, such as ERAM and TAMR, and new training requirements are factors that affect overall time to CPC. Depending on the type of facility, facility level (complexity) and the number of candidates to certify, controllers are expected to complete certification in one-and-a-half years to three years.
Over 86 percent of those who began training in fiscal years FY 2010 through FY 2014 successfully completed training at their first facility or a subsequent facility.
Completion means that employees achieved FAA CPC status. The remaining members of the hiring classes (14 percent) have been removed from the agency, resigned or are still in training. Developmental controllers who fail to certify at a facility may be removed from service or reassigned to a less complex facility in accordance with agency policies and directives.
45 2018 Air Traffic Controller Workforce Plan

Table 7.1 shows the FAA’s training targets and average training completion time by facility type for those who began training in fiscal years FY 2010 through FY 2014. Only those who achieved CPC status at their first facility assignment are included in the average training completion times displayed because incorporation of training times at additional facilities can skew the average. Additionally, training data for hiring classes after FY 2015 are not reported here because greater than 10 percent of the students are still in active phases of training, resulting in continuously changing metrics as those students certify or fail.
INVESTING FOR THE FUTUREAs the FAA transitions to NextGen, the key to providing safe, reliable and efficient air traffic services remains the same: highly skilled, trained and certified professionals. The FAA must maintain curricula to keep pace with the evolving NAS, modernize how it trains employees, incorporate new techniques and technologies for learning, and improve data collection and sharing. Training professionals are part of an FAA team that evaluates how NextGen will change the air traffic work environment and what competencies will be required for the future workforce. The FAA is incorporating what it learns from this evolving and ongoing process into training programs as new systems are implemented. Out-comes-based training aligns NextGen functionality with job tasks as well so that the training organization can make predictions on how programs will need to change as NextGen matures.
TABLE 7.1 | YEARS TO CERTIFY (FIRST ASSIGNED FACILITY ONLY)
46

Funding StatusIn addition to direct training costs, the FAA will incur salary and other costs for developmental controllers before they certify. The average compensation cost of a developmental in FY 2018 is projected to be $108,740.
Figure 8.1 depicts expected annual compensation costs of developmentals, as well as the expected number of devel- opmentals by year through 2027. As training takes one-and-a-half to three years, the chart depicts a rolling total of hires and costs from the current and previous years. It also incorporates the effect of the controller contract.
FIGURE 8.1 | ESTIMATED COST OF DEVELOPMENTALS BEFORE CERTIFICATION
Chapter 8
Sala
ry, P
rem
ium
s and
Ben
efits
$100M
$200M
$300M
$0
Average Developmental Headcount
3,000
1,000
2,000
0
20182017* 2019 20212020 2025Fiscal Year
202420232022 2026 2027
2,6512,487 2,504
2,416
1,965
1,6531,494 1,502 1,543 1,549 1,553
$265 $270
$292 $302
$257
$215
$187 $190$200 $204 $208
DEVELOPMENTAL SALARY, PREMIUMS AND BENEFITS AVERAGE DEVELOPMENTAL HEADCOUNT
*Actual
47 2018 Air Traffic Controller Workforce Plan

2018 Facility Staffing RangesThe Appendix below presents controller staffing ranges, by facility, for En Route and Terminal air traffic controlfacilities for FY 2018. Additional detail on how the staffing ranges are calculated is provided in Chapter 3.
In general, the FAA strives to keep the number of CPCs and CPC-ITs near the middle of the range. While most of the work is accomplished by CPCs, work is also being performed in facilities by CPC-IT and position-qualified developmen-tal controllers who are proficient, or checked out, in specific sectors or positions and handle work independently.Accordingly, facilities can safely operate even with CPC staffing levels below the defined staffing range.
Conversely, a facility’s total staffing levels are often above the defined staffing range because new controllers aretypically hired two to three years in advance of expected attrition to allow for sufficient training time. The totalexpected end-of-year staffing number shown in Figure 3.1 reflects this projected advanced hiring.
Appendix
En Route Actual on board as of 09/30/17
ID FACILITY NAME CPC CPC-IT DEVELOPMENTAL TOTAL LOW HIGH
Staffing Range
ZAB
ZAN
ZAU
ZBW
ZDC
ZDV
ZFW
ZHU
ZID
ZJX
ZKC
ZLA
ZLC
ZMA
ZME
ZMP
ZNY
Albuquerque ARTCC
Anchorage ARTCC
Chicago ARTCC
Boston ARTCC
Washington ARTCC
Denver ARTCC
Fort Worth ARTCC
Houston ARTCC
Indianapolis ARTCC
Jacksonville ARTCC
Kansas City ARTCC
Los Angeles ARTCC
Salt Lake City ARTCC
Miami ARTCC
Memphis ARTCC
Minneapolis ARTCC
New York ARTCC
146
80
271
208
242
219
239
206
259
232
208
203
135
206
225
207
229
10
9
17
1
13
14
16
20
11
8
6
17
5
3
6
10
2
48
33
61
15
77
10
59
79
53
3
33
54
10
78
59
92
97
204
122
349
224
332
243
314
305
323
243
247
274
150
287
290
309
328
170
84
287
176
260
234
251
229
261
241
202
227
149
219
232
220
240
207
102
351
215
317
286
306
280
319
295
247
278
182
267
284
269
293

Note: Facility numbers do not include new hires at the FAA Academy.
En Route
Actual on board as of 09/30/17
ID FACILITY NAME CPC CPC-IT DEVELOPMENTAL TOTAL LOW HIGH
Staffing Range
Actual on board as of 09/30/17
ID FACILITY NAME CPC CPC-IT DEVELOPMENTAL TOTAL LOW HIGH
Staffing Range
Terminal
EN ROUTE TOTAL 4,437 227 1,098 5,762 4,658 5,691
ZOA
ZOB
ZSE
ZSU
ZTL
ZUA
Oakland ARTCC
Cleveland ARTCC
Seattle ARTCC
San Juan CERAP
Atlanta ARTCC
Guam CERAP
155
294
136
41
280
16
8
17
12
2
19
1
104
23
39
19
50
2
267
334
187
62
349
19
187
282
137
44
312
14
228
344
167
54
382
18
A11
A80
A90
ABE
ABI
ABQ
ACK
ACT
ACY
ADS
ADW
AFW
AGC
AGS
ALB
ALO
AMA
Anchorage TRACON
Atlanta TRACON
Boston TRACON
Allentown Tower
Abilene Tower
Albuquerque Tower
Nantucket Tower
Waco Tower
Atlantic City Tower
Addison Tower
Andrews Tower
Alliance Tower
Allegheny Tower
Augusta Tower
Albany Tower
Waterloo Tower
Amarillo Tower
17
68
55
23
16
19
9
16
15
9
11
14
14
10
17
9
15
5
16
11
5
1
4
0
0
2
2
1
1
0
1
0
0
0
3
9
0
9
8
3
1
10
16
1
3
1
2
7
14
5
9
25
93
66
37
25
26
10
26
33
12
15
16
16
18
31
14
24
21
86
52
21
14
22
9
16
19
10
9
13
11
12
20
9
14
25
105
63
26
17
27
10
20
23
13
12
16
13
15
25
11
17
49 2018 Air Traffic Controller Workforce Plan

Terminal Actual on board as of 09/30/17
ID FACILITY NAME CPC CPC-IT DEVELOPMENTAL TOTAL LOW HIGH
Staffing Range
ANC
APA
APC
ARB
ARR
ASE
ATL
AUS
AVL
AVP
AZO
BDL
BED
BFI
BFL
BGM
BGR
BHM
BIL
BIS
BJC
BNA
BOI
BOS
BPT
BTR
BTV
BUF
BUR
BWI
C90
CAE
Anchorage Tower
Centennial Tower
Napa Tower
Ann Arbor Tower
Aurora Tower
Aspen Tower
Atlanta Tower
Austin Tower
Asheville Tower
Wilkes-Barre Tower
Kalamazoo Tower
Bradley Tower
Hanscom Tower
Boeing Tower
Bakers�eld Tower
Binghamton Tower
Bangor Tower
Birmingham Tower
Billings Tower
Bismarck Tower
Broom�eld Tower
Nashville Tower
Boise Tower
Boston Tower
Beaumont Tower
Baton Rouge Tower
Burlington Tower
Bu�alo Tower
Burbank Tower
Baltimore Tower
Chicago TRACON
Columbia Tower
20
20
6
10
11
13
36
32
17
16
18
14
14
18
16
15
21
23
13
9
10
31
22
24
9
18
16
27
18
21
68
19
3
1
0
0
0
0
6
9
0
0
1
0
0
1
1
0
0
3
0
0
0
7
5
5
0
0
0
3
0
1
23
0
1
2
7
0
0
5
0
0
1
6
4
2
4
3
9
2
3
7
13
5
2
2
7
1
3
12
13
8
5
1
3
7
24
23
13
10
11
18
42
41
18
22
23
16
18
22
26
17
24
33
26
14
12
40
34
30
12
30
29
38
23
23
94
26
23
20
7
7
7
10
46
37
13
16
16
12
12
18
15
11
17
22
17
11
11
37
24
29
9
14
15
23
16
21
84
18
28
24
8
9
9
13
56
45
16
20
19
14
14
21
18
13
21
27
20
13
13
45
29
35
11
18
18
28
19
26
102
23
50

Terminal Actual on board as of 09/30/17
ID FACILITY NAME CPC CPC-IT DEVELOPMENTAL TOTAL LOW HIGH
Staffing Range
CAK
CCR
CDW
CHA
CHS
CID
CKB
CLE
CLT
CMA
CMH
CMI
CNO
COS
CPR
CPS
CRP
CRQ
CRW
CSG
CVG
D01
D10
D21
DAB
DAL
DAY
DCA
DEN
DFW
DLH
DPA
Akron-Canton Tower
Concord Tower
Caldwell Tower
Chattanooga Tower
Charleston Tower
Cedar Rapids Tower
Clarksburg Tower
Cleveland Tower
Charlotte Tower
Camarillo Tower
Columbus Tower
Champaign Tower
Chino Tower
Colorado Springs Tower
Casper Tower
Downtown Tower
Corpus Christi Tower
Palomar Tower
Charleston Tower
Columbus Tower
Cincinnati Tower
Denver TRACON
Dallas-Fort Worth TRACON
Detroit TRACON
Daytona Beach Tower
Dallas Love Tower
Dayton Tower
Washington National Tower
Denver Tower
Dallas-Fort Worth Tower
Duluth Tower
Dupage Tower
18
9
10
14
21
14
14
38
79
12
36
15
8
22
11
9
24
11
20
5
33
70
64
44
42
21
15
20
32
46
15
13
1
1
0
2
0
2
0
1
11
0
6
1
1
3
0
0
5
0
0
1
10
20
29
16
14
3
0
7
11
12
0
0
7
2
3
7
4
2
6
4
0
1
0
0
4
1
3
2
9
0
6
3
5
1
12
1
7
1
0
1
0
0
7
6
26
12
13
23
25
18
20
43
90
13
42
16
13
26
14
11
38
11
26
9
48
91
105
61
63
25
15
28
43
58
22
19
18
10
9
15
20
13
12
31
72
9
39
13
10
22
9
11
29
11
17
5
38
72
78
47
47
21
12
24
35
48
17
11
22
13
11
19
25
16
15
38
88
11
48
16
12
27
12
13
35
13
20
6
47
88
96
57
57
26
14
30
43
59
21
14

Terminal Actual on board as of 09/30/17
ID FACILITY NAME CPC CPC-IT DEVELOPMENTAL TOTAL LOW HIGH
Staffing Range
DSM
DTW
DVT
DWH
ELM
ELP
EMT
ERI
EUG
EVV
EWR
F11
FAI
FAR
FAT
FAY
FCM
FFZ
FLL
FLO
FNT
FPR
FRG
FSD
FSM
FTW
FWA
FXE
GCN
GEG
GFK
GGG
Des Moines Tower
Detroit Tower
Deer Valley Tower
Hooks Tower
Elmira Tower
El Paso Tower
El Monte Tower
Erie Tower
Eugene Tower
Evansville Tower
Newark Tower
Central Florida TRACON
Fairbanks Tower
Fargo Tower
Fresno Tower
Fayetteville Tower
Flying Cloud Tower
Falcon Tower
Fort Lauderdale Tower
Florence Tower
Flint Tower
St. Lucie Tower
Farmingdale Tower
Sioux Falls Tower
Fort Smith Tower
Meacham Tower
Fort Wayne Tower
Fort Lauderdale Executive Tower
Grand Canyon Tower
Spokane Tower
Grand Forks Tower
Longview Tower
19
30
15
14
10
18
9
15
20
10
27
33
16
15
20
11
10
11
24
8
12
10
12
16
22
13
18
10
8
28
19
12
6
7
3
0
0
2
2
0
1
0
11
7
1
0
5
0
0
0
0
1
1
0
1
1
0
1
0
3
1
4
1
2
3
0
2
1
5
13
1
5
2
13
0
4
8
5
6
12
1
3
1
5
5
2
1
3
12
4
6
4
0
4
0
14
28
37
20
15
15
33
12
20
23
23
38
44
25
20
31
23
11
14
25
14
18
12
14
20
34
18
24
17
9
36
20
28
17
28
17
9
9
19
9
15
17
12
32
45
18
17
20
18
9
13
24
9
12
10
12
15
21
15
18
14
8
23
18
14
21
34
20
11
11
23
11
18
20
15
39
56
22
20
24
22
11
16
29
12
14
12
14
18
26
18
22
17
10
28
22
17
52

Terminal Actual on board as of 09/30/17
ID FACILITY NAME CPC CPC-IT DEVELOPMENTAL TOTAL LOW HIGH
Staffing Range
GPT
GRB
GRR
GSO
GSP
GTF
HCF
HEF
HIO
HLN
HOU
HPN
HSV
HTS
HUF
HWD
I90
IAD
IAH
ICT
ILG
ILM
IND
ISP
ITO
JAN
JAX
JCF
JFK
JNU
K90
L30
Gulfport Tower
Green Bay Tower
Grand Rapids Tower
Greensboro Tower
Greer Tower
Great Falls Tower
Honolulu Control Facility
Manassas Tower
Hillsboro Tower
Helena Tower
Hobby Tower
Westchester Tower
Huntsville Tower
Huntington Tower
Terre Haute /Hulman Tower
Hayward Tower
Houston TRACON
Dulles Tower
Houston Intercontinental Tower
Wichita Tower
Wilmington Tower
Wilmington Tower
Indianapolis Tower
Islip Tower
Hilo Tower
Jackson Tower
Jacksonville Tower
Joshua Control Facility
Kennedy Tower
Juneau Tower
Cape TRACON
Las Vegas TRACON
14
18
16
12
22
11
63
8
13
5
17
13
15
17
10
10
69
23
37
17
9
17
32
14
12
15
28
18
26
13
19
33
0
1
5
4
0
0
13
3
3
0
2
3
0
0
2
0
26
7
2
4
0
1
5
3
3
0
8
7
9
0
0
6
5
2
5
12
6
8
18
0
2
7
1
1
4
3
9
2
1
1
0
16
2
8
2
7
2
8
14
3
0
0
1
0
19
21
26
28
28
19
94
11
18
12
20
17
19
20
21
12
96
31
39
37
11
26
39
24
17
23
50
28
35
13
20
39
13
16
17
22
17
12
82
9
12
7
19
12
15
15
14
9
79
25
31
26
8
15
35
12
11
13
40
19
30
9
17
41
16
19
21
27
21
15
100
11
15
9
23
14
18
18
17
11
96
31
38
32
10
18
43
15
14
16
48
23
37
12
21
51
53 2018 Air Traffic Controller Workforce Plan

Terminal Actual on board as of 09/30/17
ID FACILITY NAME CPC CPC-IT DEVELOPMENTAL TOTAL LOW HIGH
Staffing Range
LAF
LAN
LAS
LAX
LBB
LCH
LEX
LFT
LGA
LGB
LIT
LNK
LOU
LVK
M03
M98
MAF
MBS
MCI
MCO
MDT
MDW
MEM
MFD
MGM
MHT
MIA
MIC
MKC
MKE
MKG
MLI
Lafayette Tower
Lansing Tower
Las Vegas Tower
Los Angeles Tower
Lubbock Tower
Lake Charles Tower
Lexington Tower
Lafayette Tower
La Guardia Tower
Long Beach Tower
Little Rock Tower
Lincoln Tower
Bowman Tower
Livermore Tower
Memphis TRACON
Minneapolis TRACON
Midland Tower
Saginaw Tower
Kansas City Tower
Orlando Tower
Harrisburg Tower
Midway Tower
Memphis Tower
Mans�eld Tower
Montgomery Tower
Manchester Tower
Miami Tower
Crystal Tower
Downtown Tower
Milwaukee Tower
Muskegon Tower
Quad City Tower
8
20
33
31
13
11
22
16
28
17
24
9
13
10
25
45
16
9
33
29
21
16
23
14
13
13
69
10
11
32
13
12
0
0
8
17
2
0
0
1
10
3
4
0
0
2
2
18
1
1
3
1
0
5
1
1
1
1
32
0
3
11
0
0
3
4
0
0
4
9
9
6
0
1
3
4
0
1
5
0
6
6
6
0
9
2
4
6
9
1
5
2
1
0
8
10
11
24
41
48
19
20
31
23
38
21
31
13
13
13
32
63
23
16
42
30
30
23
28
21
23
15
106
12
15
43
21
22
8
17
35
44
15
12
19
13
29
18
22
9
10
8
27
50
14
10
30
25
22
21
21
13
15
11
81
8
11
33
12
13
10
21
43
54
18
15
24
16
36
23
27
10
12
10
34
62
17
12
37
30
27
25
25
15
18
14
100
10
14
40
14
15

Terminal Actual on board as of 09/30/17
ID FACILITY NAME CPC CPC-IT DEVELOPMENTAL TOTAL LOW HIGH
Staffing Range
MLU
MMU
MOB
MRI
MRY
MSN
MSP
MSY
MWH
MYF
MYR
N90
NCT
NEW
OAK
OGG
OKC
OMA
ONT
ORD
ORF
ORL
P31
P50
P80
PAE
PAO
PBI
PCT
PDK
PDX
PHF
Monroe Tower
Morristown Tower
Mobile Tower
Merrill Tower
Monterey Tower
Madison Tower
Minneapolis Tower
New Orleans Tower
Grant County Tower
Montgomery Tower
Myrtle Beach Tower
New York TRACON
Northern California TRACON
Lakefront Tower
Oakland Tower
Maui Tower
Oklahoma City Tower
Eppley Tower
Ontario Tower
Chicago O'Hare Tower
Norfolk Tower
Orlando Executive Tower
Pensacola TRACON
Phoenix TRACON
Portland TRACON
Paine Tower
Palo Alto Tower
Palm Beach Tower
Potomac TRACON
DeKalb-Peachtree Tower
Portland Tower
Patrick Henry Tower
10
7
20
11
7
16
35
30
7
12
15
131
131
8
19
8
16
14
11
55
21
8
27
53
21
10
9
38
139
14
19
7
0
1
2
1
1
0
7
5
0
2
6
19
32
1
3
2
1
0
0
13
5
2
9
9
4
0
0
10
28
4
5
0
7
2
1
1
1
6
0
0
12
0
5
2
1
1
3
5
15
3
4
0
6
2
1
2
6
2
3
3
9
0
3
4
17
10
23
13
9
22
42
35
19
14
26
152
164
10
25
15
32
17
15
68
32
12
37
64
31
12
12
51
176
18
27
11
10
9
17
9
9
16
31
32
11
11
20
177
152
7
22
11
28
11
13
58
25
9
29
55
25
9
8
39
134
13
21
9
12
11
21
12
11
20
37
39
14
13
25
216
185
8
27
13
34
13
16
71
31
12
36
67
31
10
10
48
164
16
26
11
55 2018 Air Traffic Controller Workforce Plan

Terminal Actual on board as of 09/30/17
ID FACILITY NAME CPC CPC-IT DEVELOPMENTAL TOTAL LOW HIGH
Staffing Range
PHL
PHX
PIA
PIE
PIT
PNE
PNS
POC
POU
PRC
PSC
PSP
PTK
PUB
PVD
PWK
PWM
R90
RDG
RDU
RFD
RHV
RIC
RNO
ROA
ROC
ROW
RST
RSW
RVS
S46
S56
Philadelphia Tower
Phoenix Tower
Peoria Tower
St. Petersburg Tower
Pittsburgh Tower
Northeast Philadelphia Tower
Pensacola Tower
Brackett Tower
Poughkeepsie Tower
Prescott Tower
Pasco Tower
Palm Springs Tower
Pontiac Tower
Pueblo Tower
Providence Tower
Chicago Executive Tower
Portland Tower
Omaha TRACON
Reading Tower
Raleigh-Durham Tower
Rockford Tower
Reid-Hillview Tower
Richmond Tower
Reno Tower
Roanoke Tower
Rochester Tower
Roswell Tower
Rochester Tower
Fort Myers Tower
Riverside Tower
Seattle TRACON
Salt Lake City TRACON
67
29
14
10
29
8
11
9
9
11
17
9
9
13
26
11
20
19
13
38
19
9
14
14
21
22
10
11
20
11
36
38
14
3
1
1
11
1
0
1
0
3
0
0
2
0
2
0
1
0
0
6
0
0
0
2
0
0
0
0
6
0
11
6
0
0
11
3
4
3
0
1
4
2
4
4
1
3
5
0
3
1
6
1
6
3
3
0
4
9
7
2
5
5
3
8
81
32
26
14
44
12
11
11
13
16
21
13
12
16
33
11
24
20
19
45
25
12
17
16
25
31
17
13
31
16
50
52
66
29
15
9
36
8
9
9
7
11
15
9
10
12
24
9
16
19
14
38
19
10
11
11
18
21
9
12
25
11
46
37
81
35
18
11
43
10
11
11
9
14
18
11
12
14
29
11
20
23
17
47
23
12
14
14
23
26
11
14
31
13
57
46
56

Terminal Actual on board as of 09/30/17
ID FACILITY NAME CPC CPC-IT DEVELOPMENTAL TOTAL LOW HIGH
Staffing Range
SAN
SAT
SAV
SBA
SBN
SCK
SCT
SDF
SDL
SEA
SEE
SFB
SFO
SGF
SHV
SJC
SJU
SLC
SMF
SMO
SNA
SPI
SRQ
STL
STP
STS
STT
SUS
SUX
SYR
T75
TEB
San Diego Tower
San Antonio Tower
Savannah Tower
Santa Barbara Tower
South Bend Tower
Stockton Tower
Southern California TRACON
Standiford Tower
Scottsdale Tower
Seattle Tower
Gillespie Tower
Sanford Tower
San Francisco Tower
Spring�eld Tower
Shreveport Tower
San Jose Tower
San Juan Tower
Salt Lake City Tower
Sacramento Tower
Santa Monica Tower
John Wayne Tower
Spring�eld Tower
Sarasota Tower
St. Louis Tower
St. Paul Tower
Sonoma Tower
St. Thomas Tower
Spirit Tower
Sioux Gateway Tower
Syracuse Tower
St. Louis TRACON
Teterboro Tower
20
33
22
20
21
9
189
34
11
24
12
17
25
24
18
12
15
28
12
10
15
10
10
16
11
7
10
10
8
17
29
13
4
14
2
4
0
1
47
8
0
2
1
0
6
0
2
0
0
4
3
2
4
0
1
2
1
0
1
0
0
0
0
4
2
2
7
11
8
1
8
2
2
0
2
2
0
6
7
2
4
0
1
7
2
4
1
1
1
4
2
1
8
4
0
5
26
49
31
35
29
11
244
44
13
26
15
19
31
30
27
14
19
32
16
19
21
14
12
19
13
11
13
11
16
21
29
22
20
38
20
21
18
8
202
36
11
28
12
16
30
22
18
12
13
26
11
10
20
10
10
17
8
7
8
9
9
18
27
22
24
46
24
26
23
10
246
44
13
35
15
20
37
27
22
15
16
32
14
12
24
12
12
20
10
9
10
12
11
21
33
27

TERMINAL TOTAL
Terminal
GRAND TOTAL
TERMINAL TOTAL
EN ROUTE TOTAL 4,437 227 1,098 5,762 4,658 5,691
6,107 978 1,162 8,247 6,388 7,812
6,107 978 1,162 8,247 6,388 7,812
10,544 1,205 2,260 14,009 11,046 13,503
Actual on board as of 09/30/17
ID FACILITY NAME CPC CPC-IT DEVELOPMENTAL TOTAL LOW HIGH
Staffing Range
TLH
TMB
TOA
TOL
TPA
TRI
TUL
TUS
TVC
TWF
TYS
U90
VGT
VNY
VRB
Y90
YIP
YNG
Tallahassee Tower
Tamiami Tower
Torrance Tower
Toledo Tower
Tampa Tower
Tri-Cities Tower
Tulsa Tower
Tucson Tower
Traverse City Tower
Twin Falls Tower
Knoxville Tower
Tucson TRACON
North Las Vegas Tower
Van Nuys Tower
Vero Beach Tower
Yankee TRACON
Willow Run Tower
Youngstown Tower
10
17
10
18
49
11
25
11
8
9
20
15
11
18
10
14
12
14
0
1
1
0
20
0
3
3
1
1
0
1
0
7
0
2
0
1
8
1
0
6
0
8
6
4
1
2
16
1
1
0
2
7
2
6
18
19
11
24
69
19
34
18
10
12
36
17
12
25
12
23
14
21
15
16
8
17
50
13
25
13
7
7
21
16
11
16
11
20
10
14
18
19
10
21
61
16
31
15
9
8
26
20
13
20
13
25
12
18
GRAND TOTAL INCUDING STUDENTS AT FAA ACADEM
14,481
Note: Facility numbers do not include new hires at the FAA Academy.
GRAND TOTAL INCLUDING STUDENTS AT FAA ACADEMY
14,481
58

U.S. Department of Transportation
Federal Aviation Administration 800 Independence Avenue, SW
Washington, DC 20591
59 2018 Air Traffic Controller Workforce Plan