Thirsty India - Dhanlaxmi Bank · Thirsty India While the sustained ... marketing of lubricants,...
13
K n o w l e d g e S e r i e s 5 Thirsty India While the sustained economic growth of recent years has brought several wideranging and mostly positive changes to India, it has also resulted in a burgeoning appetite for energy to sustain that growth. DhanBank PRU looks at the broad contours of the energy industry in the country.
Transcript of Thirsty India - Dhanlaxmi Bank · Thirsty India While the sustained ... marketing of lubricants,...

Knowledge Series 5
Thirsty India
While the sustained economic growth of recent years has
brought several wideranging and mostly positive changes
to India, it has also resulted in a burgeoning appetite for
energy to sustain that growth. DhanBank PRU looks at the
broad contours of the energy industry in the country.

Topic Page
1. A crude run down
a) Types of crude oil
b) Spread between heavy and light crude
c) Benchmark crude oil prices
d) Factors affecting crude oil prices
2. Industry structure
3. Domestic scenario
a) New exploration licensing policy
b) Consumption of petro-products
c) Demand drivers of crude oil in India
4. Regulatory framework
5. Current scenario
a) Opec to improve spare capacity ratio
b) Petroleum product pricing
6. Financial performance
7. SWOT analysis
1
1
1
1
2
3
4
4
4
6
7
8
8
8
9
10

A Crude Run Down
C rude oil (or petroleum) and natural gas are a major source of primary energy used world over. Crude re-
mains one of the world‘s most widely traded sources of energy.
Most of the world‘s oil and gas resources are concentrated in the west Asian region. Saudi Arabia is the
largest producer of crude oil in the world and USA the largest consumer. For a long period, the developed world
was the dominant oil consumer.
However, in recent years developing economies, including China and India, have been reporting robust growth in
consumption, backed by sustained economic growth.
The largest natural gas reserves – almost a quarter of the world‘s total -- are with the Russian Federation. Natural
gas can either be used as a primary source of energy — as is by fertiliser units — or can be broken down into vari-
ous hydrocarbons such as ethane and its derivatives.
Types Of Crude Oil
In simple terms, crude oil comes in various varieties defined according to its density and sulphur content. While
all varieties of crude yield all types of fuels, the ratio of higher and lower value fuels differs from crude to crude.
Broadly there are two main types of crude – light and heavy. Also, along the process of refining, any variety of
crude oil generally yields three main kinds of distillates – lower, middle and heavy or residuum.
Lower distillates include aviation turbine fuel (ATF), liquefied petroleum gas (LPG), petrol (gasoline)
and naphtha.
Middle distillates involve fuels like kerosene and diesel.
Heavy distillates or residuum comprise lubes, heavy
fuel oil and asphalt.
Lower distillates (or alternatively higher value products) are
more easily produced through a simpler distillation of lighter
crudes. The denser (―heavier‖) crudes produce a greater share of
heavy distillates through simple distillation and require addi-
tional processing to produce the lower distillates.
Spread Between Heavy And Light Crude Oil
Crude varieties with light and sweet properties are easier to distil
into high value, high quality products. Hence, they are sold at a
premium compared to the heavy and sour varieties.
The spread between the prices of heavy and light crude varieties
reflect the demand scenario. Increasingly, production of light crude is rising faster than that of the heavy variety,
affecting the proportion of light and heavy varieties in global oil market mix.
Earlier, refiners were not able to process heavy crude because of its higher wax content which coagulates the refin-
ing system, resulting in a larger spread in prices. However, the incremental refining capacity being added has the
capability to refine heavy oil as well.
Benchmark Crude Oil Prices
Of the various crude oil varieties, three are commonly traded on exchanges and used as benchmarks -- Brent
(benchmark in European region), West Texas Intermediary (US) and Dubai (Gulf).
Mostly because of a severe demand-supply mismatch, crude prices surged to $140 a barrel in 2008. With the ad-
vent of the global financial crisis, slowdown in major economies and subsequent fall in demand for crude and its
derivates, prices nosedived to $40 per barrel in December 2008.
There has been some pick-up in prices subsequently as demand started showing some signs of revival thanks to
1

the various government stimulus programmes taking hold across the globe. Crude prices even touched $80 a few
months ago.
Factors Affecting Crude Oil Prices
Demand and supply.
Political situation in oil rich countries and production policies of Opec countries.
Stock positions of large consumers such as the US.
Weather conditions -- severe winter or summer pushes up demand for petroleum products.
Speculative trading – while demand-supply conditions are the basis for movement in prices, speculation
about higher/lower demand also has an important role to play.
Oil stocking by various countries as part of energy security strategy.
2

Industry Structure
T he Indian petroleum industry is mainly divided into
upstream and downstream companies. While the up-
stream segment includes exploration of oil and gas,
downstream companies are involved in refining and marketing
of the products. Refineries distil crude oil and process it into
fuel and lubricating products, the important among these being
petrol, diesel, LPG, kerosene, ATF and lubricating oil.
The upstream companies in India include ONGC, Oil India,
Essar Oil, Hindustan Oil Exploration, Selan Exploration Tech-
nology and Cairn Energy.
The downstream segment involves refining of crude oil
(distillation, conversion and treating) into final products and
marketing of these products.
Those entities involved only in refining and not market-
ing are known as standalone refineries. Chennai Petro-
leum, Bongaigaon Refinery and Numaligarh Refinery are
examples of this category.
Companies which both refine and market are known as
integrated refineries -- IndianOil Corporation, Hindustan
Petroleum, Bharat Petroleum, Mangalore Refinery and
Kochi Refinery.
Reliance Industries could be broadly put in a third cate-
gory, as the company is present along all points of the
value chain – from oil exploration to polyester [the main
textile derivative of petroleum] to fabrics.
There are standalone marketing companies too such as
Indo Burma Petroleum Company.
Some companies are also involved in production and
marketing of lubricants, petroleum coke, paraffin wax,
bitumen and asphalt. For instance, Castrol India, Bharat
Shell and Goa Carbon among others.
In the past few years the Indian petroleum refining indus-
try has witnessed consolidation, with oil marketers taking
over standalone refineries.
ONGC bought out the total share of the initial promoters, A V
Birla Group, in Mangalore Refineries (MRPL) and infused fur-
ther equity capital, in the process making MRPL its subsidiary.
IBP Co also got merged with its parent company -- IndianOil
Corporation. Also, Kochi Refinery was merged into its parent
Bharat Petroleum.
Once the sector was opened after the commencement of eco-
nomic reforms in 1991, the industry witnessed the entry of private players such as RIL. Cairn and Essar followed
suit.
The Legend of Digboi
„“Dig-boy,dig”, shouted the
British engineer, W L Lake, at
his men as they watched ele-
phants emerging out of the dense
forest with oil stains on their
feet.‟
This is possibly the most distilled
– though fanciful – version of the
legend explaining the siting and
naming of Digboi — the small
town in Tinsukia, Assam, which
houses India‘s and Asia‘s first
and one of the world‘s oldest oil
wells.
Crude oil was struck here in
1882 by the Assam Railways and
Trading Company. According to
the legend, officials noticed quite
by accident that the slush stick-
ing to the feet of elephants,
which were being used to lay
railroad tracks, smelt of oil.
Retracing the trail of footprints,
they found oil seeping to the
surface. Lake being an ‗oil en-
thusiast‘, persuaded the company
to drill a well.
The first well was started in Dig-
boi in September 1889. This his-
toric site continues to produce
oil, though production is not too
high.
—Wikipedia
3

Domestic Scenario
I ndia produces just over 26% of its total crude consumption. Government-run ONGC is the country‘s largest
oil producer, contributing about 78% to the total production. The other state-run player involved in explora-
tion and crude production is Oil India.
New Exploration Licensing Policy
To explore and develop India‘s oil and gas reserves, the government devised the New Exploration Licensing Pol-
icy (NELP). The scheme was brought into effect in 1997-98, providing equal opportunities to all interested parties
in the award of oil and gas exploration blocks. Under NELP, the successful bidder is required to enter into a pro-
duction sharing contract with the government.
RIL, Essar Oil and Cairn India are the
major private sector participants in In-
dia‘s oil production business. While
ONGC has accounted for nearly 75% of
the oil and gas output in India till re-
cently, its share has been declining, with
private sector participants eating into its
pie. After the government opened up the
refining sector in 1991, private partici-
pants like RIL and Essar Oil set up refin-
eries. As on April 1, 2010, there were 21
refineries in India with a combined re-
fining capacity of 18.44 crore tonnes
(184 million tones, see table 1).
Consumption Of Petro-Products
Petroleum products form an important
energy source in India, accounting for a
third of the requirement and second only
to coal. Consumption of petro-products
grew at a compounded annual rate of 4.4% during the five years ended March 2010 (see table 2, page 4).
Table 1: Installed Refining Capacity As On 1 April 2010
(in million tonnes)
IndianOil Corporation 51,200
Hindustan Petroleum Corporation 13,800
Bharat Petroleum Corporation 21,500
Chennai Petroleum Corporation 10,500
Numaligarh Refinery 3,000
ONGC 78
Mangalore Refinery & Petrochemicals 11,820
Total PSU 1,11,900
Reliance Industries 33,000
Reliance Petroleum (recently merged into parent co RIL) 29,000
Essar Oil 10,500
Total Joint Venture & PVT Companies 72,500
GRAND TOTAL 1,84,400
4

High speed diesel (HSD) is the highest
consumed product. It is widely used as
a fuel for transport sector, including
trucks (which consume 37% of total
diesel), buses (12%) and passenger cars
(15%). HSD is also used for agricultural
and power generation purposes.
LPG and kerosene are broadly classified
as cooking fuels. While the share of
superior kerosene is declining, that of
LPG is rising, consequent to increased
urbanisation and rising living standards.
Demand for ATF had been rising rap-
idly until the global recession hit the
aviation industry.
Table 2: Consumption Pattern Of Petro-Products In India
% YoY Growth % Share In Total
2007-08 2008-09 2009-10
(Prov.) 2007-08 2008-09
2009-10
(Prov.)
High Speed Diesel 11.1 8.5 8.9 37 38.7 40.8
LPG 12.1 1.5 6.3 9.4 9.2 9.5
Motor Spirit / Petrol 11.3 9 13.9 8 8.4 9.3
Furnace Oil /LSHS 0.8 -1 -7.9 9.9 9.4 8.4
Naphtha -4.3 4.6 -26.4 10.3 10.4 7.4
Superior Kerosene -1.5 -0.7 0 7.3 7 6.7
Pet Coke 9.4 3.6 9.5 4.6 4.6 4.9
Bitumen 17.6 5.3 3.6 3.5 3.6 3.6
Aviation Turbine Fuel 14.1 -2.6 4.6 3.5 3.3 3.3
Others -0.6 -15 19 6.5 5.4 6.2
TOTAL 6.8 3.6 3.4 100 100 100
5

Naphtha and furnace oil are used as feedstock fuel for the fertiliser units, power plants and the petro-
chemical industry.
Even though two-third of the crude oil consumed in India is imported, with the commissioning of RIL‘s Jamnagar
refinery, India has become a net exporter of petroleum products. RIL has commissioned another refinery in Jam-
nagar as an export-oriented unit.
Demand Drivers Of Crude Oil In India
Since India has expanded its refining capacity rapidly in the past few years, crude oil imports have also surged. So,
higher crude imports are not only an indication of higher domestic demand for petroleum products, but are also
indicative of an increase in exports of petroleum products from India.
6

Regulatory Framework
T he oil sector was strictly under government control till re-
cently. Under administered pricing mechanism (APM),
prices of crude oil and petroleum products were fixed in
such a manner so as to ensure fixed returns to companies.
Prices were decontrolled from April 1, 2002, by the NDA govern-
ment, wherein oil marketing companies were free to price petrol and
diesel in line with import parity prices. However, LPG for domestic
use and kerosene sold under the public distribution system continued
to be subsidised, which would also later be dismantled.
However, with surging crude prices, the government decided to re-
view the tariff structure on petrol and diesel on a quarterly basis, tak-
ing into account factors such as global oil prices and domestic retail
prices. Since then, the government has been controlling the prices of
all essential products, including petrol, diesel, LPG (for domestic
use) and kerosene (under PDS).
Recently, the empowered group of ministers (EGoM) finally freed
fuel prices from the APM amid huge political opposition. The panel
of ministers said petrol prices will henceforth be market driven,
while diesel prices were only partially freed. Kerosene and cooking
gas prices were raised and are expected to be freed at a later date.
It is, however, unclear as to how under-recoveries in FY11 will be
shared and by whom, thereby dampening the enthusiasm of compa-
nies and investors.
Bombay High
Supplying 14% of India‘s
oil requirements and ac-
counting for about 38% of
domestic production, Bom-
bay High is perhaps the
most important fuel asset
the country has got within
its territorial limits.
Bombay High is an offshore
oilfield 160 km off the coast
of Mumbai. The oil opera-
tions are run by ONGC.
Bombay High field was
discovered by a Russian and
Indian oil exploration team
operating from the seismic
exploration vessel Aca-
demic Arkhangelsky during
mapping of the Gulf of
Khambat (earlier Cambay)
in 1964-67.
It was a curious combina-
tion of reasons that gave the
field its name. For one, it
got the name ―Bombay‖
because the team that con-
ducted a geological survey
in 1965, functioned out of
Rashmi Building at Cum-
balla Hill in Mumbai, then
called Bombay.
Also, since the deposit was
found in an ‗anticlinal fold
trap‘ (upward convex, in the
form of a hill), that gave
birth to the ―High‖ bit in the
name. The field was thus
called ―Bombay High‖. The
first offshore well was sunk
in 1974.
—Wikipedia
7
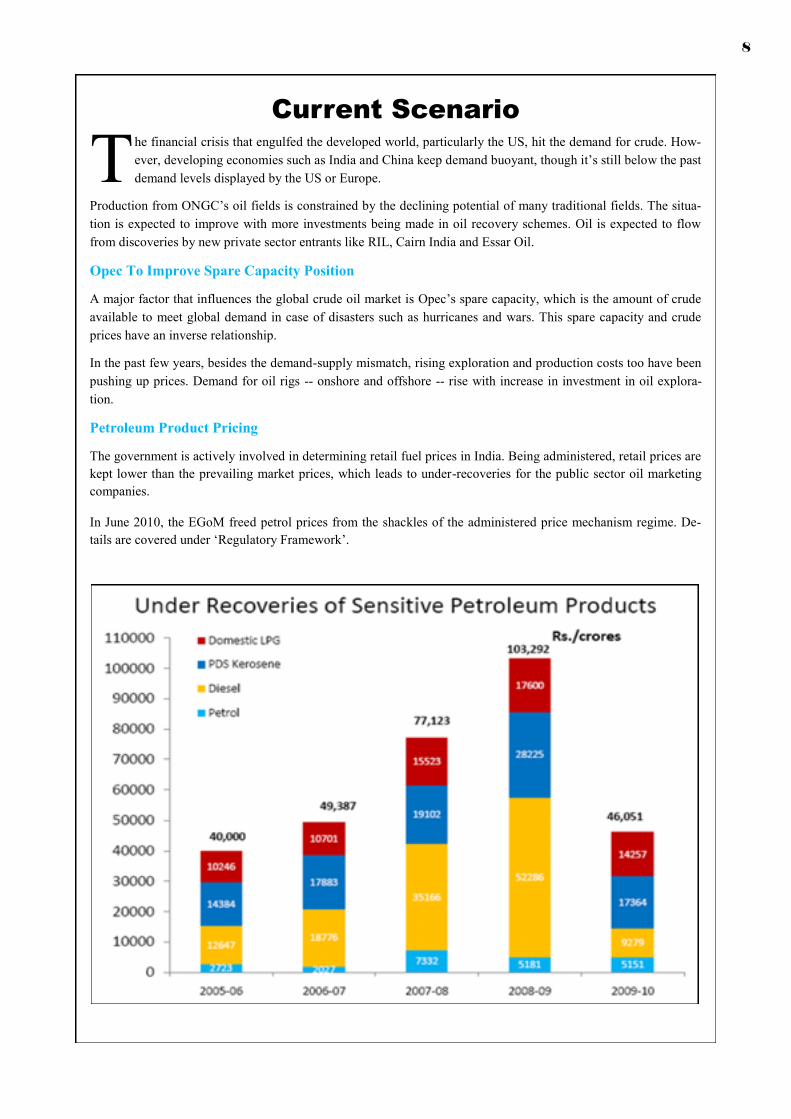
Current Scenario
T he financial crisis that engulfed the developed world, particularly the US, hit the demand for crude. How-
ever, developing economies such as India and China keep demand buoyant, though it‘s still below the past
demand levels displayed by the US or Europe.
Production from ONGC‘s oil fields is constrained by the declining potential of many traditional fields. The situa-
tion is expected to improve with more investments being made in oil recovery schemes. Oil is expected to flow
from discoveries by new private sector entrants like RIL, Cairn India and Essar Oil.
Opec To Improve Spare Capacity Position
A major factor that influences the global crude oil market is Opec‘s spare capacity, which is the amount of crude
available to meet global demand in case of disasters such as hurricanes and wars. This spare capacity and crude
prices have an inverse relationship.
In the past few years, besides the demand-supply mismatch, rising exploration and production costs too have been
pushing up prices. Demand for oil rigs -- onshore and offshore -- rise with increase in investment in oil explora-
tion.
Petroleum Product Pricing
The government is actively involved in determining retail fuel prices in India. Being administered, retail prices are
kept lower than the prevailing market prices, which leads to under-recoveries for the public sector oil marketing
companies.
In June 2010, the EGoM freed petrol prices from the shackles of the administered price mechanism regime. De-
tails are covered under ‗Regulatory Framework‘.
8

Financial Performance
P erformance of the crude oil and natural gas sector (only upstream companies) in India is mainly deter-
mined by the performance of ONGC -- the largest oil exploration company. The major cost components of
this industry include royalty and cess paid by companies to the government (see table 3).
While rising prices have augured well for the explorers, the subsidy burden borne by public sector companies,
including ONGC and Oil India, dent the profitability of the industry. These companies share with the oil market-
ing companies the under-recoveries arising out of retail sales below market prices.
On account of lower margins and high subsidy burden, the financial performance of oil refiners and marketers has
been poor.
The petroleum oil & products industry (upstream & downstream) accounts for a large chunk of the revenues of
corporate India. Lower prices of petroleum products, including regulated ones like petrol and diesel as well as non
-regulated ones, pulled down overall sales by 4.4% in FY10. Also, 2009-10 was a slow year for overall demand,
with demand for petro-products picking up pace from the December 2009 quarter.
Crude oil prices recorded a YoY rise from the December 2009 quarter onwards, resulting in a 3.1% fall in raw
material cost. The industry registered an 8.1% growth in employee cost. A fall in interest charges and other ex-
penses, together with lower raw material expenses, enabled it to record a 29.1% rise in net profits.
Table 3: Financial Performance Of Petroleum, Petro-Products & Natural Gas Cos
Rs crore % y-o-y growth
Mar-08 Mar-09 Mar-10 Mar-09 Mar-10
Net sales 714,210 890,178 850,778 24.6% -4.4%
Other income 9,911 14,605 15,755 47.4% 7.9%
Raw materials, stores, spares & purchase of
finished goods 587,376 724,881 697,514 23.4% -3.8%
Salaries and wages 9,473 13,656 14,758 44.1% 8.1%
Other expenses 40,777 63,332 55,679 55.3% -12.1%
Interest expenses 4,557 12,324 7,450 170.4% -39.6%
Depreciation 20,443 25,898 34,236 26.7% 32.2%
Total tax provision 19,254 16,611 21,037 -13.7% 26.6%
Net profit 46,120 40,424 52,183 -12.3% 29.1%
Note: Sample includes only 21 oil and gas companies with financial data available for all three years, for ease of comparability.
9

SWOT Analysis
Strengths
Demand for petroleum products increases with economic growth. Expectation of healthy economic growth
could bolster consumption of petroleum products, and hence sales of oil companies.
India has the potential of becoming a petroleum products hub, with many countries looking to source refined
products from relatively low-cost countries.
Weakness
High dependence on imported crude oil – accounting for over 80% of the consumption – could pose an energy
threat to the country anytime in the future. In this sense, such high dependence could amount to a strategic
disadvantage.
The sector is partially government-administered – that is, in LPG (domestic) and kerosene (under PDS) --
denting profitability of upstream and downstream companies.
Lack of crude storage makes the country — and by, extension, the oil companies — vulnerable to oil shocks.
Opportunities
The recent petrol price deregulation augurs well, especially for private players.
Backward and forward integration in the petroleum value chain portends a bright future.
Natural gas has the potential to be the fuel of the future with demand outpacing supply.
Threats
Deregulation of prices will boost competition for existing refining and marketing majors, with a possibility of
shrinkage in their market shares and, consequently, margins.
Continuation of government interference can hamper profits.
10
Note: All data used in the charts, graphs and tables in the previous pages have been sourced from the Minis-
try of Oil and Natural Gas, Govt of India.
Disclaimer Clause
This report is for customer ‘information’ only and does not constitute investment advice or an offer to purchase or subscribe
for any investment. This document is not intended to provide professional advice and should not be relied upon in that re-
gard. Persons accessing this document are advised to obtain appropriate professional advice where necessary. This document
is not directed to or intended for display, downloading, printing, reproducing or for distribution to or use by any person or
entity who is a citizen or resident or located in any locality, state, country or other jurisdiction where such distribution, pub-
lication, reproduction, availability or use would be contrary to law or regulation or would subject The Dhanalakshmi Bank
Limited or its associates or group companies to any registration or licensing requirement within such jurisdiction. If this
document is inadvertently sent or has reached any individual in such country, the same may be ignored and brought to the
attention of the sender. This document may not be reproduced, distributed or published for any purpose without prior writ-
ten approval of The Dhanalakshmi Bank Limited.