
Third Quarter results - Scotiabank … · Scotiabank reports third quarter results TORONTO, August...
63
2017 Quarterly Report Third Quarter results REPORT TO SHAREHOLDERS Scotiabank reports third quarter results TORONTO, August 29, 2017 – Scotiabank reported third quarter net income of $2,103 million compared to $1,959 million in the same period last year. Diluted earnings per share were $1.66, compared to $1.54 in the same period a year ago. Return on equity was 14.8%, in line with last year. A quarterly dividend increase of 3 cents to 79 cents was announced. “The Bank delivered strong quarterly earnings, generating double digit growth in our Canadian and International personal and commercial banking businesses,” said Brian Porter, President and CEO of Scotiabank. “Our good earnings momentum supported a quarterly dividend increase of 3 cents per common share – a 7% increase from last year. As well, we remain focused on leveraging our investments in digital and enhancing our capabilities to deliver a stronger customer experience. “Canadian Banking had a strong quarter exceeding $1 billion in earnings, driven by loan and deposit growth, margin expansion and productivity improvements. Our investments in digital banking, including Tangerine, will support deeper customer relationships. “International Banking delivered quarterly earnings exceeding $600 million. The strong momentum in our business was driven by good loan and deposit growth, positive operating leverage and improved credit quality. “The Bank’s Common Equity Tier 1 ratio remains strong at 11.3%. Our capital position provides flexibility to grow and invest in our businesses as well as return capital to shareholders. “We are pleased with our results. The strong performance of our underlying businesses, combined with high capital levels, will allow the Bank to continue making strategic investments, enhance our customer experience and drive sustainable results for our shareholders.” Live audio Web broadcast of the Bank’s analysts’ conference call. See page 61 for details.
Transcript of Third Quarter results - Scotiabank … · Scotiabank reports third quarter results TORONTO, August...
2017 Quarterly Report
Third QuarterresultsREPORT TO SHAREHOLDERS
Scotiabank reports third quarter results
TORONTO, August 29, 2017 – Scotiabank reported third quarter net income of $2,103 million comparedto $1,959 million in the same period last year. Diluted earnings per share were $1.66, compared to $1.54 inthe same period a year ago. Return on equity was 14.8%, in line with last year. A quarterly dividend increaseof 3 cents to 79 cents was announced.
“The Bank delivered strong quarterly earnings, generating double digit growth in our Canadian andInternational personal and commercial banking businesses,” said Brian Porter, President and CEO ofScotiabank. “Our good earnings momentum supported a quarterly dividend increase of 3 cents percommon share – a 7% increase from last year. As well, we remain focused on leveraging our investmentsin digital and enhancing our capabilities to deliver a stronger customer experience.
“Canadian Banking had a strong quarter exceeding $1 billion in earnings, driven by loan and depositgrowth, margin expansion and productivity improvements. Our investments in digital banking, includingTangerine, will support deeper customer relationships.
“International Banking delivered quarterly earnings exceeding $600 million. The strong momentum in ourbusiness was driven by good loan and deposit growth, positive operating leverage and improved creditquality.
“The Bank’s Common Equity Tier 1 ratio remains strong at 11.3%. Our capital position provides flexibilityto grow and invest in our businesses as well as return capital to shareholders.
“We are pleased with our results. The strong performance of our underlying businesses, combined withhigh capital levels, will allow the Bank to continue making strategic investments, enhance our customerexperience and drive sustainable results for our shareholders.”
Live audio Web broadcast of the Bank’s analysts’ conference call.
See page 61 for details.
Financial HighlightsAs at and for the three months ended For the nine months ended
(Unaudited)July 31
2017April 30
2017July 31
2016July 31
2017July 31
2016
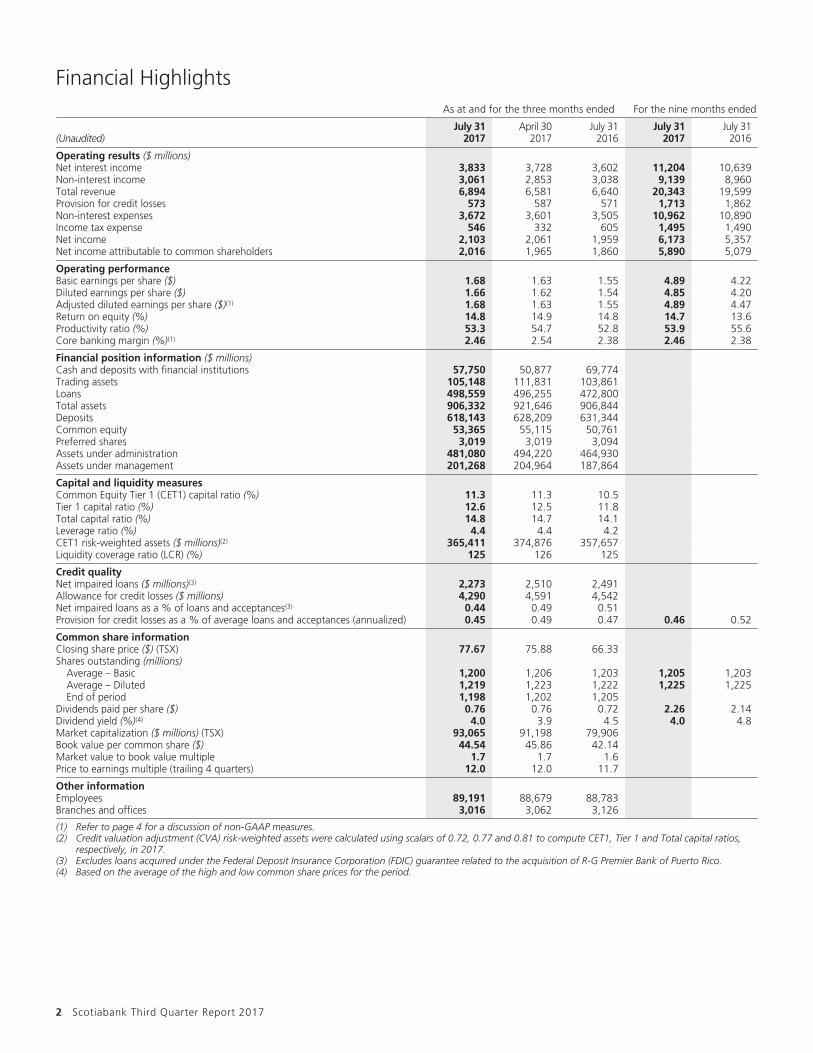
Operating results ($ millions)Net interest income 3,833 3,728 3,602 11,204 10,639Non-interest income 3,061 2,853 3,038 9,139 8,960Total revenue 6,894 6,581 6,640 20,343 19,599Provision for credit losses 573 587 571 1,713 1,862Non-interest expenses 3,672 3,601 3,505 10,962 10,890Income tax expense 546 332 605 1,495 1,490Net income 2,103 2,061 1,959 6,173 5,357Net income attributable to common shareholders 2,016 1,965 1,860 5,890 5,079
Operating performanceBasic earnings per share ($) 1.68 1.63 1.55 4.89 4.22Diluted earnings per share ($) 1.66 1.62 1.54 4.85 4.20Adjusted diluted earnings per share ($)(1) 1.68 1.63 1.55 4.89 4.47Return on equity (%) 14.8 14.9 14.8 14.7 13.6Productivity ratio (%) 53.3 54.7 52.8 53.9 55.6Core banking margin (%)(1) 2.46 2.54 2.38 2.46 2.38
Financial position information ($ millions)Cash and deposits with financial institutions 57,750 50,877 69,774Trading assets 105,148 111,831 103,861Loans 498,559 496,255 472,800Total assets 906,332 921,646 906,844Deposits 618,143 628,209 631,344Common equity 53,365 55,115 50,761Preferred shares 3,019 3,019 3,094Assets under administration 481,080 494,220 464,930Assets under management 201,268 204,964 187,864
Capital and liquidity measuresCommon Equity Tier 1 (CET1) capital ratio (%) 11.3 11.3 10.5Tier 1 capital ratio (%) 12.6 12.5 11.8Total capital ratio (%) 14.8 14.7 14.1Leverage ratio (%) 4.4 4.4 4.2CET1 risk-weighted assets ($ millions)(2) 365,411 374,876 357,657Liquidity coverage ratio (LCR) (%) 125 126 125
Credit qualityNet impaired loans ($ millions)(3) 2,273 2,510 2,491Allowance for credit losses ($ millions) 4,290 4,591 4,542Net impaired loans as a % of loans and acceptances(3) 0.44 0.49 0.51Provision for credit losses as a % of average loans and acceptances (annualized) 0.45 0.49 0.47 0.46 0.52
Common share informationClosing share price ($) (TSX) 77.67 75.88 66.33Shares outstanding (millions)
Average – Basic 1,200 1,206 1,203 1,205 1,203Average – Diluted 1,219 1,223 1,222 1,225 1,225End of period 1,198 1,202 1,205
Dividends paid per share ($) 0.76 0.76 0.72 2.26 2.14Dividend yield (%)(4) 4.0 3.9 4.5 4.0 4.8Market capitalization ($ millions) (TSX) 93,065 91,198 79,906Book value per common share ($) 44.54 45.86 42.14Market value to book value multiple 1.7 1.7 1.6Price to earnings multiple (trailing 4 quarters) 12.0 12.0 11.7
Other informationEmployees 89,191 88,679 88,783Branches and offices 3,016 3,062 3,126
(1) Refer to page 4 for a discussion of non-GAAP measures.(2) Credit valuation adjustment (CVA) risk-weighted assets were calculated using scalars of 0.72, 0.77 and 0.81 to compute CET1, Tier 1 and Total capital ratios,
respectively, in 2017.(3) Excludes loans acquired under the Federal Deposit Insurance Corporation (FDIC) guarantee related to the acquisition of R-G Premier Bank of Puerto Rico.(4) Based on the average of the high and low common share prices for the period.
2 Scotiabank Third Quarter Report 2017
MANAGEMENT’S DISCUSSION & ANALYSIS
MANAGEMENT’S DISCUSSION & ANALYSISThe Management’s Discussion and Analysis (MD&A) is provided to enable readers to assess the Bank’s financial condition and results of operations as atand for the period ended July 31, 2017. The MD&A should be read in conjunction with the Bank’s unaudited Condensed Interim Consolidated FinancialStatements included in this Report to Shareholders, and the Bank’s 2016 Annual Report. This MD&A is dated August 29, 2017.
Additional information relating to the Bank, including the Bank’s 2016 Annual Report, is available on the Bank’s website at www.scotiabank.com. Aswell, the Bank’s 2016 Annual Report and Annual Information Form are available on the SEDAR website at www.sedar.com and on the EDGAR section ofthe SEC’s website at www.sec.gov.
Contents
Management’s Discussion andAnalysis4 Non-GAAP Measures5 Group Financial Performance8 Business Segment Review
16 Geographic Highlights
16 Quarterly Financial Highlights17 Financial Position17 Risk Management30 Capital Management31 Financial Instruments31 Securitizations
31 Off-Balance Sheet Arrangements32 Regulatory Developments33 Accounting Policies and Controls33 Economic Outlook34 Share Data
Forward-looking statements Our public communications often include oral or written forward-looking statements. Statements of this type are includedin this document, and may be included in other filings with Canadian securities regulators or the U.S. Securities and Exchange Commission, or in othercommunications. All such statements are made pursuant to the “safe harbor” provisions of the U.S. Private Securities Litigation Reform Act of 1995 andany applicable Canadian securities legislation. Forward-looking statements may include, but are not limited to, statements made in this document, theManagement’s Discussion and Analysis in the Bank’s 2016 Annual Report under the headings “Overview-Outlook,” for Group Financial Performance“Outlook,” for each business segment “Outlook” and in other statements regarding the Bank’s objectives, strategies to achieve those objectives, theregulatory environment in which the Bank operates, anticipated financial results (including those in the area of risk management), and the outlook for theBank’s businesses and for the Canadian, U.S. and global economies. Such statements are typically identified by words or phrases such as “believe,”“expect,” “anticipate,” “intent,” “estimate,” “plan,” “may increase,” “may fluctuate,” and similar expressions of future or conditional verbs, such as“will,” “may,” “should,” “would” and “could.”
By their very nature, forward-looking statements involve numerous assumptions, inherent risks and uncertainties, both general and specific, and therisk that predictions and other forward-looking statements will not prove to be accurate. Do not unduly rely on forward-looking statements, as a numberof important factors, many of which are beyond the Bank’s control and the effects of which can be difficult to predict, could cause actual results to differmaterially from the estimates and intentions expressed in such forward-looking statements. These factors include, but are not limited to: the economic andfinancial conditions in Canada and globally; fluctuations in interest rates and currency values; liquidity and funding; significant market volatility andinterruptions; the failure of third parties to comply with their obligations to the Bank and its affiliates; changes in monetary policy; legislative andregulatory developments in Canada and elsewhere, including changes to, and interpretations of tax laws and risk-based capital guidelines and reportinginstructions and liquidity regulatory guidance; changes to the Bank’s credit ratings; operational (including technology) and infrastructure risks; reputationalrisks; the risk that the Bank’s risk management models may not take into account all relevant factors; the accuracy and completeness of information theBank receives on customers and counterparties; the timely development and introduction of new products and services in receptive markets; the Bank’sability to expand existing distribution channels and to develop and realize revenues from new distribution channels; the Bank’s ability to complete andintegrate acquisitions and its other growth strategies; critical accounting estimates and the effects of changes in accounting policies and methods used bythe Bank as described in the Bank’s annual financial statements (See “Controls and Accounting Policies—Critical accounting estimates” in the Bank’s 2016Annual Report) and updated by this document; global capital markets activity; the Bank’s ability to attract and retain key executives; reliance on thirdparties to provide components of the Bank’s business infrastructure; unexpected changes in consumer spending and saving habits; technologicaldevelopments; fraud by internal or external parties, including the use of new technologies in unprecedented ways to defraud the Bank or its customers;increasing cyber security risks which may include theft of assets, unauthorized access to sensitive information or operational disruption; consolidation inthe financial services sector in Canada and globally; competition, both from new entrants and established competitors; judicial and regulatory proceedings;natural disasters, including, but not limited to, earthquakes and hurricanes, and disruptions to public infrastructure, such as transportation,communication, power or water supply; the possible impact of international conflicts and other developments, including terrorist activities and war; theeffects of disease or illness on local, national or international economies; and the Bank’s anticipation of and success in managing the risks implied by theforegoing. A substantial amount of the Bank’s business involves making loans or otherwise committing resources to specific companies, industries orcountries. Unforeseen events affecting such borrowers, industries or countries could have a material adverse effect on the Bank’s financial results,businesses, financial condition or liquidity. These and other factors may cause the Bank’s actual performance to differ materially from that contemplatedby forward-looking statements. For more information, see the “Risk Management” section of the Bank’s 2016 Annual Report.
Material economic assumptions underlying the forward-looking statements contained in this document are set out in the 2016 Annual Report underthe heading “Overview-Outlook,” as updated by this document; and for each business segment “Outlook”. The “Outlook” sections are based on theBank’s views and the actual outcome is uncertain. Readers should consider the above-noted factors when reviewing these sections. The preceding list offactors is not exhaustive of all possible risk factors and other factors could also adversely affect the Bank’s results. When relying on forward-lookingstatements to make decisions with respect to the Bank and its securities, investors and others should carefully consider the preceding factors, otheruncertainties and potential events. The forward-looking statements contained in this document are presented for the purpose of assisting the holders ofthe Bank’s securities and financial analysts in understanding the Bank’s financial position and results of operations as at and for the periods ended on thedates presented, as well as the Bank’s financial performance objectives, vision and strategic goals, and may not be appropriate for other purposes. Exceptas required by law, the Bank does not undertake to update any forward-looking statements, whether written or oral, that may be made from time to timeby or on its behalf.
Additional information relating to the Bank, including the Bank’s Annual Information Form, can be located on the SEDAR website at www.sedar.comand on the EDGAR section of the SEC’s website at www.sec.gov.
Scotiabank Third Quarter Report 2017 3
MANAGEMENT’S DISCUSSION & ANALYSIS
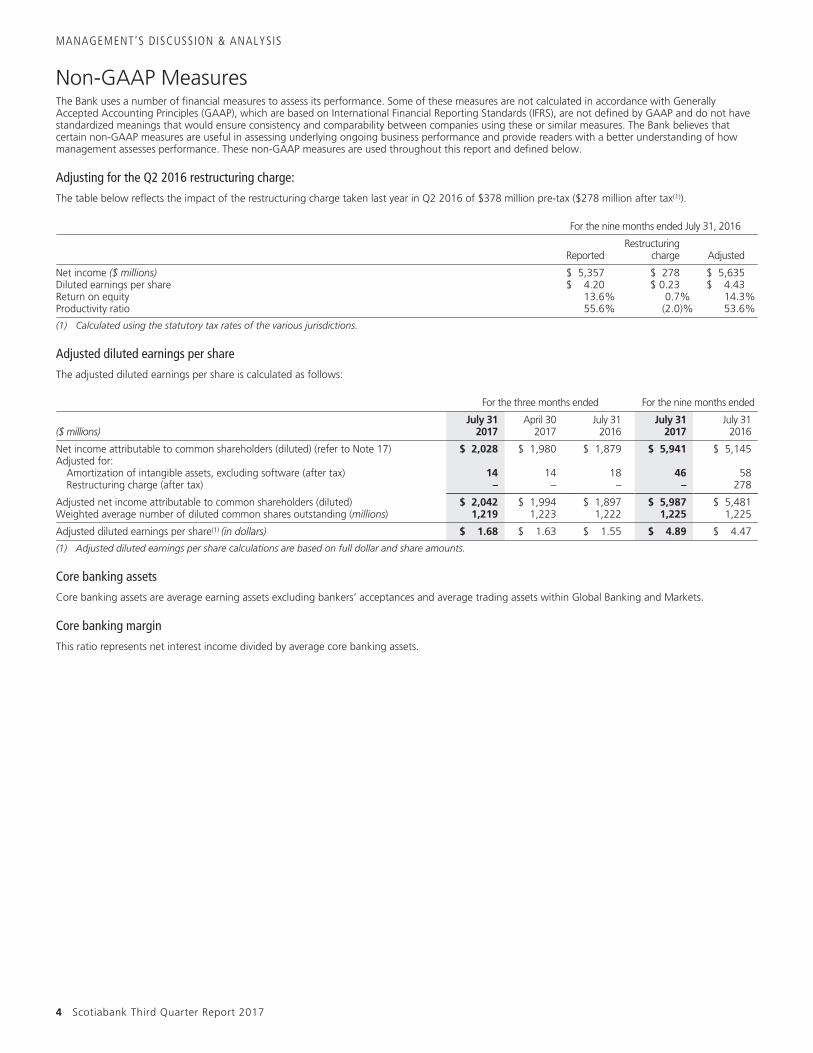
Non-GAAP MeasuresThe Bank uses a number of financial measures to assess its performance. Some of these measures are not calculated in accordance with GenerallyAccepted Accounting Principles (GAAP), which are based on International Financial Reporting Standards (IFRS), are not defined by GAAP and do not havestandardized meanings that would ensure consistency and comparability between companies using these or similar measures. The Bank believes thatcertain non-GAAP measures are useful in assessing underlying ongoing business performance and provide readers with a better understanding of howmanagement assesses performance. These non-GAAP measures are used throughout this report and defined below.
Adjusting for the Q2 2016 restructuring charge:
The table below reflects the impact of the restructuring charge taken last year in Q2 2016 of $378 million pre-tax ($278 million after tax(1)).
For the nine months ended July 31, 2016
ReportedRestructuring
charge Adjusted
Net income ($ millions) $ 5,357 $ 278 $ 5,635Diluted earnings per share $ 4.20 $ 0.23 $ 4.43Return on equity 13.6% 0.7% 14.3%Productivity ratio 55.6% (2.0)% 53.6%
(1) Calculated using the statutory tax rates of the various jurisdictions.
Adjusted diluted earnings per share
The adjusted diluted earnings per share is calculated as follows:
For the three months ended For the nine months ended
($ millions)July 31
2017April 30
2017July 31
2016July 31
2017July 31
2016
Net income attributable to common shareholders (diluted) (refer to Note 17) $ 2,028 $ 1,980 $ 1,879 $ 5,941 $ 5,145Adjusted for:
Amortization of intangible assets, excluding software (after tax) 14 14 18 46 58Restructuring charge (after tax) – – – – 278
Adjusted net income attributable to common shareholders (diluted) $ 2,042 $ 1,994 $ 1,897 $ 5,987 $ 5,481Weighted average number of diluted common shares outstanding (millions) 1,219 1,223 1,222 1,225 1,225
Adjusted diluted earnings per share(1) (in dollars) $ 1.68 $ 1.63 $ 1.55 $ 4.89 $ 4.47
(1) Adjusted diluted earnings per share calculations are based on full dollar and share amounts.
Core banking assets
Core banking assets are average earning assets excluding bankers’ acceptances and average trading assets within Global Banking and Markets.
Core banking margin
This ratio represents net interest income divided by average core banking assets.
4 Scotiabank Third Quarter Report 2017
MANAGEMENT’S DISCUSSION & ANALYSIS
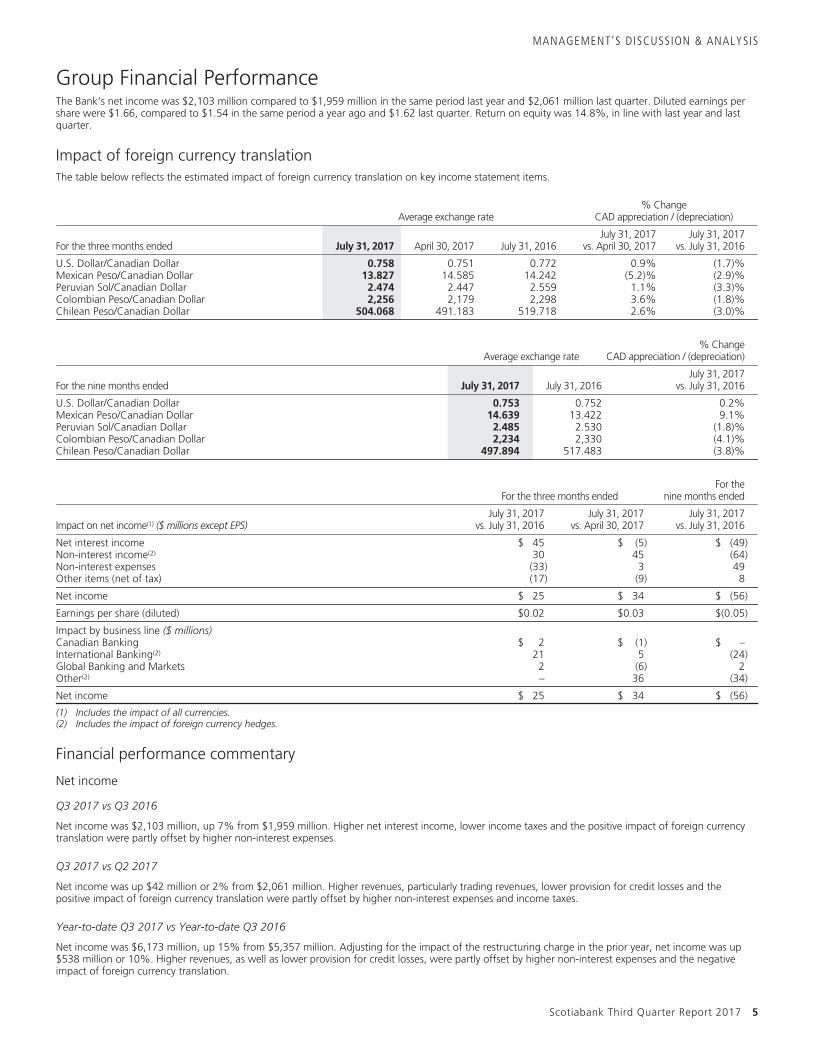
Group Financial PerformanceThe Bank’s net income was $2,103 million compared to $1,959 million in the same period last year and $2,061 million last quarter. Diluted earnings pershare were $1.66, compared to $1.54 in the same period a year ago and $1.62 last quarter. Return on equity was 14.8%, in line with last year and lastquarter.
Impact of foreign currency translationThe table below reflects the estimated impact of foreign currency translation on key income statement items.
Average exchange rate% Change
CAD appreciation / (depreciation)
For the three months ended July 31, 2017 April 30, 2017 July 31, 2016July 31, 2017
vs. April 30, 2017July 31, 2017
vs. July 31, 2016
U.S. Dollar/Canadian Dollar 0.758 0.751 0.772 0.9% (1.7)%Mexican Peso/Canadian Dollar 13.827 14.585 14.242 (5.2)% (2.9)%Peruvian Sol/Canadian Dollar 2.474 2.447 2.559 1.1% (3.3)%Colombian Peso/Canadian Dollar 2,256 2,179 2,298 3.6% (1.8)%Chilean Peso/Canadian Dollar 504.068 491.183 519.718 2.6% (3.0)%
Average exchange rate% Change
CAD appreciation / (depreciation)
For the nine months ended July 31, 2017 July 31, 2016July 31, 2017
vs. July 31, 2016
U.S. Dollar/Canadian Dollar 0.753 0.752 0.2%Mexican Peso/Canadian Dollar 14.639 13.422 9.1%Peruvian Sol/Canadian Dollar 2.485 2.530 (1.8)%Colombian Peso/Canadian Dollar 2,234 2,330 (4.1)%Chilean Peso/Canadian Dollar 497.894 517.483 (3.8)%
For the three months endedFor the
nine months ended
Impact on net income(1) ($ millions except EPS)July 31, 2017
vs. July 31, 2016July 31, 2017
vs. April 30, 2017July 31, 2017
vs. July 31, 2016
Net interest income $ 45 $ (5) $ (49)Non-interest income(2) 30 45 (64)Non-interest expenses (33) 3 49Other items (net of tax) (17) (9) 8
Net income $ 25 $ 34 $ (56)
Earnings per share (diluted) $0.02 $0.03 $(0.05)
Impact by business line ($ millions)Canadian Banking $ 2 $ (1) $ –International Banking(2) 21 5 (24)Global Banking and Markets 2 (6) 2Other(2) – 36 (34)
Net income $ 25 $ 34 $ (56)
(1) Includes the impact of all currencies.(2) Includes the impact of foreign currency hedges.
Financial performance commentary
Net income
Q3 2017 vs Q3 2016
Net income was $2,103 million, up 7% from $1,959 million. Higher net interest income, lower income taxes and the positive impact of foreign currencytranslation were partly offset by higher non-interest expenses.
Q3 2017 vs Q2 2017
Net income was up $42 million or 2% from $2,061 million. Higher revenues, particularly trading revenues, lower provision for credit losses and thepositive impact of foreign currency translation were partly offset by higher non-interest expenses and income taxes.
Year-to-date Q3 2017 vs Year-to-date Q3 2016
Net income was $6,173 million, up 15% from $5,357 million. Adjusting for the impact of the restructuring charge in the prior year, net income was up$538 million or 10%. Higher revenues, as well as lower provision for credit losses, were partly offset by higher non-interest expenses and the negativeimpact of foreign currency translation.
Scotiabank Third Quarter Report 2017 5
MANAGEMENT’S DISCUSSION & ANALYSIS
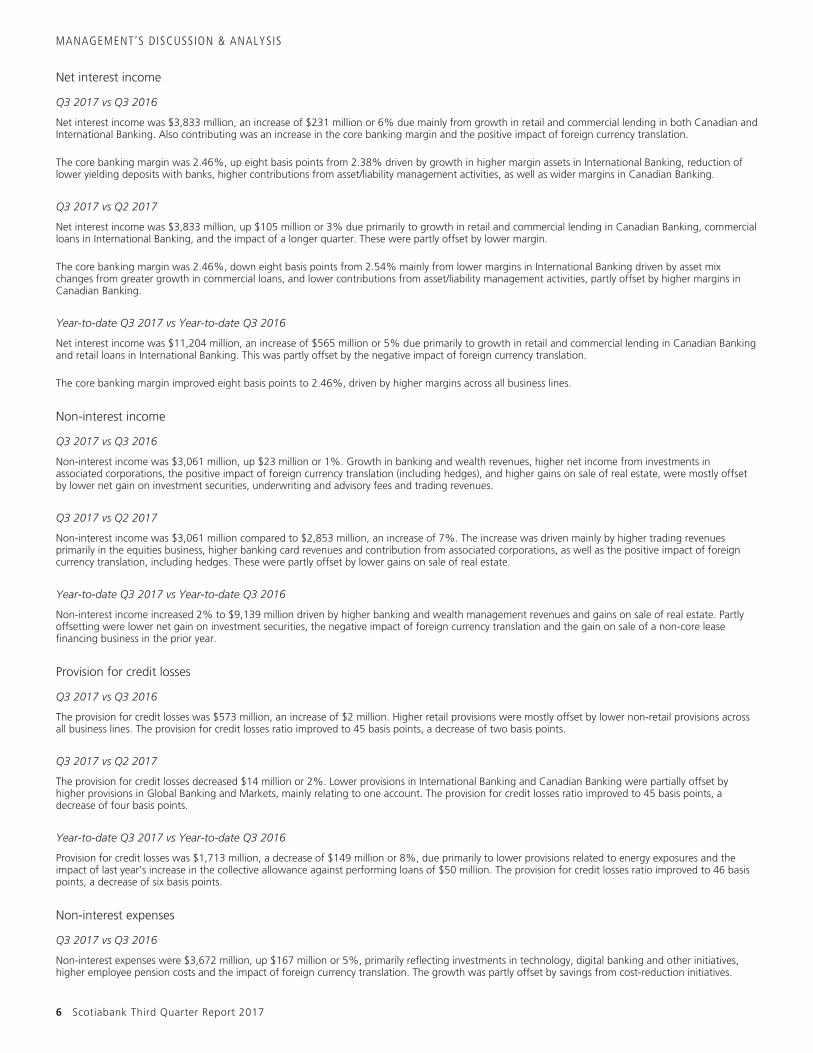
Net interest income
Q3 2017 vs Q3 2016
Net interest income was $3,833 million, an increase of $231 million or 6% due mainly from growth in retail and commercial lending in both Canadian andInternational Banking. Also contributing was an increase in the core banking margin and the positive impact of foreign currency translation.
The core banking margin was 2.46%, up eight basis points from 2.38% driven by growth in higher margin assets in International Banking, reduction oflower yielding deposits with banks, higher contributions from asset/liability management activities, as well as wider margins in Canadian Banking.
Q3 2017 vs Q2 2017
Net interest income was $3,833 million, up $105 million or 3% due primarily to growth in retail and commercial lending in Canadian Banking, commercialloans in International Banking, and the impact of a longer quarter. These were partly offset by lower margin.
The core banking margin was 2.46%, down eight basis points from 2.54% mainly from lower margins in International Banking driven by asset mixchanges from greater growth in commercial loans, and lower contributions from asset/liability management activities, partly offset by higher margins inCanadian Banking.
Year-to-date Q3 2017 vs Year-to-date Q3 2016
Net interest income was $11,204 million, an increase of $565 million or 5% due primarily to growth in retail and commercial lending in Canadian Bankingand retail loans in International Banking. This was partly offset by the negative impact of foreign currency translation.
The core banking margin improved eight basis points to 2.46%, driven by higher margins across all business lines.
Non-interest income
Q3 2017 vs Q3 2016
Non-interest income was $3,061 million, up $23 million or 1%. Growth in banking and wealth revenues, higher net income from investments inassociated corporations, the positive impact of foreign currency translation (including hedges), and higher gains on sale of real estate, were mostly offsetby lower net gain on investment securities, underwriting and advisory fees and trading revenues.
Q3 2017 vs Q2 2017
Non-interest income was $3,061 million compared to $2,853 million, an increase of 7%. The increase was driven mainly by higher trading revenuesprimarily in the equities business, higher banking card revenues and contribution from associated corporations, as well as the positive impact of foreigncurrency translation, including hedges. These were partly offset by lower gains on sale of real estate.
Year-to-date Q3 2017 vs Year-to-date Q3 2016
Non-interest income increased 2% to $9,139 million driven by higher banking and wealth management revenues and gains on sale of real estate. Partlyoffsetting were lower net gain on investment securities, the negative impact of foreign currency translation and the gain on sale of a non-core leasefinancing business in the prior year.
Provision for credit losses
Q3 2017 vs Q3 2016
The provision for credit losses was $573 million, an increase of $2 million. Higher retail provisions were mostly offset by lower non-retail provisions acrossall business lines. The provision for credit losses ratio improved to 45 basis points, a decrease of two basis points.
Q3 2017 vs Q2 2017
The provision for credit losses decreased $14 million or 2%. Lower provisions in International Banking and Canadian Banking were partially offset byhigher provisions in Global Banking and Markets, mainly relating to one account. The provision for credit losses ratio improved to 45 basis points, adecrease of four basis points.
Year-to-date Q3 2017 vs Year-to-date Q3 2016
Provision for credit losses was $1,713 million, a decrease of $149 million or 8%, due primarily to lower provisions related to energy exposures and theimpact of last year’s increase in the collective allowance against performing loans of $50 million. The provision for credit losses ratio improved to 46 basispoints, a decrease of six basis points.
Non-interest expenses
Q3 2017 vs Q3 2016
Non-interest expenses were $3,672 million, up $167 million or 5%, primarily reflecting investments in technology, digital banking and other initiatives,higher employee pension costs and the impact of foreign currency translation. The growth was partly offset by savings from cost-reduction initiatives.
6 Scotiabank Third Quarter Report 2017
MANAGEMENT’S DISCUSSION & ANALYSIS
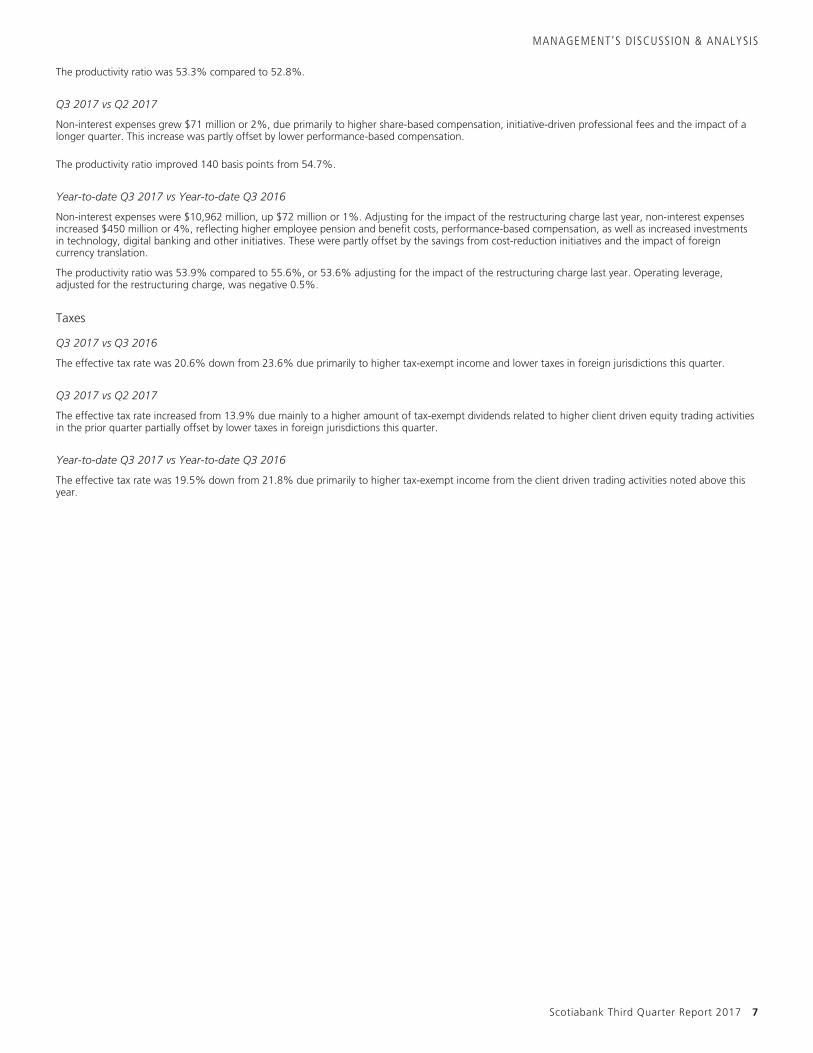
The productivity ratio was 53.3% compared to 52.8%.
Q3 2017 vs Q2 2017
Non-interest expenses grew $71 million or 2%, due primarily to higher share-based compensation, initiative-driven professional fees and the impact of alonger quarter. This increase was partly offset by lower performance-based compensation.
The productivity ratio improved 140 basis points from 54.7%.
Year-to-date Q3 2017 vs Year-to-date Q3 2016
Non-interest expenses were $10,962 million, up $72 million or 1%. Adjusting for the impact of the restructuring charge last year, non-interest expensesincreased $450 million or 4%, reflecting higher employee pension and benefit costs, performance-based compensation, as well as increased investmentsin technology, digital banking and other initiatives. These were partly offset by the savings from cost-reduction initiatives and the impact of foreigncurrency translation.
The productivity ratio was 53.9% compared to 55.6%, or 53.6% adjusting for the impact of the restructuring charge last year. Operating leverage,adjusted for the restructuring charge, was negative 0.5%.
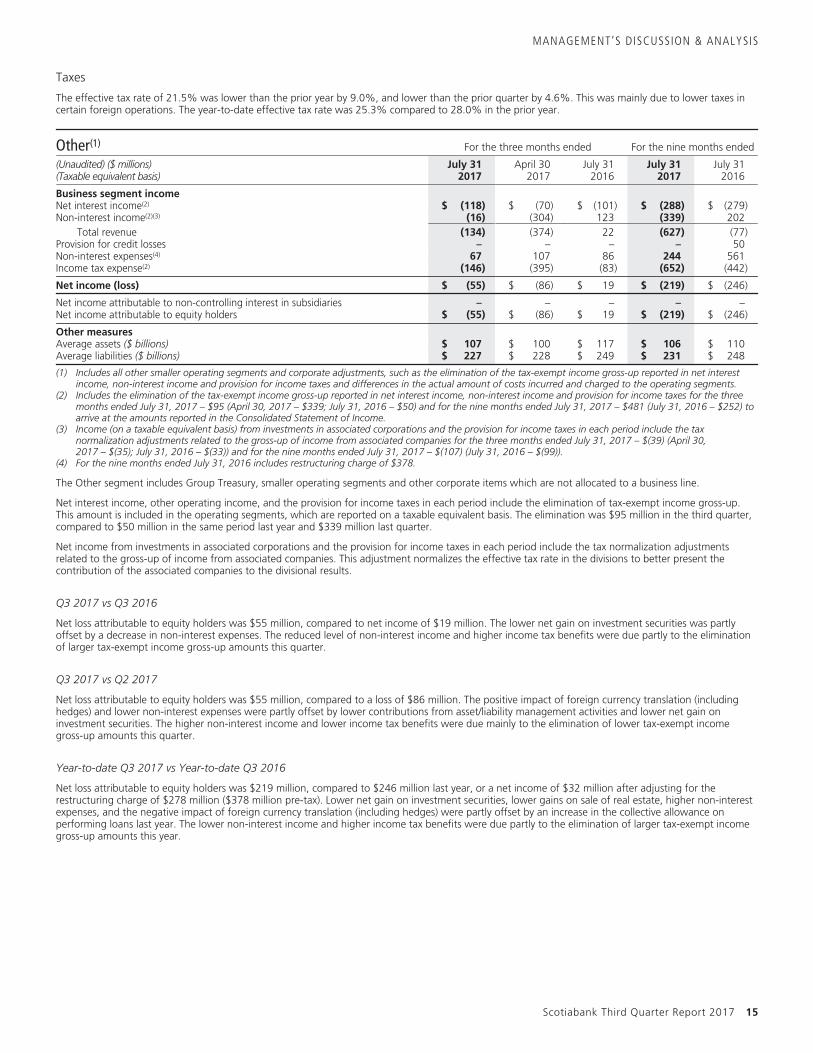
Taxes
Q3 2017 vs Q3 2016
The effective tax rate was 20.6% down from 23.6% due primarily to higher tax-exempt income and lower taxes in foreign jurisdictions this quarter.
Q3 2017 vs Q2 2017
The effective tax rate increased from 13.9% due mainly to a higher amount of tax-exempt dividends related to higher client driven equity trading activitiesin the prior quarter partially offset by lower taxes in foreign jurisdictions this quarter.
Year-to-date Q3 2017 vs Year-to-date Q3 2016
The effective tax rate was 19.5% down from 21.8% due primarily to higher tax-exempt income from the client driven trading activities noted above thisyear.
Scotiabank Third Quarter Report 2017 7
MANAGEMENT’S DISCUSSION & ANALYSIS
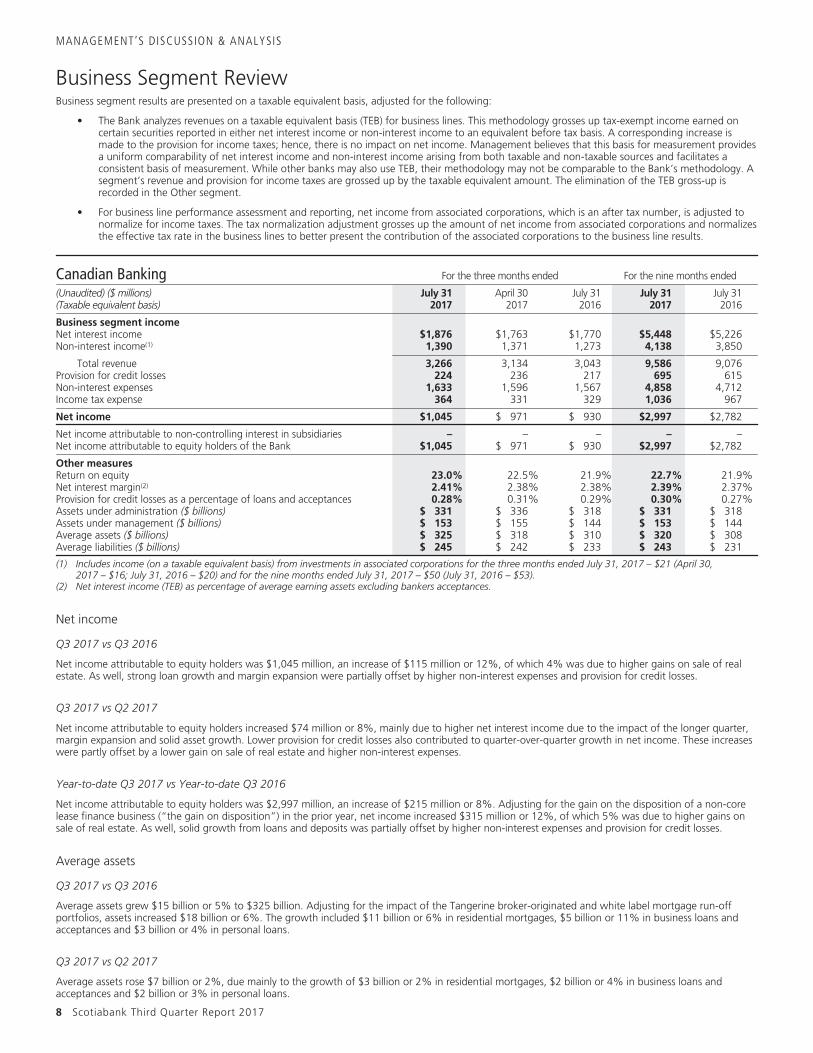
Business Segment ReviewBusiness segment results are presented on a taxable equivalent basis, adjusted for the following:
• The Bank analyzes revenues on a taxable equivalent basis (TEB) for business lines. This methodology grosses up tax-exempt income earned oncertain securities reported in either net interest income or non-interest income to an equivalent before tax basis. A corresponding increase ismade to the provision for income taxes; hence, there is no impact on net income. Management believes that this basis for measurement providesa uniform comparability of net interest income and non-interest income arising from both taxable and non-taxable sources and facilitates aconsistent basis of measurement. While other banks may also use TEB, their methodology may not be comparable to the Bank’s methodology. Asegment’s revenue and provision for income taxes are grossed up by the taxable equivalent amount. The elimination of the TEB gross-up isrecorded in the Other segment.
• For business line performance assessment and reporting, net income from associated corporations, which is an after tax number, is adjusted tonormalize for income taxes. The tax normalization adjustment grosses up the amount of net income from associated corporations and normalizesthe effective tax rate in the business lines to better present the contribution of the associated corporations to the business line results.
Canadian Banking For the three months ended For the nine months ended
(Unaudited) ($ millions)(Taxable equivalent basis)
July 312017
April 302017
July 312016
July 312017
July 312016
Business segment incomeNet interest income $1,876 $1,763 $1,770 $5,448 $5,226Non-interest income(1) 1,390 1,371 1,273 4,138 3,850
Total revenue 3,266 3,134 3,043 9,586 9,076Provision for credit losses 224 236 217 695 615Non-interest expenses 1,633 1,596 1,567 4,858 4,712Income tax expense 364 331 329 1,036 967
Net income $1,045 $ 971 $ 930 $2,997 $2,782
Net income attributable to non-controlling interest in subsidiaries – – – – –Net income attributable to equity holders of the Bank $1,045 $ 971 $ 930 $2,997 $2,782
Other measuresReturn on equity 23.0% 22.5% 21.9% 22.7% 21.9%Net interest margin(2) 2.41% 2.38% 2.38% 2.39% 2.37%Provision for credit losses as a percentage of loans and acceptances 0.28% 0.31% 0.29% 0.30% 0.27%Assets under administration ($ billions) $ 331 $ 336 $ 318 $ 331 $ 318Assets under management ($ billions) $ 153 $ 155 $ 144 $ 153 $ 144Average assets ($ billions) $ 325 $ 318 $ 310 $ 320 $ 308Average liabilities ($ billions) $ 245 $ 242 $ 233 $ 243 $ 231
(1) Includes income (on a taxable equivalent basis) from investments in associated corporations for the three months ended July 31, 2017 – $21 (April 30,2017 – $16; July 31, 2016 – $20) and for the nine months ended July 31, 2017 – $50 (July 31, 2016 – $53).
(2) Net interest income (TEB) as percentage of average earning assets excluding bankers acceptances.
Net income
Q3 2017 vs Q3 2016
Net income attributable to equity holders was $1,045 million, an increase of $115 million or 12%, of which 4% was due to higher gains on sale of realestate. As well, strong loan growth and margin expansion were partially offset by higher non-interest expenses and provision for credit losses.
Q3 2017 vs Q2 2017
Net income attributable to equity holders increased $74 million or 8%, mainly due to higher net interest income due to the impact of the longer quarter,margin expansion and solid asset growth. Lower provision for credit losses also contributed to quarter-over-quarter growth in net income. These increaseswere partly offset by a lower gain on sale of real estate and higher non-interest expenses.
Year-to-date Q3 2017 vs Year-to-date Q3 2016
Net income attributable to equity holders was $2,997 million, an increase of $215 million or 8%. Adjusting for the gain on the disposition of a non-corelease finance business (“the gain on disposition”) in the prior year, net income increased $315 million or 12%, of which 5% was due to higher gains onsale of real estate. As well, solid growth from loans and deposits was partially offset by higher non-interest expenses and provision for credit losses.
Average assets
Q3 2017 vs Q3 2016
Average assets grew $15 billion or 5% to $325 billion. Adjusting for the impact of the Tangerine broker-originated and white label mortgage run-offportfolios, assets increased $18 billion or 6%. The growth included $11 billion or 6% in residential mortgages, $5 billion or 11% in business loans andacceptances and $3 billion or 4% in personal loans.
Q3 2017 vs Q2 2017
Average assets rose $7 billion or 2%, due mainly to the growth of $3 billion or 2% in residential mortgages, $2 billion or 4% in business loans andacceptances and $2 billion or 3% in personal loans.
8 Scotiabank Third Quarter Report 2017
MANAGEMENT’S DISCUSSION & ANALYSIS
Year-to-date Q3 2017 vs Year-to-date Q3 2016
Average assets grew $12 billion or 4%. Adjusting for the impact of the Tangerine broker-originated and white label mortgage run-off portfolios, assetsincreased $15 billion or 5%. The growth included $8 billion or 5% in residential mortgages, $4 billion or 9% in business loans and acceptances and$3 billion or 4% in personal loans.
Average liabilities
Q3 2017 vs Q3 2016
Average liabilities increased $12 billion or 5%, including strong growth of $7 billion or 10% in retail banking savings deposits, and $2 billion or 11% inchequing accounts. As well, there was growth of $5 billion or 10% in small business and commercial banking operating accounts. This was partially offsetby a decline in GICs of $3 billion or 4%.
Q3 2017 vs Q2 2017
Average liabilities increased $3 billion or 2%, primarily driven by growth of $2 billion or 4% in small business and commercial banking operating accountsand $1 billion or 4% in chequing accounts.
Year-to-date Q3 2017 vs Year-to-date Q3 2016
Average liabilities increased $12 billion or 5%, including strong growth of $8 billion or 11% in retail banking savings deposits and $2 billion or 10% inchequing accounts. As well, there was growth of $4 billion or 9% in small business and commercial banking operating accounts. This was partially offsetby a decline in GICs of $3 billion or 4%.
Assets under management (AUM) and assets under administration (AUA)
Q3 2017 vs Q3 2016
AUM of $153 billion increased $9 billion or 6% from the same quarter last year driven by market appreciation and net sales.AUA of $331 billion increased $13 billion or 4% from the same quarter last year driven by market appreciation.
Q3 2017 vs Q2 2017
AUM decreased $2 billion or 1% and AUA decreased $5 billion or 1% from the previous quarter driven by market depreciation.
Net interest income
Q3 2017 vs Q3 2016
Net interest income of $1,876 million was up $106 million or 6%. This was driven by solid growth in assets and deposits. The margin increased three basispoints to 2.41%, due to higher yields on unsecured lending, the impact of the run-off of lower spread Tangerine mortgages and higher deposit volumes.
Q3 2017 vs Q2 2017
Net interest income increased $113 million or 6% due mainly to the impact of the longer quarter, solid asset growth and a higher margin.
Year-to-date Q3 2017 vs Year-to-date Q3 2016
Net interest income of $5,448 million was up $222 million or 4%. This was driven by asset and deposit growth and a higher margin. The margin increasedby two basis points due to the impact of the run-off of lower spread Tangerine mortgages, higher deposit volumes and higher yields on unsecuredlending.
Non-interest income
Q3 2017 vs Q3 2016
Non-interest income of $1,390 million increased $117 million or 9%, of which 4% was due to higher gains on sale of real estate. The remainder wasprimarily due to growth in mutual fund revenue, brokerage fees, card revenues and deposit and payment fees.
Q3 2017 vs Q2 2017
Non-interest income increased $19 million or 1%. Growth in card revenues and deposit and payment fees was partially offset by a decrease in the gain onsale of real estate.
Year-to-date Q3 2017 vs Year-to-date Q3 2016
Non-interest income of $4,138 million increased $288 million or 7%. Adjusting for the gain on disposition, non-interest income increased $404 million or11%, of which 4% was due to higher gains on sale of real estate. The remainder was primarily from growth in mutual fund fees, card revenues andcommercial credit fees.
Scotiabank Third Quarter Report 2017 9
MANAGEMENT’S DISCUSSION & ANALYSIS
Provision for credit losses
Q3 2017 vs Q3 2016
The provision for credit losses was $224 million, up $7 million or 3%, due to higher retail provisions mostly offset by lower commercial provisions. Theprovision for credit losses ratio improved to 28 basis points, a decrease of one basis point.
Q3 2017 vs Q2 2017
Provision for credit losses was down $12 million or 5% due to lower provisions in both retail and commercial portfolios. The provision for credit losses ratioimproved to 28 basis points, a decrease of three basis points.
Year-to-date Q3 2017 vs Year-to-date Q3 2016
The provision for credit losses was $695 million, up $80 million or 13% with higher provisions in the retail portfolios. The provision for credit losses ratiowas 30 basis points, up three basis points.
Non-interest expenses
Q3 2017 vs Q3 2016
Non-interest expenses were $1,633 million, an increase of $66 million or 4%, primarily reflecting higher investments in digital and technology to supportbusiness growth. These were partially offset by benefits realized from cost-reduction initiatives.
Q3 2017 vs Q2 2017
Non-interest expenses increased by $37 million or 2%, primarily reflecting higher investments in digital and technology to support business growth andthe impact of the longer quarter. These were partially offset by benefits realized from cost-reduction initiatives.
Year-to-date Q3 2017 vs Year-to-date Q3 2016
Non-interest expenses were $4,858 million year to date, an increase of $146 million or 3%, primarily reflecting higher investments in digital andtechnology to support business growth. These were partially offset by benefits realized from cost-reduction initiatives.
Taxes
The effective tax rate of 25.8% this quarter was in line with the prior year and the prior quarter. The year-to-date effective tax rate of 25.7% was in linewith the prior year.
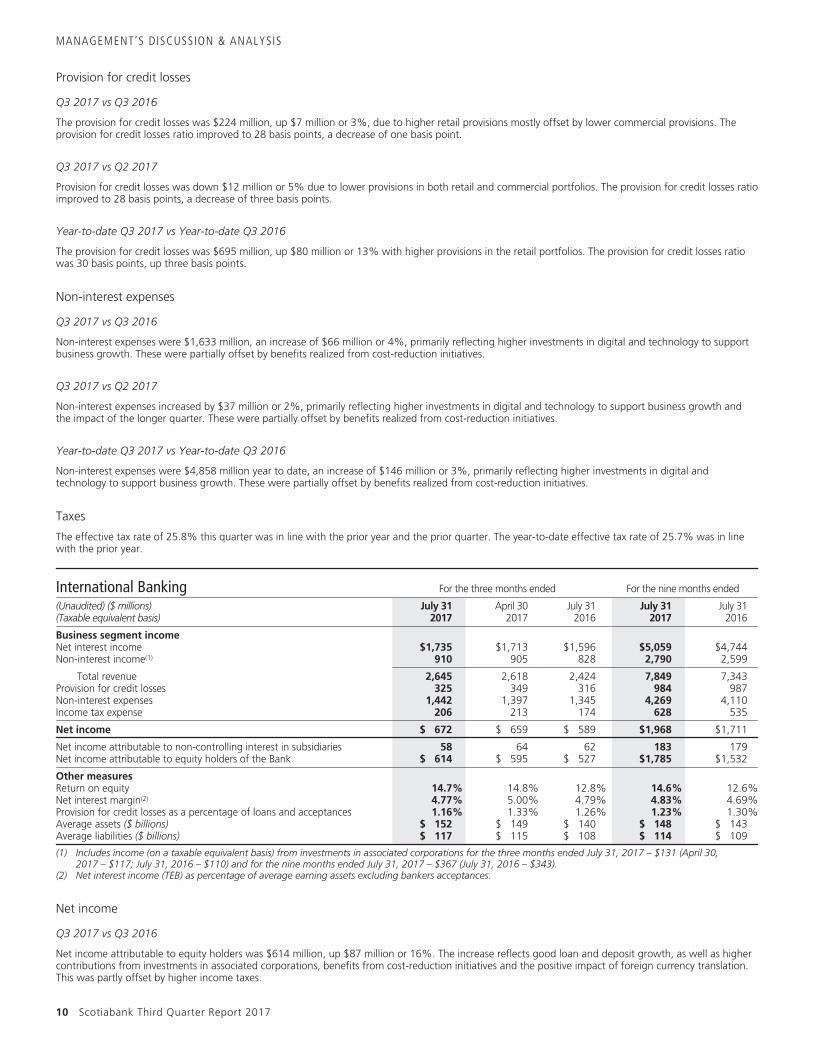
International Banking For the three months ended For the nine months ended
(Unaudited) ($ millions)(Taxable equivalent basis)
July 312017
April 302017
July 312016
July 312017
July 312016
Business segment incomeNet interest income $1,735 $1,713 $1,596 $5,059 $4,744Non-interest income(1) 910 905 828 2,790 2,599
Total revenue 2,645 2,618 2,424 7,849 7,343Provision for credit losses 325 349 316 984 987Non-interest expenses 1,442 1,397 1,345 4,269 4,110Income tax expense 206 213 174 628 535
Net income $ 672 $ 659 $ 589 $1,968 $1,711
Net income attributable to non-controlling interest in subsidiaries 58 64 62 183 179Net income attributable to equity holders of the Bank $ 614 $ 595 $ 527 $1,785 $1,532
Other measuresReturn on equity 14.7% 14.8% 12.8% 14.6% 12.6%Net interest margin(2) 4.77% 5.00% 4.79% 4.83% 4.69%Provision for credit losses as a percentage of loans and acceptances 1.16% 1.33% 1.26% 1.23% 1.30%Average assets ($ billions) $ 152 $ 149 $ 140 $ 148 $ 143Average liabilities ($ billions) $ 117 $ 115 $ 108 $ 114 $ 109
(1) Includes income (on a taxable equivalent basis) from investments in associated corporations for the three months ended July 31, 2017 – $131 (April 30,2017 – $117; July 31, 2016 – $110) and for the nine months ended July 31, 2017 – $367 (July 31, 2016 – $343).
(2) Net interest income (TEB) as percentage of average earning assets excluding bankers acceptances.
Net income
Q3 2017 vs Q3 2016
Net income attributable to equity holders was $614 million, up $87 million or 16%. The increase reflects good loan and deposit growth, as well as highercontributions from investments in associated corporations, benefits from cost-reduction initiatives and the positive impact of foreign currency translation.This was partly offset by higher income taxes.
10 Scotiabank Third Quarter Report 2017
MANAGEMENT’S DISCUSSION & ANALYSIS
Q3 2017 vs Q2 2017
Net income attributable to equity holders was up 3% from $595 million. The increase reflects higher contributions from investments in associatedcorporations, combined with lower provision for credit losses and income taxes, partly offset by higher non-interest expenses.
Year-to-date Q3 2017 vs Year-to-date Q3 2016
Net income attributable to equity holders was $1,785 million, up 17% from $1,532 million. The increase reflects higher net interest income and feesdriven by strong loan growth, and the benefits from cost-reduction initiatives. This was partly offset by higher income taxes and the negative impact offoreign currency translation.
Average assets
Q3 2017 vs Q3 2016
Average assets of $152 billion were up 9% driven by solid retail and commercial loan growth, primarily in Latin America, and the positive impact offoreign currency translation. Adjusting for the impact of foreign currency translation, retail loan growth was 9% and commercial loan growth was 7%.
Q3 2017 vs Q2 2017
Average assets were up 2%. Adjusting for the impact of foreign currency translation, retail loan growth was 2% and commercial loan growth was 6%,mainly in Latin America.
Year-to-date Q3 2017 vs Year-to-date Q3 2016
Average assets of $148 billion were up 4%. Adjusting for the impact of foreign currency translation, retail loan growth was 8% driven by Latin Americaand commercial loan growth was 2%.
Average liabilities
Q3 2017 vs Q3 2016
Average liabilities of $117 billion increased $9 billion or 8% due to strong growth in demand, savings and term deposits particularly in Latin America andthe impact of foreign currency translation.
Q3 2017 vs Q2 2017
Average liabilities increased 2%, due largely to growth in commercial term deposits in Latin America, partly offset by the impact of foreign currencytranslation.
Year-to-date Q3 2017 vs Year-to-date Q3 2016
Average liabilities increased $5 billion or 4% to $114 billion due to strong growth in demand, savings and term deposits partly offset by the impact offoreign currency translation.
Net interest income
Q3 2017 vs Q3 2016
Net interest income rose 9% to $1,735 million. This growth was due largely to good retail and commercial loan growth and the positive impact of foreigncurrency translation. The net interest margin was lower by two basis points to 4.77%, driven by lower net inflation impacts in Chile and Colombia, and theimpact of customer assistance programs related to flooding in Peru, partly offset by business mix changes and higher spreads related to Central Bank ratechanges.
Q3 2017 vs Q2 2017
Net interest income was up 1%, driven by strong loan growth, partly offset by a lower net interest margin. The net interest margin was lower by 23 basispoints this quarter driven by changes in business mix, as commercial loan growth outpaced retail loan growth, inflation impact in Chile, and the impact ofcustomer assistance programs related to flooding in Peru.
Year-to-date Q3 2017 vs Year-to-date Q3 2016
Net interest income rose 7% to $5,059 million. This growth was due largely to good retail loan growth. The net interest margin rose by 14 basis points to4.83%, driven by changes in business mix and Central Bank rate changes, particularly in Colombia and Mexico.
Non-interest income
Q3 2017 vs Q3 2016
Non-interest income was $910 million or up 10%, driven mainly by higher banking fees and card revenues in Latin America, a higher contribution frominvestments in associated corporations, and the positive impact of foreign currency translation.
Scotiabank Third Quarter Report 2017 11
MANAGEMENT’S DISCUSSION & ANALYSIS
Q3 2017 vs Q2 2017
Non-interest income increased 1% due primarily to higher contributions from investments in associated corporations, largely offset by lower fees.
Year-to-date Q3 2017 vs Year-to-date Q3 2016
Non-interest income increased 7% to $2,790 million driven mainly by higher transaction fees and card revenues in Latin America and the Caribbean.
Provision for credit losses
Q3 2017 vs Q3 2016
The provision for credit losses was $325 million, up $9 million or 3% due largely to the impact of foreign currency translation. Retail provisions increasedin Colombia, partially offset by lower provisions in the Caribbean and Central America due to higher acquisition-related benefits. Commercial provisionsdecreased, mostly in the Caribbean, partially offset by higher provisions in Chile. The provision for credit losses ratio improved 10 basis points to 116 basispoints.
Q3 2017 vs Q2 2017
The provision for credit losses decreased $24 million or 7%. Retail provisions were in line with last quarter as higher provisions in Colombia were offset bylower provisions in the Caribbean and Central America, due to higher acquisition-related benefits. Commercial provisions decreased mostly in LatinAmerica and Puerto Rico, due to provisions on a few specific accounts last quarter. The provision for credit losses ratio improved 17 basis points from 133basis points last quarter.
Year-to-date Q3 2017 vs Year-to-date Q3 2016
The provision for credit losses was $984 million, down $3 million driven by lower commercial provisions, mostly offset by higher retail provisions.Commercial provisions were lower primarily in Colombia, largely related to one account in the prior year, as well as Puerto Rico. Retail provisions werehigher with increases mainly in Colombia, partly offset by lower provisions in Mexico and the Caribbean and Central America. The provision for creditlosses ratio improved to 123 basis points from 130 basis points.
Non-interest expenses
Q3 2017 vs Q3 2016
Non-interest expenses were $1,442 million or 7% higher. Adjusting for the negative impact of foreign currency translation, expenses were up 5% due toincreased business volumes, inflation increases, higher technology investment and business taxes, partly offset by benefits realized from cost-reductioninitiatives.
Q3 2017 vs Q2 2017
Non-interest expenses increased by 3% due mostly to higher business taxes and technology investment.
Year-to-date Q3 2017 vs Year-to-date Q3 2016
Non-interest expenses were $4,269 million, an increase of 4%, driven by acquisitions, business growth and inflationary increases, and higher technologyinvestment, partly offset by benefits realized from cost-reduction initiatives and the positive impact of foreign currency translation.
Taxes
Q3 2017 vs Q3 2016
The effective tax rate was 23.5%, an increase from 22.7% primarily due to higher tax benefits in Latin America last year.
Q3 2017 vs Q2 2017
The effective tax rate decreased from 24.5% due largely to higher tax benefits in Latin America this quarter.
Year-to-date Q3 2017 vs Year-to-date Q3 2016
The effective tax rate was 24.2%, an increase from 23.8% due primarily to higher tax benefits in Latin America last year.
12 Scotiabank Third Quarter Report 2017
MANAGEMENT’S DISCUSSION & ANALYSIS
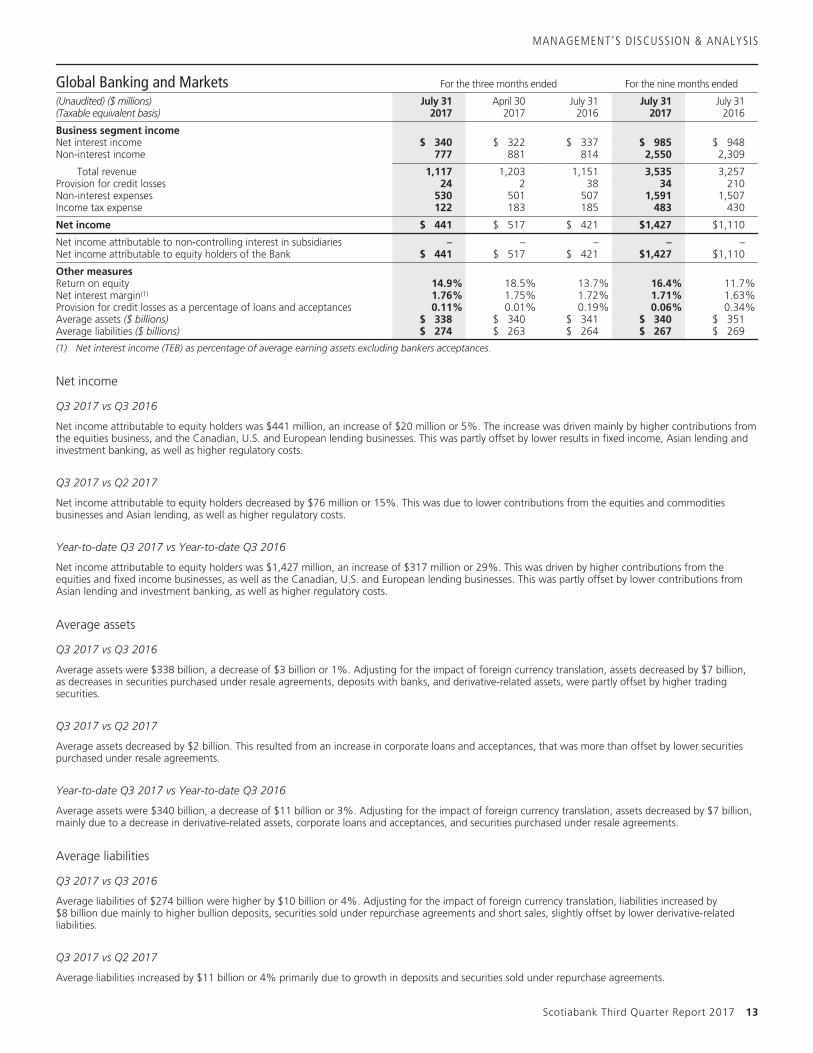
Global Banking and Markets For the three months ended For the nine months ended
(Unaudited) ($ millions)(Taxable equivalent basis)
July 312017
April 302017
July 312016
July 312017
July 312016
Business segment incomeNet interest income $ 340 $ 322 $ 337 $ 985 $ 948Non-interest income 777 881 814 2,550 2,309
Total revenue 1,117 1,203 1,151 3,535 3,257Provision for credit losses 24 2 38 34 210Non-interest expenses 530 501 507 1,591 1,507Income tax expense 122 183 185 483 430
Net income $ 441 $ 517 $ 421 $1,427 $1,110
Net income attributable to non-controlling interest in subsidiaries – – – – –Net income attributable to equity holders of the Bank $ 441 $ 517 $ 421 $1,427 $1,110
Other measuresReturn on equity 14.9% 18.5% 13.7% 16.4% 11.7%Net interest margin(1) 1.76% 1.75% 1.72% 1.71% 1.63%Provision for credit losses as a percentage of loans and acceptances 0.11% 0.01% 0.19% 0.06% 0.34%Average assets ($ billions) $ 338 $ 340 $ 341 $ 340 $ 351Average liabilities ($ billions) $ 274 $ 263 $ 264 $ 267 $ 269
(1) Net interest income (TEB) as percentage of average earning assets excluding bankers acceptances.
Net income
Q3 2017 vs Q3 2016
Net income attributable to equity holders was $441 million, an increase of $20 million or 5%. The increase was driven mainly by higher contributions fromthe equities business, and the Canadian, U.S. and European lending businesses. This was partly offset by lower results in fixed income, Asian lending andinvestment banking, as well as higher regulatory costs.
Q3 2017 vs Q2 2017
Net income attributable to equity holders decreased by $76 million or 15%. This was due to lower contributions from the equities and commoditiesbusinesses and Asian lending, as well as higher regulatory costs.
Year-to-date Q3 2017 vs Year-to-date Q3 2016
Net income attributable to equity holders was $1,427 million, an increase of $317 million or 29%. This was driven by higher contributions from theequities and fixed income businesses, as well as the Canadian, U.S. and European lending businesses. This was partly offset by lower contributions fromAsian lending and investment banking, as well as higher regulatory costs.
Average assets
Q3 2017 vs Q3 2016
Average assets were $338 billion, a decrease of $3 billion or 1%. Adjusting for the impact of foreign currency translation, assets decreased by $7 billion,as decreases in securities purchased under resale agreements, deposits with banks, and derivative-related assets, were partly offset by higher tradingsecurities.
Q3 2017 vs Q2 2017
Average assets decreased by $2 billion. This resulted from an increase in corporate loans and acceptances, that was more than offset by lower securitiespurchased under resale agreements.
Year-to-date Q3 2017 vs Year-to-date Q3 2016
Average assets were $340 billion, a decrease of $11 billion or 3%. Adjusting for the impact of foreign currency translation, assets decreased by $7 billion,mainly due to a decrease in derivative-related assets, corporate loans and acceptances, and securities purchased under resale agreements.
Average liabilities
Q3 2017 vs Q3 2016
Average liabilities of $274 billion were higher by $10 billion or 4%. Adjusting for the impact of foreign currency translation, liabilities increased by$8 billion due mainly to higher bullion deposits, securities sold under repurchase agreements and short sales, slightly offset by lower derivative-relatedliabilities.
Q3 2017 vs Q2 2017
Average liabilities increased by $11 billion or 4% primarily due to growth in deposits and securities sold under repurchase agreements.
Scotiabank Third Quarter Report 2017 13

MANAGEMENT’S DISCUSSION & ANALYSIS
Year-to-date Q3 2017 vs Year-to-date Q3 2016
Average liabilities decreased by $2 billion or 1%. Adjusting for the impact of foreign currency translation, liabilities were in line with the prior year. Growthin deposits and securities sold under repurchase agreements was offset by decreases in derivative-related liabilities.
Net interest income
Q3 2017 vs Q3 2016
Net interest income of $340 million grew $3 million or 1% due to higher deposit volumes, partly offset by lower lending margins in all regions.
Q3 2017 vs Q2 2017
Net interest income was $18 million or 6% higher than the prior quarter due to higher loan origination fees and slightly higher loan volumes.
Year-to-date Q3 2017 vs Year-to-date Q3 2016
Net interest income increased $37 million or 4%. This was primarily due to higher deposit and lending volumes in Europe, the U.S. and Canada, as well ashigher loan origination fees.
Non-interest income
Q3 2017 vs Q3 2016
Non-interest income was $777 million, a decrease of $37 million or 5%. This was primarily due to lower underwriting and advisory fees and lower creditfees. This was partly offset by higher trading revenues in equities.
Q3 2017 vs Q2 2017
Non-interest income decreased by $104 million or 12%. Lower trading revenues in equities were partially offset by higher trading revenues in metals andforeign exchange, as well as higher banking and underwriting fees.
Year-to-date Q3 2017 vs Year-to-date Q3 2016
Non-interest income increased by $241 million or 10%, driven by higher trading revenues in equities, fixed income and foreign exchange, as well as higherfixed income underwriting fees.
Provision for credit losses
Q3 2017 vs Q3 2016
The provision for credit losses was $24 million, compared to $38 million, due primarily to lower provisions in the energy sector. The provision for creditlosses ratio was 11 basis points, compared to 19 basis points.
Q3 2017 vs Q2 2017
The provision for credit losses increased $22 million, largely related to one account. The provision for credit losses ratio was 11 basis points, compared toone basis point.
Year-to-date Q3 2017 vs Year-to-date Q3 2016
The provision for credit losses was $34 million, down from $210 million mainly due to lower provisions in the energy sector. The provision for credit lossesratio was six basis points compared to 34 basis points.
Non-interest expenses
Q3 2017 vs Q3 2016
Non-interest expenses of $530 million were up $23 million or 5% mainly due to higher expenses related to regulatory initiatives.
Q3 2017 vs Q2 2017
Non-interest expenses increased $29 million or 6%. This was driven by expenses related to regulatory initiatives, and an increase in share-basedcompensation and salaries, slightly offset by lower performance-based compensation.
Year-to-date Q3 2017 vs Year-to-date Q3 2016
Non-interest expenses increased by $84 million or 6%. This was mainly driven by expenses related to technology and regulatory initiatives, and higherperformance-based compensation.
14 Scotiabank Third Quarter Report 2017
MANAGEMENT’S DISCUSSION & ANALYSIS
Taxes
The effective tax rate of 21.5% was lower than the prior year by 9.0%, and lower than the prior quarter by 4.6%. This was mainly due to lower taxes incertain foreign operations. The year-to-date effective tax rate was 25.3% compared to 28.0% in the prior year.
Other(1) For the three months ended For the nine months ended
(Unaudited) ($ millions)(Taxable equivalent basis)
July 312017
April 302017
July 312016
July 312017
July 312016
Business segment incomeNet interest income(2) $ (118) $ (70) $ (101) $ (288) $ (279)Non-interest income(2)(3) (16) (304) 123 (339) 202
Total revenue (134) (374) 22 (627) (77)Provision for credit losses – – – – 50Non-interest expenses(4) 67 107 86 244 561Income tax expense(2) (146) (395) (83) (652) (442)
Net income (loss) $ (55) $ (86) $ 19 $ (219) $ (246)
Net income attributable to non-controlling interest in subsidiaries – – – – –Net income attributable to equity holders $ (55) $ (86) $ 19 $ (219) $ (246)
Other measuresAverage assets ($ billions) $ 107 $ 100 $ 117 $ 106 $ 110Average liabilities ($ billions) $ 227 $ 228 $ 249 $ 231 $ 248
(1) Includes all other smaller operating segments and corporate adjustments, such as the elimination of the tax-exempt income gross-up reported in net interestincome, non-interest income and provision for income taxes and differences in the actual amount of costs incurred and charged to the operating segments.
(2) Includes the elimination of the tax-exempt income gross-up reported in net interest income, non-interest income and provision for income taxes for the threemonths ended July 31, 2017 – $95 (April 30, 2017 – $339; July 31, 2016 – $50) and for the nine months ended July 31, 2017 – $481 (July 31, 2016 – $252) toarrive at the amounts reported in the Consolidated Statement of Income.
(3) Income (on a taxable equivalent basis) from investments in associated corporations and the provision for income taxes in each period include the taxnormalization adjustments related to the gross-up of income from associated companies for the three months ended July 31, 2017 – $(39) (April 30,2017 – $(35); July 31, 2016 – $(33)) and for the nine months ended July 31, 2017 – $(107) (July 31, 2016 – $(99)).
(4) For the nine months ended July 31, 2016 includes restructuring charge of $378.
The Other segment includes Group Treasury, smaller operating segments and other corporate items which are not allocated to a business line.
Net interest income, other operating income, and the provision for income taxes in each period include the elimination of tax-exempt income gross-up.This amount is included in the operating segments, which are reported on a taxable equivalent basis. The elimination was $95 million in the third quarter,compared to $50 million in the same period last year and $339 million last quarter.
Net income from investments in associated corporations and the provision for income taxes in each period include the tax normalization adjustmentsrelated to the gross-up of income from associated companies. This adjustment normalizes the effective tax rate in the divisions to better present thecontribution of the associated companies to the divisional results.
Q3 2017 vs Q3 2016
Net loss attributable to equity holders was $55 million, compared to net income of $19 million. The lower net gain on investment securities was partlyoffset by a decrease in non-interest expenses. The reduced level of non-interest income and higher income tax benefits were due partly to the eliminationof larger tax-exempt income gross-up amounts this quarter.
Q3 2017 vs Q2 2017
Net loss attributable to equity holders was $55 million, compared to a loss of $86 million. The positive impact of foreign currency translation (includinghedges) and lower non-interest expenses were partly offset by lower contributions from asset/liability management activities and lower net gain oninvestment securities. The higher non-interest income and lower income tax benefits were due mainly to the elimination of lower tax-exempt incomegross-up amounts this quarter.
Year-to-date Q3 2017 vs Year-to-date Q3 2016
Net loss attributable to equity holders was $219 million, compared to $246 million last year, or a net income of $32 million after adjusting for therestructuring charge of $278 million ($378 million pre-tax). Lower net gain on investment securities, lower gains on sale of real estate, higher non-interestexpenses, and the negative impact of foreign currency translation (including hedges) were partly offset by an increase in the collective allowance onperforming loans last year. The lower non-interest income and higher income tax benefits were due partly to the elimination of larger tax-exempt incomegross-up amounts this year.
Scotiabank Third Quarter Report 2017 15
MANAGEMENT’S DISCUSSION & ANALYSIS
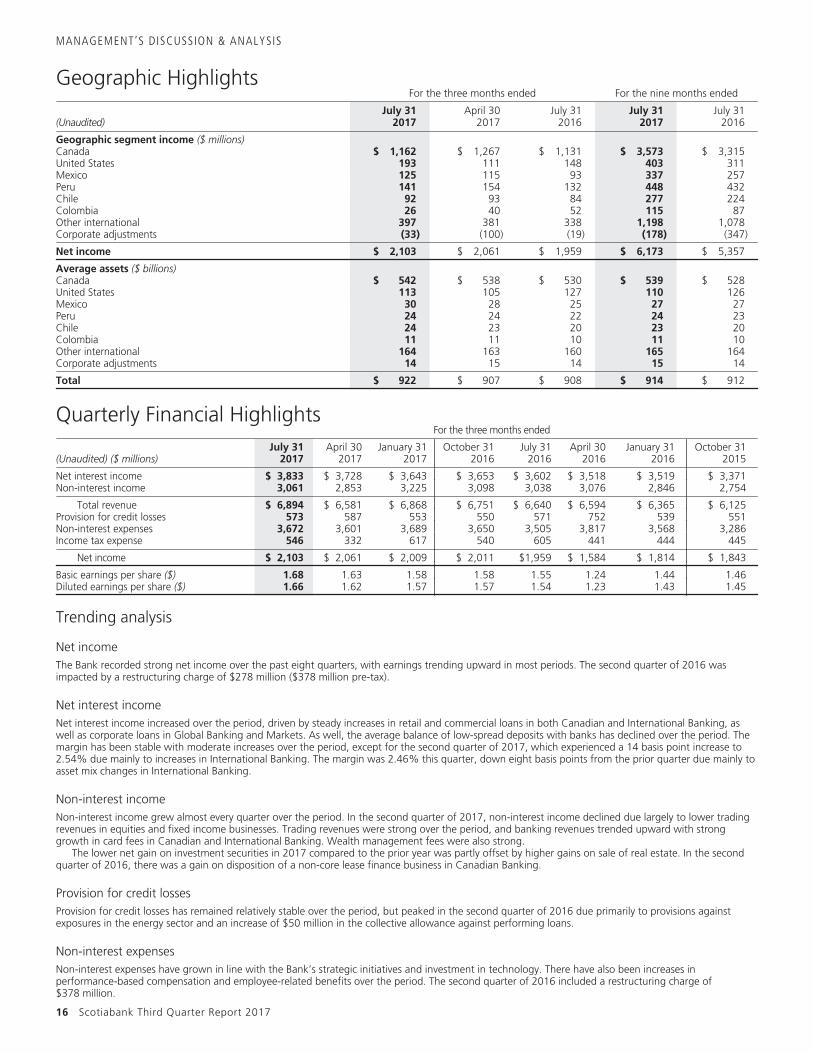
Geographic HighlightsFor the three months ended For the nine months ended
(Unaudited)July 31
2017April 30
2017July 31
2016July 31
2017July 31
2016
Geographic segment income ($ millions)Canada $ 1,162 $ 1,267 $ 1,131 $ 3,573 $ 3,315United States 193 111 148 403 311Mexico 125 115 93 337 257Peru 141 154 132 448 432Chile 92 93 84 277 224Colombia 26 40 52 115 87Other international 397 381 338 1,198 1,078Corporate adjustments (33) (100) (19) (178) (347)
Net income $ 2,103 $ 2,061 $ 1,959 $ 6,173 $ 5,357
Average assets ($ billions)Canada $ 542 $ 538 $ 530 $ 539 $ 528United States 113 105 127 110 126Mexico 30 28 25 27 27Peru 24 24 22 24 23Chile 24 23 20 23 20Colombia 11 11 10 11 10Other international 164 163 160 165 164Corporate adjustments 14 15 14 15 14
Total $ 922 $ 907 $ 908 $ 914 $ 912
Quarterly Financial HighlightsFor the three months ended
(Unaudited) ($ millions)July 31
2017April 30
2017January 31
2017October 31
2016July 31
2016April 30
2016January 31
2016October 31
2015
Net interest income $ 3,833 $ 3,728 $ 3,643 $ 3,653 $ 3,602 $ 3,518 $ 3,519 $ 3,371Non-interest income 3,061 2,853 3,225 3,098 3,038 3,076 2,846 2,754
Total revenue $ 6,894 $ 6,581 $ 6,868 $ 6,751 $ 6,640 $ 6,594 $ 6,365 $ 6,125Provision for credit losses 573 587 553 550 571 752 539 551Non-interest expenses 3,672 3,601 3,689 3,650 3,505 3,817 3,568 3,286Income tax expense 546 332 617 540 605 441 444 445
Net income $ 2,103 $ 2,061 $ 2,009 $ 2,011 $1,959 $ 1,584 $ 1,814 $ 1,843
Basic earnings per share ($) 1.68 1.63 1.58 1.58 1.55 1.24 1.44 1.46Diluted earnings per share ($) 1.66 1.62 1.57 1.57 1.54 1.23 1.43 1.45
Trending analysis
Net incomeThe Bank recorded strong net income over the past eight quarters, with earnings trending upward in most periods. The second quarter of 2016 wasimpacted by a restructuring charge of $278 million ($378 million pre-tax).
Net interest incomeNet interest income increased over the period, driven by steady increases in retail and commercial loans in both Canadian and International Banking, aswell as corporate loans in Global Banking and Markets. As well, the average balance of low-spread deposits with banks has declined over the period. Themargin has been stable with moderate increases over the period, except for the second quarter of 2017, which experienced a 14 basis point increase to2.54% due mainly to increases in International Banking. The margin was 2.46% this quarter, down eight basis points from the prior quarter due mainly toasset mix changes in International Banking.
Non-interest incomeNon-interest income grew almost every quarter over the period. In the second quarter of 2017, non-interest income declined due largely to lower tradingrevenues in equities and fixed income businesses. Trading revenues were strong over the period, and banking revenues trended upward with stronggrowth in card fees in Canadian and International Banking. Wealth management fees were also strong.
The lower net gain on investment securities in 2017 compared to the prior year was partly offset by higher gains on sale of real estate. In the secondquarter of 2016, there was a gain on disposition of a non-core lease finance business in Canadian Banking.
Provision for credit lossesProvision for credit losses has remained relatively stable over the period, but peaked in the second quarter of 2016 due primarily to provisions againstexposures in the energy sector and an increase of $50 million in the collective allowance against performing loans.
Non-interest expensesNon-interest expenses have grown in line with the Bank’s strategic initiatives and investment in technology. There have also been increases inperformance-based compensation and employee-related benefits over the period. The second quarter of 2016 included a restructuring charge of$378 million.
16 Scotiabank Third Quarter Report 2017
MANAGEMENT’S DISCUSSION & ANALYSIS
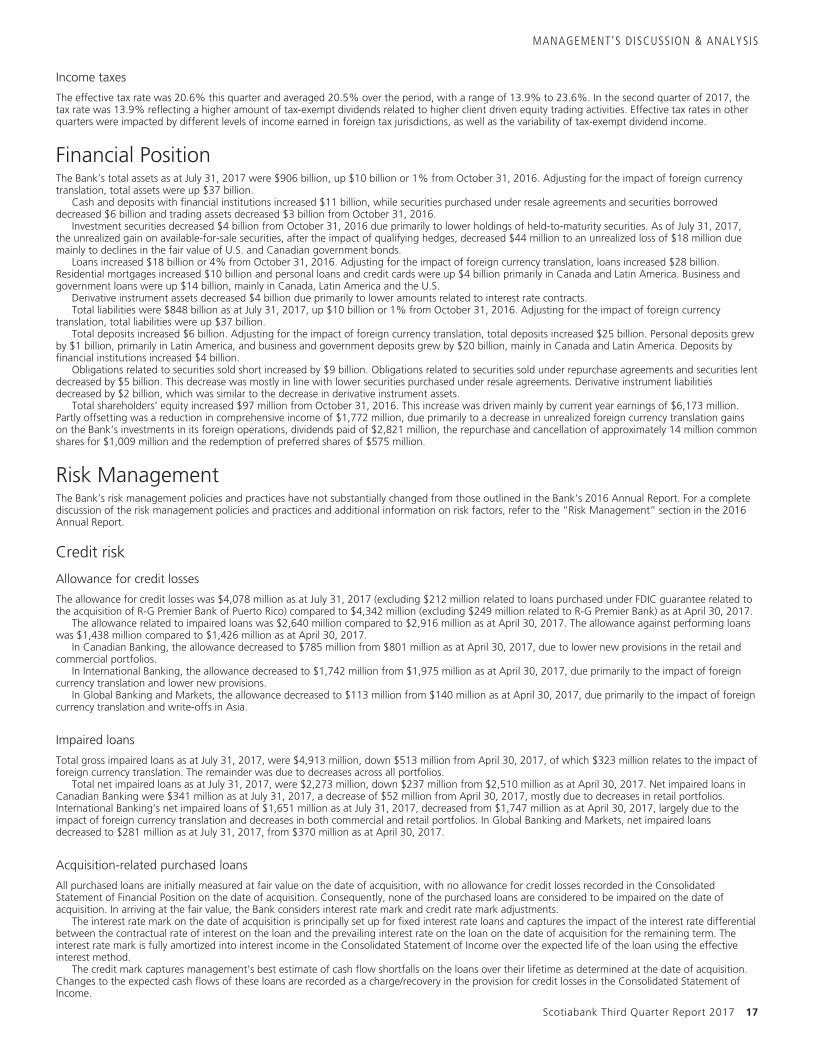
Income taxes
The effective tax rate was 20.6% this quarter and averaged 20.5% over the period, with a range of 13.9% to 23.6%. In the second quarter of 2017, thetax rate was 13.9% reflecting a higher amount of tax-exempt dividends related to higher client driven equity trading activities. Effective tax rates in otherquarters were impacted by different levels of income earned in foreign tax jurisdictions, as well as the variability of tax-exempt dividend income.
Financial PositionThe Bank’s total assets as at July 31, 2017 were $906 billion, up $10 billion or 1% from October 31, 2016. Adjusting for the impact of foreign currencytranslation, total assets were up $37 billion.
Cash and deposits with financial institutions increased $11 billion, while securities purchased under resale agreements and securities borroweddecreased $6 billion and trading assets decreased $3 billion from October 31, 2016.
Investment securities decreased $4 billion from October 31, 2016 due primarily to lower holdings of held-to-maturity securities. As of July 31, 2017,the unrealized gain on available-for-sale securities, after the impact of qualifying hedges, decreased $44 million to an unrealized loss of $18 million duemainly to declines in the fair value of U.S. and Canadian government bonds.
Loans increased $18 billion or 4% from October 31, 2016. Adjusting for the impact of foreign currency translation, loans increased $28 billion.Residential mortgages increased $10 billion and personal loans and credit cards were up $4 billion primarily in Canada and Latin America. Business andgovernment loans were up $14 billion, mainly in Canada, Latin America and the U.S.
Derivative instrument assets decreased $4 billion due primarily to lower amounts related to interest rate contracts.Total liabilities were $848 billion as at July 31, 2017, up $10 billion or 1% from October 31, 2016. Adjusting for the impact of foreign currency
translation, total liabilities were up $37 billion.Total deposits increased $6 billion. Adjusting for the impact of foreign currency translation, total deposits increased $25 billion. Personal deposits grew
by $1 billion, primarily in Latin America, and business and government deposits grew by $20 billion, mainly in Canada and Latin America. Deposits byfinancial institutions increased $4 billion.
Obligations related to securities sold short increased by $9 billion. Obligations related to securities sold under repurchase agreements and securities lentdecreased by $5 billion. This decrease was mostly in line with lower securities purchased under resale agreements. Derivative instrument liabilitiesdecreased by $2 billion, which was similar to the decrease in derivative instrument assets.
Total shareholders’ equity increased $97 million from October 31, 2016. This increase was driven mainly by current year earnings of $6,173 million.Partly offsetting was a reduction in comprehensive income of $1,772 million, due primarily to a decrease in unrealized foreign currency translation gainson the Bank’s investments in its foreign operations, dividends paid of $2,821 million, the repurchase and cancellation of approximately 14 million commonshares for $1,009 million and the redemption of preferred shares of $575 million.
Risk ManagementThe Bank’s risk management policies and practices have not substantially changed from those outlined in the Bank’s 2016 Annual Report. For a completediscussion of the risk management policies and practices and additional information on risk factors, refer to the “Risk Management” section in the 2016Annual Report.
Credit risk
Allowance for credit losses
The allowance for credit losses was $4,078 million as at July 31, 2017 (excluding $212 million related to loans purchased under FDIC guarantee related tothe acquisition of R-G Premier Bank of Puerto Rico) compared to $4,342 million (excluding $249 million related to R-G Premier Bank) as at April 30, 2017.
The allowance related to impaired loans was $2,640 million compared to $2,916 million as at April 30, 2017. The allowance against performing loanswas $1,438 million compared to $1,426 million as at April 30, 2017.
In Canadian Banking, the allowance decreased to $785 million from $801 million as at April 30, 2017, due to lower new provisions in the retail andcommercial portfolios.
In International Banking, the allowance decreased to $1,742 million from $1,975 million as at April 30, 2017, due primarily to the impact of foreigncurrency translation and lower new provisions.
In Global Banking and Markets, the allowance decreased to $113 million from $140 million as at April 30, 2017, due primarily to the impact of foreigncurrency translation and write-offs in Asia.
Impaired loans
Total gross impaired loans as at July 31, 2017, were $4,913 million, down $513 million from April 30, 2017, of which $323 million relates to the impact offoreign currency translation. The remainder was due to decreases across all portfolios.
Total net impaired loans as at July 31, 2017, were $2,273 million, down $237 million from $2,510 million as at April 30, 2017. Net impaired loans inCanadian Banking were $341 million as at July 31, 2017, a decrease of $52 million from April 30, 2017, mostly due to decreases in retail portfolios.International Banking’s net impaired loans of $1,651 million as at July 31, 2017, decreased from $1,747 million as at April 30, 2017, largely due to theimpact of foreign currency translation and decreases in both commercial and retail portfolios. In Global Banking and Markets, net impaired loansdecreased to $281 million as at July 31, 2017, from $370 million as at April 30, 2017.
Acquisition-related purchased loans
All purchased loans are initially measured at fair value on the date of acquisition, with no allowance for credit losses recorded in the ConsolidatedStatement of Financial Position on the date of acquisition. Consequently, none of the purchased loans are considered to be impaired on the date ofacquisition. In arriving at the fair value, the Bank considers interest rate mark and credit rate mark adjustments.
The interest rate mark on the date of acquisition is principally set up for fixed interest rate loans and captures the impact of the interest rate differentialbetween the contractual rate of interest on the loan and the prevailing interest rate on the loan on the date of acquisition for the remaining term. Theinterest rate mark is fully amortized into interest income in the Consolidated Statement of Income over the expected life of the loan using the effectiveinterest method.
The credit mark captures management’s best estimate of cash flow shortfalls on the loans over their lifetime as determined at the date of acquisition.Changes to the expected cash flows of these loans are recorded as a charge/recovery in the provision for credit losses in the Consolidated Statement ofIncome.
Scotiabank Third Quarter Report 2017 17
MANAGEMENT’S DISCUSSION & ANALYSIS
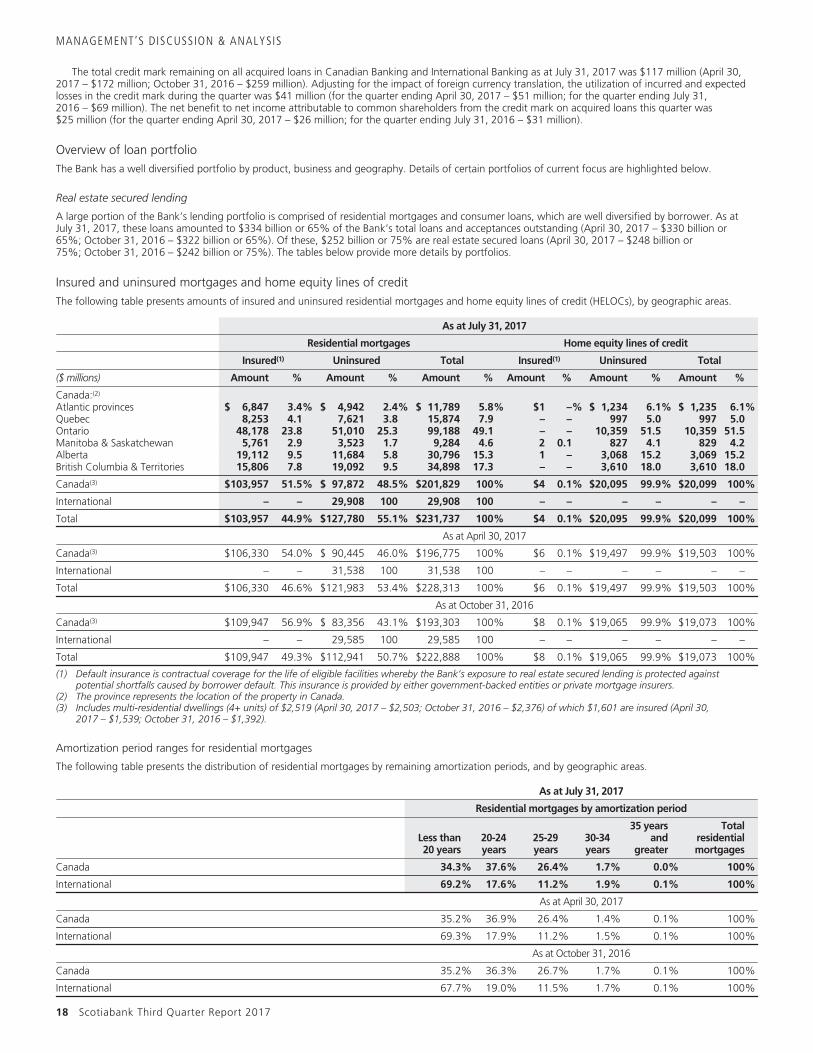
The total credit mark remaining on all acquired loans in Canadian Banking and International Banking as at July 31, 2017 was $117 million (April 30,2017 – $172 million; October 31, 2016 – $259 million). Adjusting for the impact of foreign currency translation, the utilization of incurred and expectedlosses in the credit mark during the quarter was $41 million (for the quarter ending April 30, 2017 – $51 million; for the quarter ending July 31,2016 – $69 million). The net benefit to net income attributable to common shareholders from the credit mark on acquired loans this quarter was$25 million (for the quarter ending April 30, 2017 – $26 million; for the quarter ending July 31, 2016 – $31 million).
Overview of loan portfolioThe Bank has a well diversified portfolio by product, business and geography. Details of certain portfolios of current focus are highlighted below.
Real estate secured lending
A large portion of the Bank’s lending portfolio is comprised of residential mortgages and consumer loans, which are well diversified by borrower. As atJuly 31, 2017, these loans amounted to $334 billion or 65% of the Bank’s total loans and acceptances outstanding (April 30, 2017 – $330 billion or65%; October 31, 2016 – $322 billion or 65%). Of these, $252 billion or 75% are real estate secured loans (April 30, 2017 – $248 billion or75%; October 31, 2016 – $242 billion or 75%). The tables below provide more details by portfolios.
Insured and uninsured mortgages and home equity lines of creditThe following table presents amounts of insured and uninsured residential mortgages and home equity lines of credit (HELOCs), by geographic areas.
As at July 31, 2017
Residential mortgages Home equity lines of credit
Insured(1) Uninsured Total Insured(1) Uninsured Total
($ millions) Amount % Amount % Amount % Amount % Amount % Amount %
Canada:(2)
Atlantic provinces $ 6,847 3.4% $ 4,942 2.4% $ 11,789 5.8% $1 –% $ 1,234 6.1% $ 1,235 6.1%Quebec 8,253 4.1 7,621 3.8 15,874 7.9 – – 997 5.0 997 5.0Ontario 48,178 23.8 51,010 25.3 99,188 49.1 – – 10,359 51.5 10,359 51.5Manitoba & Saskatchewan 5,761 2.9 3,523 1.7 9,284 4.6 2 0.1 827 4.1 829 4.2Alberta 19,112 9.5 11,684 5.8 30,796 15.3 1 – 3,068 15.2 3,069 15.2British Columbia & Territories 15,806 7.8 19,092 9.5 34,898 17.3 – – 3,610 18.0 3,610 18.0
Canada(3) $103,957 51.5% $ 97,872 48.5% $201,829 100% $4 0.1% $20,095 99.9% $20,099 100%
International – – 29,908 100 29,908 100 – – – – – –
Total $103,957 44.9% $127,780 55.1% $231,737 100% $4 0.1% $20,095 99.9% $20,099 100%
As at April 30, 2017
Canada(3) $106,330 54.0% $ 90,445 46.0% $196,775 100% $6 0.1% $19,497 99.9% $19,503 100%
International – – 31,538 100 31,538 100 – – – – – –
Total $106,330 46.6% $121,983 53.4% $228,313 100% $6 0.1% $19,497 99.9% $19,503 100%
As at October 31, 2016
Canada(3) $109,947 56.9% $ 83,356 43.1% $193,303 100% $8 0.1% $19,065 99.9% $19,073 100%
International – – 29,585 100 29,585 100 – – – – – –
Total $109,947 49.3% $112,941 50.7% $222,888 100% $8 0.1% $19,065 99.9% $19,073 100%
(1) Default insurance is contractual coverage for the life of eligible facilities whereby the Bank’s exposure to real estate secured lending is protected againstpotential shortfalls caused by borrower default. This insurance is provided by either government-backed entities or private mortgage insurers.
(2) The province represents the location of the property in Canada.(3) Includes multi-residential dwellings (4+ units) of $2,519 (April 30, 2017 – $2,503; October 31, 2016 – $2,376) of which $1,601 are insured (April 30,
2017 – $1,539; October 31, 2016 – $1,392).
Amortization period ranges for residential mortgages
The following table presents the distribution of residential mortgages by remaining amortization periods, and by geographic areas.
As at July 31, 2017
Residential mortgages by amortization period
Less than20 years
20-24years
25-29years
30-34years
35 yearsand
greater
Totalresidentialmortgages
Canada 34.3% 37.6% 26.4% 1.7% 0.0% 100%
International 69.2% 17.6% 11.2% 1.9% 0.1% 100%
As at April 30, 2017
Canada 35.2% 36.9% 26.4% 1.4% 0.1% 100%
International 69.3% 17.9% 11.2% 1.5% 0.1% 100%
As at October 31, 2016
Canada 35.2% 36.3% 26.7% 1.7% 0.1% 100%
International 67.7% 19.0% 11.5% 1.7% 0.1% 100%
18 Scotiabank Third Quarter Report 2017
MANAGEMENT’S DISCUSSION & ANALYSIS
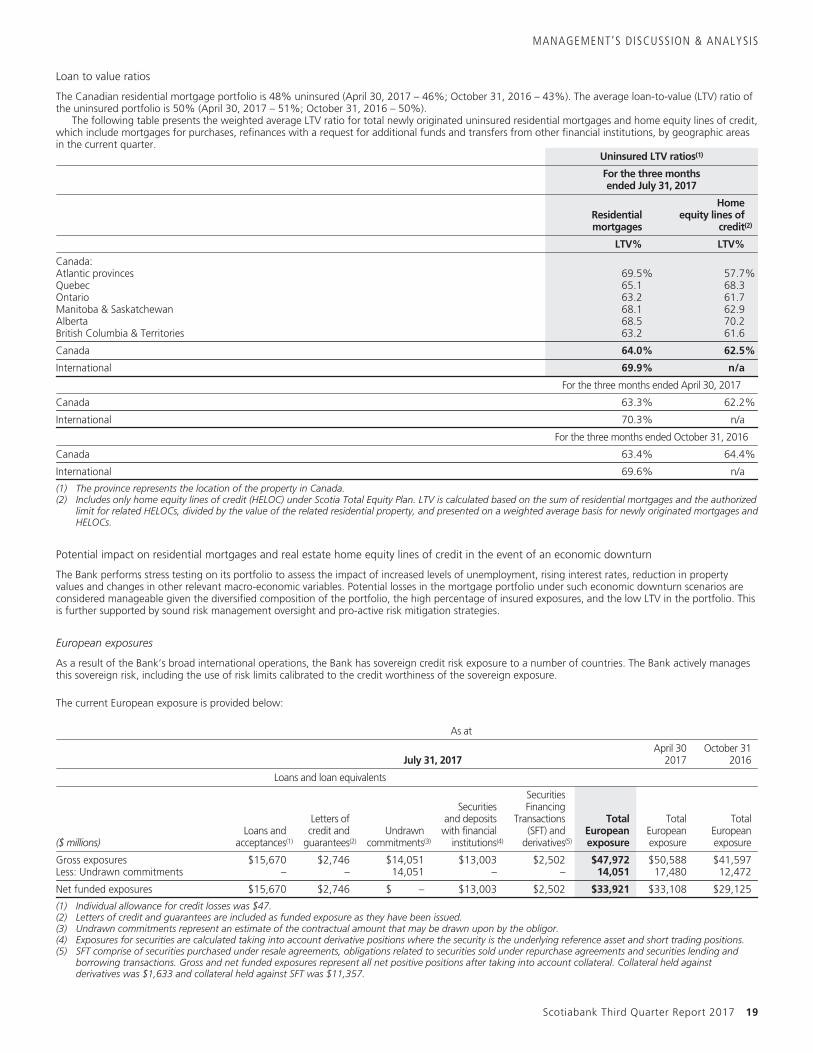
Loan to value ratios
The Canadian residential mortgage portfolio is 48% uninsured (April 30, 2017 – 46%; October 31, 2016 – 43%). The average loan-to-value (LTV) ratio ofthe uninsured portfolio is 50% (April 30, 2017 – 51%; October 31, 2016 – 50%).
The following table presents the weighted average LTV ratio for total newly originated uninsured residential mortgages and home equity lines of credit,which include mortgages for purchases, refinances with a request for additional funds and transfers from other financial institutions, by geographic areasin the current quarter.
Uninsured LTV ratios(1)
For the three monthsended July 31, 2017
Residentialmortgages
Homeequity lines of
credit(2)
LTV% LTV%
Canada:Atlantic provinces 69.5% 57.7%Quebec 65.1 68.3Ontario 63.2 61.7Manitoba & Saskatchewan 68.1 62.9Alberta 68.5 70.2British Columbia & Territories 63.2 61.6
Canada 64.0% 62.5%
International 69.9% n/a
For the three months ended April 30, 2017
Canada 63.3% 62.2%
International 70.3% n/a
For the three months ended October 31, 2016
Canada 63.4% 64.4%
International 69.6% n/a
(1) The province represents the location of the property in Canada.(2) Includes only home equity lines of credit (HELOC) under Scotia Total Equity Plan. LTV is calculated based on the sum of residential mortgages and the authorized
limit for related HELOCs, divided by the value of the related residential property, and presented on a weighted average basis for newly originated mortgages andHELOCs.
Potential impact on residential mortgages and real estate home equity lines of credit in the event of an economic downturn
The Bank performs stress testing on its portfolio to assess the impact of increased levels of unemployment, rising interest rates, reduction in propertyvalues and changes in other relevant macro-economic variables. Potential losses in the mortgage portfolio under such economic downturn scenarios areconsidered manageable given the diversified composition of the portfolio, the high percentage of insured exposures, and the low LTV in the portfolio. Thisis further supported by sound risk management oversight and pro-active risk mitigation strategies.
European exposures
As a result of the Bank’s broad international operations, the Bank has sovereign credit risk exposure to a number of countries. The Bank actively managesthis sovereign risk, including the use of risk limits calibrated to the credit worthiness of the sovereign exposure.
The current European exposure is provided below:
As at
July 31, 2017April 30
2017October 31
2016
Loans and loan equivalents
($ millions)Loans and
acceptances(1)
Letters ofcredit and
guarantees(2)Undrawn
commitments(3)
Securitiesand deposits
with financialinstitutions(4)
SecuritiesFinancing
Transactions(SFT) and
derivatives(5)
TotalEuropeanexposure
TotalEuropeanexposure
TotalEuropeanexposure
Gross exposures $15,670 $2,746 $14,051 $13,003 $2,502 $47,972 $50,588 $41,597Less: Undrawn commitments – – 14,051 – – 14,051 17,480 12,472
Net funded exposures $15,670 $2,746 $ – $13,003 $2,502 $33,921 $33,108 $29,125
(1) Individual allowance for credit losses was $47.(2) Letters of credit and guarantees are included as funded exposure as they have been issued.(3) Undrawn commitments represent an estimate of the contractual amount that may be drawn upon by the obligor.(4) Exposures for securities are calculated taking into account derivative positions where the security is the underlying reference asset and short trading positions.(5) SFT comprise of securities purchased under resale agreements, obligations related to securities sold under repurchase agreements and securities lending and
borrowing transactions. Gross and net funded exposures represent all net positive positions after taking into account collateral. Collateral held againstderivatives was $1,633 and collateral held against SFT was $11,357.
Scotiabank Third Quarter Report 2017 19
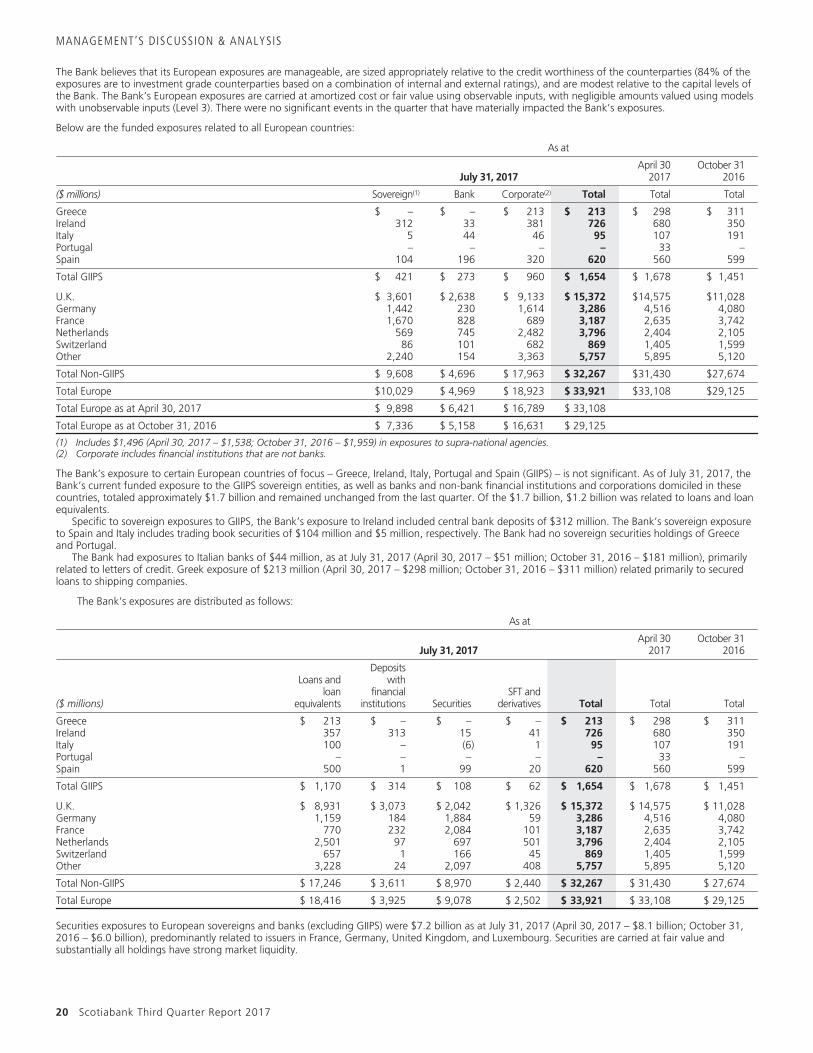
MANAGEMENT’S DISCUSSION & ANALYSIS
The Bank believes that its European exposures are manageable, are sized appropriately relative to the credit worthiness of the counterparties (84% of theexposures are to investment grade counterparties based on a combination of internal and external ratings), and are modest relative to the capital levels ofthe Bank. The Bank’s European exposures are carried at amortized cost or fair value using observable inputs, with negligible amounts valued using modelswith unobservable inputs (Level 3). There were no significant events in the quarter that have materially impacted the Bank’s exposures.
Below are the funded exposures related to all European countries:
As at
July 31, 2017April 30
2017October 31
2016
($ millions) Sovereign(1) Bank Corporate(2) Total Total Total
Greece $ – $ – $ 213 $ 213 $ 298 $ 311Ireland 312 33 381 726 680 350Italy 5 44 46 95 107 191Portugal – – – – 33 –Spain 104 196 320 620 560 599
Total GIIPS $ 421 $ 273 $ 960 $ 1,654 $ 1,678 $ 1,451
U.K. $ 3,601 $ 2,638 $ 9,133 $ 15,372 $14,575 $11,028Germany 1,442 230 1,614 3,286 4,516 4,080France 1,670 828 689 3,187 2,635 3,742Netherlands 569 745 2,482 3,796 2,404 2,105Switzerland 86 101 682 869 1,405 1,599Other 2,240 154 3,363 5,757 5,895 5,120
Total Non-GIIPS $ 9,608 $ 4,696 $ 17,963 $ 32,267 $31,430 $27,674
Total Europe $10,029 $ 4,969 $ 18,923 $ 33,921 $33,108 $29,125
Total Europe as at April 30, 2017 $ 9,898 $ 6,421 $ 16,789 $ 33,108
Total Europe as at October 31, 2016 $ 7,336 $ 5,158 $ 16,631 $ 29,125
(1) Includes $1,496 (April 30, 2017 – $1,538; October 31, 2016 – $1,959) in exposures to supra-national agencies.(2) Corporate includes financial institutions that are not banks.
The Bank’s exposure to certain European countries of focus – Greece, Ireland, Italy, Portugal and Spain (GIIPS) – is not significant. As of July 31, 2017, theBank’s current funded exposure to the GIIPS sovereign entities, as well as banks and non-bank financial institutions and corporations domiciled in thesecountries, totaled approximately $1.7 billion and remained unchanged from the last quarter. Of the $1.7 billion, $1.2 billion was related to loans and loanequivalents.
Specific to sovereign exposures to GIIPS, the Bank’s exposure to Ireland included central bank deposits of $312 million. The Bank’s sovereign exposureto Spain and Italy includes trading book securities of $104 million and $5 million, respectively. The Bank had no sovereign securities holdings of Greeceand Portugal.
The Bank had exposures to Italian banks of $44 million, as at July 31, 2017 (April 30, 2017 – $51 million; October 31, 2016 – $181 million), primarilyrelated to letters of credit. Greek exposure of $213 million (April 30, 2017 – $298 million; October 31, 2016 – $311 million) related primarily to securedloans to shipping companies.
The Bank’s exposures are distributed as follows:
As at
July 31, 2017April 30
2017October 31
2016
($ millions)
Loans andloan
equivalents
Depositswith
financialinstitutions Securities
SFT andderivatives Total Total Total
Greece $ 213 $ – $ – $ – $ 213 $ 298 $ 311Ireland 357 313 15 41 726 680 350Italy 100 – (6) 1 95 107 191Portugal – – – – – 33 –Spain 500 1 99 20 620 560 599
Total GIIPS $ 1,170 $ 314 $ 108 $ 62 $ 1,654 $ 1,678 $ 1,451
U.K. $ 8,931 $ 3,073 $ 2,042 $ 1,326 $ 15,372 $ 14,575 $ 11,028Germany 1,159 184 1,884 59 3,286 4,516 4,080France 770 232 2,084 101 3,187 2,635 3,742Netherlands 2,501 97 697 501 3,796 2,404 2,105Switzerland 657 1 166 45 869 1,405 1,599Other 3,228 24 2,097 408 5,757 5,895 5,120
Total Non-GIIPS $ 17,246 $ 3,611 $ 8,970 $ 2,440 $ 32,267 $ 31,430 $ 27,674
Total Europe $ 18,416 $ 3,925 $ 9,078 $ 2,502 $ 33,921 $ 33,108 $ 29,125
Securities exposures to European sovereigns and banks (excluding GIIPS) were $7.2 billion as at July 31, 2017 (April 30, 2017 – $8.1 billion; October 31,2016 – $6.0 billion), predominantly related to issuers in France, Germany, United Kingdom, and Luxembourg. Securities are carried at fair value andsubstantially all holdings have strong market liquidity.
20 Scotiabank Third Quarter Report 2017
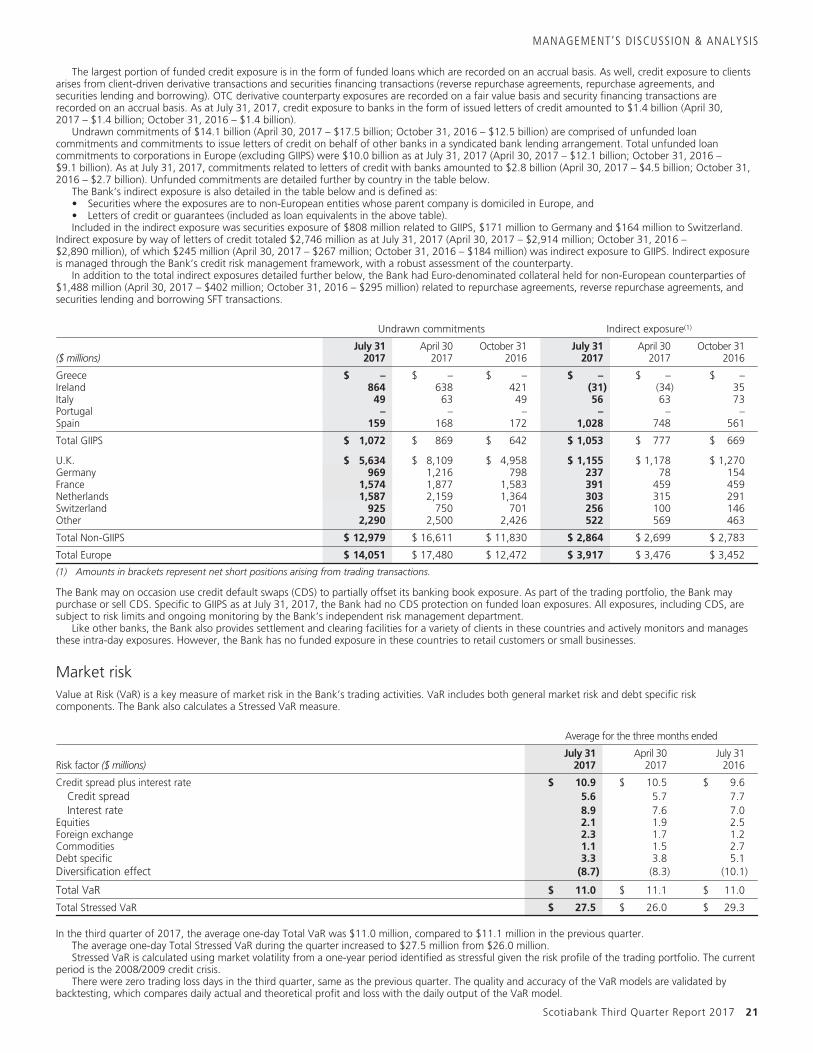
MANAGEMENT’S DISCUSSION & ANALYSIS
The largest portion of funded credit exposure is in the form of funded loans which are recorded on an accrual basis. As well, credit exposure to clientsarises from client-driven derivative transactions and securities financing transactions (reverse repurchase agreements, repurchase agreements, andsecurities lending and borrowing). OTC derivative counterparty exposures are recorded on a fair value basis and security financing transactions arerecorded on an accrual basis. As at July 31, 2017, credit exposure to banks in the form of issued letters of credit amounted to $1.4 billion (April 30,2017 – $1.4 billion; October 31, 2016 – $1.4 billion).
Undrawn commitments of $14.1 billion (April 30, 2017 – $17.5 billion; October 31, 2016 – $12.5 billion) are comprised of unfunded loancommitments and commitments to issue letters of credit on behalf of other banks in a syndicated bank lending arrangement. Total unfunded loancommitments to corporations in Europe (excluding GIIPS) were $10.0 billion as at July 31, 2017 (April 30, 2017 – $12.1 billion; October 31, 2016 –$9.1 billion). As at July 31, 2017, commitments related to letters of credit with banks amounted to $2.8 billion (April 30, 2017 – $4.5 billion; October 31,2016 – $2.7 billion). Unfunded commitments are detailed further by country in the table below.
The Bank’s indirect exposure is also detailed in the table below and is defined as:• Securities where the exposures are to non-European entities whose parent company is domiciled in Europe, and• Letters of credit or guarantees (included as loan equivalents in the above table).Included in the indirect exposure was securities exposure of $808 million related to GIIPS, $171 million to Germany and $164 million to Switzerland.
Indirect exposure by way of letters of credit totaled $2,746 million as at July 31, 2017 (April 30, 2017 – $2,914 million; October 31, 2016 –$2,890 million), of which $245 million (April 30, 2017 – $267 million; October 31, 2016 – $184 million) was indirect exposure to GIIPS. Indirect exposureis managed through the Bank’s credit risk management framework, with a robust assessment of the counterparty.
In addition to the total indirect exposures detailed further below, the Bank had Euro-denominated collateral held for non-European counterparties of$1,488 million (April 30, 2017 – $402 million; October 31, 2016 – $295 million) related to repurchase agreements, reverse repurchase agreements, andsecurities lending and borrowing SFT transactions.
Undrawn commitments Indirect exposure(1)
($ millions)July 31
2017April 30
2017October 31
2016July 31
2017April 30
2017October 31
2016
Greece $ – $ – $ – $ – $ – $ –Ireland 864 638 421 (31) (34) 35Italy 49 63 49 56 63 73Portugal – – – – – –Spain 159 168 172 1,028 748 561
Total GIIPS $ 1,072 $ 869 $ 642 $ 1,053 $ 777 $ 669
U.K. $ 5,634 $ 8,109 $ 4,958 $ 1,155 $ 1,178 $ 1,270Germany 969 1,216 798 237 78 154France 1,574 1,877 1,583 391 459 459Netherlands 1,587 2,159 1,364 303 315 291Switzerland 925 750 701 256 100 146Other 2,290 2,500 2,426 522 569 463
Total Non-GIIPS $ 12,979 $ 16,611 $ 11,830 $ 2,864 $ 2,699 $ 2,783
Total Europe $ 14,051 $ 17,480 $ 12,472 $ 3,917 $ 3,476 $ 3,452
(1) Amounts in brackets represent net short positions arising from trading transactions.
The Bank may on occasion use credit default swaps (CDS) to partially offset its banking book exposure. As part of the trading portfolio, the Bank maypurchase or sell CDS. Specific to GIIPS as at July 31, 2017, the Bank had no CDS protection on funded loan exposures. All exposures, including CDS, aresubject to risk limits and ongoing monitoring by the Bank’s independent risk management department.
Like other banks, the Bank also provides settlement and clearing facilities for a variety of clients in these countries and actively monitors and managesthese intra-day exposures. However, the Bank has no funded exposure in these countries to retail customers or small businesses.
Market riskValue at Risk (VaR) is a key measure of market risk in the Bank’s trading activities. VaR includes both general market risk and debt specific riskcomponents. The Bank also calculates a Stressed VaR measure.
Average for the three months ended
Risk factor ($ millions)July 31
2017April 30
2017July 31
2016
Credit spread plus interest rate $ 10.9 $ 10.5 $ 9.6Credit spread 5.6 5.7 7.7Interest rate 8.9 7.6 7.0
Equities 2.1 1.9 2.5Foreign exchange 2.3 1.7 1.2Commodities 1.1 1.5 2.7Debt specific 3.3 3.8 5.1Diversification effect (8.7) (8.3) (10.1)
Total VaR $ 11.0 $ 11.1 $ 11.0
Total Stressed VaR $ 27.5 $ 26.0 $ 29.3
In the third quarter of 2017, the average one-day Total VaR was $11.0 million, compared to $11.1 million in the previous quarter.The average one-day Total Stressed VaR during the quarter increased to $27.5 million from $26.0 million.Stressed VaR is calculated using market volatility from a one-year period identified as stressful given the risk profile of the trading portfolio. The current
period is the 2008/2009 credit crisis.There were zero trading loss days in the third quarter, same as the previous quarter. The quality and accuracy of the VaR models are validated by
backtesting, which compares daily actual and theoretical profit and loss with the daily output of the VaR model.
Scotiabank Third Quarter Report 2017 21
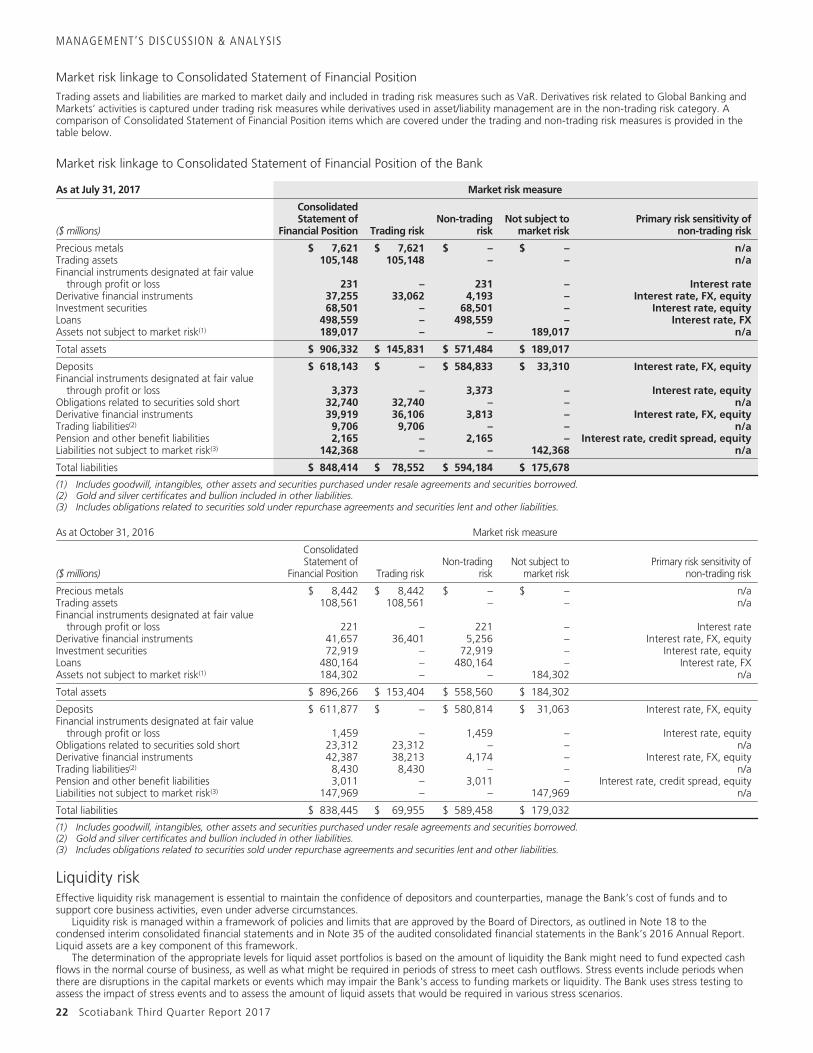
MANAGEMENT’S DISCUSSION & ANALYSIS
Market risk linkage to Consolidated Statement of Financial Position
Trading assets and liabilities are marked to market daily and included in trading risk measures such as VaR. Derivatives risk related to Global Banking andMarkets’ activities is captured under trading risk measures while derivatives used in asset/liability management are in the non-trading risk category. Acomparison of Consolidated Statement of Financial Position items which are covered under the trading and non-trading risk measures is provided in thetable below.
Market risk linkage to Consolidated Statement of Financial Position of the Bank
As at July 31, 2017 Market risk measure
($ millions)
ConsolidatedStatement of
Financial Position Trading riskNon-trading
riskNot subject to
market riskPrimary risk sensitivity of
non-trading risk
Precious metals $ 7,621 $ 7,621 $ – $ – n/aTrading assets 105,148 105,148 – – n/aFinancial instruments designated at fair value
through profit or loss 231 – 231 – Interest rateDerivative financial instruments 37,255 33,062 4,193 – Interest rate, FX, equityInvestment securities 68,501 – 68,501 – Interest rate, equityLoans 498,559 – 498,559 – Interest rate, FXAssets not subject to market risk(1) 189,017 – – 189,017 n/a
Total assets $ 906,332 $ 145,831 $ 571,484 $ 189,017
Deposits $ 618,143 $ – $ 584,833 $ 33,310 Interest rate, FX, equityFinancial instruments designated at fair value
through profit or loss 3,373 – 3,373 – Interest rate, equityObligations related to securities sold short 32,740 32,740 – – n/aDerivative financial instruments 39,919 36,106 3,813 – Interest rate, FX, equityTrading liabilities(2) 9,706 9,706 – – n/aPension and other benefit liabilities 2,165 – 2,165 – Interest rate, credit spread, equityLiabilities not subject to market risk(3) 142,368 – – 142,368 n/a
Total liabilities $ 848,414 $ 78,552 $ 594,184 $ 175,678
(1) Includes goodwill, intangibles, other assets and securities purchased under resale agreements and securities borrowed.(2) Gold and silver certificates and bullion included in other liabilities.(3) Includes obligations related to securities sold under repurchase agreements and securities lent and other liabilities.
As at October 31, 2016 Market risk measure
($ millions)
ConsolidatedStatement of
Financial Position Trading riskNon-trading
riskNot subject to
market riskPrimary risk sensitivity of
non-trading risk
Precious metals $ 8,442 $ 8,442 $ – $ – n/aTrading assets 108,561 108,561 – – n/aFinancial instruments designated at fair value
through profit or loss 221 – 221 – Interest rateDerivative financial instruments 41,657 36,401 5,256 – Interest rate, FX, equityInvestment securities 72,919 – 72,919 – Interest rate, equityLoans 480,164 – 480,164 – Interest rate, FXAssets not subject to market risk(1) 184,302 – – 184,302 n/a
Total assets $ 896,266 $ 153,404 $ 558,560 $ 184,302
Deposits $ 611,877 $ – $ 580,814 $ 31,063 Interest rate, FX, equityFinancial instruments designated at fair value
through profit or loss 1,459 – 1,459 – Interest rate, equityObligations related to securities sold short 23,312 23,312 – – n/aDerivative financial instruments 42,387 38,213 4,174 – Interest rate, FX, equityTrading liabilities(2) 8,430 8,430 – – n/aPension and other benefit liabilities 3,011 – 3,011 – Interest rate, credit spread, equityLiabilities not subject to market risk(3) 147,969 – – 147,969 n/a
Total liabilities $ 838,445 $ 69,955 $ 589,458 $ 179,032
(1) Includes goodwill, intangibles, other assets and securities purchased under resale agreements and securities borrowed.(2) Gold and silver certificates and bullion included in other liabilities.(3) Includes obligations related to securities sold under repurchase agreements and securities lent and other liabilities.
Liquidity riskEffective liquidity risk management is essential to maintain the confidence of depositors and counterparties, manage the Bank’s cost of funds and tosupport core business activities, even under adverse circumstances.
Liquidity risk is managed within a framework of policies and limits that are approved by the Board of Directors, as outlined in Note 18 to thecondensed interim consolidated financial statements and in Note 35 of the audited consolidated financial statements in the Bank’s 2016 Annual Report.Liquid assets are a key component of this framework.
The determination of the appropriate levels for liquid asset portfolios is based on the amount of liquidity the Bank might need to fund expected cashflows in the normal course of business, as well as what might be required in periods of stress to meet cash outflows. Stress events include periods whenthere are disruptions in the capital markets or events which may impair the Bank’s access to funding markets or liquidity. The Bank uses stress testing toassess the impact of stress events and to assess the amount of liquid assets that would be required in various stress scenarios.
22 Scotiabank Third Quarter Report 2017
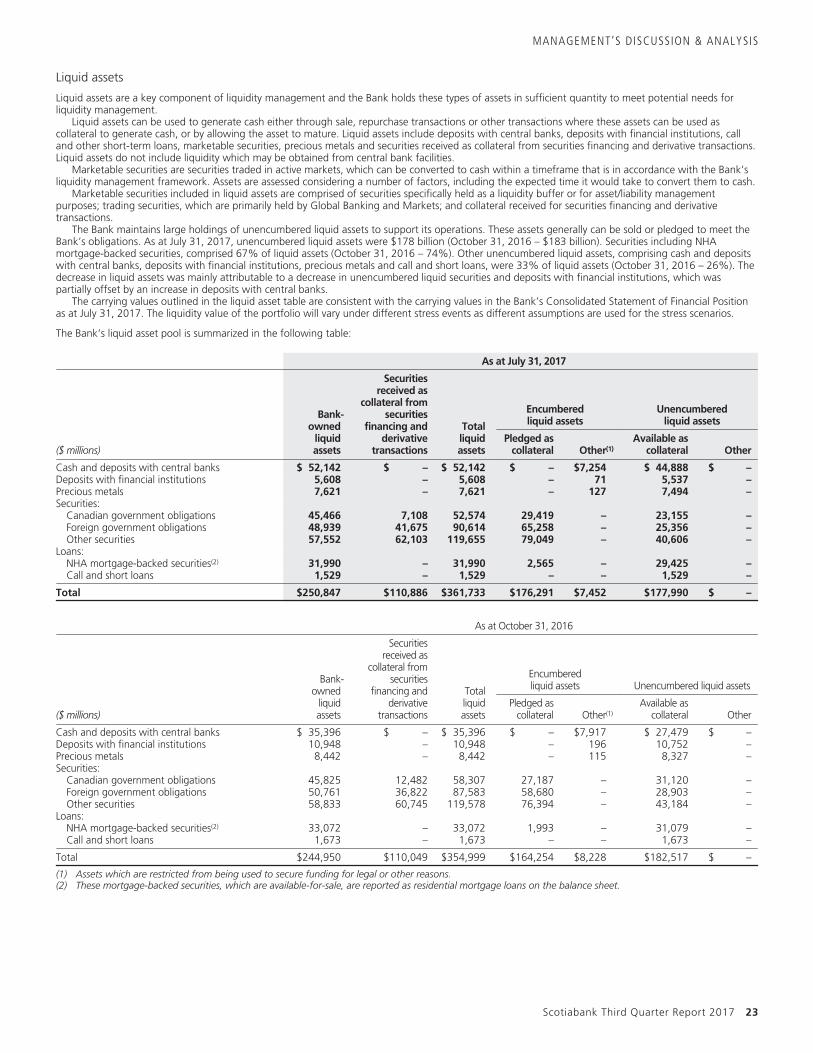
MANAGEMENT’S DISCUSSION & ANALYSIS
Liquid assets
Liquid assets are a key component of liquidity management and the Bank holds these types of assets in sufficient quantity to meet potential needs forliquidity management.
Liquid assets can be used to generate cash either through sale, repurchase transactions or other transactions where these assets can be used ascollateral to generate cash, or by allowing the asset to mature. Liquid assets include deposits with central banks, deposits with financial institutions, calland other short-term loans, marketable securities, precious metals and securities received as collateral from securities financing and derivative transactions.Liquid assets do not include liquidity which may be obtained from central bank facilities.
Marketable securities are securities traded in active markets, which can be converted to cash within a timeframe that is in accordance with the Bank’sliquidity management framework. Assets are assessed considering a number of factors, including the expected time it would take to convert them to cash.
Marketable securities included in liquid assets are comprised of securities specifically held as a liquidity buffer or for asset/liability managementpurposes; trading securities, which are primarily held by Global Banking and Markets; and collateral received for securities financing and derivativetransactions.
The Bank maintains large holdings of unencumbered liquid assets to support its operations. These assets generally can be sold or pledged to meet theBank’s obligations. As at July 31, 2017, unencumbered liquid assets were $178 billion (October 31, 2016 – $183 billion). Securities including NHAmortgage-backed securities, comprised 67% of liquid assets (October 31, 2016 – 74%). Other unencumbered liquid assets, comprising cash and depositswith central banks, deposits with financial institutions, precious metals and call and short loans, were 33% of liquid assets (October 31, 2016 – 26%). Thedecrease in liquid assets was mainly attributable to a decrease in unencumbered liquid securities and deposits with financial institutions, which waspartially offset by an increase in deposits with central banks.
The carrying values outlined in the liquid asset table are consistent with the carrying values in the Bank’s Consolidated Statement of Financial Positionas at July 31, 2017. The liquidity value of the portfolio will vary under different stress events as different assumptions are used for the stress scenarios.
The Bank’s liquid asset pool is summarized in the following table:
As at July 31, 2017
Bank-owned
liquidassets
Securitiesreceived as
collateral fromsecurities
financing andderivative
transactions
Totalliquidassets
Encumberedliquid assets
Unencumberedliquid assets
($ millions)Pledged as
collateral Other(1)Available as
collateral Other
Cash and deposits with central banks $ 52,142 $ – $ 52,142 $ – $7,254 $ 44,888 $ –Deposits with financial institutions 5,608 – 5,608 – 71 5,537 –Precious metals 7,621 – 7,621 – 127 7,494 –Securities:
Canadian government obligations 45,466 7,108 52,574 29,419 – 23,155 –Foreign government obligations 48,939 41,675 90,614 65,258 – 25,356 –Other securities 57,552 62,103 119,655 79,049 – 40,606 –
Loans:NHA mortgage-backed securities(2) 31,990 – 31,990 2,565 – 29,425 –Call and short loans 1,529 – 1,529 – – 1,529 –
Total $250,847 $110,886 $361,733 $176,291 $7,452 $177,990 $ –
As at October 31, 2016
Bank-owned
liquidassets
Securitiesreceived as
collateral fromsecurities
financing andderivative
transactions
Totalliquidassets
Encumberedliquid assets Unencumbered liquid assets
($ millions)Pledged as
collateral Other(1)Available as
collateral Other
Cash and deposits with central banks $ 35,396 $ – $ 35,396 $ – $7,917 $ 27,479 $ –Deposits with financial institutions 10,948 – 10,948 – 196 10,752 –Precious metals 8,442 – 8,442 – 115 8,327 –Securities:
Canadian government obligations 45,825 12,482 58,307 27,187 – 31,120 –Foreign government obligations 50,761 36,822 87,583 58,680 – 28,903 –Other securities 58,833 60,745 119,578 76,394 – 43,184 –
Loans:NHA mortgage-backed securities(2) 33,072 – 33,072 1,993 – 31,079 –Call and short loans 1,673 – 1,673 – – 1,673 –
Total $244,950 $110,049 $354,999 $164,254 $8,228 $182,517 $ –
(1) Assets which are restricted from being used to secure funding for legal or other reasons.(2) These mortgage-backed securities, which are available-for-sale, are reported as residential mortgage loans on the balance sheet.
Scotiabank Third Quarter Report 2017 23
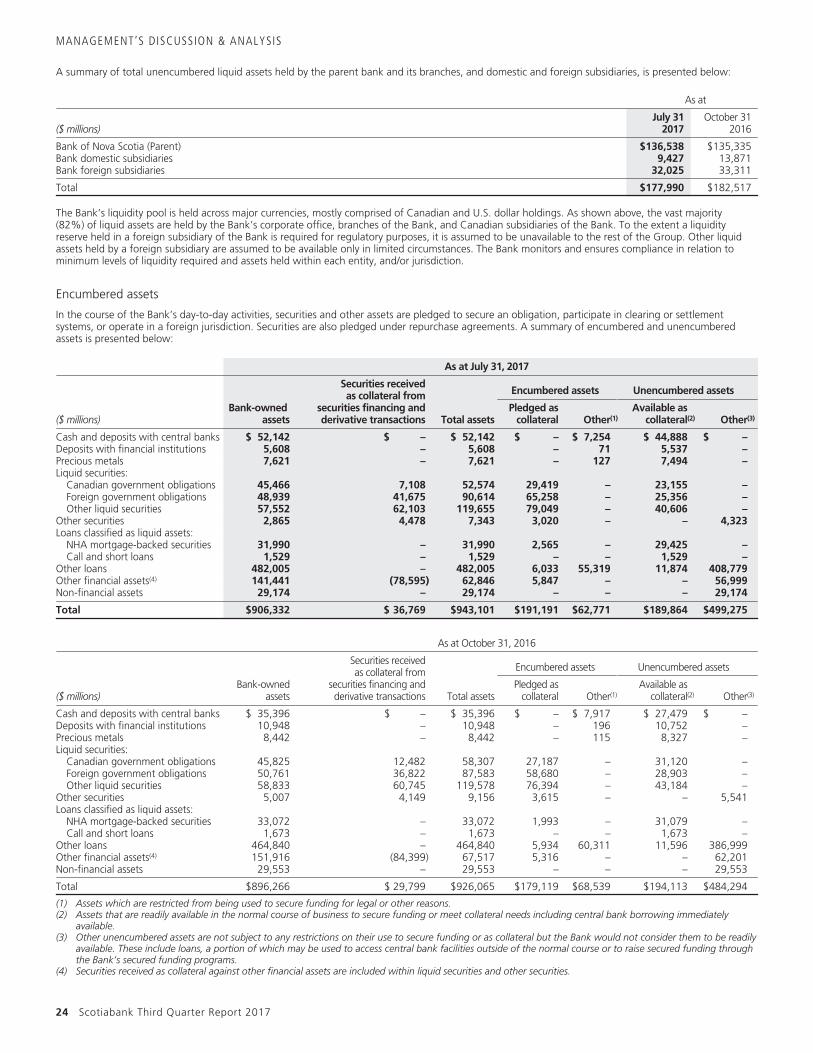
MANAGEMENT’S DISCUSSION & ANALYSIS
A summary of total unencumbered liquid assets held by the parent bank and its branches, and domestic and foreign subsidiaries, is presented below:
As at
($ millions)July 31
2017October 31
2016
Bank of Nova Scotia (Parent) $136,538 $135,335Bank domestic subsidiaries 9,427 13,871Bank foreign subsidiaries 32,025 33,311
Total $177,990 $182,517
The Bank’s liquidity pool is held across major currencies, mostly comprised of Canadian and U.S. dollar holdings. As shown above, the vast majority(82%) of liquid assets are held by the Bank’s corporate office, branches of the Bank, and Canadian subsidiaries of the Bank. To the extent a liquidityreserve held in a foreign subsidiary of the Bank is required for regulatory purposes, it is assumed to be unavailable to the rest of the Group. Other liquidassets held by a foreign subsidiary are assumed to be available only in limited circumstances. The Bank monitors and ensures compliance in relation tominimum levels of liquidity required and assets held within each entity, and/or jurisdiction.
Encumbered assets
In the course of the Bank’s day-to-day activities, securities and other assets are pledged to secure an obligation, participate in clearing or settlementsystems, or operate in a foreign jurisdiction. Securities are also pledged under repurchase agreements. A summary of encumbered and unencumberedassets is presented below:
As at July 31, 2017
Bank-ownedassets
Securities receivedas collateral from
securities financing andderivative transactions Total assets
Encumbered assets Unencumbered assets
($ millions)Pledged as
collateral Other(1)Available as
collateral(2) Other(3)
Cash and deposits with central banks $ 52,142 $ – $ 52,142 $ – $ 7,254 $ 44,888 $ –Deposits with financial institutions 5,608 – 5,608 – 71 5,537 –Precious metals 7,621 – 7,621 – 127 7,494 –Liquid securities:
Canadian government obligations 45,466 7,108 52,574 29,419 – 23,155 –Foreign government obligations 48,939 41,675 90,614 65,258 – 25,356 –Other liquid securities 57,552 62,103 119,655 79,049 – 40,606 –
Other securities 2,865 4,478 7,343 3,020 – – 4,323Loans classified as liquid assets:
NHA mortgage-backed securities 31,990 – 31,990 2,565 – 29,425 –Call and short loans 1,529 – 1,529 – – 1,529 –
Other loans 482,005 – 482,005 6,033 55,319 11,874 408,779Other financial assets(4) 141,441 (78,595) 62,846 5,847 – – 56,999Non-financial assets 29,174 – 29,174 – – – 29,174
Total $906,332 $ 36,769 $943,101 $191,191 $62,771 $189,864 $499,275
As at October 31, 2016
Bank-ownedassets
Securities receivedas collateral from
securities financing andderivative transactions Total assets
Encumbered assets Unencumbered assets
($ millions)Pledged as
collateral Other(1)Available as
collateral(2) Other(3)
Cash and deposits with central banks $ 35,396 $ – $ 35,396 $ – $ 7,917 $ 27,479 $ –Deposits with financial institutions 10,948 – 10,948 – 196 10,752 –Precious metals 8,442 – 8,442 – 115 8,327 –Liquid securities:
Canadian government obligations 45,825 12,482 58,307 27,187 – 31,120 –Foreign government obligations 50,761 36,822 87,583 58,680 – 28,903 –Other liquid securities 58,833 60,745 119,578 76,394 – 43,184 –
Other securities 5,007 4,149 9,156 3,615 – – 5,541Loans classified as liquid assets:
NHA mortgage-backed securities 33,072 – 33,072 1,993 – 31,079 –Call and short loans 1,673 – 1,673 – – 1,673 –
Other loans 464,840 – 464,840 5,934 60,311 11,596 386,999Other financial assets(4) 151,916 (84,399) 67,517 5,316 – – 62,201Non-financial assets 29,553 – 29,553 – – – 29,553
Total $896,266 $ 29,799 $926,065 $179,119 $68,539 $194,113 $484,294
(1) Assets which are restricted from being used to secure funding for legal or other reasons.(2) Assets that are readily available in the normal course of business to secure funding or meet collateral needs including central bank borrowing immediately
available.(3) Other unencumbered assets are not subject to any restrictions on their use to secure funding or as collateral but the Bank would not consider them to be readily
available. These include loans, a portion of which may be used to access central bank facilities outside of the normal course or to raise secured funding throughthe Bank’s secured funding programs.
(4) Securities received as collateral against other financial assets are included within liquid securities and other securities.
24 Scotiabank Third Quarter Report 2017
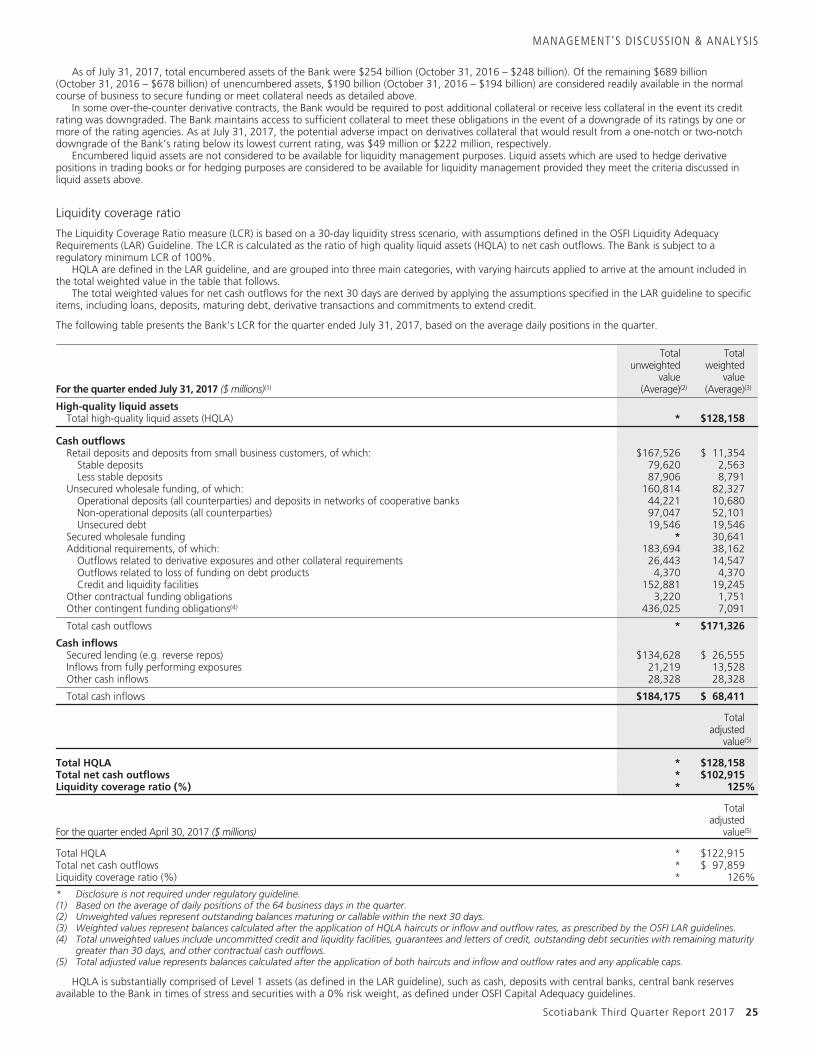
MANAGEMENT’S DISCUSSION & ANALYSIS
As of July 31, 2017, total encumbered assets of the Bank were $254 billion (October 31, 2016 – $248 billion). Of the remaining $689 billion(October 31, 2016 – $678 billion) of unencumbered assets, $190 billion (October 31, 2016 – $194 billion) are considered readily available in the normalcourse of business to secure funding or meet collateral needs as detailed above.
In some over-the-counter derivative contracts, the Bank would be required to post additional collateral or receive less collateral in the event its creditrating was downgraded. The Bank maintains access to sufficient collateral to meet these obligations in the event of a downgrade of its ratings by one ormore of the rating agencies. As at July 31, 2017, the potential adverse impact on derivatives collateral that would result from a one-notch or two-notchdowngrade of the Bank’s rating below its lowest current rating, was $49 million or $222 million, respectively.
Encumbered liquid assets are not considered to be available for liquidity management purposes. Liquid assets which are used to hedge derivativepositions in trading books or for hedging purposes are considered to be available for liquidity management provided they meet the criteria discussed inliquid assets above.
Liquidity coverage ratio
The Liquidity Coverage Ratio measure (LCR) is based on a 30-day liquidity stress scenario, with assumptions defined in the OSFI Liquidity AdequacyRequirements (LAR) Guideline. The LCR is calculated as the ratio of high quality liquid assets (HQLA) to net cash outflows. The Bank is subject to aregulatory minimum LCR of 100%.
HQLA are defined in the LAR guideline, and are grouped into three main categories, with varying haircuts applied to arrive at the amount included inthe total weighted value in the table that follows.
The total weighted values for net cash outflows for the next 30 days are derived by applying the assumptions specified in the LAR guideline to specificitems, including loans, deposits, maturing debt, derivative transactions and commitments to extend credit.
The following table presents the Bank’s LCR for the quarter ended July 31, 2017, based on the average daily positions in the quarter.
For the quarter ended July 31, 2017 ($ millions)(1)
Totalunweighted
value(Average)(2)
Totalweighted
value(Average)(3)
High-quality liquid assetsTotal high-quality liquid assets (HQLA) * $128,158
Cash outflowsRetail deposits and deposits from small business customers, of which: $167,526 $ 11,354
Stable deposits 79,620 2,563Less stable deposits 87,906 8,791
Unsecured wholesale funding, of which: 160,814 82,327Operational deposits (all counterparties) and deposits in networks of cooperative banks 44,221 10,680Non-operational deposits (all counterparties) 97,047 52,101Unsecured debt 19,546 19,546
Secured wholesale funding * 30,641Additional requirements, of which: 183,694 38,162
Outflows related to derivative exposures and other collateral requirements 26,443 14,547Outflows related to loss of funding on debt products 4,370 4,370Credit and liquidity facilities 152,881 19,245
Other contractual funding obligations 3,220 1,751Other contingent funding obligations(4) 436,025 7,091
Total cash outflows * $171,326
Cash inflowsSecured lending (e.g. reverse repos) $134,628 $ 26,555Inflows from fully performing exposures 21,219 13,528Other cash inflows 28,328 28,328
Total cash inflows $184,175 $ 68,411
Totaladjusted
value(5)
Total HQLA * $128,158Total net cash outflows * $102,915Liquidity coverage ratio (%) * 125%
For the quarter ended April 30, 2017 ($ millions)
Totaladjusted
value(5)
Total HQLA * $122,915Total net cash outflows * $ 97,859Liquidity coverage ratio (%) * 126%
* Disclosure is not required under regulatory guideline.(1) Based on the average of daily positions of the 64 business days in the quarter.(2) Unweighted values represent outstanding balances maturing or callable within the next 30 days.(3) Weighted values represent balances calculated after the application of HQLA haircuts or inflow and outflow rates, as prescribed by the OSFI LAR guidelines.(4) Total unweighted values include uncommitted credit and liquidity facilities, guarantees and letters of credit, outstanding debt securities with remaining maturity
greater than 30 days, and other contractual cash outflows.(5) Total adjusted value represents balances calculated after the application of both haircuts and inflow and outflow rates and any applicable caps.
HQLA is substantially comprised of Level 1 assets (as defined in the LAR guideline), such as cash, deposits with central banks, central bank reservesavailable to the Bank in times of stress and securities with a 0% risk weight, as defined under OSFI Capital Adequacy guidelines.
Scotiabank Third Quarter Report 2017 25
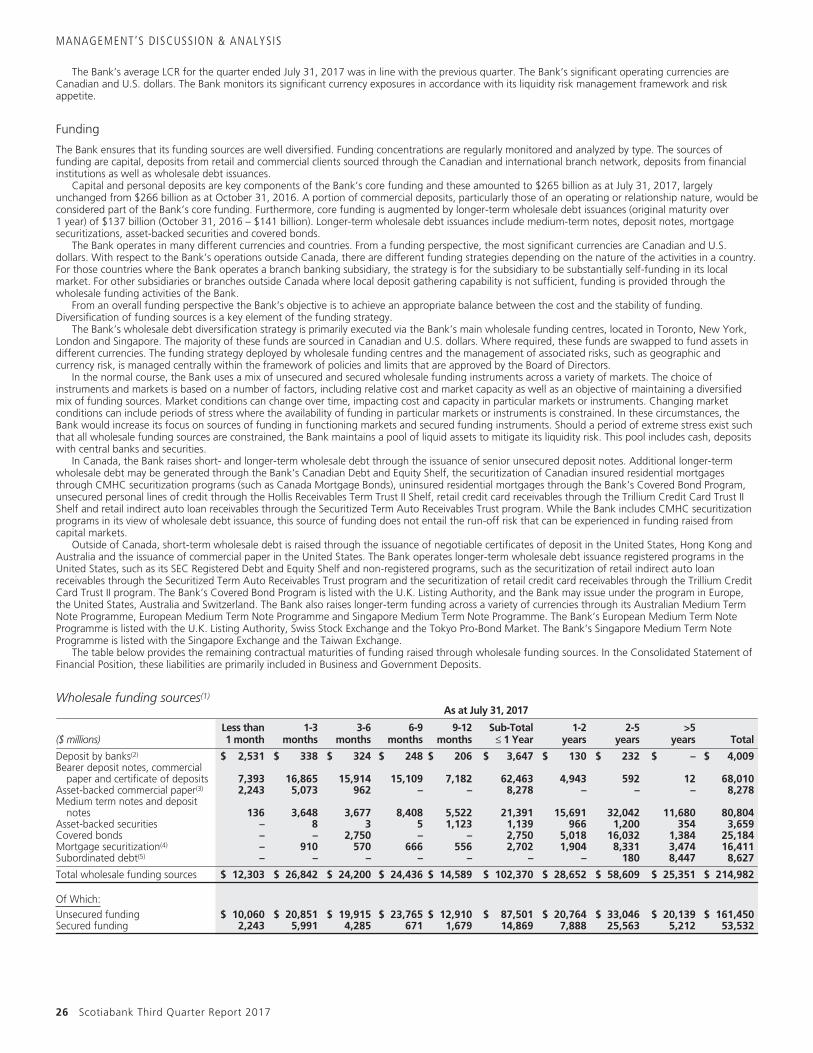
MANAGEMENT’S DISCUSSION & ANALYSIS
The Bank’s average LCR for the quarter ended July 31, 2017 was in line with the previous quarter. The Bank’s significant operating currencies areCanadian and U.S. dollars. The Bank monitors its significant currency exposures in accordance with its liquidity risk management framework and riskappetite.
Funding
The Bank ensures that its funding sources are well diversified. Funding concentrations are regularly monitored and analyzed by type. The sources offunding are capital, deposits from retail and commercial clients sourced through the Canadian and international branch network, deposits from financialinstitutions as well as wholesale debt issuances.
Capital and personal deposits are key components of the Bank’s core funding and these amounted to $265 billion as at July 31, 2017, largelyunchanged from $266 billion as at October 31, 2016. A portion of commercial deposits, particularly those of an operating or relationship nature, would beconsidered part of the Bank’s core funding. Furthermore, core funding is augmented by longer-term wholesale debt issuances (original maturity over1 year) of $137 billion (October 31, 2016 – $141 billion). Longer-term wholesale debt issuances include medium-term notes, deposit notes, mortgagesecuritizations, asset-backed securities and covered bonds.
The Bank operates in many different currencies and countries. From a funding perspective, the most significant currencies are Canadian and U.S.dollars. With respect to the Bank’s operations outside Canada, there are different funding strategies depending on the nature of the activities in a country.For those countries where the Bank operates a branch banking subsidiary, the strategy is for the subsidiary to be substantially self-funding in its localmarket. For other subsidiaries or branches outside Canada where local deposit gathering capability is not sufficient, funding is provided through thewholesale funding activities of the Bank.
From an overall funding perspective the Bank’s objective is to achieve an appropriate balance between the cost and the stability of funding.Diversification of funding sources is a key element of the funding strategy.
The Bank’s wholesale debt diversification strategy is primarily executed via the Bank’s main wholesale funding centres, located in Toronto, New York,London and Singapore. The majority of these funds are sourced in Canadian and U.S. dollars. Where required, these funds are swapped to fund assets indifferent currencies. The funding strategy deployed by wholesale funding centres and the management of associated risks, such as geographic andcurrency risk, is managed centrally within the framework of policies and limits that are approved by the Board of Directors.
In the normal course, the Bank uses a mix of unsecured and secured wholesale funding instruments across a variety of markets. The choice ofinstruments and markets is based on a number of factors, including relative cost and market capacity as well as an objective of maintaining a diversifiedmix of funding sources. Market conditions can change over time, impacting cost and capacity in particular markets or instruments. Changing marketconditions can include periods of stress where the availability of funding in particular markets or instruments is constrained. In these circumstances, theBank would increase its focus on sources of funding in functioning markets and secured funding instruments. Should a period of extreme stress exist suchthat all wholesale funding sources are constrained, the Bank maintains a pool of liquid assets to mitigate its liquidity risk. This pool includes cash, depositswith central banks and securities.
In Canada, the Bank raises short- and longer-term wholesale debt through the issuance of senior unsecured deposit notes. Additional longer-termwholesale debt may be generated through the Bank’s Canadian Debt and Equity Shelf, the securitization of Canadian insured residential mortgagesthrough CMHC securitization programs (such as Canada Mortgage Bonds), uninsured residential mortgages through the Bank’s Covered Bond Program,unsecured personal lines of credit through the Hollis Receivables Term Trust II Shelf, retail credit card receivables through the Trillium Credit Card Trust IIShelf and retail indirect auto loan receivables through the Securitized Term Auto Receivables Trust program. While the Bank includes CMHC securitizationprograms in its view of wholesale debt issuance, this source of funding does not entail the run-off risk that can be experienced in funding raised fromcapital markets.
Outside of Canada, short-term wholesale debt is raised through the issuance of negotiable certificates of deposit in the United States, Hong Kong andAustralia and the issuance of commercial paper in the United States. The Bank operates longer-term wholesale debt issuance registered programs in theUnited States, such as its SEC Registered Debt and Equity Shelf and non-registered programs, such as the securitization of retail indirect auto loanreceivables through the Securitized Term Auto Receivables Trust program and the securitization of retail credit card receivables through the Trillium CreditCard Trust II program. The Bank’s Covered Bond Program is listed with the U.K. Listing Authority, and the Bank may issue under the program in Europe,the United States, Australia and Switzerland. The Bank also raises longer-term funding across a variety of currencies through its Australian Medium TermNote Programme, European Medium Term Note Programme and Singapore Medium Term Note Programme. The Bank’s European Medium Term NoteProgramme is listed with the U.K. Listing Authority, Swiss Stock Exchange and the Tokyo Pro-Bond Market. The Bank’s Singapore Medium Term NoteProgramme is listed with the Singapore Exchange and the Taiwan Exchange.
The table below provides the remaining contractual maturities of funding raised through wholesale funding sources. In the Consolidated Statement ofFinancial Position, these liabilities are primarily included in Business and Government Deposits.
Wholesale funding sources(1)
As at July 31, 2017
($ millions)Less than1 month
1-3months
3-6months
6-9months
9-12months
Sub-Total≤ 1 Year
1-2years
2-5years
>5years Total
Deposit by banks(2) $ 2,531 $ 338 $ 324 $ 248 $ 206 $ 3,647 $ 130 $ 232 $ – $ 4,009Bearer deposit notes, commercial
paper and certificate of deposits 7,393 16,865 15,914 15,109 7,182 62,463 4,943 592 12 68,010Asset-backed commercial paper(3) 2,243 5,073 962 – – 8,278 – – – 8,278Medium term notes and deposit
notes 136 3,648 3,677 8,408 5,522 21,391 15,691 32,042 11,680 80,804Asset-backed securities – 8 3 5 1,123 1,139 966 1,200 354 3,659Covered bonds – – 2,750 – – 2,750 5,018 16,032 1,384 25,184Mortgage securitization(4) – 910 570 666 556 2,702 1,904 8,331 3,474 16,411Subordinated debt(5) – – – – – – – 180 8,447 8,627
Total wholesale funding sources $ 12,303 $ 26,842 $ 24,200 $ 24,436 $ 14,589 $ 102,370 $ 28,652 $ 58,609 $ 25,351 $ 214,982
Of Which:Unsecured funding $ 10,060 $ 20,851 $ 19,915 $ 23,765 $ 12,910 $ 87,501 $ 20,764 $ 33,046 $ 20,139 $ 161,450Secured funding 2,243 5,991 4,285 671 1,679 14,869 7,888 25,563 5,212 53,532
26 Scotiabank Third Quarter Report 2017
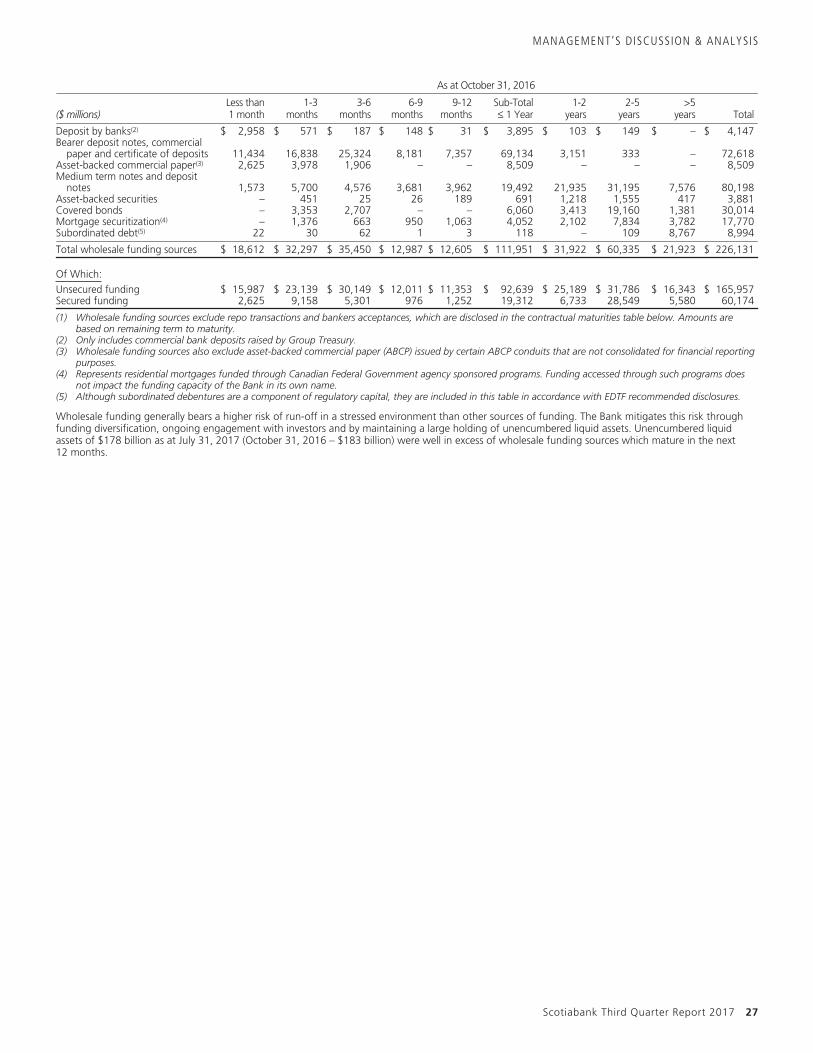
MANAGEMENT’S DISCUSSION & ANALYSIS
As at October 31, 2016
($ millions)Less than1 month
1-3months
3-6months
6-9months
9-12months
Sub-Total≤ 1 Year
1-2years
2-5years
>5years Total
Deposit by banks(2) $ 2,958 $ 571 $ 187 $ 148 $ 31 $ 3,895 $ 103 $ 149 $ – $ 4,147Bearer deposit notes, commercial
paper and certificate of deposits 11,434 16,838 25,324 8,181 7,357 69,134 3,151 333 – 72,618Asset-backed commercial paper(3) 2,625 3,978 1,906 – – 8,509 – – – 8,509Medium term notes and deposit
notes 1,573 5,700 4,576 3,681 3,962 19,492 21,935 31,195 7,576 80,198Asset-backed securities – 451 25 26 189 691 1,218 1,555 417 3,881Covered bonds – 3,353 2,707 – – 6,060 3,413 19,160 1,381 30,014Mortgage securitization(4) – 1,376 663 950 1,063 4,052 2,102 7,834 3,782 17,770Subordinated debt(5) 22 30 62 1 3 118 – 109 8,767 8,994
Total wholesale funding sources $ 18,612 $ 32,297 $ 35,450 $ 12,987 $ 12,605 $ 111,951 $ 31,922 $ 60,335 $ 21,923 $ 226,131
Of Which:Unsecured funding $ 15,987 $ 23,139 $ 30,149 $ 12,011 $ 11,353 $ 92,639 $ 25,189 $ 31,786 $ 16,343 $ 165,957Secured funding 2,625 9,158 5,301 976 1,252 19,312 6,733 28,549 5,580 60,174
(1) Wholesale funding sources exclude repo transactions and bankers acceptances, which are disclosed in the contractual maturities table below. Amounts arebased on remaining term to maturity.
(2) Only includes commercial bank deposits raised by Group Treasury.(3) Wholesale funding sources also exclude asset-backed commercial paper (ABCP) issued by certain ABCP conduits that are not consolidated for financial reporting
purposes.(4) Represents residential mortgages funded through Canadian Federal Government agency sponsored programs. Funding accessed through such programs does
not impact the funding capacity of the Bank in its own name.(5) Although subordinated debentures are a component of regulatory capital, they are included in this table in accordance with EDTF recommended disclosures.
Wholesale funding generally bears a higher risk of run-off in a stressed environment than other sources of funding. The Bank mitigates this risk throughfunding diversification, ongoing engagement with investors and by maintaining a large holding of unencumbered liquid assets. Unencumbered liquidassets of $178 billion as at July 31, 2017 (October 31, 2016 – $183 billion) were well in excess of wholesale funding sources which mature in the next12 months.
Scotiabank Third Quarter Report 2017 27
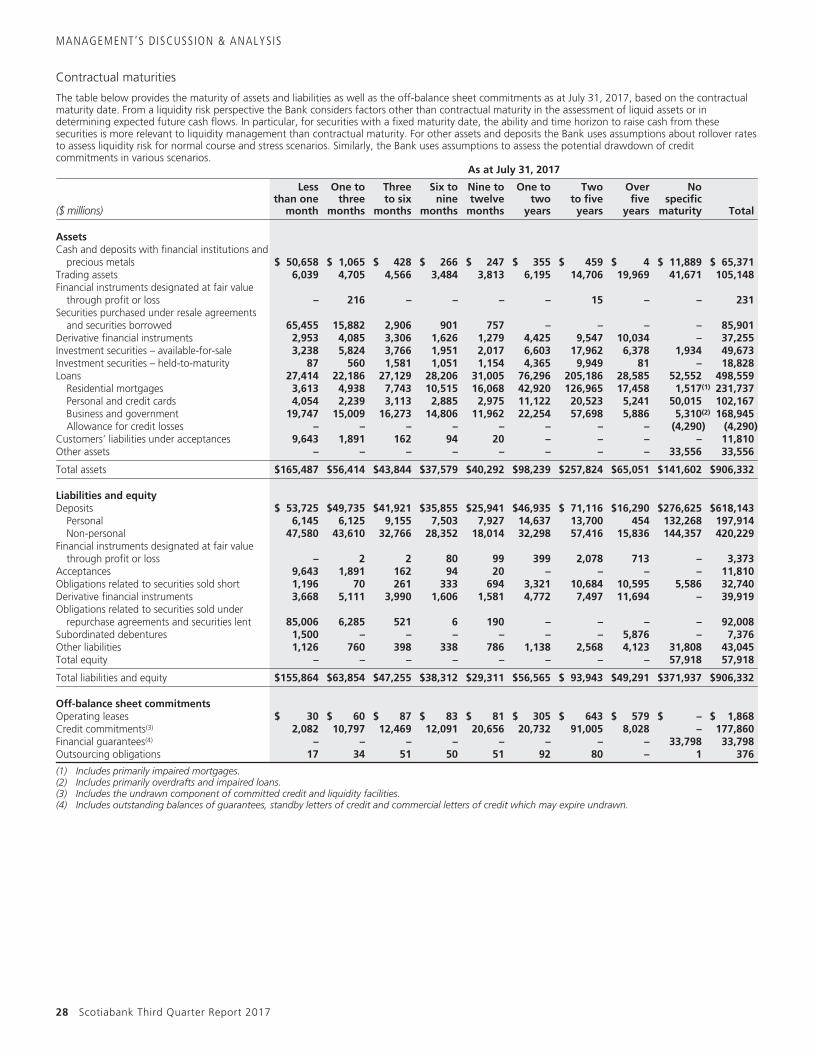
MANAGEMENT’S DISCUSSION & ANALYSIS
Contractual maturities
The table below provides the maturity of assets and liabilities as well as the off-balance sheet commitments as at July 31, 2017, based on the contractualmaturity date. From a liquidity risk perspective the Bank considers factors other than contractual maturity in the assessment of liquid assets or indetermining expected future cash flows. In particular, for securities with a fixed maturity date, the ability and time horizon to raise cash from thesesecurities is more relevant to liquidity management than contractual maturity. For other assets and deposits the Bank uses assumptions about rollover ratesto assess liquidity risk for normal course and stress scenarios. Similarly, the Bank uses assumptions to assess the potential drawdown of creditcommitments in various scenarios.
As at July 31, 2017
($ millions)
Lessthan one
month
One tothree
months
Threeto six
months
Six tonine
months
Nine totwelve
months
One totwo
years
Twoto fiveyears
Overfive
years
Nospecific
maturity Total
AssetsCash and deposits with financial institutions and
precious metals $ 50,658 $ 1,065 $ 428 $ 266 $ 247 $ 355 $ 459 $ 4 $ 11,889 $ 65,371Trading assets 6,039 4,705 4,566 3,484 3,813 6,195 14,706 19,969 41,671 105,148Financial instruments designated at fair value
through profit or loss – 216 – – – – 15 – – 231Securities purchased under resale agreements
and securities borrowed 65,455 15,882 2,906 901 757 – – – – 85,901Derivative financial instruments 2,953 4,085 3,306 1,626 1,279 4,425 9,547 10,034 – 37,255Investment securities – available-for-sale 3,238 5,824 3,766 1,951 2,017 6,603 17,962 6,378 1,934 49,673Investment securities – held-to-maturity 87 560 1,581 1,051 1,154 4,365 9,949 81 – 18,828Loans 27,414 22,186 27,129 28,206 31,005 76,296 205,186 28,585 52,552 498,559
Residential mortgages 3,613 4,938 7,743 10,515 16,068 42,920 126,965 17,458 1,517(1) 231,737Personal and credit cards 4,054 2,239 3,113 2,885 2,975 11,122 20,523 5,241 50,015 102,167Business and government 19,747 15,009 16,273 14,806 11,962 22,254 57,698 5,886 5,310(2) 168,945Allowance for credit losses – – – – – – – – (4,290) (4,290)
Customers’ liabilities under acceptances 9,643 1,891 162 94 20 – – – – 11,810Other assets – – – – – – – – 33,556 33,556
Total assets $165,487 $56,414 $43,844 $37,579 $40,292 $98,239 $257,824 $65,051 $141,602 $906,332
Liabilities and equityDeposits $ 53,725 $49,735 $41,921 $35,855 $25,941 $46,935 $ 71,116 $16,290 $276,625 $618,143
Personal 6,145 6,125 9,155 7,503 7,927 14,637 13,700 454 132,268 197,914Non-personal 47,580 43,610 32,766 28,352 18,014 32,298 57,416 15,836 144,357 420,229
Financial instruments designated at fair valuethrough profit or loss – 2 2 80 99 399 2,078 713 – 3,373
Acceptances 9,643 1,891 162 94 20 – – – – 11,810Obligations related to securities sold short 1,196 70 261 333 694 3,321 10,684 10,595 5,586 32,740Derivative financial instruments 3,668 5,111 3,990 1,606 1,581 4,772 7,497 11,694 – 39,919Obligations related to securities sold under
repurchase agreements and securities lent 85,006 6,285 521 6 190 – – – – 92,008Subordinated debentures 1,500 – – – – – – 5,876 – 7,376Other liabilities 1,126 760 398 338 786 1,138 2,568 4,123 31,808 43,045Total equity – – – – – – – – 57,918 57,918
Total liabilities and equity $155,864 $63,854 $47,255 $38,312 $29,311 $56,565 $ 93,943 $49,291 $371,937 $906,332
Off-balance sheet commitmentsOperating leases $ 30 $ 60 $ 87 $ 83 $ 81 $ 305 $ 643 $ 579 $ – $ 1,868Credit commitments(3) 2,082 10,797 12,469 12,091 20,656 20,732 91,005 8,028 – 177,860Financial guarantees(4) – – – – – – – – 33,798 33,798Outsourcing obligations 17 34 51 50 51 92 80 – 1 376
(1) Includes primarily impaired mortgages.(2) Includes primarily overdrafts and impaired loans.(3) Includes the undrawn component of committed credit and liquidity facilities.(4) Includes outstanding balances of guarantees, standby letters of credit and commercial letters of credit which may expire undrawn.
28 Scotiabank Third Quarter Report 2017
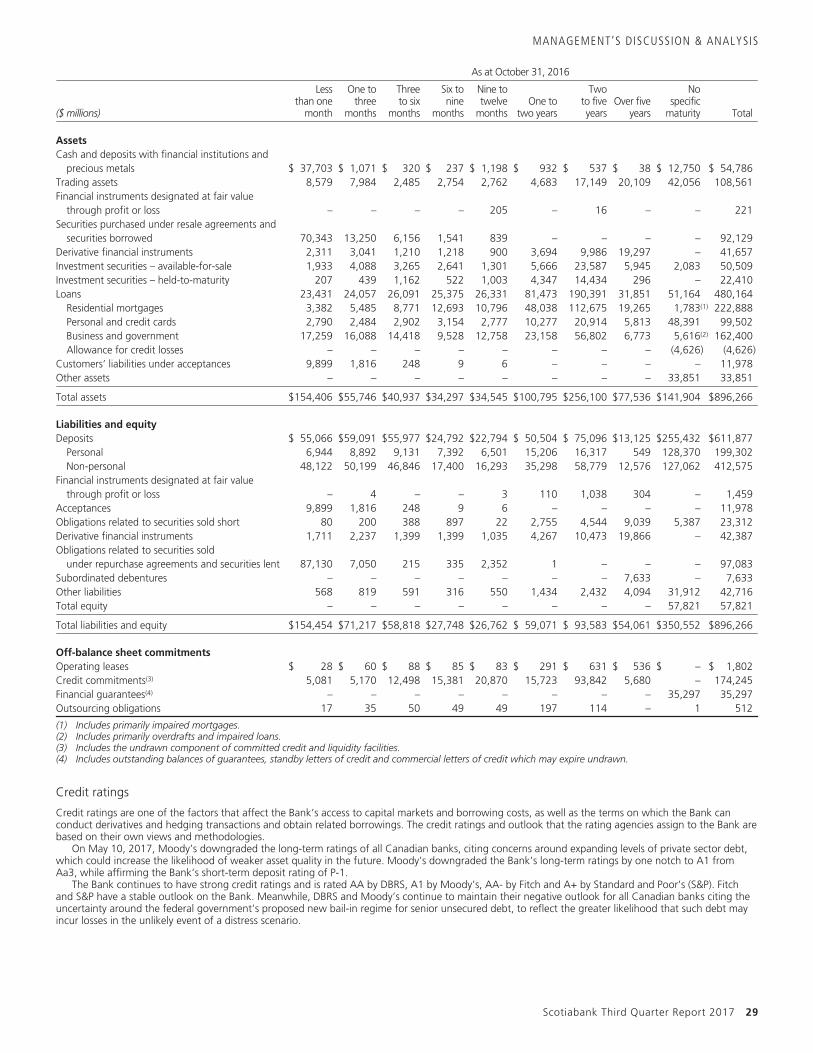
MANAGEMENT’S DISCUSSION & ANALYSIS
As at October 31, 2016
($ millions)
Lessthan one
month
One tothree
months
Threeto six
months
Six tonine
months
Nine totwelve
monthsOne to
two years
Twoto fiveyears
Over fiveyears
Nospecific
maturity Total
AssetsCash and deposits with financial institutions and
precious metals $ 37,703 $ 1,071 $ 320 $ 237 $ 1,198 $ 932 $ 537 $ 38 $ 12,750 $ 54,786Trading assets 8,579 7,984 2,485 2,754 2,762 4,683 17,149 20,109 42,056 108,561Financial instruments designated at fair value
through profit or loss – – – – 205 – 16 – – 221Securities purchased under resale agreements and
securities borrowed 70,343 13,250 6,156 1,541 839 – – – – 92,129Derivative financial instruments 2,311 3,041 1,210 1,218 900 3,694 9,986 19,297 – 41,657Investment securities – available-for-sale 1,933 4,088 3,265 2,641 1,301 5,666 23,587 5,945 2,083 50,509Investment securities – held-to-maturity 207 439 1,162 522 1,003 4,347 14,434 296 – 22,410Loans 23,431 24,057 26,091 25,375 26,331 81,473 190,391 31,851 51,164 480,164
Residential mortgages 3,382 5,485 8,771 12,693 10,796 48,038 112,675 19,265 1,783(1) 222,888Personal and credit cards 2,790 2,484 2,902 3,154 2,777 10,277 20,914 5,813 48,391 99,502Business and government 17,259 16,088 14,418 9,528 12,758 23,158 56,802 6,773 5,616(2) 162,400Allowance for credit losses – – – – – – – – (4,626) (4,626)
Customers’ liabilities under acceptances 9,899 1,816 248 9 6 – – – – 11,978Other assets – – – – – – – – 33,851 33,851
Total assets $154,406 $55,746 $40,937 $34,297 $34,545 $100,795 $256,100 $77,536 $141,904 $896,266
Liabilities and equityDeposits $ 55,066 $59,091 $55,977 $24,792 $22,794 $ 50,504 $ 75,096 $13,125 $255,432 $611,877
Personal 6,944 8,892 9,131 7,392 6,501 15,206 16,317 549 128,370 199,302Non-personal 48,122 50,199 46,846 17,400 16,293 35,298 58,779 12,576 127,062 412,575
Financial instruments designated at fair valuethrough profit or loss – 4 – – 3 110 1,038 304 – 1,459
Acceptances 9,899 1,816 248 9 6 – – – – 11,978Obligations related to securities sold short 80 200 388 897 22 2,755 4,544 9,039 5,387 23,312Derivative financial instruments 1,711 2,237 1,399 1,399 1,035 4,267 10,473 19,866 – 42,387Obligations related to securities sold
under repurchase agreements and securities lent 87,130 7,050 215 335 2,352 1 – – – 97,083Subordinated debentures – – – – – – – 7,633 – 7,633Other liabilities 568 819 591 316 550 1,434 2,432 4,094 31,912 42,716Total equity – – – – – – – – 57,821 57,821
Total liabilities and equity $154,454 $71,217 $58,818 $27,748 $26,762 $ 59,071 $ 93,583 $54,061 $350,552 $896,266
Off-balance sheet commitmentsOperating leases $ 28 $ 60 $ 88 $ 85 $ 83 $ 291 $ 631 $ 536 $ – $ 1,802Credit commitments(3) 5,081 5,170 12,498 15,381 20,870 15,723 93,842 5,680 – 174,245Financial guarantees(4) – – – – – – – – 35,297 35,297Outsourcing obligations 17 35 50 49 49 197 114 – 1 512
(1) Includes primarily impaired mortgages.(2) Includes primarily overdrafts and impaired loans.(3) Includes the undrawn component of committed credit and liquidity facilities.(4) Includes outstanding balances of guarantees, standby letters of credit and commercial letters of credit which may expire undrawn.
Credit ratings
Credit ratings are one of the factors that affect the Bank’s access to capital markets and borrowing costs, as well as the terms on which the Bank canconduct derivatives and hedging transactions and obtain related borrowings. The credit ratings and outlook that the rating agencies assign to the Bank arebased on their own views and methodologies.
On May 10, 2017, Moody’s downgraded the long-term ratings of all Canadian banks, citing concerns around expanding levels of private sector debt,which could increase the likelihood of weaker asset quality in the future. Moody’s downgraded the Bank’s long-term ratings by one notch to A1 fromAa3, while affirming the Bank’s short-term deposit rating of P-1.
The Bank continues to have strong credit ratings and is rated AA by DBRS, A1 by Moody’s, AA- by Fitch and A+ by Standard and Poor’s (S&P). Fitchand S&P have a stable outlook on the Bank. Meanwhile, DBRS and Moody’s continue to maintain their negative outlook for all Canadian banks citing theuncertainty around the federal government’s proposed new bail-in regime for senior unsecured debt, to reflect the greater likelihood that such debt mayincur losses in the unlikely event of a distress scenario.
Scotiabank Third Quarter Report 2017 29
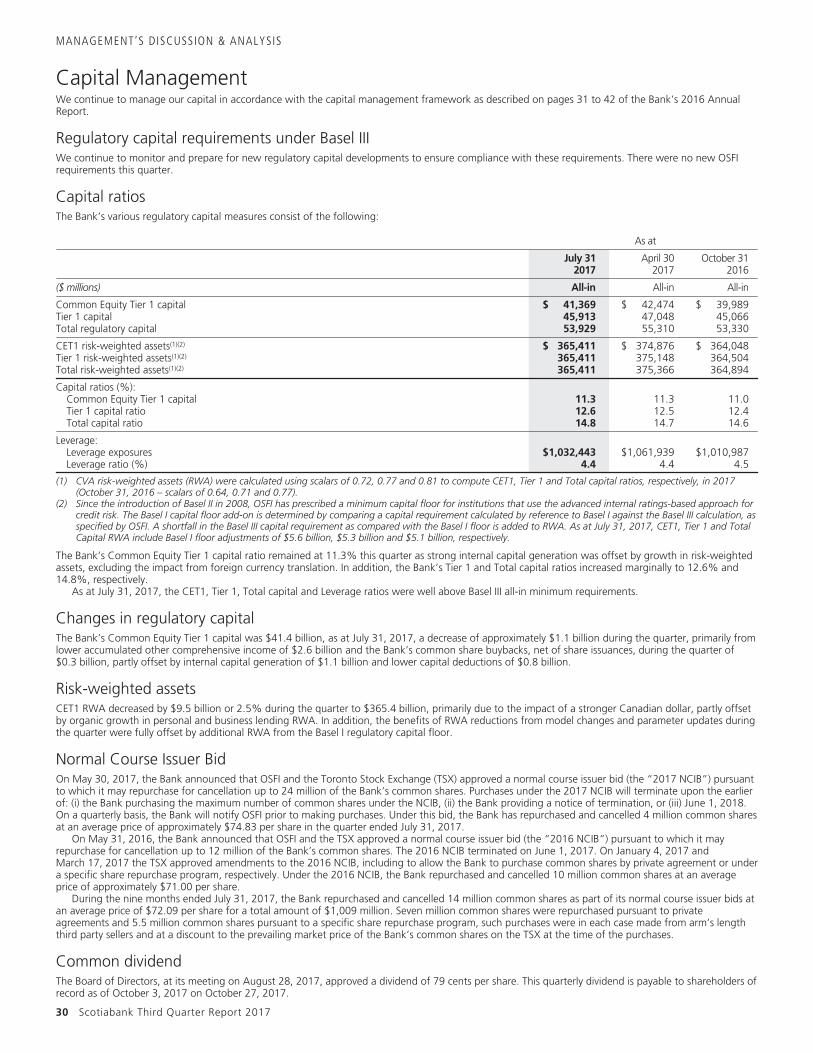
MANAGEMENT’S DISCUSSION & ANALYSIS
Capital ManagementWe continue to manage our capital in accordance with the capital management framework as described on pages 31 to 42 of the Bank’s 2016 AnnualReport.
Regulatory capital requirements under Basel IIIWe continue to monitor and prepare for new regulatory capital developments to ensure compliance with these requirements. There were no new OSFIrequirements this quarter.
Capital ratiosThe Bank’s various regulatory capital measures consist of the following:
As at
July 312017
April 302017
October 312016
($ millions) All-in All-in All-in
Common Equity Tier 1 capital $ 41,369 $ 42,474 $ 39,989Tier 1 capital 45,913 47,048 45,066Total regulatory capital 53,929 55,310 53,330
CET1 risk-weighted assets(1)(2) $ 365,411 $ 374,876 $ 364,048Tier 1 risk-weighted assets(1)(2) 365,411 375,148 364,504Total risk-weighted assets(1)(2) 365,411 375,366 364,894
Capital ratios (%):Common Equity Tier 1 capital 11.3 11.3 11.0Tier 1 capital ratio 12.6 12.5 12.4Total capital ratio 14.8 14.7 14.6
Leverage:Leverage exposures $1,032,443 $1,061,939 $1,010,987Leverage ratio (%) 4.4 4.4 4.5
(1) CVA risk-weighted assets (RWA) were calculated using scalars of 0.72, 0.77 and 0.81 to compute CET1, Tier 1 and Total capital ratios, respectively, in 2017(October 31, 2016 – scalars of 0.64, 0.71 and 0.77).
(2) Since the introduction of Basel II in 2008, OSFI has prescribed a minimum capital floor for institutions that use the advanced internal ratings-based approach forcredit risk. The Basel I capital floor add-on is determined by comparing a capital requirement calculated by reference to Basel I against the Basel III calculation, asspecified by OSFI. A shortfall in the Basel III capital requirement as compared with the Basel I floor is added to RWA. As at July 31, 2017, CET1, Tier 1 and TotalCapital RWA include Basel I floor adjustments of $5.6 billion, $5.3 billion and $5.1 billion, respectively.
The Bank’s Common Equity Tier 1 capital ratio remained at 11.3% this quarter as strong internal capital generation was offset by growth in risk-weightedassets, excluding the impact from foreign currency translation. In addition, the Bank’s Tier 1 and Total capital ratios increased marginally to 12.6% and14.8%, respectively.
As at July 31, 2017, the CET1, Tier 1, Total capital and Leverage ratios were well above Basel III all-in minimum requirements.
Changes in regulatory capitalThe Bank’s Common Equity Tier 1 capital was $41.4 billion, as at July 31, 2017, a decrease of approximately $1.1 billion during the quarter, primarily fromlower accumulated other comprehensive income of $2.6 billion and the Bank’s common share buybacks, net of share issuances, during the quarter of$0.3 billion, partly offset by internal capital generation of $1.1 billion and lower capital deductions of $0.8 billion.
Risk-weighted assetsCET1 RWA decreased by $9.5 billion or 2.5% during the quarter to $365.4 billion, primarily due to the impact of a stronger Canadian dollar, partly offsetby organic growth in personal and business lending RWA. In addition, the benefits of RWA reductions from model changes and parameter updates duringthe quarter were fully offset by additional RWA from the Basel I regulatory capital floor.
Normal Course Issuer BidOn May 30, 2017, the Bank announced that OSFI and the Toronto Stock Exchange (TSX) approved a normal course issuer bid (the “2017 NCIB”) pursuantto which it may repurchase for cancellation up to 24 million of the Bank’s common shares. Purchases under the 2017 NCIB will terminate upon the earlierof: (i) the Bank purchasing the maximum number of common shares under the NCIB, (ii) the Bank providing a notice of termination, or (iii) June 1, 2018.On a quarterly basis, the Bank will notify OSFI prior to making purchases. Under this bid, the Bank has repurchased and cancelled 4 million common sharesat an average price of approximately $74.83 per share in the quarter ended July 31, 2017.
On May 31, 2016, the Bank announced that OSFI and the TSX approved a normal course issuer bid (the “2016 NCIB”) pursuant to which it mayrepurchase for cancellation up to 12 million of the Bank’s common shares. The 2016 NCIB terminated on June 1, 2017. On January 4, 2017 andMarch 17, 2017 the TSX approved amendments to the 2016 NCIB, including to allow the Bank to purchase common shares by private agreement or undera specific share repurchase program, respectively. Under the 2016 NCIB, the Bank repurchased and cancelled 10 million common shares at an averageprice of approximately $71.00 per share.
During the nine months ended July 31, 2017, the Bank repurchased and cancelled 14 million common shares as part of its normal course issuer bids atan average price of $72.09 per share for a total amount of $1,009 million. Seven million common shares were repurchased pursuant to privateagreements and 5.5 million common shares pursuant to a specific share repurchase program, such purchases were in each case made from arm’s lengththird party sellers and at a discount to the prevailing market price of the Bank’s common shares on the TSX at the time of the purchases.
Common dividendThe Board of Directors, at its meeting on August 28, 2017, approved a dividend of 79 cents per share. This quarterly dividend is payable to shareholders ofrecord as of October 3, 2017 on October 27, 2017.
30 Scotiabank Third Quarter Report 2017
MANAGEMENT’S DISCUSSION & ANALYSIS
Financial InstrumentsGiven the nature of the Bank’s main business activities, financial instruments make up a substantial portion of the balance sheet and are integral to theBank’s business. There are various measures that reflect the level of risk associated with the Bank’s portfolio of financial instruments. Further discussion ofsome of these risk measures is included in the Risk Management section on page 17. The methods of determining the fair value of financial instrumentsare detailed on page 153 of the Bank’s 2016 Annual Report.
Management’s judgment on valuation inputs is necessary when observable market data is not available, and in the selection of appropriate valuationmodels. Uncertainty in these estimates and judgments can affect fair value and financial results recorded. During the quarter, changes in the fair value offinancial instruments generally arose from normal economic, industry and market conditions.
Many financial instruments are traded products such as derivatives, and are generally transacted under industry standard International Swaps andDerivatives Association (ISDA) master netting agreements with counterparties, which allow for a single net settlement of all transactions covered by thatagreement in the event of a default or early termination of the transactions. ISDA agreements are frequently accompanied by an ISDA Credit SupportAnnex (CSA), the terms of which may vary according to each party’s view of the other party’s creditworthiness. CSAs can require one party to post initialmargin at the onset of each transaction. CSAs also allow for variation margin to be called if total uncollateralized mark-to-market exposure exceeds anagreed upon threshold. Such variation margin provisions can be one-way (only one party will ever post collateral) or bi-lateral (either party may postdepending upon which party is in-the-money). The CSA will also detail the types of collateral that are acceptable to each party, and the haircuts that willbe applied against each collateral type. The terms of the ISDA master netting agreements and CSAs are taken into consideration in the calculation ofcounterparty credit risk exposure (see also page 73 of the Bank’s 2016 Annual Report).
Total derivative notional amounts were $4,244 billion as at July 31, 2017, compared to $4,059 billion as at April 30, 2017 and $3,895 billion as atOctober 31, 2016. The quarterly change was primarily due to an increase in volume of interest rate contracts partially offset by the impact of foreigncurrency translation. The total notional amount of over-the-counter derivatives was $3,996 billion (April 30, 2017 – $3,768 billion; October 31, 2016 –$3,666 billion), of which $2,496 billion were settled through central counterparties as at July 31, 2017 (April 30, 2017 – $2,185 billion; October 31, 2016– $2,110 billion). The credit equivalent amount, after taking master netting arrangements into account, was $32.5 billion, compared to $37.1 billion as atApril 30, 2017. The decrease was largely due to the impact of foreign currency translation and an overall decrease in volume.
Selected credit instrumentsA complete discussion of selected credit instruments which markets regarded as higher risk during the financial crisis was provided on page 46 of theBank’s 2016 Annual Report. The Bank’s net exposures have substantially remained unchanged from year end.
SecuritizationsIn February 2017, the Bank securitized $1,129 million of its Canadian auto loan receivables through Securitized Term Auto Receivables Trust 2017-1(START 2017-1), a Bank-sponsored structured entity that is consolidated. START 2017-1 issued multiple series of Class A notes to third-party investors andsubordinated notes to the Bank, and the proceeds of such issuances were used to purchase a discrete pool of Canadian auto loan receivables from theBank on a fully serviced basis. The sale of such pools did not qualify for derecognition and therefore the loan receivables continue to be recognized on theConsolidated Statement of Financial Position. Recourse of the noteholders is limited to the securitized loan receivables. The subordinated notes issued bySTART 2017-1 and held by the Bank of $69 million are eliminated upon consolidation.
Off-Balance Sheet ArrangementsIn the normal course of business, the Bank enters into contractual arrangements that are either consolidated or not required to be consolidated in itsfinancial statements, but could have a current or future impact on the Bank’s financial performance or financial condition. These arrangements can beclassified into the following categories: structured entities, securitizations and guarantees and other commitments.
No material contractual obligations were entered into this quarter by the Bank with the structured entities that are not in the ordinary course ofbusiness. Processes for review and approval of these contractual arrangements are unchanged from last year.
For a complete discussion of these types of arrangements, please refer to pages 42 to 44 of the Bank’s 2016 Annual Report.
Structured entitiesThe Bank sponsors two Canadian multi-seller conduits that are not consolidated. These multi-seller conduits purchase high-quality financial assets andfinance these assets through the issuance of highly rated commercial paper.
Although the Bank has power over the relevant activities of the conduits, it has limited exposure to variability in returns, which results in the Bank notconsolidating the two Canadian conduits.
A significant portion of the conduits’ assets have been structured to receive credit enhancements from the sellers, including overcollateralizationprotection and cash reserve accounts. Each asset purchased by the conduits is supported by a backstop liquidity facility provided by the Bank in the form ofa liquidity asset purchase agreement (LAPA). The primary purpose of the backstop liquidity facility is to provide an alternative source of financing in theevent the conduits are unable to access the commercial paper market. Under the terms of the LAPA, in most cases, the Bank is not obliged to purchasedefaulted assets.
The Bank’s primary exposure to the Canadian-based conduits is the liquidity support provided, with total liquidity facilities of $5.3 billion as at July 31,2017 (October 31, 2016 – $5.8 billion). As at July 31, 2017, total commercial paper outstanding for these conduits was $3.9 billion (October 31,2016 – $4.4 billion). Funded assets purchased and held by these conduits as at July 31, 2017, as reflected at original cost, were $3.9 billion (October 31,2016 – $4.4 billion). The fair value of these assets approximates original cost. There has been no significant change in the composition or risk profileof these conduits since October 31, 2016.
Other off-balance sheet arrangementsGuarantees and other indirect commitments increased by 3% from October 31, 2016. The increase was due to higher volumes of undrawn commitments,and commitments in relation to secured lending activities. Fees from guarantees and loan commitment arrangements recorded as credit fees in non-interest income – banking were $144 million for the three months ended July 31, 2017, compared to $142 million in the previous quarter and$146 million in the previous year.
Scotiabank Third Quarter Report 2017 31
MANAGEMENT’S DISCUSSION & ANALYSIS
Regulatory DevelopmentsThe Bank continues to respond to global regulatory developments, such as capital and liquidity requirements under the Basel Committee on BankingSupervision global standards (Basel III), over-the-counter derivatives reform, consumer protection measures and specific financial reforms. The Bankcontinues to monitor these and other developments and is working to ensure business impacts, if any, are minimized.
Bank Recapitalization Regime – Proposed Bail-in Regulations
On June 22, 2016, legislation came into force amending the Bank Act (Canada) (the “Bank Act”) and the Canada Deposit Insurance Corporation Act(Canada) (the “CDIC Act”) and certain other federal statutes pertaining to banks to create a bail-in regime for Canada’s domestically systemicallyimportant banks, which include the Bank. On June 17, 2017, the Government of Canada published in draft for public comment regulations under theCDIC Act and the Bank Act providing the final details of the conversion, issuance and compensation regimes for bail-in instruments issued by domesticsystemically important banks, including the Bank (collectively, the “Bail-In Regulations”). Pursuant to the CDIC Act, in circumstances where OSFI hasdetermined that the Bank has ceased, or is about to cease, to be viable, the Governor in Council may, upon a recommendation of the Minister of Financethat he or she is of the opinion that it is in the public interest to do so, grant an order directing CDIC to convert all or a portion of certain shares andliabilities of the Bank into common shares of the Bank (a “Bail-In Conversion”).
The Bail-In Regulations prescribe the types of shares and liabilities that will be subject to a Bail-In Conversion. In general, any senior debt with an initialor amended term to maturity (including explicit or embedded options) greater than 400 days, that is unsecured or partially secured and has been assigneda CUSIP or ISIN or similar identification number would be subject to a Bail-In Conversion. Shares, other than common shares, and subordinated debtwould also be subject to a Bail-In Conversion, unless they are non-viability contingent capital. Notwithstanding the above, assuming the draft Bail-InRegulations come into force in their current form, any shares and liabilities issued before the date the Bail-In Regulations come into force would not besubject to a Bail-In Conversion, unless, in the case of a liability the terms of such liability are, on or after that day, amended to increase its principal amountor to extend its term to maturity and the liability, as amended, meets the requirements to be subject to a Bail-In Conversion.
The draft Bank Recapitalization (Bail-in) Conversion Regulations and the Bank Recapitalization (Bail-in) Issuance Regulation provide that they will comeinto force 180 days after the regulations are finalized.
Over-The-Counter Derivatives Reform
Capital requirements for derivatives dealers are currently being considered by international regulators, and margin requirements for non-centrally clearedderivatives have been adopted in a number of jurisdictions, including Canada, Europe and the United States. In March 2015, the Basel Committee onBanking Supervision and the International Organization of Securities Commissions published a framework establishing minimum standards for marginrequirements for non-centrally cleared derivatives for financial firms and systemically important non-financial entities (“BCBS Framework”). OnFebruary 29, 2016, the Office of the Superintendent of Financial Institutions (“OSFI”) issued the final version of Guideline E-22 to implement the BCBSFramework for federally regulated financial institutions. The Guideline is effective September 1, 2016 with compliance to be phased in over the next fouryears in accordance with the BCBS Framework, and the margin requirements are designed to be coordinated with the rules established in the U.S., theEuropean Union and other relevant jurisdictions with respect to cross-border activities. Margin rules require the exchange of variation margin and initialmargin, both of which are designed to secure performance of non-centrally cleared derivatives transactions between covered entities. The Bank becamesubject to variation margin rules beginning March 1, 2017 and initial margin rules beginning no earlier than September 1, 2018 and no later thanSeptember 1, 2019. In February 2017, various regulatory authorities including the Board of Governors of the Federal Reserve System, the CFTC, theEuropean Supervisory Authorities and OSFI issued guidance concerning the implementation of their variation margin rules, affirming the importance oftimely effectiveness while recognizing the operational challenges of achieving market-wide participation, especially with respect to smaller counterpartyrelationships. On April 4, 2017, the CSA published proposed National Instrument 93-101: Derivatives: Business Conduct Rules. The proposed rules imposea business conduct standard on derivatives dealers and derivatives advisers when transacting in OTC derivatives with derivatives parties. The Bank iscontinuing with its efforts to meet all obligations imposed by the variation margin rules in accordance with the guidance received from OSFI and otherrelevant supervisory authorities.
Automatic Exchange of Information – Organisation for Economic Co-operation and Development (OECD)
Under the initiative of the OECD, many countries have committed to automatic exchange of information relating to accounts held by tax residents ofsignatory countries, using a Common Reporting Standard (CRS). Canada’s automatic exchange of financial account information arrangements withjurisdictions other than the U.S. has been implemented in accordance with the CRS and the implementation of the CRS legislation in Canada is effectiveJuly 1, 2017. The Bank will meet all obligations imposed under the CRS, in accordance with local law, in Canada and all applicable jurisdictions in which itoperates.
United Kingdom and European Regulatory Reform
On June 23, 2016, the United Kingdom (UK) held a referendum to decide on its membership in the European Union. The resulting vote was to leave theEuropean Union. A formal notice of the UK Government’s intention to withdraw was provided to the European Council on March 29, 2017, triggering atwo-year negotiation period during which the terms of the UK’s exit will be determined. Until those negotiations are concluded or the negotiation periodexpires, the UK will remain an EU Member State, subject to all EU legislation. There are a number of uncertainties in connection with the future of the UKand its relationship with the European Union, until the terms and timing of the UK’s exit from the European Union are clearer, it is difficult to determinethe potential longer term impact on the Bank. The UK’s exit from the European Union may result in significant changes in law, which may impact theBank’s business, financial condition and results of operations and could adversely impact the Bank’s cost of funding in Europe. The Bank continuallymonitors developments to prepare for changes that have the potential to impact its operations in the UK and elsewhere in Europe.
The Markets in Financial Instruments Directive II/Regulation (MiFID II/MiFIR) becomes effective January 2018 and will have a significant technologicaland procedural impact for certain of our businesses operating in the European Union as it relates to changes to pre- and post-trade transparency, marketstructure, transaction reporting, algorithmic trading, and conduct of business rules. Unlike the current MiFID regime, which applies primarily to equities,MiFID II/MiFIR will also extend to fixed income and “equity-like” products.
Regulatory developments relating to liquidity
The Net Stable Funding Ratio (NSFR) is expected to become a minimum standard in OSFI’s liquidity framework. The NSFR is aimed at reducing structuralfunding risk by requiring banks to fund their activities with sufficiently stable sources of funding. OSFI has extended the implementation timeline of theNSFR to January 2019.
32 Scotiabank Third Quarter Report 2017
MANAGEMENT’S DISCUSSION & ANALYSIS
Accounting Policies and Controls
Accounting policies and estimatesThe condensed interim consolidated financial statements have been prepared in accordance with IAS 34, Interim Financial Reporting, using InternationalFinancial Reporting Standards (IFRS) as issued by the International Accounting Standards Board (IASB). The significant accounting policies used in thepreparation of the condensed interim consolidated financial statements are consistent with those used in the Bank’s audited consolidated financialstatements for the year ended October 31, 2016. Note 3 of the Bank’s consolidated financial statements in the 2016 Annual Report describes the Bank’ssignificant accounting policies.
Future accounting developmentsThere are no significant updates to the future accounting developments disclosed in Note 4 of the Bank’s audited consolidated financial statements in the2016 Annual Report, other than the issuance of IFRS 17.
IFRS 17 Insurance ContractsOn May 18, 2017, the IASB issued IFRS 17 Insurance Contracts, which provides a comprehensive principle-based framework for the measurement andpresentation of all insurance contracts. The new standard will replace IFRS 4 Insurance Contracts and requires insurance contracts to be measured usingcurrent fulfillment cash flows and for revenue to be recognized as the service is provided over the coverage period. The standard is effective for the Bankon November 1, 2021. The Bank is assessing the impact of adopting this new standard.
New regulatory developmentsIn March 2017 the Basel Committee on Banking Supervision (BCBS) issued the Pillar 3 disclosure requirements – consolidated and enhanced frameworkwhich builds on the revisions to the Pillar 3 disclosure published by the Committee in January 2015.
In March 2017, the BCBS also released its standard on the interim approach and transitional arrangements for the regulatory treatment of accountingprovisions. In the standard, the BCBS clarified that it will retain its current treatment of provisions under both Standardized Approach and AdvancedInternal Ratings Based frameworks during an interim period. Further, the BCBS allows local jurisdictions the option to choose whether to apply atransitional arrangement for the impact of IFRS 9 on regulatory capital. OSFI has publicly issued its draft Capital Adequacy Requirements guidance forconsultation which will take effect from November 1, 2017. The Bank will participate with Industry in a response to OSFI’s proposed changes.
In April 2017, OSFI issued a guideline indicating that all domestic systemically important banks are expected to implement the Revised Pillar 3 disclosurerequirements for the reporting period ending October 31, 2018. We are awaiting OSFI’s guideline on the implementation of the Pillar 3 disclosurerequirements – consolidated and enhanced framework.
Changes in internal control over financial reportingThere have been no changes in the Bank’s internal control over financial reporting during the three months ended July 31, 2017, that have materiallyaffected, or are reasonably likely to materially affect, the Bank’s internal control over financial reporting.
Related party transactionsThere were no changes to the Bank’s procedures and policies for related party transactions from those outlined in the Bank’s 2016 Annual Report. Alltransactions with related parties continued to be at market terms and conditions.
Economic OutlookSources of global growth are strengthening and diversifying, both within countries and across regions. This is causing a re-assessment of monetary policyprospects in a number of countries, with a shift in both tone and action from several major central banks as they prepare to follow the US Fed’s lead andbegin withdrawing exceptional stimulus measures. The Bank of Canada raised its overnight rate for the first time in nearly seven years in July 2017; theEuropean Central Bank (ECB) is likely to follow with a tightening in its policy stance. The Fed is expected to announce in September a shift in its balancesheet management to tighten financial conditions further. While there is, of course, the possibility of increased volatility as markets digest the implicationsof reduced central bank support, this shift in stance from central bankers is very good news: it signals that economic recovery is now, at long last, self-sustaining, and far less reliant on exceptional policy measures.
Other threats to the outlook are mixed. It now appears clear that the United States (U.S.) will seek to modernize NAFTA instead of completely replacingit. The U.S. is, however, now also considering other actions that could trigger trade wars. Economic risks are, meanwhile, diminishing as the increasinglybroad-based nature of activity in most advanced economies reduces the reliance on households and policy support to drive growth.
In Canada, GDP growth is now tracking toward 2.9% in 2017, roughly double the Bank of Canada’s estimate of Canada’s potential. If realized, thiswould be the highest annual growth rate since 2011’s 3.1% and it would make Canada one of the fastest-growing countries in the industrialized world.Some of this demand is likely being pulled ahead from future periods: we anticipate a marked deceleration to 1.9% next year.
As the U.S. economy heads into the eighth year of its third-longest expansion, the fundamentals for continued solid growth remain in place, thoughany slack in the economy is rapidly closing. No meaningful tax reform or expanded infrastructure spending is likely to be implemented over the next18 months, but a variety of material risks to the U.S. outlook have abated: the USD has weakened, bond yields are lower than expected earlier, financialconditions have materially eased, oil prices are lower than previously projected, and trade policy risks appear lower, thereby generating less drag thanexpected on investment.
In Latin America, while economic growth is projected to be higher next year, economic performance is likely to be affected by political uncertainty aslooming presidential elections in Mexico, Chile, Colombia, and Peru are all likely to weigh on growth, while investor support for Brazil will be intimatelytied to the fate of the current government’s reform program.
In the Eurozone, survey indicators are extremely strong: they imply that GDP growth should continue to accelerate throughout 2017 to an annualaverage growth rate of 2.2%, twice the growth of potential output. In contrast, the outlook for the UK has softened since earlier in the year and theheadwinds to growth are expected to build as 2017 progresses.
The Chinese government will likely continue its sizeable fiscal injections to keep the economy’s growth trajectory in line with the official growth targetof “around 6.5%” in 2017; we expect output to expand by 6.7% this year and 6.3% in 2018.
Scotiabank Third Quarter Report 2017 33
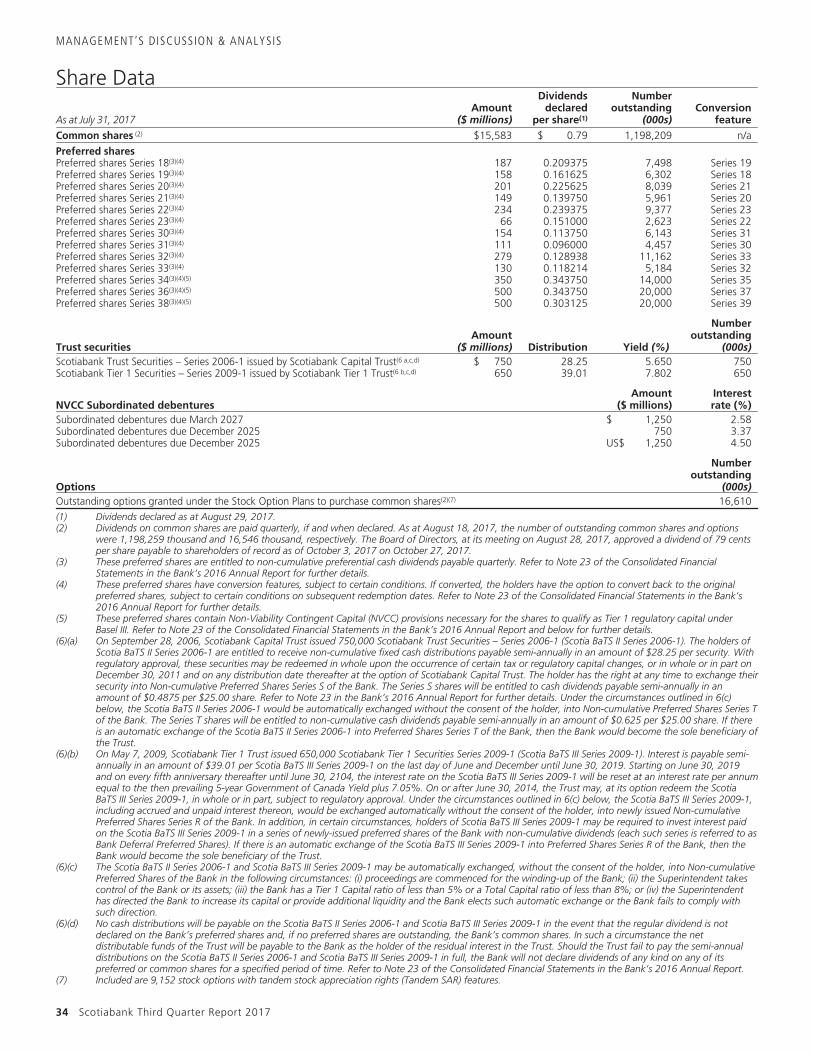
MANAGEMENT’S DISCUSSION & ANALYSIS
Share Data
As at July 31, 2017Amount
($ millions)
Dividendsdeclared
per share(1)
Numberoutstanding
(000s)Conversion
featureCommon shares (2) $15,583 $ 0.79 1,198,209 n/a
Preferred sharesPreferred shares Series 18(3)(4) 187 0.209375 7,498 Series 19Preferred shares Series 19(3)(4) 158 0.161625 6,302 Series 18Preferred shares Series 20(3)(4) 201 0.225625 8,039 Series 21Preferred shares Series 21(3)(4) 149 0.139750 5,961 Series 20Preferred shares Series 22(3)(4) 234 0.239375 9,377 Series 23Preferred shares Series 23(3)(4) 66 0.151000 2,623 Series 22Preferred shares Series 30(3)(4) 154 0.113750 6,143 Series 31Preferred shares Series 31(3)(4) 111 0.096000 4,457 Series 30Preferred shares Series 32(3)(4) 279 0.128938 11,162 Series 33Preferred shares Series 33(3)(4) 130 0.118214 5,184 Series 32Preferred shares Series 34(3)(4)(5) 350 0.343750 14,000 Series 35Preferred shares Series 36(3)(4)(5) 500 0.343750 20,000 Series 37Preferred shares Series 38(3)(4)(5) 500 0.303125 20,000 Series 39
Trust securitiesAmount
($ millions) Distribution Yield (%)
Numberoutstanding
(000s)Scotiabank Trust Securities – Series 2006-1 issued by Scotiabank Capital Trust(6 a,c,d) $ 750 28.25 5.650 750Scotiabank Tier 1 Securities – Series 2009-1 issued by Scotiabank Tier 1 Trust(6 b,c,d) 650 39.01 7.802 650
NVCC Subordinated debenturesAmount
($ millions)Interestrate (%)
Subordinated debentures due March 2027 $ 1,250 2.58Subordinated debentures due December 2025 750 3.37Subordinated debentures due December 2025 US$ 1,250 4.50
Options
Numberoutstanding
(000s)Outstanding options granted under the Stock Option Plans to purchase common shares(2)(7) 16,610(1) Dividends declared as at August 29, 2017.(2) Dividends on common shares are paid quarterly, if and when declared. As at August 18, 2017, the number of outstanding common shares and options
were 1,198,259 thousand and 16,546 thousand, respectively. The Board of Directors, at its meeting on August 28, 2017, approved a dividend of 79 centsper share payable to shareholders of record as of October 3, 2017 on October 27, 2017.
(3) These preferred shares are entitled to non-cumulative preferential cash dividends payable quarterly. Refer to Note 23 of the Consolidated FinancialStatements in the Bank’s 2016 Annual Report for further details.
(4) These preferred shares have conversion features, subject to certain conditions. If converted, the holders have the option to convert back to the originalpreferred shares, subject to certain conditions on subsequent redemption dates. Refer to Note 23 of the Consolidated Financial Statements in the Bank’s2016 Annual Report for further details.
(5) These preferred shares contain Non-Viability Contingent Capital (NVCC) provisions necessary for the shares to qualify as Tier 1 regulatory capital underBasel III. Refer to Note 23 of the Consolidated Financial Statements in the Bank’s 2016 Annual Report and below for further details.
(6)(a) On September 28, 2006, Scotiabank Capital Trust issued 750,000 Scotiabank Trust Securities – Series 2006-1 (Scotia BaTS II Series 2006-1). The holders ofScotia BaTS II Series 2006-1 are entitled to receive non-cumulative fixed cash distributions payable semi-annually in an amount of $28.25 per security. Withregulatory approval, these securities may be redeemed in whole upon the occurrence of certain tax or regulatory capital changes, or in whole or in part onDecember 30, 2011 and on any distribution date thereafter at the option of Scotiabank Capital Trust. The holder has the right at any time to exchange theirsecurity into Non-cumulative Preferred Shares Series S of the Bank. The Series S shares will be entitled to cash dividends payable semi-annually in anamount of $0.4875 per $25.00 share. Refer to Note 23 in the Bank’s 2016 Annual Report for further details. Under the circumstances outlined in 6(c)below, the Scotia BaTS II Series 2006-1 would be automatically exchanged without the consent of the holder, into Non-cumulative Preferred Shares Series Tof the Bank. The Series T shares will be entitled to non-cumulative cash dividends payable semi-annually in an amount of $0.625 per $25.00 share. If thereis an automatic exchange of the Scotia BaTS II Series 2006-1 into Preferred Shares Series T of the Bank, then the Bank would become the sole beneficiary ofthe Trust.
(6)(b) On May 7, 2009, Scotiabank Tier 1 Trust issued 650,000 Scotiabank Tier 1 Securities Series 2009-1 (Scotia BaTS III Series 2009-1). Interest is payable semi-annually in an amount of $39.01 per Scotia BaTS III Series 2009-1 on the last day of June and December until June 30, 2019. Starting on June 30, 2019and on every fifth anniversary thereafter until June 30, 2104, the interest rate on the Scotia BaTS III Series 2009-1 will be reset at an interest rate per annumequal to the then prevailing 5-year Government of Canada Yield plus 7.05%. On or after June 30, 2014, the Trust may, at its option redeem the ScotiaBaTS III Series 2009-1, in whole or in part, subject to regulatory approval. Under the circumstances outlined in 6(c) below, the Scotia BaTS III Series 2009-1,including accrued and unpaid interest thereon, would be exchanged automatically without the consent of the holder, into newly issued Non-cumulativePreferred Shares Series R of the Bank. In addition, in certain circumstances, holders of Scotia BaTS III Series 2009-1 may be required to invest interest paidon the Scotia BaTS III Series 2009-1 in a series of newly-issued preferred shares of the Bank with non-cumulative dividends (each such series is referred to asBank Deferral Preferred Shares). If there is an automatic exchange of the Scotia BaTS III Series 2009-1 into Preferred Shares Series R of the Bank, then theBank would become the sole beneficiary of the Trust.
(6)(c) The Scotia BaTS II Series 2006-1 and Scotia BaTS III Series 2009-1 may be automatically exchanged, without the consent of the holder, into Non-cumulativePreferred Shares of the Bank in the following circumstances: (i) proceedings are commenced for the winding-up of the Bank; (ii) the Superintendent takescontrol of the Bank or its assets; (iii) the Bank has a Tier 1 Capital ratio of less than 5% or a Total Capital ratio of less than 8%; or (iv) the Superintendenthas directed the Bank to increase its capital or provide additional liquidity and the Bank elects such automatic exchange or the Bank fails to comply withsuch direction.
(6)(d) No cash distributions will be payable on the Scotia BaTS II Series 2006-1 and Scotia BaTS III Series 2009-1 in the event that the regular dividend is notdeclared on the Bank’s preferred shares and, if no preferred shares are outstanding, the Bank’s common shares. In such a circumstance the netdistributable funds of the Trust will be payable to the Bank as the holder of the residual interest in the Trust. Should the Trust fail to pay the semi-annualdistributions on the Scotia BaTS II Series 2006-1 and Scotia BaTS III Series 2009-1 in full, the Bank will not declare dividends of any kind on any of itspreferred or common shares for a specified period of time. Refer to Note 23 of the Consolidated Financial Statements in the Bank’s 2016 Annual Report.
(7) Included are 9,152 stock options with tandem stock appreciation rights (Tandem SAR) features.
34 Scotiabank Third Quarter Report 2017
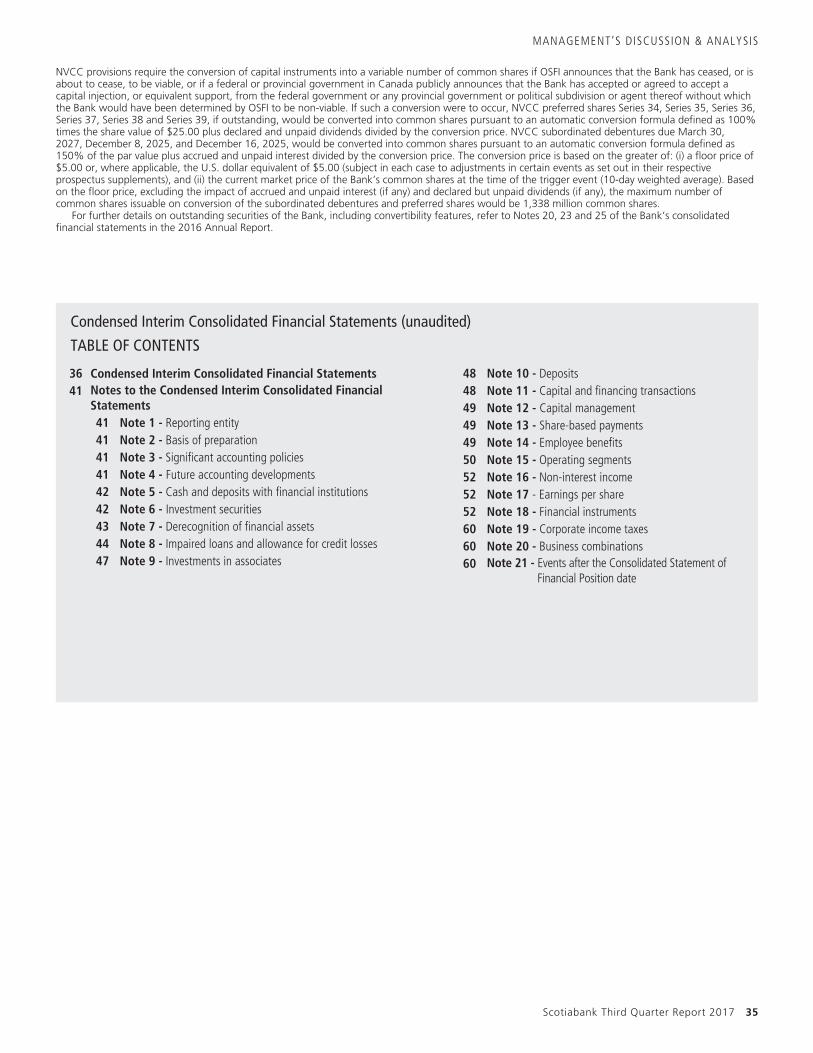
MANAGEMENT’S DISCUSSION & ANALYSIS
NVCC provisions require the conversion of capital instruments into a variable number of common shares if OSFI announces that the Bank has ceased, or isabout to cease, to be viable, or if a federal or provincial government in Canada publicly announces that the Bank has accepted or agreed to accept acapital injection, or equivalent support, from the federal government or any provincial government or political subdivision or agent thereof without whichthe Bank would have been determined by OSFI to be non-viable. If such a conversion were to occur, NVCC preferred shares Series 34, Series 35, Series 36,Series 37, Series 38 and Series 39, if outstanding, would be converted into common shares pursuant to an automatic conversion formula defined as 100%times the share value of $25.00 plus declared and unpaid dividends divided by the conversion price. NVCC subordinated debentures due March 30,2027, December 8, 2025, and December 16, 2025, would be converted into common shares pursuant to an automatic conversion formula defined as150% of the par value plus accrued and unpaid interest divided by the conversion price. The conversion price is based on the greater of: (i) a floor price of$5.00 or, where applicable, the U.S. dollar equivalent of $5.00 (subject in each case to adjustments in certain events as set out in their respectiveprospectus supplements), and (ii) the current market price of the Bank’s common shares at the time of the trigger event (10-day weighted average). Basedon the floor price, excluding the impact of accrued and unpaid interest (if any) and declared but unpaid dividends (if any), the maximum number ofcommon shares issuable on conversion of the subordinated debentures and preferred shares would be 1,338 million common shares.
For further details on outstanding securities of the Bank, including convertibility features, refer to Notes 20, 23 and 25 of the Bank’s consolidatedfinancial statements in the 2016 Annual Report.
Condensed Interim Consolidated Financial Statements (unaudited)
TABLE OF CONTENTS
36 Condensed Interim Consolidated Financial Statements41 Notes to the Condensed Interim Consolidated Financial
Statements41 Note 1 - Reporting entity41 Note 2 - Basis of preparation41 Note 3 - Significant accounting policies41 Note 4 - Future accounting developments42 Note 5 - Cash and deposits with financial institutions42 Note 6 - Investment securities43 Note 7 - Derecognition of financial assets44 Note 8 - Impaired loans and allowance for credit losses47 Note 9 - Investments in associates
48 Note 10 - Deposits48 Note 11 - Capital and financing transactions49 Note 12 - Capital management49 Note 13 - Share-based payments49 Note 14 - Employee benefits50 Note 15 - Operating segments52 Note 16 - Non-interest income52 Note 17 - Earnings per share52 Note 18 - Financial instruments60 Note 19 - Corporate income taxes60 Note 20 - Business combinations60 Note 21 - Events after the Consolidated Statement of
Financial Position date
Scotiabank Third Quarter Report 2017 35
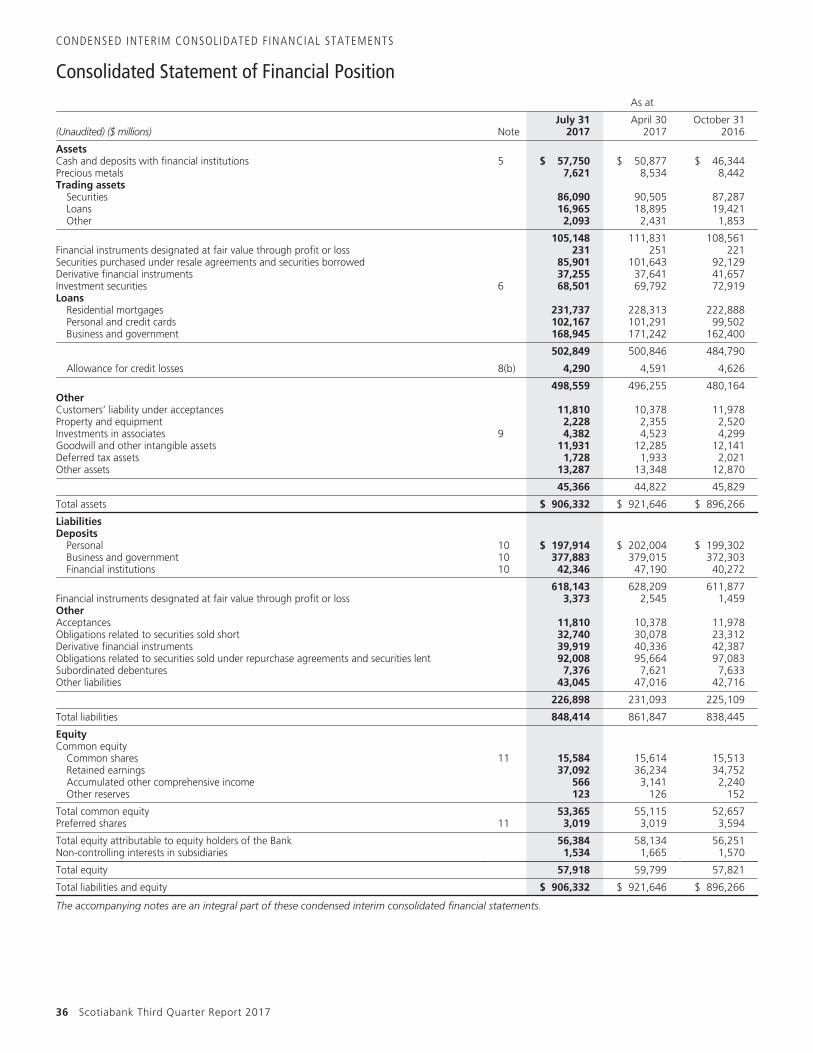
CONDENSED INTERIM CONSOLIDATED FINANCIAL STATEMENTS
Consolidated Statement of Financial PositionAs at
(Unaudited) ($ millions) NoteJuly 31
2017April 30
2017October 31
2016
AssetsCash and deposits with financial institutions 5 $ 57,750 $ 50,877 $ 46,344Precious metals 7,621 8,534 8,442Trading assets
Securities 86,090 90,505 87,287Loans 16,965 18,895 19,421Other 2,093 2,431 1,853
105,148 111,831 108,561Financial instruments designated at fair value through profit or loss 231 251 221Securities purchased under resale agreements and securities borrowed 85,901 101,643 92,129Derivative financial instruments 37,255 37,641 41,657Investment securities 6 68,501 69,792 72,919Loans
Residential mortgages 231,737 228,313 222,888Personal and credit cards 102,167 101,291 99,502Business and government 168,945 171,242 162,400
502,849 500,846 484,790
Allowance for credit losses 8(b) 4,290 4,591 4,626
498,559 496,255 480,164OtherCustomers’ liability under acceptances 11,810 10,378 11,978Property and equipment 2,228 2,355 2,520Investments in associates 9 4,382 4,523 4,299Goodwill and other intangible assets 11,931 12,285 12,141Deferred tax assets 1,728 1,933 2,021Other assets 13,287 13,348 12,870
45,366 44,822 45,829
Total assets $ 906,332 $ 921,646 $ 896,266
LiabilitiesDeposits
Personal 10 $ 197,914 $ 202,004 $ 199,302Business and government 10 377,883 379,015 372,303Financial institutions 10 42,346 47,190 40,272
618,143 628,209 611,877Financial instruments designated at fair value through profit or loss 3,373 2,545 1,459OtherAcceptances 11,810 10,378 11,978Obligations related to securities sold short 32,740 30,078 23,312Derivative financial instruments 39,919 40,336 42,387Obligations related to securities sold under repurchase agreements and securities lent 92,008 95,664 97,083Subordinated debentures 7,376 7,621 7,633Other liabilities 43,045 47,016 42,716
226,898 231,093 225,109
Total liabilities 848,414 861,847 838,445
EquityCommon equity
Common shares 11 15,584 15,614 15,513Retained earnings 37,092 36,234 34,752Accumulated other comprehensive income 566 3,141 2,240Other reserves 123 126 152
Total common equity 53,365 55,115 52,657Preferred shares 11 3,019 3,019 3,594
Total equity attributable to equity holders of the Bank 56,384 58,134 56,251Non-controlling interests in subsidiaries 1,534 1,665 1,570
Total equity 57,918 59,799 57,821
Total liabilities and equity $ 906,332 $ 921,646 $ 896,266
The accompanying notes are an integral part of these condensed interim consolidated financial statements.
36 Scotiabank Third Quarter Report 2017
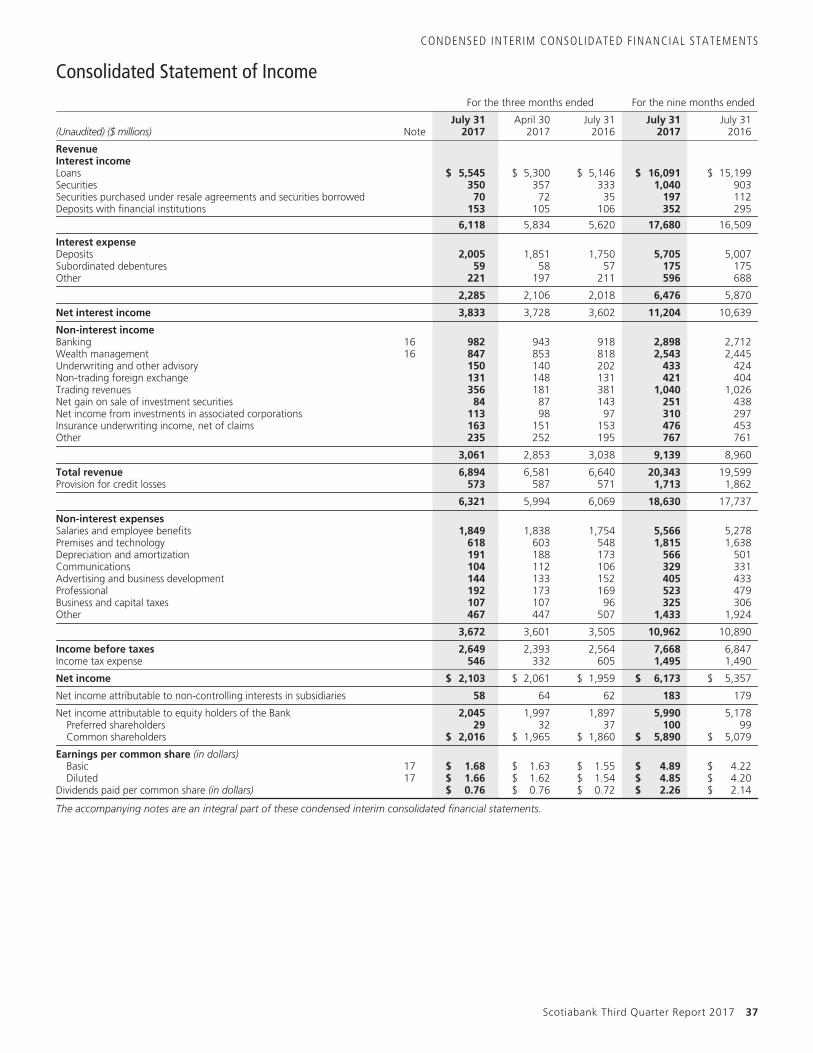
CONDENSED INTERIM CONSOLIDATED FINANCIAL STATEMENTS
Consolidated Statement of IncomeFor the three months ended For the nine months ended
(Unaudited) ($ millions) NoteJuly 31
2017April 30
2017July 31
2016July 31
2017July 31
2016
RevenueInterest incomeLoans $ 5,545 $ 5,300 $ 5,146 $ 16,091 $ 15,199Securities 350 357 333 1,040 903Securities purchased under resale agreements and securities borrowed 70 72 35 197 112Deposits with financial institutions 153 105 106 352 295
6,118 5,834 5,620 17,680 16,509
Interest expenseDeposits 2,005 1,851 1,750 5,705 5,007Subordinated debentures 59 58 57 175 175Other 221 197 211 596 688
2,285 2,106 2,018 6,476 5,870
Net interest income 3,833 3,728 3,602 11,204 10,639
Non-interest incomeBanking 16 982 943 918 2,898 2,712Wealth management 16 847 853 818 2,543 2,445Underwriting and other advisory 150 140 202 433 424Non-trading foreign exchange 131 148 131 421 404Trading revenues 356 181 381 1,040 1,026Net gain on sale of investment securities 84 87 143 251 438Net income from investments in associated corporations 113 98 97 310 297Insurance underwriting income, net of claims 163 151 153 476 453Other 235 252 195 767 761
3,061 2,853 3,038 9,139 8,960
Total revenue 6,894 6,581 6,640 20,343 19,599Provision for credit losses 573 587 571 1,713 1,862
6,321 5,994 6,069 18,630 17,737
Non-interest expensesSalaries and employee benefits 1,849 1,838 1,754 5,566 5,278Premises and technology 618 603 548 1,815 1,638Depreciation and amortization 191 188 173 566 501Communications 104 112 106 329 331Advertising and business development 144 133 152 405 433Professional 192 173 169 523 479Business and capital taxes 107 107 96 325 306Other 467 447 507 1,433 1,924
3,672 3,601 3,505 10,962 10,890
Income before taxes 2,649 2,393 2,564 7,668 6,847Income tax expense 546 332 605 1,495 1,490
Net income $ 2,103 $ 2,061 $ 1,959 $ 6,173 $ 5,357
Net income attributable to non-controlling interests in subsidiaries 58 64 62 183 179
Net income attributable to equity holders of the Bank 2,045 1,997 1,897 5,990 5,178Preferred shareholders 29 32 37 100 99Common shareholders $ 2,016 $ 1,965 $ 1,860 $ 5,890 $ 5,079
Earnings per common share (in dollars)Basic 17 $ 1.68 $ 1.63 $ 1.55 $ 4.89 $ 4.22Diluted 17 $ 1.66 $ 1.62 $ 1.54 $ 4.85 $ 4.20
Dividends paid per common share (in dollars) $ 0.76 $ 0.76 $ 0.72 $ 2.26 $ 2.14
The accompanying notes are an integral part of these condensed interim consolidated financial statements.
Scotiabank Third Quarter Report 2017 37
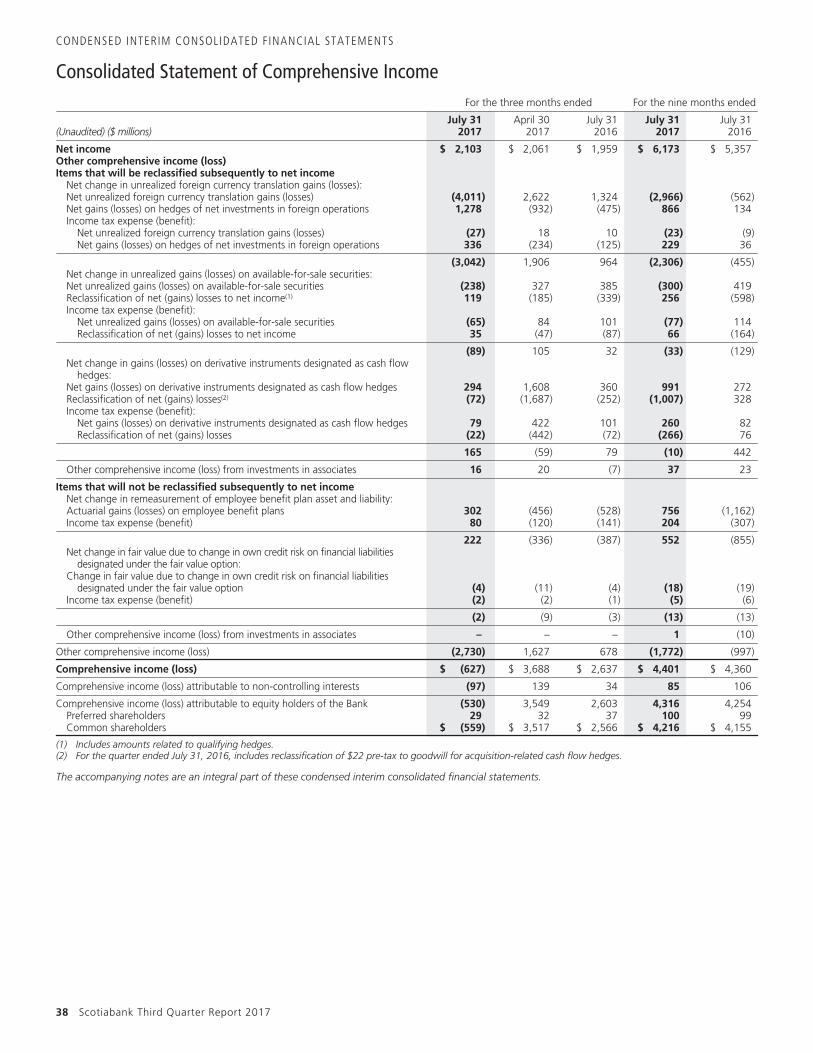
CONDENSED INTERIM CONSOLIDATED FINANCIAL STATEMENTS
Consolidated Statement of Comprehensive IncomeFor the three months ended For the nine months ended
(Unaudited) ($ millions)July 31
2017April 30
2017July 31
2016July 31
2017July 31
2016
Net income $ 2,103 $ 2,061 $ 1,959 $ 6,173 $ 5,357Other comprehensive income (loss)Items that will be reclassified subsequently to net income
Net change in unrealized foreign currency translation gains (losses):Net unrealized foreign currency translation gains (losses) (4,011) 2,622 1,324 (2,966) (562)Net gains (losses) on hedges of net investments in foreign operations 1,278 (932) (475) 866 134Income tax expense (benefit):
Net unrealized foreign currency translation gains (losses) (27) 18 10 (23) (9)Net gains (losses) on hedges of net investments in foreign operations 336 (234) (125) 229 36
(3,042) 1,906 964 (2,306) (455)Net change in unrealized gains (losses) on available-for-sale securities:Net unrealized gains (losses) on available-for-sale securities (238) 327 385 (300) 419Reclassification of net (gains) losses to net income(1) 119 (185) (339) 256 (598)Income tax expense (benefit):
Net unrealized gains (losses) on available-for-sale securities (65) 84 101 (77) 114Reclassification of net (gains) losses to net income 35 (47) (87) 66 (164)
(89) 105 32 (33) (129)Net change in gains (losses) on derivative instruments designated as cash flow
hedges:Net gains (losses) on derivative instruments designated as cash flow hedges 294 1,608 360 991 272Reclassification of net (gains) losses(2) (72) (1,687) (252) (1,007) 328Income tax expense (benefit):
Net gains (losses) on derivative instruments designated as cash flow hedges 79 422 101 260 82Reclassification of net (gains) losses (22) (442) (72) (266) 76
165 (59) 79 (10) 442
Other comprehensive income (loss) from investments in associates 16 20 (7) 37 23
Items that will not be reclassified subsequently to net incomeNet change in remeasurement of employee benefit plan asset and liability:Actuarial gains (losses) on employee benefit plans 302 (456) (528) 756 (1,162)Income tax expense (benefit) 80 (120) (141) 204 (307)
222 (336) (387) 552 (855)Net change in fair value due to change in own credit risk on financial liabilities
designated under the fair value option:Change in fair value due to change in own credit risk on financial liabilities
designated under the fair value option (4) (11) (4) (18) (19)Income tax expense (benefit) (2) (2) (1) (5) (6)
(2) (9) (3) (13) (13)
Other comprehensive income (loss) from investments in associates – – – 1 (10)
Other comprehensive income (loss) (2,730) 1,627 678 (1,772) (997)
Comprehensive income (loss) $ (627) $ 3,688 $ 2,637 $ 4,401 $ 4,360
Comprehensive income (loss) attributable to non-controlling interests (97) 139 34 85 106
Comprehensive income (loss) attributable to equity holders of the Bank (530) 3,549 2,603 4,316 4,254Preferred shareholders 29 32 37 100 99Common shareholders $ (559) $ 3,517 $ 2,566 $ 4,216 $ 4,155
(1) Includes amounts related to qualifying hedges.(2) For the quarter ended July 31, 2016, includes reclassification of $22 pre-tax to goodwill for acquisition-related cash flow hedges.
The accompanying notes are an integral part of these condensed interim consolidated financial statements.
38 Scotiabank Third Quarter Report 2017
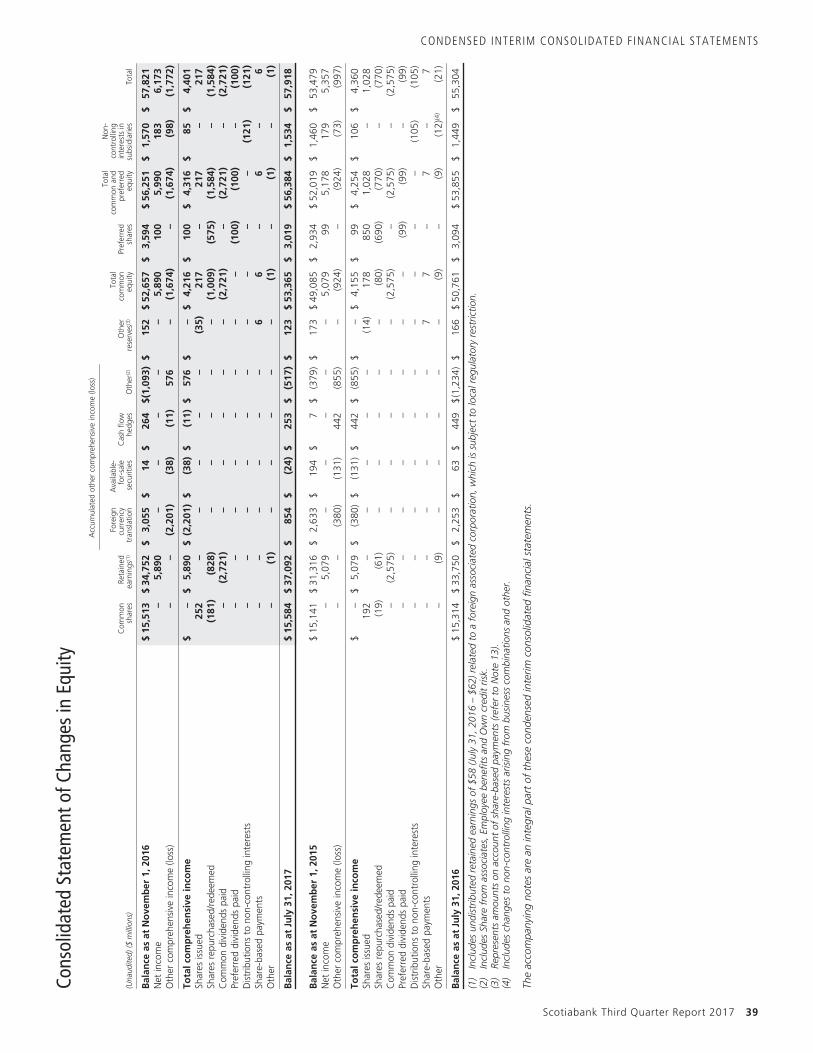
CONDENSED INTERIM CONSOLIDATED FINANCIAL STATEMENTS
Cons
olid
ated
Stat
emen
tofC
hang
esin
Equi
tyA
ccum
ulat
edot
her
com
preh
ensi
vein
com
e(lo
ss)
(Una
udite
d)($
mill
ions
)C
omm
onsh
ares
Reta
ined
earn
ings
(1)
Fore
ign
curr
ency
tran
slat
ion
Ava
ilabl
e-fo
r-sa
lese
curit
ies
Cas
hflo
whe
dges
Oth
er(2
)O
ther
rese
rves
(3)
Tota
lco
mm
oneq
uity
Pref
erre
dsh
ares
Tota
lco
mm
onan
dpr
efer
red
equi
ty
Non
-co
ntro
lling
inte
rest
sin
subs
idia
ries
Tota
l
Bala
nce
asat
Nov
embe
r1,
2016
$15
,513
$34
,752
$3,
055
$14
$26
4$(
1,09
3)$
152
$52
,657
$3,
594
$56
,251
$1,
570
$57
,821
Net
inco
me
–5,
890
––
––
–5,
890
100
5,99
018
36,
173
Oth
erco
mpr
ehen
sive
inco
me
(loss
)–
–(2
,201
)(3
8)(1
1)57
6–
(1,6
74)
–(1
,674
)(9
8)(1
,772
)
Tota
lcom
preh
ensi
vein
com
e$
–$
5,89
0$
(2,2
01)
$(3
8)$
(11)
$57
6$
–$
4,21
6$
100
$4,
316
$85
$4,
401
Shar
esis
sued
252
––
––
–(3
5)21
7–
217
–21
7Sh
ares
repu
rcha
sed/
rede
emed
(181
)(8
28)
––
––
–(1
,009
)(5
75)
(1,5
84)
–(1
,584
)C
omm
ondi
vide
nds
paid
–(2
,721
)–
––
––
(2,7
21)
–(2
,721
)–
(2,7
21)
Pref
erre
ddi
vide
nds
paid
––
––
––
––
(100
)(1
00)
–(1
00)
Dis
trib
utio
nsto
non-
cont
rolli
ngin
tere
sts
––
––
––
––
––
(121
)(1
21)
Shar
e-ba
sed
paym
ents
––
––
––
66
–6
–6
Oth
er–
(1)
––
––
–(1
)–
(1)
–(1
)
Bala
nce
asat
July
31,2
017
$15
,584
$37
,092
$85
4$
(24)
$25
3$
(517
)$
123
$53
,365
$3,
019
$56
,384
$1,
534
$57
,918
Bala
nce
asat
Nov
embe
r1,
2015
$15
,141
$31
,316
$2,
633
$19
4$
7$
(379
)$
173
$49
,085
$2,
934
$52
,019
$1,
460
$53
,479
Net
inco
me
–5,
079
––
––
–5,
079
995,
178
179
5,35
7O
ther
com
preh
ensi
vein
com
e(lo
ss)
––
(380
)(1
31)
442
(855
)–
(924
)–
(924
)(7
3)(9
97)
Tota
lcom
preh
ensi
vein
com
e$
–$
5,07
9$
(380
)$
(131
)$
442
$(8
55)
$–
$4,
155
$99
$4,
254
$10
6$
4,36
0Sh
ares
issu
ed19
2–
––
––
(14)
178
850
1,02
8–
1,02
8Sh
ares
repu
rcha
sed/
rede
emed
(19)
(61)
––
––
–(8
0)(6
90)
(770
)–
(770
)C
omm
ondi
vide
nds
paid
–(2
,575
)–
––
––
(2,5
75)
–(2
,575
)–
(2,5
75)
Pref
erre
ddi
vide
nds
paid
––
––
––
––
(99)
(99)
–(9
9)D
istr
ibut
ions
tono
n-co
ntro
lling
inte
rest
s–
––
––
––
––
–(1
05)
(105
)Sh
are-
base
dpa
ymen
ts–
––
––
–7
7–
7–
7O
ther
–(9
)–
––
––
(9)
–(9
)(1
2)(4
)(2
1)
Bala
nce
asat
July
31,2
016
$15
,314
$33
,750
$2,
253
$63
$44
9$
(1,2
34)
$16
6$
50,7
61$
3,09
4$
53,8
55$
1,44
9$
55,3
04
(1)
Incl
udes
undi
strib
uted
reta
ined
earn
ings
of$5
8(J
uly
31,2
016
–$6
2)re
late
dto
afo
reig
nas
soci
ated
corp
orat
ion,
whi
chis
subj
ect
tolo
calr
egul
ator
yre
stric
tion.
(2)
Incl
udes
Shar
efr
omas
soci
ates
,Em
ploy
eebe
nefit
san
dO
wn
cred
itris
k.(3
)Re
pres
ents
amou
nts
onac
coun
tof
shar
e-ba
sed
paym
ents
(ref
erto
Not
e13
).(4
)In
clud
esch
ange
sto
non-
cont
rolli
ngin
tere
sts
aris
ing
from
busi
ness
com
bina
tions
and
othe
r.
The
acco
mpa
nyin
gno
tes
are
anin
tegr
alpa
rtof
thes
eco
nden
sed
inte
rimco
nsol
idat
edfin
anci
alst
atem
ents
.
Scotiabank Third Quarter Report 2017 39
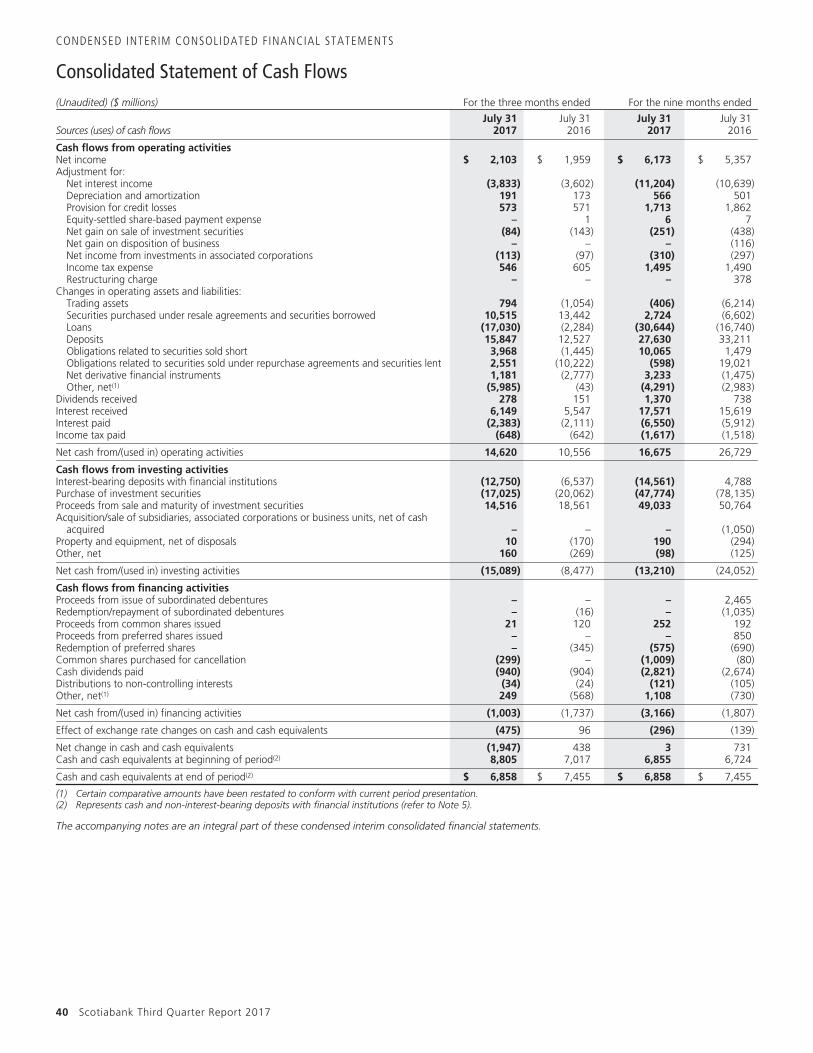
CONDENSED INTERIM CONSOLIDATED FINANCIAL STATEMENTS
Consolidated Statement of Cash Flows(Unaudited) ($ millions) For the three months ended For the nine months ended
Sources (uses) of cash flowsJuly 31
2017July 31
2016July 31
2017July 31
2016
Cash flows from operating activitiesNet income $ 2,103 $ 1,959 $ 6,173 $ 5,357Adjustment for:
Net interest income (3,833) (3,602) (11,204) (10,639)Depreciation and amortization 191 173 566 501Provision for credit losses 573 571 1,713 1,862Equity-settled share-based payment expense – 1 6 7Net gain on sale of investment securities (84) (143) (251) (438)Net gain on disposition of business – – – (116)Net income from investments in associated corporations (113) (97) (310) (297)Income tax expense 546 605 1,495 1,490Restructuring charge – – – 378
Changes in operating assets and liabilities:Trading assets 794 (1,054) (406) (6,214)Securities purchased under resale agreements and securities borrowed 10,515 13,442 2,724 (6,602)Loans (17,030) (2,284) (30,644) (16,740)Deposits 15,847 12,527 27,630 33,211Obligations related to securities sold short 3,968 (1,445) 10,065 1,479Obligations related to securities sold under repurchase agreements and securities lent 2,551 (10,222) (598) 19,021Net derivative financial instruments 1,181 (2,777) 3,233 (1,475)Other, net(1) (5,985) (43) (4,291) (2,983)
Dividends received 278 151 1,370 738Interest received 6,149 5,547 17,571 15,619Interest paid (2,383) (2,111) (6,550) (5,912)Income tax paid (648) (642) (1,617) (1,518)
Net cash from/(used in) operating activities 14,620 10,556 16,675 26,729
Cash flows from investing activitiesInterest-bearing deposits with financial institutions (12,750) (6,537) (14,561) 4,788Purchase of investment securities (17,025) (20,062) (47,774) (78,135)Proceeds from sale and maturity of investment securities 14,516 18,561 49,033 50,764Acquisition/sale of subsidiaries, associated corporations or business units, net of cash
acquired – – – (1,050)Property and equipment, net of disposals 10 (170) 190 (294)Other, net 160 (269) (98) (125)
Net cash from/(used in) investing activities (15,089) (8,477) (13,210) (24,052)
Cash flows from financing activitiesProceeds from issue of subordinated debentures – – – 2,465Redemption/repayment of subordinated debentures – (16) – (1,035)Proceeds from common shares issued 21 120 252 192Proceeds from preferred shares issued – – – 850Redemption of preferred shares – (345) (575) (690)Common shares purchased for cancellation (299) – (1,009) (80)Cash dividends paid (940) (904) (2,821) (2,674)Distributions to non-controlling interests (34) (24) (121) (105)Other, net(1) 249 (568) 1,108 (730)
Net cash from/(used in) financing activities (1,003) (1,737) (3,166) (1,807)
Effect of exchange rate changes on cash and cash equivalents (475) 96 (296) (139)
Net change in cash and cash equivalents (1,947) 438 3 731Cash and cash equivalents at beginning of period(2) 8,805 7,017 6,855 6,724
Cash and cash equivalents at end of period(2) $ 6,858 $ 7,455 $ 6,858 $ 7,455
(1) Certain comparative amounts have been restated to conform with current period presentation.(2) Represents cash and non-interest-bearing deposits with financial institutions (refer to Note 5).
The accompanying notes are an integral part of these condensed interim consolidated financial statements.
40 Scotiabank Third Quarter Report 2017
CONDENSED INTERIM CONSOLIDATED FINANCIAL STATEMENTS
Notes to the Condensed Interim Consolidated Financial Statements (Unaudited)
1. Reporting entityThe Bank of Nova Scotia (the Bank) is a chartered bank under the Bank Act (Canada) (the Bank Act). The Bank is a Schedule I Bank under the BankAct and is regulated by the Office of the Superintendent of Financial Institutions (OSFI). The Bank is a global financial services provider offering adiverse range of products and services, including personal, commercial, corporate and investment banking. The head office of the Bank is located at1709 Hollis Street, Halifax, Nova Scotia, Canada and its executive offices are at Scotia Plaza, 44 King Street West, Toronto, Canada. The commonshares of the Bank are listed on the Toronto Stock Exchange and the New York Stock Exchange.
2. Basis of preparation
Statement of complianceThese condensed interim consolidated financial statements of the Bank have been prepared in accordance with International Financial ReportingStandards (IFRS) as issued by the International Accounting Standards Board (IASB) and accounting requirements of OSFI in accordance withSection 308 of the Bank Act. Section 308 states that except as otherwise specified by OSFI, the financial statements are to be prepared in accordancewith IFRS.
These condensed interim consolidated financial statements were prepared in accordance with International Accounting Standard 34, Interim FinancialReporting (IAS 34) and do not include all of the information required for full annual financial statements. These condensed interim consolidatedfinancial statements should be read in conjunction with the Bank’s annual audited consolidated financial statements for the year ended October 31,2016.
The condensed interim consolidated financial statements for the quarter ended July 31, 2017 have been approved by the Board of Directors for issueon August 29, 2017.
Basis of measurementThe condensed interim consolidated financial statements have been prepared on the historical cost basis except for the following material items thatare measured at fair value in the Consolidated Statement of Financial Position:
• Financial assets and liabilities held-for-trading
• Financial assets and liabilities designated at fair value through profit or loss
• Derivative financial instruments
• Available-for-sale investment securities
Functional and presentation currency
These condensed interim consolidated financial statements are presented in Canadian dollars, which is the Bank’s functional currency. All financialinformation presented in Canadian dollars has been rounded to the nearest million unless otherwise stated.
Use of estimates and judgments
The preparation of financial statements, in conformity with IFRS, requires management to make estimates, apply judgments and make assumptionsthat affect the reported amount of assets and liabilities at the date of the condensed interim consolidated financial statements, and income andexpenses during the reporting period. Estimates made by management are based on historical experience and other assumptions that are believed tobe reasonable. Key areas where management has made difficult, complex or subjective judgments, often as a result of matters that are inherentlyuncertain, include those relating to the allowance for credit losses, the fair value of financial instruments (including derivatives), corporate incometaxes, employee benefits, the fair value of all identifiable assets and liabilities as a result of business combinations, impairment of investmentsecurities, impairment of non-financial assets and derecognition of financial assets and liabilities. While management makes its best estimates andassumptions, actual results could differ from these estimates and assumptions.
3. Significant accounting policiesThese condensed interim consolidated financial statements should be read in conjunction with the Bank’s audited consolidated financial statementsfor the year ended October 31, 2016. The significant accounting policies used in the preparation of these condensed interim consolidated financialstatements are consistent with those used in the Bank’s audited consolidated financial statements for the year ended October 31, 2016. Note 3 of theBank’s consolidated financial statements in the 2016 Annual Report describes the Bank’s significant accounting policies.
4. Future accounting developmentsThere are no significant updates to the future accounting developments disclosed in Note 4 of the Bank’s audited consolidated financial statements inthe 2016 Annual Report, other than the issuance of IFRS 17.
IFRS 17 Insurance Contracts
On May 18, 2017, the IASB issued IFRS 17 Insurance Contracts, which provides a comprehensive principle-based framework for the measurement andpresentation of all insurance contracts. The new standard will replace IFRS 4 Insurance Contracts and requires insurance contracts to be measuredusing current fulfillment cash flows and for revenue to be recognized as the service is provided over the coverage period. The standard is effective forthe Bank on November 1, 2021. The Bank is assessing the impact of adopting this new standard.
Scotiabank Third Quarter Report 2017 41
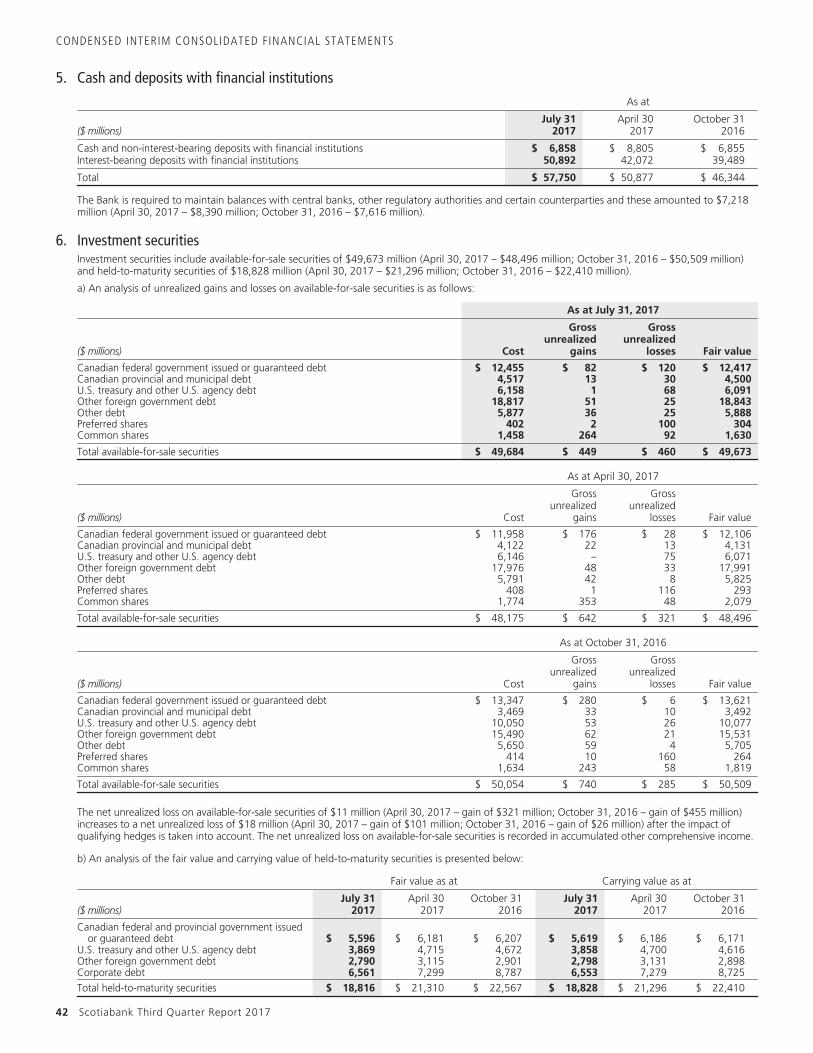
CONDENSED INTERIM CONSOLIDATED FINANCIAL STATEMENTS
5. Cash and deposits with financial institutionsAs at
($ millions)July 31
2017April 30
2017October 31
2016
Cash and non-interest-bearing deposits with financial institutions $ 6,858 $ 8,805 $ 6,855Interest-bearing deposits with financial institutions 50,892 42,072 39,489
Total $ 57,750 $ 50,877 $ 46,344
The Bank is required to maintain balances with central banks, other regulatory authorities and certain counterparties and these amounted to $7,218million (April 30, 2017 – $8,390 million; October 31, 2016 – $7,616 million).
6. Investment securitiesInvestment securities include available-for-sale securities of $49,673 million (April 30, 2017 – $48,496 million; October 31, 2016 – $50,509 million)and held-to-maturity securities of $18,828 million (April 30, 2017 – $21,296 million; October 31, 2016 – $22,410 million).
a) An analysis of unrealized gains and losses on available-for-sale securities is as follows:
As at July 31, 2017
($ millions) Cost
Grossunrealized
gains
Grossunrealized
losses Fair value
Canadian federal government issued or guaranteed debt $ 12,455 $ 82 $ 120 $ 12,417Canadian provincial and municipal debt 4,517 13 30 4,500U.S. treasury and other U.S. agency debt 6,158 1 68 6,091Other foreign government debt 18,817 51 25 18,843Other debt 5,877 36 25 5,888Preferred shares 402 2 100 304Common shares 1,458 264 92 1,630
Total available-for-sale securities $ 49,684 $ 449 $ 460 $ 49,673
As at April 30, 2017
($ millions) Cost
Grossunrealized
gains
Grossunrealized
losses Fair value
Canadian federal government issued or guaranteed debt $ 11,958 $ 176 $ 28 $ 12,106Canadian provincial and municipal debt 4,122 22 13 4,131U.S. treasury and other U.S. agency debt 6,146 – 75 6,071Other foreign government debt 17,976 48 33 17,991Other debt 5,791 42 8 5,825Preferred shares 408 1 116 293Common shares 1,774 353 48 2,079
Total available-for-sale securities $ 48,175 $ 642 $ 321 $ 48,496
As at October 31, 2016
($ millions) Cost
Grossunrealized
gains
Grossunrealized
losses Fair value
Canadian federal government issued or guaranteed debt $ 13,347 $ 280 $ 6 $ 13,621Canadian provincial and municipal debt 3,469 33 10 3,492U.S. treasury and other U.S. agency debt 10,050 53 26 10,077Other foreign government debt 15,490 62 21 15,531Other debt 5,650 59 4 5,705Preferred shares 414 10 160 264Common shares 1,634 243 58 1,819
Total available-for-sale securities $ 50,054 $ 740 $ 285 $ 50,509
The net unrealized loss on available-for-sale securities of $11 million (April 30, 2017 – gain of $321 million; October 31, 2016 – gain of $455 million)increases to a net unrealized loss of $18 million (April 30, 2017 – gain of $101 million; October 31, 2016 – gain of $26 million) after the impact ofqualifying hedges is taken into account. The net unrealized loss on available-for-sale securities is recorded in accumulated other comprehensive income.
b) An analysis of the fair value and carrying value of held-to-maturity securities is presented below:
Fair value as at Carrying value as at
($ millions)July 31
2017April 30
2017October 31
2016July 31
2017April 30
2017October 31
2016
Canadian federal and provincial government issuedor guaranteed debt $ 5,596 $ 6,181 $ 6,207 $ 5,619 $ 6,186 $ 6,171
U.S. treasury and other U.S. agency debt 3,869 4,715 4,672 3,858 4,700 4,616Other foreign government debt 2,790 3,115 2,901 2,798 3,131 2,898Corporate debt 6,561 7,299 8,787 6,553 7,279 8,725Total held-to-maturity securities $ 18,816 $ 21,310 $ 22,567 $ 18,828 $ 21,296 $ 22,410
42 Scotiabank Third Quarter Report 2017
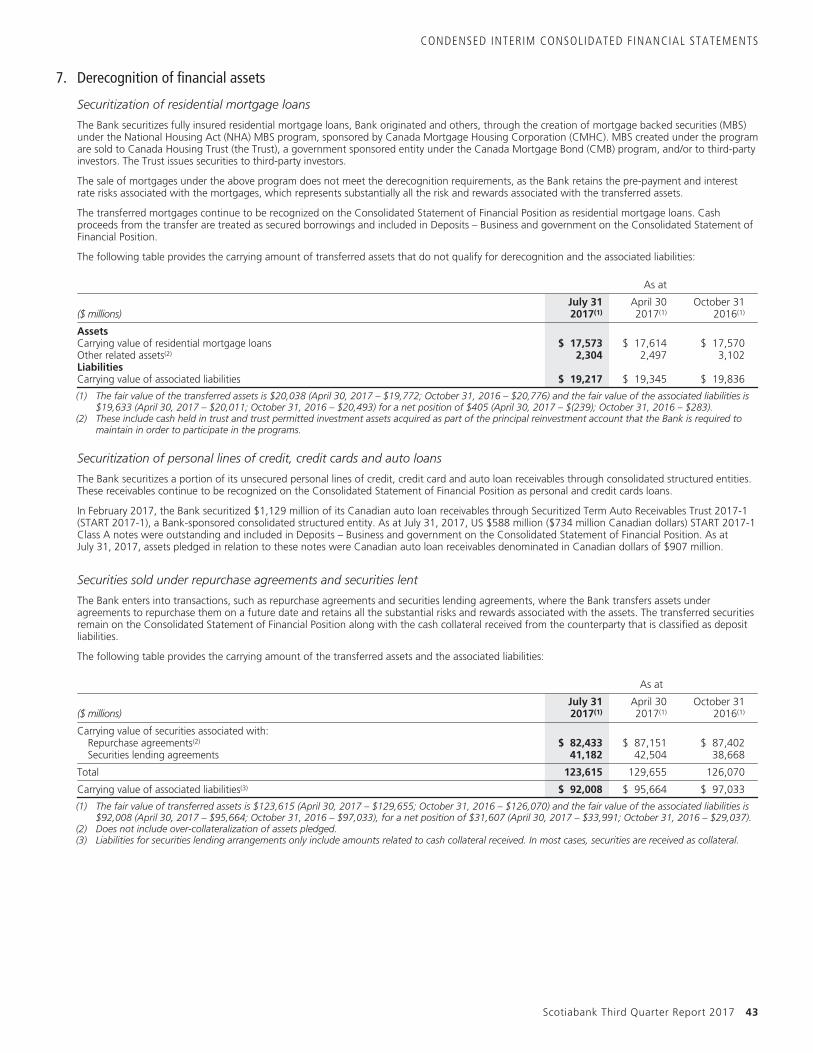
CONDENSED INTERIM CONSOLIDATED FINANCIAL STATEMENTS
7. Derecognition of financial assets
Securitization of residential mortgage loans
The Bank securitizes fully insured residential mortgage loans, Bank originated and others, through the creation of mortgage backed securities (MBS)under the National Housing Act (NHA) MBS program, sponsored by Canada Mortgage Housing Corporation (CMHC). MBS created under the programare sold to Canada Housing Trust (the Trust), a government sponsored entity under the Canada Mortgage Bond (CMB) program, and/or to third-partyinvestors. The Trust issues securities to third-party investors.
The sale of mortgages under the above program does not meet the derecognition requirements, as the Bank retains the pre-payment and interestrate risks associated with the mortgages, which represents substantially all the risk and rewards associated with the transferred assets.
The transferred mortgages continue to be recognized on the Consolidated Statement of Financial Position as residential mortgage loans. Cashproceeds from the transfer are treated as secured borrowings and included in Deposits – Business and government on the Consolidated Statement ofFinancial Position.
The following table provides the carrying amount of transferred assets that do not qualify for derecognition and the associated liabilities:
As at
($ millions)July 312017(1)
April 302017(1)
October 312016(1)
AssetsCarrying value of residential mortgage loans $ 17,573 $ 17,614 $ 17,570Other related assets(2) 2,304 2,497 3,102LiabilitiesCarrying value of associated liabilities $ 19,217 $ 19,345 $ 19,836
(1) The fair value of the transferred assets is $20,038 (April 30, 2017 – $19,772; October 31, 2016 – $20,776) and the fair value of the associated liabilities is$19,633 (April 30, 2017 – $20,011; October 31, 2016 – $20,493) for a net position of $405 (April 30, 2017 – $(239); October 31, 2016 – $283).
(2) These include cash held in trust and trust permitted investment assets acquired as part of the principal reinvestment account that the Bank is required tomaintain in order to participate in the programs.
Securitization of personal lines of credit, credit cards and auto loans
The Bank securitizes a portion of its unsecured personal lines of credit, credit card and auto loan receivables through consolidated structured entities.These receivables continue to be recognized on the Consolidated Statement of Financial Position as personal and credit cards loans.
In February 2017, the Bank securitized $1,129 million of its Canadian auto loan receivables through Securitized Term Auto Receivables Trust 2017-1(START 2017-1), a Bank-sponsored consolidated structured entity. As at July 31, 2017, US $588 million ($734 million Canadian dollars) START 2017-1Class A notes were outstanding and included in Deposits – Business and government on the Consolidated Statement of Financial Position. As atJuly 31, 2017, assets pledged in relation to these notes were Canadian auto loan receivables denominated in Canadian dollars of $907 million.
Securities sold under repurchase agreements and securities lent
The Bank enters into transactions, such as repurchase agreements and securities lending agreements, where the Bank transfers assets underagreements to repurchase them on a future date and retains all the substantial risks and rewards associated with the assets. The transferred securitiesremain on the Consolidated Statement of Financial Position along with the cash collateral received from the counterparty that is classified as depositliabilities.
The following table provides the carrying amount of the transferred assets and the associated liabilities:
As at
($ millions)July 312017(1)
April 302017(1)
October 312016(1)
Carrying value of securities associated with:Repurchase agreements(2) $ 82,433 $ 87,151 $ 87,402Securities lending agreements 41,182 42,504 38,668
Total 123,615 129,655 126,070
Carrying value of associated liabilities(3) $ 92,008 $ 95,664 $ 97,033
(1) The fair value of transferred assets is $123,615 (April 30, 2017 – $129,655; October 31, 2016 – $126,070) and the fair value of the associated liabilities is$92,008 (April 30, 2017 – $95,664; October 31, 2016 – $97,033), for a net position of $31,607 (April 30, 2017 – $33,991; October 31, 2016 – $29,037).
(2) Does not include over-collateralization of assets pledged.(3) Liabilities for securities lending arrangements only include amounts related to cash collateral received. In most cases, securities are received as collateral.
Scotiabank Third Quarter Report 2017 43
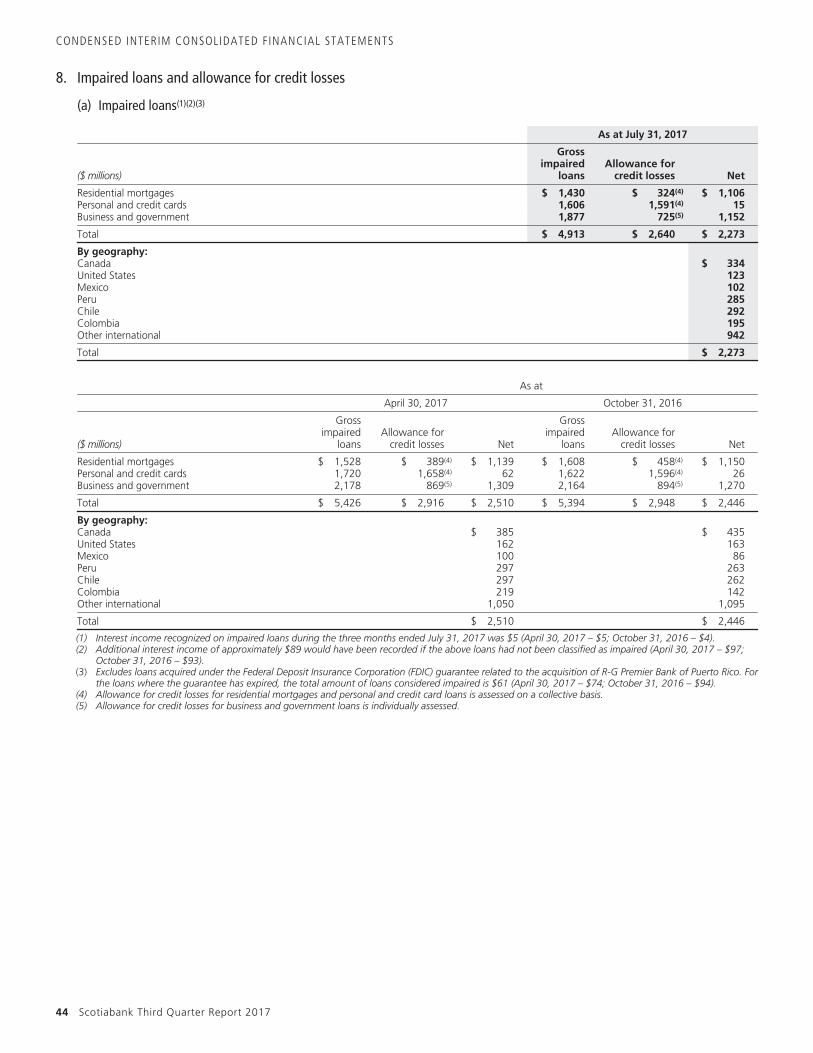
CONDENSED INTERIM CONSOLIDATED FINANCIAL STATEMENTS
8. Impaired loans and allowance for credit losses
(a) Impaired loans(1)(2)(3)
As at July 31, 2017
($ millions)
Grossimpaired
loansAllowance for
credit losses Net
Residential mortgages $ 1,430 $ 324(4) $ 1,106Personal and credit cards 1,606 1,591(4) 15Business and government 1,877 725(5) 1,152
Total $ 4,913 $ 2,640 $ 2,273
By geography:Canada $ 334United States 123Mexico 102Peru 285Chile 292Colombia 195Other international 942
Total $ 2,273
As at
April 30, 2017 October 31, 2016
($ millions)
Grossimpaired
loansAllowance for
credit losses Net
Grossimpaired
loansAllowance for
credit losses Net
Residential mortgages $ 1,528 $ 389(4) $ 1,139 $ 1,608 $ 458(4) $ 1,150Personal and credit cards 1,720 1,658(4) 62 1,622 1,596(4) 26Business and government 2,178 869(5) 1,309 2,164 894(5) 1,270
Total $ 5,426 $ 2,916 $ 2,510 $ 5,394 $ 2,948 $ 2,446
By geography:Canada $ 385 $ 435United States 162 163Mexico 100 86Peru 297 263Chile 297 262Colombia 219 142Other international 1,050 1,095
Total $ 2,510 $ 2,446
(1) Interest income recognized on impaired loans during the three months ended July 31, 2017 was $5 (April 30, 2017 – $5; October 31, 2016 – $4).(2) Additional interest income of approximately $89 would have been recorded if the above loans had not been classified as impaired (April 30, 2017 – $97;
October 31, 2016 – $93).(3) Excludes loans acquired under the Federal Deposit Insurance Corporation (FDIC) guarantee related to the acquisition of R-G Premier Bank of Puerto Rico. For
the loans where the guarantee has expired, the total amount of loans considered impaired is $61 (April 30, 2017 – $74; October 31, 2016 – $94).(4) Allowance for credit losses for residential mortgages and personal and credit card loans is assessed on a collective basis.(5) Allowance for credit losses for business and government loans is individually assessed.
44 Scotiabank Third Quarter Report 2017
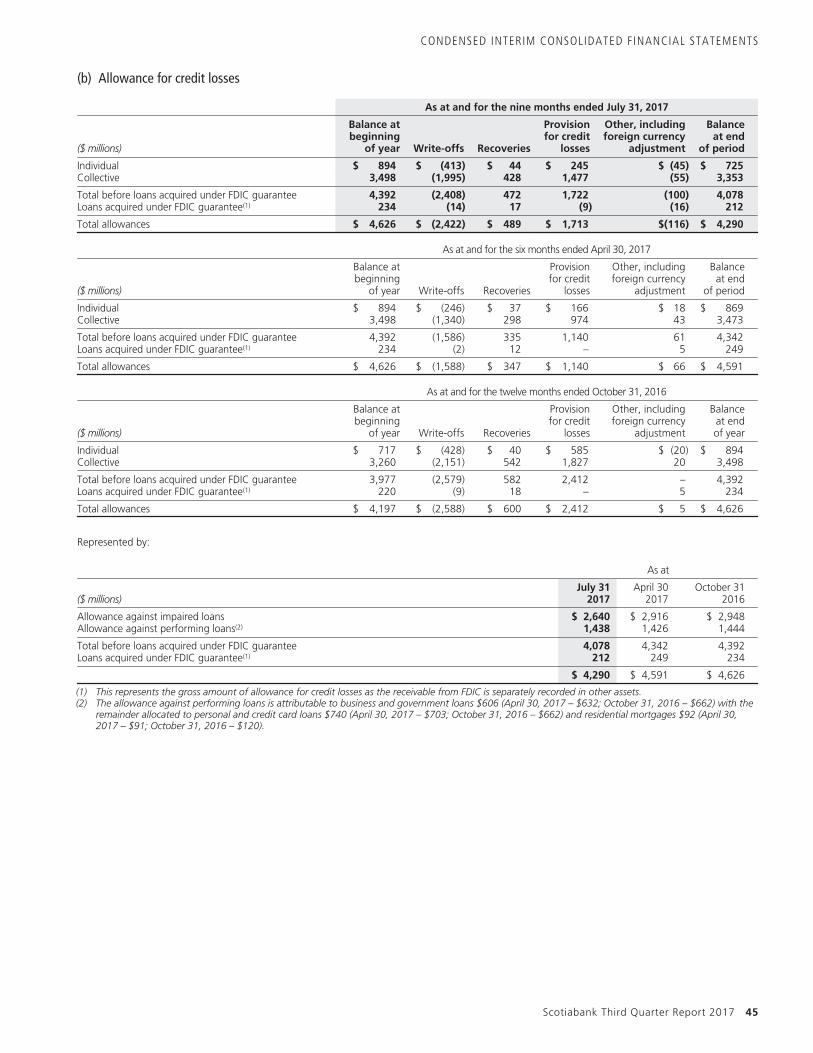
CONDENSED INTERIM CONSOLIDATED FINANCIAL STATEMENTS
(b) Allowance for credit losses
As at and for the nine months ended July 31, 2017
($ millions)
Balance atbeginning
of year Write-offs Recoveries
Provisionfor credit
losses
Other, includingforeign currency
adjustment
Balanceat end
of period
Individual $ 894 $ (413) $ 44 $ 245 $ (45) $ 725Collective 3,498 (1,995) 428 1,477 (55) 3,353
Total before loans acquired under FDIC guarantee 4,392 (2,408) 472 1,722 (100) 4,078Loans acquired under FDIC guarantee(1) 234 (14) 17 (9) (16) 212
Total allowances $ 4,626 $ (2,422) $ 489 $ 1,713 $(116) $ 4,290
As at and for the six months ended April 30, 2017
($ millions)
Balance atbeginning
of year Write-offs Recoveries
Provisionfor credit
losses
Other, includingforeign currency
adjustment
Balanceat end
of period
Individual $ 894 $ (246) $ 37 $ 166 $ 18 $ 869Collective 3,498 (1,340) 298 974 43 3,473
Total before loans acquired under FDIC guarantee 4,392 (1,586) 335 1,140 61 4,342Loans acquired under FDIC guarantee(1) 234 (2) 12 – 5 249
Total allowances $ 4,626 $ (1,588) $ 347 $ 1,140 $ 66 $ 4,591
As at and for the twelve months ended October 31, 2016
($ millions)
Balance atbeginning
of year Write-offs Recoveries
Provisionfor credit
losses
Other, includingforeign currency
adjustment
Balanceat endof year
Individual $ 717 $ (428) $ 40 $ 585 $ (20) $ 894Collective 3,260 (2,151) 542 1,827 20 3,498
Total before loans acquired under FDIC guarantee 3,977 (2,579) 582 2,412 – 4,392Loans acquired under FDIC guarantee(1) 220 (9) 18 – 5 234
Total allowances $ 4,197 $ (2,588) $ 600 $ 2,412 $ 5 $ 4,626
Represented by:
As at
($ millions)July 31
2017April 30
2017October 31
2016
Allowance against impaired loans $ 2,640 $ 2,916 $ 2,948Allowance against performing loans(2) 1,438 1,426 1,444
Total before loans acquired under FDIC guarantee 4,078 4,342 4,392Loans acquired under FDIC guarantee(1) 212 249 234
$ 4,290 $ 4,591 $ 4,626
(1) This represents the gross amount of allowance for credit losses as the receivable from FDIC is separately recorded in other assets.(2) The allowance against performing loans is attributable to business and government loans $606 (April 30, 2017 – $632; October 31, 2016 – $662) with the
remainder allocated to personal and credit card loans $740 (April 30, 2017 – $703; October 31, 2016 – $662) and residential mortgages $92 (April 30,2017 – $91; October 31, 2016 – $120).
Scotiabank Third Quarter Report 2017 45
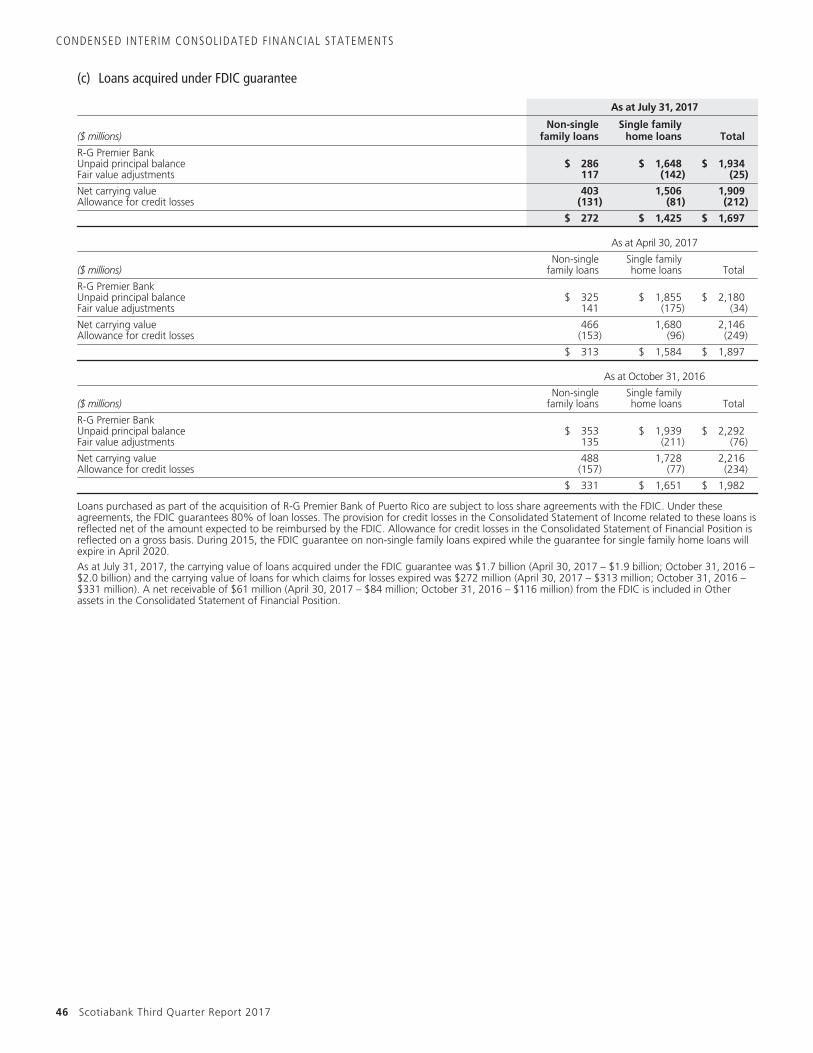
CONDENSED INTERIM CONSOLIDATED FINANCIAL STATEMENTS
(c) Loans acquired under FDIC guarantee
As at July 31, 2017
($ millions)Non-single
family loansSingle family
home loans Total
R-G Premier BankUnpaid principal balance $ 286 $ 1,648 $ 1,934Fair value adjustments 117 (142) (25)
Net carrying value 403 1,506 1,909Allowance for credit losses (131) (81) (212)
$ 272 $ 1,425 $ 1,697
As at April 30, 2017
($ millions)Non-single
family loansSingle familyhome loans Total
R-G Premier BankUnpaid principal balance $ 325 $ 1,855 $ 2,180Fair value adjustments 141 (175) (34)
Net carrying value 466 1,680 2,146Allowance for credit losses (153) (96) (249)
$ 313 $ 1,584 $ 1,897
As at October 31, 2016
($ millions)Non-single
family loansSingle familyhome loans Total
R-G Premier BankUnpaid principal balance $ 353 $ 1,939 $ 2,292Fair value adjustments 135 (211) (76)
Net carrying value 488 1,728 2,216Allowance for credit losses (157) (77) (234)
$ 331 $ 1,651 $ 1,982
Loans purchased as part of the acquisition of R-G Premier Bank of Puerto Rico are subject to loss share agreements with the FDIC. Under theseagreements, the FDIC guarantees 80% of loan losses. The provision for credit losses in the Consolidated Statement of Income related to these loans isreflected net of the amount expected to be reimbursed by the FDIC. Allowance for credit losses in the Consolidated Statement of Financial Position isreflected on a gross basis. During 2015, the FDIC guarantee on non-single family loans expired while the guarantee for single family home loans willexpire in April 2020.As at July 31, 2017, the carrying value of loans acquired under the FDIC guarantee was $1.7 billion (April 30, 2017 – $1.9 billion; October 31, 2016 –$2.0 billion) and the carrying value of loans for which claims for losses expired was $272 million (April 30, 2017 – $313 million; October 31, 2016 –$331 million). A net receivable of $61 million (April 30, 2017 – $84 million; October 31, 2016 – $116 million) from the FDIC is included in Otherassets in the Consolidated Statement of Financial Position.
46 Scotiabank Third Quarter Report 2017
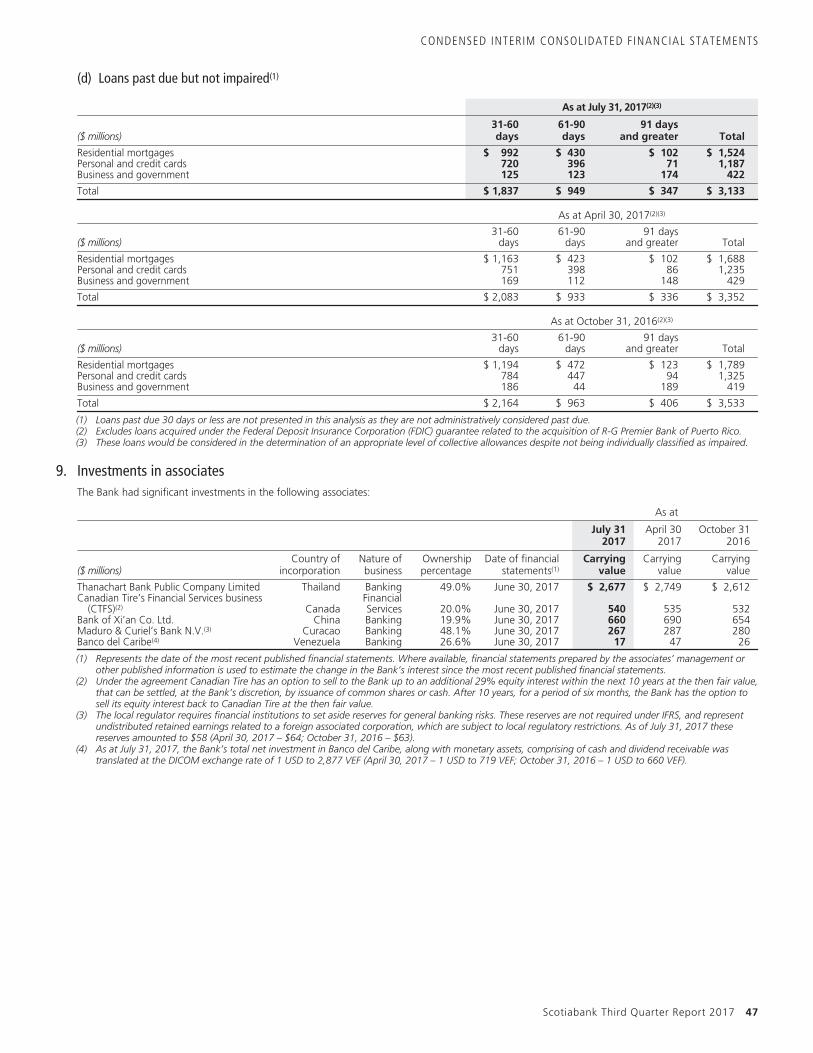
CONDENSED INTERIM CONSOLIDATED FINANCIAL STATEMENTS
(d) Loans past due but not impaired(1)
As at July 31, 2017(2)(3)
($ millions)31-60days
61-90days
91 daysand greater Total
Residential mortgages $ 992 $ 430 $ 102 $ 1,524Personal and credit cards 720 396 71 1,187Business and government 125 123 174 422
Total $ 1,837 $ 949 $ 347 $ 3,133
As at April 30, 2017(2)(3)
($ millions)31-60
days61-90
days91 days
and greater Total
Residential mortgages $ 1,163 $ 423 $ 102 $ 1,688Personal and credit cards 751 398 86 1,235Business and government 169 112 148 429
Total $ 2,083 $ 933 $ 336 $ 3,352
As at October 31, 2016(2)(3)
($ millions)31-60
days61-90
days91 days
and greater Total
Residential mortgages $ 1,194 $ 472 $ 123 $ 1,789Personal and credit cards 784 447 94 1,325Business and government 186 44 189 419
Total $ 2,164 $ 963 $ 406 $ 3,533
(1) Loans past due 30 days or less are not presented in this analysis as they are not administratively considered past due.(2) Excludes loans acquired under the Federal Deposit Insurance Corporation (FDIC) guarantee related to the acquisition of R-G Premier Bank of Puerto Rico.(3) These loans would be considered in the determination of an appropriate level of collective allowances despite not being individually classified as impaired.
9. Investments in associatesThe Bank had significant investments in the following associates:
As at
July 312017
April 302017
October 312016
($ millions)Country of
incorporationNature ofbusiness
Ownershippercentage
Date of financialstatements(1)
Carryingvalue
Carryingvalue
Carryingvalue
Thanachart Bank Public Company Limited Thailand Banking 49.0% June 30, 2017 $ 2,677 $ 2,749 $ 2,612Canadian Tire’s Financial Services business
(CTFS)(2) CanadaFinancialServices 20.0% June 30, 2017 540 535 532
Bank of Xi’an Co. Ltd. China Banking 19.9% June 30, 2017 660 690 654Maduro & Curiel’s Bank N.V.(3) Curacao Banking 48.1% June 30, 2017 267 287 280Banco del Caribe(4) Venezuela Banking 26.6% June 30, 2017 17 47 26
(1) Represents the date of the most recent published financial statements. Where available, financial statements prepared by the associates’ management orother published information is used to estimate the change in the Bank’s interest since the most recent published financial statements.
(2) Under the agreement Canadian Tire has an option to sell to the Bank up to an additional 29% equity interest within the next 10 years at the then fair value,that can be settled, at the Bank’s discretion, by issuance of common shares or cash. After 10 years, for a period of six months, the Bank has the option tosell its equity interest back to Canadian Tire at the then fair value.
(3) The local regulator requires financial institutions to set aside reserves for general banking risks. These reserves are not required under IFRS, and representundistributed retained earnings related to a foreign associated corporation, which are subject to local regulatory restrictions. As of July 31, 2017 thesereserves amounted to $58 (April 30, 2017 – $64; October 31, 2016 – $63).
(4) As at July 31, 2017, the Bank’s total net investment in Banco del Caribe, along with monetary assets, comprising of cash and dividend receivable wastranslated at the DICOM exchange rate of 1 USD to 2,877 VEF (April 30, 2017 – 1 USD to 719 VEF; October 31, 2016 – 1 USD to 660 VEF).
Scotiabank Third Quarter Report 2017 47
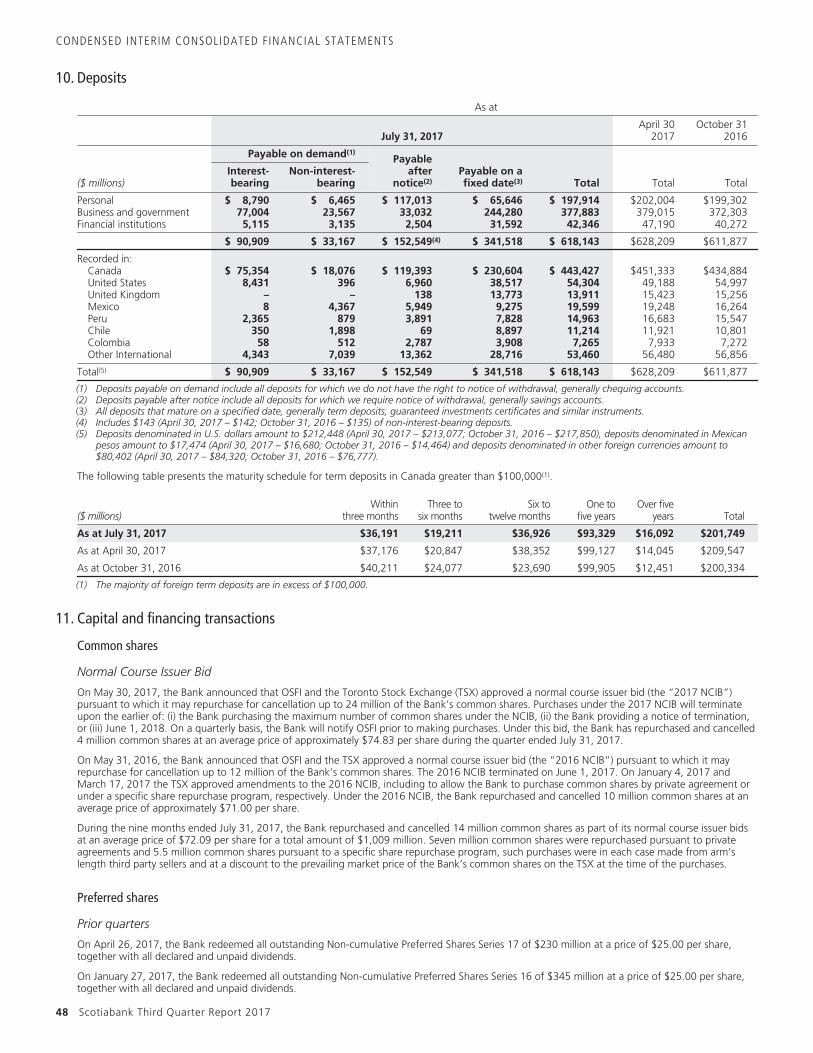
CONDENSED INTERIM CONSOLIDATED FINANCIAL STATEMENTS
10. Deposits
As at
July 31, 2017April 30
2017October 31
2016
Payable on demand(1)Payable
afternotice(2)
Payable on afixed date(3) Total($ millions)
Interest-bearing
Non-interest-bearing Total Total
Personal $ 8,790 $ 6,465 $ 117,013 $ 65,646 $ 197,914 $202,004 $199,302Business and government 77,004 23,567 33,032 244,280 377,883 379,015 372,303Financial institutions 5,115 3,135 2,504 31,592 42,346 47,190 40,272
$ 90,909 $ 33,167 $ 152,549(4) $ 341,518 $ 618,143 $628,209 $611,877
Recorded in:Canada $ 75,354 $ 18,076 $ 119,393 $ 230,604 $ 443,427 $451,333 $434,884United States 8,431 396 6,960 38,517 54,304 49,188 54,997United Kingdom – – 138 13,773 13,911 15,423 15,256Mexico 8 4,367 5,949 9,275 19,599 19,248 16,264Peru 2,365 879 3,891 7,828 14,963 16,683 15,547Chile 350 1,898 69 8,897 11,214 11,921 10,801Colombia 58 512 2,787 3,908 7,265 7,933 7,272Other International 4,343 7,039 13,362 28,716 53,460 56,480 56,856
Total(5) $ 90,909 $ 33,167 $ 152,549 $ 341,518 $ 618,143 $628,209 $611,877
(1) Deposits payable on demand include all deposits for which we do not have the right to notice of withdrawal, generally chequing accounts.(2) Deposits payable after notice include all deposits for which we require notice of withdrawal, generally savings accounts.(3) All deposits that mature on a specified date, generally term deposits, guaranteed investments certificates and similar instruments.(4) Includes $143 (April 30, 2017 – $142; October 31, 2016 – $135) of non-interest-bearing deposits.(5) Deposits denominated in U.S. dollars amount to $212,448 (April 30, 2017 – $213,077; October 31, 2016 – $217,850), deposits denominated in Mexican
pesos amount to $17,474 (April 30, 2017 – $16,680; October 31, 2016 – $14,464) and deposits denominated in other foreign currencies amount to$80,402 (April 30, 2017 – $84,320; October 31, 2016 – $76,777).
The following table presents the maturity schedule for term deposits in Canada greater than $100,000(1).
($ millions)Within
three monthsThree to
six monthsSix to
twelve monthsOne to
five yearsOver five
years Total
As at July 31, 2017 $36,191 $19,211 $36,926 $93,329 $16,092 $201,749
As at April 30, 2017 $37,176 $20,847 $38,352 $99,127 $14,045 $209,547
As at October 31, 2016 $40,211 $24,077 $23,690 $99,905 $12,451 $200,334
(1) The majority of foreign term deposits are in excess of $100,000.
11. Capital and financing transactions
Common shares
Normal Course Issuer Bid
On May 30, 2017, the Bank announced that OSFI and the Toronto Stock Exchange (TSX) approved a normal course issuer bid (the “2017 NCIB”)pursuant to which it may repurchase for cancellation up to 24 million of the Bank’s common shares. Purchases under the 2017 NCIB will terminateupon the earlier of: (i) the Bank purchasing the maximum number of common shares under the NCIB, (ii) the Bank providing a notice of termination,or (iii) June 1, 2018. On a quarterly basis, the Bank will notify OSFI prior to making purchases. Under this bid, the Bank has repurchased and cancelled4 million common shares at an average price of approximately $74.83 per share during the quarter ended July 31, 2017.
On May 31, 2016, the Bank announced that OSFI and the TSX approved a normal course issuer bid (the “2016 NCIB”) pursuant to which it mayrepurchase for cancellation up to 12 million of the Bank’s common shares. The 2016 NCIB terminated on June 1, 2017. On January 4, 2017 andMarch 17, 2017 the TSX approved amendments to the 2016 NCIB, including to allow the Bank to purchase common shares by private agreement orunder a specific share repurchase program, respectively. Under the 2016 NCIB, the Bank repurchased and cancelled 10 million common shares at anaverage price of approximately $71.00 per share.
During the nine months ended July 31, 2017, the Bank repurchased and cancelled 14 million common shares as part of its normal course issuer bidsat an average price of $72.09 per share for a total amount of $1,009 million. Seven million common shares were repurchased pursuant to privateagreements and 5.5 million common shares pursuant to a specific share repurchase program, such purchases were in each case made from arm’slength third party sellers and at a discount to the prevailing market price of the Bank’s common shares on the TSX at the time of the purchases.
Preferred shares
Prior quarters
On April 26, 2017, the Bank redeemed all outstanding Non-cumulative Preferred Shares Series 17 of $230 million at a price of $25.00 per share,together with all declared and unpaid dividends.
On January 27, 2017, the Bank redeemed all outstanding Non-cumulative Preferred Shares Series 16 of $345 million at a price of $25.00 per share,together with all declared and unpaid dividends.
48 Scotiabank Third Quarter Report 2017
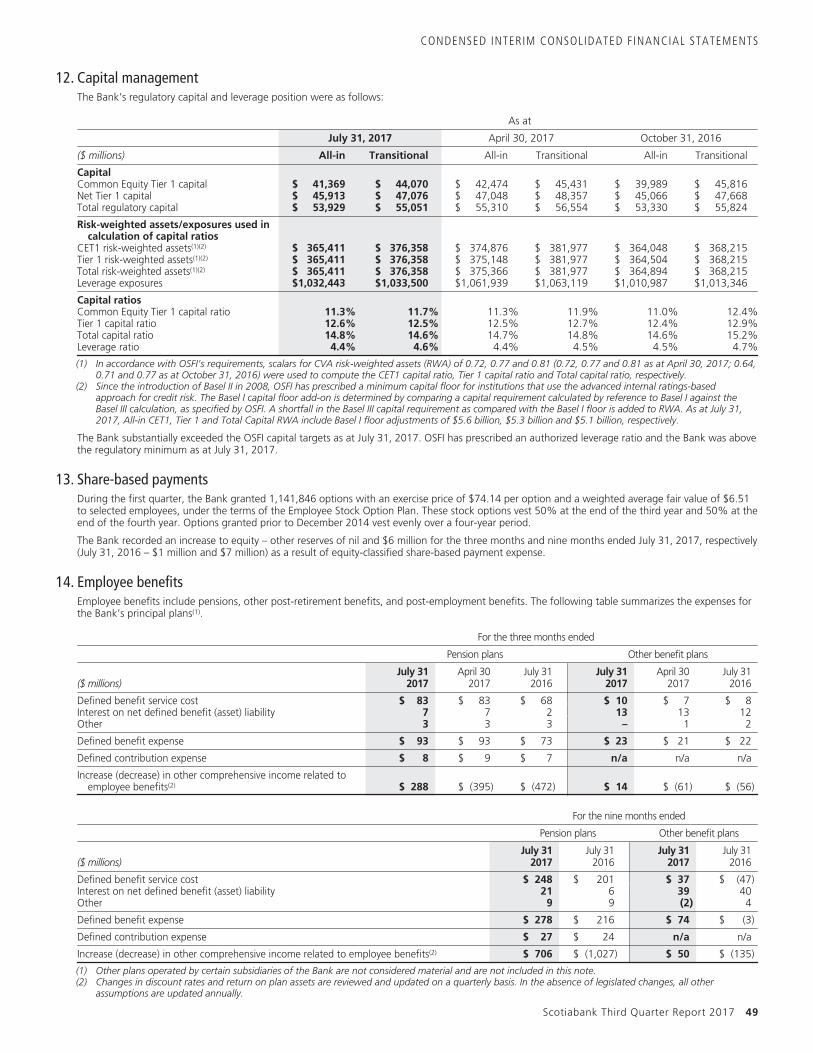
CONDENSED INTERIM CONSOLIDATED FINANCIAL STATEMENTS
12. Capital managementThe Bank’s regulatory capital and leverage position were as follows:
As at
July 31, 2017 April 30, 2017 October 31, 2016
($ millions) All-in Transitional All-in Transitional All-in Transitional
CapitalCommon Equity Tier 1 capital $ 41,369 $ 44,070 $ 42,474 $ 45,431 $ 39,989 $ 45,816Net Tier 1 capital $ 45,913 $ 47,076 $ 47,048 $ 48,357 $ 45,066 $ 47,668Total regulatory capital $ 53,929 $ 55,051 $ 55,310 $ 56,554 $ 53,330 $ 55,824
Risk-weighted assets/exposures used incalculation of capital ratios
CET1 risk-weighted assets(1)(2) $ 365,411 $ 376,358 $ 374,876 $ 381,977 $ 364,048 $ 368,215Tier 1 risk-weighted assets(1)(2) $ 365,411 $ 376,358 $ 375,148 $ 381,977 $ 364,504 $ 368,215Total risk-weighted assets(1)(2) $ 365,411 $ 376,358 $ 375,366 $ 381,977 $ 364,894 $ 368,215Leverage exposures $1,032,443 $1,033,500 $1,061,939 $1,063,119 $1,010,987 $1,013,346
Capital ratiosCommon Equity Tier 1 capital ratio 11.3% 11.7% 11.3% 11.9% 11.0% 12.4%Tier 1 capital ratio 12.6% 12.5% 12.5% 12.7% 12.4% 12.9%Total capital ratio 14.8% 14.6% 14.7% 14.8% 14.6% 15.2%Leverage ratio 4.4% 4.6% 4.4% 4.5% 4.5% 4.7%
(1) In accordance with OSFI’s requirements, scalars for CVA risk-weighted assets (RWA) of 0.72, 0.77 and 0.81 (0.72, 0.77 and 0.81 as at April 30, 2017; 0.64,0.71 and 0.77 as at October 31, 2016) were used to compute the CET1 capital ratio, Tier 1 capital ratio and Total capital ratio, respectively.
(2) Since the introduction of Basel II in 2008, OSFI has prescribed a minimum capital floor for institutions that use the advanced internal ratings-basedapproach for credit risk. The Basel I capital floor add-on is determined by comparing a capital requirement calculated by reference to Basel I against theBasel III calculation, as specified by OSFI. A shortfall in the Basel III capital requirement as compared with the Basel I floor is added to RWA. As at July 31,2017, All-in CET1, Tier 1 and Total Capital RWA include Basel I floor adjustments of $5.6 billion, $5.3 billion and $5.1 billion, respectively.
The Bank substantially exceeded the OSFI capital targets as at July 31, 2017. OSFI has prescribed an authorized leverage ratio and the Bank was abovethe regulatory minimum as at July 31, 2017.
13. Share-based paymentsDuring the first quarter, the Bank granted 1,141,846 options with an exercise price of $74.14 per option and a weighted average fair value of $6.51to selected employees, under the terms of the Employee Stock Option Plan. These stock options vest 50% at the end of the third year and 50% at theend of the fourth year. Options granted prior to December 2014 vest evenly over a four-year period.
The Bank recorded an increase to equity – other reserves of nil and $6 million for the three months and nine months ended July 31, 2017, respectively(July 31, 2016 – $1 million and $7 million) as a result of equity-classified share-based payment expense.
14. Employee benefitsEmployee benefits include pensions, other post-retirement benefits, and post-employment benefits. The following table summarizes the expenses forthe Bank’s principal plans(1).
For the three months ended
Pension plans Other benefit plans
($ millions)July 31
2017April 30
2017July 31
2016July 31
2017April 30
2017July 31
2016
Defined benefit service cost $ 83 $ 83 $ 68 $ 10 $ 7 $ 8Interest on net defined benefit (asset) liability 7 7 2 13 13 12Other 3 3 3 – 1 2
Defined benefit expense $ 93 $ 93 $ 73 $ 23 $ 21 $ 22
Defined contribution expense $ 8 $ 9 $ 7 n/a n/a n/a
Increase (decrease) in other comprehensive income related toemployee benefits(2) $ 288 $ (395) $ (472) $ 14 $ (61) $ (56)
For the nine months ended
Pension plans Other benefit plans
($ millions)July 31
2017July 31
2016July 31
2017July 31
2016
Defined benefit service cost $ 248 $ 201 $ 37 $ (47)Interest on net defined benefit (asset) liability 21 6 39 40Other 9 9 (2) 4
Defined benefit expense $ 278 $ 216 $ 74 $ (3)
Defined contribution expense $ 27 $ 24 n/a n/a
Increase (decrease) in other comprehensive income related to employee benefits(2) $ 706 $ (1,027) $ 50 $ (135)
(1) Other plans operated by certain subsidiaries of the Bank are not considered material and are not included in this note.(2) Changes in discount rates and return on plan assets are reviewed and updated on a quarterly basis. In the absence of legislated changes, all other
assumptions are updated annually.
Scotiabank Third Quarter Report 2017 49
CONDENSED INTERIM CONSOLIDATED FINANCIAL STATEMENTS
15. Operating segmentsScotiabank is a diversified financial services institution that provides a wide range of financial products and services to retail, commercial andcorporate customers around the world. The Bank’s businesses are grouped into three business lines: Canadian Banking, International Banking andGlobal Banking and Markets. The results of these business segments are based upon the internal financial reporting systems of the Bank. Theaccounting policies used in these segments are generally consistent with those followed in the preparation of the consolidated financial statements asdisclosed in Note 3 of the Bank’s audited consolidated financial statements in the 2016 Annual Report. Notable accounting measurement differencesare:
– tax normalization adjustments related to the gross-up of income from associated corporations. This adjustment normalizes the effective tax ratein the divisions to better present the contribution of the associated companies to the divisional results.
– the grossing up of tax-exempt net interest income and non-interest income to an equivalent before-tax basis for those affected segments. Thischange in measurement enables comparison of net interest income and non-interest income arising from taxable and tax-exempt sources.
Scotiabank’s results, and average assets and liabilities, allocated by these operating segments, are as follows:
For the three months ended July 31, 2017
Taxable equivalent basis ($ millions)CanadianBanking
InternationalBanking
GlobalBanking
and Markets Other(1) Total
Net interest income(2) $ 1,876 $ 1,735 $ 340 $ (118) $ 3,833Non-interest income(3) 1,390 910 777 (16) 3,061
Total revenues 3,266 2,645 1,117 (134) 6,894Provision for credit losses 224 325 24 – 573Non-interest expenses 1,633 1,442 530 67 3,672Income tax expense 364 206 122 (146) 546
Net income $ 1,045 $ 672 $ 441 $ (55) $ 2,103
Net income attributable to non-controlling interests in subsidiaries $ – $ 58 $ – $ – $ 58
Net income attributable to equity holders of the Bank $ 1,045 $ 614 $ 441 $ (55) $ 2,045
Average assets ($ billions) $ 325 $ 152 $ 338 $ 107 $ 922
Average liabilities ($ billions) $ 245 $ 117 $ 274 $ 227 $ 863
(1) Includes all other smaller operating segments and corporate adjustments, such as the elimination of the tax-exempt income gross-up reported in netinterest income and non-interest income and provision for income taxes of $95 to arrive at the amounts reported in the Consolidated Statement of Income,differences in the actual amount of costs incurred and charged to the operating segments.
(2) Interest income is reported net of interest expense as management relies primarily on net interest income as a performance measure.(3) Includes income (on a taxable equivalent basis) from investments in associated corporations for Canadian Banking – $21; International Banking – $131 and
Other – $(39).
For the three months ended April 30, 2017
Taxable equivalent basis ($ millions)Canadian
BankingInternational
Banking
GlobalBanking
and Markets Other(1) Total
Net interest income(2) $ 1,763 $ 1,713 $ 322 $ (70) $ 3,728Non-interest income(3) 1,371 905 881 (304) 2,853
Total revenues 3,134 2,618 1,203 (374) 6,581Provision for credit losses 236 349 2 – 587Non-interest expenses 1,596 1,397 501 107 3,601Income tax expense 331 213 183 (395) 332
Net income $ 971 $ 659 $ 517 $ (86) $ 2,061
Net income attributable to non-controlling interests in subsidiaries $ – $ 64 $ – $ – $ 64
Net income attributable to equity holders of the Bank $ 971 $ 595 $ 517 $ (86) $ 1,997
Average assets ($ billions) $ 318 $ 149 $ 340 $ 100 $ 907
Average liabilities ($ billions) $ 242 $ 115 $ 263 $ 228 $ 848
(1) Includes all other smaller operating segments and corporate adjustments, such as the elimination of the tax-exempt income gross-up reported in netinterest income and non-interest income and provision for income taxes of $339 to arrive at the amounts reported in the Consolidated Statement ofIncome, differences in the actual amount of costs incurred and charged to the operating segments.
(2) Interest income is reported net of interest expense as management relies primarily on net interest income as a performance measure.(3) Includes income (on a taxable equivalent basis) from investments in associated corporations for Canadian Banking – $16; International Banking – $117 and
Other – $(35).
50 Scotiabank Third Quarter Report 2017
CONDENSED INTERIM CONSOLIDATED FINANCIAL STATEMENTS
For the three months ended July 31, 2016
Taxable equivalent basis ($ millions)Canadian
BankingInternational
Banking
GlobalBanking and
Markets Other(1) Total
Net interest income(2) $ 1,770 $ 1,596 $ 337 $ (101) $ 3,602Non-interest income(3) 1,273 828 814 123 3,038
Total revenues 3,043 2,424 1,151 22 6,640Provision for credit losses 217 316 38 – 571Non-interest expenses 1,567 1,345 507 86 3,505Income tax expense 329 174 185 (83) 605
Net income $ 930 $ 589 $ 421 $ 19 $ 1,959
Net income attributable to non-controlling interests in subsidiaries $ – $ 62 $ – $ – $ 62
Net income attributable to equity holders of the Bank $ 930 $ 527 $ 421 $ 19 $ 1,897
Average assets ($ billions) $ 310 $ 140 $ 341 $ 117 $ 908
Average liabilities ($ billions) $ 233 $ 108 $ 264 $ 249 $ 854
(1) Includes all other smaller operating segments and corporate adjustments, such as the elimination of the tax-exempt income gross-up reported in netinterest income and non-interest income and provision for income taxes of $50 to arrive at the amounts reported in the Consolidated Statement of Income,differences in the actual amount of costs incurred and charged to the operating segments.
(2) Interest income is reported net of interest expense as management relies primarily on net interest income as a performance measure.(3) Includes income (on a taxable equivalent basis) from investments in associated corporations for Canadian Banking – $20; International Banking – $110 and
Other – $(33).
For the nine months ended July 31, 2017
Taxable equivalent basis ($ millions)CanadianBanking
InternationalBanking
GlobalBanking
and Markets Other(1) Total
Net interest income(2) $ 5,448 $ 5,059 $ 985 $ (288) $ 11,204Non-interest income(3) 4,138 2,790 2,550 (339) 9,139
Total revenues 9,586 7,849 3,535 (627) 20,343Provision for credit losses 695 984 34 – 1,713Non-interest expenses 4,858 4,269 1,591 244 10,962Income tax expense 1,036 628 483 (652) 1,495
Net income $ 2,997 $ 1,968 $ 1,427 $ (219) $ 6,173
Net income attributable to non-controlling interests in subsidiaries $ – $ 183 $ – $ – $ 183
Net income attributable to equity holders of the Bank $ 2,997 $ 1,785 $ 1,427 $ (219) $ 5,990
Average assets ($ billions) $ 320 $ 148 $ 340 $ 106 $ 914
Average liabilities ($ billions) $ 243 $ 114 $ 267 $ 231 $ 855
(1) Includes all other smaller operating segments and corporate adjustments, such as the elimination of the tax-exempt income gross-up reported in netinterest income and non-interest income and provision for income taxes of $481 to arrive at the amounts reported in the Consolidated Statement ofIncome, differences in the actual amount of costs incurred and charged to the operating segments.
(2) Interest income is reported net of interest expense as management relies primarily on net interest income as a performance measure.(3) Includes income (on a taxable equivalent basis) from investments in associated corporations for Canadian Banking – $50; International Banking – $367 and
Other – $(107).
For the nine months ended July 31, 2016
Taxable equivalent basis ($ millions)Canadian
BankingInternational
Banking
GlobalBanking and
Markets Other(1) Total
Net interest income(2) $ 5,226 $ 4,744 $ 948 $ (279) $ 10,639Non-interest income(3) 3,850 2,599 2,309 202 8,960
Total revenues 9,076 7,343 3,257 (77) 19,599Provision for credit losses 615 987 210 50 1,862Non-interest expenses(4) 4,712 4,110 1,507 561 10,890Income tax expense 967 535 430 (442) 1,490
Net income $ 2,782 $ 1,711 $ 1,110 $ (246) $ 5,357
Net income attributable to non-controlling interests in subsidiaries $ – $ 179 $ – $ – $ 179
Net income attributable to equity holders of the Bank $ 2,782 $ 1,532 $ 1,110 $ (246) $ 5,178
Average assets ($ billions) $ 308 $ 143 $ 351 $ 110 $ 912
Average liabilities ($ billions) $ 231 $ 109 $ 269 $ 248 $ 857
(1) Includes all other smaller operating segments and corporate adjustments, such as the elimination of the tax-exempt income gross-up reported in netinterest income and non-interest income and provision for income taxes of $252 to arrive at the amounts reported in the Consolidated Statement ofIncome, differences in the actual amount of costs incurred and charged to the operating segments.
(2) Interest income is reported net of interest expense as management relies primarily on net interest income as a performance measure.(3) Includes income (on a taxable equivalent basis) from investments in associated corporations for Canadian Banking – $53; International Banking – $343 and
Other – $(99).(4) Other segment includes restructuring charge of $378.
Scotiabank Third Quarter Report 2017 51
CONDENSED INTERIM CONSOLIDATED FINANCIAL STATEMENTS
16. Non-interest incomeThe following table presents details of banking revenues and wealth management revenues in non-interest income.
For the three months ended For the nine months ended
($ millions)July 31
2017April 30
2017July 31
2016July 31
2017July 31
2016
BankingCard revenues $ 384 $ 370 $ 345 $ 1,138 $ 1,004Deposit and payment services 342 327 318 996 957Credit fees 301 286 294 874 856Other 114 112 106 351 312
1,141 1,095 1,063 3,359 3,129Banking fee related expenses 159 152 145 461 417
Total banking revenues $ 982 $ 943 $ 918 $ 2,898 $ 2,712
Wealth managementMutual funds $ 417 $ 406 $ 406 $ 1,231 $ 1,211Brokerage fees 266 278 248 815 748Investment management and trust 164 169 164 497 486
Total wealth management revenues $ 847 $ 853 $ 818 $ 2,543 $ 2,445
17. Earnings per share
For the three months ended For the nine months ended
($ millions)July 31
2017April 30
2017July 31
2016July 31
2017July 31
2016
Basic earnings per common shareNet income attributable to common shareholders $ 2,016 $ 1,965 $ 1,860 $ 5,890 $ 5,079Weighted average number of common shares outstanding (millions) 1,200 1,206 1,203 1,205 1,203
Basic earnings per common share(1) (in dollars) $ 1.68 $ 1.63 $ 1.55 $ 4.89 $ 4.22
Diluted earnings per common shareNet income attributable to common shareholders $ 2,016 $ 1,965 $ 1,860 $ 5,890 $ 5,079Adjustments to net income due to share-based payment options and
others(2) 12 15 19 51 66
Net income attributable to common shareholders (diluted) $ 2,028 $ 1,980 $ 1,879 $ 5,941 $ 5,145
Weighted average number of common shares outstanding (millions) 1,200 1,206 1,203 1,205 1,203Adjustments to average shares due to share-based payment options and
others(2) (millions) 19 17 19 20 22
Weighted average number of diluted common shares outstanding (millions) 1,219 1,223 1,222 1,225 1,225
Diluted earnings per common share(1) (in dollars) $ 1.66 $ 1.62 $ 1.54 $ 4.85 $ 4.20
(1) Earnings per share calculations are based on full dollar and share amounts.(2) Certain tandem stock appreciation rights and options that the Bank may settle at its own discretion by issuing common shares were not included in the
calculation of diluted earnings per share as they were anti-dilutive.
18. Financial instruments
(a) Risk management
The Bank’s principal business activities result in a balance sheet that consists primarily of financial instruments. In addition, the Bank uses derivativefinancial instruments for both trading and hedging purposes. The principal financial risks that arise from transacting financial instruments includecredit risk, liquidity risk and market risk. The Bank’s framework to monitor, evaluate and manage these risks is consistent with that in place as atOctober 31, 2016.
(i) Credit risk
Credit risk is the risk of loss resulting from the failure of a borrower or counterparty to honour its financial or contractual obligations to the Bank.
Credit risk exposures disclosed below are presented based on Basel framework utilized by the Bank. The Bank uses the Advanced Internal RatingsBased approach (AIRB) for all material Canadian, U.S. and European portfolios, and for a significant portion of the international corporate andcommercial portfolios. The remaining portfolios, including other international portfolios, are treated under the standardized approach. Under the AIRBapproach, the Bank uses internal risk parameter estimates, based on historical experience.
52 Scotiabank Third Quarter Report 2017
CONDENSED INTERIM CONSOLIDATED FINANCIAL STATEMENTS
Under the standardized approach, credit risk is estimated using the risk weights as prescribed by the Basel framework, either based on creditassessments by external rating agencies or based on the counterparty type for non-retail exposures and product type for retail exposures.
Exposure at default(1) As at
July 31, 2017April 30
2017October 31
2016
($ millions) AIRB Standardized Total Total Total
By exposure sub-typeNon-retail(2)
Drawn(3) $ 341,162 $ 59,154 $ 400,316 $ 397,967 $ 393,080Undrawn commitments 75,097 5,580 80,677 87,824 76,745Other exposures(4) 95,217 2,990 98,207 104,337 102,061
Total non-retail $ 511,476 $ 67,724 $ 579,200 $ 590,128 $ 571,886
RetailDrawn(5) $ 167,469 $ 66,902 $ 234,371 $ 228,236 $ 216,535Undrawn commitments 42,916 – 42,916 41,999 36,494
Total retail $ 210,385 $ 66,902 $ 277,287 $ 270,235 $ 253,029
Total $ 721,861 $ 134,626 $ 856,487 $ 860,363 $ 824,915
(1) After credit risk mitigation and excludes available-for-sale equity securities and other assets.(2) Non-retail AIRB drawn exposures include government guaranteed and privately insured mortgages.(3) Non-retail drawn includes loans, bankers’ acceptances, deposits with financial institutions and debt investment securities.(4) Includes off-balance sheet lending instruments such as letters of credit, letters of guarantee, securitizations, over-the-counter derivatives and repo-style
transactions net of related collateral.(5) Retail drawn includes residential mortgages, credit cards, lines of credit and other personal loans.
Credit quality of non-retail exposures
The Bank’s non-retail portfolio is well diversified by industry. A significant portion of the authorized corporate and commercial lending portfolio wasinternally assessed at a grade that would generally equate to an investment grade rating by external rating agencies. There has not been a significantchange in concentrations of credit risk since October 31, 2016.
Credit quality of retail exposures
The Bank’s retail portfolios consist of a number of relatively small loans to a large number of borrowers. The portfolios are distributed across Canadaand a wide range of countries. As such, the portfolios inherently have a high degree of diversification. In addition, as of July 31, 2017, 52% (April 30,2017 – 54%; October 31, 2016 – 57%) of the Canadian residential mortgage portfolio is insured. The average loan-to-value ratio of the uninsuredportion of the Canadian residential mortgage portfolio is 50% (April 30, 2017 – 51%; October 31, 2016 – 50%).
Retail standardized portfolio
The retail standardized portfolio of $67 billion as at July 31, 2017 (April 30, 2017 – $69 billion; October 31, 2016 – $65 billion), was comprised ofresidential mortgages, personal loans, credit cards and lines of credit to individuals, mainly in the Caribbean and Latin America. Of the totalstandardized retail exposures, $32 billion (April 30, 2017 – $33 billion; October 31, 2016 – $31 billion) was represented by mortgages and loanssecured by residential real estate, mostly with a loan-to-value ratio of below 80%.
(ii) Liquidity risk
Liquidity risk is the risk that the Bank is unable to meet its financial obligations in a timely manner at reasonable prices. The Bank’s liquidity risk issubject to extensive risk management controls and is managed within the framework of policies and limits approved by the Board. The Board receivesreports on risk exposures and performance against approved limits. The Asset/Liability Committee (ALCO) provides senior management oversight ofliquidity risk.
The key elements of the Bank’s liquidity risk management framework include:
– liquidity risk measurement and management limits, including limits on maximum net cash outflow by currency over specified short-term horizons;– prudent diversification of its wholesale funding activities by using a number of different funding programs to access the global financial markets
and manage its maturity profile, as appropriate;– large holdings of liquid assets to support its operations, which can generally be sold or pledged to meet the Bank’s obligations;– liquidity stress testing, including Bank-specific, global-systemic, and combination systemic/specific scenarios; and– liquidity contingency planning.
The Bank’s foreign operations have liquidity management frameworks that are similar to the Bank’s framework. Local deposits are managed from aliquidity risk perspective based on the local management frameworks and regulatory requirements.
(iii) Market risk
Market risk arises from changes in market prices and rates (including interest rates, credit spreads, equity prices, foreign exchange rates andcommodity prices), the correlations among them, and their levels of volatility.
Interest rate risk
Interest rate risk, inclusive of credit spread risk, is the risk of loss due to the following: changes in the level, slope and curvature of the yield curve; thevolatility of interest rates; mortgage prepayment rates; changes in the market price of credit; and the creditworthiness of a particular issuer.
Scotiabank Third Quarter Report 2017 53
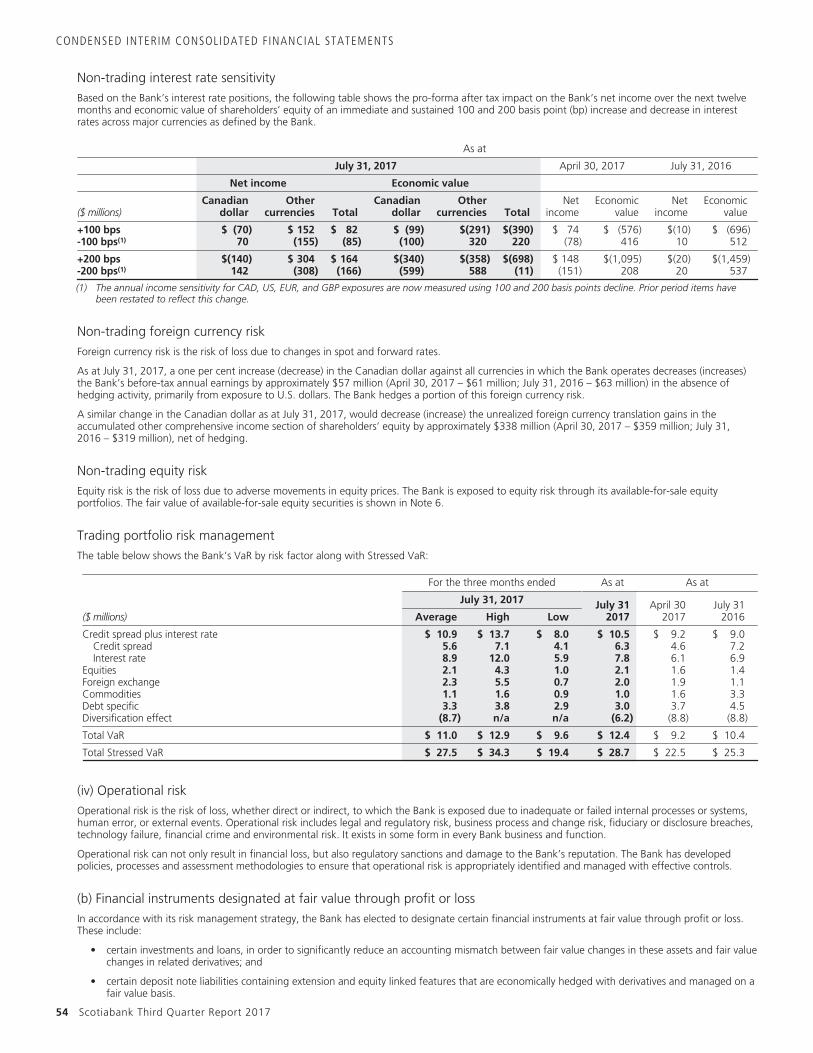
CONDENSED INTERIM CONSOLIDATED FINANCIAL STATEMENTS
Non-trading interest rate sensitivity
Based on the Bank’s interest rate positions, the following table shows the pro-forma after tax impact on the Bank’s net income over the next twelvemonths and economic value of shareholders’ equity of an immediate and sustained 100 and 200 basis point (bp) increase and decrease in interestrates across major currencies as defined by the Bank.
As at
July 31, 2017 April 30, 2017 July 31, 2016
Net income Economic value
($ millions)Canadian
dollarOther
currencies TotalCanadian
dollarOther
currencies TotalNet
incomeEconomic
valueNet
incomeEconomic
value
+100 bps $ (70) $ 152 $ 82 $ (99) $(291) $(390) $ 74 $ (576) $(10) $ (696)-100 bps(1) 70 (155) (85) (100) 320 220 (78) 416 10 512
+200 bps $(140) $ 304 $ 164 $(340) $(358) $(698) $ 148 $(1,095) $(20) $(1,459)-200 bps(1) 142 (308) (166) (599) 588 (11) (151) 208 20 537
(1) The annual income sensitivity for CAD, US, EUR, and GBP exposures are now measured using 100 and 200 basis points decline. Prior period items havebeen restated to reflect this change.
Non-trading foreign currency risk
Foreign currency risk is the risk of loss due to changes in spot and forward rates.
As at July 31, 2017, a one per cent increase (decrease) in the Canadian dollar against all currencies in which the Bank operates decreases (increases)the Bank’s before-tax annual earnings by approximately $57 million (April 30, 2017 – $61 million; July 31, 2016 – $63 million) in the absence ofhedging activity, primarily from exposure to U.S. dollars. The Bank hedges a portion of this foreign currency risk.
A similar change in the Canadian dollar as at July 31, 2017, would decrease (increase) the unrealized foreign currency translation gains in theaccumulated other comprehensive income section of shareholders’ equity by approximately $338 million (April 30, 2017 – $359 million; July 31,2016 – $319 million), net of hedging.
Non-trading equity risk
Equity risk is the risk of loss due to adverse movements in equity prices. The Bank is exposed to equity risk through its available-for-sale equityportfolios. The fair value of available-for-sale equity securities is shown in Note 6.
Trading portfolio risk management
The table below shows the Bank’s VaR by risk factor along with Stressed VaR:
For the three months ended As at As at
July 31, 2017 July 312017
April 302017
July 312016($ millions) Average High Low
Credit spread plus interest rate $ 10.9 $ 13.7 $ 8.0 $ 10.5 $ 9.2 $ 9.0Credit spread 5.6 7.1 4.1 6.3 4.6 7.2Interest rate 8.9 12.0 5.9 7.8 6.1 6.9
Equities 2.1 4.3 1.0 2.1 1.6 1.4Foreign exchange 2.3 5.5 0.7 2.0 1.9 1.1Commodities 1.1 1.6 0.9 1.0 1.6 3.3Debt specific 3.3 3.8 2.9 3.0 3.7 4.5Diversification effect (8.7) n/a n/a (6.2) (8.8) (8.8)
Total VaR $ 11.0 $ 12.9 $ 9.6 $ 12.4 $ 9.2 $ 10.4
Total Stressed VaR $ 27.5 $ 34.3 $ 19.4 $ 28.7 $ 22.5 $ 25.3
(iv) Operational risk
Operational risk is the risk of loss, whether direct or indirect, to which the Bank is exposed due to inadequate or failed internal processes or systems,human error, or external events. Operational risk includes legal and regulatory risk, business process and change risk, fiduciary or disclosure breaches,technology failure, financial crime and environmental risk. It exists in some form in every Bank business and function.
Operational risk can not only result in financial loss, but also regulatory sanctions and damage to the Bank’s reputation. The Bank has developedpolicies, processes and assessment methodologies to ensure that operational risk is appropriately identified and managed with effective controls.
(b) Financial instruments designated at fair value through profit or loss
In accordance with its risk management strategy, the Bank has elected to designate certain financial instruments at fair value through profit or loss.These include:
• certain investments and loans, in order to significantly reduce an accounting mismatch between fair value changes in these assets and fair valuechanges in related derivatives; and
• certain deposit note liabilities containing extension and equity linked features that are economically hedged with derivatives and managed on afair value basis.
54 Scotiabank Third Quarter Report 2017
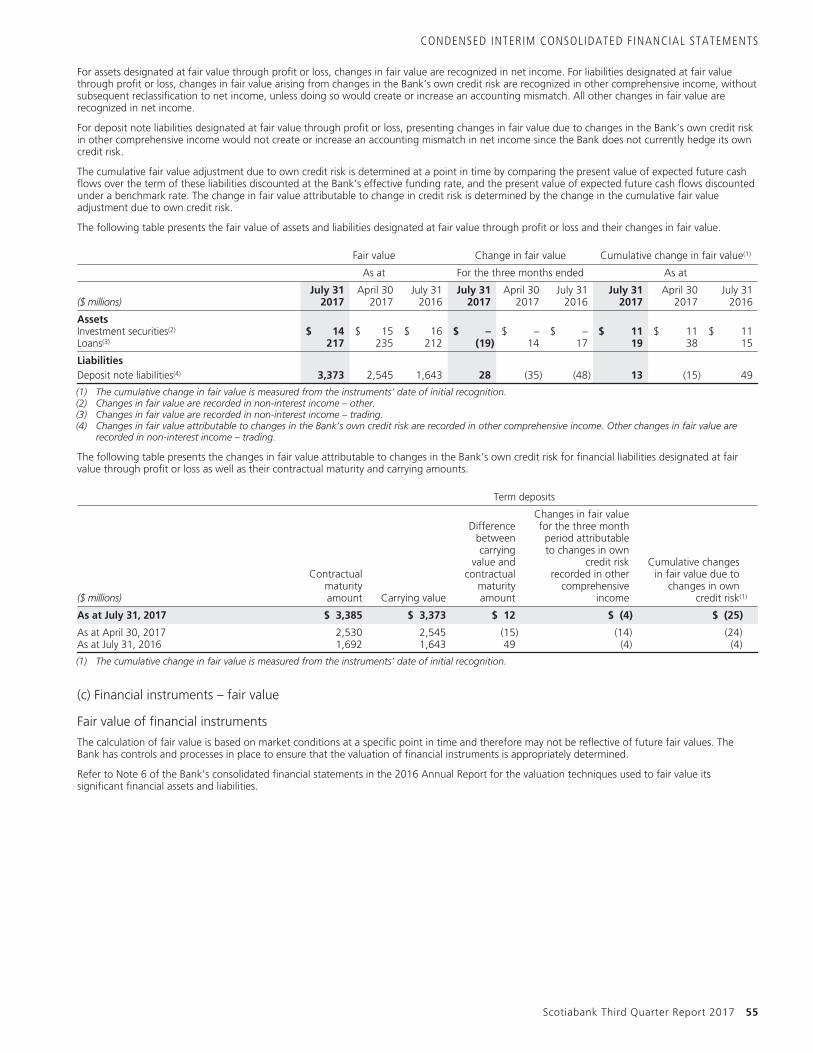
CONDENSED INTERIM CONSOLIDATED FINANCIAL STATEMENTS
For assets designated at fair value through profit or loss, changes in fair value are recognized in net income. For liabilities designated at fair valuethrough profit or loss, changes in fair value arising from changes in the Bank’s own credit risk are recognized in other comprehensive income, withoutsubsequent reclassification to net income, unless doing so would create or increase an accounting mismatch. All other changes in fair value arerecognized in net income.
For deposit note liabilities designated at fair value through profit or loss, presenting changes in fair value due to changes in the Bank’s own credit riskin other comprehensive income would not create or increase an accounting mismatch in net income since the Bank does not currently hedge its owncredit risk.
The cumulative fair value adjustment due to own credit risk is determined at a point in time by comparing the present value of expected future cashflows over the term of these liabilities discounted at the Bank’s effective funding rate, and the present value of expected future cash flows discountedunder a benchmark rate. The change in fair value attributable to change in credit risk is determined by the change in the cumulative fair valueadjustment due to own credit risk.
The following table presents the fair value of assets and liabilities designated at fair value through profit or loss and their changes in fair value.
Fair value Change in fair value Cumulative change in fair value(1)
As at For the three months ended As at
($ millions)July 31
2017April 30
2017July 31
2016July 31
2017April 30
2017July 31
2016July 31
2017April 30
2017July 31
2016
AssetsInvestment securities(2) $ 14 $ 15 $ 16 $ – $ – $ – $ 11 $ 11 $ 11Loans(3) 217 235 212 (19) 14 17 19 38 15
LiabilitiesDeposit note liabilities(4) 3,373 2,545 1,643 28 (35) (48) 13 (15) 49
(1) The cumulative change in fair value is measured from the instruments’ date of initial recognition.(2) Changes in fair value are recorded in non-interest income – other.(3) Changes in fair value are recorded in non-interest income – trading.(4) Changes in fair value attributable to changes in the Bank’s own credit risk are recorded in other comprehensive income. Other changes in fair value are
recorded in non-interest income – trading.
The following table presents the changes in fair value attributable to changes in the Bank’s own credit risk for financial liabilities designated at fairvalue through profit or loss as well as their contractual maturity and carrying amounts.
Term deposits
($ millions)
Contractualmaturityamount Carrying value
Differencebetweencarrying
value andcontractual
maturityamount
Changes in fair valuefor the three monthperiod attributableto changes in own
credit riskrecorded in other
comprehensiveincome
Cumulative changesin fair value due to
changes in owncredit risk(1)
As at July 31, 2017 $ 3,385 $ 3,373 $ 12 $ (4) $ (25)
As at April 30, 2017 2,530 2,545 (15) (14) (24)As at July 31, 2016 1,692 1,643 49 (4) (4)
(1) The cumulative change in fair value is measured from the instruments’ date of initial recognition.
(c) Financial instruments – fair value
Fair value of financial instruments
The calculation of fair value is based on market conditions at a specific point in time and therefore may not be reflective of future fair values. TheBank has controls and processes in place to ensure that the valuation of financial instruments is appropriately determined.
Refer to Note 6 of the Bank’s consolidated financial statements in the 2016 Annual Report for the valuation techniques used to fair value itssignificant financial assets and liabilities.
Scotiabank Third Quarter Report 2017 55
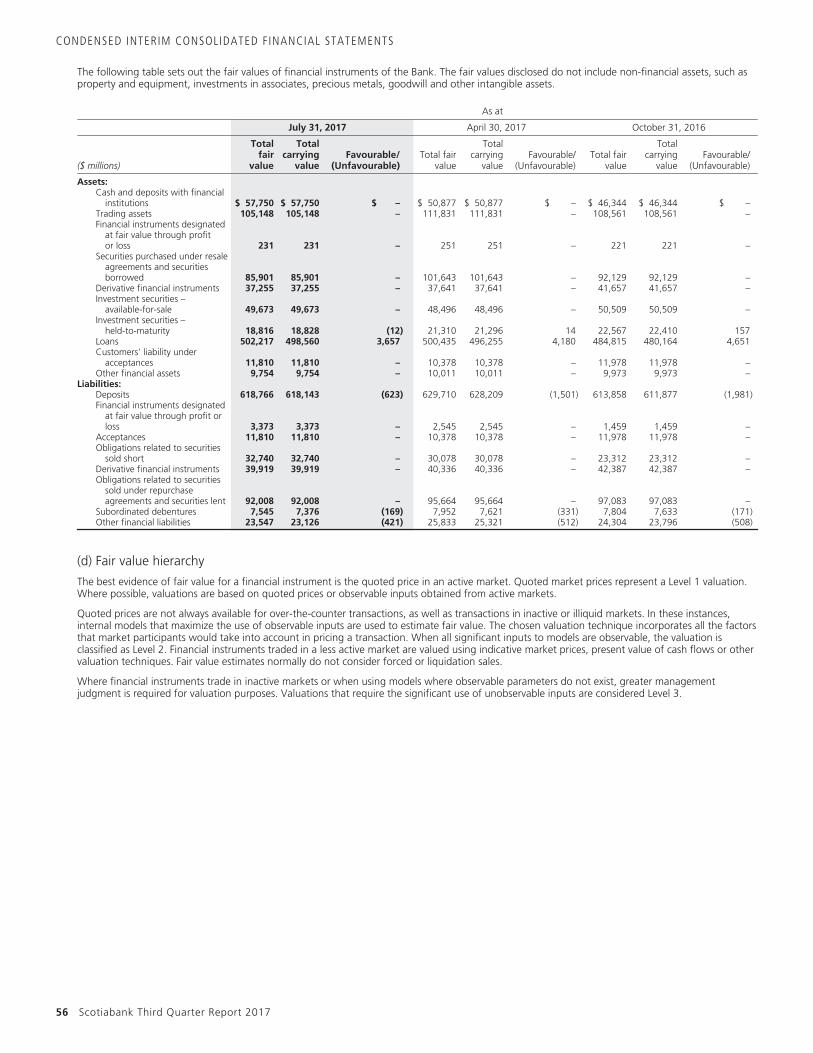
CONDENSED INTERIM CONSOLIDATED FINANCIAL STATEMENTS
The following table sets out the fair values of financial instruments of the Bank. The fair values disclosed do not include non-financial assets, such asproperty and equipment, investments in associates, precious metals, goodwill and other intangible assets.
As at
July 31, 2017 April 30, 2017 October 31, 2016
($ millions)
Totalfair
value
Totalcarrying
valueFavourable/
(Unfavourable)Total fair
value
Totalcarrying
valueFavourable/
(Unfavourable)Total fair
value
Totalcarrying
valueFavourable/
(Unfavourable)
Assets:Cash and deposits with financial
institutions $ 57,750 $ 57,750 $ – $ 50,877 $ 50,877 $ – $ 46,344 $ 46,344 $ –Trading assets 105,148 105,148 – 111,831 111,831 – 108,561 108,561 –Financial instruments designated
at fair value through profitor loss 231 231 – 251 251 – 221 221 –
Securities purchased under resaleagreements and securitiesborrowed 85,901 85,901 – 101,643 101,643 – 92,129 92,129 –
Derivative financial instruments 37,255 37,255 – 37,641 37,641 – 41,657 41,657 –Investment securities –
available-for-sale 49,673 49,673 – 48,496 48,496 – 50,509 50,509 –Investment securities –
held-to-maturity 18,816 18,828 (12) 21,310 21,296 14 22,567 22,410 157Loans 502,217 498,560 3,657 500,435 496,255 4,180 484,815 480,164 4,651Customers’ liability under
acceptances 11,810 11,810 – 10,378 10,378 – 11,978 11,978 –Other financial assets 9,754 9,754 – 10,011 10,011 – 9,973 9,973 –
Liabilities:Deposits 618,766 618,143 (623) 629,710 628,209 (1,501) 613,858 611,877 (1,981)Financial instruments designated
at fair value through profit orloss 3,373 3,373 – 2,545 2,545 – 1,459 1,459 –
Acceptances 11,810 11,810 – 10,378 10,378 – 11,978 11,978 –Obligations related to securities
sold short 32,740 32,740 – 30,078 30,078 – 23,312 23,312 –Derivative financial instruments 39,919 39,919 – 40,336 40,336 – 42,387 42,387 –Obligations related to securities
sold under repurchaseagreements and securities lent 92,008 92,008 – 95,664 95,664 – 97,083 97,083 –
Subordinated debentures 7,545 7,376 (169) 7,952 7,621 (331) 7,804 7,633 (171)Other financial liabilities 23,547 23,126 (421) 25,833 25,321 (512) 24,304 23,796 (508)
(d) Fair value hierarchy
The best evidence of fair value for a financial instrument is the quoted price in an active market. Quoted market prices represent a Level 1 valuation.Where possible, valuations are based on quoted prices or observable inputs obtained from active markets.
Quoted prices are not always available for over-the-counter transactions, as well as transactions in inactive or illiquid markets. In these instances,internal models that maximize the use of observable inputs are used to estimate fair value. The chosen valuation technique incorporates all the factorsthat market participants would take into account in pricing a transaction. When all significant inputs to models are observable, the valuation isclassified as Level 2. Financial instruments traded in a less active market are valued using indicative market prices, present value of cash flows or othervaluation techniques. Fair value estimates normally do not consider forced or liquidation sales.
Where financial instruments trade in inactive markets or when using models where observable parameters do not exist, greater managementjudgment is required for valuation purposes. Valuations that require the significant use of unobservable inputs are considered Level 3.
56 Scotiabank Third Quarter Report 2017
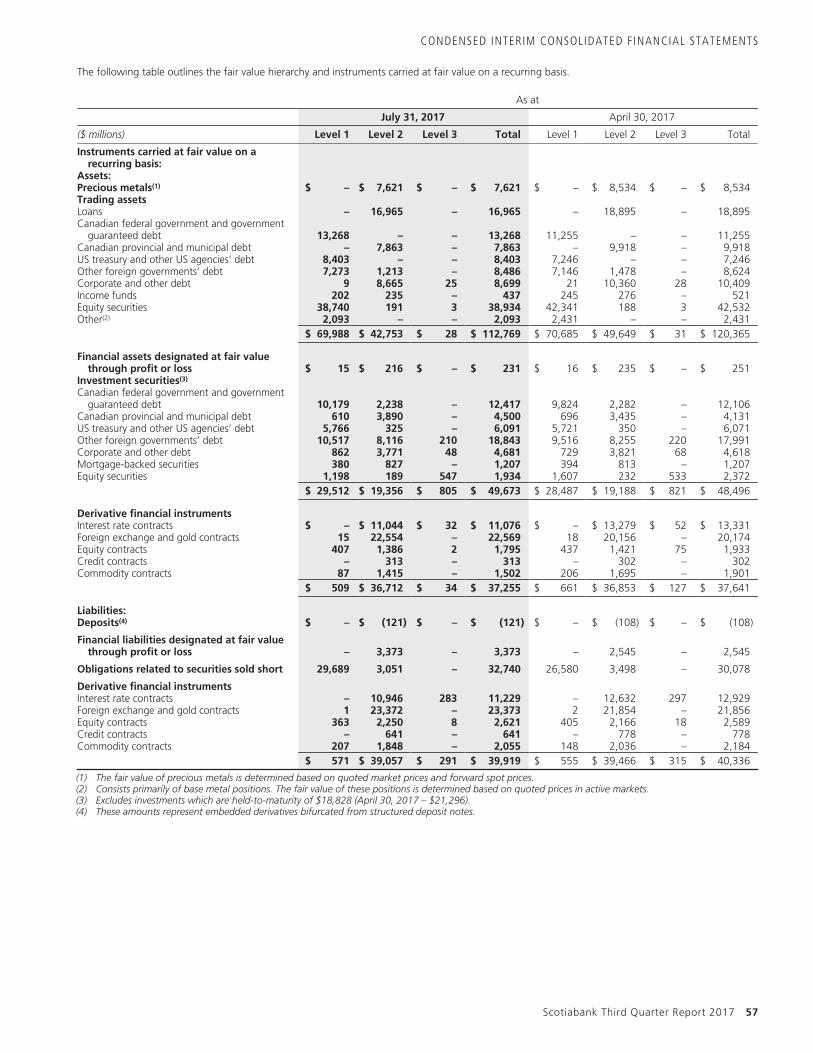
CONDENSED INTERIM CONSOLIDATED FINANCIAL STATEMENTS
The following table outlines the fair value hierarchy and instruments carried at fair value on a recurring basis.
As at
July 31, 2017 April 30, 2017
($ millions) Level 1 Level 2 Level 3 Total Level 1 Level 2 Level 3 Total
Instruments carried at fair value on arecurring basis:
Assets:Precious metals(1) $ – $ 7,621 $ – $ 7,621 $ – $ 8,534 $ – $ 8,534Trading assetsLoans – 16,965 – 16,965 – 18,895 – 18,895Canadian federal government and government
guaranteed debt 13,268 – – 13,268 11,255 – – 11,255Canadian provincial and municipal debt – 7,863 – 7,863 – 9,918 – 9,918US treasury and other US agencies’ debt 8,403 – – 8,403 7,246 – – 7,246Other foreign governments’ debt 7,273 1,213 – 8,486 7,146 1,478 – 8,624Corporate and other debt 9 8,665 25 8,699 21 10,360 28 10,409Income funds 202 235 – 437 245 276 – 521Equity securities 38,740 191 3 38,934 42,341 188 3 42,532Other(2) 2,093 – – 2,093 2,431 – – 2,431
$ 69,988 $ 42,753 $ 28 $ 112,769 $ 70,685 $ 49,649 $ 31 $ 120,365
Financial assets designated at fair valuethrough profit or loss $ 15 $ 216 $ – $ 231 $ 16 $ 235 $ – $ 251
Investment securities(3)
Canadian federal government and governmentguaranteed debt 10,179 2,238 – 12,417 9,824 2,282 – 12,106
Canadian provincial and municipal debt 610 3,890 – 4,500 696 3,435 – 4,131US treasury and other US agencies’ debt 5,766 325 – 6,091 5,721 350 – 6,071Other foreign governments’ debt 10,517 8,116 210 18,843 9,516 8,255 220 17,991Corporate and other debt 862 3,771 48 4,681 729 3,821 68 4,618Mortgage-backed securities 380 827 – 1,207 394 813 – 1,207Equity securities 1,198 189 547 1,934 1,607 232 533 2,372
$ 29,512 $ 19,356 $ 805 $ 49,673 $ 28,487 $ 19,188 $ 821 $ 48,496
Derivative financial instrumentsInterest rate contracts $ – $ 11,044 $ 32 $ 11,076 $ – $ 13,279 $ 52 $ 13,331Foreign exchange and gold contracts 15 22,554 – 22,569 18 20,156 – 20,174Equity contracts 407 1,386 2 1,795 437 1,421 75 1,933Credit contracts – 313 – 313 – 302 – 302Commodity contracts 87 1,415 – 1,502 206 1,695 – 1,901
$ 509 $ 36,712 $ 34 $ 37,255 $ 661 $ 36,853 $ 127 $ 37,641
Liabilities:Deposits(4) $ – $ (121) $ – $ (121) $ – $ (108) $ – $ (108)
Financial liabilities designated at fair valuethrough profit or loss – 3,373 – 3,373 – 2,545 – 2,545
Obligations related to securities sold short 29,689 3,051 – 32,740 26,580 3,498 – 30,078
Derivative financial instrumentsInterest rate contracts – 10,946 283 11,229 – 12,632 297 12,929Foreign exchange and gold contracts 1 23,372 – 23,373 2 21,854 – 21,856Equity contracts 363 2,250 8 2,621 405 2,166 18 2,589Credit contracts – 641 – 641 – 778 – 778Commodity contracts 207 1,848 – 2,055 148 2,036 – 2,184
$ 571 $ 39,057 $ 291 $ 39,919 $ 555 $ 39,466 $ 315 $ 40,336
(1) The fair value of precious metals is determined based on quoted market prices and forward spot prices.(2) Consists primarily of base metal positions. The fair value of these positions is determined based on quoted prices in active markets.(3) Excludes investments which are held-to-maturity of $18,828 (April 30, 2017 – $21,296).(4) These amounts represent embedded derivatives bifurcated from structured deposit notes.
Scotiabank Third Quarter Report 2017 57
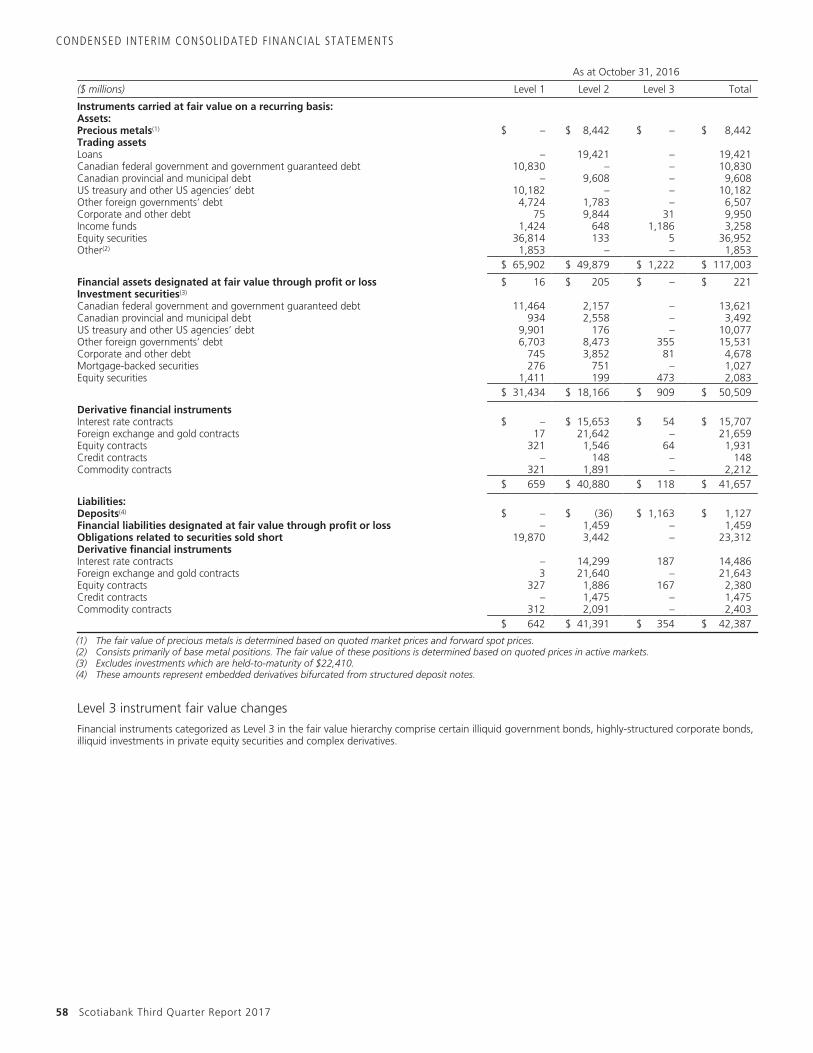
CONDENSED INTERIM CONSOLIDATED FINANCIAL STATEMENTS
As at October 31, 2016
($ millions) Level 1 Level 2 Level 3 Total
Instruments carried at fair value on a recurring basis:Assets:Precious metals(1) $ – $ 8,442 $ – $ 8,442Trading assetsLoans – 19,421 – 19,421Canadian federal government and government guaranteed debt 10,830 – – 10,830Canadian provincial and municipal debt – 9,608 – 9,608US treasury and other US agencies’ debt 10,182 – – 10,182Other foreign governments’ debt 4,724 1,783 – 6,507Corporate and other debt 75 9,844 31 9,950Income funds 1,424 648 1,186 3,258Equity securities 36,814 133 5 36,952Other(2) 1,853 – – 1,853
$ 65,902 $ 49,879 $ 1,222 $ 117,003
Financial assets designated at fair value through profit or loss $ 16 $ 205 $ – $ 221Investment securities(3)
Canadian federal government and government guaranteed debt 11,464 2,157 – 13,621Canadian provincial and municipal debt 934 2,558 – 3,492US treasury and other US agencies’ debt 9,901 176 – 10,077Other foreign governments’ debt 6,703 8,473 355 15,531Corporate and other debt 745 3,852 81 4,678Mortgage-backed securities 276 751 – 1,027Equity securities 1,411 199 473 2,083
$ 31,434 $ 18,166 $ 909 $ 50,509
Derivative financial instrumentsInterest rate contracts $ – $ 15,653 $ 54 $ 15,707Foreign exchange and gold contracts 17 21,642 – 21,659Equity contracts 321 1,546 64 1,931Credit contracts – 148 – 148Commodity contracts 321 1,891 – 2,212
$ 659 $ 40,880 $ 118 $ 41,657
Liabilities:Deposits(4) $ – $ (36) $ 1,163 $ 1,127Financial liabilities designated at fair value through profit or loss – 1,459 – 1,459Obligations related to securities sold short 19,870 3,442 – 23,312Derivative financial instrumentsInterest rate contracts – 14,299 187 14,486Foreign exchange and gold contracts 3 21,640 – 21,643Equity contracts 327 1,886 167 2,380Credit contracts – 1,475 – 1,475Commodity contracts 312 2,091 – 2,403
$ 642 $ 41,391 $ 354 $ 42,387
(1) The fair value of precious metals is determined based on quoted market prices and forward spot prices.(2) Consists primarily of base metal positions. The fair value of these positions is determined based on quoted prices in active markets.(3) Excludes investments which are held-to-maturity of $22,410.(4) These amounts represent embedded derivatives bifurcated from structured deposit notes.
Level 3 instrument fair value changes
Financial instruments categorized as Level 3 in the fair value hierarchy comprise certain illiquid government bonds, highly-structured corporate bonds,illiquid investments in private equity securities and complex derivatives.
58 Scotiabank Third Quarter Report 2017
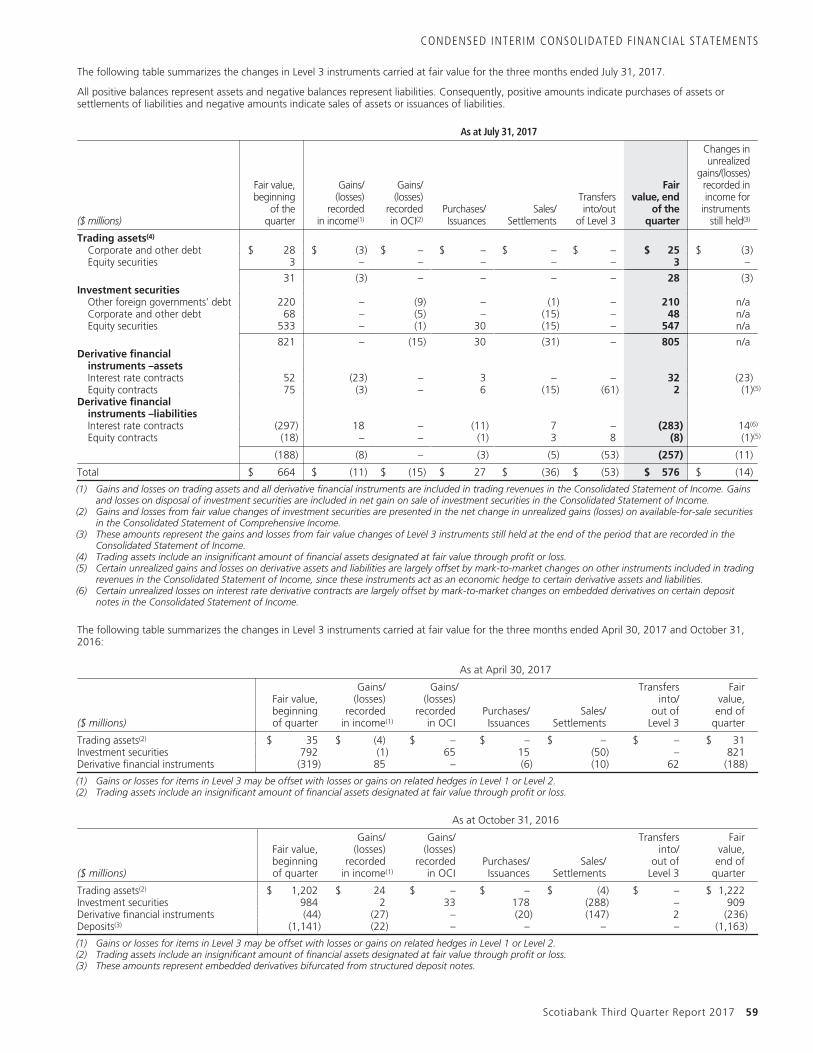
CONDENSED INTERIM CONSOLIDATED FINANCIAL STATEMENTS
The following table summarizes the changes in Level 3 instruments carried at fair value for the three months ended July 31, 2017.
All positive balances represent assets and negative balances represent liabilities. Consequently, positive amounts indicate purchases of assets orsettlements of liabilities and negative amounts indicate sales of assets or issuances of liabilities.
As at July 31, 2017
($ millions)
Fair value,beginning
of thequarter
Gains/(losses)
recordedin income(1)
Gains/(losses)
recordedin OCI(2)
Purchases/Issuances
Sales/Settlements
Transfersinto/out
of Level 3
Fairvalue, end
of thequarter
Changes inunrealized
gains/(losses)recorded inincome for
instrumentsstill held(3)
Trading assets(4)
Corporate and other debt $ 28 $ (3) $ – $ – $ – $ – $ 25 $ (3)Equity securities 3 – – – – – 3 –
31 (3) – – – – 28 (3)Investment securities
Other foreign governments’ debt 220 – (9) – (1) – 210 n/aCorporate and other debt 68 – (5) – (15) – 48 n/aEquity securities 533 – (1) 30 (15) – 547 n/a
821 – (15) 30 (31) – 805 n/aDerivative financial
instruments –assetsInterest rate contracts 52 (23) – 3 – – 32 (23)Equity contracts 75 (3) – 6 (15) (61) 2 (1)(5)
Derivative financialinstruments –liabilitiesInterest rate contracts (297) 18 – (11) 7 – (283) 14(6)
Equity contracts (18) – – (1) 3 8 (8) (1)(5)
(188) (8) – (3) (5) (53) (257) (11)
Total $ 664 $ (11) $ (15) $ 27 $ (36) $ (53) $ 576 $ (14)
(1) Gains and losses on trading assets and all derivative financial instruments are included in trading revenues in the Consolidated Statement of Income. Gainsand losses on disposal of investment securities are included in net gain on sale of investment securities in the Consolidated Statement of Income.
(2) Gains and losses from fair value changes of investment securities are presented in the net change in unrealized gains (losses) on available-for-sale securitiesin the Consolidated Statement of Comprehensive Income.
(3) These amounts represent the gains and losses from fair value changes of Level 3 instruments still held at the end of the period that are recorded in theConsolidated Statement of Income.
(4) Trading assets include an insignificant amount of financial assets designated at fair value through profit or loss.(5) Certain unrealized gains and losses on derivative assets and liabilities are largely offset by mark-to-market changes on other instruments included in trading
revenues in the Consolidated Statement of Income, since these instruments act as an economic hedge to certain derivative assets and liabilities.(6) Certain unrealized losses on interest rate derivative contracts are largely offset by mark-to-market changes on embedded derivatives on certain deposit
notes in the Consolidated Statement of Income.
The following table summarizes the changes in Level 3 instruments carried at fair value for the three months ended April 30, 2017 and October 31,2016:
As at April 30, 2017
($ millions)
Fair value,beginningof quarter
Gains/(losses)
recordedin income(1)
Gains/(losses)
recordedin OCI
Purchases/Issuances
Sales/Settlements
Transfersinto/
out ofLevel 3
Fairvalue,end of
quarter
Trading assets(2) $ 35 $ (4) $ – $ – $ – $ – $ 31Investment securities 792 (1) 65 15 (50) – 821Derivative financial instruments (319) 85 – (6) (10) 62 (188)
(1) Gains or losses for items in Level 3 may be offset with losses or gains on related hedges in Level 1 or Level 2.(2) Trading assets include an insignificant amount of financial assets designated at fair value through profit or loss.
As at October 31, 2016
($ millions)
Fair value,beginningof quarter
Gains/(losses)
recordedin income(1)
Gains/(losses)
recordedin OCI
Purchases/Issuances
Sales/Settlements
Transfersinto/
out ofLevel 3
Fairvalue,end of
quarter
Trading assets(2) $ 1,202 $ 24 $ – $ – $ (4) $ – $ 1,222Investment securities 984 2 33 178 (288) – 909Derivative financial instruments (44) (27) – (20) (147) 2 (236)Deposits(3) (1,141) (22) – – – – (1,163)
(1) Gains or losses for items in Level 3 may be offset with losses or gains on related hedges in Level 1 or Level 2.(2) Trading assets include an insignificant amount of financial assets designated at fair value through profit or loss.(3) These amounts represent embedded derivatives bifurcated from structured deposit notes.
Scotiabank Third Quarter Report 2017 59
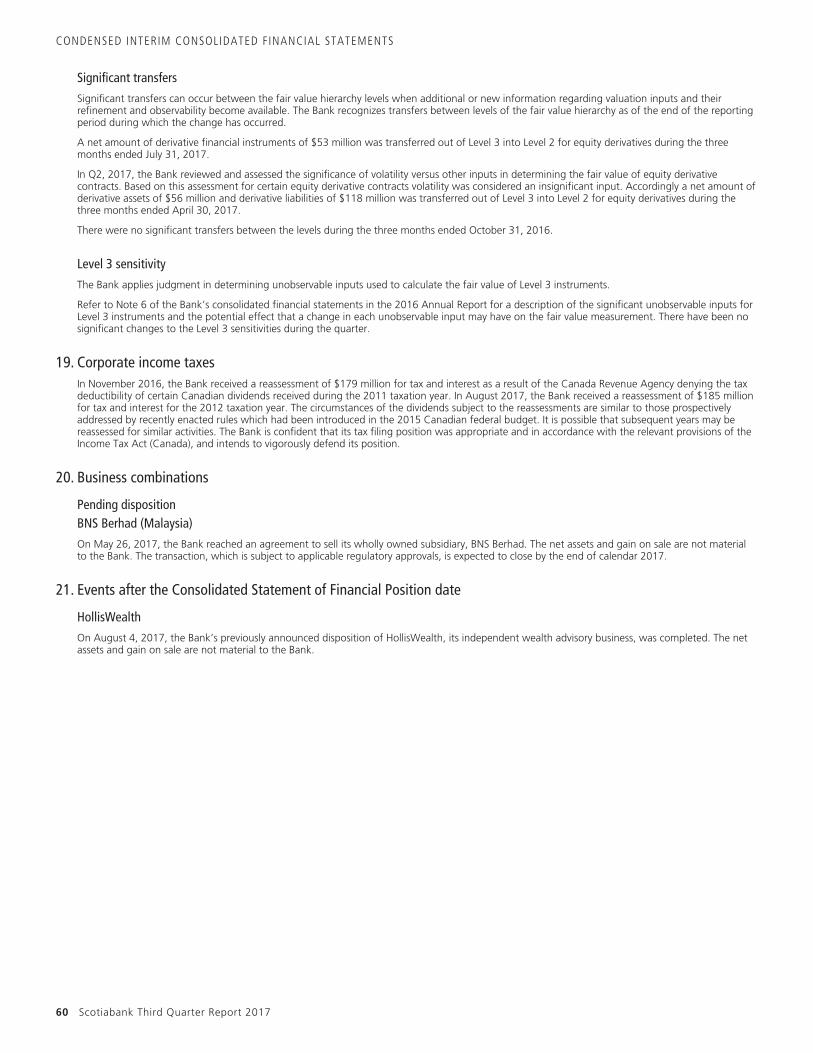
CONDENSED INTERIM CONSOLIDATED FINANCIAL STATEMENTS
Significant transfers
Significant transfers can occur between the fair value hierarchy levels when additional or new information regarding valuation inputs and theirrefinement and observability become available. The Bank recognizes transfers between levels of the fair value hierarchy as of the end of the reportingperiod during which the change has occurred.
A net amount of derivative financial instruments of $53 million was transferred out of Level 3 into Level 2 for equity derivatives during the threemonths ended July 31, 2017.
In Q2, 2017, the Bank reviewed and assessed the significance of volatility versus other inputs in determining the fair value of equity derivativecontracts. Based on this assessment for certain equity derivative contracts volatility was considered an insignificant input. Accordingly a net amount ofderivative assets of $56 million and derivative liabilities of $118 million was transferred out of Level 3 into Level 2 for equity derivatives during thethree months ended April 30, 2017.
There were no significant transfers between the levels during the three months ended October 31, 2016.
Level 3 sensitivity
The Bank applies judgment in determining unobservable inputs used to calculate the fair value of Level 3 instruments.
Refer to Note 6 of the Bank’s consolidated financial statements in the 2016 Annual Report for a description of the significant unobservable inputs forLevel 3 instruments and the potential effect that a change in each unobservable input may have on the fair value measurement. There have been nosignificant changes to the Level 3 sensitivities during the quarter.
19. Corporate income taxesIn November 2016, the Bank received a reassessment of $179 million for tax and interest as a result of the Canada Revenue Agency denying the taxdeductibility of certain Canadian dividends received during the 2011 taxation year. In August 2017, the Bank received a reassessment of $185 millionfor tax and interest for the 2012 taxation year. The circumstances of the dividends subject to the reassessments are similar to those prospectivelyaddressed by recently enacted rules which had been introduced in the 2015 Canadian federal budget. It is possible that subsequent years may bereassessed for similar activities. The Bank is confident that its tax filing position was appropriate and in accordance with the relevant provisions of theIncome Tax Act (Canada), and intends to vigorously defend its position.
20. Business combinations
Pending dispositionBNS Berhad (Malaysia)
On May 26, 2017, the Bank reached an agreement to sell its wholly owned subsidiary, BNS Berhad. The net assets and gain on sale are not materialto the Bank. The transaction, which is subject to applicable regulatory approvals, is expected to close by the end of calendar 2017.
21. Events after the Consolidated Statement of Financial Position date
HollisWealth
On August 4, 2017, the Bank’s previously announced disposition of HollisWealth, its independent wealth advisory business, was completed. The netassets and gain on sale are not material to the Bank.
60 Scotiabank Third Quarter Report 2017
SHAREHOLDER INFORMATION
Direct deposit serviceShareholders may have dividends deposited directly into accounts held at financial institutions which are members of the Canadian Payments Association. Toarrange direct deposit service, please write to the transfer agent.
Dividend and Share Purchase PlanScotiabank’s dividend reinvestment and share purchase plan allows common and preferred shareholders to purchase additional common shares by reinvestingtheir cash dividend without incurring brokerage or administrative fees.
As well, eligible shareholders may invest up to $20,000 each fiscal year to purchase additional common shares of the Bank. All administrative costs ofthe plan are paid by the Bank.
For more information on participation in the plan, please contact the transfer agent.
Dividend dates for 2017Record and payment dates for common and preferred shares, subject to approval by the Board of Directors.
Record Date Payment DateJanuary 3, 2017 January 27, 2017April 4, 2017 April 26, 2017July 4, 2017 July 27, 2017October 3, 2017 October 27, 2017
Annual Meeting date for fiscal 2017The Annual Meeting for fiscal year 2017 is scheduled for April 10, 2018, in Toronto, Ontario, Canada.
Duplicated communicationIf your shareholdings are registered under more than one name or address, multiple mailings will result. To eliminate this duplication, please write to the transferagent to combine the accounts.
Normal Course Issuer BidA copy of the Notice of Intention to commence the Normal Course Issuer Bid is available without charge by contacting the Secretary’s Department at(416) 866-3672.
WebsiteFor information relating to Scotiabank and its services, visit us at our website: www.scotiabank.com.
Conference call and Web broadcastThe quarterly results conference call will take place on August 29, 2017, at 8:00 am EST and is expected to last approximately one hour. Interested parties areinvited to access the call live, in listen-only mode, by telephone, toll-free, at (416) 640-5944 or 1-800-274-0251 and enter the access code 6751615# (pleasecall five to 15 minutes in advance). In addition, an audio webcast, with accompanying slide presentation, may be accessed via the Investor Relations page ofwww.scotiabank.com. Following discussion of the results by Scotiabank executives, there will be a question and answer session.
A telephone replay of the conference call will be available from August 29, 2017, to September 13, 2017, by calling (647) 436-0148 or 1-888-203-1112(North America toll-free) and entering the access code 6751615#. The archived audio webcast will be available on the Bank’s website for three months.
Contact information
Investors:Financial analysts, portfolio managers and other investors requiring financial information, please contact Investor Relations, Finance Department:
ScotiabankScotia Plaza, 44 King Street WestToronto, Ontario, Canada M5H 1H1Telephone: (416) 775-0798Fax: (416) 866-7867E-mail: [email protected]
Media:For media enquiries, please contact the Global Communications Department at the above address.
Telephone: (416) 866-6806Fax: (416) 866-4988E-mail: [email protected]
Scotiabank Third Quarter Report 2017 61
SHAREHOLDER INFORMATION
Shareholders:For enquiries related to changes in share registration or address, dividend information, lost share certificates, estate transfers, or to advise of duplicate mailings,please contact the Bank’s transfer agent:
Computershare Trust Company of Canada100 University Avenue, 8th FloorToronto, Ontario, Canada M5J 2Y1Telephone: 1-877-982-8767Fax: 1-888-453-0330E-mail: [email protected]
Co-Transfer Agent (U.S.A.)Computershare Trust Company N.A.250 Royall StreetCanton, MA 02021 U.S.A.Telephone: 1-800-962-4284
For other shareholder enquiries, please contact the Finance Department:ScotiabankScotia Plaza, 44 King Street WestToronto, Ontario, Canada M5H 1H1Telephone: (416) 866-4790Fax: (647) 777-1184E-mail: [email protected]
Rapport trimestriel disponible en françaisLe Rapport annuel et les états financiers de la Banque sont publiés en français et en anglais et distribués aux actionnaires dans la version de leur choix. Si vouspréférez que la documentation vous concernant vous soit adressée en français, veuillez en informer Relations publiques, Affaires de la société et Affairesgouvernementales, La Banque de Nouvelle-Écosse, Scotia Plaza, 44, rue King Ouest, Toronto (Ontario), Canada M5H 1H1, en joignant, si possible, l’étiquetted’adresse, afin que nous puissions prendre note du changement.
62 Scotiabank Third Quarter Report 2017

The Bank of Nova Scotia is incorporated in Canada with limited liability.