Third Quarter Results 2020 - Cemex
16
Third Quarter Results 2020 Stock Listing Information NYSE (ADS) Ticker: CX Mexican Stock Exchange Ticker: CEMEXCPO Ratio of CEMEXCPO to CX = 10:1 Investor Relations In the United States: + 1 877 7CX NYSE In Mexico: + 52 (81) 8888 4292 E-Mail: [email protected]
Transcript of Third Quarter Results 2020 - Cemex
Third Quarter Results 2020
Stock Listing Information
NYSE (ADS)
Ticker: CX
Mexican Stock Exchange
Ticker: CEMEXCPO
Ratio of CEMEXCPO to CX = 10:1
Investor Relations
In the United States:
+ 1 877 7CX NYSE
In Mexico:
+ 52 (81) 8888 4292
E-Mail: [email protected]
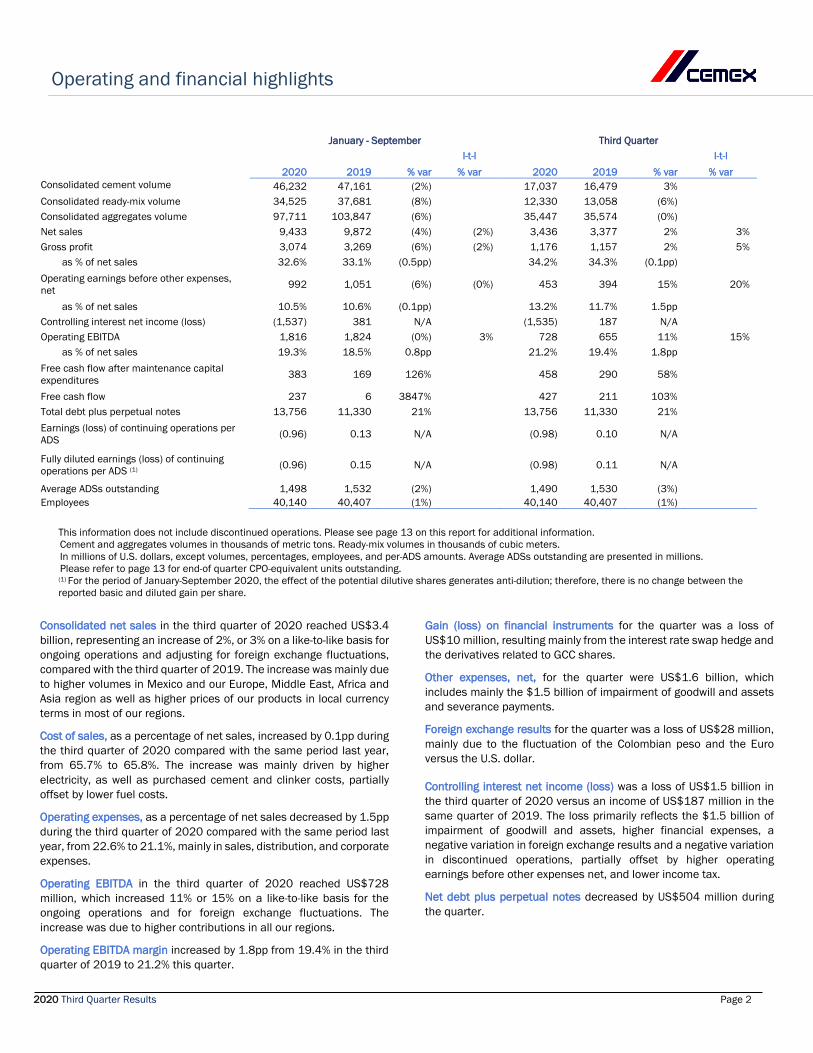
Operating and financial highlights
2020 Third Quarter Results Page 2
January - September Third Quarter
l-t-l l-t-l
2020 2019 % var % var 2020 2019 % var % var Consolidated cement volume 46,232 47,161 (2%) 17,037 16,479 3%
Consolidated ready-mix volume 34,525 37,681 (8%) 12,330 13,058 (6%)
Consolidated aggregates volume 97,711 103,847 (6%) 35,447 35,574 (0%)
Net sales 9,433 9,872 (4%) (2%) 3,436 3,377 2% 3% Gross profit 3,074 3,269 (6%) (2%) 1,176 1,157 2% 5%
as % of net sales 32.6% 33.1% (0.5pp) 34.2% 34.3% (0.1pp)
Operating earnings before other expenses, net 992 1,051 (6%) (0%) 453 394 15% 20%
as % of net sales 10.5% 10.6% (0.1pp) 13.2% 11.7% 1.5pp
Controlling interest net income (loss) (1,537) 381 N/A (1,535) 187 N/A
Operating EBITDA 1,816 1,824 (0%) 3% 728 655 11% 15% as % of net sales 19.3% 18.5% 0.8pp 21.2% 19.4% 1.8pp
Free cash flow after maintenance capital expenditures 383 169 126% 458 290 58%
Free cash flow 237 6 3847% 427 211 103%
Total debt plus perpetual notes 13,756 11,330 21% 13,756 11,330 21%
Earnings (loss) of continuing operations per ADS (0.96) 0.13 N/A (0.98) 0.10 N/A
Fully diluted earnings (loss) of continuing operations per ADS (1) (0.96) 0.15 N/A (0.98) 0.11 N/A
Average ADSs outstanding 1,498 1,532 (2%) 1,490 1,530 (3%)
Employees 40,140 40,407 (1%) 40,140 40,407 (1%)
Consolidated net sales in the third quarter of 2020 reached US$3.4 billion, representing an increase of 2%, or 3% on a like-to-like basis for ongoing operations and adjusting for foreign exchange fluctuations, compared with the third quarter of 2019. The increase was mainly due to higher volumes in Mexico and our Europe, Middle East, Africa and Asia region as well as higher prices of our products in local currency terms in most of our regions.
Cost of sales, as a percentage of net sales, increased by 0.1pp during the third quarter of 2020 compared with the same period last year, from 65.7% to 65.8%. The increase was mainly driven by higher electricity, as well as purchased cement and clinker costs, partially offset by lower fuel costs.
Operating expenses, as a percentage of net sales decreased by 1.5pp during the third quarter of 2020 compared with the same period last year, from 22.6% to 21.1%, mainly in sales, distribution, and corporate expenses.
Operating EBITDA in the third quarter of 2020 reached US$728 million, which increased 11% or 15% on a like-to-like basis for the ongoing operations and for foreign exchange fluctuations. The increase was due to higher contributions in all our regions.
Operating EBITDA margin increased by 1.8pp from 19.4% in the third quarter of 2019 to 21.2% this quarter.
Gain (loss) on financial instruments for the quarter was a loss of US$10 million, resulting mainly from the interest rate swap hedge and the derivatives related to GCC shares.
Other expenses, net, for the quarter were US$1.6 billion, which includes mainly the $1.5 billion of impairment of goodwill and assets and severance payments.
Foreign exchange results for the quarter was a loss of US$28 million, mainly due to the fluctuation of the Colombian peso and the Euro versus the U.S. dollar.
Controlling interest net income (loss) was a loss of US$1.5 billion in the third quarter of 2020 versus an income of US$187 million in the same quarter of 2019. The loss primarily reflects the $1.5 billion of impairment of goodwill and assets, higher financial expenses, a negative variation in foreign exchange results and a negative variation in discontinued operations, partially offset by higher operating earnings before other expenses net, and lower income tax.
Net debt plus perpetual notes decreased by US$504 million during the quarter.
This information does not include discontinued operations. Please see page 13 on this report for additional information. Cement and aggregates volumes in thousands of metric tons. Ready-mix volumes in thousands of cubic meters. In millions of U.S. dollars, except volumes, percentages, employees, and per-ADS amounts. Average ADSs outstanding are presented in millions. Please refer to page 13 for end-of quarter CPO-equivalent units outstanding.
(1) For the period of January-September 2020, the effect of the potential dilutive shares generates anti-dilution; therefore, there is no change between the reported basic and diluted gain per share.

Operating results
2020 Third Quarter Results Page 3
Mexico
January - September Third Quarter
2020 2019 % var l-t-l
% var 2020 2019 % var l-t-l % var
Net sales 1,976 2,175 (9%) 2% 723 716 1% 14% Operating EBITDA 662 740 (10%) 1% 246 240 3% 16% Operating EBITDA margin 33.5% 34.0% (0.5pp) 34.1% 33.5% 0.6pp
In millions of U.S. dollars, except percentages.
Domestic gray cement Ready-mix Aggregates
Year-over-year percentage variation January - September Third Quarter January - September Third Quarter January - September Third Quarter
Volume 2% 11% (20%) (13%) (14%) (5%) Price (USD) (10%) (8%) (11%) (12%) (6%) (4%) Price (local currency) 1% 3% (0%) (1%) 5% 8%
In Mexico, our cement volumes increased by 11%, while ready mix and aggregates dropped by 13% and 5%, respectively, during the quarter. Bagged cement continued its growth path supported by government social programs, home improvements and higher remittances. Formal construction activity increased as private sector and government infrastructure projects accelerate. During the quarter, our prices in local-currency terms remained flat on a sequential basis mainly due to a product mix effect.
United States
January - September Third Quarter
2020 2019 % var l-t-l % var 2020 2019 % var l-t-l
% var Net sales 2,983 2,846 5% 5% 1,012 998 1% 1% Operating EBITDA 560 480 17% 17% 199 186 7% 7% Operating EBITDA margin 18.8% 16.9% 1.9pp 19.7% 18.7% 1.0pp
In millions of U.S. dollars, except percentages.
Domestic gray cement Ready-mix Aggregates
Year-over-year percentage variation January - September Third Quarter January - September Third Quarter January - September Third Quarter
Volume 6% 3% (0%) (4%) 3% 2% Price (USD) 1% 0% 2% 1% 0% (3%) Price (local currency) 1% 0% 2% 1% 0% (3%)
The United States kept its strong momentum in the third quarter, driven primarily by a pickup in residential activity and growth in the infrastructure sector. Cement and aggregates volumes increased 3% and 2% respectively, while ready-mix decreased by 4%. During the quarter, pricing for cement, ready-mix and aggregates was stable sequentially. EBITDA margin expanded by one percentage point due to improved logistics, lower fuel costs and savings from “Operation Resilience”.

Operating results
2020 Third Quarter Results Page 4
Europe, Middle East, Africa and Asia
January - September Third Quarter
2020 2019 % var l-t-l
% var 2020 2019 % var l-t-l % var
Net sales 3,236 3,323 (3%) (4%) 1,238 1,150 8% 2% Operating EBITDA 471 483 (2%) (4%) 220 193 14% 8% Operating EBITDA margin 14.5% 14.5% 0.0pp 17.7% 16.8% 0.9pp
In millions of U.S. dollars, except percentages.
Domestic gray cement Ready-mix Aggregates
Year-over-year percentage variation January - September Third Quarter January - September Third Quarter January - September Third Quarter
Volume (3%) 1% (6%) (1%) (6%) 2% Price (USD) (0%) 4% 2% 7% 2% 8% Price (local currency) (*) (2%) (2%) 0% 1% 1% 2%
In our EMEAA region, EBITDA grew 8% YoY driven by Europe, Israel, and the Philippines. In Europe, our domestic gray cement volumes increased 2% while ready-mix decreased 4% and aggregates volumes remained flat during the quarter, on a year-over-year basis. Strong volume performance continued in Germany, Poland, and Czech Republic, while we saw a marked recovery in the UK, France, and Spain as economies opened. Prices in Europe for our three core products in local currency terms, were up both sequentially and on a year-over-year basis. In the Philippines, we experienced a sharp recovery of volumes in the quarter as the lockdown measures were lifted in late May. Our EBITDA margin in the Philippines went up 9 percentage points mainly due to cost containment measures and lower maintenance. Israel continued with its robust performance, again beating its record EBITDA which was just set in second quarter. In Egypt, despite government suspension of private residential construction permits, our volumes for the quarter were up YoY.
(*) Calculated on a volume-weighted-average basis at constant foreign-exchange rates

Operating results
2020 Third Quarter Results Page 5
South, Central America and the Caribbean
January - September Third Quarter
2020 2019 % var l-t-l
% var 2020 2019 % var l-t-l % var
Net sales 1,051 1,267 (17%) (12%) 395 417 (5%) 1% Operating EBITDA 266 284 (7%) (1%) 109 89 23% 31% Operating EBITDA margin 25.3% 22.4% 2.9pp 27.7% 21.4% 6.3pp
In millions of U.S. dollars, except percentages.
Domestic gray cement Ready-mix Aggregates
Year-over-year percentage variation January - September Third Quarter January - September Third Quarter January - September Third Quarter
Volume (13%) (1%) (37%) (26%) (39%) (28%) Price (USD) (2%) (2%) (11%) (13%) (2%) (5%) Price (local currency) (*) 5% 6% (2%) (5%) 7% 3%
In our South, Central America and the Caribbean region, cement volumes almost recovered to levels of last year. EBITDA margin increased 6.3 percentage points as a result of our cost reduction initiatives, higher prices in local currency terms and tailwinds from lower fuel prices. Cement prices declined 2% on a sequential basis mainly due to geographic mix. In Colombia, our quarterly cement volumes declined 6% reflecting the entrance of a new competitor into the market late last year. Industry volumes improved significantly almost reaching levels of the prior year. Construction activity was supported by the self-construction sector and 4G-highway projects. Our cement prices continued with favorable performance, as evidenced by the 8% and 2% year over year and sequential growth, respectively, in local-currency terms.
(*) Calculated on a volume-weighted-average basis at constant foreign-exchange rates

Operating results
2020 Third Quarter Results Page 6
Operating EBITDA and free cash flow
January - September Third Quarter
2020 2019 % var 2020 2019 % var
Operating earnings before other expenses, net 992 1,051 (6%) 453 394 15%
+ Depreciation and operating amortization 824 774 276 261
Operating EBITDA 1,816 1,824 (0%) 728 655 11%
- Net financial expense 542 522 187 169
- Maintenance capital expenditures 320 441 103 176
- Change in working capital 344 563 (136) (7)
- Taxes paid 115 142 34 31
- Other cash items (net) 126 40 83 23
- Free cash flow discontinued operations (14) (53) (1) (27)
Free cash flow after maintenance capital expenditures 383 169 126% 458 290 58%
- Strategic capital expenditures 147 163 32 80
Free cash flow 237 6 3847% 427 211 103%
In millions of U.S. dollars, except percentages.
Due to higher EBITDA and proactive working capital management and lower maintenance capex, we generated US$458 million of free cash flow after maintenance capex and US$427 million of free cash flow during the third quarter. Average working capital days on a YoY basis have improved from -6 in 3rd quarter 2019 to -12 days in 3rd quarter 2020. Our leverage ratio was reduced by 0.30 times on a sequential basis due to a decrease in net debt and an improvement in the trailing twelve months EBITDA, placing us at a lower interest rate level within the margin grid for our Facilities Agreement debt
Information on debt and perpetual notes
Second Quarter
Third Quarter Third Quarter 2020 2019 % var 2020 2020 2019 Total debt (1) 13,310 10,889 22% 13,196 Currency denomination Short-term 22% 10% 6% U.S. dollar 71% 68% Long-term 78% 90% 94% Euro 21% 23% Perpetual notes 446 441 1% 443 Mexican peso 1% 1% Total debt plus perpetual notes 13,756 11,330 21% 13,638 Other 7% 8% Cash and cash equivalents 3,453 299 1055% 2,832 Net debt plus perpetual notes 10,303 11,031 (7%) 10,807 Interest rate(3) Fixed 79% 75%
Consolidated funded debt (2) 10,337 10,624 10,790 Variable 21% 25%
Consolidated leverage ratio (2) 4.27 4.05 4.57 Consolidated coverage ratio (2) 3.69 4.03 3.69 In millions of U.S. dollars, except percentages and ratios.
(1) Includes leases, in accordance with International Financial Reporting Standards (IFRS). (2) Calculated in accordance with our contractual obligations under the 2017 Facilities Agreement, as amended and restated. (3) Includes the effect of interest-rate swap instruments related to bank loans to fix floating rates with a nominal amount of US$1,000 million.
Operating results
2020 Third Quarter Results Page 7
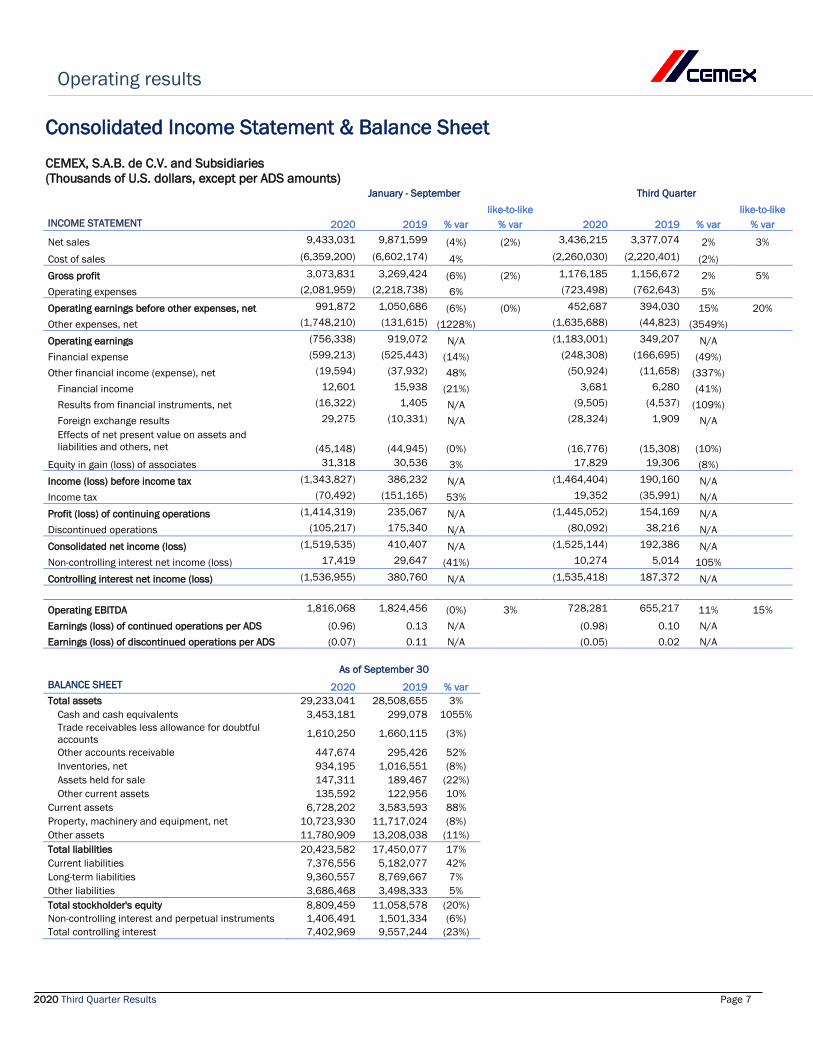
Consolidated Income Statement & Balance Sheet CEMEX, S.A.B. de C.V. and Subsidiaries (Thousands of U.S. dollars, except per ADS amounts)
January - September Third Quarter like-to-like like-to-like INCOME STATEMENT 2020 2019 % var % var 2020 2019 % var % var
Net sales 9,433,031 9,871,599 (4%) (2%) 3,436,215 3,377,074 2% 3% Cost of sales (6,359,200) (6,602,174) 4% (2,260,030) (2,220,401) (2%) Gross profit 3,073,831 3,269,424 (6%) (2%) 1,176,185 1,156,672 2% 5% Operating expenses (2,081,959) (2,218,738) 6% (723,498) (762,643) 5% Operating earnings before other expenses, net 991,872 1,050,686 (6%) (0%) 452,687 394,030 15% 20% Other expenses, net (1,748,210) (131,615) (1228%) (1,635,688) (44,823) (3549%) Operating earnings (756,338) 919,072 N/A (1,183,001) 349,207 N/A Financial expense (599,213) (525,443) (14%) (248,308) (166,695) (49%) Other financial income (expense), net (19,594) (37,932) 48% (50,924) (11,658) (337%) Financial income 12,601 15,938 (21%) 3,681 6,280 (41%) Results from financial instruments, net (16,322) 1,405 N/A (9,505) (4,537) (109%) Foreign exchange results 29,275 (10,331) N/A (28,324) 1,909 N/A
Effects of net present value on assets and liabilities and others, net (45,148) (44,945) (0%) (16,776) (15,308) (10%)
Equity in gain (loss) of associates 31,318 30,536 3% 17,829 19,306 (8%) Income (loss) before income tax (1,343,827) 386,232 N/A (1,464,404) 190,160 N/A Income tax (70,492) (151,165) 53% 19,352 (35,991) N/A Profit (loss) of continuing operations (1,414,319) 235,067 N/A (1,445,052) 154,169 N/A Discontinued operations (105,217) 175,340 N/A (80,092) 38,216 N/A Consolidated net income (loss) (1,519,535) 410,407 N/A (1,525,144) 192,386 N/A Non-controlling interest net income (loss) 17,419 29,647 (41%) 10,274 5,014 105% Controlling interest net income (loss) (1,536,955) 380,760 N/A (1,535,418) 187,372 N/A Operating EBITDA 1,816,068 1,824,456 (0%) 3% 728,281 655,217 11% 15% Earnings (loss) of continued operations per ADS (0.96) 0.13 N/A (0.98) 0.10 N/A Earnings (loss) of discontinued operations per ADS (0.07) 0.11 N/A (0.05) 0.02 N/A As of September 30 BALANCE SHEET 2020 2019 % var
Total assets 29,233,041 28,508,655 3% Cash and cash equivalents 3,453,181 299,078 1055%
Trade receivables less allowance for doubtful
accounts 1,610,250 1,660,115 (3%)
Other accounts receivable 447,674 295,426 52% Inventories, net 934,195 1,016,551 (8%) Assets held for sale 147,311 189,467 (22%) Other current assets 135,592 122,956 10% Current assets 6,728,202 3,583,593 88% Property, machinery and equipment, net 10,723,930 11,717,024 (8%) Other assets 11,780,909 13,208,038 (11%) Total liabilities 20,423,582 17,450,077 17% Current liabilities 7,376,556 5,182,077 42% Long-term liabilities 9,360,557 8,769,667 7% Other liabilities 3,686,468 3,498,333 5% Total stockholder's equity 8,809,459 11,058,578 (20%) Non-controlling interest and perpetual instruments 1,406,491 1,501,334 (6%) Total controlling interest 7,402,969 9,557,244 (23%)
Operating results
2020 Third Quarter Results Page 8
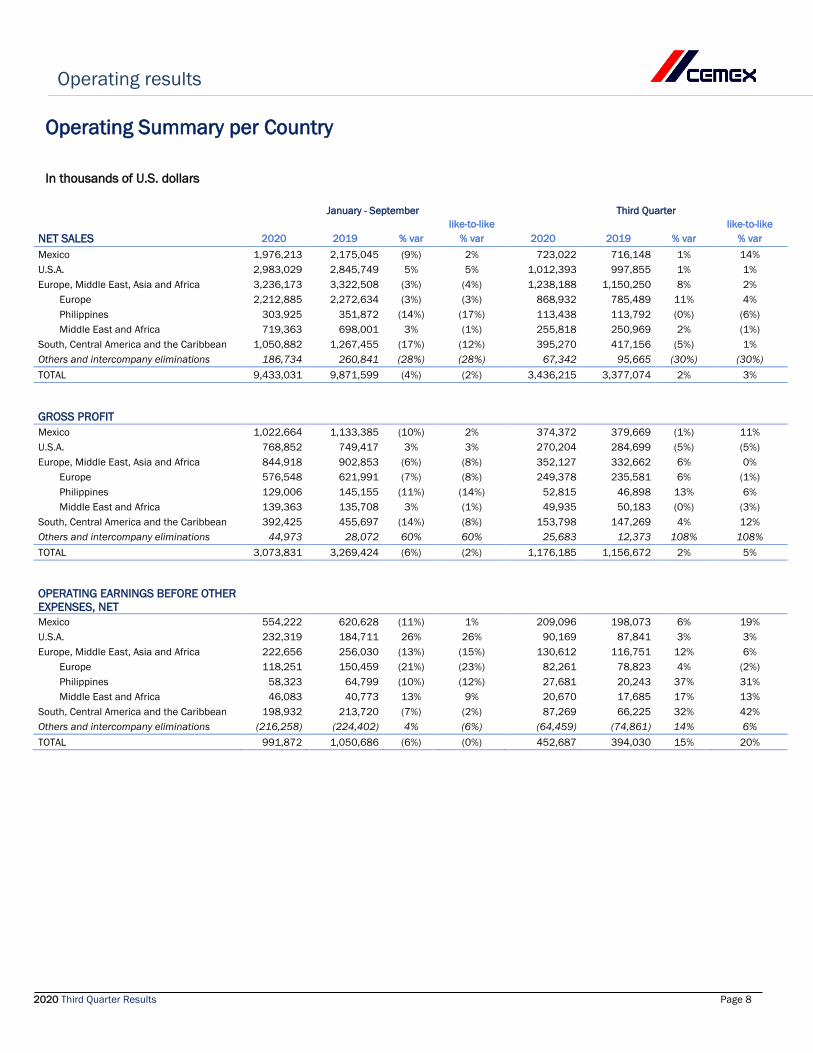
Operating Summary per Country In thousands of U.S. dollars
January - September Third Quarter like-to-like like-to-like
NET SALES 2020 2019 % var % var 2020 2019 % var % var Mexico 1,976,213 2,175,045 (9%) 2% 723,022 716,148 1% 14% U.S.A. 2,983,029 2,845,749 5% 5% 1,012,393 997,855 1% 1% Europe, Middle East, Asia and Africa 3,236,173 3,322,508 (3%) (4%) 1,238,188 1,150,250 8% 2%
Europe 2,212,885 2,272,634 (3%) (3%) 868,932 785,489 11% 4% Philippines 303,925 351,872 (14%) (17%) 113,438 113,792 (0%) (6%) Middle East and Africa 719,363 698,001 3% (1%) 255,818 250,969 2% (1%)
South, Central America and the Caribbean 1,050,882 1,267,455 (17%) (12%) 395,270 417,156 (5%) 1% Others and intercompany eliminations 186,734 260,841 (28%) (28%) 67,342 95,665 (30%) (30%) TOTAL 9,433,031 9,871,599 (4%) (2%) 3,436,215 3,377,074 2% 3%
GROSS PROFIT Mexico 1,022,664 1,133,385 (10%) 2% 374,372 379,669 (1%) 11% U.S.A. 768,852 749,417 3% 3% 270,204 284,699 (5%) (5%) Europe, Middle East, Asia and Africa 844,918 902,853 (6%) (8%) 352,127 332,662 6% 0%
Europe 576,548 621,991 (7%) (8%) 249,378 235,581 6% (1%) Philippines 129,006 145,155 (11%) (14%) 52,815 46,898 13% 6% Middle East and Africa 139,363 135,708 3% (1%) 49,935 50,183 (0%) (3%)
South, Central America and the Caribbean 392,425 455,697 (14%) (8%) 153,798 147,269 4% 12% Others and intercompany eliminations 44,973 28,072 60% 60% 25,683 12,373 108% 108% TOTAL 3,073,831 3,269,424 (6%) (2%) 1,176,185 1,156,672 2% 5%
OPERATING EARNINGS BEFORE OTHER EXPENSES, NET
Mexico 554,222 620,628 (11%) 1% 209,096 198,073 6% 19% U.S.A. 232,319 184,711 26% 26% 90,169 87,841 3% 3% Europe, Middle East, Asia and Africa 222,656 256,030 (13%) (15%) 130,612 116,751 12% 6%
Europe 118,251 150,459 (21%) (23%) 82,261 78,823 4% (2%) Philippines 58,323 64,799 (10%) (12%) 27,681 20,243 37% 31% Middle East and Africa 46,083 40,773 13% 9% 20,670 17,685 17% 13%
South, Central America and the Caribbean 198,932 213,720 (7%) (2%) 87,269 66,225 32% 42% Others and intercompany eliminations (216,258) (224,402) 4% (6%) (64,459) (74,861) 14% 6% TOTAL 991,872 1,050,686 (6%) (0%) 452,687 394,030 15% 20%

Operating results
2020 Third Quarter Results Page 9
Operating Summary per Country EBITDA in thousands of U.S. dollars. EBITDA margin as a percentage of net sales.
January - September Third Quarter
like-to-like like-to-like OPERATING EBITDA 2020 2019 % var % var 2020 2019 % var % var Mexico 662,475 739,665 (10%) 1% 246,307 239,892 3% 16% U.S.A. 560,418 480,330 17% 17% 199,067 186,225 7% 7% Europe, Middle East, Asia and Africa 470,735 482,654 (2%) (4%) 219,696 192,854 14% 8%
Europe 292,755 316,689 (8%) (9%) 145,550 134,346 8% 2% Philippines 93,035 91,990 1% (2%) 39,532 29,442 34% 28% Middle East and Africa 84,945 73,976 15% 11% 34,614 29,065 19% 16%
South, Central America and the Caribbean 265,622 284,487 (7%) (1%) 109,358 89,245 23% 31% Others and intercompany eliminations (143,183) (162,682) 12% (1%) (46,146) (52,999) 13% 2% TOTAL 1,816,068 1,824,456 (0%) 3% 728,281 655,217 11% 15%
OPERATING EBITDA MARGIN
Mexico 33.5% 34.0% 34.1% 33.5% U.S.A. 18.8% 16.9% 19.7% 18.7% Europe, Middle East, Asia and Africa 14.5% 14.5% 17.7% 16.8%
Europe 13.2% 13.9% 16.8% 17.1% Philippines 30.6% 26.1% 34.8% 25.9% Middle East and Africa 11.8% 10.6% 13.5% 11.6%
South, Central America and the Caribbean 25.3% 22.4% 27.7% 21.4% TOTAL 19.3% 18.5% 21.2% 19.4%

Operating results
2020 Third Quarter Results Page 10
Volume Summary Consolidated volume summary
Cement and aggregates: Thousands of metric tons.
Ready-mix: Thousands of cubic meters.
January -
September Third Quarter
2020 2019 % var 2020 2019 % var Consolidated cement volume (1) 46,232 47,161 (2%) 17,037 16,479 3% Consolidated ready-mix volume 34,525 37,681 (8%) 12,330 13,058 (6%) Consolidated aggregates volume (2) 97,711 103,847 (6%) 35,447 35,574 (0%)
Per-country volume summary
January -
September Third Quarter Third Quarter 2020 vs.
DOMESTIC GRAY CEMENT VOLUME 2020 vs. 2019 2020 vs. 2019 Second Quarter 2020 Mexico 2% 11% 18%
U.S.A. 6% 3% (2%) Europe, Middle East, Asia and Africa (3%) 1% 17%
Europe 1% 2% 8% Philippines (12%) (3%) 38% Middle East and Africa (1%) 1% 21%
South, Central America and the Caribbean (13%) (1%) 41% READY-MIX VOLUME
Mexico (20%) (13%) 58% U.S.A. (0%) (4%) (0%) Europe, Middle East, Asia and Africa (6%) (1%) 16%
Europe (10%) (4%) 16% Philippines N/A N/A N/A Middle East and Africa 2% 2% 16%
South, Central America and the Caribbean (37%) (26%) 91% AGGREGATES VOLUME Mexico (14%) (5%) 60% U.S.A. 3% 2% 1% Europe, Middle East, Asia and Africa (6%) 2% 16%
Europe (9%) 0% 18% Philippines N/A N/A N/A Middle East and Africa 9% 12% 7%
South, Central America and the Caribbean (39%) (28%) 85%
(1) Consolidated cement volume includes domestic and export volume of gray cement, white cement, special cement, mortar and clinker. (2) Consolidated aggregates volumes include aggregates from our marine business in UK.

Operating results
2020 Third Quarter Results Page 11
Price Summary
Variation in U.S. dollars January - September Third Quarter Third Quarter 2020 vs.
DOMESTIC GRAY CEMENT PRICE 2020 vs. 2019 2020 vs. 2019 Second Quarter 2020
Mexico (10%) (8%) 4% U.S.A. 1% 0% 0% Europe, Middle East, Asia and Africa (*) (0%) 4% 4%
Europe (*) 2% 9% 8% Philippines (2%) 2% 4% Middle East and Africa (*) (8%) (18%) (11%)
South, Central America and the Caribbean (*) (2%) (2%) (3%) READY-MIX PRICE
Mexico (11%) (12%) 4% U.S.A. 2% 1% 0% Europe, Middle East, Asia and Africa (*) 2% 7% 7%
Europe (*) 1% 10% 10% Philippines N/A N/A N/A Middle East and Africa (*) 4% 2% 0%
South, Central America and the Caribbean (*) (11%) (13%) (4%) AGGREGATES PRICE
Mexico (6%) (4%) 7% U.S.A. 0% (3%) (1%) Europe, Middle East, Asia and Africa (*) 2% 8% 8%
Europe (*) 2% 9% 10% Philippines N/A N/A N/A Middle East and Africa (*) 8% 5% 3%
South, Central America and the Caribbean (*) (2%) (5%) 2% (*) Price variation in U.S. dollars calculated on a volume-weighted-average basis; price variation in local currency calculated on a volume-weighted-average basis at constant foreign-exchange rates

Operating results
2020 Third Quarter Results Page 12
Variation in Local Currency January - September Third Quarter Third Quarter 2020 vs. DOMESTIC GRAY CEMENT PRICE 2020 vs. 2019 2020 vs. 2019 Second Quarter 2020 Mexico 1% 3% 0% U.S.A. 1% 0% 0% Europe, Middle East, Asia and Africa (*) (2%) (2%) (1%)
Europe (*) 2% 3% 1% Philippines (5%) (3%) 0% Middle East and Africa (*) (14%) (21%) (11%)
South, Central America and the Caribbean (*) 5% 6% (2%) READY-MIX PRICE Mexico (0%) (1%) (0%) U.S.A. 2% 1% 0% Europe, Middle East, Asia and Africa (*) 0% 1% 1%
Europe (*) 1% 3% 3% Philippines N/A N/A N/A Middle East and Africa (*) 1% (1%) (2%)
South, Central America and the Caribbean (*) (2%) (5%) (4%) AGGREGATES PRICE Mexico 5% 8% 3% U.S.A. 0% (3%) (1%) Europe, Middle East, Asia and Africa (*) 1% 2% 2%
Europe (*) 1% 2% 3% Philippines N/A N/A N/A Middle East and Africa (*) 5% 2% 0%
South, Central America and the Caribbean (*) 7% 3% 2% (*) Price variation in U.S. dollars calculated on a volume-weighted-average basis; price variation in local currency calculated on a volume-weighted-average basis at constant foreign-exchange rates
Other information
2020 Third Quarter Results Page 13
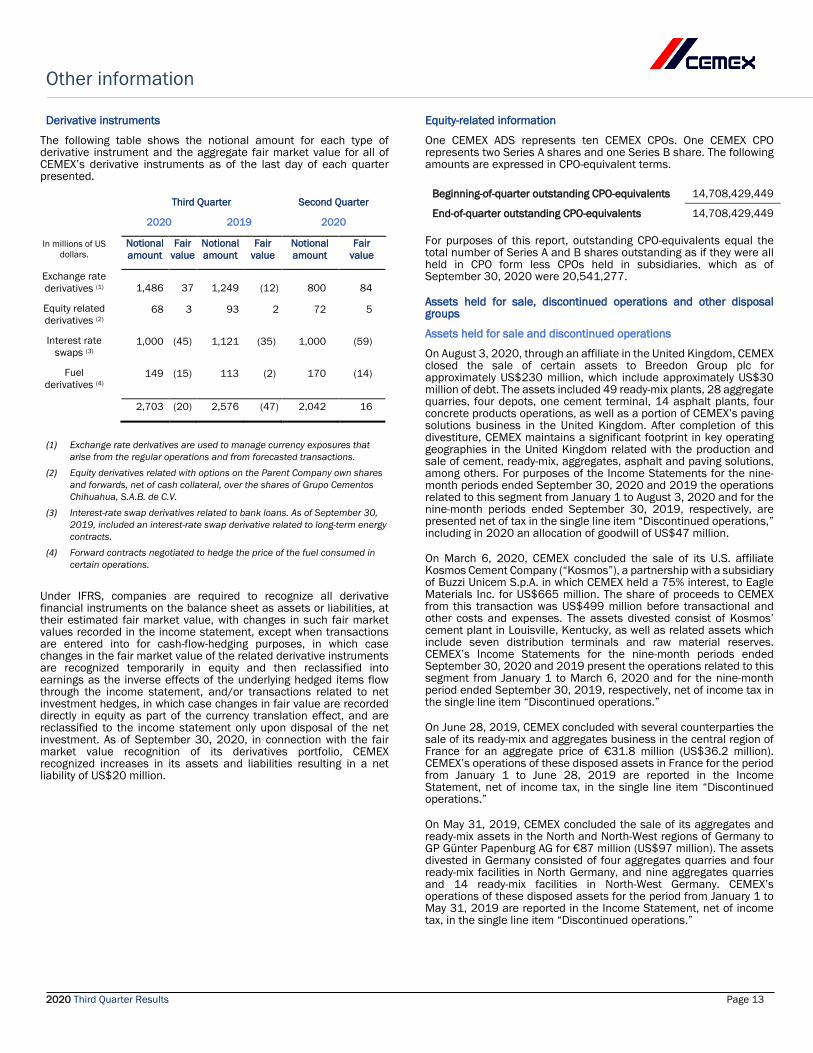
Derivative instruments
The following table shows the notional amount for each type of derivative instrument and the aggregate fair market value for all of CEMEX’s derivative instruments as of the last day of each quarter presented.
Third Quarter Second Quarter
2020 2019 2020
In millions of US dollars.
Notional amount
Fair value
Notional amount
Fair value
Notional amount
Fair value
Exchange rate derivatives (1) 1,486 37 1,249 (12) 800 84
Equity related derivatives (2)
68 3 93 2 72 5
Interest rate swaps (3)
1,000 (45) 1,121 (35) 1,000 (59)
Fuel derivatives (4)
149 (15) 113 (2) 170 (14)
2,703 (20) 2,576 (47) 2,042 16
(1) Exchange rate derivatives are used to manage currency exposures that
arise from the regular operations and from forecasted transactions. (2) Equity derivatives related with options on the Parent Company own shares
and forwards, net of cash collateral, over the shares of Grupo Cementos Chihuahua, S.A.B. de C.V.
(3) Interest-rate swap derivatives related to bank loans. As of September 30, 2019, included an interest-rate swap derivative related to long-term energy contracts.
(4) Forward contracts negotiated to hedge the price of the fuel consumed in certain operations.
Under IFRS, companies are required to recognize all derivative financial instruments on the balance sheet as assets or liabilities, at their estimated fair market value, with changes in such fair market values recorded in the income statement, except when transactions are entered into for cash-flow-hedging purposes, in which case changes in the fair market value of the related derivative instruments are recognized temporarily in equity and then reclassified into earnings as the inverse effects of the underlying hedged items flow through the income statement, and/or transactions related to net investment hedges, in which case changes in fair value are recorded directly in equity as part of the currency translation effect, and are reclassified to the income statement only upon disposal of the net investment. As of September 30, 2020, in connection with the fair market value recognition of its derivatives portfolio, CEMEX recognized increases in its assets and liabilities resulting in a net liability of US$20 million.
Equity-related information
One CEMEX ADS represents ten CEMEX CPOs. One CEMEX CPO represents two Series A shares and one Series B share. The following amounts are expressed in CPO-equivalent terms.
Beginning-of-quarter outstanding CPO-equivalents 14,708,429,449
End-of-quarter outstanding CPO-equivalents 14,708,429,449 For purposes of this report, outstanding CPO-equivalents equal the total number of Series A and B shares outstanding as if they were all held in CPO form less CPOs held in subsidiaries, which as of September 30, 2020 were 20,541,277.
Assets held for sale, discontinued operations and other disposal groups
Assets held for sale and discontinued operations
On August 3, 2020, through an affiliate in the United Kingdom, CEMEX closed the sale of certain assets to Breedon Group plc for approximately US$230 million, which include approximately US$30 million of debt. The assets included 49 ready-mix plants, 28 aggregate quarries, four depots, one cement terminal, 14 asphalt plants, four concrete products operations, as well as a portion of CEMEX’s paving solutions business in the United Kingdom. After completion of this divestiture, CEMEX maintains a significant footprint in key operating geographies in the United Kingdom related with the production and sale of cement, ready-mix, aggregates, asphalt and paving solutions, among others. For purposes of the Income Statements for the nine-month periods ended September 30, 2020 and 2019 the operations related to this segment from January 1 to August 3, 2020 and for the nine-month periods ended September 30, 2019, respectively, are presented net of tax in the single line item “Discontinued operations,” including in 2020 an allocation of goodwill of US$47 million.
On March 6, 2020, CEMEX concluded the sale of its U.S. affiliate Kosmos Cement Company (“Kosmos”), a partnership with a subsidiary of Buzzi Unicem S.p.A. in which CEMEX held a 75% interest, to Eagle Materials Inc. for US$665 million. The share of proceeds to CEMEX from this transaction was US$499 million before transactional and other costs and expenses. The assets divested consist of Kosmos’ cement plant in Louisville, Kentucky, as well as related assets which include seven distribution terminals and raw material reserves. CEMEX’s Income Statements for the nine-month periods ended September 30, 2020 and 2019 present the operations related to this segment from January 1 to March 6, 2020 and for the nine-month period ended September 30, 2019, respectively, net of income tax in the single line item “Discontinued operations.”
On June 28, 2019, CEMEX concluded with several counterparties the sale of its ready-mix and aggregates business in the central region of France for an aggregate price of €31.8 million (US$36.2 million). CEMEX’s operations of these disposed assets in France for the period from January 1 to June 28, 2019 are reported in the Income Statement, net of income tax, in the single line item “Discontinued operations.”
On May 31, 2019, CEMEX concluded the sale of its aggregates and ready-mix assets in the North and North-West regions of Germany to GP Günter Papenburg AG for €87 million (US$97 million). The assets divested in Germany consisted of four aggregates quarries and four ready-mix facilities in North Germany, and nine aggregates quarries and 14 ready-mix facilities in North-West Germany. CEMEX’s operations of these disposed assets for the period from January 1 to May 31, 2019 are reported in the Income Statement, net of income tax, in the single line item “Discontinued operations.”
Other information
2020 Third Quarter Results Page 14
On March 29, 2019, CEMEX closed the sale of assets in the Baltics and Nordics to the German building materials group Schwenk, for a price in euro equivalent of US$387 million. The Baltic assets divested consisted of one cement production plant in Broceni with a production capacity of approximately 1.7 million tons, four aggregates quarries, two cement quarries, six ready-mix plants, one marine terminal and one land distribution terminal in Latvia. The assets divested also included CEMEX’s 37.8% interest in Akmenes Cementas AB, owner of a cement production plant in Akmene in Lithuania with a production capacity of approximately 1.8 million tons, as well as the exports business to Estonia. The Nordic assets divested consisted of three import terminals in Finland, four import terminals in Norway and four import terminals in Sweden. CEMEX’s Income Statement for the six-month period ended June 30, 2019, include the operations of these disposed assets for the period from January 1 to March 29, 2019 net of income tax in the single line item “Discontinued operations,” including a gain on sale of US$66 million.
On March 29, 2019, CEMEX signed a binding agreement with Çimsa Çimento Sanayi Ve Ticaret A.Ş. to divest CEMEX’s white cement business, except for Mexico and the U.S., for a price of US$180 million, including its Buñol cement plant in Spain and its white cement customers list. CEMEX currently expects to close this transaction at the end of 2020 or early in 2021. As of September 30, 2020, the assets and liabilities associated with the white cement business were presented in the Statement of Financial Position within the line items of “assets and liabilities held for sale”, as correspond. Moreover, CEMEX’s operations of these assets in Spain for the nine-month periods ended September 30, 2020 and 2019 are reported in the Income Statements, net of income tax, in the single line item “Discontinued operations.”
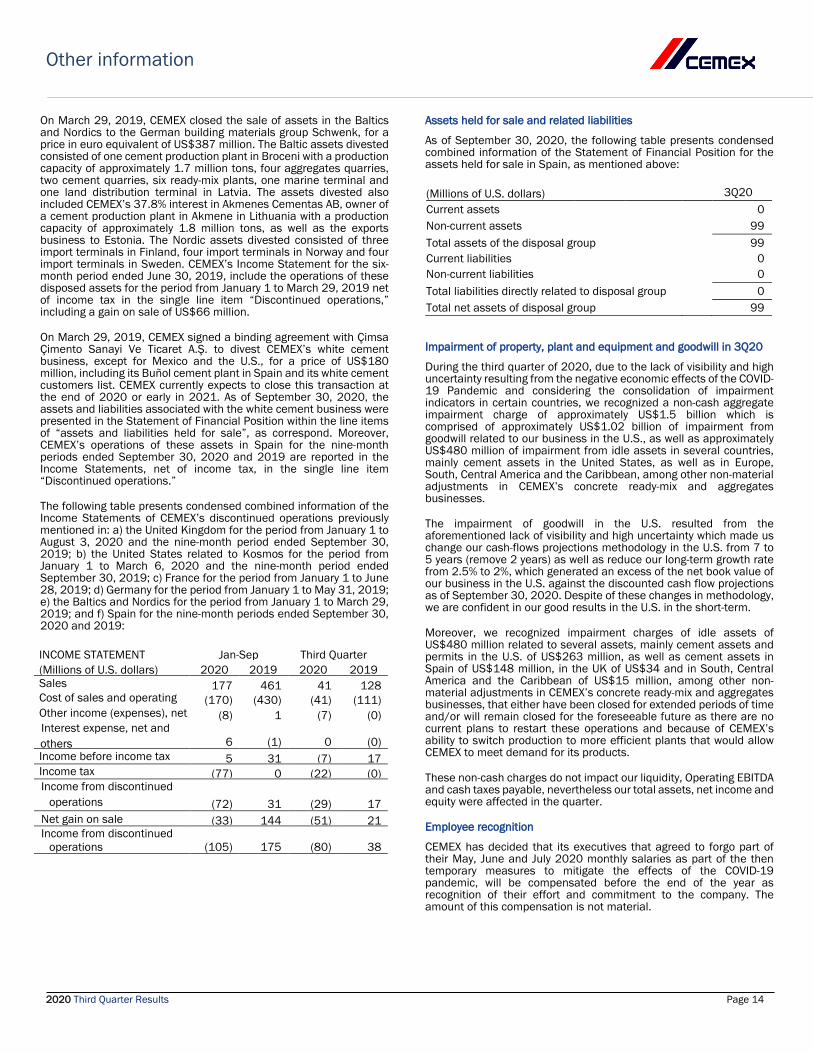
The following table presents condensed combined information of the Income Statements of CEMEX’s discontinued operations previously mentioned in: a) the United Kingdom for the period from January 1 to August 3, 2020 and the nine-month period ended September 30, 2019; b) the United States related to Kosmos for the period from January 1 to March 6, 2020 and the nine-month period ended September 30, 2019; c) France for the period from January 1 to June 28, 2019; d) Germany for the period from January 1 to May 31, 2019; e) the Baltics and Nordics for the period from January 1 to March 29, 2019; and f) Spain for the nine-month periods ended September 30, 2020 and 2019:
INCOME STATEMENT Jan-Sep Third Quarter (Millions of U.S. dollars) 2020 2019 2020 2019 Sales 177 461 41 128 Cost of sales and operating
(170) (430) (41) (111)
Other income (expenses), net (8) 1 (7) (0) Interest expense, net and others 6 (1) 0 (0) Income before income tax 5 31 (7) 17 Income tax (77) 0 (22) (0) Income from discontinued
operations (72) 31 (29) 17 Net gain on sale (33) 144 (51) 21 Income from discontinued
operations (105) 175 (80) 38
Assets held for sale and related liabilities
As of September 30, 2020, the following table presents condensed combined information of the Statement of Financial Position for the assets held for sale in Spain, as mentioned above:
(Millions of U.S. dollars) 3Q20 Current assets 0 Non-current assets 99 Total assets of the disposal group 99 Current liabilities 0 Non-current liabilities 0 Total liabilities directly related to disposal group 0 Total net assets of disposal group 99
Impairment of property, plant and equipment and goodwill in 3Q20
During the third quarter of 2020, due to the lack of visibility and high uncertainty resulting from the negative economic effects of the COVID-19 Pandemic and considering the consolidation of impairment indicators in certain countries, we recognized a non-cash aggregate impairment charge of approximately US$1.5 billion which is comprised of approximately US$1.02 billion of impairment from goodwill related to our business in the U.S., as well as approximately US$480 million of impairment from idle assets in several countries, mainly cement assets in the United States, as well as in Europe, South, Central America and the Caribbean, among other non-material adjustments in CEMEX’s concrete ready-mix and aggregates businesses.
The impairment of goodwill in the U.S. resulted from the aforementioned lack of visibility and high uncertainty which made us change our cash-flows projections methodology in the U.S. from 7 to 5 years (remove 2 years) as well as reduce our long-term growth rate from 2.5% to 2%, which generated an excess of the net book value of our business in the U.S. against the discounted cash flow projections as of September 30, 2020. Despite of these changes in methodology, we are confident in our good results in the U.S. in the short-term.
Moreover, we recognized impairment charges of idle assets of US$480 million related to several assets, mainly cement assets and permits in the U.S. of US$263 million, as well as cement assets in Spain of US$148 million, in the UK of US$34 and in South, Central America and the Caribbean of US$15 million, among other non-material adjustments in CEMEX’s concrete ready-mix and aggregates businesses, that either have been closed for extended periods of time and/or will remain closed for the foreseeable future as there are no current plans to restart these operations and because of CEMEX’s ability to switch production to more efficient plants that would allow CEMEX to meet demand for its products.
These non-cash charges do not impact our liquidity, Operating EBITDA and cash taxes payable, nevertheless our total assets, net income and equity were affected in the quarter.
Employee recognition
CEMEX has decided that its executives that agreed to forgo part of their May, June and July 2020 monthly salaries as part of the then temporary measures to mitigate the effects of the COVID-19 pandemic, will be compensated before the end of the year as recognition of their effort and commitment to the company. The amount of this compensation is not material.

Definitions of terms and disclosures
2020 Third Quarter Results Page 15
Methodology for translation, consolidation, and presentation of results
Under IFRS, CEMEX translates the financial statements of foreign subsidiaries using exchange rates at the reporting date for the balance sheet and the exchange rates at the end of each month for the income statement. Beginning on March 31, 2019 and for each subsequent period CEMEX reports its consolidated results in U.S. dollars. Breakdown of regions and subregions The South, Central America and the Caribbean region includes CEMEX’s operations in Argentina, Bahamas, Colombia, Costa Rica, the Dominican Republic, El Salvador, Guatemala, Guyana, Haiti, Jamaica, Trinidad & Tobago, Barbados, Nicaragua, Panama, Peru, and Puerto Rico, as well as trading operations in the Caribbean region. The EMEAA region includes Europe, Middle East, Asia and Africa. Europe subregion includes operations in Spain, Croatia, the Czech Republic, France, Germany, Poland, and the United Kingdom. Middle East and Africa subregion include the United Arab Emirates, Egypt, and Israel. Definition of terms Free cash flow equals operating EBITDA minus net interest expense, maintenance and strategic capital expenditures, change in working capital, taxes paid, and other cash items (net other expenses less proceeds from the disposal of obsolete and/or substantially depleted operating fixed assets that are no longer in operation and coupon payments on our perpetual notes). l-t-l (like to like) on a like-to-like basis adjusting for currency fluctuations and for investments/divestments when applicable.
Maintenance capital expenditures equal investments incurred for the purpose of ensuring the company’s operational continuity. These include capital expenditures on projects required to replace obsolete assets or maintain current operational levels, and mandatory capital expenditures, which are projects required to comply with governmental regulations or company policies. Net debt equals total debt (debt plus convertible bonds and financial leases) minus cash and cash equivalents. Operating EBITDA equals operating earnings before other expenses, net, plus depreciation and operating amortization. pp equals percentage points Prices all references to pricing initiatives, price increases or decreases, refer to our prices for our products Strategic capital expenditures equal investments incurred with the purpose of increasing the company’s profitability. These include capital expenditures on projects designed to increase profitability by expanding capacity, and margin improvement capital expenditures, which are projects designed to increase profitability by reducing costs. Working capital equals operating accounts receivable (including other current assets received as payment in kind) plus historical inventories minus operating payables. % var percentage variation Earnings per ADS Please refer to page 2 for the number of average ADSs outstanding used for the calculation of earnings per ADS.
According to the IAS 33 Earnings per share, the weighted-average number of common shares outstanding is determined considering the number of days during the accounting period in which the shares have been outstanding, including shares derived from corporate events that have modified the stockholder's equity structure during the period, such as increases in the number of shares by a public offering and the distribution of shares from stock dividends or recapitalizations of retained earnings and the potential diluted shares (Stock options, Restricted Stock Options and Mandatory Convertible Shares). The shares issued because of share dividends, recapitalizations and potential diluted shares are considered as issued at the beginning of the period.
Exchange rates January - September Third Quarter Third Quarter
2020 2019 2020 2019 2020 2019 Average Average Average Average End of period End of period
Mexican peso 21.96 19.39 22.08 19.64 22.11 19.73 Euro 0.8858 0.8925 0.8458 0.9061 0.853 0.9174 British pound 0.7837 0.7881 0.7623 0.8191 0.7741 0.8134
Amounts provided in units of local currency per U.S. dollar.
Disclaimer
2020 Third Quarter Results Page 16
This report contains, and the reports we will file in the future may contain, forward-looking statements within the meaning of the U.S. federal securities laws. We intend for these forward-looking statements to be covered by the safe harbor provisions for forward-looking statements within the meaning of the U.S. federal securities laws. In some cases, these statements can be identified by the use of forward-looking words such as “may,” “assume,” “might,” “should,” “could,” “continue,” “would,” “can,” “consider,” “anticipate,” “estimate,” “expect,” “envision,” “plan,” “believe,” “foresee,” “predict,” “potential,” “target,” “strategy,” “intend” or other similar words. These forward-looking statements reflect, as of the date such forward-looking statements are made, or unless otherwise indicated, our current expectations and projections about future events based on our knowledge of present facts and circumstances and assumptions about future events. These statements necessarily involve risks and uncertainties that could cause actual results to differ materially from our expectations. Some of the risks, uncertainties and other important factors that could cause results to differ, or that otherwise could have an impact on us or our consolidated entities, include, among other things: the cyclical activity of the construction sector; our exposure to other sectors that impact our and our clients’ businesses, such as, but not limited to, the energy sector; availability of raw materials and related fluctuating prices; competition in the markets in which we offer our products and services; general political, social, health, economic and business conditions in the markets in which we operate or that affect our operations and any significant economic, health, political or social developments in those markets, as well as any inherent risks to international operations; the regulatory environment, including environmental, tax, antitrust, and acquisition-related rules and regulations; our ability to satisfy our obligations under our material debt agreements, the indentures that govern our outstanding senior secured notes and our other debt instruments and financial obligations; the availability of short-term credit lines or working capital facilities, which can assist us in connection with market cycles; the impact of our below investment grade debt rating on our cost of capital; loss of reputation of our brands; our ability to consummate asset sales, fully integrate newly acquired businesses, achieve cost-savings from our cost-reduction initiatives, implement our global pricing initiatives for our products and generally meet our “A Stronger CEMEX” plan and “Operation Resilience” plan’s initiatives; the increasing reliance on information technology infrastructure for our sales invoicing, procurement, financial statements and other processes that can adversely affect our sales and operations in the event that the infrastructure does not work as intended, experiences technical difficulties or is subjected to cyber-attacks; changes in the economy that affect demand for consumer goods, consequently affecting demand for our products and services; the impact of pandemics, epidemics or outbreaks of infectious diseases and the response of governments and other third parties, including with respect to COVID-19, which have affected and may continue to adversely affect, among other matters, supply chains, international operations, availability of liquidity, investor confidence and consumer spending, as well as availability of, and demand for, our products and services; weather conditions, including but not limited to, excessive rain and snow, and disasters such as earthquakes and floods; trade barriers, including tariffs or import taxes and changes in existing trade policies or changes to, or withdrawals from, free trade agreements, including the USMCA, if it comes into effect, and NAFTA, while it is in effect, both of which Mexico is a party to; terrorist and organized criminal activities as well as geopolitical events; declarations of insolvency or bankruptcy, or becoming subject to similar proceedings; natural disasters and other unforeseen events (including global health hazards such as COVID-19); and other risks and uncertainties described in CEMEX’s public filings. Readers are urged to read this report and carefully consider the risks, uncertainties and other factors that affect our business. The information contained in this report is subject to change without notice, and we are not obligated to publicly update or revise forward-looking statements after the date hereof or to reflect the occurrence of anticipated or unanticipated events or circumstances. Readers should review future reports filed by CEMEX with the United States Securities and Exchange Commission. CEMEX’s “A Stronger CEMEX” plan and “Operation Resilience” plan is designed based on CEMEX’s current beliefs and expectations. Unless the context indicates otherwise, all references to pricing initiatives, price increases or decreases, refer to CEMEX’s prices for CEMEX’s products. This report also includes statistical data regarding the production, distribution, marketing and sale of cement, ready-mix concrete, clinker and aggregates. We generated some of this data internally, and some was obtained from independent industry publications and reports that we believe to be reliable sources. We have not independently verified this data nor sought the consent of any organizations to refer to their reports in this report.
UNLESS OTHERWISE NOTED, ALL FIGURES ARE PRESENTED IN DOLLARS, BASED ON INTERNATIONAL FINANCIAL REPORTING STANDARDS, AS APPLICABLE
Copyright CEMEX, S.A.B. de C.V. and its subsidiaries