Third Quarter Report - cdiccei.ca · Management Discussion and Analysis of ... • To manage our...
23
Third Quarter Report September 30, 2015
Transcript of Third Quarter Report - cdiccei.ca · Management Discussion and Analysis of ... • To manage our...

Third Quarter Report
September 30, 2015

Contents
Statement of Management Responsibility by Senior Officials 1 Management Discussion and Analysis of Results 2 Interim Condensed Consolidated Financial Statements of Canada Development Investment Corporation September 30, 2015 8 Corporate Address:
1240 Bay Street, Suite 302
Toronto, ON M5R 2A7
Telephone: (416) 966-2221
Facsimile: (416) 966-5485
Website: www.cdev.gc.ca

1
Statement of Management Responsibility by Senior Officials
Management is responsible for the preparation and fair presentation of these interim
condensed consolidated financial statements in accordance with IAS 34, Interim Financial
Reporting and for such internal controls as management determines are necessary to
enable the preparation of interim condensed consolidated financial statements that are free
from material misstatement. Management is also responsible for ensuring all other
information in this quarterly financial report is consistent, where appropriate, with the interim
condensed consolidated financial statements.
Based on our knowledge, these unaudited interim condensed consolidated financial
statements present fairly, in all material respects, the financial position, the financial
performance and cash flows of the Corporation, as at the date of and for the periods
presented in the interim condensed consolidated financial statements.
The interim condensed consolidated financial statements were authorized for issue by the
Board of Directors on November 18, 2015.
Michael Carter Andrew G. Stafl, CPA, CA
Executive Vice-President Vice-President, Finance
Toronto, Ontario
November 18, 2015

2
Management Discussion and Analysis of Results – for the period ended September 30, 2015
The public communications of Canada Development Investment Corporation (“CDEV”), including this
interim report, may include forward-looking statements that reflect management’s expectations regarding
CDEV’s objectives, strategies, outlooks, plans, anticipations, estimates and intentions.
By their nature, forward-looking statements involve numerous factors and assumptions, and they are
subject to inherent risks and uncertainties, both general and specific. In particular, any predictions,
forecasts, projections or other elements of forward-looking statements may not be achieved. A number of
risks, uncertainties and other factors could cause actual results to differ materially from what we currently
expect.
This Management Discussion and Analysis of Results should be read in conjunction with CDEV’s
unaudited interim condensed consolidated financial statements for the period ended September 30, 2015
and CDEV’s Annual Report for the year ended December 31, 2014.
Corporate Overview
CDEV, a federal crown corporation, was incorporated in 1982 to provide a commercial vehicle for
Government equity investment and to manage commercial holdings of the Government in the best
interests of Canada, operating in a commercial manner. During the fiscal quarter ended September 30,
2015 the operations and structure of CDEV were the same as those described in the 2014 Annual Report
of CDEV, available on our website, www.cdev.gc.ca. CDEV’s subsidiaries are: Canada Eldor Inc. (“CEI”),
Canada Hibernia Holding Corporation (“CHHC”), and Canada GEN Investment Corporation (“GEN”).
During the quarter, CDEV amended its guidelines and policies governing travel and hospitality to align
with current Treasury Board guidelines, including the Directive on Travel, Hospitality, Conference and
Event Expenditures. We will be posting the quarterly travel and hospitality expenses for CDEV’s directors
and officers on our website beginning this quarter.
Corporate Performance
Our year-to-date performance as compared to our key objectives is as follows:
Key Objectives:
• To manage our investments in the Hibernia oilfield and General Motors (“GM”) and continue to oversee the management of CEI’s obligations.
• To continue to manage the portions of the Corporate Asset Management Review (“CAMR”) assigned to us.
• To continue to manage the process for the potential sale of Ridley Terminals Inc. (“RTI”), another
federal Crown corporation and the potential sale of portions of the Dominion Coal Blocks in
British Columbia.
• To continue to manage other issues which may arise and to remain prepared to assume management and divestiture of any other interests of Canada assigned to us for divestiture, in a commercial manner.

Management Discussion and Analysis of Results – for the period ended September 30, 2015 (continued)
3
Performance:
We and our subsidiaries continue to manage our investments and obligations as detailed below:
CHHC recorded an after-tax profit of $44 million during the first nine months of 2015. No dividends to CDEV were declared during the third quarter.
GEN sold its remaining investment in GM common shares for proceeds of $3,254 million during the second quarter, recognizing a gain on the sale of $2,131 million.
There was no significant change in the management of CEI’s liabilities.
CDEV paid total dividends to the Government of $3,263 million in the first nine months of 2015.
We continued to manage the sale process of RTI as an agent of the Government. The project is in the initial advisory stage. We also continue to work on a sales advisory mandate to potentially sell portions of the Dominion Coal Blocks in British Columbia for the Government, acting as agent.
We continued to manage other advisory projects and remain prepared to undertake projects suitable to our capabilities.
Canada Hibernia Holding Corporation
Net crude oil revenues were 57% lower in the quarter and 54% lower year-to-date reflecting declines in oil
prices and sales volumes, and the related reductions in royalties and net profits interest expenses.
Sales volumes of 0.48 million barrels in the quarter were 42% lower than 0.82 million barrels sold in the
comparative quarter due to a 28% decrease in Hibernia production volumes combined with cargo sale
timing differences. In particular, CHHC had no cargo sales in September largely as a result of the
triennial platform turnaround which commenced September 18 for approximately four weeks. During this
time, all production was shut down for maintenance and related activities. Hibernia gross oil production
thus averaged 82,900 barrels per day in the third quarter as a result of 13 days of production downtime
associated with the turnaround and also due to drilling and water injection delays in the HSE Unit. Sales
volumes for the first nine months were similarly lower at 1.97 million barrels compared to 2.83 million
barrels in the first nine months of 2014.
CHHC’s oil prices are based on the price of Dated Brent crude. The average Dated Brent price declined
51% in the quarter to US $50 per barrel compared to US $102 per barrel in the comparative quarter in
2014, reflecting global oversupply and a weaker global economy. Similarly the year-to-date average
Dated Brent price was 49% lower at US $55 per barrel compared to US $107 per barrel in 2014. CHHC’s
oil prices benefitted from favorable foreign exchange rates, resulting in price realizations of $66 per barrel
in the third quarter and $70 per barrel year-to-date, representing declines of 40% and 41%, respectively,
over the comparative periods in 2014.
Production and operating expenses declined by $1.5 million in the quarter due to a downward inventory
adjustment and lower work-over expenses. Depletion and depreciation expenses decreased by $5.7
million in the quarter due to a lower depletion rate, lower production volumes and inventory adjustments.
Capital expenditures in the third quarter were largely directed toward drilling activities in the Hibernia
Southern Extension Unit (“HSE Unit”) and the full field seismic acquisition program. In the near term,
Hibernia owners will continue to focus on the full field development of the HSE Unit (in particular the
drilling of subsea water injection wells), as well as drilling activities, seismic acquisition and the gas lift
project at the Hibernia Main Field.

Management Discussion and Analysis of Results – for the period ended September 30, 2015 (continued)
4
Canada Eldor Inc.
CEI continues to pay for costs relating to the decommissioning of former mine site properties and for
retiree benefits of certain former employees. A plan is in place to undertake work that should allow for the
eventual transfer of the mine site properties to the Institutional Control Program of the Province of
Saskatchewan within nine years. CEI holds cash and cash equivalents and funds within the Consolidated
Revenue Fund of $27 million to pay for CEI’s total estimated liabilities of $21 million.
Canada GEN Investment Corporation
On April 6, 2015, GEN sold all of its GM common shareholdings at a price of US $35.61 per share for
total proceeds of US $2.613 billion (CAD $3.254 billion). The sale was by way of an unregistered block
trade after undertaking a competitive process. A dividend of US $2,530 million was paid to the
Government from the proceeds. See the table below for further comparative share value information.
GEN earned dividend income of $28 million in 2015 from its GM common share holdings in the first
quarter. No dividends were received from GM in the second or third quarters of 2015.
Analysis of External Business Environment
The ongoing management of our holdings will depend on overall market and economic conditions as well
as factors specific to the underlying company or investment. No material changes have been identified
since December 31, 2014 as described in the 2014 Annual Report.
Risks and Contingencies
No material changes in risks and contingencies have been identified since December 31, 2014 as
described in the 2014 Annual Report, except that risks associated with changes in value of the GM
shares are no longer a risk to the organization as a result of the sale of all remaining GM shares that
occurred in the second quarter.
Financial Statements for the Period Ended September 30, 2015
The interim condensed consolidated financial statements for the period ended September 30, 2015 and
comparable figures, have been prepared in accordance with International Accounting Standard (“IAS”)
34, Interim Financial Reporting.
Consolidated net revenue for the three months ended September 30, 2015 was $25 million, compared to
revenue of $103 million in the same period of the prior year. The significant decline is primarily
attributable to lower net crude oil sales and nil dividend income in the current quarter. Net crude oil sales
declined 57% in the third quarter to $24 million from $56 million in the third quarter of 2014. The
decrease in gross crude oil sales resulted from lower realized oil prices and lower sales volumes. Lower
oil prices are consistent with the decline in Dated Brent benchmark prices and lower sales volumes reflect
downtime during the quarter related to the triennial platform turnaround. In the third quarter of 2015 there
were no dividends received from the GM common shares as the shares were sold at the beginning of the
second quarter. In the prior year period, GEN received $36 million in common share dividends. In the
Management Discussion and Analysis of Results – for the period ended September 30, 2015 (continued)
5
third quarter of 2014, GEN also received dividends of $10 million from the GM preferred shares, which
were redeemed by GM on December 31, 2014.
Total expenses for the quarter were $9 million compared to total expenses of $19 million (excluding the
change in value of the preferred shares) in the comparative period in 2014. In the current quarter a gain
on foreign exchange of $2 million was recognized compared to a gain of $1 million in the comparative
period of the prior year. Depletion and depreciation expenses in the quarter decreased to $5 million from
$11 million in the prior year quarter while production and operating expenses declined to $4 million from
$6 million in the prior year comparative period.
Consolidated revenue for the nine months ended September 30, 2015 was $2,260 million, compared
to revenue of $356 million in the prior year period. The increase is mainly attributable to the gain on
sale of the GM common shares of $2,131 million during the second quarter of 2015. This was partly
offset by lower year to date dividend and net crude oil revenue compared to the prior year-to-date
period. Common share dividends of $28 million were received year to date compared to $139 million
in common and preferred share dividends received in the prior year period. Year-to-date net crude
oil sales were $99 million, a 54% decrease from $215 million in the prior year due to lower realized
oil prices and lower volumes sold.
Year-to-date expenses were $5 million compared to $65 million (excluding the unrealized change in
fair value of the GM preferred shares) in the prior year period. The decrease is largely due to a large
year-to-date gain on foreign exchange and lower depletion and depreciation expense. We
recognized a gain on foreign exchange of $39 million year to date compared to a negligible foreign
exchange loss in the nine months ended September 30, 2014. The foreign exchange gain is
primarily related to the GM share sale proceeds in the second quarter due to an appreciation of the
US dollar between the trade date and the settlement date. Depletion and depreciation costs
decreased to $22 million from $38 million in the nine months ended September 30, 2014, due to a
lower depletion rate per barrel combined with lower production volumes and a downward inventory
adjustment.
The remaining GM common shares investment was sold on April 6, 2015 thus there was nil other
comprehensive income (“OCI”) recognized in the third quarter. During the comparable period of 2014,
the change in the value of the GM common share investment was reflected as a $325 million (loss). For
more details on historical OCI changes relating to the GM common shares please see the table below:

Management Discussion and Analysis of Results – for the period ended September 30, 2015 (continued)
6
Cash and cash equivalents as at September 30, 2015 decreased to $254 million compared to $609
million at December 31, 2014 largely due to funds held at year end from the GM preferred share
redemption and the subsequent payment of dividends in January 2015 of $468 million.
There were no crude oil sales receivable at September 30, 2015 and a drawdown of cash call balances,
resulting in a decrease in accounts receivable to $6 million from $39 million at December 31, 2014.
Inventory increased by $5 million from December 31, 2014 due to higher inventory volumes at the
Newfoundland Transshipment Ltd. terminal and higher inventory costs.
GM Common Shares value and OCI
Quarter ending # of shares
Price GM
Common Shares
(US$) (2)
US exchange
rate (1)
Investment
Value
(C$ millions)
Quarterly
OCI/(loss)
(C$ millions)
Year-to-date
OCI/(loss)
(C$ millions)
31-Dec-10 140,084,746 $33.94 (Adj) 0.9946 4,729
2011
31-Mar-11 140,084,746 $29.68(Adj) 0.9718 4,040 (688) (688)
30-Jun-11 140,084,746 $30.37 0.9643 4,102 62 (626)
30-Sep-11 140,084,746 $20.20 1.0389 2,940 (1,163) (1,789)
31-Dec-11 140,084,746 $20.28 1.0170 2,889 (51) (1,840)
2012
31-Mar-12 140,084,746 $25.64 0.9991 3,589 699 699
30-Jun-12 140,084,746 $19.72 1.0191 2,815 (773) (74)
30-Sep-12 140,084,746 $22.75 0.9837 3,135 320 246
31-Dec-12 140,084,746 $28.82 0.9949 4,017 882 1,127
2013
31-Mar-13 140,084,746 $27.81 1.0156 3,957 (60) (60)
30-Jun-13 140,084,746 $33.34 1.0512 4,910 953 893
10-Sep-13 (30,000,000) $36.65 1.0357 (680) (3)
30-Sep-13 110,084,746 $35.95 1.0285 4,070 300 513
31-Dec-13 110,084,746 $40.87 1.0636 4,785 715 1,228
2014
31-Mar-14 110,084,746 $34.42 1.1053 4,188 (597) (597)
30-Jun-14 110,084,746 $36.29 1.0676 4,265 77 (520)
30-Sep-14 110,084,746 $31.93 1.1208 3,940 (325) (846)
22-Dec-14 (36,694,915) $33.23 1.1643 (858) (4)
31-Dec-14 73,389,831 $34.90 1.1601 2,971 452 (1,252)
2015
31-Mar-15 73,389,831 $37.49 1.2683 3,490 518 518
6-Apr-15 73,389,831 $35.61 1.2452 3,254 (235) 283 (5)
6-Apr-15 (73,389,831) $35.61 1.2452 (3,254) (2,131) (1,848) (6)
Notes
(1) exchange rate used is Bank of Canada noon rate (USD in CAD)
(2) quoted closing b id price per share at quarter end (transaction price Sept 10, Apr 6)
(3) gain on shares sold on Sept 10/13 transferred to profit and loss
(4) gain on derecognition of common shares relating to dividend in kind transferred to profit and loss
(5) fair value adjustment in OCI on date of derecognition of shares
(6) gain on shares sold on April 6/15 transferred to profit and loss (remaining Accumulated OCI is nil)

Management Discussion and Analysis of Results – for the period ended September 30, 2015 (continued)
7
Property and equipment increased $44 million from December 31, 2014, comprised of Hibernia cash
capital expenditures of $36 million plus non-cash decommissioning adjustments of $32 million, offset by
of $24 million of depletion and depreciation. Of the $36 million in cash capital expenditures, $16 million
were incurred in the third quarter, related primarily to HSE Unit drilling and the seismic acquisition
program. The $32 million of non-cash decommissioning adjustments relate mainly to increased cost
estimates for the decommissioning of Hibernia.
A higher provision for decommissioning obligations of $129 million compared to $96 million at December
31, 2014 is due mainly to higher cost estimates associated with the decommissioning of Hibernia
including the addition of recently drilled HSE Unit subsea wells.
CDEV paid dividends to the Government during the third quarter of 2015 of $75 million. Dividends paid in
the comparative period in 2014 were $88 million.

8
Interim Condensed Consolidated Financial Statements of
CANADA DEVELOPMENT INVESTMENT CORPORATION
Three and nine months ended September 30, 2015
(Unaudited)

9
CANADA DEVELOPMENT INVESTMENT CORPORATION Interim Condensed Consolidated Statement of Financial Position (Unaudited) (Thousands of Canadian Dollars)
September 30, December 31,
2015 2014
Assets Current assets:
Cash and cash equivalents $ 253,776 $ 609,420 Accounts receivable 5,958 38,525 Income taxes recoverable 5,505 12,096 Inventory 5,875 703 Prepaid expenses 694 293
Cash on deposit in the Consolidated Revenue Fund 5,691 4,228
277,499 665,265 Non-current assets:
Cash on deposit in the Consolidated Revenue Fund 113,660 114,633 Cash and cash equivalents held in escrow 5,969 5,969 Property and equipment (note 4) 203,585 159,594
Investments (note 5) - 2,971,370 Deferred tax asset 15,818 13,976
339,032 3,265,542
$ 616,531 $ 3,930,807
Liabilities and Shareholder’s Equity Current liabilities:
Accounts payable and accrued liabilities $ 25,067 $ 27,318 Dividend payable - 466,989 Current portion of defined benefit obligation 180 230
Current portion of provision for site restoration (note 6(b)) 4,511 3,976
29,758 498,513 Non-current liabilities:
Provision for decommissioning obligations (note 6(a)) 128,972 95,936 Provision for site restoration (note 6(b)) 13,345 15,417
Defined benefit obligation 1,795 1,820
144,112 113,173 Shareholder’s equity:
Share capital 1 1 Contributed surplus 603,294 1,726,527 Accumulated deficit (160,634) (255,545)
Accumulated other comprehensive income - 1,848,138
442,661 3,319,121 Commitments (note 9) Contingencies (note 10) Subsequent events (note 13)
$ 616,531 $ 3,930,807
The accompanying notes are an integral part of these interim condensed consolidated financial statements. On behalf of the Board:
Director Director

10
CANADA DEVELOPMENT INVESTMENT CORPORATION Interim Condensed Consolidated Statement of Comprehensive Income (Loss) (Unaudited) (Thousands of Canadian Dollars)
Three months ended September 30
Nine months ended September 30
2015 2014 2015 2014
Revenue:
Gain on sale of investment in common
shares (note 5) $ - $ - $ 2,130,987 $ - Net crude oil revenue (note 8(a)) 24,075 56,408 98,684 215,430 Dividends (note 5) - 46,189 28,102 138,685 Interest income 647 692 1,968 1,904
24,722 103,289 2,259,741 356,019
Expenses: Depletion and depreciation (note 4) 5,377 11,029 21,765 37,833 Production and operating (note 8(b)) 4,226 6,106 16,388 18,427
Change in fair value of investment in
preferred shares (note 5) - (17,000) - (8,000) Professional fees 428 1,752 2,856 4,769 Salaries and benefits 666 699 2,523 2,611 Other expenses 271 321 752 821 Foreign exchange loss (gain) (1,699) (993) (39,396) 57 Defined benefit expense 16 20 48 60
9,285 1,934 4,936 56,578 Finance costs:
Unwind of discount on decommissioning
obligations (note 6(a)) 540 525 1,644 1,499
Unwind of discount on provision for site
restoration (note 6(b)) 53 67 160 200 Interest on finance lease obligation - 7 - 32
593 599 1,804 1,731
Profit before income taxes 14,844 100,756 2,253,001 297,710 Income taxes: Current 4,513 12,986 19,039 45,613 Deferred (51) (1,760) (1,842) (2,651)
4,462 11,226 17,197 42,962
Profit 10,382 89,530 2,235,804 254,748 Other comprehensive income (loss):
Items that may be reclassified subsequently to profit or loss:
Change in fair value of investment in
common shares -
(325,417) 282,849
(845,692)
Gain on sale of investment in common
shares transferred to profit or loss - - (2,130,987) -
- (325,417) (1,848,138) (845,692)
Comprehensive income (loss) $ 10,382
$ (235,887) $ 387,666
$ (590,944)
The accompanying notes are an integral part of these interim condensed consolidated financial statements.

11
CANADA DEVELOPMENT INVESTMENT CORPORATION Interim Condensed Consolidated Statement of Changes in Shareholder’s Equity (Unaudited) (Thousands of Canadian Dollars)
Three months ended Nine months ended
September 30 September 30
2015 2014 2015 2014
Share capital Balance, beginning and end of period $ 1 $ 1 $ 1 $ 1
Contributed surplus
Balance, beginning of period 603,294 2,757,143 1,726,527 2,757,143 Dividends (note 12) - - (1,123,233) -
Balance, end of period 603,294 2,757,143 603,294 2,757,143
Accumulated deficit Balance, beginning of period (171,016) (286,096) (255,545) (308,885) Profit 10,382 89,530 2,235,804 254,748 Dividends - (87,847) (2,140,893) (230,276)
Balance, end of period (160,634) (284,413) (160,634) (284,413) Accumulated other comprehensive income
Balance, beginning of period - 2,580,187 1,848,138 3,100,462 Gain on sale of investment in common shares transferred to profit or loss (note 5) - - (2,130,987) - Change in fair value of investment in common shares - (325,417) 282,849 (845,692)
Balance, end of period - 2,254,770 - 2,254,770
Total shareholder’s equity $ 442,661 $ 4,727,501 $ 442,661 $ 4,727,501
The accompanying notes are an integral part of these interim condensed consolidated financial statements.

12
CANADA DEVELOPMENT INVESTMENT CORPORATION Interim Condensed Consolidated Statement of Cash Flows (Unaudited) (Thousands of Canadian Dollars)
Three months ended Nine months ended
September 30 September 30
2015 2014 2015 2014
Cash provided by (used in):
Operating activities:
Profit $ 10,382 $ 89,530 $ 2,235,804 $ 254,748 Adjustments for:
Depletion and depreciation 5,377 11,029 21,765 37,833 Income tax expense 4,462 11,226 17,197 42,962 Defined benefits paid in excess of
(less than) expenses (55) 13 (75) (71) Finance interest - 7 - 32 Interest income from Consolidated Revenue Fund (142) (252) (490) (740) Unwind of discount on decommissioning obligations 540 525 1,644 1,499 Net foreign exchange loss (gain) - 41 (33,452) 74 Change in fair value of investment
in preferred shares - (17,000) - (8,000) Gain on sale of investment in
common shares - - (2,130,987) - Change in provision for site restoration 53 67 160 200 Provisions settled (978) (457) (1,879) (1,781) Income taxes paid (4,350) (17,459) (12,448) (57,514)
15,289 77,270 97,239 269,242 Change in non-cash working capital (note 7) 28,789 52,171 19,556 36,335
44,078 129,441 116,795 305,577 Financing activities:
Dividends paid (note 7) (75,000) (87,847) (3,731,115) (230,276) Finance interest paid - (7) - (32) Lease obligation payments - (516) - (1,491)
(75,000) (88,370) (3,731,115) (231,799) Investing activities:
Proceeds on sale of investment in common shares - - 3,287,671 - Purchase of property and equipment (16,210) (12,932) (36,486) (40,785) Withdrawal from Consolidated Revenue Fund - - - 5,000 Change in non-cash working capital (note 7) 6,936 769 7,491 (689)
(9,274) (12,163) 3,258,676 (36,474)
Change in cash and cash equivalents (40,196) 28,908 (355,644) 37,304
Cash and cash equivalents, beginning of period 293,972 110,164 609,420 101,768
Cash and cash equivalents, end of period $ 253,776 $ 139,072 $ 253,776 $ 139,072
Represented by: Cash $ 68,539 $ 49,785 $ 68,539 $ 49,785 Cash equivalents 185,237 89,287 185,237 89,287
$ 253,776 $ 139,072 $ 253,776 $ 139,072
Supplementary disclosure of cash flow from operating activities:
Amount of interest received during the period $ 609 $ 700 $ 1,929 $ 1,924 Amount of dividends received during the period $ - $ 46,189 $ 28,102 $ 138,685
The accompanying notes are an integral part of these interim condensed consolidated financial statements.

CANADA DEVELOPMENT INVESTMENT CORPORATION Notes to Interim Condensed Consolidated Financial Statements (unaudited) Three and nine months ended September 30, 2015 (All dollar amounts are stated in thousands of Canadian dollars unless otherwise stated)
13
1. Reporting entity:
Canada Development Investment Corporation ("the Corporation" or "CDEV") was incorporated in
1982 under the provisions of the Canada Business Corporations Act and is wholly-owned by Her
Majesty in Right of Canada. The Corporation is an agent Crown corporation listed in Schedule III,
Part II of the Financial Administration Act and is not subject to the provisions of the Income Tax Act.
In November 2007, the Minister of Finance informed CDEV that its mandate “should reflect a future
focused on the ongoing management of its current holdings in a commercial manner, providing
assistance to the Government of Canada (“Government”) in new policy directions suited to CDEV’s
capabilities, while maintaining the capacity to divest CDEV’s existing holdings, and any other
government interests assigned to it for divestiture, upon the direction of the Minister of Finance”. In
late 2009, the Corporation began assisting the Department of Finance in its Corporate Asset
Management Review programme involving the review of certain Government corporate assets.
In July 2015, the Corporation was issued a directive pursuant to section 89 of the Financial
Administration Act to align its travel, hospitality, conference and event expenditure policies, guidelines
and practices with Treasury Board policies, directives and related instruments in a manner that is
consistent with the Corporation’s legal obligations and to report on the implementation of the directive
in its next corporate plan.
The address of the Corporation’s registered office is 79 Wellington Street West, Suite 3000, Box 270,
TD Centre, Toronto, Ontario M5K 1N2. The address of the Corporation’s principal place of business
is 1240 Bay Street, Suite 302, Toronto, Ontario M5R 2A7.
The Corporation consolidates three wholly-owned subsidiaries: Canada Eldor Inc. (“CEI”), Canada
Hibernia Holding Corporation (“CHHC”), and Canada GEN Investment Corporation (“GEN”).
CEI was incorporated under the provisions of the Canada Business Corporations Act. It is subject to
the Financial Administration Act, is an agent of Her Majesty in Right of Canada and is not subject to
the provisions of the Income Tax Act. During 1988, CEI sold substantially all of its assets and
operations to Cameco Corporation ("Cameco”) in exchange for share capital of the purchaser and a
promissory note. As a result of the sale of the Cameco shares and the assumption of certain of CEI’s
remaining debt by the Government in 1995, CEI is left with the net cash proceeds from the final sale
of Cameco shares as its only significant asset. CEI’s remaining obligations include site restoration
and retiree defined benefit obligations.
CHHC was incorporated under the provisions of the Canada Business Corporations Act and was
acquired by CDEV in March 1993. CHHC is subject to the Financial Administration Act and the
Income Tax Act. CHHC's sole purpose is the holding and management of its interest in the Hibernia
Development Project (“Hibernia Project”). The Hibernia Project is an oil development and production
project located offshore Newfoundland and Labrador. CHHC holds an 8.5% working interest in the
Hibernia Project and an 8.5% equity interest in the Hibernia Management and Development
Company Ltd. ("HMDC"). CHHC’s interest in the Hibernia Project has been recorded in CHHC’s
financial statements which are consolidated into CDEV’s financial statements.

CANADA DEVELOPMENT INVESTMENT CORPORATION Notes to Interim Condensed Consolidated Financial Statements (unaudited) Three and nine months ended September 30, 2015 (All dollar amounts are stated in thousands of Canadian dollars unless otherwise stated)
14
1. Reporting entity (continued):
In 2010, CHHC and other participants signed agreements with the Province of Newfoundland and
Labrador (the “Province”), and received regulatory approval from the Canada-Newfoundland and
Labrador Offshore Petroleum Board (“C-NLOPB”) for further development of the Hibernia Southern
Extension Unit (“HSE Unit”). CHHC’s initial unit interest is 5.08% (subject to future adjustment in
accordance with the Unit Agreement – see also note 13a).
GEN was incorporated under the provisions of the Canada Business Corporations Act and was
acquired by the Corporation on May 30, 2009. GEN is subject to the Financial Administration Act but is
not subject to the Income Tax Act. Until April 6, 2015, GEN held common shares of General Motors
Company (“GM”) and until December 31, 2014, GEN held Series A Fixed Rate Cumulative Perpetual
Preferred Stock of GM with a liquidation preference value of US $25/preferred share. GEN received
the shares of GM as a result of loans made by Export Development Canada’s Canada Account (a
related party to CDEV and GEN) to GM.
2. Basis of preparation:
a) Statement of compliance:
These interim condensed consolidated financial statements have been prepared in accordance
with International Accounting Standard (“IAS”) 34, Interim Financial Reporting. These interim
condensed consolidated financial statements do not include all of the information required for full
annual financial statements and should be read in conjunction with the audited consolidated
financial statements and notes for the year ended December 31, 2014.
The interim condensed consolidated financial statements were authorized for issue by the Board
of Directors on November 18, 2015.
b) Basis of measurement:
The interim condensed consolidated financial statements have been prepared on the historical
cost basis except for the following:
financial instruments at fair value through profit or loss are measured at fair value
available-for-sale financial assets are measured at fair value
inventory is measured at the lower of cost to produce or net realizable value
c) Functional and presentation currency:
These interim condensed consolidated financial statements are presented in Canadian dollars,
which is the Corporation’s functional currency.
d) Use of estimates and judgments:
The preparation of the Corporation’s interim condensed consolidated financial statements
requires management to make judgments, estimates and assumptions that affect the application
of accounting policies and the reported amounts of assets, liabilities, income and expenses.

CANADA DEVELOPMENT INVESTMENT CORPORATION Notes to Interim Condensed Consolidated Financial Statements (unaudited) Three and nine months ended September 30, 2015 (All dollar amounts are stated in thousands of Canadian dollars unless otherwise stated)
15
2. Basis of preparation (continued):
d) Use of estimates and judgments (continued):
Actual results may differ from these estimates.
Estimates and underlying assumptions are reviewed on an ongoing basis. Revisions to
accounting estimates are recognized in the year in which the estimates are revised and in any
future years affected. Critical judgments and key sources of estimation uncertainty are disclosed
in note 2(d) of the Corporation’s annual consolidated financial statements for the year ended
December 31, 2014.
3. Significant accounting policies:
These interim condensed consolidated financial statements have been prepared following the same
accounting policies and methods of application as those presented in note 3 of the annual audited
consolidated financial statements for the year ended December 31, 2014.
4. Property and equipment:
Oil development assets and production facilities
Cost
Balance at December 31, 2014 $ 355,729 Additions for the period 36,486 Decommissioning adjustments 31,574
Balance at September 30, 2015 $ 423,789
Depletion and depreciation
Balance at December 31, 2014 $ 196,135 Depletion and depreciation 24,069
Balance at September 30, 2015 $ 220,204
Carrying amounts At December 31, 2014 $ 159,594 At September 30, 2015 $ 203,585
At September 30, 2015, costs subject to the calculations of depletion and depreciation excluded the
cost of equipment and facilities currently under construction of $19,384 (December 31, 2014 -
$10,633) and included future development costs of $770,910 (December 31, 2014 - $809,000).
CANADA DEVELOPMENT INVESTMENT CORPORATION Notes to Interim Condensed Consolidated Financial Statements (unaudited) Three and nine months ended September 30, 2015 (All dollar amounts are stated in thousands of Canadian dollars unless otherwise stated)
16
4. Property and equipment (continued):
An assessment of potential indicators of impairment was conducted for the Company’s CGU (cash
generating unit) for the period ended September 30, 2015. In performing the review, management
determined that the decline in oil prices was a potential indicator of impairment for the Company’s
CGU. Based on the impairment test performed, there was no impairment of property and equipment
for the period ended September 30, 2015 (or for the period ended December 31, 2014).
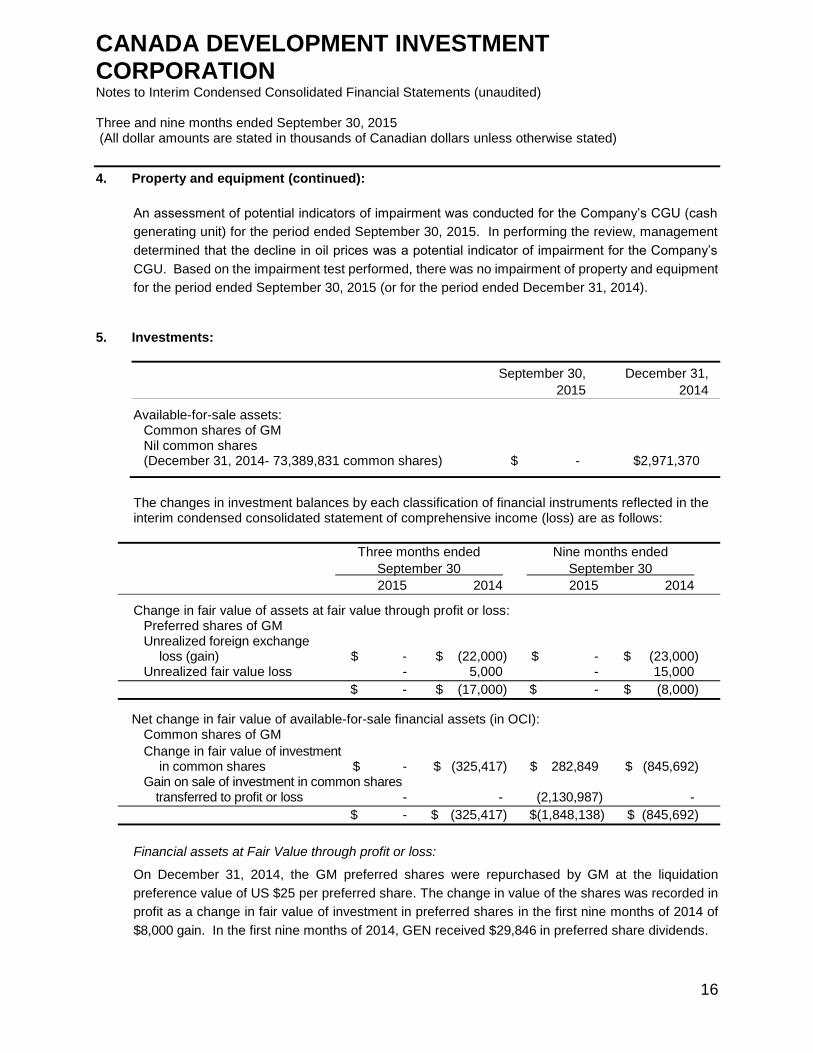
5. Investments:
September 30, December 31,
2015 2014
Available-for-sale assets: Common shares of GM Nil common shares (December 31, 2014- 73,389,831 common shares) $ - $2,971,370
The changes in investment balances by each classification of financial instruments reflected in the interim condensed consolidated statement of comprehensive income (loss) are as follows:
Three months ended Nine months ended
September 30 September 30
2015 2014 2015 2014
Change in fair value of assets at fair value through profit or loss: Preferred shares of GM Unrealized foreign exchange
loss (gain) $ - $ (22,000) $ - $ (23,000) Unrealized fair value loss - 5,000 - 15,000
$ - $ (17,000) $ - $ (8,000)
Net change in fair value of available-for-sale financial assets (in OCI): Common shares of GM
Change in fair value of investment in common shares $ - $ (325,417) $ 282,849 $ (845,692)
Gain on sale of investment in common shares transferred to profit or loss - - (2,130,987) -
$ - $ (325,417) $(1,848,138) $ (845,692)
Financial assets at Fair Value through profit or loss:
On December 31, 2014, the GM preferred shares were repurchased by GM at the liquidation
preference value of US $25 per preferred share. The change in value of the shares was recorded in
profit as a change in fair value of investment in preferred shares in the first nine months of 2014 of
$8,000 gain. In the first nine months of 2014, GEN received $29,846 in preferred share dividends.

CANADA DEVELOPMENT INVESTMENT CORPORATION Notes to Interim Condensed Consolidated Financial Statements (unaudited) Three and nine months ended September 30, 2015 (All dollar amounts are stated in thousands of Canadian dollars unless otherwise stated)
17
5. Investments (continued):
Available-for-sale financial assets:
The investment in the common shares of GM was designated as available-for-sale financial assets.
During the second quarter, the Corporation sold its holdings of 73,389,831 common shares of GM
for proceeds of US $2.613 billion. The trade date of the sale was April 6, 2015 at which time the
Canadian equivalent was $3.254 billion resulting in a realized gain of $2.131 billion.
In the three and nine month periods ended September 30, 2015, GEN received $nil (2014 - $36,180)
and $28,102 (2014 - $108,839) in common share dividends, respectively.
6. Provisions:
Changes to provisions for decommissioning obligations and site restoration were as follows:
Decommissioning Site
obligations restoration
Balance at December 31, 2014 $ 95,936 $ 19,393 New obligations 3,758 - Obligations settled (182) (1,697) Changes in estimates of future cash flows 24,106 - Changes in discount rate 3,710 - Unwind of discount 1,644 160
Balance at September 30, 2015 $ 128,972 $ 17,856
Current - 4,511 Non-current 128,972 13,345
Provisions $ 128,972 $ 17,856
a) Provision for decommissioning obligations of CHHC:
The provision for decommissioning obligations is based on CHHC’s net ownership interest in wells
and facilities and management's estimate of costs to abandon and reclaim those wells and facilities
as well as an estimate of the future timing of the costs to be incurred. CHHC estimates the total
future undiscounted liability to be $311,089 at September 30, 2015 (December 31, 2014 - $246,819).
Estimates of decommissioning obligation costs can change significantly based on factors such as
operating experience and changes in legislation and regulations.
These obligations will be settled based on the expected timing of abandonment, which currently
extends up to the year 2055 and is based upon the useful lives of the underlying assets. The provision
was calculated at September 30, 2015 using an inflation rate of 2.0% (December 31, 2014 - 2.0%)
and was discounted using a risk-free rate of 2.21% (December 31, 2014 - 2.33%).

CANADA DEVELOPMENT INVESTMENT CORPORATION Notes to Interim Condensed Consolidated Financial Statements (unaudited) Three and nine months ended September 30, 2015 (All dollar amounts are stated in thousands of Canadian dollars unless otherwise stated)
18
6. Provisions (continued):
b) Provision for site restoration:
Under the terms of the purchase and sale agreement in 1988 between CEI and Cameco, CEI is
responsible for obligations relating to the sale of assets to Cameco. The estimates used to calculate
the provision for site restoration are described in the consolidated financial statements for the year
ended December 31, 2014. There were no significant changes to estimates used.
7. Supplemental cash flow disclosure:
Changes in non-cash working capital balances for the periods ended September 30 include the
following:
Three months ended Nine months ended
September 30 September 30
2015 2014 2015 2014
Change in accounts receivable $ 35,930 $ 55,384 $ 32,567 $ 30,275 Change in inventory (1,856) (260) (2,868) 581 Change in prepaid expenses 429 454 (401) (449) Change in accounts payable and
accrued liabilities 1,222 (2,638) (2,251) 5,239
Change in non-cash working capital items $ 35,725 $ 52,940 $ 27,047 $ 35,646
Relating to: Operating activities $ 28,789 $ 52,171 $ 19,556 $ 36,335 Investing activities 6,936 769 7,491 (689)
$ 35,725 $ 52,940 $ 27,047 $ 35,646
On June 26, 2015, the Corporation’s Board of Directors declared a dividend payable to its shareholder
of $75 million, which was subsequently paid on July 3, 2015.
8. Net crude oil revenue and production and operating expenses:
a) Net crude oil revenue for the periods ended September 30 is as follows:
Three months ended Nine months ended
September 30 September 30
2015 2014 2015 2014
Gross crude oil revenue $ 31,788 $ 91,183 $ 137,721 $ 335,367 Less: marketing fees (50) (72) (256) (273) Less: royalties (6,112) (27,625) (29,751) (91,744) Less: net profits interest (1,551) (7,078) (9,030) (27,920)
Net crude oil revenue $ 24,075 $ 56,408 $ 98,684 $ 215,430

CANADA DEVELOPMENT INVESTMENT CORPORATION Notes to Interim Condensed Consolidated Financial Statements (unaudited) Three and nine months ended September 30, 2015 (All dollar amounts are stated in thousands of Canadian dollars unless otherwise stated)
19
8. Net crude oil revenue and production and operating expenses (continued):
b) Production and operating expenses for the periods ended September 30 are as follows:
Three months ended Nine months ended
September 30 September 30
2015 2014 2015 2014
Hibernia joint account production
and operating $ 3,089 $ 5,133 $ 12,908 $ 14,676 Crude oil transportation 1,523 1,013 4,772 3,941 Facility use fees net of incidental net profits interest (386) (40) (1,292) (190)
Total production and operating $ 4,226 $ 6,106 $ 16,388 $ 18,427
9. Commitments:
On June 1, 2015, CHHC entered into a long term commitment for oil transportation services pursuant
to a Contract of Affreightment (“COA”), as part of the Basin Wide Transportation and Transshipment
System (“BWTTS”) which also involves other East Coast Canada oil producers. The term of the
COA is fifteen years and involves a commitment for voyage charters on an operating lease basis on
shuttle tankers managed by a third-party shipping service provider (“SSP”) for CHHC’s needs at
Hibernia. This contrasts with CHHC’s previous fixed 25% time charter and capital lease arrangement
specifically for the Mattea shuttle tanker, which was novated to the SSP.
CHHC’s costs for the fifteen year COA commitment total an estimated $47 million, however there is
a provision such that if a nil production forecast is submitted to the SSP, the Company would only be
committed to a further 27 to 39 months (nominally three years) of COA costs. In conjunction with the
BWTTS, CHHC also amended and extended its Reserved Capacity Services agreement at the
Newfoundland Transshipment Ltd. terminal effective June 1, 2015 for a fifteen year term, at a total
estimated cost of $24 million.
10. Contingencies:
The Corporation or its subsidiaries, in the normal course of its operations, may become subject to a
variety of legal and other claims against the Corporation. Where it is probable that a past event will
require an outflow of resources to settle the obligation and a reliable estimate can be made,
management accrues its best estimate of the costs to satisfy such claims.
CHHC is a party to an ongoing contractual dispute, the outcome of which is subject to future dispute
resolution proceedings. CHHC is not disclosing its estimate of the financial effect, if any, of the dispute as
such disclosure would prejudice CHHC. Based on information presently available and after consultation
with external legal counsel, management believes that the probable resolution will be favorable to CHHC,
and thus no amount has been recognized in the interim condensed consolidated financial statements.
CANADA DEVELOPMENT INVESTMENT CORPORATION Notes to Interim Condensed Consolidated Financial Statements (unaudited) Three and nine months ended September 30, 2015 (All dollar amounts are stated in thousands of Canadian dollars unless otherwise stated)
20
10. Contingencies (continued):
CEI is co-defendant with the Province of Ontario, the Attorney General of Canada, the Canadian
Nuclear Safety Commission and BOC Canada Limited in a proposed class action lawsuit brought by
certain residents of the municipality formerly known as Deloro in the County of Hastings, Ontario.
The lawsuit is based on the alleged contamination of certain properties. CEI has filed a notice of
intent to defend. While no liability is admitted, the financial impact on the Corporation, if defence
against the action is unsuccessful, is currently not determinable.
In March 2015, CDEV received notice of a lawsuit filed in 2014 in the Republic of Panama against
Multidata Systems International Inc., Nordion Inc., and CDEV. The lawsuit alleges that the
defendants are liable for injuries to the plaintiffs as a result of overexposure to radiation from
equipment during treatments received at a clinic in Panama. The ultimate magnitude of this liability,
if any, is not reasonably estimable at this time. No accrual has been made in the interim condensed
consolidated financial statements.
11. Risks to the Corporation:
Overview:
The nature of CDEV’s consolidated operations expose the Corporation to risks arising from its
financial instruments that may have a material effect on cash flows, profit and comprehensive income
(loss). The condensed consolidated interim financial statements do not include all financial risk
management information and disclosures required in the annual financial statements; they should be
read in conjunction with the Corporation’s annual financial statements as at December 31, 2014.
There have been no changes in the Corporation’s financial risk management objectives, policies and
processes for measuring and managing these risks since year end.
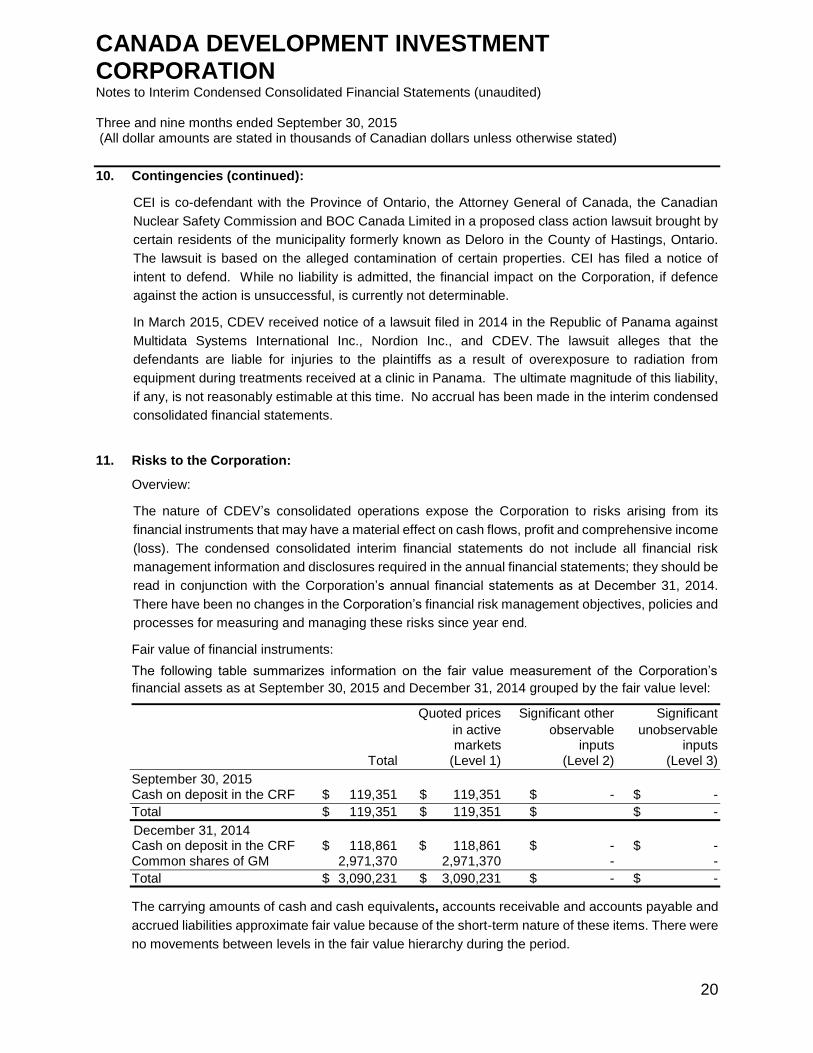
Fair value of financial instruments:
The following table summarizes information on the fair value measurement of the Corporation’s
financial assets as at September 30, 2015 and December 31, 2014 grouped by the fair value level:
Quoted prices Significant other Significant
in active observable unobservable markets inputs inputs Total (Level 1) (Level 2) (Level 3)
September 30, 2015 Cash on deposit in the CRF $ 119,351 $ 119,351 $ - $ -
Total $ 119,351 $ 119,351 $ $ -
December 31, 2014 Cash on deposit in the CRF $ 118,861 $ 118,861 $ - $ - Common shares of GM 2,971,370 2,971,370 - -
Total $ 3,090,231 $ 3,090,231 $ - $ -
The carrying amounts of cash and cash equivalents, accounts receivable and accounts payable and
accrued liabilities approximate fair value because of the short-term nature of these items. There were
no movements between levels in the fair value hierarchy during the period.
CANADA DEVELOPMENT INVESTMENT CORPORATION Notes to Interim Condensed Consolidated Financial Statements (unaudited) Three and nine months ended September 30, 2015 (All dollar amounts are stated in thousands of Canadian dollars unless otherwise stated)
21
12. Related party transactions:
The Corporation is related in terms of common ownership to all Canadian federal government
departments, agencies and Crown corporations. The Corporation may enter into transactions with
some of these entities in the normal course of business under its stated mandate.
CDEV declared dividends payable to the Government of Canada for the three and nine months
ended September 30, 2015 in the amount of $nil and $3,264,126 respectively, of which $1,123,233
was paid from contributed surplus (2014 $87,847 and $230,276, respectively).
13. Subsequent events:
a) On October 8, 2015, the operator of the HSE Unit notified Unit owners that the conditions had
been met for the HSE Unit First Interim Equity Reset (“First Interim Reset”). As a result of the First
Interim Reset, CHHC’s working interest in the HSE Unit will increase from the current 5.08% to 5.73%
effective December 1, 2015. Also on or about December 1, 2015, the operator will provide an
imbalance statement which will adjust the historical HSE Unit capital expenditures to reflect the new
working interests. CHHC estimates that it will incur an additional cash capital expenditure of
approximately $15 million in December 2015 in relation to this capital adjustment.
b) On October 22, 2015, the C-NLOPB completed its review of the Hibernia Project’s research and
development obligations shortfall amount for the 2012-2015 period, in conjunction with the October
31, 2015 Hibernia Operations Authorization renewal and expiry of the Hibernia Owners’ related
letters of credit issued to satisfy such research and development obligations.
The result was a decrease in the Hibernia shortfall amount and accordingly a reduction in the related
letters of credit. On October 26, 2015, CHHC amended its letter of credit to $2,052 (from $3,418)
reflecting its proportionate share, and extended the expiry date by three years to October 31, 2018.
CHHC’s cash escrow account to collateralize the letter of credit was similarly reduced to $2,052, with
the balance transferred to CHHC’s operating bank account.