Third Quarter Financial Report FY2017 - Riverside, Ca
801
City Council Memorandum TO: HONORABLE MAYOR AND CITY COUNCIL DATE: JUNE 20, 2017 FROM: FINANCE DEPARTMENT WARDS: ALL SUBJECT: FISCAL YEAR 2016-2017 THIRD QUARTER FINANCIAL REPORT INCLUDING ONE-TIME COST-NEUTRAL BUDGET ADJUSTMENTS; AND MID-CYCLE BUDGET UPDATE, INCLUDING A CITY COUNCIL RESOLUTION AMENDING FISCAL YEAR 2017-2018 BUDGET, PERSONNEL DETAIL AND CAPITAL IMPROVEMENT PLAN ISSUES: The issues for City Council consideration are: 1) to receive the fiscal year (FY) 2016-2017 Third Quarter Financial Report, including one-time cost-neutral budget changes as described below; and 2) adopt a resolution amending the biennial budget for FY 2017-18, including revisions to the Personnel Detail and the Capital Improvement Plan (CIP). RECOMMENDATIONS: For the FY 2016-2017 Third Quarter Report, that the City Council: 1. Receive and file the attached FY 2016-2017 Third Quarter Financial Report (Attachment A) that includes year-end projections for the General Fund and the five-year Measure Z spending plan, as well as cash/investment (Attachment B) and debt (Attachment C) reports for all funds; 2. Amend the FY 2016-2017 General Fund and Measure Z Fund Budget to appropriate funds approved through the Measure Z five-year spending plan (Attachment D); 3. Approve the appropriation of one-time revenues from the Standard Insurance reimbursement ($569,221) for one-time projects and programs in accounts to be determined by the Financed Department in the Human Resources Department ($472,350) and Innovation and Technology Department ($33,000); 4. Appropriate General Plan Surcharge revenue ($320,000) to the Community and Economic Development Department Planning Division professional services account to pay for Housing Element and Rezoning Project; and 5. Direct staff to prepare a General Fund carryover process as planned in the Adopted FY 2016-2018 Two-Year Budget (outlined in this report) for City Council approval in conjunction with the Fourth Quarter 2016-17 Financial Report.
Transcript of Third Quarter Financial Report FY2017 - Riverside, Ca
City Council Memorandum
TO: HONORABLE MAYOR AND CITY COUNCIL DATE: JUNE 20, 2017
FROM: FINANCE DEPARTMENT WARDS: ALL
SUBJECT: FISCAL YEAR 2016-2017 THIRD QUARTER FINANCIAL REPORT INCLUDING ONE-TIME COST-NEUTRAL BUDGET ADJUSTMENTS; AND MID-CYCLE BUDGET UPDATE, INCLUDING A CITY COUNCIL RESOLUTION AMENDING FISCAL YEAR 2017-2018 BUDGET, PERSONNEL DETAIL AND CAPITAL IMPROVEMENT PLAN
ISSUES:
The issues for City Council consideration are: 1) to receive the fiscal year (FY) 2016-2017 Third Quarter Financial Report, including one-time cost-neutral budget changes as described below; and 2) adopt a resolution amending the biennial budget for FY 2017-18, including revisions to the Personnel Detail and the Capital Improvement Plan (CIP).
RECOMMENDATIONS:
For the FY 2016-2017 Third Quarter Report, that the City Council:
1. Receive and file the attached FY 2016-2017 Third Quarter Financial Report (Attachment A) that includes year-end projections for the General Fund and the five-year Measure Z spending plan, as well as cash/investment (Attachment B) and debt (Attachment C) reports for all funds;
2. Amend the FY 2016-2017 General Fund and Measure Z Fund Budget to appropriate funds approved through the Measure Z five-year spending plan (Attachment D);
3. Approve the appropriation of one-time revenues from the Standard Insurance reimbursement ($569,221) for one-time projects and programs in accounts to be determined by the Financed Department in the Human Resources Department ($472,350) and Innovation and Technology Department ($33,000);
4. Appropriate General Plan Surcharge revenue ($320,000) to the Community and Economic Development Department Planning Division professional services account to pay for Housing Element and Rezoning Project; and
5. Direct staff to prepare a General Fund carryover process as planned in the Adopted FY 2016-2018 Two-Year Budget (outlined in this report) for City Council approval in conjunction with the Fourth Quarter 2016-17 Financial Report.
FY 2016-2018 Two-Year Budget Mid-Cycle Update and 3rd Quarter Financial, Investment, and Debt Reports Page 2
For the FY 2017-2018 Mid-Cycle Update, that the City Council:
1. Adopt the attached resolution (Attachment E) approving the City of Riverside’s Mid-Cycle
Amendments to the Two-Year Budget for FY 2017-2018 as reflected in the expenditure detail (Attachment F) and revenue detail (Attachment G);
2. Amend the FY 2017-2018 Personnel Detail to authorize position changes and full time employee (FTE) counts for positions under each department, division, and section (Attachment I);
3. Amend FY 2017-2018 funding for the City’s five-year Capital Improvement Plan (CIP) (Attachment H); and
4. Continue delegating investment responsibility to the City’s Chief Financial Officer/Treasurer, for a period of one year.
EXECUTIVE SUMMARY: In December 2015, the City Council approved the move to a two-year budget in the context of a five-year plan. Since that time, the City Council has been presented with reports on the City’s unfunded needs, approved departmental reductions, established a Budget Engagement Commission (BEC), adopted a Responsible Spending Pledge, and led the charge for the passage of Measure Z. The culmination of these City Council actions, combined with strong executive leadership, have laid a new, stronger, financial foundation for the City. One important outcome of the City’s disciplined focus on financial transparency and responsibility has been the recent upgrade of the City's general obligation bond rating from A+ to AA- by S&P. This report is comprised of two main sections:
1. The first section is dedicated to the FY 2016-2017 Third Quarter Financial Update, which provides an update on the City’s financials based on actuals from July 1, 2016 through March 31, 2017. A final update on FY 2016-2017 will be presented to the City Council in September/October 2017 with the City’s Comprehensive Annual Financial Report (CAFR).
2. The second section of the report is dedicated to the FY 2017-2018 Mid-Cycle Update,
which takes assumptions from the FY 2016-2017 Third Quarter Financial Update and combines them with proposed budgetary, staffing and capital changes. Because the City is on a biennial budget, Mid-Cycle budget adjustments to the second fiscal year are intentionally minimal and cost-neutral, and mainly include the necessary funding restructuring and strategic staffing changes in a few departments.
DISCUSSION: FISCAL YEAR 2016-2017: THIRD QUARTER UPDATE GENERAL FUND FINANCIAL ANALYSIS On December 20, 2016, the City Council received and provided input on the FY 2016-2017 First

FY 2016-2018 Two-Year Budget Mid-Cycle Update and 3rd Quarter Financial, Investment, and Debt Reports Page 3 Quarter Financial Report that included the projected revenues and expenditures from July 1, 2016 through September 30, 2016. The FY 2016-2017 Second Quarter Financial Report was presented to the City Council on April 11, 2017 to provide an update on the projected revenues and expenditures based on actuals from July 1, 2016 through December 31, 2016. This Third Quarter Financial Report (Attachment A) provides an update on the revenues and expenditures based on actuals from July 1, 2016 through March 31, 2017. As in the Second Quarter, the Third Quarter analysis still projects the City to be in a deficit position by year-end. Specifically, as of the Third Quarter, a $3.0 million year-end deficit is projected in FY 2016-17 and $4.4 million in FY 2017-18. The recently approved five-year spending plan for Measure Z includes transfers to the General Fund to cover these operating shortfalls and to maintain the General Fund Reserve at the minimum level of 15%, gradually building up to 20%. General Fund Revenues Compared to the second quarter FY 2016-2018 projections, the Third Quarter Financial Report General Fund revenues are estimated to be approximately $3.2 million higher in FY 2016-2017 and $1.7 million higher in FY 2017-2018. See Attachment A-3. In the Taxes category, differences of $200,000 or more between the second and third quarters are explained below. Sales Tax projection is unchanged from second quarter projections in FY 2016-2017 and
$883,610 lower in FY 2017-2018. Historically, sales tax revenues have been the most subjective General Fund revenue to the economy and the hardest to predict. As such, staff is taking a conservative estimate to sales tax revenues in FY 2017-2018.
Utility Users Taxes are estimated to be lower than second quarter projections by
approximately $197,000 in FY 2016-2017 and $206,000 in FY 2017-2018, due to lower year to date receipts from Pacific Bell and cable TV. This declining trend is expected to continue and the estimates in FY 2017-2018 take this into consideration, revising the growth assumption from 1.83% as of the second quarter to 1.80% based on third quarter actuals.
Charges for Development and Building Services are projected to increase in the third quarter
from second quarter projections by $291,000 in FY 2016-2017 and $277,000 in FY 2017-2018 due to increasing development activity in the region. Currently, the City is experiencing the highest construction permit valuation (i.e. investment in the City) the City seen in past 11 years. In fact, April 2017 set a monthly construction valuation record for the past 14 years, which includes the building boom that peaked in 2004, 2005, and 2006.
Entertainment Revenues are experiencing a gain in the third quarter with a $1.3 million
increase in FY 2016-2017 and $703,000 in FY 2017-2018 due to more events and activities in the Muni Auditorium and Convention Center. These gains are partially offset by increased costs, as discussed in the following section.
Intergovernmental Revenue is projected to increase by $645,000 in FY 2016-2017 and
$6,000 in FY 2017-2018 due to higher Mutual Aid reimbursements related to Fire Department overtime. These revenues are offset by higher Fire Department expenditures, as discussed in the next section.
FY 2016-2018 Two-Year Budget Mid-Cycle Update and 3rd Quarter Financial, Investment, and Debt Reports Page 4
Other Miscellaneous revenues are projected to be higher than second quarter projections by $1 million in FY 2016-2017 and $1.9 million in FY 2017-2018 due to one-time reimbursements and refunds from Standard Insurance ($568,000) and sale of land and property ($500,000). As discussed in detail further, most of the one-time Standard Insurance refund is recommended to be used for one-time unfunded needs, mainly in the Human Resources Department.
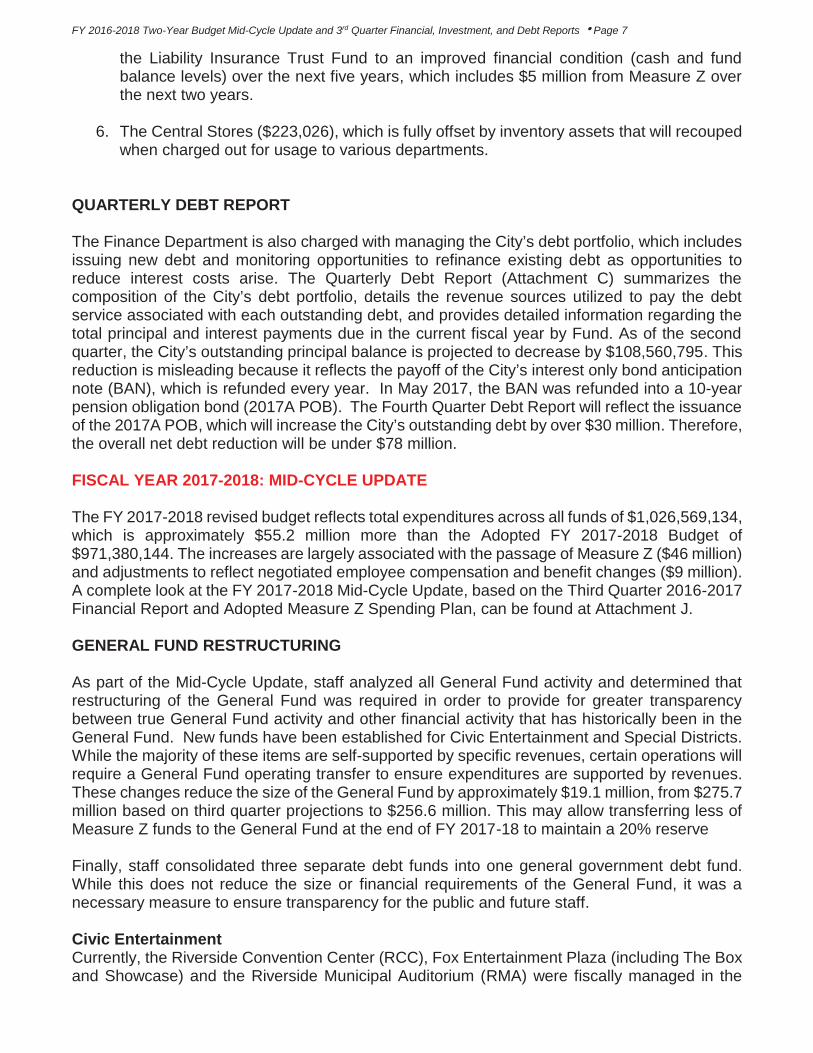
General Fund Expenditures General Fund expenditures are estimated to continue to exceed second quarter projections in FY 2016-2017 by $2.4 million and in FY 2017-2018 by $706,000. These changes are mainly due to safety services expenditures in retirement payoffs, overtime, unfunded vehicle maintenance, and one-time expenditures in employee programs and the VoIP system. Differences of $200,000 or more between the second and third quarters are explained below. See Attachment A-4. Parks, Recreation and Community Services Development Impact Fees are able to cover $1.2
million more of General Fund subsidized debt than anticipated in the first and second quarter analyses. When debt was issued for the Renaissance initiative, the plan was to utilize annual development impact fees (DIF) to fund parks projects. Unfortunately, with the downturn in the economy, the revenue never materialized. The General Fund has been subsidizing the Parks debt at approximately $2 million annually.
Fire Department Overtime and Retirement Payoffs are projected to exceed the FY 2016-2017 personnel budget due to $395,000 in overtime and $225,000 in retirement payoffs. This shortfall will be partially offset by Mutual Aid reimbursements noted in the revenue section.
Police Retirement Payoffs are projected to exceed the FY 2016-2017 personnel budget by
approximately $1.2 million. The City does not budget for all earned compensation accruals, such as unused vacation, sick leave, and compensation time. Each department is responsible for managing their budget to account for these payoffs, which depending on the timing of the retirements (e.g. end of year) may be difficult.
Convention Center expenditures are projected to exceed projections by $689,000. These expenditures are offset by revenue projections, as discussed above. With anticipated increased activity in FY 2017-2018, both revenue and expenditure assumptions have been increased.
General Fund Reserve The City’s General Fund Reserve Policy, adopted by the City Council on September 6, 2016, requires maintaining the General Fund reserve at 15%. The City Council set an aspiration goal of the General Fund Reserve at 20%; this goal was recently reaffirmed through adoption of the “Responsible Spending Vision Pledge” on October 4, 2016. With transfers from Measure Z to the General Fund to cover operational shortfalls and to build up reserves, the General Fund reserve is projected to be just under 15% in FY 2016-2017 and approximately 20% in FY 2017-2018. See Attachment A-4. Measure Z The collection of the additional one-cent sales tax authorized by voters through Measure Z began on April 1, 2017. Based on projections from the City’s sales tax consultant, HdL, the City will start receiving these revenues in May-June 2017, with the anticipated collection of $10 million in

FY 2016-2018 Two-Year Budget Mid-Cycle Update and 3rd Quarter Financial, Investment, and Debt Reports Page 5 FY 2016-2017 and the entire year’s worth of $51.5 million in FY 2017-2018. After hearing recommending Measure Z spending options from City staff and the BEC, on May 16, 2017, the City Council approved the Measure Z Spending Plan (Attachment D), which appropriated $9.5 million in FY 2016-2017 and $20.5 million in FY 2017-2018 to cover the projected General Fund shortfalls and increase the General Fund Reserves to 15% in the first year, and 20% in the second year. FY 2016-17 One-Time Cost-Neutral Budget Changes The following cost-neutral budget changes are requested to FY 2016-17 budget: Partial use of a $569,000 insurance refunds to pay for unfunded needs in the Human
Resources and Innovation & Technology Departments: Through Standard Insurance, the City offers its employees life insurance options. Periodically, Standard Insurance reviews the plan’s financial activity and may issue a refund to the City if funds available for payment of claims are higher than the expected insurance payouts. It is proposed that $472,350 of this $569,000 revenue be used for one-time unfunded needs related to compensation studies mandated in union agreements ($290,000), employee education reimbursement program ($100,000), citywide employee training ($62,250), employee wellness program ($13,500), and general office expenses ($6,600). It is recommended that the balance of the refund ($33,000) be used for Innovation and Technology unfunded needs related to phone system support and software maintenance. In March 2012, the City purchased the Avaya Voice over IP (VoIP) and Call Center solutions, including a 5-year service agreement. This VoIP system is able to utilize the City’s existing wired computer network infrastructure and cabling thus allowing both phone and data capabilities over the same medium. This minimizes the need for additional cabling and other components. The VoIP system also provides call routing features that allow for better call flow options improving the customer call experience. The initial 5-year service agreement expires in June 2017. The City issued a Request for Proposal (RFP) for a VoIP phone solution to replace the aging Ericsson analog phone system. The City is prepared to enter into a 3-year agreement with lowest responsive bidder for $93,000. The total cost will be offset partially by the Utilities 311 Call Center ($66,000).
The Housing Element/Rezone Project for the Community & Economic Development Department is funded by the General Plan Surcharge. For most planning permits issued, the City collects a 10% Planning Surcharge for the use of specific planning elements. In order to spend these funds, money has to be appropriated from the revenue account to a expenditure line item in the budget. The requested appropriation is $320,000, and is fully offset by the available revenue.
FY 2016-17 Carryovers The City’s Manager’s Budget Message, included in the FY 2016-2018 Two Year Budget, provided a carryover plan for the City’s General Fund: At the end of the first year of the two-year budget, barring any significant unforeseen revenue
shortfalls, departments with savings will automatically carry over the unspent funds to the second year. Similarly, departments that overspend in the first year will not be given higher budget allocation in the second year; they will have less to spend; and
At the end of the second year, barring an significant unforeseen revenue shortfalls,

FY 2016-2018 Two-Year Budget Mid-Cycle Update and 3rd Quarter Financial, Investment, and Debt Reports Page 6
departments with savings will be able to retain 50% of the unused funds for capital or other one-time needs. The other 50% will be used to balance the General Fund, or returned to the General Fund reserves.
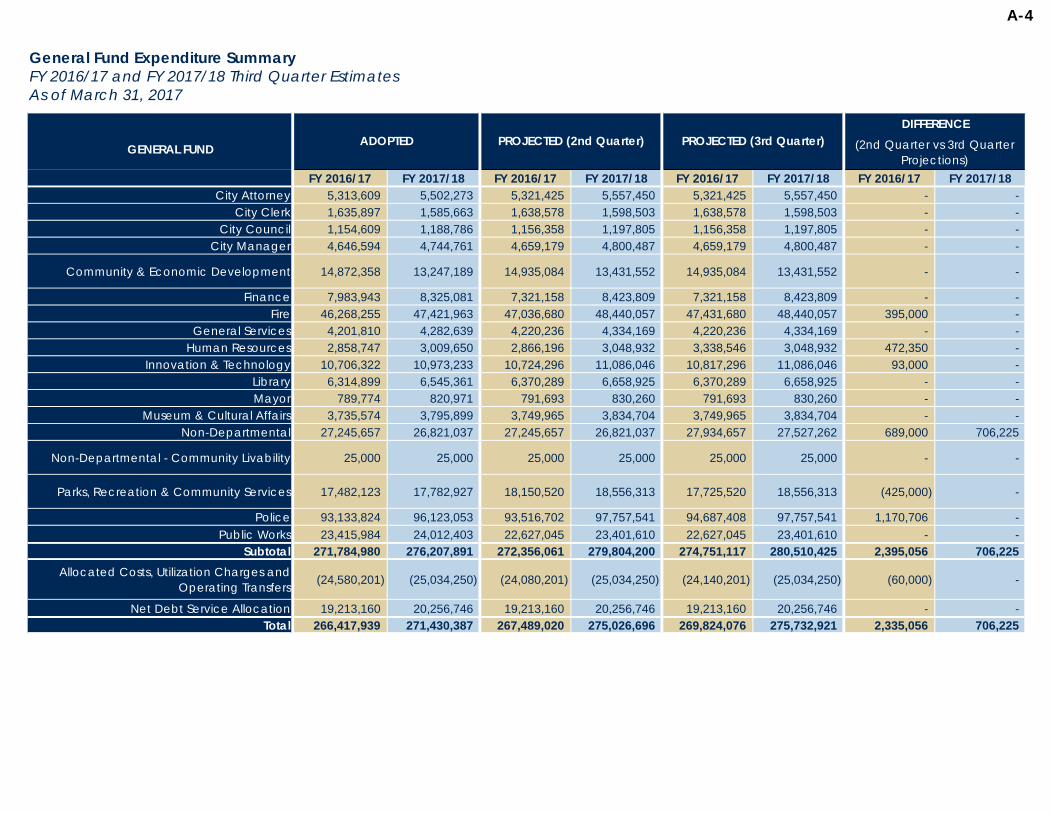
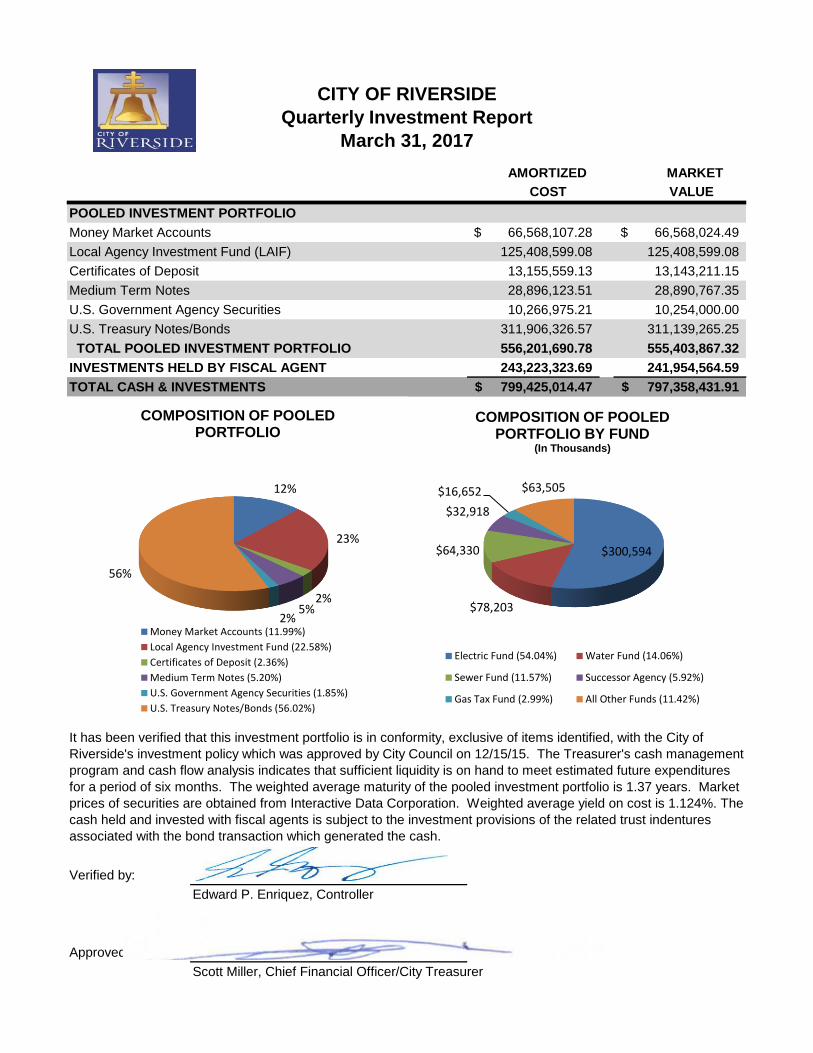
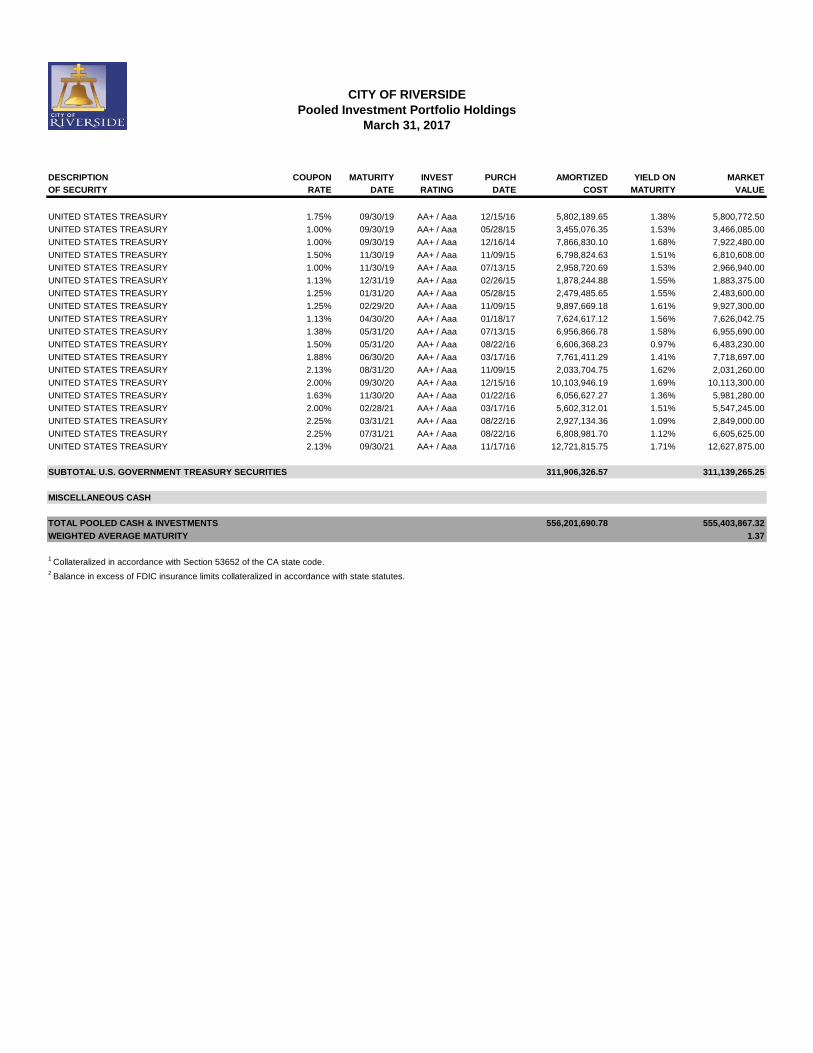
Staff recommends the City Council direct staff to implement this policy in the Fourth Quarter Financial Update to the City Council in September/October 2017. QUARTERLY INVESTMENT AND CASH REPORT Sound investment practices are an essential component of the City’s strong fiscal management. The Finance Department is responsible for managing the City’s investment portfolio, focusing first on the safety of investments, and then on liquidity and an appropriate rate of return. The investment results and portfolio composition are summarized and reported to the City Council each quarter. As of March 31, 2017, the City’s pooled investment portfolio’s market value was $555 million, with the market value of investments held by fiscal agents (bond proceeds and reserve funds primarily) amounting to an additional $242 million. The weighted average yield of the pooled investment portfolio is 1.124%. Through prior City Council approval, the Chief Financial Officer/Treasurer has the authority to invest/reinvest funds and to sell or exchange purchased securities, consistent with the City’s adopted investment policy. This approval is a requirement of State law and is received at the start of each fiscal year. The Investment Report, including a listing of cash balances by fund, is included in Attachment B. These cash balances reflect each fund’s share of the City’s pooled investment portfolio. Also shown are interfund loan receivables, which are treated as available cash due to the Finance Director/Treasurer’s authorization to move loan receivables to other funds as needed. All listed funds have a positive cash balance with the exception of the following funds:
1. The General Fund ($8,203,961), which is offset by an outstanding capital lease receivable related to the Police Records Management System and Computronix permitting system. Historically, the revenues related to the capital lease have been received prior to the initiation of project; however, the City recently completed the process of securing financing to fully offset ongoing project costs. It is anticipated that the City will receive necessary cash inflow during the fourth quarter of the fiscal year.
2. The Urban Areas Security Initiative ($101,716), Housing Opportunities for Persons with AIDS ($887,196), and NPDES Storm Drain ($307,608) which are fully offset by outstanding grant receivables.
3. Certificates of Participation Projects ($498,758), Capital Outlay ($4.1 million), and Transportation Uniform Mitigation Fees ($1.87 million) have negative cash balances due to the timing of expenditures; however, the negative balances are fully offset by grant receivables.
4. Debt Service Fund – General ($642,885) due to the timing of an annual 2008 COPS payment for $3.6 million that is recouped through monthly utilization charges.
5. The Liability Insurance Trust Fund has a negative cash balance of approximately ($1.8 million), but is consolidated with the positive cash balances of the Workers Compensation Insurance Trust Fund ($17.9 million) and Unemployment Insurance Trust Fund ($429,956) for financial reporting purposes. Staff has implemented a strategy to return
FY 2016-2018 Two-Year Budget Mid-Cycle Update and 3rd Quarter Financial, Investment, and Debt Reports Page 7
the Liability Insurance Trust Fund to an improved financial condition (cash and fund balance levels) over the next five years, which includes $5 million from Measure Z over the next two years.
6. The Central Stores ($223,026), which is fully offset by inventory assets that will recouped when charged out for usage to various departments.
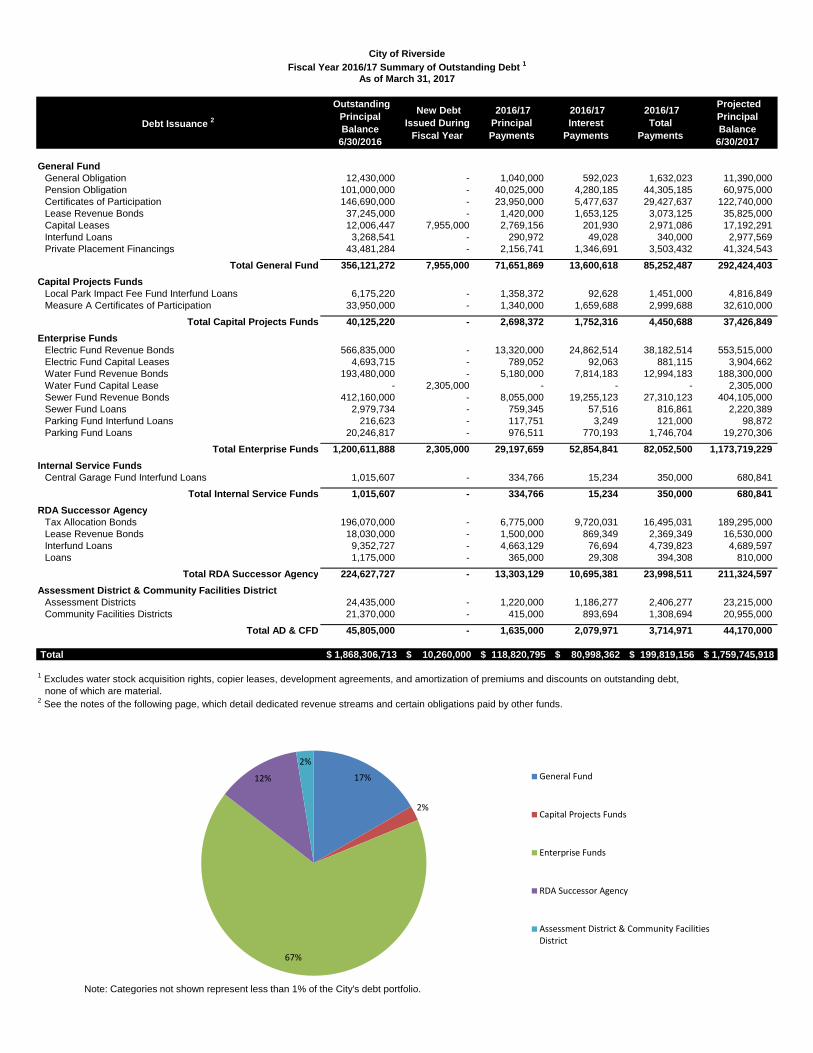
QUARTERLY DEBT REPORT The Finance Department is also charged with managing the City’s debt portfolio, which includes issuing new debt and monitoring opportunities to refinance existing debt as opportunities to reduce interest costs arise. The Quarterly Debt Report (Attachment C) summarizes the composition of the City’s debt portfolio, details the revenue sources utilized to pay the debt service associated with each outstanding debt, and provides detailed information regarding the total principal and interest payments due in the current fiscal year by Fund. As of the second quarter, the City’s outstanding principal balance is projected to decrease by $108,560,795. This reduction is misleading because it reflects the payoff of the City’s interest only bond anticipation note (BAN), which is refunded every year. In May 2017, the BAN was refunded into a 10-year pension obligation bond (2017A POB). The Fourth Quarter Debt Report will reflect the issuance of the 2017A POB, which will increase the City’s outstanding debt by over $30 million. Therefore, the overall net debt reduction will be under $78 million. FISCAL YEAR 2017-2018: MID-CYCLE UPDATE The FY 2017-2018 revised budget reflects total expenditures across all funds of $1,026,569,134, which is approximately $55.2 million more than the Adopted FY 2017-2018 Budget of $971,380,144. The increases are largely associated with the passage of Measure Z ($46 million) and adjustments to reflect negotiated employee compensation and benefit changes ($9 million). A complete look at the FY 2017-2018 Mid-Cycle Update, based on the Third Quarter 2016-2017 Financial Report and Adopted Measure Z Spending Plan, can be found at Attachment J. GENERAL FUND RESTRUCTURING As part of the Mid-Cycle Update, staff analyzed all General Fund activity and determined that restructuring of the General Fund was required in order to provide for greater transparency between true General Fund activity and other financial activity that has historically been in the General Fund. New funds have been established for Civic Entertainment and Special Districts. While the majority of these items are self-supported by specific revenues, certain operations will require a General Fund operating transfer to ensure expenditures are supported by revenues. These changes reduce the size of the General Fund by approximately $19.1 million, from $275.7 million based on third quarter projections to $256.6 million. This may allow transferring less of Measure Z funds to the General Fund at the end of FY 2017-18 to maintain a 20% reserve Finally, staff consolidated three separate debt funds into one general government debt fund. While this does not reduce the size or financial requirements of the General Fund, it was a necessary measure to ensure transparency for the public and future staff. Civic Entertainment Currently, the Riverside Convention Center (RCC), Fox Entertainment Plaza (including The Box and Showcase) and the Riverside Municipal Auditorium (RMA) were fiscally managed in the

FY 2016-2018 Two-Year Budget Mid-Cycle Update and 3rd Quarter Financial, Investment, and Debt Reports Page 8 General Fund. As part of the proposed Mid-Cycle changes, an enterprise fund called Civic Entertainment was established with all financial activity of these facilities, including any debt service charges. The financial activity in the new fund will provide greater transparency and the subsidy provided by the General Fund will be more pronounced through operating transfers. The FY 2017-18 operating subsidy required, largely associated with debt for the rehabilitation of the facilities, is $3,187,072 for RCC and $4,827,681for The Fox, RMA and City run The Box. Special Districts As part of the Mid-Cycle Update, staff proposes to establish a Special District Fund. The Special District Fund would be comprised of the street light assessment district, landscape maintenance districts and the park maintenance districts. These districts are supported through increased property tax assessments, self-imposed by the landowners, to fund improvements. The special districts should be self-supporting; however, over time, based on the dollar limits imposed during their original creation, this is not always the case. The financial activity in the new fund will provide greater transparency of special district activity, while the operating subsidy provided by the General Fund will ensure revenues meet the requirement expenditures. The operating subsidy required for fiscal year 2017-2018 for the Special District fund is $1,074,263. Debt Historically, pension bond debt and other general obligation debt issues (e.g. 2008 COPS) have been accounted for in separate funds. All General Fund debt payments will now reside in the Debt Service Fund (390) with utilization charges to the General Fund in order to pay for its share of the debt payment activity. FY 2017-2018 CAPITAL IMPROVEMENT PLAN Capital projects are proposed by staff, and approved by the City Council, based on identified needs and funding priorities. Most of the projects are related to electric system improvements, enhancements and repairs; and public works / transportation projects. High Priority projects are categorized as funded projects and are budgeted for FY 2016-2017 and FY 2017-2018 and their funding needs are planned in Fiscal Years 2018-2021. Table 1 below reflects proposed Mid-Cycle revisions to the CIP funding for FY 2017-2018 and funding needs for the remaining three years. The total funding in the five-year CIP is $376,635,669, including Measure Z. Government Code Section 65401 requires that the Planning Commission review the City’s CIP budget and plan for the upcoming fiscal year for conformity with the General Plan 2025. The CIP projects and budget were submitted to the Planning Commission on May 18, 2017 and were found to be consistent with the General Plan and exempt from CEQA review. (Attachment H) The funding of new projects from Measure Z were approved at the May 16, 2017 City Council meeting. Funding includes a parking garage ($15 million), Eastside Library site selection ($100,000), Museum expansion and rehabilitation ($15 million), new Downtown Library ($30 million), new Police Headquarters ($45 million), and funding of $4.2 million for Annual Deferred Maintenance for facilities.

FY 2016-2018 Two-Year Budget Mid-Cycle Update and 3rd Quarter Financial, Investment, and Debt Reports Page 9 Table 1: Funded CIP Projects for Fiscal Years 2016-2021 by Category
Projects with no current funding are categorized as unfunded. Table 2 below reflects unfunded CIP amounts of $156,320,879 for Fiscal Years 2016-21 and total unfunded needs beyond FY 2020-2021 of $1,246,088,541. Table 2: Unfunded CIP Projects for Fiscal Years 2016-2021
Historically the City’s proposed CIP budget has had minimal impact of the City’s General Fund. This trend continues for the Mid-Cycle amended FY 2017-2018 CIP Budget and Five-Year Plan for FYs 2016-2021. For FY 2017-2018 the CIP budget will include General Fund expenses in the amount of $107,000 and $1,100,000 from Measure Z funds. The majority of the funding sources for the proposed CIP are related to special revenues funds such as Gas Tax and Measure A for street repairs, enterprise funds for water and electric projects, and development impact for Parks and Recreation. The appropriation of funds associated with these projects occurs with the adoption of the Mid-Cycle budget revisions. Certain projects (e.g. electric infrastructure) will have funds appropriated when the projects themselves are before the Public Utilities Board and/or City Council for approval. FY 2017-2018 PERSONNEL DETAIL AMENDMENT The Personnel Detail is a section of the biennial budget that reflects the authorized and budgeted full time and part time positions (Attachment I). This document is utilized to maintain position control and is the basis for the personnel budget. Staff recommends approval of the Personnel Detail amendments for a net increase of 50.25 FTE in FY 2017-2018. The majority of the FTE increases, 41, are associated with Measure Z. Key changes in non-Measure Z positions are described below.
Department FY 2016/17 FY 2017/18 FY 2018/19 FY 2019/20 FY 2020/21
Funded CIP Total
5 Years General Services 935,556 1,607,000 8,927,177 9,818,353 11,018,353 32,306,439 Innovation and Technology - - 1,500,000 - 1,250,000 2,750,000 Parks, Recreation, and Community Services 4,627,300 10,000 - - - 4,637,300 Public Utilities 61,375,000 43,038,000 55,549,000 46,435,000 47,807,000 254,204,000 Public Works 25,511,130 19,080,500 18,585,600 11,398,000 8,162,700 82,737,930 Funded CIP Totals $92,448,986 $63,735,500 $84,561,777 $67,651,353 $68,238,053 $376,635,669
Department FY 2016/17 FY 2017/18 FY 2018/19 FY 2019/20 FY 2020/21
Unfunded CIP Total
5 Years Unfunded CIP Totals
General Services 2,940,700 7,184,081 18,678,000 56,280,000 38,351,000 123,433,781 258,993,081 Innovation and Technology - 2,931,500 13,483,650 8,839,238 5,232,710 30,487,098 30,487,098 Parks, Recreation, and Community Services 400,000 800,000 400,000 400,000 400,000 2,400,000 245,986,810 Public Utilities - - - - - - 306,102,000 Public Works - - - - - - 404,519,552 Funded CIP Totals $3,340,700 $10,915,581 $32,561,650 $65,519,238 $43,983,710 $156,320,879 $1,246,088,541

FY 2016-2018 Two-Year Budget Mid-Cycle Update and 3rd Quarter Financial, Investment, and Debt Reports Page 10 Finance Department During the downturn of the economy the Finance Department merged the Purchasing and Risk Management functions. A recent operational audit by Matrix Consulting and an independent classification and compensation study by an outside expert pointed out that combining risk and purchasing is somewhat unique compared to other cities, recommending separation of the two functions, as was the case in the City prior to 2009. Currently, the Risk Management function is a hybrid of in-house staff and an outside claims administration company, Carl Warren. In an effort to streamline claims management, provide better customer service, and reduce long-term liabilities, staff recommends the separation of Risk Management from Purchasing and the addition of staff to Risk Management to insource the entire process. The recommendation requires the addition of two employees (claims specialist and claims inspector) and a new software system, the cost of which will be offset by the elimination of the Carl Warren agreement (at $200,000 per year). A detailed overview of this proposal will be presented as a separate City Council item on June 20, 2017. City Attorney’s Office The City Attorney’s Office increases by 3.5 positions in FY 2017-2018. One of the increased positions was already included in the Adopted FY 2016-2018 Budget as part of the plan to reduce the need for outside legal counsel, which is more expensive that City staff. The additional 2.5 positions included in the Mid-Cycle Update represent a further reduction in outside legal counsel as it relates to Worker’s Compensation. A Senior Deputy City Attorney and 1.5 Paralegal positions have been added. The anticipated costs of $295,000 will reduce the outside legal counsel costs for the Worker’s Compensation Fund in the same amount. As such, there is no budget impact from the addition of these positions. A detailed overview of this proposal will be presented as a separate City Council item on June 20, 2017. Public Utilities Department The Public Utilities Department increases by two positions overall, mostly associated with the steps necessary to implement Utility 2.0. Included in the variety of changes outlined in Attachment I, are the addition of three Electric Power System Dispatcher II positions needed to appropriately staff the Dispatch function and greatly reduce overtime. There is no impact to the Public Utilities Budget as these costs represent a cost savings over the current overtime expenditures. MEASURE Z: FY 2017-2018 On May 16, 2017, the City Council approved a Five-Year Spending Plan for Measure Z. All expenditures will be tracked in the Measure Z Fund (110). The following is a reconciliation of what was approved by the City Council and what is included for City Council approval in the Mid-Cycle Update expenditure detail (Attachment F).
Est. Annual Cost 1,900,800$ Actual Costs 1,706,629$
Add: POB Savings $ 194,171 → Savings/(Deficit) $ 194,171
Add: Contingency $ 1,000,000 Total FY 2017-2018 Measure Z
Budget (City Council Approved) $ 47,235,944
General Fund 2017A POBFY 2017-2018 Measure Z Budget Reconcilliation
Fund 110 Budgeted Expenditures $ 46,041,773

FY 2016-2018 Two-Year Budget Mid-Cycle Update and 3rd Quarter Financial, Investment, and Debt Reports Page 11 Beginning with the First Quarter Financial Report for FY 2017-2018, staff will present a summary of the Measure Z financial activity to date and year-end projections, including an Action Plan with a status on each Measure Z funded item. FISCAL IMPACT: The City’s 2017-2018 Mid-Cycle revised budget totals $1,026,569,134 with $256,579,753 in the General Fund and $46,041,773 in the Measure Z fund. Prepared by: Adam Raymond, Assistant Chief Financial Officer Certified as to availability of funds: Scott Miller, Chief Financial Officer/Treasurer Approved by: Marianna Marysheva, Assistant City Manager Approved as to form: Gary G. Geuss, City Attorney Attachments:
A. FY 2016-2018 Third Quarter General Fund Financial Report B. FY 2016-2017 Third Quarter Investment Report C. FY 2016-2017 Third Quarter Debt Report D. Measure Z Spending Plan E. Resolution F. Expenditure Detail G. Revenue Detail H. Capital Improvement Plan I. Personnel Detail Amendment J. FY 2017-2018 Budget-in-Brief K. Presentation

March 7
ATTACHMENT A
FINANCIAL REPORT

A-2
General Fund and Measure Z SummaryFY 2016/17 and FY 2017/18 Third Quarter ProjectionsAs of March 31, 2017
FY 2016/17 FY 2017/18 FY 2016/17 FY 2017/18 FY 2016/17 FY 2017/18 FY 2016/17 FY 2017/18BEGINNING: General Fund Reserve 33,158,729$ 33,185,259$ 33,158,729$ 29,219,202$ 33,158,729$ 39,584,967$ -$ 10,365,765$
REVENUES/TRANSFERS IN(See A-3)
266,444,469$ 273,508,401$ 263,549,493$ 269,544,291$ 266,761,564$ 271,249,547$ 3,212,071$ 1,705,256$
EXPENDITURES/TRANSFERS OUT(See A-4) 266,417,939$ 271,430,387$ 267,489,020$ 275,026,696$ 269,824,076$ 275,732,921$ 2,335,056$ 706,225$
PROJECTED SURPLUS/(DEFICIT) 26,530$ 2,078,014$ (3,939,527)$ (5,482,405)$ (3,062,512)$ (4,483,374)$ 877,015$ 999,031$
33,185,259$ 35,263,273$ 29,219,202$ 23,736,797$ 30,096,217$ 35,101,593$ 877,015$ 11,364,796$
12.5% 13.0% 10.9% 8.6% 11.2% 12.7%
General Fund Reserve and Operating Shortfall Transfer In
From Measure Z9,488,750$ 20,482,404$
33,185,259$ 35,263,273$ 29,219,202$ 23,736,797$ 39,584,967$ 55,583,997$ 877,015$ 11,364,796$
12.5% 13.0% 10.9% 8.6% 14.7% 20.2%
ENDING: General Fund Reserve(With Measure Z)
PROJECTED (3RD QTR) DIFFERENCE(2nd vs 3rd Quarter Projections)GENERAL FUND
ADOPTED
General Fund Reserve(Without Measure Z)
PROJECTED (2ND QTR)

A-3
General Fund and Measure Z Revenue Summary 276241059 16,417,008.00$ FY 2016/17 and FY 2017/18 Third Quarter Estimates 259824051
FY 2016-17 FY 2017-18 FY 2016-17 FY 2017-18 FY 2016-17 FY 2017-18 FY 2016-17 FY 2017-18Sales & Use Taxes 66,567,942$ 70,140,574$ 64,774,596$ 67,301,060$ 64,774,596$ 66,417,450$ -$ (883,610)$
Property Taxes 56,730,769$ 59,713,414$ 56,013,942$ 58,955,324$ 56,013,942$ 58,955,324$ -$ -$ Utilities Users Tax 28,577,109$ 29,180,764$ 27,987,000$ 28,497,775$ 27,790,294$ 28,291,424$ (196,706)$ (206,351)$
Franchise Fees 5,590,000$ 5,682,700$ 5,275,000$ 5,372,500$ 5,275,000$ 5,372,500$ -$ -$ Transient Occupancy Tax 6,541,500$ 6,868,575$ 6,541,500$ 6,868,575$ 6,541,500$ 6,868,575$ -$ -$
Property Transfer Tax 2,684,000$ 2,952,400$ 2,208,091$ 2,428,900$ 2,300,000$ 2,530,000$ 91,909$ 101,100$ General Fund Transfer 45,075,000$ 46,142,500$ 44,902,400$ 46,142,500$ 44,902,400$ 45,981,500$ -$ (161,000)$
Charges for Services - Development & Building 4,505,786$ 4,742,061$ 4,717,984$ 4,971,445$ 5,008,655$ 5,248,191$ 290,671$ 276,746$
Special Revenue - Entertainment 11,151,690$ 11,289,982$ 11,969,102$ 12,121,395$ 13,278,000$ 12,824,250$ 1,308,898$ 702,855$ Charges for Services 10,692,514$ 10,891,110$ 10,713,437$ 10,923,092$ 10,849,061$ 10,997,428$ 135,624$ 74,336$ Licenses and Permits 9,825,167$ 10,499,737$ 9,920,348$ 10,559,461$ 9,726,151$ 10,453,741$ (194,197)$ (105,720)$
Fines and Forfeits 1,737,000$ 1,745,065$ 1,444,000$ 1,427,669$ 1,441,000$ 1,413,539$ (3,000)$ (14,130)$ Special Assessments 4,504,237$ 4,494,029$ 4,514,237$ 4,504,029$ 4,564,237$ 4,554,029$ 50,000$ 50,000$
Intergovernmental Revenues 1,520,000$ 1,525,000$ 1,575,959$ 1,578,834$ 2,219,849$ 1,584,815$ 643,890$ 5,981$ Other 10,741,756$ 7,640,491$ 10,991,897$ 7,891,732$ 12,076,879$ 9,756,781$ 1,084,982$ 1,865,049$
Projected Total Revenues / Transfers In* 266,444,469$ 273,508,401$ 263,549,493$ 269,544,291$ 266,761,564$ 271,249,547$ 3,212,071$ 1,705,256$
-$ (0)$
FY 2016-17 FY 2017-18 FY 2016-17 FY 2017-18 FY 2016-17 FY 2017-18 FY 2016-17 FY 2017-18Measure Z Revenue -$ -$ 10,000,000$ 51,557,000$ 10,000,000$ 51,557,000$ -$ -$
Projected Total Measure Z Revenues / Transfers In -$ -$ 10,000,000$ 51,557,000$ 10,000,000$ 51,557,000$ -$ -$
GENERAL FUND ADOPTED PROJECTED (2nd QTR)
DIFFERENCE
PROJECTED (3rd QTR)DIFFERENCE
(2nd Qtr vs 3rd Qtr Projections)
MEASURE Z ADOPTED PROJECTED (2nd QTR) PROJECTED (3rd QTR)
* The Revenues/Transfer In total does not equal the total on Attachment G of the Staff report. The difference is related to Mid-Cycle adjustments for Measure Z and the transfer of debt payments to the Debt Service Fund (390) that are not included with Third Quarter Projections.
A-4
General Fund Expenditure SummaryFY 2016/17 and FY 2017/18 Third Quarter EstimatesAs of March 31, 2017
FY 2016/17 FY 2017/18 FY 2016/17 FY 2017/18 FY 2016/17 FY 2017/18 FY 2016/17 FY 2017/18City Attorney 5,313,609 5,502,273 5,321,425 5,557,450 5,321,425 5,557,450 - -
City Clerk 1,635,897 1,585,663 1,638,578 1,598,503 1,638,578 1,598,503 - - City Council 1,154,609 1,188,786 1,156,358 1,197,805 1,156,358 1,197,805 - -
City Manager 4,646,594 4,744,761 4,659,179 4,800,487 4,659,179 4,800,487 - -
Community & Economic Development 14,872,358 13,247,189 14,935,084 13,431,552 14,935,084 13,431,552 - -
Finance 7,983,943 8,325,081 7,321,158 8,423,809 7,321,158 8,423,809 - - Fire 46,268,255 47,421,963 47,036,680 48,440,057 47,431,680 48,440,057 395,000 -
General Services 4,201,810 4,282,639 4,220,236 4,334,169 4,220,236 4,334,169 - - Human Resources 2,858,747 3,009,650 2,866,196 3,048,932 3,338,546 3,048,932 472,350 -
Innovation & Technology 10,706,322 10,973,233 10,724,296 11,086,046 10,817,296 11,086,046 93,000 - Library 6,314,899 6,545,361 6,370,289 6,658,925 6,370,289 6,658,925 - - Mayor 789,774 820,971 791,693 830,260 791,693 830,260 - -
Museum & Cultural Affairs 3,735,574 3,795,899 3,749,965 3,834,704 3,749,965 3,834,704 - - Non-Departmental 27,245,657 26,821,037 27,245,657 26,821,037 27,934,657 27,527,262 689,000 706,225
Non-Departmental - Community Livability 25,000 25,000 25,000 25,000 25,000 25,000 - -
Parks, Recreation & Community Services 17,482,123 17,782,927 18,150,520 18,556,313 17,725,520 18,556,313 (425,000) -
Police 93,133,824 96,123,053 93,516,702 97,757,541 94,687,408 97,757,541 1,170,706 - Public Works 23,415,984 24,012,403 22,627,045 23,401,610 22,627,045 23,401,610 - -
Subtotal 271,784,980 276,207,891 272,356,061 279,804,200 274,751,117 280,510,425 2,395,056 706,225 Allocated Costs, Utilization Charges and
Operating Transfers (24,580,201) (25,034,250) (24,080,201) (25,034,250) (24,140,201) (25,034,250) (60,000) -
Net Debt Service Allocation 19,213,160 20,256,746 19,213,160 20,256,746 19,213,160 20,256,746 - - Total 266,417,939 271,430,387 267,489,020 275,026,696 269,824,076 275,732,921 2,335,056 706,225
PROJECTED (2nd Quarter) PROJECTED (3rd Quarter)DIFFERENCE
(2nd Quarter vs 3rd Quarter Projections)
GENERAL FUND ADOPTED

March 2017
B-1
ATTACHMENT B
INVESTMENT REPORT
CITY OF RIVERSIDEQuarterly Investment Report
March 31, 2017AMORTIZED MARKET
COST VALUEPOOLED INVESTMENT PORTFOLIOMoney Market Accounts 66,568,107.28$ 66,568,024.49$ Local Agency Investment Fund (LAIF) 125,408,599.08 125,408,599.08 Certificates of Deposit 13,155,559.13 13,143,211.15 Medium Term Notes 28,896,123.51 28,890,767.35 U.S. Government Agency Securities 10,266,975.21 10,254,000.00 U.S. Treasury Notes/Bonds 311,906,326.57 311,139,265.25 TOTAL POOLED INVESTMENT PORTFOLIO 556,201,690.78 555,403,867.32 INVESTMENTS HELD BY FISCAL AGENT 243,223,323.69 241,954,564.59 TOTAL CASH & INVESTMENTS 799,425,014.47$ 797,358,431.91$
Verified by:Edward P. Enriquez, Controller
Approved by:Scott Miller, Chief Financial Officer/City Treasurer
It has been verified that this investment portfolio is in conformity, exclusive of items identified, with the City of Riverside's investment policy which was approved by City Council on 12/15/15. The Treasurer's cash management program and cash flow analysis indicates that sufficient liquidity is on hand to meet estimated future expenditures for a period of six months. The weighted average maturity of the pooled investment portfolio is 1.37 years. Market prices of securities are obtained from Interactive Data Corporation. Weighted average yield on cost is 1.124%. The cash held and invested with fiscal agents is subject to the investment provisions of the related trust indentures associated with the bond transaction which generated the cash.
12%
23%
2%5%
2%
56%
COMPOSITION OF POOLED PORTFOLIO
Money Market Accounts (11.99%)
Local Agency Investment Fund (22.58%)
Certificates of Deposit (2.36%)
Medium Term Notes (5.20%)
U.S. Government Agency Securities (1.85%)
U.S. Treasury Notes/Bonds (56.02%)
$300,594
$78,203
$64,330
$32,918
$16,652 $63,505
COMPOSITION OF POOLED PORTFOLIO BY FUND
(In Thousands)
Electric Fund (54.04%) Water Fund (14.06%)
Sewer Fund (11.57%) Successor Agency (5.92%)
Gas Tax Fund (2.99%) All Other Funds (11.42%)
CITY OF RIVERSIDEPooled Investment Portfolio Holdings
March 31, 2017
DESCRIPTION COUPON MATURITY INVEST PURCH AMORTIZED YIELD ON MARKETOF SECURITY RATE DATE RATING DATE COST MATURITY VALUE
MONEY MARKET ACCOUNTS
CALTRUST Heritage Money Market Fund - Select Class Varies Varies AAA Varies 54,543.53 0.95% 54,548.97CALTRUST Investment Trust of California Varies Varies AA Varies 45,099,504.13 1.03% 45,099,415.90Bank of America Varies Varies Coll. 1 Varies 16,318,835.73 0.50% 16,318,835.73Citizens Business Bank Varies Varies Coll. 1 Varies 5,095,223.89 0.35% 5,095,223.89
SUBTOTAL MONEY MARKET ACCOUNTS 66,568,107.28 66,568,024.49
LOCAL AGENCY INVESTMENT FUND (LAIF) Varies Varies NR Varies 125,408,599.08 0.85% 125,408,599.08
CERTIFICATES OF DEPOSIT
Parkway Bank And Trust Company 1.15% 04/07/17 FDIC 10/07/14 248,000.00 1.15% 248,029.76United Community Bank 1.00% 04/13/17 FDIC 10/14/14 248,000.00 1.00% 248,034.72Leader Bank, National Association 1.05% 04/21/17 FDIC 10/23/14 248,000.00 1.05% 248,062.00South State Bank 1.00% 06/20/17 FDIC 12/20/13 249,000.00 1.00% 249,176.79First Commercial Bank 1.00% 07/31/17 FDIC 10/30/14 248,000.00 1.00% 248,223.20American Express Bank, FSB 1.25% 08/21/17 FDIC 08/21/14 248,000.00 1.25% 248,466.24Capital One, National Association 1.25% 08/21/17 FDIC 08/19/15 249,000.00 1.25% 249,475.59Discover Bank 1.30% 08/21/17 FDIC 08/20/14 248,000.00 1.30% 248,520.80Signature Bank of Arkansas 1.05% 08/25/17 FDIC 08/26/15 249,000.00 1.05% 249,288.84EverBank 1.10% 08/28/17 FDIC 08/28/15 248,000.00 1.10% 248,342.24Mauch Chunk Trust Company 1.20% 09/11/17 FDIC 10/10/14 248,000.00 1.20% 248,453.84Keybank National Association 1.15% 09/25/17 FDIC 09/25/15 248,000.00 1.15% 248,414.16First Bank of Highland Park 1.25% 10/10/17 FDIC 10/08/14 248,000.00 1.25% 248,535.68Third Federal Savings and Loan Association of Clev 1.40% 11/27/17 FDIC 11/27/13 248,000.00 1.40% 248,699.36BBVA Compass 0.45% 12/04/17 FDIC 2 12/04/15 1,000,000.00 0.45% 1,000,000.00WEX Inc. 1.20% 12/11/17 FDIC 12/11/15 248,000.00 1.20% 248,391.84Customers Bank 1.25% 12/18/17 FDIC 12/18/15 248,000.00 1.25% 248,451.36Bank of North Carolina 1.25% 01/16/18 FDIC 01/16/15 247,000.00 1.25% 247,370.50Cadence Bank, N.A. 1.25% 02/12/18 FDIC 02/10/16 248,000.00 1.25% 248,277.76Mercantil Commercebank, National Association 1.50% 04/24/18 FDIC 10/24/14 248,000.00 1.50% 248,463.76GE Capital Financial Inc. 1.60% 07/03/18 FDIC 07/03/14 248,000.00 1.60% 248,629.92United Bank 1.55% 07/17/18 FDIC 10/17/14 248,000.00 1.55% 248,461.28MB Financial Bank, National Association 1.35% 08/21/18 FDIC 08/21/15 249,000.00 1.35% 248,820.72Comenity Capital Bank 1.70% 08/24/18 FDIC 08/24/15 249,000.00 1.70% 249,841.62East Boston Savings Bank 1.40% 08/24/18 FDIC 08/24/15 249,000.00 1.40% 248,947.71Goldman Sachs Bank USA 1.65% 09/04/18 FDIC 09/03/14 247,000.00 1.65% 247,649.61Sallie Mae Bank 1.80% 09/04/18 FDIC 09/03/14 247,000.00 1.80% 248,076.92First Priority Bank 1.45% 09/28/18 FDIC 09/30/15 248,000.00 1.45% 247,962.80UBS Bank USA 1.40% 10/01/18 FDIC 10/08/15 248,000.00 1.40% 247,801.60Capital One Bank 1.80% 10/09/18 FDIC 10/08/14 248,000.00 1.80% 249,019.28Marlin Business Bank 1.70% 10/15/18 FDIC 10/14/14 248,000.00 1.70% 248,709.28Community Bankers' Bank 1.65% 10/17/18 FDIC 10/17/14 248,000.00 1.65% 248,543.12American Express Centurion Bank 2.00% 11/28/18 FDIC 11/28/14 248,000.00 2.00% 249,450.80Flushing Bank 1.50% 12/17/18 FDIC 12/17/15 249,000.00 1.50% 248,810.76Keybank National Association 1.55% 01/22/19 FDIC 01/20/16 247,000.00 1.55% 246,832.04Investors Community Bank 1.15% 02/12/19 FDIC 02/12/16 249,000.00 1.15% 247,095.15Prime Alliance Bank, Inc. 1.15% 02/12/19 FDIC 02/12/16 249,000.00 1.15% 247,095.15CIT Bank, National Association 2.00% 05/14/19 FDIC 05/14/14 247,000.00 2.00% 248,101.62Webster Bank, National Association 1.90% 07/02/19 FDIC 07/02/14 247,559.13 1.98% 248,600.16ConnectOne Bank 1.55% 07/29/19 FDIC 01/28/15 247,000.00 1.55% 245,950.25Alma Bank 1.70% 09/30/19 FDIC 09/30/15 247,000.00 1.70% 246,377.56Belmont Savings Bank 1.40% 02/18/20 FDIC 02/17/16 249,000.00 1.40% 245,653.44Bank of Wisconsin Dells 1.50% 07/17/20 FDIC 02/17/16 249,000.00 1.50% 245,369.58

CITY OF RIVERSIDEPooled Investment Portfolio Holdings
March 31, 2017
DESCRIPTION COUPON MATURITY INVEST PURCH AMORTIZED YIELD ON MARKETOF SECURITY RATE DATE RATING DATE COST MATURITY VALUE
Bridgewater Bank 1.50% 08/17/20 FDIC 02/17/16 249,000.00 1.50% 245,150.46Unity Bank 1.50% 08/26/20 FDIC 02/26/16 249,000.00 1.50% 245,083.23Barclays Bank Delaware 2.20% 09/16/20 FDIC 09/16/15 247,000.00 2.20% 247,918.84Bank of Charles Town 1.80% 09/30/20 FDIC 09/30/15 249,000.00 1.80% 247,040.37HSBC Bank USA, National Association 1.60% 11/17/20 FDIC 11/23/15 246,000.00 2.96% 245,987.70EnerBank USA 1.90% 01/28/21 FDIC 01/28/16 247,000.00 1.90% 245,051.17The State Bank and Trust Company 1.60% 02/17/21 FDIC 02/17/16 249,000.00 1.60% 244,500.57
SUBTOTAL CERTIFICATES OF DEPOSIT 13,155,559.13 13,143,211.15
MEDIUM TERM NOTES
GENERAL ELECTRIC CO 2.30% 04/27/17 AA- / A1 09/10/14 7,591,205.63 1.15% 7,589,854.40APPLE INC 1.05% 05/05/17 AA+ / Aa1 09/10/14 4,000,780.43 0.84% 4,000,160.00SHELL INTERNATIONAL FINANCE BV 1.13% 08/21/17 A / Aa2 04/10/14 1,803,832.75 1.29% 1,804,043.35TOYOTA MOTOR CREDIT CORP 1.25% 10/05/17 AA- / Aa3 04/10/14 2,716,365.54 1.30% 2,716,456.60CHEVRON CORP 1.10% 12/05/17 AA- / Aa2 04/10/14 2,743,450.46 1.46% 2,746,535.00WAL-MART STORES INC 5.80% 02/15/18 AA / Aa2 01/28/16 491,815.59 0.48% 488,753.00BERKSHIRE HATHAWAY FINANCE CORP 1.30% 05/15/18 AA / Aa2 01/28/16 1,000,958.70 1.21% 1,000,330.00TOYOTA MOTOR CREDIT CORP 1.55% 07/13/18 AA- / Aa3 01/28/16 5,007,445.32 1.43% 5,005,050.00APPLE INC 2.10% 05/06/19 AA+ / Aa1 01/28/16 3,540,269.10 1.54% 3,539,585.00
SUBTOTAL MEDIUM TERM NOTES 28,896,123.51 28,890,767.35
U.S. GOVERNMENT AGENCY SECURITIES
FEDERAL HOME LOAN MORTGAGE CORP 5.13% 11/17/17 AA+ / Aaa 01/16/13 10,266,975.21 0.85% 10,254,000.00
SUBTOTAL U.S. GOVERNMENT AGENCY SECURITIES 10,266,975.21 10,254,000.00
U.S. GOVERNMENT TREASURY SECURITIES
UNITED STATES TREASURY 2.63% 01/31/18 AA+ / Aaa 05/21/14 12,153,287.48 1.08% 12,155,640.00UNITED STATES TREASURY 0.88% 01/31/18 AA+ / Aaa 07/16/14 1,988,890.57 1.55% 1,997,180.00UNITED STATES TREASURY 0.75% 03/31/18 AA+ / Aaa 07/13/15 4,993,049.81 0.89% 4,983,200.00UNITED STATES TREASURY 2.63% 04/30/18 AA+ / Aaa 05/21/14 11,169,834.16 1.18% 11,175,780.00UNITED STATES TREASURY 1.00% 05/31/18 AA+ / Aaa 07/13/15 10,266,218.74 0.86% 10,234,420.00UNITED STATES TREASURY 1.00% 05/31/18 AA+ / Aaa 05/21/14 3,980,188.39 1.43% 3,993,920.00UNITED STATES TREASURY 1.38% 06/30/18 AA+ / Aaa 10/10/14 1,501,365.36 1.30% 1,504,275.00UNITED STATES TREASURY 2.25% 07/31/18 AA+ / Aaa 11/17/16 11,188,446.86 0.95% 11,157,740.00UNITED STATES TREASURY 1.38% 07/31/18 AA+ / Aaa 11/17/16 11,057,666.67 0.98% 11,031,790.00UNITED STATES TREASURY 1.50% 08/31/18 AA+ / Aaa 05/21/14 5,526,222.39 1.16% 5,524,695.00UNITED STATES TREASURY 1.38% 09/30/18 AA+ / Aaa 12/16/15 10,540,428.53 1.11% 10,529,925.00UNITED STATES TREASURY 1.25% 10/31/18 AA+ / Aaa 05/21/14 4,983,315.10 1.46% 5,004,100.00UNITED STATES TREASURY 1.25% 11/30/18 AA+ / Aaa 07/13/15 5,316,655.18 1.06% 5,303,498.00UNITED STATES TREASURY 1.25% 01/31/19 AA+ / Aaa 05/21/14 2,981,418.19 1.59% 3,000,690.00UNITED STATES TREASURY 2.75% 02/15/19 AA+ / Aaa 07/16/14 2,070,797.11 0.84% 2,055,620.00UNITED STATES TREASURY 2.75% 02/15/19 AA+ / Aaa 05/21/14 2,080,932.41 0.58% 2,055,620.00UNITED STATES TREASURY 0.75% 02/15/19 AA+ / Aaa 11/17/16 9,935,921.32 1.10% 9,909,400.00UNITED STATES TREASURY 1.38% 02/28/19 AA+ / Aaa 05/24/16 14,599,071.38 1.01% 14,533,930.00UNITED STATES TREASURY 1.38% 02/28/19 AA+ / Aaa 10/10/14 2,592,339.17 1.53% 2,606,084.00UNITED STATES TREASURY 1.63% 04/30/19 AA+ / Aaa 02/26/15 7,060,344.42 1.20% 7,048,650.00UNITED STATES TREASURY 1.63% 06/30/19 AA+ / Aaa 11/09/15 3,719,203.28 1.39% 3,724,568.00UNITED STATES TREASURY 1.63% 06/30/19 AA+ / Aaa 05/24/16 6,075,784.69 1.06% 6,039,840.00UNITED STATES TREASURY 0.75% 07/15/19 AA+ / Aaa 11/17/16 12,618,565.88 1.21% 12,581,700.00UNITED STATES TREASURY 0.88% 07/31/19 AA+ / Aaa 11/17/16 12,652,659.15 1.21% 12,613,575.00UNITED STATES TREASURY 1.63% 07/31/19 AA+ / Aaa 09/09/14 3,496,457.30 1.67% 3,521,875.00UNITED STATES TREASURY 1.00% 08/31/19 AA+ / Aaa 10/10/14 1,856,696.81 1.97% 1,883,375.00UNITED STATES TREASURY 1.75% 09/30/19 AA+ / Aaa 01/18/17 19,159,739.63 1.41% 19,167,770.00
CITY OF RIVERSIDEPooled Investment Portfolio Holdings
March 31, 2017
DESCRIPTION COUPON MATURITY INVEST PURCH AMORTIZED YIELD ON MARKETOF SECURITY RATE DATE RATING DATE COST MATURITY VALUE
UNITED STATES TREASURY 1.75% 09/30/19 AA+ / Aaa 12/15/16 5,802,189.65 1.38% 5,800,772.50UNITED STATES TREASURY 1.00% 09/30/19 AA+ / Aaa 05/28/15 3,455,076.35 1.53% 3,466,085.00UNITED STATES TREASURY 1.00% 09/30/19 AA+ / Aaa 12/16/14 7,866,830.10 1.68% 7,922,480.00UNITED STATES TREASURY 1.50% 11/30/19 AA+ / Aaa 11/09/15 6,798,824.63 1.51% 6,810,608.00UNITED STATES TREASURY 1.00% 11/30/19 AA+ / Aaa 07/13/15 2,958,720.69 1.53% 2,966,940.00UNITED STATES TREASURY 1.13% 12/31/19 AA+ / Aaa 02/26/15 1,878,244.88 1.55% 1,883,375.00UNITED STATES TREASURY 1.25% 01/31/20 AA+ / Aaa 05/28/15 2,479,485.65 1.55% 2,483,600.00UNITED STATES TREASURY 1.25% 02/29/20 AA+ / Aaa 11/09/15 9,897,669.18 1.61% 9,927,300.00UNITED STATES TREASURY 1.13% 04/30/20 AA+ / Aaa 01/18/17 7,624,617.12 1.56% 7,626,042.75UNITED STATES TREASURY 1.38% 05/31/20 AA+ / Aaa 07/13/15 6,956,866.78 1.58% 6,955,690.00UNITED STATES TREASURY 1.50% 05/31/20 AA+ / Aaa 08/22/16 6,606,368.23 0.97% 6,483,230.00UNITED STATES TREASURY 1.88% 06/30/20 AA+ / Aaa 03/17/16 7,761,411.29 1.41% 7,718,697.00UNITED STATES TREASURY 2.13% 08/31/20 AA+ / Aaa 11/09/15 2,033,704.75 1.62% 2,031,260.00UNITED STATES TREASURY 2.00% 09/30/20 AA+ / Aaa 12/15/16 10,103,946.19 1.69% 10,113,300.00UNITED STATES TREASURY 1.63% 11/30/20 AA+ / Aaa 01/22/16 6,056,627.27 1.36% 5,981,280.00UNITED STATES TREASURY 2.00% 02/28/21 AA+ / Aaa 03/17/16 5,602,312.01 1.51% 5,547,245.00UNITED STATES TREASURY 2.25% 03/31/21 AA+ / Aaa 08/22/16 2,927,134.36 1.09% 2,849,000.00UNITED STATES TREASURY 2.25% 07/31/21 AA+ / Aaa 08/22/16 6,808,981.70 1.12% 6,605,625.00UNITED STATES TREASURY 2.13% 09/30/21 AA+ / Aaa 11/17/16 12,721,815.75 1.71% 12,627,875.00
SUBTOTAL U.S. GOVERNMENT TREASURY SECURITIES 311,906,326.57 311,139,265.25
MISCELLANEOUS CASH
TOTAL POOLED CASH & INVESTMENTS 556,201,690.78 555,403,867.32WEIGHTED AVERAGE MATURITY 1.37
1 Collateralized in accordance with Section 53652 of the CA state code.2 Balance in excess of FDIC insurance limits collateralized in accordance with state statutes.

CITY OF RIVERSIDEInvestments Held by Fiscal Agent
March 31, 2017
DESCRIPTION COUPON MATURITY INVEST PURCH AMORTIZED YIELD ON MARKETOF SECURITY RATE DATE RATING DATE COST MATURITY VALUE
CASH & MONEY MARKET ACCOUNTS
Cash Varies Varies Varies 10,306,173.33 Varies 10,306,173.33Wells Fargo Advantage 100% Treasury Money Market 0.00% Varies Varies 161,382.10 0.00% 161,382.10Wells Fargo Advantage Government Money Market 0.00% Varies Varies 7,523,889.39 0.00% 7,523,889.39US Bank Money Market Account 10 0.05% Varies Varies 1,123,599.71 0.05% 1,123,599.71US Bank Mmkt 5 - CT 0.02% Varies Varies 46,762,724.80 0.02% 46,762,724.80First American Government Obligation 0.00% Varies Varies 420,972.40 0.00% 420,972.40First American Prime Obligations Fund CL " Z " 0.02% Varies Varies 43,520,488.09 0.02% 43,520,488.09
SUBTOTAL CASH & MONEY MARKET ACCOUNTS 109,819,229.82 109,819,229.82
LOCAL AGENCY INVESTMENT FUND (LAIF) 0.51% Varies NR Varies 49,555,336.33 0.51% 49,555,336.33
BONDS, DEBENTURES, NOTES & AGREEMENTS
US Bank Na C P 0.10% 05/01/17 09/01/16 332,671.95 0.10% 332,671.95US Bank Na C P 0.00% 08/01/17 12/01/16 2,680,558.17 0.00% 2,680,558.17United Overseas BK LTD CPDN 0.00% 06/01/17 01/13/17 3,435,816.93 0.00% 3,491,983.44FNMA Debt 1.13% 4/27/17 1/16/13 3,559,500.00 1.13% 3,500,840.00Glaxosmithkline Cap 1.50% 5/8/17 11/1/12 2,040,140.00 1.50% 2,000,660.00US Govt Agency-F N M A MTN 5.00% 05/11/17 07/06/07 996,779.15 5.00% 1,043,592.38US Treasury Bill 0.59% 05/25/17 06/27/16 293,721.34 0.59% 294,696.15Caterpillar 1.63% 6/1/17 11/1/12 2,290,826.72 1.63% 2,236,603.72US Govt Agency-Federal Home Loan Bks Bonds 5.63% 06/09/17 06/13/07 5,400,000.00 5.63% 5,446,980.00FNMAMTN 5.38% 6/12/17 11/1/12 4,844,520.00 5.38% 4,034,440.00US Treasury Bill 0.58% 06/22/17 06/29/16 3,894,446.89 0.58% 3,903,470.30FHLMCM 1.00% 6/29/17 11/1/12 3,042,120.00 1.00% 3,000,930.00FHLMC Debt 1.00% 7/28/17 11/1/12 3,040,080.00 1.00% 3,001,080.00US Treasury Note 2.38% 07/31/17 10/20/15 4,914,160.78 2.38% 4,786,190.96FHLMCM 1.00% 9/29/17 1/16/13 3,023,340.00 1.00% 3,000,660.00Oracle Corp 1.20% 10/15/17 11/1/12 4,015,960.00 1.20% 3,998,960.00FNMA Debt 0.88% 12/20/17 1/16/13 3,498,145.00 0.88% 3,494,855.00FHLMCM 0.75% 1/12/18 3/19/13 3,973,128.00 0.75% 3,990,960.00US Treasury Note 2.63% 1/31/18 8/29/14 5,026,442.89 2.63% 4,881,887.95FHLB Debt 1.25% 06/08/18 06/28/13 290,532.33 1.25% 295,265.50US Treasury Note 2.25% 07/31/18 10/20/15 3,366,614.38 2.25% 3,288,846.90FHLB Debt 1.00% 09/21/18 09/21/16 1,335,000.00 1.00% 1,325,881.95Natixis Funding Corp 1.67% 03/01/19 02/14/14 7,422,802.00 1.67% 7,422,802.00FNMA Debt 1.38% 02/26/21 03/30/16 370,735.63 1.38% 364,466.69Invt Agmt-Trinity Plus Fdg Co Gic 4.68% 10/01/29 05/14/08 6,411,744.65 4.68% 6,411,744.65Invt Agmt-Trinity Plus Fdg Co Gic 4.68% 10/01/35 05/14/08 4,348,970.73 4.68% 4,348,970.73
SUBTOTAL BONDS, DEBENTURES, NOTES & AGREEMENTS 83,848,757.54 82,579,998.44
TOTAL INVESTMENTS HELD BY FISCAL AGENT 243,223,323.69 241,954,564.59
A+
AAAm
NRAAAm
A+AAAm
AAA
A2AAA
AAAm
A+A+
A2AAA
AAA
AA-AA-
BBB
AAAAAA
AAA
AAAAAAAAA
A1
AAA
AAA
AAAAAA
AAAAAA
A-1+
AAA

General Fund 101 (8,203,961) - (8,203,961)
Successor Agency Administration Fund 170 (33,069) - (33,069)
Enterprise FundsElectric 510 284,839,571 4,689,598 289,529,169 Electric - Public Benefits Charge 511 15,754,828 - 15,754,828 Water 520 75,586,076 - 75,586,076 Water - Conservation & Reclamation Program 521 2,616,746 - 2,616,746 Airport 530 749,522 - 749,522 Refuse Collection 540 6,292,269 - 6,292,269 Sewer Service 550 64,330,059 5,014,518 69,344,577 Special Transit 560 1,451,625 - 1,451,625 Public Parking 570 334,427 - 334,427
SubTotal - Enterprise Funds 451,955,123 9,704,115 461,659,238
Special Revenue FundsUrban Areas Security Initiative 205 (101,716) - (101,716) Community Development Block Grant 220 308,134 - 308,134 Home Investment Partnership Program 221 230,111 - 230,111 Housing Opportunities for Persons with AIDS 222 (887,196) - (887,196) Community Development Grants 223 1,565,182 - 1,565,182 Neighborhood Stabilization Program 225 127,461 - 127,461 Special Gas Tax 230 16,652,364 - 16,652,364 Air Quality 240 900,919 - 900,919 NPDES Storm Drain 260 (307,608) - (307,608) Housing Authority 280 4,235,460 - 4,235,460 Housing Assets 281 4,229,905 14,146,520 18,376,425
SubTotal - Special Revenue Funds 26,953,017 14,146,520 41,099,537
Capital Projects FundsCertificates of Participation Projects 401 (498,758) - (498,758) Storm Drain 410 1,203,781 - 1,203,781 Local Park Special Capital Improvements 411 2,383,427 - 2,383,427 Regional Park Special Capital Improvements 413 2,473,644 - 2,473,644 Capital Outlay 430 (4,095,578) - (4,095,578) Transportation Projects 431 (62,691) - (62,691) Measure A Capital Outlay 432 17,303,000 - 17,303,000 Transportation Development Impact Fees 433 3,615,478 - 3,615,478 Transportation Uniform Mitigation Fees 434 (1,869,443) - (1,869,443) Community Facilities Districts and Assessment Districts Various 1,883,092 - 1,883,092
SubTotal - Capital Project Funds 22,335,952 - 22,335,952
Debt Service FundsDebt Service Fund - General 390 (642,885) - (642,885) Debt Service Fund - Public Works 391 1,437,248 - 1,437,248
SubTotal Debt Service Funds 794,364 - 794,364
Agency FundsRedevelopment Successor Agency Various 32,950,456 - 32,950,456 Community Facilities Districts and Assessment Districts Various 1,695,944 - 1,695,944 Special Deposits Various 12,926,691 - 12,926,691
SubTotal Agency Funds 47,573,091 - 47,573,091
Internal Service FundsWorkers' Compensation Insurance Trust 610 10,546,747 7,316,264 17,863,011 Unemployment Insurance Trust 620 429,956 - 429,956 Liability Insurance Trust 630 (1,755,548) - (1,755,548) Central Stores 640 (223,026) - (223,026) Central Garage 650 5,031,223 2,779,900 7,811,123
SubTotal - Internal Service Funds 14,029,351 10,096,164 24,125,515
555,403,867$ 33,946,799$ 589,350,667$
1 Amount reflects each fund's share of the City's pooled investment portfolio.2 Amounts shown are interfund loans outstanding, including the SERAF loan due to the Housing Authority. Interfund loan receivable balances are treated as available cash due to the ability to move loan receivables to other funds as needed.
City of RiversideCash Balances by Fund
As of March 31, 2017
Total - All Funds
CashBalance 1
FundInterfund Loan Receivables 2
Cash Balance + Loan
Receivables

March 2017
C-1
ATTACHMENT C
DEBT REPORT
Debt Issuance 2 Outstanding
PrincipalBalance
6/30/2016
New Debt Issued During
Fiscal Year
2016/17 Principal Payments
2016/17 Interest
Payments
2016/17Total
Payments
ProjectedPrincipalBalance
6/30/2017
General FundGeneral Obligation 12,430,000 - 1,040,000 592,023 1,632,023 11,390,000 Pension Obligation 101,000,000 - 40,025,000 4,280,185 44,305,185 60,975,000 Certificates of Participation 146,690,000 - 23,950,000 5,477,637 29,427,637 122,740,000 Lease Revenue Bonds 37,245,000 - 1,420,000 1,653,125 3,073,125 35,825,000 Capital Leases 12,006,447 7,955,000 2,769,156 201,930 2,971,086 17,192,291 Interfund Loans 3,268,541 - 290,972 49,028 340,000 2,977,569 Private Placement Financings 43,481,284 - 2,156,741 1,346,691 3,503,432 41,324,543
Total General Fund 356,121,272 7,955,000 71,651,869 13,600,618 85,252,487 292,424,403 Capital Projects Funds
Local Park Impact Fee Fund Interfund Loans 6,175,220 - 1,358,372 92,628 1,451,000 4,816,849 Measure A Certificates of Participation 33,950,000 - 1,340,000 1,659,688 2,999,688 32,610,000
Total Capital Projects Funds 40,125,220 - 2,698,372 1,752,316 4,450,688 37,426,849 Enterprise Funds
Electric Fund Revenue Bonds 566,835,000 - 13,320,000 24,862,514 38,182,514 553,515,000 Electric Fund Capital Leases 4,693,715 - 789,052 92,063 881,115 3,904,662 Water Fund Revenue Bonds 193,480,000 - 5,180,000 7,814,183 12,994,183 188,300,000 Water Fund Capital Lease - 2,305,000 - - - 2,305,000 Sewer Fund Revenue Bonds 412,160,000 - 8,055,000 19,255,123 27,310,123 404,105,000 Sewer Fund Loans 2,979,734 - 759,345 57,516 816,861 2,220,389 Parking Fund Interfund Loans 216,623 - 117,751 3,249 121,000 98,872 Parking Fund Loans 20,246,817 - 976,511 770,193 1,746,704 19,270,306
Total Enterprise Funds 1,200,611,888 2,305,000 29,197,659 52,854,841 82,052,500 1,173,719,229 Internal Service Funds
Central Garage Fund Interfund Loans 1,015,607 - 334,766 15,234 350,000 680,841
Total Internal Service Funds 1,015,607 - 334,766 15,234 350,000 680,841 RDA Successor Agency
Tax Allocation Bonds 196,070,000 - 6,775,000 9,720,031 16,495,031 189,295,000 Lease Revenue Bonds 18,030,000 - 1,500,000 869,349 2,369,349 16,530,000 Interfund Loans 9,352,727 - 4,663,129 76,694 4,739,823 4,689,597 Loans 1,175,000 - 365,000 29,308 394,308 810,000
Total RDA Successor Agency 224,627,727 - 13,303,129 10,695,381 23,998,511 211,324,597 Assessment District & Community Facilities District
Assessment Districts 24,435,000 - 1,220,000 1,186,277 2,406,277 23,215,000 Community Facilities Districts 21,370,000 - 415,000 893,694 1,308,694 20,955,000
Total AD & CFD 45,805,000 - 1,635,000 2,079,971 3,714,971 44,170,000
Total $ 1,868,306,713 $ 10,260,000 $ 118,820,795 $ 80,998,362 $ 199,819,156 $ 1,759,745,918
1 Excludes water stock acquisition rights, copier leases, development agreements, and amortization of premiums and discounts on outstanding debt,none of which are material.
2 See the notes of the following page, which detail dedicated revenue streams and certain obligations paid by other funds.
As of March 31, 2017Fiscal Year 2016/17 Summary of Outstanding Debt 1
City of Riverside
17%
2%
67%
12%
2%General Fund
Capital Projects Funds
Enterprise Funds
RDA Successor Agency
Assessment District & Community FacilitiesDistrict
Note: Categories not shown represent less than 1% of the City's debt portfolio.

Debt Issuance Year of Issuance
Year of Final
Maturity
Total Issue Size Repayment Source
OutstandingPrincipalBalance
6/30/2016
New Debt Issued During Fiscal Year
2016/17 Principal Payments
2016/17 Interest Payments
2016/17Total
Payments
ProjectedPrincipalBalance
6/30/2017
General Obligation Measure G Fire Facility Projects Bonds 2004 2024 20,000,000 Existing Special Property Tax 12,430,000 - 1,040,000 592,023 1,632,023 11,390,000 Pension Obligation Pension Obligation Bonds (2004) 2004 2023 89,540,000 General Purpose General Fund Revenues 56,600,000 - 5,760,000 3,337,136 9,097,136 50,840,000 Pension Obligation Bonds (2005) Series A 2005 2020 30,000,000 General Purpose General Fund Revenues 2 13,255,000 - 3,120,000 633,589 3,753,589 10,135,000 Pension Obligation Refunding Bond Anticipation Notes 2016 2017 31,145,000 General Purpose General Fund Revenues 2, 7 31,145,000 - 31,145,000 309,460 31,454,460 - Certificates of Participation Galleria Mall Improvements 2006 2036 19,945,000 Project Developer / Successor Agency 17,575,000 - 535,000 790,491 1,325,491 17,040,000 Riverside Renaissance Projects Refunding 2008 2037 128,300,000 General Purpose General Fund Revenues 109,300,000 - 3,600,000 3,644,408 7,244,408 105,700,000 Recovery Zone Facility Hotel Project (Hyatt) 2010 2040 20,660,000 Project Developer / Successor Agency 19,815,000 - 19,815,000 1,042,738 20,857,738 - Lease Revenue Bonds Lease Revenue Refunding Bonds Series A 2012 2033 41,240,000 General Purpose General Fund Revenues 3 37,245,000 - 1,420,000 1,653,125 3,073,125 35,825,000 Capital Leases VOIP Phone System 2012 2022 1,650,000 General Purpose General Fund Revenues 1,116,334 - 160,771 25,618 186,388 955,564 Police Department Helicopter 2013 2019 1,348,316 General Purpose General Fund Revenues 689,198 - 225,889 10,665 236,554 463,309 Various Vehicles, Software, and Hardware 2013 2019 3,642,934 General Purpose General Fund Revenues 1,862,102 - 610,315 28,816 639,131 1,251,787 Various Vehicles, Software, and Hardware 2013 2018 2,957,221 General Purpose General Fund Revenues 1,498,981 - 594,218 16,210 610,428 904,764 Convention Center, Fox, Muni, and RPD Dispatch FF&E 2013 2021 3,668,000 General Purpose General Fund Revenues 2,666,783 - 514,934 44,426 559,360 2,151,849 Various Vehicles, Software, and Hardware 2014 2022 4,450,000 General Purpose General Fund Revenues 4,173,048 - 663,030 76,194 739,224 3,510,019 Various Hardware and Software 2017 2025 7,955,000 General Purpose General Fund Revenues - 7,955,000 - - - 7,955,000 Interfund Loans Utilities Plaza Purchase Interfund Loan 2012 2027 4,469,221 Building Lease Revenue 3,268,541 - 290,972 49,028 340,000 2,977,569 Private Placement Financings Ryan Bonaminio Park Loan 2012 2021 4,000,000 General Purpose General Fund Revenues 2,543,567 - 392,506 74,608 467,114 2,151,061 Convention Center Expansion Loan 2012 2034 44,650,000 General Fund Transient Occupancy Tax 4 40,937,717 - 1,764,235 1,272,083 3,036,318 39,173,482
Total General Fund 356,121,272 7,955,000 71,651,869 13,600,618 85,252,487 292,424,403 Local Park Impact Fee Fund Riverside Renaissance Debt Service Interfund Loan #1 2010 2020 3,460,000 Development Impact Fee Revenue 3,460,000 - 680,100 51,900 732,000 2,779,900 Riverside Renaissance Debt Service Interfund Loan #2 2011 2019 3,402,000 Development Impact Fee Revenue 2,715,220 - 678,272 40,728 719,000 2,036,949
Total Local Park Impact Fee Fund 6,175,220 - 1,358,372 92,628 1,451,000 4,816,849 Measure A Fund RPFA Local Measure A Sales Tax Revenue COPs 2013 2033 35,235,000 Measure A Sales Tax Revenues 33,950,000 - 1,340,000 1,659,688 2,999,688 32,610,000
Total Measure A Fund 33,950,000 - 1,340,000 1,659,688 2,999,688 32,610,000 Electric Utility Electric Revenue Refunding Bonds (2008) Series A 2008 2029 84,515,000 Existing Electric Rates/Refunding Proceeds 70,540,000 - - 2,194,499 2,194,499 70,540,000 Electric Revenue Refunding Bonds (2008) Series C 2008 2035 57,325,000 Existing Electric Rates/Refunding Proceeds 41,975,000 - - 1,344,879 1,344,879 41,975,000 Electric Revenue Bonds (2008) Series D 2008 2038 209,740,000 Existing Electric Rates 209,740,000 - - 10,246,400 10,246,400 209,740,000 Electric Revenue Bonds (2009) Series A 2009 2018 34,920,000 Existing Electric Rates 3,640,000 - 1,150,000 140,500 1,290,500 2,490,000 Electric Revenue Bonds (2010) Series A 2010 2040 133,290,000 Existing Electric Rates 133,290,000 - - 6,479,481 6,479,481 133,290,000 Electric Revenue Bonds (2010) Series B 2010 2019 7,090,000 Existing Electric Rates 7,090,000 - 95,000 305,625 400,625 6,995,000 Electric Revenue Bonds (2011) Series A 2011 2035 56,450,000 Existing Electric Rates/Refunding Proceeds 41,925,000 - - 1,613,274 1,613,274 41,925,000 Electric Revenue Refunding Bonds (2013) Series A 2013 2043 79,080,000 Existing Electric Rates 58,635,000 - 12,075,000 2,537,856 14,612,856 46,560,000 Electric Fund Vehicles Capital Leases Various Various Various Existing Electric Rates 4,693,715 - 789,052 92,063 881,115 3,904,662
Total Electric Fund 571,528,715 - 14,109,052 24,954,578 39,063,630 557,419,662 Water Utility Water Revenue Bonds (2008) Series B 2008 2038 58,235,000 Existing Water Rates 58,235,000 - 1,610,000 2,798,150 4,408,150 56,625,000 Water Revenue Bonds (2009) Series A 2009 2020 31,895,000 Existing Water Rates 12,730,000 - 2,970,000 517,350 3,487,350 9,760,000 Water Revenue Bonds (2009) Series B 2009 2039 67,790,000 Existing Water Rates 67,790,000 - - 2,717,377 2,717,377 67,790,000 Water Revenue Bonds (2011) Series A 2011 2035 59,000,000 Existing Water Rates 54,725,000 - 600,000 1,781,306 2,381,306 54,125,000 Water Fund Vehicles Capital Lease 2017 2027 2,305,000 Existing Water Rates - 2,305,000 - - - 2,305,000
Total Water Fund 193,480,000 2,305,000 5,180,000 7,814,183 12,994,183 190,605,000 Sewer Utility Headworks Project Loan 2000 2019 7,956,419 Existing Sewer Rates 1,383,086 - 452,992 24,395 477,387 930,095 Cogeneration Project Loan 2003 2021 5,374,978 Existing Sewer Rates 1,596,647 - 306,353 33,120 339,474 1,290,294 Sewer Revenue Bonds (2009) Series A 2009 2016 36,835,000 Existing Sewer Rates 8,055,000 - 8,055,000 201,375 8,256,375 - Sewer Revenue Bonds (2009) Series B 2009 2039 204,075,000 Existing Sewer Rates 204,075,000 - - 9,216,748 9,216,748 204,075,000 Sewer Revenue Bonds (2015) Series A 2015 2040 200,030,000 Existing Sewer Rates 200,030,000 - - 9,837,000 9,837,000 200,030,000
Total Sewer Fund 415,139,734 - 8,814,345 19,312,639 28,126,984 406,325,389
City of RiversideFiscal Year 2016/17 Detail of Outstanding Debt 1
As of March 31, 2017

Debt Issuance Year of Issuance
Year of Final
Maturity
Total Issue Size Repayment Source
OutstandingPrincipalBalance
6/30/2016
New Debt Issued During Fiscal Year
2016/17 Principal Payments
2016/17 Interest Payments
2016/17Total
Payments
ProjectedPrincipalBalance
6/30/2017
Parking Fund Parking Garages 1 & 2 Interfund Loan #2 2008 2018 942,006 Parking Fund Revenue 216,623 - 117,751 3,249 121,000 98,872 Fox Entertainment Plaza Loan 2010 2032 25,000,000 Parking Fund Revenue 5 20,246,817 - 976,511 770,193 1,746,704 19,270,306
Total Parking Fund 20,463,440 - 1,094,262 773,442 1,867,704 19,369,178 Central Garage Fund CNG Refueling Station Interfund Loan 2013 2019 1,674,262 Fuel Sales 1,015,607 - 334,766 15,234 350,000 680,841
Total Central Garage Fund 1,015,607 - 334,766 15,234 350,000 680,841 RDA Successor Agency RPFA Multiple Project Area TABs (1991) 1991 2018 13,285,000 Successor Agency Tax Increment 45,000 - 20,000 3,600 23,600 25,000 California Tower Lease Revenue Bonds Series A 2003 2024 26,255,000 Successor Agency Tax Increment 15,475,000 - 1,275,000 735,500 2,010,500 14,200,000 California Tower Lease Revenue Bonds Series B 2003 2024 4,810,000 Successor Agency Tax Increment 2,555,000 - 225,000 133,849 358,849 2,330,000 RPFA Multiple Project Area TABs (2007) Series A 2007 2037 8,340,000 Successor Agency Tax Increment 8,170,000 - 25,000 356,331 381,331 8,145,000 RPFA Multiple Project Area TABs (2007) Series B 2007 2028 14,850,000 Successor Agency Tax Increment 11,620,000 - 470,000 658,922 1,128,922 11,150,000 RPFA Multiple Project Area TABs (2007) Series C 2007 2037 89,205,000 Successor Agency Tax Increment 85,960,000 - 605,000 4,193,100 4,798,100 85,355,000 RPFA Multiple Project Area TABs (2007) Series D 2007 2032 43,875,000 Successor Agency Tax Increment 31,430,000 - 1,805,000 1,782,519 3,587,519 29,625,000 3615-3653 Main Street Acquisition Interfund Loan 2009 2017 4,280,000 Successor Agency Tax Increment 4,239,823 - 4,239,823 - 4,239,823 (0) HUD Section 108 Refunding Loan - Mission Village 2011 2018 2,695,000 Successor Agency Tax Increment 1,175,000 - 365,000 29,308 394,308 810,000 Reid Park Acquisition Interfund Loan 2011 2028 720,000 Successor Agency Tax Increment 662,178 - 55,067 9,933 65,000 607,111 Riverside Golf Course Acquisition Interfund Loan 2011 2028 4,837,500 Successor Agency Tax Increment 4,450,726 - 368,239 66,761 435,000 4,082,487 2014 Subordinate Tax Allocation Refunding Bonds Series A 2014 2034 61,250,000 Successor Agency Tax Increment 57,280,000 - 3,690,000 2,681,900 6,371,900 53,590,000 2014 Subordinate Tax Allocation Refunding Bonds Series B 2014 2024 1,730,000 Successor Agency Tax Increment 1,565,000 - 160,000 43,660 203,660 1,405,000
Total RDA Successor Agency 224,627,727 - 13,303,129 10,695,381 23,998,511 211,324,597 Assessment District & Community Facilities District Riverwalk Business Center Assessment District Bonds 2004 2029 3,755,000 Existing Special Property Tax 2,690,000 - 130,000 159,693 289,693 2,560,000 Sycamore Canyon Business Park CFD 92-1 Bonds 2005 2034 9,700,000 Existing Special Property Tax 7,690,000 - 250,000 392,990 642,990 7,440,000 Hunter Park Assessment District Bonds 2006 2036 15,269,906 Existing Special Property Tax 12,675,000 - 355,000 641,106 996,106 12,320,000 Riverwalk Assessment District Refunding Bonds 2011 2026 7,805,000 Existing Special Property Tax 6,100,000 - 450,000 267,006 717,006 5,650,000 Auto Center Assessment District Refunding Bonds 2012 2024 4,050,000 General Fund Sales Tax Revenue 6 2,970,000 - 285,000 118,472 403,472 2,685,000 Riverwalk Vista CFD 2006-1 2013 2043 4,415,000 Existing Special Property Tax 4,290,000 - 85,000 204,919 289,919 4,205,000 Riverwalk Vista CFD 2006-1 Improv Area No.2 Series A 2016 2046 5,505,000 Existing Special Property Tax 5,505,000 - - 179,005 179,005 5,505,000 Riverwalk Vista CFD 2006-1 Improv Area No.2 Series B 2016 2031 1,275,000 Existing Special Property Tax 1,275,000 - 80,000 42,934 122,934 1,195,000 Highlands CFD 2014-2 Series A 2016 2046 1,800,000 Existing Special Property Tax 1,800,000 - - 48,880 48,880 1,800,000 Highlands CFD 2014-2 Series B 2016 2031 810,000 Existing Special Property Tax 810,000 - - 24,966 24,966 810,000
Total Assessment District & Community Facilities District 45,805,000 - 1,635,000 2,079,971 3,714,971 44,170,000
$ 1,868,306,713 $ 10,260,000 $ 118,820,795 $ 80,998,362 $ 199,819,156 $ 1,759,745,918 1 Excludes water stock acquisition rights, copier leases, development agreements, and amortization of premiums and discounts on outstanding debt, none of which are material.2 48.3% of the debt service for these bonds is allocated to other Funds based on the percentage of miscellaneous CalPERS plan employees budgeted in those Funds.3 25.4% of the debt service for these bonds is allocated to the Parking Fund for the construction of Garage 6 and to the Successor Agency for the construction of the University Village garage.4 Debt service for this loan is primarily funded from a voter-approved increase in the transient occupancy tax rate from 11% to 13%. 5 A portion of the debt service for this loan related to non-parking facilities is funded by the General Fund.6 Under the terms of an existing development agreement, increased incremental sales tax resulting from the expansion of the Auto Center funds the debt service on these bonds.7 Historically, the City has annually refinanced the BAN and rolled over the principal balance yearly. During the 4th quarter, the City refinanced the BAN into a long term 10-year Bond and will be reflected as such on the 4th quarter report.
Total

5-Year Measure Z Spending PlanAdopted by City Council on May 16, 2017
Year 1 Year 2 Year 3 Year 4 Year 5
FY 2016/17 FY 2017/18 FY 2018/19 FY 2019/20 FY 2020/21
1 20% General Fund Reserve Financial Discipline/ Responsibility $ 5,549,224 $ 15,000,000 $ 2,450,776 $ 1,000,000 $ 1,000,000 $ 25,000,000
2 Payoff of the Balloon $32 million Pension Obligation Bond Financial Discipline/ Responsibility -$ 1,900,800$ 1,900,800$ 1,900,800$ 1,900,800$ 7,603,200$
February 2017 Finance Committee recommendation to utilize Measure Z funding to pay off the BAN. The General Fund portion of the POB costs is approximately 48% of the total. The revised 10-year financing reflects approximately $40 million in total principal and interest payments. The total amounts presented are the General Fund portion only. City Council approved 10-year financing on April 25, 2017, subject to final City Council approval on May 16, 2017.
3 Funding for Workers Comp and General Liability Financial Discipline/ Responsibility $ - $ 2,500,000 $ 2,500,000 $ - $ - $ 5,000,000
4 Measure Z Spending Contingency Financial Discipline/ Responsibility $ - $ 1,000,000 $ 1,000,000 $ 2,000,000 As a new sales tax, Measure Z revenues will take between 6-12 months take shape. Amounts can cover either an overage in expense or a decrease in revenue.
5 Additional Sworn Police Positions Public Safety -$ 3,700,000$ 6,500,000$ 8,800,000$ 11,000,000$ 30,000,000$
Year 2: Add back 17 sworn officers reduced during FY 2016-18 Two-Year BudgetYear 3: Add 16 additional officersYear 4: Add 14 additional officersYear 5: Add 13 additional officers* 60 total sworn positions; all positions have an estimated 5% annual increase for salaries, benefits, etc.
6 Public Safety Non-Sworn Positions and Recruitment Costs Public Safety $ - $ 903,500 $ 1,040,408 $ 1,070,778 $ 1,127,321 $ 4,142,008
Civilian: Year 2: Add back all non-sworn FY 2016-18 Two-Year Budget Reductions, including records specialist (2), sr. office specialist (2), assistant range master (0.75), sr. police records specialist (2), background investigator (1.25), custodian (1), general service worker (1), office specialist (1)* 11 total civilian (non-dispatchers); all positions have an estimated 3% annual increase for salaries, benefits, etc.Recruitment: Includes vacation bank accruals and testing/background expenditures.HR Analyst: Total salary and benefits - based on existing position. Final amounts may differ based on starting salary and CalPERS tier. Current costs anticipated 5% annual increases
7 Police Officer Lateral Hire Incentives and Recruitment Costs Public Safety -$ -$ 344,360$ 344,360$ 344,360$ 1,033,080$ Includes hiring and retention bonuses, vacation bank
accruals, and testing/background expenditures.
Overview of ItemCity Council Approved
ItemsFunding Request Category
Measure Z Spending Plan (5-
Year Totals)
Note: Annual allocations are subject to City Council approval through the biennial or mid-cycle budget process.
Attachment D

5-Year Measure Z Spending PlanAdopted by City Council on May 16, 2017
Year 1 Year 2 Year 3 Year 4 Year 5
FY 2016/17 FY 2017/18 FY 2018/19 FY 2019/20 FY 2020/21 Overview of Item
City Council Approved
ItemsFunding Request Category
Measure Z Spending Plan (5-
Year Totals)
8 Additional Dispatchers Public Safety -$ 260,000$ 480,000$ 705,000$ 930,000$ 2,375,000$
Year 2: Add 3 additional dispatchers Year 3: Add 2 additional dispatchers Year 4: Add 2 additional dispatchers Year 5: Add 2 additional dispatchers * 9 total dispatchers are all net "new" positions; all positions have an estimated 5% annual increase for salaries, benefits, etc.
9 Reinstatement of Fire Squad Public Safety 450,000$ 792,798$ 832,438$ 874,060$ 917,763$ 3,867,058$ Approved by City Council in December 2016. Estimates include 5% annual increases (salaries, benefits, etc.).
10 Reinstatement of Captains (Training and Arson) Public Safety -$ 450,025$ 472,526$ 496,153$ 520,960$ 1,939,664$ Estimates include 5% annual increases (salaries,
benefits, etc.).
11 Reinstatement of Battalion Chief Public Safety -$ 282,595$ 296,725$ 311,561$ 327,139$ 1,218,020$ Estimates include 5% annual increases (salaries, benefits, etc.).
12 Revised PD Vehicle Replacement and Maintenance Plan Public Safety -$ 2,704,822$ 2,745,119$ 2,786,221$ 2,828,146$ 11,064,308$
Annual debt services of $690,000 plus replacement of vehicles each year. Useful life of 3-5 years; 4 year financing ($2.5 million)
13 Refurbish PD Vehicle (Pilot Program) Public Safety -$ 50,000$ -$ -$ -$ 50,000$ $25,000 per vehicle - 2 vehicle pilot program.
14 Revised Fire Vehicle Replacement and Maintenance Plan Public Safety -$ 1,690,000$ 1,990,000$ 3,574,252$ 3,894,158$ 11,148,410$
One-time replacement of 16 vehicle; 10-year financing ($13.7 million). Additional layering in of vehicle replacement for remainder of vehicles.
15 Fleet Facility Capital Repairs Needed Public Safety -$ 100,000$ -$ -$ -$ 100,000$ Facility improvements to doors, lifts and drive approach.
16 Additional Fleet Mechanics for Police Department (2) Public Safety -$ 181,000$ 190,050$ 199,553$ 209,530$ 780,133$
Total salary and benefits - based on existing position. Final amounts may differ based on starting salary and CalPERS tier. Current costs anticipated 5% annual increases for first 5-years with 2% increases thereafter.
17 Additional Fleet Mechanics for Fire Department (2) Public Safety -$ 181,000$ 190,050$ 199,553$ 209,530$ 780,133$
Total salary and benefits - based on existing position. Final amounts may differ based on starting salary and CalPERS tier. Current costs anticipated 5% annual increases for first 5-years with 2% increases thereafter.
18
Funding Gap - Existing Services (based on the FY 16-17 2nd Qtr General Fund Operating Deficit estimate)
Critical Operating Needs 3,939,526$ 5,482,404$ 10,787,847$ 17,266,026$ 10,734,277$ 48,210,080$ Based on 5-Year Model and largely associated with union contracts and a slowing of revenue growth. Model assumes no-raises for SEIU in Year 5.
19 General Plan Update (Includes Zoning Code Changes) Critical Operating Needs -$ 2,000,000$ 1,500,000$ 1,500,000$ -$ 5,000,000$
Over the past 20 years, the City's regulatory environment for development has become burdensome. In order to make an investment in the future of Riverside, funding is needed for a General Plan Update, including zoning code, in the near future.
Note: Annual allocations are subject to City Council approval through the biennial or mid-cycle budget process.
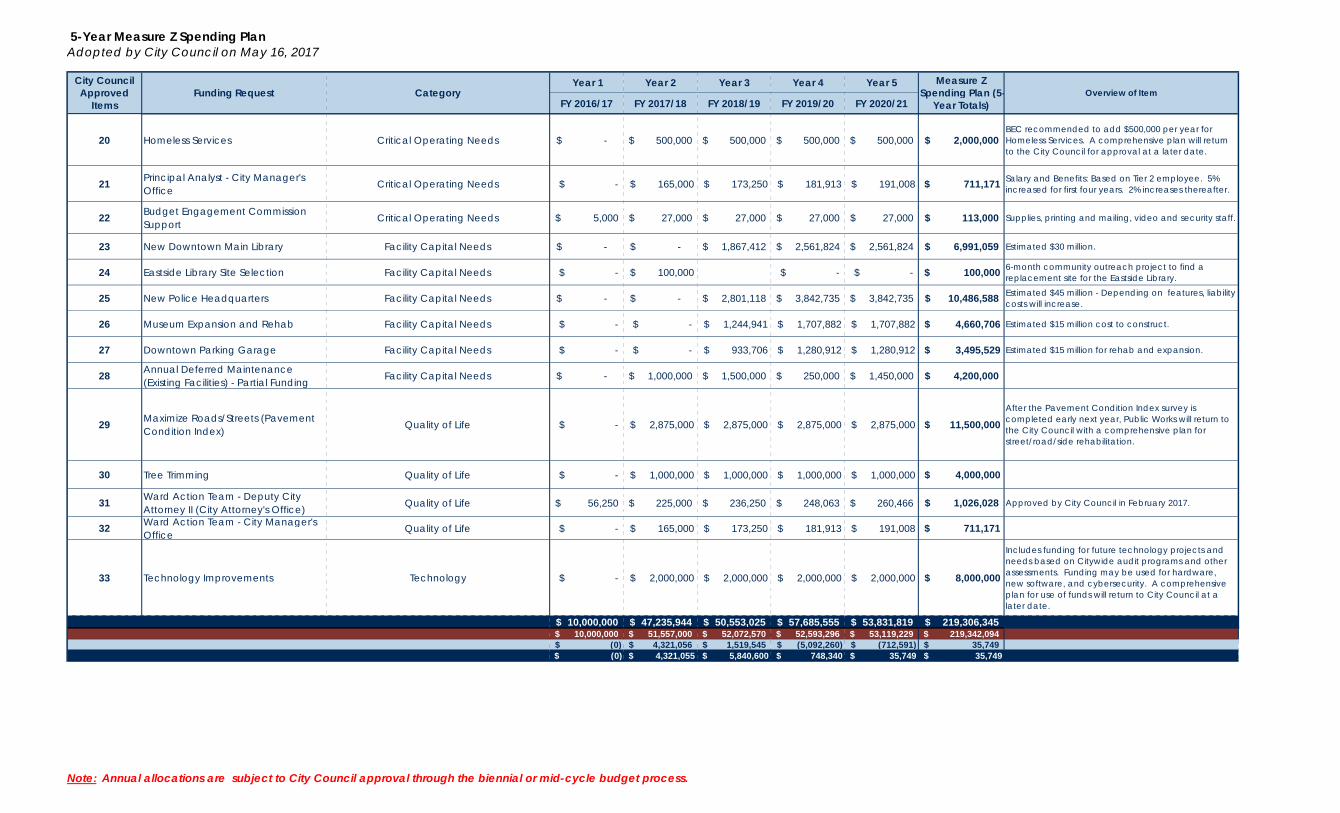
5-Year Measure Z Spending PlanAdopted by City Council on May 16, 2017
Year 1 Year 2 Year 3 Year 4 Year 5
FY 2016/17 FY 2017/18 FY 2018/19 FY 2019/20 FY 2020/21 Overview of Item
City Council Approved
ItemsFunding Request Category
Measure Z Spending Plan (5-
Year Totals)
20 Homeless Services Critical Operating Needs -$ 500,000$ 500,000$ 500,000$ 500,000$ 2,000,000$ BEC recommended to add $500,000 per year for Homeless Services. A comprehensive plan will return to the City Council for approval at a later date.
21 Principal Analyst - City Manager's Office Critical Operating Needs $ - $ 165,000 $ 173,250 $ 181,913 $ 191,008 $ 711,171 Salary and Benefits: Based on Tier 2 employee. 5%
increased for first four years. 2% increases thereafter.
22 Budget Engagement Commission Support Critical Operating Needs 5,000$ 27,000$ 27,000$ 27,000$ 27,000$ 113,000$ Supplies, printing and mailing, video and security staff.
23 New Downtown Main Library Facility Capital Needs -$ -$ 1,867,412$ 2,561,824$ 2,561,824$ 6,991,059$ Estimated $30 million.
24 Eastside Library Site Selection Facility Capital Needs $ - $ 100,000 $ - $ - $ 100,000 6-month community outreach project to find a replacement site for the Eastside Library.
25 New Police Headquarters Facility Capital Needs -$ -$ 2,801,118$ 3,842,735$ 3,842,735$ 10,486,588$ Estimated $45 million - Depending on features, liability costs will increase.
26 Museum Expansion and Rehab Facility Capital Needs $ - $ - $ 1,244,941 $ 1,707,882 $ 1,707,882 $ 4,660,706 Estimated $15 million cost to construct.
27 Downtown Parking Garage Facility Capital Needs $ - $ - $ 933,706 $ 1,280,912 $ 1,280,912 $ 3,495,529 Estimated $15 million for rehab and expansion.
28 Annual Deferred Maintenance (Existing Facilities) - Partial Funding Facility Capital Needs -$ 1,000,000$ 1,500,000$ 250,000$ 1,450,000$ 4,200,000$
29 Maximize Roads/Streets (Pavement Condition Index) Quality of Life $ - $ 2,875,000 $ 2,875,000 $ 2,875,000 $ 2,875,000 $ 11,500,000
After the Pavement Condition Index survey is completed early next year, Public Works will return to the City Council with a comprehensive plan for street/road/side rehabilitation.
30 Tree Trimming Quality of Life $ - $ 1,000,000 $ 1,000,000 $ 1,000,000 $ 1,000,000 $ 4,000,000
31 Ward Action Team - Deputy City Attorney II (City Attorney's Office) Quality of Life 56,250$ 225,000$ 236,250$ 248,063$ 260,466$ 1,026,028$ Approved by City Council in February 2017.
32 Ward Action Team - City Manager's Office Quality of Life $ - $ 165,000 $ 173,250 $ 181,913 $ 191,008 $ 711,171
33 Technology Improvements Technology $ - $ 2,000,000 $ 2,000,000 $ 2,000,000 $ 2,000,000 $ 8,000,000
Includes funding for future technology projects and needs based on Citywide audit programs and other assessments. Funding may be used for hardware, new software, and cybersecurity. A comprehensive plan for use of funds will return to City Council at a later date.
10,000,000$ 47,235,944$ 50,553,025$ 57,685,555$ 53,831,819$ 219,306,345$ 10,000,000$ 51,557,000$ 52,072,570$ 52,593,296$ 53,119,229$ 219,342,094$
(0)$ 4,321,056$ 1,519,545$ (5,092,260)$ (712,591)$ 35,749$ $ (0) $ 4,321,055 $ 5,840,600 $ 748,340 $ 35,749 $ 35,749
Note: Annual allocations are subject to City Council approval through the biennial or mid-cycle budget process.

1
2
3
4
5
6
7
8
9
10
11
12
13
14
15
16
17
18
19
20
21
22
23
24
25
26
27
28
CITY ATTORNEY’S OFFICE
3900 MAIN STREET RIVERSIDE, CA 92522
(951) 826-5567
RESOLUTION NO.
A RESOLUTION OF THE CITY COUNCIL OF THE CITY OF
RIVERSIDE, CALIFORNIA, AMENDING THE TWO-YEAR
BUDGET OF THE CITY OF RIVERSIDE FOR THE FISCAL
YEARS BEGINNING JULY 1, 2016, AND ENDING JUNE 30, 2017,
AND BEGINNING JULY 1, 2017, AND ENDING JUNE 30, 2018.
WHEREAS, on June 21, 2016, following a public hearing thereon, the City Council for
the City of Riverside adopted the Biennial Budget for the Fiscal Years beginning July 1, 2016, and
ending June 30, 2017, and beginning July 1, 2017, and ending June 30, 2018; and
WHEREAS, on June 20, 2017, in an open public meeting and following public comment,
the City Council reviewed and discussed amendments to the aforementioned Biennial Budget as
recommended by staff, including any modifications, revisions, and/or corrections made and
approved by the City Council, which are incorporated by reference as though fully set forth herein,
and together constitute the “Amended Biennial Budget for Fiscal Years 2016-2017 and 2017-2018”;
and
WHEREAS, Section 1103 of the Charter of the City of Riverside requires that the annual
budget of the City of Riverside be adopted on or before June 30th.
NOW THEREFORE, BE IT RESOLVED that the City Council hereby finds and
determines as follows:
Section 1: That the preceding recitals are true and correct and are incorporated by
reference as though fully set forth herein.
Section 2: The Amended Biennial Budget of the City of Riverside for Fiscal Years
beginning July 1, 2016, and ending June 30, 2017, and beginning July 1, 2017, and ending June 30,
2018, prepared and submitted to the City Council by the City Manager and on file in the Office of
the City Clerk, as modified and amended by the City Council, is hereby adopted on the basis of the
totals set forth in each of the budgets contained therein by program and/or sub-program within each
department, the totals set forth therein for debt redemption and interest requirements, and the totals
set forth therein for capital improvements.
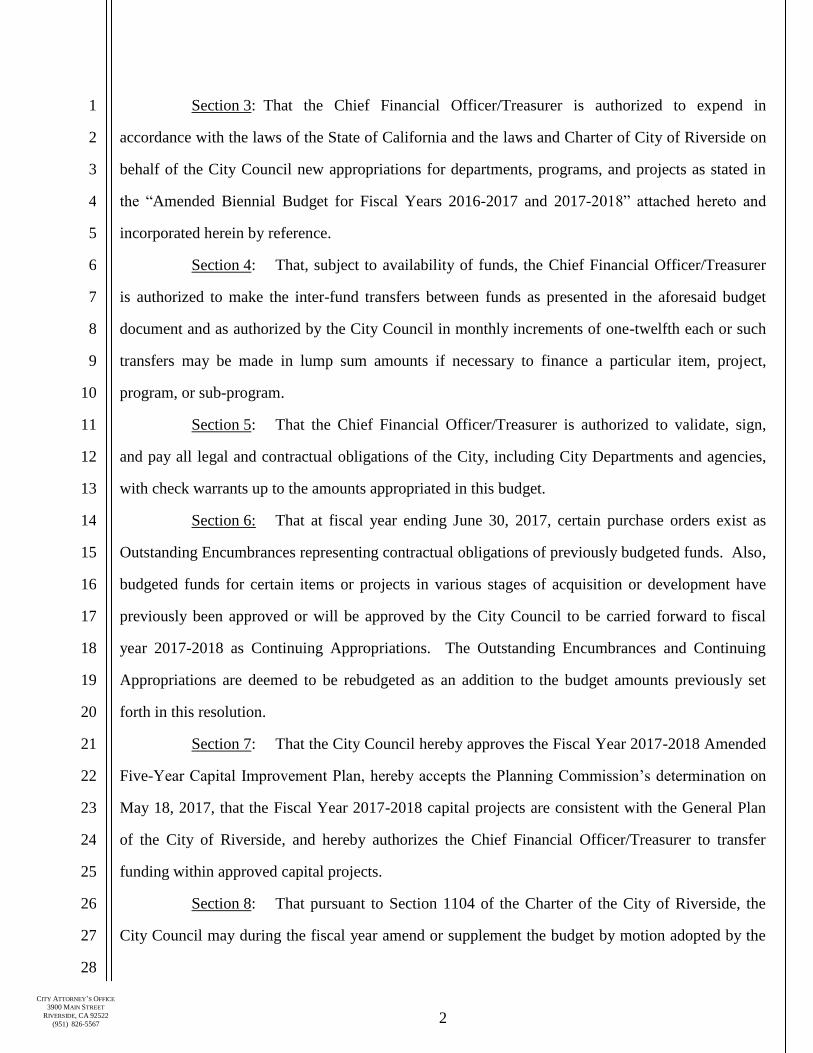
2
1
2
3
4
5
6
7
8
9
10
11
12
13
14
15
16
17
18
19
20
21
22
23
24
25
26
27
28
CITY ATTORNEY’S OFFICE 3900 MAIN STREET
RIVERSIDE, CA 92522
(951) 826-5567
Section 3: That the Chief Financial Officer/Treasurer is authorized to expend in
accordance with the laws of the State of California and the laws and Charter of City of Riverside on
behalf of the City Council new appropriations for departments, programs, and projects as stated in
the “Amended Biennial Budget for Fiscal Years 2016-2017 and 2017-2018” attached hereto and
incorporated herein by reference.
Section 4: That, subject to availability of funds, the Chief Financial Officer/Treasurer
is authorized to make the inter-fund transfers between funds as presented in the aforesaid budget
document and as authorized by the City Council in monthly increments of one-twelfth each or such
transfers may be made in lump sum amounts if necessary to finance a particular item, project,
program, or sub-program.
Section 5: That the Chief Financial Officer/Treasurer is authorized to validate, sign,
and pay all legal and contractual obligations of the City, including City Departments and agencies,
with check warrants up to the amounts appropriated in this budget.
Section 6: That at fiscal year ending June 30, 2017, certain purchase orders exist as
Outstanding Encumbrances representing contractual obligations of previously budgeted funds. Also,
budgeted funds for certain items or projects in various stages of acquisition or development have
previously been approved or will be approved by the City Council to be carried forward to fiscal
year 2017-2018 as Continuing Appropriations. The Outstanding Encumbrances and Continuing
Appropriations are deemed to be rebudgeted as an addition to the budget amounts previously set
forth in this resolution.
Section 7: That the City Council hereby approves the Fiscal Year 2017-2018 Amended
Five-Year Capital Improvement Plan, hereby accepts the Planning Commission’s determination on
May 18, 2017, that the Fiscal Year 2017-2018 capital projects are consistent with the General Plan
of the City of Riverside, and hereby authorizes the Chief Financial Officer/Treasurer to transfer
funding within approved capital projects.
Section 8: That pursuant to Section 1104 of the Charter of the City of Riverside, the
City Council may during the fiscal year amend or supplement the budget by motion adopted by the

3
1
2
3
4
5
6
7
8
9
10
11
12
13
14
15
16
17
18
19
20
21
22
23
24
25
26
27
28
CITY ATTORNEY’S OFFICE 3900 MAIN STREET
RIVERSIDE, CA 92522
(951) 826-5567
affirmative votes of at least five members so as to authorize the transfer of unused balances
appropriated for one purpose to another purpose or to appropriate available funds not included in the
budget.
Section 9: That this Resolution shall become effective immediately upon its passage.
ADOPTED by the City Council this _____ day of June, 2017.
_________________________________
WILLIAM R. BAILEY, III
Mayor of the City of Riverside
Attest:
_____________________________
COLLEEN J. NICOL
City Clerk of the City of Riverside

4
1
2
3
4
5
6
7
8
9
10
11
12
13
14
15
16
17
18
19
20
21
22
23
24
25
26
27
28
CITY ATTORNEY’S OFFICE 3900 MAIN STREET
RIVERSIDE, CA 92522
(951) 826-5567
I, Colleen J. Nicol, City Clerk of the City of Riverside, California, hereby certify that the
foregoing resolution was duly and regularly adopted at a meeting of the City Council of said City at
its meeting held on the ______ day of June, 2017, by the following vote, to wit:
Ayes: Councilmembers Noes: Absent: Abstain:
IN WITNESS WHEREOF, I have hereunto set my hand and affixed the official seal of the
City of Riverside, California, this ____ day of __________, 2017.
_________________________________
COLLEEN J. NICOL City Clerk of the City of Riverside
\\rc-citylawprod\Cycom\WPDocs\D006\P024\00339796.DOC
17-0872

Department / Section: Balance Sheet / Revenue / Balance Sheet / Revenue101 - 000000
Department Budget Detail
%Chnge16/17 vs 17/182017/182017/18
AmendedAdoptedAdopted2016/17
AmendedActualActual2016/172015/162014/15GL KeyObject Description
-0 003,0240Operating Transfer to 550 Fund0000101990550 0
-0 0Operating Transfers Out Total 003,0240
-0 00(5,400)0Sublet Repairs-Automotive0000101424250 0
-0 008130Misc Expenses Unclassified0000101447000 0
-0 0Non-personnel Expenses Total 00(4,587)0
-00 00(1,562)Total Budget Requirements 0
CCReport Name: 2017_Mid_Cycle_Report
Report Description: Budget Book - Department Budget Detail wMD
06/07/2017Date:
Time: 1
Version:
Page:19:21:28
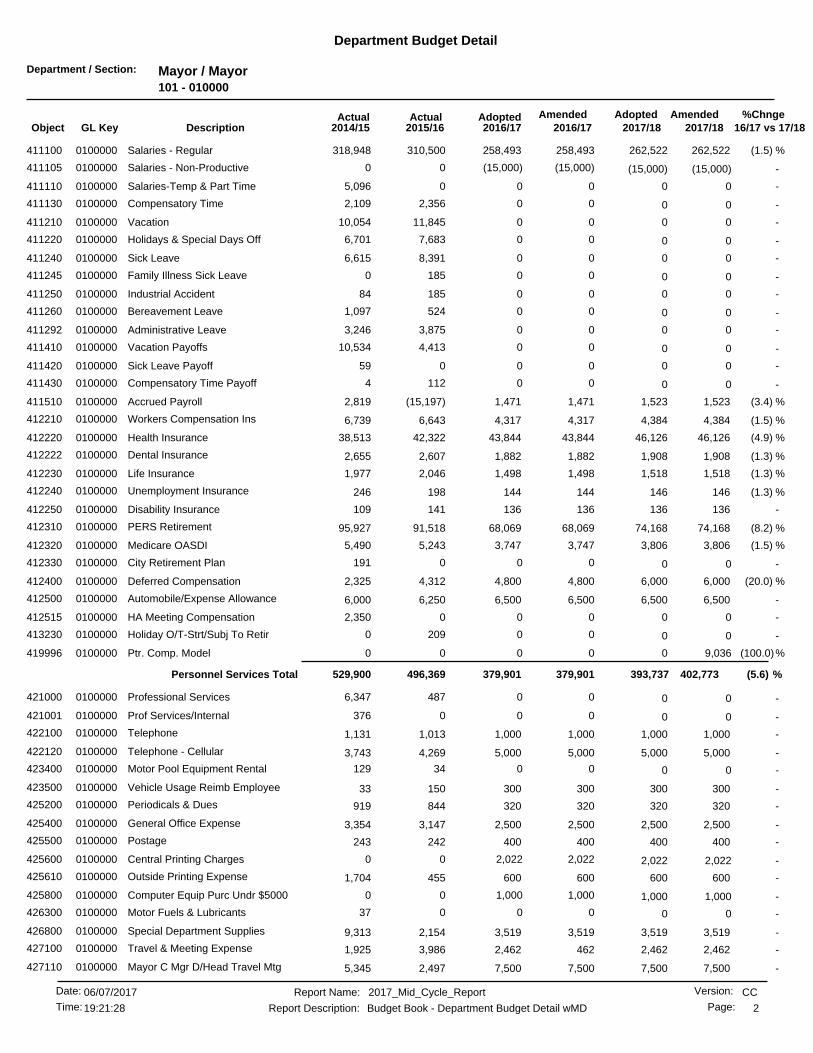
Department / Section: Mayor / Mayor101 - 010000
Department Budget Detail
%Chnge16/17 vs 17/182017/182017/18
AmendedAdoptedAdopted2016/17
AmendedActualActual2016/172015/162014/15GL KeyObject Description
(1.5) %262,522258,493 262,522258,493310,500411100 Salaries - Regular0100000 318,948
-(15,000) (15,000)(15,000)00Salaries - Non-Productive0100000411105 (15,000)
-0 0005,096Salaries-Temp & Part Time0100000411110 0
-0 002,3562,109Compensatory Time0100000411130 0
-0 0011,84510,054Vacation0100000411210 0
-0 007,6836,701Holidays & Special Days Off0100000411220 0
-0 008,3916,615Sick Leave0100000411240 0
-0 001850Family Illness Sick Leave0100000411245 0
-0 0018584Industrial Accident0100000411250 0
-0 005241,097Bereavement Leave0100000411260 0
-0 003,8753,246Administrative Leave0100000411292 0
-0 004,41310,534Vacation Payoffs0100000411410 0
-0 00059Sick Leave Payoff0100000411420 0
-0 001124Compensatory Time Payoff0100000411430 0
(3.4) %1,5231,471 1,5231,471(15,197)411510 Accrued Payroll0100000 2,819
(1.5) %4,3844,317 4,3844,3176,643412210 Workers Compensation Ins0100000 6,739
(4.9) %46,12643,844 46,12643,84442,322412220 Health Insurance0100000 38,513
(1.3) %1,9081,882 1,9081,8822,607412222 Dental Insurance0100000 2,655
(1.3) %1,5181,498 1,5181,4982,046412230 Life Insurance0100000 1,977
(1.3) %146144 146144198412240 Unemployment Insurance0100000 246
-136136 136136141412250 Disability Insurance0100000 109
(8.2) %74,16868,069 74,16868,06991,518412310 PERS Retirement0100000 95,927
(1.5) %3,8063,747 3,8063,7475,243412320 Medicare OASDI0100000 5,490
-0 000191City Retirement Plan0100000412330 0
(20.0) %6,0004,800 6,0004,8004,312412400 Deferred Compensation0100000 2,325
-6,5006,500 6,5006,5006,250412500 Automobile/Expense Allowance0100000 6,000
-0 0002,350HA Meeting Compensation0100000412515 0
-0 002090Holiday O/T-Strt/Subj To Retir0100000413230 0
(100.0)%0 9,036000Ptr. Comp. Model0100000419996 0
(5.6) %402,773379,901379,901 393,737Personnel Services Total 496,369529,900
-0 004876,347Professional Services0100000421000 0
-0 000376Prof Services/Internal0100000421001 0
-1,0001,000 1,0001,0001,013422100 Telephone0100000 1,131
-5,0005,000 5,0005,0004,269422120 Telephone - Cellular0100000 3,743
-0 0034129Motor Pool Equipment Rental0100000423400 0
-300300 300300150423500 Vehicle Usage Reimb Employee0100000 33
-320320 320320844425200 Periodicals & Dues0100000 919
-2,5002,500 2,5002,5003,147425400 General Office Expense0100000 3,354
-400400 400400242425500 Postage0100000 243
-2,022 2,0222,02200Central Printing Charges0100000425600 2,022
-600600 600600455425610 Outside Printing Expense0100000 1,704
-1,000 1,0001,00000Computer Equip Purc Undr $50000100000425800 1,000
-0 00037Motor Fuels & Lubricants0100000426300 0
-3,5193,519 3,5193,5192,154426800 Special Department Supplies0100000 9,313
-2,4622,462 2,4624623,986427100 Travel & Meeting Expense0100000 1,925
-7,5007,500 7,5007,5002,497427110 Mayor C Mgr D/Head Travel Mtg0100000 5,345
CCReport Name: 2017_Mid_Cycle_Report
Report Description: Budget Book - Department Budget Detail wMD
06/07/2017Date:
Time: 2
Version:
Page:19:21:28

Department / Section: Mayor / Mayor101 - 010000
Department Budget Detail
%Chnge16/17 vs 17/182017/182017/18
AmendedAdoptedAdopted2016/17
AmendedActualActual2016/172015/162014/15GL KeyObject Description
(1.5) %3,8853,826 3,8853,82631,053428400 Liability Insurance0100000 24,843
( .1) %30,50828,44930,449 30,508Non-personnel Expenses Total 50,33659,448
27.0 %18,50023,500 23,50044,13813,757450006 Sister Cities0100000 20,628
-00 04,2481,952450008 Model Deaf Community Program0100000 679
-0 019,00000Distracted Driving Grant0100000450102 0
-0 00051Multicultural Forum0100000450358 0
27.0 %18,50067,38723,500 23,500Special Projects Total 15,70921,360
-0 0000Walkable Communities Task Forc9776600440301 0
-0 0Capital Outlay & Grants Total 0000
(10.5) %186,340166,754 166,754166,754166,753881100 General Fund Allocation Chgs0100000 126,942
(6.6) %3,6003,360 3,6003,3605,954882101 Utilization Chgs from 101 Fund0100000 5,131
(10.4) %189,940170,114170,114 170,354Charges From Others Total 172,708132,073
1.6 %(1,035,936)(1,053,382) (1,053,382)(1,053,382)(1,075,469)891100 General Fund Allocation Chgs0100000 (953,161)
1.6 %(1,035,936)(1,053,382)(1,053,382) (1,053,382)Charges to Others Total (1,075,469)(953,161)
14.0 %(449,418) (394,215)(435,283)(407,530)(340,344)(210,378)Total Budget Requirements
CCReport Name: 2017_Mid_Cycle_Report
Report Description: Budget Book - Department Budget Detail wMD
06/07/2017Date:
Time: 3
Version:
Page:19:21:28

Department / Section: Mayor / Mayor-Community Relations101 - 012000
Department Budget Detail
%Chnge16/17 vs 17/182017/182017/18
AmendedAdoptedAdopted2016/17
AmendedActualActual2016/172015/162014/15GL KeyObject Description
(1.7) %221,124217,215 221,124217,215116,423411100 Salaries - Regular0120000 98,239
-0 026,00000CHAMPS9899500411100 0
-(2,500) (2,500)(2,500)00Salaries - Non-Productive0120000411105 (2,500)
(2.2)%5,590 5,7205,59000Salaries-Temp & Part Time0120000411110 5,720
-0 003,7097,978Vacation0120000411210 0
-0 003,9424,498Holidays & Special Days Off0120000411220 0
-0 006952,097Sick Leave0120000411240 0
-0 0001,217Bereavement Leave0120000411260 0
-0 009271,422Administrative Leave0120000411292 0
-0 001,1591,217Vacation Payoffs0120000411410 0
(3.4) %1,2921,247 1,2921,247(5,777)411510 Accrued Payroll0120000 3,426
(1.7) %3,7883,720 3,7883,7202,454412210 Workers Compensation Ins0120000 2,388
(3.9) %28,96927,829 28,96927,82926,887412220 Health Insurance0120000 21,760
(2.5) %1,5161,477 1,5161,477948412222 Dental Insurance0120000 728
(1.7) %1,3711,347 1,3711,347742412230 Life Insurance0120000 636
(1.5) %126124 12612472412240 Unemployment Insurance0120000 87
(7.8) %71,50865,875 71,50865,87533,165412310 PERS Retirement0120000 28,277
(1.7) %3,2893,231 3,2893,2311,843412320 Medicare OASDI0120000 1,694
(20.0) %4,5003,600 4,5003,6001,875412400 Deferred Compensation0120000 975
(100.0)%0 4,167000Ptr. Comp. Model0120000419996 0
(4.6) %344,870354,755328,755 340,703Personnel Services Total 189,071176,646
-0 005000Professional Services0120000421000 0
-0 07,50000CHAMPS9899500421000 0
-1,2001,200 1,2001,2001,187422120 Telephone - Cellular0120000 837
-0 01,00000CHAMPS9899500425100 0
-0 03,00000CHAMPS9899500425400 0
-0 02,50000CHAMPS9899500427100 0
(1.7) %3,3583,298 3,3583,29811,473428400 Liability Insurance0120000 8,800
(1.3) %4,55818,4984,498 4,558Non-personnel Expenses Total 13,1619,638
-2,0002,000 2,0002,0006,020450008 Model Deaf Community Program0120000 (53)
-1,5001,500 1,5005,7051,259450039 Commission on Aging0120000 570
-5,0005,000 5,00012,9534,023450051 Human Relations Commission0120000 6,184
-1,0001,000 1,0001,747452450358 Multicultural Forum0120000 2,280
-7,500 7,50020,000025,000Long Night of Arts/Innov0120000450370 7,500
(55.5) %1,800800 1,8008001,708450502 Connect with the Mayor0120000 387
-250 25025000Purple City0120000453232 250
-3,0003,000 3,0005,7237,841453925 College Council of Riverside0120000 128
-5,0005,000 5,0007,0175,482453926 Fit, Fresh and Fun0120000 161
(25.0) %2,0001,500 2,0003,5004,422456022 Commty Supprt Outrch/Educatn0120000 2,481
(5.1) %29,05059,69727,550 29,050Special Projects Total 31,20937,142
(4.6) %360,803 378,478374,311432,950233,442223,426Total Budget Requirements
CCReport Name: 2017_Mid_Cycle_Report
Report Description: Budget Book - Department Budget Detail wMD
06/07/2017Date:
Time: 4
Version:
Page:19:21:28

Department / Section: Mayor / Mayor-Debt101 - 019000
Department Budget Detail
%Chnge16/17 vs 17/182017/182017/18
AmendedAdoptedAdopted2016/17
AmendedActualActual2016/172015/162014/15GL KeyObject Description
-015,013 15,73715,01314,035882101 Utilization Chgs from 101 Fund0190000 13,122
(100.0)%0 12,142000Utilization Chgs from 390 Fund0190000882390 0
23.6 %12,14215,01315,013 15,737Charges From Others Total 14,03513,122
23.6 %15,013 12,14215,73715,01314,03513,122Total Budget Requirements
CCReport Name: 2017_Mid_Cycle_Report
Report Description: Budget Book - Department Budget Detail wMD
06/07/2017Date:
Time: 5
Version:
Page:19:21:28

Department / Section: City Council / City Council101 - 020000
Department Budget Detail
%Chnge16/17 vs 17/182017/182017/18
AmendedAdoptedAdopted2016/17
AmendedActualActual2016/172015/162014/15GL KeyObject Description
( .7) %705,205700,031 705,205700,031668,764411100 Salaries - Regular0200000 554,081
-0 0013,26510,541Vacation0200000411210 0
-0 0016,27514,948Holidays & Special Days Off0200000411220 0
-0 008,2222,746Sick Leave0200000411240 0
-0 001,8040Bereavement Leave0200000411260 0
-0 004690Jury Duty0200000411280 0
-0 007,3517,788Administrative Leave0200000411292 0
-0 003,3800Vacation Payoffs0200000411410 0
(2.8) %4,0703,954 4,0703,954(28,365)411510 Accrued Payroll0200000 6,364
( .7) %10,58110,503 10,58110,50312,771412210 Workers Compensation Ins0200000 12,063
(4.5) %112,252107,186 112,252107,186106,779412220 Health Insurance0200000 98,893
(3.1) %4,1484,018 4,1484,0184,056412222 Dental Insurance0200000 4,035
( .7) %4,3774,343 4,3774,3434,210412230 Life Insurance0200000 3,426
(1.0) %394390 394390397412240 Unemployment Insurance0200000 448
(7.1) %212,801197,516 212,801197,516157,682412310 PERS Retirement0200000 122,574
( .7) %10,22410,149 10,22410,14911,265412320 Medicare OASDI0200000 9,317
(20.0) %21,00016,800 21,00016,80041,266412400 Deferred Compensation0200000 25,681
-25,20025,200 25,20025,20026,075412500 Automobile/Expense Allowance0200000 18,375
-0 004690Holiday O/T-Strt/Subj To Retir0200000413230 0
(100.0)%0 12,821000Ptr. Comp. Model0200000419996 0
(3.8) %1,123,0731,080,0901,080,090 1,110,252Personnel Services Total 1,056,143891,286
-00 055724,442421000 Professional Services0200000 12,321
-0 00065Prof Services/Internal0200000421001 0
-1,4001,400 1,4001,4001,098422100 Telephone0200000 1,688
-1,1401,140 1,1401,1402,415422120 Telephone - Cellular0200000 14,672
-10,00010,000 10,00010,0008,491423400 Motor Pool Equipment Rental0200000 16,091
-10,00010,000 10,00010,0002,447423500 Vehicle Usage Reimb Employee0200000 5,025
(2.9) %8,5158,267 8,5158,267130425200 Periodicals & Dues0200000 1,131
-0 000280General Office Expense0200000425400 0
-2,8002,800 2,8002,8002,190425401 Council Ward 1 - Office Exp0200000 0
-2,8002,800 2,8002,8001,965425402 Council Ward 2 - Office Exp0200000 0
-2,8002,800 2,8002,8002,529425403 Council Ward 3 - Office Exp0200000 0
-1,6601,660 1,6601,6602,135425404 Council Ward 4 - Office Exp0200000 0
-2,8002,800 2,8002,8002,791425405 Council Ward 5 - Office Exp0200000 0
-2,8002,800 2,8002,8001,650425406 Council Ward 6 - Office Exp0200000 0
-2,8002,800 2,8002,8001,997425407 Council Ward 7 - Office Exp0200000 0
-1,0001,000 1,0001,0001,378425500 Postage0200000 624
-0 00905938Outside Printing Expense0200000425610 0
-0 001941,205Computer Equip Purc Undr $50000200000425800 0
-0 0009,322Travel & Meeting Expense0200000427100 0
-1,5001,500 1,5001,5001,148427101 Council Ward 1 Travel/Meeting0200000 85
-1,5001,500 1,5001,5006,331427102 Council Ward 2 Travel/Meeting0200000 7,792
-1,5001,500 1,5001,5001,719427103 Council Ward 3 Travel/Meeting0200000 171
-1,5001,500 1,5001,5007,858427104 Council Ward 4 Travel/Meeting0200000 3,343
-1,5001,500 1,5001,5001,786427105 Council Ward 5 Travel/Meeting0200000 120
-1,5001,500 1,5001,500385427106 Council Ward 6 Travel/Meeting0200000 0
CCReport Name: 2017_Mid_Cycle_Report
Report Description: Budget Book - Department Budget Detail wMD
06/07/2017Date:
Time: 6
Version:
Page:19:21:28

Department / Section: City Council / City Council101 - 020000
Department Budget Detail
%Chnge16/17 vs 17/182017/182017/18
AmendedAdoptedAdopted2016/17
AmendedActualActual2016/172015/162014/15GL KeyObject Description
-1,5001,500 1,5001,500900427107 Council Ward 7 Travel/Meeting0200000 992
-3,3503,350 3,3503,3502,150427115 Assorted Council Mtg Expenses0200000 409
( .7) %10,36710,291 10,36710,29150,016428400 Liability Insurance0200000 38,310
( .4) %74,73274,96574,408 74,732Non-personnel Expenses Total 129,060114,592
(4.8) %507,768483,386 483,386483,386483,385881100 General Fund Allocation Chgs0200000 307,662
-41,76141,761 41,76141,76141,800882101 Utilization Chgs from 101 Fund0200000 40,171
(4.4) %549,529525,147525,147 525,147Charges From Others Total 525,186347,834
.3 %(1,778,039)(1,785,127) (1,785,127)(1,785,127)(1,788,664)891100 General Fund Allocation Chgs0200000 (1,475,994)
.3 %(1,778,039)(1,785,127)(1,785,127) (1,785,127)Charges to Others Total (1,788,664)(1,475,994)
243.5 %(105,482) (30,705)(74,996)(104,924)(78,272)(122,280)Total Budget Requirements
CCReport Name: 2017_Mid_Cycle_Report
Report Description: Budget Book - Department Budget Detail wMD
06/07/2017Date:
Time: 7
Version:
Page:19:21:28
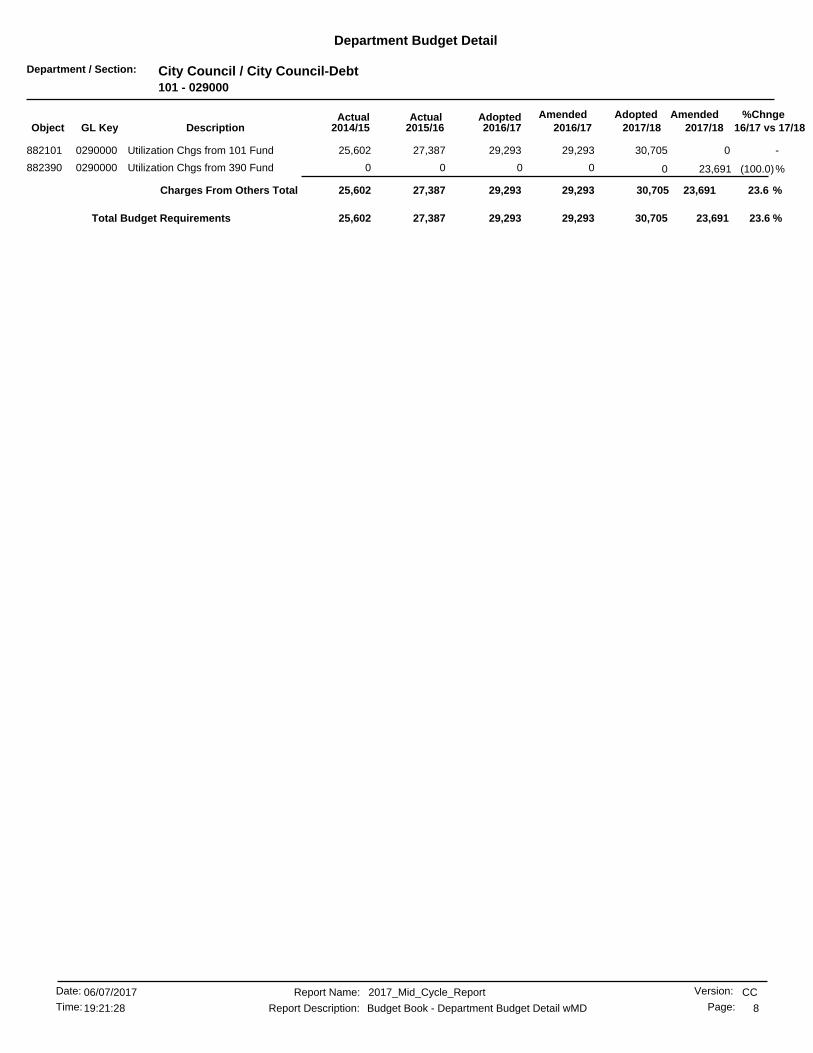
Department / Section: City Council / City Council-Debt101 - 029000
Department Budget Detail
%Chnge16/17 vs 17/182017/182017/18
AmendedAdoptedAdopted2016/17
AmendedActualActual2016/172015/162014/15GL KeyObject Description
-029,293 30,70529,29327,387882101 Utilization Chgs from 101 Fund0290000 25,602
(100.0)%0 23,691000Utilization Chgs from 390 Fund0290000882390 0
23.6 %23,69129,29329,293 30,705Charges From Others Total 27,38725,602
23.6 %29,293 23,69130,70529,29327,38725,602Total Budget Requirements
CCReport Name: 2017_Mid_Cycle_Report
Report Description: Budget Book - Department Budget Detail wMD
06/07/2017Date:
Time: 8
Version:
Page:19:21:28
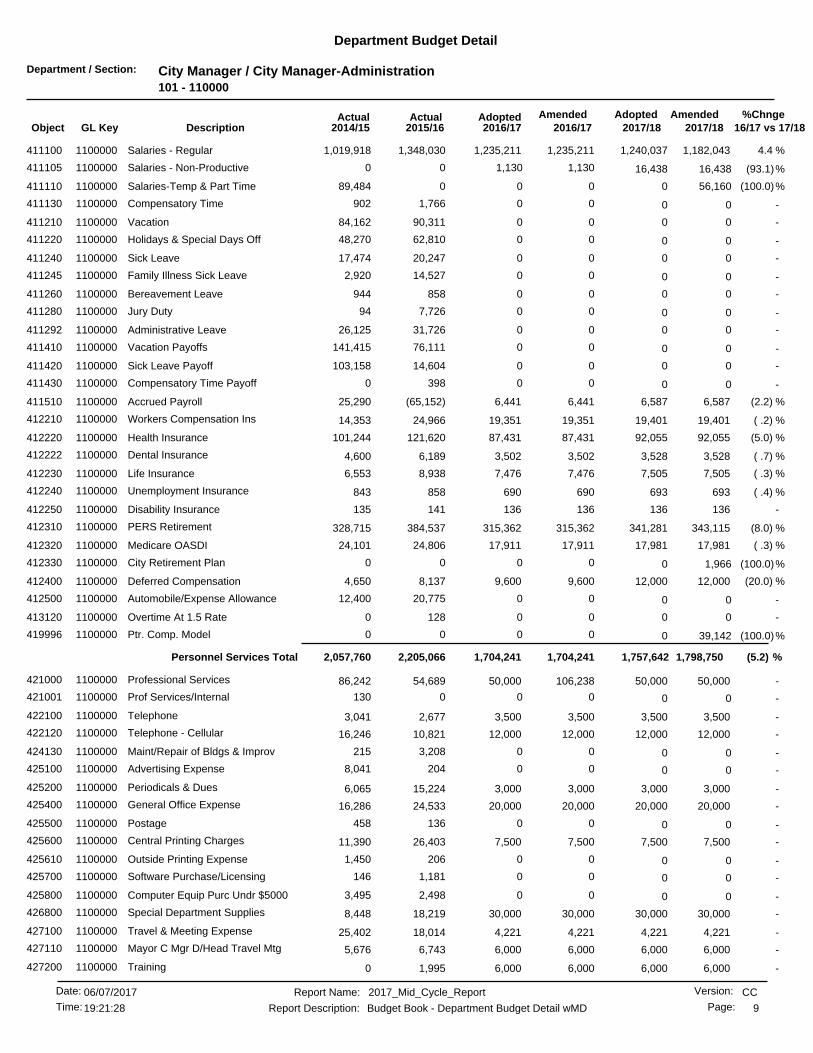
Department / Section: City Manager / City Manager-Administration101 - 110000
Department Budget Detail
%Chnge16/17 vs 17/182017/182017/18
AmendedAdoptedAdopted2016/17
AmendedActualActual2016/172015/162014/15GL KeyObject Description
4.4 %1,182,0431,235,211 1,240,0371,235,2111,348,030411100 Salaries - Regular1100000 1,019,918
(93.1)%1,130 16,4381,13000Salaries - Non-Productive1100000411105 16,438
(100.0)%0 56,1600089,484Salaries-Temp & Part Time1100000411110 0
-0 001,766902Compensatory Time1100000411130 0
-0 0090,31184,162Vacation1100000411210 0
-0 0062,81048,270Holidays & Special Days Off1100000411220 0
-0 0020,24717,474Sick Leave1100000411240 0
-0 0014,5272,920Family Illness Sick Leave1100000411245 0
-0 00858944Bereavement Leave1100000411260 0
-0 007,72694Jury Duty1100000411280 0
-0 0031,72626,125Administrative Leave1100000411292 0
-0 0076,111141,415Vacation Payoffs1100000411410 0
-0 0014,604103,158Sick Leave Payoff1100000411420 0
-0 003980Compensatory Time Payoff1100000411430 0
(2.2) %6,5876,441 6,5876,441(65,152)411510 Accrued Payroll1100000 25,290
( .2) %19,40119,351 19,40119,35124,966412210 Workers Compensation Ins1100000 14,353
(5.0) %92,05587,431 92,05587,431121,620412220 Health Insurance1100000 101,244
( .7) %3,5283,502 3,5283,5026,189412222 Dental Insurance1100000 4,600
( .3) %7,5057,476 7,5057,4768,938412230 Life Insurance1100000 6,553
( .4) %693690 693690858412240 Unemployment Insurance1100000 843
-136136 136136141412250 Disability Insurance1100000 135
(8.0) %343,115315,362 341,281315,362384,537412310 PERS Retirement1100000 328,715
( .3) %17,98117,911 17,98117,91124,806412320 Medicare OASDI1100000 24,101
(100.0)%0 1,966000City Retirement Plan1100000412330 0
(20.0) %12,0009,600 12,0009,6008,137412400 Deferred Compensation1100000 4,650
-0 0020,77512,400Automobile/Expense Allowance1100000412500 0
-0 001280Overtime At 1.5 Rate1100000413120 0
(100.0)%0 39,142000Ptr. Comp. Model1100000419996 0
(5.2) %1,798,7501,704,2411,704,241 1,757,642Personnel Services Total 2,205,0662,057,760
-50,00050,000 50,000106,23854,689421000 Professional Services1100000 86,242
-0 000130Prof Services/Internal1100000421001 0
-3,5003,500 3,5003,5002,677422100 Telephone1100000 3,041
-12,00012,000 12,00012,00010,821422120 Telephone - Cellular1100000 16,246
-0 003,208215Maint/Repair of Bldgs & Improv1100000424130 0
-0 002048,041Advertising Expense1100000425100 0
-3,0003,000 3,0003,00015,224425200 Periodicals & Dues1100000 6,065
-20,00020,000 20,00020,00024,533425400 General Office Expense1100000 16,286
-0 00136458Postage1100000425500 0
-7,5007,500 7,5007,50026,403425600 Central Printing Charges1100000 11,390
-0 002061,450Outside Printing Expense1100000425610 0
-0 001,181146Software Purchase/Licensing1100000425700 0
-0 002,4983,495Computer Equip Purc Undr $50001100000425800 0
-30,00030,000 30,00030,00018,219426800 Special Department Supplies1100000 8,448
-4,2214,221 4,2214,22118,014427100 Travel & Meeting Expense1100000 25,402
-6,0006,000 6,0006,0006,743427110 Mayor C Mgr D/Head Travel Mtg1100000 5,676
-6,0006,000 6,0006,0001,995427200 Training1100000 0
CCReport Name: 2017_Mid_Cycle_Report
Report Description: Budget Book - Department Budget Detail wMD
06/07/2017Date:
Time: 9
Version:
Page:19:21:28

Department / Section: City Manager / City Manager-Administration101 - 110000
Department Budget Detail
%Chnge16/17 vs 17/182017/182017/18
AmendedAdoptedAdopted2016/17
AmendedActualActual2016/172015/162014/15GL KeyObject Description
( .3) %20,12720,066 20,12720,06647,395428400 Liability Insurance1100000 31,603
( .0) %162,348218,525162,287 162,348Non-personnel Expenses Total 234,154224,341
(4.0) %594,625570,741 570,741570,741570,741881100 General Fund Allocation Chgs1100000 553,314
-0 0004,690Utilization Chgs from 101 Fund1100000882101 0
(4.8) %221,600210,800 221,600210,800216,799882510 Utilization Chgs from 510 Fund1100000 252,099
(4.2) %816,225781,541781,541 792,341Charges From Others Total 787,540810,104
(4.4) %(5,472,169)(5,226,789) (5,226,789)(5,226,789)(5,260,170)891100 General Fund Allocation Chgs1100000 (5,305,881)
-0 00(21,267)(19,398)Utilization Chgs to 650 Fund1100000892650 0
(4.4) %(5,472,169)(5,226,789)(5,226,789) (5,226,789)Charges to Others Total (5,281,437)(5,325,279)
(4.3) %(2,578,720) (2,694,846)(2,514,458)(2,522,481)(2,054,675)(2,233,072)Total Budget Requirements
CCReport Name: 2017_Mid_Cycle_Report
Report Description: Budget Book - Department Budget Detail wMD
06/07/2017Date:
Time: 10
Version:
Page:19:21:28
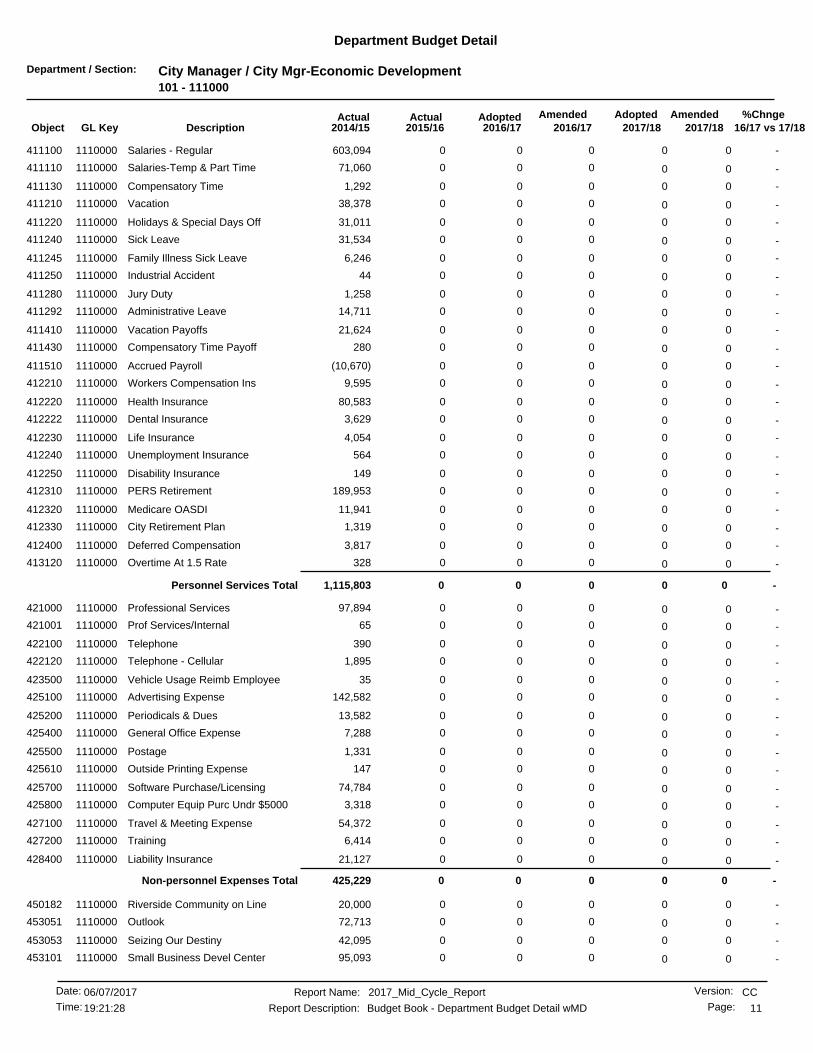
Department / Section: City Manager / City Mgr-Economic Development101 - 111000
Department Budget Detail
%Chnge16/17 vs 17/182017/182017/18
AmendedAdoptedAdopted2016/17
AmendedActualActual2016/172015/162014/15GL KeyObject Description
-0 000603,094Salaries - Regular1110000411100 0
-0 00071,060Salaries-Temp & Part Time1110000411110 0
-0 0001,292Compensatory Time1110000411130 0
-0 00038,378Vacation1110000411210 0
-0 00031,011Holidays & Special Days Off1110000411220 0
-0 00031,534Sick Leave1110000411240 0
-0 0006,246Family Illness Sick Leave1110000411245 0
-0 00044Industrial Accident1110000411250 0
-0 0001,258Jury Duty1110000411280 0
-0 00014,711Administrative Leave1110000411292 0
-0 00021,624Vacation Payoffs1110000411410 0
-0 000280Compensatory Time Payoff1110000411430 0
-0 000(10,670)Accrued Payroll1110000411510 0
-0 0009,595Workers Compensation Ins1110000412210 0
-0 00080,583Health Insurance1110000412220 0
-0 0003,629Dental Insurance1110000412222 0
-0 0004,054Life Insurance1110000412230 0
-0 000564Unemployment Insurance1110000412240 0
-0 000149Disability Insurance1110000412250 0
-0 000189,953PERS Retirement1110000412310 0
-0 00011,941Medicare OASDI1110000412320 0
-0 0001,319City Retirement Plan1110000412330 0
-0 0003,817Deferred Compensation1110000412400 0
-0 000328Overtime At 1.5 Rate1110000413120 0
-0 0Personnel Services Total 0001,115,803
-0 00097,894Professional Services1110000421000 0
-0 00065Prof Services/Internal1110000421001 0
-0 000390Telephone1110000422100 0
-0 0001,895Telephone - Cellular1110000422120 0
-0 00035Vehicle Usage Reimb Employee1110000423500 0
-0 000142,582Advertising Expense1110000425100 0
-0 00013,582Periodicals & Dues1110000425200 0
-0 0007,288General Office Expense1110000425400 0
-0 0001,331Postage1110000425500 0
-0 000147Outside Printing Expense1110000425610 0
-0 00074,784Software Purchase/Licensing1110000425700 0
-0 0003,318Computer Equip Purc Undr $50001110000425800 0
-0 00054,372Travel & Meeting Expense1110000427100 0
-0 0006,414Training1110000427200 0
-0 00021,127Liability Insurance1110000428400 0
-0 0Non-personnel Expenses Total 000425,229
-0 00020,000Riverside Community on Line1110000450182 0
-0 00072,713Outlook1110000453051 0
-0 00042,095Seizing Our Destiny1110000453053 0
-0 00095,093Small Business Devel Center1110000453101 0
CCReport Name: 2017_Mid_Cycle_Report
Report Description: Budget Book - Department Budget Detail wMD
06/07/2017Date:
Time: 11
Version:
Page:19:21:28

Department / Section: City Manager / City Mgr-Economic Development101 - 111000
Department Budget Detail
%Chnge16/17 vs 17/182017/182017/18
AmendedAdoptedAdopted2016/17
AmendedActualActual2016/172015/162014/15GL KeyObject Description
-0 00032,316Shop Riverside Program1110000453220 0
-0 0Special Projects Total 000262,219
-0 00076,296Utilization Chgs from 101 Fund1110000882101 0
-0 0Charges From Others Total 00076,296
-0 000(140,634)Utilization Chgs to 510 Fund1110000892510 0
-0 0Charges to Others Total 000(140,634)
-00 000Total Budget Requirements 1,738,914
CCReport Name: 2017_Mid_Cycle_Report
Report Description: Budget Book - Department Budget Detail wMD
06/07/2017Date:
Time: 12
Version:
Page:19:21:28
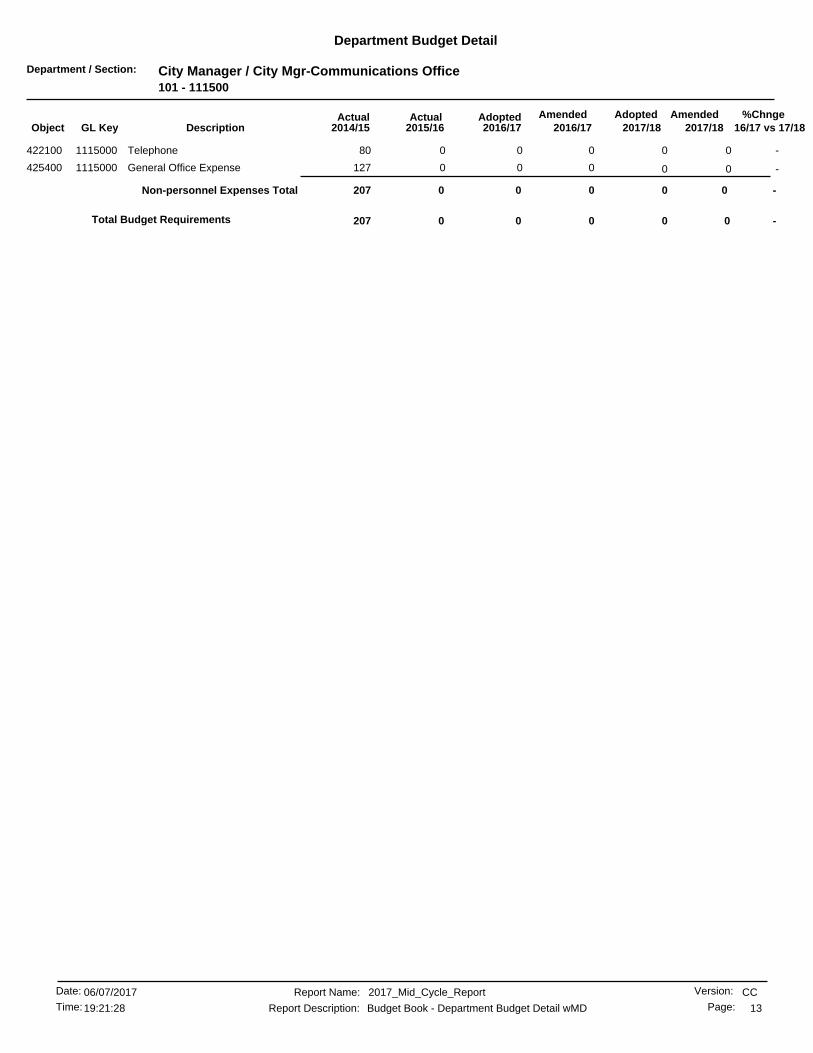
Department / Section: City Manager / City Mgr-Communications Office101 - 111500
Department Budget Detail
%Chnge16/17 vs 17/182017/182017/18
AmendedAdoptedAdopted2016/17
AmendedActualActual2016/172015/162014/15GL KeyObject Description
-0 00080Telephone1115000422100 0
-0 000127General Office Expense1115000425400 0
-0 0Non-personnel Expenses Total 000207
-00 000Total Budget Requirements 207
CCReport Name: 2017_Mid_Cycle_Report
Report Description: Budget Book - Department Budget Detail wMD
06/07/2017Date:
Time: 13
Version:
Page:19:21:28

Department / Section: City Manager / CM-Comm Police Review Commiss.101 - 112500
Department Budget Detail
%Chnge16/17 vs 17/182017/182017/18
AmendedAdoptedAdopted2016/17
AmendedActualActual2016/172015/162014/15GL KeyObject Description
-48,13248,132 48,13248,13243,127411100 Salaries - Regular1125000 36,794
-0 00250Salaries-Substitute Labor1125000411120 0
-0 00980679Compensatory Time1125000411130 0
-0 003,2374,649Vacation1125000411210 0
-0 002,0151,868Holidays & Special Days Off1125000411220 0
-0 009650Sick Leave1125000411240 0
-0 000169Bereavement Leave1125000411260 0
(2.1) %320313 320313(2,439)411510 Accrued Payroll1125000 576
-501501 501501496412210 Workers Compensation Ins1125000 525
(4.3) %15,09714,437 15,09714,43714,362412220 Health Insurance1125000 13,117
-540540 540540562412222 Dental Insurance1125000 536
-125125 125125230412230 Life Insurance1125000 108
-2727 272724412240 Unemployment Insurance1125000 30
-136136 136136141412250 Disability Insurance1125000 135
(5.8) %17,10216,103 17,10216,10315,883412310 PERS Retirement1125000 12,990
-698698 698698760412320 Medicare OASDI1125000 666
(20.0) %1,5001,200 1,5001,200937412400 Deferred Compensation1125000 600
-3,0003,000 3,0003,0001,903413120 Overtime At 1.5 Rate1125000 1,655
(100.0)%0 1,468000Ptr. Comp. Model1125000419996 0
(3.8) %88,64685,21285,212 87,178Personnel Services Total 83,21475,106
-130,000130,000 130,000130,000132,266421000 Professional Services1125000 115,449
-0 004165Prof Services/Internal1125000421001 0
-300300 300300215422100 Telephone1125000 197
-500 50050000All Other Equip Maint/Repair1125000424220 500
-1,000 1,0001,00001,080Advertising Expense1125000425100 1,000
-660660 660660400425200 Periodicals & Dues1125000 145
-1,5601,560 1,5601,560707425400 General Office Expense1125000 541
-500500 50050084425500 Postage1125000 94
-3,0003,000 3,0003,0003,712425600 Central Printing Charges1125000 1,314
-0 0014784Outside Printing Expense1125000425610 0
-0 00048Software Purchase/Licensing1125000425700 0
-5,000 5,0005,00000Computer Equip Purc Undr $50001125000425800 5,000
-300300 300300559426800 Special Department Supplies1125000 48
-7,0357,035 7,0357,0356,134427100 Travel & Meeting Expense1125000 7,473
-3,0003,000 3,0003,000520427200 Training1125000 350
-611611 6116111,242428400 Liability Insurance1125000 1,156
-153,466153,466153,466 153,466Non-personnel Expenses Total 146,031128,049
(1.4) %238,678 242,112240,644238,678229,246203,156Total Budget Requirements
CCReport Name: 2017_Mid_Cycle_Report
Report Description: Budget Book - Department Budget Detail wMD
06/07/2017Date:
Time: 14
Version:
Page:19:21:28

Department / Section: City Manager / CM-Sundry/Gen Govt101 - 113500
Department Budget Detail
%Chnge16/17 vs 17/182017/182017/18
AmendedAdoptedAdopted2016/17
AmendedActualActual2016/172015/162014/15GL KeyObject Description
-0 00631364Homeless Street Outreach9125100423400 0
-235,100235,100 235,100235,100250,650425200 Periodicals & Dues1135000 220,407
-22,000 22,00022,000020,790Software Purchase/Licensing1135000425700 22,000
-257,100257,100257,100 257,100Non-personnel Expenses Total 251,281241,561
-257,100 257,100257,100257,100251,281241,561Total Budget Requirements
CCReport Name: 2017_Mid_Cycle_Report
Report Description: Budget Book - Department Budget Detail wMD
06/07/2017Date:
Time: 15
Version:
Page:19:21:28
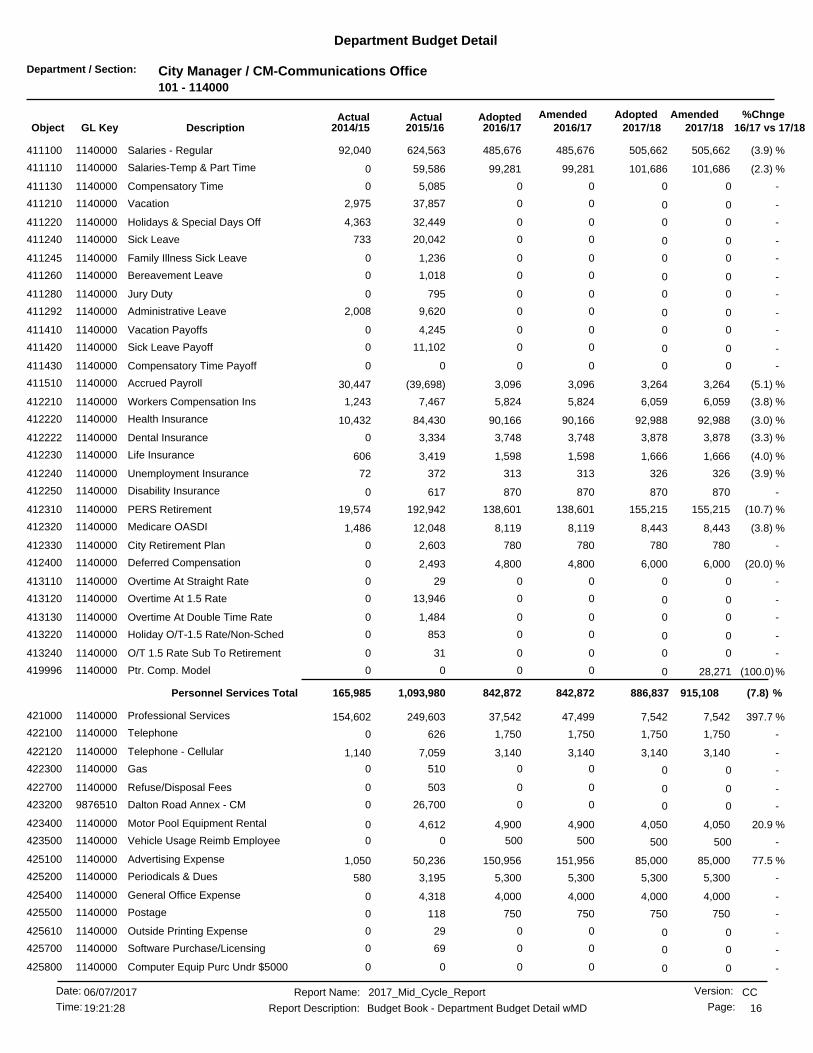
Department / Section: City Manager / CM-Communications Office101 - 114000
Department Budget Detail
%Chnge16/17 vs 17/182017/182017/18
AmendedAdoptedAdopted2016/17
AmendedActualActual2016/172015/162014/15GL KeyObject Description
(3.9) %505,662485,676 505,662485,676624,563411100 Salaries - Regular1140000 92,040
(2.3) %101,68699,281 101,68699,28159,586411110 Salaries-Temp & Part Time1140000 0
-0 005,0850Compensatory Time1140000411130 0
-0 0037,8572,975Vacation1140000411210 0
-0 0032,4494,363Holidays & Special Days Off1140000411220 0
-0 0020,042733Sick Leave1140000411240 0
-0 001,2360Family Illness Sick Leave1140000411245 0
-0 001,0180Bereavement Leave1140000411260 0
-0 007950Jury Duty1140000411280 0
-0 009,6202,008Administrative Leave1140000411292 0
-0 004,2450Vacation Payoffs1140000411410 0
-0 0011,1020Sick Leave Payoff1140000411420 0
-0 0000Compensatory Time Payoff1140000411430 0
(5.1) %3,2643,096 3,2643,096(39,698)411510 Accrued Payroll1140000 30,447
(3.8) %6,0595,824 6,0595,8247,467412210 Workers Compensation Ins1140000 1,243
(3.0) %92,98890,166 92,98890,16684,430412220 Health Insurance1140000 10,432
(3.3) %3,8783,748 3,8783,7483,334412222 Dental Insurance1140000 0
(4.0) %1,6661,598 1,6661,5983,419412230 Life Insurance1140000 606
(3.9) %326313 326313372412240 Unemployment Insurance1140000 72
-870870 870870617412250 Disability Insurance1140000 0
(10.7) %155,215138,601 155,215138,601192,942412310 PERS Retirement1140000 19,574
(3.8) %8,4438,119 8,4438,11912,048412320 Medicare OASDI1140000 1,486
-780780 7807802,603412330 City Retirement Plan1140000 0
(20.0) %6,0004,800 6,0004,8002,493412400 Deferred Compensation1140000 0
-0 00290Overtime At Straight Rate1140000413110 0
-0 0013,9460Overtime At 1.5 Rate1140000413120 0
-0 001,4840Overtime At Double Time Rate1140000413130 0
-0 008530Holiday O/T-1.5 Rate/Non-Sched1140000413220 0
-0 00310O/T 1.5 Rate Sub To Retirement1140000413240 0
(100.0)%0 28,271000Ptr. Comp. Model1140000419996 0
(7.8) %915,108842,872842,872 886,837Personnel Services Total 1,093,980165,985
397.7 %7,54237,542 7,54247,499249,603421000 Professional Services1140000 154,602
-1,7501,750 1,7501,750626422100 Telephone1140000 0
-3,1403,140 3,1403,1407,059422120 Telephone - Cellular1140000 1,140
-0 005100Gas1140000422300 0
-0 005030Refuse/Disposal Fees1140000422700 0
-0 0026,7000Dalton Road Annex - CM9876510423200 0
20.9 %4,0504,900 4,0504,9004,612423400 Motor Pool Equipment Rental1140000 0
-500 50050000Vehicle Usage Reimb Employee1140000423500 500
77.5 %85,000150,956 85,000151,95650,236425100 Advertising Expense1140000 1,050
-5,3005,300 5,3005,3003,195425200 Periodicals & Dues1140000 580
-4,0004,000 4,0004,0004,318425400 General Office Expense1140000 0
-750750 750750118425500 Postage1140000 0
-0 00290Outside Printing Expense1140000425610 0
-0 00690Software Purchase/Licensing1140000425700 0
-0 0000Computer Equip Purc Undr $50001140000425800 0
CCReport Name: 2017_Mid_Cycle_Report
Report Description: Budget Book - Department Budget Detail wMD
06/07/2017Date:
Time: 16
Version:
Page:19:21:28

Department / Section: City Manager / CM-Communications Office101 - 114000
Department Budget Detail
%Chnge16/17 vs 17/182017/182017/18
AmendedAdoptedAdopted2016/17
AmendedActualActual2016/172015/162014/15GL KeyObject Description
-7,9157,915 7,9157,91513,060427100 Travel & Meeting Expense1140000 3,453
-5,1255,125 5,1255,125580427200 Training1140000 35
(3.8) %7,3957,111 7,3957,11118,667428400 Liability Insurance1140000 2,739
72.8 %132,467239,946228,989 132,467Non-personnel Expenses Total 379,891163,599
-13,64613,646 13,64613,64615,066450050 CATV Public Access Programming1140000 0
-400,000400,000 400,000598,685468,413450055 PEG Exp1140000 0
-65,00065,000 65,00065,00074,016453051 Outlook1140000 0
-0 0044,4590Seizing Our Destiny1140000453053 0
-15,000 15,00015,00000Community Outreach ED & Mktg1140000453055 15,000
-40,00040,000 40,00040,00017,299453220 Shop Riverside Program1140000 9,150
-533,646732,331533,646 533,646Special Projects Total 619,2549,150
(6.5) %5,6005,235 5,6005,2354,331882101 Utilization Chgs from 101 Fund1140000 0
(6.5) %5,6005,2355,235 5,600Charges From Others Total 4,3310
-0 00(84,000)(84,000)Utilization Chgs to 510 Fund1140000892510 0
-0 00(4,120)0Interfund Services to 101 Fund1140000894101 0
-0 00(1,086)0Interfund Services to 510 Fund1140000894510 0
-0 00(419)0Interfund Services to 720 Fund1140000894720 0
-0 0Charges to Others Total 00(89,626)(84,000)
1.5 %1,610,742 1,586,8211,558,5501,820,3852,007,830254,735Total Budget Requirements
CCReport Name: 2017_Mid_Cycle_Report
Report Description: Budget Book - Department Budget Detail wMD
06/07/2017Date:
Time: 17
Version:
Page:19:21:28

Department / Section: City Manager / CM-Internal Audit101 - 114500
Department Budget Detail
%Chnge16/17 vs 17/182017/182017/18
AmendedAdoptedAdopted2016/17
AmendedActualActual2016/172015/162014/15GL KeyObject Description
(16.0) %264,873222,373 222,373274,305198,714411100 Salaries - Regular1145000 91,965
-0 0014,6618,436Vacation1145000411210 0
-0 009,4085,087Holidays & Special Days Off1145000411220 0
-0 003,9212,630Sick Leave1145000411240 0
-0 0046410,086Family Illness Sick Leave1145000411245 0
-0 003,7132,023Administrative Leave1145000411292 0
-0 001,9522,312Vacation Payoffs1145000411410 0
(1.9) %1,2651,240 1,2651,240(9,799)411510 Accrued Payroll1145000 5,642
-2,3132,313 2,3132,3132,166412210 Workers Compensation Ins1145000 2,439
(5.9) %19,15718,015 19,15718,01518,290412220 Health Insurance1145000 10,432
(8.9) %724659 724659640412222 Dental Insurance1145000 360
-1,3781,378 1,3781,3781,406412230 Life Insurance1145000 696
-124124 124124108412240 Unemployment Insurance1145000 142
(5.8) %79,01374,397 79,01374,39772,877412310 PERS Retirement1145000 35,500
-3,2243,224 3,2243,2243,425412320 Medicare OASDI1145000 1,819
(20.0) %3,0002,400 3,0002,4001,875412400 Deferred Compensation1145000 600
(100.0)%0 4,891000Ptr. Comp. Model1145000419996 0
(14.1) %379,962378,055326,123 332,571Personnel Services Total 323,828180,175
-1,5001,500 1,5001,5001,440422120 Telephone - Cellular1145000 1,118
-1,1001,100 1,1001,100945425200 Periodicals & Dues1145000 910
-1,0001,000 1,0001,000793425400 General Office Expense1145000 0
-1,0001,000 1,0001,0001,466425800 Computer Equip Purc Undr $50001145000 997
-2,1112,111 2,1112,111863427100 Travel & Meeting Expense1145000 1,982
-4,0004,000 4,0004,000335427200 Training1145000 1,909
-2,8242,824 2,8242,8245,418428400 Liability Insurance1145000 5,368
-13,53513,53513,535 13,535Non-personnel Expenses Total 11,26212,286
(13.6) %339,658 393,497346,106391,590335,091192,461Total Budget Requirements
CCReport Name: 2017_Mid_Cycle_Report
Report Description: Budget Book - Department Budget Detail wMD
06/07/2017Date:
Time: 18
Version:
Page:19:21:28
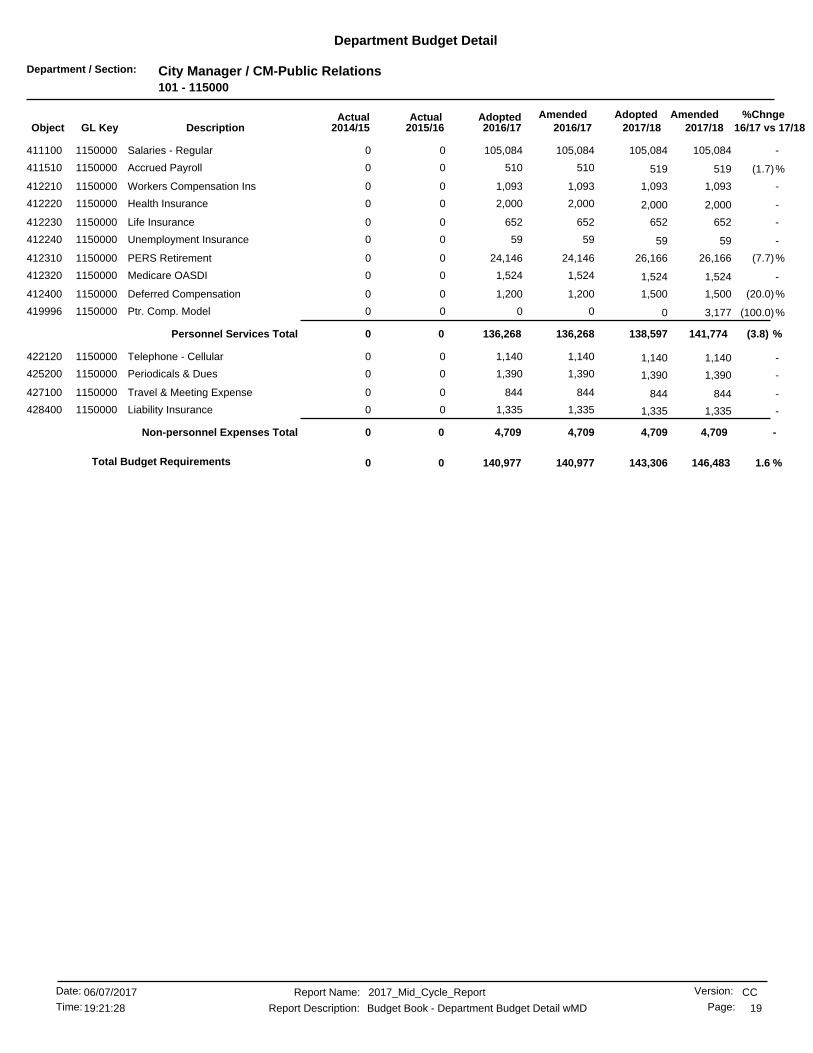
Department / Section: City Manager / CM-Public Relations101 - 115000
Department Budget Detail
%Chnge16/17 vs 17/182017/182017/18
AmendedAdoptedAdopted2016/17
AmendedActualActual2016/172015/162014/15GL KeyObject Description
-105,084 105,084105,08400Salaries - Regular1150000411100 105,084
(1.7)%510 51951000Accrued Payroll1150000411510 519
-1,093 1,0931,09300Workers Compensation Ins1150000412210 1,093
-2,000 2,0002,00000Health Insurance1150000412220 2,000
-652 65265200Life Insurance1150000412230 652
-59 595900Unemployment Insurance1150000412240 59
(7.7)%24,146 26,16624,14600PERS Retirement1150000412310 26,166
-1,524 1,5241,52400Medicare OASDI1150000412320 1,524
(20.0)%1,200 1,5001,20000Deferred Compensation1150000412400 1,500
(100.0)%0 3,177000Ptr. Comp. Model1150000419996 0
(3.8) %136,268 141,774Personnel Services Total 138,597136,26800
-1,140 1,1401,14000Telephone - Cellular1150000422120 1,140
-1,390 1,3901,39000Periodicals & Dues1150000425200 1,390
-844 84484400Travel & Meeting Expense1150000427100 844
-1,335 1,3351,33500Liability Insurance1150000428400 1,335
-4,709 4,709Non-personnel Expenses Total 4,7094,70900
1.6 %146,483140,977 143,306140,9770Total Budget Requirements 0
CCReport Name: 2017_Mid_Cycle_Report
Report Description: Budget Book - Department Budget Detail wMD
06/07/2017Date:
Time: 19
Version:
Page:19:21:28
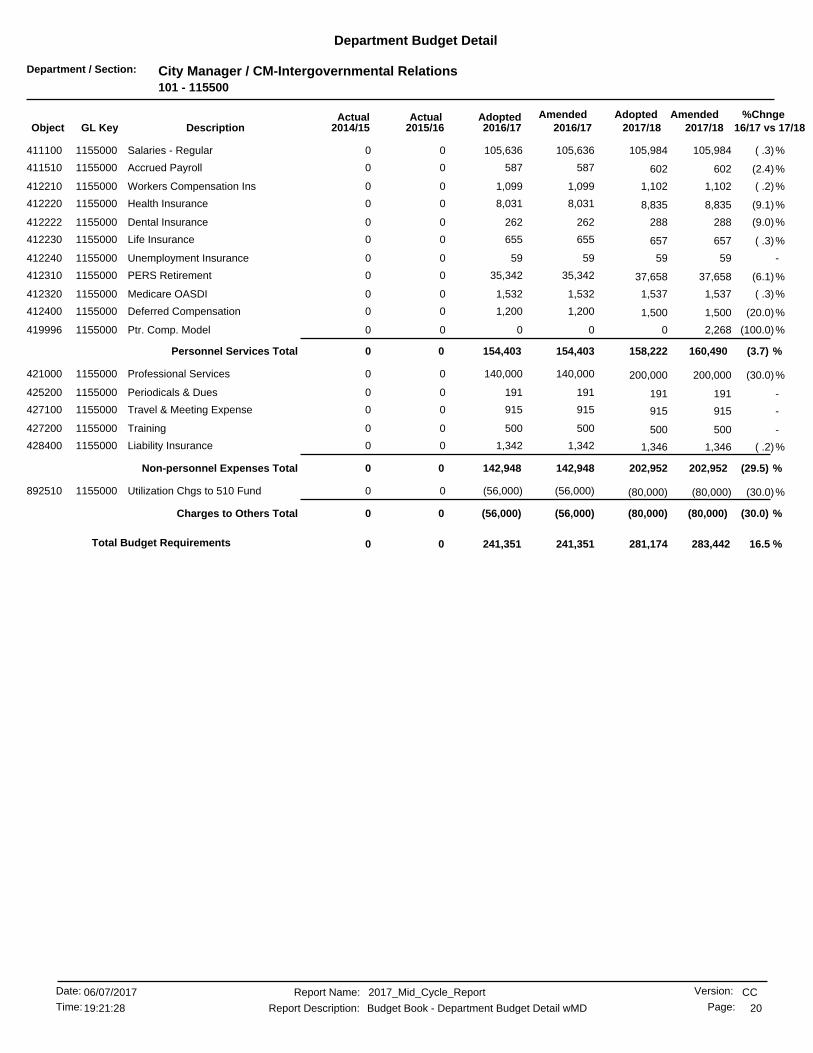
Department / Section: City Manager / CM-Intergovernmental Relations101 - 115500
Department Budget Detail
%Chnge16/17 vs 17/182017/182017/18
AmendedAdoptedAdopted2016/17
AmendedActualActual2016/172015/162014/15GL KeyObject Description
( .3)%105,636 105,984105,63600Salaries - Regular1155000411100 105,984
(2.4)%587 60258700Accrued Payroll1155000411510 602
( .2)%1,099 1,1021,09900Workers Compensation Ins1155000412210 1,102
(9.1)%8,031 8,8358,03100Health Insurance1155000412220 8,835
(9.0)%262 28826200Dental Insurance1155000412222 288
( .3)%655 65765500Life Insurance1155000412230 657
-59 595900Unemployment Insurance1155000412240 59
(6.1)%35,342 37,65835,34200PERS Retirement1155000412310 37,658
( .3)%1,532 1,5371,53200Medicare OASDI1155000412320 1,537
(20.0)%1,200 1,5001,20000Deferred Compensation1155000412400 1,500
(100.0)%0 2,268000Ptr. Comp. Model1155000419996 0
(3.7) %154,403 160,490Personnel Services Total 158,222154,40300
(30.0)%140,000 200,000140,00000Professional Services1155000421000 200,000
-191 19119100Periodicals & Dues1155000425200 191
-915 91591500Travel & Meeting Expense1155000427100 915
-500 50050000Training1155000427200 500
( .2)%1,342 1,3461,34200Liability Insurance1155000428400 1,346
(29.5) %142,948 202,952Non-personnel Expenses Total 202,952142,94800
(30.0)%(56,000) (80,000)(56,000)00Utilization Chgs to 510 Fund1155000892510 (80,000)
(30.0) %(56,000) (80,000)Charges to Others Total (80,000)(56,000)00
16.5 %283,442241,351 281,174241,3510Total Budget Requirements 0
CCReport Name: 2017_Mid_Cycle_Report
Report Description: Budget Book - Department Budget Detail wMD
06/07/2017Date:
Time: 20
Version:
Page:19:21:28
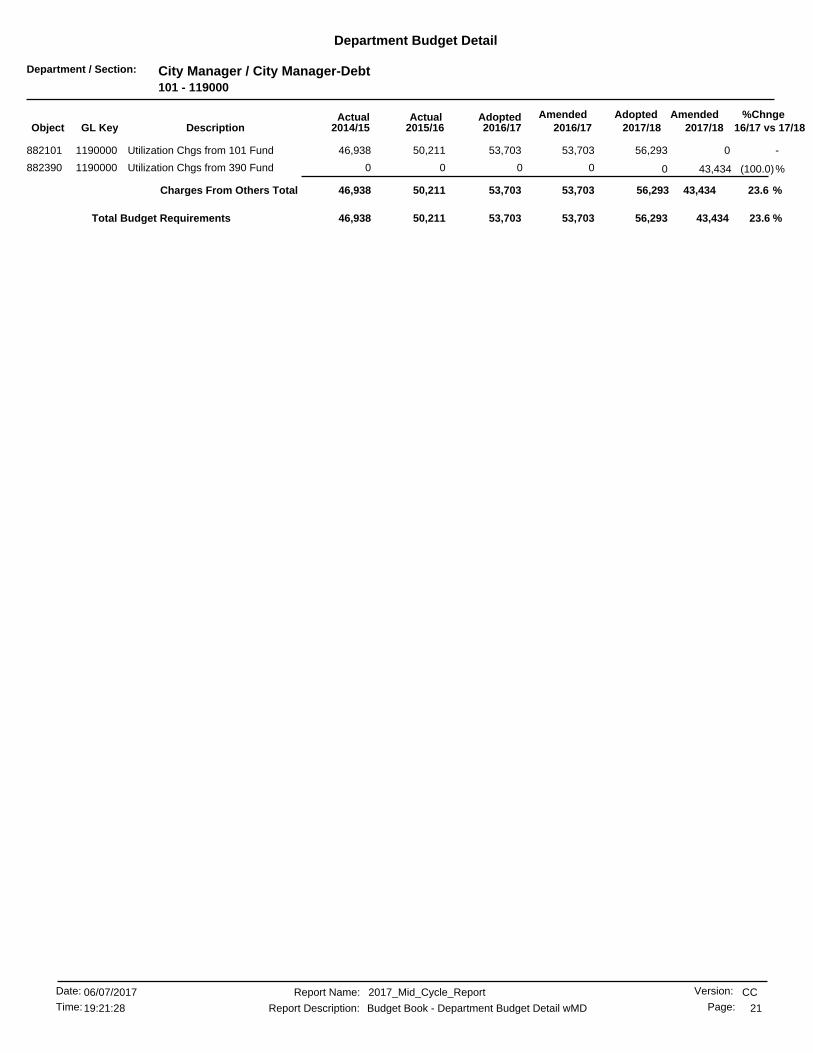
Department / Section: City Manager / City Manager-Debt101 - 119000
Department Budget Detail
%Chnge16/17 vs 17/182017/182017/18
AmendedAdoptedAdopted2016/17
AmendedActualActual2016/172015/162014/15GL KeyObject Description
-053,703 56,29353,70350,211882101 Utilization Chgs from 101 Fund1190000 46,938
(100.0)%0 43,434000Utilization Chgs from 390 Fund1190000882390 0
23.6 %43,43453,70353,703 56,293Charges From Others Total 50,21146,938
23.6 %53,703 43,43456,29353,70350,21146,938Total Budget Requirements
CCReport Name: 2017_Mid_Cycle_Report
Report Description: Budget Book - Department Budget Detail wMD
06/07/2017Date:
Time: 21
Version:
Page:19:21:28

Department / Section: City Manager / CM-Managed Savings101 - 119900
Department Budget Detail
%Chnge16/17 vs 17/182017/182017/18
AmendedAdoptedAdopted2016/17
AmendedActualActual2016/172015/162014/15GL KeyObject Description
-(100,000) (100,000)(100,000)00Managed Savings Allocation1199000499999 (100,000)
-(100,000) (100,000)Managed Savings Total (100,000)(100,000)00
-(100,000)(100,000) (100,000)(100,000)0Total Budget Requirements 0
CCReport Name: 2017_Mid_Cycle_Report
Report Description: Budget Book - Department Budget Detail wMD
06/07/2017Date:
Time: 22
Version:
Page:19:21:28
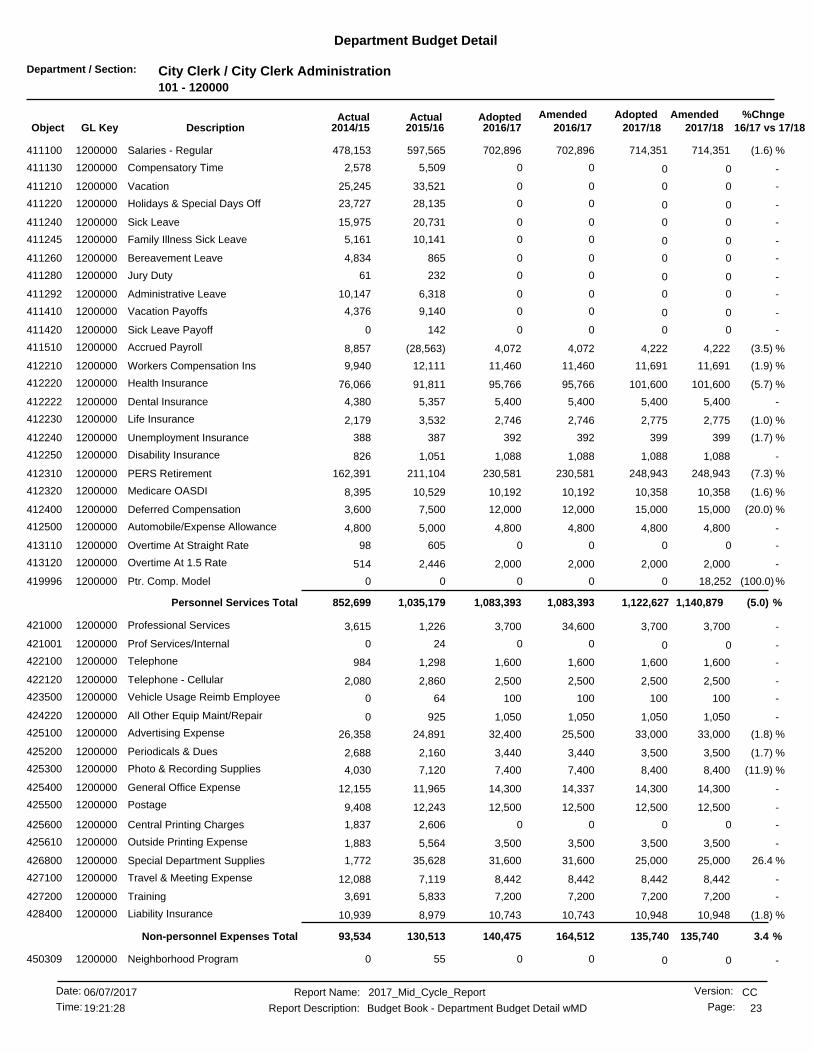
Department / Section: City Clerk / City Clerk Administration101 - 120000
Department Budget Detail
%Chnge16/17 vs 17/182017/182017/18
AmendedAdoptedAdopted2016/17
AmendedActualActual2016/172015/162014/15GL KeyObject Description
(1.6) %714,351702,896 714,351702,896597,565411100 Salaries - Regular1200000 478,153
-0 005,5092,578Compensatory Time1200000411130 0
-0 0033,52125,245Vacation1200000411210 0
-0 0028,13523,727Holidays & Special Days Off1200000411220 0
-0 0020,73115,975Sick Leave1200000411240 0
-0 0010,1415,161Family Illness Sick Leave1200000411245 0
-0 008654,834Bereavement Leave1200000411260 0
-0 0023261Jury Duty1200000411280 0
-0 006,31810,147Administrative Leave1200000411292 0
-0 009,1404,376Vacation Payoffs1200000411410 0
-0 001420Sick Leave Payoff1200000411420 0
(3.5) %4,2224,072 4,2224,072(28,563)411510 Accrued Payroll1200000 8,857
(1.9) %11,69111,460 11,69111,46012,111412210 Workers Compensation Ins1200000 9,940
(5.7) %101,60095,766 101,60095,76691,811412220 Health Insurance1200000 76,066
-5,4005,400 5,4005,4005,357412222 Dental Insurance1200000 4,380
(1.0) %2,7752,746 2,7752,7463,532412230 Life Insurance1200000 2,179
(1.7) %399392 399392387412240 Unemployment Insurance1200000 388
-1,0881,088 1,0881,0881,051412250 Disability Insurance1200000 826
(7.3) %248,943230,581 248,943230,581211,104412310 PERS Retirement1200000 162,391
(1.6) %10,35810,192 10,35810,19210,529412320 Medicare OASDI1200000 8,395
(20.0) %15,00012,000 15,00012,0007,500412400 Deferred Compensation1200000 3,600
-4,8004,800 4,8004,8005,000412500 Automobile/Expense Allowance1200000 4,800
-0 0060598Overtime At Straight Rate1200000413110 0
-2,0002,000 2,0002,0002,446413120 Overtime At 1.5 Rate1200000 514
(100.0)%0 18,252000Ptr. Comp. Model1200000419996 0
(5.0) %1,140,8791,083,3931,083,393 1,122,627Personnel Services Total 1,035,179852,699
-3,7003,700 3,70034,6001,226421000 Professional Services1200000 3,615
-0 00240Prof Services/Internal1200000421001 0
-1,6001,600 1,6001,6001,298422100 Telephone1200000 984
-2,5002,500 2,5002,5002,860422120 Telephone - Cellular1200000 2,080
-100100 10010064423500 Vehicle Usage Reimb Employee1200000 0
-1,0501,050 1,0501,050925424220 All Other Equip Maint/Repair1200000 0
(1.8) %33,00032,400 33,00025,50024,891425100 Advertising Expense1200000 26,358
(1.7) %3,5003,440 3,5003,4402,160425200 Periodicals & Dues1200000 2,688
(11.9) %8,4007,400 8,4007,4007,120425300 Photo & Recording Supplies1200000 4,030
-14,30014,300 14,30014,33711,965425400 General Office Expense1200000 12,155
-12,50012,500 12,50012,50012,243425500 Postage1200000 9,408
-0 002,6061,837Central Printing Charges1200000425600 0
-3,5003,500 3,5003,5005,564425610 Outside Printing Expense1200000 1,883
26.4 %25,00031,600 25,00031,60035,628426800 Special Department Supplies1200000 1,772
-8,4428,442 8,4428,4427,119427100 Travel & Meeting Expense1200000 12,088
-7,2007,200 7,2007,2005,833427200 Training1200000 3,691
(1.8) %10,94810,743 10,94810,7438,979428400 Liability Insurance1200000 10,939
3.4 %135,740164,512140,475 135,740Non-personnel Expenses Total 130,51393,534
-0 00550Neighborhood Program1200000450309 0
CCReport Name: 2017_Mid_Cycle_Report
Report Description: Budget Book - Department Budget Detail wMD
06/07/2017Date:
Time: 23
Version:
Page:19:21:28
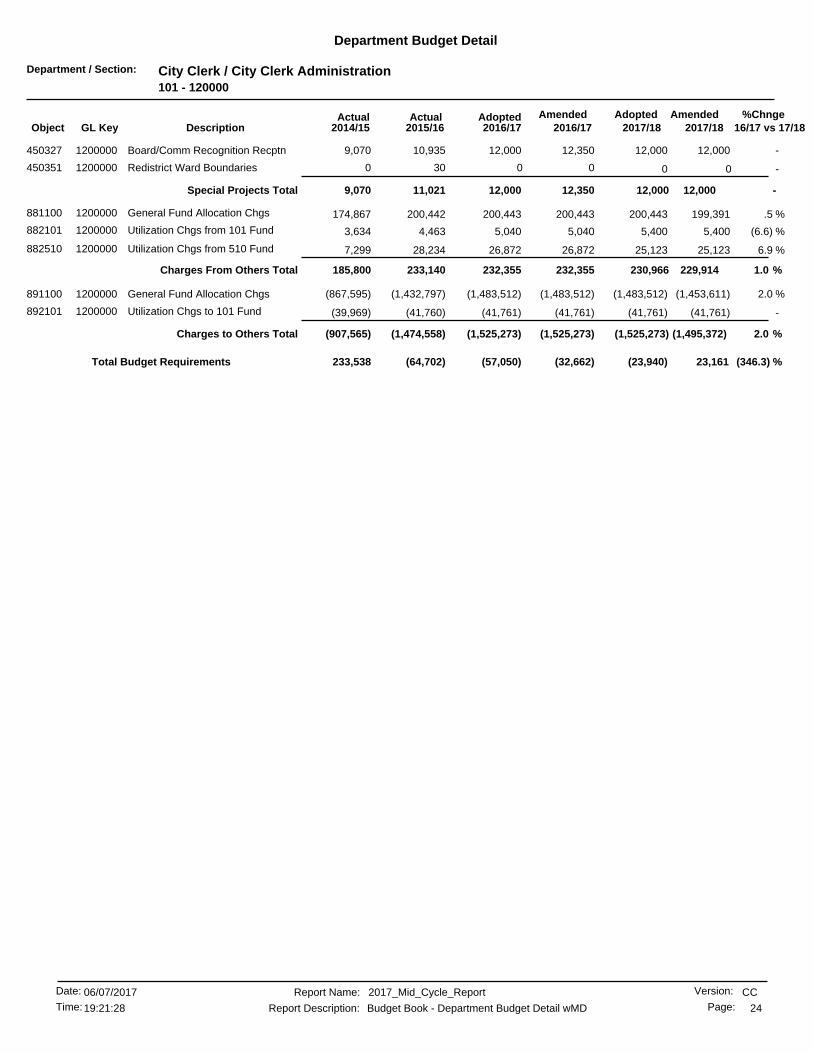
Department / Section: City Clerk / City Clerk Administration101 - 120000
Department Budget Detail
%Chnge16/17 vs 17/182017/182017/18
AmendedAdoptedAdopted2016/17
AmendedActualActual2016/172015/162014/15GL KeyObject Description
-12,00012,000 12,00012,35010,935450327 Board/Comm Recognition Recptn1200000 9,070
-0 00300Redistrict Ward Boundaries1200000450351 0
-12,00012,35012,000 12,000Special Projects Total 11,0219,070
.5 %199,391200,443 200,443200,443200,442881100 General Fund Allocation Chgs1200000 174,867
(6.6) %5,4005,040 5,4005,0404,463882101 Utilization Chgs from 101 Fund1200000 3,634
6.9 %25,12326,872 25,12326,87228,234882510 Utilization Chgs from 510 Fund1200000 7,299
1.0 %229,914232,355232,355 230,966Charges From Others Total 233,140185,800
2.0 %(1,453,611)(1,483,512) (1,483,512)(1,483,512)(1,432,797)891100 General Fund Allocation Chgs1200000 (867,595)
-(41,761)(41,761) (41,761)(41,761)(41,760)892101 Utilization Chgs to 101 Fund1200000 (39,969)
2.0 %(1,495,372)(1,525,273)(1,525,273) (1,525,273)Charges to Others Total (1,474,558)(907,565)
(346.3) %(57,050) 23,161(23,940)(32,662)(64,702)233,538Total Budget Requirements
CCReport Name: 2017_Mid_Cycle_Report
Report Description: Budget Book - Department Budget Detail wMD
06/07/2017Date:
Time: 24
Version:
Page:19:21:28

Department / Section: City Clerk / City Clerk-Election Services101 - 120500
Department Budget Detail
%Chnge16/17 vs 17/182017/182017/18
AmendedAdoptedAdopted2016/17
AmendedActualActual2016/172015/162014/15GL KeyObject Description
34.2 %262,524352,500 262,524328,500329,073421000 Professional Services1205000 78,912
-110110 110110109425200 Periodicals & Dues1205000 111
34.2 %262,634328,610352,610 262,634Non-personnel Expenses Total 329,18279,024
34.2 %352,610 262,634262,634328,610329,18279,024Total Budget Requirements
CCReport Name: 2017_Mid_Cycle_Report
Report Description: Budget Book - Department Budget Detail wMD
06/07/2017Date:
Time: 25
Version:
Page:19:21:28

Department / Section: City Clerk / City Clerk-Records Management101 - 121000
Department Budget Detail
%Chnge16/17 vs 17/182017/182017/18
AmendedAdoptedAdopted2016/17
AmendedActualActual2016/172015/162014/15GL KeyObject Description
-47,00047,000 47,00047,00037,091421000 Professional Services1210000 47,462
-250 25025000General Office Expense1210000425400 250
-47,25047,25047,250 47,250Non-personnel Expenses Total 37,09147,462
-47,250 47,25047,25047,25037,09147,462Total Budget Requirements
CCReport Name: 2017_Mid_Cycle_Report
Report Description: Budget Book - Department Budget Detail wMD
06/07/2017Date:
Time: 26
Version:
Page:19:21:28

Department / Section: City Clerk / City Clerk-Debt101 - 129000
Department Budget Detail
%Chnge16/17 vs 17/182017/182017/18
AmendedAdoptedAdopted2016/17
AmendedActualActual2016/172015/162014/15GL KeyObject Description
-021,970 23,02921,97020,541882101 Utilization Chgs from 101 Fund1290000 19,201
(100.0)%0 17,769000Utilization Chgs from 390 Fund1290000882390 0
23.6 %17,76921,97021,970 23,029Charges From Others Total 20,54119,201
23.6 %21,970 17,76923,02921,97020,54119,201Total Budget Requirements
CCReport Name: 2017_Mid_Cycle_Report
Report Description: Budget Book - Department Budget Detail wMD
06/07/2017Date:
Time: 27
Version:
Page:19:21:28

Department / Section: Office of the City Attorney / Office of the City Attorney101 - 130000
Department Budget Detail
%Chnge16/17 vs 17/182017/182017/18
AmendedAdoptedAdopted2016/17
AmendedActualActual2016/172015/162014/15GL KeyObject Description
(8.5) %3,184,1602,911,417 2,972,5392,902,2172,355,723411100 Salaries - Regular1300000 1,803,386
-11,44011,440 11,44011,44031,730411110 Salaries-Temp & Part Time1300000 110,812
-0 00158,796104,129Vacation1300000411210 0
-0 00112,87490,154Holidays & Special Days Off1300000411220 0
-0 000277Rest Time Pay - IBEW1300000411225 0
-0 0063,55775,386Sick Leave1300000411240 0
-0 0022,26718,244Family Illness Sick Leave1300000411245 0
-0 002,2331,233Bereavement Leave1300000411260 0
-0 001,547982Jury Duty1300000411280 0
-0 0043,70341,963Administrative Leave1300000411292 0
-30,00030,000 30,00030,00049,273411410 Vacation Payoffs1300000 70,287
-0 00120755Sick Leave Payoff1300000411420 0
(3.7) %16,64716,018 16,64716,018(106,583)411510 Accrued Payroll1300000 19,857
(8.9) %33,08030,106 30,73530,10632,076412210 Workers Compensation Ins1300000 31,620
(12.5) %334,650292,734 308,800292,734277,550412220 Health Insurance1300000 230,505
(8.7) %14,59213,317 13,51213,31712,908412222 Dental Insurance1300000 10,784
(8.5) %19,72718,049 18,42918,04916,357412230 Life Insurance1300000 12,567
(9.3) %1,7991,630 1,6671,6301,612412240 Unemployment Insurance1300000 1,828
(12.5) %962,305841,867 918,647841,867756,893412310 PERS Retirement1300000 601,300
(8.9) %46,56742,385 43,26642,38541,482412320 Medicare OASDI1300000 33,547
-0 009521,387City Retirement Plan1300000412330 0
(25.3) %45,00033,600 42,00033,60020,962412400 Deferred Compensation1300000 12,225
-0 006,2501,000Automobile/Expense Allowance1300000412500 0
(100.0)%0 78,437000Ptr. Comp. Model1300000419996 0
(11.2) %4,778,4044,233,3634,242,563 4,407,682Personnel Services Total 3,902,2903,274,238
-00 09,20011,498421000 Professional Services1300000 157,855
-0 00097Prof Services/Internal1300000421001 0
-00 0107,786118,985421100 Outside Legal Services1300000 0
-5,8325,832 5,8325,8323,252422100 Telephone1300000 2,654
-2,3802,380 2,3802,3808,538422120 Telephone - Cellular1300000 5,771
-411,035 411,035411,03500Land and Building Rental1300000423200 411,035
-9,500 9,5009,5000238Motor Pool Equipment Rental1300000423400 9,500
-0 00350Maint/Repair of Bldgs & Improv1300000424130 0
-15,05415,054 15,05415,05412,908424220 All Other Equip Maint/Repair1300000 13,435
-10,79010,790 10,79010,79015,244425200 Periodicals & Dues1300000 7,229
-13,00013,000 13,00019,85329,272425400 General Office Expense1300000 22,269
-3,0003,000 3,0003,0004,878425500 Postage1300000 3,960
-15,12515,125 15,12515,12515,618425600 Central Printing Charges1300000 2,956
-0 0058317Outside Printing Expense1300000425610 0
-350 35035000Software Purchase/Licensing1300000425700 350
-3,0003,000 3,0003,0006,945425800 Computer Equip Purc Undr $50001300000 5,450
-23,17623,176 23,17623,17626,432426800 Special Department Supplies1300000 24,020
-8,7948,794 8,7948,7947,109427100 Travel & Meeting Expense1300000 16,366
-0 00690Mayor C Mgr D/Head Travel Mtg1300000427110 0
-2,1002,100 2,1002,100215427200 Training1300000 1,711
-00 016,2493,158428200 Legal Fees1300000 0
CCReport Name: 2017_Mid_Cycle_Report
Report Description: Budget Book - Department Budget Detail wMD
06/07/2017Date:
Time: 28
Version:
Page:19:21:28

Department / Section: Office of the City Attorney / Office of the City Attorney101 - 130000
Department Budget Detail
%Chnge16/17 vs 17/182017/182017/18
AmendedAdoptedAdopted2016/17
AmendedActualActual2016/172015/162014/15GL KeyObject Description
(8.9) %41,10937,416 38,19537,41677,157428400 Liability Insurance1300000 69,513
( .6) %564,245700,641560,552 561,331Non-personnel Expenses Total 341,379333,849
-52,50052,500 52,500193,710(31,129)450209 Unspecfd Outside Counsel Cost1300000 71,013
-7,500 7,50064,147060,794General Litigation Costs1300000450239 7,500
-0 00051,040Neighborhood Livability Prog.1300000450242 0
-00 0470360,647450246 City Attorney Mission Sq Rent1300000 0
-60,000258,32760,000 60,000Special Projects Total 329,518182,849
-0 0000Office Furniture & Equipment1300000462300 0
-0 0Equipment Outlay Total 0000
2.7 %637,260654,831 654,831654,831654,831881100 General Fund Allocation Chgs1300000 1,446,679
(6.6) %13,70012,795 13,70012,7959,522882101 Utilization Chgs from 101 Fund1300000 11,899
2.5 %650,960667,626667,626 668,531Charges From Others Total 664,3531,458,579
(7.6) %(5,169,557)(4,775,831) (4,775,831)(4,775,831)(4,768,678)891100 General Fund Allocation Chgs1300000 (5,420,966)
-(250,000)(250,000) (250,000)(250,000)(249,999)892101 Utilization Chgs to 101 Fund1300000 0
(100.0)%0 (295,199)000Utilization Chgs to 610 Fund1300000892610 0
-(700,000) (700,000)(700,000)00Utilization Chgs to 630 Fund1300000892630 (700,000)
-(100,000)(100,000) (100,000)(100,000)(25,000)894170 Interfund Services to 170 Fund1300000 (25,000)
-0 00(726,493)0Interfund Services to 630 Fund1300000894630 0
(10.5) %(6,514,756)(5,825,831)(5,825,831) (5,825,831)Charges to Others Total (5,770,171)(5,445,966)
(36.0) %(295,090) (461,147)(128,287)34,127(532,628)(196,449)Total Budget Requirements
CCReport Name: 2017_Mid_Cycle_Report
Report Description: Budget Book - Department Budget Detail wMD
06/07/2017Date:
Time: 29
Version:
Page:19:21:28

Department / Section: Office of the City Attorney / CAO-Community Involvemnt-Mes Z101 - 130500
Department Budget Detail
%Chnge16/17 vs 17/182017/182017/18
AmendedAdoptedAdopted2016/17
AmendedActualActual2016/172015/162014/15GL KeyObject Description
-500,000 500,000500,00000Community Prosecutor1305000450248 500,000
-500,000 500,000Special Projects Total 500,000500,00000
-500,000500,000 500,000500,0000Total Budget Requirements 0
CCReport Name: 2017_Mid_Cycle_Report
Report Description: Budget Book - Department Budget Detail wMD
06/07/2017Date:
Time: 30
Version:
Page:19:21:28

Department / Section: Office of the City Attorney / City Atty-Debt101 - 139000
Department Budget Detail
%Chnge16/17 vs 17/182017/182017/18
AmendedAdoptedAdopted2016/17
AmendedActualActual2016/172015/162014/15GL KeyObject Description
-058,585 61,41158,58554,774882101 Utilization Chgs from 101 Fund1390000 51,205
(100.0)%0 47,383000Utilization Chgs from 390 Fund1390000882390 0
23.6 %47,38358,58558,585 61,411Charges From Others Total 54,77451,205
23.6 %58,585 47,38361,41158,58554,77451,205Total Budget Requirements
CCReport Name: 2017_Mid_Cycle_Report
Report Description: Budget Book - Department Budget Detail wMD
06/07/2017Date:
Time: 31
Version:
Page:19:21:28

Department / Section: Office of the City Attorney / CA-Managed Savings101 - 139900
Department Budget Detail
%Chnge16/17 vs 17/182017/182017/18
AmendedAdoptedAdopted2016/17
AmendedActualActual2016/172015/162014/15GL KeyObject Description
-(50,000) (50,000)(50,000)00Managed Savings Allocation1399000499999 (50,000)
-(50,000) (50,000)Managed Savings Total (50,000)(50,000)00
-(50,000)(50,000) (50,000)(50,000)0Total Budget Requirements 0
CCReport Name: 2017_Mid_Cycle_Report
Report Description: Budget Book - Department Budget Detail wMD
06/07/2017Date:
Time: 32
Version:
Page:19:21:28

Department / Section: Human Resources / Human Resources-Administration101 - 210000
Department Budget Detail
%Chnge16/17 vs 17/182017/182017/18
AmendedAdoptedAdopted2016/17
AmendedActualActual2016/172015/162014/15GL KeyObject Description
(3.1) %1,745,0631,690,419 1,745,0631,517,0191,139,736411100 Salaries - Regular2100000 322,596
49.5%(19,396) (12,971)(19,396)00Salaries - Non-Productive2100000411105 (12,971)
(10.9) %18,20016,206 18,20016,206117,666411110 Salaries-Temp & Part Time2100000 0
-0 001,66710Compensatory Time2100000411130 0
-0 0063,2124,591Vacation2100000411210 0
-0 0053,75713,059Holidays & Special Days Off2100000411220 0
-0 0025,0683,446Sick Leave2100000411240 0
-0 0010,1900Family Illness Sick Leave2100000411245 0
-0 004440Industrial Accident2100000411250 0
-0 004210Bereavement Leave2100000411260 0
-0 00160265Jury Duty2100000411280 0
-0 0019,96512,572Administrative Leave2100000411292 0
-0 0081,06748,429Vacation Payoffs2100000411410 0
-0 002,71974,389Sick Leave Payoff2100000411420 0
-0 00320Compensatory Time Payoff2100000411430 0
(4.8) %10,1269,637 10,1269,637(65,619)411510 Accrued Payroll2100000 49,630
(3.2) %21,68620,990 21,68620,99019,863412210 Workers Compensation Ins2100000 5,898
(4.3) %266,045254,549 266,045254,549199,554412220 Health Insurance2100000 28,942
( .5) %12,06411,999 12,06411,99910,247412222 Dental Insurance2100000 1,698
(3.1) %10,50610,178 10,50610,1788,159412230 Life Insurance2100000 1,910
(3.2) %985953 985953865412240 Unemployment Insurance2100000 292
-272272 272272287412250 Disability Insurance2100000 125
(9.5) %522,596472,471 522,596472,471379,346412310 PERS Retirement2100000 77,517
(3.3) %24,35123,544 24,35123,54421,475412320 Medicare OASDI2100000 5,020
(10.9) %683608 683608500412330 City Retirement Plan2100000 0
(20.0) %34,50027,600 34,50027,60017,437412400 Deferred Compensation2100000 1,475
-4,2004,200 4,2004,2008,050412500 Automobile/Expense Allowance2100000 8,225
-0 001490Overtime At Straight Rate2100000413110 0
-0 005850Overtime At 1.5 Rate2100000413120 0
(100.0)%0 55,841000Ptr. Comp. Model2100000419996 0
(7.0) %2,714,1472,350,8302,524,230 2,658,306Personnel Services Total 2,117,013660,099
-153,909153,909 153,909339,415272,710421000 Professional Services2100000 7,121
-0 001,702292Prof Services/Internal2100000421001 0
-29,50029,500 29,50053,9701,270421100 Outside Legal Services2100000 0
-5,6945,694 5,6945,6943,807422100 Telephone2100000 2,673
-4,2004,200 4,2004,2004,172422120 Telephone - Cellular2100000 1,959
-7,6257,625 7,6257,625264423500 Vehicle Usage Reimb Employee2100000 0
-0 00187216Maint/Repair of Bldgs & Improv2100000424130 0
-2,000 2,0002,0000330All Other Equip Maint/Repair2100000424220 2,000
-15,26315,263 15,26315,2638,646425100 Advertising Expense2100000 0
-6,2506,250 6,2506,2502,047425200 Periodicals & Dues2100000 939
-18,85018,850 18,85018,8508,399425400 General Office Expense2100000 3,516
-8,7508,750 8,7508,7506,156425500 Postage2100000 178
-0 005184Central Printing Charges2100000425600 0
-7,7257,725 7,7257,7252,496425610 Outside Printing Expense2100000 212
-16,00016,000 16,00016,000995425700 Software Purchase/Licensing2100000 0
CCReport Name: 2017_Mid_Cycle_Report
Report Description: Budget Book - Department Budget Detail wMD
06/07/2017Date:
Time: 33
Version:
Page:19:21:28
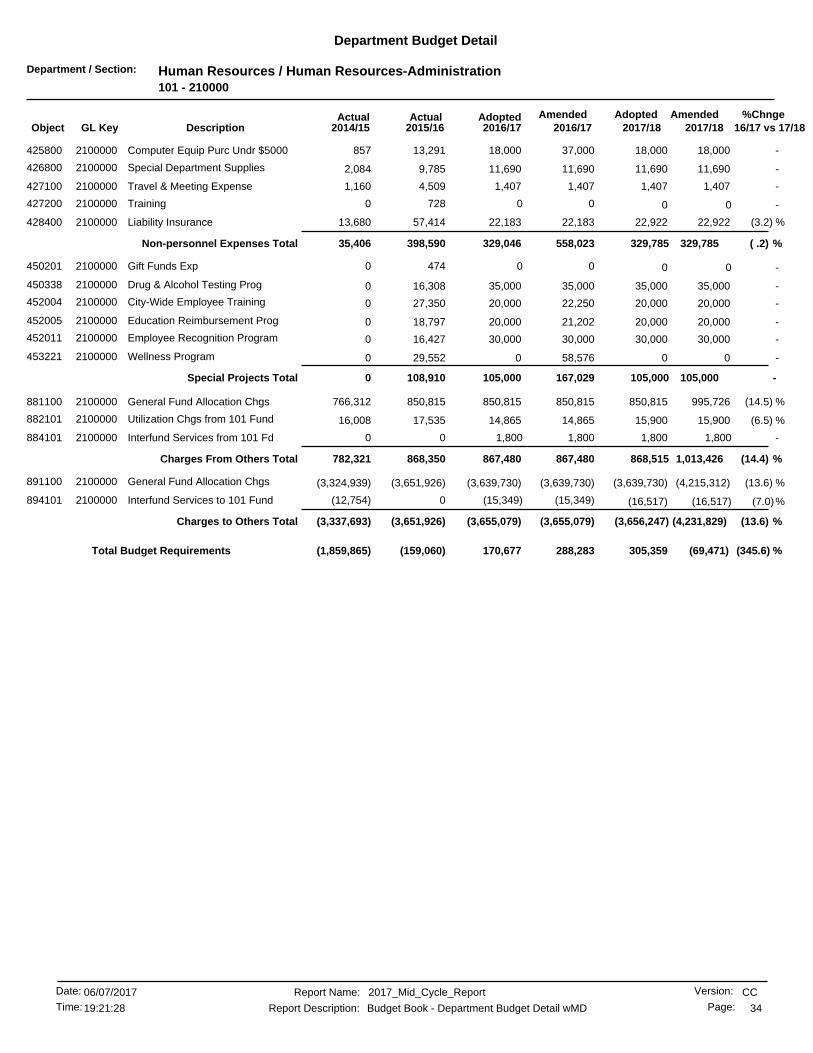
Department / Section: Human Resources / Human Resources-Administration101 - 210000
Department Budget Detail
%Chnge16/17 vs 17/182017/182017/18
AmendedAdoptedAdopted2016/17
AmendedActualActual2016/172015/162014/15GL KeyObject Description
-18,00018,000 18,00037,00013,291425800 Computer Equip Purc Undr $50002100000 857
-11,69011,690 11,69011,6909,785426800 Special Department Supplies2100000 2,084
-1,4071,407 1,4071,4074,509427100 Travel & Meeting Expense2100000 1,160
-0 007280Training2100000427200 0
(3.2) %22,92222,183 22,92222,18357,414428400 Liability Insurance2100000 13,680
( .2) %329,785558,023329,046 329,785Non-personnel Expenses Total 398,59035,406
-0 004740Gift Funds Exp2100000450201 0
-35,00035,000 35,00035,00016,308450338 Drug & Alcohol Testing Prog2100000 0
-20,00020,000 20,00022,25027,350452004 City-Wide Employee Training2100000 0
-20,00020,000 20,00021,20218,797452005 Education Reimbursement Prog2100000 0
-30,00030,000 30,00030,00016,427452011 Employee Recognition Program2100000 0
-00 058,57629,552453221 Wellness Program2100000 0
-105,000167,029105,000 105,000Special Projects Total 108,9100
(14.5) %995,726850,815 850,815850,815850,815881100 General Fund Allocation Chgs2100000 766,312
(6.5) %15,90014,865 15,90014,86517,535882101 Utilization Chgs from 101 Fund2100000 16,008
-1,800 1,8001,80000Interfund Services from 101 Fd2100000884101 1,800
(14.4) %1,013,426867,480867,480 868,515Charges From Others Total 868,350782,321
(13.6) %(4,215,312)(3,639,730) (3,639,730)(3,639,730)(3,651,926)891100 General Fund Allocation Chgs2100000 (3,324,939)
(7.0)%(15,349) (16,517)(15,349)0(12,754)Interfund Services to 101 Fund2100000894101 (16,517)
(13.6) %(4,231,829)(3,655,079)(3,655,079) (3,656,247)Charges to Others Total (3,651,926)(3,337,693)
(345.6) %170,677 (69,471)305,359288,283(159,060)(1,859,865)Total Budget Requirements
CCReport Name: 2017_Mid_Cycle_Report
Report Description: Budget Book - Department Budget Detail wMD
06/07/2017Date:
Time: 34
Version:
Page:19:21:28

Department / Section: Human Resources / Human Resources-Benefits101 - 211500
Department Budget Detail
%Chnge16/17 vs 17/182017/182017/18
AmendedAdoptedAdopted2016/17
AmendedActualActual2016/172015/162014/15GL KeyObject Description
-0 000212,739Salaries - Regular2115000411100 0
-0 0009,400Salaries-Temp & Part Time2115000411110 0
-0 00038Compensatory Time2115000411130 0
-0 00022,807Vacation2115000411210 0
-0 00011,418Holidays & Special Days Off2115000411220 0
-0 0006,400Sick Leave2115000411240 0
-0 0002,483Family Illness Sick Leave2115000411245 0
-0 0001,896Bereavement Leave2115000411260 0
-0 0003,488Administrative Leave2115000411292 0
-0 0002,904Vacation Payoffs2115000411410 0
-0 000(7,963)Accrued Payroll2115000411510 0
-0 0003,801Workers Compensation Ins2115000412210 0
-0 00038,064Health Insurance2115000412220 0
-0 0002,134Dental Insurance2115000412222 0
-0 0001,524Life Insurance2115000412230 0
-0 000189Unemployment Insurance2115000412240 0
-0 00070,902PERS Retirement2115000412310 0
-0 0002,892Medicare OASDI2115000412320 0
-0 000352City Retirement Plan2115000412330 0
-0 0002,375Deferred Compensation2115000412400 0
-0 00035Overtime At 1.5 Rate2115000413120 0
-0 0Personnel Services Total 000387,885
-0 00021,433Professional Services2115000421000 0
-0 000475Telephone2115000422100 0
-0 000130Vehicle Usage Reimb Employee2115000423500 0
-0 0002,379General Office Expense2115000425400 0
-0 0008,688Postage2115000425500 0
-0 0001,384Outside Printing Expense2115000425610 0
-0 0008,814Liability Insurance2115000428400 0
-0 0Non-personnel Expenses Total 00043,306
-00 000Total Budget Requirements 431,192
CCReport Name: 2017_Mid_Cycle_Report
Report Description: Budget Book - Department Budget Detail wMD
06/07/2017Date:
Time: 35
Version:
Page:19:21:28
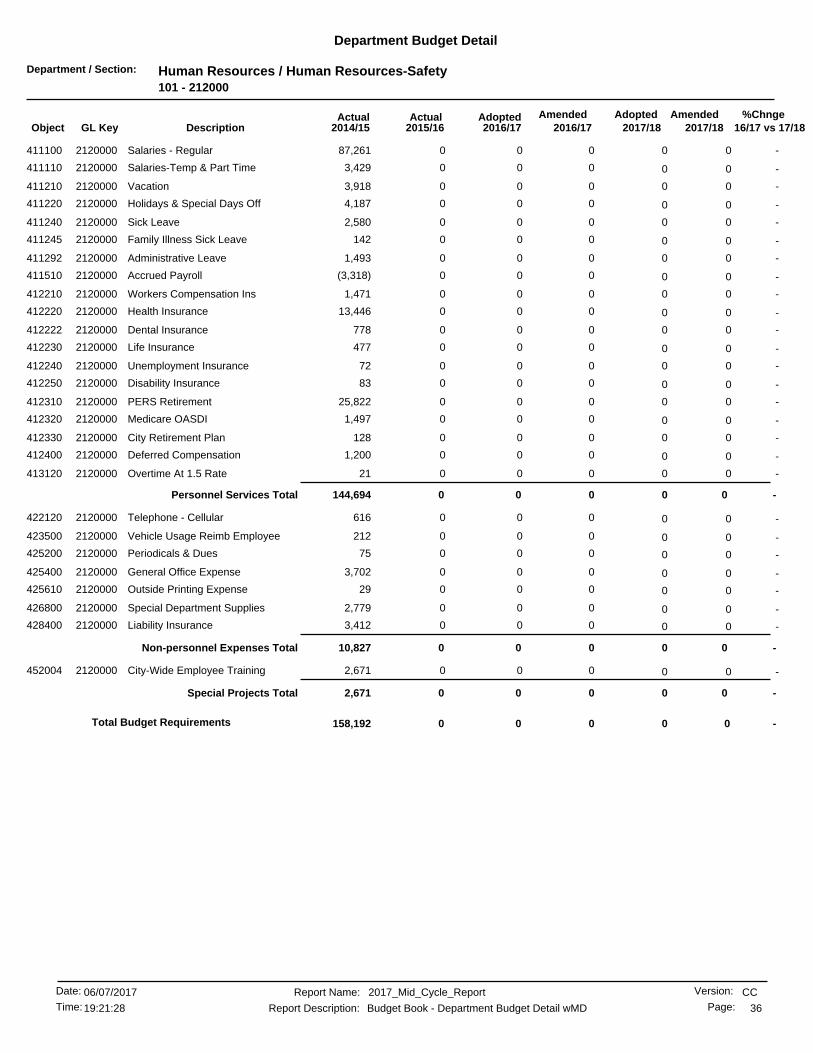
Department / Section: Human Resources / Human Resources-Safety101 - 212000
Department Budget Detail
%Chnge16/17 vs 17/182017/182017/18
AmendedAdoptedAdopted2016/17
AmendedActualActual2016/172015/162014/15GL KeyObject Description
-0 00087,261Salaries - Regular2120000411100 0
-0 0003,429Salaries-Temp & Part Time2120000411110 0
-0 0003,918Vacation2120000411210 0
-0 0004,187Holidays & Special Days Off2120000411220 0
-0 0002,580Sick Leave2120000411240 0
-0 000142Family Illness Sick Leave2120000411245 0
-0 0001,493Administrative Leave2120000411292 0
-0 000(3,318)Accrued Payroll2120000411510 0
-0 0001,471Workers Compensation Ins2120000412210 0
-0 00013,446Health Insurance2120000412220 0
-0 000778Dental Insurance2120000412222 0
-0 000477Life Insurance2120000412230 0
-0 00072Unemployment Insurance2120000412240 0
-0 00083Disability Insurance2120000412250 0
-0 00025,822PERS Retirement2120000412310 0
-0 0001,497Medicare OASDI2120000412320 0
-0 000128City Retirement Plan2120000412330 0
-0 0001,200Deferred Compensation2120000412400 0
-0 00021Overtime At 1.5 Rate2120000413120 0
-0 0Personnel Services Total 000144,694
-0 000616Telephone - Cellular2120000422120 0
-0 000212Vehicle Usage Reimb Employee2120000423500 0
-0 00075Periodicals & Dues2120000425200 0
-0 0003,702General Office Expense2120000425400 0
-0 00029Outside Printing Expense2120000425610 0
-0 0002,779Special Department Supplies2120000426800 0
-0 0003,412Liability Insurance2120000428400 0
-0 0Non-personnel Expenses Total 00010,827
-0 0002,671City-Wide Employee Training2120000452004 0
-0 0Special Projects Total 0002,671
-00 000Total Budget Requirements 158,192
CCReport Name: 2017_Mid_Cycle_Report
Report Description: Budget Book - Department Budget Detail wMD
06/07/2017Date:
Time: 36
Version:
Page:19:21:28
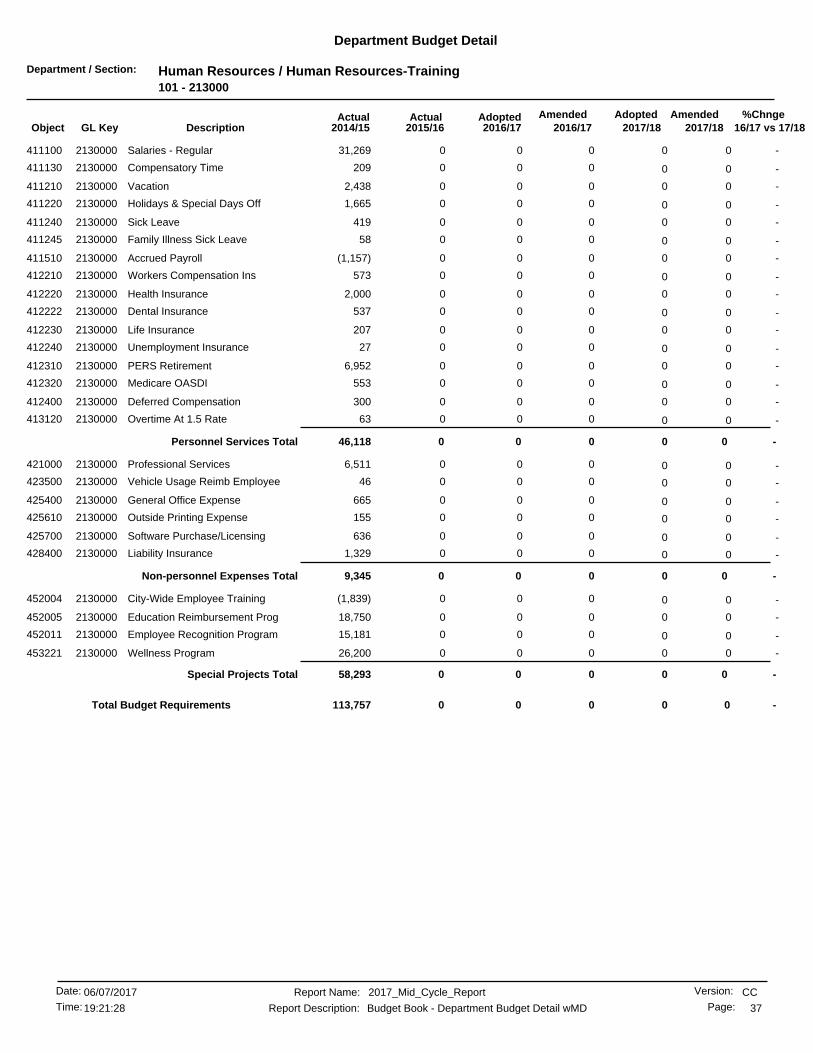
Department / Section: Human Resources / Human Resources-Training101 - 213000
Department Budget Detail
%Chnge16/17 vs 17/182017/182017/18
AmendedAdoptedAdopted2016/17
AmendedActualActual2016/172015/162014/15GL KeyObject Description
-0 00031,269Salaries - Regular2130000411100 0
-0 000209Compensatory Time2130000411130 0
-0 0002,438Vacation2130000411210 0
-0 0001,665Holidays & Special Days Off2130000411220 0
-0 000419Sick Leave2130000411240 0
-0 00058Family Illness Sick Leave2130000411245 0
-0 000(1,157)Accrued Payroll2130000411510 0
-0 000573Workers Compensation Ins2130000412210 0
-0 0002,000Health Insurance2130000412220 0
-0 000537Dental Insurance2130000412222 0
-0 000207Life Insurance2130000412230 0
-0 00027Unemployment Insurance2130000412240 0
-0 0006,952PERS Retirement2130000412310 0
-0 000553Medicare OASDI2130000412320 0
-0 000300Deferred Compensation2130000412400 0
-0 00063Overtime At 1.5 Rate2130000413120 0
-0 0Personnel Services Total 00046,118
-0 0006,511Professional Services2130000421000 0
-0 00046Vehicle Usage Reimb Employee2130000423500 0
-0 000665General Office Expense2130000425400 0
-0 000155Outside Printing Expense2130000425610 0
-0 000636Software Purchase/Licensing2130000425700 0
-0 0001,329Liability Insurance2130000428400 0
-0 0Non-personnel Expenses Total 0009,345
-0 000(1,839)City-Wide Employee Training2130000452004 0
-0 00018,750Education Reimbursement Prog2130000452005 0
-0 00015,181Employee Recognition Program2130000452011 0
-0 00026,200Wellness Program2130000453221 0
-0 0Special Projects Total 00058,293
-00 000Total Budget Requirements 113,757
CCReport Name: 2017_Mid_Cycle_Report
Report Description: Budget Book - Department Budget Detail wMD
06/07/2017Date:
Time: 37
Version:
Page:19:21:28

Department / Section: Human Resources / Human Resources-Recruit/Sel101 - 214000
Department Budget Detail
%Chnge16/17 vs 17/182017/182017/18
AmendedAdoptedAdopted2016/17
AmendedActualActual2016/172015/162014/15GL KeyObject Description
-0 000206,147Salaries - Regular2140000411100 0
-0 00021,595Salaries-Temp & Part Time2140000411110 0
-0 00010,042Vacation2140000411210 0
-0 0009,319Holidays & Special Days Off2140000411220 0
-0 0004,879Sick Leave2140000411240 0
-0 0002,088Family Illness Sick Leave2140000411245 0
-0 0004,162Administrative Leave2140000411292 0
-0 0004,703Vacation Payoffs2140000411410 0
-0 000(12,443)Accrued Payroll2140000411510 0
-0 0002,850Workers Compensation Ins2140000412210 0
-0 00040,696Health Insurance2140000412220 0
-0 0002,311Dental Insurance2140000412222 0
-0 0001,226Life Insurance2140000412230 0
-0 000141Unemployment Insurance2140000412240 0
-0 000120Disability Insurance2140000412250 0
-0 00057,906PERS Retirement2140000412310 0
-0 0003,866Medicare OASDI2140000412320 0
-0 000809City Retirement Plan2140000412330 0
-0 0002,800Deferred Compensation2140000412400 0
-0 000107Overtime At Straight Rate2140000413110 0
-0 000934Overtime At 1.5 Rate2140000413120 0
-0 0Personnel Services Total 000364,268
-0 00084,499Professional Services2140000421000 0
-0 000129Prof Services/Internal2140000421001 0
-0 000387Vehicle Usage Reimb Employee2140000423500 0
-0 0006,179Advertising Expense2140000425100 0
-0 0002,325General Office Expense2140000425400 0
-0 000171Postage2140000425500 0
-0 000100Outside Printing Expense2140000425610 0
-0 00015,876Software Purchase/Licensing2140000425700 0
-0 0001,299Computer Equip Purc Undr $50002140000425800 0
-0 000486Special Department Supplies2140000426800 0
-0 0006,612Liability Insurance2140000428400 0
-0 0Non-personnel Expenses Total 000118,068
-00 000Total Budget Requirements 482,336
CCReport Name: 2017_Mid_Cycle_Report
Report Description: Budget Book - Department Budget Detail wMD
06/07/2017Date:
Time: 38
Version:
Page:19:21:28

Department / Section: Human Resources / HR-Employee & Labor Relations101 - 215000
Department Budget Detail
%Chnge16/17 vs 17/182017/182017/18
AmendedAdoptedAdopted2016/17
AmendedActualActual2016/172015/162014/15GL KeyObject Description
-0 000210,895Salaries - Regular2150000411100 0
-0 0002,970Salaries-Temp & Part Time2150000411110 0
-0 0009,819Vacation2150000411210 0
-0 00010,852Holidays & Special Days Off2150000411220 0
-0 0005,542Sick Leave2150000411240 0
-0 0005,351Family Illness Sick Leave2150000411245 0
-0 000657Jury Duty2150000411280 0
-0 0004,164Administrative Leave2150000411292 0
-0 0005,065Vacation Payoffs2150000411410 0
-0 000(5,442)Accrued Payroll2150000411510 0
-0 0005,692Workers Compensation Ins2150000412210 0
-0 00041,439Health Insurance2150000412220 0
-0 0001,804Dental Insurance2150000412222 0
-0 0001,421Life Insurance2150000412230 0
-0 000282Unemployment Insurance2150000412240 0
-0 00036Disability Insurance2150000412250 0
-0 00075,139PERS Retirement2150000412310 0
-0 0003,879Medicare OASDI2150000412320 0
-0 000111City Retirement Plan2150000412330 0
-0 0002,000Deferred Compensation2150000412400 0
-0 0Personnel Services Total 000381,684
-0 0003,202Professional Services2150000421000 0
-0 00016,665Prof Services/Internal2150000421001 0
-0 0009,440Outside Legal Services2150000421100 0
-0 0001,239Telephone - Cellular2150000422120 0
-0 000360Periodicals & Dues2150000425200 0
-0 000677General Office Expense2150000425400 0
-0 00071Outside Printing Expense2150000425610 0
-0 000197Special Department Supplies2150000426800 0
-0 000870Travel & Meeting Expense2150000427100 0
-0 00013,201Liability Insurance2150000428400 0
-0 0Non-personnel Expenses Total 00045,926
-0 00022,489Drug & Alcohol Testing Prog2150000450338 0
-0 0Special Projects Total 00022,489
-00 000Total Budget Requirements 450,099
CCReport Name: 2017_Mid_Cycle_Report
Report Description: Budget Book - Department Budget Detail wMD
06/07/2017Date:
Time: 39
Version:
Page:19:21:28
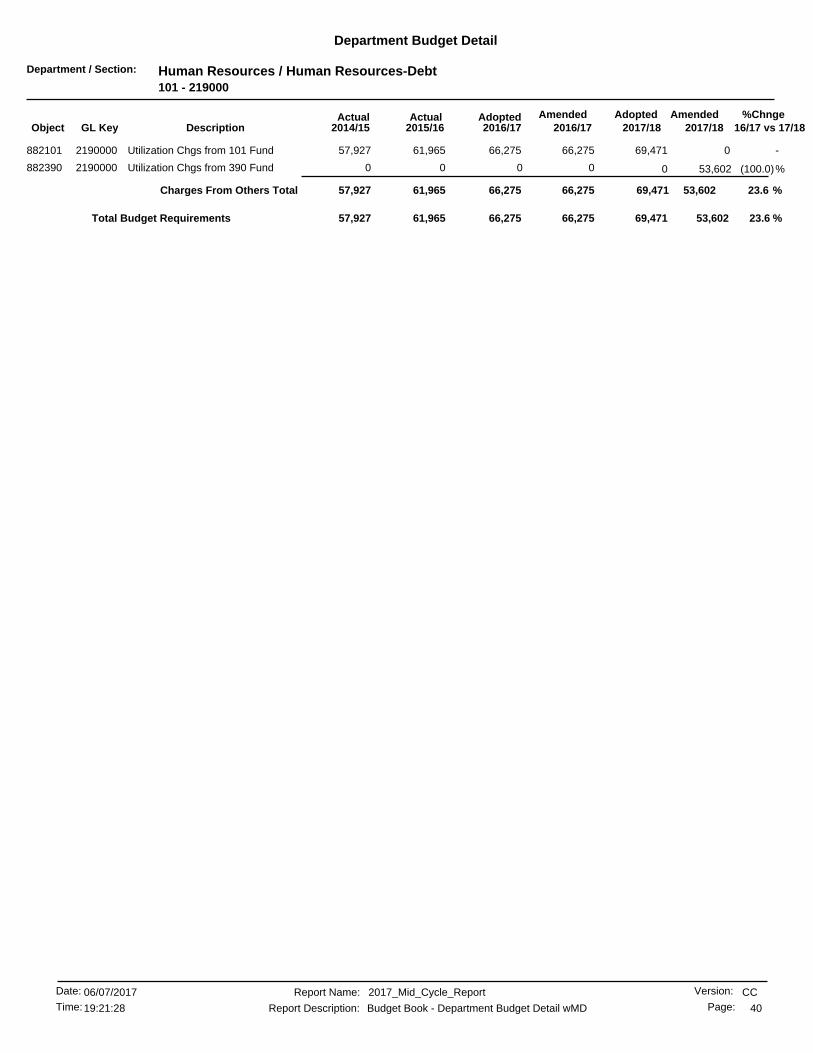
Department / Section: Human Resources / Human Resources-Debt101 - 219000
Department Budget Detail
%Chnge16/17 vs 17/182017/182017/18
AmendedAdoptedAdopted2016/17
AmendedActualActual2016/172015/162014/15GL KeyObject Description
-066,275 69,47166,27561,965882101 Utilization Chgs from 101 Fund2190000 57,927
(100.0)%0 53,602000Utilization Chgs from 390 Fund2190000882390 0
23.6 %53,60266,27566,275 69,471Charges From Others Total 61,96557,927
23.6 %66,275 53,60269,47166,27561,96557,927Total Budget Requirements
CCReport Name: 2017_Mid_Cycle_Report
Report Description: Budget Book - Department Budget Detail wMD
06/07/2017Date:
Time: 40
Version:
Page:19:21:28
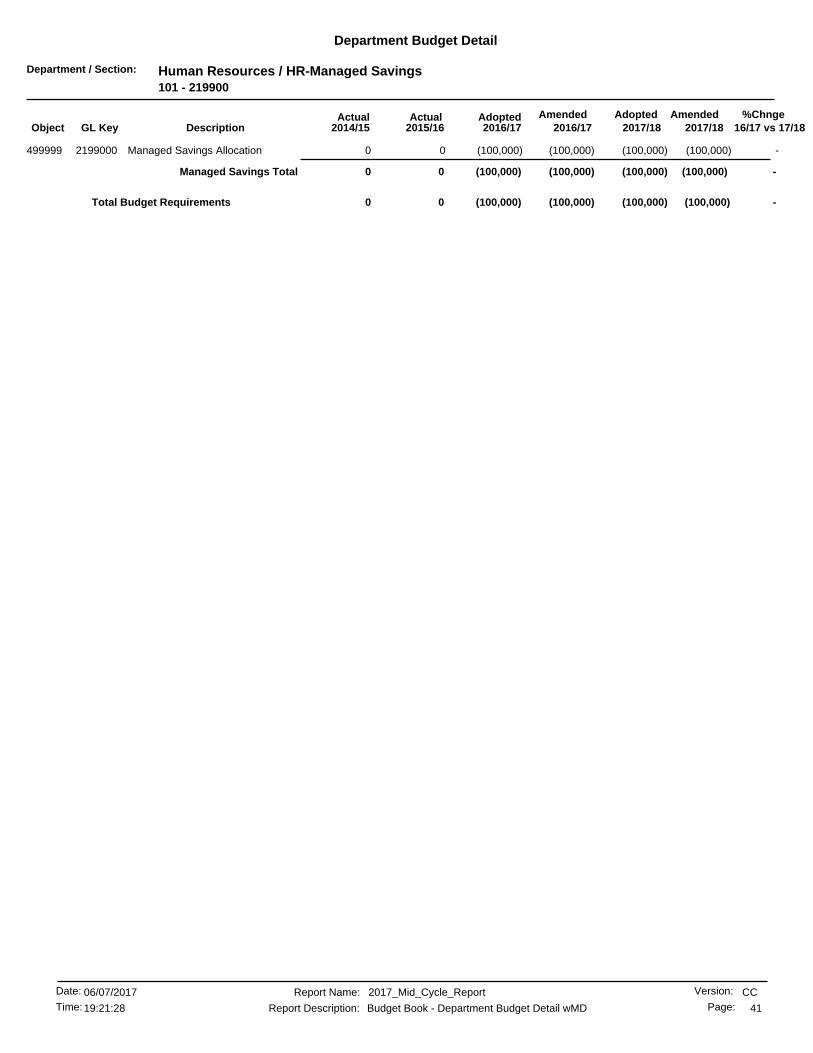
Department / Section: Human Resources / HR-Managed Savings101 - 219900
Department Budget Detail
%Chnge16/17 vs 17/182017/182017/18
AmendedAdoptedAdopted2016/17
AmendedActualActual2016/172015/162014/15GL KeyObject Description
-(100,000) (100,000)(100,000)00Managed Savings Allocation2199000499999 (100,000)
-(100,000) (100,000)Managed Savings Total (100,000)(100,000)00
-(100,000)(100,000) (100,000)(100,000)0Total Budget Requirements 0
CCReport Name: 2017_Mid_Cycle_Report
Report Description: Budget Book - Department Budget Detail wMD
06/07/2017Date:
Time: 41
Version:
Page:19:21:28

Department / Section: General Services / General Services-Administratn101 - 220000
Department Budget Detail
%Chnge16/17 vs 17/182017/182017/18
AmendedAdoptedAdopted2016/17
AmendedActualActual2016/172015/162014/15GL KeyObject Description
(1.5) %606,382597,228 606,382597,228419,200411100 Salaries - Regular2200000 399,945
1.7%(123,554) (121,435)(123,554)00Salaries - Non-Productive2200000411105 (121,435)
-0 0041,17714,960Salaries-Temp & Part Time2200000411110 0
-0 00177385Compensatory Time2200000411130 0
-0 0019,88527,773Vacation2200000411210 0
-0 0019,97619,329Holidays & Special Days Off2200000411220 0
-0 007,95410,996Sick Leave2200000411240 0
-0 001,4851,089Family Illness Sick Leave2200000411245 0
-0 001,2060Bereavement Leave2200000411260 0
-0 001,360177Jury Duty2200000411280 0
-0 0010,84610,063Administrative Leave2200000411292 0
-0 003,0086,822Vacation Payoffs2200000411410 0
(3.2) %3,4333,321 3,4333,321(27,028)411510 Accrued Payroll2200000 17,153
(1.5) %10,43010,272 10,43010,2729,969412210 Workers Compensation Ins2200000 9,171
(4.5) %71,96368,697 71,96368,69754,584412220 Health Insurance2200000 38,296
-3,2403,240 3,2403,2402,992412222 Dental Insurance2200000 2,647
(1.5) %3,7593,702 3,7593,7023,135412230 Life Insurance2200000 2,647
(1.4) %339334 339334322412240 Unemployment Insurance2200000 364
(7.7) %189,374174,748 189,374174,748165,207412310 PERS Retirement2200000 142,625
(1.5) %8,7938,660 8,7938,6607,739412320 Medicare OASDI2200000 7,253
(20.0) %9,0007,200 9,0007,2004,975412400 Deferred Compensation2200000 2,975
-4,2004,200 4,2004,2004,200412500 Automobile/Expense Allowance2200000 4,200
(100.0)%0 16,222000Ptr. Comp. Model2200000419996 0
(5.9) %805,700758,048758,048 789,478Personnel Services Total 752,375718,881
-0 0037106Professional Services2200000421000 0
-0 002,076224Prof Services/Internal2200000421001 0
-1,0001,000 1,0001,000588422100 Telephone2200000 502
-3,5003,500 3,5003,5003,523422120 Telephone - Cellular2200000 1,864
-6,0006,000 6,0006,0006,422423400 Motor Pool Equipment Rental2200000 6,750
-0 003710Maint/Repair of Bldgs & Improv2200000424130 0
-500 50050000Central Garage Charges2200000424230 500
-800800 800800581425200 Periodicals & Dues2200000 0
-1,5001,500 1,500635806425400 General Office Expense2200000 151
-9090 909027425500 Postage2200000 29
-150 15015000Central Printing Charges2200000425600 150
-0 00206576Outside Printing Expense2200000425610 0
-1,0001,000 1,0001,000242425800 Computer Equip Purc Undr $50002200000 0
-0 01900Clothing/Linen/Safety Supplies2200000426200 0
-750750 7501,5952,243426800 Special Department Supplies2200000 959
-0 00(280)0Travel & Meeting Expense2200000427100 0
-1,0001,000 1,0001,0003,697427200 Training2200000 919
(1.5) %14,19113,976 14,19113,97619,300428400 Liability Insurance2200000 12,820
( .7) %30,48130,26630,266 30,481Non-personnel Expenses Total 39,84524,905
-5,0005,000 5,0005,000563450052 Commission of Disabilities2200000 871
-5,0005,0005,000 5,000Special Projects Total 563871
CCReport Name: 2017_Mid_Cycle_Report
Report Description: Budget Book - Department Budget Detail wMD
06/07/2017Date:
Time: 42
Version:
Page:19:21:28

Department / Section: General Services / General Services-Administratn101 - 220000
Department Budget Detail
%Chnge16/17 vs 17/182017/182017/18
AmendedAdoptedAdopted2016/17
AmendedActualActual2016/172015/162014/15GL KeyObject Description
(3.4) %970,978937,718 937,718937,718937,717881100 General Fund Allocation Chgs2200000 891,876
(3.4) %970,978937,718937,718 937,718Charges From Others Total 937,717891,876
2.8 %(4,840,867)(4,977,953) (4,977,953)(4,977,953)(4,977,325)891100 General Fund Allocation Chgs2200000 (5,586,197)
-0 000(3,365)Interfund Services to 101 Fund2200000894101 0
2.8 %(4,840,867)(4,977,953)(4,977,953) (4,977,953)Charges to Others Total (4,977,325)(5,589,562)
7.2 %(3,246,921) (3,028,708)(3,215,276)(3,246,921)(3,246,822)(3,953,026)Total Budget Requirements
CCReport Name: 2017_Mid_Cycle_Report
Report Description: Budget Book - Department Budget Detail wMD
06/07/2017Date:
Time: 43
Version:
Page:19:21:28

Department / Section: General Services / General Serv-Property Mgmt101 - 220500
Department Budget Detail
%Chnge16/17 vs 17/182017/182017/18
AmendedAdoptedAdopted2016/17
AmendedActualActual2016/172015/162014/15GL KeyObject Description
-86,47286,472 86,47286,47278,766411100 Salaries - Regular2205000 75,992
-0 005,7764,984Vacation2205000411210 0
-0 002,6602,978Holidays & Special Days Off2205000411220 0
-0 008730Sick Leave2205000411240 0
-0 000579Jury Duty2205000411280 0
-0 001,7041,489Administrative Leave2205000411292 0
(1.9) %511501 511501(3,955)411510 Accrued Payroll2205000 889
-1,4871,487 1,4871,4871,486412210 Workers Compensation Ins2205000 1,513
(4.0) %11,87211,392 11,87211,39211,375412220 Health Insurance2205000 10,432
(8.9) %436397 436397385412222 Dental Insurance2205000 360
-536536 536536544412230 Life Insurance2205000 499
-4848 484848412240 Unemployment Insurance2205000 60
(5.8) %30,72528,930 30,72528,93028,339412310 PERS Retirement2205000 25,303
-1,2541,254 1,2541,2541,311412320 Medicare OASDI2205000 1,256
(20.0) %1,5001,200 1,5001,200937412400 Deferred Compensation2205000 600
(100.0)%0 2,149000Ptr. Comp. Model2205000419996 0
(3.4) %136,990132,217132,217 134,841Personnel Services Total 130,254126,940
-400 400000Professional Services2205000421000 400
-440440 44044094422100 Telephone2205000 61
-501501 501501432422120 Telephone - Cellular2205000 300
-8,0008,000 8,0006,9598,818423400 Motor Pool Equipment Rental2205000 6,131
-500 500000General Office Expense2205000425400 500
-50 505000Postage2205000425500 50
-750 75000113Special Department Supplies2205000426800 750
-250 250000Training2205000427200 250
-2,0232,023 2,0232,0232,878428400 Liability Insurance2205000 2,115
-00 02,9412,616447100 Taxes And Assessments2205000 6,338
-12,91412,91412,914 12,914Non-personnel Expenses Total 14,84115,061
(3.1) %145,131 149,904147,755145,131145,095142,001Total Budget Requirements
CCReport Name: 2017_Mid_Cycle_Report
Report Description: Budget Book - Department Budget Detail wMD
06/07/2017Date:
Time: 44
Version:
Page:19:21:28

Department / Section: General Services / Gen Svs-Bldg Svs-Maintenance101 - 221000
Department Budget Detail
%Chnge16/17 vs 17/182017/182017/18
AmendedAdoptedAdopted2016/17
AmendedActualActual2016/172015/162014/15GL KeyObject Description
(2.6) %874,049850,782 874,049850,782636,490411100 Salaries - Regular2210000 598,144
(4.9) %6,1055,805 6,1055,8051,810411110 Salaries-Temp & Part Time2210000 3,435
-0 0028,99726,735Compensatory Time2210000411130 0
-0 0031,52942,225Vacation2210000411210 0
-0 0029,41829,837Holidays & Special Days Off2210000411220 0
-0 0015,22721,869Sick Leave2210000411240 0
-0 0012,1688,394Family Illness Sick Leave2210000411245 0
-0 002,5890Bereavement Leave2210000411260 0
-0 0003,641Jury Duty2210000411280 0
-0 003,3251,945Administrative Leave2210000411292 0
-0 001024,266Vacation Payoffs2210000411410 0
-0 00010,834Sick Leave Payoff2210000411420 0
-0 000580Compensatory Time Payoff2210000411430 0
(4.0) %5,0734,866 5,0734,866(13,335)411510 Accrued Payroll2210000 (14,062)
(2.6) %15,14014,734 15,14014,73414,191412210 Workers Compensation Ins2210000 14,127
(3.4) %166,562160,800 166,562160,800115,895412220 Health Insurance2210000 92,533
( .9) %6,7996,734 6,7996,7345,012412222 Dental Insurance2210000 4,029
(1.5) %1,9181,889 1,9181,8891,317412230 Life Insurance2210000 1,174
(2.6) %490477 490477459412240 Unemployment Insurance2210000 567
-1,5301,530 1,5301,5301,249412250 Disability Insurance2210000 1,274
(9.4) %247,646224,355 247,646224,355176,374412310 PERS Retirement2210000 168,457
(2.9) %11,47111,129 11,47111,12910,422412320 Medicare OASDI2210000 9,678
(4.8) %229218 22921867412330 City Retirement Plan2210000 131
(20.0) %4,5003,600 4,5003,6001,875412400 Deferred Compensation2210000 1,200
-10,00010,000 10,00010,0009,709413110 Overtime At Straight Rate2210000 4,782
-40,00040,000 40,00040,00029,622413120 Overtime At 1.5 Rate2210000 32,325
-2,0002,000 2,0002,0002,166413130 Overtime At Double Time Rate2210000 573
(100.0)%0 39,621000Ptr. Comp. Model2210000419996 0
(6.5) %1,433,1331,338,9191,338,919 1,393,512Personnel Services Total 1,116,6881,068,705
(2.7) %291,730283,730 291,730302,031251,149421000 Professional Services2210000 363,054
-0 005,7793,147Prof Services/Internal2210000421001 0
-1,000 1,0001,00000Regulatory/Market Compliance2210000421200 1,000
-1,9001,900 1,9001,9001,071422100 Telephone2210000 1,236
-1,100 1,1001,10000Telephone Outside Comm Lines2210000422110 1,100
-7,0007,000 7,0007,0008,522422120 Telephone - Cellular2210000 6,499
-129,000129,000 129,000129,000132,957422200 Electric2210000 130,916
-30,00030,000 30,00030,00030,002422300 Gas2210000 26,261
-15,10015,100 15,10015,10011,331422500 Water2210000 12,192
-19,20019,200 19,20019,20014,220422600 Other Utilities2210000 18,435
-800 80080000Refuse/Disposal Fees2210000422700 800
-1,000 1,0001,00000Equipment Rental2210000423100 1,000
(4.0) %100,00096,000 100,00096,00098,660423400 Motor Pool Equipment Rental2210000 96,889
-0 00720Constr & Maint Materials2210000424120 0
15.1 %373,500430,000 373,500443,330411,576424130 Maint/Repair of Bldgs & Improv2210000 583,069
-0 003,0410Casa Blanca Library Roof Repr9873600424130 0
-00 016,3187,068424130 SB1186-Accesibility Projects9890400 0
CCReport Name: 2017_Mid_Cycle_Report
Report Description: Budget Book - Department Budget Detail wMD
06/07/2017Date:
Time: 45
Version:
Page:19:21:28
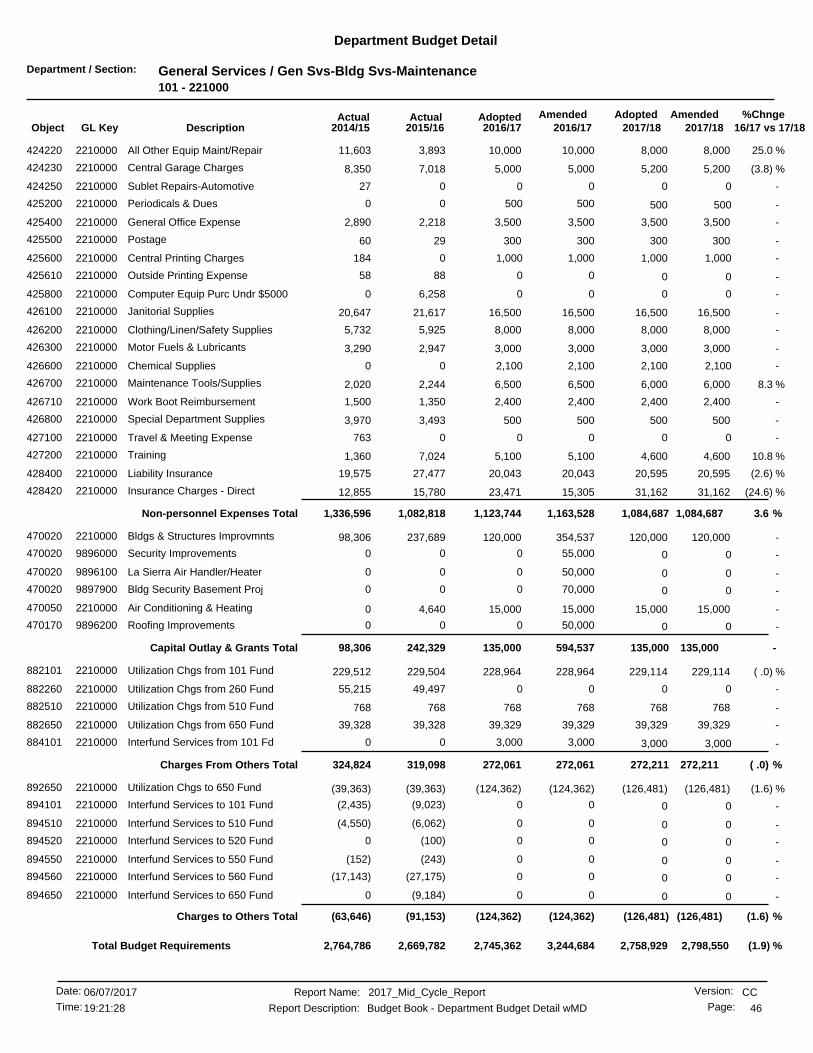
Department / Section: General Services / Gen Svs-Bldg Svs-Maintenance101 - 221000
Department Budget Detail
%Chnge16/17 vs 17/182017/182017/18
AmendedAdoptedAdopted2016/17
AmendedActualActual2016/172015/162014/15GL KeyObject Description
25.0 %8,00010,000 8,00010,0003,893424220 All Other Equip Maint/Repair2210000 11,603
(3.8) %5,2005,000 5,2005,0007,018424230 Central Garage Charges2210000 8,350
-0 00027Sublet Repairs-Automotive2210000424250 0
-500 50050000Periodicals & Dues2210000425200 500
-3,5003,500 3,5003,5002,218425400 General Office Expense2210000 2,890
-300300 30030029425500 Postage2210000 60
-1,000 1,0001,0000184Central Printing Charges2210000425600 1,000
-0 008858Outside Printing Expense2210000425610 0
-0 006,2580Computer Equip Purc Undr $50002210000425800 0
-16,50016,500 16,50016,50021,617426100 Janitorial Supplies2210000 20,647
-8,0008,000 8,0008,0005,925426200 Clothing/Linen/Safety Supplies2210000 5,732
-3,0003,000 3,0003,0002,947426300 Motor Fuels & Lubricants2210000 3,290
-2,100 2,1002,10000Chemical Supplies2210000426600 2,100
8.3 %6,0006,500 6,0006,5002,244426700 Maintenance Tools/Supplies2210000 2,020
-2,4002,400 2,4002,4001,350426710 Work Boot Reimbursement2210000 1,500
-500500 5005003,493426800 Special Department Supplies2210000 3,970
-0 000763Travel & Meeting Expense2210000427100 0
10.8 %4,6005,100 4,6005,1007,024427200 Training2210000 1,360
(2.6) %20,59520,043 20,59520,04327,477428400 Liability Insurance2210000 19,575
(24.6) %31,16223,471 31,16215,30515,780428420 Insurance Charges - Direct2210000 12,855
3.6 %1,084,6871,163,5281,123,744 1,084,687Non-personnel Expenses Total 1,082,8181,336,596
-120,000120,000 120,000354,537237,689470020 Bldgs & Structures Improvmnts2210000 98,306
-0 055,00000Security Improvements9896000470020 0
-0 050,00000La Sierra Air Handler/Heater9896100470020 0
-0 070,00000Bldg Security Basement Proj9897900470020 0
-15,00015,000 15,00015,0004,640470050 Air Conditioning & Heating2210000 0
-0 050,00000Roofing Improvements9896200470170 0
-135,000594,537135,000 135,000Capital Outlay & Grants Total 242,32998,306
( .0) %229,114228,964 229,114228,964229,504882101 Utilization Chgs from 101 Fund2210000 229,512
-0 0049,49755,215Utilization Chgs from 260 Fund2210000882260 0
-768768 768768768882510 Utilization Chgs from 510 Fund2210000 768
-39,32939,329 39,32939,32939,328882650 Utilization Chgs from 650 Fund2210000 39,328
-3,000 3,0003,00000Interfund Services from 101 Fd2210000884101 3,000
( .0) %272,211272,061272,061 272,211Charges From Others Total 319,098324,824
(1.6) %(126,481)(124,362) (126,481)(124,362)(39,363)892650 Utilization Chgs to 650 Fund2210000 (39,363)
-0 00(9,023)(2,435)Interfund Services to 101 Fund2210000894101 0
-0 00(6,062)(4,550)Interfund Services to 510 Fund2210000894510 0
-0 00(100)0Interfund Services to 520 Fund2210000894520 0
-0 00(243)(152)Interfund Services to 550 Fund2210000894550 0
-0 00(27,175)(17,143)Interfund Services to 560 Fund2210000894560 0
-0 00(9,184)0Interfund Services to 650 Fund2210000894650 0
(1.6) %(126,481)(124,362)(124,362) (126,481)Charges to Others Total (91,153)(63,646)
(1.9) %2,745,362 2,798,5502,758,9293,244,6842,669,7822,764,786Total Budget Requirements
CCReport Name: 2017_Mid_Cycle_Report
Report Description: Budget Book - Department Budget Detail wMD
06/07/2017Date:
Time: 46
Version:
Page:19:21:28
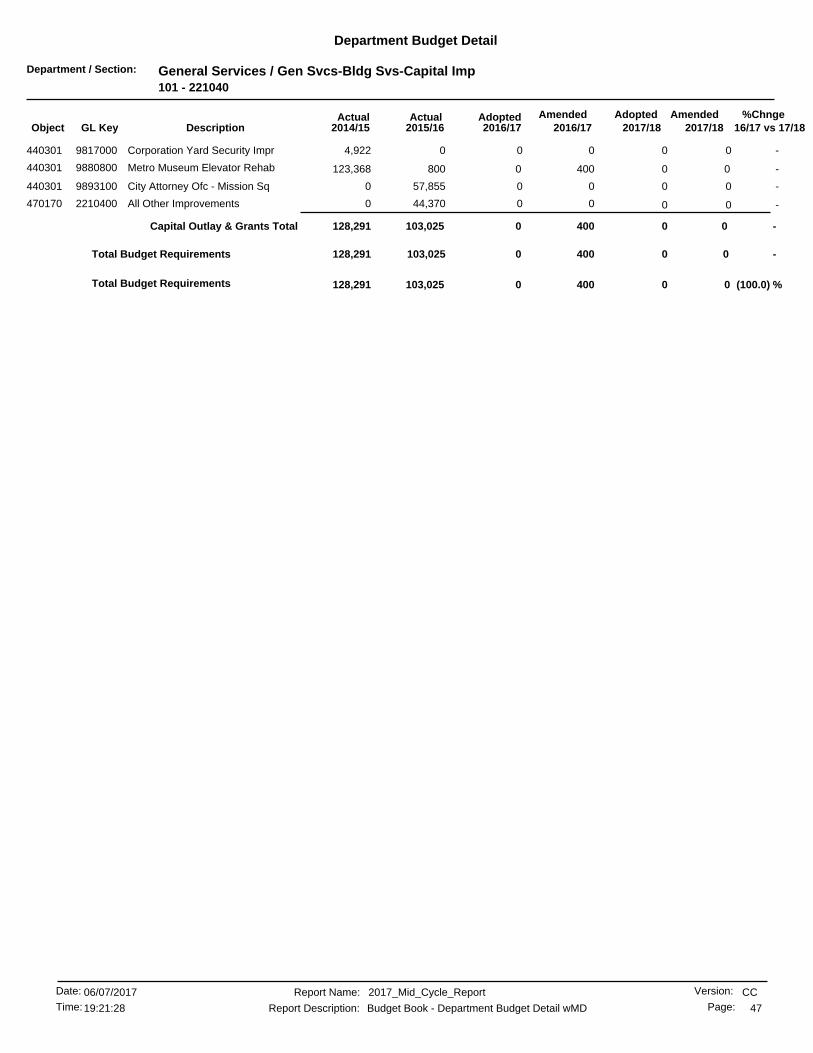
Department / Section: General Services / Gen Svcs-Bldg Svs-Capital Imp101 - 221040
Department Budget Detail
%Chnge16/17 vs 17/182017/182017/18
AmendedAdoptedAdopted2016/17
AmendedActualActual2016/172015/162014/15GL KeyObject Description
-0 0004,922Corporation Yard Security Impr9817000440301 0
-00 0400800440301 Metro Museum Elevator Rehab9880800 123,368
-0 0057,8550City Attorney Ofc - Mission Sq9893100440301 0
-0 0044,3700All Other Improvements2210400470170 0
-0 0Capital Outlay & Grants Total 0400103,025128,291
-0 00400103,025128,291Total Budget Requirements
(100.0) %00 0400103,025Total Budget Requirements 128,291
CCReport Name: 2017_Mid_Cycle_Report
Report Description: Budget Book - Department Budget Detail wMD
06/07/2017Date:
Time: 47
Version:
Page:19:21:28
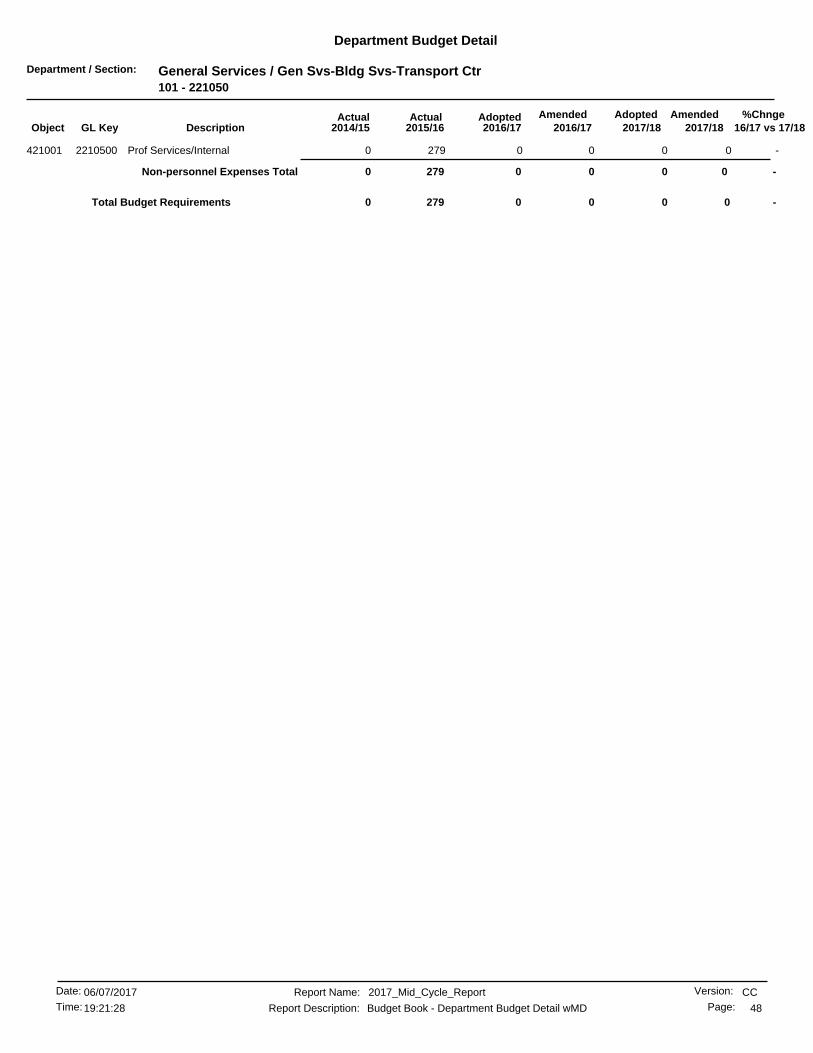
Department / Section: General Services / Gen Svs-Bldg Svs-Transport Ctr101 - 221050
Department Budget Detail
%Chnge16/17 vs 17/182017/182017/18
AmendedAdoptedAdopted2016/17
AmendedActualActual2016/172015/162014/15GL KeyObject Description
-0 002790Prof Services/Internal2210500421001 0
-0 0Non-personnel Expenses Total 002790
-00 00279Total Budget Requirements 0
CCReport Name: 2017_Mid_Cycle_Report
Report Description: Budget Book - Department Budget Detail wMD
06/07/2017Date:
Time: 48
Version:
Page:19:21:28

Department / Section: General Services / General Sev-Publishing Svcs101 - 223000
Department Budget Detail
%Chnge16/17 vs 17/182017/182017/18
AmendedAdoptedAdopted2016/17
AmendedActualActual2016/172015/162014/15GL KeyObject Description
-148,752148,752 148,752148,752131,535411100 Salaries - Regular2230000 122,866
-0 0010,8349,720Vacation2230000411210 0
-0 005,9125,953Holidays & Special Days Off2230000411220 0
-0 004,6704,219Sick Leave2230000411240 0
-0 00476780Family Illness Sick Leave2230000411245 0
-0 000930Bereavement Leave2230000411260 0
-0 00762372Jury Duty2230000411280 0
-0 00143139Administrative Leave2230000411292 0
(1.8) %824809 824809(6,572)411510 Accrued Payroll2230000 1,380
-2,5592,559 2,5592,5593,213412210 Workers Compensation Ins2230000 3,207
(7.9) %16,57015,246 16,57015,24615,473412220 Health Insurance2230000 15,281
-1,6201,620 1,6201,6201,687412222 Dental Insurance2230000 1,616
-7878 787885412230 Life Insurance2230000 79
-8484 8484103412240 Unemployment Insurance2230000 127
-408408 408408423412250 Disability Insurance2230000 407
(6.2) %46,88443,968 46,88443,96836,636412310 PERS Retirement2230000 35,182
-2,1572,157 2,1572,1572,290412320 Medicare OASDI2230000 2,153
-10,90010,900 10,90010,900761413120 Overtime At 1.5 Rate2230000 704
(100.0)%0 7,632000Ptr. Comp. Model2230000419996 0
(4.9) %238,468226,581226,581 230,836Personnel Services Total 208,439205,123
-10,000 10,00010,00000Professional Services2230000421000 10,000
-150150 15015064422100 Telephone2230000 89
-0 001290Telephone - Cellular2230000422120 0
-2,0002,000 2,0002,0005,674423400 Motor Pool Equipment Rental2230000 6,229
-20,500 20,50020,50000All Other Equip Maint/Repair2230000424220 20,500
-500500 500500323424230 Central Garage Charges2230000 2,957
-1,5001,500 1,5001,5003,213425400 General Office Expense2230000 3,314
-500 50050008Postage2230000425500 500
-0 004131,009Central Printing Charges2230000425600 0
-0 004,3362,670Outside Printing Expense2230000425610 0
-4,100 4,1004,10000Software Purchase/Licensing2230000425700 4,100
-500 50050000Computer Equip Purc Undr $50002230000425800 500
-800 80080000Clothing/Linen/Safety Supplies2230000426200 800
(3.8) %2,6002,500 2,6002,5002,212426300 Motor Fuels & Lubricants2230000 1,021
-300300 300300450426710 Work Boot Reimbursement2230000 450
20.0 %25,00030,000 25,00030,0005,934426800 Special Department Supplies2230000 4,619
-3,4803,480 3,4803,4806,222428400 Liability Insurance2230000 4,485
-0 000(860)Public Liability Claims2230000428600 0
6.8 %71,93076,83076,830 71,930Non-personnel Expenses Total 28,97525,994
-15,00015,000 15,00015,00035,554463300 Off Furn & Equip Cap Lease2230000 31,030
-15,00015,00015,000 15,000Equipment Outlay Total 35,55431,030
-(63,462)(63,462) (63,462)(63,462)(63,462)892510 Utilization Chgs to 510 Fund2230000 (63,462)
-(63,462) (63,462)Charges to Others Total (63,462)(63,462)(63,462)(63,462)
(2.6) %254,949 261,936254,304254,949209,507198,687Total Budget Requirements
CCReport Name: 2017_Mid_Cycle_Report
Report Description: Budget Book - Department Budget Detail wMD
06/07/2017Date:
Time: 49
Version:
Page:19:21:28
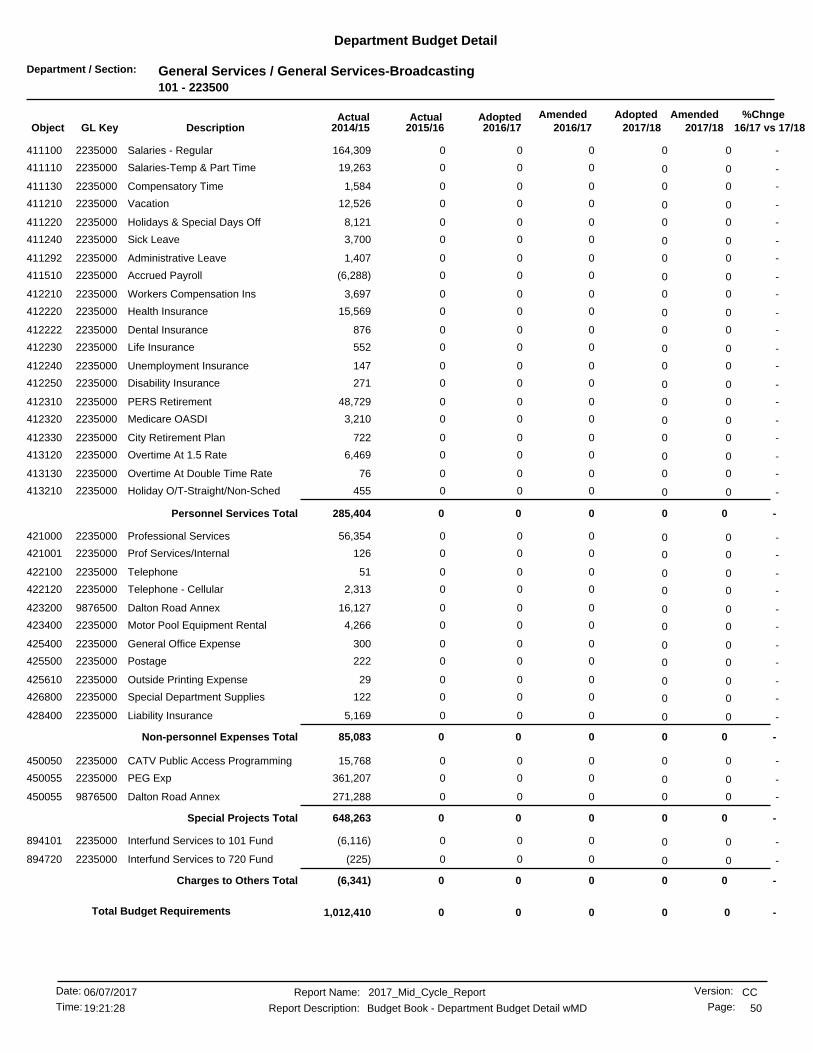
Department / Section: General Services / General Services-Broadcasting101 - 223500
Department Budget Detail
%Chnge16/17 vs 17/182017/182017/18
AmendedAdoptedAdopted2016/17
AmendedActualActual2016/172015/162014/15GL KeyObject Description
-0 000164,309Salaries - Regular2235000411100 0
-0 00019,263Salaries-Temp & Part Time2235000411110 0
-0 0001,584Compensatory Time2235000411130 0
-0 00012,526Vacation2235000411210 0
-0 0008,121Holidays & Special Days Off2235000411220 0
-0 0003,700Sick Leave2235000411240 0
-0 0001,407Administrative Leave2235000411292 0
-0 000(6,288)Accrued Payroll2235000411510 0
-0 0003,697Workers Compensation Ins2235000412210 0
-0 00015,569Health Insurance2235000412220 0
-0 000876Dental Insurance2235000412222 0
-0 000552Life Insurance2235000412230 0
-0 000147Unemployment Insurance2235000412240 0
-0 000271Disability Insurance2235000412250 0
-0 00048,729PERS Retirement2235000412310 0
-0 0003,210Medicare OASDI2235000412320 0
-0 000722City Retirement Plan2235000412330 0
-0 0006,469Overtime At 1.5 Rate2235000413120 0
-0 00076Overtime At Double Time Rate2235000413130 0
-0 000455Holiday O/T-Straight/Non-Sched2235000413210 0
-0 0Personnel Services Total 000285,404
-0 00056,354Professional Services2235000421000 0
-0 000126Prof Services/Internal2235000421001 0
-0 00051Telephone2235000422100 0
-0 0002,313Telephone - Cellular2235000422120 0
-0 00016,127Dalton Road Annex9876500423200 0
-0 0004,266Motor Pool Equipment Rental2235000423400 0
-0 000300General Office Expense2235000425400 0
-0 000222Postage2235000425500 0
-0 00029Outside Printing Expense2235000425610 0
-0 000122Special Department Supplies2235000426800 0
-0 0005,169Liability Insurance2235000428400 0
-0 0Non-personnel Expenses Total 00085,083
-0 00015,768CATV Public Access Programming2235000450050 0
-0 000361,207PEG Exp2235000450055 0
-0 000271,288Dalton Road Annex9876500450055 0
-0 0Special Projects Total 000648,263
-0 000(6,116)Interfund Services to 101 Fund2235000894101 0
-0 000(225)Interfund Services to 720 Fund2235000894720 0
-0 0Charges to Others Total 000(6,341)
-00 000Total Budget Requirements 1,012,410
CCReport Name: 2017_Mid_Cycle_Report
Report Description: Budget Book - Department Budget Detail wMD
06/07/2017Date:
Time: 50
Version:
Page:19:21:28

Department / Section: General Services / Capital Projects101 - 224000
Department Budget Detail
%Chnge16/17 vs 17/182017/182017/18
AmendedAdoptedAdopted2016/17
AmendedActualActual2016/172015/162014/15GL KeyObject Description
( .2) %338,436337,705 338,436337,705292,294411100 Salaries - Regular2240000 286,025
-0 0023,91223,053Vacation2240000411210 0
-0 0014,19513,915Holidays & Special Days Off2240000411220 0
-0 0012,5036,209Sick Leave2240000411240 0
-0 001,568156Family Illness Sick Leave2240000411245 0
-0 005,0508,417Administrative Leave2240000411292 0
-0 002,1633,229Vacation Payoffs2240000411410 0
(2.0) %1,9641,923 1,9641,923(15,036)411510 Accrued Payroll2240000 (3,481)
( .2) %5,8215,808 5,8215,8085,752412210 Workers Compensation Ins2240000 5,736
(5.4) %39,02936,905 39,02936,90536,012412220 Health Insurance2240000 32,127
-1,6201,620 1,6201,6201,566412222 Dental Insurance2240000 1,554
( .1) %2,0992,095 2,0992,0952,090412230 Life Insurance2240000 1,967
-189189 189189186412240 Unemployment Insurance2240000 228
(6.0) %120,254112,983 120,254112,983110,462412310 PERS Retirement2240000 99,449
( .2) %4,9064,896 4,9064,8965,138412320 Medicare OASDI2240000 4,979
(20.0) %4,5003,600 4,5003,6002,812412400 Deferred Compensation2240000 1,850
(100.0)%0 7,627000Ptr. Comp. Model2240000419996 0
(3.5) %526,445507,724507,724 518,818Personnel Services Total 500,675485,418
-8,000 8,0008,00000Professional Services2240000421000 8,000
-0 0003,365Prof Services/Internal2240000421001 0
-1,2501,250 1,2501,250306422100 Telephone2240000 355
-2,5002,500 2,5002,5002,510422120 Telephone - Cellular2240000 2,908
-13,50013,500 13,50013,50012,718423400 Motor Pool Equipment Rental2240000 12,802
-250 25025000Vehicle Usage Reimb Employee2240000423500 250
-0 005530Constr & Maint Materials2240000424120 0
-250 25025000All Other Equip Maint/Repair2240000424220 250
-2,0002,000 2,0002,0001,360425400 General Office Expense2240000 468
-750750 7507507,172426800 Special Department Supplies2240000 3,390
-2,0002,000 2,0002,000515427200 Training2240000 0
( .2) %7,9207,903 7,9207,90311,137428400 Liability Insurance2240000 8,017
( .0) %38,42038,40338,403 38,420Non-personnel Expenses Total 36,27431,309
-126,923126,923 126,923126,923126,922881100 General Fund Allocation Chgs2240000 302,647
-126,923126,923126,923 126,923Charges From Others Total 126,922302,647
-(222,008)(222,008) (222,008)(222,008)(222,007)892101 Utilization Chgs to 101 Fund2240000 (222,008)
-(438,684)(438,684) (438,684)(438,684)(422,798)894101 Interfund Services to 101 Fund2240000 (540,333)
-0 00(19,067)(56,980)Interfund Services to 510 Fund2240000894510 0
-(660,692)(660,692)(660,692) (660,692)Charges to Others Total (663,873)(819,321)
89.9 %31,09612,358 23,46912,3580Total Budget Requirements 54
CCReport Name: 2017_Mid_Cycle_Report
Report Description: Budget Book - Department Budget Detail wMD
06/07/2017Date:
Time: 51
Version:
Page:19:21:28
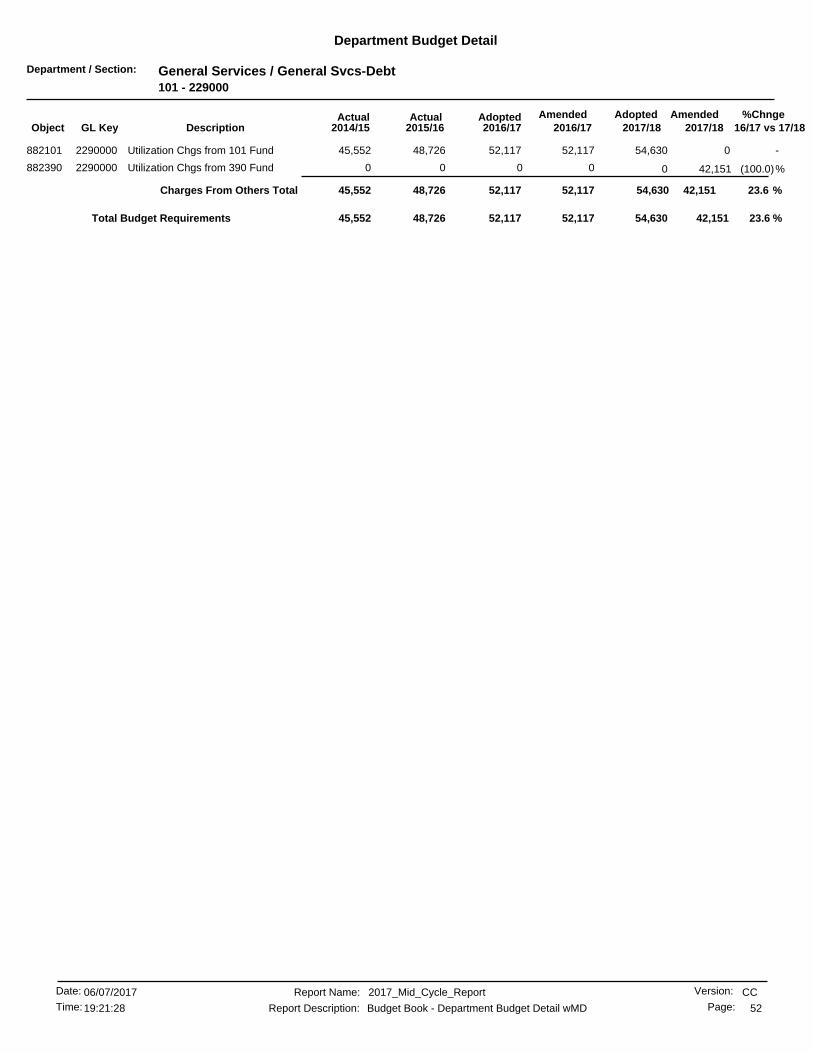
Department / Section: General Services / General Svcs-Debt101 - 229000
Department Budget Detail
%Chnge16/17 vs 17/182017/182017/18
AmendedAdoptedAdopted2016/17
AmendedActualActual2016/172015/162014/15GL KeyObject Description
-052,117 54,63052,11748,726882101 Utilization Chgs from 101 Fund2290000 45,552
(100.0)%0 42,151000Utilization Chgs from 390 Fund2290000882390 0
23.6 %42,15152,11752,117 54,630Charges From Others Total 48,72645,552
23.6 %52,117 42,15154,63052,11748,72645,552Total Budget Requirements
CCReport Name: 2017_Mid_Cycle_Report
Report Description: Budget Book - Department Budget Detail wMD
06/07/2017Date:
Time: 52
Version:
Page:19:21:28

Department / Section: General Services / GS-Managed Savings101 - 229900
Department Budget Detail
%Chnge16/17 vs 17/182017/182017/18
AmendedAdoptedAdopted2016/17
AmendedActualActual2016/172015/162014/15GL KeyObject Description
-(200,000) (200,000)(200,000)00Managed Savings Allocation2299000499999 (200,000)
-(200,000) (200,000)Managed Savings Total (200,000)(200,000)00
-(200,000)(200,000) (200,000)(200,000)0Total Budget Requirements 0
CCReport Name: 2017_Mid_Cycle_Report
Report Description: Budget Book - Department Budget Detail wMD
06/07/2017Date:
Time: 53
Version:
Page:19:21:28

Department / Section: Finance / Finance-Administration101 - 230000
Department Budget Detail
%Chnge16/17 vs 17/182017/182017/18
AmendedAdoptedAdopted2016/17
AmendedActualActual2016/172015/162014/15GL KeyObject Description
12.5 %544,394612,926 608,863612,926564,720411100 Salaries - Regular2300000 447,016
(1.1) %90,25389,213 90,25389,21360,031411110 Salaries-Temp & Part Time2300000 0
-0 0033,83523,216Vacation2300000411210 0
-0 0026,27222,384Holidays & Special Days Off2300000411220 0
-0 003,9094,406Sick Leave2300000411240 0
-0 007,13113,807Family Illness Sick Leave2300000411245 0
-0 002,3233,041Bereavement Leave2300000411260 0
-0 007781,467Jury Duty2300000411280 0
-0 0017,25012,706Administrative Leave2300000411292 0
-0 0034,84823,887Vacation Payoffs2300000411410 0
-0 0041,0440Sick Leave Payoff2300000411420 0
8.0 %3,6323,924 3,9803,924(25,284)411510 Accrued Payroll2300000 2,887
10.6 %6,5367,232 7,2017,2327,197412210 Workers Compensation Ins2300000 6,198
3.4 %65,26167,531 70,48667,53154,633412220 Health Insurance2300000 38,666
26.9 %2,1682,753 2,8122,7532,610412222 Dental Insurance2300000 1,977
3.5 %3,8644,000 3,9594,0003,548412230 Life Insurance2300000 3,006
10.4 %355392 391392367412240 Unemployment Insurance2300000 367
-0136 136136135412250 Disability Insurance2300000 0
3.6 %221,437229,446 242,201229,446191,831412310 PERS Retirement2300000 155,340
10.9 %9,03710,030 9,97210,03011,596412320 Medicare OASDI2300000 8,121
(9.0)%390 42939000City Retirement Plan2300000412330 429
(20.0) %7,5006,000 7,5006,0003,862412400 Deferred Compensation2300000 2,400
-4,2004,200 4,2004,2003,500412500 Automobile/Expense Allowance2300000 4,200
-0 00330Overtime At 1.5 Rate2300000413120 0
(100.0)%0 16,517000Ptr. Comp. Model2300000419996 0
6.4 %975,5831,038,1731,038,173 1,052,383Personnel Services Total 1,046,179775,101
-165,775165,775 165,775217,263427,642421000 Professional Services2300000 142,924
-1,3001,300 1,3001,300935422100 Telephone2300000 1,112
50.0 %1,6002,400 2,4002,4002,416422120 Telephone - Cellular2300000 2,403
-0 00012Motor Pool Equipment Rental2300000423400 0
-3,200 3,2003,20000All Other Equip Maint/Repair2300000424220 3,200
-3,3003,300 3,3003,3003,410425200 Periodicals & Dues2300000 3,835
-3,0003,000 3,0003,0001,770425400 General Office Expense2300000 6,194
-500500 50050036425500 Postage2300000 356
-2,0002,000 2,0002,0001,839425600 Central Printing Charges2300000 1,314
-0 00580Outside Printing Expense2300000425610 0
-01,500 1,5001,500396425700 Software Purchase/Licensing2300000 418
-02,000 2,0002,0001,352425800 Computer Equip Purc Undr $50002300000 1,944
100.0 %1,5003,000 3,0003,000715426800 Special Department Supplies2300000 2,566
-3,5183,518 3,5183,5183,832427100 Travel & Meeting Expense2300000 9,317
-32,408 32,40832,4080975Training2300000427200 32,408
10.6 %8,1889,059 9,0209,05915,780428400 Liability Insurance2300000 12,660
2.9 %226,289284,448232,960 232,921Non-personnel Expenses Total 460,185186,036
-0 060,00000Computer System Upgrades2300000462305 0
-0 0Equipment Outlay Total 060,00000
CCReport Name: 2017_Mid_Cycle_Report
Report Description: Budget Book - Department Budget Detail wMD
06/07/2017Date:
Time: 54
Version:
Page:19:21:28

Department / Section: Finance / Finance-Administration101 - 230000
Department Budget Detail
%Chnge16/17 vs 17/182017/182017/18
AmendedAdoptedAdopted2016/17
AmendedActualActual2016/172015/162014/15GL KeyObject Description
(10.3) %2,444,0892,190,320 2,190,3202,190,3202,190,319881100 General Fund Allocation Chgs2300000 2,085,637
(6.6) %27,00025,200 27,00025,20034,872882101 Utilization Chgs from 101 Fund2300000 33,254
(10.3) %2,471,0892,215,5202,215,520 2,217,320Charges From Others Total 2,225,1922,118,892
(7.0) %(7,614,913)(7,078,037) (7,078,037)(7,078,037)(7,088,370)891100 General Fund Allocation Chgs2300000 (6,901,883)
(7.0) %(7,614,913)(7,078,037)(7,078,037) (7,078,037)Charges to Others Total (7,088,370)(6,901,883)
(8.8) %(3,591,384) (3,941,952)(3,575,413)(3,479,895)(3,356,813)(3,821,852)Total Budget Requirements
CCReport Name: 2017_Mid_Cycle_Report
Report Description: Budget Book - Department Budget Detail wMD
06/07/2017Date:
Time: 55
Version:
Page:19:21:28
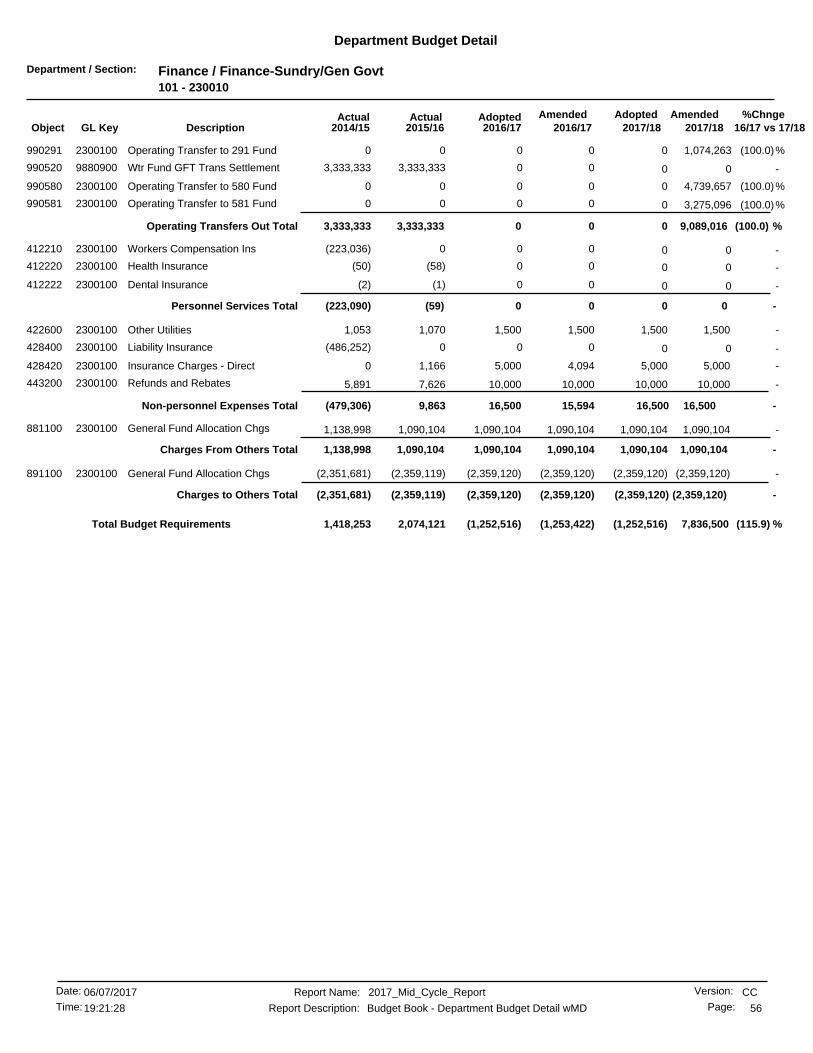
Department / Section: Finance / Finance-Sundry/Gen Govt101 - 230010
Department Budget Detail
%Chnge16/17 vs 17/182017/182017/18
AmendedAdoptedAdopted2016/17
AmendedActualActual2016/172015/162014/15GL KeyObject Description
(100.0)%0 1,074,263000Operating Transfer to 291 Fund2300100990291 0
-0 003,333,3333,333,333Wtr Fund GFT Trans Settlement9880900990520 0
(100.0)%0 4,739,657000Operating Transfer to 580 Fund2300100990580 0
(100.0)%0 3,275,096000Operating Transfer to 581 Fund2300100990581 0
(100.0) %0 9,089,016Operating Transfers Out Total 003,333,3333,333,333
-0 000(223,036)Workers Compensation Ins2300100412210 0
-0 00(58)(50)Health Insurance2300100412220 0
-0 00(1)(2)Dental Insurance2300100412222 0
-0 0Personnel Services Total 00(59)(223,090)
-1,5001,500 1,5001,5001,070422600 Other Utilities2300100 1,053
-0 000(486,252)Liability Insurance2300100428400 0
-5,0005,000 5,0004,0941,166428420 Insurance Charges - Direct2300100 0
-10,00010,000 10,00010,0007,626443200 Refunds and Rebates2300100 5,891
-16,50015,59416,500 16,500Non-personnel Expenses Total 9,863(479,306)
-1,090,1041,090,104 1,090,1041,090,1041,090,104881100 General Fund Allocation Chgs2300100 1,138,998
-1,090,104 1,090,104Charges From Others Total 1,090,1041,090,1041,090,1041,138,998
-(2,359,120)(2,359,120) (2,359,120)(2,359,120)(2,359,119)891100 General Fund Allocation Chgs2300100 (2,351,681)
-(2,359,120)(2,359,120)(2,359,120) (2,359,120)Charges to Others Total (2,359,119)(2,351,681)
(115.9) %(1,252,516) 7,836,500(1,252,516)(1,253,422)2,074,1211,418,253Total Budget Requirements
CCReport Name: 2017_Mid_Cycle_Report
Report Description: Budget Book - Department Budget Detail wMD
06/07/2017Date:
Time: 56
Version:
Page:19:21:28
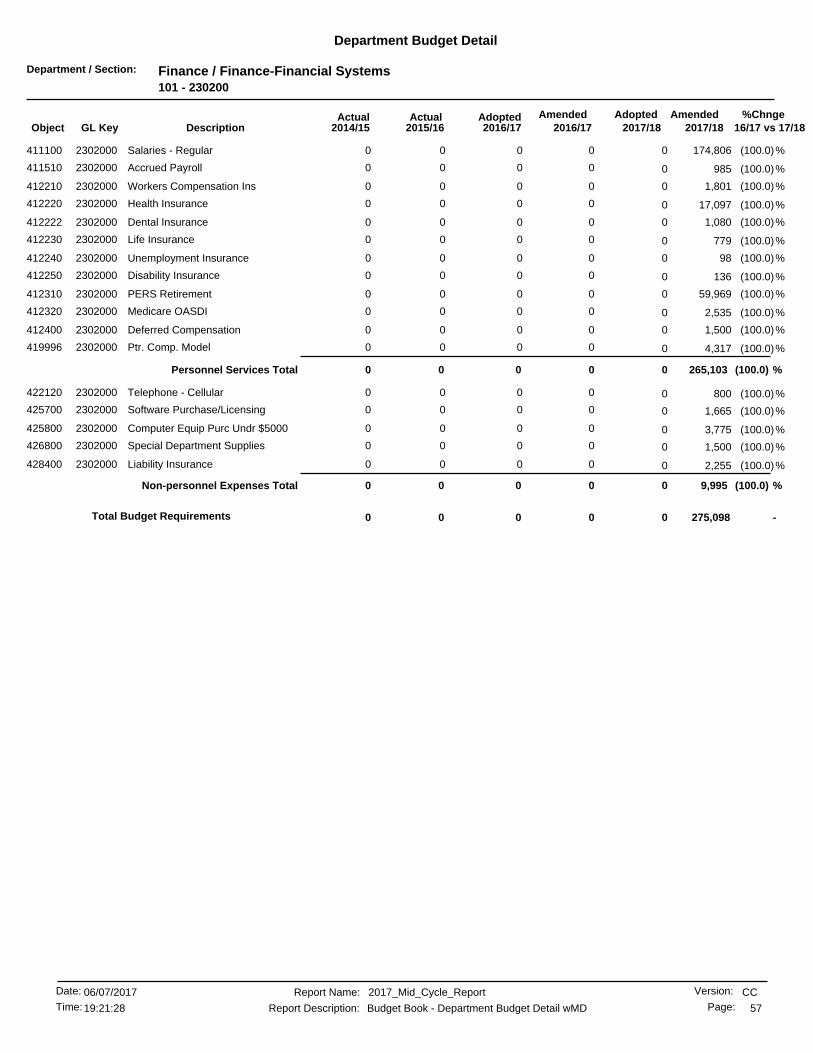
Department / Section: Finance / Finance-Financial Systems101 - 230200
Department Budget Detail
%Chnge16/17 vs 17/182017/182017/18
AmendedAdoptedAdopted2016/17
AmendedActualActual2016/172015/162014/15GL KeyObject Description
(100.0)%0 174,806000Salaries - Regular2302000411100 0
(100.0)%0 985000Accrued Payroll2302000411510 0
(100.0)%0 1,801000Workers Compensation Ins2302000412210 0
(100.0)%0 17,097000Health Insurance2302000412220 0
(100.0)%0 1,080000Dental Insurance2302000412222 0
(100.0)%0 779000Life Insurance2302000412230 0
(100.0)%0 98000Unemployment Insurance2302000412240 0
(100.0)%0 136000Disability Insurance2302000412250 0
(100.0)%0 59,969000PERS Retirement2302000412310 0
(100.0)%0 2,535000Medicare OASDI2302000412320 0
(100.0)%0 1,500000Deferred Compensation2302000412400 0
(100.0)%0 4,317000Ptr. Comp. Model2302000419996 0
(100.0) %0 265,103Personnel Services Total 0000
(100.0)%0 800000Telephone - Cellular2302000422120 0
(100.0)%0 1,665000Software Purchase/Licensing2302000425700 0
(100.0)%0 3,775000Computer Equip Purc Undr $50002302000425800 0
(100.0)%0 1,500000Special Department Supplies2302000426800 0
(100.0)%0 2,255000Liability Insurance2302000428400 0
(100.0) %0 9,995Non-personnel Expenses Total 0000
-275,0980 000Total Budget Requirements 0
CCReport Name: 2017_Mid_Cycle_Report
Report Description: Budget Book - Department Budget Detail wMD
06/07/2017Date:
Time: 57
Version:
Page:19:21:28
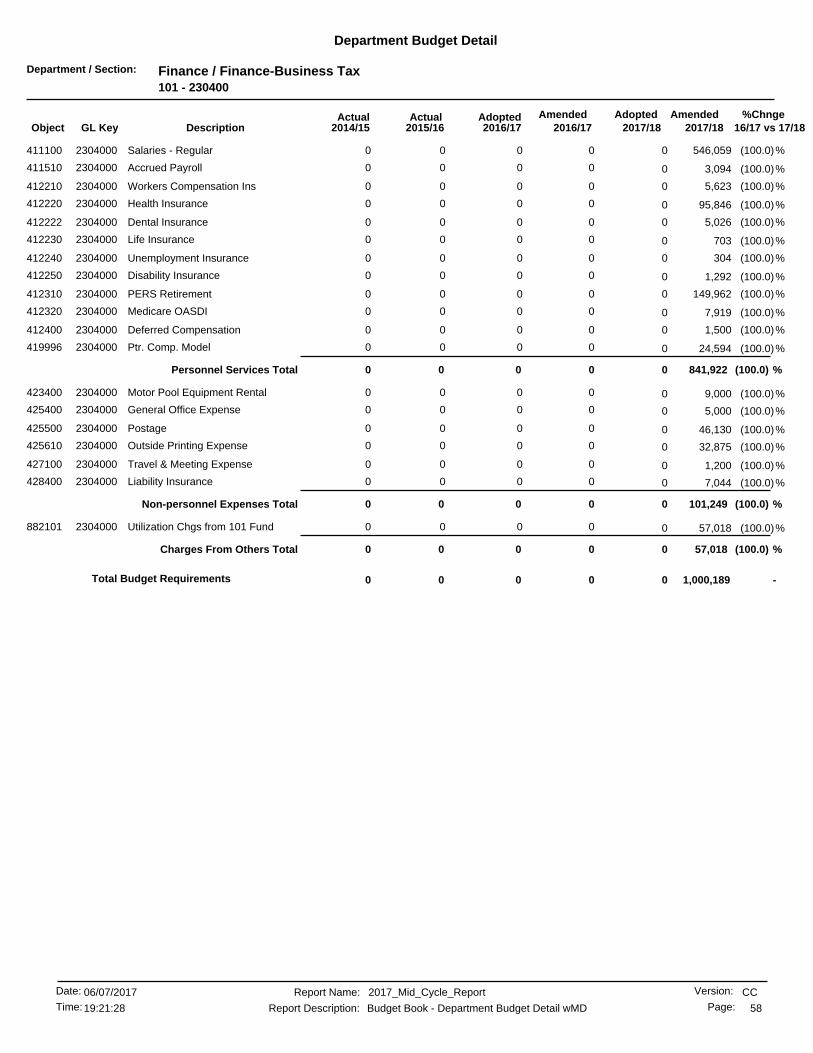
Department / Section: Finance / Finance-Business Tax101 - 230400
Department Budget Detail
%Chnge16/17 vs 17/182017/182017/18
AmendedAdoptedAdopted2016/17
AmendedActualActual2016/172015/162014/15GL KeyObject Description
(100.0)%0 546,059000Salaries - Regular2304000411100 0
(100.0)%0 3,094000Accrued Payroll2304000411510 0
(100.0)%0 5,623000Workers Compensation Ins2304000412210 0
(100.0)%0 95,846000Health Insurance2304000412220 0
(100.0)%0 5,026000Dental Insurance2304000412222 0
(100.0)%0 703000Life Insurance2304000412230 0
(100.0)%0 304000Unemployment Insurance2304000412240 0
(100.0)%0 1,292000Disability Insurance2304000412250 0
(100.0)%0 149,962000PERS Retirement2304000412310 0
(100.0)%0 7,919000Medicare OASDI2304000412320 0
(100.0)%0 1,500000Deferred Compensation2304000412400 0
(100.0)%0 24,594000Ptr. Comp. Model2304000419996 0
(100.0) %0 841,922Personnel Services Total 0000
(100.0)%0 9,000000Motor Pool Equipment Rental2304000423400 0
(100.0)%0 5,000000General Office Expense2304000425400 0
(100.0)%0 46,130000Postage2304000425500 0
(100.0)%0 32,875000Outside Printing Expense2304000425610 0
(100.0)%0 1,200000Travel & Meeting Expense2304000427100 0
(100.0)%0 7,044000Liability Insurance2304000428400 0
(100.0) %0 101,249Non-personnel Expenses Total 0000
(100.0)%0 57,018000Utilization Chgs from 101 Fund2304000882101 0
(100.0) %0 57,018Charges From Others Total 0000
-1,000,1890 000Total Budget Requirements 0
CCReport Name: 2017_Mid_Cycle_Report
Report Description: Budget Book - Department Budget Detail wMD
06/07/2017Date:
Time: 58
Version:
Page:19:21:28
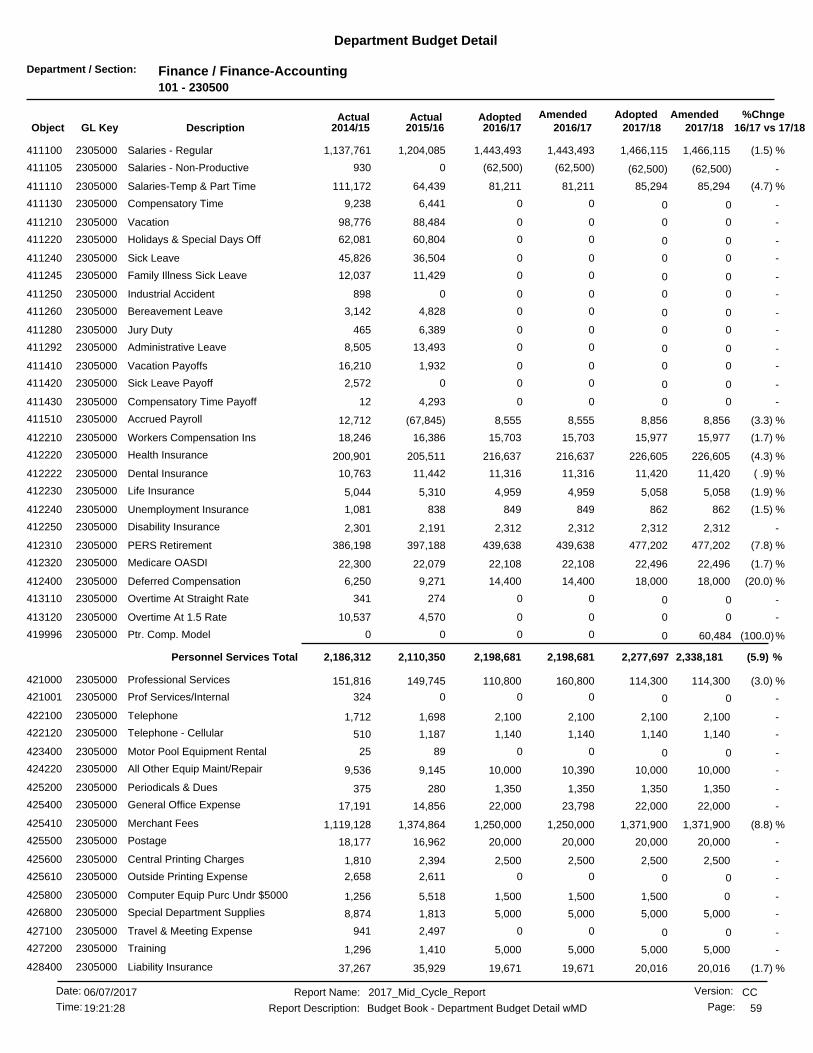
Department / Section: Finance / Finance-Accounting101 - 230500
Department Budget Detail
%Chnge16/17 vs 17/182017/182017/18
AmendedAdoptedAdopted2016/17
AmendedActualActual2016/172015/162014/15GL KeyObject Description
(1.5) %1,466,1151,443,493 1,466,1151,443,4931,204,085411100 Salaries - Regular2305000 1,137,761
-(62,500) (62,500)(62,500)0930Salaries - Non-Productive2305000411105 (62,500)
(4.7) %85,29481,211 85,29481,21164,439411110 Salaries-Temp & Part Time2305000 111,172
-0 006,4419,238Compensatory Time2305000411130 0
-0 0088,48498,776Vacation2305000411210 0
-0 0060,80462,081Holidays & Special Days Off2305000411220 0
-0 0036,50445,826Sick Leave2305000411240 0
-0 0011,42912,037Family Illness Sick Leave2305000411245 0
-0 000898Industrial Accident2305000411250 0
-0 004,8283,142Bereavement Leave2305000411260 0
-0 006,389465Jury Duty2305000411280 0
-0 0013,4938,505Administrative Leave2305000411292 0
-0 001,93216,210Vacation Payoffs2305000411410 0
-0 0002,572Sick Leave Payoff2305000411420 0
-0 004,29312Compensatory Time Payoff2305000411430 0
(3.3) %8,8568,555 8,8568,555(67,845)411510 Accrued Payroll2305000 12,712
(1.7) %15,97715,703 15,97715,70316,386412210 Workers Compensation Ins2305000 18,246
(4.3) %226,605216,637 226,605216,637205,511412220 Health Insurance2305000 200,901
( .9) %11,42011,316 11,42011,31611,442412222 Dental Insurance2305000 10,763
(1.9) %5,0584,959 5,0584,9595,310412230 Life Insurance2305000 5,044
(1.5) %862849 862849838412240 Unemployment Insurance2305000 1,081
-2,3122,312 2,3122,3122,191412250 Disability Insurance2305000 2,301
(7.8) %477,202439,638 477,202439,638397,188412310 PERS Retirement2305000 386,198
(1.7) %22,49622,108 22,49622,10822,079412320 Medicare OASDI2305000 22,300
(20.0) %18,00014,400 18,00014,4009,271412400 Deferred Compensation2305000 6,250
-0 00274341Overtime At Straight Rate2305000413110 0
-0 004,57010,537Overtime At 1.5 Rate2305000413120 0
(100.0)%0 60,484000Ptr. Comp. Model2305000419996 0
(5.9) %2,338,1812,198,6812,198,681 2,277,697Personnel Services Total 2,110,3502,186,312
(3.0) %114,300110,800 114,300160,800149,745421000 Professional Services2305000 151,816
-0 000324Prof Services/Internal2305000421001 0
-2,1002,100 2,1002,1001,698422100 Telephone2305000 1,712
-1,1401,140 1,1401,1401,187422120 Telephone - Cellular2305000 510
-0 008925Motor Pool Equipment Rental2305000423400 0
-10,00010,000 10,00010,3909,145424220 All Other Equip Maint/Repair2305000 9,536
-1,3501,350 1,3501,350280425200 Periodicals & Dues2305000 375
-22,00022,000 22,00023,79814,856425400 General Office Expense2305000 17,191
(8.8) %1,371,9001,250,000 1,371,9001,250,0001,374,864425410 Merchant Fees2305000 1,119,128
-20,00020,000 20,00020,00016,962425500 Postage2305000 18,177
-2,5002,500 2,5002,5002,394425600 Central Printing Charges2305000 1,810
-0 002,6112,658Outside Printing Expense2305000425610 0
-01,500 1,5001,5005,518425800 Computer Equip Purc Undr $50002305000 1,256
-5,0005,000 5,0005,0001,813426800 Special Department Supplies2305000 8,874
-0 002,497941Travel & Meeting Expense2305000427100 0
-5,0005,000 5,0005,0001,410427200 Training2305000 1,296
(1.7) %20,01619,671 20,01619,67135,929428400 Liability Insurance2305000 37,267
CCReport Name: 2017_Mid_Cycle_Report
Report Description: Budget Book - Department Budget Detail wMD
06/07/2017Date:
Time: 59
Version:
Page:19:21:28
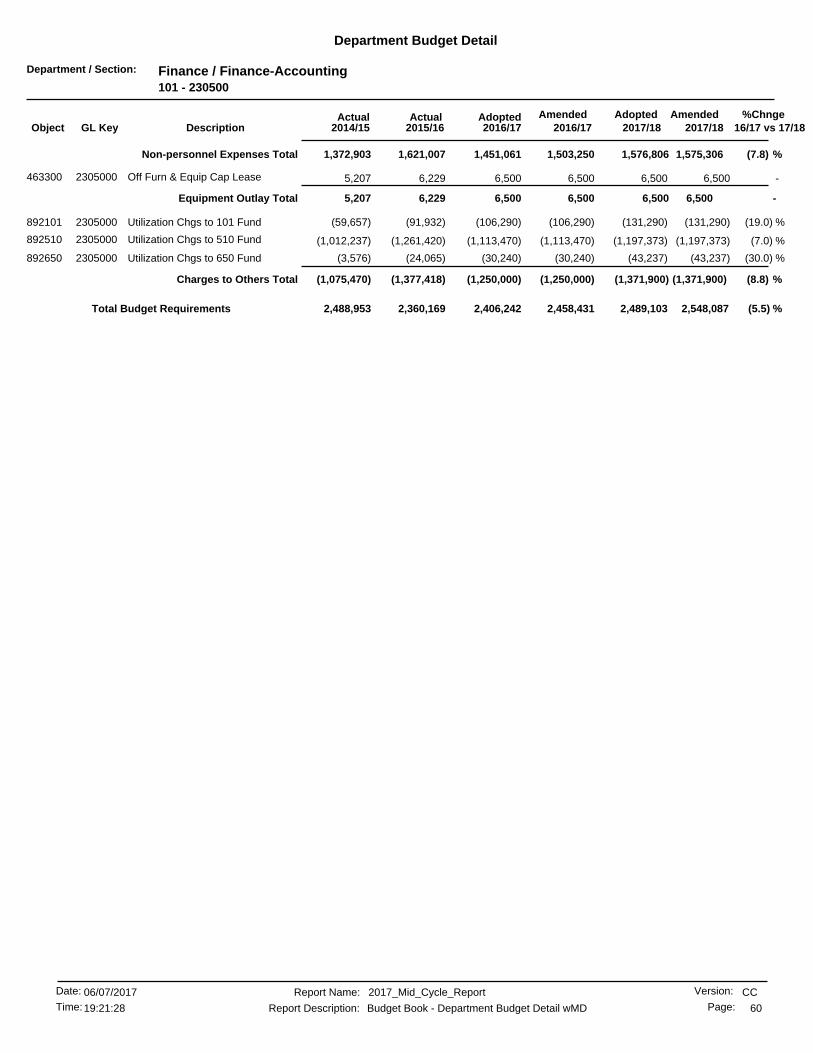
Department / Section: Finance / Finance-Accounting101 - 230500
Department Budget Detail
%Chnge16/17 vs 17/182017/182017/18
AmendedAdoptedAdopted2016/17
AmendedActualActual2016/172015/162014/15GL KeyObject Description
(7.8) %1,575,3061,503,2501,451,061 1,576,806Non-personnel Expenses Total 1,621,0071,372,903
-6,5006,500 6,5006,5006,229463300 Off Furn & Equip Cap Lease2305000 5,207
-6,5006,5006,500 6,500Equipment Outlay Total 6,2295,207
(19.0) %(131,290)(106,290) (131,290)(106,290)(91,932)892101 Utilization Chgs to 101 Fund2305000 (59,657)
(7.0) %(1,197,373)(1,113,470) (1,197,373)(1,113,470)(1,261,420)892510 Utilization Chgs to 510 Fund2305000 (1,012,237)
(30.0) %(43,237)(30,240) (43,237)(30,240)(24,065)892650 Utilization Chgs to 650 Fund2305000 (3,576)
(8.8) %(1,371,900)(1,250,000)(1,250,000) (1,371,900)Charges to Others Total (1,377,418)(1,075,470)
(5.5) %2,406,242 2,548,0872,489,1032,458,4312,360,1692,488,953Total Budget Requirements
CCReport Name: 2017_Mid_Cycle_Report
Report Description: Budget Book - Department Budget Detail wMD
06/07/2017Date:
Time: 60
Version:
Page:19:21:28
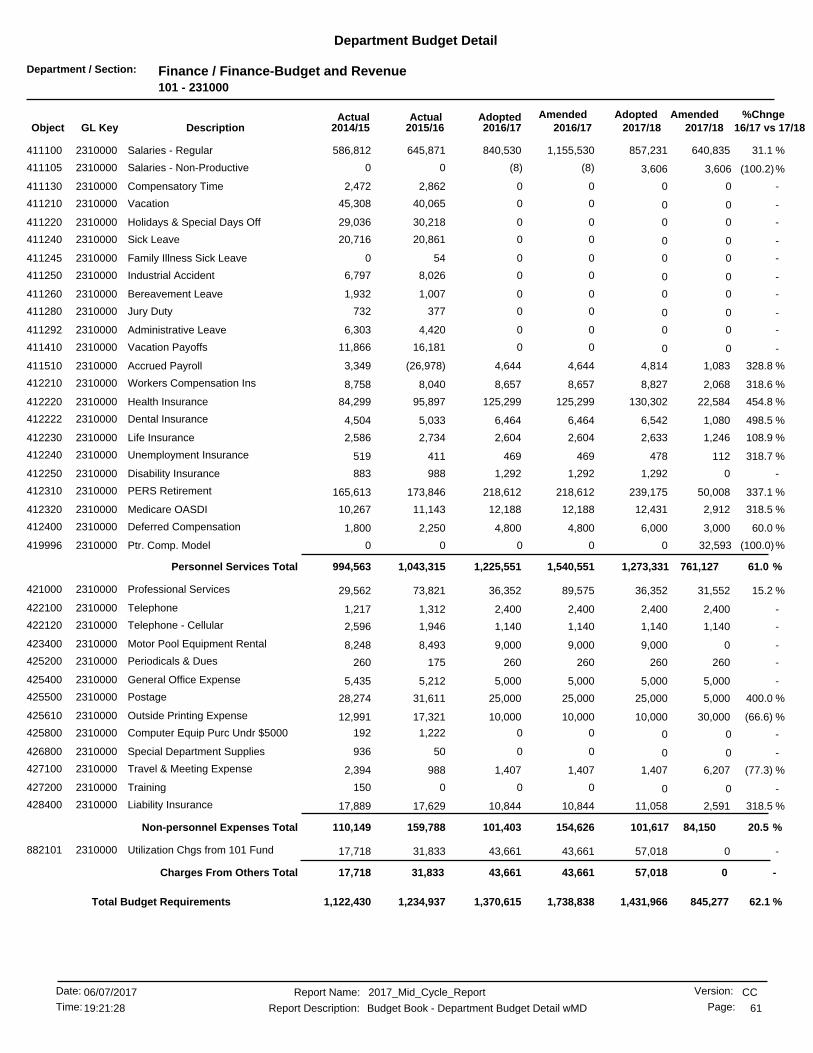
Department / Section: Finance / Finance-Budget and Revenue101 - 231000
Department Budget Detail
%Chnge16/17 vs 17/182017/182017/18
AmendedAdoptedAdopted2016/17
AmendedActualActual2016/172015/162014/15GL KeyObject Description
31.1 %640,835840,530 857,2311,155,530645,871411100 Salaries - Regular2310000 586,812
(100.2)%(8) 3,606(8)00Salaries - Non-Productive2310000411105 3,606
-0 002,8622,472Compensatory Time2310000411130 0
-0 0040,06545,308Vacation2310000411210 0
-0 0030,21829,036Holidays & Special Days Off2310000411220 0
-0 0020,86120,716Sick Leave2310000411240 0
-0 00540Family Illness Sick Leave2310000411245 0
-0 008,0266,797Industrial Accident2310000411250 0
-0 001,0071,932Bereavement Leave2310000411260 0
-0 00377732Jury Duty2310000411280 0
-0 004,4206,303Administrative Leave2310000411292 0
-0 0016,18111,866Vacation Payoffs2310000411410 0
328.8 %1,0834,644 4,8144,644(26,978)411510 Accrued Payroll2310000 3,349
318.6 %2,0688,657 8,8278,6578,040412210 Workers Compensation Ins2310000 8,758
454.8 %22,584125,299 130,302125,29995,897412220 Health Insurance2310000 84,299
498.5 %1,0806,464 6,5426,4645,033412222 Dental Insurance2310000 4,504
108.9 %1,2462,604 2,6332,6042,734412230 Life Insurance2310000 2,586
318.7 %112469 478469411412240 Unemployment Insurance2310000 519
-01,292 1,2921,292988412250 Disability Insurance2310000 883
337.1 %50,008218,612 239,175218,612173,846412310 PERS Retirement2310000 165,613
318.5 %2,91212,188 12,43112,18811,143412320 Medicare OASDI2310000 10,267
60.0 %3,0004,800 6,0004,8002,250412400 Deferred Compensation2310000 1,800
(100.0)%0 32,593000Ptr. Comp. Model2310000419996 0
61.0 %761,1271,540,5511,225,551 1,273,331Personnel Services Total 1,043,315994,563
15.2 %31,55236,352 36,35289,57573,821421000 Professional Services2310000 29,562
-2,4002,400 2,4002,4001,312422100 Telephone2310000 1,217
-1,1401,140 1,1401,1401,946422120 Telephone - Cellular2310000 2,596
-09,000 9,0009,0008,493423400 Motor Pool Equipment Rental2310000 8,248
-260260 260260175425200 Periodicals & Dues2310000 260
-5,0005,000 5,0005,0005,212425400 General Office Expense2310000 5,435
400.0 %5,00025,000 25,00025,00031,611425500 Postage2310000 28,274
(66.6) %30,00010,000 10,00010,00017,321425610 Outside Printing Expense2310000 12,991
-0 001,222192Computer Equip Purc Undr $50002310000425800 0
-0 0050936Special Department Supplies2310000426800 0
(77.3) %6,2071,407 1,4071,407988427100 Travel & Meeting Expense2310000 2,394
-0 000150Training2310000427200 0
318.5 %2,59110,844 11,05810,84417,629428400 Liability Insurance2310000 17,889
20.5 %84,150154,626101,403 101,617Non-personnel Expenses Total 159,788110,149
-043,661 57,01843,66131,833882101 Utilization Chgs from 101 Fund2310000 17,718
-43,661 0Charges From Others Total 57,01843,66131,83317,718
62.1 %1,370,615 845,2771,431,9661,738,8381,234,9371,122,430Total Budget Requirements
CCReport Name: 2017_Mid_Cycle_Report
Report Description: Budget Book - Department Budget Detail wMD
06/07/2017Date:
Time: 61
Version:
Page:19:21:28

Department / Section: Finance / Finance-Purchasing101 - 231500
Department Budget Detail
%Chnge16/17 vs 17/182017/182017/18
AmendedAdoptedAdopted2016/17
AmendedActualActual2016/172015/162014/15GL KeyObject Description
135.4 %269,355634,296 646,469544,296422,422411100 Salaries - Regular2315000 409,800
-0 001310Compensatory Time2315000411130 0
-0 0023,67324,691Vacation2315000411210 0
-0 0020,95918,167Holidays & Special Days Off2315000411220 0
-0 0012,5738,948Sick Leave2315000411240 0
-0 004164,376Family Illness Sick Leave2315000411245 0
-0 0003,682Bereavement Leave2315000411260 0
-0 002,775198Jury Duty2315000411280 0
-0 001,5652,475Administrative Leave2315000411292 0
-0 0017,07725,090Vacation Payoffs2315000411410 0
-0 0034,21618,011Sick Leave Payoff2315000411420 0
-0 00321,181Compensatory Time Payoff2315000411430 0
(3.5) %3,7223,590 3,7223,590(19,452)411510 Accrued Payroll2315000 694
133.4 %2,7996,533 6,6586,5336,702412210 Workers Compensation Ins2315000 6,291
440.6 %16,98191,814 95,96691,81453,675412220 Health Insurance2315000 54,574
140.1 %1,9084,582 4,6084,5823,087412222 Dental Insurance2315000 3,306
351.9 %5662,558 2,5942,5582,099412230 Life Insurance2315000 1,714
162.2 %135354 360354342412240 Unemployment Insurance2315000 372
500.0 %136816 816816627412250 Disability Insurance2315000 523
80.7 %101,564183,585 199,319183,585135,365412310 PERS Retirement2315000 128,644
133.2 %3,9439,198 9,3759,1987,845412320 Medicare OASDI2315000 7,548
460.0 %1,5008,400 10,5008,4003,300412400 Deferred Compensation2315000 2,400
-0 002,429870Overtime At 1.5 Rate2315000413120 0
(100.0)%0 16,000000Ptr. Comp. Model2315000419996 0
125.9 %418,609855,726945,726 980,387Personnel Services Total 731,737723,875
-051,500 51,500141,50095,375421000 Professional Services2315000 101,306
-0 00240Prof Services/Internal2315000421001 0
100.0 %1,0002,000 2,0002,0001,473422100 Telephone2315000 1,756
-2,2802,280 2,2802,2802,458422120 Telephone - Cellular2315000 4,388
100.0 %400800 80080015423400 Motor Pool Equipment Rental2315000 188
100.0%750 37575000All Other Equip Maint/Repair2315000424220 750
-560560 5605603,190425100 Advertising Expense2315000 540
8.9%1,220 1,1201,22000Periodicals & Dues2315000425200 1,220
-4,1804,180 4,1804,1804,405425400 General Office Expense2315000 8,432
-1,0001,000 1,0001,000587425500 Postage2315000 347
-2,0002,000 2,0002,0001,826425600 Central Printing Charges2315000 1,402
-0 00147147Outside Printing Expense2315000425610 0
-0165 165165990425700 Software Purchase/Licensing2315000 0
-275275 2752752,943425800 Computer Equip Purc Undr $50002315000 192
-0 0072157Special Department Supplies2315000426800 0
-0 001,8252,122Travel & Meeting Expense2315000427100 0
-250250 250250771427200 Training2315000 370
153.1 %3,2338,183 8,3418,18314,695428400 Liability Insurance2315000 12,849
350.8 %16,673165,16375,163 75,321Non-personnel Expenses Total 130,803134,202
-0255,000 255,000255,000278,503450337 Hazardous Materials Cleanup2315000 252,152
CCReport Name: 2017_Mid_Cycle_Report
Report Description: Budget Book - Department Budget Detail wMD
06/07/2017Date:
Time: 62
Version:
Page:19:21:28
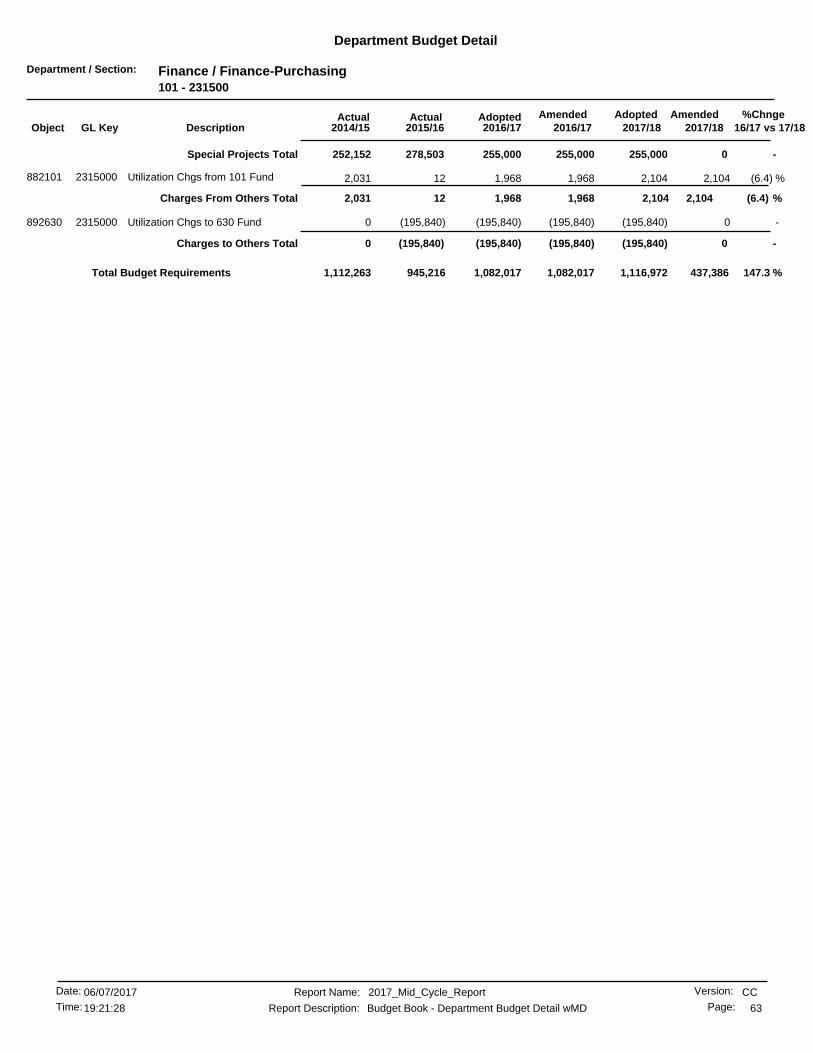
Department / Section: Finance / Finance-Purchasing101 - 231500
Department Budget Detail
%Chnge16/17 vs 17/182017/182017/18
AmendedAdoptedAdopted2016/17
AmendedActualActual2016/172015/162014/15GL KeyObject Description
-255,000 0Special Projects Total 255,000255,000278,503252,152
(6.4) %2,1041,968 2,1041,96812882101 Utilization Chgs from 101 Fund2315000 2,031
(6.4) %2,1041,9681,968 2,104Charges From Others Total 122,031
-0(195,840) (195,840)(195,840)(195,840)892630 Utilization Chgs to 630 Fund2315000 0
-(195,840) 0Charges to Others Total (195,840)(195,840)(195,840)0
147.3 %1,082,017 437,3861,116,9721,082,017945,2161,112,263Total Budget Requirements
CCReport Name: 2017_Mid_Cycle_Report
Report Description: Budget Book - Department Budget Detail wMD
06/07/2017Date:
Time: 63
Version:
Page:19:21:28

Department / Section: Finance / Finance-Debt Service101 - 237000
Department Budget Detail
%Chnge16/17 vs 17/182017/182017/18
AmendedAdoptedAdopted2016/17
AmendedActualActual2016/172015/162014/15GL KeyObject Description
-0 0002,355Professional Services2370000421000 0
-0 001,6771,413Insurance Charges - Direct2370000428420 0
-060,000 60,00060,00017,160447010 Annual Bond Expense2370000 64,821
-60,000 0Non-personnel Expenses Total 60,00060,00018,83768,589
-03,699,573 4,085,9763,699,57334,353,471481000 Principal2370000 34,037,772
-09,920,000 11,030,0009,920,0008,895,000481015 L/T Bond Debt Principal2370000 7,950,000
-0190,000 195,000190,000179,696481018 Bond Cost of Issuance2370000 172,476
-05,403,587 4,945,7705,403,5875,626,103482000 Interest2370000 5,940,258
-19,213,160 0Debt Service Total 20,256,74619,213,16049,054,27048,100,507
-012,823,150 12,784,04012,823,15012,692,560882390 Utilization Chgs from 390 Fund2370000 12,690,369
-0824,706 824,706824,706717,895882570 Utilization Chgs from 570 Fund2370000 0
-13,647,856 0Charges From Others Total 13,608,74613,647,85613,410,45612,690,369
-0(32,817,290) (33,739,616)(32,817,290)(31,716,472)892101 Utilization Chgs to 101 Fund2370000 (30,162,660)
-0(38,226) (38,226)(38,226)(38,226)892240 Utilization Chgs to 240 Fund2370000 (38,226)
-(32,855,516) 0Charges to Others Total (33,777,842)(32,855,516)(31,754,698)(30,200,886)
-65,500 0147,65065,50030,728,86430,658,580Total Budget Requirements
125.4 %065,500 147,65065,50030,728,864Total Budget Requirements 30,658,580
CCReport Name: 2017_Mid_Cycle_Report
Report Description: Budget Book - Department Budget Detail wMD
06/07/2017Date:
Time: 64
Version:
Page:19:21:28
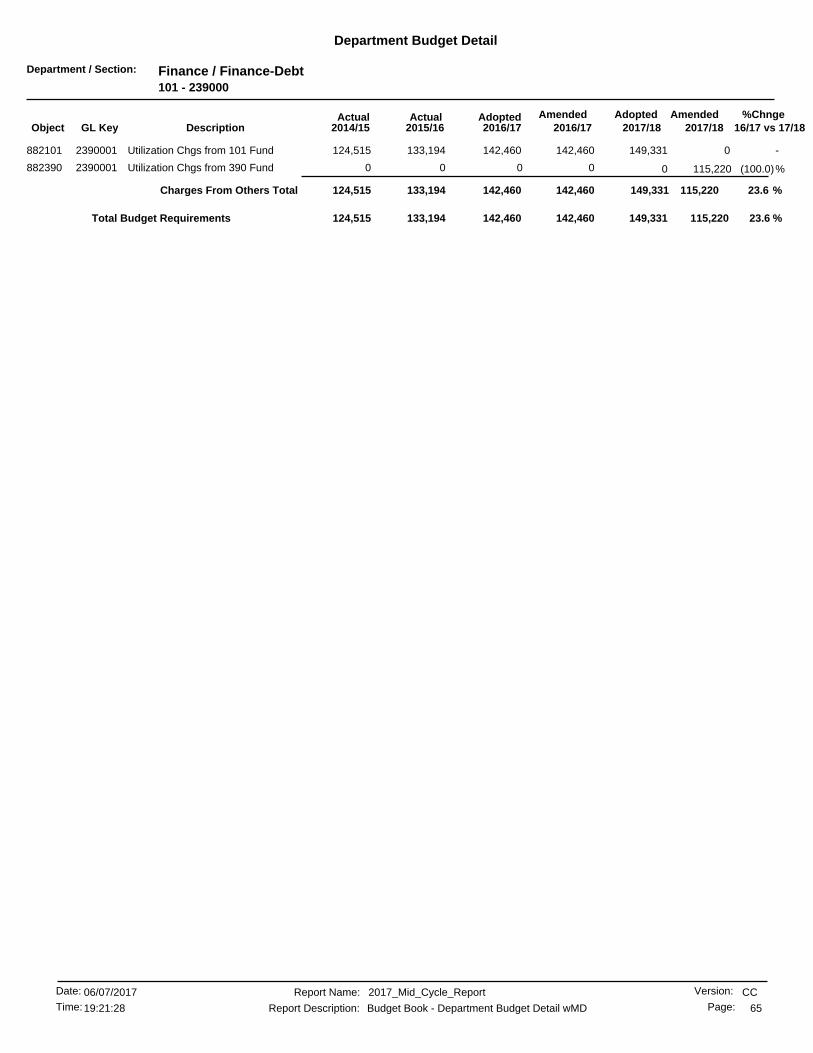
Department / Section: Finance / Finance-Debt101 - 239000
Department Budget Detail
%Chnge16/17 vs 17/182017/182017/18
AmendedAdoptedAdopted2016/17
AmendedActualActual2016/172015/162014/15GL KeyObject Description
-0142,460 149,331142,460133,194882101 Utilization Chgs from 101 Fund2390001 124,515
(100.0)%0 115,220000Utilization Chgs from 390 Fund2390001882390 0
23.6 %115,220142,460142,460 149,331Charges From Others Total 133,194124,515
23.6 %142,460 115,220149,331142,460133,194124,515Total Budget Requirements
CCReport Name: 2017_Mid_Cycle_Report
Report Description: Budget Book - Department Budget Detail wMD
06/07/2017Date:
Time: 65
Version:
Page:19:21:28

Department / Section: Finance / Finance-Managed Savings101 - 239900
Department Budget Detail
%Chnge16/17 vs 17/182017/182017/18
AmendedAdoptedAdopted2016/17
AmendedActualActual2016/172015/162014/15GL KeyObject Description
-(125,000) (125,000)(125,000)00Managed Savings Allocation2399000499999 (125,000)
-(125,000) (125,000)Managed Savings Total (125,000)(125,000)00
-(125,000)(125,000) (125,000)(125,000)0Total Budget Requirements 0
CCReport Name: 2017_Mid_Cycle_Report
Report Description: Budget Book - Department Budget Detail wMD
06/07/2017Date:
Time: 66
Version:
Page:19:21:28

Department / Section: Innovation and Technology / IT-Administration101 - 240000
Department Budget Detail
%Chnge16/17 vs 17/182017/182017/18
AmendedAdoptedAdopted2016/17
AmendedActualActual2016/172015/162014/15GL KeyObject Description
( .2) %608,923607,618 608,923666,4421,386,531411100 Salaries - Regular2400000 793,186
-0 00094Compensatory Time2400000411130 0
-0 0068,60548,937Vacation2400000411210 0
-0 0065,63736,530Holidays & Special Days Off2400000411220 0
-0 0049,64422,299Sick Leave2400000411240 0
-0 007591,257Family Illness Sick Leave2400000411245 0
-0 003,9280Bereavement Leave2400000411260 0
-0 000966Jury Duty2400000411280 0
-0 0033,68511,358Administrative Leave2400000411292 0
-0 0016,21916,404Vacation Payoffs2400000411410 0
-0 0034,5885,804Sick Leave Payoff2400000411420 0
-0 00802160Compensatory Time Payoff2400000411430 0
(2.1) %3,4313,358 3,4313,697(69,884)411510 Accrued Payroll2400000 40,743
( .2) %7,1257,109 7,1257,79727,436412210 Workers Compensation Ins2400000 13,993
(4.9) %65,99862,734 65,99869,357159,459412220 Health Insurance2400000 97,427
(1.8) %2,0562,017 2,0562,5576,251412222 Dental Insurance2400000 4,259
( .2) %3,7753,767 3,7754,1329,088412230 Life Insurance2400000 3,997
( .2) %340339 340372969412240 Unemployment Insurance2400000 600
-0 00156355Disability Insurance2400000412250 0
(6.5) %194,902182,136 194,902201,816392,621412310 PERS Retirement2400000 233,787
( .2) %8,8298,810 8,8299,66324,290412320 Medicare OASDI2400000 13,878
(20.0) %7,5006,000 7,5007,20010,950412400 Deferred Compensation2400000 3,875
-3,0003,000 3,0003,0004,375412500 Automobile/Expense Allowance2400000 4,200
-4,0004,000 4,0004,0004,526413120 Overtime At 1.5 Rate2400000 1,549
(100.0)%0 15,234000Ptr. Comp. Model2400000419996 0
(3.6) %925,113980,033890,888 909,879Personnel Services Total 2,230,6431,355,670
1500.0 %2,00032,000 2,00061,72383,205421000 Professional Services2400000 81,645
-00 01,1764,136421000 Security Audit9837000 3,840
-0 0000SPL Project9837400421000 0
-00 09,92380,076421000 Seibel-Perficient Upgrade9882800 0
-0 00011,590SmartRiverside - CPUC Grant9883300421000 0
-0 00065Prof Services/Internal2400000421001 0
730.0 %1,52312,642 1,52312,6424,051,378421202 Info Systems Outsourcing2400000 4,845,865
-00 07,013101,138421215 IT-Internet Service Provider2400000 0
-20,50020,500 20,50020,50010,324422100 Telephone2400000 10,342
-0 0022,294(3,663)Telephone Outside Comm Lines2400000422110 0
-5,0005,000 5,0005,00047,281422120 Telephone - Cellular2400000 47,709
-0 0007State Energy Tax2400000422202 0
-0 000261Public Benefits Charge2400000422203 0
-1,3201,320 1,3201,3207,480423200 Land and Building Rental2400000 12,045
(2.9) %8,4238,178 8,4238,1783,888423400 Motor Pool Equipment Rental2400000 11,218
-0 0002,000Maint/Repair of Bldgs & Improv2400000424130 0
-30,00030,000 30,00030,00016,440424220 All Other Equip Maint/Repair2400000 30,282
-0 0002,472Central Garage Charges2400000424230 0
-00 037,9602,314,543424310 Software Maintenance/Support2400000 2,701,593
(3.1) %630610 630610501425200 Periodicals & Dues2400000 605
CCReport Name: 2017_Mid_Cycle_Report
Report Description: Budget Book - Department Budget Detail wMD
06/07/2017Date:
Time: 67
Version:
Page:19:21:28
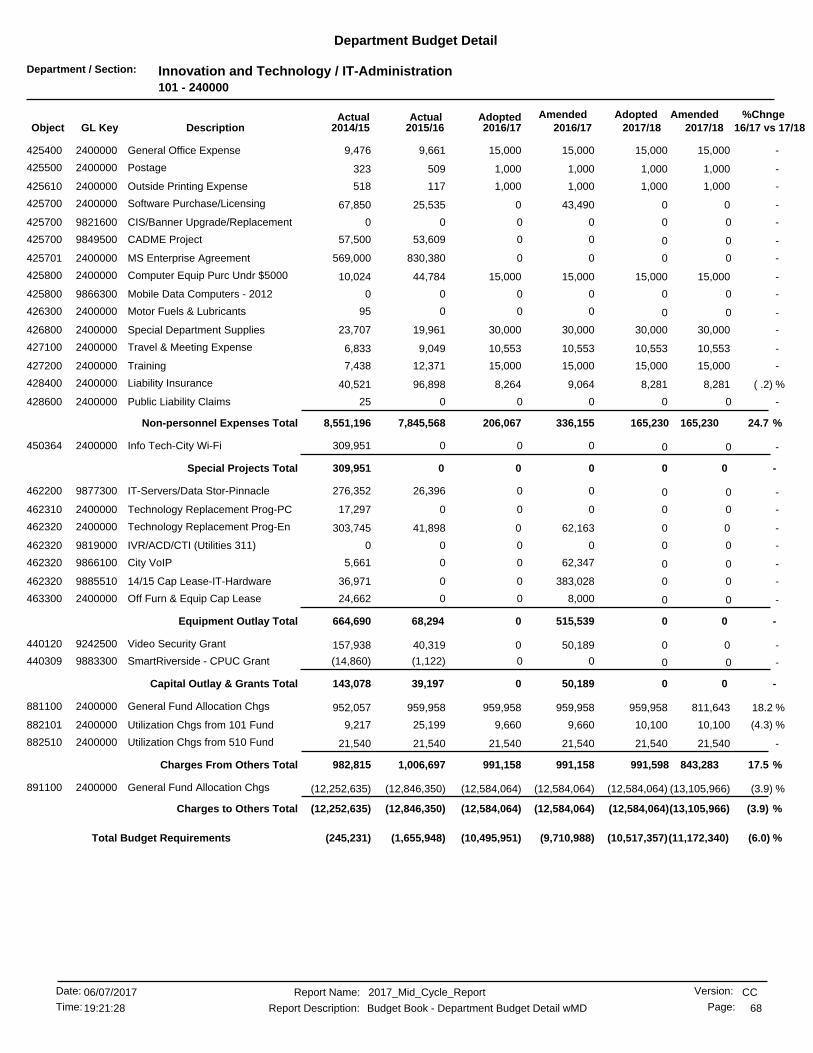
Department / Section: Innovation and Technology / IT-Administration101 - 240000
Department Budget Detail
%Chnge16/17 vs 17/182017/182017/18
AmendedAdoptedAdopted2016/17
AmendedActualActual2016/172015/162014/15GL KeyObject Description
-15,00015,000 15,00015,0009,661425400 General Office Expense2400000 9,476
-1,0001,000 1,0001,000509425500 Postage2400000 323
-1,0001,000 1,0001,000117425610 Outside Printing Expense2400000 518
-00 043,49025,535425700 Software Purchase/Licensing2400000 67,850
-0 0000CIS/Banner Upgrade/Replacement9821600425700 0
-0 0053,60957,500CADME Project9849500425700 0
-0 00830,380569,000MS Enterprise Agreement2400000425701 0
-15,00015,000 15,00015,00044,784425800 Computer Equip Purc Undr $50002400000 10,024
-0 0000Mobile Data Computers - 20129866300425800 0
-0 00095Motor Fuels & Lubricants2400000426300 0
-30,00030,000 30,00030,00019,961426800 Special Department Supplies2400000 23,707
-10,55310,553 10,55310,5539,049427100 Travel & Meeting Expense2400000 6,833
-15,00015,000 15,00015,00012,371427200 Training2400000 7,438
( .2) %8,2818,264 8,2819,06496,898428400 Liability Insurance2400000 40,521
-0 00025Public Liability Claims2400000428600 0
24.7 %165,230336,155206,067 165,230Non-personnel Expenses Total 7,845,5688,551,196
-0 000309,951Info Tech-City Wi-Fi2400000450364 0
-0 0Special Projects Total 000309,951
-0 0026,396276,352IT-Servers/Data Stor-Pinnacle9877300462200 0
-0 00017,297Technology Replacement Prog-PC2400000462310 0
-00 062,16341,898462320 Technology Replacement Prog-En2400000 303,745
-0 0000IVR/ACD/CTI (Utilities 311)9819000462320 0
-0 062,34705,661City VoIP9866100462320 0
-0 0383,028036,97114/15 Cap Lease-IT-Hardware9885510462320 0
-0 08,000024,662Off Furn & Equip Cap Lease2400000463300 0
-0 0Equipment Outlay Total 0515,53968,294664,690
-00 050,18940,319440120 Video Security Grant9242500 157,938
-0 00(1,122)(14,860)SmartRiverside - CPUC Grant9883300440309 0
-0 0Capital Outlay & Grants Total 050,18939,197143,078
18.2 %811,643959,958 959,958959,958959,958881100 General Fund Allocation Chgs2400000 952,057
(4.3) %10,1009,660 10,1009,66025,199882101 Utilization Chgs from 101 Fund2400000 9,217
-21,54021,540 21,54021,54021,540882510 Utilization Chgs from 510 Fund2400000 21,540
17.5 %843,283991,158991,158 991,598Charges From Others Total 1,006,697982,815
(3.9) %(13,105,966)(12,584,064) (12,584,064)(12,584,064)(12,846,350)891100 General Fund Allocation Chgs2400000 (12,252,635)
(3.9) %(13,105,966)(12,584,064)(12,584,064) (12,584,064)Charges to Others Total (12,846,350)(12,252,635)
(6.0) %(10,495,951) (11,172,340)(10,517,357)(9,710,988)(1,655,948)(245,231)Total Budget Requirements
CCReport Name: 2017_Mid_Cycle_Report
Report Description: Budget Book - Department Budget Detail wMD
06/07/2017Date:
Time: 68
Version:
Page:19:21:28
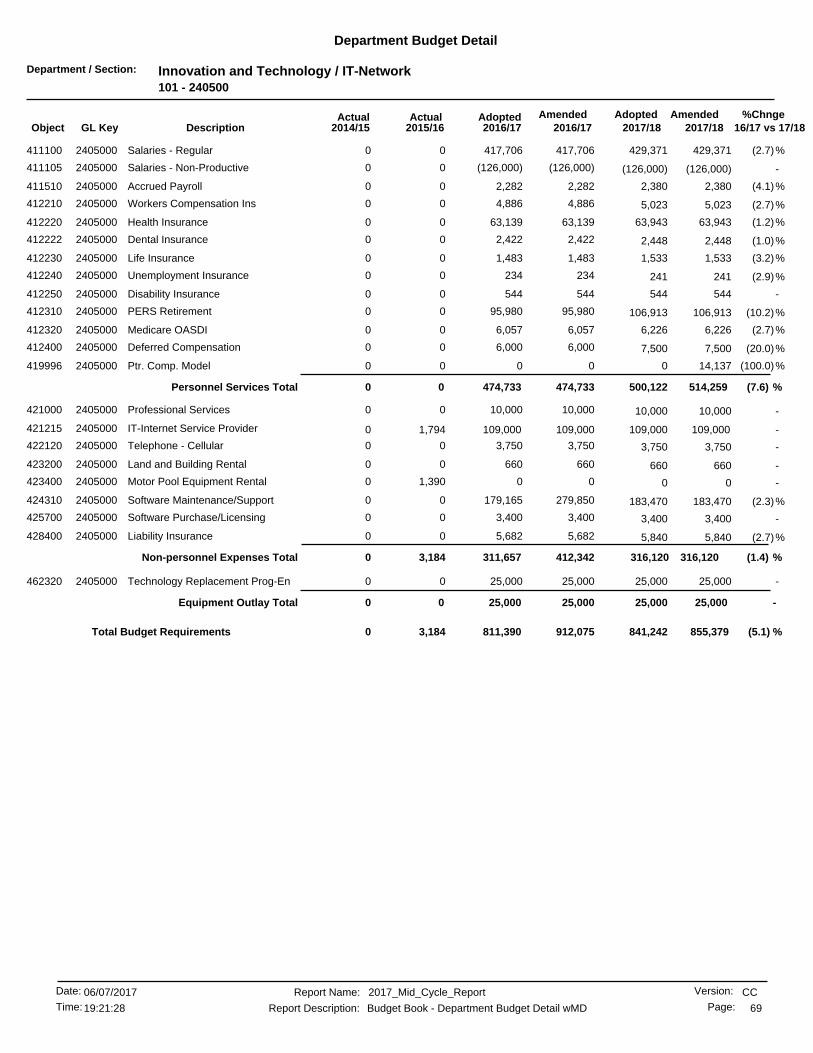
Department / Section: Innovation and Technology / IT-Network101 - 240500
Department Budget Detail
%Chnge16/17 vs 17/182017/182017/18
AmendedAdoptedAdopted2016/17
AmendedActualActual2016/172015/162014/15GL KeyObject Description
(2.7)%417,706 429,371417,70600Salaries - Regular2405000411100 429,371
-(126,000) (126,000)(126,000)00Salaries - Non-Productive2405000411105 (126,000)
(4.1)%2,282 2,3802,28200Accrued Payroll2405000411510 2,380
(2.7)%4,886 5,0234,88600Workers Compensation Ins2405000412210 5,023
(1.2)%63,139 63,94363,13900Health Insurance2405000412220 63,943
(1.0)%2,422 2,4482,42200Dental Insurance2405000412222 2,448
(3.2)%1,483 1,5331,48300Life Insurance2405000412230 1,533
(2.9)%234 24123400Unemployment Insurance2405000412240 241
-544 54454400Disability Insurance2405000412250 544
(10.2)%95,980 106,91395,98000PERS Retirement2405000412310 106,913
(2.7)%6,057 6,2266,05700Medicare OASDI2405000412320 6,226
(20.0)%6,000 7,5006,00000Deferred Compensation2405000412400 7,500
(100.0)%0 14,137000Ptr. Comp. Model2405000419996 0
(7.6) %474,733 514,259Personnel Services Total 500,122474,73300
-10,000 10,00010,00000Professional Services2405000421000 10,000
-109,000109,000 109,000109,0001,794421215 IT-Internet Service Provider2405000 0
-3,750 3,7503,75000Telephone - Cellular2405000422120 3,750
-660 66066000Land and Building Rental2405000423200 660
-0 001,3900Motor Pool Equipment Rental2405000423400 0
(2.3)%179,165 183,470279,85000Software Maintenance/Support2405000424310 183,470
-3,400 3,4003,40000Software Purchase/Licensing2405000425700 3,400
(2.7)%5,682 5,8405,68200Liability Insurance2405000428400 5,840
(1.4) %316,120412,342311,657 316,120Non-personnel Expenses Total 3,1840
-25,000 25,00025,00000Technology Replacement Prog-En2405000462320 25,000
-25,000 25,000Equipment Outlay Total 25,00025,00000
(5.1) %811,390 855,379841,242912,0753,1840Total Budget Requirements
CCReport Name: 2017_Mid_Cycle_Report
Report Description: Budget Book - Department Budget Detail wMD
06/07/2017Date:
Time: 69
Version:
Page:19:21:28
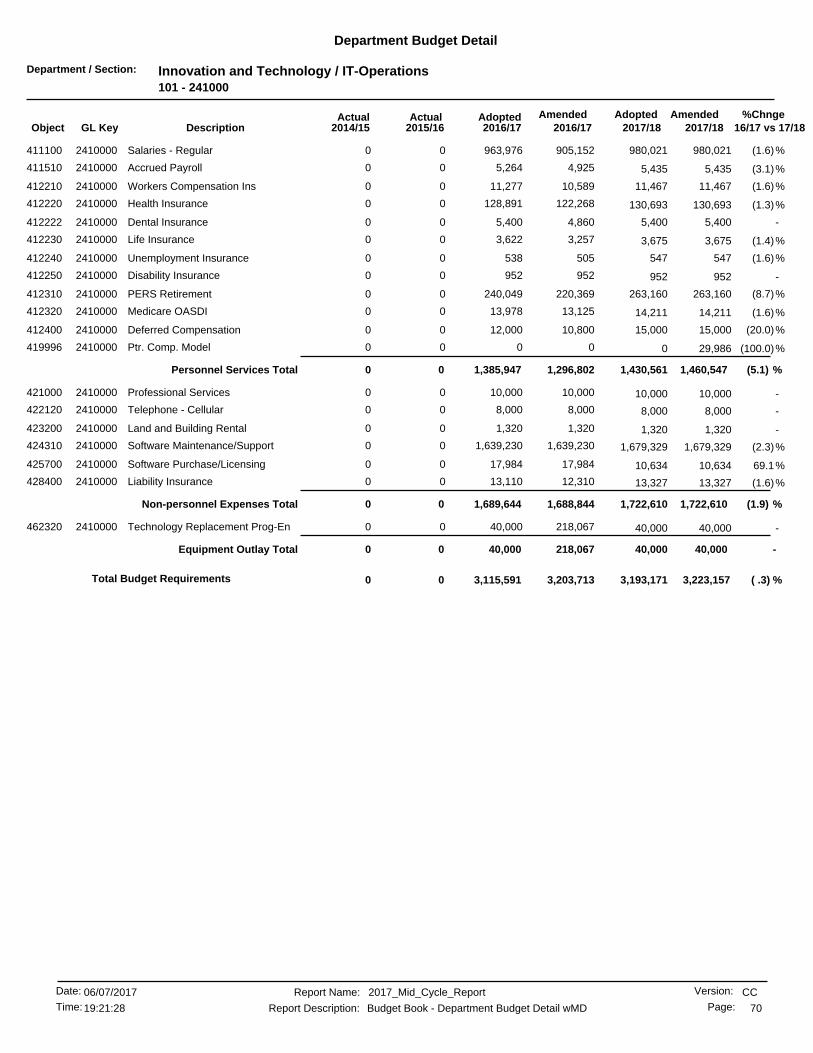
Department / Section: Innovation and Technology / IT-Operations101 - 241000
Department Budget Detail
%Chnge16/17 vs 17/182017/182017/18
AmendedAdoptedAdopted2016/17
AmendedActualActual2016/172015/162014/15GL KeyObject Description
(1.6)%963,976 980,021905,15200Salaries - Regular2410000411100 980,021
(3.1)%5,264 5,4354,92500Accrued Payroll2410000411510 5,435
(1.6)%11,277 11,46710,58900Workers Compensation Ins2410000412210 11,467
(1.3)%128,891 130,693122,26800Health Insurance2410000412220 130,693
-5,400 5,4004,86000Dental Insurance2410000412222 5,400
(1.4)%3,622 3,6753,25700Life Insurance2410000412230 3,675
(1.6)%538 54750500Unemployment Insurance2410000412240 547
-952 95295200Disability Insurance2410000412250 952
(8.7)%240,049 263,160220,36900PERS Retirement2410000412310 263,160
(1.6)%13,978 14,21113,12500Medicare OASDI2410000412320 14,211
(20.0)%12,000 15,00010,80000Deferred Compensation2410000412400 15,000
(100.0)%0 29,986000Ptr. Comp. Model2410000419996 0
(5.1) %1,385,947 1,460,547Personnel Services Total 1,430,5611,296,80200
-10,000 10,00010,00000Professional Services2410000421000 10,000
-8,000 8,0008,00000Telephone - Cellular2410000422120 8,000
-1,320 1,3201,32000Land and Building Rental2410000423200 1,320
(2.3)%1,639,230 1,679,3291,639,23000Software Maintenance/Support2410000424310 1,679,329
69.1%17,984 10,63417,98400Software Purchase/Licensing2410000425700 10,634
(1.6)%13,110 13,32712,31000Liability Insurance2410000428400 13,327
(1.9) %1,689,644 1,722,610Non-personnel Expenses Total 1,722,6101,688,84400
-40,000 40,000218,06700Technology Replacement Prog-En2410000462320 40,000
-40,000 40,000Equipment Outlay Total 40,000218,06700
( .3) %3,223,1573,115,591 3,193,1713,203,7130Total Budget Requirements 0
CCReport Name: 2017_Mid_Cycle_Report
Report Description: Budget Book - Department Budget Detail wMD
06/07/2017Date:
Time: 70
Version:
Page:19:21:28
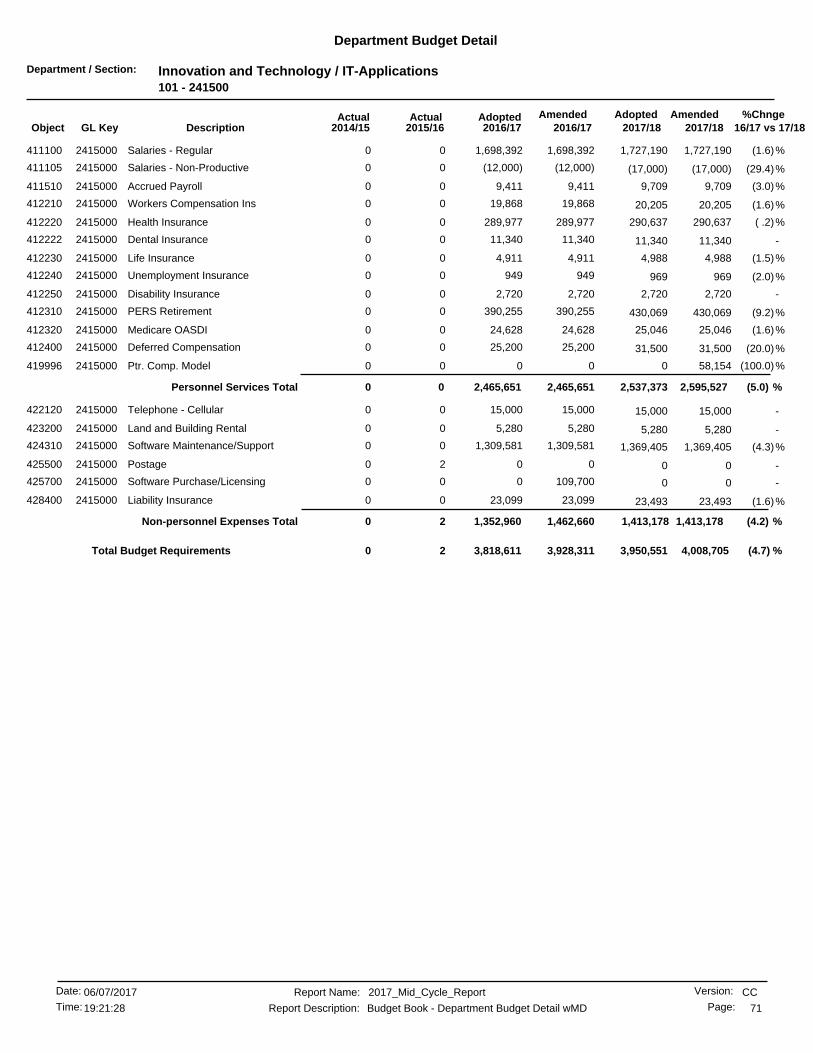
Department / Section: Innovation and Technology / IT-Applications101 - 241500
Department Budget Detail
%Chnge16/17 vs 17/182017/182017/18
AmendedAdoptedAdopted2016/17
AmendedActualActual2016/172015/162014/15GL KeyObject Description
(1.6)%1,698,392 1,727,1901,698,39200Salaries - Regular2415000411100 1,727,190
(29.4)%(12,000) (17,000)(12,000)00Salaries - Non-Productive2415000411105 (17,000)
(3.0)%9,411 9,7099,41100Accrued Payroll2415000411510 9,709
(1.6)%19,868 20,20519,86800Workers Compensation Ins2415000412210 20,205
( .2)%289,977 290,637289,97700Health Insurance2415000412220 290,637
-11,340 11,34011,34000Dental Insurance2415000412222 11,340
(1.5)%4,911 4,9884,91100Life Insurance2415000412230 4,988
(2.0)%949 96994900Unemployment Insurance2415000412240 969
-2,720 2,7202,72000Disability Insurance2415000412250 2,720
(9.2)%390,255 430,069390,25500PERS Retirement2415000412310 430,069
(1.6)%24,628 25,04624,62800Medicare OASDI2415000412320 25,046
(20.0)%25,200 31,50025,20000Deferred Compensation2415000412400 31,500
(100.0)%0 58,154000Ptr. Comp. Model2415000419996 0
(5.0) %2,465,651 2,595,527Personnel Services Total 2,537,3732,465,65100
-15,000 15,00015,00000Telephone - Cellular2415000422120 15,000
-5,280 5,2805,28000Land and Building Rental2415000423200 5,280
(4.3)%1,309,581 1,369,4051,309,58100Software Maintenance/Support2415000424310 1,369,405
-0 0020Postage2415000425500 0
-0 0109,70000Software Purchase/Licensing2415000425700 0
(1.6)%23,099 23,49323,09900Liability Insurance2415000428400 23,493
(4.2) %1,413,1781,462,6601,352,960 1,413,178Non-personnel Expenses Total 20
(4.7) %3,818,611 4,008,7053,950,5513,928,31120Total Budget Requirements
CCReport Name: 2017_Mid_Cycle_Report
Report Description: Budget Book - Department Budget Detail wMD
06/07/2017Date:
Time: 71
Version:
Page:19:21:28

Department / Section: Innovation and Technology / IT-Client Srvc.101 - 242000
Department Budget Detail
%Chnge16/17 vs 17/182017/182017/18
AmendedAdoptedAdopted2016/17
AmendedActualActual2016/172015/162014/15GL KeyObject Description
(2.3)%632,814 648,202632,81400Salaries - Regular2420000411100 648,202
-(70,000) (70,000)(70,000)00Salaries - Non-Productive2420000411105 (70,000)
(3.6)%3,703 3,8423,70300Accrued Payroll2420000411510 3,842
(2.3)%7,404 7,5817,40400Workers Compensation Ins2420000412210 7,581
-153,547 153,547153,54700Health Insurance2420000412220 153,547
-5,940 5,9405,94000Dental Insurance2420000412222 5,940
(3.0)%1,976 2,0381,97600Life Insurance2420000412230 2,038
(2.4)%353 36235300Unemployment Insurance2420000412240 362
-1,496 1,4961,49600Disability Insurance2420000412250 1,496
(9.9)%145,404 161,403145,40400PERS Retirement2420000412310 161,403
(2.3)%9,175 9,3999,17500Medicare OASDI2420000412320 9,399
(20.0)%14,400 18,00014,40000Deferred Compensation2420000412400 18,000
(100.0)%0 24,366000Ptr. Comp. Model2420000419996 0
(6.2) %906,212 966,176Personnel Services Total 941,810906,21200
-4,500 4,5004,50000Telephone - Cellular2420000422120 4,500
-0 0040Motor Pool Equipment Rental2420000423400 0
(5.8)%800 85080000Software Maintenance/Support2420000424310 850
-10,000 10,00010,00000Computer Equip Purc Undr $50002420000425800 10,000
(2.4)%8,604 8,8178,60400Liability Insurance2420000428400 8,817
(1.0) %24,16723,90423,904 24,167Non-personnel Expenses Total 40
(6.0) %930,116 990,343965,977930,11640Total Budget Requirements
CCReport Name: 2017_Mid_Cycle_Report
Report Description: Budget Book - Department Budget Detail wMD
06/07/2017Date:
Time: 72
Version:
Page:19:21:28

Department / Section: Innovation and Technology / IT-Cybersecurity101 - 242500
Department Budget Detail
%Chnge16/17 vs 17/182017/182017/18
AmendedAdoptedAdopted2016/17
AmendedActualActual2016/172015/162014/15GL KeyObject Description
(4.7)%127,975 134,374289,47500Salaries - Regular2425000411100 134,374
(6.0)%678 72267800Accrued Payroll2425000411510 722
(4.7)%1,497 1,5721,49700Workers Compensation Ins2425000412210 1,572
(4.3)%14,437 15,09714,43700Health Insurance2425000412220 15,097
-540 54054000Dental Insurance2425000412222 540
(4.8)%793 83379300Life Insurance2425000412230 833
(5.3)%71 757100Unemployment Insurance2425000412240 75
(12.1)%29,406 33,45929,40600PERS Retirement2425000412310 33,459
(4.7)%1,856 1,9481,85600Medicare OASDI2425000412320 1,948
(20.0)%1,200 1,5001,20000Deferred Compensation2425000412400 1,500
(100.0)%0 4,142000Ptr. Comp. Model2425000419996 0
(8.1) %178,453 194,262Personnel Services Total 190,120339,95300
-140,000 0140,00000Professional Services2425000421000 0
-800 80080000Telephone - Cellular2425000422120 800
(19.9) %42,66334,162 42,66334,1629,107424310 Software Maintenance/Support2425000 0
(9.0)%24,532 26,985235,38000Software Purchase/Licensing2425000425700 26,985
(4.7)%1,740 1,8271,74000Liability Insurance2425000428400 1,827
178.4 %72,275412,082201,234 72,275Non-personnel Expenses Total 9,1070
42.4 %379,687 266,537262,395752,0359,1070Total Budget Requirements
CCReport Name: 2017_Mid_Cycle_Report
Report Description: Budget Book - Department Budget Detail wMD
06/07/2017Date:
Time: 73
Version:
Page:19:21:28

Department / Section: Innovation and Technology / IT-GIS101 - 243000
Department Budget Detail
%Chnge16/17 vs 17/182017/182017/18
AmendedAdoptedAdopted2016/17
AmendedActualActual2016/172015/162014/15GL KeyObject Description
(2.9)%281,270 289,819281,27000Salaries - Regular2430000411100 289,819
-(125,000) (125,000)(125,000)00Salaries - Non-Productive2430000411105 (125,000)
(4.2)%1,596 1,6661,59600Accrued Payroll2430000411510 1,666
(2.9)%3,291 3,3903,29100Workers Compensation Ins2430000412210 3,390
(1.1)%55,768 56,42855,76800Health Insurance2430000412220 56,428
-2,160 2,1602,16000Dental Insurance2430000412222 2,160
(3.5)%1,128 1,1691,12800Life Insurance2430000412230 1,169
(3.0)%157 16215700Unemployment Insurance2430000412240 162
-408 40840800Disability Insurance2430000412250 408
(10.4)%64,630 72,16564,63000PERS Retirement2430000412310 72,165
(2.9)%4,078 4,2024,07800Medicare OASDI2430000412320 4,202
(1.9)%705 71970500City Retirement Plan2430000412330 719
(20.0)%4,800 6,0004,80000Deferred Compensation2430000412400 6,000
(100.0)%0 10,093000Ptr. Comp. Model2430000419996 0
(8.7) %294,991 323,381Personnel Services Total 313,288294,99100
-30,000 30,00030,00000Professional Services2430000421000 30,000
-2,500 2,5002,50000Telephone - Cellular2430000422120 2,500
-660 66066000Land and Building Rental2430000423200 660
(14.4)%369,994 432,316369,99400Software Maintenance/Support2430000424310 432,316
-4,000 4,0004,00000Software Purchase/Licensing2430000425700 4,000
(2.9)%3,826 3,9423,82600Liability Insurance2430000428400 3,942
(13.1) %410,980 473,418Non-personnel Expenses Total 473,418410,98000
11.4 %796,799705,971 786,706705,9710Total Budget Requirements 0
CCReport Name: 2017_Mid_Cycle_Report
Report Description: Budget Book - Department Budget Detail wMD
06/07/2017Date:
Time: 74
Version:
Page:19:21:28

Department / Section: Innovation and Technology / IT-Project Management101 - 243500
Department Budget Detail
%Chnge16/17 vs 17/182017/182017/18
AmendedAdoptedAdopted2016/17
AmendedActualActual2016/172015/162014/15GL KeyObject Description
-139,848 139,848139,84800Salaries - Regular2435000411100 139,848
(1.8)%735 74973500Accrued Payroll2435000411510 749
-1,636 1,6361,63600Workers Compensation Ins2435000412210 1,636
(4.3)%14,437 15,09714,43700Health Insurance2435000412220 15,097
-540 54054000Dental Insurance2435000412222 540
-867 86786700Life Insurance2435000412230 867
-78 787800Unemployment Insurance2435000412240 78
(7.7)%32,134 34,82232,13400PERS Retirement2435000412310 34,822
-2,028 2,0282,02800Medicare OASDI2435000412320 2,028
(20.0)%1,200 1,5001,20000Deferred Compensation2435000412400 1,500
(100.0)%0 4,256000Ptr. Comp. Model2435000419996 0
(3.9) %193,503 201,421Personnel Services Total 197,165193,50300
-800 80080000Telephone - Cellular2435000422120 800
-660 66066000Land and Building Rental2435000423200 660
-1,902 1,9021,90200Liability Insurance2435000428400 1,902
-3,362 3,362Non-personnel Expenses Total 3,3623,36200
1.8 %204,783196,865 200,527196,8650Total Budget Requirements 0
CCReport Name: 2017_Mid_Cycle_Report
Report Description: Budget Book - Department Budget Detail wMD
06/07/2017Date:
Time: 75
Version:
Page:19:21:28
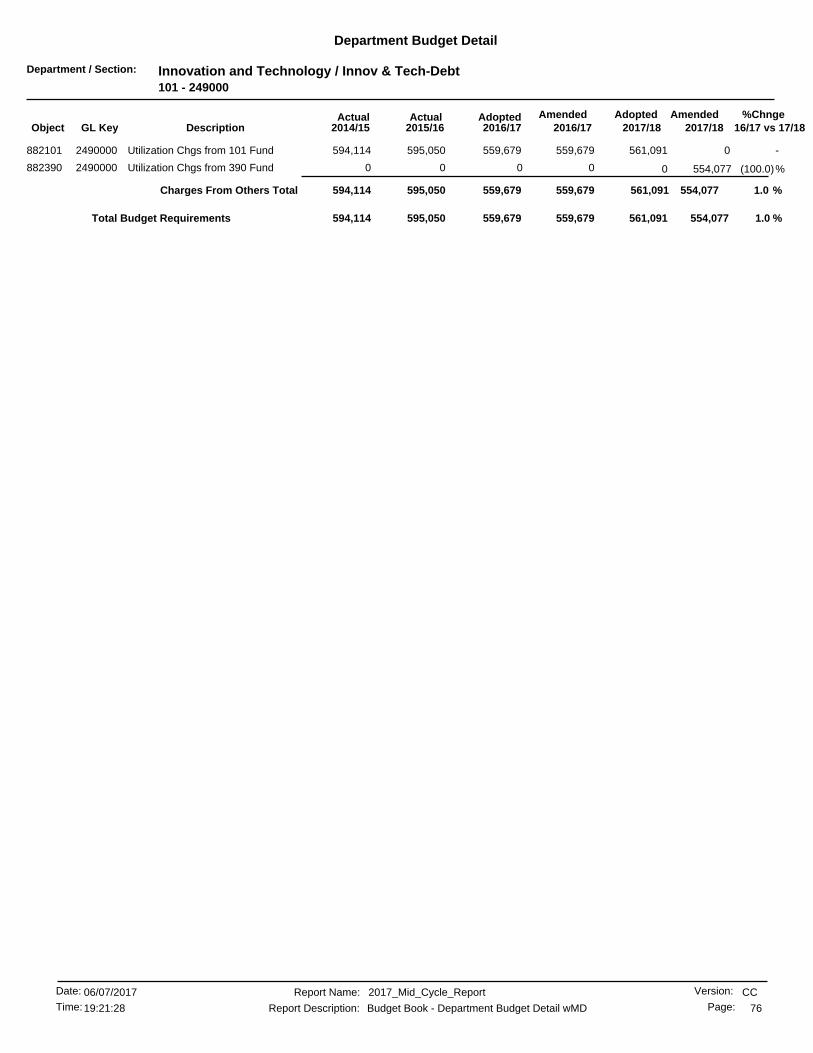
Department / Section: Innovation and Technology / Innov & Tech-Debt101 - 249000
Department Budget Detail
%Chnge16/17 vs 17/182017/182017/18
AmendedAdoptedAdopted2016/17
AmendedActualActual2016/172015/162014/15GL KeyObject Description
-0559,679 561,091559,679595,050882101 Utilization Chgs from 101 Fund2490000 594,114
(100.0)%0 554,077000Utilization Chgs from 390 Fund2490000882390 0
1.0 %554,077559,679559,679 561,091Charges From Others Total 595,050594,114
1.0 %559,679 554,077561,091559,679595,050594,114Total Budget Requirements
CCReport Name: 2017_Mid_Cycle_Report
Report Description: Budget Book - Department Budget Detail wMD
06/07/2017Date:
Time: 76
Version:
Page:19:21:28

Department / Section: Innovation and Technology / IT-Managed Savings101 - 249900
Department Budget Detail
%Chnge16/17 vs 17/182017/182017/18
AmendedAdoptedAdopted2016/17
AmendedActualActual2016/172015/162014/15GL KeyObject Description
-(350,000) (350,000)(350,000)00Managed Savings Allocation2499000499999 (350,000)
-(350,000) (350,000)Managed Savings Total (350,000)(350,000)00
-(350,000)(350,000) (350,000)(350,000)0Total Budget Requirements 0
CCReport Name: 2017_Mid_Cycle_Report
Report Description: Budget Book - Department Budget Detail wMD
06/07/2017Date:
Time: 77
Version:
Page:19:21:28
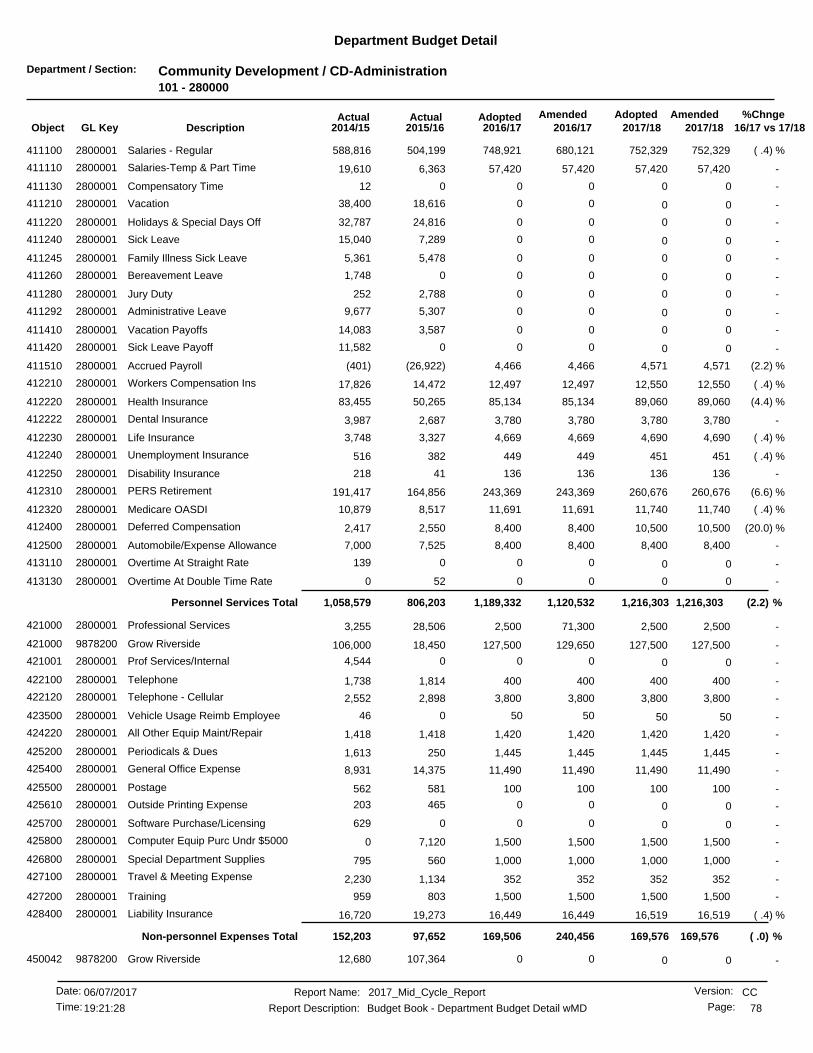
Department / Section: Community Development / CD-Administration101 - 280000
Department Budget Detail
%Chnge16/17 vs 17/182017/182017/18
AmendedAdoptedAdopted2016/17
AmendedActualActual2016/172015/162014/15GL KeyObject Description
( .4) %752,329748,921 752,329680,121504,199411100 Salaries - Regular2800001 588,816
-57,42057,420 57,42057,4206,363411110 Salaries-Temp & Part Time2800001 19,610
-0 00012Compensatory Time2800001411130 0
-0 0018,61638,400Vacation2800001411210 0
-0 0024,81632,787Holidays & Special Days Off2800001411220 0
-0 007,28915,040Sick Leave2800001411240 0
-0 005,4785,361Family Illness Sick Leave2800001411245 0
-0 0001,748Bereavement Leave2800001411260 0
-0 002,788252Jury Duty2800001411280 0
-0 005,3079,677Administrative Leave2800001411292 0
-0 003,58714,083Vacation Payoffs2800001411410 0
-0 00011,582Sick Leave Payoff2800001411420 0
(2.2) %4,5714,466 4,5714,466(26,922)411510 Accrued Payroll2800001 (401)
( .4) %12,55012,497 12,55012,49714,472412210 Workers Compensation Ins2800001 17,826
(4.4) %89,06085,134 89,06085,13450,265412220 Health Insurance2800001 83,455
-3,7803,780 3,7803,7802,687412222 Dental Insurance2800001 3,987
( .4) %4,6904,669 4,6904,6693,327412230 Life Insurance2800001 3,748
( .4) %451449 451449382412240 Unemployment Insurance2800001 516
-136136 13613641412250 Disability Insurance2800001 218
(6.6) %260,676243,369 260,676243,369164,856412310 PERS Retirement2800001 191,417
( .4) %11,74011,691 11,74011,6918,517412320 Medicare OASDI2800001 10,879
(20.0) %10,5008,400 10,5008,4002,550412400 Deferred Compensation2800001 2,417
-8,4008,400 8,4008,4007,525412500 Automobile/Expense Allowance2800001 7,000
-0 000139Overtime At Straight Rate2800001413110 0
-0 00520Overtime At Double Time Rate2800001413130 0
(2.2) %1,216,3031,120,5321,189,332 1,216,303Personnel Services Total 806,2031,058,579
-2,5002,500 2,50071,30028,506421000 Professional Services2800001 3,255
-127,500127,500 127,500129,65018,450421000 Grow Riverside9878200 106,000
-0 0004,544Prof Services/Internal2800001421001 0
-400400 4004001,814422100 Telephone2800001 1,738
-3,8003,800 3,8003,8002,898422120 Telephone - Cellular2800001 2,552
-50 5050046Vehicle Usage Reimb Employee2800001423500 50
-1,4201,420 1,4201,4201,418424220 All Other Equip Maint/Repair2800001 1,418
-1,4451,445 1,4451,445250425200 Periodicals & Dues2800001 1,613
-11,49011,490 11,49011,49014,375425400 General Office Expense2800001 8,931
-100100 100100581425500 Postage2800001 562
-0 00465203Outside Printing Expense2800001425610 0
-0 000629Software Purchase/Licensing2800001425700 0
-1,5001,500 1,5001,5007,120425800 Computer Equip Purc Undr $50002800001 0
-1,0001,000 1,0001,000560426800 Special Department Supplies2800001 795
-352352 3523521,134427100 Travel & Meeting Expense2800001 2,230
-1,5001,500 1,5001,500803427200 Training2800001 959
( .4) %16,51916,449 16,51916,44919,273428400 Liability Insurance2800001 16,720
( .0) %169,576240,456169,506 169,576Non-personnel Expenses Total 97,652152,203
-0 00107,36412,680Grow Riverside9878200450042 0
CCReport Name: 2017_Mid_Cycle_Report
Report Description: Budget Book - Department Budget Detail wMD
06/07/2017Date:
Time: 78
Version:
Page:19:21:28

Department / Section: Community Development / CD-Administration101 - 280000
Department Budget Detail
%Chnge16/17 vs 17/182017/182017/18
AmendedAdoptedAdopted2016/17
AmendedActualActual2016/172015/162014/15GL KeyObject Description
-0 0Special Projects Total 00107,36412,680
-0 0012,6600Office Furniture & Equipment2800001462300 0
-15,00015,000 15,00015,00023,598463300 Off Furn & Equip Cap Lease2800001 28,658
-15,00015,00015,000 15,000Equipment Outlay Total 36,25828,658
161.8 %1,146,1783,000,953 3,000,9533,000,9533,000,952881100 General Fund Allocation Chgs2800001 3,171,343
(7.9) %73,96868,058 73,96868,05871,768882101 Utilization Chgs from 101 Fund2800001 52,644
-0 0049,49755,215Utilization Chgs from 260 Fund2800001882260 0
-0 000293,414Interfund Services from 170 Fd2800001884170 0
-0 00068,400Interfund Services from 220 Fd2800001884220 0
151.5 %1,220,1463,069,0113,069,011 3,074,921Charges From Others Total 3,122,2183,641,018
(5.1) %(144,669)(137,289) (144,669)(137,289)(126,375)892101 Utilization Chgs to 101 Fund2800001 (124,719)
22.5 %(436,238)(534,772) (436,238)(534,772)70,515892170 Utilization Chgs to 170 Fund2800001 (400,473)
-0 0026,951(70,883)Utilization Chgs to 220 Fund2800001892220 0
(4.9) %(237,892)(226,134) (237,892)(226,134)(199,365)892280 Utilization Chgs to 280 Fund2800001 (193,632)
(5.1) %(86,114)(81,666) (86,114)(81,666)(48,011)894220 Interfund Services to 220 Fund2800001 0
249.1 %(865)(3,020) (865)(3,020)(41,600)894223 Interfund Services to 223 Fund2800001 (1,265)
8.5 %(905,778)(982,881)(982,881) (905,778)Charges to Others Total (317,885)(790,975)
101.7 %3,459,968 1,715,2473,570,0223,462,1183,851,8104,102,164Total Budget Requirements
CCReport Name: 2017_Mid_Cycle_Report
Report Description: Budget Book - Department Budget Detail wMD
06/07/2017Date:
Time: 79
Version:
Page:19:21:28
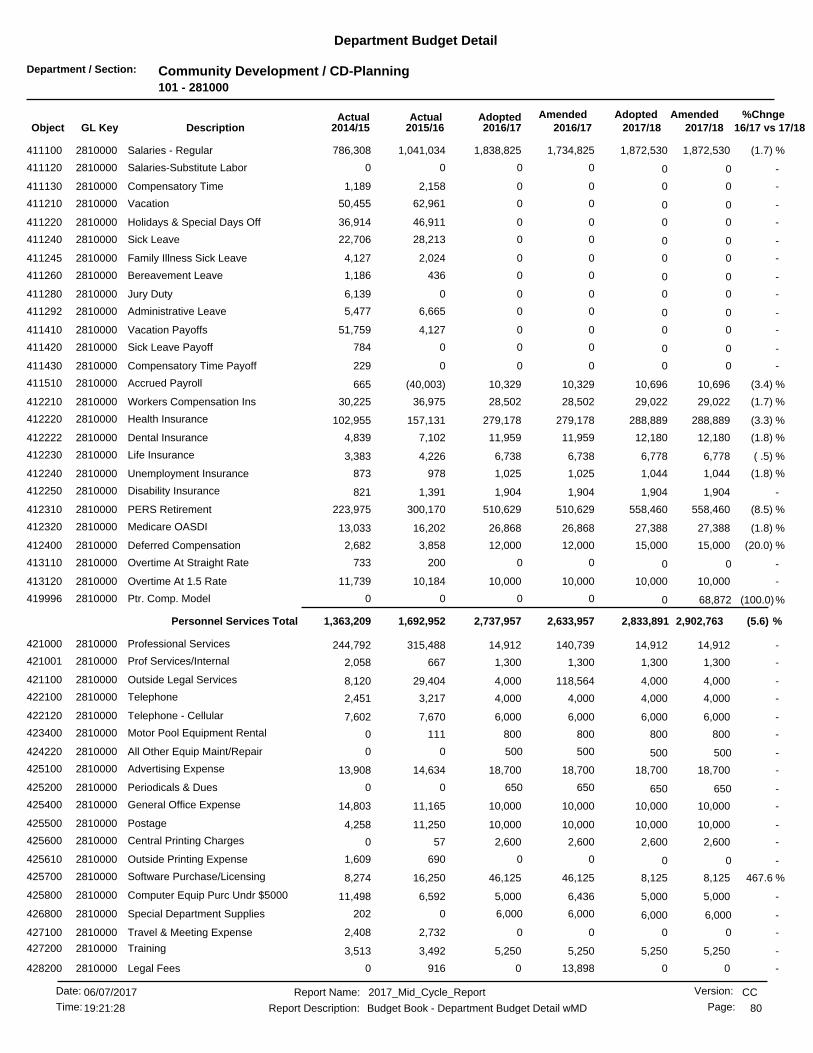
Department / Section: Community Development / CD-Planning101 - 281000
Department Budget Detail
%Chnge16/17 vs 17/182017/182017/18
AmendedAdoptedAdopted2016/17
AmendedActualActual2016/172015/162014/15GL KeyObject Description
(1.7) %1,872,5301,838,825 1,872,5301,734,8251,041,034411100 Salaries - Regular2810000 786,308
-0 0000Salaries-Substitute Labor2810000411120 0
-0 002,1581,189Compensatory Time2810000411130 0
-0 0062,96150,455Vacation2810000411210 0
-0 0046,91136,914Holidays & Special Days Off2810000411220 0
-0 0028,21322,706Sick Leave2810000411240 0
-0 002,0244,127Family Illness Sick Leave2810000411245 0
-0 004361,186Bereavement Leave2810000411260 0
-0 0006,139Jury Duty2810000411280 0
-0 006,6655,477Administrative Leave2810000411292 0
-0 004,12751,759Vacation Payoffs2810000411410 0
-0 000784Sick Leave Payoff2810000411420 0
-0 000229Compensatory Time Payoff2810000411430 0
(3.4) %10,69610,329 10,69610,329(40,003)411510 Accrued Payroll2810000 665
(1.7) %29,02228,502 29,02228,50236,975412210 Workers Compensation Ins2810000 30,225
(3.3) %288,889279,178 288,889279,178157,131412220 Health Insurance2810000 102,955
(1.8) %12,18011,959 12,18011,9597,102412222 Dental Insurance2810000 4,839
( .5) %6,7786,738 6,7786,7384,226412230 Life Insurance2810000 3,383
(1.8) %1,0441,025 1,0441,025978412240 Unemployment Insurance2810000 873
-1,9041,904 1,9041,9041,391412250 Disability Insurance2810000 821
(8.5) %558,460510,629 558,460510,629300,170412310 PERS Retirement2810000 223,975
(1.8) %27,38826,868 27,38826,86816,202412320 Medicare OASDI2810000 13,033
(20.0) %15,00012,000 15,00012,0003,858412400 Deferred Compensation2810000 2,682
-0 00200733Overtime At Straight Rate2810000413110 0
-10,00010,000 10,00010,00010,184413120 Overtime At 1.5 Rate2810000 11,739
(100.0)%0 68,872000Ptr. Comp. Model2810000419996 0
(5.6) %2,902,7632,633,9572,737,957 2,833,891Personnel Services Total 1,692,9521,363,209
-14,91214,912 14,912140,739315,488421000 Professional Services2810000 244,792
-1,3001,300 1,3001,300667421001 Prof Services/Internal2810000 2,058
-4,0004,000 4,000118,56429,404421100 Outside Legal Services2810000 8,120
-4,0004,000 4,0004,0003,217422100 Telephone2810000 2,451
-6,0006,000 6,0006,0007,670422120 Telephone - Cellular2810000 7,602
-800800 800800111423400 Motor Pool Equipment Rental2810000 0
-500 50050000All Other Equip Maint/Repair2810000424220 500
-18,70018,700 18,70018,70014,634425100 Advertising Expense2810000 13,908
-650 65065000Periodicals & Dues2810000425200 650
-10,00010,000 10,00010,00011,165425400 General Office Expense2810000 14,803
-10,00010,000 10,00010,00011,250425500 Postage2810000 4,258
-2,6002,600 2,6002,60057425600 Central Printing Charges2810000 0
-0 006901,609Outside Printing Expense2810000425610 0
467.6 %8,12546,125 8,12546,12516,250425700 Software Purchase/Licensing2810000 8,274
-5,0005,000 5,0006,4366,592425800 Computer Equip Purc Undr $50002810000 11,498
-6,000 6,0006,0000202Special Department Supplies2810000426800 6,000
-0 002,7322,408Travel & Meeting Expense2810000427100 0
-5,2505,250 5,2505,2503,492427200 Training2810000 3,513
-00 013,898916428200 Legal Fees2810000 0
CCReport Name: 2017_Mid_Cycle_Report
Report Description: Budget Book - Department Budget Detail wMD
06/07/2017Date:
Time: 80
Version:
Page:19:21:28
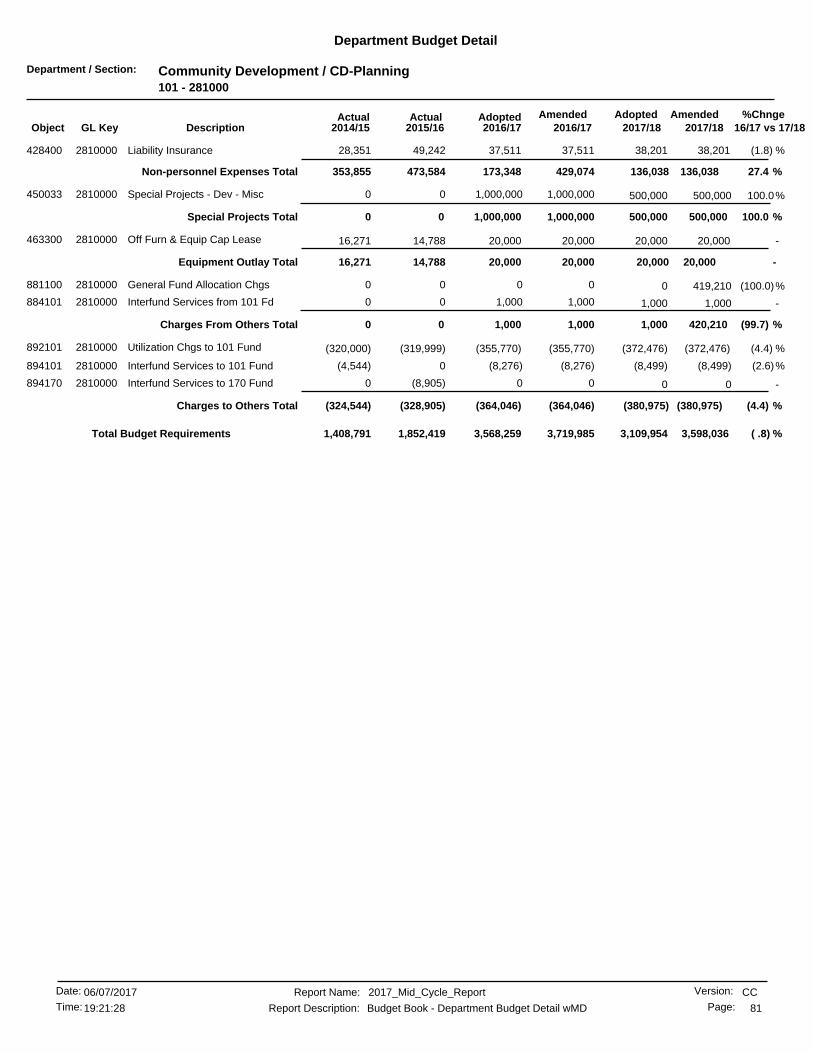
Department / Section: Community Development / CD-Planning101 - 281000
Department Budget Detail
%Chnge16/17 vs 17/182017/182017/18
AmendedAdoptedAdopted2016/17
AmendedActualActual2016/172015/162014/15GL KeyObject Description
(1.8) %38,20137,511 38,20137,51149,242428400 Liability Insurance2810000 28,351
27.4 %136,038429,074173,348 136,038Non-personnel Expenses Total 473,584353,855
100.0%1,000,000 500,0001,000,00000Special Projects - Dev - Misc2810000450033 500,000
100.0 %1,000,000 500,000Special Projects Total 500,0001,000,00000
-20,00020,000 20,00020,00014,788463300 Off Furn & Equip Cap Lease2810000 16,271
-20,00020,00020,000 20,000Equipment Outlay Total 14,78816,271
(100.0)%0 419,210000General Fund Allocation Chgs2810000881100 0
-1,000 1,0001,00000Interfund Services from 101 Fd2810000884101 1,000
(99.7) %1,000 420,210Charges From Others Total 1,0001,00000
(4.4) %(372,476)(355,770) (372,476)(355,770)(319,999)892101 Utilization Chgs to 101 Fund2810000 (320,000)
(2.6)%(8,276) (8,499)(8,276)0(4,544)Interfund Services to 101 Fund2810000894101 (8,499)
-0 00(8,905)0Interfund Services to 170 Fund2810000894170 0
(4.4) %(380,975)(364,046)(364,046) (380,975)Charges to Others Total (328,905)(324,544)
( .8) %3,568,259 3,598,0363,109,9543,719,9851,852,4191,408,791Total Budget Requirements
CCReport Name: 2017_Mid_Cycle_Report
Report Description: Budget Book - Department Budget Detail wMD
06/07/2017Date:
Time: 81
Version:
Page:19:21:28
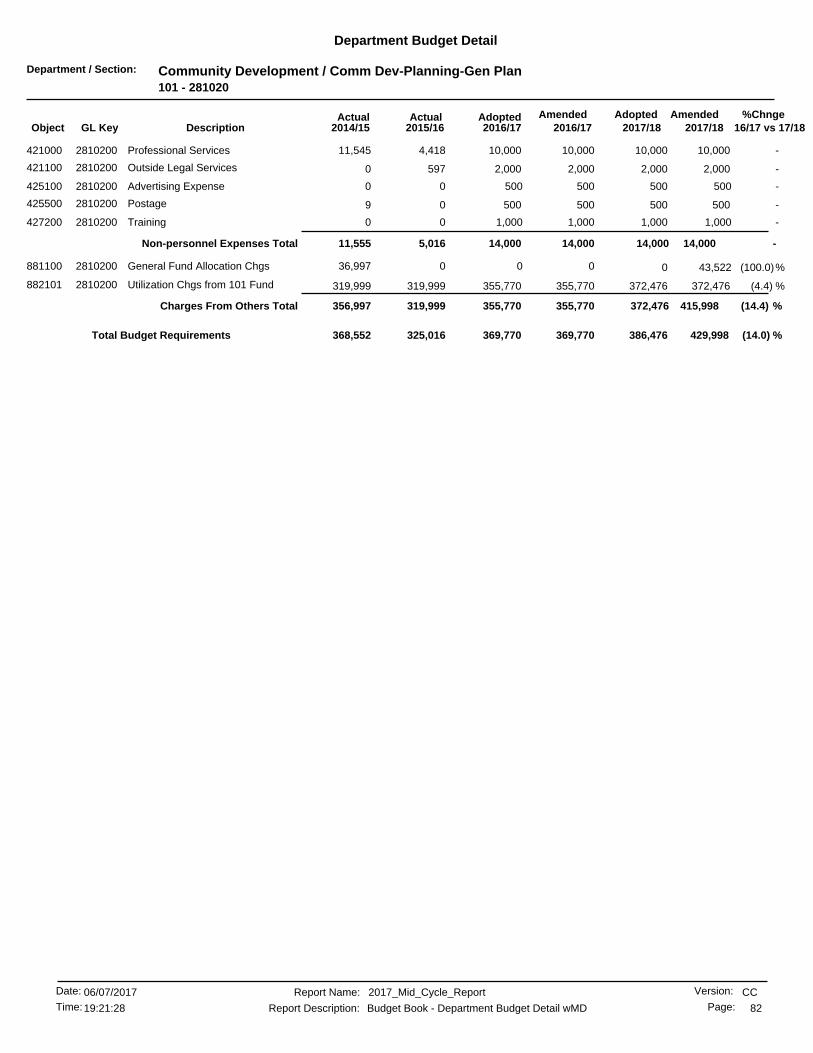
Department / Section: Community Development / Comm Dev-Planning-Gen Plan101 - 281020
Department Budget Detail
%Chnge16/17 vs 17/182017/182017/18
AmendedAdoptedAdopted2016/17
AmendedActualActual2016/172015/162014/15GL KeyObject Description
-10,00010,000 10,00010,0004,418421000 Professional Services2810200 11,545
-2,0002,000 2,0002,000597421100 Outside Legal Services2810200 0
-500 50050000Advertising Expense2810200425100 500
-500500 5005000425500 Postage2810200 9
-1,000 1,0001,00000Training2810200427200 1,000
-14,00014,00014,000 14,000Non-personnel Expenses Total 5,01611,555
(100.0)%0 43,5220036,997General Fund Allocation Chgs2810200881100 0
(4.4) %372,476355,770 372,476355,770319,999882101 Utilization Chgs from 101 Fund2810200 319,999
(14.4) %415,998355,770355,770 372,476Charges From Others Total 319,999356,997
(14.0) %369,770 429,998386,476369,770325,016368,552Total Budget Requirements
CCReport Name: 2017_Mid_Cycle_Report
Report Description: Budget Book - Department Budget Detail wMD
06/07/2017Date:
Time: 82
Version:
Page:19:21:28

Department / Section: Community Development / Comm Dev-Plng-Hist Pres101 - 281025
Department Budget Detail
%Chnge16/17 vs 17/182017/182017/18
AmendedAdoptedAdopted2016/17
AmendedActualActual2016/172015/162014/15GL KeyObject Description
(2.1) %445,131435,467 445,131383,667305,908411100 Salaries - Regular2810250 367,348
-0 0010,58019,244Compensatory Time2810250411130 0
-0 0027,81918,631Vacation2810250411210 0
-0 0014,46919,385Holidays & Special Days Off2810250411220 0
-0 008,50319,941Sick Leave2810250411240 0
-0 003,8103,571Family Illness Sick Leave2810250411245 0
-0 001,9210Bereavement Leave2810250411260 0
-0 001,0560Jury Duty2810250411280 0
-0 002,1573,357Administrative Leave2810250411292 0
-0 0011,651259Vacation Payoffs2810250411410 0
-0 004110Sick Leave Payoff2810250411420 0
-0 001,58915Compensatory Time Payoff2810250411430 0
(3.5) %2,5712,481 2,5712,481(21,167)411510 Accrued Payroll2810250 7,218
(2.1) %6,9006,750 6,9006,7509,837412210 Workers Compensation Ins2810250 11,307
(1.8) %72,67371,353 72,67371,35353,682412220 Health Insurance2810250 54,234
-3,2403,240 3,2403,2402,477412222 Dental Insurance2810250 2,349
(1.9) %2,1052,065 2,1052,0651,768412230 Life Insurance2810250 1,938
(2.4) %249243 249243259412240 Unemployment Insurance2810250 327
-272272 272272230412250 Disability Insurance2810250 258
(8.2) %134,757123,664 134,757123,664108,261412310 PERS Retirement2810250 111,779
(2.1) %6,4556,314 6,4556,3145,287412320 Medicare OASDI2810250 5,484
(20.0) %6,0004,800 6,0004,8003,112412400 Deferred Compensation2810250 1,805
-0 004360Overtime At Straight Rate2810250413110 0
-0 001,9972,918Overtime At 1.5 Rate2810250413120 0
(100.0)%0 15,112000Ptr. Comp. Model2810250419996 0
(5.5) %695,465604,849656,649 680,353Personnel Services Total 556,064651,377
-40,95240,952 40,952189,80025,582421000 Professional Services2810250 46,099
-0 0025538Prof Services/Internal2810250421001 0
-0 00186190Telephone2810250422100 0
-6,0006,000 6,0006,0007,565422120 Telephone - Cellular2810250 7,656
-500500 5005003,477425100 Advertising Expense2810250 58
-0 006856,023General Office Expense2810250425400 0
-0 00(56)0Merchant Fees2810250425410 0
-1,3251,325 1,3251,32515425500 Postage2810250 298
-1,500 1,5001,5000248Central Printing Charges2810250425600 1,500
-0 00190104Outside Printing Expense2810250425610 0
-1,5001,500 1,5001,5001,495425800 Computer Equip Purc Undr $50002810250 1,862
-1,0001,000 1,0001,000803426800 Special Department Supplies2810250 55
-0 003,4731,098Travel & Meeting Expense2810250427100 0
-2,5002,500 2,5002,5006,533427200 Training2810250 2,337
-0 004350Employee Loyalty2810250427400 0
(2.1) %9,0818,883 9,0818,88313,099428400 Liability Insurance2810250 10,606
( .3) %64,358213,00864,160 64,358Non-personnel Expenses Total 63,51377,180
-4,500 4,5004,50004,298Neighborhood Pride Awards2810250450301 4,500
-31,00031,000 31,00034,50023,641450309 Neighborhood Program2810250 50,911
CCReport Name: 2017_Mid_Cycle_Report
Report Description: Budget Book - Department Budget Detail wMD
06/07/2017Date:
Time: 83
Version:
Page:19:21:28
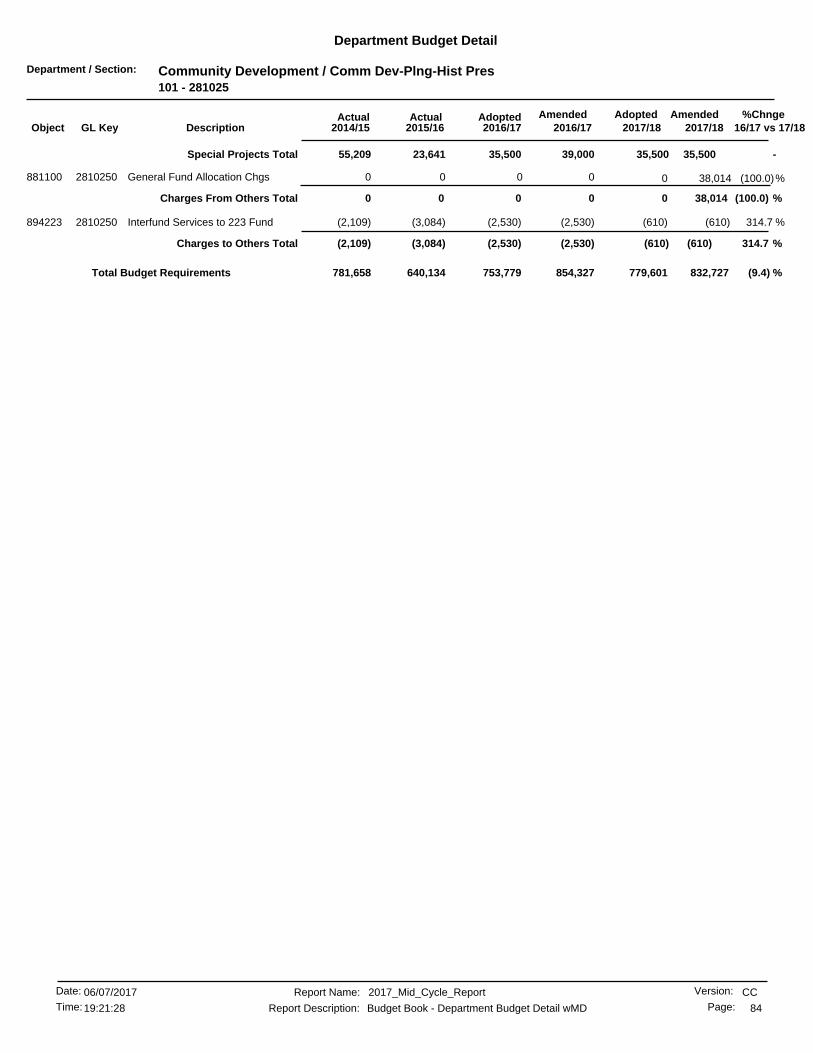
Department / Section: Community Development / Comm Dev-Plng-Hist Pres101 - 281025
Department Budget Detail
%Chnge16/17 vs 17/182017/182017/18
AmendedAdoptedAdopted2016/17
AmendedActualActual2016/172015/162014/15GL KeyObject Description
-35,50039,00035,500 35,500Special Projects Total 23,64155,209
(100.0)%0 38,014000General Fund Allocation Chgs2810250881100 0
(100.0) %0 38,014Charges From Others Total 0000
314.7 %(610)(2,530) (610)(2,530)(3,084)894223 Interfund Services to 223 Fund2810250 (2,109)
314.7 %(610)(2,530)(2,530) (610)Charges to Others Total (3,084)(2,109)
(9.4) %753,779 832,727779,601854,327640,134781,658Total Budget Requirements
CCReport Name: 2017_Mid_Cycle_Report
Report Description: Budget Book - Department Budget Detail wMD
06/07/2017Date:
Time: 84
Version:
Page:19:21:28

Department / Section: Community Development / Comm Dev-Plng-Hist Pres Awards101 - 281026
Department Budget Detail
%Chnge16/17 vs 17/182017/182017/18
AmendedAdoptedAdopted2016/17
AmendedActualActual2016/172015/162014/15GL KeyObject Description
-0 025,00000Heritage Hse-HPO Grant9895400440309 0
-0 025,00000Harada Hse-HPO Grant9895500440309 0
-0 009,7300Historical Preservation Awards9895600440309 0
-0 025,00000St Francis Falls-HPF9895700440309 0
-0 0Capital Outlay & Grants Total 075,0009,7300
-0 0075,0009,7300Total Budget Requirements
(100.0) %00 075,0009,730Total Budget Requirements 0
CCReport Name: 2017_Mid_Cycle_Report
Report Description: Budget Book - Department Budget Detail wMD
06/07/2017Date:
Time: 85
Version:
Page:19:21:28

Department / Section: Community Development / Economic Development101 - 281500
Department Budget Detail
%Chnge16/17 vs 17/182017/182017/18
AmendedAdoptedAdopted2016/17
AmendedActualActual2016/172015/162014/15GL KeyObject Description
(2.6) %455,602443,483 455,602443,483325,309411100 Salaries - Regular2815001 0
(2.2) %22,88022,360 22,88022,36017,971411110 Salaries-Temp & Part Time2815001 0
-0 0032,5020Vacation2815001411210 0
-0 0018,5220Holidays & Special Days Off2815001411220 0
-0 0069,3250Sick Leave2815001411240 0
-0 001,0650Family Illness Sick Leave2815001411245 0
-0 007,6900Administrative Leave2815001411292 0
(4.1) %2,6122,503 2,6122,503(8,020)411510 Accrued Payroll2815001 0
(2.6) %7,4157,220 7,4157,22013,188412210 Workers Compensation Ins2815001 0
(3.6) %50,03148,229 50,03148,22939,988412220 Health Insurance2815001 0
-2,1602,160 2,1602,1601,778412222 Dental Insurance2815001 0
(2.6) %2,8252,749 2,8252,7492,719412230 Life Insurance2815001 0
(3.0) %267259 267259348412240 Unemployment Insurance2815001 0
(8.9) %132,302120,483 132,302120,483127,519412310 PERS Retirement2815001 0
(2.6) %6,9396,754 6,9396,7546,899412320 Medicare OASDI2815001 0
(2.3) %858838 858838956412330 City Retirement Plan2815001 0
(20.0) %7,5006,000 7,5006,0003,632412400 Deferred Compensation2815001 0
(100.0)%0 14,648000Ptr. Comp. Model2815001419996 0
(6.0) %706,039663,038663,038 691,391Personnel Services Total 661,3970
-103,404103,404 103,404103,40443,531421000 Professional Services2815001 0
-2,500 2,5002,50000Telephone2815001422100 2,500
-2,5002,500 2,5002,5002,759422120 Telephone - Cellular2815001 0
-500500 500500544423400 Motor Pool Equipment Rental2815001 0
-500 50050000Vehicle Usage Reimb Employee2815001423500 500
-600 60060000All Other Equip Maint/Repair2815001424220 600
-25,00025,000 25,00025,00010,000425100 Advertising Expense2815001 0
-12,00012,000 12,00012,0005,425425200 Periodicals & Dues2815001 0
-2,5002,500 2,5002,5005,619425400 General Office Expense2815001 0
-4,0004,000 4,0004,000376425500 Postage2815001 0
-9,300 9,3009,30000Central Printing Charges2815001425600 9,300
-0 003,8120Outside Printing Expense2815001425610 0
-128,264128,264 128,264128,264105,415425700 Software Purchase/Licensing2815001 0
-05,000 05,000948425800 Computer Equip Purc Undr $50002815001 0
-24,62024,620 24,62024,62024,295427100 Travel & Meeting Expense2815001 0
-10,00010,000 10,00010,0001,717427200 Training2815001 0
(2.6) %9,7609,502 9,7609,50217,562428400 Liability Insurance2815001 0
1.4 %335,448340,190340,190 335,448Non-personnel Expenses Total 222,0070
3000.0%1,550,000 50,000350,00000Special Projects - Dev - Misc2815001450033 50,000
-27,000 27,00027,00000Sponsorships2815001450302 27,000
-0 003,4430Destination Marketing2815001453052 0
-0 0000Community Outreach ED & Mktg2815001453055 0
-73,50073,500 73,50073,50062,119453101 Small Business Devel Center2815001 0
-0 050,00000Greenbelt Preservation Grant2815001453231 0
996.6 %150,500500,5001,650,500 150,500Special Projects Total 65,5620
-0 070,00000Chow Alley Demo9893210440301 0
CCReport Name: 2017_Mid_Cycle_Report
Report Description: Budget Book - Department Budget Detail wMD
06/07/2017Date:
Time: 86
Version:
Page:19:21:28

Department / Section: Community Development / Economic Development101 - 281500
Department Budget Detail
%Chnge16/17 vs 17/182017/182017/18
AmendedAdoptedAdopted2016/17
AmendedActualActual2016/172015/162014/15GL KeyObject Description
-0 0480,00000Pedestrian Mall Extension9893220440301 0
-0 0650,00000Chow Alley Infrastructure9893230440301 0
-0 0Capital Outlay & Grants Total 01,200,00000
8.3 %10,19711,045 11,04511,04511,044881100 General Fund Allocation Chgs2815001 0
(6.2)%3,750 4,0003,75000Utilization Chgs from 101 Fund2815001882101 4,000
4.2 %14,19714,79514,795 15,045Charges From Others Total 11,0440
1305.3 %(80,860)(1,136,369) (1,136,369)(1,136,369)(1,136,373)891100 General Fund Allocation Chgs2815001 0
1305.3 %(80,860)(1,136,369)(1,136,369) (1,136,369)Charges to Others Total (1,136,373)0
36.1 %1,532,154 1,125,32456,0151,582,154(176,360)0Total Budget Requirements
CCReport Name: 2017_Mid_Cycle_Report
Report Description: Budget Book - Department Budget Detail wMD
06/07/2017Date:
Time: 87
Version:
Page:19:21:28
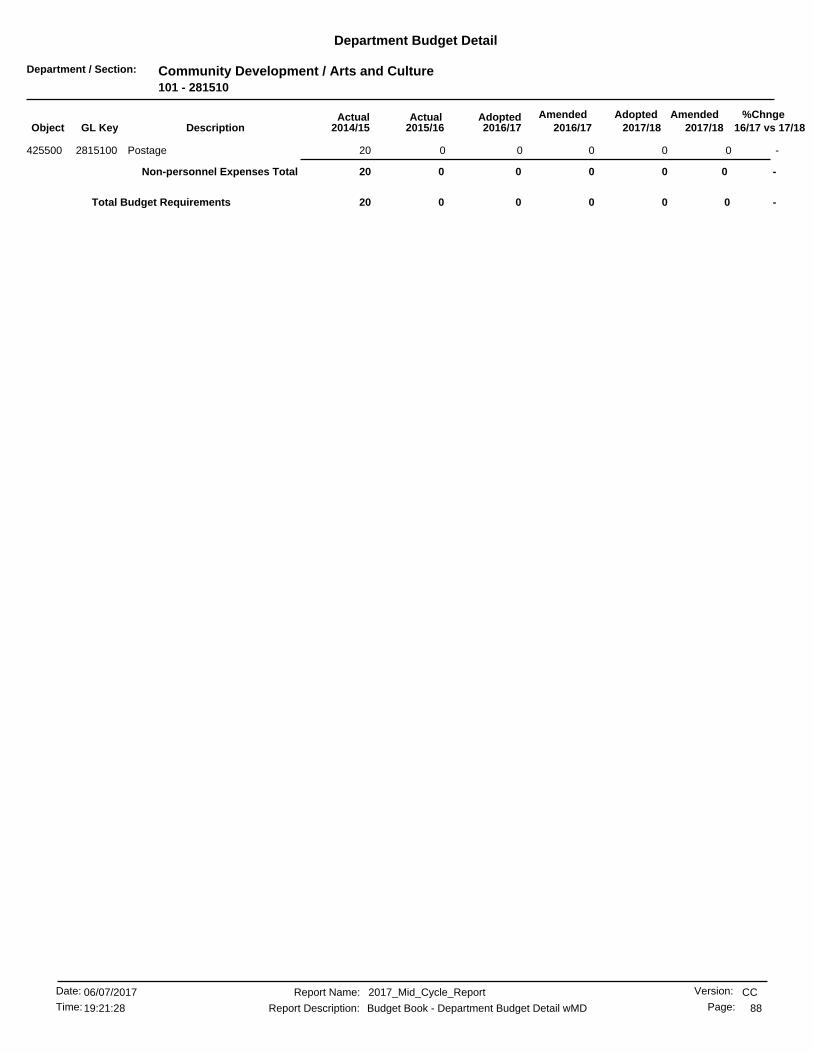
Department / Section: Community Development / Arts and Culture101 - 281510
Department Budget Detail
%Chnge16/17 vs 17/182017/182017/18
AmendedAdoptedAdopted2016/17
AmendedActualActual2016/172015/162014/15GL KeyObject Description
-0 00020Postage2815100425500 0
-0 0Non-personnel Expenses Total 00020
-00 000Total Budget Requirements 20
CCReport Name: 2017_Mid_Cycle_Report
Report Description: Budget Book - Department Budget Detail wMD
06/07/2017Date:
Time: 88
Version:
Page:19:21:28

Department / Section: Community Development / Comm Dev-Building & Safety101 - 282500
Department Budget Detail
%Chnge16/17 vs 17/182017/182017/18
AmendedAdoptedAdopted2016/17
AmendedActualActual2016/172015/162014/15GL KeyObject Description
(1.3) %1,597,6011,576,459 1,597,6011,510,8591,285,187411100 Salaries - Regular2825000 906,778
-0 002,5471,339Compensatory Time2825000411130 0
-0 0083,72950,238Vacation2825000411210 0
-0 0057,16741,568Holidays & Special Days Off2825000411220 0
-0 004,8611,479Military Leave2825000411230 0
-0 0040,75341,475Sick Leave2825000411240 0
-0 006,6154,275Family Illness Sick Leave2825000411245 0
-0 002,076340Bereavement Leave2825000411260 0
-0 007331,053Jury Duty2825000411280 0
-0 004,017377Administrative Leave2825000411292 0
-0 001,6770Vacation Payoffs2825000411410 0
(2.9) %8,9048,639 8,9048,639(62,064)411510 Accrued Payroll2825000 29,787
(1.3) %24,76324,436 24,76324,43631,782412210 Workers Compensation Ins2825000 29,082
(4.6) %194,925185,797 194,925185,797169,847412220 Health Insurance2825000 135,007
(1.6) %9,9849,815 9,9849,8158,877412222 Dental Insurance2825000 6,765
(2.1) %3,6863,608 3,6863,6082,919412230 Life Insurance2825000 1,146
(1.3) %891879 891879840412240 Unemployment Insurance2825000 840
-2,0402,040 2,0402,0402,003412250 Disability Insurance2825000 1,746
(7.6) %480,125443,413 480,125443,413362,277412310 PERS Retirement2825000 250,249
(1.3) %23,16622,860 23,16622,86022,416412320 Medicare OASDI2825000 16,323
(20.0) %7,5006,000 7,5006,0002,062412400 Deferred Compensation2825000 675
-0 001771Overtime At Straight Rate2825000413110 0
-25,00025,000 25,00025,00048,205413120 Overtime At 1.5 Rate2825000 66,866
(100.0)%0 64,264000Ptr. Comp. Model2825000419996 0
(5.4) %2,442,8492,243,3462,308,946 2,378,585Personnel Services Total 2,078,5551,587,490
(100.0) %125,0000 065,60093,872421000 Professional Services2825000 189,212
-0 000130Prof Services/Internal2825000421001 0
-3,4613,461 3,4613,4612,841422100 Telephone2825000 2,123
-5,0005,000 5,0005,0002,088422120 Telephone - Cellular2825000 6,633
-60,00060,000 60,00060,00060,721423400 Motor Pool Equipment Rental2825000 52,194
-0 0001,806Advertising Expense2825000425100 0
-5,0005,000 5,0005,0004,269425200 Periodicals & Dues2825000 1,267
-30,00030,000 30,00030,00059,324425301 Document Archival and Supplies2825000 25,870
-10,00010,000 10,00010,00010,281425400 General Office Expense2825000 7,925
-1,0001,000 1,0001,000433425500 Postage2825000 397
-1,1001,100 1,1001,100878425600 Central Printing Charges2825000 0
-0 00618853Outside Printing Expense2825000425610 0
-2,5002,500 2,5002,5003,584425800 Computer Equip Purc Undr $50002825000 8,276
-3,0003,000 3,0003,000272426200 Clothing/Linen/Safety Supplies2825000 0
-900900 900900900426710 Work Boot Reimbursement2825000 900
51.5%5,000 3,3005,00001,094Special Department Supplies2825000426800 3,300
-0 006131,514Travel & Meeting Expense2825000427100 0
-12,00012,000 12,00012,0008,358427200 Training2825000 2,461
-0 024,51400SB1186-Training9890410427200 0
-0 07,22000Seismic Education & Traning9723110427300 0
(1.3) %32,59032,158 32,59032,15842,327428400 Liability Insurance2825000 27,279
CCReport Name: 2017_Mid_Cycle_Report
Report Description: Budget Book - Department Budget Detail wMD
06/07/2017Date:
Time: 89
Version:
Page:19:21:28

Department / Section: Community Development / Comm Dev-Building & Safety101 - 282500
Department Budget Detail
%Chnge16/17 vs 17/182017/182017/18
AmendedAdoptedAdopted2016/17
AmendedActualActual2016/172015/162014/15GL KeyObject Description
(41.9) %294,851268,454171,119 169,851Non-personnel Expenses Total 291,383329,942
-0 0000Office Furniture & Equipment2825000462300 0
-00 01,689,752116,064462305 Permit SW- Computronix GF9892100 0
-0 00332,7560Permit SW- Computronix Elec9892110462305 0
-0 00135,9150Permit SW- Computronix Water9892120462305 0
-5,0005,000 5,0005,0004,522463300 Off Furn & Equip Cap Lease2825000 2,480
-5,0001,694,7525,000 5,000Equipment Outlay Total 589,2572,480
(100.0)%0 383,577000General Fund Allocation Chgs2825000881100 0
-600600 600600499882510 Utilization Chgs from 510 Fund2825000 399
(99.8) %384,177600600 600Charges From Others Total 499399
-0 00(332,756)0Permit SW- Computronix Elec9892110894101 0
-0 00(129,800)0Permit SW- Computronix Water9892120894101 0
-0 0Charges to Others Total 00(462,556)0
(20.5) %2,485,665 3,126,8772,554,0364,207,1522,497,1401,920,313Total Budget Requirements
CCReport Name: 2017_Mid_Cycle_Report
Report Description: Budget Book - Department Budget Detail wMD
06/07/2017Date:
Time: 90
Version:
Page:19:21:28
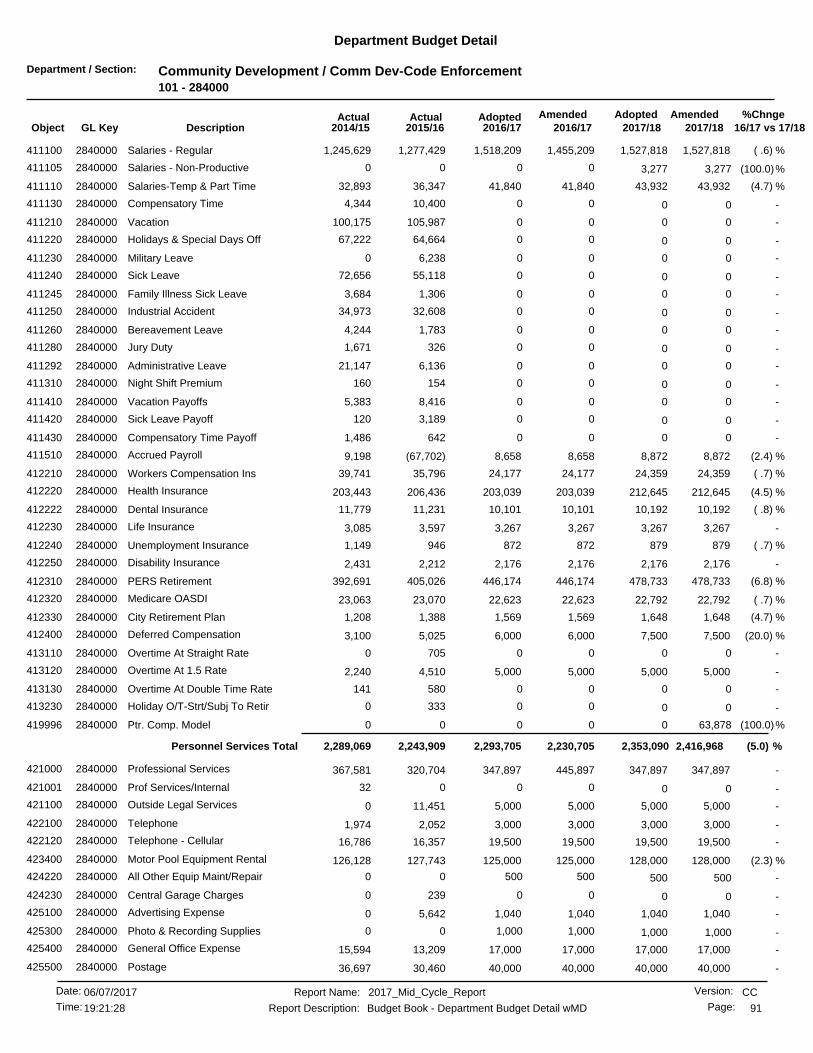
Department / Section: Community Development / Comm Dev-Code Enforcement101 - 284000
Department Budget Detail
%Chnge16/17 vs 17/182017/182017/18
AmendedAdoptedAdopted2016/17
AmendedActualActual2016/172015/162014/15GL KeyObject Description
( .6) %1,527,8181,518,209 1,527,8181,455,2091,277,429411100 Salaries - Regular2840000 1,245,629
(100.0)%0 3,277000Salaries - Non-Productive2840000411105 3,277
(4.7) %43,93241,840 43,93241,84036,347411110 Salaries-Temp & Part Time2840000 32,893
-0 0010,4004,344Compensatory Time2840000411130 0
-0 00105,987100,175Vacation2840000411210 0
-0 0064,66467,222Holidays & Special Days Off2840000411220 0
-0 006,2380Military Leave2840000411230 0
-0 0055,11872,656Sick Leave2840000411240 0
-0 001,3063,684Family Illness Sick Leave2840000411245 0
-0 0032,60834,973Industrial Accident2840000411250 0
-0 001,7834,244Bereavement Leave2840000411260 0
-0 003261,671Jury Duty2840000411280 0
-0 006,13621,147Administrative Leave2840000411292 0
-0 00154160Night Shift Premium2840000411310 0
-0 008,4165,383Vacation Payoffs2840000411410 0
-0 003,189120Sick Leave Payoff2840000411420 0
-0 006421,486Compensatory Time Payoff2840000411430 0
(2.4) %8,8728,658 8,8728,658(67,702)411510 Accrued Payroll2840000 9,198
( .7) %24,35924,177 24,35924,17735,796412210 Workers Compensation Ins2840000 39,741
(4.5) %212,645203,039 212,645203,039206,436412220 Health Insurance2840000 203,443
( .8) %10,19210,101 10,19210,10111,231412222 Dental Insurance2840000 11,779
-3,2673,267 3,2673,2673,597412230 Life Insurance2840000 3,085
( .7) %879872 879872946412240 Unemployment Insurance2840000 1,149
-2,1762,176 2,1762,1762,212412250 Disability Insurance2840000 2,431
(6.8) %478,733446,174 478,733446,174405,026412310 PERS Retirement2840000 392,691
( .7) %22,79222,623 22,79222,62323,070412320 Medicare OASDI2840000 23,063
(4.7) %1,6481,569 1,6481,5691,388412330 City Retirement Plan2840000 1,208
(20.0) %7,5006,000 7,5006,0005,025412400 Deferred Compensation2840000 3,100
-0 007050Overtime At Straight Rate2840000413110 0
-5,0005,000 5,0005,0004,510413120 Overtime At 1.5 Rate2840000 2,240
-0 00580141Overtime At Double Time Rate2840000413130 0
-0 003330Holiday O/T-Strt/Subj To Retir2840000413230 0
(100.0)%0 63,878000Ptr. Comp. Model2840000419996 0
(5.0) %2,416,9682,230,7052,293,705 2,353,090Personnel Services Total 2,243,9092,289,069
-347,897347,897 347,897445,897320,704421000 Professional Services2840000 367,581
-0 00032Prof Services/Internal2840000421001 0
-5,0005,000 5,0005,00011,451421100 Outside Legal Services2840000 0
-3,0003,000 3,0003,0002,052422100 Telephone2840000 1,974
-19,50019,500 19,50019,50016,357422120 Telephone - Cellular2840000 16,786
(2.3) %128,000125,000 128,000125,000127,743423400 Motor Pool Equipment Rental2840000 126,128
-500 50050000All Other Equip Maint/Repair2840000424220 500
-0 002390Central Garage Charges2840000424230 0
-1,0401,040 1,0401,0405,642425100 Advertising Expense2840000 0
-1,000 1,0001,00000Photo & Recording Supplies2840000425300 1,000
-17,00017,000 17,00017,00013,209425400 General Office Expense2840000 15,594
-40,00040,000 40,00040,00030,460425500 Postage2840000 36,697
CCReport Name: 2017_Mid_Cycle_Report
Report Description: Budget Book - Department Budget Detail wMD
06/07/2017Date:
Time: 91
Version:
Page:19:21:28

Department / Section: Community Development / Comm Dev-Code Enforcement101 - 284000
Department Budget Detail
%Chnge16/17 vs 17/182017/182017/18
AmendedAdoptedAdopted2016/17
AmendedActualActual2016/172015/162014/15GL KeyObject Description
-2,5002,500 2,5002,500117425600 Central Printing Charges2840000 0
-0 001,3852,199Outside Printing Expense2840000425610 0
-18,90018,900 18,90018,90019,800425700 Software Purchase/Licensing2840000 15,000
-15,88715,887 15,88715,88716,751425800 Computer Equip Purc Undr $50002840000 1,771
-25,00025,000 25,00025,00016,256426200 Clothing/Linen/Safety Supplies2840000 10,898
-2,1002,100 2,1002,1001,950426710 Work Boot Reimbursement2840000 2,100
-3,500 3,5003,5000762Special Department Supplies2840000426800 3,500
-704704 704704344427100 Travel & Meeting Expense2840000 705
-9,0009,000 9,0009,000606427200 Training2840000 3,131
( .7) %32,06231,826 32,06231,82647,673428400 Liability Insurance2840000 37,278
( .4) %672,590767,354669,354 672,590Non-personnel Expenses Total 632,746638,642
-0 0023,3470Office Furniture & Equipment2840000462300 0
-10,00010,000 10,00010,0007,091463300 Off Furn & Equip Cap Lease2840000 6,380
-10,00010,00010,000 10,000Equipment Outlay Total 30,4396,380
(100.0)%0 1,133,458000General Fund Allocation Chgs2840000881100 0
(4.8) %70,30066,900 70,30066,90052,999882510 Utilization Chgs from 510 Fund2840000 57,000
(94.4) %1,203,75866,90066,900 70,300Charges From Others Total 52,99957,000
-0 00(172)(7,651)Interfund Services to 101 Fund2840000894101 0
-0 0Charges to Others Total 00(172)(7,651)
(29.3) %3,039,959 4,303,3163,105,9803,074,9592,959,9222,983,441Total Budget Requirements
CCReport Name: 2017_Mid_Cycle_Report
Report Description: Budget Book - Department Budget Detail wMD
06/07/2017Date:
Time: 92
Version:
Page:19:21:28
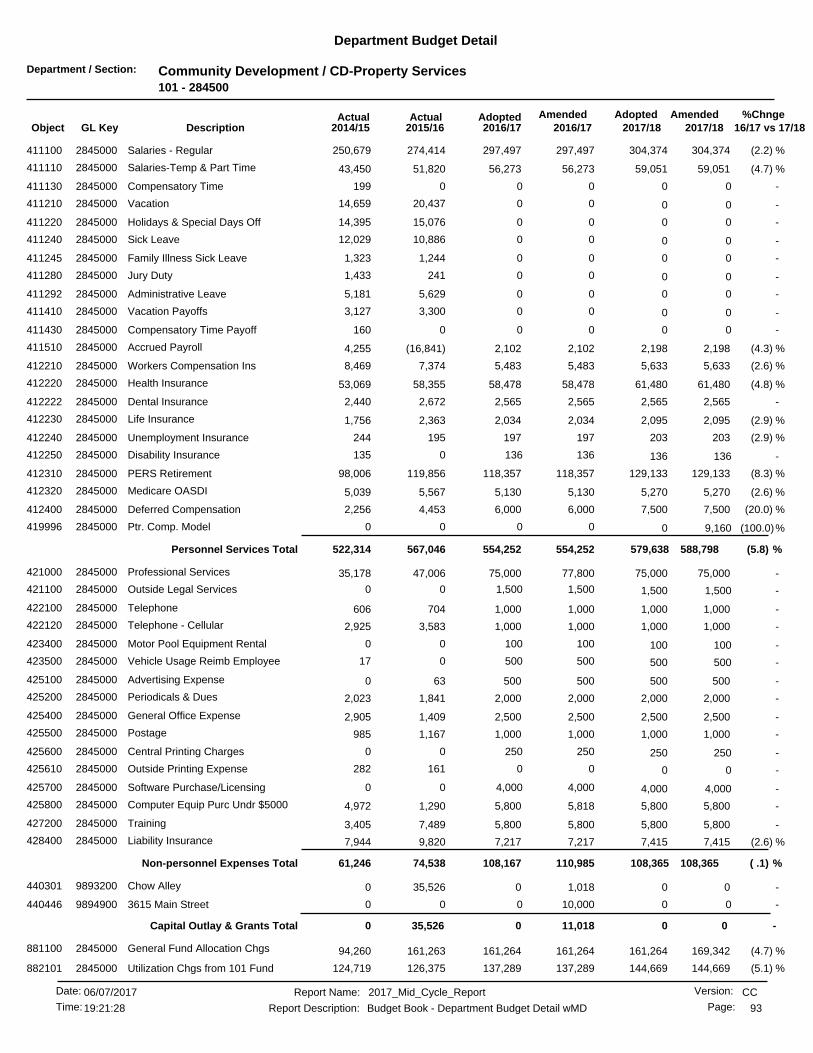
Department / Section: Community Development / CD-Property Services101 - 284500
Department Budget Detail
%Chnge16/17 vs 17/182017/182017/18
AmendedAdoptedAdopted2016/17
AmendedActualActual2016/172015/162014/15GL KeyObject Description
(2.2) %304,374297,497 304,374297,497274,414411100 Salaries - Regular2845000 250,679
(4.7) %59,05156,273 59,05156,27351,820411110 Salaries-Temp & Part Time2845000 43,450
-0 000199Compensatory Time2845000411130 0
-0 0020,43714,659Vacation2845000411210 0
-0 0015,07614,395Holidays & Special Days Off2845000411220 0
-0 0010,88612,029Sick Leave2845000411240 0
-0 001,2441,323Family Illness Sick Leave2845000411245 0
-0 002411,433Jury Duty2845000411280 0
-0 005,6295,181Administrative Leave2845000411292 0
-0 003,3003,127Vacation Payoffs2845000411410 0
-0 000160Compensatory Time Payoff2845000411430 0
(4.3) %2,1982,102 2,1982,102(16,841)411510 Accrued Payroll2845000 4,255
(2.6) %5,6335,483 5,6335,4837,374412210 Workers Compensation Ins2845000 8,469
(4.8) %61,48058,478 61,48058,47858,355412220 Health Insurance2845000 53,069
-2,5652,565 2,5652,5652,672412222 Dental Insurance2845000 2,440
(2.9) %2,0952,034 2,0952,0342,363412230 Life Insurance2845000 1,756
(2.9) %203197 203197195412240 Unemployment Insurance2845000 244
-136 1361360135Disability Insurance2845000412250 136
(8.3) %129,133118,357 129,133118,357119,856412310 PERS Retirement2845000 98,006
(2.6) %5,2705,130 5,2705,1305,567412320 Medicare OASDI2845000 5,039
(20.0) %7,5006,000 7,5006,0004,453412400 Deferred Compensation2845000 2,256
(100.0)%0 9,160000Ptr. Comp. Model2845000419996 0
(5.8) %588,798554,252554,252 579,638Personnel Services Total 567,046522,314
-75,00075,000 75,00077,80047,006421000 Professional Services2845000 35,178
-1,500 1,5001,50000Outside Legal Services2845000421100 1,500
-1,0001,000 1,0001,000704422100 Telephone2845000 606
-1,0001,000 1,0001,0003,583422120 Telephone - Cellular2845000 2,925
-100 10010000Motor Pool Equipment Rental2845000423400 100
-500 500500017Vehicle Usage Reimb Employee2845000423500 500
-500500 50050063425100 Advertising Expense2845000 0
-2,0002,000 2,0002,0001,841425200 Periodicals & Dues2845000 2,023
-2,5002,500 2,5002,5001,409425400 General Office Expense2845000 2,905
-1,0001,000 1,0001,0001,167425500 Postage2845000 985
-250 25025000Central Printing Charges2845000425600 250
-0 00161282Outside Printing Expense2845000425610 0
-4,000 4,0004,00000Software Purchase/Licensing2845000425700 4,000
-5,8005,800 5,8005,8181,290425800 Computer Equip Purc Undr $50002845000 4,972
-5,8005,800 5,8005,8007,489427200 Training2845000 3,405
(2.6) %7,4157,217 7,4157,2179,820428400 Liability Insurance2845000 7,944
( .1) %108,365110,985108,167 108,365Non-personnel Expenses Total 74,53861,246
-00 01,01835,526440301 Chow Alley9893200 0
-0 010,000003615 Main Street9894900440446 0
-0 0Capital Outlay & Grants Total 011,01835,5260
(4.7) %169,342161,264 161,264161,264161,263881100 General Fund Allocation Chgs2845000 94,260
(5.1) %144,669137,289 144,669137,289126,375882101 Utilization Chgs from 101 Fund2845000 124,719
CCReport Name: 2017_Mid_Cycle_Report
Report Description: Budget Book - Department Budget Detail wMD
06/07/2017Date:
Time: 93
Version:
Page:19:21:28
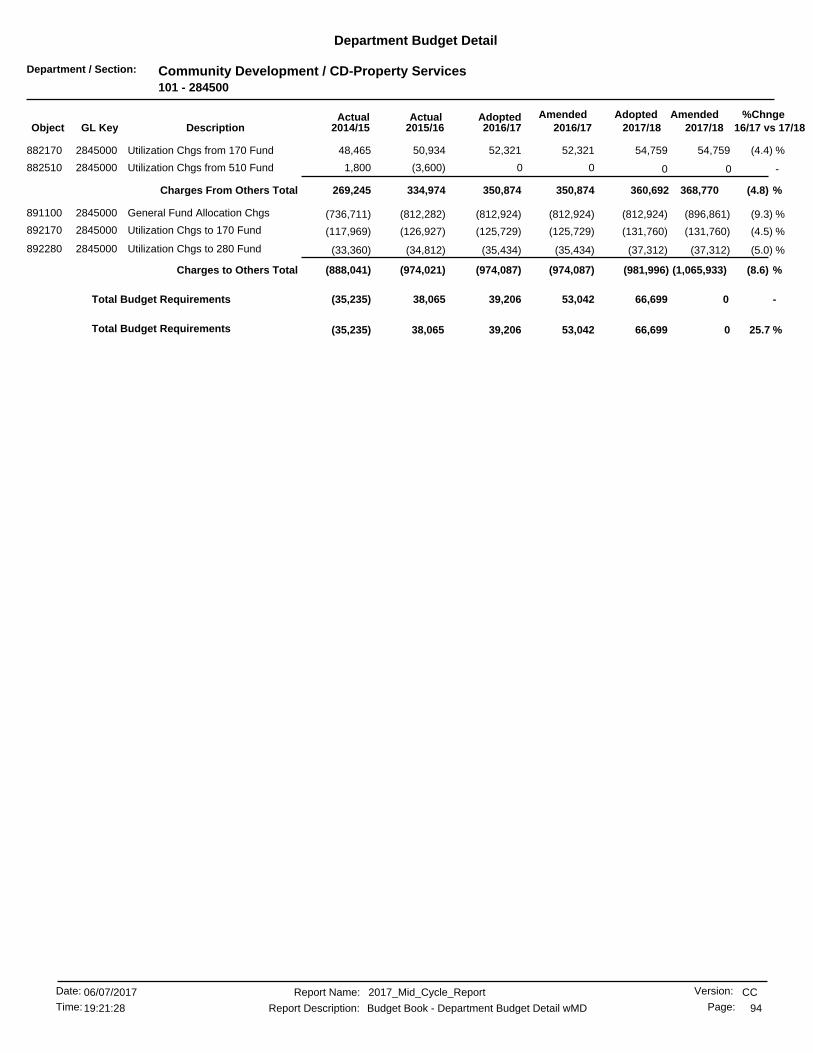
Department / Section: Community Development / CD-Property Services101 - 284500
Department Budget Detail
%Chnge16/17 vs 17/182017/182017/18
AmendedAdoptedAdopted2016/17
AmendedActualActual2016/172015/162014/15GL KeyObject Description
(4.4) %54,75952,321 54,75952,32150,934882170 Utilization Chgs from 170 Fund2845000 48,465
-0 00(3,600)1,800Utilization Chgs from 510 Fund2845000882510 0
(4.8) %368,770350,874350,874 360,692Charges From Others Total 334,974269,245
(9.3) %(896,861)(812,924) (812,924)(812,924)(812,282)891100 General Fund Allocation Chgs2845000 (736,711)
(4.5) %(131,760)(125,729) (131,760)(125,729)(126,927)892170 Utilization Chgs to 170 Fund2845000 (117,969)
(5.0) %(37,312)(35,434) (37,312)(35,434)(34,812)892280 Utilization Chgs to 280 Fund2845000 (33,360)
(8.6) %(1,065,933)(974,087)(974,087) (981,996)Charges to Others Total (974,021)(888,041)
-39,206 066,69953,04238,065(35,235)Total Budget Requirements
25.7 %039,206 66,69953,04238,065Total Budget Requirements (35,235)
CCReport Name: 2017_Mid_Cycle_Report
Report Description: Budget Book - Department Budget Detail wMD
06/07/2017Date:
Time: 94
Version:
Page:19:21:28

Department / Section: Community Development / CD-Homeless Svcs Campus101 - 285530
Department Budget Detail
%Chnge16/17 vs 17/182017/182017/18
AmendedAdoptedAdopted2016/17
AmendedActualActual2016/172015/162014/15GL KeyObject Description
-00 01,13711,691421001 Prof Services/Internal2855304 0
-0 000513Telephone - Cellular2855304422120 0
-78,47378,473 78,473293,43584,515424130 Maint/Repair of Bldgs & Improv2855301 71,682
-68,40068,400 68,40070,15054,711424130 Maint/Repair of Bldgs & Improv2855304 78,352
-0 0002,239General Office Expense2855304425400 0
(24.4) %2,4401,843 2,4401,2021,246428420 Insurance Charges - Direct2855300 1,011
( .3) %149,313365,924148,716 149,313Non-personnel Expenses Total 152,163153,798
(100.0)%0 13,984000General Fund Allocation Chgs2855300881100 0
-0 00019,774General Fund Allocation Chgs2855301881100 0
(5.4) %7,4007,000 7,4007,0005,499882510 Utilization Chgs from 510 Fund2855300 4,599
(67.2) %21,3847,0007,000 7,400Charges From Others Total 5,49924,374
(8.7) %155,716 170,697156,713372,924157,663178,173Total Budget Requirements
CCReport Name: 2017_Mid_Cycle_Report
Report Description: Budget Book - Department Budget Detail wMD
06/07/2017Date:
Time: 95
Version:
Page:19:21:28

Department / Section: Community Development / CD-Outreach Homeless Services101 - 285531
Department Budget Detail
%Chnge16/17 vs 17/182017/182017/18
AmendedAdoptedAdopted2016/17
AmendedActualActual2016/172015/162014/15GL KeyObject Description
(4.7) %98,66393,967 98,66393,96775,786411100 Salaries - Regular2855310 45,929
-0 004,366994Salaries-Temp & Part Time2855310411110 0
-0 000135Compensatory Time2855310411130 0
-0 005,232818Vacation2855310411210 0
-0 003,3152,406Holidays & Special Days Off2855310411220 0
-0 002,6602,060Sick Leave2855310411240 0
-0 001120Family Illness Sick Leave2855310411245 0
-0 00153225Administrative Leave2855310411292 0
(6.6) %615574 615574(3,697)411510 Accrued Payroll2855310 3,697
(4.8) %1,5301,456 1,5301,4562,070412210 Workers Compensation Ins2855310 2,275
(6.5) %28,28926,429 28,28926,42929,867412220 Health Insurance2855310 15,728
-1,6201,620 1,6201,6201,578412222 Dental Insurance2855310 855
(5.0) %256243 256243492412230 Life Insurance2855310 116
(5.5) %5451 545154412240 Unemployment Insurance2855310 66
-408408 408408282412250 Disability Insurance2855310 219
(12.1) %24,56721,591 24,56721,59119,277412310 PERS Retirement2855310 9,727
(4.8) %1,4311,362 1,4311,3621,332412320 Medicare OASDI2855310 738
(20.0)%3,600 4,5003,60000Deferred Compensation2855310412400 4,500
-0 000518Overtime At 1.5 Rate2855310413120 0
(100.0)%0 4,171000Ptr. Comp. Model2855310419996 0
(8.9) %166,104151,301151,301 161,933Personnel Services Total 142,88586,512
-90,23790,237 90,23790,237102,883421000 Professional Services2855310 66,116
-2,5002,500 2,5002,5004,239422120 Telephone - Cellular2855310 5,216
-9,0009,000 9,0009,00011,452423400 Motor Pool Equipment Rental2855310 13,139
-0 002,3462,520Maint/Repair of Bldgs & Improv2855310424130 0
-15,000 15,00015,00006,538General Office Expense2855310425400 15,000
-0 00176740Outside Printing Expense2855310425610 0
(4.7) %2,0131,917 2,0131,9172,757428400 Liability Insurance2855310 2,134
( .0) %118,750118,654118,654 118,750Non-personnel Expenses Total 123,85596,406
-0 0063,28269,645Riverside Emergency Shelter2855310453056 0
-0 08540145Hulen Campus Pet Kennel2855310453606 0
-0 0Special Projects Total 085463,28269,791
(100.0)%0 2,924000General Fund Allocation Chgs2855310881100 0
(3.7) %39,13137,674 39,13137,67429,412882280 Utilization Chgs from 280 Fund2855310 61,443
(10.4) %42,05537,67437,674 39,131Charges From Others Total 29,41261,443
-(28,233) (28,233)(28,233)00Interfund Services to 101 Fund2855310894101 (28,233)
-0 00(44,473)(1,985)Interfund Services to 223 Fund2855310894223 0
-(28,233)(28,233)(28,233) (28,233)Charges to Others Total (44,473)(1,985)
(6.4) %279,396 298,676291,581280,250314,962312,167Total Budget Requirements
CCReport Name: 2017_Mid_Cycle_Report
Report Description: Budget Book - Department Budget Detail wMD
06/07/2017Date:
Time: 96
Version:
Page:19:21:28

Department / Section: Community Development / CD-Debt101 - 289000
Department Budget Detail
%Chnge16/17 vs 17/182017/182017/18
AmendedAdoptedAdopted2016/17
AmendedActualActual2016/172015/162014/15GL KeyObject Description
-0455,904 465,834455,904192,511882101 Utilization Chgs from 101 Fund2890000 179,967
(100.0)%0 374,501000Utilization Chgs from 390 Fund2890000882390 0
21.7 %374,501455,904455,904 465,834Charges From Others Total 192,511179,967
21.7 %455,904 374,501465,834455,904192,511179,967Total Budget Requirements
CCReport Name: 2017_Mid_Cycle_Report
Report Description: Budget Book - Department Budget Detail wMD
06/07/2017Date:
Time: 97
Version:
Page:19:21:28

Department / Section: Community Development / CD-Managed Savings101 - 289900
Department Budget Detail
%Chnge16/17 vs 17/182017/182017/18
AmendedAdoptedAdopted2016/17
AmendedActualActual2016/172015/162014/15GL KeyObject Description
-(400,000) (400,000)(400,000)00Managed Savings Allocation2899000499999 (400,000)
-(400,000) (400,000)Managed Savings Total (400,000)(400,000)00
-(400,000)(400,000) (400,000)(400,000)0Total Budget Requirements 0
CCReport Name: 2017_Mid_Cycle_Report
Report Description: Budget Book - Department Budget Detail wMD
06/07/2017Date:
Time: 98
Version:
Page:19:21:28
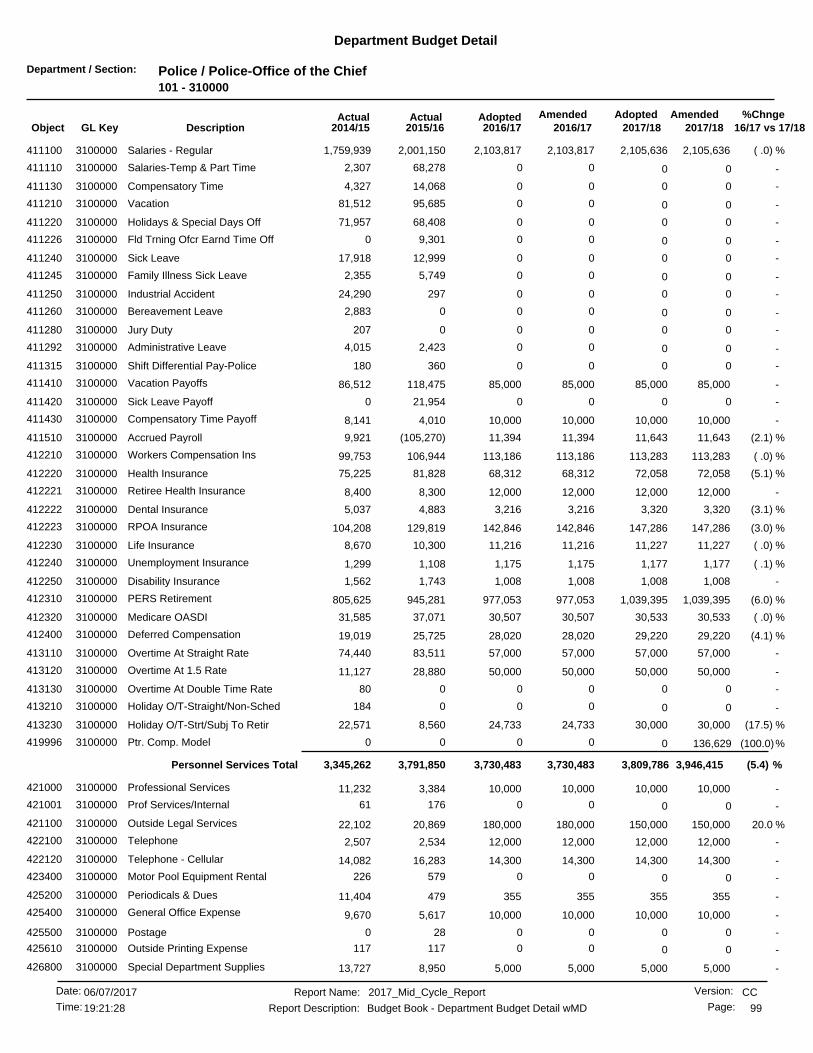
Department / Section: Police / Police-Office of the Chief101 - 310000
Department Budget Detail
%Chnge16/17 vs 17/182017/182017/18
AmendedAdoptedAdopted2016/17
AmendedActualActual2016/172015/162014/15GL KeyObject Description
( .0) %2,105,6362,103,817 2,105,6362,103,8172,001,150411100 Salaries - Regular3100000 1,759,939
-0 0068,2782,307Salaries-Temp & Part Time3100000411110 0
-0 0014,0684,327Compensatory Time3100000411130 0
-0 0095,68581,512Vacation3100000411210 0
-0 0068,40871,957Holidays & Special Days Off3100000411220 0
-0 009,3010Fld Trning Ofcr Earnd Time Off3100000411226 0
-0 0012,99917,918Sick Leave3100000411240 0
-0 005,7492,355Family Illness Sick Leave3100000411245 0
-0 0029724,290Industrial Accident3100000411250 0
-0 0002,883Bereavement Leave3100000411260 0
-0 000207Jury Duty3100000411280 0
-0 002,4234,015Administrative Leave3100000411292 0
-0 00360180Shift Differential Pay-Police3100000411315 0
-85,00085,000 85,00085,000118,475411410 Vacation Payoffs3100000 86,512
-0 0021,9540Sick Leave Payoff3100000411420 0
-10,00010,000 10,00010,0004,010411430 Compensatory Time Payoff3100000 8,141
(2.1) %11,64311,394 11,64311,394(105,270)411510 Accrued Payroll3100000 9,921
( .0) %113,283113,186 113,283113,186106,944412210 Workers Compensation Ins3100000 99,753
(5.1) %72,05868,312 72,05868,31281,828412220 Health Insurance3100000 75,225
-12,00012,000 12,00012,0008,300412221 Retiree Health Insurance3100000 8,400
(3.1) %3,3203,216 3,3203,2164,883412222 Dental Insurance3100000 5,037
(3.0) %147,286142,846 147,286142,846129,819412223 RPOA Insurance3100000 104,208
( .0) %11,22711,216 11,22711,21610,300412230 Life Insurance3100000 8,670
( .1) %1,1771,175 1,1771,1751,108412240 Unemployment Insurance3100000 1,299
-1,0081,008 1,0081,0081,743412250 Disability Insurance3100000 1,562
(6.0) %1,039,395977,053 1,039,395977,053945,281412310 PERS Retirement3100000 805,625
( .0) %30,53330,507 30,53330,50737,071412320 Medicare OASDI3100000 31,585
(4.1) %29,22028,020 29,22028,02025,725412400 Deferred Compensation3100000 19,019
-57,00057,000 57,00057,00083,511413110 Overtime At Straight Rate3100000 74,440
-50,00050,000 50,00050,00028,880413120 Overtime At 1.5 Rate3100000 11,127
-0 00080Overtime At Double Time Rate3100000413130 0
-0 000184Holiday O/T-Straight/Non-Sched3100000413210 0
(17.5) %30,00024,733 30,00024,7338,560413230 Holiday O/T-Strt/Subj To Retir3100000 22,571
(100.0)%0 136,629000Ptr. Comp. Model3100000419996 0
(5.4) %3,946,4153,730,4833,730,483 3,809,786Personnel Services Total 3,791,8503,345,262
-10,00010,000 10,00010,0003,384421000 Professional Services3100000 11,232
-0 0017661Prof Services/Internal3100000421001 0
20.0 %150,000180,000 150,000180,00020,869421100 Outside Legal Services3100000 22,102
-12,00012,000 12,00012,0002,534422100 Telephone3100000 2,507
-14,30014,300 14,30014,30016,283422120 Telephone - Cellular3100000 14,082
-0 00579226Motor Pool Equipment Rental3100000423400 0
-355355 355355479425200 Periodicals & Dues3100000 11,404
-10,00010,000 10,00010,0005,617425400 General Office Expense3100000 9,670
-0 00280Postage3100000425500 0
-0 00117117Outside Printing Expense3100000425610 0
-5,0005,000 5,0005,0008,950426800 Special Department Supplies3100000 13,727
CCReport Name: 2017_Mid_Cycle_Report
Report Description: Budget Book - Department Budget Detail wMD
06/07/2017Date:
Time: 99
Version:
Page:19:21:28
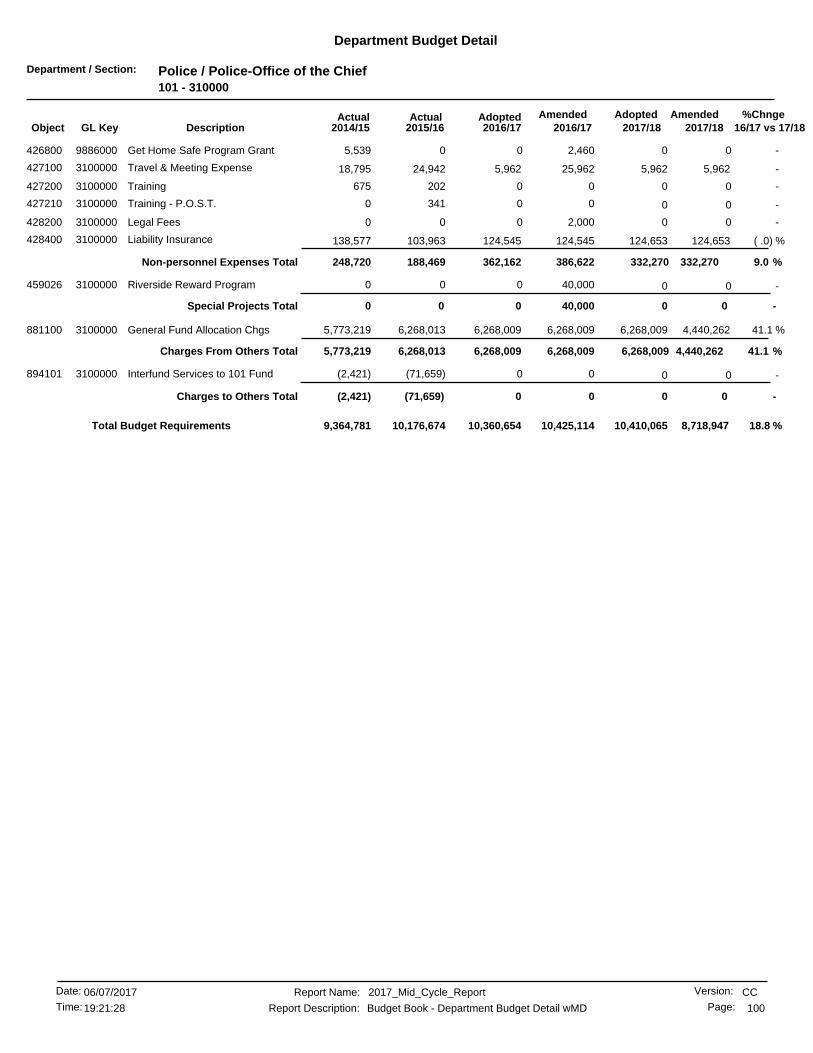
Department / Section: Police / Police-Office of the Chief101 - 310000
Department Budget Detail
%Chnge16/17 vs 17/182017/182017/18
AmendedAdoptedAdopted2016/17
AmendedActualActual2016/172015/162014/15GL KeyObject Description
-0 02,46005,539Get Home Safe Program Grant9886000426800 0
-5,9625,962 5,96225,96224,942427100 Travel & Meeting Expense3100000 18,795
-0 00202675Training3100000427200 0
-0 003410Training - P.O.S.T.3100000427210 0
-0 02,00000Legal Fees3100000428200 0
( .0) %124,653124,545 124,653124,545103,963428400 Liability Insurance3100000 138,577
9.0 %332,270386,622362,162 332,270Non-personnel Expenses Total 188,469248,720
-0 040,00000Riverside Reward Program3100000459026 0
-0 0Special Projects Total 040,00000
41.1 %4,440,2626,268,009 6,268,0096,268,0096,268,013881100 General Fund Allocation Chgs3100000 5,773,219
41.1 %4,440,2626,268,0096,268,009 6,268,009Charges From Others Total 6,268,0135,773,219
-0 00(71,659)(2,421)Interfund Services to 101 Fund3100000894101 0
-0 0Charges to Others Total 00(71,659)(2,421)
18.8 %10,360,654 8,718,94710,410,06510,425,11410,176,6749,364,781Total Budget Requirements
CCReport Name: 2017_Mid_Cycle_Report
Report Description: Budget Book - Department Budget Detail wMD
06/07/2017Date:
Time: 100
Version:
Page:19:21:28

Department / Section: Police / Police-Capital101 - 319500
Department Budget Detail
%Chnge16/17 vs 17/182017/182017/18
AmendedAdoptedAdopted2016/17
AmendedActualActual2016/172015/162014/15GL KeyObject Description
-00 012,01720,276462100 14/15 Cap Lease-PD Vehicles9885530 1,956,947
-0 0Equipment Outlay Total 012,01720,2761,956,947
-0 0067,939742,576PD-CAD Hardware/Software-Chase9868800440301 0
-0 00199,916014/15 Cap Lease-PD Hardware9885540440301 0
-0 0Capital Outlay & Grants Total 00267,855742,576
-0 0012,017288,1322,699,523Total Budget Requirements
(100.0) %00 012,017288,132Total Budget Requirements 2,699,523
CCReport Name: 2017_Mid_Cycle_Report
Report Description: Budget Book - Department Budget Detail wMD
06/07/2017Date:
Time: 101
Version:
Page:19:21:28
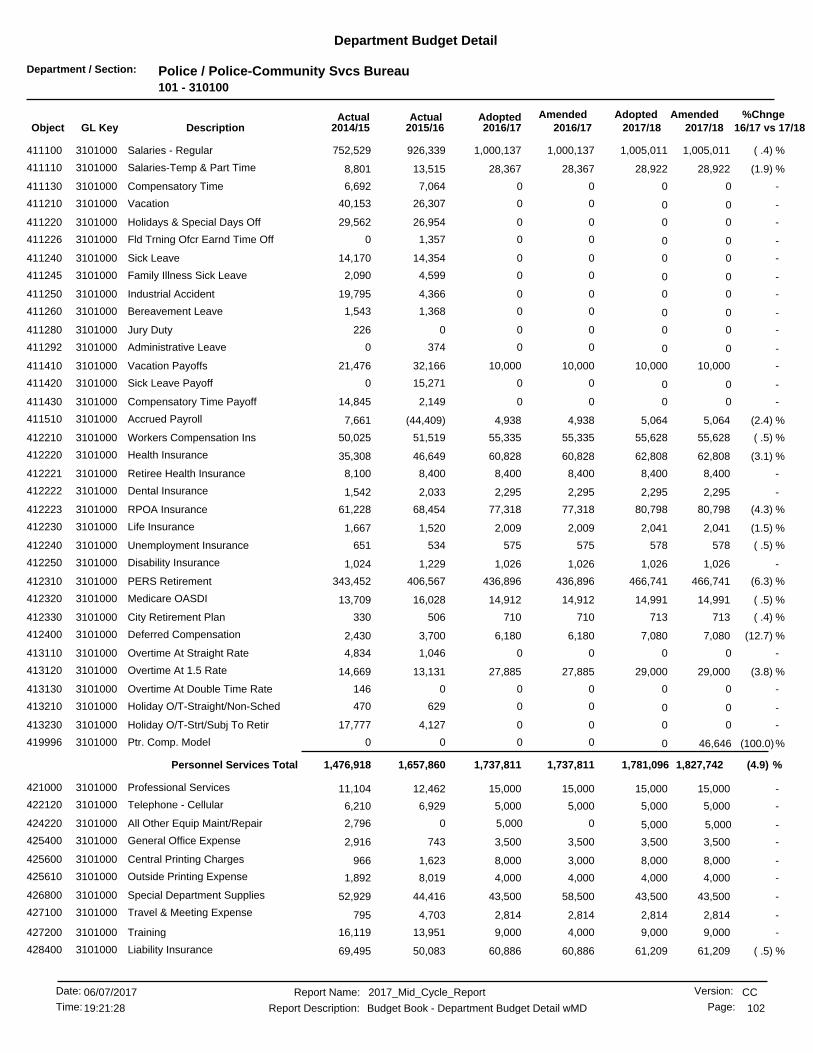
Department / Section: Police / Police-Community Svcs Bureau101 - 310100
Department Budget Detail
%Chnge16/17 vs 17/182017/182017/18
AmendedAdoptedAdopted2016/17
AmendedActualActual2016/172015/162014/15GL KeyObject Description
( .4) %1,005,0111,000,137 1,005,0111,000,137926,339411100 Salaries - Regular3101000 752,529
(1.9) %28,92228,367 28,92228,36713,515411110 Salaries-Temp & Part Time3101000 8,801
-0 007,0646,692Compensatory Time3101000411130 0
-0 0026,30740,153Vacation3101000411210 0
-0 0026,95429,562Holidays & Special Days Off3101000411220 0
-0 001,3570Fld Trning Ofcr Earnd Time Off3101000411226 0
-0 0014,35414,170Sick Leave3101000411240 0
-0 004,5992,090Family Illness Sick Leave3101000411245 0
-0 004,36619,795Industrial Accident3101000411250 0
-0 001,3681,543Bereavement Leave3101000411260 0
-0 000226Jury Duty3101000411280 0
-0 003740Administrative Leave3101000411292 0
-10,00010,000 10,00010,00032,166411410 Vacation Payoffs3101000 21,476
-0 0015,2710Sick Leave Payoff3101000411420 0
-0 002,14914,845Compensatory Time Payoff3101000411430 0
(2.4) %5,0644,938 5,0644,938(44,409)411510 Accrued Payroll3101000 7,661
( .5) %55,62855,335 55,62855,33551,519412210 Workers Compensation Ins3101000 50,025
(3.1) %62,80860,828 62,80860,82846,649412220 Health Insurance3101000 35,308
-8,4008,400 8,4008,4008,400412221 Retiree Health Insurance3101000 8,100
-2,2952,295 2,2952,2952,033412222 Dental Insurance3101000 1,542
(4.3) %80,79877,318 80,79877,31868,454412223 RPOA Insurance3101000 61,228
(1.5) %2,0412,009 2,0412,0091,520412230 Life Insurance3101000 1,667
( .5) %578575 578575534412240 Unemployment Insurance3101000 651
-1,0261,026 1,0261,0261,229412250 Disability Insurance3101000 1,024
(6.3) %466,741436,896 466,741436,896406,567412310 PERS Retirement3101000 343,452
( .5) %14,99114,912 14,99114,91216,028412320 Medicare OASDI3101000 13,709
( .4) %713710 713710506412330 City Retirement Plan3101000 330
(12.7) %7,0806,180 7,0806,1803,700412400 Deferred Compensation3101000 2,430
-0 001,0464,834Overtime At Straight Rate3101000413110 0
(3.8) %29,00027,885 29,00027,88513,131413120 Overtime At 1.5 Rate3101000 14,669
-0 000146Overtime At Double Time Rate3101000413130 0
-0 00629470Holiday O/T-Straight/Non-Sched3101000413210 0
-0 004,12717,777Holiday O/T-Strt/Subj To Retir3101000413230 0
(100.0)%0 46,646000Ptr. Comp. Model3101000419996 0
(4.9) %1,827,7421,737,8111,737,811 1,781,096Personnel Services Total 1,657,8601,476,918
-15,00015,000 15,00015,00012,462421000 Professional Services3101000 11,104
-5,0005,000 5,0005,0006,929422120 Telephone - Cellular3101000 6,210
-5,000 5,000002,796All Other Equip Maint/Repair3101000424220 5,000
-3,5003,500 3,5003,500743425400 General Office Expense3101000 2,916
-8,0008,000 8,0003,0001,623425600 Central Printing Charges3101000 966
-4,0004,000 4,0004,0008,019425610 Outside Printing Expense3101000 1,892
-43,50043,500 43,50058,50044,416426800 Special Department Supplies3101000 52,929
-2,8142,814 2,8142,8144,703427100 Travel & Meeting Expense3101000 795
-9,0009,000 9,0004,00013,951427200 Training3101000 16,119
( .5) %61,20960,886 61,20960,88650,083428400 Liability Insurance3101000 69,495
CCReport Name: 2017_Mid_Cycle_Report
Report Description: Budget Book - Department Budget Detail wMD
06/07/2017Date:
Time: 102
Version:
Page:19:21:28
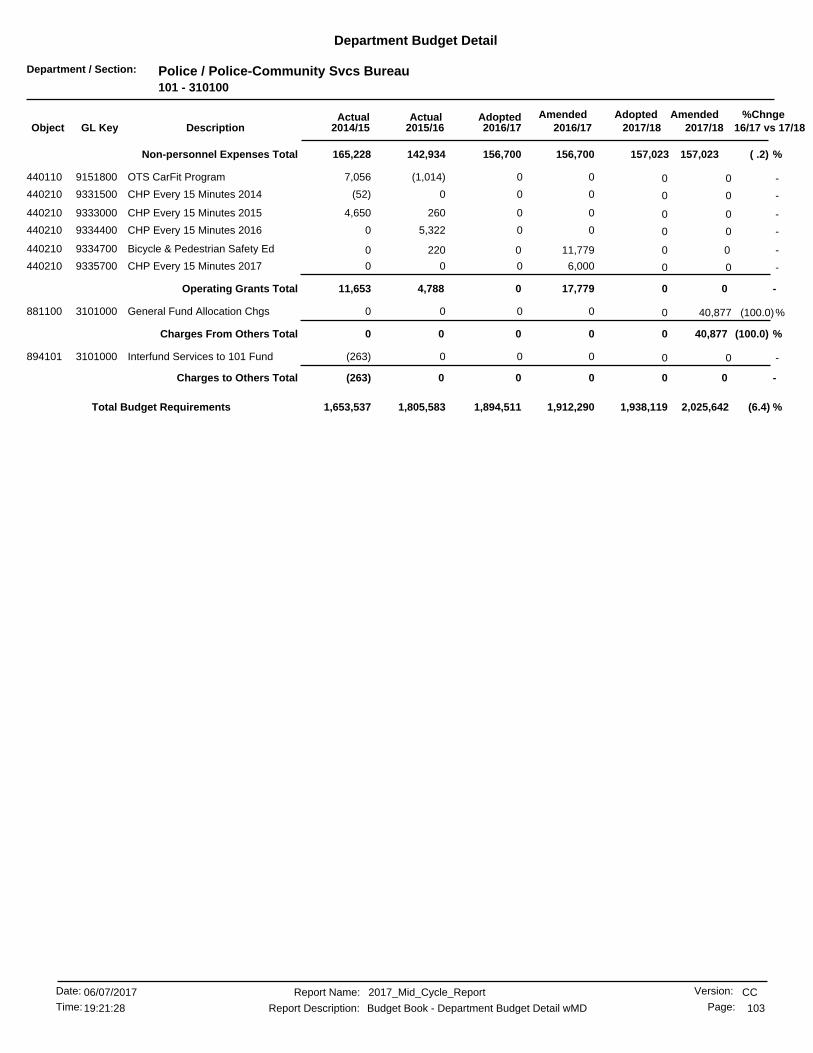
Department / Section: Police / Police-Community Svcs Bureau101 - 310100
Department Budget Detail
%Chnge16/17 vs 17/182017/182017/18
AmendedAdoptedAdopted2016/17
AmendedActualActual2016/172015/162014/15GL KeyObject Description
( .2) %157,023156,700156,700 157,023Non-personnel Expenses Total 142,934165,228
-0 00(1,014)7,056OTS CarFit Program9151800440110 0
-0 000(52)CHP Every 15 Minutes 20149331500440210 0
-0 002604,650CHP Every 15 Minutes 20159333000440210 0
-0 005,3220CHP Every 15 Minutes 20169334400440210 0
-00 011,779220440210 Bicycle & Pedestrian Safety Ed9334700 0
-0 06,00000CHP Every 15 Minutes 20179335700440210 0
-0 0Operating Grants Total 017,7794,78811,653
(100.0)%0 40,877000General Fund Allocation Chgs3101000881100 0
(100.0) %0 40,877Charges From Others Total 0000
-0 000(263)Interfund Services to 101 Fund3101000894101 0
-0 0Charges to Others Total 000(263)
(6.4) %1,894,511 2,025,6421,938,1191,912,2901,805,5831,653,537Total Budget Requirements
CCReport Name: 2017_Mid_Cycle_Report
Report Description: Budget Book - Department Budget Detail wMD
06/07/2017Date:
Time: 103
Version:
Page:19:21:28

Department / Section: Police / Police-Support Services101 - 310200
Department Budget Detail
%Chnge16/17 vs 17/182017/182017/18
AmendedAdoptedAdopted2016/17
AmendedActualActual2016/172015/162014/15GL KeyObject Description
(1.2) %4,019,5163,969,429 4,019,5163,969,4293,486,071411100 Salaries - Regular3102000 1,427,293
(4.1) %228,510219,046 228,510219,046307,274411110 Salaries-Temp & Part Time3102000 297,895
-0 0065,2658,332Compensatory Time3102000411130 0
-0 00194,93052,605Vacation3102000411210 0
-0 00122,80856,980Holidays & Special Days Off3102000411220 0
-0 0015,1929,309Fld Trning Ofcr Earnd Time Off3102000411226 0
-0 0011,5960Military Leave3102000411230 0
-0 0068,41312,619Sick Leave3102000411240 0
-0 0027,8622,816Family Illness Sick Leave3102000411245 0
-0 001,3086,676Industrial Accident3102000411250 0
-0 001,1371,156Bereavement Leave3102000411260 0
-0 001,5610Jury Duty3102000411280 0
-0 007,2510Administrative Leave3102000411292 0
-0 003,0243,924Shift Differential Pay-Police3102000411315 0
-0 007590Temporary Foreman Pay3102000411320 0
-50,00050,000 50,00050,00087,622411410 Vacation Payoffs3102000 84,196
-0 00077,026Sick Leave Payoff3102000411420 0
-11,13011,130 11,13011,13018,979411430 Compensatory Time Payoff3102000 13,581
(3.1) %22,58221,876 22,58221,876(151,529)411510 Accrued Payroll3102000 67,092
(1.4) %228,542225,337 228,542225,337231,012412210 Workers Compensation Ins3102000 96,819
(4.3) %498,108476,468 498,108476,468431,278412220 Health Insurance3102000 38,807
-14,40014,400 14,40014,40014,100412221 Retiree Health Insurance3102000 14,200
(1.3) %22,35922,060 22,35922,06020,584412222 Dental Insurance3102000 1,598
(4.1) %178,221170,841 178,221170,841153,709412223 RPOA Insurance3102000 139,147
(1.0) %9,8119,709 9,8119,7099,023412230 Life Insurance3102000 3,969
(1.4) %2,3702,336 2,3702,3362,395412240 Unemployment Insurance3102000 1,261
-6,5186,518 6,5186,5187,053412250 Disability Insurance3102000 2,323
(7.2) %1,541,4181,429,313 1,541,4181,429,3131,305,308412310 PERS Retirement3102000 632,809
(1.2) %57,06656,376 57,06656,37665,025412320 Medicare OASDI3102000 29,340
(4.7) %7,8807,507 7,8807,5076,053412330 City Retirement Plan3102000 6,265
(10.7) %27,90024,900 27,90024,90021,637412400 Deferred Compensation3102000 10,494
-0 004,6960Overtime At Straight Rate3102000413110 0
-88,00088,000 88,00088,000158,701413120 Overtime At 1.5 Rate3102000 66,378
-0 001,68960Overtime At Double Time Rate3102000413130 0
-0 006,223528Holiday O/T-Straight/Non-Sched3102000413210 0
(13.0) %37,75032,839 37,75032,8395,285413230 Holiday O/T-Strt/Subj To Retir3102000 34,038
-0 00880O/T 1.5 Rate Sub To Retirement3102000413240 0
-0 002300Police Special Event Program3102000413330 0
(100.0)%0 210,850000Ptr. Comp. Model3102000419996 0
(5.8) %7,262,9316,838,0856,838,085 7,052,081Personnel Services Total 6,713,6263,199,550
-146,117146,117 146,117125,839157,162421000 Professional Services3102000 18,507
-0 000130Prof Services/Internal3102000421001 0
-4,0004,000 4,0004,0001,596422100 Telephone3102000 1,944
-12,04012,040 12,04012,0407,051422120 Telephone - Cellular3102000 5,155
-2,0002,000 2,0002,0004,345423500 Vehicle Usage Reimb Employee3102000 3,979
-0 001040Maint/Repair of Bldgs & Improv3102000424130 0
CCReport Name: 2017_Mid_Cycle_Report
Report Description: Budget Book - Department Budget Detail wMD
06/07/2017Date:
Time: 104
Version:
Page:19:21:28
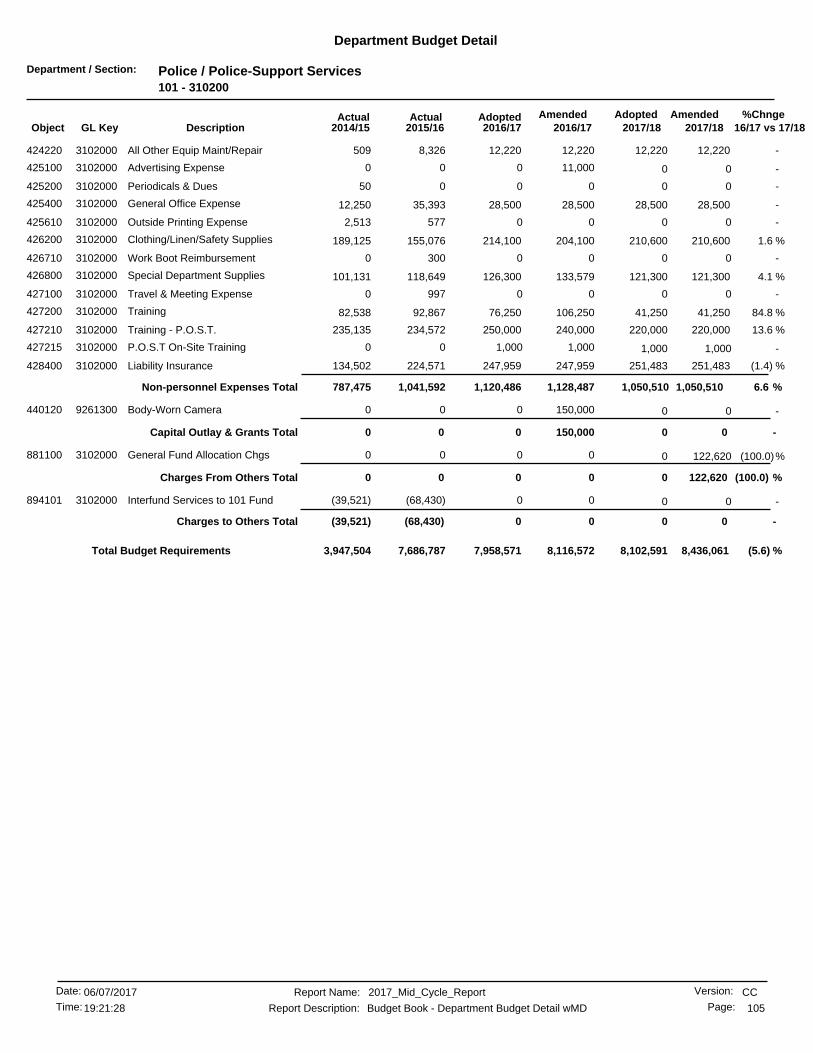
Department / Section: Police / Police-Support Services101 - 310200
Department Budget Detail
%Chnge16/17 vs 17/182017/182017/18
AmendedAdoptedAdopted2016/17
AmendedActualActual2016/172015/162014/15GL KeyObject Description
-12,22012,220 12,22012,2208,326424220 All Other Equip Maint/Repair3102000 509
-0 011,00000Advertising Expense3102000425100 0
-0 00050Periodicals & Dues3102000425200 0
-28,50028,500 28,50028,50035,393425400 General Office Expense3102000 12,250
-0 005772,513Outside Printing Expense3102000425610 0
1.6 %210,600214,100 210,600204,100155,076426200 Clothing/Linen/Safety Supplies3102000 189,125
-0 003000Work Boot Reimbursement3102000426710 0
4.1 %121,300126,300 121,300133,579118,649426800 Special Department Supplies3102000 101,131
-0 009970Travel & Meeting Expense3102000427100 0
84.8 %41,25076,250 41,250106,25092,867427200 Training3102000 82,538
13.6 %220,000250,000 220,000240,000234,572427210 Training - P.O.S.T.3102000 235,135
-1,000 1,0001,00000P.O.S.T On-Site Training3102000427215 1,000
(1.4) %251,483247,959 251,483247,959224,571428400 Liability Insurance3102000 134,502
6.6 %1,050,5101,128,4871,120,486 1,050,510Non-personnel Expenses Total 1,041,592787,475
-0 0150,00000Body-Worn Camera9261300440120 0
-0 0Capital Outlay & Grants Total 0150,00000
(100.0)%0 122,620000General Fund Allocation Chgs3102000881100 0
(100.0) %0 122,620Charges From Others Total 0000
-0 00(68,430)(39,521)Interfund Services to 101 Fund3102000894101 0
-0 0Charges to Others Total 00(68,430)(39,521)
(5.6) %7,958,571 8,436,0618,102,5918,116,5727,686,7873,947,504Total Budget Requirements
CCReport Name: 2017_Mid_Cycle_Report
Report Description: Budget Book - Department Budget Detail wMD
06/07/2017Date:
Time: 105
Version:
Page:19:21:28
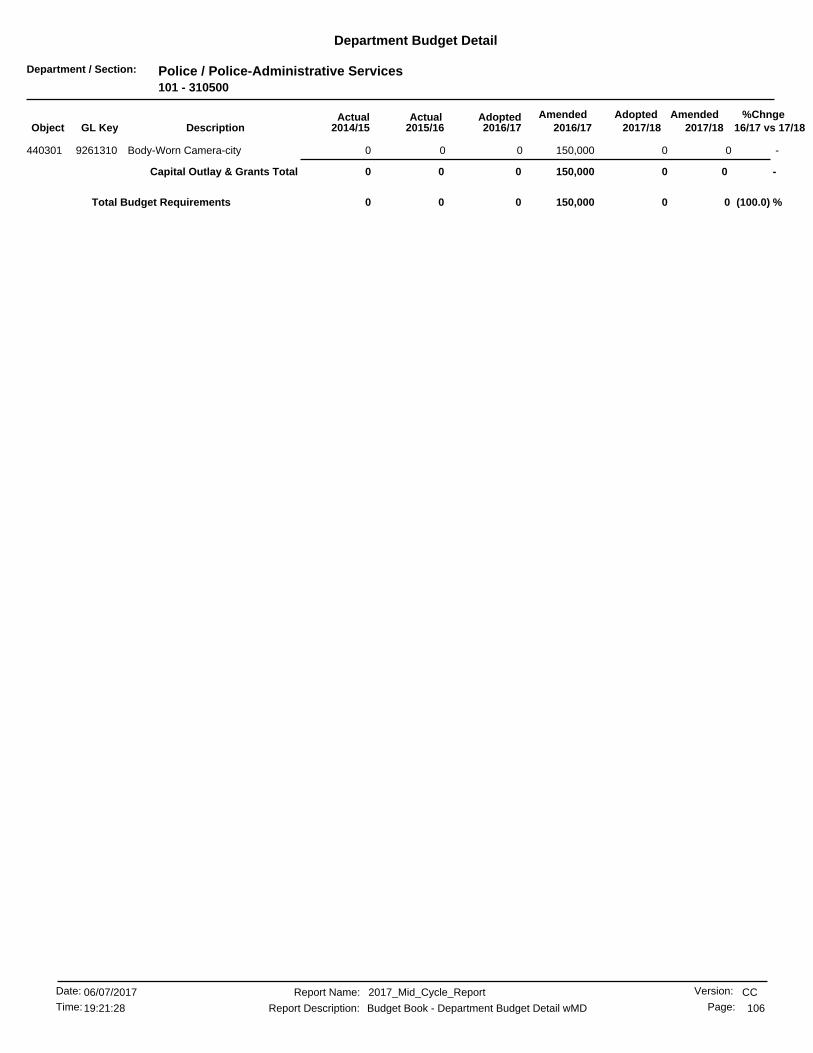
Department / Section: Police / Police-Administrative Services101 - 310500
Department Budget Detail
%Chnge16/17 vs 17/182017/182017/18
AmendedAdoptedAdopted2016/17
AmendedActualActual2016/172015/162014/15GL KeyObject Description
-0 0150,00000Body-Worn Camera-city9261310440301 0
-0 0Capital Outlay & Grants Total 0150,00000
(100.0) %00 0150,0000Total Budget Requirements 0
CCReport Name: 2017_Mid_Cycle_Report
Report Description: Budget Book - Department Budget Detail wMD
06/07/2017Date:
Time: 106
Version:
Page:19:21:28
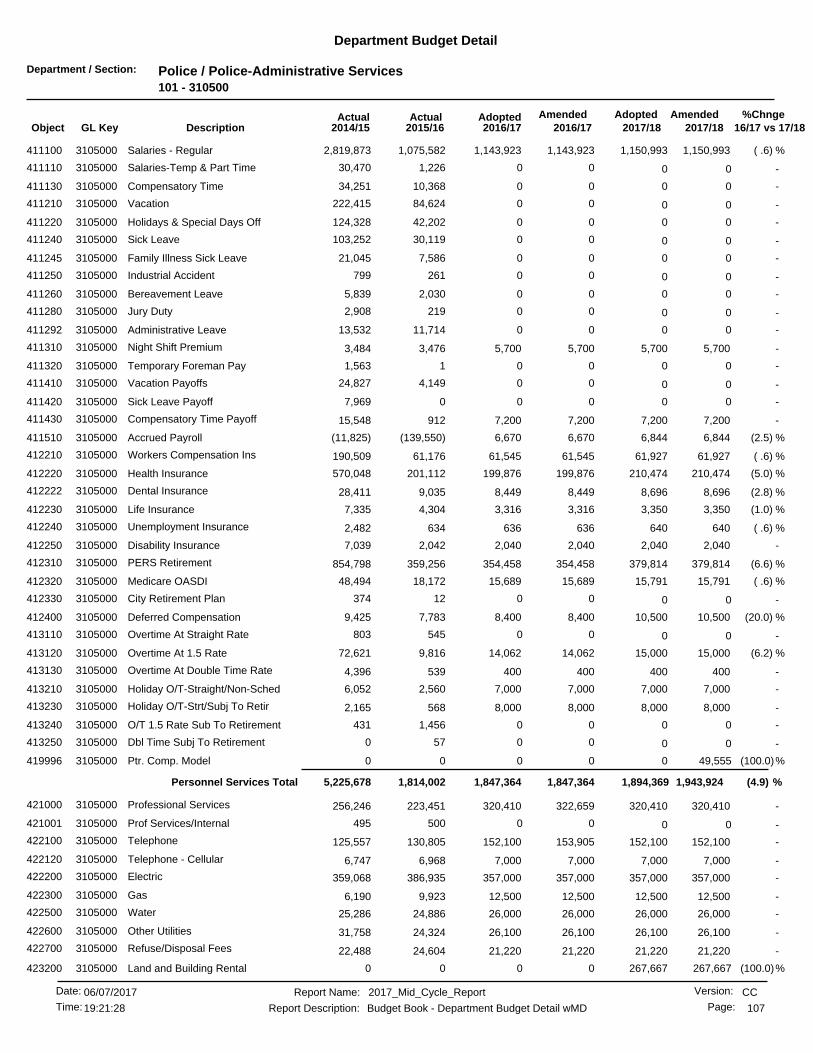
Department / Section: Police / Police-Administrative Services101 - 310500
Department Budget Detail
%Chnge16/17 vs 17/182017/182017/18
AmendedAdoptedAdopted2016/17
AmendedActualActual2016/172015/162014/15GL KeyObject Description
( .6) %1,150,9931,143,923 1,150,9931,143,9231,075,582411100 Salaries - Regular3105000 2,819,873
-0 001,22630,470Salaries-Temp & Part Time3105000411110 0
-0 0010,36834,251Compensatory Time3105000411130 0
-0 0084,624222,415Vacation3105000411210 0
-0 0042,202124,328Holidays & Special Days Off3105000411220 0
-0 0030,119103,252Sick Leave3105000411240 0
-0 007,58621,045Family Illness Sick Leave3105000411245 0
-0 00261799Industrial Accident3105000411250 0
-0 002,0305,839Bereavement Leave3105000411260 0
-0 002192,908Jury Duty3105000411280 0
-0 0011,71413,532Administrative Leave3105000411292 0
-5,7005,700 5,7005,7003,476411310 Night Shift Premium3105000 3,484
-0 0011,563Temporary Foreman Pay3105000411320 0
-0 004,14924,827Vacation Payoffs3105000411410 0
-0 0007,969Sick Leave Payoff3105000411420 0
-7,2007,200 7,2007,200912411430 Compensatory Time Payoff3105000 15,548
(2.5) %6,8446,670 6,8446,670(139,550)411510 Accrued Payroll3105000 (11,825)
( .6) %61,92761,545 61,92761,54561,176412210 Workers Compensation Ins3105000 190,509
(5.0) %210,474199,876 210,474199,876201,112412220 Health Insurance3105000 570,048
(2.8) %8,6968,449 8,6968,4499,035412222 Dental Insurance3105000 28,411
(1.0) %3,3503,316 3,3503,3164,304412230 Life Insurance3105000 7,335
( .6) %640636 640636634412240 Unemployment Insurance3105000 2,482
-2,0402,040 2,0402,0402,042412250 Disability Insurance3105000 7,039
(6.6) %379,814354,458 379,814354,458359,256412310 PERS Retirement3105000 854,798
( .6) %15,79115,689 15,79115,68918,172412320 Medicare OASDI3105000 48,494
-0 0012374City Retirement Plan3105000412330 0
(20.0) %10,5008,400 10,5008,4007,783412400 Deferred Compensation3105000 9,425
-0 00545803Overtime At Straight Rate3105000413110 0
(6.2) %15,00014,062 15,00014,0629,816413120 Overtime At 1.5 Rate3105000 72,621
-400400 400400539413130 Overtime At Double Time Rate3105000 4,396
-7,0007,000 7,0007,0002,560413210 Holiday O/T-Straight/Non-Sched3105000 6,052
-8,0008,000 8,0008,000568413230 Holiday O/T-Strt/Subj To Retir3105000 2,165
-0 001,456431O/T 1.5 Rate Sub To Retirement3105000413240 0
-0 00570Dbl Time Subj To Retirement3105000413250 0
(100.0)%0 49,555000Ptr. Comp. Model3105000419996 0
(4.9) %1,943,9241,847,3641,847,364 1,894,369Personnel Services Total 1,814,0025,225,678
-320,410320,410 320,410322,659223,451421000 Professional Services3105000 256,246
-0 00500495Prof Services/Internal3105000421001 0
-152,100152,100 152,100153,905130,805422100 Telephone3105000 125,557
-7,0007,000 7,0007,0006,968422120 Telephone - Cellular3105000 6,747
-357,000357,000 357,000357,000386,935422200 Electric3105000 359,068
-12,50012,500 12,50012,5009,923422300 Gas3105000 6,190
-26,00026,000 26,00026,00024,886422500 Water3105000 25,286
-26,10026,100 26,10026,10024,324422600 Other Utilities3105000 31,758
-21,22021,220 21,22021,22024,604422700 Refuse/Disposal Fees3105000 22,488
(100.0)%0 267,667000Land and Building Rental3105000423200 267,667
CCReport Name: 2017_Mid_Cycle_Report
Report Description: Budget Book - Department Budget Detail wMD
06/07/2017Date:
Time: 107
Version:
Page:19:21:28

Department / Section: Police / Police-Administrative Services101 - 310500
Department Budget Detail
%Chnge16/17 vs 17/182017/182017/18
AmendedAdoptedAdopted2016/17
AmendedActualActual2016/172015/162014/15GL KeyObject Description
-400400 40040010423400 Motor Pool Equipment Rental3105000 1,455
-0 000215Vehicle Usage Reimb Employee3105000423500 0
-50,00050,000 50,00052,18022,766424130 Maint/Repair of Bldgs & Improv3105000 40,835
-52,25752,257 52,25752,25742,252424220 All Other Equip Maint/Repair3105000 57,829
-8,0008,000 8,0008,00018,487424230 Central Garage Charges3105000 7,093
-525,000525,000 525,000683,696490,755424250 Sublet Repairs-Automotive3105000 456,392
-1,450 1,4501,45000Advertising Expense3105000425100 1,450
-16,55216,552 16,55216,55215,725425200 Periodicals & Dues3105000 783
-35,00035,000 35,00035,0008,833425400 General Office Expense3105000 46,749
-25,00025,000 25,00025,00034,671425500 Postage3105000 32,535
-7,5007,500 7,5007,5004,787425600 Central Printing Charges3105000 4,432
-0 001,6363,532Outside Printing Expense3105000425610 0
-1,6501,650 1,6501,6502,826425700 Software Purchase/Licensing3105000 389
-53,44353,443 53,44353,44351,843425800 Computer Equip Purc Undr $50003105000 33,934
20.0 %25,00030,000 25,00030,00034,659426100 Janitorial Supplies3105000 36,952
-10,60010,600 10,60010,60011,409426200 Clothing/Linen/Safety Supplies3105000 11,012
-1,150,0001,150,000 1,150,0001,133,392812,506426300 Motor Fuels & Lubricants3105000 972,360
-0 00040,858Horticultural Supplies3105000426400 0
-1,8001,800 1,8001,800119426700 Maintenance Tools/Supplies3105000 1,605
65.0 %1,0001,650 1,0001,6501,950426710 Work Boot Reimbursement3105000 2,100
141.9 %123,300298,300 123,300148,30095,442426800 Special Department Supplies3105000 124,674
-2,0002,000 2,0002,0002,547427200 Training3105000 16,413
-0 00350Training - P.O.S.T.3105000427210 0
( .6) %68,13767,719 68,13767,71959,470428400 Liability Insurance3105000 264,654
(27.8) %65,30647,145 65,30630,74231,176428420 Insurance Charges - Direct3105000 25,431
-200,000200,000 200,000200,0005,145447410 County Booking Fees3105000 132,004
(2.9) %3,613,3923,489,7163,507,796 3,613,392Non-personnel Expenses Total 2,581,4583,148,084
-10,00010,000 10,00010,00010,000450018 Horizon House-RCCADV3105000 10,000
-10,00010,000 10,00010,00010,000450020 Rape Crisis Center3105000 10,000
-10,00010,000 10,00010,00010,000453123 Operation Safehouse3105000 10,000
-30,000 30,000Special Projects Total 30,00030,00030,00030,000
-0 0000Secure Our Schools 20119142300440110 0
-0 00850134,123JAG-20129144700440110 0
-0 000283,925STATE COPS 13/14-AB32299330100440210 0
-0 0080,329458,649STATE COPS 14/15-AB32299331700440210 0
-00 046,600488,431440210 STATE COPS 15/16-AB32299333100 38,367
-0 0641,42200STATE COPS 16/17-AB32299334500440210 0
-0 0500,04900STATE COPS 17/18-AB32299335600440210 0
-0 0Operating Grants Total 01,188,071569,611915,066
-00 085,000100,657462100 Automotive Equipment3105000 0
-00 02,859,6374,140,362462300 PS Enterprise Comm Sys-Lease9890700 0
-0 0Equipment Outlay Total 02,944,6374,241,0200
-0 0000Mag Police Stat Tn Impr-RC9855230440446 0
-0 0Capital Outlay & Grants Total 0000
CCReport Name: 2017_Mid_Cycle_Report
Report Description: Budget Book - Department Budget Detail wMD
06/07/2017Date:
Time: 108
Version:
Page:19:21:28
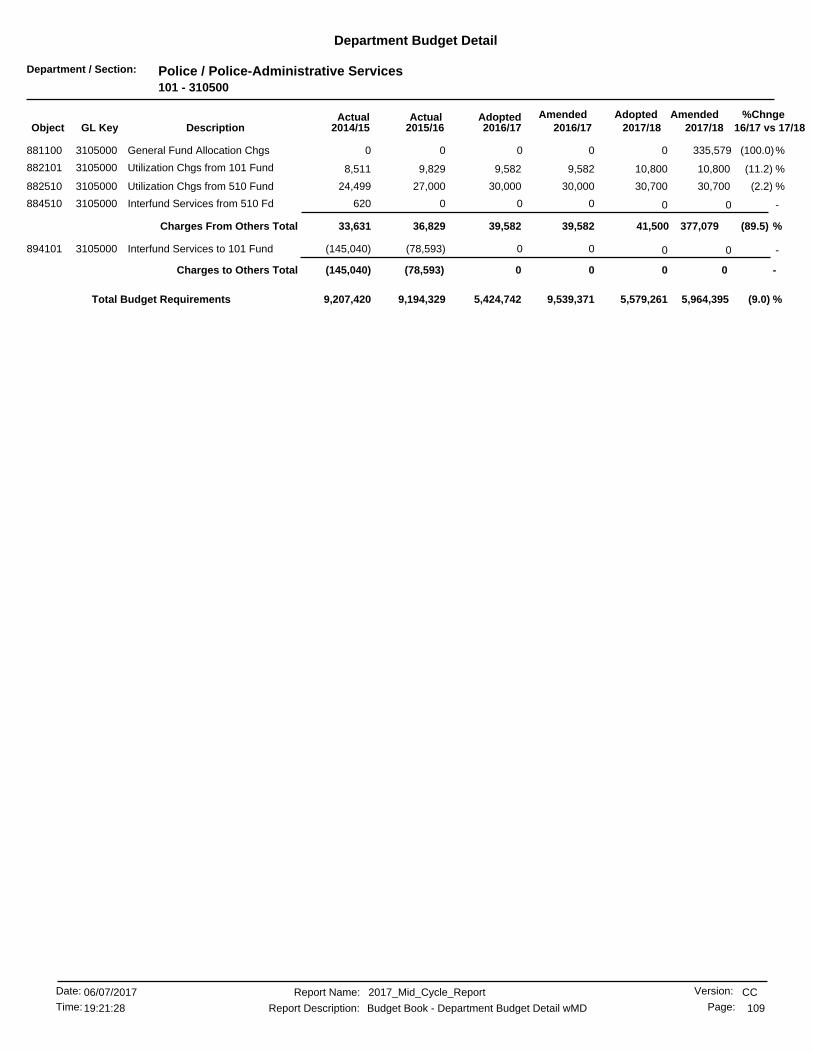
Department / Section: Police / Police-Administrative Services101 - 310500
Department Budget Detail
%Chnge16/17 vs 17/182017/182017/18
AmendedAdoptedAdopted2016/17
AmendedActualActual2016/172015/162014/15GL KeyObject Description
(100.0)%0 335,579000General Fund Allocation Chgs3105000881100 0
(11.2) %10,8009,582 10,8009,5829,829882101 Utilization Chgs from 101 Fund3105000 8,511
(2.2) %30,70030,000 30,70030,00027,000882510 Utilization Chgs from 510 Fund3105000 24,499
-0 000620Interfund Services from 510 Fd3105000884510 0
(89.5) %377,07939,58239,582 41,500Charges From Others Total 36,82933,631
-0 00(78,593)(145,040)Interfund Services to 101 Fund3105000894101 0
-0 0Charges to Others Total 00(78,593)(145,040)
(9.0) %5,424,742 5,964,3955,579,2619,539,3719,194,3299,207,420Total Budget Requirements
CCReport Name: 2017_Mid_Cycle_Report
Report Description: Budget Book - Department Budget Detail wMD
06/07/2017Date:
Time: 109
Version:
Page:19:21:28

Department / Section: Police / Police-Communications101 - 311000
Department Budget Detail
%Chnge16/17 vs 17/182017/182017/18
AmendedAdoptedAdopted2016/17
AmendedActualActual2016/172015/162014/15GL KeyObject Description
(1.5) %3,748,5843,690,194 3,748,5843,690,1942,910,283411100 Salaries - Regular3110000 2,441,365
( .5) %122,181121,554 122,181121,554133,231411110 Salaries-Temp & Part Time3110000 159,652
-0 00131,371112,834Compensatory Time3110000411130 0
-0 00188,248138,338Vacation3110000411210 0
-0 0071,96628,413Holidays & Special Days Off3110000411220 0
-0 0072,26671,076Sick Leave3110000411240 0
-0 0027,87537,212Family Illness Sick Leave3110000411245 0
-0 0019,98422,697Industrial Accident3110000411250 0
-0 006,9313,220Bereavement Leave3110000411260 0
-0 00216324Jury Duty3110000411280 0
-0 002309,227Administrative Leave3110000411292 0
-56,60056,600 56,60056,60064,677411310 Night Shift Premium3110000 54,614
-0 002,4052,546Temporary Foreman Pay3110000411320 0
-0 0025,70412,462Vacation Payoffs3110000411410 0
-25,00025,000 25,00025,0007,601411430 Compensatory Time Payoff3110000 45,409
(3.0) %21,67421,005 21,67421,005(155,639)411510 Accrued Payroll3110000 (7,482)
(1.5) %208,239205,066 208,239205,066199,935412210 Workers Compensation Ins3110000 195,648
(4.3) %538,141514,900 538,141514,900425,029412220 Health Insurance3110000 350,180
-1,2001,200 1,2001,2001,200412221 Retiree Health Insurance3110000 0
( .5) %23,87123,728 23,87123,72820,627412222 Dental Insurance3110000 17,879
(4.0) %11,92011,440 11,92011,44010,745412223 RPOA Insurance3110000 0
(1.0) %6,0936,029 6,0936,0295,465412230 Life Insurance3110000 4,161
(1.7) %2,1712,134 2,1712,1342,073412240 Unemployment Insurance3110000 2,550
-5,8825,882 5,8825,8825,257412250 Disability Insurance3110000 4,639
(7.8) %1,203,6251,109,660 1,203,6251,109,660910,654412310 PERS Retirement3110000 737,085
(1.5) %56,12455,274 56,12455,27463,340412320 Medicare OASDI3110000 56,092
(16.0) %13,08010,980 13,08010,9808,962412400 Deferred Compensation3110000 4,200
-0 0023,64312,700Overtime At Straight Rate3110000413110 0
(5.0) %575,000545,900 575,000545,900477,479413120 Overtime At 1.5 Rate3110000 570,108
-140,000140,000 140,000140,000204,576413130 Overtime At Double Time Rate3110000 261,163
-24,00024,000 24,00024,00030,935413210 Holiday O/T-Straight/Non-Sched3110000 21,270
-18,00018,000 18,00018,0002,057413230 Holiday O/T-Strt/Subj To Retir3110000 15,551
-0 0031,0872,093O/T 1.5 Rate Sub To Retirement3110000413240 0
-0 0018,706896Dbl Time Subj To Retirement3110000413250 0
(100.0)%0 170,361000Ptr. Comp. Model3110000419996 0
(5.4) %6,971,7466,588,5466,588,546 6,801,385Personnel Services Total 5,949,1325,388,136
-110,500110,500 110,500112,60072,668421000 Professional Services3110000 86,750
-0 002,5757,773Prof Services/Internal3110000421001 0
-46,00046,000 46,00046,00066,156422100 Telephone3110000 41,568
-5,0005,000 5,0005,0006,773422120 Telephone - Cellular3110000 4,896
-65,60065,600 65,60065,78037,663424220 All Other Equip Maint/Repair3110000 63,313
-0 000195Periodicals & Dues3110000425200 0
-16,10016,100 16,10016,1006,218425400 General Office Expense3110000 8,682
-23,60523,605 23,60523,6059,321426800 Special Department Supplies3110000 14,479
-16,00016,000 16,00016,0006,292427200 Training3110000 7,064
(1.5) %229,150225,656 229,150225,656194,359428400 Liability Insurance3110000 271,795
CCReport Name: 2017_Mid_Cycle_Report
Report Description: Budget Book - Department Budget Detail wMD
06/07/2017Date:
Time: 110
Version:
Page:19:21:28
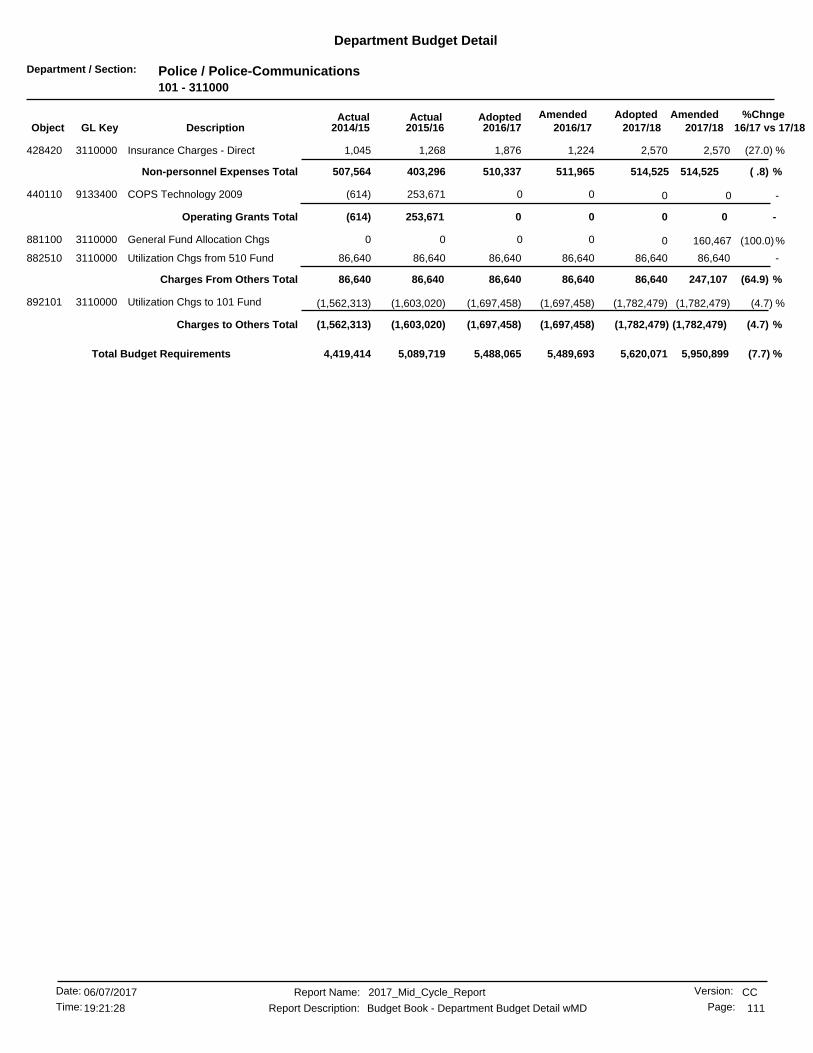
Department / Section: Police / Police-Communications101 - 311000
Department Budget Detail
%Chnge16/17 vs 17/182017/182017/18
AmendedAdoptedAdopted2016/17
AmendedActualActual2016/172015/162014/15GL KeyObject Description
(27.0) %2,5701,876 2,5701,2241,268428420 Insurance Charges - Direct3110000 1,045
( .8) %514,525511,965510,337 514,525Non-personnel Expenses Total 403,296507,564
-0 00253,671(614)COPS Technology 20099133400440110 0
-0 0Operating Grants Total 00253,671(614)
(100.0)%0 160,467000General Fund Allocation Chgs3110000881100 0
-86,64086,640 86,64086,64086,640882510 Utilization Chgs from 510 Fund3110000 86,640
(64.9) %86,640 247,107Charges From Others Total 86,64086,64086,64086,640
(4.7) %(1,782,479)(1,697,458) (1,782,479)(1,697,458)(1,603,020)892101 Utilization Chgs to 101 Fund3110000 (1,562,313)
(4.7) %(1,782,479)(1,697,458)(1,697,458) (1,782,479)Charges to Others Total (1,603,020)(1,562,313)
(7.7) %5,488,065 5,950,8995,620,0715,489,6935,089,7194,419,414Total Budget Requirements
CCReport Name: 2017_Mid_Cycle_Report
Report Description: Budget Book - Department Budget Detail wMD
06/07/2017Date:
Time: 111
Version:
Page:19:21:28
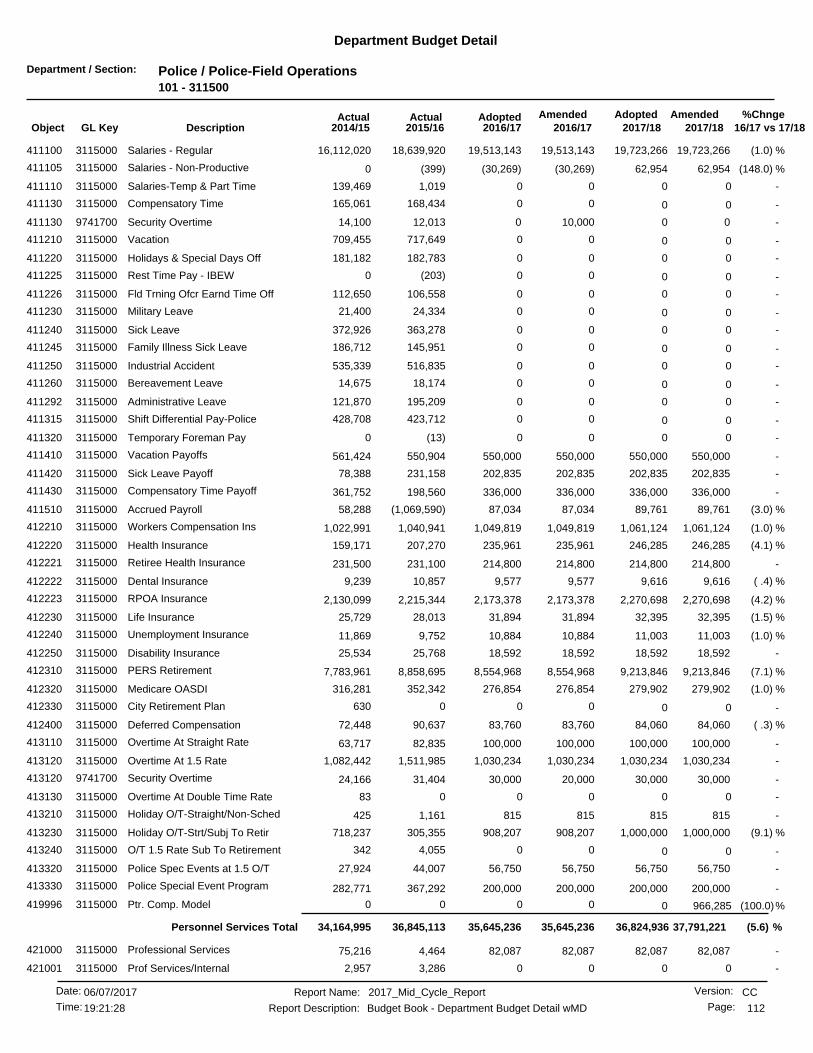
Department / Section: Police / Police-Field Operations101 - 311500
Department Budget Detail
%Chnge16/17 vs 17/182017/182017/18
AmendedAdoptedAdopted2016/17
AmendedActualActual2016/172015/162014/15GL KeyObject Description
(1.0) %19,723,26619,513,143 19,723,26619,513,14318,639,920411100 Salaries - Regular3115000 16,112,020
(148.0) %62,954(30,269) 62,954(30,269)(399)411105 Salaries - Non-Productive3115000 0
-0 001,019139,469Salaries-Temp & Part Time3115000411110 0
-0 00168,434165,061Compensatory Time3115000411130 0
-00 010,00012,013411130 Security Overtime9741700 14,100
-0 00717,649709,455Vacation3115000411210 0
-0 00182,783181,182Holidays & Special Days Off3115000411220 0
-0 00(203)0Rest Time Pay - IBEW3115000411225 0
-0 00106,558112,650Fld Trning Ofcr Earnd Time Off3115000411226 0
-0 0024,33421,400Military Leave3115000411230 0
-0 00363,278372,926Sick Leave3115000411240 0
-0 00145,951186,712Family Illness Sick Leave3115000411245 0
-0 00516,835535,339Industrial Accident3115000411250 0
-0 0018,17414,675Bereavement Leave3115000411260 0
-0 00195,209121,870Administrative Leave3115000411292 0
-0 00423,712428,708Shift Differential Pay-Police3115000411315 0
-0 00(13)0Temporary Foreman Pay3115000411320 0
-550,000550,000 550,000550,000550,904411410 Vacation Payoffs3115000 561,424
-202,835202,835 202,835202,835231,158411420 Sick Leave Payoff3115000 78,388
-336,000336,000 336,000336,000198,560411430 Compensatory Time Payoff3115000 361,752
(3.0) %89,76187,034 89,76187,034(1,069,590)411510 Accrued Payroll3115000 58,288
(1.0) %1,061,1241,049,819 1,061,1241,049,8191,040,941412210 Workers Compensation Ins3115000 1,022,991
(4.1) %246,285235,961 246,285235,961207,270412220 Health Insurance3115000 159,171
-214,800214,800 214,800214,800231,100412221 Retiree Health Insurance3115000 231,500
( .4) %9,6169,577 9,6169,57710,857412222 Dental Insurance3115000 9,239
(4.2) %2,270,6982,173,378 2,270,6982,173,3782,215,344412223 RPOA Insurance3115000 2,130,099
(1.5) %32,39531,894 32,39531,89428,013412230 Life Insurance3115000 25,729
(1.0) %11,00310,884 11,00310,8849,752412240 Unemployment Insurance3115000 11,869
-18,59218,592 18,59218,59225,768412250 Disability Insurance3115000 25,534
(7.1) %9,213,8468,554,968 9,213,8468,554,9688,858,695412310 PERS Retirement3115000 7,783,961
(1.0) %279,902276,854 279,902276,854352,342412320 Medicare OASDI3115000 316,281
-0 000630City Retirement Plan3115000412330 0
( .3) %84,06083,760 84,06083,76090,637412400 Deferred Compensation3115000 72,448
-100,000100,000 100,000100,00082,835413110 Overtime At Straight Rate3115000 63,717
-1,030,2341,030,234 1,030,2341,030,2341,511,985413120 Overtime At 1.5 Rate3115000 1,082,442
-30,00030,000 30,00020,00031,404413120 Security Overtime9741700 24,166
-0 00083Overtime At Double Time Rate3115000413130 0
-815815 8158151,161413210 Holiday O/T-Straight/Non-Sched3115000 425
(9.1) %1,000,000908,207 1,000,000908,207305,355413230 Holiday O/T-Strt/Subj To Retir3115000 718,237
-0 004,055342O/T 1.5 Rate Sub To Retirement3115000413240 0
-56,75056,750 56,75056,75044,007413320 Police Spec Events at 1.5 O/T3115000 27,924
-200,000200,000 200,000200,000367,292413330 Police Special Event Program3115000 282,771
(100.0)%0 966,285000Ptr. Comp. Model3115000419996 0
(5.6) %37,791,22135,645,23635,645,236 36,824,936Personnel Services Total 36,845,11334,164,995
-82,08782,087 82,08782,0874,464421000 Professional Services3115000 75,216
-0 003,2862,957Prof Services/Internal3115000421001 0
CCReport Name: 2017_Mid_Cycle_Report
Report Description: Budget Book - Department Budget Detail wMD
06/07/2017Date:
Time: 112
Version:
Page:19:21:28
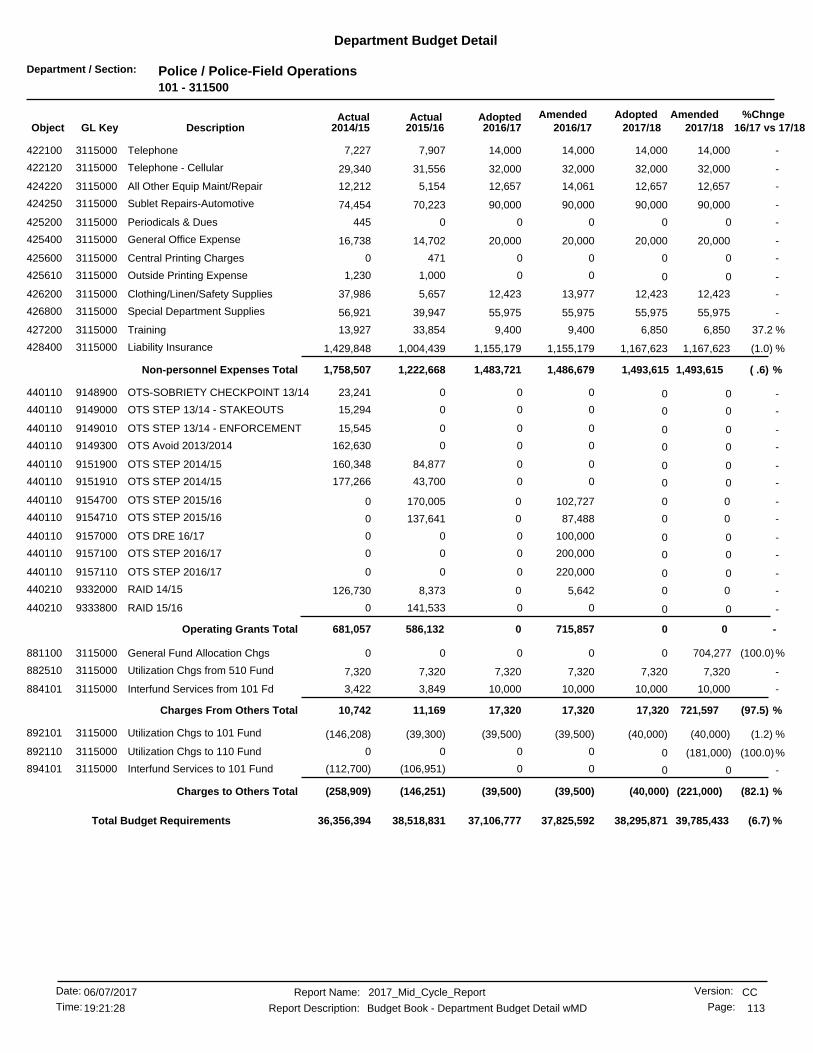
Department / Section: Police / Police-Field Operations101 - 311500
Department Budget Detail
%Chnge16/17 vs 17/182017/182017/18
AmendedAdoptedAdopted2016/17
AmendedActualActual2016/172015/162014/15GL KeyObject Description
-14,00014,000 14,00014,0007,907422100 Telephone3115000 7,227
-32,00032,000 32,00032,00031,556422120 Telephone - Cellular3115000 29,340
-12,65712,657 12,65714,0615,154424220 All Other Equip Maint/Repair3115000 12,212
-90,00090,000 90,00090,00070,223424250 Sublet Repairs-Automotive3115000 74,454
-0 000445Periodicals & Dues3115000425200 0
-20,00020,000 20,00020,00014,702425400 General Office Expense3115000 16,738
-0 004710Central Printing Charges3115000425600 0
-0 001,0001,230Outside Printing Expense3115000425610 0
-12,42312,423 12,42313,9775,657426200 Clothing/Linen/Safety Supplies3115000 37,986
-55,97555,975 55,97555,97539,947426800 Special Department Supplies3115000 56,921
37.2 %6,8509,400 6,8509,40033,854427200 Training3115000 13,927
(1.0) %1,167,6231,155,179 1,167,6231,155,1791,004,439428400 Liability Insurance3115000 1,429,848
( .6) %1,493,6151,486,6791,483,721 1,493,615Non-personnel Expenses Total 1,222,6681,758,507
-0 00023,241OTS-SOBRIETY CHECKPOINT 13/149148900440110 0
-0 00015,294OTS STEP 13/14 - STAKEOUTS9149000440110 0
-0 00015,545OTS STEP 13/14 - ENFORCEMENT9149010440110 0
-0 000162,630OTS Avoid 2013/20149149300440110 0
-0 0084,877160,348OTS STEP 2014/159151900440110 0
-0 0043,700177,266OTS STEP 2014/159151910440110 0
-00 0102,727170,005440110 OTS STEP 2015/169154700 0
-00 087,488137,641440110 OTS STEP 2015/169154710 0
-0 0100,00000OTS DRE 16/179157000440110 0
-0 0200,00000OTS STEP 2016/179157100440110 0
-0 0220,00000OTS STEP 2016/179157110440110 0
-00 05,6428,373440210 RAID 14/159332000 126,730
-0 00141,5330RAID 15/169333800440210 0
-0 0Operating Grants Total 0715,857586,132681,057
(100.0)%0 704,277000General Fund Allocation Chgs3115000881100 0
-7,3207,320 7,3207,3207,320882510 Utilization Chgs from 510 Fund3115000 7,320
-10,00010,000 10,00010,0003,849884101 Interfund Services from 101 Fd3115000 3,422
(97.5) %721,59717,32017,320 17,320Charges From Others Total 11,16910,742
(1.2) %(40,000)(39,500) (40,000)(39,500)(39,300)892101 Utilization Chgs to 101 Fund3115000 (146,208)
(100.0)%0 (181,000)000Utilization Chgs to 110 Fund3115000892110 0
-0 00(106,951)(112,700)Interfund Services to 101 Fund3115000894101 0
(82.1) %(221,000)(39,500)(39,500) (40,000)Charges to Others Total (146,251)(258,909)
(6.7) %37,106,777 39,785,43338,295,87137,825,59238,518,83136,356,394Total Budget Requirements
CCReport Name: 2017_Mid_Cycle_Report
Report Description: Budget Book - Department Budget Detail wMD
06/07/2017Date:
Time: 113
Version:
Page:19:21:28

Department / Section: Police / Police-Aviation Unit101 - 312000
Department Budget Detail
%Chnge16/17 vs 17/182017/182017/18
AmendedAdoptedAdopted2016/17
AmendedActualActual2016/172015/162014/15GL KeyObject Description
-973,299973,299 973,299973,299882,769411100 Salaries - Regular3120000 712,772
-0 0032932,419Salaries-Temp & Part Time3120000411110 0
-0 0011,4866,728Compensatory Time3120000411130 0
-0 0029,37332,873Vacation3120000411210 0
-0 0013,72313,468Holidays & Special Days Off3120000411220 0
-0 0002,501Fld Trning Ofcr Earnd Time Off3120000411226 0
-0 009,61911,351Military Leave3120000411230 0
-0 0014,09825,319Sick Leave3120000411240 0
-0 0099411,939Family Illness Sick Leave3120000411245 0
-0 0042,66816,750Industrial Accident3120000411250 0
-0 002,424746Night Shift Premium3120000411310 0
-0 0011,80811,232Shift Differential Pay-Police3120000411315 0
-0 00572594Temporary Foreman Pay3120000411320 0
-32,00032,000 32,00032,00033,837411410 Vacation Payoffs3120000 60,780
-0 00076,468Sick Leave Payoff3120000411420 0
-6,2006,200 6,2006,2006,092411430 Compensatory Time Payoff3120000 13,354
(2.0) %4,6054,509 4,6054,509(42,402)411510 Accrued Payroll3120000 (2,481)
-52,36352,363 52,36352,36359,008412210 Workers Compensation Ins3120000 58,179
(3.6) %18,24517,585 18,24517,58520,916412220 Health Insurance3120000 26,086
-8,4008,400 8,4008,4008,400412221 Retiree Health Insurance3120000 7,600
(3.1) %828802 828802942412222 Dental Insurance3120000 1,061
(4.2) %101,66497,344 101,66497,34487,767412223 RPOA Insurance3120000 69,794
-923923 923923806412230 Life Insurance3120000 726
-543543 543543612412240 Unemployment Insurance3120000 757
-992992 9929921,182412250 Disability Insurance3120000 1,091
(5.9) %461,038433,531 461,038433,531414,650412310 PERS Retirement3120000 327,294
-14,11214,112 14,11214,11215,323412320 Medicare OASDI3120000 13,313
-2,5802,580 2,5802,5802,500412400 Deferred Compensation3120000 1,308
-0 004590Overtime At Straight Rate3120000413110 0
-5,0005,000 5,0005,00024,351413120 Overtime At 1.5 Rate3120000 10,527
-0 001780Overtime At Double Time Rate3120000413130 0
-319319 319319714413210 Holiday O/T-Straight/Non-Sched3120000 273
(4.6) %25,00023,834 25,00023,834929413230 Holiday O/T-Strt/Subj To Retir3120000 14,427
(100.0)%0 52,945000Ptr. Comp. Model3120000419996 0
(4.9) %1,761,0561,674,3361,674,336 1,708,111Personnel Services Total 1,656,1391,559,264
-6,9506,950 6,9506,9503,881421000 Professional Services3120000 5,817
-1,7501,750 1,7501,7501,669422100 Telephone3120000 1,326
-0 00437420Telephone - Cellular3120000422120 0
-20,00020,000 20,00020,00019,136422200 Electric3120000 18,033
-2,0002,000 2,0002,0001,135422300 Gas3120000 1,211
-7,0007,000 7,0007,0004,641422500 Water3120000 6,626
-3,5003,500 3,5003,5001,753422600 Other Utilities3120000 3,008
-1,1501,150 1,1501,1501,146422700 Refuse/Disposal Fees3120000 1,241
-52,70252,702 52,70252,70253,568423200 Land and Building Rental3120000 53,057
-1,2001,200 1,2001,2002,569423300 Freight/Express & Cartage3120000 1,800
-00 0309,11290,180424120 Constr & Maint Materials3120000 0
CCReport Name: 2017_Mid_Cycle_Report
Report Description: Budget Book - Department Budget Detail wMD
06/07/2017Date:
Time: 114
Version:
Page:19:21:28

Department / Section: Police / Police-Aviation Unit101 - 312000
Department Budget Detail
%Chnge16/17 vs 17/182017/182017/18
AmendedAdoptedAdopted2016/17
AmendedActualActual2016/172015/162014/15GL KeyObject Description
-4,7564,756 4,7564,7562,822424130 Maint/Repair of Bldgs & Improv3120000 4,953
13.4 %310,000351,651 310,000619,253105,641424210 Non Stock Inventory3120000 478,047
-8,2658,265 8,2658,2658,558424220 All Other Equip Maint/Repair3120000 4,329
-0 000410Periodicals & Dues3120000425200 0
-2,0002,000 2,0002,000384425400 General Office Expense3120000 785
-5,7005,700 5,7007,957870426200 Clothing/Linen/Safety Supplies3120000 3,020
-128,000128,000 128,000122,63483,957426300 Motor Fuels & Lubricants3120000 124,626
-1,5001,500 1,5001,500500426600 Chemical Supplies3120000 534
-1,2001,200 1,2001,200852426700 Maintenance Tools/Supplies3120000 292
-300300 300300300426710 Work Boot Reimbursement3120000 300
-5,3005,300 5,30077,3001,897426800 Special Department Supplies3120000 5,932
125.0 %20,00045,000 20,00045,00010,407427200 Training3120000 18,429
-57,61957,619 57,61957,61957,363428400 Liability Insurance3120000 80,823
(2.6) %57,29355,799 57,29349,29652,026428420 Insurance Charges - Direct3120000 53,033
9.3 %698,1851,402,445763,342 698,185Non-personnel Expenses Total 505,701868,061
-0 00067,359INCA OPS 14/159149800440110 0
-00 051,39747,201440110 INCA OPS 15/169153700 1,480
-0 0100,00000St. Homeland Security-PD-20159154900440110 0
-00 046,49528,504440110 INCA OPS 16/179156300 0
-0 085,00000INCA OPS 20179158900440110 0
-0 0Operating Grants Total 0282,89375,70568,840
(100.0)%0 74,667000General Fund Allocation Chgs3120000881100 0
-5,0285,028 5,0285,0285,028882510 Utilization Chgs from 510 Fund3120000 5,028
(93.6) %5,028 79,695Charges From Others Total 5,0285,0285,0285,028
-(127,407)(127,407) (127,407)(127,407)(127,407)892510 Utilization Chgs to 510 Fund3120000 0
-0 000(127,407)Interfund Services to 510 Fund3120000894510 0
-(127,407) (127,407)Charges to Others Total (127,407)(127,407)(127,407)(127,407)
(3.9) %2,315,299 2,411,5292,283,9173,237,2962,115,1672,373,786Total Budget Requirements
CCReport Name: 2017_Mid_Cycle_Report
Report Description: Budget Book - Department Budget Detail wMD
06/07/2017Date:
Time: 115
Version:
Page:19:21:28

Department / Section: Police / Police-Special Operations101 - 312500
Department Budget Detail
%Chnge16/17 vs 17/182017/182017/18
AmendedAdoptedAdopted2016/17
AmendedActualActual2016/172015/162014/15GL KeyObject Description
( .3) %8,014,1037,985,999 8,014,1037,985,9997,617,202411100 Salaries - Regular3125000 6,386,696
-0 00(28,296)(14,654)Compensatory Time3125000411130 0
-0 00319,081307,500Vacation3125000411210 0
-0 00199,027202,221Holidays & Special Days Off3125000411220 0
-0 002,609878Fld Trning Ofcr Earnd Time Off3125000411226 0
-0 003,3960Military Leave3125000411230 0
-0 0054,790119,270Sick Leave3125000411240 0
-0 0044,56372,924Family Illness Sick Leave3125000411245 0
-0 00132,50514,315Industrial Accident3125000411250 0
-0 008,3419,849Bereavement Leave3125000411260 0
-0 00878479Jury Duty3125000411280 0
-0 0010,67111,879Administrative Leave3125000411292 0
-0 001,5561,218Night Shift Premium3125000411310 0
-0 0073,14073,044Shift Differential Pay-Police3125000411315 0
-180,000180,000 180,000180,000192,005411410 Vacation Payoffs3125000 214,593
-0 0030747,620Sick Leave Payoff3125000411420 0
-100,000100,000 100,000100,00084,297411430 Compensatory Time Payoff3125000 155,433
(2.3) %36,87035,990 36,87035,990(410,137)411510 Accrued Payroll3125000 34,253
( .3) %431,166429,655 431,166429,655400,254412210 Workers Compensation Ins3125000 381,417
(4.7) %98,97794,231 98,97794,231106,984412220 Health Insurance3125000 97,906
-80,40080,400 80,40080,40078,700412221 Retiree Health Insurance3125000 76,800
(2.3) %4,4004,296 4,4004,2964,813412222 Dental Insurance3125000 6,062
(4.2) %849,736813,256 849,736813,256763,098412223 RPOA Insurance3125000 679,303
( .3) %14,15214,106 14,15214,10611,738412230 Life Insurance3125000 10,557
( .3) %4,4694,454 4,4694,4544,150412240 Unemployment Insurance3125000 4,971
-7,5687,568 7,5687,5689,920412250 Disability Insurance3125000 9,215
(6.2) %3,857,7683,617,050 3,857,7683,617,0503,532,255412310 PERS Retirement3125000 2,983,368
( .3) %110,106109,748 110,106109,748133,427412320 Medicare OASDI3125000 118,872
( .8) %35,04034,740 35,04034,74033,437412400 Deferred Compensation3125000 23,813
-0 007,43413,559Overtime At Straight Rate3125000413110 0
-250,000250,000 250,000250,000345,783413120 Overtime At 1.5 Rate3125000 258,135
-0 00079Overtime At Double Time Rate3125000413130 0
-0 001,1500Holiday O/T-Straight/Non-Sched3125000413210 0
(9.1) %180,000163,470 180,000163,47049,532413230 Holiday O/T-Strt/Subj To Retir3125000 161,056
-0 001540O/T 1.5 Rate Sub To Retirement3125000413240 0
(100.0)%0 361,342000Ptr. Comp. Model3125000419996 0
(4.7) %14,616,09713,924,96313,924,963 14,254,755Personnel Services Total 13,788,77712,462,645
-050,000 050,0003,357421000 Professional Services3125000 4,107
-0 002,7010Prof Services/Internal3125000421001 0
-9,0009,000 9,0009,0008,975422100 Telephone3125000 6,625
-27,50027,500 27,50027,50035,565422120 Telephone - Cellular3125000 23,697
-2,8002,800 2,8002,8001,217424220 All Other Equip Maint/Repair3125000 1,784
-0 000161Central Garage Charges3125000424230 0
-0 000400Periodicals & Dues3125000425200 0
-15,00015,000 15,00015,00011,738425400 General Office Expense3125000 13,622
-0 001740Central Printing Charges3125000425600 0
CCReport Name: 2017_Mid_Cycle_Report
Report Description: Budget Book - Department Budget Detail wMD
06/07/2017Date:
Time: 116
Version:
Page:19:21:28
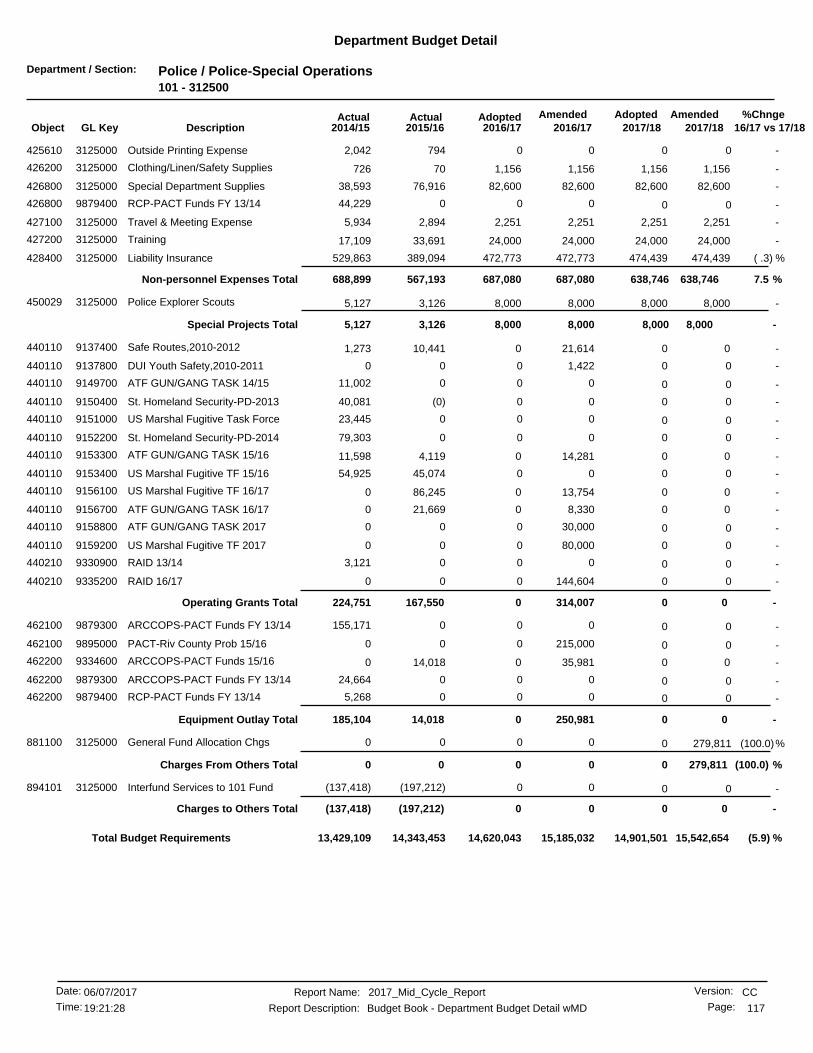
Department / Section: Police / Police-Special Operations101 - 312500
Department Budget Detail
%Chnge16/17 vs 17/182017/182017/18
AmendedAdoptedAdopted2016/17
AmendedActualActual2016/172015/162014/15GL KeyObject Description
-0 007942,042Outside Printing Expense3125000425610 0
-1,1561,156 1,1561,15670426200 Clothing/Linen/Safety Supplies3125000 726
-82,60082,600 82,60082,60076,916426800 Special Department Supplies3125000 38,593
-0 00044,229RCP-PACT Funds FY 13/149879400426800 0
-2,2512,251 2,2512,2512,894427100 Travel & Meeting Expense3125000 5,934
-24,00024,000 24,00024,00033,691427200 Training3125000 17,109
( .3) %474,439472,773 474,439472,773389,094428400 Liability Insurance3125000 529,863
7.5 %638,746687,080687,080 638,746Non-personnel Expenses Total 567,193688,899
-8,0008,000 8,0008,0003,126450029 Police Explorer Scouts3125000 5,127
-8,0008,0008,000 8,000Special Projects Total 3,1265,127
-00 021,61410,441440110 Safe Routes,2010-20129137400 1,273
-0 01,42200DUI Youth Safety,2010-20119137800440110 0
-0 00011,002ATF GUN/GANG TASK 14/159149700440110 0
-0 00(0)40,081St. Homeland Security-PD-20139150400440110 0
-0 00023,445US Marshal Fugitive Task Force9151000440110 0
-0 00079,303St. Homeland Security-PD-20149152200440110 0
-00 014,2814,119440110 ATF GUN/GANG TASK 15/169153300 11,598
-0 0045,07454,925US Marshal Fugitive TF 15/169153400440110 0
-00 013,75486,245440110 US Marshal Fugitive TF 16/179156100 0
-00 08,33021,669440110 ATF GUN/GANG TASK 16/179156700 0
-0 030,00000ATF GUN/GANG TASK 20179158800440110 0
-0 080,00000US Marshal Fugitive TF 20179159200440110 0
-0 0003,121RAID 13/149330900440210 0
-0 0144,60400RAID 16/179335200440210 0
-0 0Operating Grants Total 0314,007167,550224,751
-0 000155,171ARCCOPS-PACT Funds FY 13/149879300462100 0
-0 0215,00000PACT-Riv County Prob 15/169895000462100 0
-00 035,98114,018462200 ARCCOPS-PACT Funds 15/169334600 0
-0 00024,664ARCCOPS-PACT Funds FY 13/149879300462200 0
-0 0005,268RCP-PACT Funds FY 13/149879400462200 0
-0 0Equipment Outlay Total 0250,98114,018185,104
(100.0)%0 279,811000General Fund Allocation Chgs3125000881100 0
(100.0) %0 279,811Charges From Others Total 0000
-0 00(197,212)(137,418)Interfund Services to 101 Fund3125000894101 0
-0 0Charges to Others Total 00(197,212)(137,418)
(5.9) %14,620,043 15,542,65414,901,50115,185,03214,343,45313,429,109Total Budget Requirements
CCReport Name: 2017_Mid_Cycle_Report
Report Description: Budget Book - Department Budget Detail wMD
06/07/2017Date:
Time: 117
Version:
Page:19:21:28

Department / Section: Police / Police-Central Investigations101 - 313000
Department Budget Detail
%Chnge16/17 vs 17/182017/182017/18
AmendedAdoptedAdopted2016/17
AmendedActualActual2016/172015/162014/15GL KeyObject Description
( .5) %4,125,8024,101,604 4,125,8024,101,6043,924,932411100 Salaries - Regular3130000 3,366,121
-0 0061,69243,618Compensatory Time3130000411130 0
-0 00121,100134,483Vacation3130000411210 0
-0 00121,343132,068Holidays & Special Days Off3130000411220 0
-0 008511,302Fld Trning Ofcr Earnd Time Off3130000411226 0
-0 0047,93945,095Sick Leave3130000411240 0
-0 0017,40813,605Family Illness Sick Leave3130000411245 0
-0 0048,74966,905Industrial Accident3130000411250 0
-0 004,9347,057Bereavement Leave3130000411260 0
-0 00777344Jury Duty3130000411280 0
-0 0019,27639,161Administrative Leave3130000411292 0
-0 000240Shift Differential Pay-Police3130000411315 0
-0 00725591Temporary Foreman Pay3130000411320 0
-200,000200,000 200,000200,000280,871411410 Vacation Payoffs3130000 218,326
-30,00030,000 30,00030,000117,135411420 Sick Leave Payoff3130000 122,517
-81,00081,000 81,00081,00087,202411430 Compensatory Time Payoff3130000 107,315
(2.6) %19,46718,942 19,46718,942(219,071)411510 Accrued Payroll3130000 16,155
( .5) %221,973220,670 221,973220,670208,953412210 Workers Compensation Ins3130000 202,480
(3.2) %81,32978,689 81,32978,68974,272412220 Health Insurance3130000 83,994
-38,40038,400 38,40038,40039,500412221 Retiree Health Insurance3130000 38,700
(1.0) %3,6763,637 3,6763,6372,951412222 Dental Insurance3130000 4,030
(4.2) %429,368411,128 429,368411,128391,868412223 RPOA Insurance3130000 371,326
(1.7) %6,8616,744 6,8616,7445,366412230 Life Insurance3130000 5,077
( .5) %2,2972,284 2,2972,2842,166412240 Unemployment Insurance3130000 2,638
-3,8003,800 3,8003,8005,088412250 Disability Insurance3130000 5,091
(6.6) %2,064,7791,928,109 2,064,7791,928,1091,832,451412310 PERS Retirement3130000 1,550,720
( .5) %57,02556,711 57,02556,71173,701412320 Medicare OASDI3130000 60,092
(3.2) %18,48017,880 18,48017,88013,212412400 Deferred Compensation3130000 9,719
(5.1) %125,000118,580 125,000118,58098,163413110 Overtime At Straight Rate3130000 89,876
33.3 %150,000200,000 150,000200,000305,238413120 Overtime At 1.5 Rate3130000 204,069
-6,0006,000 6,0006,0007,370413130 Overtime At Double Time Rate3130000 8,236
-0 002161,067Holiday O/T-Straight/Non-Sched3130000413210 0
(12.1) %53,00046,580 53,00046,58018,555413230 Holiday O/T-Strt/Subj To Retir3130000 56,231
-0 002110O/T 1.5 Rate Sub To Retirement3130000413240 0
(100.0)%0 189,471000Ptr. Comp. Model3130000419996 0
(4.2) %7,907,7287,570,7587,570,758 7,718,257Personnel Services Total 7,715,1607,008,267
-78,25578,255 78,25578,25561,572421000 Professional Services3130000 47,552
-17,00017,000 17,00017,00016,444422100 Telephone3130000 12,944
-16,00016,000 16,00016,00017,242422120 Telephone - Cellular3130000 13,779
-3,0003,000 3,0003,0002,167424220 All Other Equip Maint/Repair3130000 626
-0 00140150Periodicals & Dues3130000425200 0
-5,0005,000 5,0005,000433425300 Photo & Recording Supplies3130000 2,029
-12,00012,000 12,00012,0009,874425400 General Office Expense3130000 11,772
-200200 200200323425610 Outside Printing Expense3130000 412
-12,90012,900 12,90012,90013,170426800 Special Department Supplies3130000 11,980
-3,7293,729 3,7293,7296,403427100 Travel & Meeting Expense3130000 2,233
CCReport Name: 2017_Mid_Cycle_Report
Report Description: Budget Book - Department Budget Detail wMD
06/07/2017Date:
Time: 118
Version:
Page:19:21:28
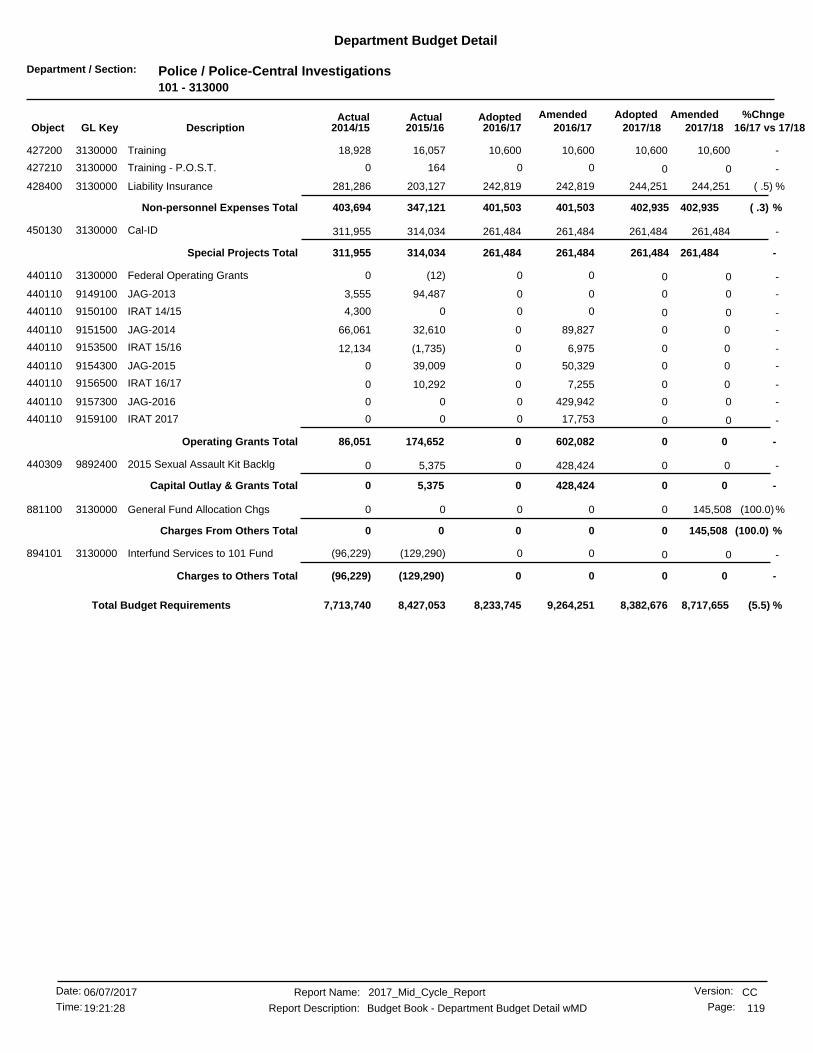
Department / Section: Police / Police-Central Investigations101 - 313000
Department Budget Detail
%Chnge16/17 vs 17/182017/182017/18
AmendedAdoptedAdopted2016/17
AmendedActualActual2016/172015/162014/15GL KeyObject Description
-10,60010,600 10,60010,60016,057427200 Training3130000 18,928
-0 001640Training - P.O.S.T.3130000427210 0
( .5) %244,251242,819 244,251242,819203,127428400 Liability Insurance3130000 281,286
( .3) %402,935401,503401,503 402,935Non-personnel Expenses Total 347,121403,694
-261,484261,484 261,484261,484314,034450130 Cal-ID3130000 311,955
-261,484261,484261,484 261,484Special Projects Total 314,034311,955
-0 00(12)0Federal Operating Grants3130000440110 0
-0 0094,4873,555JAG-20139149100440110 0
-0 0004,300IRAT 14/159150100440110 0
-00 089,82732,610440110 JAG-20149151500 66,061
-00 06,975(1,735)440110 IRAT 15/169153500 12,134
-00 050,32939,009440110 JAG-20159154300 0
-00 07,25510,292440110 IRAT 16/179156500 0
-0 0429,94200JAG-20169157300440110 0
-0 017,75300IRAT 20179159100440110 0
-0 0Operating Grants Total 0602,082174,65286,051
-00 0428,4245,375440309 2015 Sexual Assault Kit Backlg9892400 0
-0 0Capital Outlay & Grants Total 0428,4245,3750
(100.0)%0 145,508000General Fund Allocation Chgs3130000881100 0
(100.0) %0 145,508Charges From Others Total 0000
-0 00(129,290)(96,229)Interfund Services to 101 Fund3130000894101 0
-0 0Charges to Others Total 00(129,290)(96,229)
(5.5) %8,233,745 8,717,6558,382,6769,264,2518,427,0537,713,740Total Budget Requirements
CCReport Name: 2017_Mid_Cycle_Report
Report Description: Budget Book - Department Budget Detail wMD
06/07/2017Date:
Time: 119
Version:
Page:19:21:28
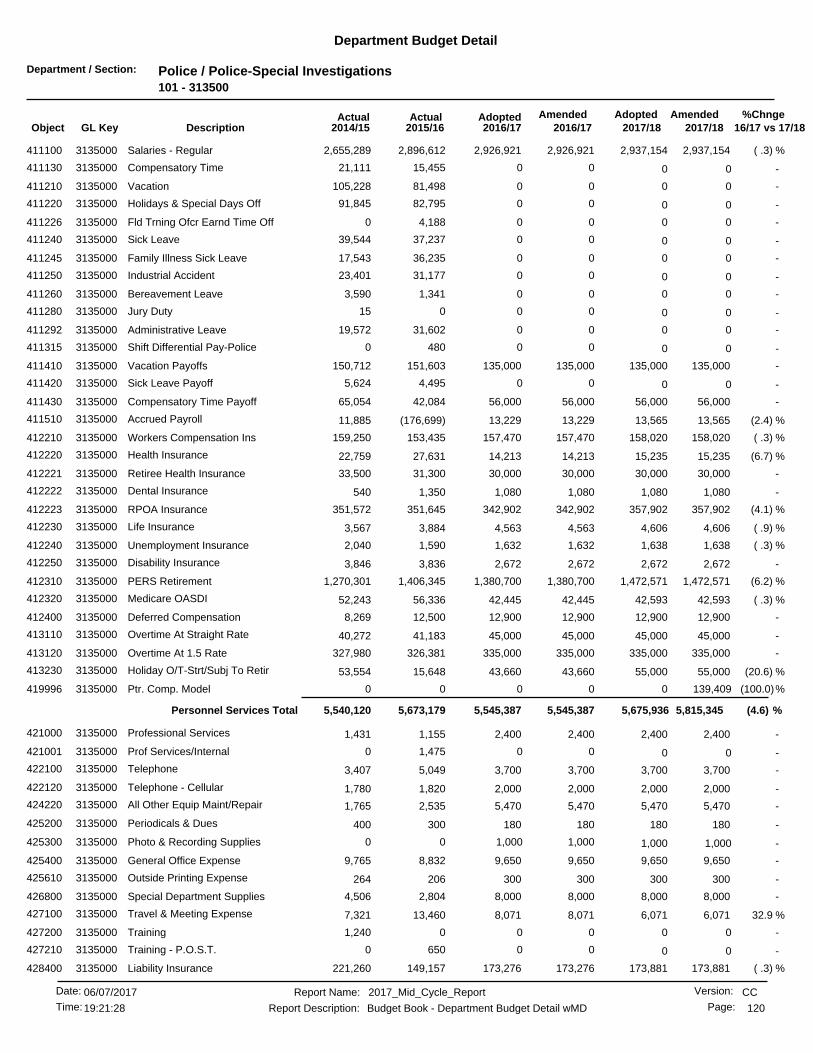
Department / Section: Police / Police-Special Investigations101 - 313500
Department Budget Detail
%Chnge16/17 vs 17/182017/182017/18
AmendedAdoptedAdopted2016/17
AmendedActualActual2016/172015/162014/15GL KeyObject Description
( .3) %2,937,1542,926,921 2,937,1542,926,9212,896,612411100 Salaries - Regular3135000 2,655,289
-0 0015,45521,111Compensatory Time3135000411130 0
-0 0081,498105,228Vacation3135000411210 0
-0 0082,79591,845Holidays & Special Days Off3135000411220 0
-0 004,1880Fld Trning Ofcr Earnd Time Off3135000411226 0
-0 0037,23739,544Sick Leave3135000411240 0
-0 0036,23517,543Family Illness Sick Leave3135000411245 0
-0 0031,17723,401Industrial Accident3135000411250 0
-0 001,3413,590Bereavement Leave3135000411260 0
-0 00015Jury Duty3135000411280 0
-0 0031,60219,572Administrative Leave3135000411292 0
-0 004800Shift Differential Pay-Police3135000411315 0
-135,000135,000 135,000135,000151,603411410 Vacation Payoffs3135000 150,712
-0 004,4955,624Sick Leave Payoff3135000411420 0
-56,00056,000 56,00056,00042,084411430 Compensatory Time Payoff3135000 65,054
(2.4) %13,56513,229 13,56513,229(176,699)411510 Accrued Payroll3135000 11,885
( .3) %158,020157,470 158,020157,470153,435412210 Workers Compensation Ins3135000 159,250
(6.7) %15,23514,213 15,23514,21327,631412220 Health Insurance3135000 22,759
-30,00030,000 30,00030,00031,300412221 Retiree Health Insurance3135000 33,500
-1,0801,080 1,0801,0801,350412222 Dental Insurance3135000 540
(4.1) %357,902342,902 357,902342,902351,645412223 RPOA Insurance3135000 351,572
( .9) %4,6064,563 4,6064,5633,884412230 Life Insurance3135000 3,567
( .3) %1,6381,632 1,6381,6321,590412240 Unemployment Insurance3135000 2,040
-2,6722,672 2,6722,6723,836412250 Disability Insurance3135000 3,846
(6.2) %1,472,5711,380,700 1,472,5711,380,7001,406,345412310 PERS Retirement3135000 1,270,301
( .3) %42,59342,445 42,59342,44556,336412320 Medicare OASDI3135000 52,243
-12,90012,900 12,90012,90012,500412400 Deferred Compensation3135000 8,269
-45,00045,000 45,00045,00041,183413110 Overtime At Straight Rate3135000 40,272
-335,000335,000 335,000335,000326,381413120 Overtime At 1.5 Rate3135000 327,980
(20.6) %55,00043,660 55,00043,66015,648413230 Holiday O/T-Strt/Subj To Retir3135000 53,554
(100.0)%0 139,409000Ptr. Comp. Model3135000419996 0
(4.6) %5,815,3455,545,3875,545,387 5,675,936Personnel Services Total 5,673,1795,540,120
-2,4002,400 2,4002,4001,155421000 Professional Services3135000 1,431
-0 001,4750Prof Services/Internal3135000421001 0
-3,7003,700 3,7003,7005,049422100 Telephone3135000 3,407
-2,0002,000 2,0002,0001,820422120 Telephone - Cellular3135000 1,780
-5,4705,470 5,4705,4702,535424220 All Other Equip Maint/Repair3135000 1,765
-180180 180180300425200 Periodicals & Dues3135000 400
-1,000 1,0001,00000Photo & Recording Supplies3135000425300 1,000
-9,6509,650 9,6509,6508,832425400 General Office Expense3135000 9,765
-300300 300300206425610 Outside Printing Expense3135000 264
-8,0008,000 8,0008,0002,804426800 Special Department Supplies3135000 4,506
32.9 %6,0718,071 6,0718,07113,460427100 Travel & Meeting Expense3135000 7,321
-0 0001,240Training3135000427200 0
-0 006500Training - P.O.S.T.3135000427210 0
( .3) %173,881173,276 173,881173,276149,157428400 Liability Insurance3135000 221,260
CCReport Name: 2017_Mid_Cycle_Report
Report Description: Budget Book - Department Budget Detail wMD
06/07/2017Date:
Time: 120
Version:
Page:19:21:28

Department / Section: Police / Police-Special Investigations101 - 313500
Department Budget Detail
%Chnge16/17 vs 17/182017/182017/18
AmendedAdoptedAdopted2016/17
AmendedActualActual2016/172015/162014/15GL KeyObject Description
.6 %212,652214,047214,047 212,652Non-personnel Expenses Total 187,446253,143
-0 0000DOJ-VIOLENCE AGAINST WOMEN9146300440110 0
-0 0001,549HIDTA 14/159149600440110 0
-0 00014,574INCA OT 14/159149900440110 0
-0 000(659)ICEP 14/159150000440110 0
-0 0005,112Ontario PD ABC Task Force9151400440110 0
-0 001,67650,446HIDTA 15/169153200440110 0
-0 052,12300ICEP 15/169153600440110 0
-00 06,93621,947440110 INCA OT 15/169153800 26,116
-00 039,69219,353440110 INCA OT 16/179156400 0
-00 07,54845,095440110 HIDTA 16/179156600 0
-0 017,75300HIDTA 17/189156900440110 0
-0 059,04600INCA OT 20179159000440110 0
-0 000(33)ABC GAP 20139330500440110 0
-0 00037,755Anti-Drug Abuse 13/149331900440210 0
-0 004,86451,806ABC GAP 20149332100440210 0
-00 07,28617,713440210 ABC MINI 20159334200 0
-0 0Operating Grants Total 0190,386110,650186,668
(100.0)%0 107,289000General Fund Allocation Chgs3135000881100 0
(100.0) %0 107,289Charges From Others Total 0000
-0 000(55)Interfund Services to 101 Fund3135000894101 0
-0 000(24,674)Interfund Services to 721 Fund3135000894721 0
-0 0Charges to Others Total 000(24,730)
(6.1) %5,759,434 6,135,2865,888,5885,949,8205,971,2755,955,203Total Budget Requirements
CCReport Name: 2017_Mid_Cycle_Report
Report Description: Budget Book - Department Budget Detail wMD
06/07/2017Date:
Time: 121
Version:
Page:19:21:28

Department / Section: Police / Police-Asset Forefeiture-Misc101 - 314520
Department Budget Detail
%Chnge16/17 vs 17/182017/182017/18
AmendedAdoptedAdopted2016/17
AmendedActualActual2016/172015/162014/15GL KeyObject Description
-00 082,31568,772421000 Professional Services3145200 41,270
-0 020,00000Maint/Repair of Bldgs & Improv3145200424130 0
-00 09,67415,702425400 General Office Expense3145200 6,358
-00 015,45754,185425700 Software Purchase/Licensing3145200 8,949
-00 020,56214,425425800 Computer Equip Purc Undr $50003145200 0
-0 080000Clothing/Linen/Safety Supplies3145200426200 0
-00 0118,5393,394426800 Special Department Supplies3145200 23,847
-00 018,1561,843427100 Travel & Meeting Expense3145200 0
-00 0170,69014,884427200 Training3145200 9,873
-0 0Non-personnel Expenses Total 0456,195173,20890,299
-00 0107,51458,299462100 Automotive Equipment3145200 205,064
-0 0726038,449Computer System Upgrades3145200462305 0
-0 0Equipment Outlay Total 0108,24058,299243,514
-0 00564,436231,508333,813Total Budget Requirements
(100.0) %00 0564,436231,508Total Budget Requirements 333,813
CCReport Name: 2017_Mid_Cycle_Report
Report Description: Budget Book - Department Budget Detail wMD
06/07/2017Date:
Time: 122
Version:
Page:19:21:28

Department / Section: Police / Pol-Asst Forefeit-US DOJ101 - 314540
Department Budget Detail
%Chnge16/17 vs 17/182017/182017/18
AmendedAdoptedAdopted2016/17
AmendedActualActual2016/172015/162014/15GL KeyObject Description
-00 047,3241,602421000 Professional Services3145400 1,510
-0 0024,9830Maint/Repair of Bldgs & Improv3145400424130 0
-0 002,1870Non Stock Inventory3145400424210 0
-0 014,24100All Other Equip Maint/Repair3145400424220 0
-0 060000Photo & Recording Supplies3145400425300 0
-00 01,2902,354425400 General Office Expense3145400 0
-0 050,44000Software Purchase/Licensing3145400425700 0
-00 08,220105,383426200 Clothing/Linen/Safety Supplies3145400 0
-00 0214,0022,623426800 Special Department Supplies3145400 2,138
-00 013,5901,059427100 Travel & Meeting Expense3145400 1,150
-00 073,47224,484427200 Training3145400 11,998
-0 0Non-personnel Expenses Total 0423,183164,67716,797
-0 017,18200Automotive Equipment3145400462100 0
-0 069,440021,243Machine and Equipment3145400462200 0
-0 0Equipment Outlay Total 086,623021,243
-0 00509,806164,67738,040Total Budget Requirements
(100.0) %00 0509,806164,677Total Budget Requirements 38,040
CCReport Name: 2017_Mid_Cycle_Report
Report Description: Budget Book - Department Budget Detail wMD
06/07/2017Date:
Time: 123
Version:
Page:19:21:28

Department / Section: Police / Pol-Asset Forefeiture-US Treas101 - 314550
Department Budget Detail
%Chnge16/17 vs 17/182017/182017/18
AmendedAdoptedAdopted2016/17
AmendedActualActual2016/172015/162014/15GL KeyObject Description
-00 059,54513,879421000 Professional Services3145500 10,780
-00 022,59621,171422120 Telephone - Cellular3145500 19,836
-00 021,46215,778423100 Equipment Rental3145500 17,077
-0 0Non-personnel Expenses Total 0103,60450,82847,693
-0 06,00008,856Machine and Equipment3145500462200 0
-0 0Equipment Outlay Total 06,00008,856
-0 00109,60450,82856,549Total Budget Requirements
(100.0) %00 0109,60450,828Total Budget Requirements 56,549
CCReport Name: 2017_Mid_Cycle_Report
Report Description: Budget Book - Department Budget Detail wMD
06/07/2017Date:
Time: 124
Version:
Page:19:21:28
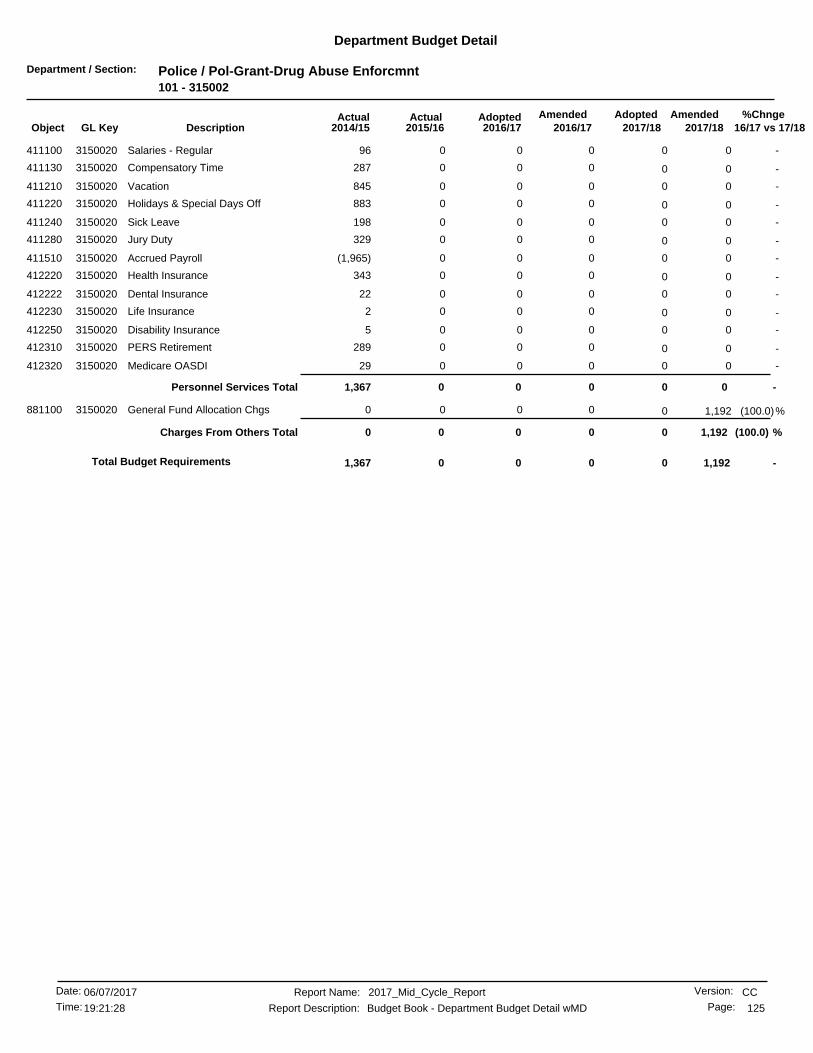
Department / Section: Police / Pol-Grant-Drug Abuse Enforcmnt101 - 315002
Department Budget Detail
%Chnge16/17 vs 17/182017/182017/18
AmendedAdoptedAdopted2016/17
AmendedActualActual2016/172015/162014/15GL KeyObject Description
-0 00096Salaries - Regular3150020411100 0
-0 000287Compensatory Time3150020411130 0
-0 000845Vacation3150020411210 0
-0 000883Holidays & Special Days Off3150020411220 0
-0 000198Sick Leave3150020411240 0
-0 000329Jury Duty3150020411280 0
-0 000(1,965)Accrued Payroll3150020411510 0
-0 000343Health Insurance3150020412220 0
-0 00022Dental Insurance3150020412222 0
-0 0002Life Insurance3150020412230 0
-0 0005Disability Insurance3150020412250 0
-0 000289PERS Retirement3150020412310 0
-0 00029Medicare OASDI3150020412320 0
-0 0Personnel Services Total 0001,367
(100.0)%0 1,192000General Fund Allocation Chgs3150020881100 0
(100.0) %0 1,192Charges From Others Total 0000
-1,1920 000Total Budget Requirements 1,367
CCReport Name: 2017_Mid_Cycle_Report
Report Description: Budget Book - Department Budget Detail wMD
06/07/2017Date:
Time: 125
Version:
Page:19:21:28
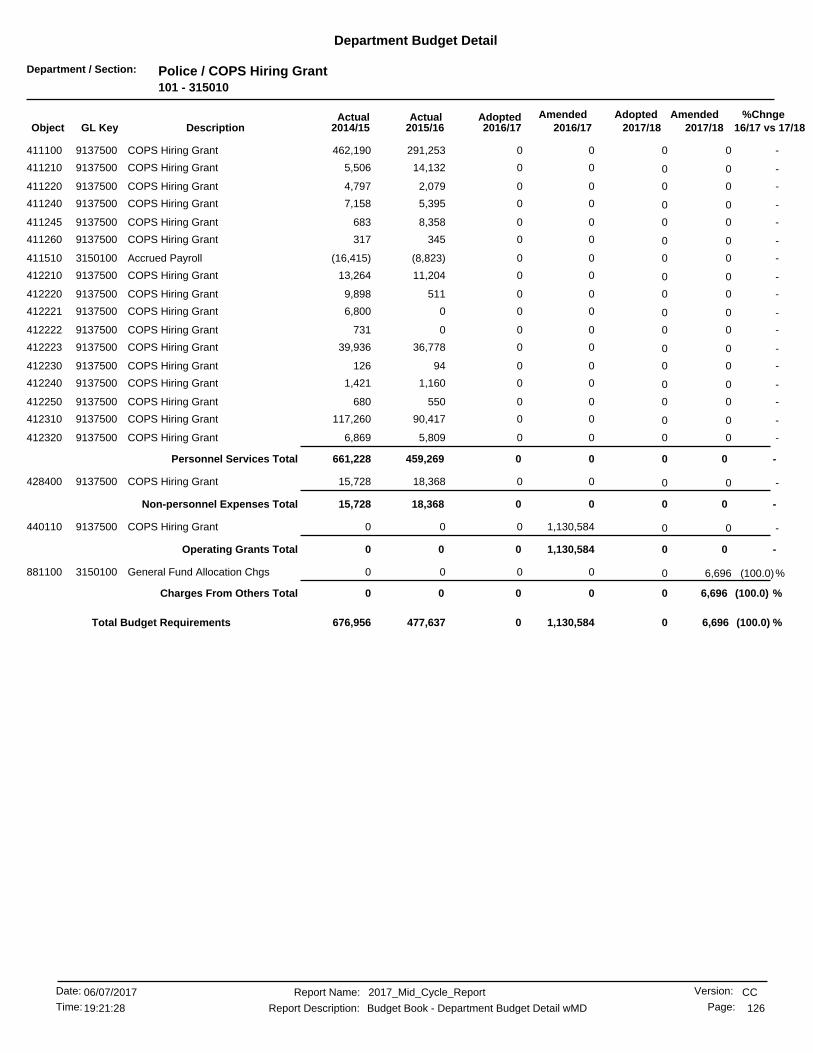
Department / Section: Police / COPS Hiring Grant101 - 315010
Department Budget Detail
%Chnge16/17 vs 17/182017/182017/18
AmendedAdoptedAdopted2016/17
AmendedActualActual2016/172015/162014/15GL KeyObject Description
-0 00291,253462,190COPS Hiring Grant9137500411100 0
-0 0014,1325,506COPS Hiring Grant9137500411210 0
-0 002,0794,797COPS Hiring Grant9137500411220 0
-0 005,3957,158COPS Hiring Grant9137500411240 0
-0 008,358683COPS Hiring Grant9137500411245 0
-0 00345317COPS Hiring Grant9137500411260 0
-0 00(8,823)(16,415)Accrued Payroll3150100411510 0
-0 0011,20413,264COPS Hiring Grant9137500412210 0
-0 005119,898COPS Hiring Grant9137500412220 0
-0 0006,800COPS Hiring Grant9137500412221 0
-0 000731COPS Hiring Grant9137500412222 0
-0 0036,77839,936COPS Hiring Grant9137500412223 0
-0 0094126COPS Hiring Grant9137500412230 0
-0 001,1601,421COPS Hiring Grant9137500412240 0
-0 00550680COPS Hiring Grant9137500412250 0
-0 0090,417117,260COPS Hiring Grant9137500412310 0
-0 005,8096,869COPS Hiring Grant9137500412320 0
-0 0Personnel Services Total 00459,269661,228
-0 0018,36815,728COPS Hiring Grant9137500428400 0
-0 0Non-personnel Expenses Total 0018,36815,728
-0 01,130,58400COPS Hiring Grant9137500440110 0
-0 0Operating Grants Total 01,130,58400
(100.0)%0 6,696000General Fund Allocation Chgs3150100881100 0
(100.0) %0 6,696Charges From Others Total 0000
(100.0) %0 6,69601,130,584477,637676,956Total Budget Requirements
CCReport Name: 2017_Mid_Cycle_Report
Report Description: Budget Book - Department Budget Detail wMD
06/07/2017Date:
Time: 126
Version:
Page:19:21:28

Department / Section: Police / Police-Debt101 - 319000
Department Budget Detail
%Chnge16/17 vs 17/182017/182017/18
AmendedAdoptedAdopted2016/17
AmendedActualActual2016/172015/162014/15GL KeyObject Description
-08,849,932 9,480,1098,849,9328,184,884882101 Utilization Chgs from 101 Fund3190000 7,780,989
(100.0)%0 9,468,135000Utilization Chgs from 390 Fund3190000882390 0
(6.5) %9,468,1358,849,9328,849,932 9,480,109Charges From Others Total 8,184,8847,780,989
(6.5) %8,849,932 9,468,1359,480,1098,849,9328,184,8847,780,989Total Budget Requirements
CCReport Name: 2017_Mid_Cycle_Report
Report Description: Budget Book - Department Budget Detail wMD
06/07/2017Date:
Time: 127
Version:
Page:19:21:28

Department / Section: Police / Police-Capital101 - 319500
Department Budget Detail
%Chnge16/17 vs 17/182017/182017/18
AmendedAdoptedAdopted2016/17
AmendedActualActual2016/172015/162014/15GL KeyObject Description
-0 000334,347PD Marked Patrol Cars-Pinnacle9877100462100 0
-00 031,30731,235462200 Machine and Equipment3195000 0
-0 0Equipment Outlay Total 031,30731,235334,347
(100.0)%0 37,583000General Fund Allocation Chgs3195000881100 0
(100.0) %0 37,583Charges From Others Total 0000
(100.0) %0 37,583031,30731,235334,347Total Budget Requirements
CCReport Name: 2017_Mid_Cycle_Report
Report Description: Budget Book - Department Budget Detail wMD
06/07/2017Date:
Time: 128
Version:
Page:19:21:28

Department / Section: Police / PD-Managed Savings101 - 319900
Department Budget Detail
%Chnge16/17 vs 17/182017/182017/18
AmendedAdoptedAdopted2016/17
AmendedActualActual2016/172015/162014/15GL KeyObject Description
-(1,500,000) (1,500,000)(1,500,000)00Managed Savings Allocation3199000499999 (1,500,000)
-(1,500,000) (1,500,000)Managed Savings Total (1,500,000)(1,500,000)00
-(1,500,000)(1,500,000) (1,500,000)(1,500,000)0Total Budget Requirements 0
CCReport Name: 2017_Mid_Cycle_Report
Report Description: Budget Book - Department Budget Detail wMD
06/07/2017Date:
Time: 129
Version:
Page:19:21:28
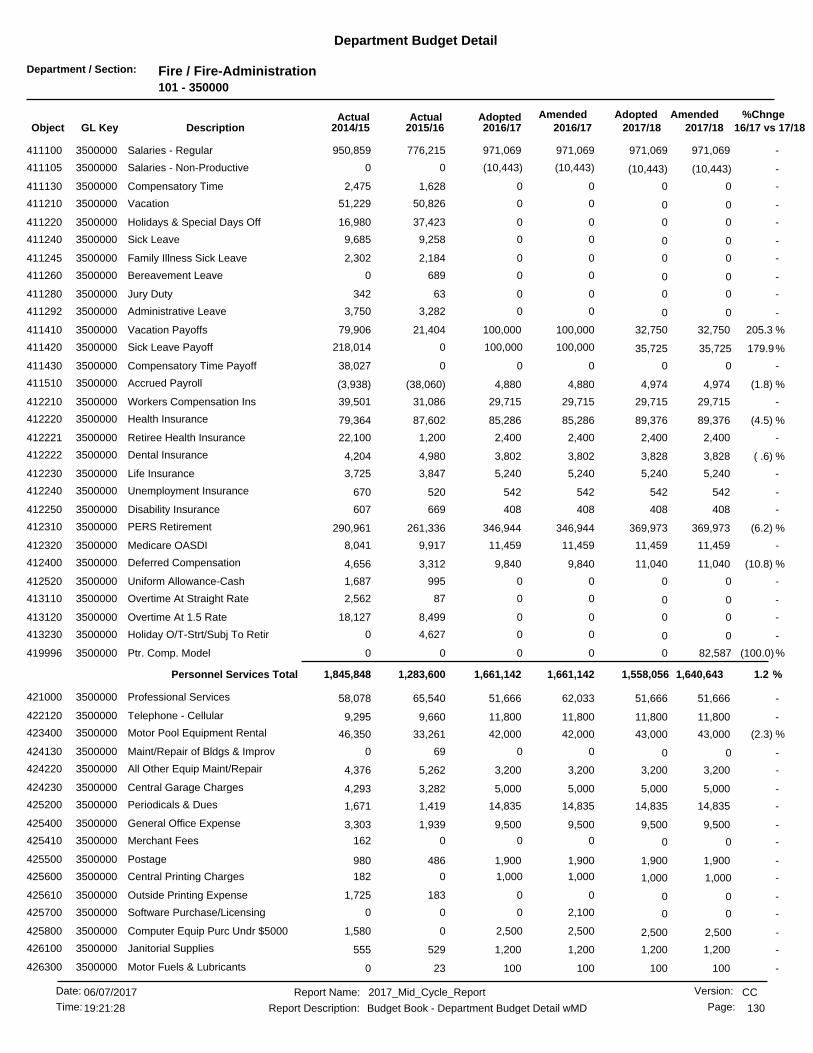
Department / Section: Fire / Fire-Administration101 - 350000
Department Budget Detail
%Chnge16/17 vs 17/182017/182017/18
AmendedAdoptedAdopted2016/17
AmendedActualActual2016/172015/162014/15GL KeyObject Description
-971,069971,069 971,069971,069776,215411100 Salaries - Regular3500000 950,859
-(10,443) (10,443)(10,443)00Salaries - Non-Productive3500000411105 (10,443)
-0 001,6282,475Compensatory Time3500000411130 0
-0 0050,82651,229Vacation3500000411210 0
-0 0037,42316,980Holidays & Special Days Off3500000411220 0
-0 009,2589,685Sick Leave3500000411240 0
-0 002,1842,302Family Illness Sick Leave3500000411245 0
-0 006890Bereavement Leave3500000411260 0
-0 0063342Jury Duty3500000411280 0
-0 003,2823,750Administrative Leave3500000411292 0
205.3 %32,750100,000 32,750100,00021,404411410 Vacation Payoffs3500000 79,906
179.9%100,000 35,725100,0000218,014Sick Leave Payoff3500000411420 35,725
-0 00038,027Compensatory Time Payoff3500000411430 0
(1.8) %4,9744,880 4,9744,880(38,060)411510 Accrued Payroll3500000 (3,938)
-29,71529,715 29,71529,71531,086412210 Workers Compensation Ins3500000 39,501
(4.5) %89,37685,286 89,37685,28687,602412220 Health Insurance3500000 79,364
-2,4002,400 2,4002,4001,200412221 Retiree Health Insurance3500000 22,100
( .6) %3,8283,802 3,8283,8024,980412222 Dental Insurance3500000 4,204
-5,2405,240 5,2405,2403,847412230 Life Insurance3500000 3,725
-542542 542542520412240 Unemployment Insurance3500000 670
-408408 408408669412250 Disability Insurance3500000 607
(6.2) %369,973346,944 369,973346,944261,336412310 PERS Retirement3500000 290,961
-11,45911,459 11,45911,4599,917412320 Medicare OASDI3500000 8,041
(10.8) %11,0409,840 11,0409,8403,312412400 Deferred Compensation3500000 4,656
-0 009951,687Uniform Allowance-Cash3500000412520 0
-0 00872,562Overtime At Straight Rate3500000413110 0
-0 008,49918,127Overtime At 1.5 Rate3500000413120 0
-0 004,6270Holiday O/T-Strt/Subj To Retir3500000413230 0
(100.0)%0 82,587000Ptr. Comp. Model3500000419996 0
1.2 %1,640,6431,661,1421,661,142 1,558,056Personnel Services Total 1,283,6001,845,848
-51,66651,666 51,66662,03365,540421000 Professional Services3500000 58,078
-11,80011,800 11,80011,8009,660422120 Telephone - Cellular3500000 9,295
(2.3) %43,00042,000 43,00042,00033,261423400 Motor Pool Equipment Rental3500000 46,350
-0 00690Maint/Repair of Bldgs & Improv3500000424130 0
-3,2003,200 3,2003,2005,262424220 All Other Equip Maint/Repair3500000 4,376
-5,0005,000 5,0005,0003,282424230 Central Garage Charges3500000 4,293
-14,83514,835 14,83514,8351,419425200 Periodicals & Dues3500000 1,671
-9,5009,500 9,5009,5001,939425400 General Office Expense3500000 3,303
-0 000162Merchant Fees3500000425410 0
-1,9001,900 1,9001,900486425500 Postage3500000 980
-1,000 1,0001,0000182Central Printing Charges3500000425600 1,000
-0 001831,725Outside Printing Expense3500000425610 0
-0 02,10000Software Purchase/Licensing3500000425700 0
-2,500 2,5002,50001,580Computer Equip Purc Undr $50003500000425800 2,500
-1,2001,200 1,2001,200529426100 Janitorial Supplies3500000 555
-100100 10010023426300 Motor Fuels & Lubricants3500000 0
CCReport Name: 2017_Mid_Cycle_Report
Report Description: Budget Book - Department Budget Detail wMD
06/07/2017Date:
Time: 130
Version:
Page:19:21:28

Department / Section: Fire / Fire-Administration101 - 350000
Department Budget Detail
%Chnge16/17 vs 17/182017/182017/18
AmendedAdoptedAdopted2016/17
AmendedActualActual2016/172015/162014/15GL KeyObject Description
-5,0005,000 5,0005,0002,839426800 Special Department Supplies3500000 17,969
-0 001,0770Rotary Club Donation9890500426800 0
-14,50014,500 14,50014,5008,960427200 Training3500000 6,091
-20,00520,005 20,00520,00517,364428400 Liability Insurance3500000 20,229
(25.8) %120,17189,059 120,17158,07357,947428420 Insurance Charges - Direct3500000 52,275
(10.5) %305,377254,746273,265 305,377Non-personnel Expenses Total 209,846229,120
-0 07,99000Firefighter Memorial9798000440301 0
-0 0000Firefighter Memorial9798000440310 0
-0 0Capital Outlay & Grants Total 07,99000
106.0 %1,162,9722,395,999 2,395,9992,395,9992,395,998881100 General Fund Allocation Chgs3500000 2,347,518
(9.0) %5,7155,196 5,7155,1966,064882101 Utilization Chgs from 101 Fund3500000 6,950
-104,748104,748 104,748104,748112,113882510 Utilization Chgs from 510 Fund3500000 97,938
-0 003,8007,445Interfund Services from 101 Fd3500000884101 0
96.7 %1,273,4352,505,9432,505,943 2,506,462Charges From Others Total 2,517,9762,459,852
(4.3) %(168,134)(160,811) (168,134)(160,811)(128,369)894101 Interfund Services to 101 Fund3500000 (240,507)
-0 00(53,271)(48,884)Interfund Services to 205 Fund3500000894205 0
(4.3) %(168,134)(160,811)(160,811) (168,134)Charges to Others Total (181,641)(289,391)
40.2 %4,279,539 3,051,3214,201,7614,269,0103,829,7814,245,430Total Budget Requirements
CCReport Name: 2017_Mid_Cycle_Report
Report Description: Budget Book - Department Budget Detail wMD
06/07/2017Date:
Time: 131
Version:
Page:19:21:28

Department / Section: Fire / Fire-Prevention101 - 350500
Department Budget Detail
%Chnge16/17 vs 17/182017/182017/18
AmendedAdoptedAdopted2016/17
AmendedActualActual2016/172015/162014/15GL KeyObject Description
( .9) %826,807818,611 826,807818,611697,792411100 Salaries - Regular3505000 703,139
-(5,221) (5,221)(5,221)00Salaries - Non-Productive3505000411105 (5,221)
-0 005,5896,938Compensatory Time3505000411130 0
-0 0055,77855,190Vacation3505000411210 0
-0 0033,56625,958Holidays & Special Days Off3505000411220 0
-0 0018,18516,571Sick Leave3505000411240 0
-0 0010,3873,244Family Illness Sick Leave3505000411245 0
-0 005475Industrial Accident3505000411250 0
-0 00325143Jury Duty3505000411280 0
-0 001,209551Administrative Leave3505000411292 0
-0 00933755Night Shift Premium3505000411310 0
-0 0027,4250Vacation Payoffs3505000411410 0
-0 0016,7470Sick Leave Payoff3505000411420 0
-0 004,1620Compensatory Time Payoff3505000411430 0
(2.6) %4,4424,325 4,4424,325(40,169)411510 Accrued Payroll3505000 5,095
( .9) %25,30325,052 25,30325,05227,678412210 Workers Compensation Ins3505000 30,312
(3.8) %114,095109,708 114,095109,70886,623412220 Health Insurance3505000 79,917
-1,2001,200 1,2001,2001,100412221 Retiree Health Insurance3505000 1,200
(2.1) %4,8204,716 4,8204,7163,762412222 Dental Insurance3505000 4,024
-1,4621,462 1,4621,4621,162412230 Life Insurance3505000 1,155
(1.0) %461456 461456463412240 Unemployment Insurance3505000 514
-1,2241,224 1,2241,2241,297412250 Disability Insurance3505000 1,343
(7.0) %284,996264,903 284,996264,903253,662412310 PERS Retirement3505000 243,707
( .9) %11,98911,871 11,98911,87113,009412320 Medicare OASDI3505000 12,180
-2,5202,520 2,5202,5202,500412400 Deferred Compensation3505000 2,400
-443443 4434431,082412520 Uniform Allowance-Cash3505000 1,038
-0 00253318Overtime At Straight Rate3505000413110 0
-5,7005,700 5,7005,7004,736413120 Overtime At 1.5 Rate3505000 17,707
-0 0036143Overtime At Double Time Rate3505000413130 0
-0 001,9470Holiday O/T-Strt/Subj To Retir3505000413230 0
(100.0)%0 29,877000Ptr. Comp. Model3505000419996 0
(4.8) %1,310,1181,246,9701,246,970 1,280,241Personnel Services Total 1,231,3051,213,630
-3,0003,000 3,0003,0002,185421000 Professional Services3505000 1,933
-2,5002,500 2,5002,5002,184422100 Telephone3505000 1,933
-5,0405,040 5,0405,0406,509422120 Telephone - Cellular3505000 5,429
-44,00044,000 44,00044,00044,097423400 Motor Pool Equipment Rental3505000 43,283
-1,5001,500 1,5001,50069424230 Central Garage Charges3505000 3,440
464.3 %1,6159,115 1,6159,1152,482425200 Periodicals & Dues3505000 2,350
-4,0004,000 4,0005,5054,998425400 General Office Expense3505000 4,699
-3,0003,000 3,0003,0004,168425500 Postage3505000 4,489
-0 00881,231Outside Printing Expense3505000425610 0
-2,0002,000 2,0002,0001,799425800 Computer Equip Purc Undr $50003505000 199
-0 00640Clothing/Linen/Safety Supplies3505000426200 0
-3,5003,500 3,5003,500682426300 Motor Fuels & Lubricants3505000 921
-900900 9009001,200426710 Work Boot Reimbursement3505000 1,050
-1,0001,000 1,0001,00076426800 Special Department Supplies3505000 227
CCReport Name: 2017_Mid_Cycle_Report
Report Description: Budget Book - Department Budget Detail wMD
06/07/2017Date:
Time: 132
Version:
Page:19:21:28
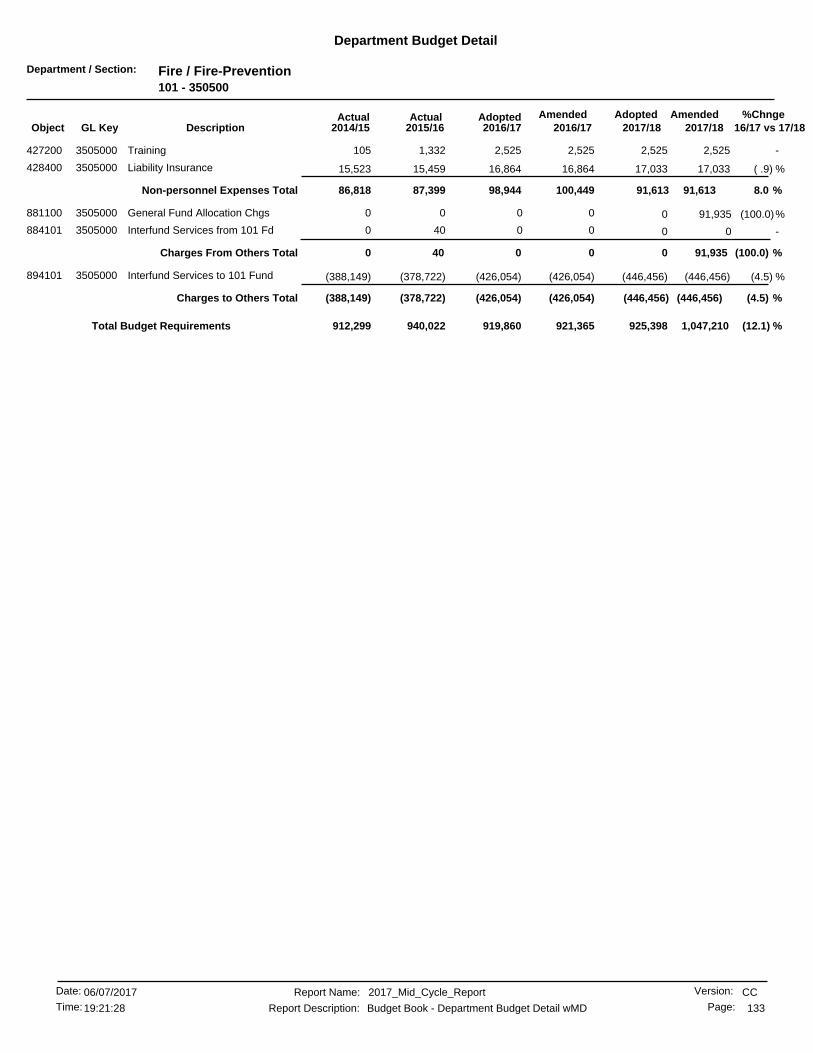
Department / Section: Fire / Fire-Prevention101 - 350500
Department Budget Detail
%Chnge16/17 vs 17/182017/182017/18
AmendedAdoptedAdopted2016/17
AmendedActualActual2016/172015/162014/15GL KeyObject Description
-2,5252,525 2,5252,5251,332427200 Training3505000 105
( .9) %17,03316,864 17,03316,86415,459428400 Liability Insurance3505000 15,523
8.0 %91,613100,44998,944 91,613Non-personnel Expenses Total 87,39986,818
(100.0)%0 91,935000General Fund Allocation Chgs3505000881100 0
-0 00400Interfund Services from 101 Fd3505000884101 0
(100.0) %0 91,935Charges From Others Total 00400
(4.5) %(446,456)(426,054) (446,456)(426,054)(378,722)894101 Interfund Services to 101 Fund3505000 (388,149)
(4.5) %(446,456)(426,054)(426,054) (446,456)Charges to Others Total (378,722)(388,149)
(12.1) %919,860 1,047,210925,398921,365940,022912,299Total Budget Requirements
CCReport Name: 2017_Mid_Cycle_Report
Report Description: Budget Book - Department Budget Detail wMD
06/07/2017Date:
Time: 133
Version:
Page:19:21:28

Department / Section: Fire / Fire-Operations101 - 351000
Department Budget Detail
%Chnge16/17 vs 17/182017/182017/18
AmendedAdoptedAdopted2016/17
AmendedActualActual2016/172015/162014/15GL KeyObject Description
(1.0) %21,831,74421,608,570 21,831,74421,608,57017,853,297411100 Salaries - Regular3510000 16,322,869
-(824,543) (824,543)(824,543)00Salaries - Non-Productive3510000411105 (824,543)
-0 002130Salaries-Substitute Labor3510000411120 0
-0 0066,94851,172Compensatory Time3510000411130 0
-0 001,272,3291,154,420Vacation3510000411210 0
-0 00861,544712,541Holidays & Special Days Off3510000411220 0
-0 008040Military Leave3510000411230 0
-0 00378,762321,541Sick Leave3510000411240 0
-0 00272,173233,702Family Illness Sick Leave3510000411245 0
-0 00147,795203,696Industrial Accident3510000411250 0
-0 0019,45324,977Bereavement Leave3510000411260 0
-0 005,6054,711Jury Duty3510000411280 0
-0 001,67223,557Administrative Leave3510000411292 0
-0 009,6588,820Night Shift Premium3510000411310 0
-0 0098,84587,059Fire Eng Operators Certif Pay3510000411330 0
-0 0077,49569,847Haz-Mat Pay3510000411340 0
-0 00626,266550,805Paramedic Pay3510000411350 0
-0 0058,05052,028Technical Rescue Team3510000411360 0
-104,500104,500 104,500104,500107,853411410 Vacation Payoffs3510000 93,970
-104,500104,500 104,500104,50090,662411420 Sick Leave Payoff3510000 54,738
-0 003,9312,389Compensatory Time Payoff3510000411430 0
(3.0) %97,12394,152 97,12394,152(1,418,970)411510 Accrued Payroll3510000 350,799
(1.0) %668,043661,214 668,043661,214700,398412210 Workers Compensation Ins3510000 834,285
(5.3) %2,254,9212,134,389 2,254,9212,134,3892,130,034412220 Health Insurance3510000 1,912,579
-252,000252,000 252,000252,000254,100412221 Retiree Health Insurance3510000 231,300
( .8) %79,46478,758 79,46478,75881,932412222 Dental Insurance3510000 77,046
(2.2) %11,91511,650 11,91511,65011,015412230 Life Insurance3510000 9,363
(1.0) %12,19212,063 12,19212,06311,740412240 Unemployment Insurance3510000 14,179
-24,48024,480 24,48024,48024,060412250 Disability Insurance3510000 23,665
(6.9) %10,547,0469,815,338 10,547,0469,815,3389,442,801412310 PERS Retirement3510000 8,195,758
(1.0) %314,873311,639 314,873311,639424,245412320 Medicare OASDI3510000 376,566
(1.8) %16,62016,320 16,62016,32020,882412400 Deferred Compensation3510000 15,420
-5,7605,760 5,7605,7606,405412520 Uniform Allowance-Cash3510000 6,838
-60,00060,000 60,00060,00050,431413110 Overtime At Straight Rate3510000 37,556
1.9 %4,329,4154,412,773 4,278,3244,412,7735,579,332413120 Overtime At 1.5 Rate3510000 5,951,593
-0 00073,507USAR 13/159149200413120 0
-0 001,03882,169USAR 2014/20169151600413120 0
-520,000520,000 520,000520,000500,625413230 Holiday O/T-Strt/Subj To Retir3510000 464,219
(100.0)%0 616,757000Ptr. Comp. Model3510000419996 0
(3.9) %41,026,81039,403,56339,403,563 40,358,962Personnel Services Total 39,773,43738,629,699
-144,610144,610 144,610144,61057,706421000 Professional Services3510000 57,148
-0 00013,988USAR 13/159149200421000 0
-0 00020,257USAR 2014/20169151600421000 0
-0 0026597Prof Services/Internal3510000421001 0
-30,00030,000 30,00030,00018,746422100 Telephone3510000 17,165
-0 0002,104USAR 13/159149200422100 0
CCReport Name: 2017_Mid_Cycle_Report
Report Description: Budget Book - Department Budget Detail wMD
06/07/2017Date:
Time: 134
Version:
Page:19:21:28

Department / Section: Fire / Fire-Operations101 - 351000
Department Budget Detail
%Chnge16/17 vs 17/182017/182017/18
AmendedAdoptedAdopted2016/17
AmendedActualActual2016/172015/162014/15GL KeyObject Description
-0 00439,123USAR 2014/20169151600422100 0
-43,70043,700 43,70043,70039,236422120 Telephone - Cellular3510000 39,669
-170,000170,000 170,000170,000138,290422200 Electric3510000 138,330
-0 0003,157USAR 13/159149200422200 0
-0 008862,054USAR 2014/20169151600422200 0
-18,00018,000 18,00018,00019,142422300 Gas3510000 17,906
-30,00030,000 30,00030,00030,359422500 Water3510000 33,352
-17,00017,000 17,00017,00014,948422600 Other Utilities3510000 19,060
-0 000100USAR 13/159149200422600 0
-17,14217,142 17,14217,14216,872422700 Refuse/Disposal Fees3510000 16,771
-0 00028,333USAR 13/159149200423200 0
-0 00056,666USAR 2014/20169151600423200 0
-65,00065,000 65,00065,00074,148423400 Motor Pool Equipment Rental3510000 75,403
-20,50020,500 20,50020,50017,776424130 Maint/Repair of Bldgs & Improv3510000 15,329
-0 000214Maintenance & Repair - General3510000424200 0
( .1) %156,195155,992 156,195156,51692,191424220 All Other Equip Maint/Repair3510000 104,325
-0 0000USAR 11/129141800424220 0
-0 0001,583USAR 13/159149200424220 0
-550,000550,000 550,000550,000811,109424230 Central Garage Charges3510000 800,168
-0 000246USAR 13/159149200424230 0
-0 0001,770USAR 2014/20169151600424230 0
-1,000 1,0001,0000103Advertising Expense3510000425100 1,000
-240 240240080Periodicals & Dues3510000425200 240
-0 00110Photo & Recording Supplies3510000425300 0
-23,41523,415 23,41523,41517,281425400 General Office Expense3510000 21,902
-0 00088USAR 13/159149200425400 0
-0 0033,89272USAR 2014/20169151600425400 0
-00 034,28467,420425400 USAR 20159154400 0
-0 0159,24800USAR 20169156800425400 0
-0 00700Postage3510000425500 0
-0 0001,217USAR 13/159149200425500 0
-0 000275USAR 2014/20169151600425500 0
-1,0001,000 1,0001,000805425600 Central Printing Charges3510000 464
-0 0088500Outside Printing Expense3510000425610 0
-0 00029USAR 2014/20169151600425610 0
-250 2501,14201,996Software Purchase/Licensing3510000425700 250
-0 0003,272USAR 13/159149200425700 0
-20,65920,659 20,65920,65914,341425800 Computer Equip Purc Undr $50003510000 11,220
-0 0001,127USAR 2014/20169151600425800 0
-32,24532,245 32,24532,24534,623426100 Janitorial Supplies3510000 33,005
( .0) %292,139291,964 292,139294,398294,615426200 Clothing/Linen/Safety Supplies3510000 230,699
-0 000289USAR 13/159149200426200 0
-0 0025,0240USAR 2014/20169151600426200 0
-240,000240,000 240,000240,000150,053426300 Motor Fuels & Lubricants3510000 187,277
-0 0001,883USAR 13/159149200426300 0
-0 0007,235USAR 2014/20169151600426300 0
CCReport Name: 2017_Mid_Cycle_Report
Report Description: Budget Book - Department Budget Detail wMD
06/07/2017Date:
Time: 135
Version:
Page:19:21:28
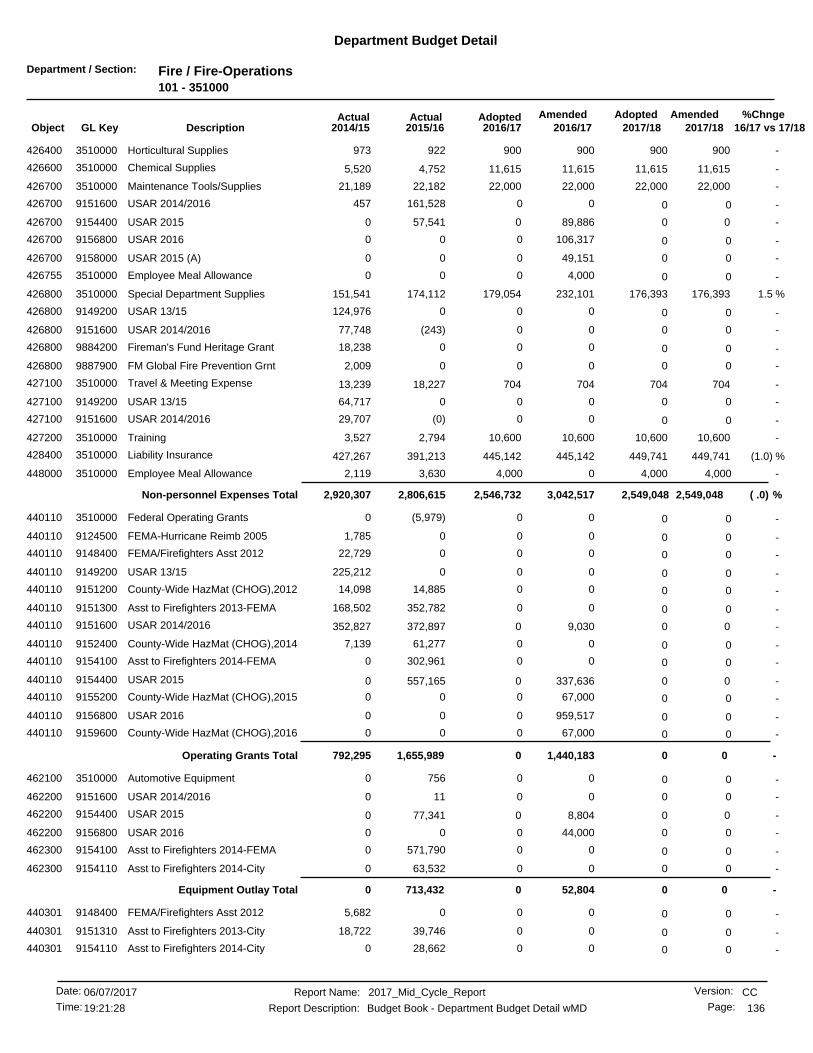
Department / Section: Fire / Fire-Operations101 - 351000
Department Budget Detail
%Chnge16/17 vs 17/182017/182017/18
AmendedAdoptedAdopted2016/17
AmendedActualActual2016/172015/162014/15GL KeyObject Description
-900900 900900922426400 Horticultural Supplies3510000 973
-11,61511,615 11,61511,6154,752426600 Chemical Supplies3510000 5,520
-22,00022,000 22,00022,00022,182426700 Maintenance Tools/Supplies3510000 21,189
-0 00161,528457USAR 2014/20169151600426700 0
-00 089,88657,541426700 USAR 20159154400 0
-0 0106,31700USAR 20169156800426700 0
-0 049,15100USAR 2015 (A)9158000426700 0
-0 04,00000Employee Meal Allowance3510000426755 0
1.5 %176,393179,054 176,393232,101174,112426800 Special Department Supplies3510000 151,541
-0 000124,976USAR 13/159149200426800 0
-0 00(243)77,748USAR 2014/20169151600426800 0
-0 00018,238Fireman's Fund Heritage Grant9884200426800 0
-0 0002,009FM Global Fire Prevention Grnt9887900426800 0
-704704 70470418,227427100 Travel & Meeting Expense3510000 13,239
-0 00064,717USAR 13/159149200427100 0
-0 00(0)29,707USAR 2014/20169151600427100 0
-10,60010,600 10,60010,6002,794427200 Training3510000 3,527
(1.0) %449,741445,142 449,741445,142391,213428400 Liability Insurance3510000 427,267
-4,000 4,00003,6302,119Employee Meal Allowance3510000448000 4,000
( .0) %2,549,0483,042,5172,546,732 2,549,048Non-personnel Expenses Total 2,806,6152,920,307
-0 00(5,979)0Federal Operating Grants3510000440110 0
-0 0001,785FEMA-Hurricane Reimb 20059124500440110 0
-0 00022,729FEMA/Firefighters Asst 20129148400440110 0
-0 000225,212USAR 13/159149200440110 0
-0 0014,88514,098County-Wide HazMat (CHOG),20129151200440110 0
-0 00352,782168,502Asst to Firefighters 2013-FEMA9151300440110 0
-00 09,030372,897440110 USAR 2014/20169151600 352,827
-0 0061,2777,139County-Wide HazMat (CHOG),20149152400440110 0
-0 00302,9610Asst to Firefighters 2014-FEMA9154100440110 0
-00 0337,636557,165440110 USAR 20159154400 0
-0 067,00000County-Wide HazMat (CHOG),20159155200440110 0
-0 0959,51700USAR 20169156800440110 0
-0 067,00000County-Wide HazMat (CHOG),20169159600440110 0
-0 0Operating Grants Total 01,440,1831,655,989792,295
-0 007560Automotive Equipment3510000462100 0
-0 00110USAR 2014/20169151600462200 0
-00 08,80477,341462200 USAR 20159154400 0
-0 044,00000USAR 20169156800462200 0
-0 00571,7900Asst to Firefighters 2014-FEMA9154100462300 0
-0 0063,5320Asst to Firefighters 2014-City9154110462300 0
-0 0Equipment Outlay Total 052,804713,4320
-0 0005,682FEMA/Firefighters Asst 20129148400440301 0
-0 0039,74618,722Asst to Firefighters 2013-City9151310440301 0
-0 0028,6620Asst to Firefighters 2014-City9154110440301 0
CCReport Name: 2017_Mid_Cycle_Report
Report Description: Budget Book - Department Budget Detail wMD
06/07/2017Date:
Time: 136
Version:
Page:19:21:28
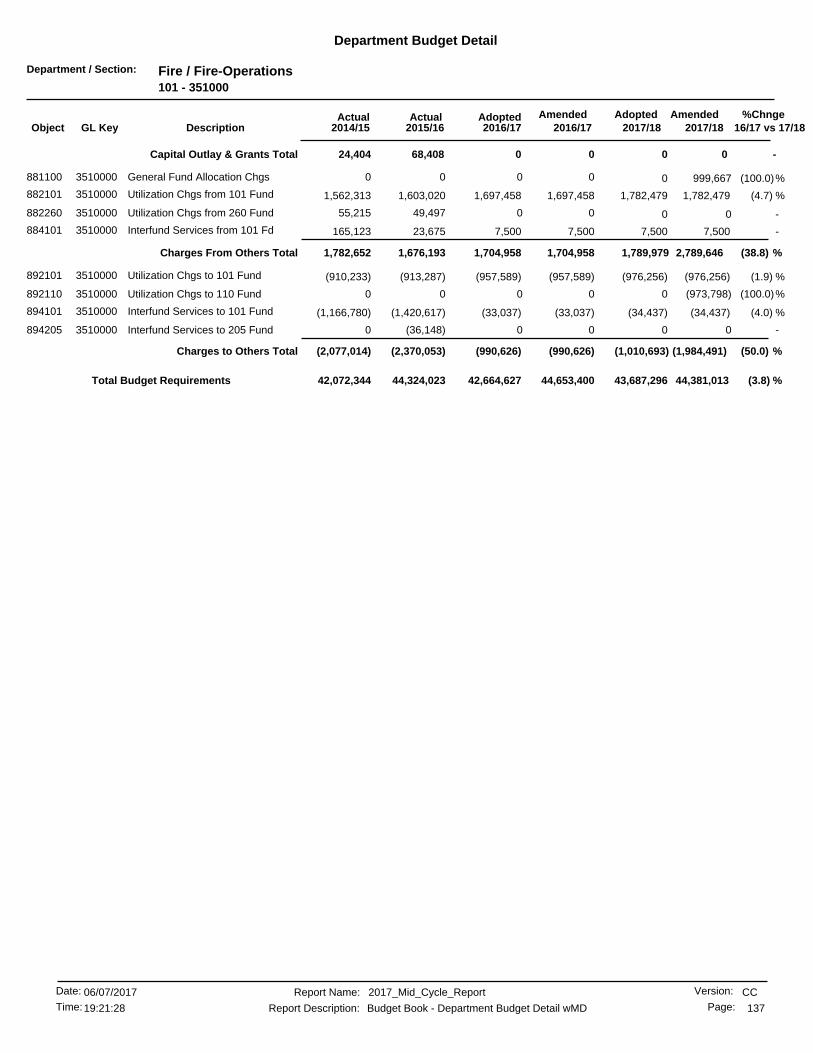
Department / Section: Fire / Fire-Operations101 - 351000
Department Budget Detail
%Chnge16/17 vs 17/182017/182017/18
AmendedAdoptedAdopted2016/17
AmendedActualActual2016/172015/162014/15GL KeyObject Description
-0 0Capital Outlay & Grants Total 0068,40824,404
(100.0)%0 999,667000General Fund Allocation Chgs3510000881100 0
(4.7) %1,782,4791,697,458 1,782,4791,697,4581,603,020882101 Utilization Chgs from 101 Fund3510000 1,562,313
-0 0049,49755,215Utilization Chgs from 260 Fund3510000882260 0
-7,5007,500 7,5007,50023,675884101 Interfund Services from 101 Fd3510000 165,123
(38.8) %2,789,6461,704,9581,704,958 1,789,979Charges From Others Total 1,676,1931,782,652
(1.9) %(976,256)(957,589) (976,256)(957,589)(913,287)892101 Utilization Chgs to 101 Fund3510000 (910,233)
(100.0)%0 (973,798)000Utilization Chgs to 110 Fund3510000892110 0
(4.0) %(34,437)(33,037) (34,437)(33,037)(1,420,617)894101 Interfund Services to 101 Fund3510000 (1,166,780)
-0 00(36,148)0Interfund Services to 205 Fund3510000894205 0
(50.0) %(1,984,491)(990,626)(990,626) (1,010,693)Charges to Others Total (2,370,053)(2,077,014)
(3.8) %42,664,627 44,381,01343,687,29644,653,40044,324,02342,072,344Total Budget Requirements
CCReport Name: 2017_Mid_Cycle_Report
Report Description: Budget Book - Department Budget Detail wMD
06/07/2017Date:
Time: 137
Version:
Page:19:21:28

Department / Section: Fire / Fire-Operatn-Paramedic Program101 - 351010
Department Budget Detail
%Chnge16/17 vs 17/182017/182017/18
AmendedAdoptedAdopted2016/17
AmendedActualActual2016/172015/162014/15GL KeyObject Description
-3,5003,500 3,5003,5005,193421000 Professional Services3510100 3,237
-5,0005,000 5,0005,0005,242422120 Telephone - Cellular3510100 5,104
(3.0) %5,6755,500 5,6755,5006,061423400 Motor Pool Equipment Rental3510100 5,528
-30,01530,015 30,01530,01528,623424220 All Other Equip Maint/Repair3510100 27,837
-500 50050000Central Garage Charges3510100424230 500
-10,25010,250 10,25010,2502,646425200 Periodicals & Dues3510100 1,343
-1,5001,500 1,5001,5001,385425400 General Office Expense3510100 816
-0 00320Postage3510100425500 0
-500500 50050067425700 Software Purchase/Licensing3510100 0
-1,000 1,0001,00001,074Computer Equip Purc Undr $50003510100425800 1,000
-1,000 1,0001,00000Motor Fuels & Lubricants3510100426300 1,000
-65,97565,975 65,97565,97579,758426800 Special Department Supplies3510100 76,739
-17,85017,850 17,85017,8507,498427200 Training3510100 2,114
( .1) %142,765142,590142,590 142,765Non-personnel Expenses Total 136,509123,796
(100.0)%0 3,092000General Fund Allocation Chgs3510100881100 0
(1.9) %976,256957,589 976,256957,589913,287882101 Utilization Chgs from 101 Fund3510100 910,233
-0 0071702,798Interfund Services from 101 Fd3510100884101 0
(2.2) %979,348957,589957,589 976,256Charges From Others Total 913,3591,613,031
-0 00895,4610Interfund Services to 101 Fund3510100894101 0
-0 0Charges to Others Total 00895,4610
(1.9) %1,100,179 1,122,1131,119,0211,100,1791,945,3291,736,828Total Budget Requirements
CCReport Name: 2017_Mid_Cycle_Report
Report Description: Budget Book - Department Budget Detail wMD
06/07/2017Date:
Time: 138
Version:
Page:19:21:28

Department / Section: Fire / Fire-Operations-Mutual Aid101 - 351020
Department Budget Detail
%Chnge16/17 vs 17/182017/182017/18
AmendedAdoptedAdopted2016/17
AmendedActualActual2016/172015/162014/15GL KeyObject Description
-650,000650,000 650,000650,0001,351,896413120 Overtime At 1.5 Rate3510200 0
-650,000650,000650,000 650,000Personnel Services Total 1,351,8960
-650,000 650,000650,000650,0001,351,8960Total Budget Requirements
CCReport Name: 2017_Mid_Cycle_Report
Report Description: Budget Book - Department Budget Detail wMD
06/07/2017Date:
Time: 139
Version:
Page:19:21:28

Department / Section: Fire / Fire-Special Services101 - 351500
Department Budget Detail
%Chnge16/17 vs 17/182017/182017/18
AmendedAdoptedAdopted2016/17
AmendedActualActual2016/172015/162014/15GL KeyObject Description
(1.6) %222,218218,484 222,218218,484354,106411100 Salaries - Regular3515000 228,988
-0 00025,979Emerg Mgmnt Perf Grant 20149152000411100 0
-00 09,19522,233411100 Emerg Mgmnt Perf Grant 20159155100 0
-0 029,00000Emerg Mgmnt Perf Grant 20169158200411100 0
-0 005,5840Emerg Mgmnt Perf Grant 20159155100411110 0
-0 002,515915Compensatory Time3515000411130 0
-0 0011,8779,091Vacation3515000411210 0
-0 009,8139,321Holidays & Special Days Off3515000411220 0
-0 002,7622,983Sick Leave3515000411240 0
-0 002901,095Family Illness Sick Leave3515000411245 0
-0 003,0590Bereavement Leave3515000411260 0
-0 002240Jury Duty3515000411280 0
-0 003,2652,406Administrative Leave3515000411292 0
-0 0015,9451,689Vacation Payoffs3515000411410 0
-0 002640Sick Leave Payoff3515000411420 0
-0 002800Compensatory Time Payoff3515000411430 0
(3.4) %1,2451,202 1,2451,202(20,159)411510 Accrued Payroll3515000 10,568
(1.6) %6,8006,686 6,8006,6866,159412210 Workers Compensation Ins3515000 8,428
(5.6) %25,93224,468 25,93224,46846,385412220 Health Insurance3515000 36,064
-0 001,0000Retiree Health Insurance3515000412221 0
(2.5) %1,5161,477 1,5161,4772,287412222 Dental Insurance3515000 1,824
(2.0) %1,1211,098 1,1211,098992412230 Life Insurance3515000 955
(1.6) %124122 124122102412240 Unemployment Insurance3515000 142
-136136 136136256412250 Disability Insurance3515000 135
(7.7) %68,74263,446 68,74263,446119,201412310 PERS Retirement3515000 63,434
(1.6) %3,2223,168 3,2223,1685,968412320 Medicare OASDI3515000 3,965
(20.0) %3,0002,400 3,0002,4001,762412400 Deferred Compensation3515000 1,200
-4,0004,000 4,0004,0001,541413120 Overtime At 1.5 Rate3515000 260
(100.0)%0 7,361000Ptr. Comp. Model3515000419996 0
(5.4) %345,417364,882326,687 338,056Personnel Services Total 597,721409,450
-10,49610,496 10,49610,4969,405421000 Professional Services3515000 12,328
-12,60012,600 12,60012,60012,656422100 Telephone3515000 5,142
-7,7407,740 7,7407,7406,333422120 Telephone - Cellular3515000 19,927
-20,00020,000 20,00020,00031,792422200 Electric3515000 22,568
-600 60060000Water3515000422500 600
-2,0402,040 2,0402,0401,839422600 Other Utilities3515000 1,989
-4,6404,640 4,6404,6402,170422700 Refuse/Disposal Fees3515000 2,109
-22,00022,000 22,00022,00023,670423400 Motor Pool Equipment Rental3515000 21,970
-5,6005,600 5,6005,6002,897424130 Maint/Repair of Bldgs & Improv3515000 3,127
-5,000 5,0005,0000686All Other Equip Maint/Repair3515000424220 5,000
-4,5004,500 4,5004,5003,269424230 Central Garage Charges3515000 2,206
-850850 850850850425200 Periodicals & Dues3515000 1,075
-2,9002,900 2,9002,9001,989425400 General Office Expense3515000 3,485
-200200 200200221425500 Postage3515000 198
-2,0002,000 2,0002,000718425600 Central Printing Charges3515000 0
-0 000100Outside Printing Expense3515000425610 0
CCReport Name: 2017_Mid_Cycle_Report
Report Description: Budget Book - Department Budget Detail wMD
06/07/2017Date:
Time: 140
Version:
Page:19:21:28
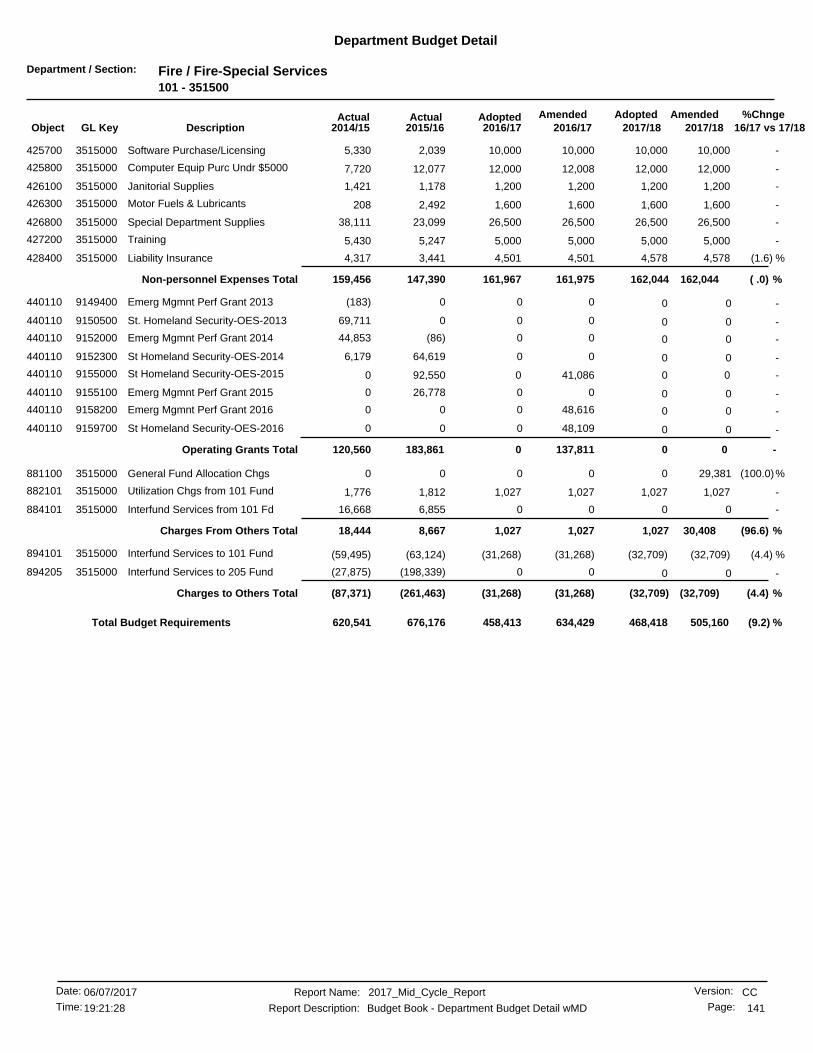
Department / Section: Fire / Fire-Special Services101 - 351500
Department Budget Detail
%Chnge16/17 vs 17/182017/182017/18
AmendedAdoptedAdopted2016/17
AmendedActualActual2016/172015/162014/15GL KeyObject Description
-10,00010,000 10,00010,0002,039425700 Software Purchase/Licensing3515000 5,330
-12,00012,000 12,00012,00812,077425800 Computer Equip Purc Undr $50003515000 7,720
-1,2001,200 1,2001,2001,178426100 Janitorial Supplies3515000 1,421
-1,6001,600 1,6001,6002,492426300 Motor Fuels & Lubricants3515000 208
-26,50026,500 26,50026,50023,099426800 Special Department Supplies3515000 38,111
-5,0005,000 5,0005,0005,247427200 Training3515000 5,430
(1.6) %4,5784,501 4,5784,5013,441428400 Liability Insurance3515000 4,317
( .0) %162,044161,975161,967 162,044Non-personnel Expenses Total 147,390159,456
-0 000(183)Emerg Mgmnt Perf Grant 20139149400440110 0
-0 00069,711St. Homeland Security-OES-20139150500440110 0
-0 00(86)44,853Emerg Mgmnt Perf Grant 20149152000440110 0
-0 0064,6196,179St Homeland Security-OES-20149152300440110 0
-00 041,08692,550440110 St Homeland Security-OES-20159155000 0
-0 0026,7780Emerg Mgmnt Perf Grant 20159155100440110 0
-0 048,61600Emerg Mgmnt Perf Grant 20169158200440110 0
-0 048,10900St Homeland Security-OES-20169159700440110 0
-0 0Operating Grants Total 0137,811183,861120,560
(100.0)%0 29,381000General Fund Allocation Chgs3515000881100 0
-1,0271,027 1,0271,0271,812882101 Utilization Chgs from 101 Fund3515000 1,776
-0 006,85516,668Interfund Services from 101 Fd3515000884101 0
(96.6) %30,4081,0271,027 1,027Charges From Others Total 8,66718,444
(4.4) %(32,709)(31,268) (32,709)(31,268)(63,124)894101 Interfund Services to 101 Fund3515000 (59,495)
-0 00(198,339)(27,875)Interfund Services to 205 Fund3515000894205 0
(4.4) %(32,709)(31,268)(31,268) (32,709)Charges to Others Total (261,463)(87,371)
(9.2) %458,413 505,160468,418634,429676,176620,541Total Budget Requirements
CCReport Name: 2017_Mid_Cycle_Report
Report Description: Budget Book - Department Budget Detail wMD
06/07/2017Date:
Time: 141
Version:
Page:19:21:28

Department / Section: Fire / Fire-Training101 - 352000
Department Budget Detail
%Chnge16/17 vs 17/182017/182017/18
AmendedAdoptedAdopted2016/17
AmendedActualActual2016/172015/162014/15GL KeyObject Description
-189,769189,769 189,769189,769474,011411100 Salaries - Regular3520000 440,105
-0 001007,893Compensatory Time3520000411130 0
-0 0018,35615,246Vacation3520000411210 0
-0 0023,06710,930Holidays & Special Days Off3520000411220 0
-0 007,4953,533Sick Leave3520000411240 0
-0 002,8732,028Family Illness Sick Leave3520000411245 0
-0 0002,244Bereavement Leave3520000411260 0
-0 001,7500Jury Duty3520000411280 0
-0 0086128Administrative Leave3520000411292 0
-0 009,25425,465Vacation Payoffs3520000411410 0
-0 00079,031Sick Leave Payoff3520000411420 0
-0 0002,667Compensatory Time Payoff3520000411430 0
(2.2) %909889 909889(24,672)411510 Accrued Payroll3520000 2,553
-5,8075,807 5,8075,80716,072412210 Workers Compensation Ins3520000 19,812
(6.6) %19,91018,588 19,91018,58837,832412220 Health Insurance3520000 36,677
-1,2001,200 1,2001,2003,600412221 Retiree Health Insurance3520000 3,500
-960960 9609601,875412222 Dental Insurance3520000 1,622
-5252 5252880412230 Life Insurance3520000 836
-106106 106106268412240 Unemployment Insurance3520000 336
-256256 256256401412250 Disability Insurance3520000 465
(5.9) %87,14381,931 87,14381,931231,646412310 PERS Retirement3520000 194,235
-2,7522,752 2,7522,7529,034412320 Medicare OASDI3520000 9,208
-0 002,3002,300Deferred Compensation3520000412400 0
-960960 9609601,082412520 Uniform Allowance-Cash3520000 995
-0 006,1848,919Overtime At Straight Rate3520000413110 0
-20,00020,000 20,00020,00032,262413120 Overtime At 1.5 Rate3520000 34,815
-012,830 012,8301,854413230 Holiday O/T-Strt/Subj To Retir3520000 0
(100.0)%0 (89)000Ptr. Comp. Model3520000419996 0
1.9 %329,735336,100336,100 329,824Personnel Services Total 858,392905,455
-25,00025,000 25,00025,00022,413421000 Professional Services3520000 21,525
-0 00258272Telephone3520000422100 0
-0 000166Telephone - Cellular3520000422120 0
-5,500 5,5005,50001,324Gas3520000422300 5,500
-35,00035,000 35,00035,00032,184423400 Motor Pool Equipment Rental3520000 36,947
-4,0004,000 4,0004,0008,726424130 Maint/Repair of Bldgs & Improv3520000 5,186
-0 00710Maintenance & Repair - General3520000424200 0
-4,5004,500 4,5005,642372424220 All Other Equip Maint/Repair3520000 3,216
-500 50050000Central Garage Charges3520000424230 500
-4,2504,250 4,2504,2501,920425200 Periodicals & Dues3520000 3,507
-1,000 1,0001,00000Photo & Recording Supplies3520000425300 1,000
-5,0005,000 5,0005,0002,571425400 General Office Expense3520000 6,586
-2,000 2,0002,000089Central Printing Charges3520000425600 2,000
-0 000671Outside Printing Expense3520000425610 0
-0 00290CFFJAC Firefighter Apprent.9773400425610 0
-4,0004,000 4,0004,00099425700 Software Purchase/Licensing3520000 358
-0 002360Computer Equip Purc Undr $50003520000425800 0
CCReport Name: 2017_Mid_Cycle_Report
Report Description: Budget Book - Department Budget Detail wMD
06/07/2017Date:
Time: 142
Version:
Page:19:21:28
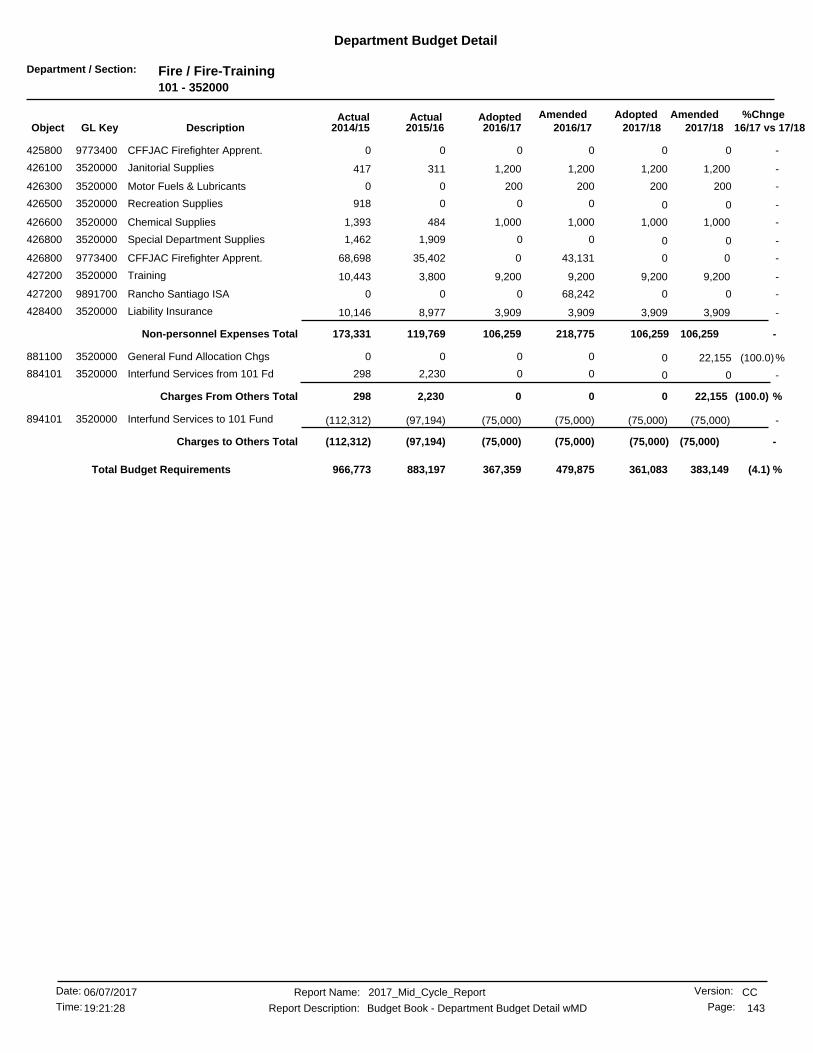
Department / Section: Fire / Fire-Training101 - 352000
Department Budget Detail
%Chnge16/17 vs 17/182017/182017/18
AmendedAdoptedAdopted2016/17
AmendedActualActual2016/172015/162014/15GL KeyObject Description
-0 0000CFFJAC Firefighter Apprent.9773400425800 0
-1,2001,200 1,2001,200311426100 Janitorial Supplies3520000 417
-200 20020000Motor Fuels & Lubricants3520000426300 200
-0 000918Recreation Supplies3520000426500 0
-1,0001,000 1,0001,000484426600 Chemical Supplies3520000 1,393
-0 001,9091,462Special Department Supplies3520000426800 0
-00 043,13135,402426800 CFFJAC Firefighter Apprent.9773400 68,698
-9,2009,200 9,2009,2003,800427200 Training3520000 10,443
-0 068,24200Rancho Santiago ISA9891700427200 0
-3,9093,909 3,9093,9098,977428400 Liability Insurance3520000 10,146
-106,259218,775106,259 106,259Non-personnel Expenses Total 119,769173,331
(100.0)%0 22,155000General Fund Allocation Chgs3520000881100 0
-0 002,230298Interfund Services from 101 Fd3520000884101 0
(100.0) %0 22,155Charges From Others Total 002,230298
-(75,000)(75,000) (75,000)(75,000)(97,194)894101 Interfund Services to 101 Fund3520000 (112,312)
-(75,000)(75,000)(75,000) (75,000)Charges to Others Total (97,194)(112,312)
(4.1) %367,359 383,149361,083479,875883,197966,773Total Budget Requirements
CCReport Name: 2017_Mid_Cycle_Report
Report Description: Budget Book - Department Budget Detail wMD
06/07/2017Date:
Time: 143
Version:
Page:19:21:28

Department / Section: Fire / Fire-Cert Unifd Part Agcy-CUPA101 - 352500
Department Budget Detail
%Chnge16/17 vs 17/182017/182017/18
AmendedAdoptedAdopted2016/17
AmendedActualActual2016/172015/162014/15GL KeyObject Description
-0 006,842(8,357)Salaries - Regular3525000411100 0
-0 002,1110Salaries-Temp & Part Time3525000411110 0
-0 00300Medicare OASDI3525000412320 0
-0 00790City Retirement Plan3525000412330 0
-0 0Personnel Services Total 009,063(8,357)
-0 0003,690Professional Services3525000421000 0
-2,100 2,1002,10000Telephone - Cellular3525000422120 2,100
-500 50050000Central Garage Charges3525000424230 500
-150 1501500100Periodicals & Dues3525000425200 150
-200 20020000Photo & Recording Supplies3525000425300 200
-700700 700700333425400 General Office Expense3525000 53
-0 006040Postage3525000425500 0
-250 2502500735Central Printing Charges3525000425600 250
-0 000188Outside Printing Expense3525000425610 0
-8,0008,000 8,0008,0008,000425700 Software Purchase/Licensing3525000 8,000
-00 01,1697,000425800 CUPA-Electronic Reporting9330300 11,830
-500500 500500538426200 Clothing/Linen/Safety Supplies3525000 87
-200 20020000Motor Fuels & Lubricants3525000426300 200
-500500 5005007426800 Special Department Supplies3525000 109
-5,7005,700 5,7005,7003,133427200 Training3525000 606
-18,80019,96918,800 18,800Non-personnel Expenses Total 19,61825,401
(100.0)%0 4,805000General Fund Allocation Chgs3525000881100 0
(4.5) %446,456426,054 446,456426,054371,629884101 Interfund Services from 101 Fd3525000 396,507
(5.5) %451,261426,054426,054 446,456Charges From Others Total 371,629396,507
-0 00(2,292)0Interfund Services to 101 Fund3525000894101 0
-0 0Charges to Others Total 00(2,292)0
(5.3) %444,854 470,061465,256446,023398,019413,551Total Budget Requirements
CCReport Name: 2017_Mid_Cycle_Report
Report Description: Budget Book - Department Budget Detail wMD
06/07/2017Date:
Time: 144
Version:
Page:19:21:28

Department / Section: Fire / Fire-Debt101 - 359000
Department Budget Detail
%Chnge16/17 vs 17/182017/182017/18
AmendedAdoptedAdopted2016/17
AmendedActualActual2016/172015/162014/15GL KeyObject Description
-05,685,766 5,833,0345,685,7665,552,028882101 Utilization Chgs from 101 Fund3590000 5,258,293
(100.0)%0 5,822,133000Utilization Chgs from 390 Fund3590000882390 0
(2.3) %5,822,1335,685,7665,685,766 5,833,034Charges From Others Total 5,552,0285,258,293
(2.3) %5,685,766 5,822,1335,833,0345,685,7665,552,0285,258,293Total Budget Requirements
CCReport Name: 2017_Mid_Cycle_Report
Report Description: Budget Book - Department Budget Detail wMD
06/07/2017Date:
Time: 145
Version:
Page:19:21:28
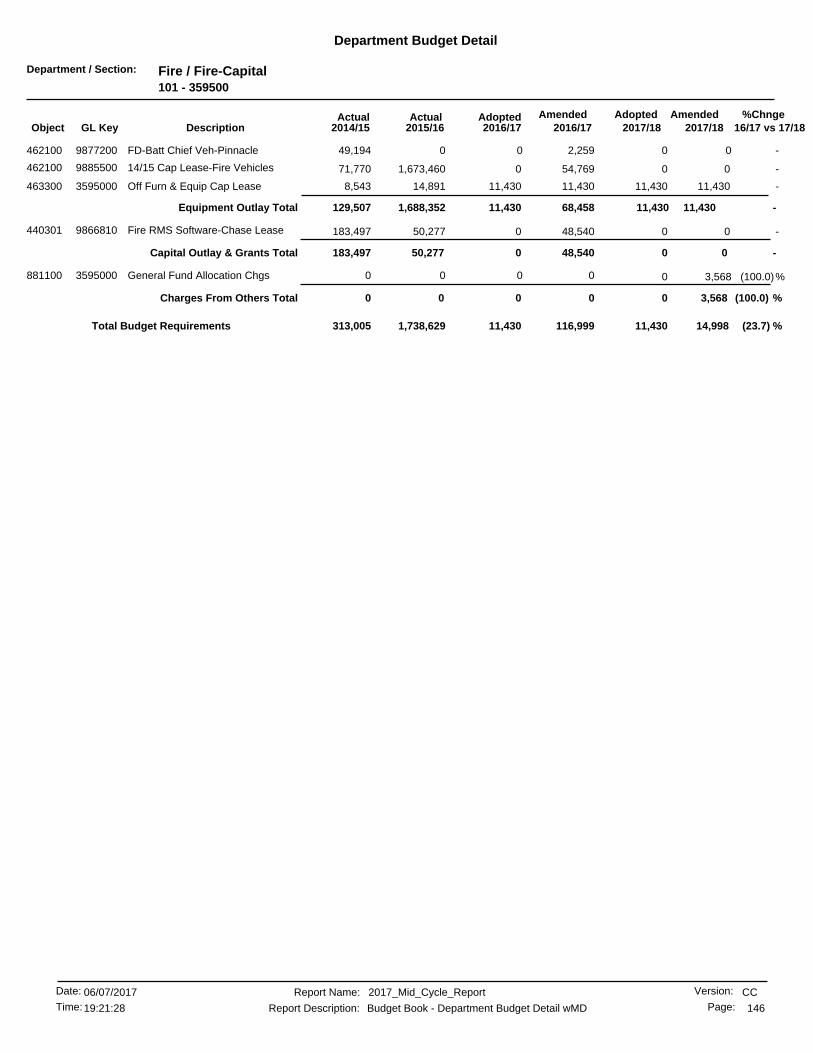
Department / Section: Fire / Fire-Capital101 - 359500
Department Budget Detail
%Chnge16/17 vs 17/182017/182017/18
AmendedAdoptedAdopted2016/17
AmendedActualActual2016/172015/162014/15GL KeyObject Description
-0 02,259049,194FD-Batt Chief Veh-Pinnacle9877200462100 0
-00 054,7691,673,460462100 14/15 Cap Lease-Fire Vehicles9885500 71,770
-11,43011,430 11,43011,43014,891463300 Off Furn & Equip Cap Lease3595000 8,543
-11,43068,45811,430 11,430Equipment Outlay Total 1,688,352129,507
-00 048,54050,277440301 Fire RMS Software-Chase Lease9866810 183,497
-0 0Capital Outlay & Grants Total 048,54050,277183,497
(100.0)%0 3,568000General Fund Allocation Chgs3595000881100 0
(100.0) %0 3,568Charges From Others Total 0000
(23.7) %11,430 14,99811,430116,9991,738,629313,005Total Budget Requirements
CCReport Name: 2017_Mid_Cycle_Report
Report Description: Budget Book - Department Budget Detail wMD
06/07/2017Date:
Time: 146
Version:
Page:19:21:28

Department / Section: Fire / FD-Managed Savings101 - 359900
Department Budget Detail
%Chnge16/17 vs 17/182017/182017/18
AmendedAdoptedAdopted2016/17
AmendedActualActual2016/172015/162014/15GL KeyObject Description
-(750,000) (750,000)(750,000)00Managed Savings Allocation3599000499999 (750,000)
-(750,000) (750,000)Managed Savings Total (750,000)(750,000)00
-(750,000)(750,000) (750,000)(750,000)0Total Budget Requirements 0
CCReport Name: 2017_Mid_Cycle_Report
Report Description: Budget Book - Department Budget Detail wMD
06/07/2017Date:
Time: 147
Version:
Page:19:21:28

Department / Section: Public Works / Public Works-Administration101 - 410000
Department Budget Detail
%Chnge16/17 vs 17/182017/182017/18
AmendedAdoptedAdopted2016/17
AmendedActualActual2016/172015/162014/15GL KeyObject Description
(5.7) %1,036,530976,898 985,434976,898679,991411100 Salaries - Regular4100000 636,032
(72.1)%7,712 27,7147,71200Salaries - Non-Productive4100000411105 27,714
-0 0040,27943,868Vacation4100000411210 0
-0 0029,67730,442Holidays & Special Days Off4100000411220 0
-0 005,7678,451Sick Leave4100000411240 0
-0 0015,36617,678Family Illness Sick Leave4100000411245 0
-0 003,9291,482Bereavement Leave4100000411260 0
-0 000340Jury Duty4100000411280 0
-0 0012,27715,532Administrative Leave4100000411292 0
-0 0080,2637,399Vacation Payoffs4100000411410 0
-0 0053,6070Sick Leave Payoff4100000411420 0
(8.0) %5,8085,343 5,4895,343(34,054)411510 Accrued Payroll4100000 10,621
(5.7) %35,55433,509 33,80133,50928,197412210 Workers Compensation Ins4100000 29,422
(17.8) %106,17587,202 91,93087,20279,939412220 Health Insurance4100000 77,486
(12.5) %4,3203,780 3,7803,7803,456412222 Dental Insurance4100000 3,210
(1.2) %6,1366,058 6,1106,0584,956412230 Life Insurance4100000 4,319
(6.0) %581546 552546429412240 Unemployment Insurance4100000 531
(100.0)%0 136000Disability Insurance4100000412250 0
(11.6) %332,013293,481 315,909293,481252,712412310 PERS Retirement4100000 217,179
(5.7) %15,03014,165 14,28914,16514,258412320 Medicare OASDI4100000 11,177
(20.0) %12,0009,600 12,0009,6006,375412400 Deferred Compensation4100000 4,025
-4,2004,200 4,2004,2004,375412500 Automobile/Expense Allowance4100000 4,200
(100.0)%0 25,801000Ptr. Comp. Model4100000419996 0
(10.5) %1,611,9981,442,4941,442,494 1,501,208Personnel Services Total 1,281,8061,123,405
-3,0003,000 3,0003,0002,892421000 Professional Services4100000 1,740
-0 0002,849AVL9823300421000 0
-0 00132,0304,808Prof Services/Internal4100000421001 0
-1,3751,375 1,3751,3751,466422100 Telephone4100000 1,022
-7,2507,250 7,2507,2503,741422120 Telephone - Cellular4100000 3,202
-0 003,8884,223Motor Pool Equipment Rental4100000423400 0
-1,000 1,0001,00000Constr & Maint Materials4100000424120 1,000
-2,5002,500 2,5002,500368425200 Periodicals & Dues4100000 0
-10,22010,220 10,22010,2208,720425400 General Office Expense4100000 16,462
-0 000280Merchant Fees4100000425410 0
-350350 350350113425500 Postage4100000 36
-1,700 1,7001,700081Central Printing Charges4100000425600 1,700
-0 001,1801,182Outside Printing Expense4100000425610 0
-0 001,2910Software Purchase/Licensing4100000425700 0
-9,0009,000 9,0009,0003,289425800 Computer Equip Purc Undr $50004100000 9,080
-0 025000Clothing/Linen/Safety Supplies4100000426200 0
-4,7454,745 4,7454,7453,153426800 Special Department Supplies4100000 734
-0 005,7281,932Travel & Meeting Expense4100000427100 0
-6,3006,300 6,3006,300676427200 Training4100000 2,984
(5.7) %70,79466,721 67,30466,72144,485428400 Liability Insurance4100000 35,565
(3.4) %118,234114,411114,161 114,744Non-personnel Expenses Total 213,02586,188
CCReport Name: 2017_Mid_Cycle_Report
Report Description: Budget Book - Department Budget Detail wMD
06/07/2017Date:
Time: 148
Version:
Page:19:21:28

Department / Section: Public Works / Public Works-Administration101 - 410000
Department Budget Detail
%Chnge16/17 vs 17/182017/182017/18
AmendedAdoptedAdopted2016/17
AmendedActualActual2016/172015/162014/15GL KeyObject Description
(39.2) %2,522,8121,532,909 1,532,9091,532,9091,532,908881100 General Fund Allocation Chgs4100000 1,662,963
(3.8) %91,30087,750 91,30087,75081,028882101 Utilization Chgs from 101 Fund4100000 85,950
(5.0) %35,50033,700 35,50033,70040,500882510 Utilization Chgs from 510 Fund4100000 60,499
(37.5) %2,649,6121,654,3591,654,359 1,659,709Charges From Others Total 1,654,4371,809,413
(9.2) %(807,537)(732,827) (732,827)(732,827)(732,826)892101 Utilization Chgs to 101 Fund4100000 (472,422)
-(717,286)(717,286) (717,286)(717,286)(717,285)892540 Utilization Chgs to 540 Fund4100000 (926,565)
-(1,151,948)(1,151,948) (1,151,948)(1,151,948)(1,151,947)892550 Utilization Chgs to 550 Fund4100000 (1,232,079)
(4.3) %(314,829)(301,060) (301,060)(301,060)(301,059)892570 Utilization Chgs to 570 Fund4100000 (381,899)
(2.9) %(2,991,600)(2,903,121)(2,903,121) (2,903,121)Charges to Others Total (2,903,120)(3,012,966)
(77.8) %307,893 1,388,244372,540308,143246,1496,040Total Budget Requirements
CCReport Name: 2017_Mid_Cycle_Report
Report Description: Budget Book - Department Budget Detail wMD
06/07/2017Date:
Time: 149
Version:
Page:19:21:28
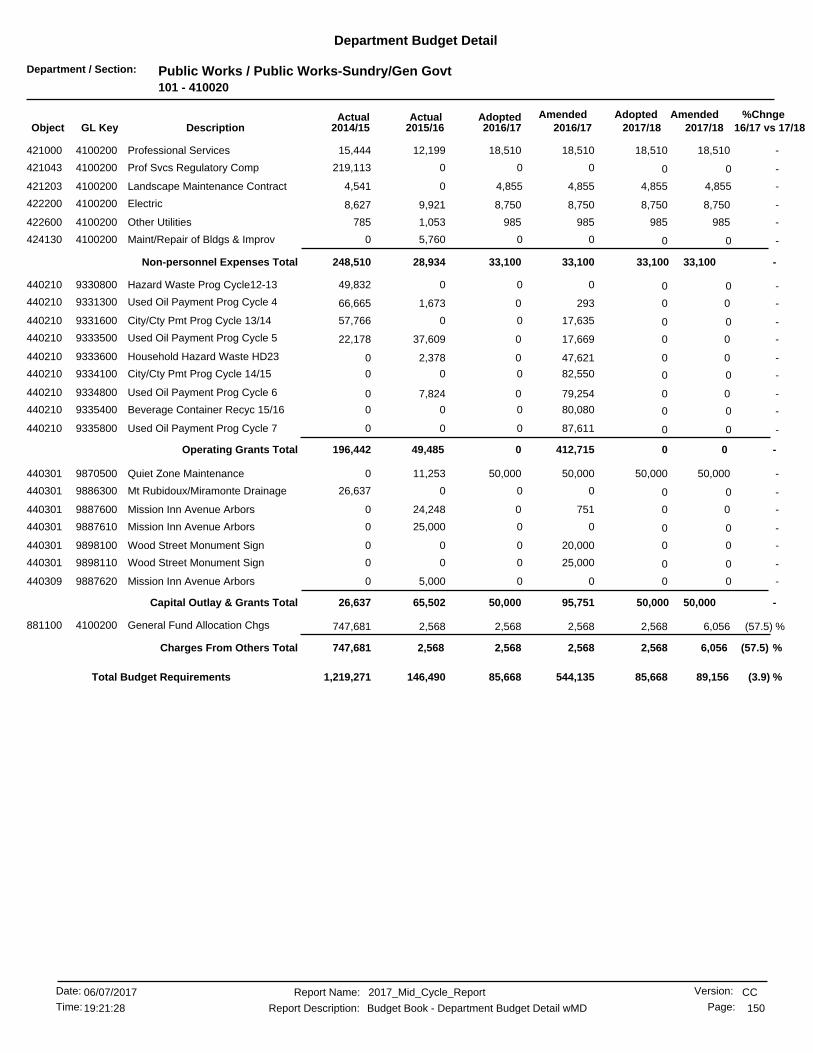
Department / Section: Public Works / Public Works-Sundry/Gen Govt101 - 410020
Department Budget Detail
%Chnge16/17 vs 17/182017/182017/18
AmendedAdoptedAdopted2016/17
AmendedActualActual2016/172015/162014/15GL KeyObject Description
-18,51018,510 18,51018,51012,199421000 Professional Services4100200 15,444
-0 000219,113Prof Svcs Regulatory Comp4100200421043 0
-4,855 4,8554,85504,541Landscape Maintenance Contract4100200421203 4,855
-8,7508,750 8,7508,7509,921422200 Electric4100200 8,627
-985985 9859851,053422600 Other Utilities4100200 785
-0 005,7600Maint/Repair of Bldgs & Improv4100200424130 0
-33,10033,10033,100 33,100Non-personnel Expenses Total 28,934248,510
-0 00049,832Hazard Waste Prog Cycle12-139330800440210 0
-00 02931,673440210 Used Oil Payment Prog Cycle 49331300 66,665
-0 017,635057,766City/Cty Pmt Prog Cycle 13/149331600440210 0
-00 017,66937,609440210 Used Oil Payment Prog Cycle 59333500 22,178
-00 047,6212,378440210 Household Hazard Waste HD239333600 0
-0 082,55000City/Cty Pmt Prog Cycle 14/159334100440210 0
-00 079,2547,824440210 Used Oil Payment Prog Cycle 69334800 0
-0 080,08000Beverage Container Recyc 15/169335400440210 0
-0 087,61100Used Oil Payment Prog Cycle 79335800440210 0
-0 0Operating Grants Total 0412,71549,485196,442
-50,00050,000 50,00050,00011,253440301 Quiet Zone Maintenance9870500 0
-0 00026,637Mt Rubidoux/Miramonte Drainage9886300440301 0
-00 075124,248440301 Mission Inn Avenue Arbors9887600 0
-0 0025,0000Mission Inn Avenue Arbors9887610440301 0
-0 020,00000Wood Street Monument Sign9898100440301 0
-0 025,00000Wood Street Monument Sign9898110440301 0
-0 005,0000Mission Inn Avenue Arbors9887620440309 0
-50,00095,75150,000 50,000Capital Outlay & Grants Total 65,50226,637
(57.5) %6,0562,568 2,5682,5682,568881100 General Fund Allocation Chgs4100200 747,681
(57.5) %2,568 6,056Charges From Others Total 2,5682,5682,568747,681
(3.9) %85,668 89,15685,668544,135146,4901,219,271Total Budget Requirements
CCReport Name: 2017_Mid_Cycle_Report
Report Description: Budget Book - Department Budget Detail wMD
06/07/2017Date:
Time: 150
Version:
Page:19:21:28

Department / Section: Public Works / Public Works-Streets-Admin101 - 411000
Department Budget Detail
%Chnge16/17 vs 17/182017/182017/18
AmendedAdoptedAdopted2016/17
AmendedActualActual2016/172015/162014/15GL KeyObject Description
( .7) %348,828346,170 348,828346,170270,739411100 Salaries - Regular4110000 247,424
-0 001,2491,566Compensatory Time4110000411130 0
-0 0019,7949,465Vacation4110000411210 0
-0 0011,12110,917Holidays & Special Days Off4110000411220 0
-0 003,173(2,437)Sick Leave4110000411240 0
-0 001,7013,027Family Illness Sick Leave4110000411245 0
-0 001,8710Industrial Accident4110000411250 0
-0 003,8433,489Administrative Leave4110000411292 0
-0 005,0544,123Vacation Payoffs4110000411410 0
(2.6) %2,0501,995 2,0501,995(10,131)411510 Accrued Payroll4110000 (654)
( .7) %11,96511,874 11,96511,87411,505412210 Workers Compensation Ins4110000 11,503
(5.0) %48,73946,277 48,73946,27740,913412220 Health Insurance4110000 41,281
(3.6) %1,8041,739 1,8041,7391,687412222 Dental Insurance4110000 1,555
( .8) %1,8911,874 1,8911,8741,600412230 Life Insurance4110000 1,303
( .5) %195194 195194174412240 Unemployment Insurance4110000 207
-136136 136136146412250 Disability Insurance4110000 203
(6.6) %122,019113,944 122,019113,94495,287412310 PERS Retirement4110000 76,794
( .7) %5,0585,020 5,0585,0204,614412320 Medicare OASDI4110000 4,099
(20.0) %4,5003,600 4,5003,6002,250412400 Deferred Compensation4110000 1,200
-0 000(360)Overtime At Straight Rate4110000413110 0
-2,0002,000 2,0002,000258413120 Overtime At 1.5 Rate4110000 (97)
-0 00014Holiday O/T-1.5 Rate/Non-Sched4110000413220 0
(100.0)%0 12,630000Ptr. Comp. Model4110000419996 0
(4.8) %561,815534,823534,823 549,185Personnel Services Total 466,853414,626
-0 007,8922,854Prof Services/Internal4110000421001 0
-1,2001,200 1,2001,200795422100 Telephone4110000 785
-2,4002,400 2,4002,4002,935422120 Telephone - Cellular4110000 1,756
(2.9) %4,8564,715 4,8564,7155,168423400 Motor Pool Equipment Rental4110000 4,676
-300300 3003001424220 All Other Equip Maint/Repair4110000 7
-0 002140Periodicals & Dues4110000425200 0
-6,9006,900 6,9006,9008,617425400 General Office Expense4110000 4,647
-400400 40040068425500 Postage4110000 29
-1,0001,000 1,0001,00035425600 Central Printing Charges4110000 38
-0 00126140Outside Printing Expense4110000425610 0
-0 070000Software Purchase/Licensing4110000425700 0
-0 003,2340Computer Equip Purc Undr $50004110000425800 0
-0 000354Clothing/Linen/Safety Supplies4110000426200 0
-0 004,2070Special Department Supplies4110000426800 0
-0 00020Travel & Meeting Expense4110000427100 0
-0 00154884Training4110000427200 0
( .7) %23,82523,643 23,82523,64318,150428400 Liability Insurance4110000 13,905
( .7) %40,88141,25840,558 40,881Non-personnel Expenses Total 51,60330,100
(5.4) %268,062253,580 253,580253,580253,579881100 General Fund Allocation Chgs4110000 0
-141,591141,591 141,591141,591141,591882101 Utilization Chgs from 101 Fund4110000 36,835
(3.5) %409,653395,171395,171 395,171Charges From Others Total 395,17036,835
CCReport Name: 2017_Mid_Cycle_Report
Report Description: Budget Book - Department Budget Detail wMD
06/07/2017Date:
Time: 151
Version:
Page:19:21:28
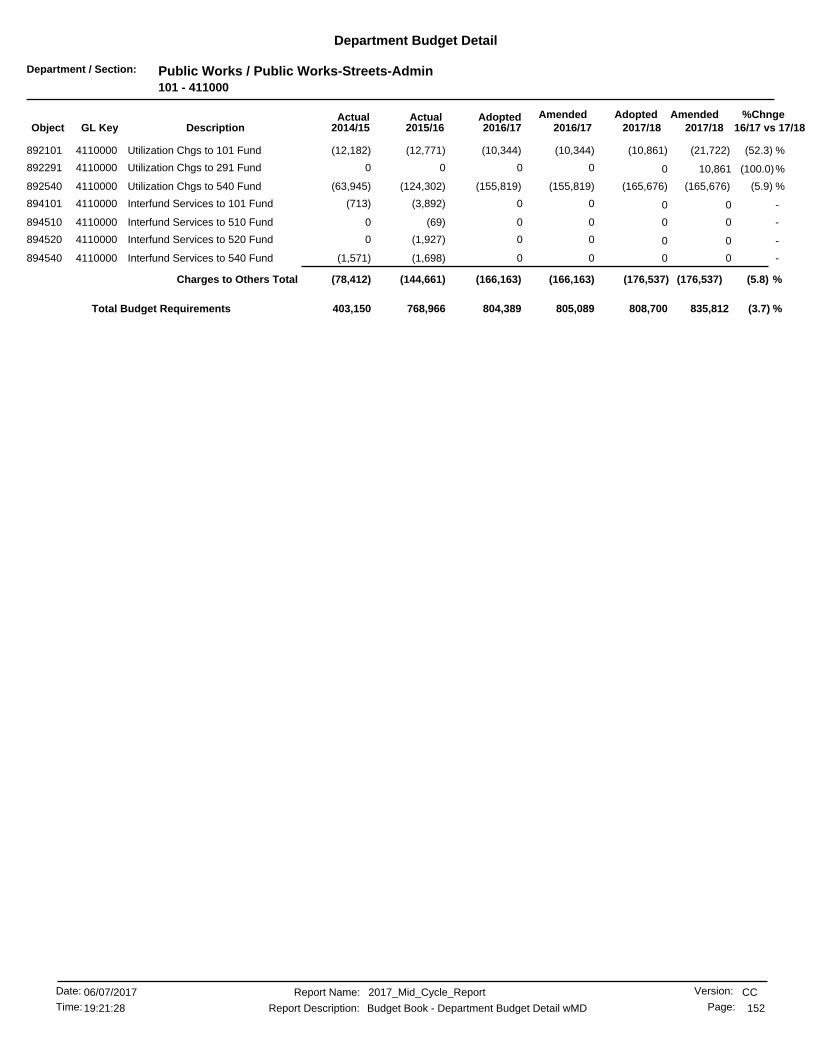
Department / Section: Public Works / Public Works-Streets-Admin101 - 411000
Department Budget Detail
%Chnge16/17 vs 17/182017/182017/18
AmendedAdoptedAdopted2016/17
AmendedActualActual2016/172015/162014/15GL KeyObject Description
(52.3) %(21,722)(10,344) (10,861)(10,344)(12,771)892101 Utilization Chgs to 101 Fund4110000 (12,182)
(100.0)%0 10,861000Utilization Chgs to 291 Fund4110000892291 0
(5.9) %(165,676)(155,819) (165,676)(155,819)(124,302)892540 Utilization Chgs to 540 Fund4110000 (63,945)
-0 00(3,892)(713)Interfund Services to 101 Fund4110000894101 0
-0 00(69)0Interfund Services to 510 Fund4110000894510 0
-0 00(1,927)0Interfund Services to 520 Fund4110000894520 0
-0 00(1,698)(1,571)Interfund Services to 540 Fund4110000894540 0
(5.8) %(176,537)(166,163)(166,163) (176,537)Charges to Others Total (144,661)(78,412)
(3.7) %804,389 835,812808,700805,089768,966403,150Total Budget Requirements
CCReport Name: 2017_Mid_Cycle_Report
Report Description: Budget Book - Department Budget Detail wMD
06/07/2017Date:
Time: 152
Version:
Page:19:21:28

Department / Section: Public Works / Public Wrk-Streets-Maintenance101 - 411010
Department Budget Detail
%Chnge16/17 vs 17/182017/182017/18
AmendedAdoptedAdopted2016/17
AmendedActualActual2016/172015/162014/15GL KeyObject Description
( .8) %2,944,1552,919,036 2,944,1552,919,0362,386,365411100 Salaries - Regular4110100 2,205,501
(4.7) %110,289105,037 110,289105,03782,128411110 Salaries-Temp & Part Time4110100 71,749
-0 0020,30114,728Compensatory Time4110100411130 0
-0 00177,739166,189Vacation4110100411210 0
-0 00114,421111,413Holidays & Special Days Off4110100411220 0
-0 001,7640Rest Time Pay - IBEW4110100411225 0
-0 0076,17975,327Sick Leave4110100411240 0
-0 0018,63516,487Family Illness Sick Leave4110100411245 0
-0 0011,23318,898Industrial Accident4110100411250 0
-0 003,8434,211Bereavement Leave4110100411260 0
-0 003,0892,035Jury Duty4110100411280 0
-0 006,4663,140Administrative Leave4110100411292 0
-4,0004,000 4,0004,0002,757411320 Temporary Foreman Pay4110100 2,560
-0 0029,61711,702Vacation Payoffs4110100411410 0
-0 00889,661Sick Leave Payoff4110100411420 0
-0 007791,332Compensatory Time Payoff4110100411430 0
(2.6) %17,70617,231 17,70617,231(160,477)411510 Accrued Payroll4110100 63,786
( .9) %104,760103,719 104,760103,719114,270412210 Workers Compensation Ins4110100 118,251
(4.6) %559,961533,903 559,961533,903487,753412220 Health Insurance4110100 450,422
( .6) %22,78822,632 22,78822,63221,744412222 Dental Insurance4110100 21,320
( .0) %3,6603,658 3,6603,6583,695412230 Life Insurance4110100 3,312
( .8) %1,7031,688 1,7031,6881,737412240 Unemployment Insurance4110100 2,133
-6,1206,120 6,1206,1205,925412250 Disability Insurance4110100 5,653
(7.0) %910,468846,132 910,468846,132692,713412310 PERS Retirement4110100 648,730
( .9) %40,19239,797 40,19239,79741,433412320 Medicare OASDI4110100 36,291
(4.7) %4,1373,940 4,1373,9403,152412330 City Retirement Plan4110100 2,710
(20.0) %7,5006,000 7,5006,0004,687412400 Deferred Compensation4110100 2,900
-13,00013,000 13,00013,00011,759413110 Overtime At Straight Rate4110100 13,805
-135,000135,000 135,000135,000156,938413120 Overtime At 1.5 Rate4110100 96,939
-8,6008,600 8,6008,60012,951413130 Overtime At Double Time Rate4110100 8,763
(100.0)%0 149,086000Ptr. Comp. Model4110100419996 0
(5.4) %5,043,1254,769,4934,769,493 4,894,039Personnel Services Total 4,333,6984,189,959
-43,89043,890 43,89046,38561,634421000 Professional Services4110100 55,529
-0 0073,99538,818Prof Services/Internal4110100421001 0
-679679 679679252422100 Telephone4110100 383
-17,93017,930 17,93017,93015,665422120 Telephone - Cellular4110100 15,566
-8,550 8,5508,55000Electric4110100422200 8,550
-8,6928,692 8,6928,6923,692422500 Water4110100 5,790
-670 67067000Other Utilities4110100422600 670
-49,50049,500 49,50049,50023,775423100 Equipment Rental4110100 28,475
-627,735627,735 627,735627,735680,268423400 Motor Pool Equipment Rental4110100 636,559
-4,2764,276 4,2764,2766,051424120 Constr & Maint Materials4110100 7,484
-923,030923,030 923,030495,030589,167424121 Const. Maint. Materials- St. M4110100 737,168
-138,600138,600 138,60090,60098,347424122 Const. Maint. Materials- Conc4110100 115,700
-171,060171,060 171,060117,06075,313424123 Const. Maint. Mat-Grad./Slry4110100 87,320
-4,1804,180 4,1804,1801,027424130 Maint/Repair of Bldgs & Improv4110100 342
CCReport Name: 2017_Mid_Cycle_Report
Report Description: Budget Book - Department Budget Detail wMD
06/07/2017Date:
Time: 153
Version:
Page:19:21:28
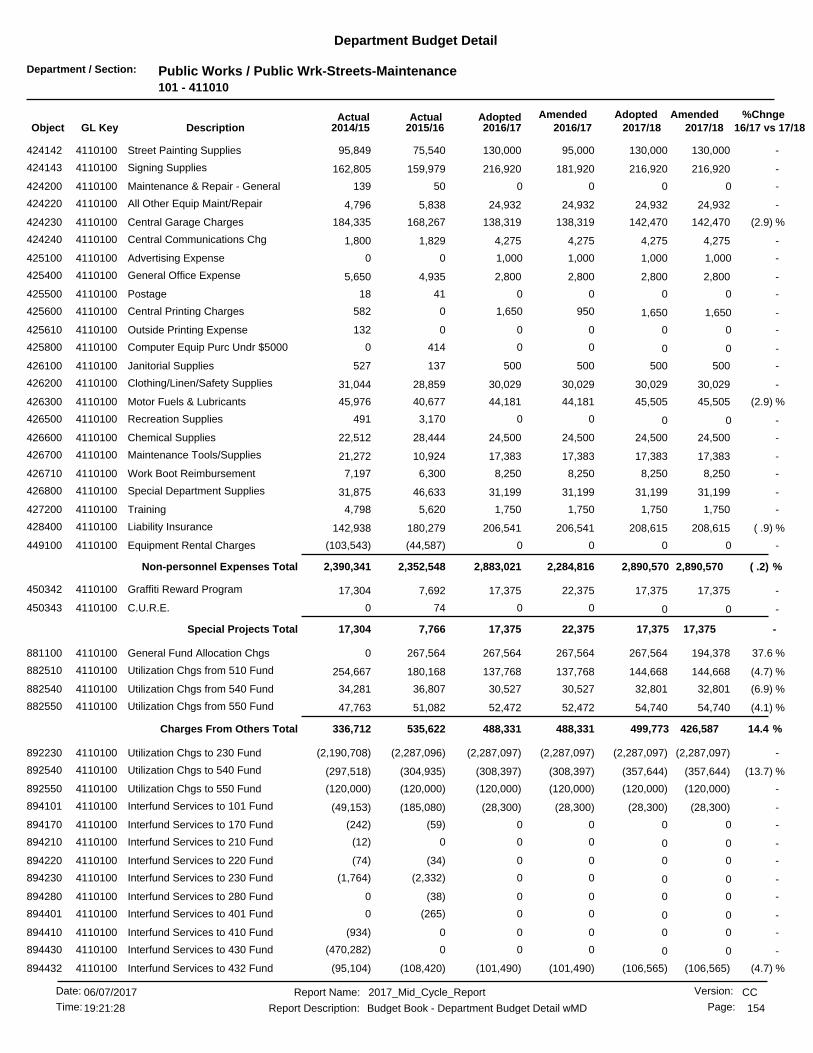
Department / Section: Public Works / Public Wrk-Streets-Maintenance101 - 411010
Department Budget Detail
%Chnge16/17 vs 17/182017/182017/18
AmendedAdoptedAdopted2016/17
AmendedActualActual2016/172015/162014/15GL KeyObject Description
-130,000130,000 130,00095,00075,540424142 Street Painting Supplies4110100 95,849
-216,920216,920 216,920181,920159,979424143 Signing Supplies4110100 162,805
-0 0050139Maintenance & Repair - General4110100424200 0
-24,93224,932 24,93224,9325,838424220 All Other Equip Maint/Repair4110100 4,796
(2.9) %142,470138,319 142,470138,319168,267424230 Central Garage Charges4110100 184,335
-4,2754,275 4,2754,2751,829424240 Central Communications Chg4110100 1,800
-1,000 1,0001,00000Advertising Expense4110100425100 1,000
-2,8002,800 2,8002,8004,935425400 General Office Expense4110100 5,650
-0 004118Postage4110100425500 0
-1,650 1,6509500582Central Printing Charges4110100425600 1,650
-0 000132Outside Printing Expense4110100425610 0
-0 004140Computer Equip Purc Undr $50004110100425800 0
-500500 500500137426100 Janitorial Supplies4110100 527
-30,02930,029 30,02930,02928,859426200 Clothing/Linen/Safety Supplies4110100 31,044
(2.9) %45,50544,181 45,50544,18140,677426300 Motor Fuels & Lubricants4110100 45,976
-0 003,170491Recreation Supplies4110100426500 0
-24,50024,500 24,50024,50028,444426600 Chemical Supplies4110100 22,512
-17,38317,383 17,38317,38310,924426700 Maintenance Tools/Supplies4110100 21,272
-8,2508,250 8,2508,2506,300426710 Work Boot Reimbursement4110100 7,197
-31,19931,199 31,19931,19946,633426800 Special Department Supplies4110100 31,875
-1,7501,750 1,7501,7505,620427200 Training4110100 4,798
( .9) %208,615206,541 208,615206,541180,279428400 Liability Insurance4110100 142,938
-0 00(44,587)(103,543)Equipment Rental Charges4110100449100 0
( .2) %2,890,5702,284,8162,883,021 2,890,570Non-personnel Expenses Total 2,352,5482,390,341
-17,37517,375 17,37522,3757,692450342 Graffiti Reward Program4110100 17,304
-0 00740C.U.R.E.4110100450343 0
-17,37522,37517,375 17,375Special Projects Total 7,76617,304
37.6 %194,378267,564 267,564267,564267,564881100 General Fund Allocation Chgs4110100 0
(4.7) %144,668137,768 144,668137,768180,168882510 Utilization Chgs from 510 Fund4110100 254,667
(6.9) %32,80130,527 32,80130,52736,807882540 Utilization Chgs from 540 Fund4110100 34,281
(4.1) %54,74052,472 54,74052,47251,082882550 Utilization Chgs from 550 Fund4110100 47,763
14.4 %426,587488,331488,331 499,773Charges From Others Total 535,622336,712
-(2,287,097)(2,287,097) (2,287,097)(2,287,097)(2,287,096)892230 Utilization Chgs to 230 Fund4110100 (2,190,708)
(13.7) %(357,644)(308,397) (357,644)(308,397)(304,935)892540 Utilization Chgs to 540 Fund4110100 (297,518)
-(120,000)(120,000) (120,000)(120,000)(120,000)892550 Utilization Chgs to 550 Fund4110100 (120,000)
-(28,300)(28,300) (28,300)(28,300)(185,080)894101 Interfund Services to 101 Fund4110100 (49,153)
-0 00(59)(242)Interfund Services to 170 Fund4110100894170 0
-0 000(12)Interfund Services to 210 Fund4110100894210 0
-0 00(34)(74)Interfund Services to 220 Fund4110100894220 0
-0 00(2,332)(1,764)Interfund Services to 230 Fund4110100894230 0
-0 00(38)0Interfund Services to 280 Fund4110100894280 0
-0 00(265)0Interfund Services to 401 Fund4110100894401 0
-0 000(934)Interfund Services to 410 Fund4110100894410 0
-0 000(470,282)Interfund Services to 430 Fund4110100894430 0
(4.7) %(106,565)(101,490) (106,565)(101,490)(108,420)894432 Interfund Services to 432 Fund4110100 (95,104)
CCReport Name: 2017_Mid_Cycle_Report
Report Description: Budget Book - Department Budget Detail wMD
06/07/2017Date:
Time: 154
Version:
Page:19:21:28

Department / Section: Public Works / Public Wrk-Streets-Maintenance101 - 411010
Department Budget Detail
%Chnge16/17 vs 17/182017/182017/18
AmendedAdoptedAdopted2016/17
AmendedActualActual2016/172015/162014/15GL KeyObject Description
-0 00(3,963)0Interfund Services to 479 Fund4110100894479 0
-(33,000)(33,000) (33,000)(33,000)(35,379)894510 Interfund Services to 510 Fund4110100 (19,640)
-0 00(337)(195)Interfund Services to 511 Fund4110100894511 0
(2.0) %(1,106,206)(1,083,424) (1,106,206)(1,383,424)(1,029,240)894520 Interfund Services to 520 Fund4110100 (993,202)
-0 00(923)0Interfund Services to 521 Fund4110100894521 0
-0 00(2,718)(93,378)Interfund Services to 530 Fund4110100894530 0
-(2,500)(2,500) (2,500)(2,500)(59,450)894540 Interfund Services to 540 Fund4110100 (53,949)
-(10,000)(10,000) (10,000)(10,000)(2,812)894550 Interfund Services to 550 Fund4110100 (2,399)
-0 00(2,375)(1,413)Interfund Services to 560 Fund4110100894560 0
-0 00(329)(4,701)Interfund Services to 570 Fund4110100894570 0
-0 00(1,208)0Interfund Services to 640 Fund4110100894640 0
-0 00(4,901)(12,903)Interfund Services to 650 Fund4110100894650 0
(1.9) %(4,051,312)(4,274,208)(3,974,208) (4,051,312)Charges to Others Total (4,151,905)(4,407,578)
(3.2) %4,184,012 4,326,3454,250,4453,290,8073,077,7312,526,740Total Budget Requirements
CCReport Name: 2017_Mid_Cycle_Report
Report Description: Budget Book - Department Budget Detail wMD
06/07/2017Date:
Time: 155
Version:
Page:19:21:28
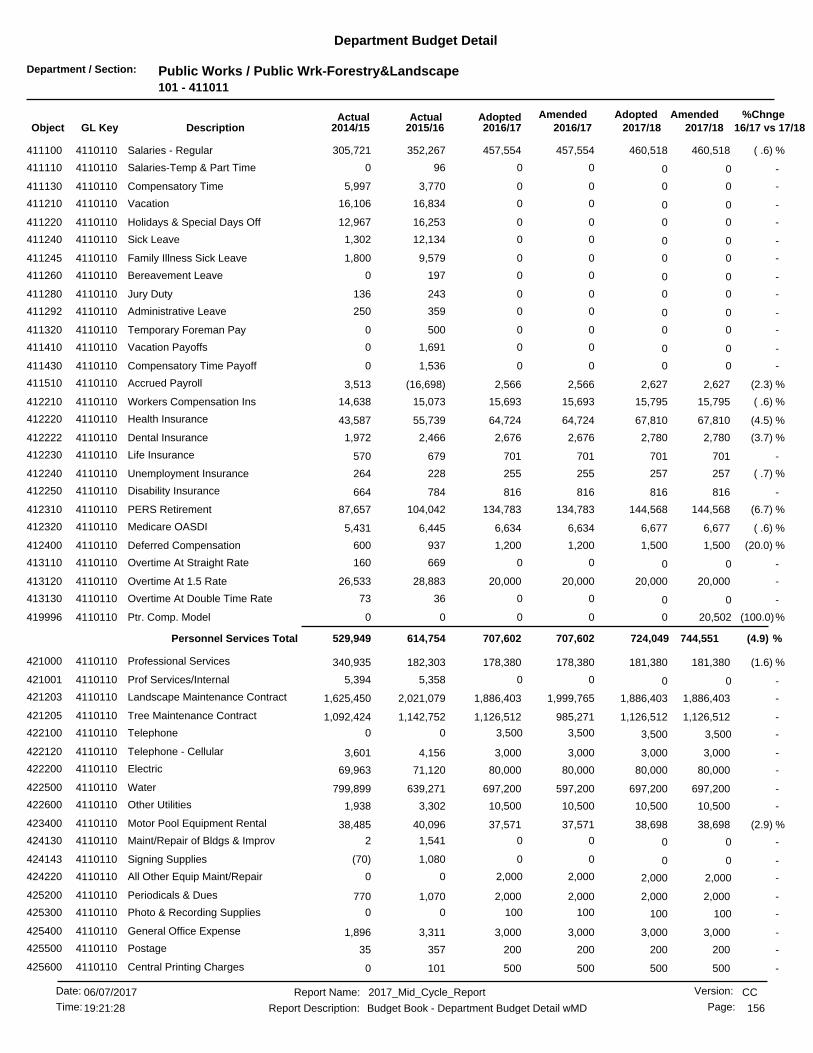
Department / Section: Public Works / Public Wrk-Forestry&Landscape101 - 411011
Department Budget Detail
%Chnge16/17 vs 17/182017/182017/18
AmendedAdoptedAdopted2016/17
AmendedActualActual2016/172015/162014/15GL KeyObject Description
( .6) %460,518457,554 460,518457,554352,267411100 Salaries - Regular4110110 305,721
-0 00960Salaries-Temp & Part Time4110110411110 0
-0 003,7705,997Compensatory Time4110110411130 0
-0 0016,83416,106Vacation4110110411210 0
-0 0016,25312,967Holidays & Special Days Off4110110411220 0
-0 0012,1341,302Sick Leave4110110411240 0
-0 009,5791,800Family Illness Sick Leave4110110411245 0
-0 001970Bereavement Leave4110110411260 0
-0 00243136Jury Duty4110110411280 0
-0 00359250Administrative Leave4110110411292 0
-0 005000Temporary Foreman Pay4110110411320 0
-0 001,6910Vacation Payoffs4110110411410 0
-0 001,5360Compensatory Time Payoff4110110411430 0
(2.3) %2,6272,566 2,6272,566(16,698)411510 Accrued Payroll4110110 3,513
( .6) %15,79515,693 15,79515,69315,073412210 Workers Compensation Ins4110110 14,638
(4.5) %67,81064,724 67,81064,72455,739412220 Health Insurance4110110 43,587
(3.7) %2,7802,676 2,7802,6762,466412222 Dental Insurance4110110 1,972
-701701 701701679412230 Life Insurance4110110 570
( .7) %257255 257255228412240 Unemployment Insurance4110110 264
-816816 816816784412250 Disability Insurance4110110 664
(6.7) %144,568134,783 144,568134,783104,042412310 PERS Retirement4110110 87,657
( .6) %6,6776,634 6,6776,6346,445412320 Medicare OASDI4110110 5,431
(20.0) %1,5001,200 1,5001,200937412400 Deferred Compensation4110110 600
-0 00669160Overtime At Straight Rate4110110413110 0
-20,00020,000 20,00020,00028,883413120 Overtime At 1.5 Rate4110110 26,533
-0 003673Overtime At Double Time Rate4110110413130 0
(100.0)%0 20,502000Ptr. Comp. Model4110110419996 0
(4.9) %744,551707,602707,602 724,049Personnel Services Total 614,754529,949
(1.6) %181,380178,380 181,380178,380182,303421000 Professional Services4110110 340,935
-0 005,3585,394Prof Services/Internal4110110421001 0
-1,886,4031,886,403 1,886,4031,999,7652,021,079421203 Landscape Maintenance Contract4110110 1,625,450
-1,126,5121,126,512 1,126,512985,2711,142,752421205 Tree Maintenance Contract4110110 1,092,424
-3,500 3,5003,50000Telephone4110110422100 3,500
-3,0003,000 3,0003,0004,156422120 Telephone - Cellular4110110 3,601
-80,00080,000 80,00080,00071,120422200 Electric4110110 69,963
-697,200697,200 697,200597,200639,271422500 Water4110110 799,899
-10,50010,500 10,50010,5003,302422600 Other Utilities4110110 1,938
(2.9) %38,69837,571 38,69837,57140,096423400 Motor Pool Equipment Rental4110110 38,485
-0 001,5412Maint/Repair of Bldgs & Improv4110110424130 0
-0 001,080(70)Signing Supplies4110110424143 0
-2,000 2,0002,00000All Other Equip Maint/Repair4110110424220 2,000
-2,0002,000 2,0002,0001,070425200 Periodicals & Dues4110110 770
-100 10010000Photo & Recording Supplies4110110425300 100
-3,0003,000 3,0003,0003,311425400 General Office Expense4110110 1,896
-200200 200200357425500 Postage4110110 35
-500500 500500101425600 Central Printing Charges4110110 0
CCReport Name: 2017_Mid_Cycle_Report
Report Description: Budget Book - Department Budget Detail wMD
06/07/2017Date:
Time: 156
Version:
Page:19:21:28

Department / Section: Public Works / Public Wrk-Forestry&Landscape101 - 411011
Department Budget Detail
%Chnge16/17 vs 17/182017/182017/18
AmendedAdoptedAdopted2016/17
AmendedActualActual2016/172015/162014/15GL KeyObject Description
-200200 200200505425610 Outside Printing Expense4110110 29
-0 006,2630Computer Equip Purc Undr $50004110110425800 0
-2,3452,345 2,3452,3451,478426200 Clothing/Linen/Safety Supplies4110110 1,022
-100 10010000Motor Fuels & Lubricants4110110426300 100
-2,0002,000 2,0002,000811426700 Maintenance Tools/Supplies4110110 822
-750750 750750600426710 Work Boot Reimbursement4110110 600
-2,5002,500 2,5002,500(3,989)426800 Special Department Supplies4110110 1,050
-0 005280Training4110110427200 0
( .0) %1,492,3981,492,196 1,492,3981,492,1961,484,731428400 Liability Insurance4110110 1,171,965
-0 003850Equipment Rental Charges4110110449100 0
( .0) %5,535,2865,403,0795,530,957 5,535,286Non-personnel Expenses Total 5,608,2165,156,217
-00 08,334338,656440301 Median Tree Irrigation Project9890600 0
-0 0Capital Outlay & Grants Total 08,334338,6560
16.4 %98,273114,452 114,452114,452114,451881100 General Fund Allocation Chgs4110110 0
-106,717106,717 106,717106,717106,716882101 Utilization Chgs from 101 Fund4110110 68,184
(4.5) %58,70056,000 58,70056,00049,200882510 Utilization Chgs from 510 Fund4110110 65,100
5.1 %263,690277,169277,169 279,869Charges From Others Total 270,368133,284
(52.1) %(201,798)(96,624) (100,899)(96,624)(91,491)892101 Utilization Chgs to 101 Fund4110110 (85,980)
(100.0)%0 100,899000Utilization Chgs to 291 Fund4110110892291 0
(4.0) %(144,887)(138,974) (144,887)(138,974)(125,607)892510 Utilization Chgs to 510 Fund4110110 (154,264)
(4.2) %(41,812)(40,047) (41,812)(40,047)(38,574)892540 Utilization Chgs to 540 Fund4110110 (34,683)
-0 00(8,620)(11,340)Interfund Services to 101 Fund4110110894101 0
-0 00(2,308)(2,287)Interfund Services to 430 Fund4110110894430 0
-(50,000) (50,000)(50,000)00Interfund Services to 510 Fund4110110894510 (50,000)
-0 00(1,614)(1,279)Interfund Services to 540 Fund4110110894540 0
(3.5) %(337,598)(325,645)(325,645) (337,598)Charges to Others Total (268,218)(289,836)
( .2) %6,190,083 6,205,9296,201,6066,070,5396,563,7785,529,614Total Budget Requirements
CCReport Name: 2017_Mid_Cycle_Report
Report Description: Budget Book - Department Budget Detail wMD
06/07/2017Date:
Time: 157
Version:
Page:19:21:28
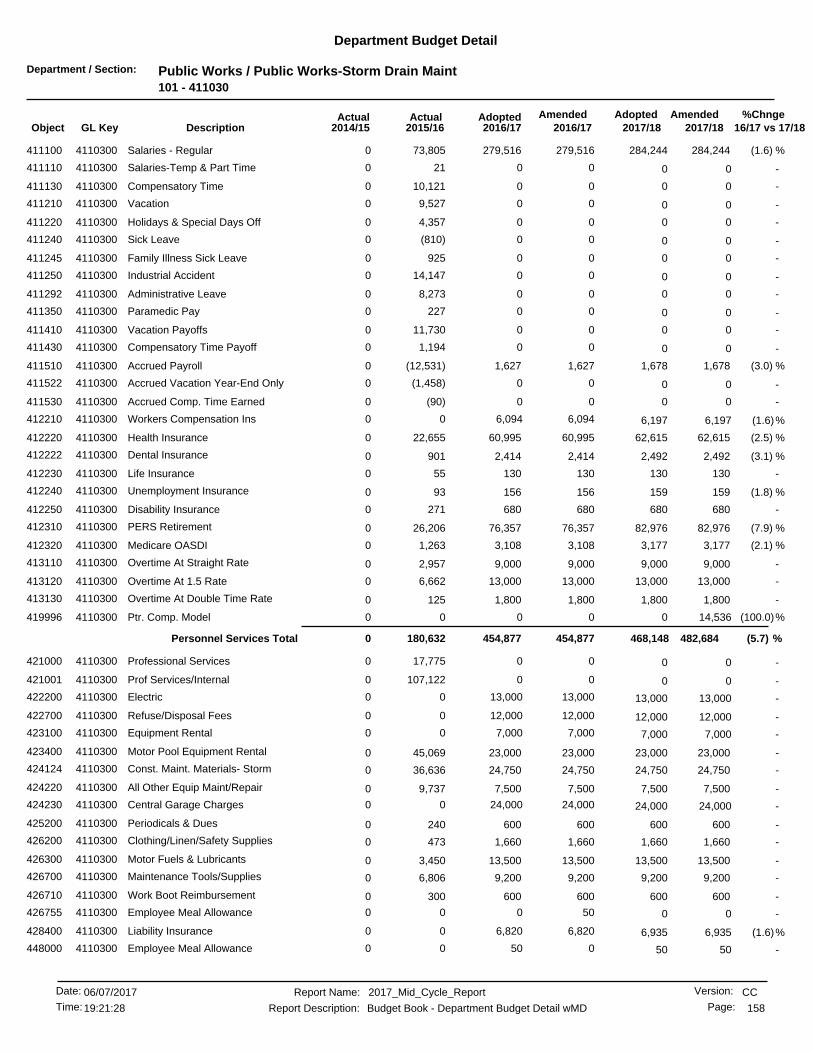
Department / Section: Public Works / Public Works-Storm Drain Maint101 - 411030
Department Budget Detail
%Chnge16/17 vs 17/182017/182017/18
AmendedAdoptedAdopted2016/17
AmendedActualActual2016/172015/162014/15GL KeyObject Description
(1.6) %284,244279,516 284,244279,51673,805411100 Salaries - Regular4110300 0
-0 00210Salaries-Temp & Part Time4110300411110 0
-0 0010,1210Compensatory Time4110300411130 0
-0 009,5270Vacation4110300411210 0
-0 004,3570Holidays & Special Days Off4110300411220 0
-0 00(810)0Sick Leave4110300411240 0
-0 009250Family Illness Sick Leave4110300411245 0
-0 0014,1470Industrial Accident4110300411250 0
-0 008,2730Administrative Leave4110300411292 0
-0 002270Paramedic Pay4110300411350 0
-0 0011,7300Vacation Payoffs4110300411410 0
-0 001,1940Compensatory Time Payoff4110300411430 0
(3.0) %1,6781,627 1,6781,627(12,531)411510 Accrued Payroll4110300 0
-0 00(1,458)0Accrued Vacation Year-End Only4110300411522 0
-0 00(90)0Accrued Comp. Time Earned4110300411530 0
(1.6)%6,094 6,1976,09400Workers Compensation Ins4110300412210 6,197
(2.5) %62,61560,995 62,61560,99522,655412220 Health Insurance4110300 0
(3.1) %2,4922,414 2,4922,414901412222 Dental Insurance4110300 0
-130130 13013055412230 Life Insurance4110300 0
(1.8) %159156 15915693412240 Unemployment Insurance4110300 0
-680680 680680271412250 Disability Insurance4110300 0
(7.9) %82,97676,357 82,97676,35726,206412310 PERS Retirement4110300 0
(2.1) %3,1773,108 3,1773,1081,263412320 Medicare OASDI4110300 0
-9,0009,000 9,0009,0002,957413110 Overtime At Straight Rate4110300 0
-13,00013,000 13,00013,0006,662413120 Overtime At 1.5 Rate4110300 0
-1,8001,800 1,8001,800125413130 Overtime At Double Time Rate4110300 0
(100.0)%0 14,536000Ptr. Comp. Model4110300419996 0
(5.7) %482,684454,877454,877 468,148Personnel Services Total 180,6320
-0 0017,7750Professional Services4110300421000 0
-0 00107,1220Prof Services/Internal4110300421001 0
-13,000 13,00013,00000Electric4110300422200 13,000
-12,000 12,00012,00000Refuse/Disposal Fees4110300422700 12,000
-7,000 7,0007,00000Equipment Rental4110300423100 7,000
-23,00023,000 23,00023,00045,069423400 Motor Pool Equipment Rental4110300 0
-24,75024,750 24,75024,75036,636424124 Const. Maint. Materials- Storm4110300 0
-7,5007,500 7,5007,5009,737424220 All Other Equip Maint/Repair4110300 0
-24,000 24,00024,00000Central Garage Charges4110300424230 24,000
-600600 600600240425200 Periodicals & Dues4110300 0
-1,6601,660 1,6601,660473426200 Clothing/Linen/Safety Supplies4110300 0
-13,50013,500 13,50013,5003,450426300 Motor Fuels & Lubricants4110300 0
-9,2009,200 9,2009,2006,806426700 Maintenance Tools/Supplies4110300 0
-600600 600600300426710 Work Boot Reimbursement4110300 0
-0 05000Employee Meal Allowance4110300426755 0
(1.6)%6,820 6,9356,82000Liability Insurance4110300428400 6,935
-50 50000Employee Meal Allowance4110300448000 50
CCReport Name: 2017_Mid_Cycle_Report
Report Description: Budget Book - Department Budget Detail wMD
06/07/2017Date:
Time: 158
Version:
Page:19:21:28
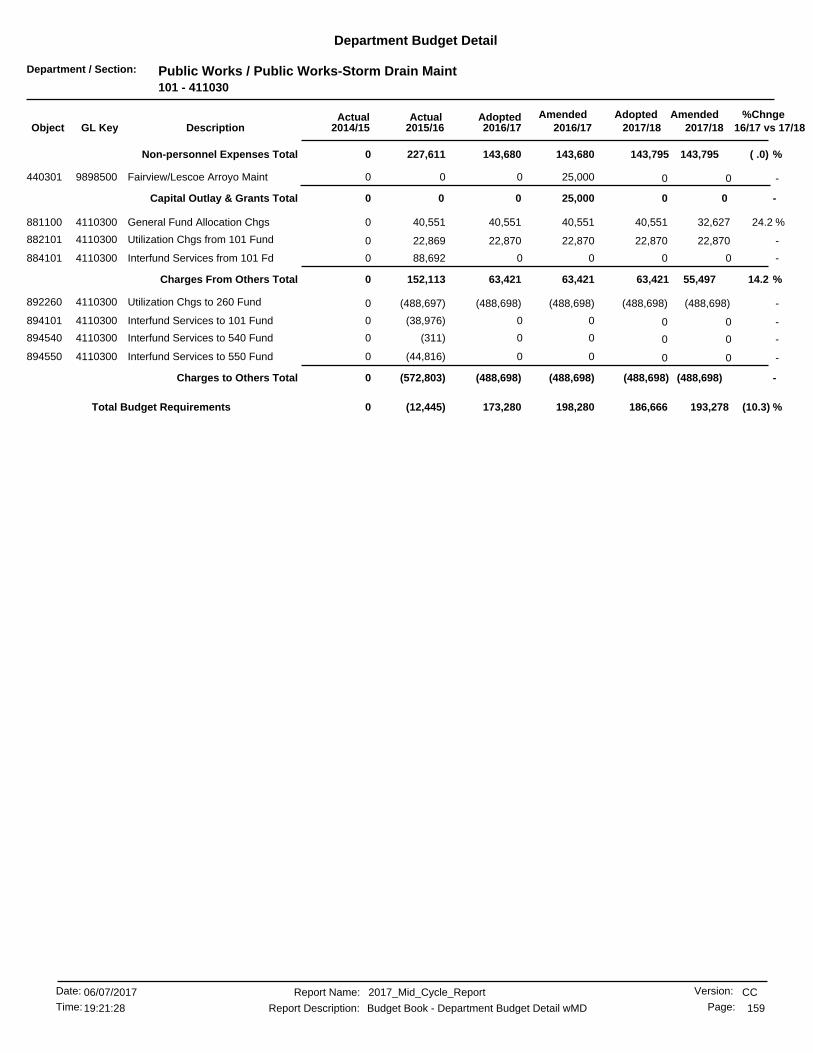
Department / Section: Public Works / Public Works-Storm Drain Maint101 - 411030
Department Budget Detail
%Chnge16/17 vs 17/182017/182017/18
AmendedAdoptedAdopted2016/17
AmendedActualActual2016/172015/162014/15GL KeyObject Description
( .0) %143,795143,680143,680 143,795Non-personnel Expenses Total 227,6110
-0 025,00000Fairview/Lescoe Arroyo Maint9898500440301 0
-0 0Capital Outlay & Grants Total 025,00000
24.2 %32,62740,551 40,55140,55140,551881100 General Fund Allocation Chgs4110300 0
-22,87022,870 22,87022,87022,869882101 Utilization Chgs from 101 Fund4110300 0
-0 0088,6920Interfund Services from 101 Fd4110300884101 0
14.2 %55,49763,42163,421 63,421Charges From Others Total 152,1130
-(488,698)(488,698) (488,698)(488,698)(488,697)892260 Utilization Chgs to 260 Fund4110300 0
-0 00(38,976)0Interfund Services to 101 Fund4110300894101 0
-0 00(311)0Interfund Services to 540 Fund4110300894540 0
-0 00(44,816)0Interfund Services to 550 Fund4110300894550 0
-(488,698)(488,698)(488,698) (488,698)Charges to Others Total (572,803)0
(10.3) %173,280 193,278186,666198,280(12,445)0Total Budget Requirements
CCReport Name: 2017_Mid_Cycle_Report
Report Description: Budget Book - Department Budget Detail wMD
06/07/2017Date:
Time: 159
Version:
Page:19:21:28

Department / Section: Public Works / Public Wrk-Signals Maintenance101 - 411040
Department Budget Detail
%Chnge16/17 vs 17/182017/182017/18
AmendedAdoptedAdopted2016/17
AmendedActualActual2016/172015/162014/15GL KeyObject Description
(2.2) %454,422444,006 454,422444,006413,046411100 Salaries - Regular4110400 370,277
-0 003,7296,336Compensatory Time4110400411130 0
-0 0021,04523,689Vacation4110400411210 0
-0 0018,94117,670Holidays & Special Days Off4110400411220 0
-0 006,9489,743Sick Leave4110400411240 0
-0 0001,739Family Illness Sick Leave4110400411245 0
-0 007,4410Industrial Accident4110400411250 0
-0 0001,187Bereavement Leave4110400411260 0
-0 00551261Administrative Leave4110400411292 0
-0 004,1340Vacation Payoffs4110400411410 0
-0 004670Compensatory Time Payoff4110400411430 0
(3.6) %2,4982,406 2,4982,406(25,181)411510 Accrued Payroll4110400 4,363
(2.2) %15,58615,230 15,58615,23019,449412210 Workers Compensation Ins4110400 19,554
(3.2) %57,18255,322 57,18255,32246,781412220 Health Insurance4110400 36,576
-2,1602,160 2,1602,1602,295412222 Dental Insurance4110400 2,677
(3.9) %691664 691664338412230 Life Insurance4110400 620
(2.3) %253247 253247295412240 Unemployment Insurance4110400 352
-680680 680680826412250 Disability Insurance4110400 627
(8.7) %128,309117,093 128,309117,093108,853412310 PERS Retirement4110400 98,051
(2.2) %6,5886,438 6,5886,4387,625412320 Medicare OASDI4110400 7,061
(20.0) %1,5001,200 1,5001,200262412400 Deferred Compensation4110400 600
(3.8) %26,00025,000 26,00025,00023,712413110 Overtime At Straight Rate4110400 20,468
-30,00030,000 30,00030,00020,881413120 Overtime At 1.5 Rate4110400 23,604
-10,00010,000 10,00010,0007,945413130 Overtime At Double Time Rate4110400 8,877
(100.0)%0 23,306000Ptr. Comp. Model4110400419996 0
(6.4) %759,175710,446710,446 735,869Personnel Services Total 690,392654,343
-0 00084Prof Services/Internal4110400421001 0
-360360 360360359422100 Telephone4110400 196
-4,2004,200 4,2004,2003,895422120 Telephone - Cellular4110400 3,478
-58,20058,200 58,20058,20042,067422200 Electric4110400 29,583
(3.5) %140,000135,000 140,000135,000119,917422201 St. Light/Traffic Signal Elec4110400 126,764
-435435 435435368422202 State Energy Tax4110400 385
-4,1404,140 4,1404,1403,436422203 Public Benefits Charge4110400 3,593
-400400 400400309422500 Water4110400 255
-0 010,00000Equipment Rental4110400423100 0
-84,00084,000 84,00074,00084,989423400 Motor Pool Equipment Rental4110400 91,658
-306306 30630616424130 Maint/Repair of Bldgs & Improv4110400 27
-86,50086,500 86,50090,17874,697424220 All Other Equip Maint/Repair4110400 104,058
(2.3) %8,4008,200 8,4008,2008,267424230 Central Garage Charges4110400 13,771
-0 002000Advertising Expense4110400425100 0
-0 000175Periodicals & Dues4110400425200 0
-2,5002,500 2,5002,5001,600425400 General Office Expense4110400 937
-0 000119Postage4110400425500 0
-0 00084Outside Printing Expense4110400425610 0
-0 00551,251Computer Equip Purc Undr $50004110400425800 0
-3,3003,300 3,3003,3001,919426200 Clothing/Linen/Safety Supplies4110400 2,476
CCReport Name: 2017_Mid_Cycle_Report
Report Description: Budget Book - Department Budget Detail wMD
06/07/2017Date:
Time: 160
Version:
Page:19:21:28

Department / Section: Public Works / Public Wrk-Signals Maintenance101 - 411040
Department Budget Detail
%Chnge16/17 vs 17/182017/182017/18
AmendedAdoptedAdopted2016/17
AmendedActualActual2016/172015/162014/15GL KeyObject Description
(2.8) %7,1006,900 7,1006,9006,094426300 Motor Fuels & Lubricants4110400 8,598
-2,0002,000 2,0002,0001,188426700 Maintenance Tools/Supplies4110400 35
-900900 900900750426710 Work Boot Reimbursement4110400 600
-02,000 02,0007,491427200 Training4110400 2,180
(2.2) %31,03630,325 31,03630,32530,684428400 Liability Insurance4110400 23,637
( .9) %433,777433,344429,666 433,777Non-personnel Expenses Total 388,310413,955
3.2 %11,55211,933 11,93311,93311,932881100 General Fund Allocation Chgs4110400 0
-26,16426,164 26,16426,16426,163882101 Utilization Chgs from 101 Fund4110400 25,014
1.0 %37,71638,09738,097 38,097Charges From Others Total 38,09625,014
-0 000(2,505)Utilization Chgs to 101 Fund4110400892101 0
(4.1) %(51,908)(49,740) (51,908)(49,740)(47,976)892540 Utilization Chgs to 540 Fund4110400 (45,231)
-0 00(298)0Interfund Services to 101 Fund4110400894101 0
-0 000(4,126)Interfund Services to 230 Fund4110400894230 0
-0 00(2,236)(3,764)Interfund Services to 430 Fund4110400894430 0
-(30,000)(30,000) (30,000)(30,000)(21,074)894432 Interfund Services to 432 Fund4110400 (4,624)
-0 00(277)(3,776)Interfund Services to 510 Fund4110400894510 0
-0 00(1,773)(1,371)Interfund Services to 520 Fund4110400894520 0
-0 000(258)Interfund Services to 540 Fund4110400894540 0
-0 000(81)Interfund Services to 550 Fund4110400894550 0
(2.6) %(81,908)(79,740)(79,740) (81,908)Charges to Others Total (73,637)(65,741)
(4.3) %1,098,469 1,148,7601,125,8351,102,1471,043,1621,027,571Total Budget Requirements
CCReport Name: 2017_Mid_Cycle_Report
Report Description: Budget Book - Department Budget Detail wMD
06/07/2017Date:
Time: 161
Version:
Page:19:21:28

Department / Section: Public Works / Pub Works-City Engineering Svs101 - 411500
Department Budget Detail
%Chnge16/17 vs 17/182017/182017/18
AmendedAdoptedAdopted2016/17
AmendedActualActual2016/172015/162014/15GL KeyObject Description
3.7 %3,587,7413,721,669 3,783,2363,506,6123,084,925411100 Salaries - Regular4115000 2,738,623
-0 006,1840Salaries-Temp & Part Time4115000411110 0
-0 00(136)0Salaries-Substitute Labor4115000411120 0
-0 0011,65613,200Compensatory Time4115000411130 0
-0 00211,044175,704Vacation4115000411210 0
-0 00143,809140,025Holidays & Special Days Off4115000411220 0
-0 0011,3448,528Military Leave4115000411230 0
-0 0067,61893,935Sick Leave4115000411240 0
-0 0033,46526,858Family Illness Sick Leave4115000411245 0
-0 0015,8963,323Bereavement Leave4115000411260 0
-0 004701,329Jury Duty4115000411280 0
-0 0028,10229,608Administrative Leave4115000411292 0
-0 000121Night Shift Premium4115000411310 0
-0 0014,83688,136Vacation Payoffs4115000411410 0
-0 00049,185Sick Leave Payoff4115000411420 0
-0 001,1700Compensatory Time Payoff4115000411430 0
1.7 %20,30120,654 21,34220,654(163,589)411510 Accrued Payroll4115000 66,689
3.7 %123,060127,651 129,766127,651145,326412210 Workers Compensation Ins4115000 141,141
( .1) %475,348474,400 495,558474,400395,301412220 Health Insurance4115000 348,032
4.1 %21,07221,957 22,15221,95719,791412222 Dental Insurance4115000 18,321
5.4 %9,61410,136 10,31210,1369,580412230 Life Insurance4115000 8,366
3.6 %2,0012,075 2,1102,0752,139412240 Unemployment Insurance4115000 2,545
3.3 %4,0804,216 4,2164,2163,917412250 Disability Insurance4115000 3,791
(3.7) %1,120,4731,078,187 1,169,1511,078,187902,348412310 PERS Retirement4115000 809,166
3.9 %48,95850,904 51,79350,90448,934412320 Medicare OASDI4115000 42,708
-0 002200City Retirement Plan4115000412330 0
(13.3) %18,00015,600 19,50015,6009,637412400 Deferred Compensation4115000 5,700
-0 001,777549Overtime At Straight Rate4115000413110 0
-75,00075,000 75,00075,00095,620413120 Overtime At 1.5 Rate4115000 43,606
-0 0015,2093,276Overtime At Double Time Rate4115000413130 0
(100.0)%0 147,276000Ptr. Comp. Model4115000419996 0
( .8) %5,652,9245,387,3925,602,449 5,784,136Personnel Services Total 5,116,6044,862,477
-0 00185,3355,269Professional Services4115000421000 0
-0 002,943170Prof Services/Internal4115000421001 0
-0 0043,74939,932Prof Services/Computer4115000421004 0
-5,5505,550 5,5505,5503,351422100 Telephone4115000 2,945
-26,75026,750 26,75026,75022,238422120 Telephone - Cellular4115000 23,004
-135,000135,000 135,000135,000139,400423400 Motor Pool Equipment Rental4115000 130,689
-0 001073Vehicle Usage Reimb Employee4115000423500 0
-6,500 6,5006,50001,492All Other Equip Maint/Repair4115000424220 6,500
-0 00150860Central Garage Charges4115000424230 0
-0 004951,965Advertising Expense4115000425100 0
-1,0001,000 1,0001,000845425200 Periodicals & Dues4115000 1,217
-6,5006,500 6,5006,5001,748425300 Photo & Recording Supplies4115000 4,197
-15,00015,000 15,00015,00025,517425400 General Office Expense4115000 9,489
-8,0008,000 8,0008,0007,170425500 Postage4115000 6,731
CCReport Name: 2017_Mid_Cycle_Report
Report Description: Budget Book - Department Budget Detail wMD
06/07/2017Date:
Time: 162
Version:
Page:19:21:28
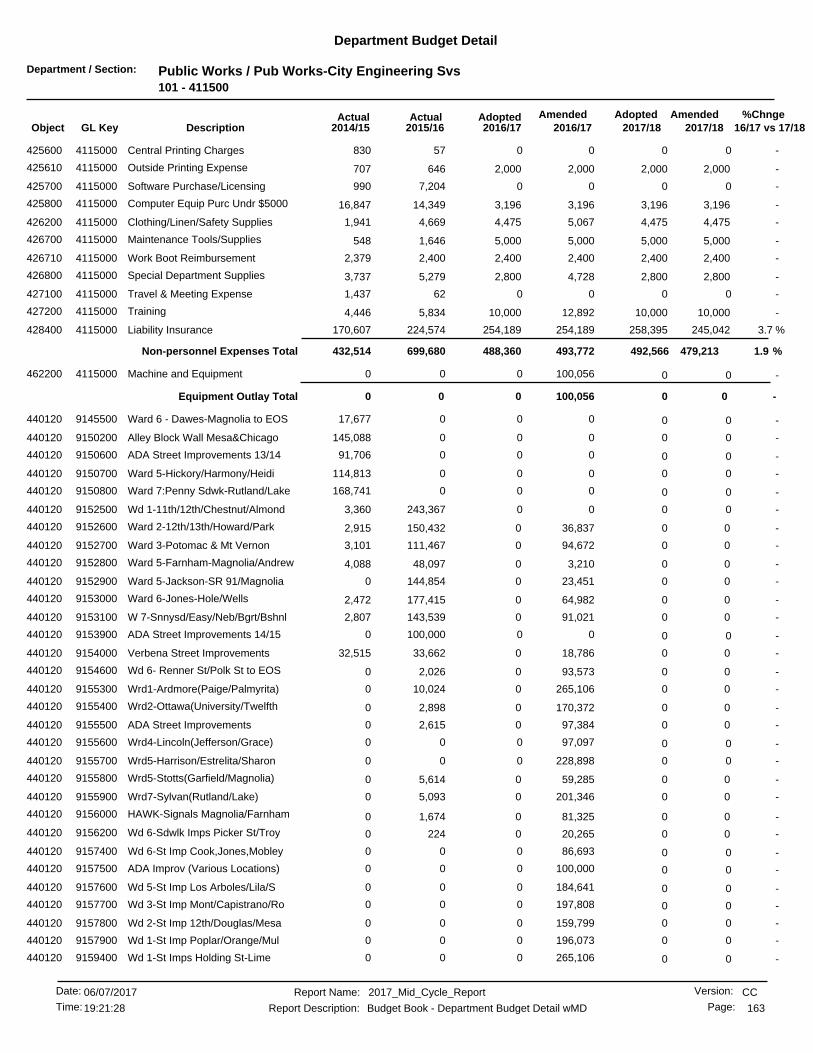
Department / Section: Public Works / Pub Works-City Engineering Svs101 - 411500
Department Budget Detail
%Chnge16/17 vs 17/182017/182017/18
AmendedAdoptedAdopted2016/17
AmendedActualActual2016/172015/162014/15GL KeyObject Description
-0 0057830Central Printing Charges4115000425600 0
-2,0002,000 2,0002,000646425610 Outside Printing Expense4115000 707
-0 007,204990Software Purchase/Licensing4115000425700 0
-3,1963,196 3,1963,19614,349425800 Computer Equip Purc Undr $50004115000 16,847
-4,4754,475 4,4755,0674,669426200 Clothing/Linen/Safety Supplies4115000 1,941
-5,0005,000 5,0005,0001,646426700 Maintenance Tools/Supplies4115000 548
-2,4002,400 2,4002,4002,400426710 Work Boot Reimbursement4115000 2,379
-2,8002,800 2,8004,7285,279426800 Special Department Supplies4115000 3,737
-0 00621,437Travel & Meeting Expense4115000427100 0
-10,00010,000 10,00012,8925,834427200 Training4115000 4,446
3.7 %245,042254,189 258,395254,189224,574428400 Liability Insurance4115000 170,607
1.9 %479,213493,772488,360 492,566Non-personnel Expenses Total 699,680432,514
-0 0100,05600Machine and Equipment4115000462200 0
-0 0Equipment Outlay Total 0100,05600
-0 00017,677Ward 6 - Dawes-Magnolia to EOS9145500440120 0
-0 000145,088Alley Block Wall Mesa&Chicago9150200440120 0
-0 00091,706ADA Street Improvements 13/149150600440120 0
-0 000114,813Ward 5-Hickory/Harmony/Heidi9150700440120 0
-0 000168,741Ward 7:Penny Sdwk-Rutland/Lake9150800440120 0
-0 00243,3673,360Wd 1-11th/12th/Chestnut/Almond9152500440120 0
-00 036,837150,432440120 Ward 2-12th/13th/Howard/Park9152600 2,915
-00 094,672111,467440120 Ward 3-Potomac & Mt Vernon9152700 3,101
-00 03,21048,097440120 Ward 5-Farnham-Magnolia/Andrew9152800 4,088
-00 023,451144,854440120 Ward 5-Jackson-SR 91/Magnolia9152900 0
-00 064,982177,415440120 Ward 6-Jones-Hole/Wells9153000 2,472
-00 091,021143,539440120 W 7-Snnysd/Easy/Neb/Bgrt/Bshnl9153100 2,807
-0 00100,0000ADA Street Improvements 14/159153900440120 0
-00 018,78633,662440120 Verbena Street Improvements9154000 32,515
-00 093,5732,026440120 Wd 6- Renner St/Polk St to EOS9154600 0
-00 0265,10610,024440120 Wrd1-Ardmore(Paige/Palmyrita)9155300 0
-00 0170,3722,898440120 Wrd2-Ottawa(University/Twelfth9155400 0
-00 097,3842,615440120 ADA Street Improvements9155500 0
-0 097,09700Wrd4-Lincoln(Jefferson/Grace)9155600440120 0
-0 0228,89800Wrd5-Harrison/Estrelita/Sharon9155700440120 0
-00 059,2855,614440120 Wrd5-Stotts(Garfield/Magnolia)9155800 0
-00 0201,3465,093440120 Wrd7-Sylvan(Rutland/Lake)9155900 0
-00 081,3251,674440120 HAWK-Signals Magnolia/Farnham9156000 0
-00 020,265224440120 Wd 6-Sdwlk Imps Picker St/Troy9156200 0
-0 086,69300Wd 6-St Imp Cook,Jones,Mobley9157400440120 0
-0 0100,00000ADA Improv (Various Locations)9157500440120 0
-0 0184,64100Wd 5-St Imp Los Arboles/Lila/S9157600440120 0
-0 0197,80800Wd 3-St Imp Mont/Capistrano/Ro9157700440120 0
-0 0159,79900Wd 2-St Imp 12th/Douglas/Mesa9157800440120 0
-0 0196,07300Wd 1-St Imp Poplar/Orange/Mul9157900440120 0
-0 0265,10600Wd 1-St Imps Holding St-Lime9159400440120 0
CCReport Name: 2017_Mid_Cycle_Report
Report Description: Budget Book - Department Budget Detail wMD
06/07/2017Date:
Time: 163
Version:
Page:19:21:28
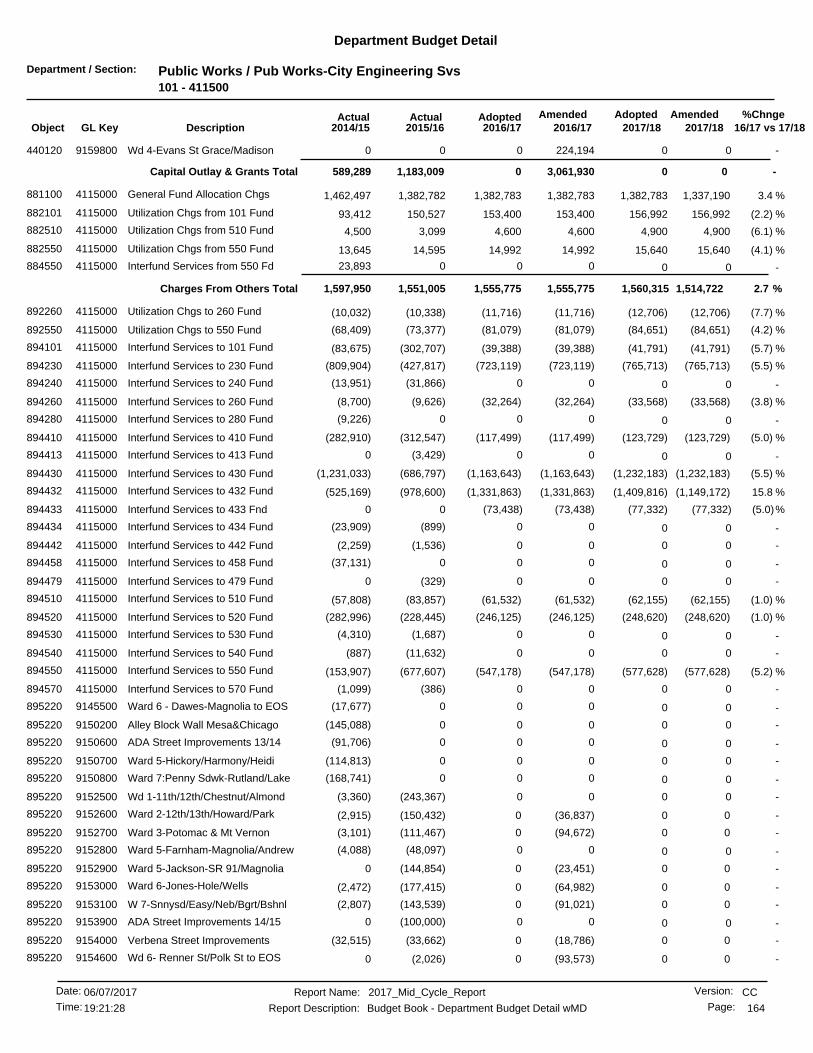
Department / Section: Public Works / Pub Works-City Engineering Svs101 - 411500
Department Budget Detail
%Chnge16/17 vs 17/182017/182017/18
AmendedAdoptedAdopted2016/17
AmendedActualActual2016/172015/162014/15GL KeyObject Description
-0 0224,19400Wd 4-Evans St Grace/Madison9159800440120 0
-0 0Capital Outlay & Grants Total 03,061,9301,183,009589,289
3.4 %1,337,1901,382,783 1,382,7831,382,7831,382,782881100 General Fund Allocation Chgs4115000 1,462,497
(2.2) %156,992153,400 156,992153,400150,527882101 Utilization Chgs from 101 Fund4115000 93,412
(6.1) %4,9004,600 4,9004,6003,099882510 Utilization Chgs from 510 Fund4115000 4,500
(4.1) %15,64014,992 15,64014,99214,595882550 Utilization Chgs from 550 Fund4115000 13,645
-0 00023,893Interfund Services from 550 Fd4115000884550 0
2.7 %1,514,7221,555,7751,555,775 1,560,315Charges From Others Total 1,551,0051,597,950
(7.7) %(12,706)(11,716) (12,706)(11,716)(10,338)892260 Utilization Chgs to 260 Fund4115000 (10,032)
(4.2) %(84,651)(81,079) (84,651)(81,079)(73,377)892550 Utilization Chgs to 550 Fund4115000 (68,409)
(5.7) %(41,791)(39,388) (41,791)(39,388)(302,707)894101 Interfund Services to 101 Fund4115000 (83,675)
(5.5) %(765,713)(723,119) (765,713)(723,119)(427,817)894230 Interfund Services to 230 Fund4115000 (809,904)
-0 00(31,866)(13,951)Interfund Services to 240 Fund4115000894240 0
(3.8) %(33,568)(32,264) (33,568)(32,264)(9,626)894260 Interfund Services to 260 Fund4115000 (8,700)
-0 000(9,226)Interfund Services to 280 Fund4115000894280 0
(5.0) %(123,729)(117,499) (123,729)(117,499)(312,547)894410 Interfund Services to 410 Fund4115000 (282,910)
-0 00(3,429)0Interfund Services to 413 Fund4115000894413 0
(5.5) %(1,232,183)(1,163,643) (1,232,183)(1,163,643)(686,797)894430 Interfund Services to 430 Fund4115000 (1,231,033)
15.8 %(1,149,172)(1,331,863) (1,409,816)(1,331,863)(978,600)894432 Interfund Services to 432 Fund4115000 (525,169)
(5.0)%(73,438) (77,332)(73,438)00Interfund Services to 433 Fnd4115000894433 (77,332)
-0 00(899)(23,909)Interfund Services to 434 Fund4115000894434 0
-0 00(1,536)(2,259)Interfund Services to 442 Fund4115000894442 0
-0 000(37,131)Interfund Services to 458 Fund4115000894458 0
-0 00(329)0Interfund Services to 479 Fund4115000894479 0
(1.0) %(62,155)(61,532) (62,155)(61,532)(83,857)894510 Interfund Services to 510 Fund4115000 (57,808)
(1.0) %(248,620)(246,125) (248,620)(246,125)(228,445)894520 Interfund Services to 520 Fund4115000 (282,996)
-0 00(1,687)(4,310)Interfund Services to 530 Fund4115000894530 0
-0 00(11,632)(887)Interfund Services to 540 Fund4115000894540 0
(5.2) %(577,628)(547,178) (577,628)(547,178)(677,607)894550 Interfund Services to 550 Fund4115000 (153,907)
-0 00(386)(1,099)Interfund Services to 570 Fund4115000894570 0
-0 000(17,677)Ward 6 - Dawes-Magnolia to EOS9145500895220 0
-0 000(145,088)Alley Block Wall Mesa&Chicago9150200895220 0
-0 000(91,706)ADA Street Improvements 13/149150600895220 0
-0 000(114,813)Ward 5-Hickory/Harmony/Heidi9150700895220 0
-0 000(168,741)Ward 7:Penny Sdwk-Rutland/Lake9150800895220 0
-0 00(243,367)(3,360)Wd 1-11th/12th/Chestnut/Almond9152500895220 0
-00 0(36,837)(150,432)895220 Ward 2-12th/13th/Howard/Park9152600 (2,915)
-00 0(94,672)(111,467)895220 Ward 3-Potomac & Mt Vernon9152700 (3,101)
-0 00(48,097)(4,088)Ward 5-Farnham-Magnolia/Andrew9152800895220 0
-00 0(23,451)(144,854)895220 Ward 5-Jackson-SR 91/Magnolia9152900 0
-00 0(64,982)(177,415)895220 Ward 6-Jones-Hole/Wells9153000 (2,472)
-00 0(91,021)(143,539)895220 W 7-Snnysd/Easy/Neb/Bgrt/Bshnl9153100 (2,807)
-0 00(100,000)0ADA Street Improvements 14/159153900895220 0
-00 0(18,786)(33,662)895220 Verbena Street Improvements9154000 (32,515)
-00 0(93,573)(2,026)895220 Wd 6- Renner St/Polk St to EOS9154600 0
CCReport Name: 2017_Mid_Cycle_Report
Report Description: Budget Book - Department Budget Detail wMD
06/07/2017Date:
Time: 164
Version:
Page:19:21:28
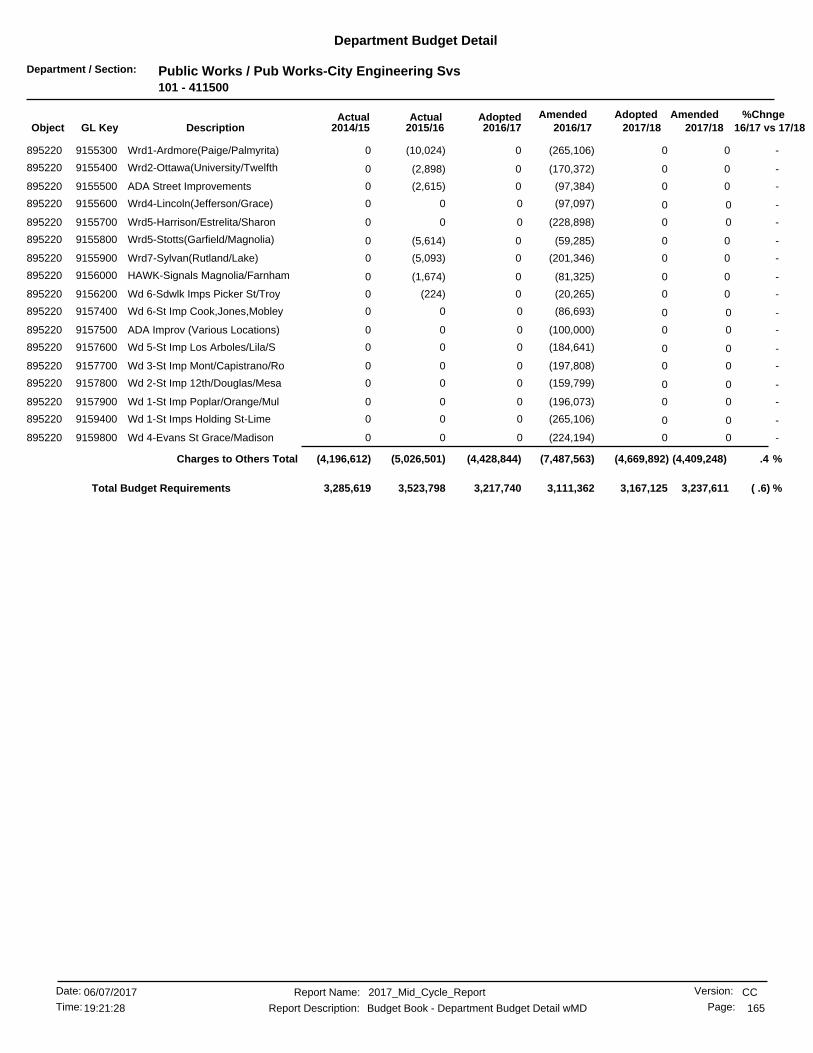
Department / Section: Public Works / Pub Works-City Engineering Svs101 - 411500
Department Budget Detail
%Chnge16/17 vs 17/182017/182017/18
AmendedAdoptedAdopted2016/17
AmendedActualActual2016/172015/162014/15GL KeyObject Description
-00 0(265,106)(10,024)895220 Wrd1-Ardmore(Paige/Palmyrita)9155300 0
-00 0(170,372)(2,898)895220 Wrd2-Ottawa(University/Twelfth9155400 0
-00 0(97,384)(2,615)895220 ADA Street Improvements9155500 0
-0 0(97,097)00Wrd4-Lincoln(Jefferson/Grace)9155600895220 0
-0 0(228,898)00Wrd5-Harrison/Estrelita/Sharon9155700895220 0
-00 0(59,285)(5,614)895220 Wrd5-Stotts(Garfield/Magnolia)9155800 0
-00 0(201,346)(5,093)895220 Wrd7-Sylvan(Rutland/Lake)9155900 0
-00 0(81,325)(1,674)895220 HAWK-Signals Magnolia/Farnham9156000 0
-00 0(20,265)(224)895220 Wd 6-Sdwlk Imps Picker St/Troy9156200 0
-0 0(86,693)00Wd 6-St Imp Cook,Jones,Mobley9157400895220 0
-0 0(100,000)00ADA Improv (Various Locations)9157500895220 0
-0 0(184,641)00Wd 5-St Imp Los Arboles/Lila/S9157600895220 0
-0 0(197,808)00Wd 3-St Imp Mont/Capistrano/Ro9157700895220 0
-0 0(159,799)00Wd 2-St Imp 12th/Douglas/Mesa9157800895220 0
-0 0(196,073)00Wd 1-St Imp Poplar/Orange/Mul9157900895220 0
-0 0(265,106)00Wd 1-St Imps Holding St-Lime9159400895220 0
-0 0(224,194)00Wd 4-Evans St Grace/Madison9159800895220 0
.4 %(4,409,248)(7,487,563)(4,428,844) (4,669,892)Charges to Others Total (5,026,501)(4,196,612)
( .6) %3,217,740 3,237,6113,167,1253,111,3623,523,7983,285,619Total Budget Requirements
CCReport Name: 2017_Mid_Cycle_Report
Report Description: Budget Book - Department Budget Detail wMD
06/07/2017Date:
Time: 165
Version:
Page:19:21:28
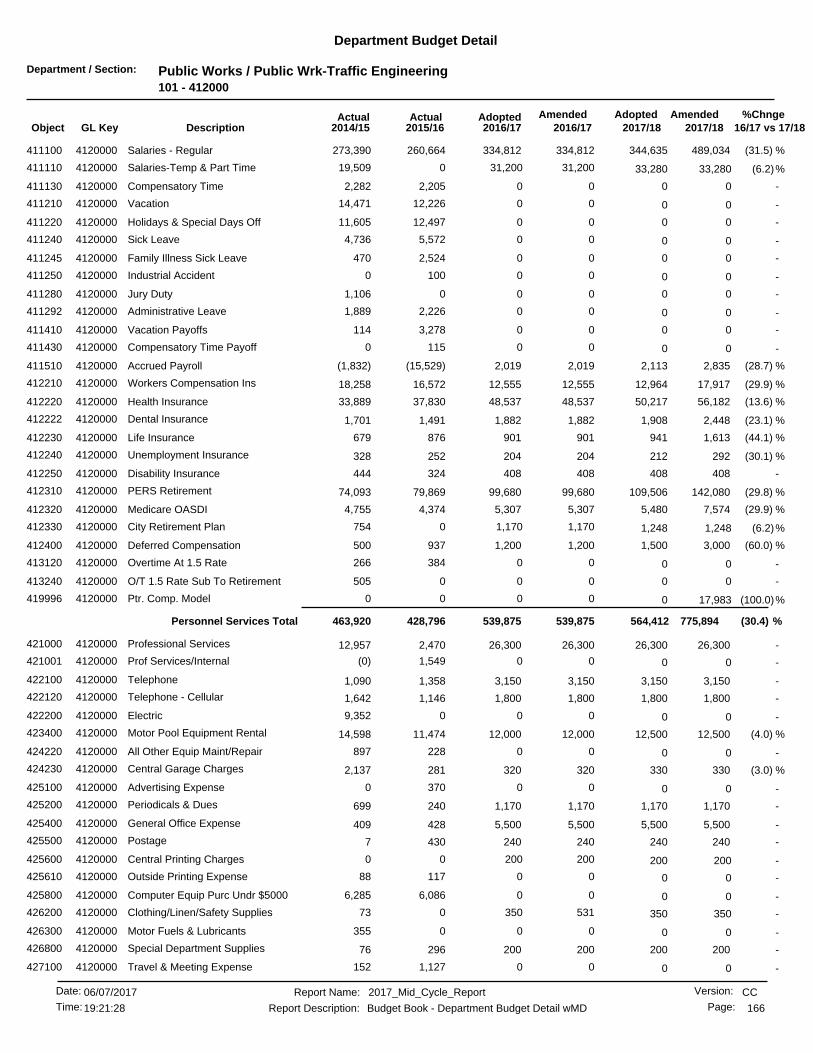
Department / Section: Public Works / Public Wrk-Traffic Engineering101 - 412000
Department Budget Detail
%Chnge16/17 vs 17/182017/182017/18
AmendedAdoptedAdopted2016/17
AmendedActualActual2016/172015/162014/15GL KeyObject Description
(31.5) %489,034334,812 344,635334,812260,664411100 Salaries - Regular4120000 273,390
(6.2)%31,200 33,28031,200019,509Salaries-Temp & Part Time4120000411110 33,280
-0 002,2052,282Compensatory Time4120000411130 0
-0 0012,22614,471Vacation4120000411210 0
-0 0012,49711,605Holidays & Special Days Off4120000411220 0
-0 005,5724,736Sick Leave4120000411240 0
-0 002,524470Family Illness Sick Leave4120000411245 0
-0 001000Industrial Accident4120000411250 0
-0 0001,106Jury Duty4120000411280 0
-0 002,2261,889Administrative Leave4120000411292 0
-0 003,278114Vacation Payoffs4120000411410 0
-0 001150Compensatory Time Payoff4120000411430 0
(28.7) %2,8352,019 2,1132,019(15,529)411510 Accrued Payroll4120000 (1,832)
(29.9) %17,91712,555 12,96412,55516,572412210 Workers Compensation Ins4120000 18,258
(13.6) %56,18248,537 50,21748,53737,830412220 Health Insurance4120000 33,889
(23.1) %2,4481,882 1,9081,8821,491412222 Dental Insurance4120000 1,701
(44.1) %1,613901 941901876412230 Life Insurance4120000 679
(30.1) %292204 212204252412240 Unemployment Insurance4120000 328
-408408 408408324412250 Disability Insurance4120000 444
(29.8) %142,08099,680 109,50699,68079,869412310 PERS Retirement4120000 74,093
(29.9) %7,5745,307 5,4805,3074,374412320 Medicare OASDI4120000 4,755
(6.2)%1,170 1,2481,1700754City Retirement Plan4120000412330 1,248
(60.0) %3,0001,200 1,5001,200937412400 Deferred Compensation4120000 500
-0 00384266Overtime At 1.5 Rate4120000413120 0
-0 000505O/T 1.5 Rate Sub To Retirement4120000413240 0
(100.0)%0 17,983000Ptr. Comp. Model4120000419996 0
(30.4) %775,894539,875539,875 564,412Personnel Services Total 428,796463,920
-26,30026,300 26,30026,3002,470421000 Professional Services4120000 12,957
-0 001,549(0)Prof Services/Internal4120000421001 0
-3,1503,150 3,1503,1501,358422100 Telephone4120000 1,090
-1,8001,800 1,8001,8001,146422120 Telephone - Cellular4120000 1,642
-0 0009,352Electric4120000422200 0
(4.0) %12,50012,000 12,50012,00011,474423400 Motor Pool Equipment Rental4120000 14,598
-0 00228897All Other Equip Maint/Repair4120000424220 0
(3.0) %330320 330320281424230 Central Garage Charges4120000 2,137
-0 003700Advertising Expense4120000425100 0
-1,1701,170 1,1701,170240425200 Periodicals & Dues4120000 699
-5,5005,500 5,5005,500428425400 General Office Expense4120000 409
-240240 240240430425500 Postage4120000 7
-200 20020000Central Printing Charges4120000425600 200
-0 0011788Outside Printing Expense4120000425610 0
-0 006,0866,285Computer Equip Purc Undr $50004120000425800 0
-350 350531073Clothing/Linen/Safety Supplies4120000426200 350
-0 000355Motor Fuels & Lubricants4120000426300 0
-200200 200200296426800 Special Department Supplies4120000 76
-0 001,127152Travel & Meeting Expense4120000427100 0
CCReport Name: 2017_Mid_Cycle_Report
Report Description: Budget Book - Department Budget Detail wMD
06/07/2017Date:
Time: 166
Version:
Page:19:21:28

Department / Section: Public Works / Public Wrk-Traffic Engineering101 - 412000
Department Budget Detail
%Chnge16/17 vs 17/182017/182017/18
AmendedAdoptedAdopted2016/17
AmendedActualActual2016/172015/162014/15GL KeyObject Description
-2,0002,000 2,0002,000382427200 Training4120000 3,000
(29.9) %35,67424,998 25,81124,99826,143428400 Liability Insurance4120000 22,069
(12.5) %89,41478,40978,228 79,551Non-personnel Expenses Total 54,13275,896
11.2 %166,417185,076 185,076185,076185,076881100 General Fund Allocation Chgs4120000 248,649
(38.6) %193,266118,556 118,556118,556118,555882101 Utilization Chgs from 101 Fund4120000 95,622
(3.9) %27,80026,700 27,80026,70022,200882510 Utilization Chgs from 510 Fund4120000 19,999
(14.7) %387,483330,332330,332 331,432Charges From Others Total 325,831364,270
-0 000(66,780)Utilization Chgs to 101 Fund4120000892101 0
-0 000(96,387)Utilization Chgs to 230 Fund4120000892230 0
48.0 %(23,325)(34,543) (37,094)(34,543)(29,610)892570 Utilization Chgs to 570 Fund4120000 (29,760)
-0 000(90)Interfund Services to 101 Fund4120000894101 0
-0 000(2,558)Interfund Services to 230 Fund4120000894230 0
-(25,000)(25,000) (25,000)(25,000)(12,095)894240 Interfund Services to 240 Fund4120000 (26,974)
-0 000(1,320)Interfund Services to 430 Fund4120000894430 0
(57.5) %(490,605)(208,361) (229,961)(208,361)(174,388)894432 Interfund Services to 432 Fund4120000 (181,976)
(50.2) %(538,930)(267,904)(267,904) (292,055)Charges to Others Total (216,093)(405,848)
(4.6) %680,531 713,861683,340680,712592,667498,239Total Budget Requirements
CCReport Name: 2017_Mid_Cycle_Report
Report Description: Budget Book - Department Budget Detail wMD
06/07/2017Date:
Time: 167
Version:
Page:19:21:28
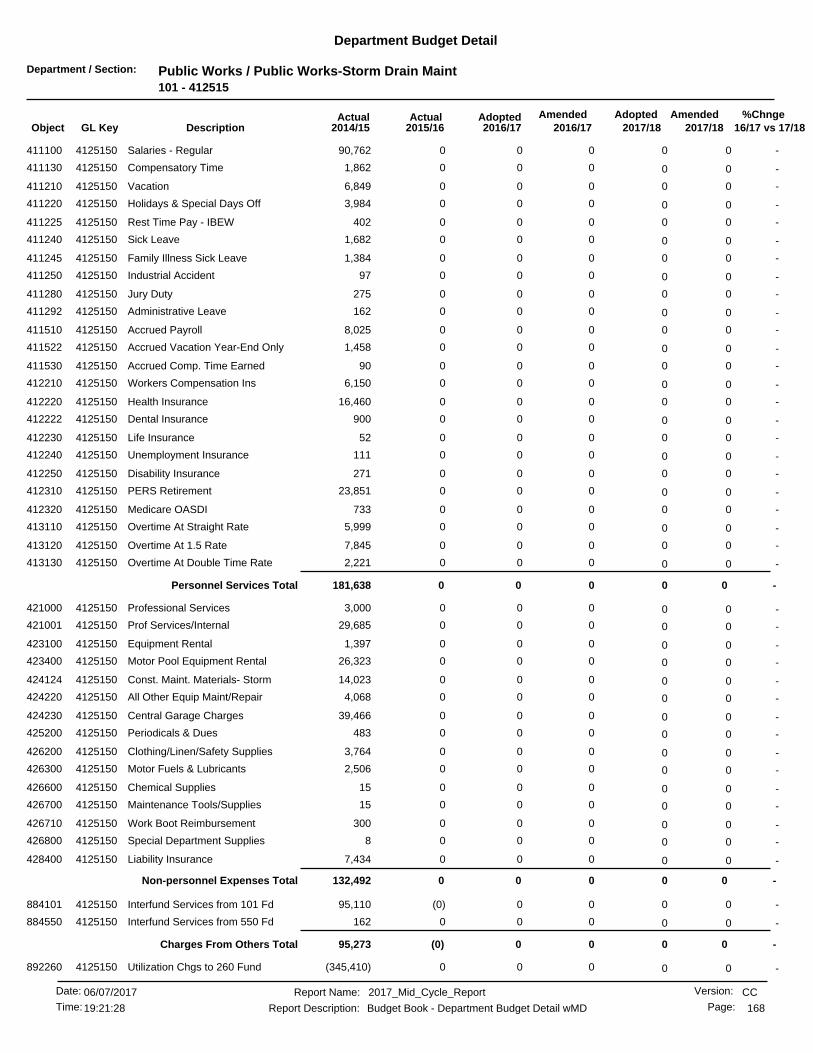
Department / Section: Public Works / Public Works-Storm Drain Maint101 - 412515
Department Budget Detail
%Chnge16/17 vs 17/182017/182017/18
AmendedAdoptedAdopted2016/17
AmendedActualActual2016/172015/162014/15GL KeyObject Description
-0 00090,762Salaries - Regular4125150411100 0
-0 0001,862Compensatory Time4125150411130 0
-0 0006,849Vacation4125150411210 0
-0 0003,984Holidays & Special Days Off4125150411220 0
-0 000402Rest Time Pay - IBEW4125150411225 0
-0 0001,682Sick Leave4125150411240 0
-0 0001,384Family Illness Sick Leave4125150411245 0
-0 00097Industrial Accident4125150411250 0
-0 000275Jury Duty4125150411280 0
-0 000162Administrative Leave4125150411292 0
-0 0008,025Accrued Payroll4125150411510 0
-0 0001,458Accrued Vacation Year-End Only4125150411522 0
-0 00090Accrued Comp. Time Earned4125150411530 0
-0 0006,150Workers Compensation Ins4125150412210 0
-0 00016,460Health Insurance4125150412220 0
-0 000900Dental Insurance4125150412222 0
-0 00052Life Insurance4125150412230 0
-0 000111Unemployment Insurance4125150412240 0
-0 000271Disability Insurance4125150412250 0
-0 00023,851PERS Retirement4125150412310 0
-0 000733Medicare OASDI4125150412320 0
-0 0005,999Overtime At Straight Rate4125150413110 0
-0 0007,845Overtime At 1.5 Rate4125150413120 0
-0 0002,221Overtime At Double Time Rate4125150413130 0
-0 0Personnel Services Total 000181,638
-0 0003,000Professional Services4125150421000 0
-0 00029,685Prof Services/Internal4125150421001 0
-0 0001,397Equipment Rental4125150423100 0
-0 00026,323Motor Pool Equipment Rental4125150423400 0
-0 00014,023Const. Maint. Materials- Storm4125150424124 0
-0 0004,068All Other Equip Maint/Repair4125150424220 0
-0 00039,466Central Garage Charges4125150424230 0
-0 000483Periodicals & Dues4125150425200 0
-0 0003,764Clothing/Linen/Safety Supplies4125150426200 0
-0 0002,506Motor Fuels & Lubricants4125150426300 0
-0 00015Chemical Supplies4125150426600 0
-0 00015Maintenance Tools/Supplies4125150426700 0
-0 000300Work Boot Reimbursement4125150426710 0
-0 0008Special Department Supplies4125150426800 0
-0 0007,434Liability Insurance4125150428400 0
-0 0Non-personnel Expenses Total 000132,492
-0 00(0)95,110Interfund Services from 101 Fd4125150884101 0
-0 000162Interfund Services from 550 Fd4125150884550 0
-0 0Charges From Others Total 00(0)95,273
-0 000(345,410)Utilization Chgs to 260 Fund4125150892260 0
CCReport Name: 2017_Mid_Cycle_Report
Report Description: Budget Book - Department Budget Detail wMD
06/07/2017Date:
Time: 168
Version:
Page:19:21:28
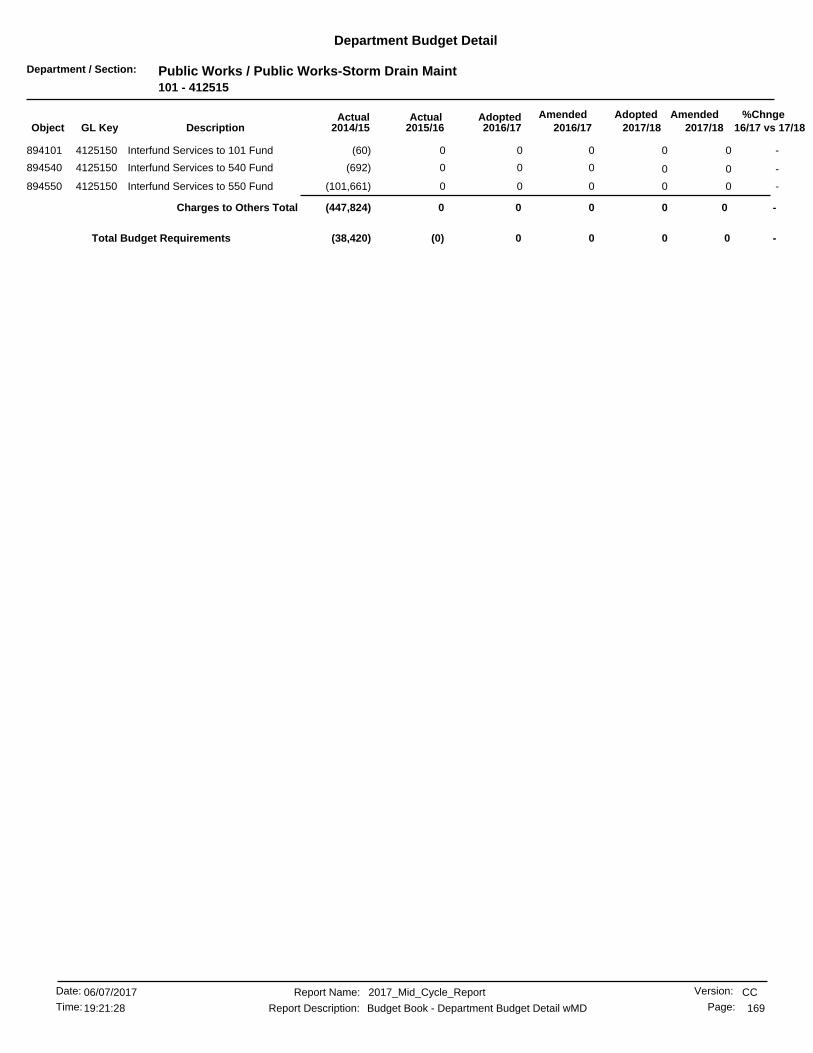
Department / Section: Public Works / Public Works-Storm Drain Maint101 - 412515
Department Budget Detail
%Chnge16/17 vs 17/182017/182017/18
AmendedAdoptedAdopted2016/17
AmendedActualActual2016/172015/162014/15GL KeyObject Description
-0 000(60)Interfund Services to 101 Fund4125150894101 0
-0 000(692)Interfund Services to 540 Fund4125150894540 0
-0 000(101,661)Interfund Services to 550 Fund4125150894550 0
-0 0Charges to Others Total 000(447,824)
-00 00(0)Total Budget Requirements (38,420)
CCReport Name: 2017_Mid_Cycle_Report
Report Description: Budget Book - Department Budget Detail wMD
06/07/2017Date:
Time: 169
Version:
Page:19:21:28

Department / Section: Public Works / PW-Cap Imp-Street Projects101 - 413530
Department Budget Detail
%Chnge16/17 vs 17/182017/182017/18
AmendedAdoptedAdopted2016/17
AmendedActualActual2016/172015/162014/15GL KeyObject Description
-0 000(38,914)Chicago Emergency Repair9243300440120 0
-0 065,00000Iowa/MLK Bicycle Improvements9887400440301 0
-0 0Capital Outlay & Grants Total 065,0000(38,914)
(100.0) %00 065,0000Total Budget Requirements (38,914)
CCReport Name: 2017_Mid_Cycle_Report
Report Description: Budget Book - Department Budget Detail wMD
06/07/2017Date:
Time: 170
Version:
Page:19:21:28
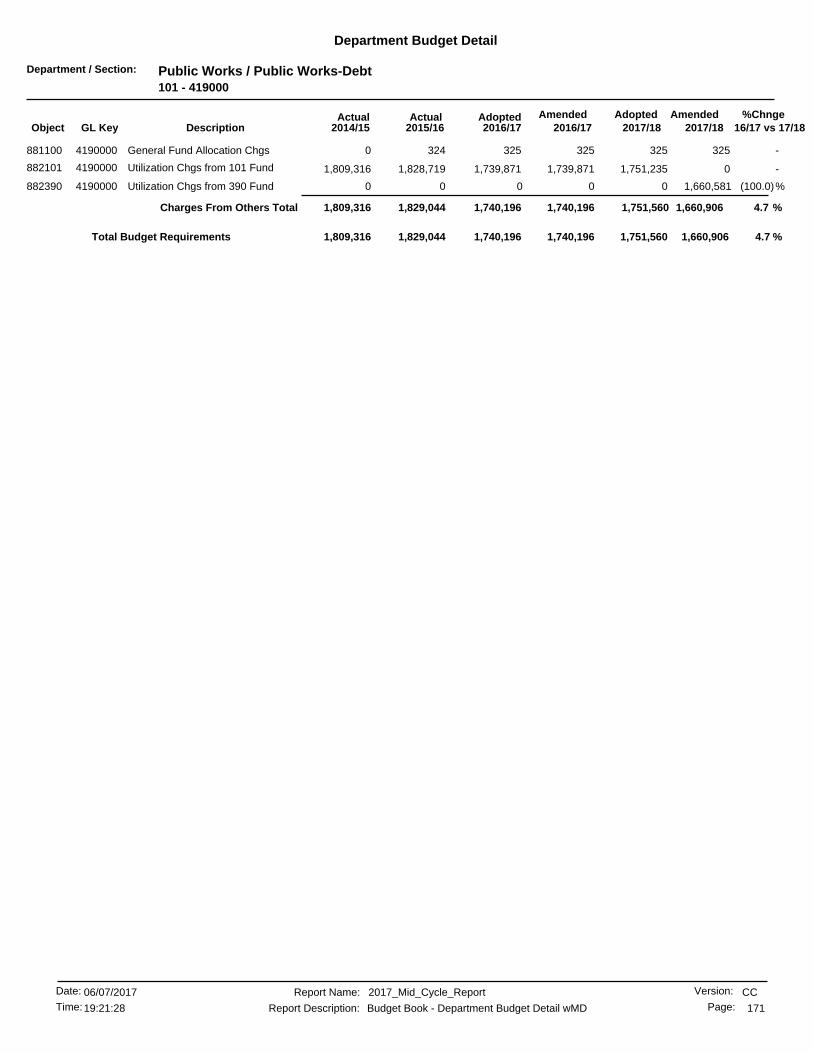
Department / Section: Public Works / Public Works-Debt101 - 419000
Department Budget Detail
%Chnge16/17 vs 17/182017/182017/18
AmendedAdoptedAdopted2016/17
AmendedActualActual2016/172015/162014/15GL KeyObject Description
-325325 325325324881100 General Fund Allocation Chgs4190000 0
-01,739,871 1,751,2351,739,8711,828,719882101 Utilization Chgs from 101 Fund4190000 1,809,316
(100.0)%0 1,660,581000Utilization Chgs from 390 Fund4190000882390 0
4.7 %1,660,9061,740,1961,740,196 1,751,560Charges From Others Total 1,829,0441,809,316
4.7 %1,740,196 1,660,9061,751,5601,740,1961,829,0441,809,316Total Budget Requirements
CCReport Name: 2017_Mid_Cycle_Report
Report Description: Budget Book - Department Budget Detail wMD
06/07/2017Date:
Time: 171
Version:
Page:19:21:28
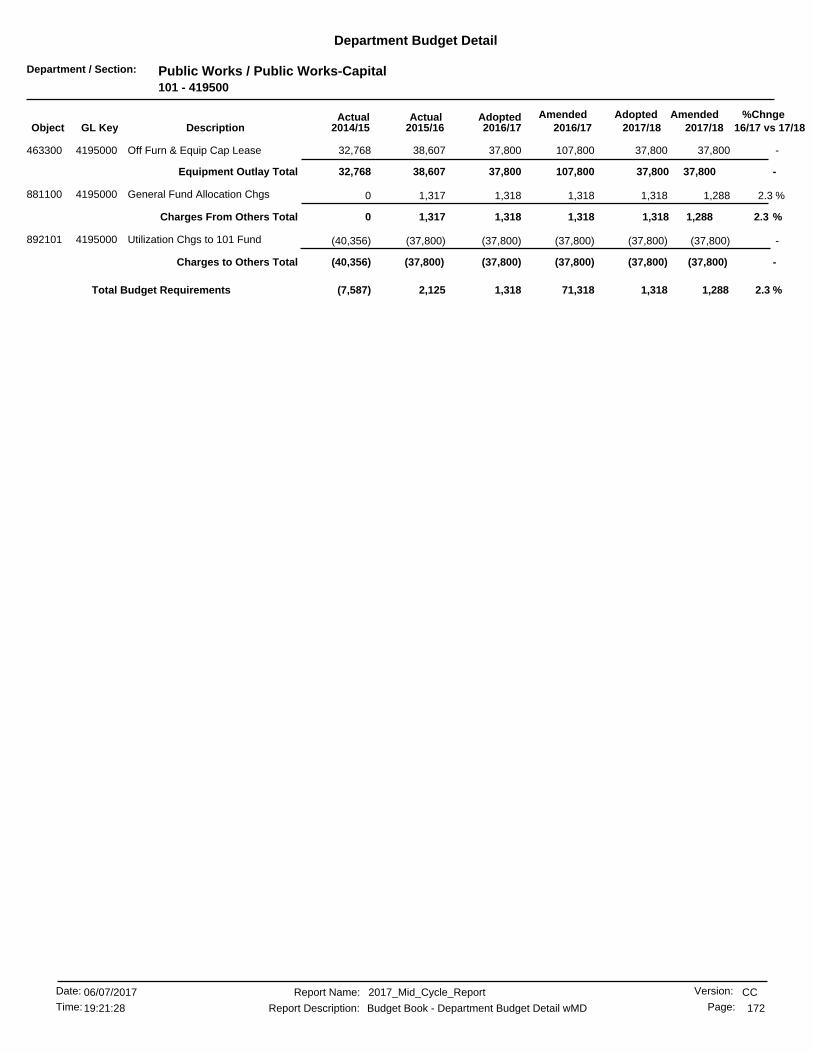
Department / Section: Public Works / Public Works-Capital101 - 419500
Department Budget Detail
%Chnge16/17 vs 17/182017/182017/18
AmendedAdoptedAdopted2016/17
AmendedActualActual2016/172015/162014/15GL KeyObject Description
-37,80037,800 37,800107,80038,607463300 Off Furn & Equip Cap Lease4195000 32,768
-37,800107,80037,800 37,800Equipment Outlay Total 38,60732,768
2.3 %1,2881,318 1,3181,3181,317881100 General Fund Allocation Chgs4195000 0
2.3 %1,2881,3181,318 1,318Charges From Others Total 1,3170
-(37,800)(37,800) (37,800)(37,800)(37,800)892101 Utilization Chgs to 101 Fund4195000 (40,356)
-(37,800) (37,800)Charges to Others Total (37,800)(37,800)(37,800)(40,356)
2.3 %1,318 1,2881,31871,3182,125(7,587)Total Budget Requirements
CCReport Name: 2017_Mid_Cycle_Report
Report Description: Budget Book - Department Budget Detail wMD
06/07/2017Date:
Time: 172
Version:
Page:19:21:28
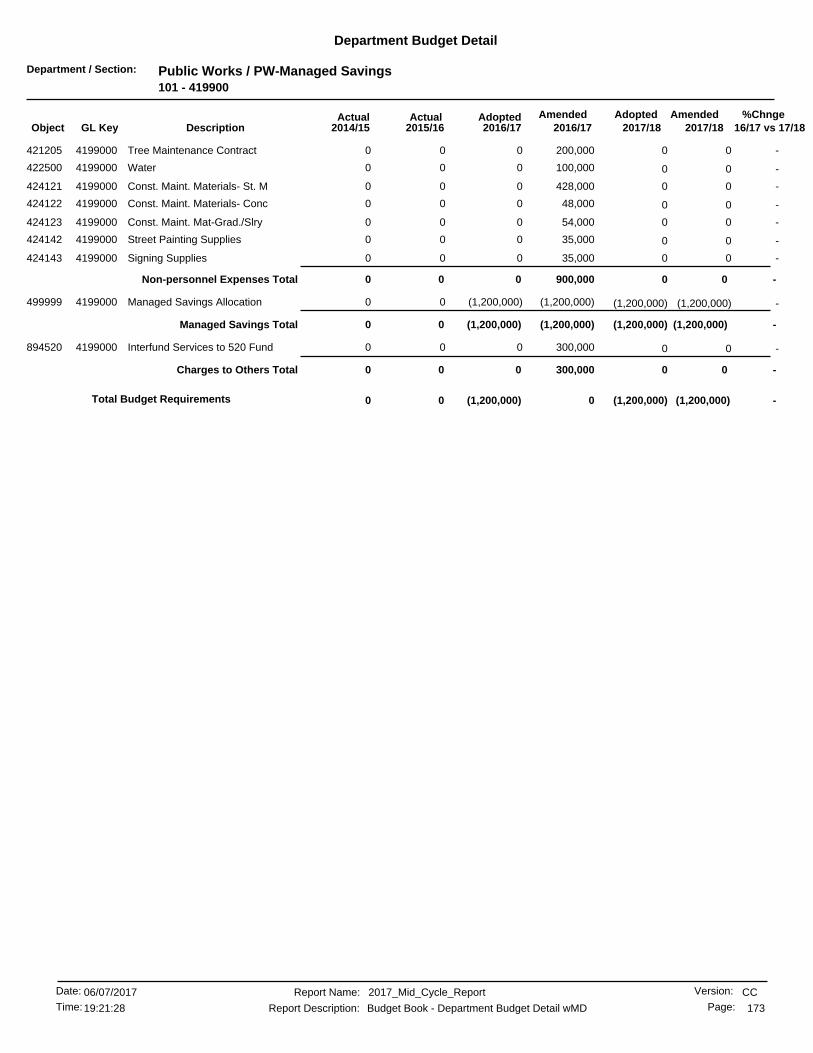
Department / Section: Public Works / PW-Managed Savings101 - 419900
Department Budget Detail
%Chnge16/17 vs 17/182017/182017/18
AmendedAdoptedAdopted2016/17
AmendedActualActual2016/172015/162014/15GL KeyObject Description
-0 0200,00000Tree Maintenance Contract4199000421205 0
-0 0100,00000Water4199000422500 0
-0 0428,00000Const. Maint. Materials- St. M4199000424121 0
-0 048,00000Const. Maint. Materials- Conc4199000424122 0
-0 054,00000Const. Maint. Mat-Grad./Slry4199000424123 0
-0 035,00000Street Painting Supplies4199000424142 0
-0 035,00000Signing Supplies4199000424143 0
-0 0Non-personnel Expenses Total 0900,00000
-(1,200,000) (1,200,000)(1,200,000)00Managed Savings Allocation4199000499999 (1,200,000)
-(1,200,000) (1,200,000)Managed Savings Total (1,200,000)(1,200,000)00
-0 0300,00000Interfund Services to 520 Fund4199000894520 0
-0 0Charges to Others Total 0300,00000
-(1,200,000)(1,200,000) (1,200,000)00Total Budget Requirements 0
CCReport Name: 2017_Mid_Cycle_Report
Report Description: Budget Book - Department Budget Detail wMD
06/07/2017Date:
Time: 173
Version:
Page:19:21:28

Department / Section: Library / Library Administration101 - 513000
Department Budget Detail
%Chnge16/17 vs 17/182017/182017/18
AmendedAdoptedAdopted2016/17
AmendedActualActual2016/172015/162014/15GL KeyObject Description
(11.6) %704,938622,495 629,938622,495327,441411100 Salaries - Regular5130000 330,290
-0 0024326Compensatory Time5130000411130 0
-0 0030,75728,297Vacation5130000411210 0
-0 0015,48216,947Holidays & Special Days Off5130000411220 0
-0 0039,46112,821Sick Leave5130000411240 0
-0 009851,290Family Illness Sick Leave5130000411245 0
-0 00563148Bereavement Leave5130000411260 0
-0 006,1854,989Administrative Leave5130000411292 0
-0 005,0415,027Vacation Payoffs5130000411410 0
-0 00080Compensatory Time Payoff5130000411430 0
(2.7) %3,6063,507 3,6063,507(17,645)411510 Accrued Payroll5130000 3,430
(1.1) %10,0169,898 10,0169,8986,099412210 Workers Compensation Ins5130000 7,443
(2.8) %85,25382,793 85,25382,79343,024412220 Health Insurance5130000 51,234
-3,7803,780 3,7803,7802,250412222 Dental Insurance5130000 2,557
(1.1) %2,9362,901 2,9362,9011,635412230 Life Insurance5130000 1,426
(1.1) %352348 352348228412240 Unemployment Insurance5130000 288
-408408 408408350412250 Disability Insurance5130000 376
(7.1) %201,962187,568 201,962187,568120,849412310 PERS Retirement5130000 108,087
(1.1) %9,1339,026 9,1339,0266,284412320 Medicare OASDI5130000 5,901
(20.0) %6,0004,800 6,0004,8001,875412400 Deferred Compensation5130000 1,200
-4,5504,550 4,5504,5504,375412500 Automobile/Expense Allowance5130000 4,200
-0 002810Overtime At Straight Rate5130000413110 0
-0 001,5031,497Overtime At 1.5 Rate5130000413120 0
(100.0)%0 19,970000Ptr. Comp. Model5130000419996 0
(11.4) %1,052,904932,074932,074 957,934Personnel Services Total 597,055587,863
(29.7) %280,551197,201 205,551206,648182,208421000 Professional Services5130000 175,894
-0 000135Prof Services/Internal5130000421001 0
-1,0001,000 1,0001,000503422100 Telephone5130000 390
-1,1001,100 1,1001,1001,139422120 Telephone - Cellular5130000 1,482
(2.9) %8,8998,640 8,8998,6408,878423400 Motor Pool Equipment Rental5130000 8,769
-800 80080000Vehicle Usage Reimb Employee5130000423500 800
-65,50065,500 65,50067,19245,274424220 All Other Equip Maint/Repair5130000 52,222
-0 002470Central Garage Charges5130000424230 0
-4,7354,735 4,7355,2355,040425200 Periodicals & Dues5130000 5,152
-5,5005,500 5,5005,0003,179425400 General Office Expense5130000 2,290
-0 0001,314Special Department Supplies5130000426800 0
(1.1) %8,1278,031 8,1278,03110,111428400 Liability Insurance5130000 9,924
(24.0) %89,44167,971 89,44144,32246,500428420 Insurance Charges - Direct5130000 25,463
(22.5) %465,653347,968360,478 390,653Non-personnel Expenses Total 303,082283,038
15.4 %1,179,3771,361,042 1,361,0421,361,0421,361,041881100 General Fund Allocation Chgs5130000 1,384,510
-8,9808,980 8,9808,9807,281882101 Utilization Chgs from 101 Fund5130000 7,129
-34,10434,104 34,10434,10434,104882510 Utilization Chgs from 510 Fund5130000 34,104
14.8 %1,222,4611,404,1261,404,126 1,404,126Charges From Others Total 1,402,4271,425,743
-0 000(73,702)Interfund Services to 101 Fund5130000894101 0
CCReport Name: 2017_Mid_Cycle_Report
Report Description: Budget Book - Department Budget Detail wMD
06/07/2017Date:
Time: 174
Version:
Page:19:21:28
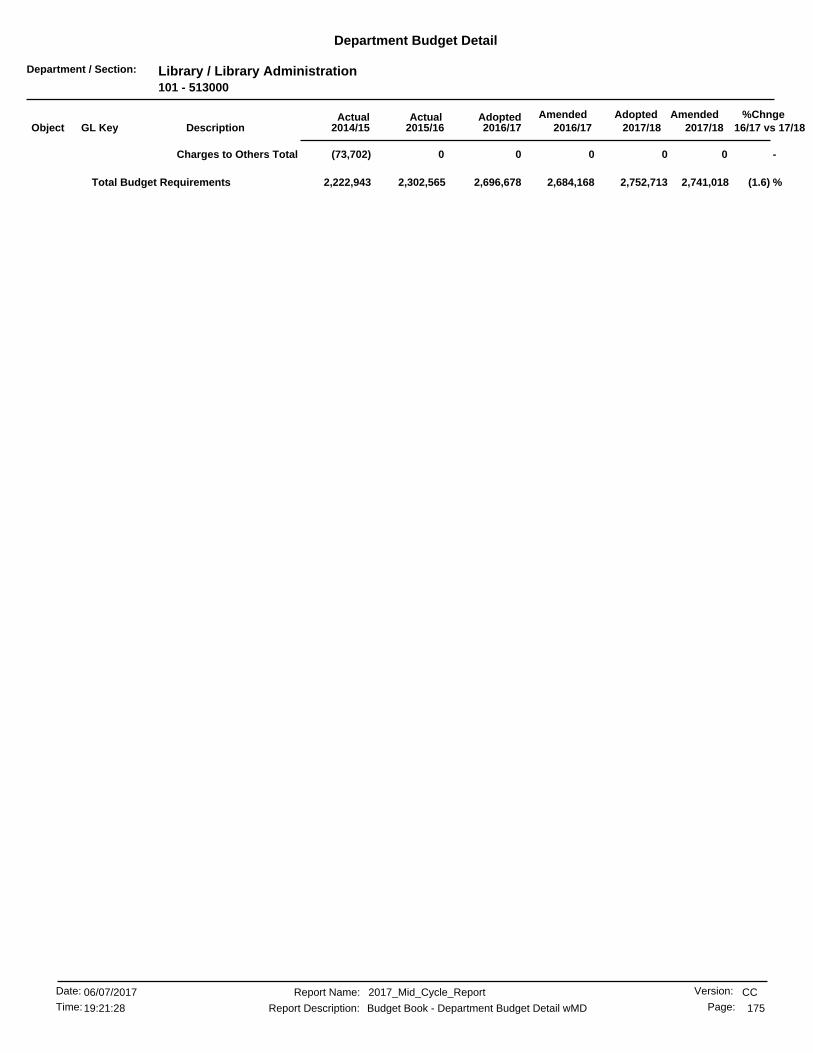
Department / Section: Library / Library Administration101 - 513000
Department Budget Detail
%Chnge16/17 vs 17/182017/182017/18
AmendedAdoptedAdopted2016/17
AmendedActualActual2016/172015/162014/15GL KeyObject Description
-0 0Charges to Others Total 000(73,702)
(1.6) %2,696,678 2,741,0182,752,7132,684,1682,302,5652,222,943Total Budget Requirements
CCReport Name: 2017_Mid_Cycle_Report
Report Description: Budget Book - Department Budget Detail wMD
06/07/2017Date:
Time: 175
Version:
Page:19:21:28
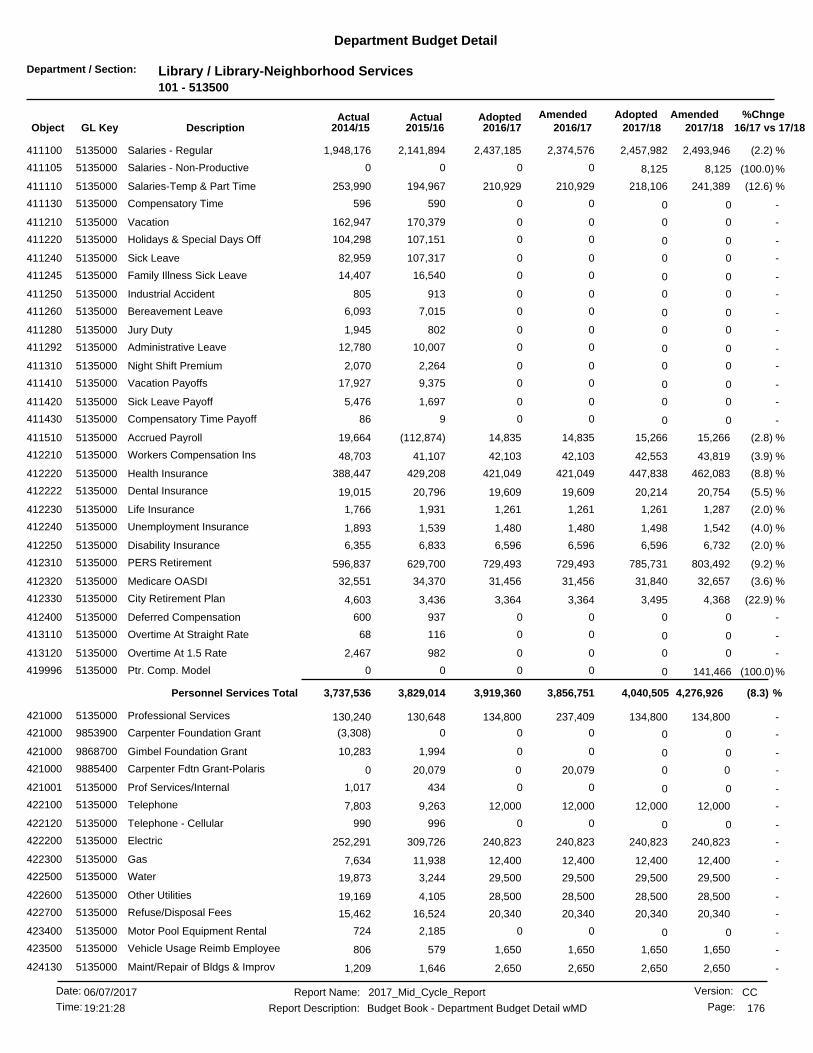
Department / Section: Library / Library-Neighborhood Services101 - 513500
Department Budget Detail
%Chnge16/17 vs 17/182017/182017/18
AmendedAdoptedAdopted2016/17
AmendedActualActual2016/172015/162014/15GL KeyObject Description
(2.2) %2,493,9462,437,185 2,457,9822,374,5762,141,894411100 Salaries - Regular5135000 1,948,176
(100.0)%0 8,125000Salaries - Non-Productive5135000411105 8,125
(12.6) %241,389210,929 218,106210,929194,967411110 Salaries-Temp & Part Time5135000 253,990
-0 00590596Compensatory Time5135000411130 0
-0 00170,379162,947Vacation5135000411210 0
-0 00107,151104,298Holidays & Special Days Off5135000411220 0
-0 00107,31782,959Sick Leave5135000411240 0
-0 0016,54014,407Family Illness Sick Leave5135000411245 0
-0 00913805Industrial Accident5135000411250 0
-0 007,0156,093Bereavement Leave5135000411260 0
-0 008021,945Jury Duty5135000411280 0
-0 0010,00712,780Administrative Leave5135000411292 0
-0 002,2642,070Night Shift Premium5135000411310 0
-0 009,37517,927Vacation Payoffs5135000411410 0
-0 001,6975,476Sick Leave Payoff5135000411420 0
-0 00986Compensatory Time Payoff5135000411430 0
(2.8) %15,26614,835 15,26614,835(112,874)411510 Accrued Payroll5135000 19,664
(3.9) %43,81942,103 42,55342,10341,107412210 Workers Compensation Ins5135000 48,703
(8.8) %462,083421,049 447,838421,049429,208412220 Health Insurance5135000 388,447
(5.5) %20,75419,609 20,21419,60920,796412222 Dental Insurance5135000 19,015
(2.0) %1,2871,261 1,2611,2611,931412230 Life Insurance5135000 1,766
(4.0) %1,5421,480 1,4981,4801,539412240 Unemployment Insurance5135000 1,893
(2.0) %6,7326,596 6,5966,5966,833412250 Disability Insurance5135000 6,355
(9.2) %803,492729,493 785,731729,493629,700412310 PERS Retirement5135000 596,837
(3.6) %32,65731,456 31,84031,45634,370412320 Medicare OASDI5135000 32,551
(22.9) %4,3683,364 3,4953,3643,436412330 City Retirement Plan5135000 4,603
-0 00937600Deferred Compensation5135000412400 0
-0 0011668Overtime At Straight Rate5135000413110 0
-0 009822,467Overtime At 1.5 Rate5135000413120 0
(100.0)%0 141,466000Ptr. Comp. Model5135000419996 0
(8.3) %4,276,9263,856,7513,919,360 4,040,505Personnel Services Total 3,829,0143,737,536
-134,800134,800 134,800237,409130,648421000 Professional Services5135000 130,240
-0 000(3,308)Carpenter Foundation Grant9853900421000 0
-0 001,99410,283Gimbel Foundation Grant9868700421000 0
-00 020,07920,079421000 Carpenter Fdtn Grant-Polaris9885400 0
-0 004341,017Prof Services/Internal5135000421001 0
-12,00012,000 12,00012,0009,263422100 Telephone5135000 7,803
-0 00996990Telephone - Cellular5135000422120 0
-240,823240,823 240,823240,823309,726422200 Electric5135000 252,291
-12,40012,400 12,40012,40011,938422300 Gas5135000 7,634
-29,50029,500 29,50029,5003,244422500 Water5135000 19,873
-28,50028,500 28,50028,5004,105422600 Other Utilities5135000 19,169
-20,34020,340 20,34020,34016,524422700 Refuse/Disposal Fees5135000 15,462
-0 002,185724Motor Pool Equipment Rental5135000423400 0
-1,6501,650 1,6501,650579423500 Vehicle Usage Reimb Employee5135000 806
-2,6502,650 2,6502,6501,646424130 Maint/Repair of Bldgs & Improv5135000 1,209
CCReport Name: 2017_Mid_Cycle_Report
Report Description: Budget Book - Department Budget Detail wMD
06/07/2017Date:
Time: 176
Version:
Page:19:21:28

Department / Section: Library / Library-Neighborhood Services101 - 513500
Department Budget Detail
%Chnge16/17 vs 17/182017/182017/18
AmendedAdoptedAdopted2016/17
AmendedActualActual2016/172015/162014/15GL KeyObject Description
-29,50029,500 29,50022,64225,759424220 All Other Equip Maint/Repair5135000 17,036
-89,33689,336 89,33689,33669,960425400 General Office Expense5135000 94,258
-0 0000Calif Lib Lit Srvcs Grnt-10/119328200425400 0
-0 07,50000Best Buy Foundation Comm Grnt9898600425400 0
-0 017,50000Orange Terrace Library Imps9899300425400 0
-22,50022,500 22,50018,06015,615425500 Postage5135000 13,027
-0 00069Central Printing Charges5135000425600 0
-0 00537234Outside Printing Expense5135000425610 0
-24,00024,000 24,00024,00023,235426100 Janitorial Supplies5135000 21,479
-100,000100,000 100,00082,50099,876426800 Special Department Supplies5135000 98,226
-0 000253LSTA-STAYCATION STATION9148800426800 0
-0 0000Calif Lib Lit Srvcs Grnt-10/119328200426800 0
-0 0004,159Calif Lib Lit Srvcs Grnt-13/149331100426800 0
-0 0008,930Calif Lib Lit Srvcs Grnt-14/159332600426800 0
-0 0038,05327,679Neighborhood Strategies 26/269332900426800 0
-00 010,528471426800 Calif Libr Adlt Litercy 15/169334300 0
-0 011,95000Calif Libr Adlt Litercy 16/179335100426800 0
-0 0000Cal Council 4 Humanities Grant9862800426800 0
-0 050000Bourns Foundation Grant9898900426800 0
(3.9) %35,55334,163 34,52634,16368,145428400 Liability Insurance5135000 64,938
( .1) %783,552924,031782,162 782,525Non-personnel Expenses Total 855,023814,494
-0 000251Gift Funds Exp5135000450201 0
-0 0Special Projects Total 000251
-0 001770State Operating Grants5135000440210 0
-0 00050LSTA-STAYCATION STATION9148800440210 0
-0 00011,907California Reads 20149332400440210 0
-0 002,9719,000Calif Lib Lit Srvcs Grnt-14/159332600440210 0
-0 007784,213The American Dream Delayed9332700440210 0
-00 06441,175440210 Community Gardens in Libraries9332800 3,179
-0 0012,3207,532Neighborhood Strategies 26/269332900440210 0
-00 010,2982,775440210 Calif Libr Adlt Litercy 15/169334300 0
-0 06,05000Calif Libr Adlt Litercy 16/179335100440210 0
-0 090,00000CA Libr Broadband Project9335300440210 0
-0 0Operating Grants Total 0106,99320,19835,884
-0 0350446Main Library Project9880700440301 0
-00 017,40217,402440301 Carpenter Fdtn Grant-Polaris9885400 0
-00 02,49526,765440301 Arlanza Lib Accident Repair9892500 0
-0 0Capital Outlay & Grants Total 019,93344,167446
(100.0)%0 167,763000General Fund Allocation Chgs5135000881100 0
(4.7) %2,6302,505 2,6302,5052,605882101 Utilization Chgs from 101 Fund5135000 2,031
(98.5) %170,3932,5052,505 2,630Charges From Others Total 2,6052,031
-(1,088,421)(1,088,421) (1,088,421)(1,088,421)(1,088,421)892101 Utilization Chgs to 101 Fund5135000 (1,045,613)
-0 00(7,541)(9,938)Interfund Services to 101 Fund5135000894101 0
CCReport Name: 2017_Mid_Cycle_Report
Report Description: Budget Book - Department Budget Detail wMD
06/07/2017Date:
Time: 177
Version:
Page:19:21:28
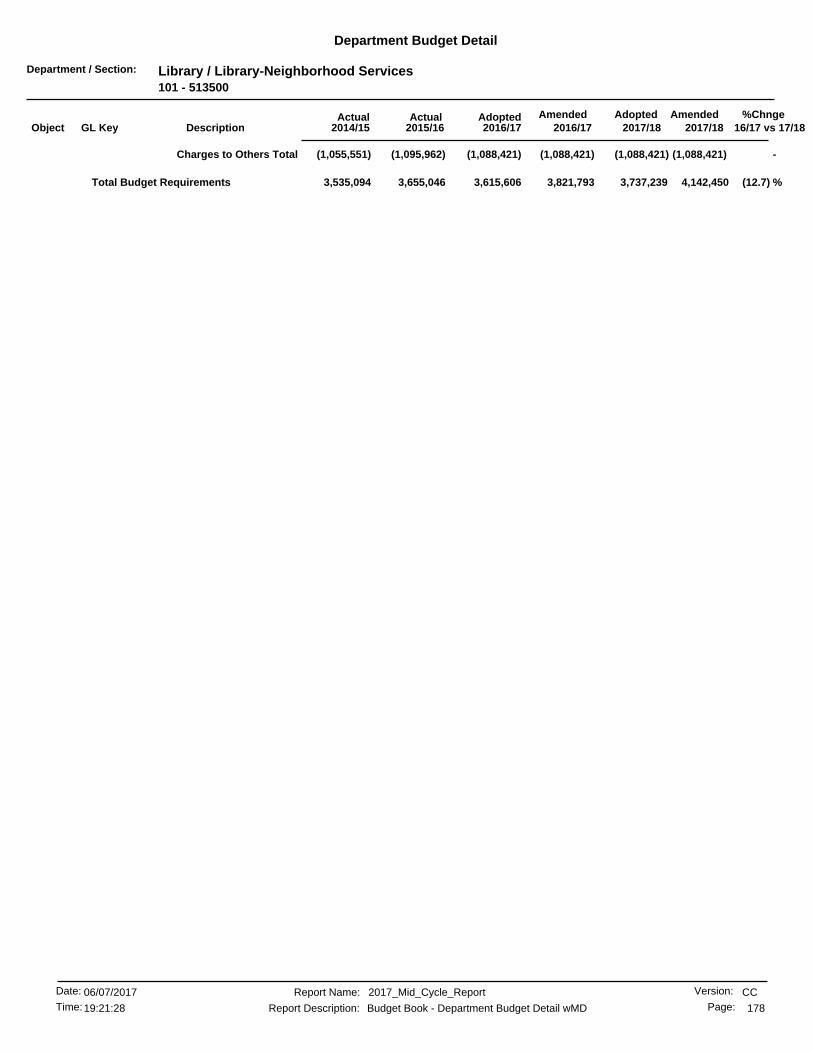
Department / Section: Library / Library-Neighborhood Services101 - 513500
Department Budget Detail
%Chnge16/17 vs 17/182017/182017/18
AmendedAdoptedAdopted2016/17
AmendedActualActual2016/172015/162014/15GL KeyObject Description
-(1,088,421)(1,088,421)(1,088,421) (1,088,421)Charges to Others Total (1,095,962)(1,055,551)
(12.7) %3,615,606 4,142,4503,737,2393,821,7933,655,0463,535,094Total Budget Requirements
CCReport Name: 2017_Mid_Cycle_Report
Report Description: Budget Book - Department Budget Detail wMD
06/07/2017Date:
Time: 178
Version:
Page:19:21:28
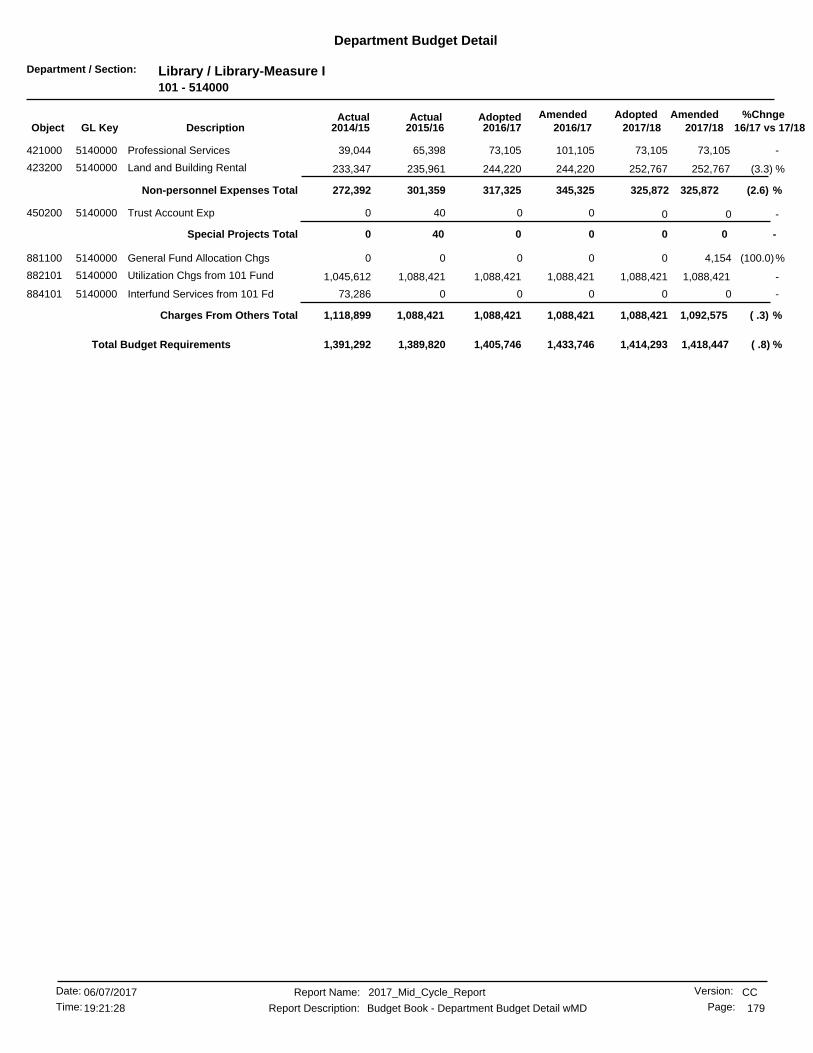
Department / Section: Library / Library-Measure I101 - 514000
Department Budget Detail
%Chnge16/17 vs 17/182017/182017/18
AmendedAdoptedAdopted2016/17
AmendedActualActual2016/172015/162014/15GL KeyObject Description
-73,10573,105 73,105101,10565,398421000 Professional Services5140000 39,044
(3.3) %252,767244,220 252,767244,220235,961423200 Land and Building Rental5140000 233,347
(2.6) %325,872345,325317,325 325,872Non-personnel Expenses Total 301,359272,392
-0 00400Trust Account Exp5140000450200 0
-0 0Special Projects Total 00400
(100.0)%0 4,154000General Fund Allocation Chgs5140000881100 0
-1,088,4211,088,421 1,088,4211,088,4211,088,421882101 Utilization Chgs from 101 Fund5140000 1,045,612
-0 00073,286Interfund Services from 101 Fd5140000884101 0
( .3) %1,088,421 1,092,575Charges From Others Total 1,088,4211,088,4211,088,4211,118,899
( .8) %1,405,746 1,418,4471,414,2931,433,7461,389,8201,391,292Total Budget Requirements
CCReport Name: 2017_Mid_Cycle_Report
Report Description: Budget Book - Department Budget Detail wMD
06/07/2017Date:
Time: 179
Version:
Page:19:21:28

Department / Section: Library / Library-Gift & Trust101 - 514500
Department Budget Detail
%Chnge16/17 vs 17/182017/182017/18
AmendedAdoptedAdopted2016/17
AmendedActualActual2016/172015/162014/15GL KeyObject Description
-00 0206,637166,302450200 Trust Account Exp5145000 133,783
-00 0337,722404,326450201 Gift Funds Exp5145000 278,063
-0 0Special Projects Total 0544,359570,629411,847
(100.0)%0 15,081000General Fund Allocation Chgs5145000881100 0
(100.0) %0 15,081Charges From Others Total 0000
(100.0) %0 15,0810544,359570,629411,847Total Budget Requirements
CCReport Name: 2017_Mid_Cycle_Report
Report Description: Budget Book - Department Budget Detail wMD
06/07/2017Date:
Time: 180
Version:
Page:19:21:28
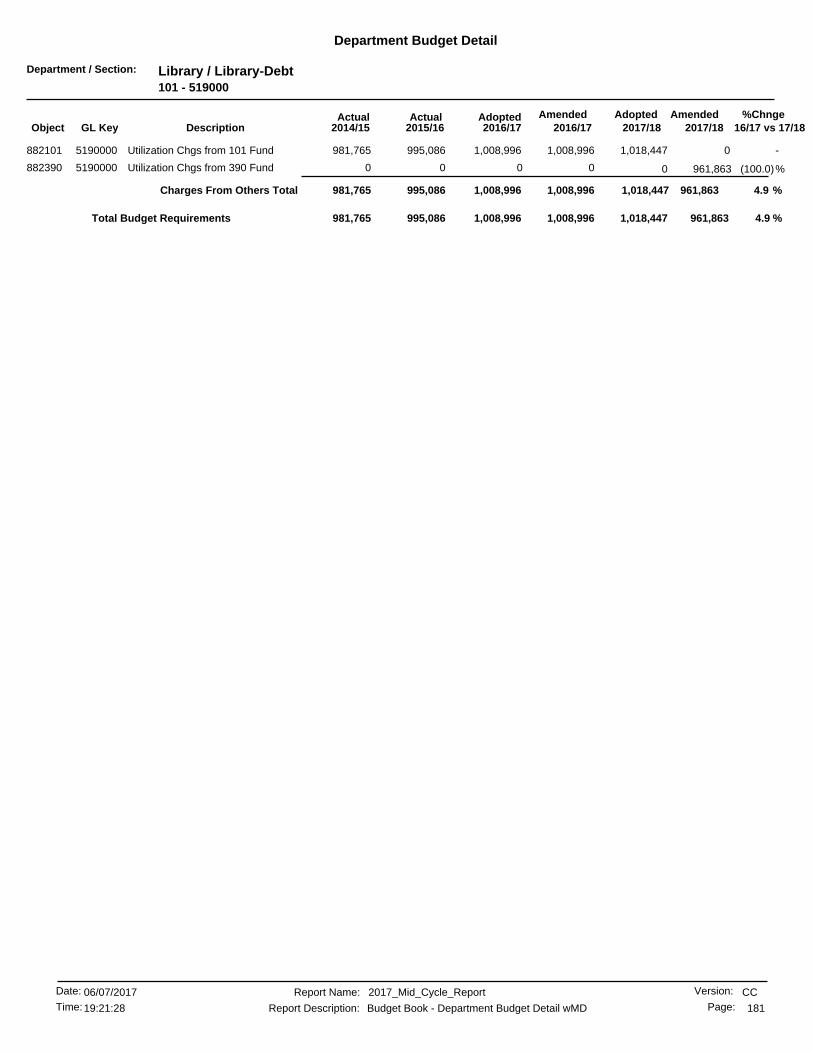
Department / Section: Library / Library-Debt101 - 519000
Department Budget Detail
%Chnge16/17 vs 17/182017/182017/18
AmendedAdoptedAdopted2016/17
AmendedActualActual2016/172015/162014/15GL KeyObject Description
-01,008,996 1,018,4471,008,996995,086882101 Utilization Chgs from 101 Fund5190000 981,765
(100.0)%0 961,863000Utilization Chgs from 390 Fund5190000882390 0
4.9 %961,8631,008,9961,008,996 1,018,447Charges From Others Total 995,086981,765
4.9 %1,008,996 961,8631,018,4471,008,996995,086981,765Total Budget Requirements
CCReport Name: 2017_Mid_Cycle_Report
Report Description: Budget Book - Department Budget Detail wMD
06/07/2017Date:
Time: 181
Version:
Page:19:21:28

Department / Section: Library / LB-Managed Savings101 - 519900
Department Budget Detail
%Chnge16/17 vs 17/182017/182017/18
AmendedAdoptedAdopted2016/17
AmendedActualActual2016/172015/162014/15GL KeyObject Description
-(150,000) (150,000)(150,000)00Managed Savings Allocation5199000499999 (150,000)
-(150,000) (150,000)Managed Savings Total (150,000)(150,000)00
-(150,000)(150,000) (150,000)(150,000)0Total Budget Requirements 0
CCReport Name: 2017_Mid_Cycle_Report
Report Description: Budget Book - Department Budget Detail wMD
06/07/2017Date:
Time: 182
Version:
Page:19:21:28
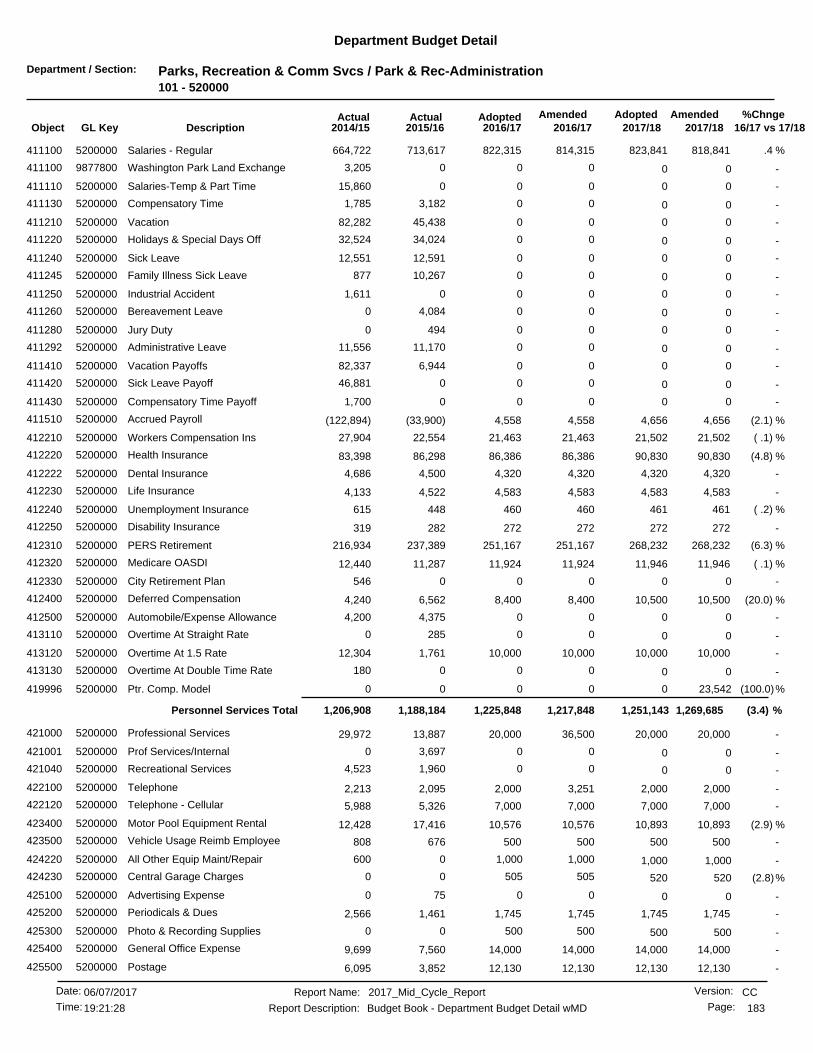
Department / Section: Parks, Recreation & Comm Svcs / Park & Rec-Administration101 - 520000
Department Budget Detail
%Chnge16/17 vs 17/182017/182017/18
AmendedAdoptedAdopted2016/17
AmendedActualActual2016/172015/162014/15GL KeyObject Description
.4 %818,841822,315 823,841814,315713,617411100 Salaries - Regular5200000 664,722
-0 0003,205Washington Park Land Exchange9877800411100 0
-0 00015,860Salaries-Temp & Part Time5200000411110 0
-0 003,1821,785Compensatory Time5200000411130 0
-0 0045,43882,282Vacation5200000411210 0
-0 0034,02432,524Holidays & Special Days Off5200000411220 0
-0 0012,59112,551Sick Leave5200000411240 0
-0 0010,267877Family Illness Sick Leave5200000411245 0
-0 0001,611Industrial Accident5200000411250 0
-0 004,0840Bereavement Leave5200000411260 0
-0 004940Jury Duty5200000411280 0
-0 0011,17011,556Administrative Leave5200000411292 0
-0 006,94482,337Vacation Payoffs5200000411410 0
-0 00046,881Sick Leave Payoff5200000411420 0
-0 0001,700Compensatory Time Payoff5200000411430 0
(2.1) %4,6564,558 4,6564,558(33,900)411510 Accrued Payroll5200000 (122,894)
( .1) %21,50221,463 21,50221,46322,554412210 Workers Compensation Ins5200000 27,904
(4.8) %90,83086,386 90,83086,38686,298412220 Health Insurance5200000 83,398
-4,3204,320 4,3204,3204,500412222 Dental Insurance5200000 4,686
-4,5834,583 4,5834,5834,522412230 Life Insurance5200000 4,133
( .2) %461460 461460448412240 Unemployment Insurance5200000 615
-272272 272272282412250 Disability Insurance5200000 319
(6.3) %268,232251,167 268,232251,167237,389412310 PERS Retirement5200000 216,934
( .1) %11,94611,924 11,94611,92411,287412320 Medicare OASDI5200000 12,440
-0 000546City Retirement Plan5200000412330 0
(20.0) %10,5008,400 10,5008,4006,562412400 Deferred Compensation5200000 4,240
-0 004,3754,200Automobile/Expense Allowance5200000412500 0
-0 002850Overtime At Straight Rate5200000413110 0
-10,00010,000 10,00010,0001,761413120 Overtime At 1.5 Rate5200000 12,304
-0 000180Overtime At Double Time Rate5200000413130 0
(100.0)%0 23,542000Ptr. Comp. Model5200000419996 0
(3.4) %1,269,6851,217,8481,225,848 1,251,143Personnel Services Total 1,188,1841,206,908
-20,00020,000 20,00036,50013,887421000 Professional Services5200000 29,972
-0 003,6970Prof Services/Internal5200000421001 0
-0 001,9604,523Recreational Services5200000421040 0
-2,0002,000 2,0003,2512,095422100 Telephone5200000 2,213
-7,0007,000 7,0007,0005,326422120 Telephone - Cellular5200000 5,988
(2.9) %10,89310,576 10,89310,57617,416423400 Motor Pool Equipment Rental5200000 12,428
-500500 500500676423500 Vehicle Usage Reimb Employee5200000 808
-1,000 1,0001,0000600All Other Equip Maint/Repair5200000424220 1,000
(2.8)%505 52050500Central Garage Charges5200000424230 520
-0 00750Advertising Expense5200000425100 0
-1,7451,745 1,7451,7451,461425200 Periodicals & Dues5200000 2,566
-500 50050000Photo & Recording Supplies5200000425300 500
-14,00014,000 14,00014,0007,560425400 General Office Expense5200000 9,699
-12,13012,130 12,13012,1303,852425500 Postage5200000 6,095
CCReport Name: 2017_Mid_Cycle_Report
Report Description: Budget Book - Department Budget Detail wMD
06/07/2017Date:
Time: 183
Version:
Page:19:21:28

Department / Section: Parks, Recreation & Comm Svcs / Park & Rec-Administration101 - 520000
Department Budget Detail
%Chnge16/17 vs 17/182017/182017/18
AmendedAdoptedAdopted2016/17
AmendedActualActual2016/172015/162014/15GL KeyObject Description
-2,5002,500 2,5002,5004,452425600 Central Printing Charges5200000 0
-141,924141,924 141,924125,424122,263425610 Outside Printing Expense5200000 128,989
-00 06,000713425700 Software Purchase/Licensing5200000 369
-00 02,0002,621425800 Computer Equip Purc Undr $50005200000 6,049
-500 500500048Clothing/Linen/Safety Supplies5200000426200 500
-0 003952,197Recreation Supplies5200000426500 0
-0 000150Work Boot Reimbursement5200000426710 0
-2,1802,180 2,1802,1801,481426800 Special Department Supplies5200000 1,542
-1,5131,513 1,5131,5135,605427100 Travel & Meeting Expense5200000 8,105
-0 00972,957Training5200000427200 0
( .1) %22,90222,860 22,90222,86021,829428400 Liability Insurance5200000 29,136
(22.7) %136,825105,686 136,82568,97474,547428420 Insurance Charges - Direct5200000 61,353
(8.3) %378,632319,658347,119 378,632Non-personnel Expenses Total 292,018315,796
-00 0127,39357,771450065 Bordwell Park Cell Tower5200000 0
-00 0108,18519,101450066 La Sierra Park Cell Tower5200000 0
-0 039,73800Riverside Sprt Complx Cell Twr5200000450067 0
-00 040,75417,311450068 Nichols Park Cell Tower5200000 0
-0 0106,73800Villegas Park Cell Tower5200000450069 0
-0 05,26800Swanson Park Cell Tower5200000450070 0
-0 043,93000Taft Park Cell Tower5200000450071 0
-0 035,11300Unprogrammed Funds5200000453001 0
-0 0Special Projects Total 0507,12294,1830
-15,00015,000 15,00015,00015,415463300 Off Furn & Equip Cap Lease5200000 22,605
-15,00015,00015,000 15,000Equipment Outlay Total 15,41522,605
-0 0000Cesar Chavez Comm Ctr Imps9141500440120 0
-00 067,6972,800440120 Reader Board at Bobby Bonds9252700 0
-0 0000Reid Pk Comm Ctr Roofing9252800440120 0
-0 00131,02472,494Restroom Bldg Replc-Don Jones9253000440120 0
-0 0028,0389,461Bordwell Park Fitness Center9255000440120 0
-00 098,2199,760440120 Villegas ADA Concrete Walkways9255100 0
-00 0200,176143,755440120 Arlington Youth Opportunity Ct9256000 6,067
-00 019,66655,333440120 Villegas Pk Plygrnd Shade Stru9256300 0
-00 0149,03325,966440120 Villegas Pk Brown Rm Renovtn9256400 0
-0 068,00000Hunter Park Railroad Kiosk9260000440120 0
-0 055,00000Mrtha McL/Anza Nrrws Frs Golf9260100440120 0
-0 050,00000Janet Goeske Fdtn Restroom9260200440120 0
-0 035,00000Myra Linn Park ADA9260400440120 0
-0 05,00000Myra Linn Park Swing9260500440120 0
-0 090,00000Myra Linn Park Playground9260600440120 0
-0 014,00000Myra Linn Park Turf Conv9260700440120 0
-0 090,00000Myra Linn Pk Fitness Stations9260800440120 0
-0 0204,07700La Sierra Park ADA Pathway9260900440120 0
-0 0072,3900HEAL Zone-PRCS Admin9877010462050 0
-0 0Capital Outlay & Grants Total 01,145,870469,06988,024
CCReport Name: 2017_Mid_Cycle_Report
Report Description: Budget Book - Department Budget Detail wMD
06/07/2017Date:
Time: 184
Version:
Page:19:21:28

Department / Section: Parks, Recreation & Comm Svcs / Park & Rec-Administration101 - 520000
Department Budget Detail
%Chnge16/17 vs 17/182017/182017/18
AmendedAdoptedAdopted2016/17
AmendedActualActual2016/172015/162014/15GL KeyObject Description
28.7 %1,418,9371,826,509 1,826,5091,826,5091,826,508881100 General Fund Allocation Chgs5200000 1,861,702
(1.8) %65,52464,324 65,52464,32449,323882510 Utilization Chgs from 510 Fund5200000 49,023
27.3 %1,484,4611,890,8331,890,833 1,892,033Charges From Others Total 1,875,8321,910,726
(2.5) %(226,231)(220,513) (226,231)(220,513)(214,939)892560 Utilization Chgs to 560 Fund5200000 (227,990)
-(36,000)(36,000) (36,000)(36,000)(56,817)894101 Interfund Services to 101 Fund5200000 (128,477)
(16.6)%(106,225) (127,470)(106,225)00Interfund Services to 170 Fund5200000894170 (127,470)
(2.3)%(36,540) (37,408)(36,540)00Interfund Services to 220 Fund5200000894220 (37,408)
-0 00(39,477)(131,746)Interfund Services to 401 Fund5200000894401 0
-(117,323)(117,323) (117,323)(117,323)(18,778)894413 Interfund Services to 413 Fund5200000 (3,836)
-0 00(7,832)(26,865)Interfund Services to 471 Fund5200000894471 0
-00 0(67,697)(2,800)895220 Reader Board at Bobby Bonds9252700 0
-0 0000Reid Pk Comm Ctr Roofing9252800895220 0
-0 00(131,024)(72,494)Restroom Bldg Replc-Don Jones9253000895220 0
-0 00(28,038)(9,461)Bordwell Park Fitness Center9255000895220 0
-00 0(98,219)(9,760)895220 Villegas ADA Concrete Walkways9255100 0
-00 0(19,666)(55,333)895220 Villegas Pk Plygrnd Shade Stru9256300 0
-00 0(149,033)(25,966)895220 Villegas Pk Brown Rm Renovtn9256400 0
-0 0(68,000)00Hunter Park Railroad Kiosk9260000895220 0
-0 0(55,000)00Mrtha McL/Anza Nrrws Frs Golf9260100895220 0
-0 0(50,000)00Janet Goeske Fdtn Restroom9260200895220 0
-0 0(35,000)00Myra Linn Park ADA9260400895220 0
-0 0(5,000)00Myra Linn Park Swing9260500895220 0
-0 0(90,000)00Myra Linn Park Playground9260600895220 0
-0 0(14,000)00Myra Linn Park Turf Conv9260700895220 0
-0 0(90,000)00Myra Linn Pk Fitness Stations9260800895220 0
-0 0(204,077)00La Sierra Park ADA Pathway9260900895220 0
-00 0(200,176)(143,755)895471 Arlington Youth Opportunity Ct9256000 (6,067)
(5.1) %(544,432)(1,662,471)(516,601) (544,432)Charges to Others Total (734,524)(606,940)
13.7 %2,962,199 2,603,3462,992,3763,433,8603,200,1812,937,121Total Budget Requirements
CCReport Name: 2017_Mid_Cycle_Report
Report Description: Budget Book - Department Budget Detail wMD
06/07/2017Date:
Time: 185
Version:
Page:19:21:28

Department / Section: Parks, Recreation & Comm Svcs / P&R-Adm-Plan & Des-Park Proj101 - 520011
Department Budget Detail
%Chnge16/17 vs 17/182017/182017/18
AmendedAdoptedAdopted2016/17
AmendedActualActual2016/172015/162014/15GL KeyObject Description
-0 0000Dog People Donations9736151424130 0
-0 0Non-personnel Expenses Total 0000
-00 078,19750,691440210 Sycamore Canyon Nature Center9330251 29,237
-0 0Operating Grants Total 078,19750,69129,237
-0 096000Reid Park Clubhouse Renovation9143051440120 0
-0 000(703)Arlanza EDI9227651440120 0
-0 0005,000Sycamore Canyon Nature Ctr CAP9330200440220 0
-0 00(821)8,993Syc Cyn Wildness Nature Center9406151440220 0
-00 0349,82517,311440301 Park Refurbishing Program9721651 0
-0 0292,54700Park Refurbishment -Rec Ctrs9729151440301 0
-00 044,5414,217440301 Park Land Acquisition9779251 33,583
-0 001,080819Tequesquite Park9847951440301 0
-0 002,9010Mt Rubidoux Storm Repairs9879251440301 0
-0 0Capital Outlay & Grants Total 0687,87524,68847,691
-0 00766,07275,37976,929Total Budget Requirements
(100.0) %00 0766,07275,379Total Budget Requirements 76,929
CCReport Name: 2017_Mid_Cycle_Report
Report Description: Budget Book - Department Budget Detail wMD
06/07/2017Date:
Time: 186
Version:
Page:19:21:28
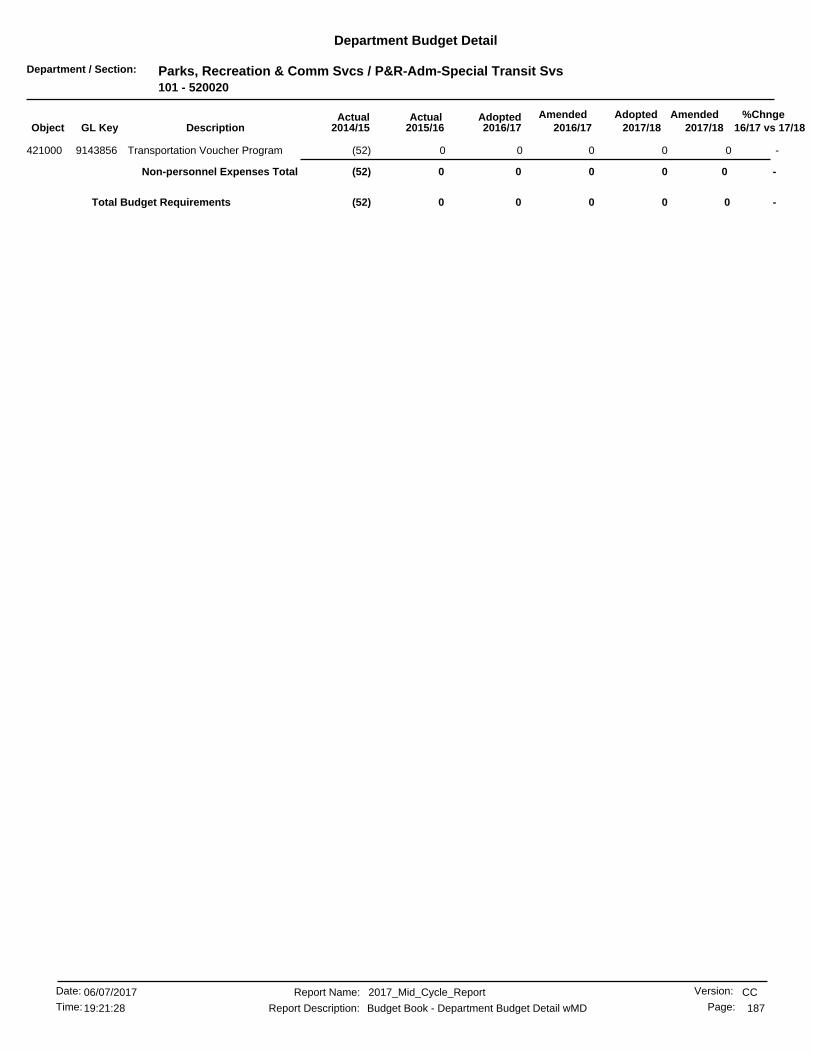
Department / Section: Parks, Recreation & Comm Svcs / P&R-Adm-Special Transit Svs101 - 520020
Department Budget Detail
%Chnge16/17 vs 17/182017/182017/18
AmendedAdoptedAdopted2016/17
AmendedActualActual2016/172015/162014/15GL KeyObject Description
-0 000(52)Transportation Voucher Program9143856421000 0
-0 0Non-personnel Expenses Total 000(52)
-00 000Total Budget Requirements (52)
CCReport Name: 2017_Mid_Cycle_Report
Report Description: Budget Book - Department Budget Detail wMD
06/07/2017Date:
Time: 187
Version:
Page:19:21:28
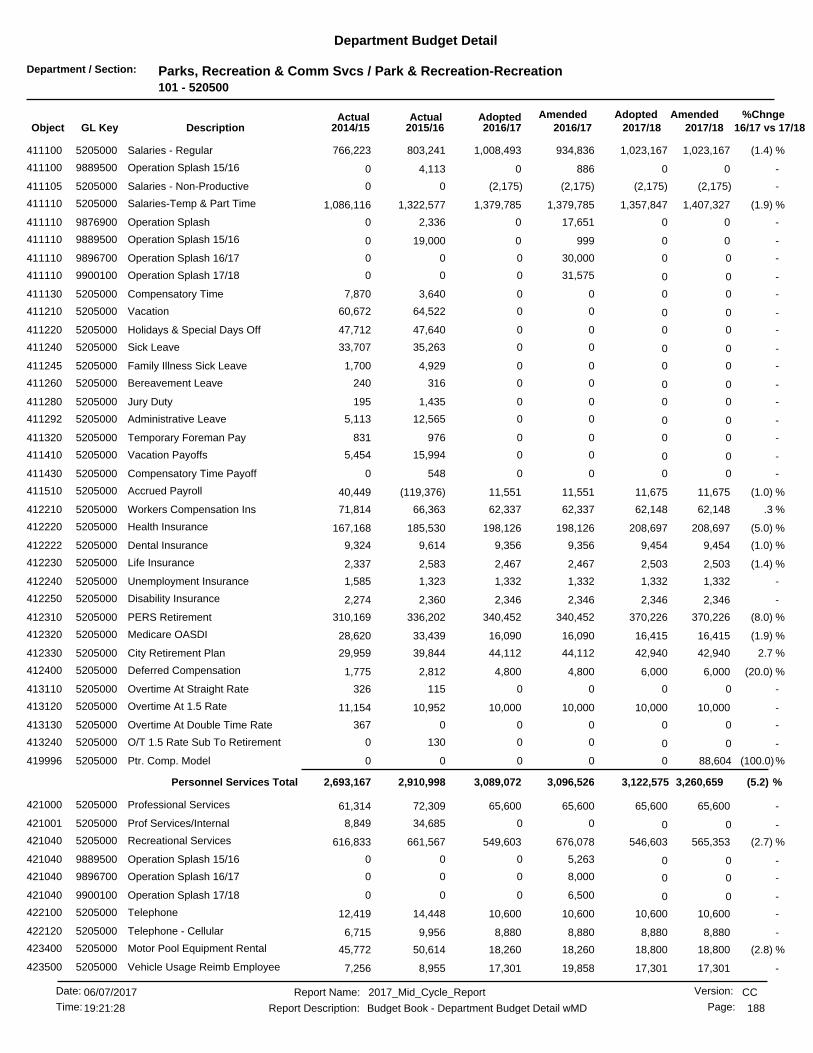
Department / Section: Parks, Recreation & Comm Svcs / Park & Recreation-Recreation101 - 520500
Department Budget Detail
%Chnge16/17 vs 17/182017/182017/18
AmendedAdoptedAdopted2016/17
AmendedActualActual2016/172015/162014/15GL KeyObject Description
(1.4) %1,023,1671,008,493 1,023,167934,836803,241411100 Salaries - Regular5205000 766,223
-00 08864,113411100 Operation Splash 15/169889500 0
-(2,175) (2,175)(2,175)00Salaries - Non-Productive5205000411105 (2,175)
(1.9) %1,407,3271,379,785 1,357,8471,379,7851,322,577411110 Salaries-Temp & Part Time5205000 1,086,116
-00 017,6512,336411110 Operation Splash9876900 0
-00 099919,000411110 Operation Splash 15/169889500 0
-0 030,00000Operation Splash 16/179896700411110 0
-0 031,57500Operation Splash 17/189900100411110 0
-0 003,6407,870Compensatory Time5205000411130 0
-0 0064,52260,672Vacation5205000411210 0
-0 0047,64047,712Holidays & Special Days Off5205000411220 0
-0 0035,26333,707Sick Leave5205000411240 0
-0 004,9291,700Family Illness Sick Leave5205000411245 0
-0 00316240Bereavement Leave5205000411260 0
-0 001,435195Jury Duty5205000411280 0
-0 0012,5655,113Administrative Leave5205000411292 0
-0 00976831Temporary Foreman Pay5205000411320 0
-0 0015,9945,454Vacation Payoffs5205000411410 0
-0 005480Compensatory Time Payoff5205000411430 0
(1.0) %11,67511,551 11,67511,551(119,376)411510 Accrued Payroll5205000 40,449
.3 %62,14862,337 62,14862,33766,363412210 Workers Compensation Ins5205000 71,814
(5.0) %208,697198,126 208,697198,126185,530412220 Health Insurance5205000 167,168
(1.0) %9,4549,356 9,4549,3569,614412222 Dental Insurance5205000 9,324
(1.4) %2,5032,467 2,5032,4672,583412230 Life Insurance5205000 2,337
-1,3321,332 1,3321,3321,323412240 Unemployment Insurance5205000 1,585
-2,3462,346 2,3462,3462,360412250 Disability Insurance5205000 2,274
(8.0) %370,226340,452 370,226340,452336,202412310 PERS Retirement5205000 310,169
(1.9) %16,41516,090 16,41516,09033,439412320 Medicare OASDI5205000 28,620
2.7 %42,94044,112 42,94044,11239,844412330 City Retirement Plan5205000 29,959
(20.0) %6,0004,800 6,0004,8002,812412400 Deferred Compensation5205000 1,775
-0 00115326Overtime At Straight Rate5205000413110 0
-10,00010,000 10,00010,00010,952413120 Overtime At 1.5 Rate5205000 11,154
-0 000367Overtime At Double Time Rate5205000413130 0
-0 001300O/T 1.5 Rate Sub To Retirement5205000413240 0
(100.0)%0 88,604000Ptr. Comp. Model5205000419996 0
(5.2) %3,260,6593,096,5263,089,072 3,122,575Personnel Services Total 2,910,9982,693,167
-65,60065,600 65,60065,60072,309421000 Professional Services5205000 61,314
-0 0034,6858,849Prof Services/Internal5205000421001 0
(2.7) %565,353549,603 546,603676,078661,567421040 Recreational Services5205000 616,833
-0 05,26300Operation Splash 15/169889500421040 0
-0 08,00000Operation Splash 16/179896700421040 0
-0 06,50000Operation Splash 17/189900100421040 0
-10,60010,600 10,60010,60014,448422100 Telephone5205000 12,419
-8,8808,880 8,8808,8809,956422120 Telephone - Cellular5205000 6,715
(2.8) %18,80018,260 18,80018,26050,614423400 Motor Pool Equipment Rental5205000 45,772
-17,30117,301 17,30119,8588,955423500 Vehicle Usage Reimb Employee5205000 7,256
CCReport Name: 2017_Mid_Cycle_Report
Report Description: Budget Book - Department Budget Detail wMD
06/07/2017Date:
Time: 188
Version:
Page:19:21:28
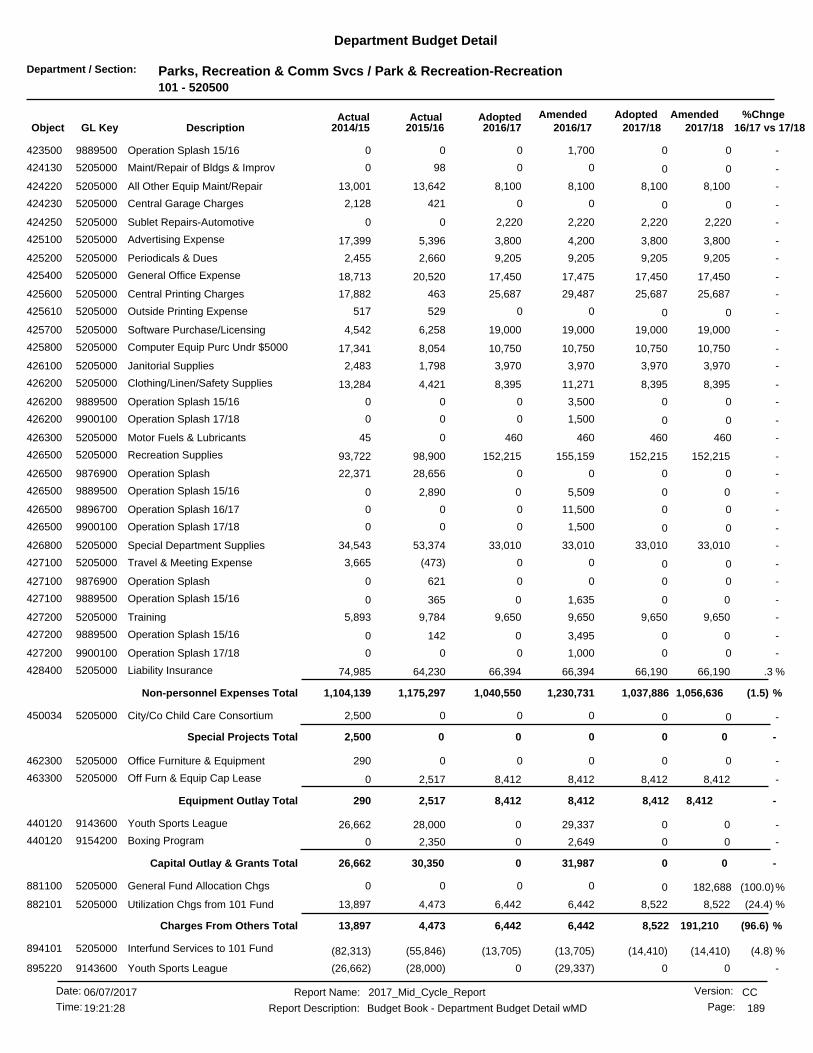
Department / Section: Parks, Recreation & Comm Svcs / Park & Recreation-Recreation101 - 520500
Department Budget Detail
%Chnge16/17 vs 17/182017/182017/18
AmendedAdoptedAdopted2016/17
AmendedActualActual2016/172015/162014/15GL KeyObject Description
-0 01,70000Operation Splash 15/169889500423500 0
-0 00980Maint/Repair of Bldgs & Improv5205000424130 0
-8,1008,100 8,1008,10013,642424220 All Other Equip Maint/Repair5205000 13,001
-0 004212,128Central Garage Charges5205000424230 0
-2,220 2,2202,22000Sublet Repairs-Automotive5205000424250 2,220
-3,8003,800 3,8004,2005,396425100 Advertising Expense5205000 17,399
-9,2059,205 9,2059,2052,660425200 Periodicals & Dues5205000 2,455
-17,45017,450 17,45017,47520,520425400 General Office Expense5205000 18,713
-25,68725,687 25,68729,487463425600 Central Printing Charges5205000 17,882
-0 00529517Outside Printing Expense5205000425610 0
-19,00019,000 19,00019,0006,258425700 Software Purchase/Licensing5205000 4,542
-10,75010,750 10,75010,7508,054425800 Computer Equip Purc Undr $50005205000 17,341
-3,9703,970 3,9703,9701,798426100 Janitorial Supplies5205000 2,483
-8,3958,395 8,39511,2714,421426200 Clothing/Linen/Safety Supplies5205000 13,284
-0 03,50000Operation Splash 15/169889500426200 0
-0 01,50000Operation Splash 17/189900100426200 0
-460 460460045Motor Fuels & Lubricants5205000426300 460
-152,215152,215 152,215155,15998,900426500 Recreation Supplies5205000 93,722
-0 0028,65622,371Operation Splash9876900426500 0
-00 05,5092,890426500 Operation Splash 15/169889500 0
-0 011,50000Operation Splash 16/179896700426500 0
-0 01,50000Operation Splash 17/189900100426500 0
-33,01033,010 33,01033,01053,374426800 Special Department Supplies5205000 34,543
-0 00(473)3,665Travel & Meeting Expense5205000427100 0
-0 006210Operation Splash9876900427100 0
-00 01,635365427100 Operation Splash 15/169889500 0
-9,6509,650 9,6509,6509,784427200 Training5205000 5,893
-00 03,495142427200 Operation Splash 15/169889500 0
-0 01,00000Operation Splash 17/189900100427200 0
.3 %66,19066,394 66,19066,39464,230428400 Liability Insurance5205000 74,985
(1.5) %1,056,6361,230,7311,040,550 1,037,886Non-personnel Expenses Total 1,175,2971,104,139
-0 0002,500City/Co Child Care Consortium5205000450034 0
-0 0Special Projects Total 0002,500
-0 000290Office Furniture & Equipment5205000462300 0
-8,4128,412 8,4128,4122,517463300 Off Furn & Equip Cap Lease5205000 0
-8,4128,4128,412 8,412Equipment Outlay Total 2,517290
-00 029,33728,000440120 Youth Sports League9143600 26,662
-00 02,6492,350440120 Boxing Program9154200 0
-0 0Capital Outlay & Grants Total 031,98730,35026,662
(100.0)%0 182,688000General Fund Allocation Chgs5205000881100 0
(24.4) %8,5226,442 8,5226,4424,473882101 Utilization Chgs from 101 Fund5205000 13,897
(96.6) %191,2106,4426,442 8,522Charges From Others Total 4,47313,897
(4.8) %(14,410)(13,705) (14,410)(13,705)(55,846)894101 Interfund Services to 101 Fund5205000 (82,313)
-00 0(29,337)(28,000)895220 Youth Sports League9143600 (26,662)
CCReport Name: 2017_Mid_Cycle_Report
Report Description: Budget Book - Department Budget Detail wMD
06/07/2017Date:
Time: 189
Version:
Page:19:21:28
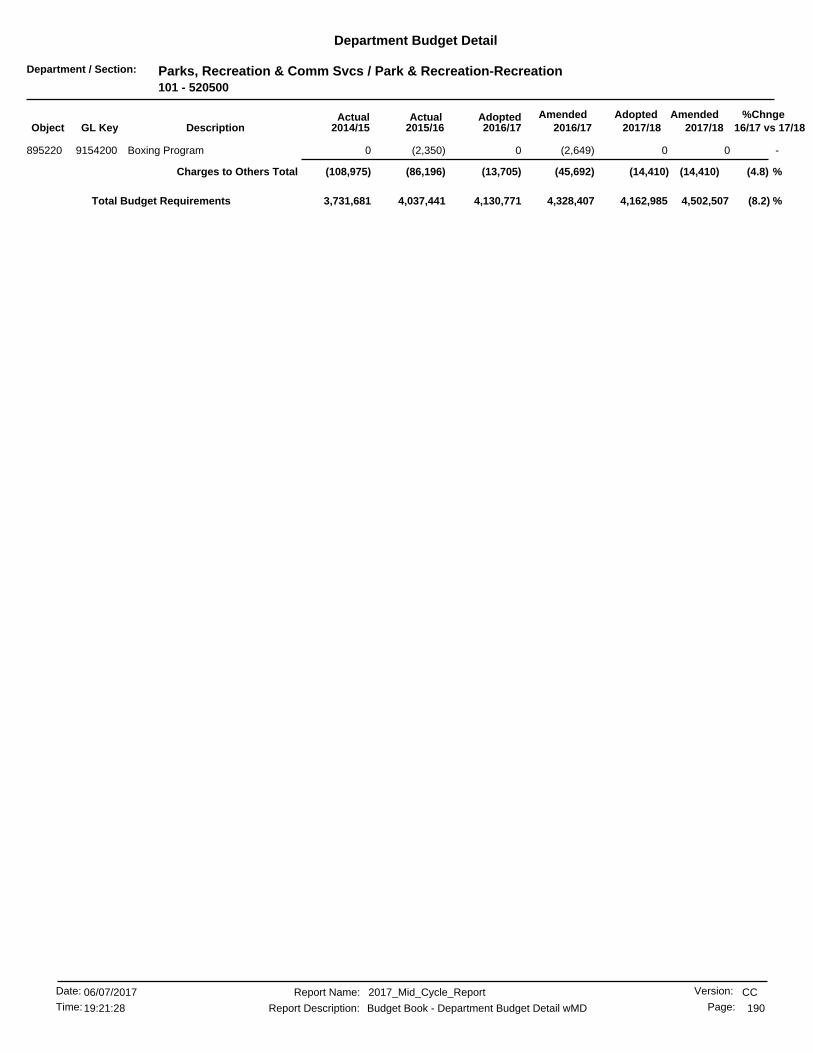
Department / Section: Parks, Recreation & Comm Svcs / Park & Recreation-Recreation101 - 520500
Department Budget Detail
%Chnge16/17 vs 17/182017/182017/18
AmendedAdoptedAdopted2016/17
AmendedActualActual2016/172015/162014/15GL KeyObject Description
-00 0(2,649)(2,350)895220 Boxing Program9154200 0
(4.8) %(14,410)(45,692)(13,705) (14,410)Charges to Others Total (86,196)(108,975)
(8.2) %4,130,771 4,502,5074,162,9854,328,4074,037,4413,731,681Total Budget Requirements
CCReport Name: 2017_Mid_Cycle_Report
Report Description: Budget Book - Department Budget Detail wMD
06/07/2017Date:
Time: 190
Version:
Page:19:21:28
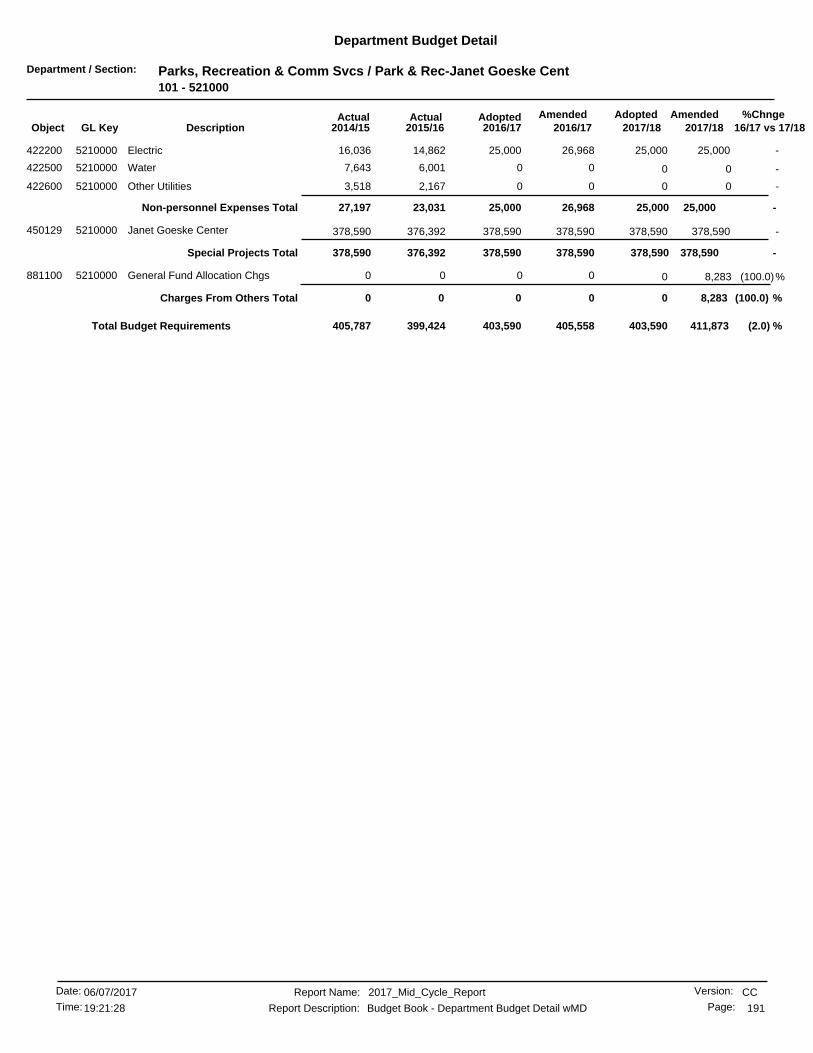
Department / Section: Parks, Recreation & Comm Svcs / Park & Rec-Janet Goeske Cent101 - 521000
Department Budget Detail
%Chnge16/17 vs 17/182017/182017/18
AmendedAdoptedAdopted2016/17
AmendedActualActual2016/172015/162014/15GL KeyObject Description
-25,00025,000 25,00026,96814,862422200 Electric5210000 16,036
-0 006,0017,643Water5210000422500 0
-0 002,1673,518Other Utilities5210000422600 0
-25,00026,96825,000 25,000Non-personnel Expenses Total 23,03127,197
-378,590378,590 378,590378,590376,392450129 Janet Goeske Center5210000 378,590
-378,590378,590378,590 378,590Special Projects Total 376,392378,590
(100.0)%0 8,283000General Fund Allocation Chgs5210000881100 0
(100.0) %0 8,283Charges From Others Total 0000
(2.0) %403,590 411,873403,590405,558399,424405,787Total Budget Requirements
CCReport Name: 2017_Mid_Cycle_Report
Report Description: Budget Book - Department Budget Detail wMD
06/07/2017Date:
Time: 191
Version:
Page:19:21:28

Department / Section: Parks, Recreation & Comm Svcs / Park & Recreation-Parks101 - 521500
Department Budget Detail
%Chnge16/17 vs 17/182017/182017/18
AmendedAdoptedAdopted2016/17
AmendedActualActual2016/172015/162014/15GL KeyObject Description
(1.5) %1,717,3901,691,518 1,717,3901,691,5181,403,041411100 Salaries - Regular5215000 1,222,846
(4.9) %195,931186,303 195,618186,303113,821411110 Salaries-Temp & Part Time5215000 128,747
-0 0017,27918,859Compensatory Time5215000411130 0
-0 00107,37489,412Vacation5215000411210 0
-0 0066,54562,903Holidays & Special Days Off5215000411220 0
-0 00400Rest Time Pay - IBEW5215000411225 0
-0 0057,54055,584Sick Leave5215000411240 0
-0 0016,1229,113Family Illness Sick Leave5215000411245 0
-0 001660Industrial Accident5215000411250 0
-0 004,9311,222Bereavement Leave5215000411260 0
-0 00382351Jury Duty5215000411280 0
-0 0013,1357,921Administrative Leave5215000411292 0
-0 00510Night Shift Premium5215000411310 0
-0 003,4171,524Vacation Payoffs5215000411410 0
-0 001590Sick Leave Payoff5215000411420 0
-0 001480Compensatory Time Payoff5215000411430 0
(3.2) %10,73810,390 10,73810,390(80,766)411510 Accrued Payroll5215000 25,474
(1.8) %49,93149,011 49,93149,01153,416412210 Workers Compensation Ins5215000 57,408
(4.3) %317,413303,519 317,413303,519266,755412220 Health Insurance5215000 216,629
( .7) %13,04012,936 13,04012,93611,816412222 Dental Insurance5215000 10,038
( .7) %3,2633,240 3,2633,2403,223412230 Life Insurance5215000 2,404
(2.0) %1,0691,047 1,0691,0471,065412240 Unemployment Insurance5215000 1,267
-3,2643,264 3,2643,2643,127412250 Disability Insurance5215000 3,012
(7.6) %504,803466,050 504,803466,050424,013412310 PERS Retirement5215000 372,925
(1.4) %24,49224,135 24,49224,13525,692412320 Medicare OASDI5215000 24,279
(4.7) %7,3366,987 7,3366,9873,603412330 City Retirement Plan5215000 3,682
(20.0) %7,5006,000 7,5006,0004,104412400 Deferred Compensation5215000 2,033
-26,75226,752 26,75226,75220,635413110 Overtime At Straight Rate5215000 19,535
-73,63573,635 73,63573,63543,123413120 Overtime At 1.5 Rate5215000 60,679
-4,9544,954 4,9544,9542,637413130 Overtime At Double Time Rate5215000 3,896
-0 00046Holiday O/T-Straight/Non-Sched5215000413210 0
-0 00204504Holiday O/T-Strt/Subj To Retir5215000413230 0
-0 0073212O/T 1.5 Rate Sub To Retirement5215000413240 0
-0 00320Dbl Time Subj To Retirement5215000413250 0
(100.0)%0 84,070000Ptr. Comp. Model5215000419996 0
(5.7) %3,045,5812,869,7412,869,741 2,961,198Personnel Services Total 2,586,9192,402,518
-699,808699,808 699,808778,395778,355421000 Professional Services5215000 762,686
-0 004,311104,991Prof Services/Internal5215000421001 0
-0 00(221)0Recreational Services5215000421040 0
-2,570,4212,570,421 2,570,4212,571,5022,135,262421204 Neighborhood Maint Contract5215000 2,020,617
-47,50047,500 47,50051,73286,282421205 Tree Maintenance Contract5215000 267,139
-14,00014,000 14,00014,00019,610422100 Telephone5215000 14,981
-17,60017,600 17,60017,60020,796422120 Telephone - Cellular5215000 16,140
-1,194,2291,194,229 1,194,2291,194,2291,149,058422200 Electric5215000 1,151,470
-99,96599,965 99,96599,96584,825422300 Gas5215000 77,949
-771,703771,703 771,703775,503814,706422500 Water5215000 1,146,150
CCReport Name: 2017_Mid_Cycle_Report
Report Description: Budget Book - Department Budget Detail wMD
06/07/2017Date:
Time: 192
Version:
Page:19:21:28

Department / Section: Parks, Recreation & Comm Svcs / Park & Recreation-Parks101 - 521500
Department Budget Detail
%Chnge16/17 vs 17/182017/182017/18
AmendedAdoptedAdopted2016/17
AmendedActualActual2016/172015/162014/15GL KeyObject Description
-36,04736,047 36,04736,0479,234422600 Other Utilities5215000 23,051
-242,700242,700 242,700242,700132,063422700 Refuse/Disposal Fees5215000 153,401
-5,0005,000 5,0005,0007,551423100 Equipment Rental5215000 0
(2.9) %271,250263,350 271,250263,350293,138423400 Motor Pool Equipment Rental5215000 281,714
-587,147587,147 587,147603,686656,001424130 Maint/Repair of Bldgs & Improv5215000 771,384
-0 00162,1045,526Maintenance & Repair - General5215000424200 0
-10,00010,000 10,00010,00010,134424220 All Other Equip Maint/Repair5215000 6,350
(2.8) %77,20075,000 77,20075,00053,345424230 Central Garage Charges5215000 51,821
-1,7001,700 1,7001,7001,634425200 Periodicals & Dues5215000 1,321
-5,0005,000 5,0005,0003,882425400 General Office Expense5215000 12,064
-0 001039Postage5215000425500 0
-500 50050000Central Printing Charges5215000425600 500
-0 0058909Outside Printing Expense5215000425610 0
-4,0004,000 4,0004,0001,442425800 Computer Equip Purc Undr $50005215000 2,381
-24,50024,500 24,50024,50029,559426100 Janitorial Supplies5215000 42,134
-50,00050,000 50,00050,00020,333426200 Clothing/Linen/Safety Supplies5215000 32,155
(2.9) %15,76015,300 15,76015,30019,810426300 Motor Fuels & Lubricants5215000 16,827
-0 00057Recreation Supplies5215000426500 0
-10,00010,000 10,00010,0007,783426600 Chemical Supplies5215000 13,681
-5,0005,000 5,0005,0005,530426700 Maintenance Tools/Supplies5215000 858
-3,4503,450 3,4503,4503,600426710 Work Boot Reimbursement5215000 3,600
-5,5005,500 5,5005,50010,169426800 Special Department Supplies5215000 10,888
-0 006772,396Adopt-A-Park9863600426800 0
-0 005190Travel & Meeting Expense5215000427100 0
-14,50014,500 14,50014,50020,207427200 Training5215000 10,856
(1.8) %53,17852,202 53,17852,20251,699428400 Liability Insurance5215000 59,943
-49 49000Taxes And Assessments5215000447100 49
( .1) %6,837,7076,930,3626,826,171 6,837,707Non-personnel Expenses Total 6,593,4807,065,493
-6,5006,500 6,5006,5001,846450014 Live Steamers5215000 6,342
42.8%(10,000) (7,000)01,950720Weekend Prisoner Program5215000450016 (7,000)
-0 030,34600Sycamore Park Maintenance5215000450073 0
-80,00080,000 80,00080,00080,000450082 RCC Aquatics Complex5215000 0
(3.7) %79,500116,84676,500 79,500Special Projects Total 83,7967,063
-0 00045Automotive Equipment5215000462100 0
-0 0Equipment Outlay Total 00045
-0 00041,734Bryant Park Improvements9141300440120 0
-0 0000Reid Park-Pool Gate Install.9248700440120 0
-0 0009,865Villegas Pk-Pool Gate Install9249000440120 0
-00 0110,32899,218440120 Arlington Park Imp Proj9249300 144
-0 0181,895030,673Bryant Park Improvements9252200440120 0
-0 017,089026,910Dales Senior Center HVAC9252300440120 0
-0 00069,999HVAC Cesar Chavez9252400440120 0
-0 0000Fairmount ADA Boat Launch9254500440120 0
-0 00050,000Cesar Chavez CC Classrm Refurb9254900440120 0
-0 050,00000Bryant Park Tennis&Basketball9256700440120 0
CCReport Name: 2017_Mid_Cycle_Report
Report Description: Budget Book - Department Budget Detail wMD
06/07/2017Date:
Time: 193
Version:
Page:19:21:28
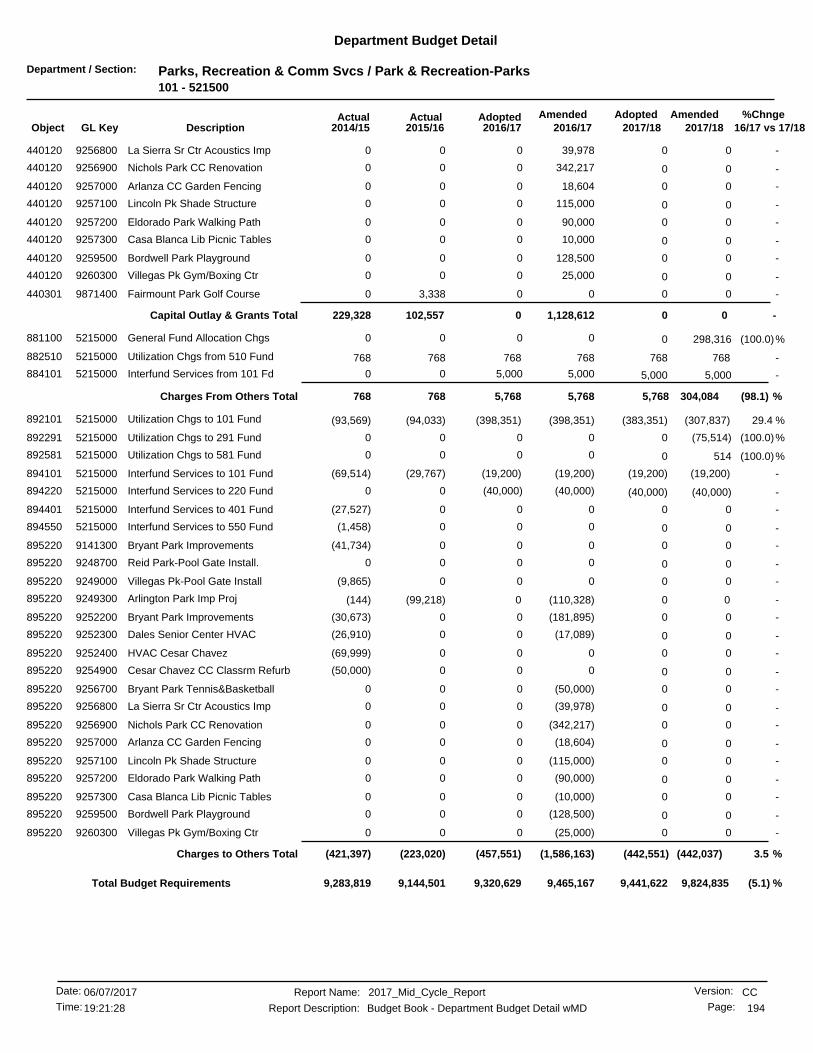
Department / Section: Parks, Recreation & Comm Svcs / Park & Recreation-Parks101 - 521500
Department Budget Detail
%Chnge16/17 vs 17/182017/182017/18
AmendedAdoptedAdopted2016/17
AmendedActualActual2016/172015/162014/15GL KeyObject Description
-0 039,97800La Sierra Sr Ctr Acoustics Imp9256800440120 0
-0 0342,21700Nichols Park CC Renovation9256900440120 0
-0 018,60400Arlanza CC Garden Fencing9257000440120 0
-0 0115,00000Lincoln Pk Shade Structure9257100440120 0
-0 090,00000Eldorado Park Walking Path9257200440120 0
-0 010,00000Casa Blanca Lib Picnic Tables9257300440120 0
-0 0128,50000Bordwell Park Playground9259500440120 0
-0 025,00000Villegas Pk Gym/Boxing Ctr9260300440120 0
-0 003,3380Fairmount Park Golf Course9871400440301 0
-0 0Capital Outlay & Grants Total 01,128,612102,557229,328
(100.0)%0 298,316000General Fund Allocation Chgs5215000881100 0
-768768 768768768882510 Utilization Chgs from 510 Fund5215000 768
-5,000 5,0005,00000Interfund Services from 101 Fd5215000884101 5,000
(98.1) %304,0845,7685,768 5,768Charges From Others Total 768768
29.4 %(307,837)(398,351) (383,351)(398,351)(94,033)892101 Utilization Chgs to 101 Fund5215000 (93,569)
(100.0)%0 (75,514)000Utilization Chgs to 291 Fund5215000892291 0
(100.0)%0 514000Utilization Chgs to 581 Fund5215000892581 0
-(19,200)(19,200) (19,200)(19,200)(29,767)894101 Interfund Services to 101 Fund5215000 (69,514)
-(40,000) (40,000)(40,000)00Interfund Services to 220 Fund5215000894220 (40,000)
-0 000(27,527)Interfund Services to 401 Fund5215000894401 0
-0 000(1,458)Interfund Services to 550 Fund5215000894550 0
-0 000(41,734)Bryant Park Improvements9141300895220 0
-0 0000Reid Park-Pool Gate Install.9248700895220 0
-0 000(9,865)Villegas Pk-Pool Gate Install9249000895220 0
-00 0(110,328)(99,218)895220 Arlington Park Imp Proj9249300 (144)
-0 0(181,895)0(30,673)Bryant Park Improvements9252200895220 0
-0 0(17,089)0(26,910)Dales Senior Center HVAC9252300895220 0
-0 000(69,999)HVAC Cesar Chavez9252400895220 0
-0 000(50,000)Cesar Chavez CC Classrm Refurb9254900895220 0
-0 0(50,000)00Bryant Park Tennis&Basketball9256700895220 0
-0 0(39,978)00La Sierra Sr Ctr Acoustics Imp9256800895220 0
-0 0(342,217)00Nichols Park CC Renovation9256900895220 0
-0 0(18,604)00Arlanza CC Garden Fencing9257000895220 0
-0 0(115,000)00Lincoln Pk Shade Structure9257100895220 0
-0 0(90,000)00Eldorado Park Walking Path9257200895220 0
-0 0(10,000)00Casa Blanca Lib Picnic Tables9257300895220 0
-0 0(128,500)00Bordwell Park Playground9259500895220 0
-0 0(25,000)00Villegas Pk Gym/Boxing Ctr9260300895220 0
3.5 %(442,037)(1,586,163)(457,551) (442,551)Charges to Others Total (223,020)(421,397)
(5.1) %9,320,629 9,824,8359,441,6229,465,1679,144,5019,283,819Total Budget Requirements
CCReport Name: 2017_Mid_Cycle_Report
Report Description: Budget Book - Department Budget Detail wMD
06/07/2017Date:
Time: 194
Version:
Page:19:21:28

Department / Section: Parks, Recreation & Comm Svcs / Park & Rec-Parks-Street Tree101 - 521510
Department Budget Detail
%Chnge16/17 vs 17/182017/182017/18
AmendedAdoptedAdopted2016/17
AmendedActualActual2016/172015/162014/15GL KeyObject Description
-0 001,0560Maint/Repair of Bldgs & Improv5215100424130 0
-0 001,2790Janitorial Supplies5215100426100 0
-0 0Non-personnel Expenses Total 002,3350
-00 002,335Total Budget Requirements 0
CCReport Name: 2017_Mid_Cycle_Report
Report Description: Budget Book - Department Budget Detail wMD
06/07/2017Date:
Time: 195
Version:
Page:19:21:28
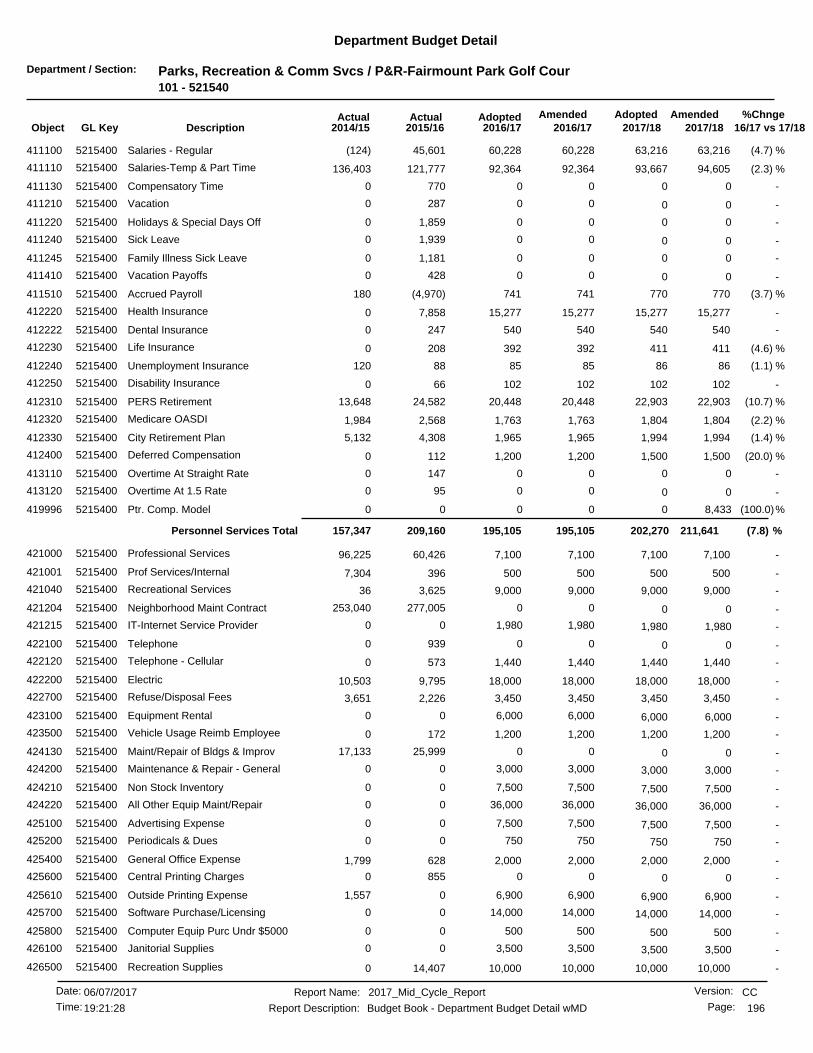
Department / Section: Parks, Recreation & Comm Svcs / P&R-Fairmount Park Golf Cour101 - 521540
Department Budget Detail
%Chnge16/17 vs 17/182017/182017/18
AmendedAdoptedAdopted2016/17
AmendedActualActual2016/172015/162014/15GL KeyObject Description
(4.7) %63,21660,228 63,21660,22845,601411100 Salaries - Regular5215400 (124)
(2.3) %94,60592,364 93,66792,364121,777411110 Salaries-Temp & Part Time5215400 136,403
-0 007700Compensatory Time5215400411130 0
-0 002870Vacation5215400411210 0
-0 001,8590Holidays & Special Days Off5215400411220 0
-0 001,9390Sick Leave5215400411240 0
-0 001,1810Family Illness Sick Leave5215400411245 0
-0 004280Vacation Payoffs5215400411410 0
(3.7) %770741 770741(4,970)411510 Accrued Payroll5215400 180
-15,27715,277 15,27715,2777,858412220 Health Insurance5215400 0
-540540 540540247412222 Dental Insurance5215400 0
(4.6) %411392 411392208412230 Life Insurance5215400 0
(1.1) %8685 868588412240 Unemployment Insurance5215400 120
-102102 10210266412250 Disability Insurance5215400 0
(10.7) %22,90320,448 22,90320,44824,582412310 PERS Retirement5215400 13,648
(2.2) %1,8041,763 1,8041,7632,568412320 Medicare OASDI5215400 1,984
(1.4) %1,9941,965 1,9941,9654,308412330 City Retirement Plan5215400 5,132
(20.0) %1,5001,200 1,5001,200112412400 Deferred Compensation5215400 0
-0 001470Overtime At Straight Rate5215400413110 0
-0 00950Overtime At 1.5 Rate5215400413120 0
(100.0)%0 8,433000Ptr. Comp. Model5215400419996 0
(7.8) %211,641195,105195,105 202,270Personnel Services Total 209,160157,347
-7,1007,100 7,1007,10060,426421000 Professional Services5215400 96,225
-500500 500500396421001 Prof Services/Internal5215400 7,304
-9,0009,000 9,0009,0003,625421040 Recreational Services5215400 36
-0 00277,005253,040Neighborhood Maint Contract5215400421204 0
-1,980 1,9801,98000IT-Internet Service Provider5215400421215 1,980
-0 009390Telephone5215400422100 0
-1,4401,440 1,4401,440573422120 Telephone - Cellular5215400 0
-18,00018,000 18,00018,0009,795422200 Electric5215400 10,503
-3,4503,450 3,4503,4502,226422700 Refuse/Disposal Fees5215400 3,651
-6,000 6,0006,00000Equipment Rental5215400423100 6,000
-1,2001,200 1,2001,200172423500 Vehicle Usage Reimb Employee5215400 0
-0 0025,99917,133Maint/Repair of Bldgs & Improv5215400424130 0
-3,000 3,0003,00000Maintenance & Repair - General5215400424200 3,000
-7,500 7,5007,50000Non Stock Inventory5215400424210 7,500
-36,000 36,00036,00000All Other Equip Maint/Repair5215400424220 36,000
-7,500 7,5007,50000Advertising Expense5215400425100 7,500
-750 75075000Periodicals & Dues5215400425200 750
-2,0002,000 2,0002,000628425400 General Office Expense5215400 1,799
-0 008550Central Printing Charges5215400425600 0
-6,900 6,9006,90001,557Outside Printing Expense5215400425610 6,900
-14,000 14,00014,00000Software Purchase/Licensing5215400425700 14,000
-500 50050000Computer Equip Purc Undr $50005215400425800 500
-3,500 3,5003,50000Janitorial Supplies5215400426100 3,500
-10,00010,000 10,00010,00014,407426500 Recreation Supplies5215400 0
CCReport Name: 2017_Mid_Cycle_Report
Report Description: Budget Book - Department Budget Detail wMD
06/07/2017Date:
Time: 196
Version:
Page:19:21:28

Department / Section: Parks, Recreation & Comm Svcs / P&R-Fairmount Park Golf Cour101 - 521540
Department Budget Detail
%Chnge16/17 vs 17/182017/182017/18
AmendedAdoptedAdopted2016/17
AmendedActualActual2016/172015/162014/15GL KeyObject Description
-20,50020,500 20,50020,500144426800 Special Department Supplies5215400 0
-915 91591500Travel & Meeting Expense5215400427100 915
-2,3002,300 2,3002,300125427200 Training5215400 0
-20,000 20,00020,00000Purch of Souvenirs for Resale5215400447500 20,000
-184,035184,035184,035 184,035Non-personnel Expenses Total 397,322391,253
-15,000 15,00015,00000Machine and Equipment5215400462200 15,000
-2,500 2,5002,50000Off Furn & Eq/Computer Acqustn5215400462308 2,500
-17,500 17,500Equipment Outlay Total 17,50017,50000
(100.0)%0 9,093000General Fund Allocation Chgs5215400881100 0
-285,000 285,000285,00000Utilization Chgs from 101 Fund5215400882101 285,000
(3.0) %285,000 294,093Charges From Others Total 285,000285,00000
-0 00(820)(592)Interfund Services to 101 Fund5215400894101 0
-0 0Charges to Others Total 00(820)(592)
(3.6) %681,640 707,269688,805681,640605,663548,008Total Budget Requirements
CCReport Name: 2017_Mid_Cycle_Report
Report Description: Budget Book - Department Budget Detail wMD
06/07/2017Date:
Time: 197
Version:
Page:19:21:28
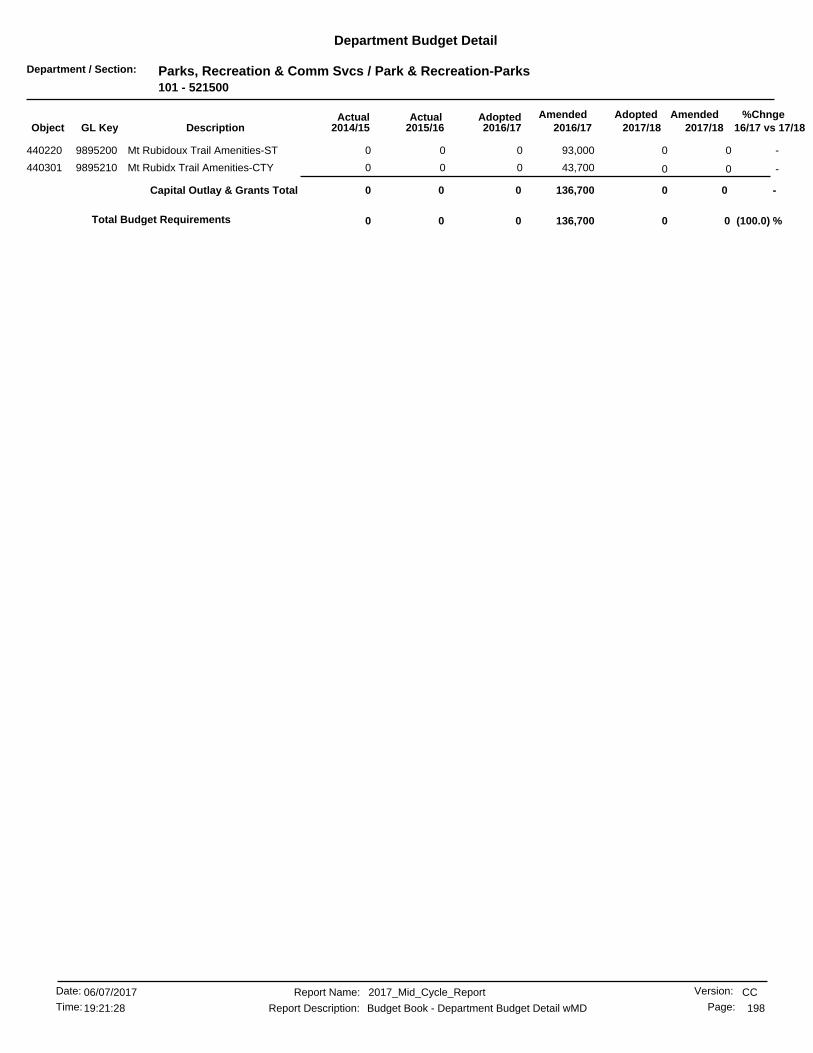
Department / Section: Parks, Recreation & Comm Svcs / Park & Recreation-Parks101 - 521500
Department Budget Detail
%Chnge16/17 vs 17/182017/182017/18
AmendedAdoptedAdopted2016/17
AmendedActualActual2016/172015/162014/15GL KeyObject Description
-0 093,00000Mt Rubidoux Trail Amenities-ST9895200440220 0
-0 043,70000Mt Rubidx Trail Amenities-CTY9895210440301 0
-0 0Capital Outlay & Grants Total 0136,70000
(100.0) %00 0136,7000Total Budget Requirements 0
CCReport Name: 2017_Mid_Cycle_Report
Report Description: Budget Book - Department Budget Detail wMD
06/07/2017Date:
Time: 198
Version:
Page:19:21:28
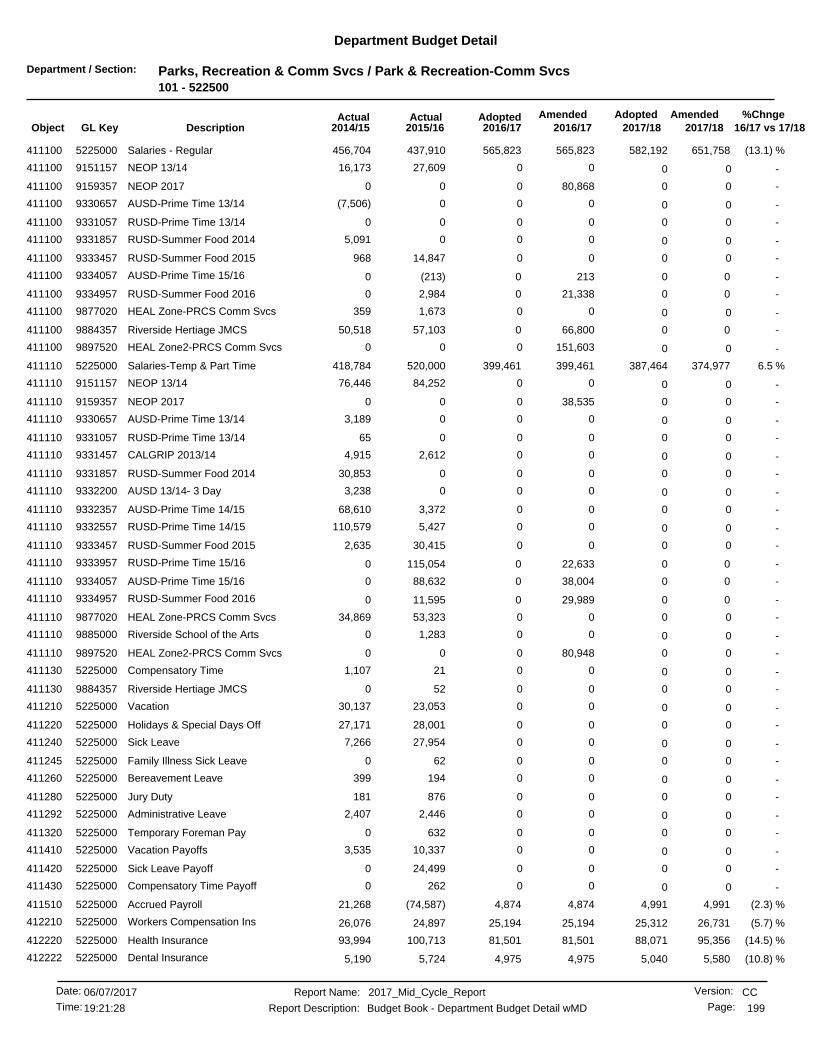
Department / Section: Parks, Recreation & Comm Svcs / Park & Recreation-Comm Svcs101 - 522500
Department Budget Detail
%Chnge16/17 vs 17/182017/182017/18
AmendedAdoptedAdopted2016/17
AmendedActualActual2016/172015/162014/15GL KeyObject Description
(13.1) %651,758565,823 582,192565,823437,910411100 Salaries - Regular5225000 456,704
-0 0027,60916,173NEOP 13/149151157411100 0
-0 080,86800NEOP 20179159357411100 0
-0 000(7,506)AUSD-Prime Time 13/149330657411100 0
-0 0000RUSD-Prime Time 13/149331057411100 0
-0 0005,091RUSD-Summer Food 20149331857411100 0
-0 0014,847968RUSD-Summer Food 20159333457411100 0
-00 0213(213)411100 AUSD-Prime Time 15/169334057 0
-00 021,3382,984411100 RUSD-Summer Food 20169334957 0
-0 001,673359HEAL Zone-PRCS Comm Svcs9877020411100 0
-00 066,80057,103411100 Riverside Hertiage JMCS9884357 50,518
-0 0151,60300HEAL Zone2-PRCS Comm Svcs9897520411100 0
6.5 %374,977399,461 387,464399,461520,000411110 Salaries-Temp & Part Time5225000 418,784
-0 0084,25276,446NEOP 13/149151157411110 0
-0 038,53500NEOP 20179159357411110 0
-0 0003,189AUSD-Prime Time 13/149330657411110 0
-0 00065RUSD-Prime Time 13/149331057411110 0
-0 002,6124,915CALGRIP 2013/149331457411110 0
-0 00030,853RUSD-Summer Food 20149331857411110 0
-0 0003,238AUSD 13/14- 3 Day9332200411110 0
-0 003,37268,610AUSD-Prime Time 14/159332357411110 0
-0 005,427110,579RUSD-Prime Time 14/159332557411110 0
-0 0030,4152,635RUSD-Summer Food 20159333457411110 0
-00 022,633115,054411110 RUSD-Prime Time 15/169333957 0
-00 038,00488,632411110 AUSD-Prime Time 15/169334057 0
-00 029,98911,595411110 RUSD-Summer Food 20169334957 0
-0 0053,32334,869HEAL Zone-PRCS Comm Svcs9877020411110 0
-0 001,2830Riverside School of the Arts9885000411110 0
-0 080,94800HEAL Zone2-PRCS Comm Svcs9897520411110 0
-0 00211,107Compensatory Time5225000411130 0
-0 00520Riverside Hertiage JMCS9884357411130 0
-0 0023,05330,137Vacation5225000411210 0
-0 0028,00127,171Holidays & Special Days Off5225000411220 0
-0 0027,9547,266Sick Leave5225000411240 0
-0 00620Family Illness Sick Leave5225000411245 0
-0 00194399Bereavement Leave5225000411260 0
-0 00876181Jury Duty5225000411280 0
-0 002,4462,407Administrative Leave5225000411292 0
-0 006320Temporary Foreman Pay5225000411320 0
-0 0010,3373,535Vacation Payoffs5225000411410 0
-0 0024,4990Sick Leave Payoff5225000411420 0
-0 002620Compensatory Time Payoff5225000411430 0
(2.3) %4,9914,874 4,9914,874(74,587)411510 Accrued Payroll5225000 21,268
(5.7) %26,73125,194 25,31225,19424,897412210 Workers Compensation Ins5225000 26,076
(14.5) %95,35681,501 88,07181,501100,713412220 Health Insurance5225000 93,994
(10.8) %5,5804,975 5,0404,9755,724412222 Dental Insurance5225000 5,190
CCReport Name: 2017_Mid_Cycle_Report
Report Description: Budget Book - Department Budget Detail wMD
06/07/2017Date:
Time: 199
Version:
Page:19:21:28
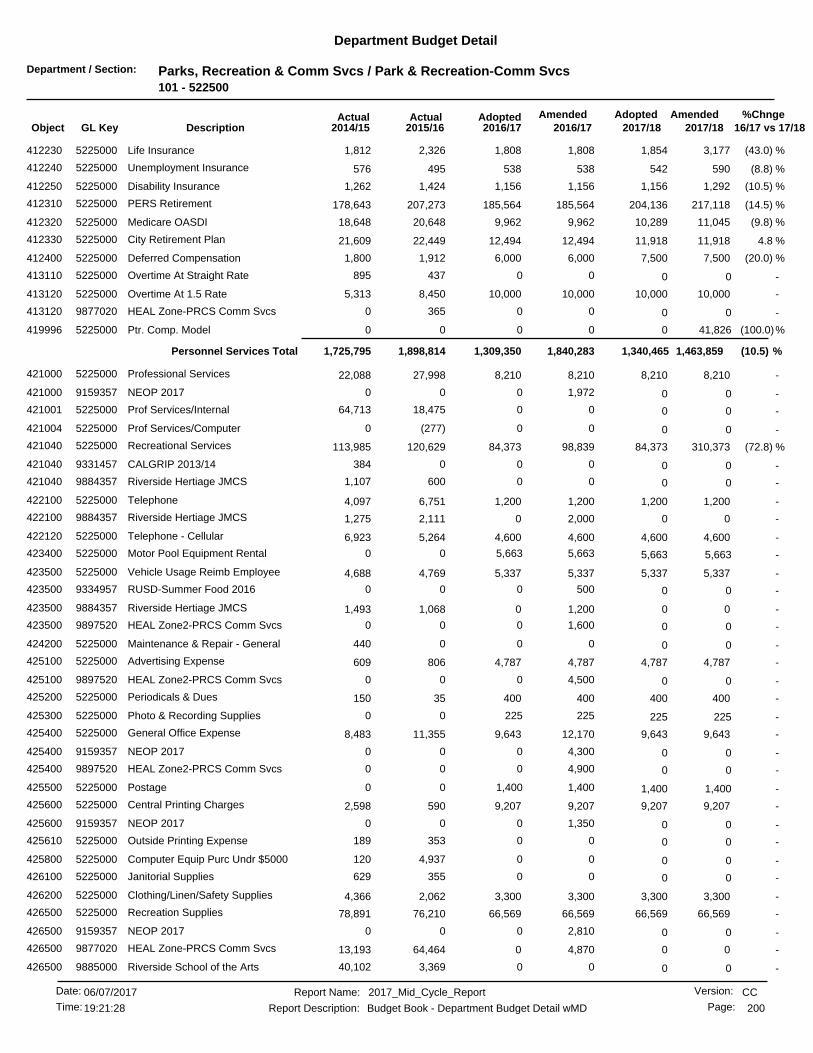
Department / Section: Parks, Recreation & Comm Svcs / Park & Recreation-Comm Svcs101 - 522500
Department Budget Detail
%Chnge16/17 vs 17/182017/182017/18
AmendedAdoptedAdopted2016/17
AmendedActualActual2016/172015/162014/15GL KeyObject Description
(43.0) %3,1771,808 1,8541,8082,326412230 Life Insurance5225000 1,812
(8.8) %590538 542538495412240 Unemployment Insurance5225000 576
(10.5) %1,2921,156 1,1561,1561,424412250 Disability Insurance5225000 1,262
(14.5) %217,118185,564 204,136185,564207,273412310 PERS Retirement5225000 178,643
(9.8) %11,0459,962 10,2899,96220,648412320 Medicare OASDI5225000 18,648
4.8 %11,91812,494 11,91812,49422,449412330 City Retirement Plan5225000 21,609
(20.0) %7,5006,000 7,5006,0001,912412400 Deferred Compensation5225000 1,800
-0 00437895Overtime At Straight Rate5225000413110 0
-10,00010,000 10,00010,0008,450413120 Overtime At 1.5 Rate5225000 5,313
-0 003650HEAL Zone-PRCS Comm Svcs9877020413120 0
(100.0)%0 41,826000Ptr. Comp. Model5225000419996 0
(10.5) %1,463,8591,840,2831,309,350 1,340,465Personnel Services Total 1,898,8141,725,795
-8,2108,210 8,2108,21027,998421000 Professional Services5225000 22,088
-0 01,97200NEOP 20179159357421000 0
-0 0018,47564,713Prof Services/Internal5225000421001 0
-0 00(277)0Prof Services/Computer5225000421004 0
(72.8) %310,37384,373 84,37398,839120,629421040 Recreational Services5225000 113,985
-0 000384CALGRIP 2013/149331457421040 0
-0 006001,107Riverside Hertiage JMCS9884357421040 0
-1,2001,200 1,2001,2006,751422100 Telephone5225000 4,097
-00 02,0002,111422100 Riverside Hertiage JMCS9884357 1,275
-4,6004,600 4,6004,6005,264422120 Telephone - Cellular5225000 6,923
-5,663 5,6635,66300Motor Pool Equipment Rental5225000423400 5,663
-5,3375,337 5,3375,3374,769423500 Vehicle Usage Reimb Employee5225000 4,688
-0 050000RUSD-Summer Food 20169334957423500 0
-00 01,2001,068423500 Riverside Hertiage JMCS9884357 1,493
-0 01,60000HEAL Zone2-PRCS Comm Svcs9897520423500 0
-0 000440Maintenance & Repair - General5225000424200 0
-4,7874,787 4,7874,787806425100 Advertising Expense5225000 609
-0 04,50000HEAL Zone2-PRCS Comm Svcs9897520425100 0
-400400 40040035425200 Periodicals & Dues5225000 150
-225 22522500Photo & Recording Supplies5225000425300 225
-9,6439,643 9,64312,17011,355425400 General Office Expense5225000 8,483
-0 04,30000NEOP 20179159357425400 0
-0 04,90000HEAL Zone2-PRCS Comm Svcs9897520425400 0
-1,400 1,4001,40000Postage5225000425500 1,400
-9,2079,207 9,2079,207590425600 Central Printing Charges5225000 2,598
-0 01,35000NEOP 20179159357425600 0
-0 00353189Outside Printing Expense5225000425610 0
-0 004,937120Computer Equip Purc Undr $50005225000425800 0
-0 00355629Janitorial Supplies5225000426100 0
-3,3003,300 3,3003,3002,062426200 Clothing/Linen/Safety Supplies5225000 4,366
-66,56966,569 66,56966,56976,210426500 Recreation Supplies5225000 78,891
-0 02,81000NEOP 20179159357426500 0
-00 04,87064,464426500 HEAL Zone-PRCS Comm Svcs9877020 13,193
-0 003,36940,102Riverside School of the Arts9885000426500 0
CCReport Name: 2017_Mid_Cycle_Report
Report Description: Budget Book - Department Budget Detail wMD
06/07/2017Date:
Time: 200
Version:
Page:19:21:28
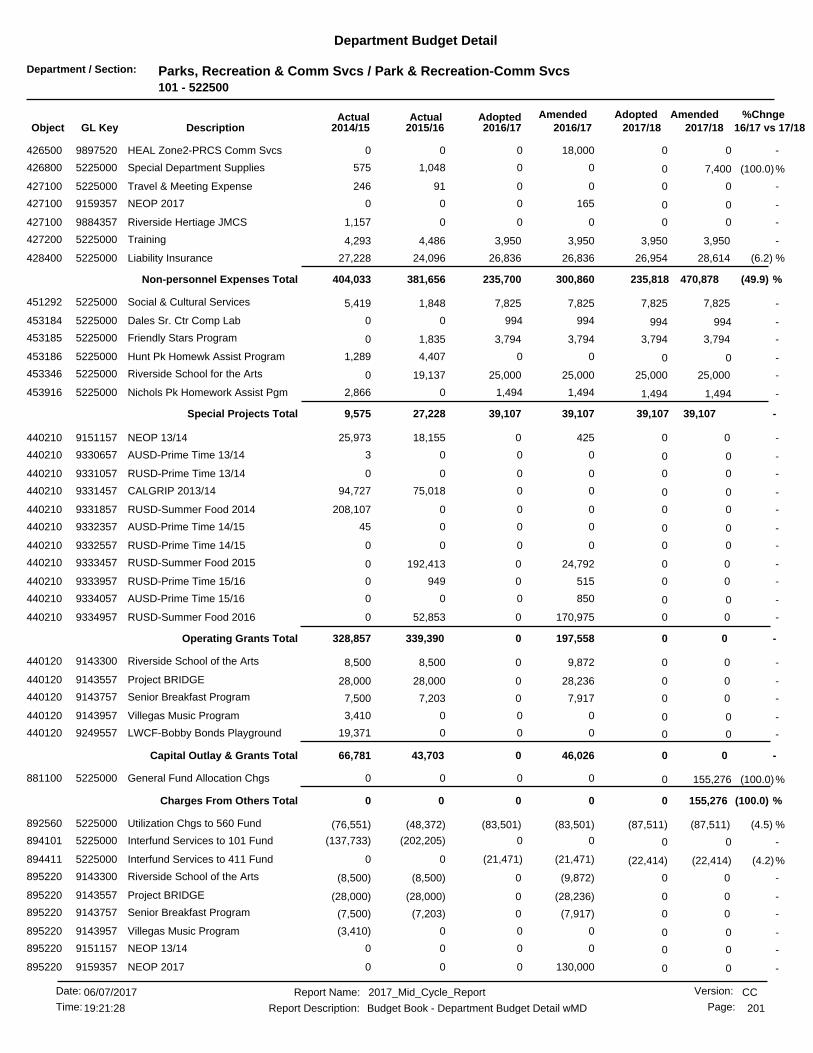
Department / Section: Parks, Recreation & Comm Svcs / Park & Recreation-Comm Svcs101 - 522500
Department Budget Detail
%Chnge16/17 vs 17/182017/182017/18
AmendedAdoptedAdopted2016/17
AmendedActualActual2016/172015/162014/15GL KeyObject Description
-0 018,00000HEAL Zone2-PRCS Comm Svcs9897520426500 0
(100.0)%0 7,40001,048575Special Department Supplies5225000426800 0
-0 0091246Travel & Meeting Expense5225000427100 0
-0 016500NEOP 20179159357427100 0
-0 0001,157Riverside Hertiage JMCS9884357427100 0
-3,9503,950 3,9503,9504,486427200 Training5225000 4,293
(6.2) %28,61426,836 26,95426,83624,096428400 Liability Insurance5225000 27,228
(49.9) %470,878300,860235,700 235,818Non-personnel Expenses Total 381,656404,033
-7,8257,825 7,8257,8251,848451292 Social & Cultural Services5225000 5,419
-994 99499400Dales Sr. Ctr Comp Lab5225000453184 994
-3,7943,794 3,7943,7941,835453185 Friendly Stars Program5225000 0
-0 004,4071,289Hunt Pk Homewk Assist Program5225000453186 0
-25,00025,000 25,00025,00019,137453346 Riverside School for the Arts5225000 0
-1,494 1,4941,49402,866Nichols Pk Homework Assist Pgm5225000453916 1,494
-39,10739,10739,107 39,107Special Projects Total 27,2289,575
-00 042518,155440210 NEOP 13/149151157 25,973
-0 0003AUSD-Prime Time 13/149330657440210 0
-0 0000RUSD-Prime Time 13/149331057440210 0
-0 0075,01894,727CALGRIP 2013/149331457440210 0
-0 000208,107RUSD-Summer Food 20149331857440210 0
-0 00045AUSD-Prime Time 14/159332357440210 0
-0 0000RUSD-Prime Time 14/159332557440210 0
-00 024,792192,413440210 RUSD-Summer Food 20159333457 0
-00 0515949440210 RUSD-Prime Time 15/169333957 0
-0 085000AUSD-Prime Time 15/169334057440210 0
-00 0170,97552,853440210 RUSD-Summer Food 20169334957 0
-0 0Operating Grants Total 0197,558339,390328,857
-00 09,8728,500440120 Riverside School of the Arts9143300 8,500
-00 028,23628,000440120 Project BRIDGE9143557 28,000
-00 07,9177,203440120 Senior Breakfast Program9143757 7,500
-0 0003,410Villegas Music Program9143957440120 0
-0 00019,371LWCF-Bobby Bonds Playground9249557440120 0
-0 0Capital Outlay & Grants Total 046,02643,70366,781
(100.0)%0 155,276000General Fund Allocation Chgs5225000881100 0
(100.0) %0 155,276Charges From Others Total 0000
(4.5) %(87,511)(83,501) (87,511)(83,501)(48,372)892560 Utilization Chgs to 560 Fund5225000 (76,551)
-0 00(202,205)(137,733)Interfund Services to 101 Fund5225000894101 0
(4.2)%(21,471) (22,414)(21,471)00Interfund Services to 411 Fund5225000894411 (22,414)
-00 0(9,872)(8,500)895220 Riverside School of the Arts9143300 (8,500)
-00 0(28,236)(28,000)895220 Project BRIDGE9143557 (28,000)
-00 0(7,917)(7,203)895220 Senior Breakfast Program9143757 (7,500)
-0 000(3,410)Villegas Music Program9143957895220 0
-0 0000NEOP 13/149151157895220 0
-0 0130,00000NEOP 20179159357895220 0
CCReport Name: 2017_Mid_Cycle_Report
Report Description: Budget Book - Department Budget Detail wMD
06/07/2017Date:
Time: 201
Version:
Page:19:21:28

Department / Section: Parks, Recreation & Comm Svcs / Park & Recreation-Comm Svcs101 - 522500
Department Budget Detail
%Chnge16/17 vs 17/182017/182017/18
AmendedAdoptedAdopted2016/17
AmendedActualActual2016/172015/162014/15GL KeyObject Description
-0 00(126,744)(116,085)NEOP 13/149151157895223 0
(4.5) %(109,925)(20,998)(104,972) (109,925)Charges to Others Total (421,027)(377,780)
(26.7) %1,479,185 2,019,1951,505,4652,402,8382,269,7662,157,262Total Budget Requirements
CCReport Name: 2017_Mid_Cycle_Report
Report Description: Budget Book - Department Budget Detail wMD
06/07/2017Date:
Time: 202
Version:
Page:19:21:28

Department / Section: Parks, Recreation & Comm Svcs / Park & Rec-Debt101 - 529000
Department Budget Detail
%Chnge16/17 vs 17/182017/182017/18
AmendedAdoptedAdopted2016/17
AmendedActualActual2016/172015/162014/15GL KeyObject Description
-04,133,893 4,135,4794,133,8934,267,414882101 Utilization Chgs from 101 Fund5290000 4,255,164
(100.0)%0 4,048,128000Utilization Chgs from 390 Fund5290000882390 0
2.1 %4,048,1284,133,8934,133,893 4,135,479Charges From Others Total 4,267,4144,255,164
-(1,100,000)(1,100,000) (1,100,000)(1,100,000)(1,099,999)892411 Utilization Chgs to 411 Fund5290000 (1,625,000)
-(1,100,000)(1,100,000)(1,100,000) (1,100,000)Charges to Others Total (1,099,999)(1,625,000)
2.9 %3,033,893 2,948,1283,035,4793,033,8933,167,4152,630,163Total Budget Requirements
CCReport Name: 2017_Mid_Cycle_Report
Report Description: Budget Book - Department Budget Detail wMD
06/07/2017Date:
Time: 203
Version:
Page:19:21:28

Department / Section: Parks, Recreation & Comm Svcs / PR-Managed Savings101 - 529900
Department Budget Detail
%Chnge16/17 vs 17/182017/182017/18
AmendedAdoptedAdopted2016/17
AmendedActualActual2016/172015/162014/15GL KeyObject Description
-(400,000) (400,000)(400,000)00Managed Savings Allocation5299000499999 (400,000)
-(400,000) (400,000)Managed Savings Total (400,000)(400,000)00
-(400,000)(400,000) (400,000)(400,000)0Total Budget Requirements 0
CCReport Name: 2017_Mid_Cycle_Report
Report Description: Budget Book - Department Budget Detail wMD
06/07/2017Date:
Time: 204
Version:
Page:19:21:28
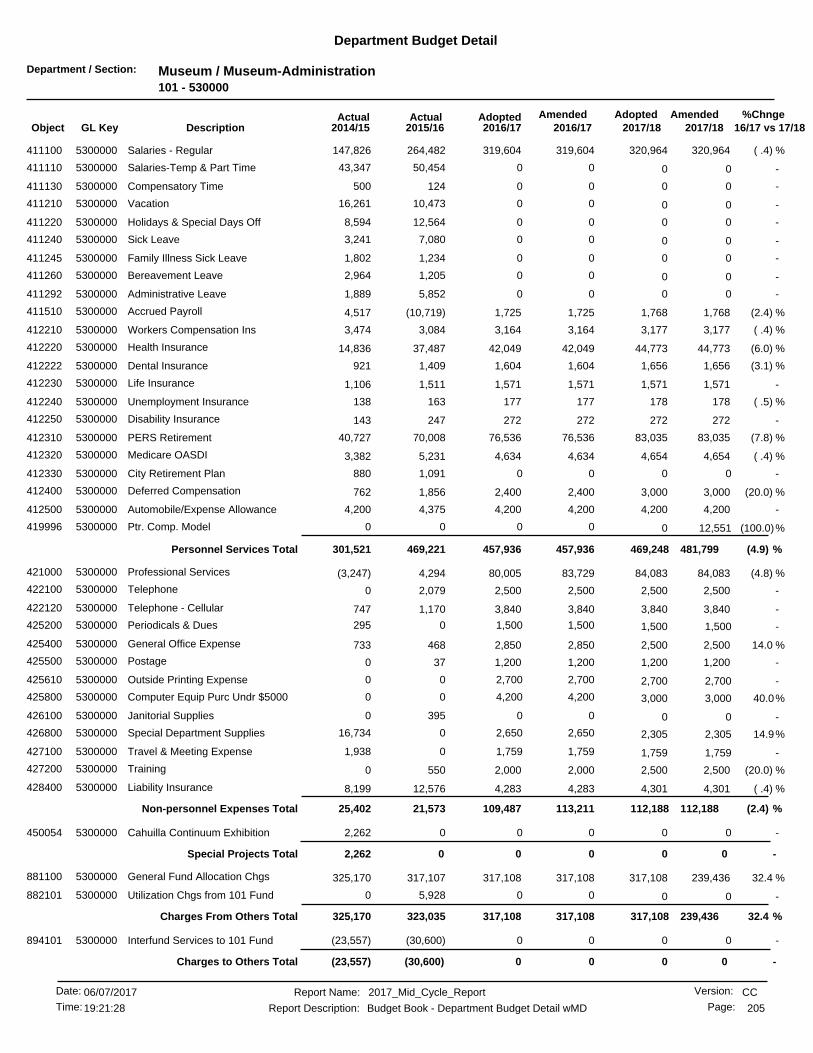
Department / Section: Museum / Museum-Administration101 - 530000
Department Budget Detail
%Chnge16/17 vs 17/182017/182017/18
AmendedAdoptedAdopted2016/17
AmendedActualActual2016/172015/162014/15GL KeyObject Description
( .4) %320,964319,604 320,964319,604264,482411100 Salaries - Regular5300000 147,826
-0 0050,45443,347Salaries-Temp & Part Time5300000411110 0
-0 00124500Compensatory Time5300000411130 0
-0 0010,47316,261Vacation5300000411210 0
-0 0012,5648,594Holidays & Special Days Off5300000411220 0
-0 007,0803,241Sick Leave5300000411240 0
-0 001,2341,802Family Illness Sick Leave5300000411245 0
-0 001,2052,964Bereavement Leave5300000411260 0
-0 005,8521,889Administrative Leave5300000411292 0
(2.4) %1,7681,725 1,7681,725(10,719)411510 Accrued Payroll5300000 4,517
( .4) %3,1773,164 3,1773,1643,084412210 Workers Compensation Ins5300000 3,474
(6.0) %44,77342,049 44,77342,04937,487412220 Health Insurance5300000 14,836
(3.1) %1,6561,604 1,6561,6041,409412222 Dental Insurance5300000 921
-1,5711,571 1,5711,5711,511412230 Life Insurance5300000 1,106
( .5) %178177 178177163412240 Unemployment Insurance5300000 138
-272272 272272247412250 Disability Insurance5300000 143
(7.8) %83,03576,536 83,03576,53670,008412310 PERS Retirement5300000 40,727
( .4) %4,6544,634 4,6544,6345,231412320 Medicare OASDI5300000 3,382
-0 001,091880City Retirement Plan5300000412330 0
(20.0) %3,0002,400 3,0002,4001,856412400 Deferred Compensation5300000 762
-4,2004,200 4,2004,2004,375412500 Automobile/Expense Allowance5300000 4,200
(100.0)%0 12,551000Ptr. Comp. Model5300000419996 0
(4.9) %481,799457,936457,936 469,248Personnel Services Total 469,221301,521
(4.8) %84,08380,005 84,08383,7294,294421000 Professional Services5300000 (3,247)
-2,5002,500 2,5002,5002,079422100 Telephone5300000 0
-3,8403,840 3,8403,8401,170422120 Telephone - Cellular5300000 747
-1,500 1,5001,5000295Periodicals & Dues5300000425200 1,500
14.0 %2,5002,850 2,5002,850468425400 General Office Expense5300000 733
-1,2001,200 1,2001,20037425500 Postage5300000 0
-2,700 2,7002,70000Outside Printing Expense5300000425610 2,700
40.0%4,200 3,0004,20000Computer Equip Purc Undr $50005300000425800 3,000
-0 003950Janitorial Supplies5300000426100 0
14.9%2,650 2,3052,650016,734Special Department Supplies5300000426800 2,305
-1,759 1,7591,75901,938Travel & Meeting Expense5300000427100 1,759
(20.0) %2,5002,000 2,5002,000550427200 Training5300000 0
( .4) %4,3014,283 4,3014,28312,576428400 Liability Insurance5300000 8,199
(2.4) %112,188113,211109,487 112,188Non-personnel Expenses Total 21,57325,402
-0 0002,262Cahuilla Continuum Exhibition5300000450054 0
-0 0Special Projects Total 0002,262
32.4 %239,436317,108 317,108317,108317,107881100 General Fund Allocation Chgs5300000 325,170
-0 005,9280Utilization Chgs from 101 Fund5300000882101 0
32.4 %239,436317,108317,108 317,108Charges From Others Total 323,035325,170
-0 00(30,600)(23,557)Interfund Services to 101 Fund5300000894101 0
-0 0Charges to Others Total 00(30,600)(23,557)
CCReport Name: 2017_Mid_Cycle_Report
Report Description: Budget Book - Department Budget Detail wMD
06/07/2017Date:
Time: 205
Version:
Page:19:21:28
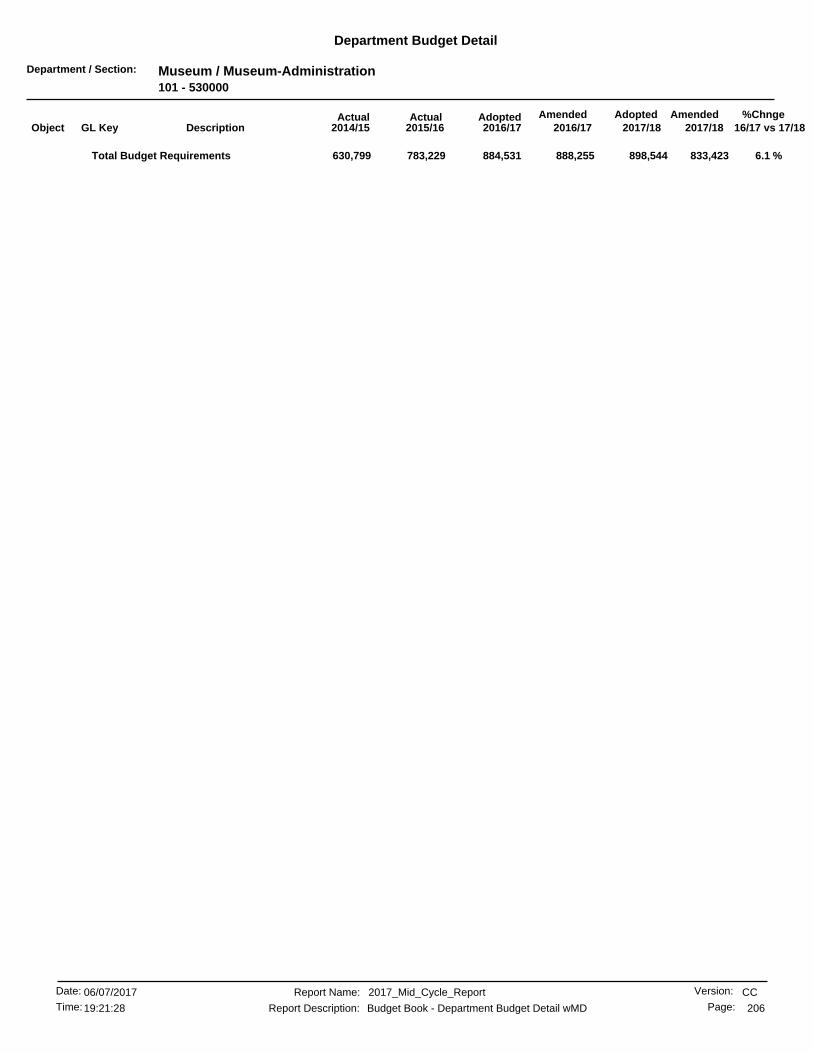
Department / Section: Museum / Museum-Administration101 - 530000
Department Budget Detail
%Chnge16/17 vs 17/182017/182017/18
AmendedAdoptedAdopted2016/17
AmendedActualActual2016/172015/162014/15GL KeyObject Description
6.1 %884,531 833,423898,544888,255783,229630,799Total Budget Requirements
CCReport Name: 2017_Mid_Cycle_Report
Report Description: Budget Book - Department Budget Detail wMD
06/07/2017Date:
Time: 206
Version:
Page:19:21:28
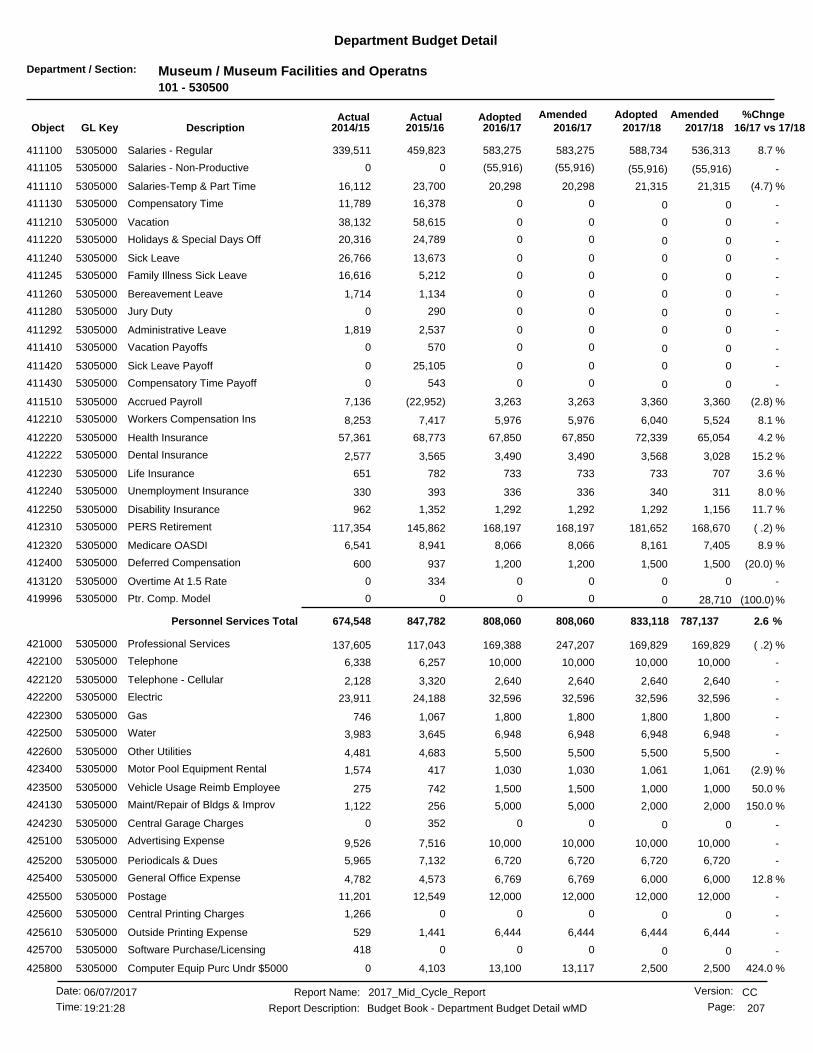
Department / Section: Museum / Museum Facilities and Operatns101 - 530500
Department Budget Detail
%Chnge16/17 vs 17/182017/182017/18
AmendedAdoptedAdopted2016/17
AmendedActualActual2016/172015/162014/15GL KeyObject Description
8.7 %536,313583,275 588,734583,275459,823411100 Salaries - Regular5305000 339,511
-(55,916) (55,916)(55,916)00Salaries - Non-Productive5305000411105 (55,916)
(4.7) %21,31520,298 21,31520,29823,700411110 Salaries-Temp & Part Time5305000 16,112
-0 0016,37811,789Compensatory Time5305000411130 0
-0 0058,61538,132Vacation5305000411210 0
-0 0024,78920,316Holidays & Special Days Off5305000411220 0
-0 0013,67326,766Sick Leave5305000411240 0
-0 005,21216,616Family Illness Sick Leave5305000411245 0
-0 001,1341,714Bereavement Leave5305000411260 0
-0 002900Jury Duty5305000411280 0
-0 002,5371,819Administrative Leave5305000411292 0
-0 005700Vacation Payoffs5305000411410 0
-0 0025,1050Sick Leave Payoff5305000411420 0
-0 005430Compensatory Time Payoff5305000411430 0
(2.8) %3,3603,263 3,3603,263(22,952)411510 Accrued Payroll5305000 7,136
8.1 %5,5245,976 6,0405,9767,417412210 Workers Compensation Ins5305000 8,253
4.2 %65,05467,850 72,33967,85068,773412220 Health Insurance5305000 57,361
15.2 %3,0283,490 3,5683,4903,565412222 Dental Insurance5305000 2,577
3.6 %707733 733733782412230 Life Insurance5305000 651
8.0 %311336 340336393412240 Unemployment Insurance5305000 330
11.7 %1,1561,292 1,2921,2921,352412250 Disability Insurance5305000 962
( .2) %168,670168,197 181,652168,197145,862412310 PERS Retirement5305000 117,354
8.9 %7,4058,066 8,1618,0668,941412320 Medicare OASDI5305000 6,541
(20.0) %1,5001,200 1,5001,200937412400 Deferred Compensation5305000 600
-0 003340Overtime At 1.5 Rate5305000413120 0
(100.0)%0 28,710000Ptr. Comp. Model5305000419996 0
2.6 %787,137808,060808,060 833,118Personnel Services Total 847,782674,548
( .2) %169,829169,388 169,829247,207117,043421000 Professional Services5305000 137,605
-10,00010,000 10,00010,0006,257422100 Telephone5305000 6,338
-2,6402,640 2,6402,6403,320422120 Telephone - Cellular5305000 2,128
-32,59632,596 32,59632,59624,188422200 Electric5305000 23,911
-1,8001,800 1,8001,8001,067422300 Gas5305000 746
-6,9486,948 6,9486,9483,645422500 Water5305000 3,983
-5,5005,500 5,5005,5004,683422600 Other Utilities5305000 4,481
(2.9) %1,0611,030 1,0611,030417423400 Motor Pool Equipment Rental5305000 1,574
50.0 %1,0001,500 1,0001,500742423500 Vehicle Usage Reimb Employee5305000 275
150.0 %2,0005,000 2,0005,000256424130 Maint/Repair of Bldgs & Improv5305000 1,122
-0 003520Central Garage Charges5305000424230 0
-10,00010,000 10,00010,0007,516425100 Advertising Expense5305000 9,526
-6,7206,720 6,7206,7207,132425200 Periodicals & Dues5305000 5,965
12.8 %6,0006,769 6,0006,7694,573425400 General Office Expense5305000 4,782
-12,00012,000 12,00012,00012,549425500 Postage5305000 11,201
-0 0001,266Central Printing Charges5305000425600 0
-6,4446,444 6,4446,4441,441425610 Outside Printing Expense5305000 529
-0 000418Software Purchase/Licensing5305000425700 0
424.0 %2,50013,100 2,50013,1174,103425800 Computer Equip Purc Undr $50005305000 0
CCReport Name: 2017_Mid_Cycle_Report
Report Description: Budget Book - Department Budget Detail wMD
06/07/2017Date:
Time: 207
Version:
Page:19:21:28
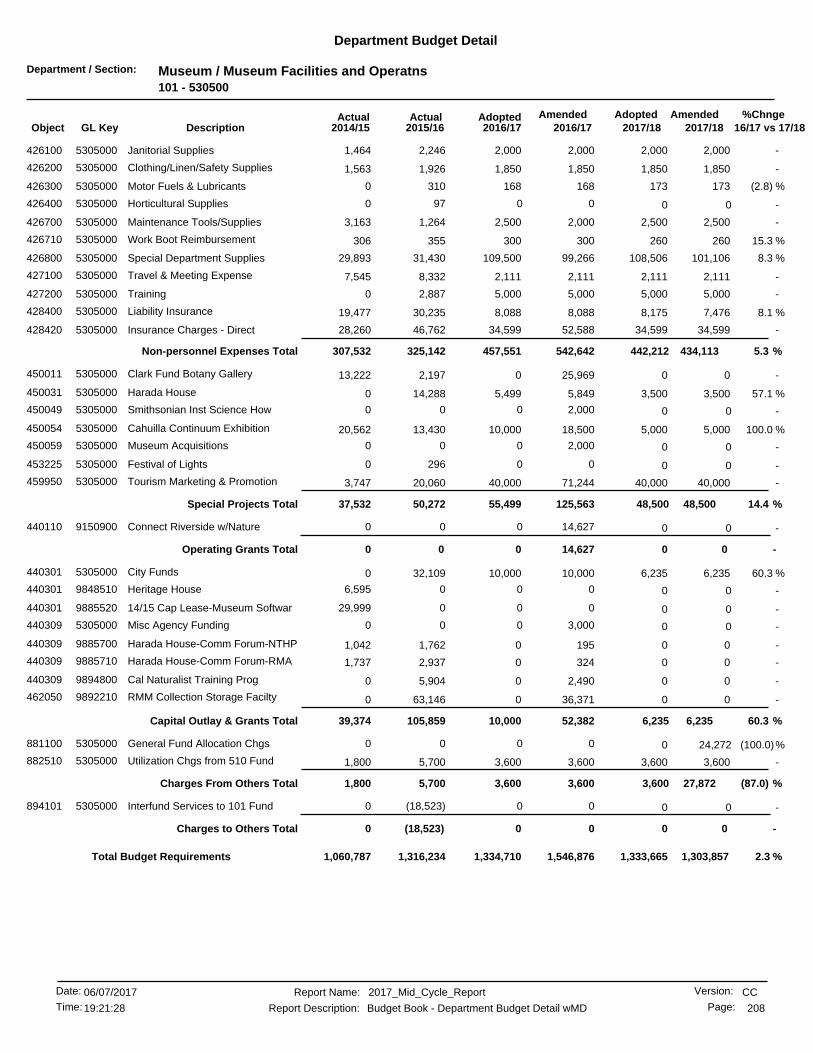
Department / Section: Museum / Museum Facilities and Operatns101 - 530500
Department Budget Detail
%Chnge16/17 vs 17/182017/182017/18
AmendedAdoptedAdopted2016/17
AmendedActualActual2016/172015/162014/15GL KeyObject Description
-2,0002,000 2,0002,0002,246426100 Janitorial Supplies5305000 1,464
-1,8501,850 1,8501,8501,926426200 Clothing/Linen/Safety Supplies5305000 1,563
(2.8) %173168 173168310426300 Motor Fuels & Lubricants5305000 0
-0 00970Horticultural Supplies5305000426400 0
-2,5002,500 2,5002,0001,264426700 Maintenance Tools/Supplies5305000 3,163
15.3 %260300 260300355426710 Work Boot Reimbursement5305000 306
8.3 %101,106109,500 108,50699,26631,430426800 Special Department Supplies5305000 29,893
-2,1112,111 2,1112,1118,332427100 Travel & Meeting Expense5305000 7,545
-5,0005,000 5,0005,0002,887427200 Training5305000 0
8.1 %7,4768,088 8,1758,08830,235428400 Liability Insurance5305000 19,477
-34,59934,599 34,59952,58846,762428420 Insurance Charges - Direct5305000 28,260
5.3 %434,113542,642457,551 442,212Non-personnel Expenses Total 325,142307,532
-00 025,9692,197450011 Clark Fund Botany Gallery5305000 13,222
57.1 %3,5005,499 3,5005,84914,288450031 Harada House5305000 0
-0 02,00000Smithsonian Inst Science How5305000450049 0
100.0 %5,00010,000 5,00018,50013,430450054 Cahuilla Continuum Exhibition5305000 20,562
-0 02,00000Museum Acquisitions5305000450059 0
-0 002960Festival of Lights5305000453225 0
-40,00040,000 40,00071,24420,060459950 Tourism Marketing & Promotion5305000 3,747
14.4 %48,500125,56355,499 48,500Special Projects Total 50,27237,532
-0 014,62700Connect Riverside w/Nature9150900440110 0
-0 0Operating Grants Total 014,62700
60.3 %6,23510,000 6,23510,00032,109440301 City Funds5305000 0
-0 0006,595Heritage House9848510440301 0
-0 00029,99914/15 Cap Lease-Museum Softwar9885520440301 0
-0 03,00000Misc Agency Funding5305000440309 0
-00 01951,762440309 Harada House-Comm Forum-NTHP9885700 1,042
-00 03242,937440309 Harada House-Comm Forum-RMA9885710 1,737
-00 02,4905,904440309 Cal Naturalist Training Prog9894800 0
-00 036,37163,146462050 RMM Collection Storage Facilty9892210 0
60.3 %6,23552,38210,000 6,235Capital Outlay & Grants Total 105,85939,374
(100.0)%0 24,272000General Fund Allocation Chgs5305000881100 0
-3,6003,600 3,6003,6005,700882510 Utilization Chgs from 510 Fund5305000 1,800
(87.0) %27,8723,6003,600 3,600Charges From Others Total 5,7001,800
-0 00(18,523)0Interfund Services to 101 Fund5305000894101 0
-0 0Charges to Others Total 00(18,523)0
2.3 %1,334,710 1,303,8571,333,6651,546,8761,316,2341,060,787Total Budget Requirements
CCReport Name: 2017_Mid_Cycle_Report
Report Description: Budget Book - Department Budget Detail wMD
06/07/2017Date:
Time: 208
Version:
Page:19:21:28

Department / Section: Museum / Museum-Arts & Cultural Affairs101 - 531000
Department Budget Detail
%Chnge16/17 vs 17/182017/182017/18
AmendedAdoptedAdopted2016/17
AmendedActualActual2016/172015/162014/15GL KeyObject Description
(2.6) %468,006455,424 468,006455,424392,661411100 Salaries - Regular5310000 297,242
(100.0)%0 3,299000Salaries - Non-Productive5310000411105 3,299
-0 002,9021,588Compensatory Time5310000411130 0
-0 0024,83211,403Vacation5310000411210 0
-0 0016,96812,501Holidays & Special Days Off5310000411220 0
-0 0014,4619,259Sick Leave5310000411240 0
-0 00210299Family Illness Sick Leave5310000411245 0
-0 005850Bereavement Leave5310000411260 0
-0 000498Jury Duty5310000411280 0
-0 005,1635,481Administrative Leave5310000411292 0
-0 002,10312,137Vacation Payoffs5310000411410 0
(4.6) %2,6942,570 2,6942,570(19,468)411510 Accrued Payroll5310000 8,540
(2.6) %4,6334,509 4,6334,5095,172412210 Workers Compensation Ins5310000 6,390
(6.9) %60,75956,545 60,75956,54556,269412220 Health Insurance5310000 38,624
(1.9) %2,7362,684 2,7362,6842,759412222 Dental Insurance5310000 1,964
(2.6) %2,9022,825 2,9022,8252,523412230 Life Insurance5310000 1,698
(2.6) %261254 261254274412240 Unemployment Insurance5310000 255
-0 00120135Disability Insurance5310000412250 0
(9.1) %150,467136,769 150,467136,769134,491412310 PERS Retirement5310000 91,101
(2.6) %6,7866,604 6,7866,6046,687412320 Medicare OASDI5310000 5,121
(20.0) %9,0007,200 9,0007,2003,900412400 Deferred Compensation5310000 2,150
-0 0001,809Overtime At 1.5 Rate5310000413120 0
(100.0)%0 13,903000Ptr. Comp. Model5310000419996 0
(6.9) %725,446675,384675,384 711,543Personnel Services Total 652,621508,207
-70,00070,000 70,00065,36530,578421000 Professional Services5310000 47,070
-1,4401,440 1,4401,440537422100 Telephone5310000 519
-4,6204,620 4,6204,6203,397422120 Telephone - Cellular5310000 3,131
-400 400400062Electric5310000422200 400
-500 500500025Vehicle Usage Reimb Employee5310000423500 500
-400 40040000All Other Equip Maint/Repair5310000424220 400
-60,00060,000 60,00060,00042,187425100 Advertising Expense5310000 41,542
40.0 %2,5003,500 2,5003,5003,205425200 Periodicals & Dues5310000 535
(12.5) %4,0003,500 4,0003,5004,255425400 General Office Expense5310000 4,702
25.0 %400500 40050058425500 Postage5310000 85
-0 000848Central Printing Charges5310000425600 0
-6,0006,000 6,0006,000109425610 Outside Printing Expense5310000 71
-1,5001,500 1,5001,500133425700 Software Purchase/Licensing5310000 4,858
100.0 %1,0002,000 1,0002,000806425800 Computer Equip Purc Undr $50005310000 551
-0 00578734Janitorial Supplies5310000426100 0
23.5 %12,00014,820 12,00014,82012,625426800 Special Department Supplies5310000 11,431
-3,5183,518 3,5183,5184,350427100 Travel & Meeting Expense5310000 409
-2,5002,500 2,5002,5001,432427200 Training5310000 34
(2.6) %6,2716,102 6,2716,10221,087428400 Liability Insurance5310000 15,081
2.4 %177,049176,665181,300 177,049Non-personnel Expenses Total 125,343131,696
-280,000280,000 280,000280,000280,000450032 Art Organizatn Special Support5310000 280,000
CCReport Name: 2017_Mid_Cycle_Report
Report Description: Budget Book - Department Budget Detail wMD
06/07/2017Date:
Time: 209
Version:
Page:19:21:28
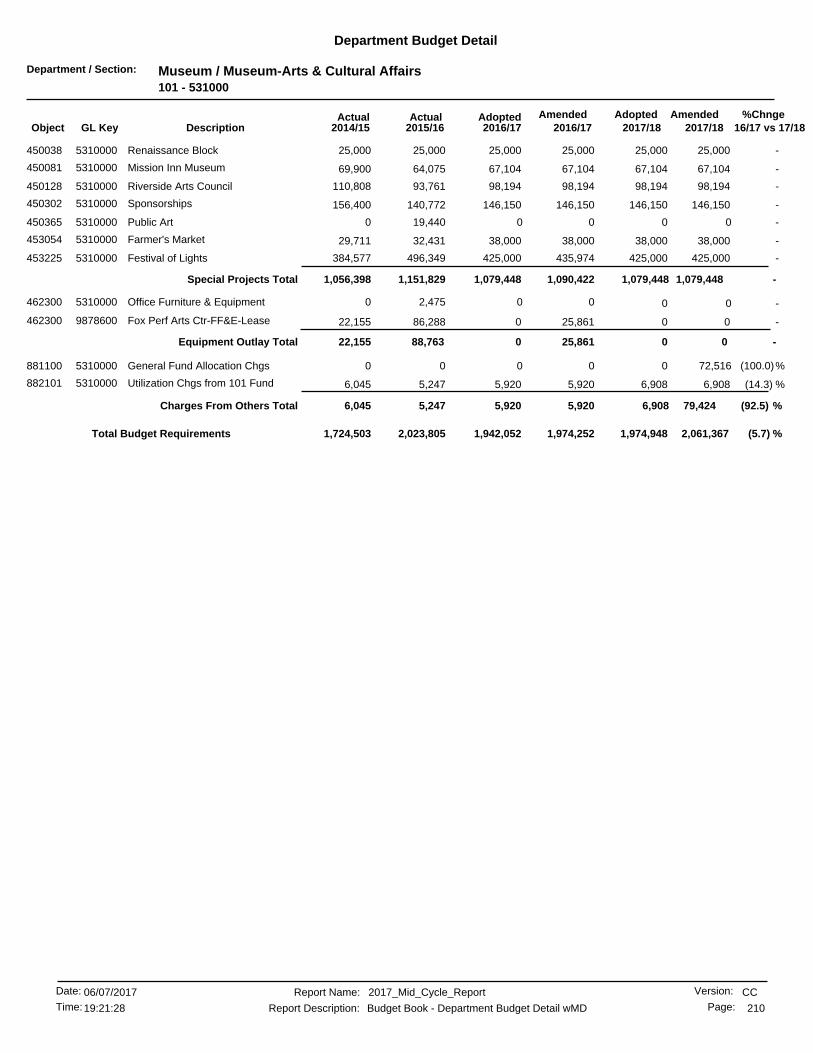
Department / Section: Museum / Museum-Arts & Cultural Affairs101 - 531000
Department Budget Detail
%Chnge16/17 vs 17/182017/182017/18
AmendedAdoptedAdopted2016/17
AmendedActualActual2016/172015/162014/15GL KeyObject Description
-25,00025,000 25,00025,00025,000450038 Renaissance Block5310000 25,000
-67,10467,104 67,10467,10464,075450081 Mission Inn Museum5310000 69,900
-98,19498,194 98,19498,19493,761450128 Riverside Arts Council5310000 110,808
-146,150146,150 146,150146,150140,772450302 Sponsorships5310000 156,400
-0 0019,4400Public Art5310000450365 0
-38,00038,000 38,00038,00032,431453054 Farmer's Market5310000 29,711
-425,000425,000 425,000435,974496,349453225 Festival of Lights5310000 384,577
-1,079,4481,090,4221,079,448 1,079,448Special Projects Total 1,151,8291,056,398
-0 002,4750Office Furniture & Equipment5310000462300 0
-00 025,86186,288462300 Fox Perf Arts Ctr-FF&E-Lease9878600 22,155
-0 0Equipment Outlay Total 025,86188,76322,155
(100.0)%0 72,516000General Fund Allocation Chgs5310000881100 0
(14.3) %6,9085,920 6,9085,9205,247882101 Utilization Chgs from 101 Fund5310000 6,045
(92.5) %79,4245,9205,920 6,908Charges From Others Total 5,2476,045
(5.7) %1,942,052 2,061,3671,974,9481,974,2522,023,8051,724,503Total Budget Requirements
CCReport Name: 2017_Mid_Cycle_Report
Report Description: Budget Book - Department Budget Detail wMD
06/07/2017Date:
Time: 210
Version:
Page:19:21:28
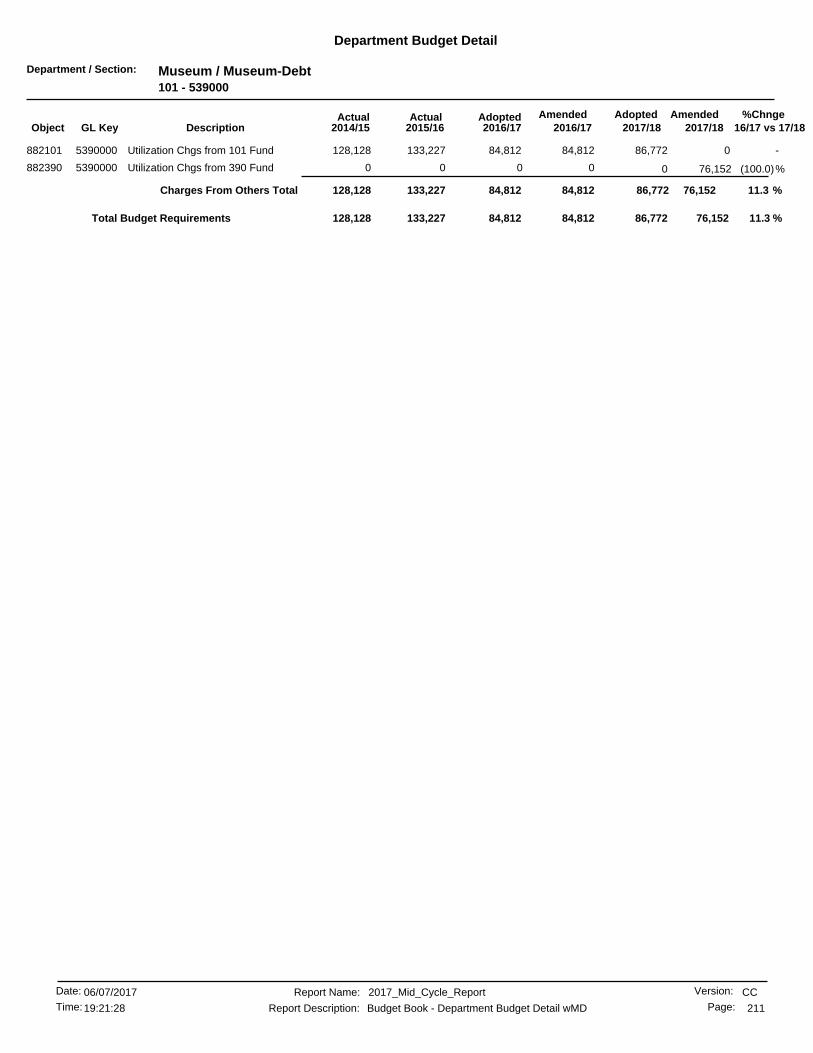
Department / Section: Museum / Museum-Debt101 - 539000
Department Budget Detail
%Chnge16/17 vs 17/182017/182017/18
AmendedAdoptedAdopted2016/17
AmendedActualActual2016/172015/162014/15GL KeyObject Description
-084,812 86,77284,812133,227882101 Utilization Chgs from 101 Fund5390000 128,128
(100.0)%0 76,152000Utilization Chgs from 390 Fund5390000882390 0
11.3 %76,15284,81284,812 86,772Charges From Others Total 133,227128,128
11.3 %84,812 76,15286,77284,812133,227128,128Total Budget Requirements
CCReport Name: 2017_Mid_Cycle_Report
Report Description: Budget Book - Department Budget Detail wMD
06/07/2017Date:
Time: 211
Version:
Page:19:21:28
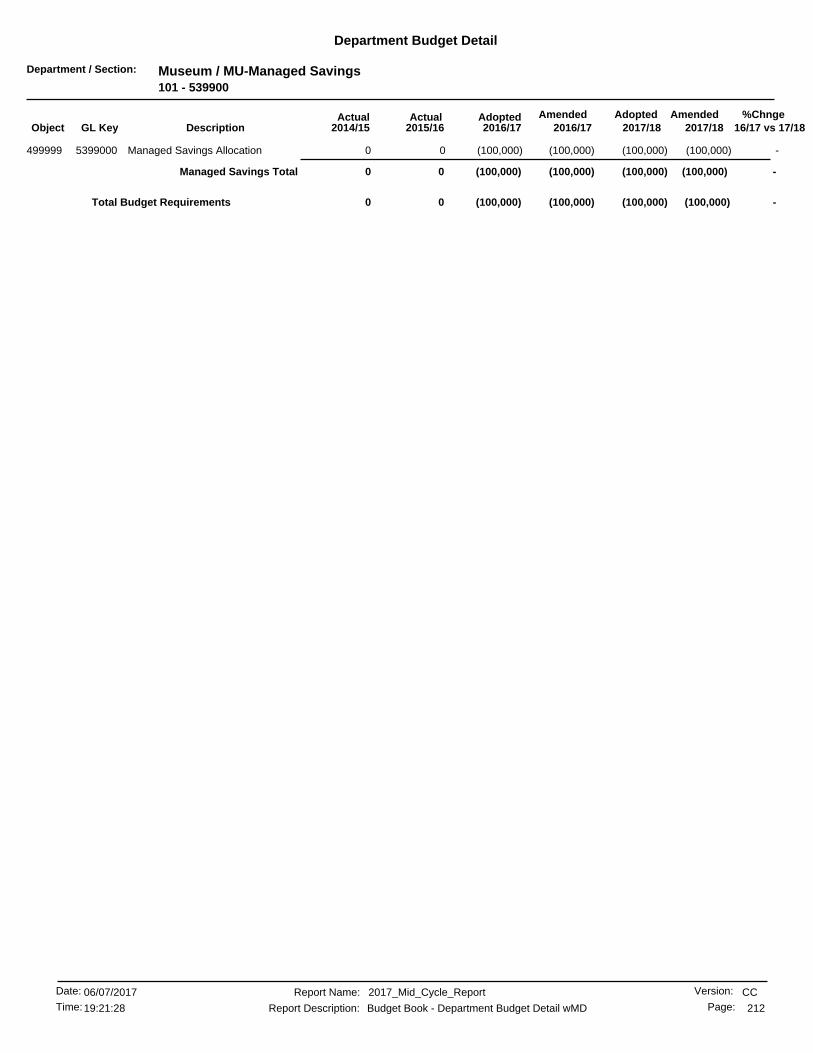
Department / Section: Museum / MU-Managed Savings101 - 539900
Department Budget Detail
%Chnge16/17 vs 17/182017/182017/18
AmendedAdoptedAdopted2016/17
AmendedActualActual2016/172015/162014/15GL KeyObject Description
-(100,000) (100,000)(100,000)00Managed Savings Allocation5399000499999 (100,000)
-(100,000) (100,000)Managed Savings Total (100,000)(100,000)00
-(100,000)(100,000) (100,000)(100,000)0Total Budget Requirements 0
CCReport Name: 2017_Mid_Cycle_Report
Report Description: Budget Book - Department Budget Detail wMD
06/07/2017Date:
Time: 212
Version:
Page:19:21:28

Department / Section: Non Departmental / N/D-City Manager-Conv Ctr101 - 721100
Department Budget Detail
%Chnge16/17 vs 17/182017/182017/18
AmendedAdoptedAdopted2016/17
AmendedActualActual2016/172015/162014/15GL KeyObject Description
-0 00487,274451,492Convention Center Mgmt Fee7211000459971 0
-0 005,429,1054,654,079Convention Ctr Operating Exp7211000459972 0
-0 001,596,5001,312,500Riverside CVB7211000459974 0
-0 0Special Projects Total 007,512,8806,418,072
-00 0159,59746,839462300 Convention Center FF&E - Lease9878500 118,357
-0 0Equipment Outlay Total 0159,59746,839118,357
-0 00159,5977,559,7206,536,429Total Budget Requirements
(100.0) %00 0159,5977,559,720Total Budget Requirements 6,536,429
CCReport Name: 2017_Mid_Cycle_Report
Report Description: Budget Book - Department Budget Detail wMD
06/07/2017Date:
Time: 213
Version:
Page:19:21:28

Department / Section: Non Departmental / N/D-City Manager-Special Proj101 - 721110
Department Budget Detail
%Chnge16/17 vs 17/182017/182017/18
AmendedAdoptedAdopted2016/17
AmendedActualActual2016/172015/162014/15GL KeyObject Description
-450,000 450,000427,00000CM Audit Program7211100450087 450,000
-450,000 450,000Special Projects Total 450,000427,00000
5.3 %450,000450,000 450,000427,0000Total Budget Requirements 0
CCReport Name: 2017_Mid_Cycle_Report
Report Description: Budget Book - Department Budget Detail wMD
06/07/2017Date:
Time: 214
Version:
Page:19:21:28

Department / Section: Non Departmental / N/D-City Mgr-Sundry/Gen Gov't101 - 721120
Department Budget Detail
%Chnge16/17 vs 17/182017/182017/18
AmendedAdoptedAdopted2016/17
AmendedActualActual2016/172015/162014/15GL KeyObject Description
76.3%500,000 283,60445,78500Fiscal Management7211200450247 500,000
76.3 %500,000 283,604Special Projects Total 500,00045,78500
992.0 %283,604500,000 500,00045,7850Total Budget Requirements 0
CCReport Name: 2017_Mid_Cycle_Report
Report Description: Budget Book - Department Budget Detail wMD
06/07/2017Date:
Time: 215
Version:
Page:19:21:28
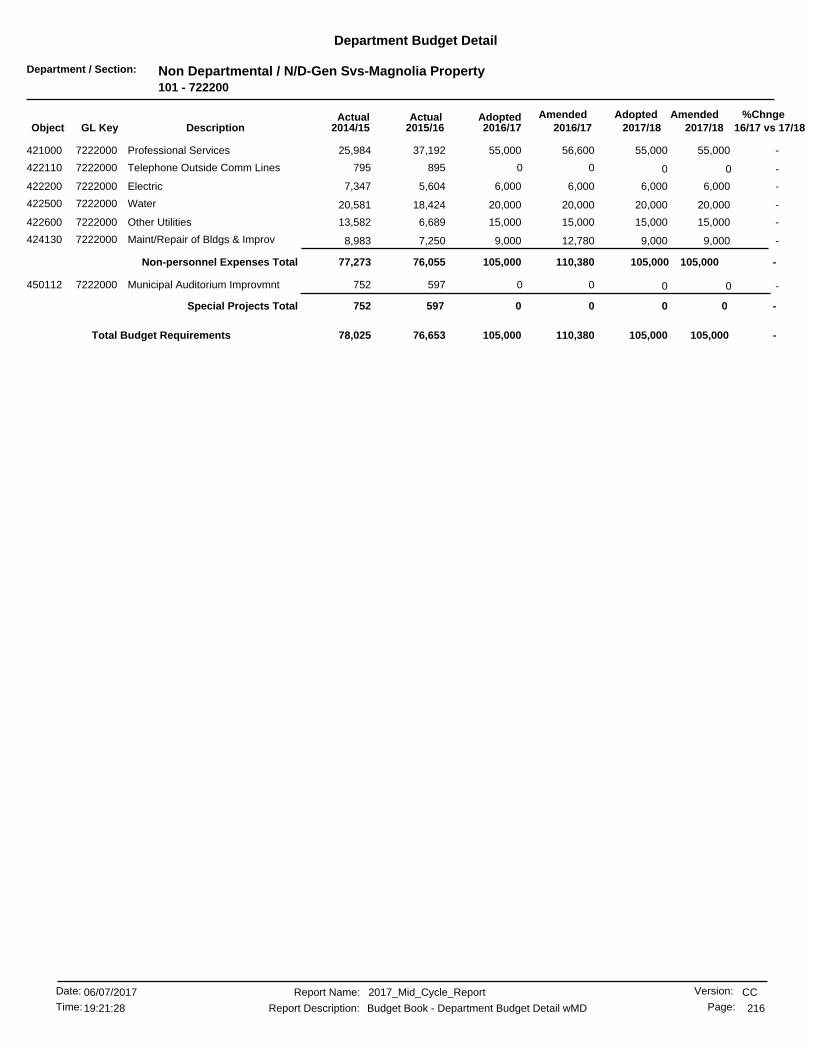
Department / Section: Non Departmental / N/D-Gen Svs-Magnolia Property101 - 722200
Department Budget Detail
%Chnge16/17 vs 17/182017/182017/18
AmendedAdoptedAdopted2016/17
AmendedActualActual2016/172015/162014/15GL KeyObject Description
-55,00055,000 55,00056,60037,192421000 Professional Services7222000 25,984
-0 00895795Telephone Outside Comm Lines7222000422110 0
-6,0006,000 6,0006,0005,604422200 Electric7222000 7,347
-20,00020,000 20,00020,00018,424422500 Water7222000 20,581
-15,00015,000 15,00015,0006,689422600 Other Utilities7222000 13,582
-9,0009,000 9,00012,7807,250424130 Maint/Repair of Bldgs & Improv7222000 8,983
-105,000110,380105,000 105,000Non-personnel Expenses Total 76,05577,273
-0 00597752Municipal Auditorium Improvmnt7222000450112 0
-0 0Special Projects Total 00597752
-105,000 105,000105,000110,38076,65378,025Total Budget Requirements
CCReport Name: 2017_Mid_Cycle_Report
Report Description: Budget Book - Department Budget Detail wMD
06/07/2017Date:
Time: 216
Version:
Page:19:21:28

Department / Section: Non Departmental / N/D-Gen Svs-City Hall Occ101 - 722210
Department Budget Detail
%Chnge16/17 vs 17/182017/182017/18
AmendedAdoptedAdopted2016/17
AmendedActualActual2016/172015/162014/15GL KeyObject Description
-0 001,1320Salaries - Regular7222100411100 0
-0 00080Salaries-Temp & Part Time7222100411110 0
-0 001,9701,416Compensatory Time7222100411130 0
-0 000534Overtime At Straight Rate7222100413110 0
-0 000(351)Overtime At 1.5 Rate7222100413120 0
-0 0Personnel Services Total 003,1021,679
(1.4) %336,600331,600 336,600353,611373,359421000 Professional Services7222100 357,783
-0 01,62000Prof Services/Internal7222100421001 0
-297297 2972973,720422100 Telephone7222100 2,940
-400,000400,000 400,000400,000380,651422200 Electric7222100 364,494
-11,600 11,60011,60000Gas7222100422300 11,600
-16,00016,000 16,00016,00019,026422500 Water7222100 16,373
-18,00018,000 18,00018,0009,410422600 Other Utilities7222100 14,466
1000.0 %50,000550,000 50,00064,395140,307424130 Maint/Repair of Bldgs & Improv7222100 62,869
-2,6002,600 2,6002,600728424220 All Other Equip Maint/Repair7222100 2,495
-0 00899934General Office Expense7222100425400 0
-20,00020,000 20,00020,00013,477426100 Janitorial Supplies7222100 32,000
-0 00558468Clothing/Linen/Safety Supplies7222100426200 0
(21.7) %116,56791,248 116,56765,88465,615428420 Insurance Charges - Direct7222100 56,131
48.3 %971,664954,0081,441,345 971,664Non-personnel Expenses Total 1,007,755910,957
-0 002,450497Bldgs & Structures Improvmnts7222100470020 0
-0 0500,00000One Stop Shop9898700470020 0
-0 0Capital Outlay & Grants Total 0500,0002,450497
(92.5) %2,508,016187,832 187,832187,832187,831881100 General Fund Allocation Chgs7222100 230,997
2008.7 %40,000843,506 841,893843,506844,942882101 Utilization Chgs from 101 Fund7222100 843,804
(100.0)%0 801,893000Utilization Chgs from 390 Fund7222100882390 0
-2,6162,616 2,6162,6162,616882510 Utilization Chgs from 510 Fund7222100 2,616
(69.1) %3,352,5251,033,9541,033,954 1,032,341Charges From Others Total 1,035,3901,077,418
(52.7) %(4,157,369)(1,962,747) (1,962,747)(1,962,747)(1,962,747)891100 General Fund Allocation Chgs7222100 (1,977,902)
(52.7) %(1,962,747) (4,157,369)Charges to Others Total (1,962,747)(1,962,747)(1,962,747)(1,977,902)
207.2 %512,552 166,82041,258525,21585,95112,651Total Budget Requirements
CCReport Name: 2017_Mid_Cycle_Report
Report Description: Budget Book - Department Budget Detail wMD
06/07/2017Date:
Time: 217
Version:
Page:19:21:28

Department / Section: Non Departmental / N/D-Gen Svs-Managed Facilities101 - 722220
Department Budget Detail
%Chnge16/17 vs 17/182017/182017/18
AmendedAdoptedAdopted2016/17
AmendedActualActual2016/172015/162014/15GL KeyObject Description
-0146,494 184,379103,719109,234428420 Insurance Charges - Direct7222200 86,474
-146,494 0Non-personnel Expenses Total 184,379103,719109,23486,474
-015,000 15,00015,0008,346450112 Municipal Auditorium Improvmnt7222200 10,000
-040,000 40,00043,57519,177450310 Convention Center Improvements7222200 9,847
-55,000 0Special Projects Total 55,00058,57527,52419,847
-00 0227,988(95,000)462300 Muni Auditorium-FF&E-Lease9878700 161,940
-0 0Equipment Outlay Total 0227,988(95,000)161,940
-03,597,106 3,596,9443,597,1063,597,252882101 Utilization Chgs from 101 Fund7222200 3,598,537
-3,597,106 0Charges From Others Total 3,596,9443,597,1063,597,2523,598,537
-3,798,600 03,836,3233,987,3893,639,0103,866,800Total Budget Requirements
(3.7) %03,798,600 3,836,3233,987,3893,639,010Total Budget Requirements 3,866,800
CCReport Name: 2017_Mid_Cycle_Report
Report Description: Budget Book - Department Budget Detail wMD
06/07/2017Date:
Time: 218
Version:
Page:19:21:28
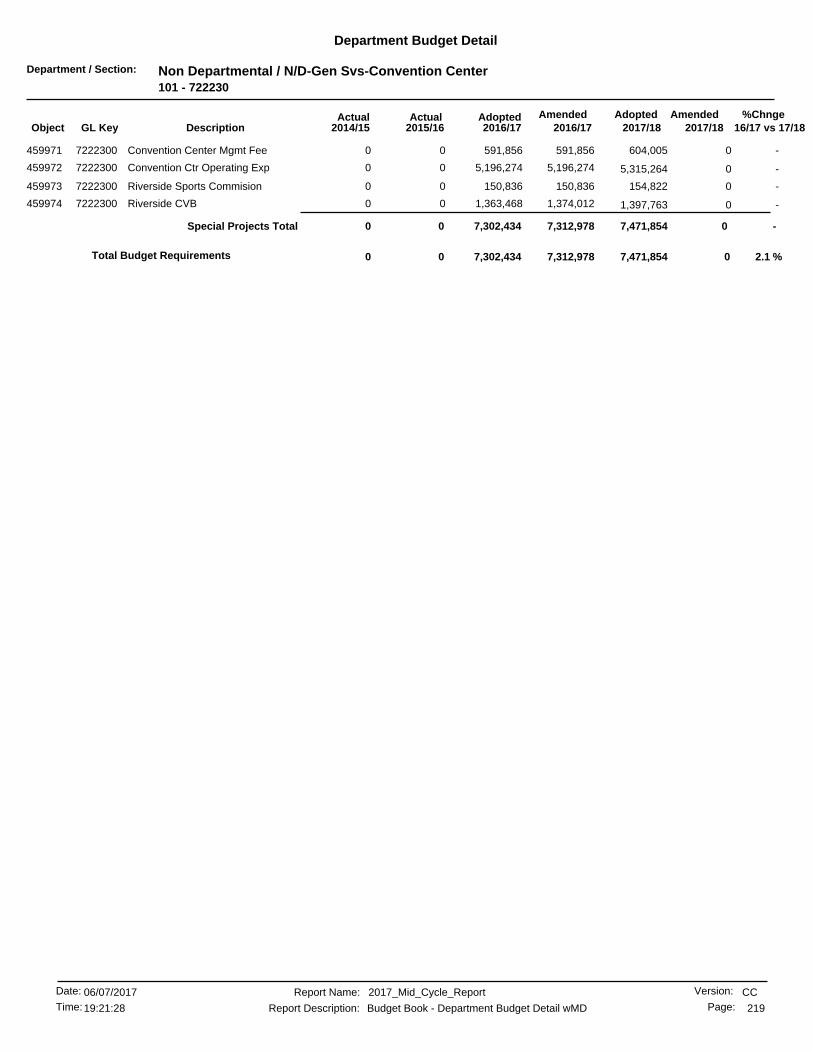
Department / Section: Non Departmental / N/D-Gen Svs-Convention Center101 - 722230
Department Budget Detail
%Chnge16/17 vs 17/182017/182017/18
AmendedAdoptedAdopted2016/17
AmendedActualActual2016/172015/162014/15GL KeyObject Description
-591,856 0591,85600Convention Center Mgmt Fee7222300459971 604,005
-5,196,274 05,196,27400Convention Ctr Operating Exp7222300459972 5,315,264
-150,836 0150,83600Riverside Sports Commision7222300459973 154,822
-1,363,468 01,374,01200Riverside CVB7222300459974 1,397,763
-7,302,434 0Special Projects Total 7,471,8547,312,97800
2.1 %07,302,434 7,471,8547,312,9780Total Budget Requirements 0
CCReport Name: 2017_Mid_Cycle_Report
Report Description: Budget Book - Department Budget Detail wMD
06/07/2017Date:
Time: 219
Version:
Page:19:21:28

Department / Section: Non Departmental / N/D-Finance-Development Agrmts101 - 722300
Department Budget Detail
%Chnge16/17 vs 17/182017/182017/18
AmendedAdoptedAdopted2016/17
AmendedActualActual2016/172015/162014/15GL KeyObject Description
19.2 %1,032,0001,231,000 1,032,0001,231,0001,194,040446000 Devel Agreemnt Requirements7223000 1,058,332
19.2 %1,032,0001,231,0001,231,000 1,032,000Non-personnel Expenses Total 1,194,0401,058,332
19.2 %1,231,000 1,032,0001,032,0001,231,0001,194,0401,058,332Total Budget Requirements
CCReport Name: 2017_Mid_Cycle_Report
Report Description: Budget Book - Department Budget Detail wMD
06/07/2017Date:
Time: 220
Version:
Page:19:21:28
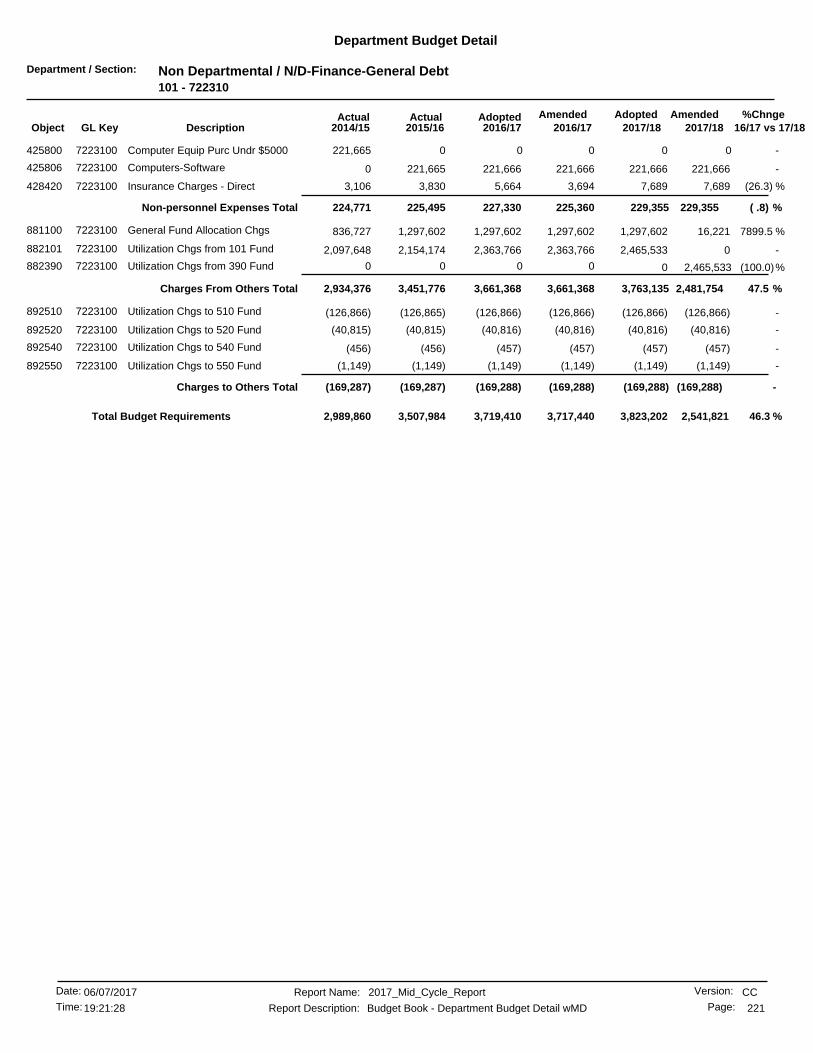
Department / Section: Non Departmental / N/D-Finance-General Debt101 - 722310
Department Budget Detail
%Chnge16/17 vs 17/182017/182017/18
AmendedAdoptedAdopted2016/17
AmendedActualActual2016/172015/162014/15GL KeyObject Description
-0 000221,665Computer Equip Purc Undr $50007223100425800 0
-221,666221,666 221,666221,666221,665425806 Computers-Software7223100 0
(26.3) %7,6895,664 7,6893,6943,830428420 Insurance Charges - Direct7223100 3,106
( .8) %229,355225,360227,330 229,355Non-personnel Expenses Total 225,495224,771
7899.5 %16,2211,297,602 1,297,6021,297,6021,297,602881100 General Fund Allocation Chgs7223100 836,727
-02,363,766 2,465,5332,363,7662,154,174882101 Utilization Chgs from 101 Fund7223100 2,097,648
(100.0)%0 2,465,533000Utilization Chgs from 390 Fund7223100882390 0
47.5 %2,481,7543,661,3683,661,368 3,763,135Charges From Others Total 3,451,7762,934,376
-(126,866)(126,866) (126,866)(126,866)(126,865)892510 Utilization Chgs to 510 Fund7223100 (126,866)
-(40,816)(40,816) (40,816)(40,816)(40,815)892520 Utilization Chgs to 520 Fund7223100 (40,815)
-(457)(457) (457)(457)(456)892540 Utilization Chgs to 540 Fund7223100 (456)
-(1,149)(1,149) (1,149)(1,149)(1,149)892550 Utilization Chgs to 550 Fund7223100 (1,149)
-(169,288)(169,288)(169,288) (169,288)Charges to Others Total (169,287)(169,287)
46.3 %3,719,410 2,541,8213,823,2023,717,4403,507,9842,989,860Total Budget Requirements
CCReport Name: 2017_Mid_Cycle_Report
Report Description: Budget Book - Department Budget Detail wMD
06/07/2017Date:
Time: 221
Version:
Page:19:21:28

Department / Section: Non Departmental / N/D-Finance-St Lighting AD101 - 722320
Department Budget Detail
%Chnge16/17 vs 17/182017/182017/18
AmendedAdoptedAdopted2016/17
AmendedActualActual2016/172015/162014/15GL KeyObject Description
-020,000 20,00020,00036,358421000 Professional Services7223200 0
-026,000 26,00026,00022,286422200 Electric7223200 28,026
-04,442,563 4,442,5634,442,5634,344,280422201 St. Light/Traffic Signal Elec7223200 4,330,158
-05,700 5,7005,7005,542422202 State Energy Tax7223200 5,566
-0 00123,812123,409Public Benefits Charge7223200422203 0
-4,494,263 0Non-personnel Expenses Total 4,494,2634,494,2634,532,2804,487,160
-4,494,263 04,494,2634,494,2634,532,2804,487,160Total Budget Requirements
-04,494,263 4,494,2634,494,2634,532,280Total Budget Requirements 4,487,160
CCReport Name: 2017_Mid_Cycle_Report
Report Description: Budget Book - Department Budget Detail wMD
06/07/2017Date:
Time: 222
Version:
Page:19:21:28

Department / Section: Non Departmental / N/D-CD City Property Maint.101 - 722800
Department Budget Detail
%Chnge16/17 vs 17/182017/182017/18
AmendedAdoptedAdopted2016/17
AmendedActualActual2016/172015/162014/15GL KeyObject Description
-00 030020,412421000 Professional Services7228000 0
-0 0Non-personnel Expenses Total 030020,4120
-0 0030020,4120Total Budget Requirements
(100.0) %00 030020,412Total Budget Requirements 0
CCReport Name: 2017_Mid_Cycle_Report
Report Description: Budget Book - Department Budget Detail wMD
06/07/2017Date:
Time: 223
Version:
Page:19:21:28
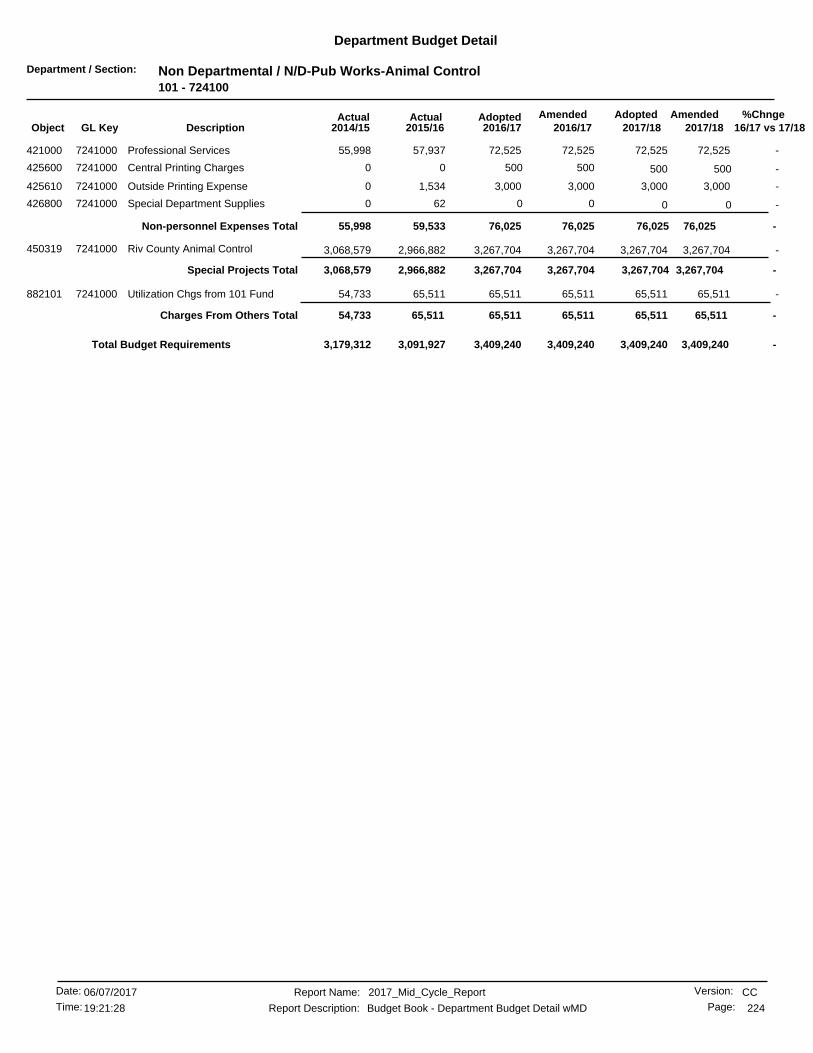
Department / Section: Non Departmental / N/D-Pub Works-Animal Control101 - 724100
Department Budget Detail
%Chnge16/17 vs 17/182017/182017/18
AmendedAdoptedAdopted2016/17
AmendedActualActual2016/172015/162014/15GL KeyObject Description
-72,52572,525 72,52572,52557,937421000 Professional Services7241000 55,998
-500 50050000Central Printing Charges7241000425600 500
-3,0003,000 3,0003,0001,534425610 Outside Printing Expense7241000 0
-0 00620Special Department Supplies7241000426800 0
-76,02576,02576,025 76,025Non-personnel Expenses Total 59,53355,998
-3,267,7043,267,704 3,267,7043,267,7042,966,882450319 Riv County Animal Control7241000 3,068,579
-3,267,7043,267,7043,267,704 3,267,704Special Projects Total 2,966,8823,068,579
-65,51165,511 65,51165,51165,511882101 Utilization Chgs from 101 Fund7241000 54,733
-65,511 65,511Charges From Others Total 65,51165,51165,51154,733
-3,409,240 3,409,2403,409,2403,409,2403,091,9273,179,312Total Budget Requirements
CCReport Name: 2017_Mid_Cycle_Report
Report Description: Budget Book - Department Budget Detail wMD
06/07/2017Date:
Time: 224
Version:
Page:19:21:28

Department / Section: Non Departmental / N/D-Pub Works-Landscape Dist101 - 724110
Department Budget Detail
%Chnge16/17 vs 17/182017/182017/18
AmendedAdoptedAdopted2016/17
AmendedActualActual2016/172015/162014/15GL KeyObject Description
-04,500 4,5004,5008,483421000 Highlander Lndscp Maint Area9716820 0
-045,500 45,50045,5008,483421000 Riverwalk Landscape Maint Dist9760340 2,286
-062,616 62,61662,61656,266421203 Highlander Lndscp Maint Area9716820 47,655
-0180,648 180,648182,934123,770421203 Riverwalk Landscape Maint Dist9760340 157,413
-020,000 20,00051,7755,111421205 Riverwalk Landscape Maint Dist9760340 29,517
-05,000 5,0005,000408422200 Riverwalk Landscape Maint Dist9760340 483
-025,000 25,00025,00016,102422500 Highlander Lndscp Maint Area9716820 22,759
-010,000 10,00010,00010,688422500 Riverwalk Landscape Maint Dist9760340 8,738
-5 0500Highlander Lndscp Maint Area9716820422600 5
-100 010000Highlander Lndscp Maint Area9716820424220 100
-500 050000Riverwalk Landscape Maint Dist9760340425300 500
-100 010000Highlander Lndscp Maint Area9716820425400 100
-1,000 01,00000Riverwalk Landscape Maint Dist9760340425400 1,000
-100 010000Highlander Lndscp Maint Area9716820426700 100
-1,000 01,00000Riverwalk Landscape Maint Dist9760340426700 1,000
-100 010000Highlander Lndscp Maint Area9716820426800 100
-23,000 023,00000Riverwalk Landscape Maint Dist9760340426800 23,000
-379,169 0Non-personnel Expenses Total 379,169413,230229,316268,854
-0 007,91310,017Highlander Lndscp Maint Area9716820450119 0
-0 0000Riverwalk Landscape Maint Dist9760340450119 0
-030,000 30,000134,2555,908450119 Riverwalk LMD Park Improvemnts9760350 4,188
-0 0609,08400Riverwalk LMD Surplus9760360450119 0
-30,000 0Special Projects Total 30,000743,33913,82114,205
-0196,968 186,760196,968174,573882101 Riverwalk Landscape Maint Dist9760340 168,475
-196,968 0Charges From Others Total 186,760196,968174,573168,475
-606,137 0595,9291,353,538417,711451,536Total Budget Requirements
(55.9) %0606,137 595,9291,353,538417,711Total Budget Requirements 451,536
CCReport Name: 2017_Mid_Cycle_Report
Report Description: Budget Book - Department Budget Detail wMD
06/07/2017Date:
Time: 225
Version:
Page:19:21:28
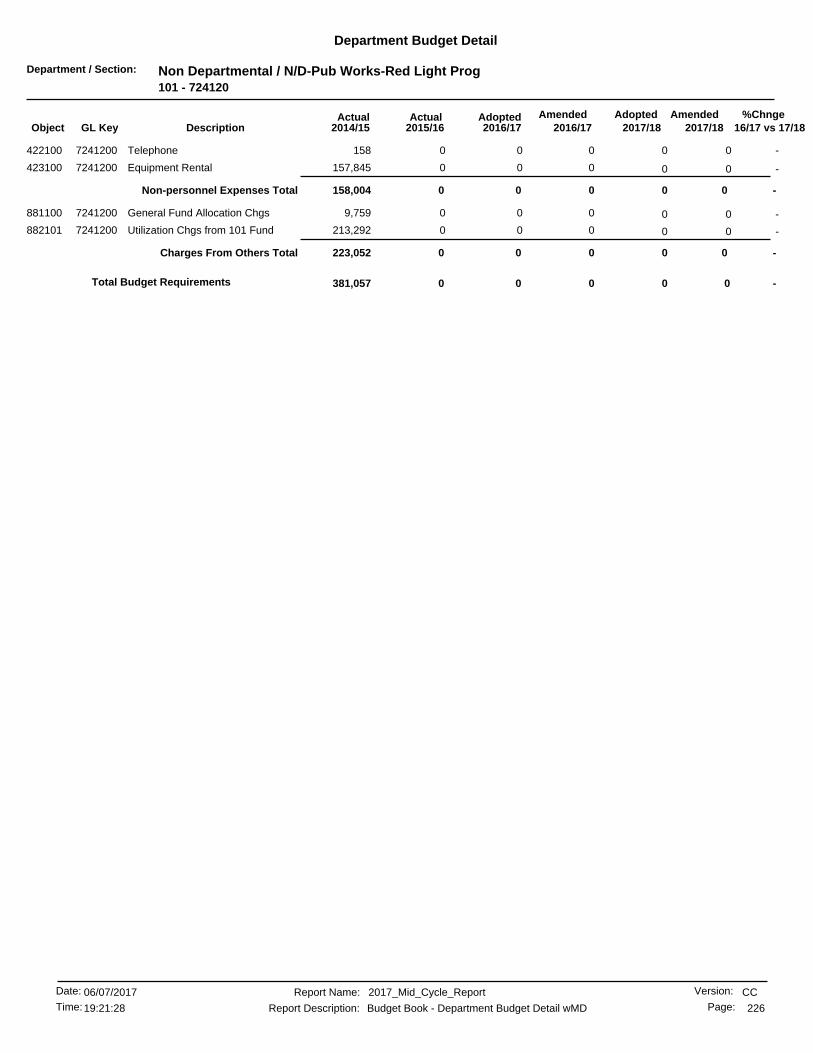
Department / Section: Non Departmental / N/D-Pub Works-Red Light Prog101 - 724120
Department Budget Detail
%Chnge16/17 vs 17/182017/182017/18
AmendedAdoptedAdopted2016/17
AmendedActualActual2016/172015/162014/15GL KeyObject Description
-0 000158Telephone7241200422100 0
-0 000157,845Equipment Rental7241200423100 0
-0 0Non-personnel Expenses Total 000158,004
-0 0009,759General Fund Allocation Chgs7241200881100 0
-0 000213,292Utilization Chgs from 101 Fund7241200882101 0
-0 0Charges From Others Total 000223,052
-00 000Total Budget Requirements 381,057
CCReport Name: 2017_Mid_Cycle_Report
Report Description: Budget Book - Department Budget Detail wMD
06/07/2017Date:
Time: 226
Version:
Page:19:21:28

Department / Section: Non Departmental / N/D-Pub Works-Employee Parking101 - 724130
Department Budget Detail
%Chnge16/17 vs 17/182017/182017/18
AmendedAdoptedAdopted2016/17
AmendedActualActual2016/172015/162014/15GL KeyObject Description
(2.5) %12,80012,480 12,80012,480228,703423201 Parking Space Rental7241300 187,651
-2,000 2,0002,00000Special Department Supplies7241300426800 2,000
(2.1) %14,80014,48014,480 14,800Non-personnel Expenses Total 228,703187,651
-10,39210,392 10,39210,39210,392882101 Utilization Chgs from 101 Fund7241300 0
-10,392 10,392Charges From Others Total 10,39210,39210,3920
(6.4) %(185,785)(173,765) (185,785)(173,765)(196,519)892101 Utilization Chgs to 101 Fund7241300 (187,651)
(6.4) %(185,785)(173,765)(173,765) (185,785)Charges to Others Total (196,519)(187,651)
(7.2) %(148,893) (160,593)(160,593)(148,893)42,5750Total Budget Requirements
CCReport Name: 2017_Mid_Cycle_Report
Report Description: Budget Book - Department Budget Detail wMD
06/07/2017Date:
Time: 227
Version:
Page:19:21:28

Department / Section: Non Departmental / N/D-PW-Shopping Cart Retreival101 - 724140
Department Budget Detail
%Chnge16/17 vs 17/182017/182017/18
AmendedAdoptedAdopted2016/17
AmendedActualActual2016/172015/162014/15GL KeyObject Description
-100 10010000Shopping Cart Retrieval9791910425500 100
-2,100 2,1002,10000Shopping Cart Retrieval9791910425600 2,100
-2,200 2,200Non-personnel Expenses Total 2,2002,20000
-150,000150,000 150,000214,58062,710440301 Shopping Cart Retrieval9791910 99,532
-150,000214,580150,000 150,000Capital Outlay & Grants Total 62,71099,532
-56,37256,372 56,37256,37256,371882101 Shopping Cart Retrieval9791910 31,210
-56,37256,37256,372 56,372Charges From Others Total 56,37131,210
-208,572 208,572208,572273,152119,081130,742Total Budget Requirements
CCReport Name: 2017_Mid_Cycle_Report
Report Description: Budget Book - Department Budget Detail wMD
06/07/2017Date:
Time: 228
Version:
Page:19:21:28
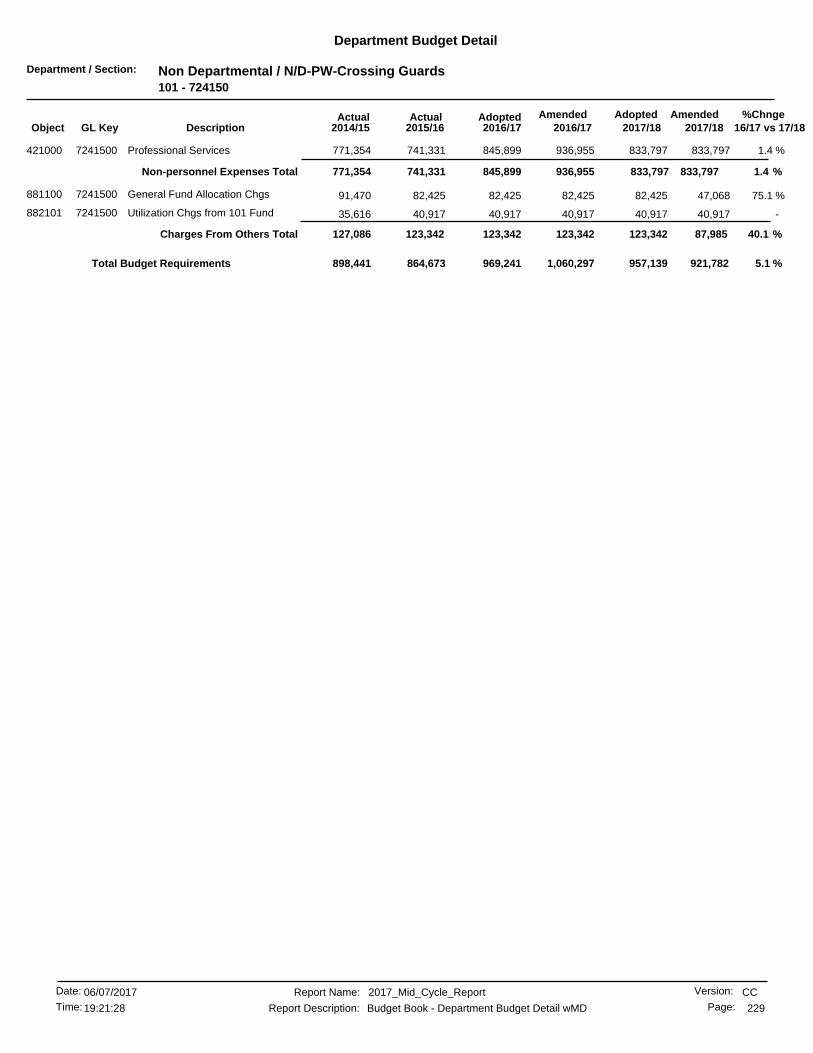
Department / Section: Non Departmental / N/D-PW-Crossing Guards101 - 724150
Department Budget Detail
%Chnge16/17 vs 17/182017/182017/18
AmendedAdoptedAdopted2016/17
AmendedActualActual2016/172015/162014/15GL KeyObject Description
1.4 %833,797845,899 833,797936,955741,331421000 Professional Services7241500 771,354
1.4 %833,797936,955845,899 833,797Non-personnel Expenses Total 741,331771,354
75.1 %47,06882,425 82,42582,42582,425881100 General Fund Allocation Chgs7241500 91,470
-40,91740,917 40,91740,91740,917882101 Utilization Chgs from 101 Fund7241500 35,616
40.1 %123,342 87,985Charges From Others Total 123,342123,342123,342127,086
5.1 %969,241 921,782957,1391,060,297864,673898,441Total Budget Requirements
CCReport Name: 2017_Mid_Cycle_Report
Report Description: Budget Book - Department Budget Detail wMD
06/07/2017Date:
Time: 229
Version:
Page:19:21:28

Department / Section: Non Departmental / N/D-PW-Keep Riv Beautiful101 - 724160
Department Budget Detail
%Chnge16/17 vs 17/182017/182017/18
AmendedAdoptedAdopted2016/17
AmendedActualActual2016/172015/162014/15GL KeyObject Description
( .4) %58,05357,764 58,05357,76457,448459022 Keep Riv Clean Cham of Commrc7241600 223,125
( .4) %58,05357,76457,764 58,053Special Projects Total 57,448223,125
( .4) %57,764 58,05358,05357,76457,448223,125Total Budget Requirements
CCReport Name: 2017_Mid_Cycle_Report
Report Description: Budget Book - Department Budget Detail wMD
06/07/2017Date:
Time: 230
Version:
Page:19:21:28
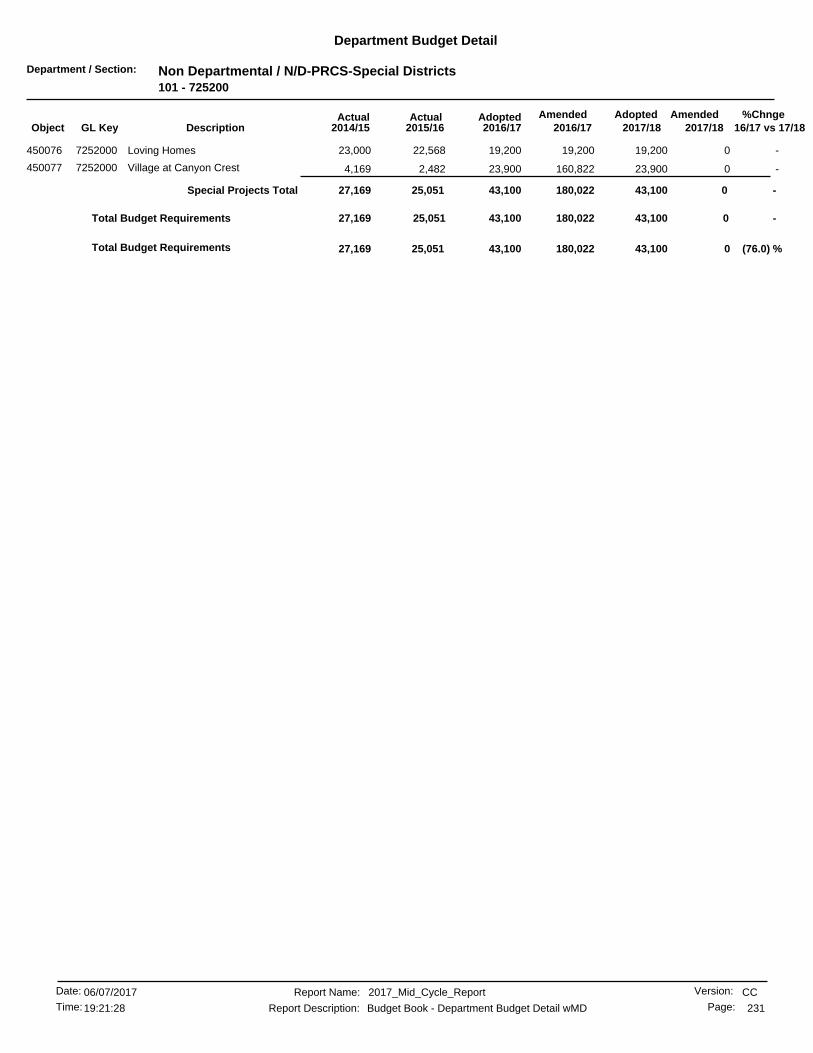
Department / Section: Non Departmental / N/D-PRCS-Special Districts101 - 725200
Department Budget Detail
%Chnge16/17 vs 17/182017/182017/18
AmendedAdoptedAdopted2016/17
AmendedActualActual2016/172015/162014/15GL KeyObject Description
-019,200 19,20019,20022,568450076 Loving Homes7252000 23,000
-023,900 23,900160,8222,482450077 Village at Canyon Crest7252000 4,169
-43,100 0Special Projects Total 43,100180,02225,05127,169
-43,100 043,100180,02225,05127,169Total Budget Requirements
(76.0) %043,100 43,100180,02225,051Total Budget Requirements 27,169
CCReport Name: 2017_Mid_Cycle_Report
Report Description: Budget Book - Department Budget Detail wMD
06/07/2017Date:
Time: 231
Version:
Page:19:21:28

Department / Section: Non Departmental / N/D-Museum-Fox Perf Arts Ctr101 - 725300
Department Budget Detail
%Chnge16/17 vs 17/182017/182017/18
AmendedAdoptedAdopted2016/17
AmendedActualActual2016/172015/162014/15GL KeyObject Description
-03,500,000 3,500,0003,500,3384,153,542421000 Professional Services7253000 1,063,780
-062,450 75,67448,91648,722428420 Insurance Charges - Direct7253000 70,182
-3,562,450 0Non-personnel Expenses Total 3,575,6743,549,2544,202,2641,133,962
-533,000 0533,00000Live Nation Management Fee7253000459965 550,000
-533,000 0Special Projects Total 550,000533,00000
-02,269,951 2,258,4462,269,9512,281,747882101 Utilization Chgs from 101 Fund7253000 2,287,860
-85,344 085,34400Utilization Chgs from 570 Fund7253000882570 85,344
-2,355,295 0Charges From Others Total 2,343,7902,355,2952,281,7472,287,860
-6,450,745 06,469,4646,437,5496,484,0123,421,822Total Budget Requirements
.4 %06,450,745 6,469,4646,437,5496,484,012Total Budget Requirements 3,421,822
CCReport Name: 2017_Mid_Cycle_Report
Report Description: Budget Book - Department Budget Detail wMD
06/07/2017Date:
Time: 232
Version:
Page:19:21:28

Department / Section: Non Departmental / N/D-Museum-Municipal Aud101 - 725310
Department Budget Detail
%Chnge16/17 vs 17/182017/182017/18
AmendedAdoptedAdopted2016/17
AmendedActualActual2016/172015/162014/15GL KeyObject Description
-02,000,000 2,000,0002,000,0002,328,803421000 Professional Services7253100 1,750,985
-2,000,000 0Non-personnel Expenses Total 2,000,0002,000,0002,328,8031,750,985
-131,000 0131,00000Live Nation Management Fee7253100459965 147,000
-131,000 0Special Projects Total 147,000131,00000
-2,131,000 02,147,0002,131,0002,328,8031,750,985Total Budget Requirements
.7 %02,131,000 2,147,0002,131,0002,328,803Total Budget Requirements 1,750,985
CCReport Name: 2017_Mid_Cycle_Report
Report Description: Budget Book - Department Budget Detail wMD
06/07/2017Date:
Time: 233
Version:
Page:19:21:28
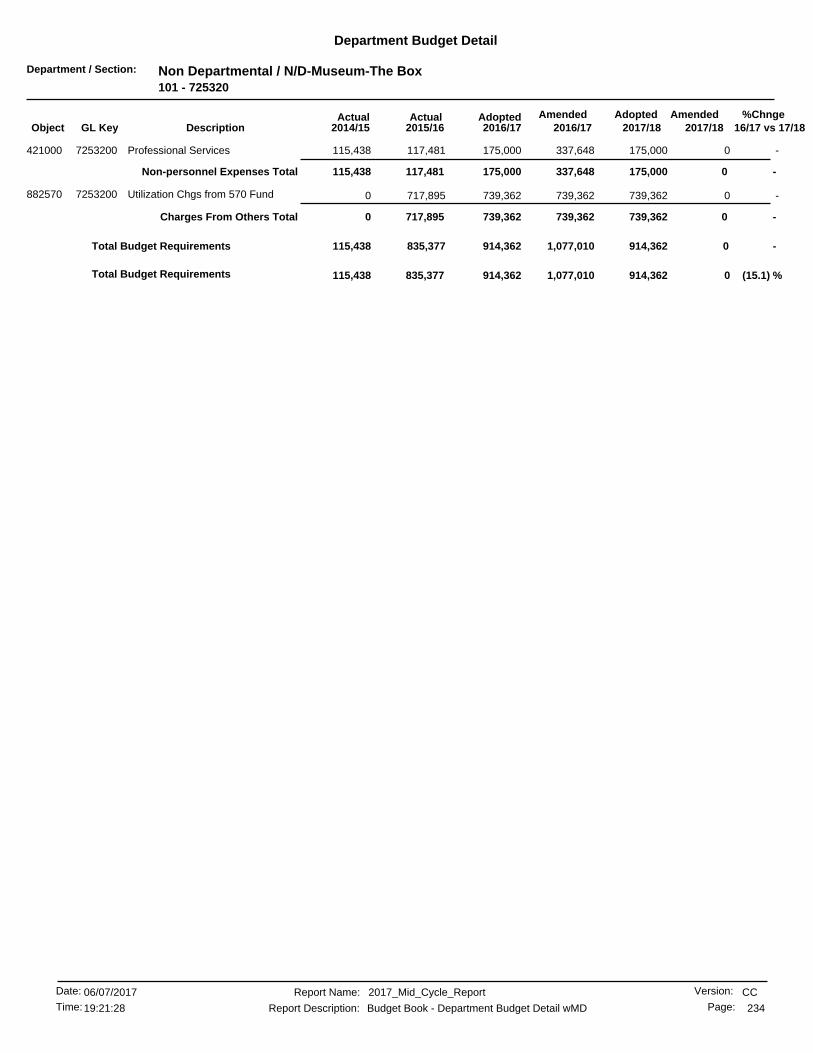
Department / Section: Non Departmental / N/D-Museum-The Box101 - 725320
Department Budget Detail
%Chnge16/17 vs 17/182017/182017/18
AmendedAdoptedAdopted2016/17
AmendedActualActual2016/172015/162014/15GL KeyObject Description
-0175,000 175,000337,648117,481421000 Professional Services7253200 115,438
-175,000 0Non-personnel Expenses Total 175,000337,648117,481115,438
-0739,362 739,362739,362717,895882570 Utilization Chgs from 570 Fund7253200 0
-739,362 0Charges From Others Total 739,362739,362717,8950
-914,362 0914,3621,077,010835,377115,438Total Budget Requirements
(15.1) %0914,362 914,3621,077,010835,377Total Budget Requirements 115,438
CCReport Name: 2017_Mid_Cycle_Report
Report Description: Budget Book - Department Budget Detail wMD
06/07/2017Date:
Time: 234
Version:
Page:19:21:28

Department / Section: Non Departmental / N/D-Museum-Showcase101 - 725330
Department Budget Detail
%Chnge16/17 vs 17/182017/182017/18
AmendedAdoptedAdopted2016/17
AmendedActualActual2016/172015/162014/15GL KeyObject Description
-0 000413Professional Services7253300421000 0
-0 0Non-personnel Expenses Total 000413
-00 000Total Budget Requirements 413
CCReport Name: 2017_Mid_Cycle_Report
Report Description: Budget Book - Department Budget Detail wMD
06/07/2017Date:
Time: 235
Version:
Page:19:21:28
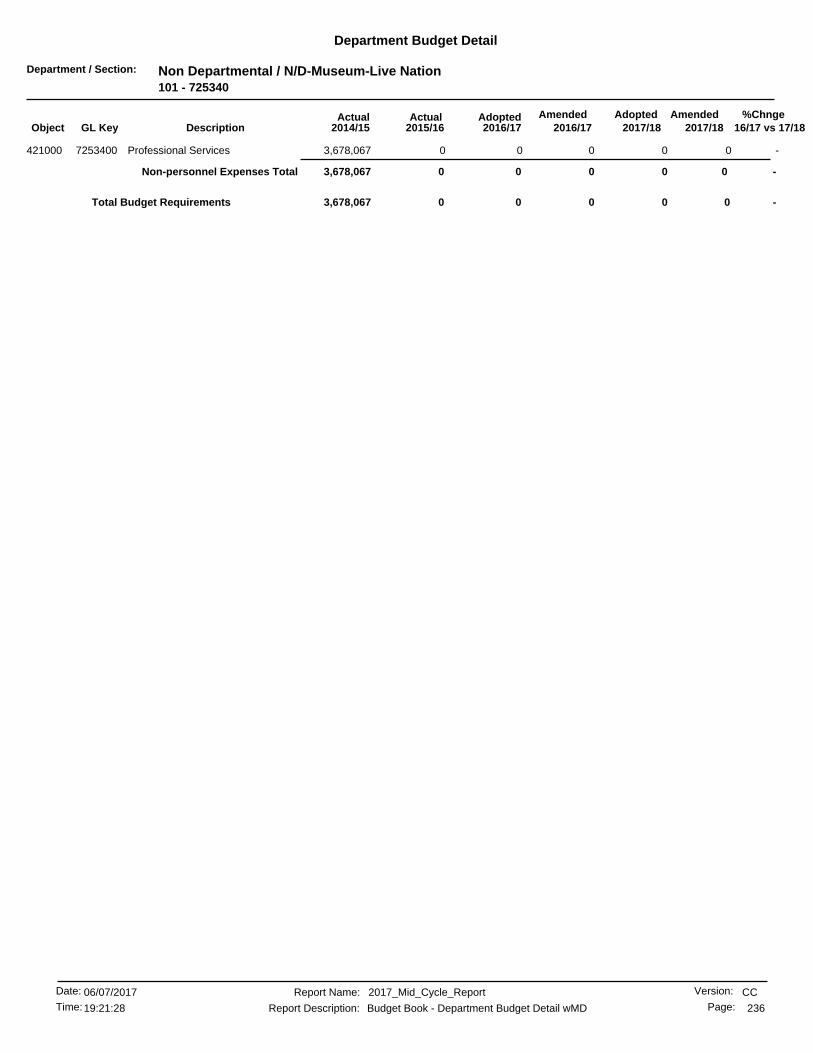
Department / Section: Non Departmental / N/D-Museum-Live Nation101 - 725340
Department Budget Detail
%Chnge16/17 vs 17/182017/182017/18
AmendedAdoptedAdopted2016/17
AmendedActualActual2016/172015/162014/15GL KeyObject Description
-0 0003,678,067Professional Services7253400421000 0
-0 0Non-personnel Expenses Total 0003,678,067
-00 000Total Budget Requirements 3,678,067
CCReport Name: 2017_Mid_Cycle_Report
Report Description: Budget Book - Department Budget Detail wMD
06/07/2017Date:
Time: 236
Version:
Page:19:21:28
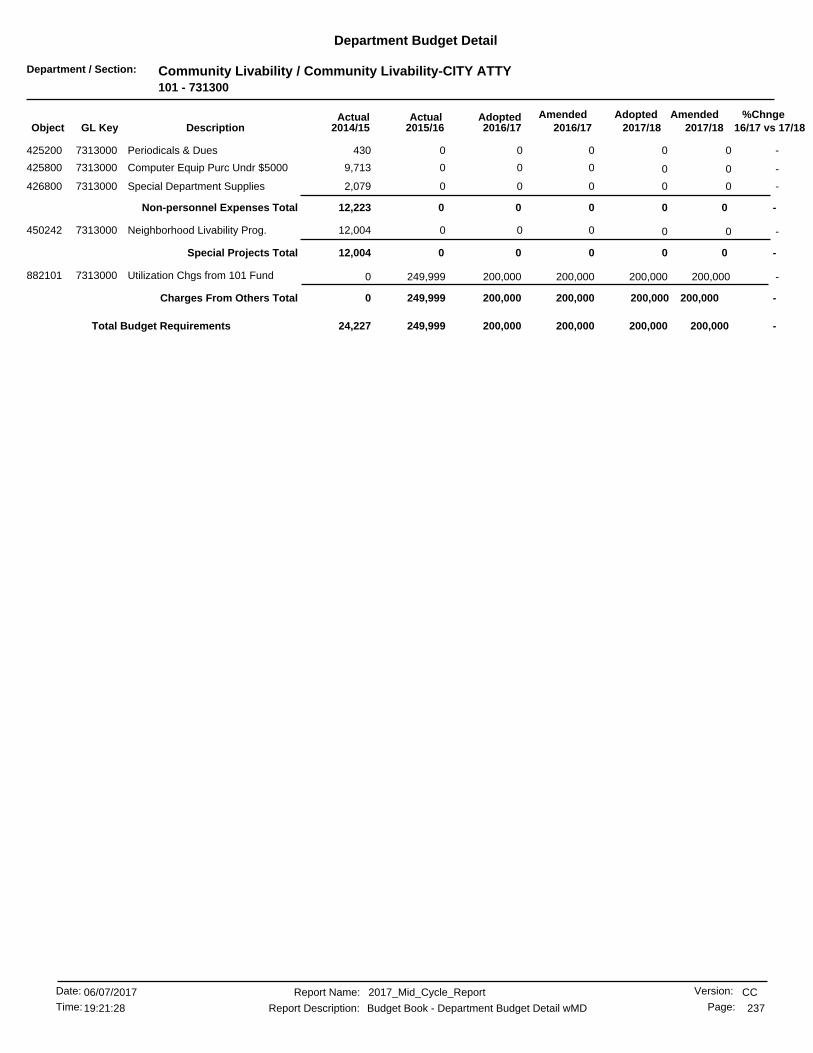
Department / Section: Community Livability / Community Livability-CITY ATTY101 - 731300
Department Budget Detail
%Chnge16/17 vs 17/182017/182017/18
AmendedAdoptedAdopted2016/17
AmendedActualActual2016/172015/162014/15GL KeyObject Description
-0 000430Periodicals & Dues7313000425200 0
-0 0009,713Computer Equip Purc Undr $50007313000425800 0
-0 0002,079Special Department Supplies7313000426800 0
-0 0Non-personnel Expenses Total 00012,223
-0 00012,004Neighborhood Livability Prog.7313000450242 0
-0 0Special Projects Total 00012,004
-200,000200,000 200,000200,000249,999882101 Utilization Chgs from 101 Fund7313000 0
-200,000200,000200,000 200,000Charges From Others Total 249,9990
-200,000 200,000200,000200,000249,99924,227Total Budget Requirements
CCReport Name: 2017_Mid_Cycle_Report
Report Description: Budget Book - Department Budget Detail wMD
06/07/2017Date:
Time: 237
Version:
Page:19:21:28

Department / Section: Community Livability / Community Livability-CDD101 - 732800
Department Budget Detail
%Chnge16/17 vs 17/182017/182017/18
AmendedAdoptedAdopted2016/17
AmendedActualActual2016/172015/162014/15GL KeyObject Description
-25,000 25,00050,00000Professional Services7328000421000 25,000
-0 003,30015,251Special Department Supplies7328000426800 0
-25,00050,00025,000 25,000Non-personnel Expenses Total 3,30015,251
-25,000 25,00025,00050,0003,30015,251Total Budget Requirements
CCReport Name: 2017_Mid_Cycle_Report
Report Description: Budget Book - Department Budget Detail wMD
06/07/2017Date:
Time: 238
Version:
Page:19:21:28
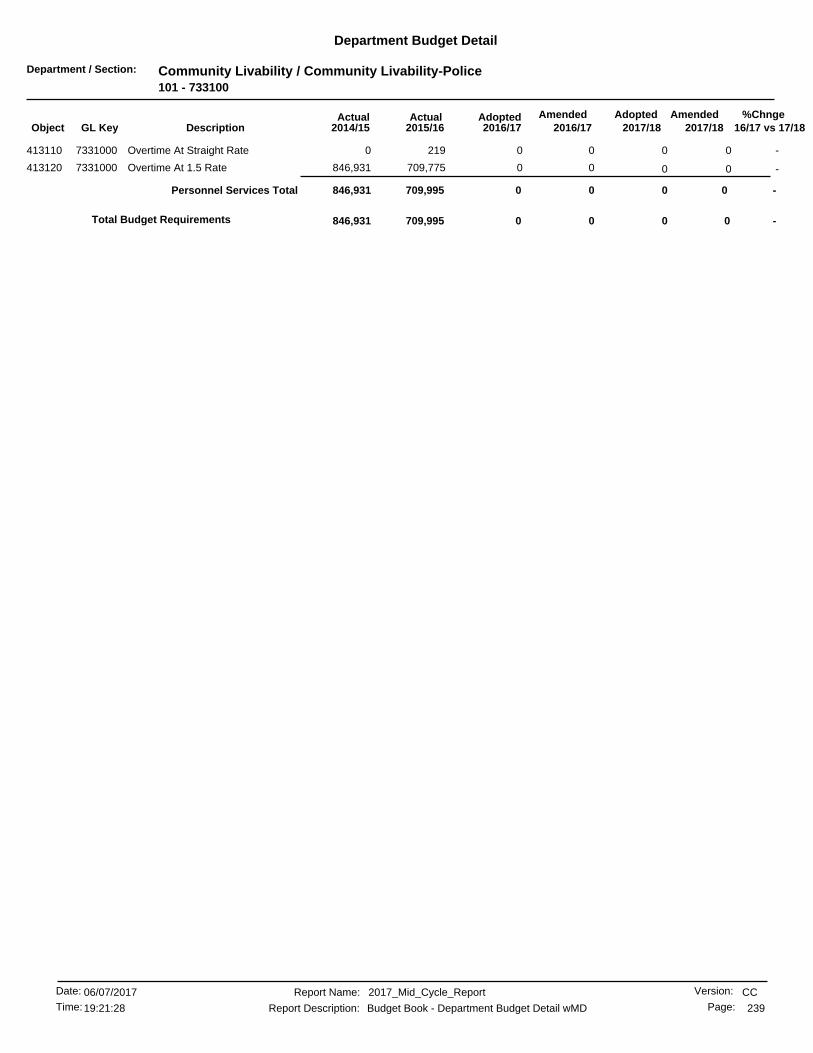
Department / Section: Community Livability / Community Livability-Police101 - 733100
Department Budget Detail
%Chnge16/17 vs 17/182017/182017/18
AmendedAdoptedAdopted2016/17
AmendedActualActual2016/172015/162014/15GL KeyObject Description
-0 002190Overtime At Straight Rate7331000413110 0
-0 00709,775846,931Overtime At 1.5 Rate7331000413120 0
-0 0Personnel Services Total 00709,995846,931
-00 00709,995Total Budget Requirements 846,931
CCReport Name: 2017_Mid_Cycle_Report
Report Description: Budget Book - Department Budget Detail wMD
06/07/2017Date:
Time: 239
Version:
Page:19:21:28

Department / Section: City Manager / City Manager-Administration110 - 110000
Department Budget Detail
%Chnge16/17 vs 17/182017/182017/18
AmendedAdoptedAdopted2016/17
AmendedActualActual2016/172015/162014/15GL KeyObject Description
(100.0)%0 213,800000Salaries - Regular1100009411100 0
(100.0)%0 1,204000Accrued Payroll1100009411510 0
(100.0)%0 2,108000Workers Compensation Ins1100009412210 0
(100.0)%0 31,450000Health Insurance1100009412220 0
(100.0)%0 1,080000Dental Insurance1100009412222 0
(100.0)%0 114000Unemployment Insurance1100009412240 0
(100.0)%0 72,034000PERS Retirement1100009412310 0
(100.0)%0 2,940000Medicare OASDI1100009412320 0
(100.0)%0 3,000000Deferred Compensation1100009412400 0
(100.0) %0 327,730Personnel Services Total 0000
(100.0)%0 2,574000Liability Insurance1100009428400 0
(100.0) %0 2,574Non-personnel Expenses Total 0000
-330,3040 000Total Budget Requirements 0
CCReport Name: 2017_Mid_Cycle_Report
Report Description: Budget Book - Department Budget Detail wMD
06/07/2017Date:
Time: 240
Version:
Page:19:21:28
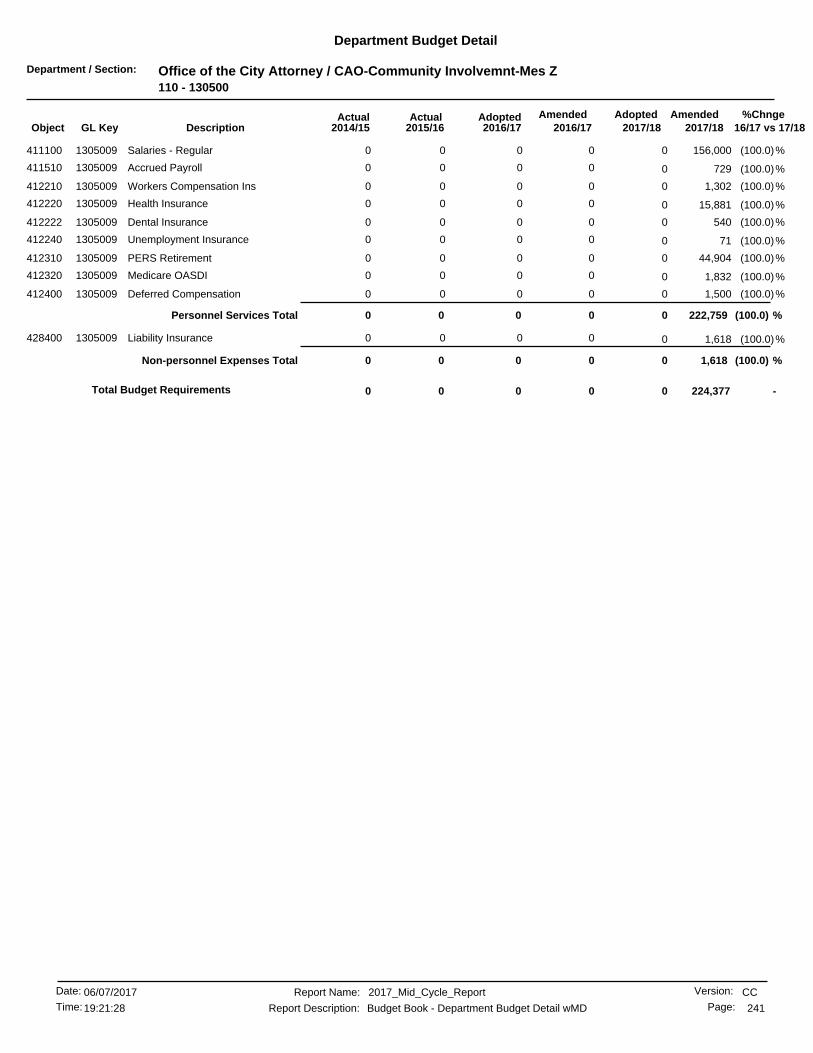
Department / Section: Office of the City Attorney / CAO-Community Involvemnt-Mes Z110 - 130500
Department Budget Detail
%Chnge16/17 vs 17/182017/182017/18
AmendedAdoptedAdopted2016/17
AmendedActualActual2016/172015/162014/15GL KeyObject Description
(100.0)%0 156,000000Salaries - Regular1305009411100 0
(100.0)%0 729000Accrued Payroll1305009411510 0
(100.0)%0 1,302000Workers Compensation Ins1305009412210 0
(100.0)%0 15,881000Health Insurance1305009412220 0
(100.0)%0 540000Dental Insurance1305009412222 0
(100.0)%0 71000Unemployment Insurance1305009412240 0
(100.0)%0 44,904000PERS Retirement1305009412310 0
(100.0)%0 1,832000Medicare OASDI1305009412320 0
(100.0)%0 1,500000Deferred Compensation1305009412400 0
(100.0) %0 222,759Personnel Services Total 0000
(100.0)%0 1,618000Liability Insurance1305009428400 0
(100.0) %0 1,618Non-personnel Expenses Total 0000
-224,3770 000Total Budget Requirements 0
CCReport Name: 2017_Mid_Cycle_Report
Report Description: Budget Book - Department Budget Detail wMD
06/07/2017Date:
Time: 241
Version:
Page:19:21:28
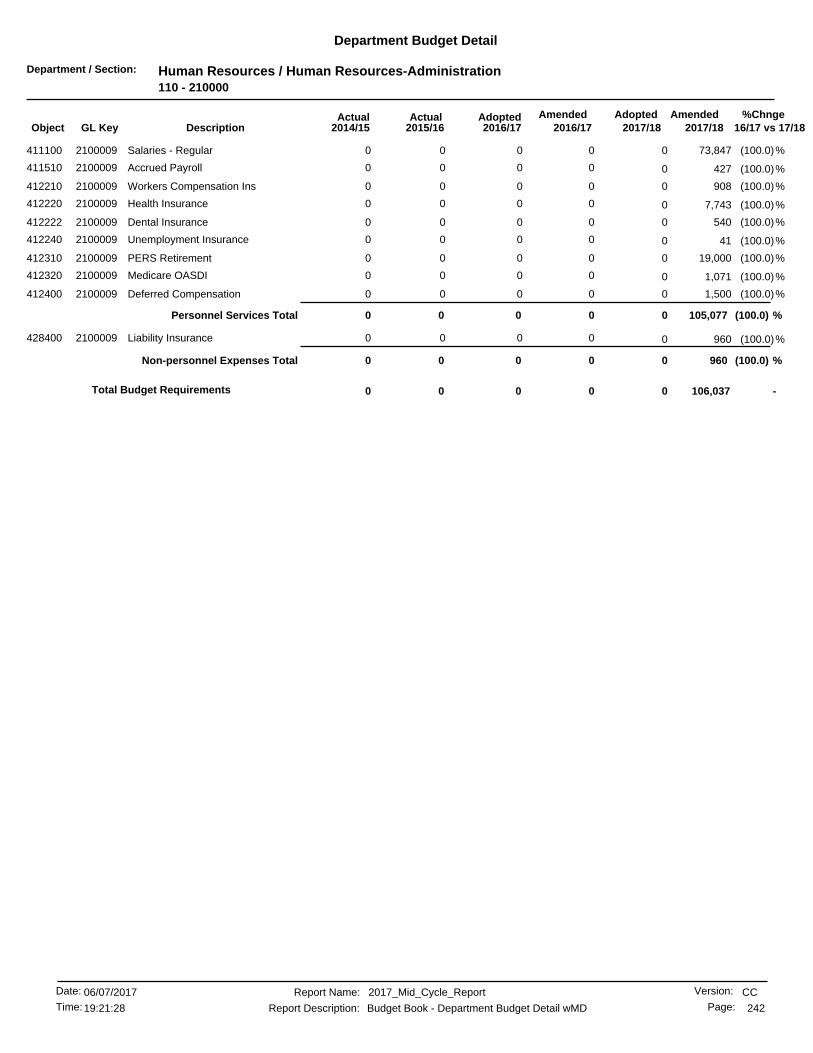
Department / Section: Human Resources / Human Resources-Administration110 - 210000
Department Budget Detail
%Chnge16/17 vs 17/182017/182017/18
AmendedAdoptedAdopted2016/17
AmendedActualActual2016/172015/162014/15GL KeyObject Description
(100.0)%0 73,847000Salaries - Regular2100009411100 0
(100.0)%0 427000Accrued Payroll2100009411510 0
(100.0)%0 908000Workers Compensation Ins2100009412210 0
(100.0)%0 7,743000Health Insurance2100009412220 0
(100.0)%0 540000Dental Insurance2100009412222 0
(100.0)%0 41000Unemployment Insurance2100009412240 0
(100.0)%0 19,000000PERS Retirement2100009412310 0
(100.0)%0 1,071000Medicare OASDI2100009412320 0
(100.0)%0 1,500000Deferred Compensation2100009412400 0
(100.0) %0 105,077Personnel Services Total 0000
(100.0)%0 960000Liability Insurance2100009428400 0
(100.0) %0 960Non-personnel Expenses Total 0000
-106,0370 000Total Budget Requirements 0
CCReport Name: 2017_Mid_Cycle_Report
Report Description: Budget Book - Department Budget Detail wMD
06/07/2017Date:
Time: 242
Version:
Page:19:21:28

Department / Section: General Services / Gen Svs-Bldg Svs-Maintenance110 - 221000
Department Budget Detail
%Chnge16/17 vs 17/182017/182017/18
AmendedAdoptedAdopted2016/17
AmendedActualActual2016/172015/162014/15GL KeyObject Description
(100.0)%0 1,100,000000Maint/Repair of Bldgs & Improv2210009424130 0
(100.0) %0 1,100,000Non-personnel Expenses Total 0000
-1,100,0000 000Total Budget Requirements 0
CCReport Name: 2017_Mid_Cycle_Report
Report Description: Budget Book - Department Budget Detail wMD
06/07/2017Date:
Time: 243
Version:
Page:19:21:28

Department / Section: General Services / Capital Projects110 - 224000
Department Budget Detail
%Chnge16/17 vs 17/182017/182017/18
AmendedAdoptedAdopted2016/17
AmendedActualActual2016/172015/162014/15GL KeyObject Description
(100.0)%0 100,000000Professional Services2240009421000 0
(100.0) %0 100,000Non-personnel Expenses Total 0000
-100,0000 000Total Budget Requirements 0
CCReport Name: 2017_Mid_Cycle_Report
Report Description: Budget Book - Department Budget Detail wMD
06/07/2017Date:
Time: 244
Version:
Page:19:21:28
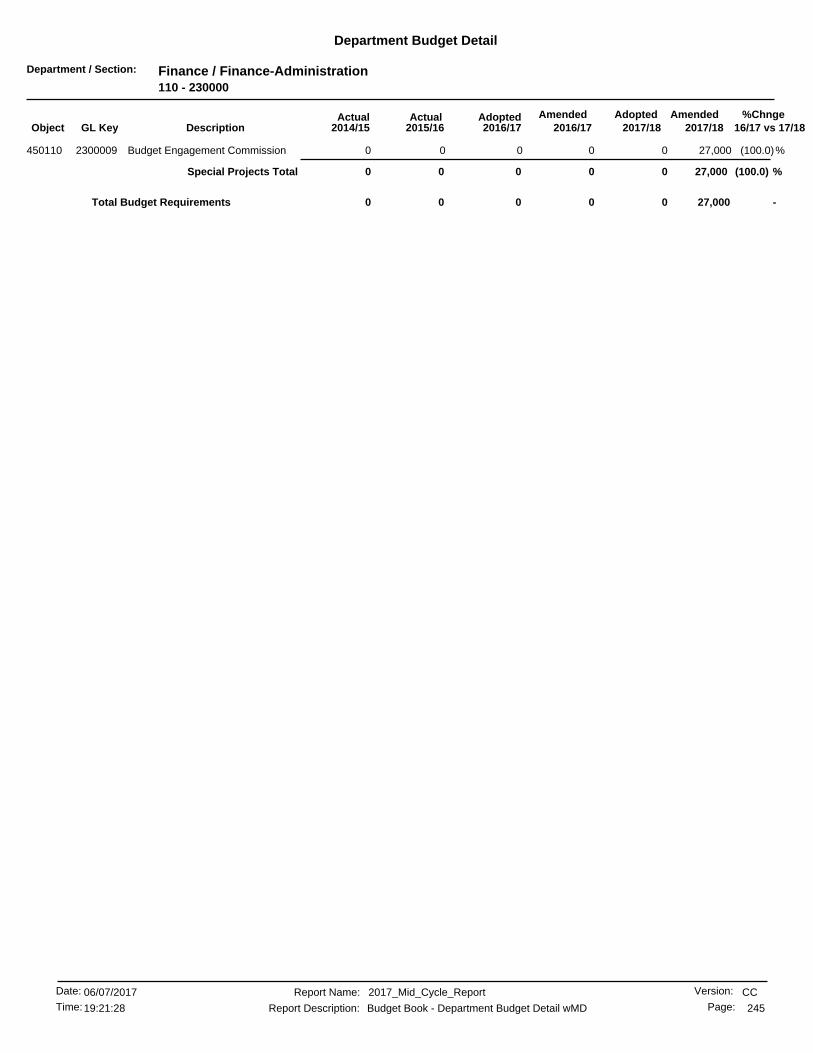
Department / Section: Finance / Finance-Administration110 - 230000
Department Budget Detail
%Chnge16/17 vs 17/182017/182017/18
AmendedAdoptedAdopted2016/17
AmendedActualActual2016/172015/162014/15GL KeyObject Description
(100.0)%0 27,000000Budget Engagement Commission2300009450110 0
(100.0) %0 27,000Special Projects Total 0000
-27,0000 000Total Budget Requirements 0
CCReport Name: 2017_Mid_Cycle_Report
Report Description: Budget Book - Department Budget Detail wMD
06/07/2017Date:
Time: 245
Version:
Page:19:21:28

Department / Section: Finance / Finance-Liability Trust110 - 232020
Department Budget Detail
%Chnge16/17 vs 17/182017/182017/18
AmendedAdoptedAdopted2016/17
AmendedActualActual2016/172015/162014/15GL KeyObject Description
(100.0)%0 20,482,007000Operating Transfer to 101 Fund2320209990101 0
(100.0) %0 20,482,007Operating Transfers Out Total 0000
(100.0)%0 2,500,000000Liability Insurance2320209428400 0
(100.0) %0 2,500,000Non-personnel Expenses Total 0000
-22,982,0070 000Total Budget Requirements 0
CCReport Name: 2017_Mid_Cycle_Report
Report Description: Budget Book - Department Budget Detail wMD
06/07/2017Date:
Time: 246
Version:
Page:19:21:28
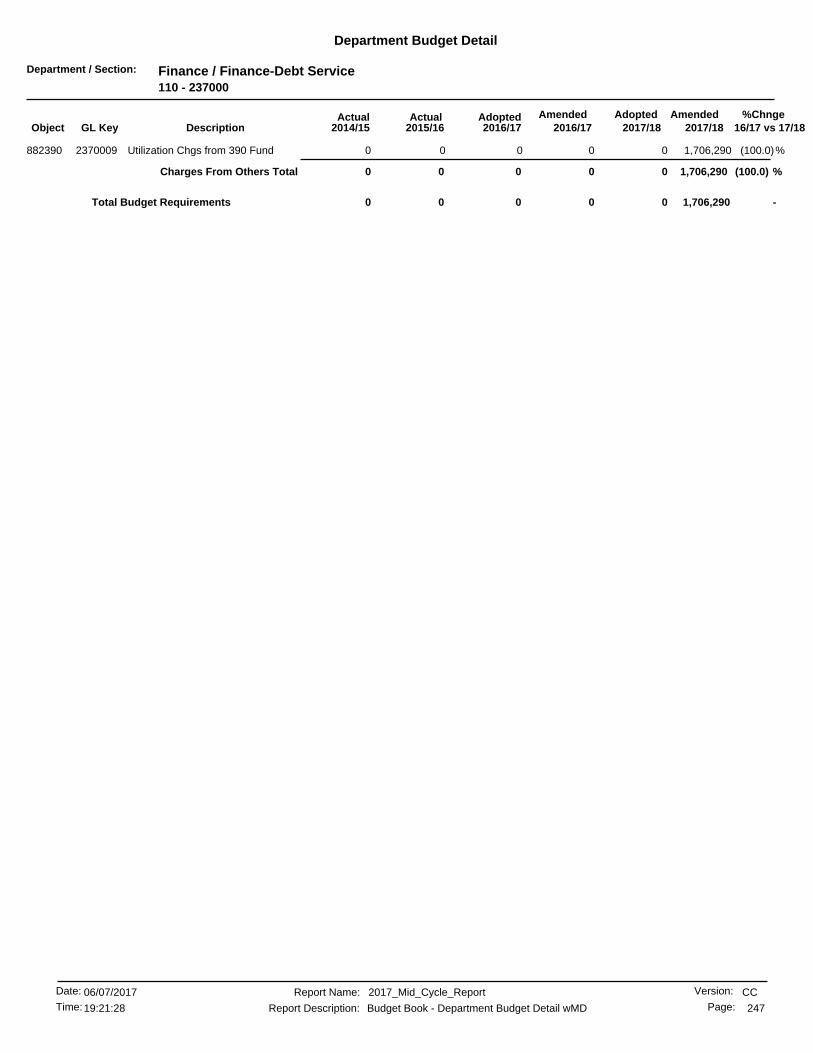
Department / Section: Finance / Finance-Debt Service110 - 237000
Department Budget Detail
%Chnge16/17 vs 17/182017/182017/18
AmendedAdoptedAdopted2016/17
AmendedActualActual2016/172015/162014/15GL KeyObject Description
(100.0)%0 1,706,290000Utilization Chgs from 390 Fund2370009882390 0
(100.0) %0 1,706,290Charges From Others Total 0000
-1,706,2900 000Total Budget Requirements 0
CCReport Name: 2017_Mid_Cycle_Report
Report Description: Budget Book - Department Budget Detail wMD
06/07/2017Date:
Time: 247
Version:
Page:19:21:28

Department / Section: Innovation and Technology / IT-Project Management110 - 243500
Department Budget Detail
%Chnge16/17 vs 17/182017/182017/18
AmendedAdoptedAdopted2016/17
AmendedActualActual2016/172015/162014/15GL KeyObject Description
(100.0)%0 2,000,000000Technology Replacement Prog-PC2435009462310 0
(100.0) %0 2,000,000Equipment Outlay Total 0000
-2,000,0000 000Total Budget Requirements 0
CCReport Name: 2017_Mid_Cycle_Report
Report Description: Budget Book - Department Budget Detail wMD
06/07/2017Date:
Time: 248
Version:
Page:19:21:28
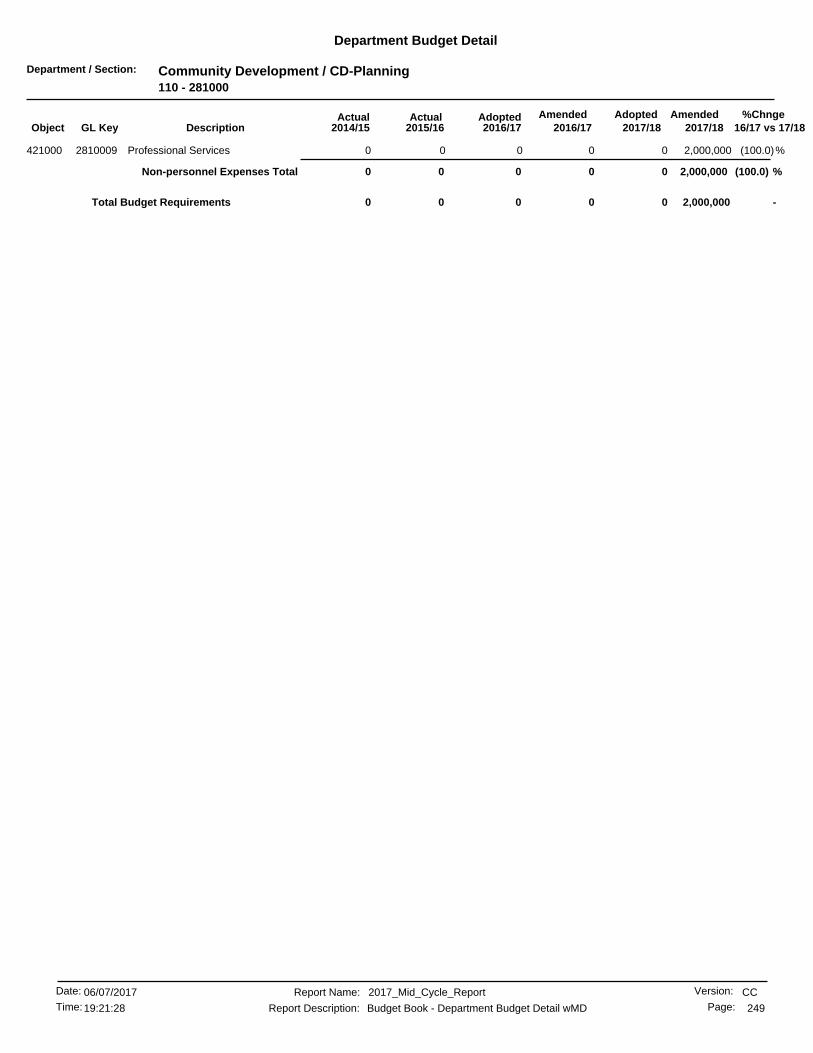
Department / Section: Community Development / CD-Planning110 - 281000
Department Budget Detail
%Chnge16/17 vs 17/182017/182017/18
AmendedAdoptedAdopted2016/17
AmendedActualActual2016/172015/162014/15GL KeyObject Description
(100.0)%0 2,000,000000Professional Services2810009421000 0
(100.0) %0 2,000,000Non-personnel Expenses Total 0000
-2,000,0000 000Total Budget Requirements 0
CCReport Name: 2017_Mid_Cycle_Report
Report Description: Budget Book - Department Budget Detail wMD
06/07/2017Date:
Time: 249
Version:
Page:19:21:28

Department / Section: Community Development / CD-Outreach Homeless Services110 - 285531
Department Budget Detail
%Chnge16/17 vs 17/182017/182017/18
AmendedAdoptedAdopted2016/17
AmendedActualActual2016/172015/162014/15GL KeyObject Description
(100.0)%0 500,000000Professional Services2855319421000 0
(100.0) %0 500,000Non-personnel Expenses Total 0000
-500,0000 000Total Budget Requirements 0
CCReport Name: 2017_Mid_Cycle_Report
Report Description: Budget Book - Department Budget Detail wMD
06/07/2017Date:
Time: 250
Version:
Page:19:21:28

Department / Section: Police / Police-Office of the Chief110 - 310000
Department Budget Detail
%Chnge16/17 vs 17/182017/182017/18
AmendedAdoptedAdopted2016/17
AmendedActualActual2016/172015/162014/15GL KeyObject Description
(100.0)%0 205,671000Salaries - Regular3100009411100 0
(100.0)%0 1,137000Accrued Payroll3100009411510 0
(100.0)%0 11,064000Workers Compensation Ins3100009412210 0
(100.0)%0 33,858000Health Insurance3100009412220 0
(100.0)%0 1,620000Dental Insurance3100009412222 0
(100.0)%0 114000Unemployment Insurance3100009412240 0
(100.0)%0 408000Disability Insurance3100009412250 0
(100.0)%0 51,213000PERS Retirement3100009412310 0
(100.0)%0 2,982000Medicare OASDI3100009412320 0
(100.0) %0 308,067Personnel Services Total 0000
(100.0)%0 20,000000Training3100009427200 0
(100.0)%0 12,177000Liability Insurance3100009428400 0
(100.0) %0 32,177Non-personnel Expenses Total 0000
-340,2440 000Total Budget Requirements 0
CCReport Name: 2017_Mid_Cycle_Report
Report Description: Budget Book - Department Budget Detail wMD
06/07/2017Date:
Time: 251
Version:
Page:19:21:28

Department / Section: Police / Police-Support Services110 - 310200
Department Budget Detail
%Chnge16/17 vs 17/182017/182017/18
AmendedAdoptedAdopted2016/17
AmendedActualActual2016/172015/162014/15GL KeyObject Description
(100.0)%0 399,204000Salaries - Regular3102009411100 0
(100.0)%0 25,000000Salaries-Temp & Part Time3102009411110 0
(100.0)%0 5,000000Vacation Payoffs3102009411410 0
(100.0)%0 2,449000Accrued Payroll3102009411510 0
(100.0)%0 21,914000Workers Compensation Ins3102009412210 0
(100.0)%0 104,254000Health Insurance3102009412220 0
(100.0)%0 4,756000Dental Insurance3102009412222 0
(100.0)%0 227000Unemployment Insurance3102009412240 0
(100.0)%0 1,224000Disability Insurance3102009412250 0
(100.0)%0 98,204000PERS Retirement3102009412310 0
(100.0)%0 5,906000Medicare OASDI3102009412320 0
(100.0) %0 668,138Personnel Services Total 0000
(100.0)%0 90,000000Professional Services3102009421000 0
(100.0)%0 15,000000Training3102009427200 0
(100.0)%0 24,112000Liability Insurance3102009428400 0
(100.0) %0 129,112Non-personnel Expenses Total 0000
-797,2500 000Total Budget Requirements 0
CCReport Name: 2017_Mid_Cycle_Report
Report Description: Budget Book - Department Budget Detail wMD
06/07/2017Date:
Time: 252
Version:
Page:19:21:28

Department / Section: Police / Police-Field Operations110 - 311500
Department Budget Detail
%Chnge16/17 vs 17/182017/182017/18
AmendedAdoptedAdopted2016/17
AmendedActualActual2016/172015/162014/15GL KeyObject Description
(100.0)%0 1,743,112000Salaries - Regular3115009411100 0
(100.0)%0 7,667000Accrued Payroll3115009411510 0
(100.0)%0 93,772000Workers Compensation Ins3115009412210 0
(100.0)%0 113,730000Health Insurance3115009412220 0
(100.0)%0 20,400000Retiree Health Insurance3115009412221 0
(100.0)%0 272000RPOA Insurance3115009412223 0
(100.0)%0 969000Unemployment Insurance3115009412240 0
(100.0)%0 2,040000Disability Insurance3115009412250 0
(100.0)%0 885,394000PERS Retirement3115009412310 0
(100.0)%0 25,279000Medicare OASDI3115009412320 0
(100.0)%0 25,000000Overtime At 1.5 Rate3115009413120 0
(100.0) %0 2,917,635Personnel Services Total 0000
(100.0)%0 150,000000Clothing/Linen/Safety Supplies3115009426200 0
(100.0)%0 150,000000Special Department Supplies3115009426800 0
(100.0)%0 150,000000Training3115009427200 0
(100.0)%0 150,000000Training - P.O.S.T.3115009427210 0
(100.0)%0 103,190000Liability Insurance3115009428400 0
(100.0) %0 703,190Non-personnel Expenses Total 0000
(100.0)%0 2,064,822000Vehicle Replacement - PD3115009450057 0
(100.0) %0 2,064,822Special Projects Total 0000
(100.0)%0 181,000000Utilization Chgs from 101 Fund3115009882101 0
(100.0) %0 181,000Charges From Others Total 0000
-5,866,6470 000Total Budget Requirements 0
CCReport Name: 2017_Mid_Cycle_Report
Report Description: Budget Book - Department Budget Detail wMD
06/07/2017Date:
Time: 253
Version:
Page:19:21:28

Department / Section: Police / Police-Capital110 - 319500
Department Budget Detail
%Chnge16/17 vs 17/182017/182017/18
AmendedAdoptedAdopted2016/17
AmendedActualActual2016/172015/162014/15GL KeyObject Description
(100.0)%0 690,000000Utilization Chgs from 390 Fund3195009882390 0
(100.0) %0 690,000Charges From Others Total 0000
-690,0000 000Total Budget Requirements 0
CCReport Name: 2017_Mid_Cycle_Report
Report Description: Budget Book - Department Budget Detail wMD
06/07/2017Date:
Time: 254
Version:
Page:19:21:28
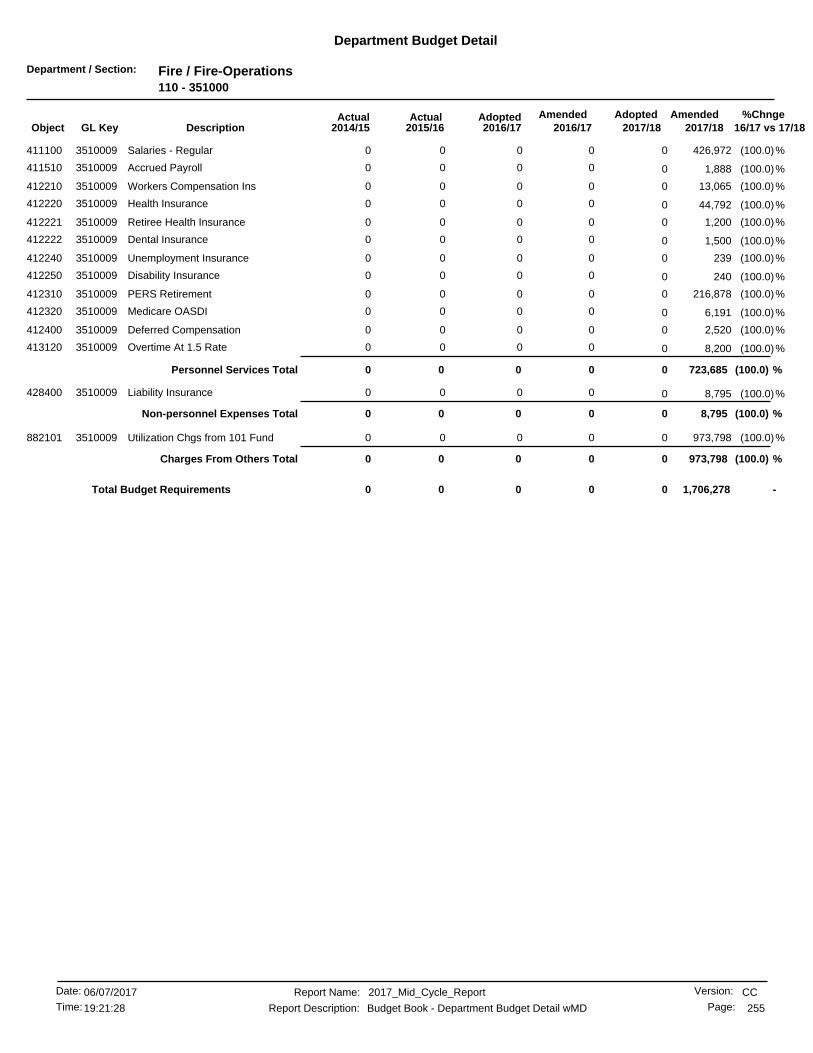
Department / Section: Fire / Fire-Operations110 - 351000
Department Budget Detail
%Chnge16/17 vs 17/182017/182017/18
AmendedAdoptedAdopted2016/17
AmendedActualActual2016/172015/162014/15GL KeyObject Description
(100.0)%0 426,972000Salaries - Regular3510009411100 0
(100.0)%0 1,888000Accrued Payroll3510009411510 0
(100.0)%0 13,065000Workers Compensation Ins3510009412210 0
(100.0)%0 44,792000Health Insurance3510009412220 0
(100.0)%0 1,200000Retiree Health Insurance3510009412221 0
(100.0)%0 1,500000Dental Insurance3510009412222 0
(100.0)%0 239000Unemployment Insurance3510009412240 0
(100.0)%0 240000Disability Insurance3510009412250 0
(100.0)%0 216,878000PERS Retirement3510009412310 0
(100.0)%0 6,191000Medicare OASDI3510009412320 0
(100.0)%0 2,520000Deferred Compensation3510009412400 0
(100.0)%0 8,200000Overtime At 1.5 Rate3510009413120 0
(100.0) %0 723,685Personnel Services Total 0000
(100.0)%0 8,795000Liability Insurance3510009428400 0
(100.0) %0 8,795Non-personnel Expenses Total 0000
(100.0)%0 973,798000Utilization Chgs from 101 Fund3510009882101 0
(100.0) %0 973,798Charges From Others Total 0000
-1,706,2780 000Total Budget Requirements 0
CCReport Name: 2017_Mid_Cycle_Report
Report Description: Budget Book - Department Budget Detail wMD
06/07/2017Date:
Time: 255
Version:
Page:19:21:28

Department / Section: Fire / Fire-Capital110 - 359500
Department Budget Detail
%Chnge16/17 vs 17/182017/182017/18
AmendedAdoptedAdopted2016/17
AmendedActualActual2016/172015/162014/15GL KeyObject Description
(100.0)%0 1,690,000000Utilization Chgs from 390 Fund3595009882390 0
(100.0) %0 1,690,000Charges From Others Total 0000
-1,690,0000 000Total Budget Requirements 0
CCReport Name: 2017_Mid_Cycle_Report
Report Description: Budget Book - Department Budget Detail wMD
06/07/2017Date:
Time: 256
Version:
Page:19:21:28
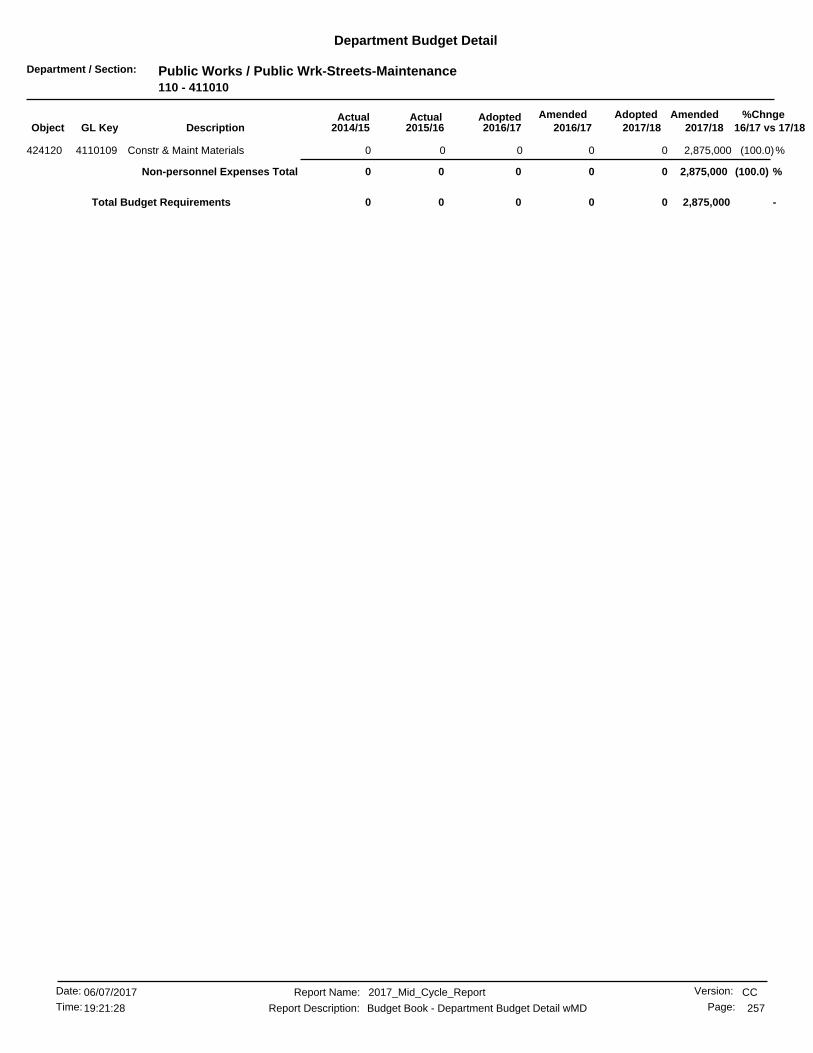
Department / Section: Public Works / Public Wrk-Streets-Maintenance110 - 411010
Department Budget Detail
%Chnge16/17 vs 17/182017/182017/18
AmendedAdoptedAdopted2016/17
AmendedActualActual2016/172015/162014/15GL KeyObject Description
(100.0)%0 2,875,000000Constr & Maint Materials4110109424120 0
(100.0) %0 2,875,000Non-personnel Expenses Total 0000
-2,875,0000 000Total Budget Requirements 0
CCReport Name: 2017_Mid_Cycle_Report
Report Description: Budget Book - Department Budget Detail wMD
06/07/2017Date:
Time: 257
Version:
Page:19:21:28

Department / Section: Public Works / Public Wrk-Forestry&Landscape110 - 411011
Department Budget Detail
%Chnge16/17 vs 17/182017/182017/18
AmendedAdoptedAdopted2016/17
AmendedActualActual2016/172015/162014/15GL KeyObject Description
(100.0)%0 1,000,000000Tree Maintenance Contract4110119421205 0
(100.0) %0 1,000,000Non-personnel Expenses Total 0000
-1,000,0000 000Total Budget Requirements 0
CCReport Name: 2017_Mid_Cycle_Report
Report Description: Budget Book - Department Budget Detail wMD
06/07/2017Date:
Time: 258
Version:
Page:19:21:28

Department / Section: Community Development / CD-Administration170 - 280000
Department Budget Detail
%Chnge16/17 vs 17/182017/182017/18
AmendedAdoptedAdopted2016/17
AmendedActualActual2016/172015/162014/15GL KeyObject Description
-0 0026,7480Salaries - Regular2800000411100 0
-0 002,7340Vacation2800000411210 0
-0 004680Holidays & Special Days Off2800000411220 0
-0 009940Sick Leave2800000411240 0
-0 001,3160Family Illness Sick Leave2800000411245 0
-0 004970Administrative Leave2800000411292 0
-0 003,513(295)Health Insurance2800000412220 0
-0 00135(10)Dental Insurance2800000412222 0
-0 001760Life Insurance2800000412230 0
-0 0012,9191,722PERS Retirement2800000412310 0
-0 005630Medicare OASDI2800000412320 0
-0 002250Deferred Compensation2800000412400 0
(100.0)%0 21,974000Ptr. Comp. Model2800000419996 0
(100.0) %0 21,974Personnel Services Total 0050,2911,417
-0 008,90565Prof Services/Internal2800000421001 0
-0 0001,969General Office Expense2800000425400 0
-0 0001Postage2800000425500 0
-0 000304Computer Equip Purc Undr $50002800000425800 0
-0 00018Travel & Meeting Expense2800000427100 0
-0 0Non-personnel Expenses Total 008,9052,358
-21,9740 0059,196Total Budget Requirements 3,775
CCReport Name: 2017_Mid_Cycle_Report
Report Description: Budget Book - Department Budget Detail wMD
06/07/2017Date:
Time: 259
Version:
Page:19:21:28
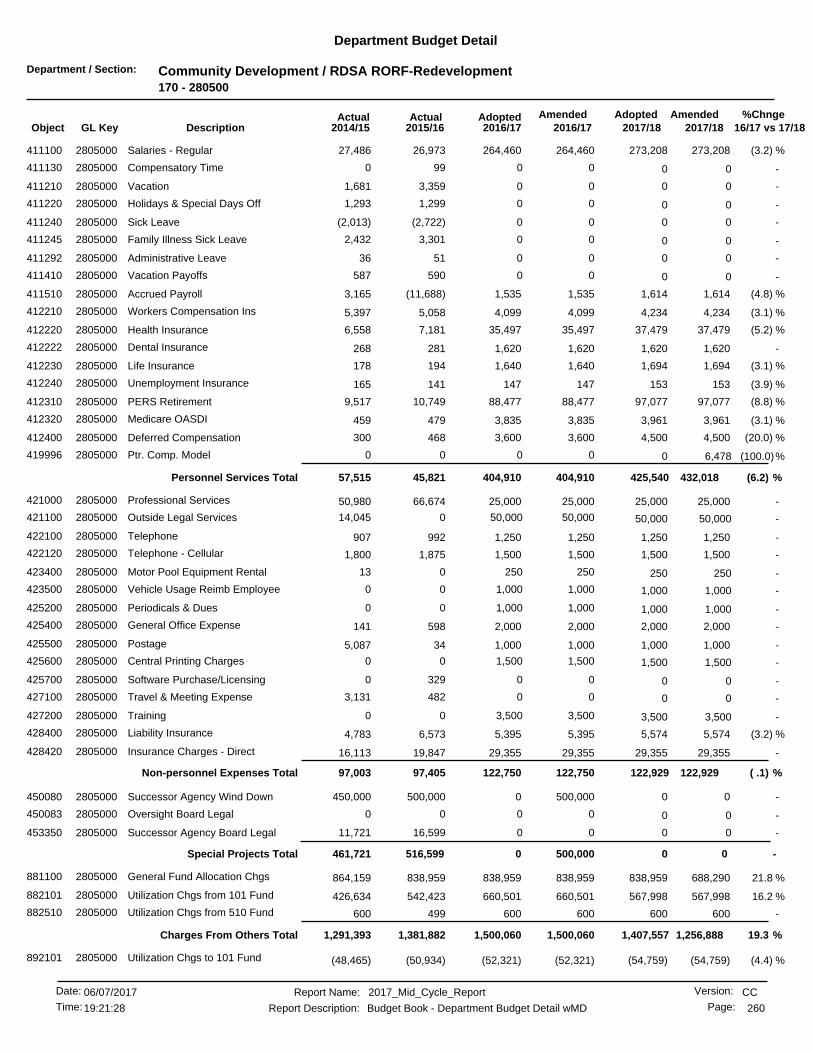
Department / Section: Community Development / RDSA RORF-Redevelopment170 - 280500
Department Budget Detail
%Chnge16/17 vs 17/182017/182017/18
AmendedAdoptedAdopted2016/17
AmendedActualActual2016/172015/162014/15GL KeyObject Description
(3.2) %273,208264,460 273,208264,46026,973411100 Salaries - Regular2805000 27,486
-0 00990Compensatory Time2805000411130 0
-0 003,3591,681Vacation2805000411210 0
-0 001,2991,293Holidays & Special Days Off2805000411220 0
-0 00(2,722)(2,013)Sick Leave2805000411240 0
-0 003,3012,432Family Illness Sick Leave2805000411245 0
-0 005136Administrative Leave2805000411292 0
-0 00590587Vacation Payoffs2805000411410 0
(4.8) %1,6141,535 1,6141,535(11,688)411510 Accrued Payroll2805000 3,165
(3.1) %4,2344,099 4,2344,0995,058412210 Workers Compensation Ins2805000 5,397
(5.2) %37,47935,497 37,47935,4977,181412220 Health Insurance2805000 6,558
-1,6201,620 1,6201,620281412222 Dental Insurance2805000 268
(3.1) %1,6941,640 1,6941,640194412230 Life Insurance2805000 178
(3.9) %153147 153147141412240 Unemployment Insurance2805000 165
(8.8) %97,07788,477 97,07788,47710,749412310 PERS Retirement2805000 9,517
(3.1) %3,9613,835 3,9613,835479412320 Medicare OASDI2805000 459
(20.0) %4,5003,600 4,5003,600468412400 Deferred Compensation2805000 300
(100.0)%0 6,478000Ptr. Comp. Model2805000419996 0
(6.2) %432,018404,910404,910 425,540Personnel Services Total 45,82157,515
-25,00025,000 25,00025,00066,674421000 Professional Services2805000 50,980
-50,000 50,00050,000014,045Outside Legal Services2805000421100 50,000
-1,2501,250 1,2501,250992422100 Telephone2805000 907
-1,5001,500 1,5001,5001,875422120 Telephone - Cellular2805000 1,800
-250 250250013Motor Pool Equipment Rental2805000423400 250
-1,000 1,0001,00000Vehicle Usage Reimb Employee2805000423500 1,000
-1,000 1,0001,00000Periodicals & Dues2805000425200 1,000
-2,0002,000 2,0002,000598425400 General Office Expense2805000 141
-1,0001,000 1,0001,00034425500 Postage2805000 5,087
-1,500 1,5001,50000Central Printing Charges2805000425600 1,500
-0 003290Software Purchase/Licensing2805000425700 0
-0 004823,131Travel & Meeting Expense2805000427100 0
-3,500 3,5003,50000Training2805000427200 3,500
(3.2) %5,5745,395 5,5745,3956,573428400 Liability Insurance2805000 4,783
-29,35529,355 29,35529,35519,847428420 Insurance Charges - Direct2805000 16,113
( .1) %122,929122,750122,750 122,929Non-personnel Expenses Total 97,40597,003
-00 0500,000500,000450080 Successor Agency Wind Down2805000 450,000
-0 0000Oversight Board Legal2805000450083 0
-0 0016,59911,721Successor Agency Board Legal2805000453350 0
-0 0Special Projects Total 0500,000516,599461,721
21.8 %688,290838,959 838,959838,959838,959881100 General Fund Allocation Chgs2805000 864,159
16.2 %567,998660,501 567,998660,501542,423882101 Utilization Chgs from 101 Fund2805000 426,634
-600600 600600499882510 Utilization Chgs from 510 Fund2805000 600
19.3 %1,256,8881,500,0601,500,060 1,407,557Charges From Others Total 1,381,8821,291,393
(4.4) %(54,759)(52,321) (54,759)(52,321)(50,934)892101 Utilization Chgs to 101 Fund2805000 (48,465)
CCReport Name: 2017_Mid_Cycle_Report
Report Description: Budget Book - Department Budget Detail wMD
06/07/2017Date:
Time: 260
Version:
Page:19:21:28

Department / Section: Community Development / RDSA RORF-Redevelopment170 - 280500
Department Budget Detail
%Chnge16/17 vs 17/182017/182017/18
AmendedAdoptedAdopted2016/17
AmendedActualActual2016/172015/162014/15GL KeyObject Description
-0 00(587,297)(293,414)Interfund Services to 101 Fund2805000894101 0
(4.4) %(54,759)(52,321)(52,321) (54,759)Charges to Others Total (638,232)(341,879)
12.4 %1,975,399 1,757,0761,901,2672,475,3991,403,4771,565,754Total Budget Requirements
CCReport Name: 2017_Mid_Cycle_Report
Report Description: Budget Book - Department Budget Detail wMD
06/07/2017Date:
Time: 261
Version:
Page:19:21:28

Department / Section: Fire / Fire-UASI-Riverside205 - 353010
Department Budget Detail
%Chnge16/17 vs 17/182017/182017/18
AmendedAdoptedAdopted2016/17
AmendedActualActual2016/172015/162014/15GL KeyObject Description
-0 00019,281UASI-Riverside,20129147110411100 0
-0 00155,31156,172UASI-Riverside,20149151710411100 0
-0 00133,3250UASI-Riverside,20159154810411100 0
-0 0118,48000UASI-Riverside,20169158110411100 0
-0 0Personnel Services Total 0118,480288,63775,454
-0 00071UASI-Riverside,20149151710425610 0
-0 0Non-personnel Expenses Total 00071
-0 0372,47900UASI-Riverside,20159154810440450 0
-0 000(570)UASI-Riverside,20129147110440451 0
-00 03,617129,382440451 UASI-Riverside,20149151710 0
-00 025,8002,200440451 UASI-Riverside,20159154810 0
-0 046,35000UASI-Riverside,20169158110440451 0
-00 01,853217,890440452 UASI-Riverside,20149151710 0
-0 0160,00000UASI-Riverside,20159154810440452 0
-0 000(38,626)UASI-Riverside,20119142510440453 0
-0 00039,196UASI-Riverside,20129147110440453 0
-0 001,870466UASI-Riverside,20149151710440453 0
-00 0320,55158,548440453 UASI-Riverside,20159154810 0
-0 0555,00000UASI-Riverside,20169158110440453 0
-0 000(3,747)UASI-Riverside,20119142510440454 0
-0 00095,733UASI-Riverside,20129147110440454 0
-0 00113,67857,938UASI-Riverside,20149151710440454 0
-00 0340,55680,433440454 UASI-Riverside,20159154810 0
-0 0426,08900UASI-Riverside,20169158110440454 0
-0 000109UASI-Riverside,20109138410440455 0
-0 00043UASI-Riverside,20119142510440455 0
-0 0003,515UASI-Riverside,20129147110440455 0
-0 001,2591,802UASI-Riverside,20149151710440455 0
-00 02,512593440455 UASI-Riverside,20159154810 0
-0 000114,918UASI-Riverside,20119142510440456 0
-00 090037,798440456 UASI-Riverside,20149151710 24,969
-00 019,8895,110440456 UASI-Riverside,20159154810 0
-0 025,00000UASI-Riverside,20169158110440456 0
-0 000(114,918)UASI-Riverside,20119142510440457 0
-0 0025,748168UASI-Riverside,20149151710440457 0
-0 030,22100UASI-Riverside,20169158110440457 0
-0 0Capital Outlay & Grants Total 02,330,818674,514180,998
-0 002,449,298963,152256,524Total Budget Requirements
(100.0) %00 02,449,298963,152Total Budget Requirements 256,524
CCReport Name: 2017_Mid_Cycle_Report
Report Description: Budget Book - Department Budget Detail wMD
06/07/2017Date:
Time: 262
Version:
Page:19:21:28
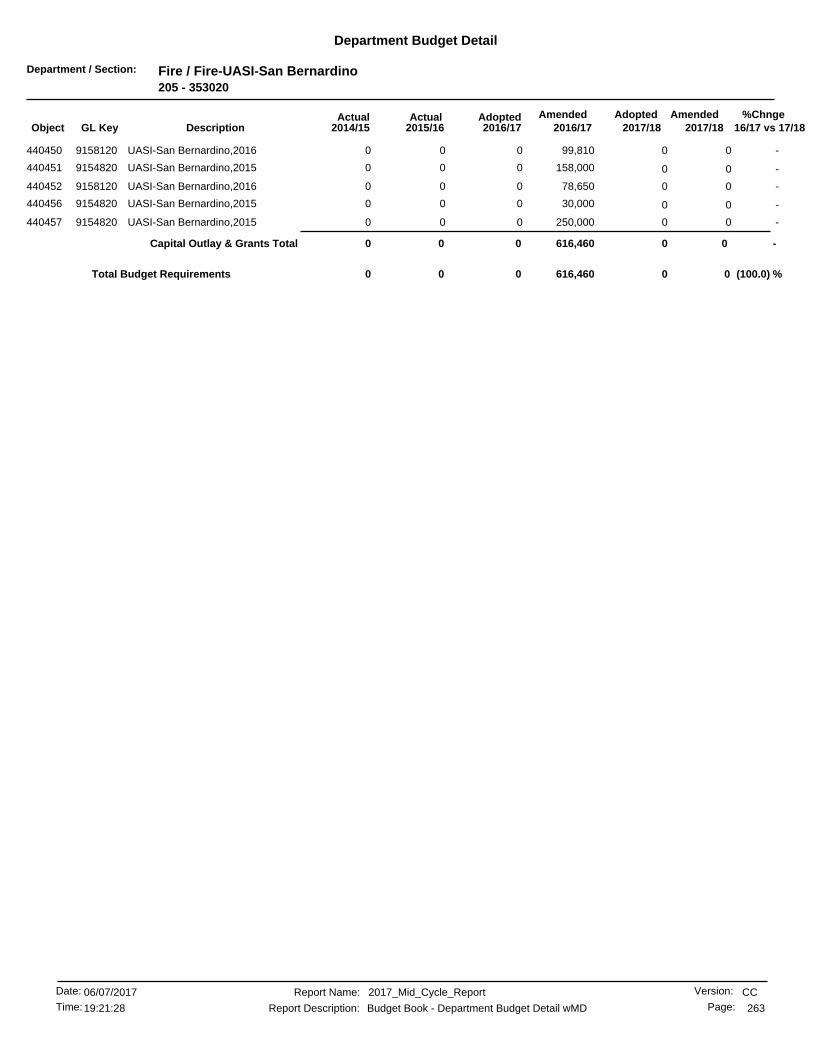
Department / Section: Fire / Fire-UASI-San Bernardino205 - 353020
Department Budget Detail
%Chnge16/17 vs 17/182017/182017/18
AmendedAdoptedAdopted2016/17
AmendedActualActual2016/172015/162014/15GL KeyObject Description
-0 099,81000UASI-San Bernardino,20169158120440450 0
-0 0158,00000UASI-San Bernardino,20159154820440451 0
-0 078,65000UASI-San Bernardino,20169158120440452 0
-0 030,00000UASI-San Bernardino,20159154820440456 0
-0 0250,00000UASI-San Bernardino,20159154820440457 0
-0 0Capital Outlay & Grants Total 0616,46000
(100.0) %00 0616,4600Total Budget Requirements 0
CCReport Name: 2017_Mid_Cycle_Report
Report Description: Budget Book - Department Budget Detail wMD
06/07/2017Date:
Time: 263
Version:
Page:19:21:28
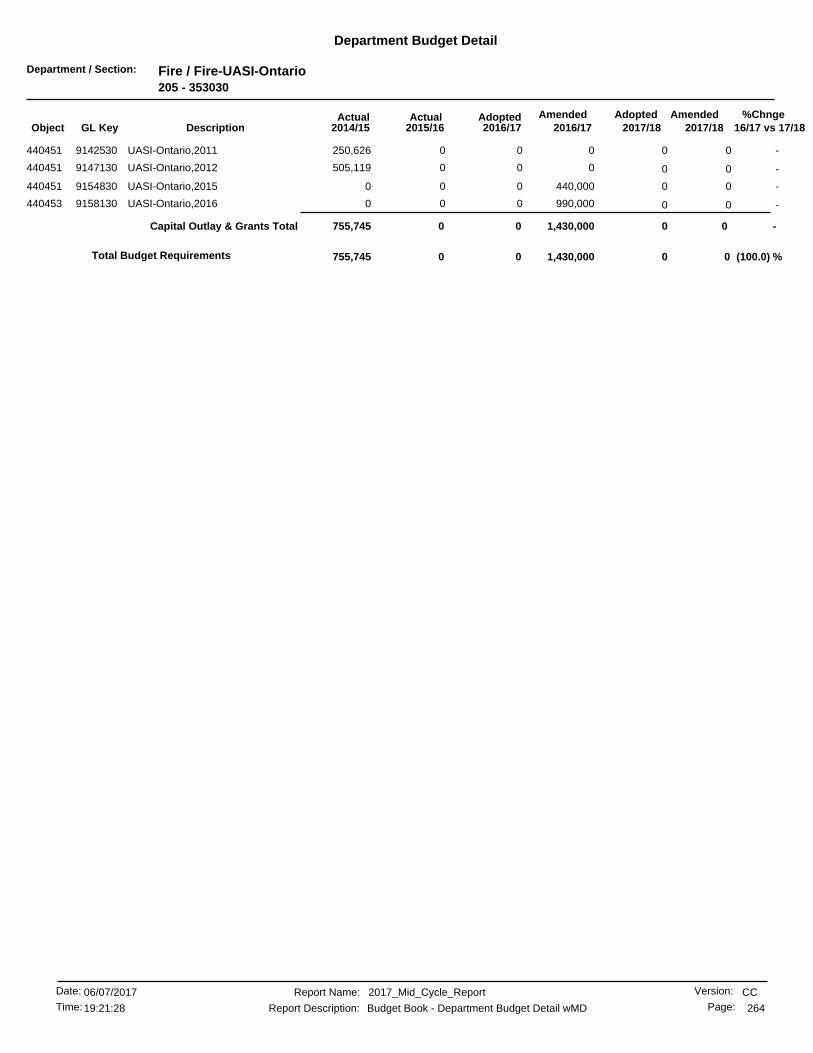
Department / Section: Fire / Fire-UASI-Ontario205 - 353030
Department Budget Detail
%Chnge16/17 vs 17/182017/182017/18
AmendedAdoptedAdopted2016/17
AmendedActualActual2016/172015/162014/15GL KeyObject Description
-0 000250,626UASI-Ontario,20119142530440451 0
-0 000505,119UASI-Ontario,20129147130440451 0
-0 0440,00000UASI-Ontario,20159154830440451 0
-0 0990,00000UASI-Ontario,20169158130440453 0
-0 0Capital Outlay & Grants Total 01,430,0000755,745
(100.0) %00 01,430,0000Total Budget Requirements 755,745
CCReport Name: 2017_Mid_Cycle_Report
Report Description: Budget Book - Department Budget Detail wMD
06/07/2017Date:
Time: 264
Version:
Page:19:21:28

Department / Section: Community Development / Proj-CDBG Projects220 - 283510
Department Budget Detail
%Chnge16/17 vs 17/182017/182017/18
AmendedAdoptedAdopted2016/17
AmendedActualActual2016/172015/162014/15GL KeyObject Description
-2,254,964 2,254,964720,96100Unprogrammed Funds2835100453001 2,254,964
-00 0125,500125,500453003 Homeless Shelter Programs2835100 115,500
-00 079,70079,700453010 Fair Housing Program2835100 85,422
-00 07,5007,500453017 Volunteer Center 211 Riv Co2835100 7,500
-00 04,5504,550453027 Assistance League2835100 4,050
-00 06518,455453031 Lutheran Soc Svs-Transitional2835100 0
-0 0003,410Villegas Music Program2835100453034 0
-00 028,00028,000453035 PRCS Youth Sports2835100 26,662
-0 015,00000Alternatve to Domestic Violenc2835100453048 0
-00 01,3191,168453066 Family Service Association2835100 0
-00 015,60015,600453098 Arlington Temporary Services2835100 15,600
-00 014,50014,500453110 Rape Crisis Center2835100 0
-0 02,90000YWCA Of Riverside2835100453122 0
-00 018,60018,600453126 Whiteside Manor2835100 18,600
-00 07,5007,500453166 Care Connexxus Adult Day Svcs2835100 8,069
-00 07,5007,500453313 Operation Safehse Transitional2835100 7,500
-00 07,5007,500453314 Operation Safehse Shelter2835100 7,500
-0 07,50007,500Catholic Charities Neigh Prog2835100453315 0
-00 02,9002,900453328 ARC-Advance Enterprise2835100 0
-00 05,4002,700453335 Smooth Transition Inc2835100 4,050
-00 028,00028,000453336 Park & Rec - Project Bridge2835100 28,000
-00 06,9506,950453339 Janet Goeske Sr Adivor Svc2835100 6,950
-00 07,7967,203453340 PRCS Sr Breakfast Prog2835100 7,500
-0 0002,305Church of God Prophecy2835100453341 0
-0 0002,824The Carolyn E. Wylie Center2835100453345 0
-00 08,5008,500453346 Riverside School for the Arts2835100 8,500
-0 0005,587POLM Rainy Day Shelter2835100453347 0
-0 040,475014,525AMPAC TRI ST CDC2835100453348 0
-00 02,5002,300453352 IE Latino Lawyers Association2835100 0
-0 002,1760Goodwill Southern California2835100453353 0
-00 025,00024,948453354 Habitat for Humanity2835100 23,642
-0 0000Feed America Rvsd Eman Foster2835100453355 0
-00 07,50015,000453356 Voices for Children CASA2835100 0
-00 05,0005,000453357 Big Brother Big Sister2835100 0
-00 02,5002,500453358 Inspire Life Skills2835100 0
-0 002,5000Olive Crest2835100453359 0
-0 010,00000City HA-Riverside at Work2835100453360 0
-0 010,00000Riverside County HPRP2835100453361 0
-0 02,50000Leading Edge-Community Success2835100453362 0
-0 02,00000Bobby Bonds Day&Youth Festivl2835100453363 0
-200,000200,000 200,000200,000200,000453416 DT Mission Vlg Sect 108 Repmt2835100 200,000
-00 073810,861453601 Casa Blanca Hm Neighborly Svcs2835100 10,814
-00 02,6492,350453607 PRCS Boxing Program2835100 0
-00 018,95527,414459982 Smart Riverside Bridge Proj2835100 27,500
-2,454,9641,454,1472,454,964 2,454,964Special Projects Total 677,378649,514
-00 0110,32899,218440120 Arlington Park Imp Proj9247600 144
CCReport Name: 2017_Mid_Cycle_Report
Report Description: Budget Book - Department Budget Detail wMD
06/07/2017Date:
Time: 265
Version:
Page:19:21:28

Department / Section: Community Development / Proj-CDBG Projects220 - 283510
Department Budget Detail
%Chnge16/17 vs 17/182017/182017/18
AmendedAdoptedAdopted2016/17
AmendedActualActual2016/172015/162014/15GL KeyObject Description
-0 00041,734PRCS Bryant Park Improvements9247800440120 0
-0 00028,678Ward 6 Dawes St/Mag St Imps9250200440120 0
-0 0009,865PRCS Villegas Park Pool Gates9251100440120 0
-0 000145,088Alley Block Wall9251900440120 0
-00 018,78633,662440120 Ward 5 Verbena Drive/ St Impro9253100 32,515
-0 000168,741PW Ward 7 / Sidewalk Imps9253300440120 0
-0 00091,706PW ADA Street Improvements9253400440120 0
-0 000114,813PW Ward 5 / St Improvements9253500440120 0
-00 067,6972,800440120 PRCS Bobby Bonds Reader Board9253700 0
-0 00131,02472,494PRCS Don Jones Park Restroom B9253800440120 0
-0 017,089026,910PRCS HVAC Dales Senior Center9253900440120 0
-0 0181,895030,673PRCS Bryant Park Improvements9254000440120 0
-0 00069,999PRCS HVAC Cesar Chavez CC9254100440120 0
-0 0009,200MFI Recovery Center Inc9254600440120 0
-0 0014,71814,719Community Settlement Assoc.9254800440120 0
-0 00050,000PRCS Cesar Chavez Classroom9255300440120 0
-0 00100,0000PW ADA St Improv 14/15 Various9255400440120 0
-00 064,71664,716440120 Design Homeless Shelter Improv9255500 55,471
-0 0028,0389,461PRCS Bordwell Park Fitness Stn9255600440120 0
-00 098,2199,760440120 PRCS Villegas Park ADA Walkway9255700 0
-00 0149,03325,966440120 PRCS Villegas Pk Brown Rm Imp9255800 0
-00 019,66655,333440120 PRCS Villegas Pk Plygrnd-Shade9255900 0
-0 0342,21700Nichols Park Comm Center Renov9256500440120 0
-0 010,00000PRCS Casa Blanca Picnic Tables9256600440120 0
-0 00243,3673,360Ward 1 11th & 12th Streets9257400440120 0
-00 036,837150,432440120 Ward 2 12th & 13th Streets9257500 2,915
-00 094,672111,467440120 Ward 3 Potomac/Madison/SanRafa9257600 3,101
-0 0048,0974,088Ward 5 Farnham/Magnolia/Andrew9257700440120 0
-00 023,451144,854440120 Ward5 Jackson St9257800 0
-00 064,982177,415440120 Ward 6 Jones/Hole/Wells9257900 2,472
-00 091,021143,539440120 Ward7 Sunnyside/Easy/Nebraska9258000 2,807
-00 059,2855,614440120 Ward 5 Stotts St Sidewalk Imp9258700 0
-00 081,3251,674440120 Ward 5 HAWK Pedestrian Signal9258800 0
-0 0018,3000Riv Housing Dev Corp RHDC9259000440120 0
-00 093,5732,026440120 Ward 6 Renner St Improvements9259100 0
-00 020,265224440120 Picker St 15/16 PW Street Impr9259200 0
-00 0170,3722,898440120 Ward 2 Ottawa Ave Improvements9259600 0
-00 0201,3465,093440120 Ward 7 Sylvan-Rutland/Lake Imp9259700 0
-00 0265,10610,024440120 Ward 1 Admore Street Improveme9259800 0
-00 097,3842,615440120 PW ADA Street Improvements 15-9259900 0
-0 018,60400PRCS Arlanza Comm Garden 15/169261400440120 0
-0 050,00000PRCS Bryant Pk Tennis 15/169261500440120 0
-0 039,97800PRCS La Sierra Sr Ctr 15/169261600440120 0
-0 0228,89800Ward 5-15/16 Sidewalk Imps9261700440120 0
-0 0128,50000PRCS Bordwell Pk Plygrnd 16/179261800440120 0
-0 090,00000PRCS El Dorado Park 15/169261900440120 0
CCReport Name: 2017_Mid_Cycle_Report
Report Description: Budget Book - Department Budget Detail wMD
06/07/2017Date:
Time: 266
Version:
Page:19:21:28
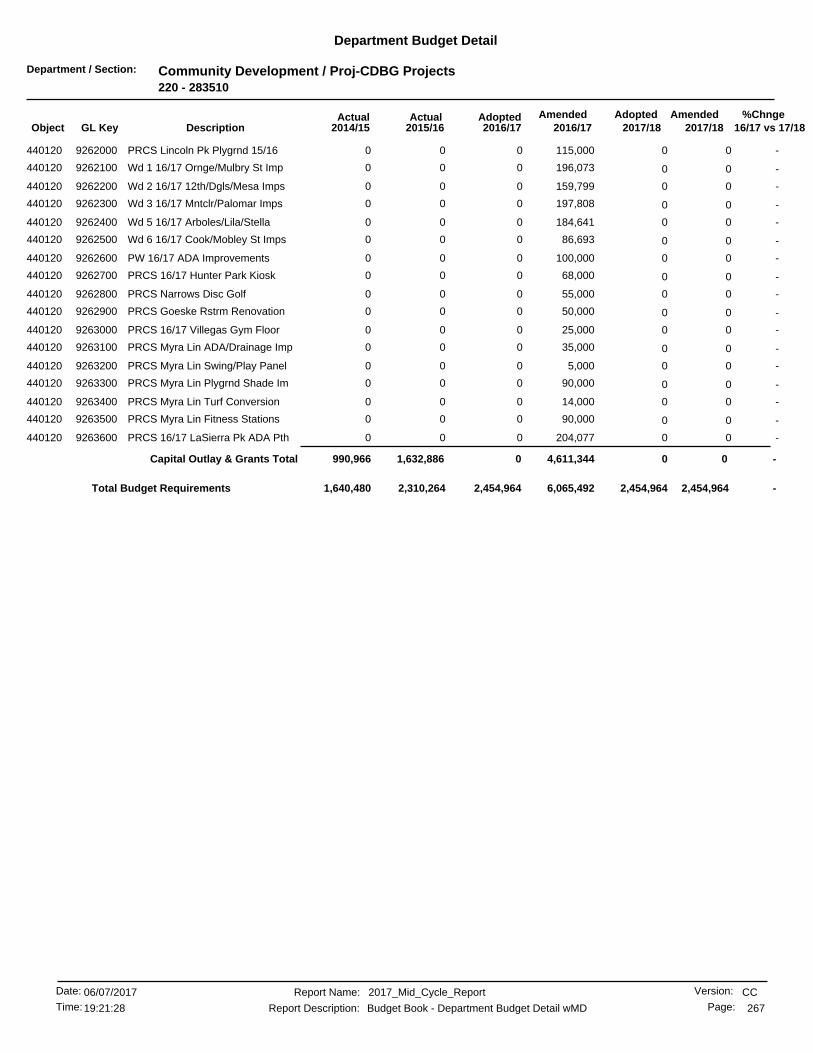
Department / Section: Community Development / Proj-CDBG Projects220 - 283510
Department Budget Detail
%Chnge16/17 vs 17/182017/182017/18
AmendedAdoptedAdopted2016/17
AmendedActualActual2016/172015/162014/15GL KeyObject Description
-0 0115,00000PRCS Lincoln Pk Plygrnd 15/169262000440120 0
-0 0196,07300Wd 1 16/17 Ornge/Mulbry St Imp9262100440120 0
-0 0159,79900Wd 2 16/17 12th/Dgls/Mesa Imps9262200440120 0
-0 0197,80800Wd 3 16/17 Mntclr/Palomar Imps9262300440120 0
-0 0184,64100Wd 5 16/17 Arboles/Lila/Stella9262400440120 0
-0 086,69300Wd 6 16/17 Cook/Mobley St Imps9262500440120 0
-0 0100,00000PW 16/17 ADA Improvements9262600440120 0
-0 068,00000PRCS 16/17 Hunter Park Kiosk9262700440120 0
-0 055,00000PRCS Narrows Disc Golf9262800440120 0
-0 050,00000PRCS Goeske Rstrm Renovation9262900440120 0
-0 025,00000PRCS 16/17 Villegas Gym Floor9263000440120 0
-0 035,00000PRCS Myra Lin ADA/Drainage Imp9263100440120 0
-0 05,00000PRCS Myra Lin Swing/Play Panel9263200440120 0
-0 090,00000PRCS Myra Lin Plygrnd Shade Im9263300440120 0
-0 014,00000PRCS Myra Lin Turf Conversion9263400440120 0
-0 090,00000PRCS Myra Lin Fitness Stations9263500440120 0
-0 0204,07700PRCS 16/17 LaSierra Pk ADA Pth9263600440120 0
-0 0Capital Outlay & Grants Total 04,611,3441,632,886990,966
-2,454,964 2,454,9642,454,9646,065,4922,310,2641,640,480Total Budget Requirements
CCReport Name: 2017_Mid_Cycle_Report
Report Description: Budget Book - Department Budget Detail wMD
06/07/2017Date:
Time: 267
Version:
Page:19:21:28

Department / Section: Community Development / Housing220 - 285500
Department Budget Detail
%Chnge16/17 vs 17/182017/182017/18
AmendedAdoptedAdopted2016/17
AmendedActualActual2016/172015/162014/15GL KeyObject Description
(3.8) %256,980246,963 256,980191,963192,170411100 Salaries - Regular2855000 212,765
-0 005,2020Salaries-Temp & Part Time2855000411110 0
-0 00283255Compensatory Time2855000411130 0
-0 0010,7616,273Vacation2855000411210 0
-0 009,8129,894Holidays & Special Days Off2855000411220 0
-0 002,5793,188Sick Leave2855000411240 0
-0 001,1795,481Family Illness Sick Leave2855000411245 0
-0 001,3021,011Bereavement Leave2855000411260 0
-0 001730Jury Duty2855000411280 0
-0 003,0653,480Administrative Leave2855000411292 0
-0 0048,5211,497Vacation Payoffs2855000411410 0
-0 0027,4190Sick Leave Payoff2855000411420 0
(5.3) %1,4881,408 1,4881,408(14,193)411510 Accrued Payroll2855000 4,838
(3.8) %3,9843,829 3,9843,8295,412412210 Workers Compensation Ins2855000 5,184
(4.7) %44,99442,868 44,99442,86831,586412220 Health Insurance2855000 28,784
-2,1602,160 2,1602,1601,627412222 Dental Insurance2855000 1,696
(4.2) %1,2071,156 1,2071,1561,128412230 Life Insurance2855000 1,188
(3.4) %143138 143138150412240 Unemployment Insurance2855000 157
-272272 272272279412250 Disability Insurance2855000 188
(10.6) %73,11465,317 73,11465,31766,744412310 PERS Retirement2855000 70,000
(3.8) %3,7263,581 3,7263,5814,405412320 Medicare OASDI2855000 3,565
(20.0) %4,5003,600 4,5003,6002,250412400 Deferred Compensation2855000 1,800
-0 00167328Overtime At 1.5 Rate2855000413120 0
(100.0)%0 8,936000Ptr. Comp. Model2855000419996 0
(7.5) %401,504316,292371,292 392,568Personnel Services Total 402,030361,580
-50,00050,000 50,00098,46739,000421000 Professional Services2855000 37,593
-0 00022Prof Services/Internal2855000421001 0
-1,0001,000 1,0001,0001,706422100 Telephone2855000 1,641
-1,5001,500 1,5001,500635422120 Telephone - Cellular2855000 616
-800800 800800224423400 Motor Pool Equipment Rental2855000 262
-200 200200052Vehicle Usage Reimb Employee2855000423500 200
-500 50050000All Other Equip Maint/Repair2855000424220 500
-10,00010,000 10,00010,0007,010425100 Advertising Expense2855000 3,734
-1,0001,000 1,0001,0002,425425200 Periodicals & Dues2855000 2,000
-200 20020000Photo & Recording Supplies2855000425300 200
-2,0002,000 2,0002,000544425400 General Office Expense2855000 1,528
-10,00010,000 10,00010,00017,657425500 Postage2855000 16,997
-4,000 4,0004,000015Central Printing Charges2855000425600 4,000
-0 0001,537Outside Printing Expense2855000425610 0
-500 500500029Software Purchase/Licensing2855000425700 500
-00 05,0001,013425800 Computer Equip Purc Undr $50002855000 393
-2,5002,500 2,5002,50013426800 Special Department Supplies2855000 143
-0 000225Travel & Meeting Expense2855000427100 0
-2,0002,000 2,0007,0001,376427200 Training2855000 934
(3.8) %5,2425,038 5,2425,0387,050428400 Liability Insurance2855000 4,594
-180 18018000Insurance Charges - Direct2855000428420 180
CCReport Name: 2017_Mid_Cycle_Report
Report Description: Budget Book - Department Budget Detail wMD
06/07/2017Date:
Time: 268
Version:
Page:19:21:28
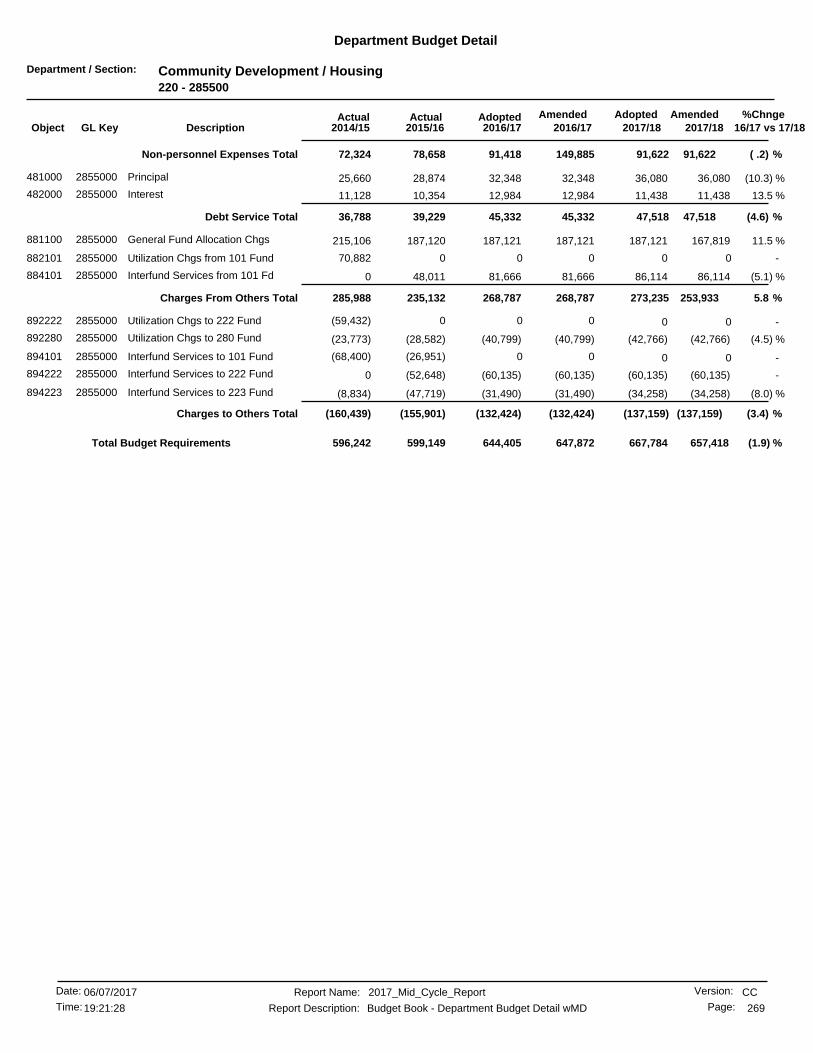
Department / Section: Community Development / Housing220 - 285500
Department Budget Detail
%Chnge16/17 vs 17/182017/182017/18
AmendedAdoptedAdopted2016/17
AmendedActualActual2016/172015/162014/15GL KeyObject Description
( .2) %91,622149,88591,418 91,622Non-personnel Expenses Total 78,65872,324
(10.3) %36,08032,348 36,08032,34828,874481000 Principal2855000 25,660
13.5 %11,43812,984 11,43812,98410,354482000 Interest2855000 11,128
(4.6) %47,51845,33245,332 47,518Debt Service Total 39,22936,788
11.5 %167,819187,121 187,121187,121187,120881100 General Fund Allocation Chgs2855000 215,106
-0 00070,882Utilization Chgs from 101 Fund2855000882101 0
(5.1) %86,11481,666 86,11481,66648,011884101 Interfund Services from 101 Fd2855000 0
5.8 %253,933268,787268,787 273,235Charges From Others Total 235,132285,988
-0 000(59,432)Utilization Chgs to 222 Fund2855000892222 0
(4.5) %(42,766)(40,799) (42,766)(40,799)(28,582)892280 Utilization Chgs to 280 Fund2855000 (23,773)
-0 00(26,951)(68,400)Interfund Services to 101 Fund2855000894101 0
-(60,135)(60,135) (60,135)(60,135)(52,648)894222 Interfund Services to 222 Fund2855000 0
(8.0) %(34,258)(31,490) (34,258)(31,490)(47,719)894223 Interfund Services to 223 Fund2855000 (8,834)
(3.4) %(137,159)(132,424)(132,424) (137,159)Charges to Others Total (155,901)(160,439)
(1.9) %644,405 657,418667,784647,872599,149596,242Total Budget Requirements
CCReport Name: 2017_Mid_Cycle_Report
Report Description: Budget Book - Department Budget Detail wMD
06/07/2017Date:
Time: 269
Version:
Page:19:21:28
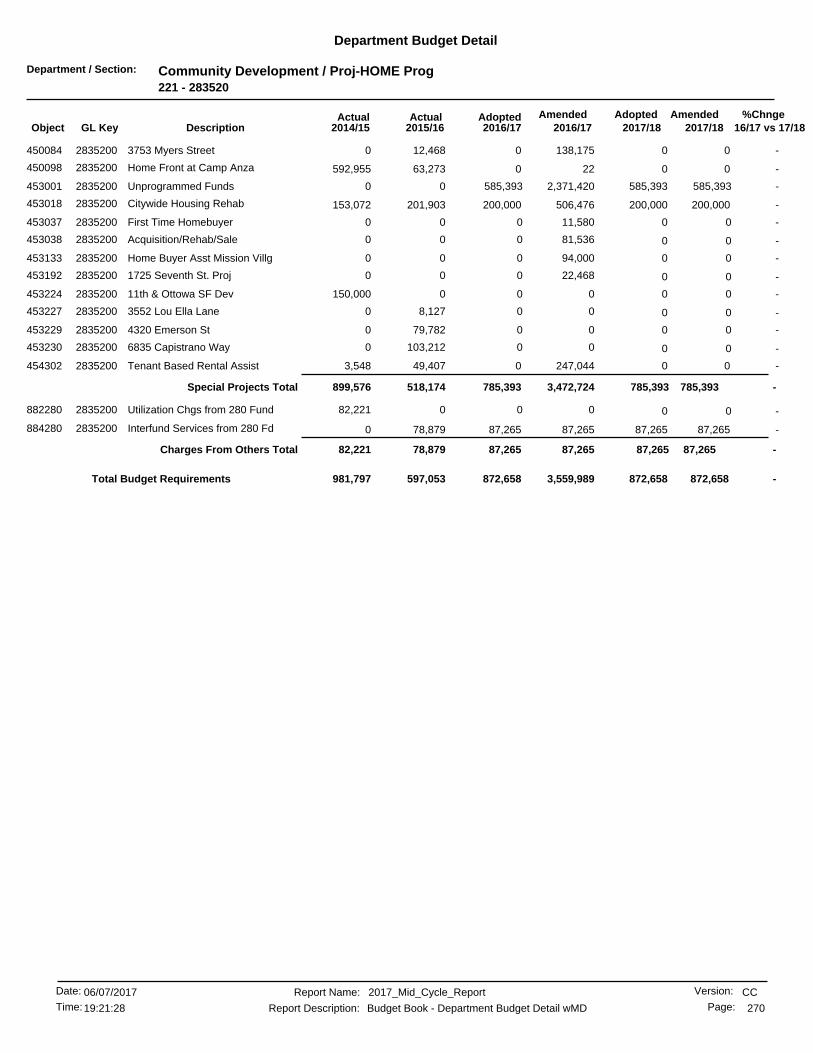
Department / Section: Community Development / Proj-HOME Prog221 - 283520
Department Budget Detail
%Chnge16/17 vs 17/182017/182017/18
AmendedAdoptedAdopted2016/17
AmendedActualActual2016/172015/162014/15GL KeyObject Description
-00 0138,17512,468450084 3753 Myers Street2835200 0
-00 02263,273450098 Home Front at Camp Anza2835200 592,955
-585,393 585,3932,371,42000Unprogrammed Funds2835200453001 585,393
-200,000200,000 200,000506,476201,903453018 Citywide Housing Rehab2835200 153,072
-0 011,58000First Time Homebuyer2835200453037 0
-0 081,53600Acquisition/Rehab/Sale2835200453038 0
-0 094,00000Home Buyer Asst Mission Villg2835200453133 0
-0 022,468001725 Seventh St. Proj2835200453192 0
-0 000150,00011th & Ottowa SF Dev2835200453224 0
-0 008,12703552 Lou Ella Lane2835200453227 0
-0 0079,78204320 Emerson St2835200453229 0
-0 00103,21206835 Capistrano Way2835200453230 0
-00 0247,04449,407454302 Tenant Based Rental Assist2835200 3,548
-785,3933,472,724785,393 785,393Special Projects Total 518,174899,576
-0 00082,221Utilization Chgs from 280 Fund2835200882280 0
-87,26587,265 87,26587,26578,879884280 Interfund Services from 280 Fd2835200 0
-87,26587,26587,265 87,265Charges From Others Total 78,87982,221
-872,658 872,658872,6583,559,989597,053981,797Total Budget Requirements
CCReport Name: 2017_Mid_Cycle_Report
Report Description: Budget Book - Department Budget Detail wMD
06/07/2017Date:
Time: 270
Version:
Page:19:21:28

Department / Section: Community Development / Projects-HOPWA Proj222 - 283530
Department Budget Detail
%Chnge16/17 vs 17/182017/182017/18
AmendedAdoptedAdopted2016/17
AmendedActualActual2016/172015/162014/15GL KeyObject Description
-1,108,2971,108,297 1,108,2973,342,3951,525,020450410 Riverside Co Housing Authority2835300 1,110,340
-0 018,73600Unprogrammed Funds2835300453001 0
-836,084836,084 836,0841,611,169713,926453207 Foothill Aids Project2835300 722,902
-1,944,3814,972,3001,944,381 1,944,381Special Projects Total 2,238,9461,833,243
-0 00059,431Utilization Chgs from 220 Fund2835300882220 0
-60,13560,135 60,13560,13552,648884220 Interfund Services from 220 Fd2835300 0
-60,13560,13560,135 60,135Charges From Others Total 52,64859,431
-2,004,516 2,004,5162,004,5165,032,4352,291,5951,892,675Total Budget Requirements
CCReport Name: 2017_Mid_Cycle_Report
Report Description: Budget Book - Department Budget Detail wMD
06/07/2017Date:
Time: 271
Version:
Page:19:21:28
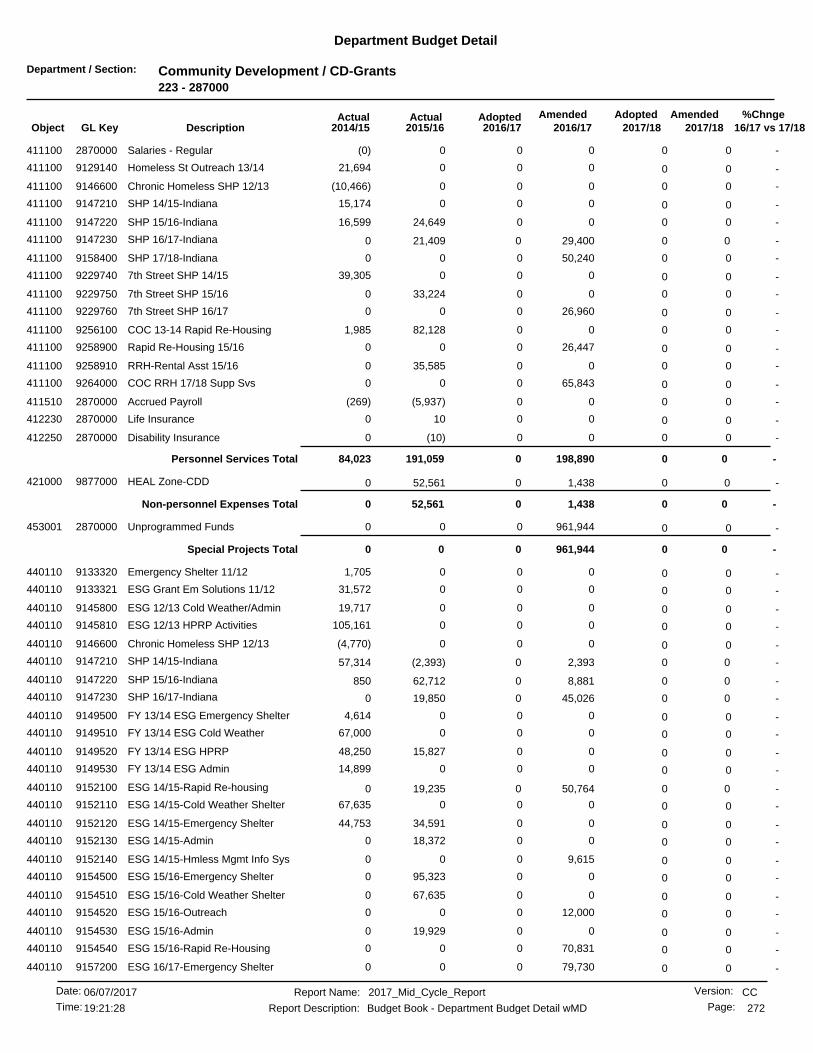
Department / Section: Community Development / CD-Grants223 - 287000
Department Budget Detail
%Chnge16/17 vs 17/182017/182017/18
AmendedAdoptedAdopted2016/17
AmendedActualActual2016/172015/162014/15GL KeyObject Description
-0 000(0)Salaries - Regular2870000411100 0
-0 00021,694Homeless St Outreach 13/149129140411100 0
-0 000(10,466)Chronic Homeless SHP 12/139146600411100 0
-0 00015,174SHP 14/15-Indiana9147210411100 0
-0 0024,64916,599SHP 15/16-Indiana9147220411100 0
-00 029,40021,409411100 SHP 16/17-Indiana9147230 0
-0 050,24000SHP 17/18-Indiana9158400411100 0
-0 00039,3057th Street SHP 14/159229740411100 0
-0 0033,22407th Street SHP 15/169229750411100 0
-0 026,960007th Street SHP 16/179229760411100 0
-0 0082,1281,985COC 13-14 Rapid Re-Housing9256100411100 0
-0 026,44700Rapid Re-Housing 15/169258900411100 0
-0 0035,5850RRH-Rental Asst 15/169258910411100 0
-0 065,84300COC RRH 17/18 Supp Svs9264000411100 0
-0 00(5,937)(269)Accrued Payroll2870000411510 0
-0 00100Life Insurance2870000412230 0
-0 00(10)0Disability Insurance2870000412250 0
-0 0Personnel Services Total 0198,890191,05984,023
-00 01,43852,561421000 HEAL Zone-CDD9877000 0
-0 0Non-personnel Expenses Total 01,43852,5610
-0 0961,94400Unprogrammed Funds2870000453001 0
-0 0Special Projects Total 0961,94400
-0 0001,705Emergency Shelter 11/129133320440110 0
-0 00031,572ESG Grant Em Solutions 11/129133321440110 0
-0 00019,717ESG 12/13 Cold Weather/Admin9145800440110 0
-0 000105,161ESG 12/13 HPRP Activities9145810440110 0
-0 000(4,770)Chronic Homeless SHP 12/139146600440110 0
-00 02,393(2,393)440110 SHP 14/15-Indiana9147210 57,314
-00 08,88162,712440110 SHP 15/16-Indiana9147220 850
-00 045,02619,850440110 SHP 16/17-Indiana9147230 0
-0 0004,614FY 13/14 ESG Emergency Shelter9149500440110 0
-0 00067,000FY 13/14 ESG Cold Weather9149510440110 0
-0 0015,82748,250FY 13/14 ESG HPRP9149520440110 0
-0 00014,899FY 13/14 ESG Admin9149530440110 0
-00 050,76419,235440110 ESG 14/15-Rapid Re-housing9152100 0
-0 00067,635ESG 14/15-Cold Weather Shelter9152110440110 0
-0 0034,59144,753ESG 14/15-Emergency Shelter9152120440110 0
-0 0018,3720ESG 14/15-Admin9152130440110 0
-0 09,61500ESG 14/15-Hmless Mgmt Info Sys9152140440110 0
-0 0095,3230ESG 15/16-Emergency Shelter9154500440110 0
-0 0067,6350ESG 15/16-Cold Weather Shelter9154510440110 0
-0 012,00000ESG 15/16-Outreach9154520440110 0
-0 0019,9290ESG 15/16-Admin9154530440110 0
-0 070,83100ESG 15/16-Rapid Re-Housing9154540440110 0
-0 079,73000ESG 16/17-Emergency Shelter9157200440110 0
CCReport Name: 2017_Mid_Cycle_Report
Report Description: Budget Book - Department Budget Detail wMD
06/07/2017Date:
Time: 272
Version:
Page:19:21:28
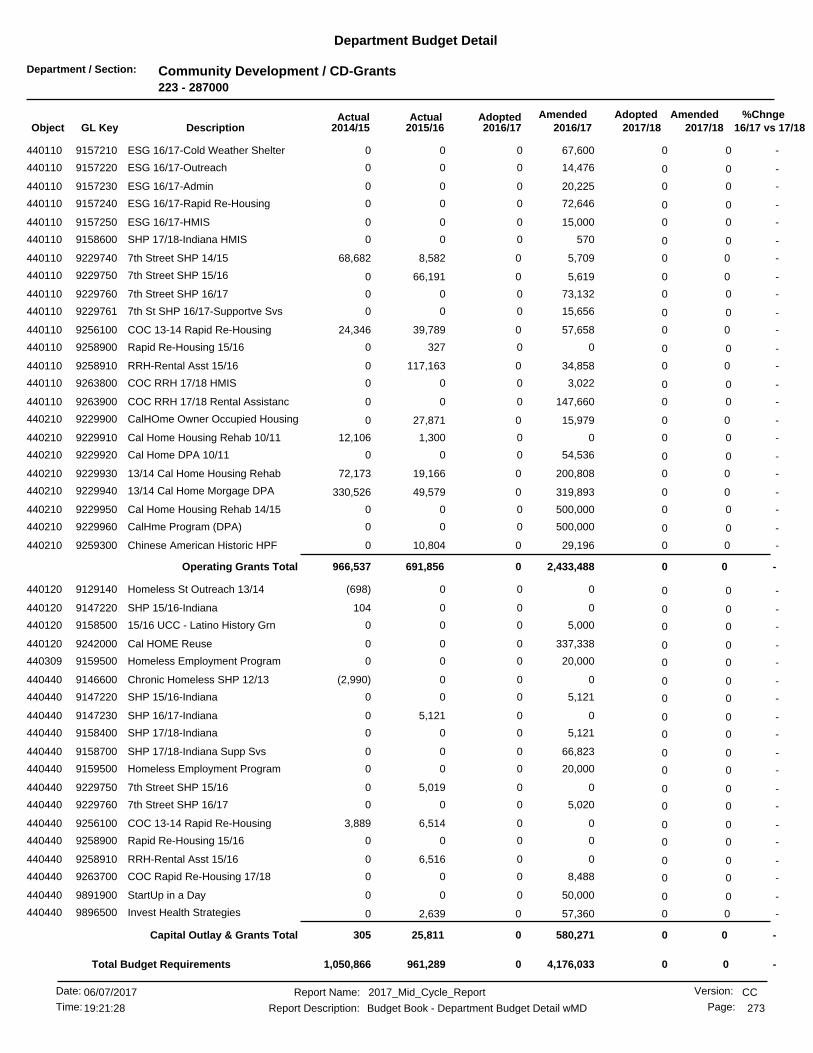
Department / Section: Community Development / CD-Grants223 - 287000
Department Budget Detail
%Chnge16/17 vs 17/182017/182017/18
AmendedAdoptedAdopted2016/17
AmendedActualActual2016/172015/162014/15GL KeyObject Description
-0 067,60000ESG 16/17-Cold Weather Shelter9157210440110 0
-0 014,47600ESG 16/17-Outreach9157220440110 0
-0 020,22500ESG 16/17-Admin9157230440110 0
-0 072,64600ESG 16/17-Rapid Re-Housing9157240440110 0
-0 015,00000ESG 16/17-HMIS9157250440110 0
-0 057000SHP 17/18-Indiana HMIS9158600440110 0
-00 05,7098,582440110 7th Street SHP 14/159229740 68,682
-00 05,61966,191440110 7th Street SHP 15/169229750 0
-0 073,132007th Street SHP 16/179229760440110 0
-0 015,656007th St SHP 16/17-Supportve Svs9229761440110 0
-00 057,65839,789440110 COC 13-14 Rapid Re-Housing9256100 24,346
-0 003270Rapid Re-Housing 15/169258900440110 0
-00 034,858117,163440110 RRH-Rental Asst 15/169258910 0
-0 03,02200COC RRH 17/18 HMIS9263800440110 0
-0 0147,66000COC RRH 17/18 Rental Assistanc9263900440110 0
-00 015,97927,871440210 CalHOme Owner Occupied Housing9229900 0
-0 001,30012,106Cal Home Housing Rehab 10/119229910440210 0
-0 054,53600Cal Home DPA 10/119229920440210 0
-00 0200,80819,166440210 13/14 Cal Home Housing Rehab9229930 72,173
-00 0319,89349,579440210 13/14 Cal Home Morgage DPA9229940 330,526
-0 0500,00000Cal Home Housing Rehab 14/159229950440210 0
-0 0500,00000CalHme Program (DPA)9229960440210 0
-00 029,19610,804440210 Chinese American Historic HPF9259300 0
-0 0Operating Grants Total 02,433,488691,856966,537
-0 000(698)Homeless St Outreach 13/149129140440120 0
-0 000104SHP 15/16-Indiana9147220440120 0
-0 05,0000015/16 UCC - Latino History Grn9158500440120 0
-0 0337,33800Cal HOME Reuse9242000440120 0
-0 020,00000Homeless Employment Program9159500440309 0
-0 000(2,990)Chronic Homeless SHP 12/139146600440440 0
-0 05,12100SHP 15/16-Indiana9147220440440 0
-0 005,1210SHP 16/17-Indiana9147230440440 0
-0 05,12100SHP 17/18-Indiana9158400440440 0
-0 066,82300SHP 17/18-Indiana Supp Svs9158700440440 0
-0 020,00000Homeless Employment Program9159500440440 0
-0 005,01907th Street SHP 15/169229750440440 0
-0 05,020007th Street SHP 16/179229760440440 0
-0 006,5143,889COC 13-14 Rapid Re-Housing9256100440440 0
-0 0000Rapid Re-Housing 15/169258900440440 0
-0 006,5160RRH-Rental Asst 15/169258910440440 0
-0 08,48800COC Rapid Re-Housing 17/189263700440440 0
-0 050,00000StartUp in a Day9891900440440 0
-00 057,3602,639440440 Invest Health Strategies9896500 0
-0 0Capital Outlay & Grants Total 0580,27125,811305
-0 004,176,033961,2891,050,866Total Budget Requirements
CCReport Name: 2017_Mid_Cycle_Report
Report Description: Budget Book - Department Budget Detail wMD
06/07/2017Date:
Time: 273
Version:
Page:19:21:28

Department / Section: Community Development / CD-Grants223 - 287000
Department Budget Detail
%Chnge16/17 vs 17/182017/182017/18
AmendedAdoptedAdopted2016/17
AmendedActualActual2016/172015/162014/15GL KeyObject Description
(100.0) %00 04,176,033961,289Total Budget Requirements 1,050,866
CCReport Name: 2017_Mid_Cycle_Report
Report Description: Budget Book - Department Budget Detail wMD
06/07/2017Date:
Time: 274
Version:
Page:19:21:28
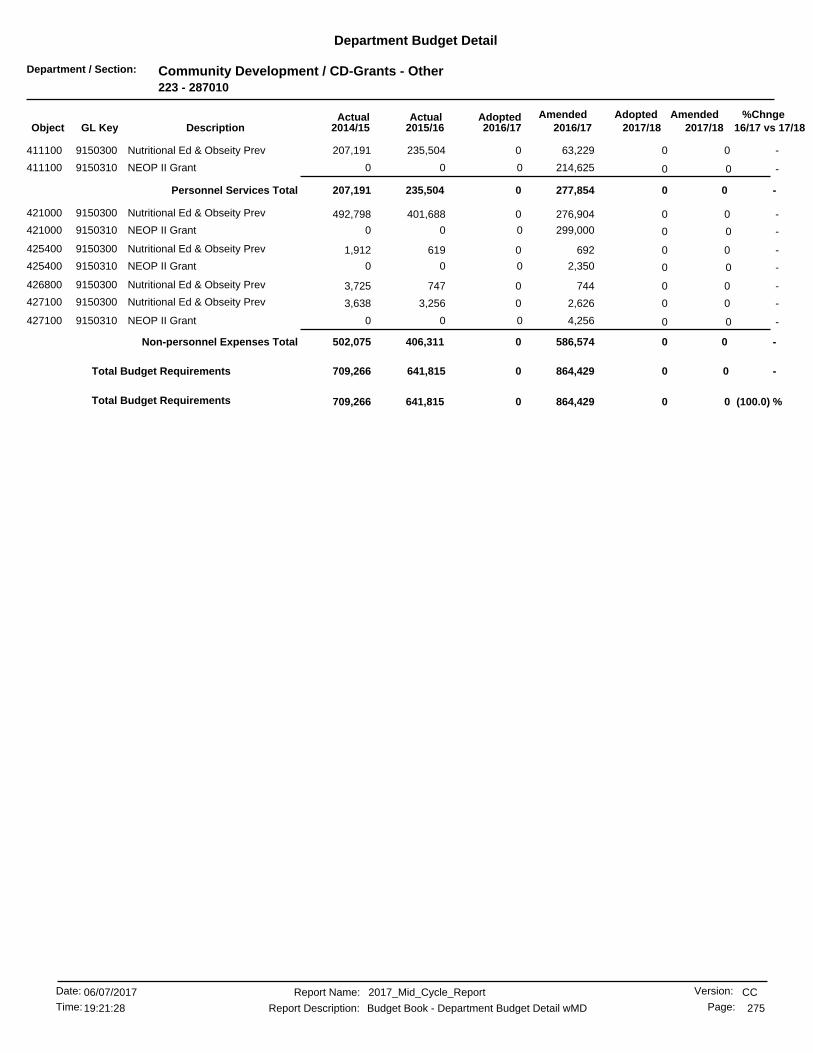
Department / Section: Community Development / CD-Grants - Other223 - 287010
Department Budget Detail
%Chnge16/17 vs 17/182017/182017/18
AmendedAdoptedAdopted2016/17
AmendedActualActual2016/172015/162014/15GL KeyObject Description
-00 063,229235,504411100 Nutritional Ed & Obseity Prev9150300 207,191
-0 0214,62500NEOP II Grant9150310411100 0
-0 0Personnel Services Total 0277,854235,504207,191
-00 0276,904401,688421000 Nutritional Ed & Obseity Prev9150300 492,798
-0 0299,00000NEOP II Grant9150310421000 0
-00 0692619425400 Nutritional Ed & Obseity Prev9150300 1,912
-0 02,35000NEOP II Grant9150310425400 0
-00 0744747426800 Nutritional Ed & Obseity Prev9150300 3,725
-00 02,6263,256427100 Nutritional Ed & Obseity Prev9150300 3,638
-0 04,25600NEOP II Grant9150310427100 0
-0 0Non-personnel Expenses Total 0586,574406,311502,075
-0 00864,429641,815709,266Total Budget Requirements
(100.0) %00 0864,429641,815Total Budget Requirements 709,266
CCReport Name: 2017_Mid_Cycle_Report
Report Description: Budget Book - Department Budget Detail wMD
06/07/2017Date:
Time: 275
Version:
Page:19:21:28
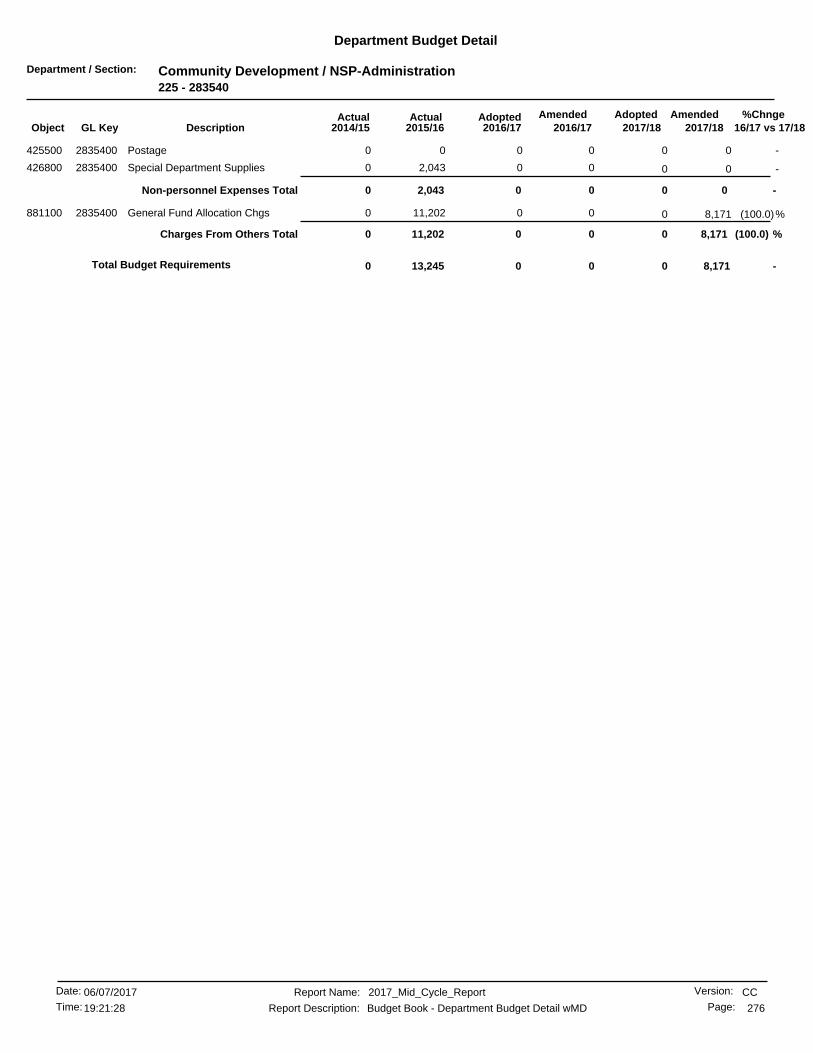
Department / Section: Community Development / NSP-Administration225 - 283540
Department Budget Detail
%Chnge16/17 vs 17/182017/182017/18
AmendedAdoptedAdopted2016/17
AmendedActualActual2016/172015/162014/15GL KeyObject Description
-0 0000Postage2835400425500 0
-0 002,0430Special Department Supplies2835400426800 0
-0 0Non-personnel Expenses Total 002,0430
(100.0)%0 8,171011,2020General Fund Allocation Chgs2835400881100 0
(100.0) %0 8,171Charges From Others Total 0011,2020
-8,1710 0013,245Total Budget Requirements 0
CCReport Name: 2017_Mid_Cycle_Report
Report Description: Budget Book - Department Budget Detail wMD
06/07/2017Date:
Time: 276
Version:
Page:19:21:28

Department / Section: Community Development / NSP Programs225 - 283541
Department Budget Detail
%Chnge16/17 vs 17/182017/182017/18
AmendedAdoptedAdopted2016/17
AmendedActualActual2016/172015/162014/15GL KeyObject Description
-0 039,18100Unprogrammed Funds2835410453001 0
-0 0Special Projects Total 039,18100
-0 0002,07510820 Sunnyslope9243100440440 0
-00 01,470350440440 2825 Mulberry St- NSP9246900 0
-0 0473004578 Sunnyside -NSP9247700440440 0
-0 002,93327510370 Gould - NSP9248100440440 0
-00 04,6421,479440446 1791 Orange9236200 5,088
-0 01,65401,31011502 Anacapa9238900440446 0
-0 01,42202132792 Woodbine-NSP9246700440446 0
-0 019,476002825 Mulberry St- NSP9246900440446 0
-0 04110294578 Sunnyside -NSP9247700440446 0
-00 02,4649440446 2841 Mulberry - NSP9247900 9
-00 03,7715,132440446 10370 Gould - NSP9248100 0
-00 021,84811,794440446 3552 Lou Ella Lane-NSP9248400 0
-00 015,90266440446 3553 Lou Ella Lane-NSP9248500 (40)
-00 05,73166440446 1740 Loma Vista-N19251500 0
-0 00024,9992929 11th St-NSP19254300440446 0
-00 010,7809440446 3236 Washington- N19254700 38,209
-00 05,02239,300440446 2831 Mulberry- N19256200 4,037
-0 0Capital Outlay & Grants Total 095,06961,14176,208
-0 00134,25161,14176,208Total Budget Requirements
(100.0) %00 0134,25161,141Total Budget Requirements 76,208
CCReport Name: 2017_Mid_Cycle_Report
Report Description: Budget Book - Department Budget Detail wMD
06/07/2017Date:
Time: 277
Version:
Page:19:21:28
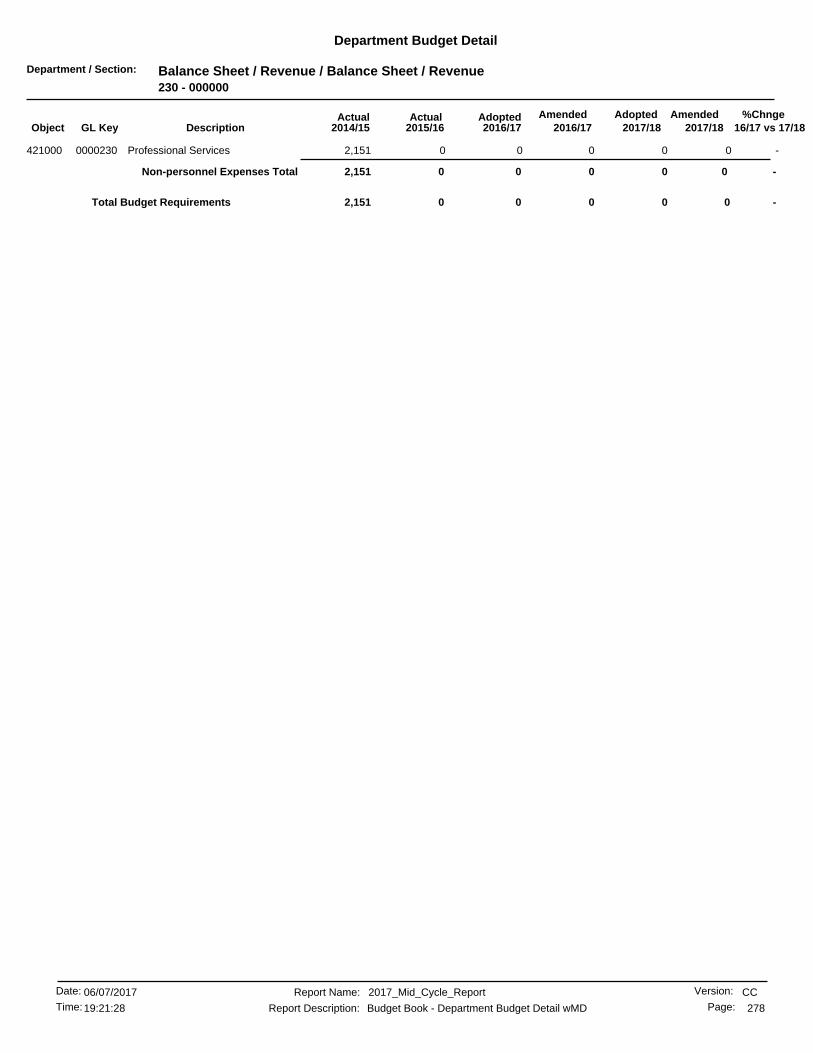
Department / Section: Balance Sheet / Revenue / Balance Sheet / Revenue230 - 000000
Department Budget Detail
%Chnge16/17 vs 17/182017/182017/18
AmendedAdoptedAdopted2016/17
AmendedActualActual2016/172015/162014/15GL KeyObject Description
-0 0002,151Professional Services0000230421000 0
-0 0Non-personnel Expenses Total 0002,151
-00 000Total Budget Requirements 2,151
CCReport Name: 2017_Mid_Cycle_Report
Report Description: Budget Book - Department Budget Detail wMD
06/07/2017Date:
Time: 278
Version:
Page:19:21:28
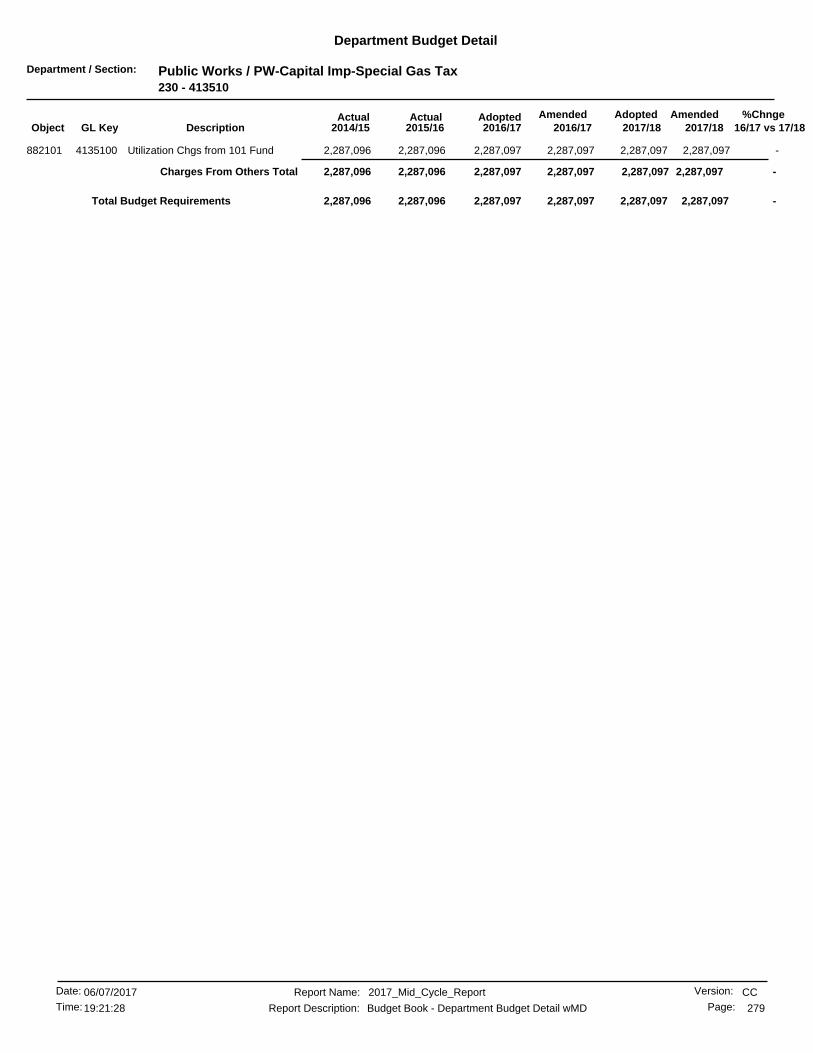
Department / Section: Public Works / PW-Capital Imp-Special Gas Tax230 - 413510
Department Budget Detail
%Chnge16/17 vs 17/182017/182017/18
AmendedAdoptedAdopted2016/17
AmendedActualActual2016/172015/162014/15GL KeyObject Description
-2,287,0972,287,097 2,287,0972,287,0972,287,096882101 Utilization Chgs from 101 Fund4135100 2,287,096
-2,287,0972,287,0972,287,097 2,287,097Charges From Others Total 2,287,0962,287,096
-2,287,097 2,287,0972,287,0972,287,0972,287,0962,287,096Total Budget Requirements
CCReport Name: 2017_Mid_Cycle_Report
Report Description: Budget Book - Department Budget Detail wMD
06/07/2017Date:
Time: 279
Version:
Page:19:21:28
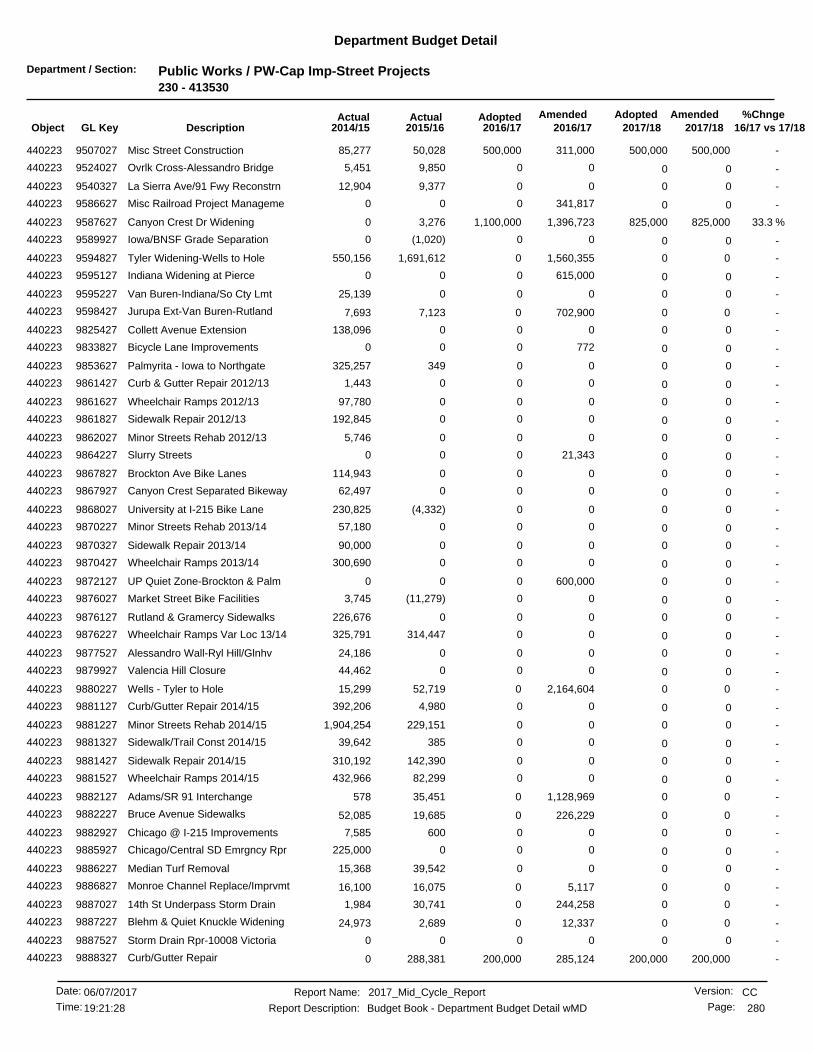
Department / Section: Public Works / PW-Cap Imp-Street Projects230 - 413530
Department Budget Detail
%Chnge16/17 vs 17/182017/182017/18
AmendedAdoptedAdopted2016/17
AmendedActualActual2016/172015/162014/15GL KeyObject Description
-500,000500,000 500,000311,00050,028440223 Misc Street Construction9507027 85,277
-0 009,8505,451Ovrlk Cross-Alessandro Bridge9524027440223 0
-0 009,37712,904La Sierra Ave/91 Fwy Reconstrn9540327440223 0
-0 0341,81700Misc Railroad Project Manageme9586627440223 0
33.3 %825,0001,100,000 825,0001,396,7233,276440223 Canyon Crest Dr Widening9587627 0
-0 00(1,020)0Iowa/BNSF Grade Separation9589927440223 0
-00 01,560,3551,691,612440223 Tyler Widening-Wells to Hole9594827 550,156
-0 0615,00000Indiana Widening at Pierce9595127440223 0
-0 00025,139Van Buren-Indiana/So Cty Lmt9595227440223 0
-00 0702,9007,123440223 Jurupa Ext-Van Buren-Rutland9598427 7,693
-0 000138,096Collett Avenue Extension9825427440223 0
-0 077200Bicycle Lane Improvements9833827440223 0
-0 00349325,257Palmyrita - Iowa to Northgate9853627440223 0
-0 0001,443Curb & Gutter Repair 2012/139861427440223 0
-0 00097,780Wheelchair Ramps 2012/139861627440223 0
-0 000192,845Sidewalk Repair 2012/139861827440223 0
-0 0005,746Minor Streets Rehab 2012/139862027440223 0
-0 021,34300Slurry Streets9864227440223 0
-0 000114,943Brockton Ave Bike Lanes9867827440223 0
-0 00062,497Canyon Crest Separated Bikeway9867927440223 0
-0 00(4,332)230,825University at I-215 Bike Lane9868027440223 0
-0 00057,180Minor Streets Rehab 2013/149870227440223 0
-0 00090,000Sidewalk Repair 2013/149870327440223 0
-0 000300,690Wheelchair Ramps 2013/149870427440223 0
-0 0600,00000UP Quiet Zone-Brockton & Palm9872127440223 0
-0 00(11,279)3,745Market Street Bike Facilities9876027440223 0
-0 000226,676Rutland & Gramercy Sidewalks9876127440223 0
-0 00314,447325,791Wheelchair Ramps Var Loc 13/149876227440223 0
-0 00024,186Alessandro Wall-Ryl Hill/Glnhv9877527440223 0
-0 00044,462Valencia Hill Closure9879927440223 0
-00 02,164,60452,719440223 Wells - Tyler to Hole9880227 15,299
-0 004,980392,206Curb/Gutter Repair 2014/159881127440223 0
-0 00229,1511,904,254Minor Streets Rehab 2014/159881227440223 0
-0 0038539,642Sidewalk/Trail Const 2014/159881327440223 0
-0 00142,390310,192Sidewalk Repair 2014/159881427440223 0
-0 0082,299432,966Wheelchair Ramps 2014/159881527440223 0
-00 01,128,96935,451440223 Adams/SR 91 Interchange9882127 578
-00 0226,22919,685440223 Bruce Avenue Sidewalks9882227 52,085
-0 006007,585Chicago @ I-215 Improvements9882927440223 0
-0 000225,000Chicago/Central SD Emrgncy Rpr9885927440223 0
-0 0039,54215,368Median Turf Removal9886227440223 0
-00 05,11716,075440223 Monroe Channel Replace/Imprvmt9886827 16,100
-00 0244,25830,741440223 14th St Underpass Storm Drain9887027 1,984
-00 012,3372,689440223 Blehm & Quiet Knuckle Widening9887227 24,973
-0 0000Storm Drain Rpr-10008 Victoria9887527440223 0
-200,000200,000 200,000285,124288,381440223 Curb/Gutter Repair9888327 0
CCReport Name: 2017_Mid_Cycle_Report
Report Description: Budget Book - Department Budget Detail wMD
06/07/2017Date:
Time: 280
Version:
Page:19:21:28
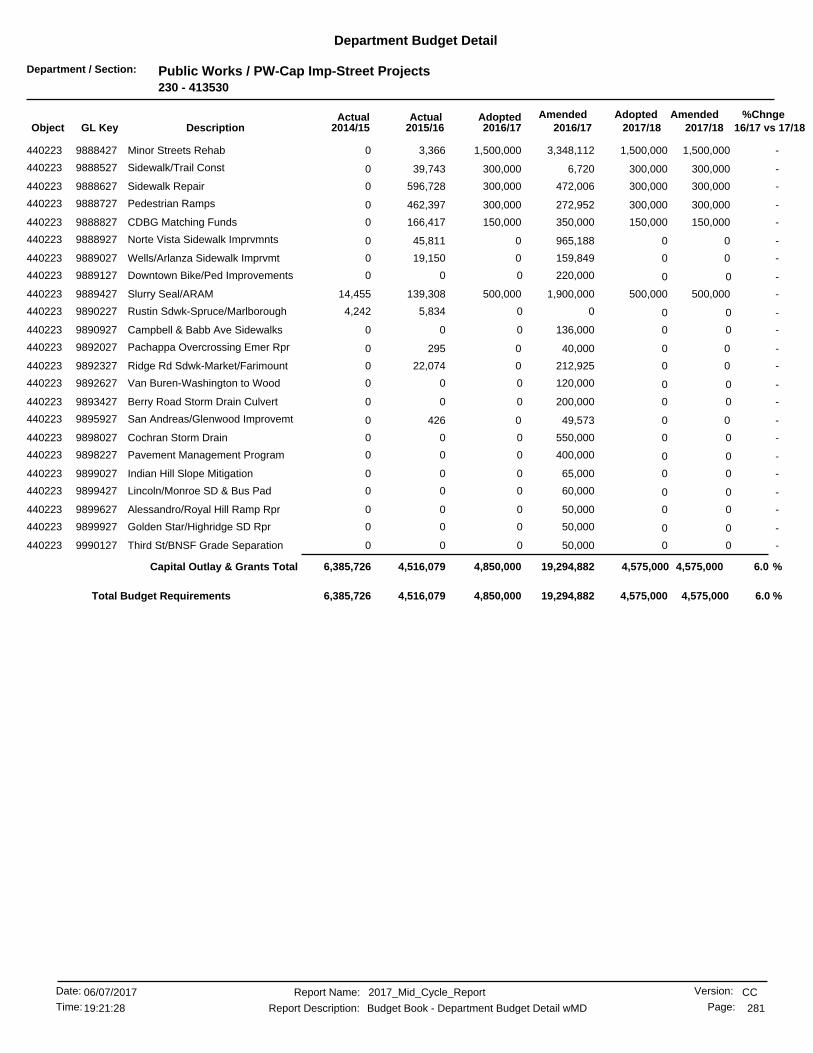
Department / Section: Public Works / PW-Cap Imp-Street Projects230 - 413530
Department Budget Detail
%Chnge16/17 vs 17/182017/182017/18
AmendedAdoptedAdopted2016/17
AmendedActualActual2016/172015/162014/15GL KeyObject Description
-1,500,0001,500,000 1,500,0003,348,1123,366440223 Minor Streets Rehab9888427 0
-300,000300,000 300,0006,72039,743440223 Sidewalk/Trail Const9888527 0
-300,000300,000 300,000472,006596,728440223 Sidewalk Repair9888627 0
-300,000300,000 300,000272,952462,397440223 Pedestrian Ramps9888727 0
-150,000150,000 150,000350,000166,417440223 CDBG Matching Funds9888827 0
-00 0965,18845,811440223 Norte Vista Sidewalk Imprvmnts9888927 0
-00 0159,84919,150440223 Wells/Arlanza Sidewalk Imprvmt9889027 0
-0 0220,00000Downtown Bike/Ped Improvements9889127440223 0
-500,000500,000 500,0001,900,000139,308440223 Slurry Seal/ARAM9889427 14,455
-0 005,8344,242Rustin Sdwk-Spruce/Marlborough9890227440223 0
-0 0136,00000Campbell & Babb Ave Sidewalks9890927440223 0
-00 040,000295440223 Pachappa Overcrossing Emer Rpr9892027 0
-00 0212,92522,074440223 Ridge Rd Sdwk-Market/Farimount9892327 0
-0 0120,00000Van Buren-Washington to Wood9892627440223 0
-0 0200,00000Berry Road Storm Drain Culvert9893427440223 0
-00 049,573426440223 San Andreas/Glenwood Improvemt9895927 0
-0 0550,00000Cochran Storm Drain9898027440223 0
-0 0400,00000Pavement Management Program9898227440223 0
-0 065,00000Indian Hill Slope Mitigation9899027440223 0
-0 060,00000Lincoln/Monroe SD & Bus Pad9899427440223 0
-0 050,00000Alessandro/Royal Hill Ramp Rpr9899627440223 0
-0 050,00000Golden Star/Highridge SD Rpr9899927440223 0
-0 050,00000Third St/BNSF Grade Separation9990127440223 0
6.0 %4,575,00019,294,8824,850,000 4,575,000Capital Outlay & Grants Total 4,516,0796,385,726
6.0 %4,850,000 4,575,0004,575,00019,294,8824,516,0796,385,726Total Budget Requirements
CCReport Name: 2017_Mid_Cycle_Report
Report Description: Budget Book - Department Budget Detail wMD
06/07/2017Date:
Time: 281
Version:
Page:19:21:28

Department / Section: Public Works / PW-Cap Imp-Traffic Signal Proj230 - 413540
Department Budget Detail
%Chnge16/17 vs 17/182017/182017/18
AmendedAdoptedAdopted2016/17
AmendedActualActual2016/172015/162014/15GL KeyObject Description
-0 0067,32237,795Canyon Crest Traffic Signals9880427440223 0
-0 0225,00000Magnolia-Buchanan to 1st9882027440223 0
-75,00075,000 75,00075,000(1,652)440223 Misc Traffic Projects9883227 1
-75,000300,00075,000 75,000Capital Outlay & Grants Total 65,67037,796
-75,000 75,00075,000300,00065,67037,796Total Budget Requirements
CCReport Name: 2017_Mid_Cycle_Report
Report Description: Budget Book - Department Budget Detail wMD
06/07/2017Date:
Time: 282
Version:
Page:19:21:28

Department / Section: Public Works / Public Works-Sundry-AQMD240 - 414010
Department Budget Detail
%Chnge16/17 vs 17/182017/182017/18
AmendedAdoptedAdopted2016/17
AmendedActualActual2016/172015/162014/15GL KeyObject Description
-3,2003,200 3,2003,8082,591421000 Professional Services4140100 3,276
-84,00084,000 84,000276,183335,155421041 Prof Svcs Air Quality Program4140100 332,815
-0 0006Postage4140100425500 0
-0 090000Central Printing Charges4140100425600 0
-87,200280,89287,200 87,200Non-personnel Expenses Total 337,746336,098
-25,000 25,00050,000025,000Clean Cities4140100450344 25,000
-25,00025,000 25,00069,17728,589450347 Traffic Timing and Coordinatn4140100 27,233
-1,2001,200 1,2003,9322,989450348 Employee Rideshare Program4140100 1,200
-30,00030,000 30,00071,90723,400450352 Vehicle Scrapping Program4140100 24,692
-00 015,5007,500450355 City AFV Program4140100 2,500
-20,00020,000 20,00046,9751,897450366 Bicycles4140100 0
-16,50016,500 16,50020,33514,172450367 City Pass Program4140100 16,948
-118,874 118,87457,58800Matching Funds4140100453228 118,874
-236,574335,416236,574 236,574Special Projects Total 78,54997,574
-0 014,47400Air Quality Prog Expenditures4140100440211 0
-0 029,34500Pm10 Paving Projects9764334440211 0
-0 038,552054,865ProjectDox9865434440211 0
-0 0050,0000Market Street Bike Facilities9876034440211 0
-0 0200,00000Magnolia-Buchanan to 1st9882000440211 0
-0 063,00000Bicycle Share Program9882300440211 0
-00 014,9076,091440211 SAR Bike Trail-McLean/Rubidoux9882534 14,001
-0 0Capital Outlay & Grants Total 0360,27856,09168,866
-18,21018,210 18,21018,21018,210881100 General Fund Allocation Chgs4140100 23,208
-038,226 38,22638,22638,226882101 Utilization Chgs from 101 Fund4140100 38,226
(100.0)%0 38,226000Utilization Chgs from 390 Fund4140100882390 0
-56,436 56,436Charges From Others Total 56,43656,43656,43661,434
-380,210 380,210380,2101,033,023528,824563,974Total Budget Requirements
CCReport Name: 2017_Mid_Cycle_Report
Report Description: Budget Book - Department Budget Detail wMD
06/07/2017Date:
Time: 283
Version:
Page:19:21:28
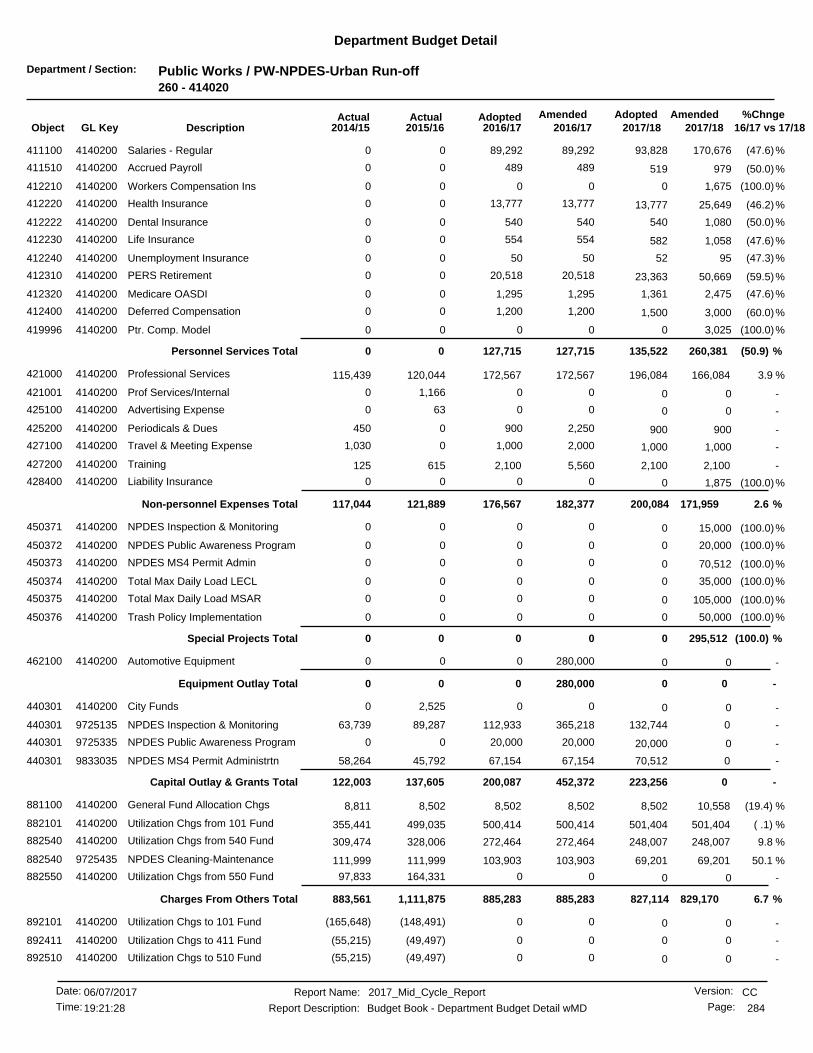
Department / Section: Public Works / PW-NPDES-Urban Run-off260 - 414020
Department Budget Detail
%Chnge16/17 vs 17/182017/182017/18
AmendedAdoptedAdopted2016/17
AmendedActualActual2016/172015/162014/15GL KeyObject Description
(47.6)%89,292 170,67689,29200Salaries - Regular4140200411100 93,828
(50.0)%489 97948900Accrued Payroll4140200411510 519
(100.0)%0 1,675000Workers Compensation Ins4140200412210 0
(46.2)%13,777 25,64913,77700Health Insurance4140200412220 13,777
(50.0)%540 1,08054000Dental Insurance4140200412222 540
(47.6)%554 1,05855400Life Insurance4140200412230 582
(47.3)%50 955000Unemployment Insurance4140200412240 52
(59.5)%20,518 50,66920,51800PERS Retirement4140200412310 23,363
(47.6)%1,295 2,4751,29500Medicare OASDI4140200412320 1,361
(60.0)%1,200 3,0001,20000Deferred Compensation4140200412400 1,500
(100.0)%0 3,025000Ptr. Comp. Model4140200419996 0
(50.9) %127,715 260,381Personnel Services Total 135,522127,71500
3.9 %166,084172,567 196,084172,567120,044421000 Professional Services4140200 115,439
-0 001,1660Prof Services/Internal4140200421001 0
-0 00630Advertising Expense4140200425100 0
-900 9002,2500450Periodicals & Dues4140200425200 900
-1,000 1,0002,00001,030Travel & Meeting Expense4140200427100 1,000
-2,1002,100 2,1005,560615427200 Training4140200 125
(100.0)%0 1,875000Liability Insurance4140200428400 0
2.6 %171,959182,377176,567 200,084Non-personnel Expenses Total 121,889117,044
(100.0)%0 15,000000NPDES Inspection & Monitoring4140200450371 0
(100.0)%0 20,000000NPDES Public Awareness Program4140200450372 0
(100.0)%0 70,512000NPDES MS4 Permit Admin4140200450373 0
(100.0)%0 35,000000Total Max Daily Load LECL4140200450374 0
(100.0)%0 105,000000Total Max Daily Load MSAR4140200450375 0
(100.0)%0 50,000000Trash Policy Implementation4140200450376 0
(100.0) %0 295,512Special Projects Total 0000
-0 0280,00000Automotive Equipment4140200462100 0
-0 0Equipment Outlay Total 0280,00000
-0 002,5250City Funds4140200440301 0
-0112,933 132,744365,21889,287440301 NPDES Inspection & Monitoring9725135 63,739
-20,000 020,00000NPDES Public Awareness Program9725335440301 20,000
-067,154 70,51267,15445,792440301 NPDES MS4 Permit Administrtn9833035 58,264
-200,087 0Capital Outlay & Grants Total 223,256452,372137,605122,003
(19.4) %10,5588,502 8,5028,5028,502881100 General Fund Allocation Chgs4140200 8,811
( .1) %501,404500,414 501,404500,414499,035882101 Utilization Chgs from 101 Fund4140200 355,441
9.8 %248,007272,464 248,007272,464328,006882540 Utilization Chgs from 540 Fund4140200 309,474
50.1 %69,201103,903 69,201103,903111,999882540 NPDES Cleaning-Maintenance9725435 111,999
-0 00164,33197,833Utilization Chgs from 550 Fund4140200882550 0
6.7 %829,170885,283885,283 827,114Charges From Others Total 1,111,875883,561
-0 00(148,491)(165,648)Utilization Chgs to 101 Fund4140200892101 0
-0 00(49,497)(55,215)Utilization Chgs to 411 Fund4140200892411 0
-0 00(49,497)(55,215)Utilization Chgs to 510 Fund4140200892510 0
CCReport Name: 2017_Mid_Cycle_Report
Report Description: Budget Book - Department Budget Detail wMD
06/07/2017Date:
Time: 284
Version:
Page:19:21:28
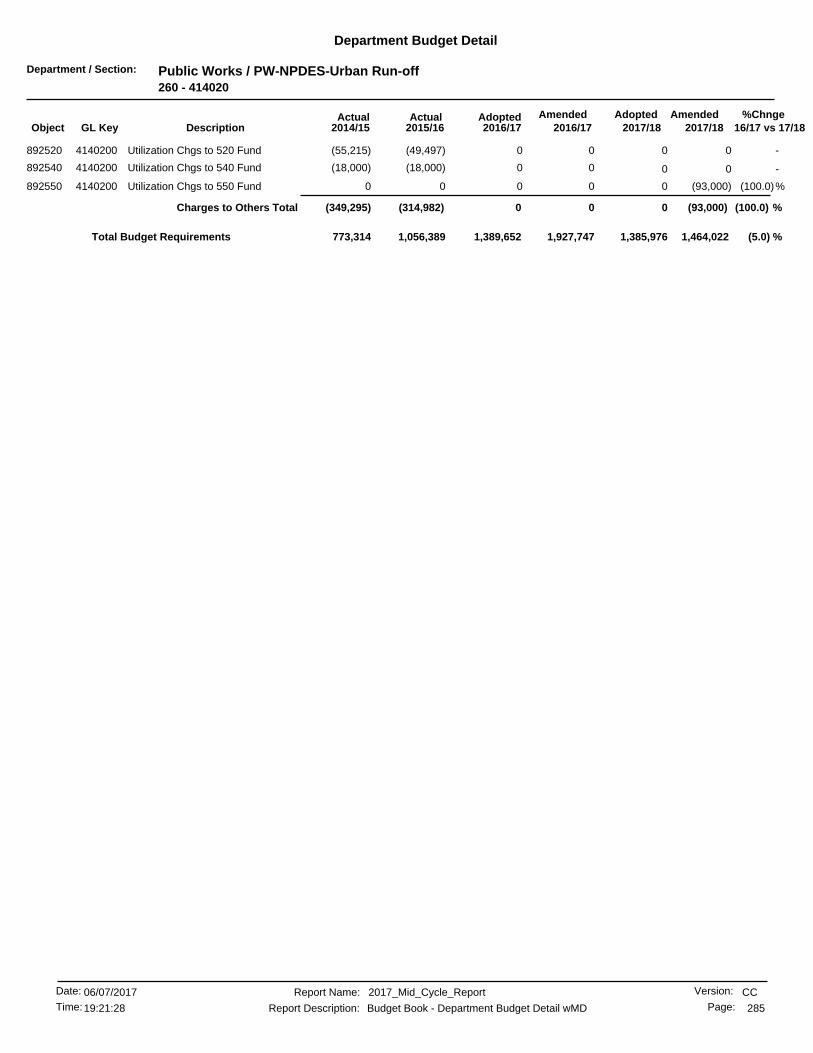
Department / Section: Public Works / PW-NPDES-Urban Run-off260 - 414020
Department Budget Detail
%Chnge16/17 vs 17/182017/182017/18
AmendedAdoptedAdopted2016/17
AmendedActualActual2016/172015/162014/15GL KeyObject Description
-0 00(49,497)(55,215)Utilization Chgs to 520 Fund4140200892520 0
-0 00(18,000)(18,000)Utilization Chgs to 540 Fund4140200892540 0
(100.0)%0 (93,000)000Utilization Chgs to 550 Fund4140200892550 0
(100.0) %0 (93,000)Charges to Others Total 00(314,982)(349,295)
(5.0) %1,389,652 1,464,0221,385,9761,927,7471,056,389773,314Total Budget Requirements
CCReport Name: 2017_Mid_Cycle_Report
Report Description: Budget Book - Department Budget Detail wMD
06/07/2017Date:
Time: 285
Version:
Page:19:21:28
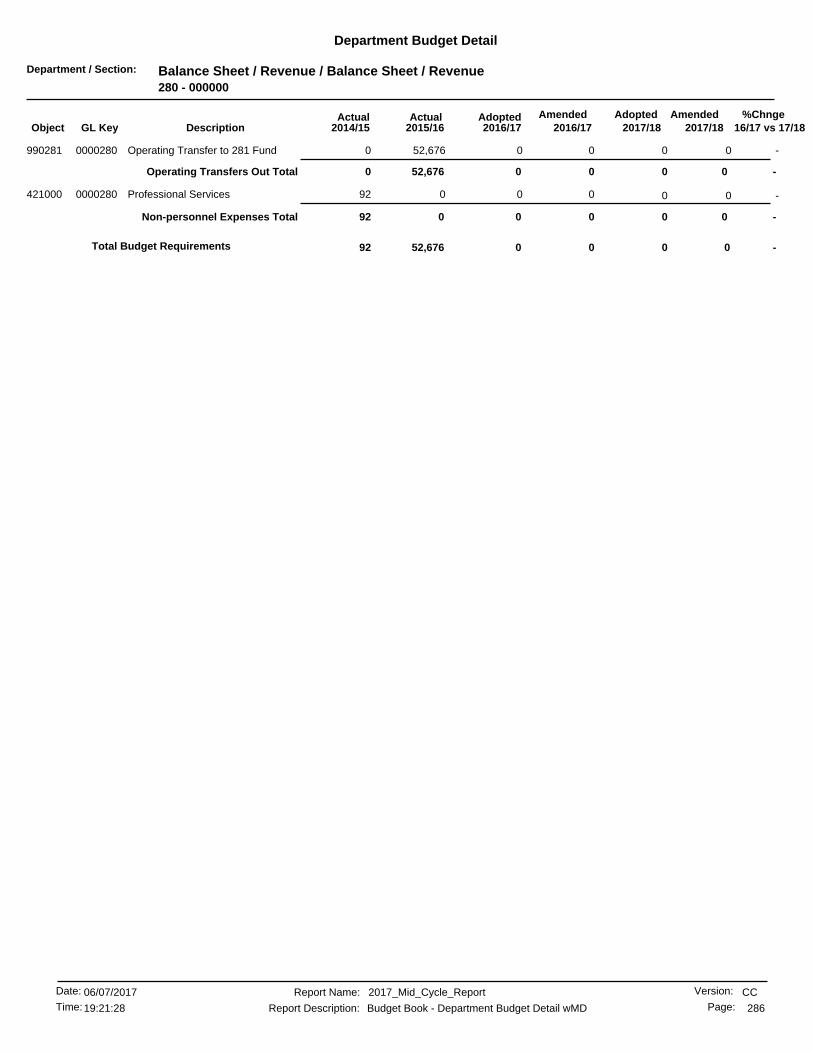
Department / Section: Balance Sheet / Revenue / Balance Sheet / Revenue280 - 000000
Department Budget Detail
%Chnge16/17 vs 17/182017/182017/18
AmendedAdoptedAdopted2016/17
AmendedActualActual2016/172015/162014/15GL KeyObject Description
-0 0052,6760Operating Transfer to 281 Fund0000280990281 0
-0 0Operating Transfers Out Total 0052,6760
-0 00092Professional Services0000280421000 0
-0 0Non-personnel Expenses Total 00092
-00 0052,676Total Budget Requirements 92
CCReport Name: 2017_Mid_Cycle_Report
Report Description: Budget Book - Department Budget Detail wMD
06/07/2017Date:
Time: 286
Version:
Page:19:21:28

Department / Section: Community Development / Housing Authority280 - 287500
Department Budget Detail
%Chnge16/17 vs 17/182017/182017/18
AmendedAdoptedAdopted2016/17
AmendedActualActual2016/172015/162014/15GL KeyObject Description
(3.2) %503,336487,199 503,336487,199358,889411100 Salaries - Regular2875000 279,557
-0 009500Compensatory Time2875000411130 0
-0 0023,66213,285Vacation2875000411210 0
-0 0017,14112,320Holidays & Special Days Off2875000411220 0
-0 0022,5226,349Sick Leave2875000411240 0
-0 003,1833,729Family Illness Sick Leave2875000411245 0
-0 004140Bereavement Leave2875000411260 0
-0 004231,006Jury Duty2875000411280 0
-0 003,7385,029Administrative Leave2875000411292 0
-0 005,5273,467Vacation Payoffs2875000411410 0
-0 00420Compensatory Time Payoff2875000411430 0
(4.6) %2,9622,824 2,9622,824(17,997)411510 Accrued Payroll2875000 4,310
(3.2) %7,8027,551 7,8027,55110,057412210 Workers Compensation Ins2875000 8,899
(4.0) %81,45078,148 81,45078,14865,453412220 Health Insurance2875000 49,758
( .8) %2,9882,962 2,9882,9623,002412222 Dental Insurance2875000 2,334
(3.0) %2,9162,826 2,9162,8262,098412230 Life Insurance2875000 1,522
(3.5) %281271 281271279412240 Unemployment Insurance2875000 270
-136136 136136251412250 Disability Insurance2875000 125
(8.9) %163,128148,582 163,128148,582124,850412310 PERS Retirement2875000 89,308
(2.7) %7,2597,061 7,2597,0616,340412320 Medicare OASDI2875000 4,716
(20.0) %9,0007,200 9,0007,2003,975412400 Deferred Compensation2875000 1,900
-0 004,35016,150HA Meeting Compensation2875000412515 0
(100.0)%0 15,365000Ptr. Comp. Model2875000419996 0
(6.5) %796,623744,760744,760 781,258Personnel Services Total 639,155504,042
-65,00065,000 65,00079,82418,395421000 Professional Services2875000 22,130
-10,00010,000 10,00025,0222,733421100 Outside Legal Services2875000 12,395
-2,500 2,5002,50000Telephone2875000422100 2,500
-2,5002,500 2,5002,5062,271422120 Telephone - Cellular2875000 1,849
(26.1) %6,5004,800 6,5004,8005,689423400 Motor Pool Equipment Rental2875000 4,970
-1,000 1,0001,0000172Vehicle Usage Reimb Employee2875000423500 1,000
-60,00060,000 60,00026,2589,274424130 Maint/Repair of Bldgs & Improv2875000 34,064
-10,00010,000 10,00010,0002,366425100 Advertising Expense2875000 917
-5,0005,000 5,0005,0004,418425400 General Office Expense2875000 2,680
-5,0005,000 5,0005,000393425500 Postage2875000 477
-1,000 1,0001,00000Central Printing Charges2875000425600 1,000
-1,0001,000 1,0001,0001,830425610 Outside Printing Expense2875000 143
-500500 500500225426800 Special Department Supplies2875000 485
-4,0004,000 4,0004,0005,733427200 Training2875000 2,400
-0 01,52200Legal Fees2875000428200 0
(3.1) %10,2679,939 10,2679,93913,123428400 Liability Insurance2875000 7,887
(1.1) %184,267179,873182,239 184,267Non-personnel Expenses Total 66,45590,576
-0 00458,1510Principal2875000481000 0
-5,500 5,5005,50003,918Interest2875000482000 5,500
-5,5005,5005,500 5,500Debt Service Total 458,1513,918
-0 095,44100Chicago/Linden SP - UDAG9864510440440 0
CCReport Name: 2017_Mid_Cycle_Report
Report Description: Budget Book - Department Budget Detail wMD
06/07/2017Date:
Time: 287
Version:
Page:19:21:28
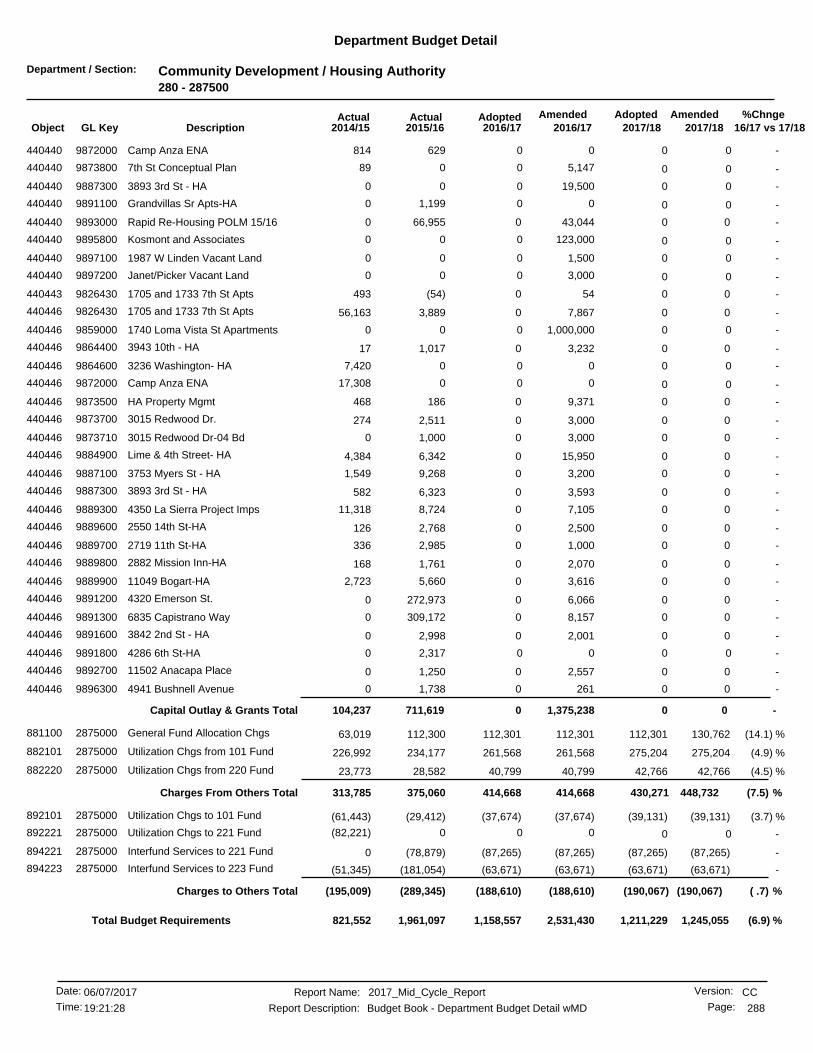
Department / Section: Community Development / Housing Authority280 - 287500
Department Budget Detail
%Chnge16/17 vs 17/182017/182017/18
AmendedAdoptedAdopted2016/17
AmendedActualActual2016/172015/162014/15GL KeyObject Description
-0 00629814Camp Anza ENA9872000440440 0
-0 05,1470897th St Conceptual Plan9873800440440 0
-0 019,500003893 3rd St - HA9887300440440 0
-0 001,1990Grandvillas Sr Apts-HA9891100440440 0
-00 043,04466,955440440 Rapid Re-Housing POLM 15/169893000 0
-0 0123,00000Kosmont and Associates9895800440440 0
-0 01,500001987 W Linden Vacant Land9897100440440 0
-0 03,00000Janet/Picker Vacant Land9897200440440 0
-00 054(54)440443 1705 and 1733 7th St Apts9826430 493
-00 07,8673,889440446 1705 and 1733 7th St Apts9826430 56,163
-0 01,000,000001740 Loma Vista St Apartments9859000440446 0
-00 03,2321,017440446 3943 10th - HA9864400 17
-0 0007,4203236 Washington- HA9864600440446 0
-0 00017,308Camp Anza ENA9872000440446 0
-00 09,371186440446 HA Property Mgmt9873500 468
-00 03,0002,511440446 3015 Redwood Dr.9873700 274
-00 03,0001,000440446 3015 Redwood Dr-04 Bd9873710 0
-00 015,9506,342440446 Lime & 4th Street- HA9884900 4,384
-00 03,2009,268440446 3753 Myers St - HA9887100 1,549
-00 03,5936,323440446 3893 3rd St - HA9887300 582
-00 07,1058,724440446 4350 La Sierra Project Imps9889300 11,318
-00 02,5002,768440446 2550 14th St-HA9889600 126
-00 01,0002,985440446 2719 11th St-HA9889700 336
-00 02,0701,761440446 2882 Mission Inn-HA9889800 168
-00 03,6165,660440446 11049 Bogart-HA9889900 2,723
-00 06,066272,973440446 4320 Emerson St.9891200 0
-00 08,157309,172440446 6835 Capistrano Way9891300 0
-00 02,0012,998440446 3842 2nd St - HA9891600 0
-0 002,31704286 6th St-HA9891800440446 0
-00 02,5571,250440446 11502 Anacapa Place9892700 0
-00 02611,738440446 4941 Bushnell Avenue9896300 0
-0 0Capital Outlay & Grants Total 01,375,238711,619104,237
(14.1) %130,762112,301 112,301112,301112,300881100 General Fund Allocation Chgs2875000 63,019
(4.9) %275,204261,568 275,204261,568234,177882101 Utilization Chgs from 101 Fund2875000 226,992
(4.5) %42,76640,799 42,76640,79928,582882220 Utilization Chgs from 220 Fund2875000 23,773
(7.5) %448,732414,668414,668 430,271Charges From Others Total 375,060313,785
(3.7) %(39,131)(37,674) (39,131)(37,674)(29,412)892101 Utilization Chgs to 101 Fund2875000 (61,443)
-0 000(82,221)Utilization Chgs to 221 Fund2875000892221 0
-(87,265)(87,265) (87,265)(87,265)(78,879)894221 Interfund Services to 221 Fund2875000 0
-(63,671)(63,671) (63,671)(63,671)(181,054)894223 Interfund Services to 223 Fund2875000 (51,345)
( .7) %(190,067)(188,610)(188,610) (190,067)Charges to Others Total (289,345)(195,009)
(6.9) %1,158,557 1,245,0551,211,2292,531,4301,961,097821,552Total Budget Requirements
CCReport Name: 2017_Mid_Cycle_Report
Report Description: Budget Book - Department Budget Detail wMD
06/07/2017Date:
Time: 288
Version:
Page:19:21:28

Department / Section: Balance Sheet / Revenue / Balance Sheet / Revenue281 - 000000
Department Budget Detail
%Chnge16/17 vs 17/182017/182017/18
AmendedAdoptedAdopted2016/17
AmendedActualActual2016/172015/162014/15GL KeyObject Description
-0 000133,014Operating Transfer to 101 Fund0000281990101 0
-0 000960,670Operating Transfer to 223 Fund0000281990223 0
-0 002,942,0003,641,800Operating Transfer to 280 Fund0000281990280 0
-0 000324Operating Transfer to 770 Fund0000281990770 0
-0 0Operating Transfers Out Total 002,942,0004,735,809
-00 002,942,000Total Budget Requirements 4,735,809
CCReport Name: 2017_Mid_Cycle_Report
Report Description: Budget Book - Department Budget Detail wMD
06/07/2017Date:
Time: 289
Version:
Page:19:21:28
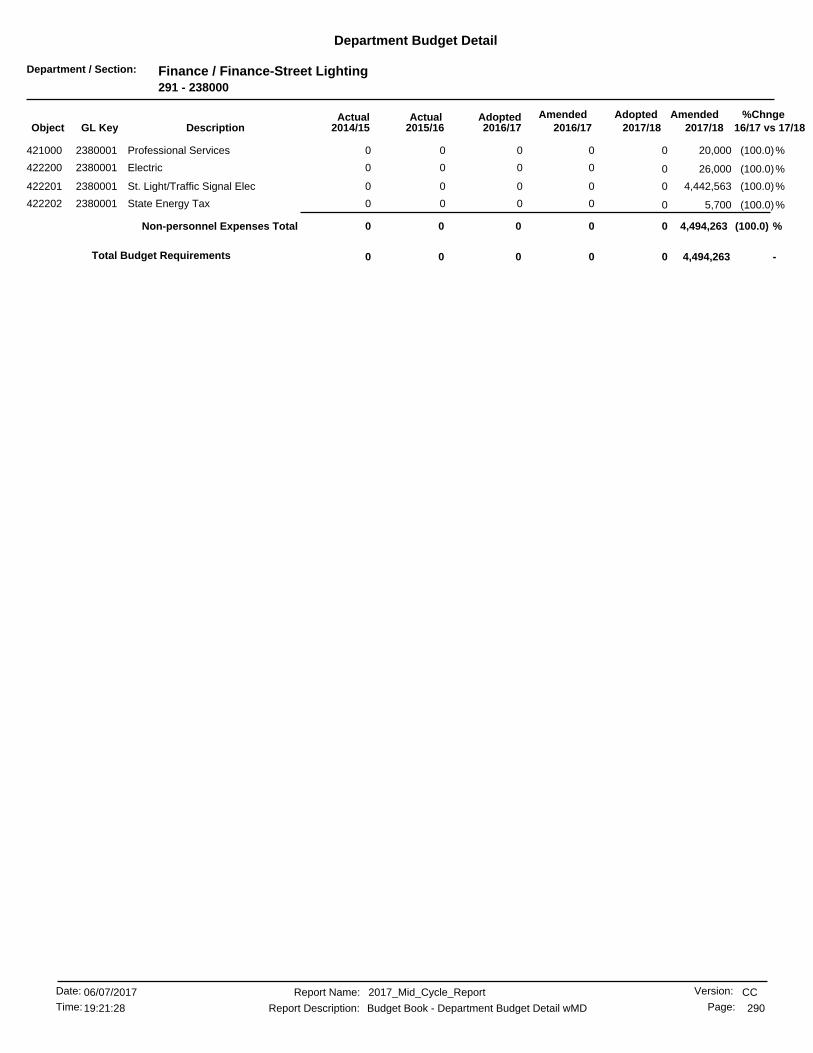
Department / Section: Finance / Finance-Street Lighting291 - 238000
Department Budget Detail
%Chnge16/17 vs 17/182017/182017/18
AmendedAdoptedAdopted2016/17
AmendedActualActual2016/172015/162014/15GL KeyObject Description
(100.0)%0 20,000000Professional Services2380001421000 0
(100.0)%0 26,000000Electric2380001422200 0
(100.0)%0 4,442,563000St. Light/Traffic Signal Elec2380001422201 0
(100.0)%0 5,700000State Energy Tax2380001422202 0
(100.0) %0 4,494,263Non-personnel Expenses Total 0000
-4,494,2630 000Total Budget Requirements 0
CCReport Name: 2017_Mid_Cycle_Report
Report Description: Budget Book - Department Budget Detail wMD
06/07/2017Date:
Time: 290
Version:
Page:19:21:28

Department / Section: Public Works / Public Wrk-Landscpe Maint Dist291 - 411012
Department Budget Detail
%Chnge16/17 vs 17/182017/182017/18
AmendedAdoptedAdopted2016/17
AmendedActualActual2016/172015/162014/15GL KeyObject Description
(100.0)%0 4,500000Highlander Lndscp Maint Area9716830421000 0
(100.0)%0 45,500000Riverwalk Landscape Maint Dist9760370421000 0
(100.0)%0 62,616000Highlander Lndscp Maint Area9716830421203 0
(100.0)%0 180,648000Riverwalk Landscape Maint Dist9760370421203 0
(100.0)%0 20,000000Riverwalk Landscape Maint Dist9760370421205 0
(100.0)%0 5,000000Riverwalk Landscape Maint Dist9760370422200 0
(100.0)%0 25,000000Highlander Lndscp Maint Area9716830422500 0
(100.0)%0 10,000000Riverwalk Landscape Maint Dist9760370422500 0
(100.0)%0 5000Highlander Lndscp Maint Area9716830422600 0
(100.0)%0 100000Highlander Lndscp Maint Area9716830424220 0
(100.0)%0 500000Riverwalk Landscape Maint Dist9760370425300 0
(100.0)%0 100000Highlander Lndscp Maint Area9716830425400 0
(100.0)%0 1,000000Riverwalk Landscape Maint Dist9760370425400 0
(100.0)%0 100000Highlander Lndscp Maint Area9716830426700 0
(100.0)%0 1,000000Riverwalk Landscape Maint Dist9760370426700 0
(100.0)%0 100000Highlander Lndscp Maint Area9716830426800 0
(100.0)%0 23,000000Riverwalk Landscape Maint Dist9760370426800 0
(100.0) %0 379,169Non-personnel Expenses Total 0000
(100.0)%0 30,000000Riverwalk LMD Park Improvemnts9760380450119 0
(100.0) %0 30,000Special Projects Total 0000
(100.0)%0 186,760000Riverwalk Landscape Maint Dist9760370882101 0
(100.0) %0 186,760Charges From Others Total 0000
-595,9290 000Total Budget Requirements 0
CCReport Name: 2017_Mid_Cycle_Report
Report Description: Budget Book - Department Budget Detail wMD
06/07/2017Date:
Time: 291
Version:
Page:19:21:28
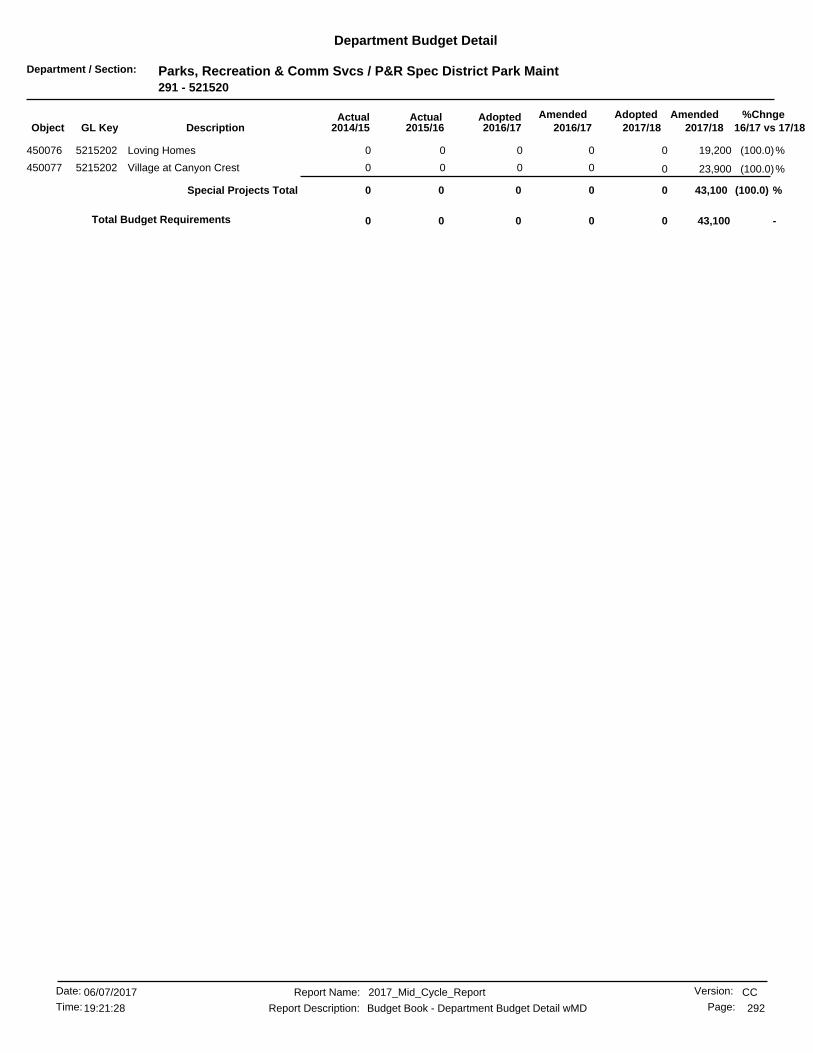
Department / Section: Parks, Recreation & Comm Svcs / P&R Spec District Park Maint291 - 521520
Department Budget Detail
%Chnge16/17 vs 17/182017/182017/18
AmendedAdoptedAdopted2016/17
AmendedActualActual2016/172015/162014/15GL KeyObject Description
(100.0)%0 19,200000Loving Homes5215202450076 0
(100.0)%0 23,900000Village at Canyon Crest5215202450077 0
(100.0) %0 43,100Special Projects Total 0000
-43,1000 000Total Budget Requirements 0
CCReport Name: 2017_Mid_Cycle_Report
Report Description: Budget Book - Department Budget Detail wMD
06/07/2017Date:
Time: 292
Version:
Page:19:21:28

Department / Section: Balance Sheet / Revenue / RDSA RORF-Arlington371 - 000000
Department Budget Detail
%Chnge16/17 vs 17/182017/182017/18
AmendedAdoptedAdopted2016/17
AmendedActualActual2016/172015/162014/15GL KeyObject Description
-00 0837,553871,185990770 Operating Transfer to 770 Fund0000371 901,954
-0 0Operating Transfers Out Total 0837,553871,185901,954
-0 00137,425233,923Principal0000371481000 0
-0 0Debt Service Total 00137,425233,923
-0 00837,5531,008,6111,135,877Total Budget Requirements
(100.0) %00 0837,5531,008,611Total Budget Requirements 1,135,877
CCReport Name: 2017_Mid_Cycle_Report
Report Description: Budget Book - Department Budget Detail wMD
06/07/2017Date:
Time: 293
Version:
Page:19:21:28
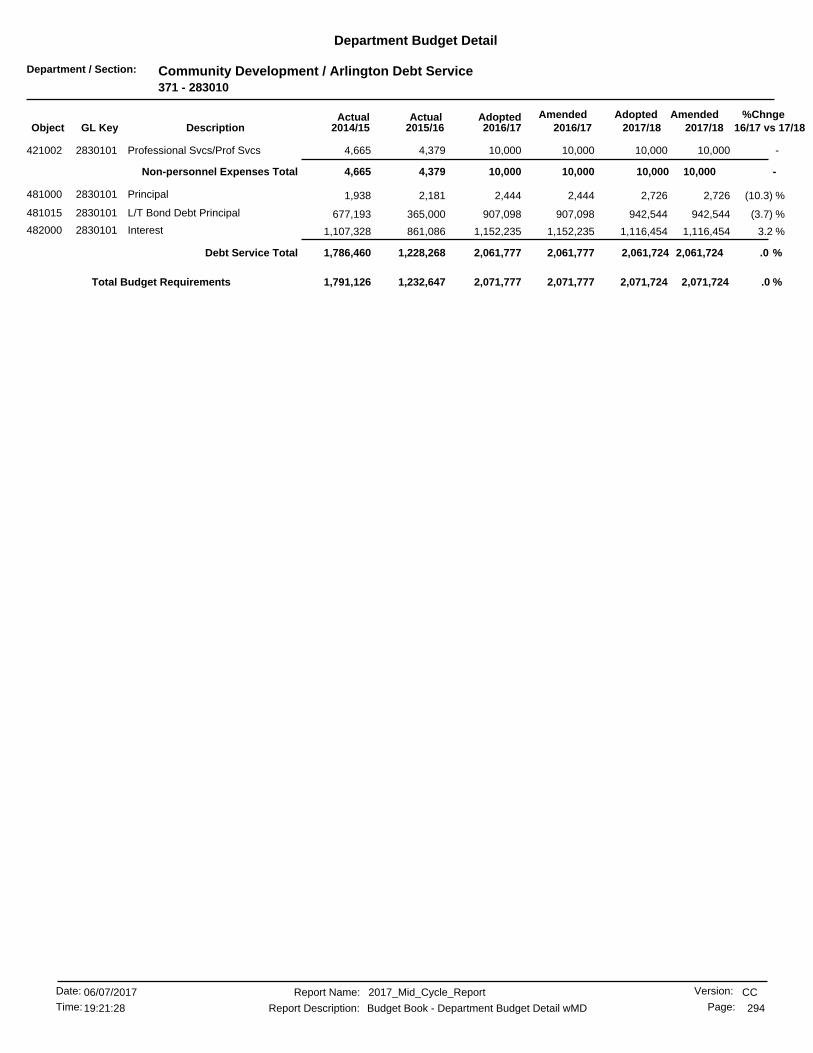
Department / Section: Community Development / Arlington Debt Service371 - 283010
Department Budget Detail
%Chnge16/17 vs 17/182017/182017/18
AmendedAdoptedAdopted2016/17
AmendedActualActual2016/172015/162014/15GL KeyObject Description
-10,00010,000 10,00010,0004,379421002 Professional Svcs/Prof Svcs2830101 4,665
-10,00010,00010,000 10,000Non-personnel Expenses Total 4,3794,665
(10.3) %2,7262,444 2,7262,4442,181481000 Principal2830101 1,938
(3.7) %942,544907,098 942,544907,098365,000481015 L/T Bond Debt Principal2830101 677,193
3.2 %1,116,4541,152,235 1,116,4541,152,235861,086482000 Interest2830101 1,107,328
.0 %2,061,7242,061,7772,061,777 2,061,724Debt Service Total 1,228,2681,786,460
.0 %2,071,777 2,071,7242,071,7242,071,7771,232,6471,791,126Total Budget Requirements
CCReport Name: 2017_Mid_Cycle_Report
Report Description: Budget Book - Department Budget Detail wMD
06/07/2017Date:
Time: 294
Version:
Page:19:21:28

Department / Section: Balance Sheet / Revenue / RDSA RORF-Casa Blanca372 - 000000
Department Budget Detail
%Chnge16/17 vs 17/182017/182017/18
AmendedAdoptedAdopted2016/17
AmendedActualActual2016/172015/162014/15GL KeyObject Description
-00 0998,4611,042,151990770 Operating Transfer to 770 Fund0000372 495,737
-0 0Operating Transfers Out Total 0998,4611,042,151495,737
-0 0015,21625,901Principal0000372481000 0
-0 0Debt Service Total 0015,21625,901
-0 00998,4611,057,368521,639Total Budget Requirements
(100.0) %00 0998,4611,057,368Total Budget Requirements 521,639
CCReport Name: 2017_Mid_Cycle_Report
Report Description: Budget Book - Department Budget Detail wMD
06/07/2017Date:
Time: 295
Version:
Page:19:21:28

Department / Section: Community Development / Casa Blanca Debt Service372 - 283020
Department Budget Detail
%Chnge16/17 vs 17/182017/182017/18
AmendedAdoptedAdopted2016/17
AmendedActualActual2016/172015/162014/15GL KeyObject Description
-10,00010,000 10,00010,0006,482421002 Professional Svcs/Prof Svcs2830201 6,863
-10,00010,00010,000 10,000Non-personnel Expenses Total 6,4826,863
(10.3) %5,3934,836 5,3934,8364,316481000 Principal2830201 3,835
(2.8) %944,676918,223 944,676918,223335,000481015 L/T Bond Debt Principal2830201 1,268,652
4.3 %881,669920,372 881,669920,372516,390482000 Interest2830201 832,660
.6 %1,831,7381,843,4311,843,431 1,831,738Debt Service Total 855,7072,105,148
.6 %1,853,431 1,841,7381,841,7381,853,431862,1892,112,011Total Budget Requirements
CCReport Name: 2017_Mid_Cycle_Report
Report Description: Budget Book - Department Budget Detail wMD
06/07/2017Date:
Time: 296
Version:
Page:19:21:28
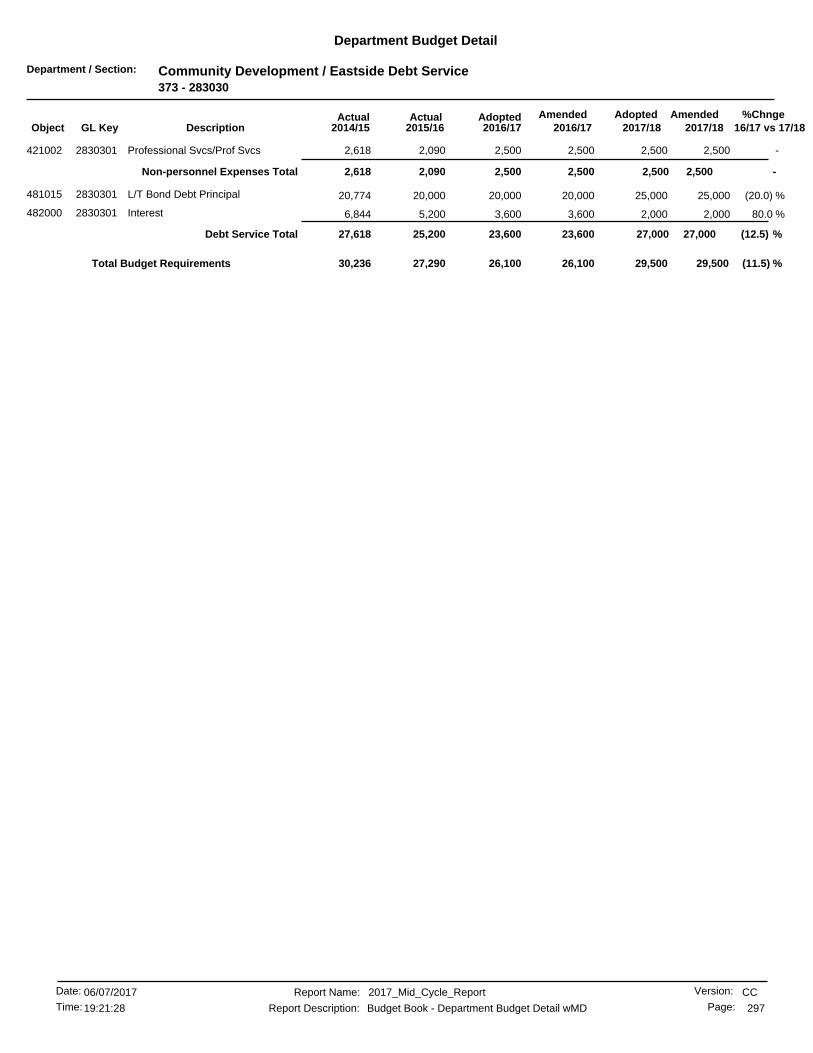
Department / Section: Community Development / Eastside Debt Service373 - 283030
Department Budget Detail
%Chnge16/17 vs 17/182017/182017/18
AmendedAdoptedAdopted2016/17
AmendedActualActual2016/172015/162014/15GL KeyObject Description
-2,5002,500 2,5002,5002,090421002 Professional Svcs/Prof Svcs2830301 2,618
-2,5002,5002,500 2,500Non-personnel Expenses Total 2,0902,618
(20.0) %25,00020,000 25,00020,00020,000481015 L/T Bond Debt Principal2830301 20,774
80.0 %2,0003,600 2,0003,6005,200482000 Interest2830301 6,844
(12.5) %27,00023,60023,600 27,000Debt Service Total 25,20027,618
(11.5) %26,100 29,50029,50026,10027,29030,236Total Budget Requirements
CCReport Name: 2017_Mid_Cycle_Report
Report Description: Budget Book - Department Budget Detail wMD
06/07/2017Date:
Time: 297
Version:
Page:19:21:28
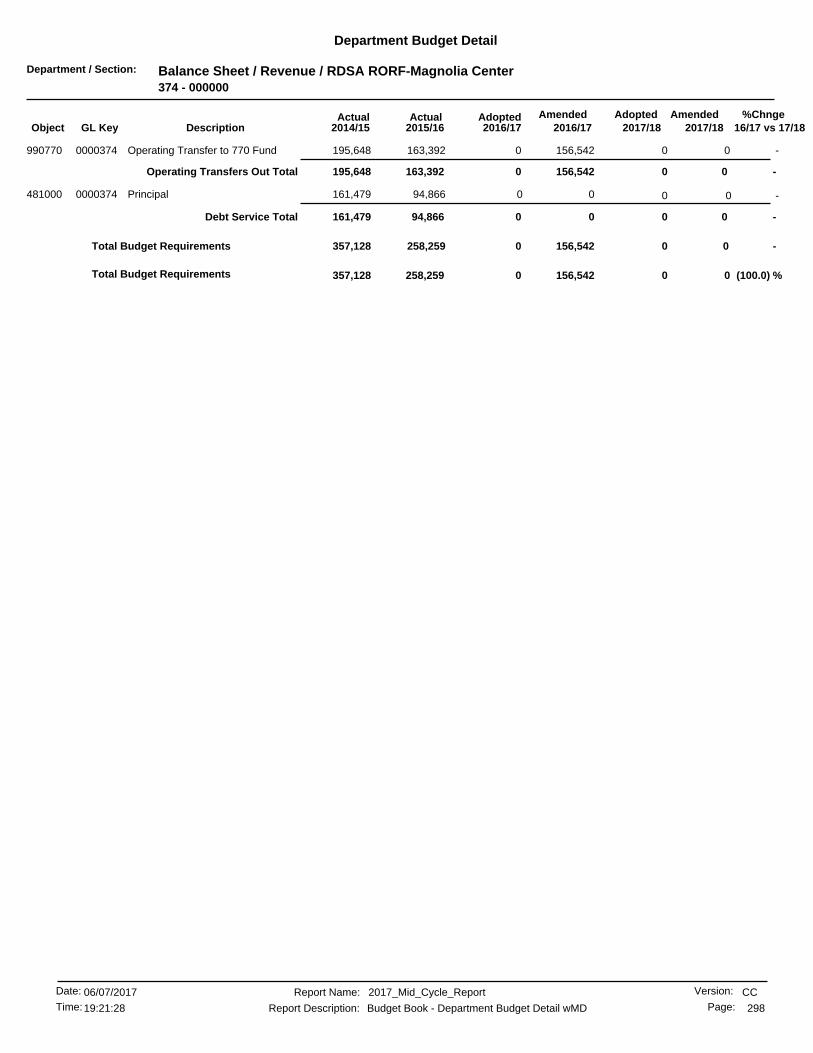
Department / Section: Balance Sheet / Revenue / RDSA RORF-Magnolia Center374 - 000000
Department Budget Detail
%Chnge16/17 vs 17/182017/182017/18
AmendedAdoptedAdopted2016/17
AmendedActualActual2016/172015/162014/15GL KeyObject Description
-00 0156,542163,392990770 Operating Transfer to 770 Fund0000374 195,648
-0 0Operating Transfers Out Total 0156,542163,392195,648
-0 0094,866161,479Principal0000374481000 0
-0 0Debt Service Total 0094,866161,479
-0 00156,542258,259357,128Total Budget Requirements
(100.0) %00 0156,542258,259Total Budget Requirements 357,128
CCReport Name: 2017_Mid_Cycle_Report
Report Description: Budget Book - Department Budget Detail wMD
06/07/2017Date:
Time: 298
Version:
Page:19:21:28

Department / Section: Community Development / Magnolia Center Debt Service374 - 283040
Department Budget Detail
%Chnge16/17 vs 17/182017/182017/18
AmendedAdoptedAdopted2016/17
AmendedActualActual2016/172015/162014/15GL KeyObject Description
-3,5003,500 3,5003,5001,876421002 Professional Svcs/Prof Svcs2830401 2,012
-3,5003,5003,500 3,500Non-personnel Expenses Total 1,8762,012
(10.3) %1,6241,456 1,6241,4561,299481000 Principal2830401 1,154
(3.6) %478,236460,656 478,236460,656350,000481015 L/T Bond Debt Principal2830401 414,835
2.6 %872,587895,656 872,587895,656848,475482000 Interest2830401 908,944
.3 %1,352,4471,357,7681,357,768 1,352,447Debt Service Total 1,199,7741,324,934
.3 %1,361,268 1,355,9471,355,9471,361,2681,201,6511,326,947Total Budget Requirements
CCReport Name: 2017_Mid_Cycle_Report
Report Description: Budget Book - Department Budget Detail wMD
06/07/2017Date:
Time: 299
Version:
Page:19:21:28
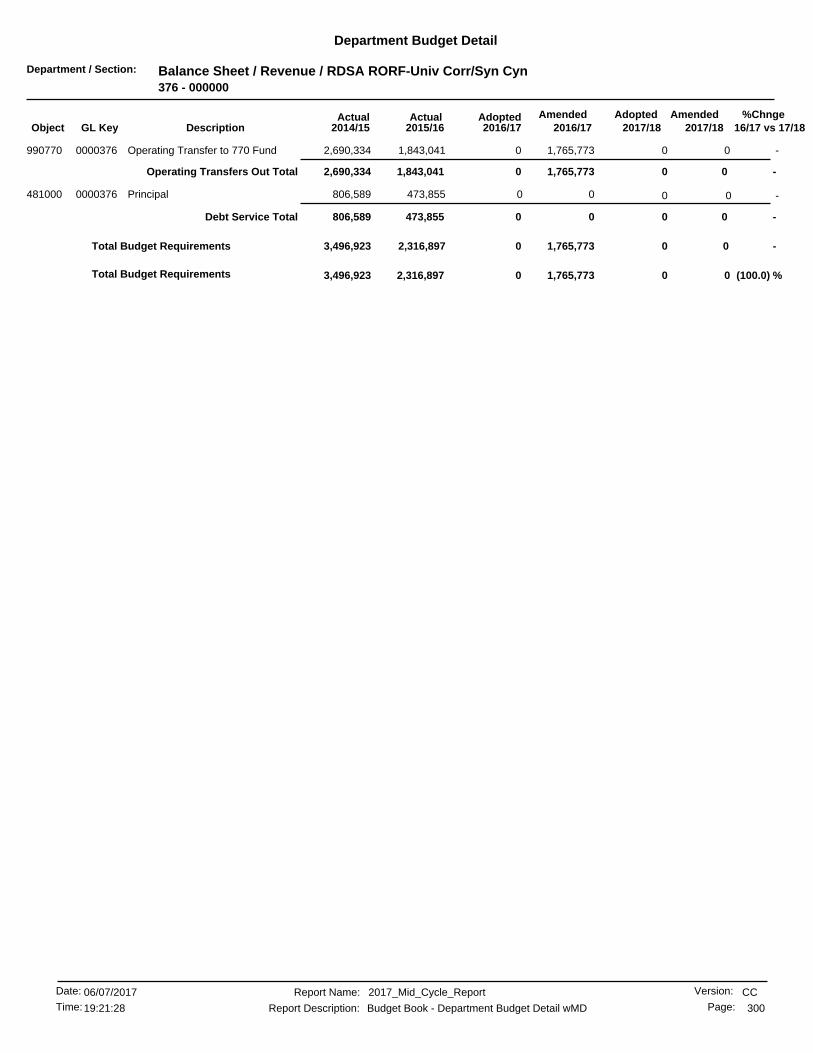
Department / Section: Balance Sheet / Revenue / RDSA RORF-Univ Corr/Syn Cyn376 - 000000
Department Budget Detail
%Chnge16/17 vs 17/182017/182017/18
AmendedAdoptedAdopted2016/17
AmendedActualActual2016/172015/162014/15GL KeyObject Description
-00 01,765,7731,843,041990770 Operating Transfer to 770 Fund0000376 2,690,334
-0 0Operating Transfers Out Total 01,765,7731,843,0412,690,334
-0 00473,855806,589Principal0000376481000 0
-0 0Debt Service Total 00473,855806,589
-0 001,765,7732,316,8973,496,923Total Budget Requirements
(100.0) %00 01,765,7732,316,897Total Budget Requirements 3,496,923
CCReport Name: 2017_Mid_Cycle_Report
Report Description: Budget Book - Department Budget Detail wMD
06/07/2017Date:
Time: 300
Version:
Page:19:21:28

Department / Section: Community Development / Univ Corridor/Syca Cyn Debt376 - 283060
Department Budget Detail
%Chnge16/17 vs 17/182017/182017/18
AmendedAdoptedAdopted2016/17
AmendedActualActual2016/172015/162014/15GL KeyObject Description
-10,00010,000 10,00010,0002,915421002 Professional Svcs/Prof Svcs2830601 5,050
-10,00010,00010,000 10,000Non-personnel Expenses Total 2,9155,050
(10.3) %12,52711,231 12,52711,231405,025481000 Principal2830601 388,909
(25.5) %1,447,9511,077,585 1,447,9511,077,58560,000481015 L/T Bond Debt Principal2830601 1,118,120
2.4 %2,055,9182,106,706 2,055,9182,106,7061,373,703482000 Interest2830601 1,918,924
(9.1) %3,516,3963,195,5223,195,522 3,516,396Debt Service Total 1,838,7293,425,953
-216,000216,000 216,000216,000216,000882390 Utilization Chgs from 390 Fund2830601 216,000
-216,000 216,000Charges From Others Total 216,000216,000216,000216,000
(8.5) %3,421,522 3,742,3963,742,3963,421,5222,057,6443,647,004Total Budget Requirements
CCReport Name: 2017_Mid_Cycle_Report
Report Description: Budget Book - Department Budget Detail wMD
06/07/2017Date:
Time: 301
Version:
Page:19:21:28
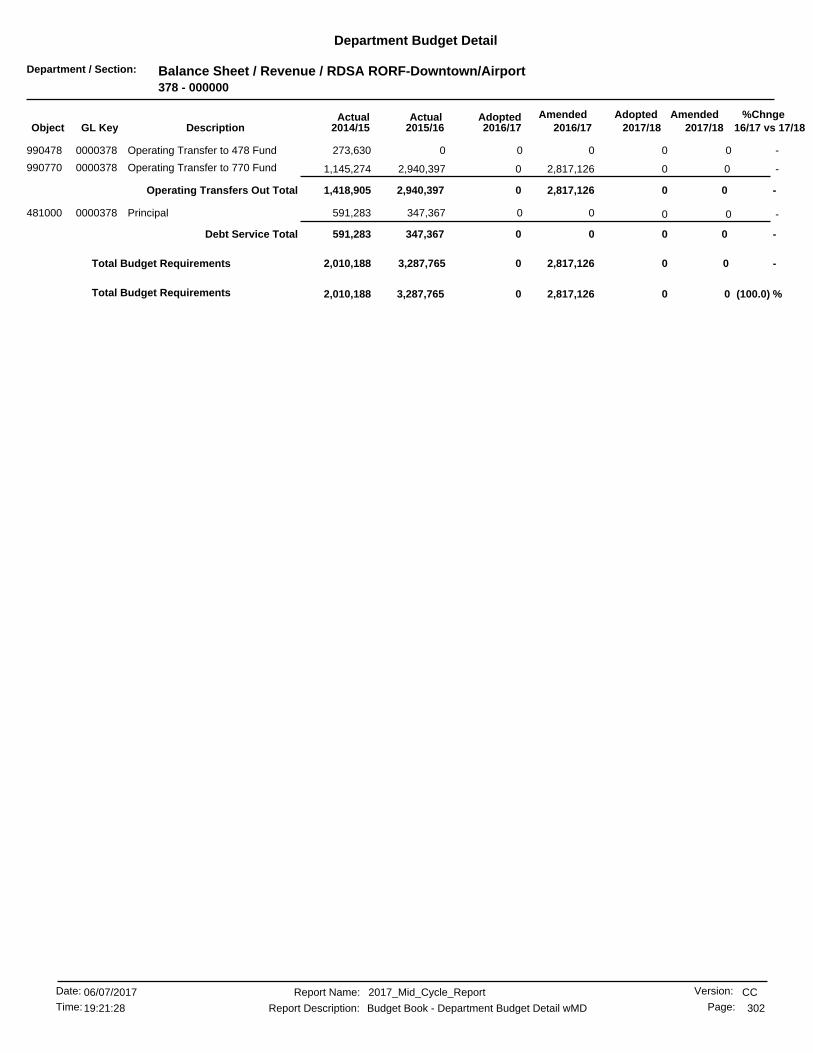
Department / Section: Balance Sheet / Revenue / RDSA RORF-Downtown/Airport378 - 000000
Department Budget Detail
%Chnge16/17 vs 17/182017/182017/18
AmendedAdoptedAdopted2016/17
AmendedActualActual2016/172015/162014/15GL KeyObject Description
-0 000273,630Operating Transfer to 478 Fund0000378990478 0
-00 02,817,1262,940,397990770 Operating Transfer to 770 Fund0000378 1,145,274
-0 0Operating Transfers Out Total 02,817,1262,940,3971,418,905
-0 00347,367591,283Principal0000378481000 0
-0 0Debt Service Total 00347,367591,283
-0 002,817,1263,287,7652,010,188Total Budget Requirements
(100.0) %00 02,817,1263,287,765Total Budget Requirements 2,010,188
CCReport Name: 2017_Mid_Cycle_Report
Report Description: Budget Book - Department Budget Detail wMD
06/07/2017Date:
Time: 302
Version:
Page:19:21:28
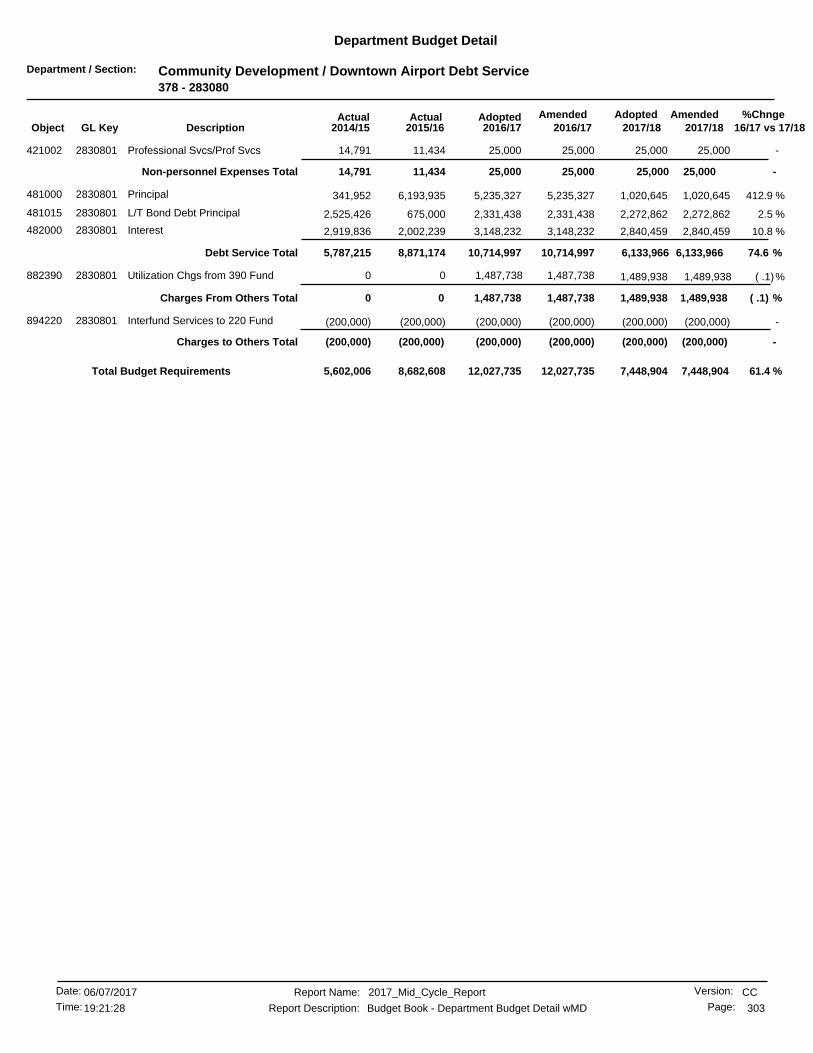
Department / Section: Community Development / Downtown Airport Debt Service378 - 283080
Department Budget Detail
%Chnge16/17 vs 17/182017/182017/18
AmendedAdoptedAdopted2016/17
AmendedActualActual2016/172015/162014/15GL KeyObject Description
-25,00025,000 25,00025,00011,434421002 Professional Svcs/Prof Svcs2830801 14,791
-25,00025,00025,000 25,000Non-personnel Expenses Total 11,43414,791
412.9 %1,020,6455,235,327 1,020,6455,235,3276,193,935481000 Principal2830801 341,952
2.5 %2,272,8622,331,438 2,272,8622,331,438675,000481015 L/T Bond Debt Principal2830801 2,525,426
10.8 %2,840,4593,148,232 2,840,4593,148,2322,002,239482000 Interest2830801 2,919,836
74.6 %6,133,96610,714,99710,714,997 6,133,966Debt Service Total 8,871,1745,787,215
( .1)%1,487,738 1,489,9381,487,73800Utilization Chgs from 390 Fund2830801882390 1,489,938
( .1) %1,487,738 1,489,938Charges From Others Total 1,489,9381,487,73800
-(200,000)(200,000) (200,000)(200,000)(200,000)894220 Interfund Services to 220 Fund2830801 (200,000)
-(200,000) (200,000)Charges to Others Total (200,000)(200,000)(200,000)(200,000)
61.4 %12,027,735 7,448,9047,448,90412,027,7358,682,6085,602,006Total Budget Requirements
CCReport Name: 2017_Mid_Cycle_Report
Report Description: Budget Book - Department Budget Detail wMD
06/07/2017Date:
Time: 303
Version:
Page:19:21:28
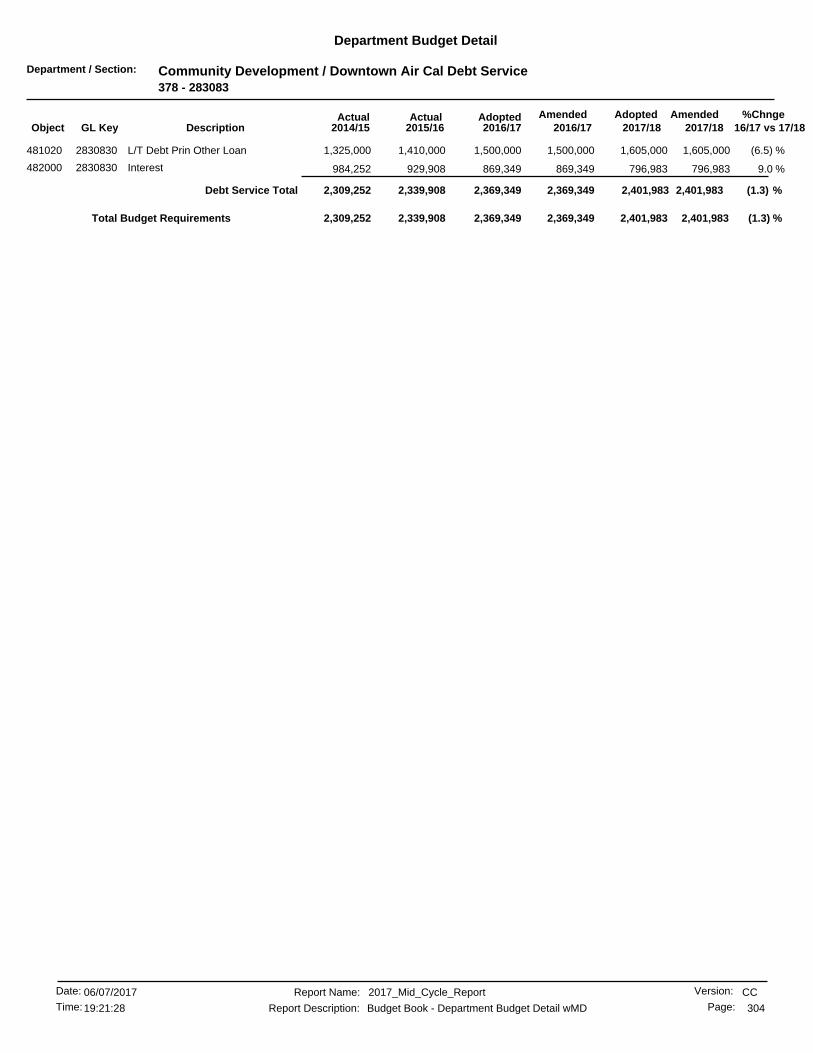
Department / Section: Community Development / Downtown Air Cal Debt Service378 - 283083
Department Budget Detail
%Chnge16/17 vs 17/182017/182017/18
AmendedAdoptedAdopted2016/17
AmendedActualActual2016/172015/162014/15GL KeyObject Description
(6.5) %1,605,0001,500,000 1,605,0001,500,0001,410,000481020 L/T Debt Prin Other Loan2830830 1,325,000
9.0 %796,983869,349 796,983869,349929,908482000 Interest2830830 984,252
(1.3) %2,401,9832,369,3492,369,349 2,401,983Debt Service Total 2,339,9082,309,252
(1.3) %2,369,349 2,401,9832,401,9832,369,3492,339,9082,309,252Total Budget Requirements
CCReport Name: 2017_Mid_Cycle_Report
Report Description: Budget Book - Department Budget Detail wMD
06/07/2017Date:
Time: 304
Version:
Page:19:21:28
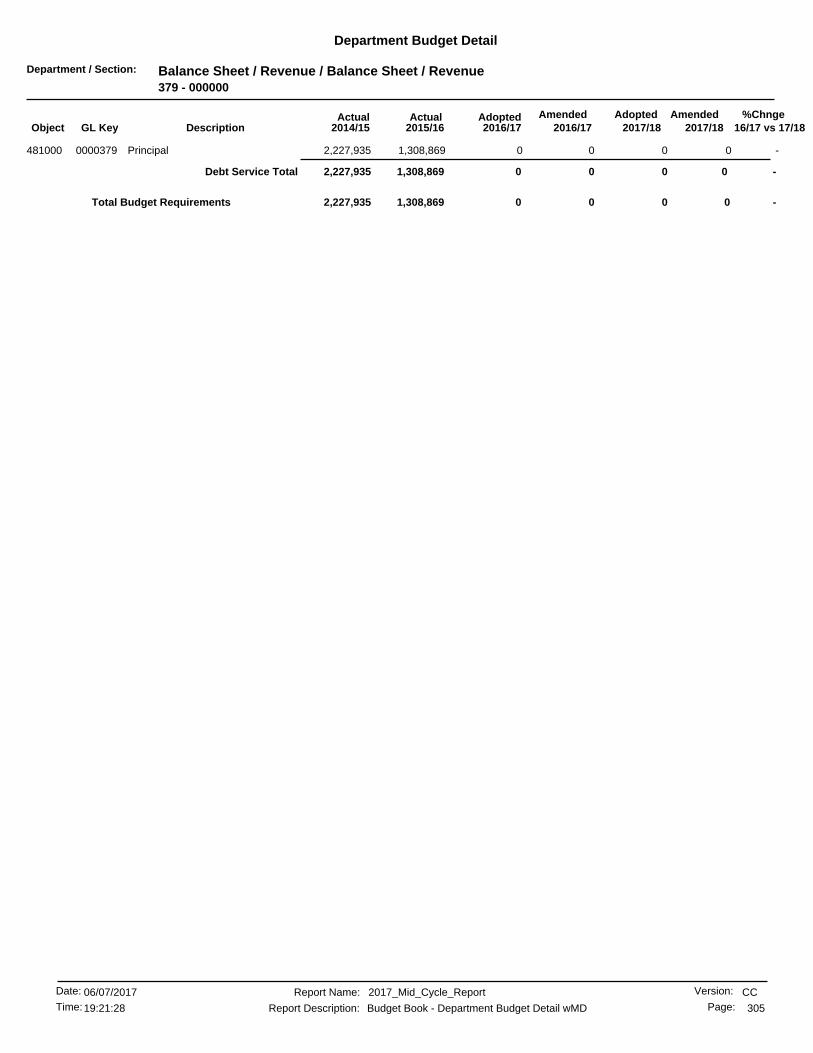
Department / Section: Balance Sheet / Revenue / Balance Sheet / Revenue379 - 000000
Department Budget Detail
%Chnge16/17 vs 17/182017/182017/18
AmendedAdoptedAdopted2016/17
AmendedActualActual2016/172015/162014/15GL KeyObject Description
-0 001,308,8692,227,935Principal0000379481000 0
-0 0Debt Service Total 001,308,8692,227,935
-00 001,308,869Total Budget Requirements 2,227,935
CCReport Name: 2017_Mid_Cycle_Report
Report Description: Budget Book - Department Budget Detail wMD
06/07/2017Date:
Time: 305
Version:
Page:19:21:28

Department / Section: Community Development / La Sierra/Arlanza Proj Area379 - 283090
Department Budget Detail
%Chnge16/17 vs 17/182017/182017/18
AmendedAdoptedAdopted2016/17
AmendedActualActual2016/172015/162014/15GL KeyObject Description
-6,0006,000 6,0006,0004,461421002 Professional Svcs/Prof Svcs2830901 4,848
-6,0006,0006,000 6,000Non-personnel Expenses Total 4,4614,848
(5.3) %1,120,0001,060,000 1,120,0001,060,0001,010,000481015 L/T Bond Debt Principal2830901 960,000
2.9 %1,894,1611,950,269 1,894,1611,950,2692,004,503482000 Interest2830901 2,056,117
( .1) %3,014,1613,010,2693,010,269 3,014,161Debt Service Total 3,014,5033,016,117
(1.9) %253,442248,473 253,442248,473242,968882390 Utilization Chgs from 390 Fund2830901 242,122
(1.9) %253,442248,473248,473 253,442Charges From Others Total 242,968242,122
( .2) %3,264,742 3,273,6033,273,6033,264,7423,261,9333,263,088Total Budget Requirements
CCReport Name: 2017_Mid_Cycle_Report
Report Description: Budget Book - Department Budget Detail wMD
06/07/2017Date:
Time: 306
Version:
Page:19:21:28

Department / Section: Finance / Finance-Debt Service390 - 237000
Department Budget Detail
%Chnge16/17 vs 17/182017/182017/18
AmendedAdoptedAdopted2016/17
AmendedActualActual2016/172015/162014/15GL KeyObject Description
-0 003,5403,540Professional Services2370100421000 0
(54.5) %110,00050,000 50,00050,00030,605447010 Annual Bond Expense2370100 26,633
-10,00010,000 10,000153,9691,177455001 Spec Dist Admin Misc Expense2370100 895
(50.0) %120,000203,96960,000 60,000Non-personnel Expenses Total 35,32231,068
(63.2) %5,634,2022,071,602 2,120,3902,071,6022,018,962481000 Principal2370100 1,973,598
(70.2) %20,145,0006,000,000 6,205,0006,000,0005,815,000481015 L/T Bond Debt Principal2370100 5,540,000
(100.0)%0 195,000000Bond Cost of Issuance2370100481018 0
(32.5) %13,253,6418,934,178 8,641,6928,934,1789,039,257482000 Interest2370100 9,322,549
(56.6) %39,227,84317,005,78017,005,780 16,967,082Debt Service Total 16,873,21916,836,148
(51.7) %(26,588,388)(12,823,150) (12,784,040)(12,823,150)(12,692,560)892101 Utilization Chgs to 101 Fund2370100 (12,690,363)
(100.0)%0 (4,086,290)000Utilization Chgs to 110 Fund2370100892110 0
(100.0)%0 (38,226)000Utilization Chgs to 240 Fund2370100892240 0
-(216,000)(216,000) (216,000)(216,000)(216,000)892376 Utilization Chgs to 376 Fund2370100 (216,000)
( .1)%(1,487,738) (1,489,938)(1,487,738)0(0)Utilization Chgs to 378 Fund2370100892378 (1,489,938)
(1.9) %(253,442)(248,473) (253,442)(248,473)(242,968)892379 Utilization chgs to 379 Fund2370100 (242,123)
-(738,000)(738,000) (738,000)(738,000)(738,000)892570 Utilization Chgs to 570 Fund2370100 (738,000)
(100.0)%0 (14,118)000Utilization Chgs to 580 Fund2370100892580 0
(100.0)%0 (2,275,579)000Utilization Chgs to 581 Fund2370100892581 0
-(2,000)(2,000) (2,000)(2,000)(1,999)892742 Utilization Chgs to 742 Fund2370100 (2,000)
-(2,000)(2,000) (2,000)(2,000)(1,999)892745 Utilization Chgs to 745 Fund2370100 (2,000)
-(2,000)(2,000) (2,000)(2,000)(1,999)892746 Utilization Chgs to 746 Fund2370100 (2,000)
-0 000(2,000)Utilization Chgs to 751 Fund2370100892751 0
-0 000(2,000)Utilization Chgs to 753 Fund2370100892753 0
-(2,000)(2,000) (2,000)(2,000)(1,999)892756 Utilization Chgs to 756 Fund2370100 (2,000)
-0 000(2,000)Utilization Chgs to 757 Fund2370100892757 0
-(2,000)(2,000) (2,000)(2,000)(1,999)892758 Utilization Chgs to 758 Fund2370100 (2,000)
-(2,000) (2,000)(2,000)00Utilization Chgs to 759 Fund2370100892759 (2,000)
-(2,000) (2,000)(2,000)00Utilization Chgs to 760 Fund2370100892760 (2,000)
(100.0)%0 (2,000)000Utilization Chgs to 761 Fund2370100892761 0
(56.5) %(35,715,981)(15,527,361)(15,527,361) (15,495,420)Charges to Others Total (13,899,528)(13,902,486)
(57.6) %1,538,419 3,631,8621,531,6621,682,3883,009,0132,964,730Total Budget Requirements
CCReport Name: 2017_Mid_Cycle_Report
Report Description: Budget Book - Department Budget Detail wMD
06/07/2017Date:
Time: 307
Version:
Page:19:21:28

Department / Section: Public Works / Public Works-COPS Debt391 - 419001
Department Budget Detail
%Chnge16/17 vs 17/182017/182017/18
AmendedAdoptedAdopted2016/17
AmendedActualActual2016/172015/162014/15GL KeyObject Description
(3.5)%1,340,000 1,390,0001,340,00000Principal4190010481000 1,390,000
-0 001,285,0000L/T Bond Debt Principal4190010481015 0
3.3 %1,606,0881,659,688 1,606,0881,659,6881,711,087482000 Interest4190010 1,711,087
.1 %2,996,0882,999,6882,999,688 2,996,088Debt Service Total 2,996,0871,711,087
.1 %(2,996,088)(2,999,688) (2,996,088)(2,999,688)(2,996,088)892432 Utilization Chgs to 432 Fund4190010 (1,711,088)
.1 %(2,996,088)(2,999,688)(2,999,688) (2,996,088)Charges to Others Total (2,996,088)(1,711,088)
-00 00(0)Total Budget Requirements (0)
CCReport Name: 2017_Mid_Cycle_Report
Report Description: Budget Book - Department Budget Detail wMD
06/07/2017Date:
Time: 308
Version:
Page:19:21:28

Department / Section: Balance Sheet / Revenue / Balance Sheet / Revenue401 - 000000
Department Budget Detail
%Chnge16/17 vs 17/182017/182017/18
AmendedAdoptedAdopted2016/17
AmendedActualActual2016/172015/162014/15GL KeyObject Description
-0 00109,0930Operating Transfer to 390 Fund0000401990390 0
-0 0Operating Transfers Out Total 00109,0930
-00 00109,093Total Budget Requirements 0
CCReport Name: 2017_Mid_Cycle_Report
Report Description: Budget Book - Department Budget Detail wMD
06/07/2017Date:
Time: 309
Version:
Page:19:21:28

Department / Section: General Services / Future Debt Projects401 - 226700
Department Budget Detail
%Chnge16/17 vs 17/182017/182017/18
AmendedAdoptedAdopted2016/17
AmendedActualActual2016/172015/162014/15GL KeyObject Description
-0 00227,878140,318Police Headquarters Dsgn/Plng9887700440301 0
-0 00227,87859,756Downtown Library Dsgn/Plan'g9887800440301 0
-0 0Capital Outlay & Grants Total 00455,757200,074
-00 00455,757Total Budget Requirements 200,074
CCReport Name: 2017_Mid_Cycle_Report
Report Description: Budget Book - Department Budget Detail wMD
06/07/2017Date:
Time: 310
Version:
Page:19:21:28

Department / Section: Community Development / RDA Projects401 - 280020
Department Budget Detail
%Chnge16/17 vs 17/182017/182017/18
AmendedAdoptedAdopted2016/17
AmendedActualActual2016/172015/162014/15GL KeyObject Description
-0 000(18,948)Auto Center Litigation9879700440440 0
-00 0218,1814,606440446 Fire Station #1-RC9850540 127,628
-0 00165,2861,413,373PRCS-Villegas Pk Construction9874200440446 0
-0 0Capital Outlay & Grants Total 0218,181169,8921,522,053
-0 00(165,286)(1,413,373)PRCS-Villegas Pk Construction9874200895472 0
-0 0Charges to Others Total 00(165,286)(1,413,373)
-0 00218,1814,606108,680Total Budget Requirements
(100.0) %00 0218,1814,606Total Budget Requirements 108,680
CCReport Name: 2017_Mid_Cycle_Report
Report Description: Budget Book - Department Budget Detail wMD
06/07/2017Date:
Time: 311
Version:
Page:19:21:28
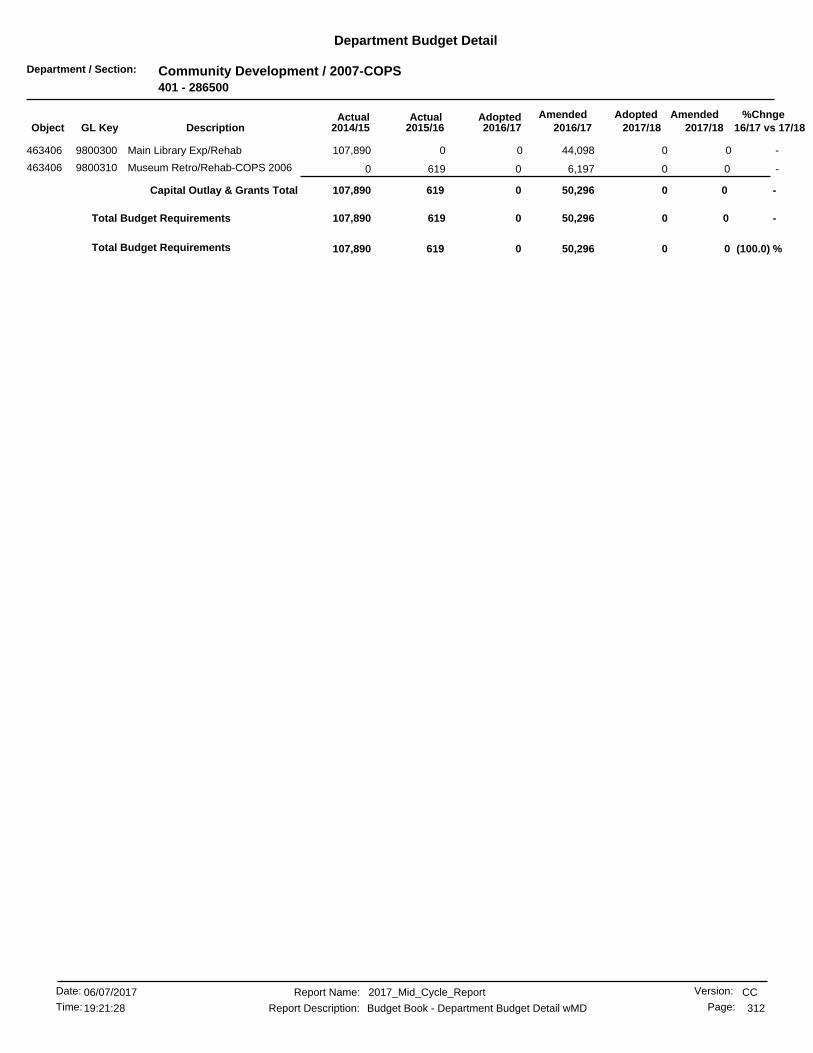
Department / Section: Community Development / 2007-COPS401 - 286500
Department Budget Detail
%Chnge16/17 vs 17/182017/182017/18
AmendedAdoptedAdopted2016/17
AmendedActualActual2016/172015/162014/15GL KeyObject Description
-0 044,0980107,890Main Library Exp/Rehab9800300463406 0
-00 06,197619463406 Museum Retro/Rehab-COPS 20069800310 0
-0 0Capital Outlay & Grants Total 050,296619107,890
-0 0050,296619107,890Total Budget Requirements
(100.0) %00 050,296619Total Budget Requirements 107,890
CCReport Name: 2017_Mid_Cycle_Report
Report Description: Budget Book - Department Budget Detail wMD
06/07/2017Date:
Time: 312
Version:
Page:19:21:28

Department / Section: Community Development / 2007-COPS401 - 286500
Department Budget Detail
%Chnge16/17 vs 17/182017/182017/18
AmendedAdoptedAdopted2016/17
AmendedActualActual2016/172015/162014/15GL KeyObject Description
-00 061,665214,507462050 RMM Collection Storage Facilty9892200 0
-00 0194,14762,033463406 Harada House9884400 15,593
-0 0Capital Outlay & Grants Total 0255,812276,54115,593
-0 00255,812276,54115,593Total Budget Requirements
(100.0) %00 0255,812276,541Total Budget Requirements 15,593
CCReport Name: 2017_Mid_Cycle_Report
Report Description: Budget Book - Department Budget Detail wMD
06/07/2017Date:
Time: 313
Version:
Page:19:21:28
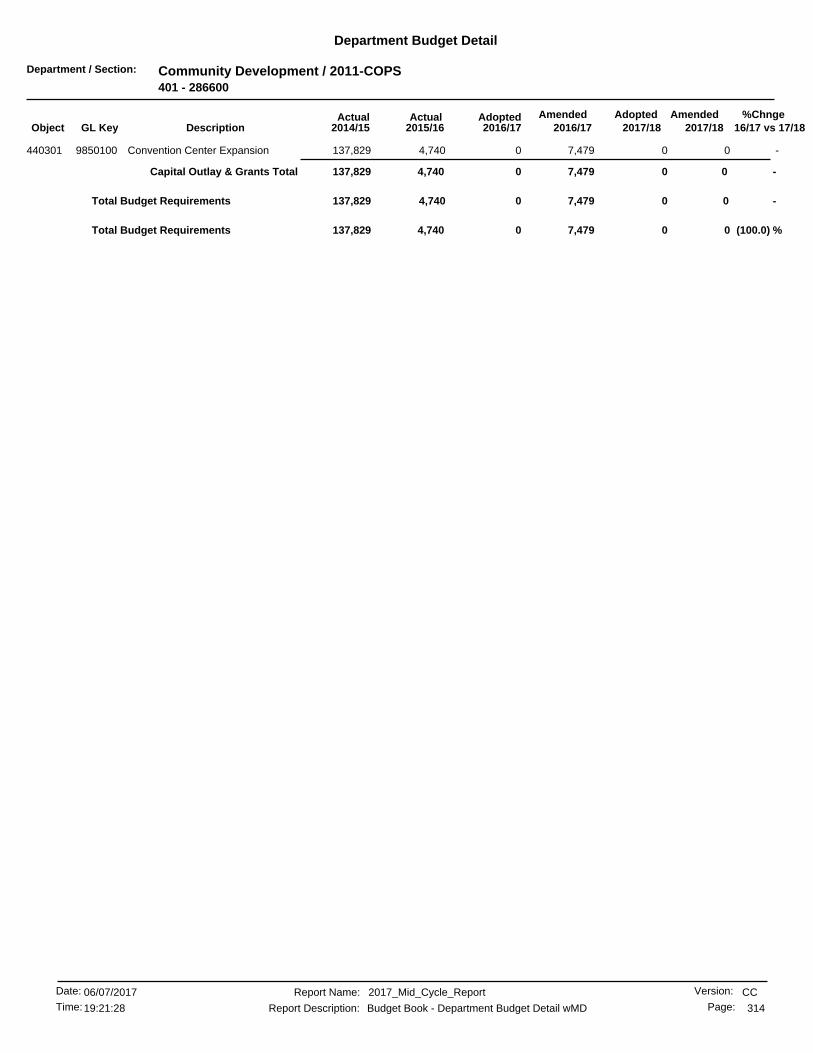
Department / Section: Community Development / 2011-COPS401 - 286600
Department Budget Detail
%Chnge16/17 vs 17/182017/182017/18
AmendedAdoptedAdopted2016/17
AmendedActualActual2016/172015/162014/15GL KeyObject Description
-00 07,4794,740440301 Convention Center Expansion9850100 137,829
-0 0Capital Outlay & Grants Total 07,4794,740137,829
-0 007,4794,740137,829Total Budget Requirements
(100.0) %00 07,4794,740Total Budget Requirements 137,829
CCReport Name: 2017_Mid_Cycle_Report
Report Description: Budget Book - Department Budget Detail wMD
06/07/2017Date:
Time: 314
Version:
Page:19:21:28

Department / Section: Balance Sheet / Revenue / Balance Sheet / Revenue410 - 000000
Department Budget Detail
%Chnge16/17 vs 17/182017/182017/18
AmendedAdoptedAdopted2016/17
AmendedActualActual2016/172015/162014/15GL KeyObject Description
-0 0050,9120Operating Transfer to 550 Fund0000410990550 0
-0 0Operating Transfers Out Total 0050,9120
-00 0050,912Total Budget Requirements 0
CCReport Name: 2017_Mid_Cycle_Report
Report Description: Budget Book - Department Budget Detail wMD
06/07/2017Date:
Time: 315
Version:
Page:19:21:28

Department / Section: Public Works / PW-Cap Imp-Storm Drain Project410 - 413520
Department Budget Detail
%Chnge16/17 vs 17/182017/182017/18
AmendedAdoptedAdopted2016/17
AmendedActualActual2016/172015/162014/15GL KeyObject Description
-100,000100,000 100,000124,45031,695440301 Misc Storm Drain Construction9700126 7,753
-50,00050,000 50,00050,00068,011440301 Misc Drainage Studies9744526 51,834
-00 049,550712,386440301 Cole/Lurin Storm Drain9818826 56,942
-00 0300,80913,113440301 Sycamore Water Quality Basins9858026 284,793
-0 00018,710Chicago/Central SD Emrgncy Rpr9885926440301 0
-00 02,2149,786440301 Monticello SD Channel Repair9886926 19,224
-0 006,5490Bordwell Park Storm Drain Emgc9892926440301 0
-0 00159,928163,400Cole/Lurin Storm Drain9818800440309 0
-0 002,848,460377,440Myers & Victoria Storm Drain9860400440309 0
-150,000527,024150,000 150,000Capital Outlay & Grants Total 3,849,930980,099
-16,17316,173 16,17316,17316,173881100 General Fund Allocation Chgs4135200 33,012
-16,173 16,173Charges From Others Total 16,17316,17316,17333,012
-166,173 166,173166,173543,1973,866,1031,013,111Total Budget Requirements
CCReport Name: 2017_Mid_Cycle_Report
Report Description: Budget Book - Department Budget Detail wMD
06/07/2017Date:
Time: 316
Version:
Page:19:21:28

Department / Section: Balance Sheet / Revenue / Balance Sheet / Revenue411 - 000000
Department Budget Detail
%Chnge16/17 vs 17/182017/182017/18
AmendedAdoptedAdopted2016/17
AmendedActualActual2016/172015/162014/15GL KeyObject Description
-0 0031,3200Operating Transfer to 550 Fund0000411990550 0
-0 0Operating Transfers Out Total 0031,3200
-00 0031,320Total Budget Requirements 0
CCReport Name: 2017_Mid_Cycle_Report
Report Description: Budget Book - Department Budget Detail wMD
06/07/2017Date:
Time: 317
Version:
Page:19:21:28

Department / Section: Parks, Recreation & Comm Svcs / P&R-Adm-Plan & Des-Park Proj411 - 520011
Department Budget Detail
%Chnge16/17 vs 17/182017/182017/18
AmendedAdoptedAdopted2016/17
AmendedActualActual2016/172015/162014/15GL KeyObject Description
( .1) %1,391,2391,389,298 1,391,2391,389,298686,779481000 Principal5200111 0
3.2 %59,76261,702 59,76261,70264,990482000 Interest5200111 58,690
( .0) %1,451,0011,451,0001,451,000 1,451,001Debt Service Total 751,76958,690
-00 0145,44779440305 Construction Contingency Res9779152 0
-00 07916440305 Park Land Acquisition9779252 497
-0 0Capital Outlay & Grants Total 0146,23986497
45.1 %9,40713,650 13,65013,65013,650881100 General Fund Allocation Chgs5200111 19,374
-1,100,0001,100,000 1,100,0001,100,0001,099,999882101 Utilization Chgs from 101 Fund5200111 1,624,999
-0 0049,49755,215Construction Contingency Res9779152882260 0
.3 %1,109,4071,113,6501,113,650 1,113,650Charges From Others Total 1,163,1461,699,590
.1 %2,564,650 2,560,4082,564,6512,710,8891,915,0021,758,778Total Budget Requirements
CCReport Name: 2017_Mid_Cycle_Report
Report Description: Budget Book - Department Budget Detail wMD
06/07/2017Date:
Time: 318
Version:
Page:19:21:28

Department / Section: Balance Sheet / Revenue / Balance Sheet / Revenue413 - 000000
Department Budget Detail
%Chnge16/17 vs 17/182017/182017/18
AmendedAdoptedAdopted2016/17
AmendedActualActual2016/172015/162014/15GL KeyObject Description
-0 00124,8510Operating Transfer to 550 Fund0000413990550 0
-0 0Operating Transfers Out Total 00124,8510
-00 00124,851Total Budget Requirements 0
CCReport Name: 2017_Mid_Cycle_Report
Report Description: Budget Book - Department Budget Detail wMD
06/07/2017Date:
Time: 319
Version:
Page:19:21:28

Department / Section: Parks, Recreation & Comm Svcs / Park & Rec-Administration413 - 520000
Department Budget Detail
%Chnge16/17 vs 17/182017/182017/18
AmendedAdoptedAdopted2016/17
AmendedActualActual2016/172015/162014/15GL KeyObject Description
-00 0346,54334,463440305 Fairmount Park Boat Launch9889254 3,992
-0 0Capital Outlay & Grants Total 0346,54334,4633,992
-0 00346,54334,4633,992Total Budget Requirements
(100.0) %00 0346,54334,463Total Budget Requirements 3,992
CCReport Name: 2017_Mid_Cycle_Report
Report Description: Budget Book - Department Budget Detail wMD
06/07/2017Date:
Time: 320
Version:
Page:19:21:28
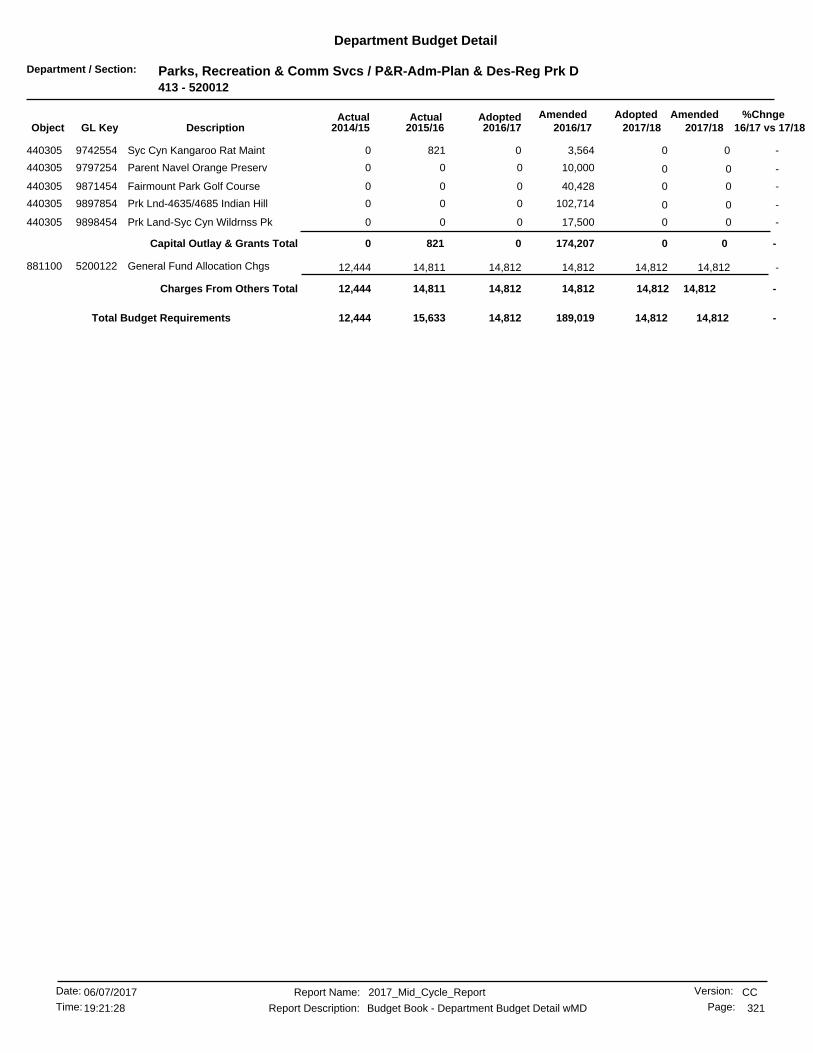
Department / Section: Parks, Recreation & Comm Svcs / P&R-Adm-Plan & Des-Reg Prk D413 - 520012
Department Budget Detail
%Chnge16/17 vs 17/182017/182017/18
AmendedAdoptedAdopted2016/17
AmendedActualActual2016/172015/162014/15GL KeyObject Description
-00 03,564821440305 Syc Cyn Kangaroo Rat Maint9742554 0
-0 010,00000Parent Navel Orange Preserv9797254440305 0
-0 040,42800Fairmount Park Golf Course9871454440305 0
-0 0102,71400Prk Lnd-4635/4685 Indian Hill9897854440305 0
-0 017,50000Prk Land-Syc Cyn Wildrnss Pk9898454440305 0
-0 0Capital Outlay & Grants Total 0174,2078210
-14,81214,812 14,81214,81214,811881100 General Fund Allocation Chgs5200122 12,444
-14,81214,81214,812 14,812Charges From Others Total 14,81112,444
-14,812 14,81214,812189,01915,63312,444Total Budget Requirements
CCReport Name: 2017_Mid_Cycle_Report
Report Description: Budget Book - Department Budget Detail wMD
06/07/2017Date:
Time: 321
Version:
Page:19:21:28
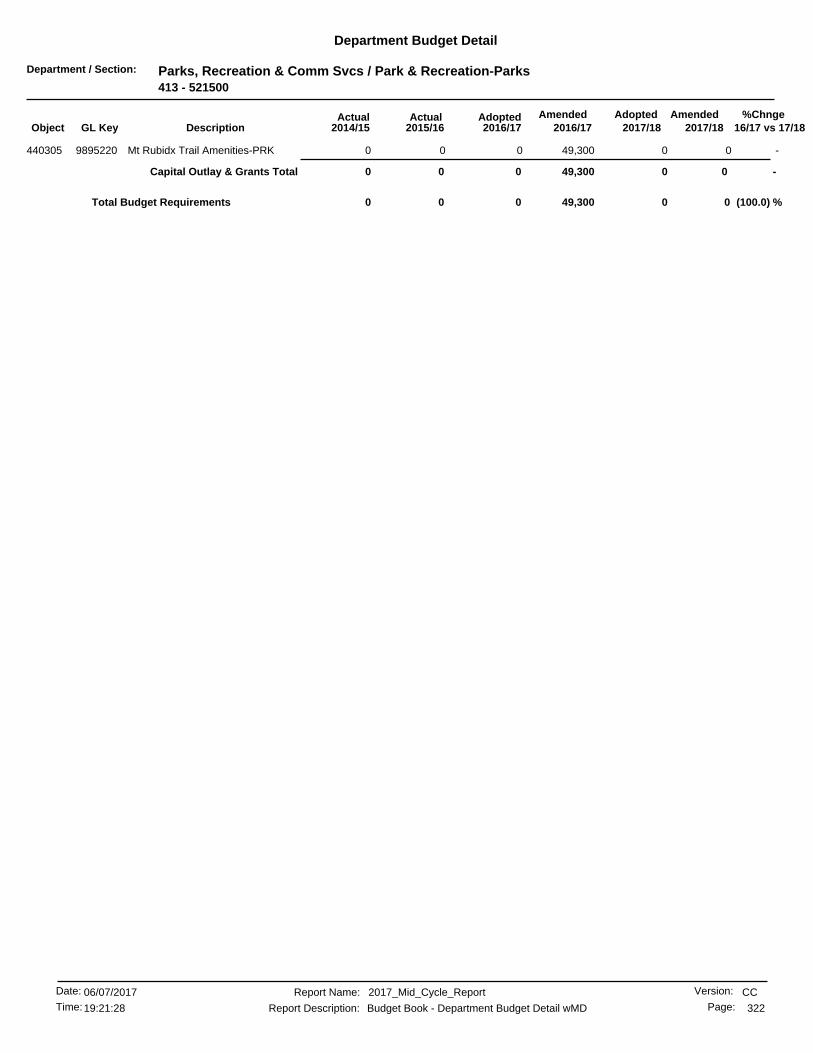
Department / Section: Parks, Recreation & Comm Svcs / Park & Recreation-Parks413 - 521500
Department Budget Detail
%Chnge16/17 vs 17/182017/182017/18
AmendedAdoptedAdopted2016/17
AmendedActualActual2016/172015/162014/15GL KeyObject Description
-0 049,30000Mt Rubidx Trail Amenities-PRK9895220440305 0
-0 0Capital Outlay & Grants Total 049,30000
(100.0) %00 049,3000Total Budget Requirements 0
CCReport Name: 2017_Mid_Cycle_Report
Report Description: Budget Book - Department Budget Detail wMD
06/07/2017Date:
Time: 322
Version:
Page:19:21:28

Department / Section: General Services / Capital Projects420 - 224000
Department Budget Detail
%Chnge16/17 vs 17/182017/182017/18
AmendedAdoptedAdopted2016/17
AmendedActualActual2016/172015/162014/15GL KeyObject Description
-0 01,997,50000Downtown Library - 2017 Meas Z9990509462050 0
-0 0Capital Outlay & Grants Total 01,997,50000
(100.0) %00 01,997,5000Total Budget Requirements 0
CCReport Name: 2017_Mid_Cycle_Report
Report Description: Budget Book - Department Budget Detail wMD
06/07/2017Date:
Time: 323
Version:
Page:19:21:28
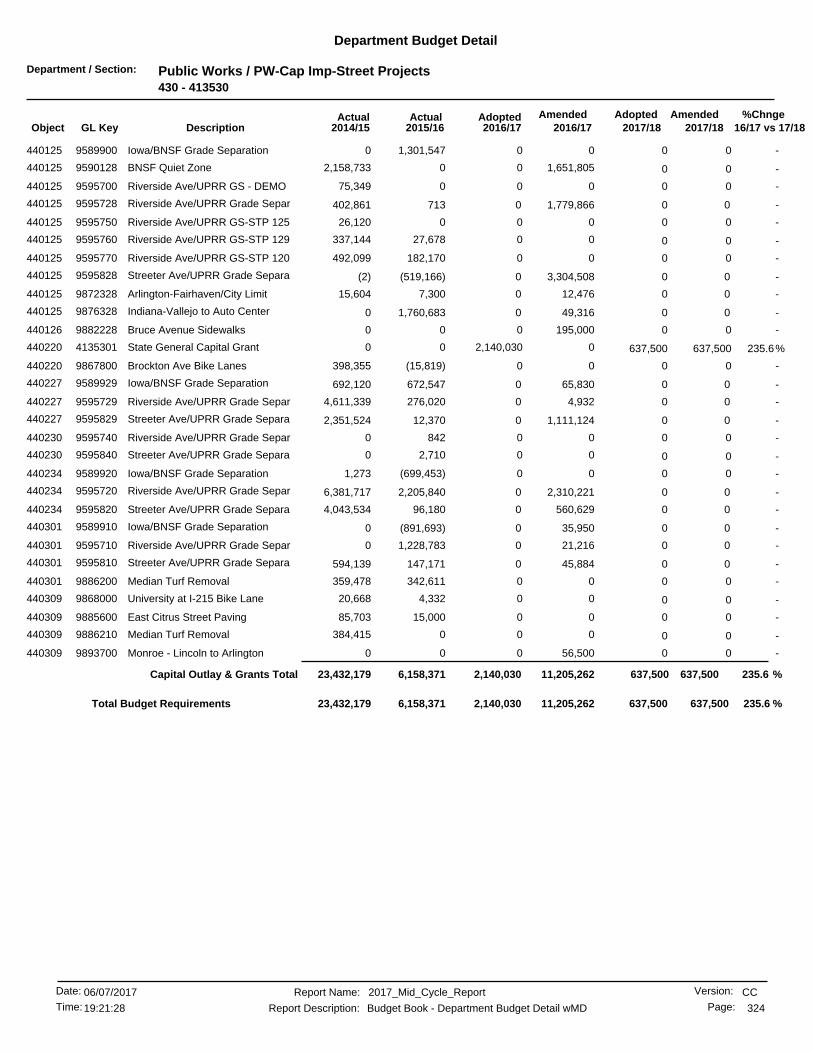
Department / Section: Public Works / PW-Cap Imp-Street Projects430 - 413530
Department Budget Detail
%Chnge16/17 vs 17/182017/182017/18
AmendedAdoptedAdopted2016/17
AmendedActualActual2016/172015/162014/15GL KeyObject Description
-0 001,301,5470Iowa/BNSF Grade Separation9589900440125 0
-0 01,651,80502,158,733BNSF Quiet Zone9590128440125 0
-0 00075,349Riverside Ave/UPRR GS - DEMO9595700440125 0
-00 01,779,866713440125 Riverside Ave/UPRR Grade Separ9595728 402,861
-0 00026,120Riverside Ave/UPRR GS-STP 1259595750440125 0
-0 0027,678337,144Riverside Ave/UPRR GS-STP 1299595760440125 0
-0 00182,170492,099Riverside Ave/UPRR GS-STP 1209595770440125 0
-00 03,304,508(519,166)440125 Streeter Ave/UPRR Grade Separa9595828 (2)
-00 012,4767,300440125 Arlington-Fairhaven/City Limit9872328 15,604
-00 049,3161,760,683440125 Indiana-Vallejo to Auto Center9876328 0
-0 0195,00000Bruce Avenue Sidewalks9882228440126 0
235.6%2,140,030 637,500000State General Capital Grant4135301440220 637,500
-0 00(15,819)398,355Brockton Ave Bike Lanes9867800440220 0
-00 065,830672,547440227 Iowa/BNSF Grade Separation9589929 692,120
-00 04,932276,020440227 Riverside Ave/UPRR Grade Separ9595729 4,611,339
-00 01,111,12412,370440227 Streeter Ave/UPRR Grade Separa9595829 2,351,524
-0 008420Riverside Ave/UPRR Grade Separ9595740440230 0
-0 002,7100Streeter Ave/UPRR Grade Separa9595840440230 0
-0 00(699,453)1,273Iowa/BNSF Grade Separation9589920440234 0
-00 02,310,2212,205,840440234 Riverside Ave/UPRR Grade Separ9595720 6,381,717
-00 0560,62996,180440234 Streeter Ave/UPRR Grade Separa9595820 4,043,534
-00 035,950(891,693)440301 Iowa/BNSF Grade Separation9589910 0
-00 021,2161,228,783440301 Riverside Ave/UPRR Grade Separ9595710 0
-00 045,884147,171440301 Streeter Ave/UPRR Grade Separa9595810 594,139
-0 00342,611359,478Median Turf Removal9886200440301 0
-0 004,33220,668University at I-215 Bike Lane9868000440309 0
-0 0015,00085,703East Citrus Street Paving9885600440309 0
-0 000384,415Median Turf Removal9886210440309 0
-0 056,50000Monroe - Lincoln to Arlington9893700440309 0
235.6 %637,50011,205,2622,140,030 637,500Capital Outlay & Grants Total 6,158,37123,432,179
235.6 %2,140,030 637,500637,50011,205,2626,158,37123,432,179Total Budget Requirements
CCReport Name: 2017_Mid_Cycle_Report
Report Description: Budget Book - Department Budget Detail wMD
06/07/2017Date:
Time: 324
Version:
Page:19:21:28
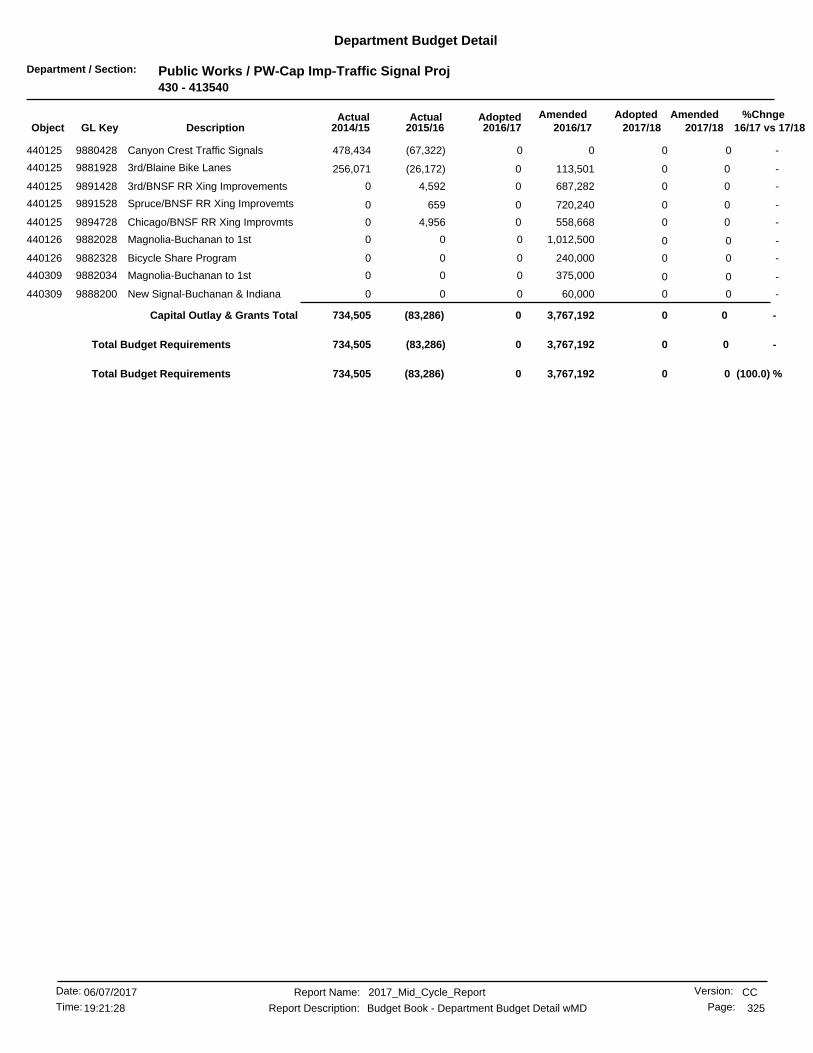
Department / Section: Public Works / PW-Cap Imp-Traffic Signal Proj430 - 413540
Department Budget Detail
%Chnge16/17 vs 17/182017/182017/18
AmendedAdoptedAdopted2016/17
AmendedActualActual2016/172015/162014/15GL KeyObject Description
-0 00(67,322)478,434Canyon Crest Traffic Signals9880428440125 0
-00 0113,501(26,172)440125 3rd/Blaine Bike Lanes9881928 256,071
-00 0687,2824,592440125 3rd/BNSF RR Xing Improvements9891428 0
-00 0720,240659440125 Spruce/BNSF RR Xing Improvemts9891528 0
-00 0558,6684,956440125 Chicago/BNSF RR Xing Improvmts9894728 0
-0 01,012,50000Magnolia-Buchanan to 1st9882028440126 0
-0 0240,00000Bicycle Share Program9882328440126 0
-0 0375,00000Magnolia-Buchanan to 1st9882034440309 0
-0 060,00000New Signal-Buchanan & Indiana9888200440309 0
-0 0Capital Outlay & Grants Total 03,767,192(83,286)734,505
-0 003,767,192(83,286)734,505Total Budget Requirements
(100.0) %00 03,767,192(83,286)Total Budget Requirements 734,505
CCReport Name: 2017_Mid_Cycle_Report
Report Description: Budget Book - Department Budget Detail wMD
06/07/2017Date:
Time: 325
Version:
Page:19:21:28
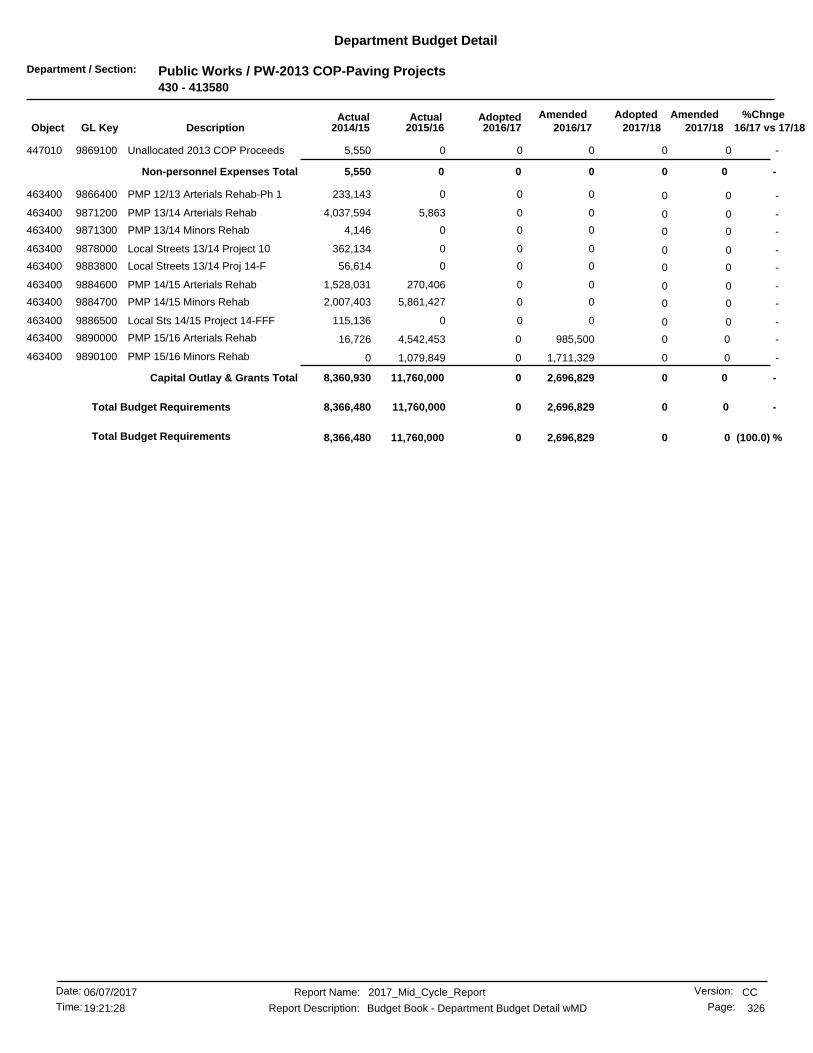
Department / Section: Public Works / PW-2013 COP-Paving Projects430 - 413580
Department Budget Detail
%Chnge16/17 vs 17/182017/182017/18
AmendedAdoptedAdopted2016/17
AmendedActualActual2016/172015/162014/15GL KeyObject Description
-0 0005,550Unallocated 2013 COP Proceeds9869100447010 0
-0 0Non-personnel Expenses Total 0005,550
-0 000233,143PMP 12/13 Arterials Rehab-Ph 19866400463400 0
-0 005,8634,037,594PMP 13/14 Arterials Rehab9871200463400 0
-0 0004,146PMP 13/14 Minors Rehab9871300463400 0
-0 000362,134Local Streets 13/14 Project 109878000463400 0
-0 00056,614Local Streets 13/14 Proj 14-F9883800463400 0
-0 00270,4061,528,031PMP 14/15 Arterials Rehab9884600463400 0
-0 005,861,4272,007,403PMP 14/15 Minors Rehab9884700463400 0
-0 000115,136Local Sts 14/15 Project 14-FFF9886500463400 0
-00 0985,5004,542,453463400 PMP 15/16 Arterials Rehab9890000 16,726
-00 01,711,3291,079,849463400 PMP 15/16 Minors Rehab9890100 0
-0 0Capital Outlay & Grants Total 02,696,82911,760,0008,360,930
-0 002,696,82911,760,0008,366,480Total Budget Requirements
(100.0) %00 02,696,82911,760,000Total Budget Requirements 8,366,480
CCReport Name: 2017_Mid_Cycle_Report
Report Description: Budget Book - Department Budget Detail wMD
06/07/2017Date:
Time: 326
Version:
Page:19:21:28

Department / Section: Balance Sheet / Revenue / Balance Sheet / Revenue431 - 000000
Department Budget Detail
%Chnge16/17 vs 17/182017/182017/18
AmendedAdoptedAdopted2016/17
AmendedActualActual2016/172015/162014/15GL KeyObject Description
-0 0058,2140Operating Transfer to 434 Fund0000431990434 0
-0 0Operating Transfers Out Total 0058,2140
-00 0058,214Total Budget Requirements 0
CCReport Name: 2017_Mid_Cycle_Report
Report Description: Budget Book - Department Budget Detail wMD
06/07/2017Date:
Time: 327
Version:
Page:19:21:28
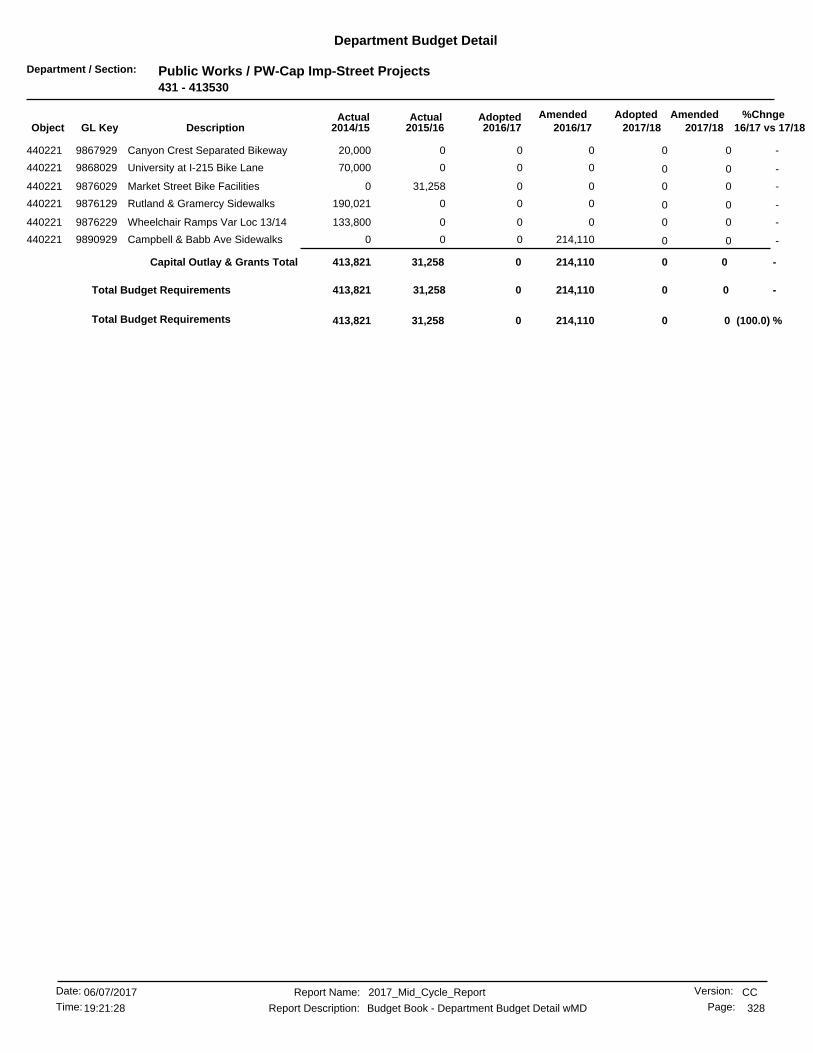
Department / Section: Public Works / PW-Cap Imp-Street Projects431 - 413530
Department Budget Detail
%Chnge16/17 vs 17/182017/182017/18
AmendedAdoptedAdopted2016/17
AmendedActualActual2016/172015/162014/15GL KeyObject Description
-0 00020,000Canyon Crest Separated Bikeway9867929440221 0
-0 00070,000University at I-215 Bike Lane9868029440221 0
-0 0031,2580Market Street Bike Facilities9876029440221 0
-0 000190,021Rutland & Gramercy Sidewalks9876129440221 0
-0 000133,800Wheelchair Ramps Var Loc 13/149876229440221 0
-0 0214,11000Campbell & Babb Ave Sidewalks9890929440221 0
-0 0Capital Outlay & Grants Total 0214,11031,258413,821
-0 00214,11031,258413,821Total Budget Requirements
(100.0) %00 0214,11031,258Total Budget Requirements 413,821
CCReport Name: 2017_Mid_Cycle_Report
Report Description: Budget Book - Department Budget Detail wMD
06/07/2017Date:
Time: 328
Version:
Page:19:21:28
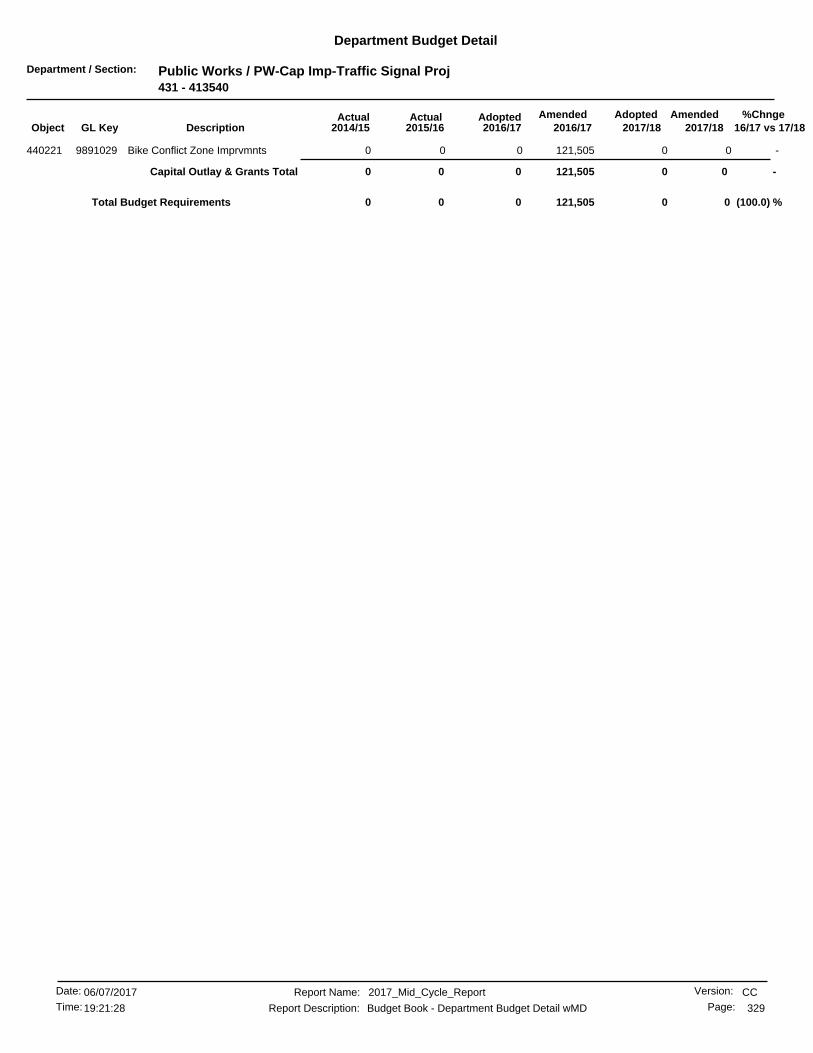
Department / Section: Public Works / PW-Cap Imp-Traffic Signal Proj431 - 413540
Department Budget Detail
%Chnge16/17 vs 17/182017/182017/18
AmendedAdoptedAdopted2016/17
AmendedActualActual2016/172015/162014/15GL KeyObject Description
-0 0121,50500Bike Conflict Zone Imprvmnts9891029440221 0
-0 0Capital Outlay & Grants Total 0121,50500
(100.0) %00 0121,5050Total Budget Requirements 0
CCReport Name: 2017_Mid_Cycle_Report
Report Description: Budget Book - Department Budget Detail wMD
06/07/2017Date:
Time: 329
Version:
Page:19:21:28

Department / Section: Public Works / PW-Cap Imp-Street Projects432 - 413530
Department Budget Detail
%Chnge16/17 vs 17/182017/182017/18
AmendedAdoptedAdopted2016/17
AmendedActualActual2016/172015/162014/15GL KeyObject Description
(5.7) %3,5003,300 3,5003,3002,900447010 Debt Svc-2013 Transportn Bonds9861730 0
(5.7) %3,5003,3003,300 3,500Non-personnel Expenses Total 2,9000
-00 013,9361,694440302 Misc Railroad Project Manageme9586630 13,587
-00 05,1987,024440302 Magnolia/UP Grade Design9589730 8,556
-00 0448,307(368,869)440302 Iowa/BNSF Grade Separation9589930 8,839
-00 06,198335440302 BNSF Quiet Zone9590130 0
-00 041,51310,393440302 BNSF/UP QZ-Panorama/Cridge9593430 16,255
-00 0304,226(165,682)440302 Tyler Widening-Wells to Hole9594830 97,533
-0 0419,76600Indiana Widening at Pierce9595130440302 0
-0 0018068,891Van Buren-Indiana to Dufferin9595230440302 0
-00 027,428(8,235)440302 Riverside Ave/UPRR Grade Separ9595730 (8,934)
-00 0178,033518,252440302 Streeter Ave/UPRR Grade Separa9595830 80,530
-0 02060916Jurpua Ext-Van Buren-Rutland9598430440302 0
-0 000222,125Van Buren Imp-Wells to Jackson9863430440302 0
-0 04460091 Fwy-Van Buren Interchange9535530440312 0
-00 05,280,077535,730440312 BNSF Quiet Zone9590132 438,213
-50,00050,000 50,00050,000132,998440313 Transportation Planning9509230 50,000
-125,000125,000 125,000125,000121,619440313 Pavement Management Systems9513830 123,476
-0 07,2000010% Measure A Rail Set-Aside9585330440313 0
-00 0450,42947,399440313 Misc Railroad Project Manageme9586630 28,299
53.8%1,000,000 650,0001,000,00000Canyon Crest Dr Widening9587630440313 650,000
-0751,100 02,190,79327,506440313 BNSF/UP QZ-Panorama/Cridge9593430 0
-00 02,401,2461,598,753440313 Tyler Widening-Wells to Hole9594830 0
-00 032,15425,802440313 Riverside Ave/UPRR Grade Separ9595730 128,706
-00 0506,3395,183440313 Streeter Ave/UPRR Grade Separa9595830 1,181
-0 0071733,707Collett Avenue Extension9825430440313 0
-0 000332,237Van Buren-Jurupa to SAR Bridge9840930440313 0
-0 020,00000Quiet Zone-Miss Inn/3rd/Spruce9861030440313 0
-0 0000Arlington Rehab-Van Buren/SR919862330440313 0
-0 0300,00000Jurupa Extension-Rutland/Crest9862430440313 0
-100,000100,000 100,000288,9168,066440313 Mission Blvd Bridge Replacemnt9862930 3,016
-0 0001,387Van Buren Imp-Wells to Jackson9863430440313 0
-0 0015,819668,136Brockton Ave Bike Lanes9867830440313 0
-0 000350Major Streets Rehab 2013/149869730440313 0
-0 00029,870Market St Arbor Rpr s/o SR-609869830440313 0
-00 099,623376440313 Market St Bridge Replacement9869930 0
-0 00048,590Sidewalk/Trail Const 2013/149870030440313 0
(100.0) %766,1000 766,100161,67038,329440313 UP Quiet Zone-Brockton & Palm9872130 0
-00 0550,37827,675440313 Arlington-Fairhaven/City Limit9872330 21,946
-00 0327,1241,139,164440313 Indiana-Vallejo to Auto Center9876330 15,517
-00 0232,8607,139440313 Central Ave Crossing Imprvmnts9881630 0
-0 00924,58527,367Major Streets Rehab 2014/159881730440313 0
-00 03,256,94933,407440313 Magnolia Wdng-Buchanan/Banbury9882430 10,643
(79.1) %2,400,000500,000 2,400,000520,92789,200440313 Major Streets Rehab9888030 0
-0 01,881,00000Minor Streets Rehab9888430440313 0
-00 038,898170,118440313 Sidewalk Repair9888630 0
CCReport Name: 2017_Mid_Cycle_Report
Report Description: Budget Book - Department Budget Detail wMD
06/07/2017Date:
Time: 330
Version:
Page:19:21:28

Department / Section: Public Works / PW-Cap Imp-Street Projects432 - 413530
Department Budget Detail
%Chnge16/17 vs 17/182017/182017/18
AmendedAdoptedAdopted2016/17
AmendedActualActual2016/172015/162014/15GL KeyObject Description
-00 0373,0546,945440313 Iowa Ave RR Xing Improvements9890830 0
-00 0171,63743,362440313 Campbell & Babb Ave Sidewalks9890930 0
-00 0133,101376440313 Van Buren-Washington to Wood9892630 0
-195,000 0195,00000High Friction Srfc/HAWK Sgnls9893630440313 0
-2,400,000 02,400,00000Monroe - Lincoln to Arlington9893730440313 0
-0 05,00000Perris Valley Line Quiet Zone9897630440313 0
25.1 %4,091,10024,444,6465,121,100 4,091,100Capital Outlay & Grants Total 4,995,3722,470,952
.1 %2,996,0882,999,688 2,996,0882,999,6882,996,088882391 Debt Svc-2013 Transportn Bonds9861730 1,711,087
.1 %2,996,0882,999,6882,999,688 2,996,088Charges From Others Total 2,996,0881,711,087
14.5 %8,124,088 7,090,6887,090,68827,447,6347,994,3604,182,040Total Budget Requirements
CCReport Name: 2017_Mid_Cycle_Report
Report Description: Budget Book - Department Budget Detail wMD
06/07/2017Date:
Time: 331
Version:
Page:19:21:28

Department / Section: Public Works / PW-Cap Imp-Traffic Signal Proj432 - 413540
Department Budget Detail
%Chnge16/17 vs 17/182017/182017/18
AmendedAdoptedAdopted2016/17
AmendedActualActual2016/172015/162014/15GL KeyObject Description
-0 00199(0)Planning/Investigations9520830440302 0
-0 00013,105Misc Signal Revisions9586133440302 0
-00 03,7722,449440302 Traffic Management Center9593133 15,750
-300,000300,000 300,000150,870179,829440313 Planning/Investigations9520830 170,765
-100,000100,000 100,000274,496252,234440313 Misc Signal Revisions9586133 158,619
-40,00040,000 40,00053,0356,648440313 Arterial Interconnections9586233 10,315
150.0 %50,000125,000 50,000185,17181,945440313 Traffic Management Center9593133 3,824
-250,000 250,00025,00001,815New Traffic Signals9834130440313 250,000
-0 000582Brockton Protect/Permit Turns9870933440313 0
-0 000212,030Lincoln/St Lawrence New Signal9871033440313 0
-0 050,00000University-Brockton to Campus9871133440313 0
-0 00085,800Magnolia-Jackson to Arlington9879833440313 0
-0 0125,00000Protect/Permit Left Turns9881833440313 0
-0 0032,96010,1443rd/Blaine Bike Lanes9881933440313 0
-0 0863,50000Magnolia-Buchanan to 1st9882033440313 0
-0 00247,99316,511New Signal- Rumsey & Central9883033440313 0
-0 00110,9280LED Luminaire Safety Lighting9888133440313 0
-0 034,62000Bike Conflict Zone Imprvmnts9891033440313 0
-215,000 0215,00000Cntrl/Cnyn Crst/Wtkns Bike Lns9893533440313 0
39.1 %740,0001,980,4661,030,000 740,000Capital Outlay & Grants Total 915,190699,265
39.1 %1,030,000 740,000740,0001,980,466915,190699,265Total Budget Requirements
CCReport Name: 2017_Mid_Cycle_Report
Report Description: Budget Book - Department Budget Detail wMD
06/07/2017Date:
Time: 332
Version:
Page:19:21:28

Department / Section: Public Works / PW-CapImp-Traffic Signal Maint432 - 413545
Department Budget Detail
%Chnge16/17 vs 17/182017/182017/18
AmendedAdoptedAdopted2016/17
AmendedActualActual2016/172015/162014/15GL KeyObject Description
-40,00040,000 40,000110,00031,210440313 Controller Assembly Replacemnt9518337 0
-10,00010,000 10,00010,0007,251440313 Spread Spectrum Radio Rep9584637 0
-35,00035,000 35,00035,00012,985440313 Traffic Signal Loop Rep9584737 15,080
-40,000 40,00020,00000LED Signal Lenses Replacement9861937440313 40,000
-125,000175,000125,000 125,000Capital Outlay & Grants Total 51,44715,080
-125,000 125,000125,000175,00051,44715,080Total Budget Requirements
CCReport Name: 2017_Mid_Cycle_Report
Report Description: Budget Book - Department Budget Detail wMD
06/07/2017Date:
Time: 333
Version:
Page:19:21:28
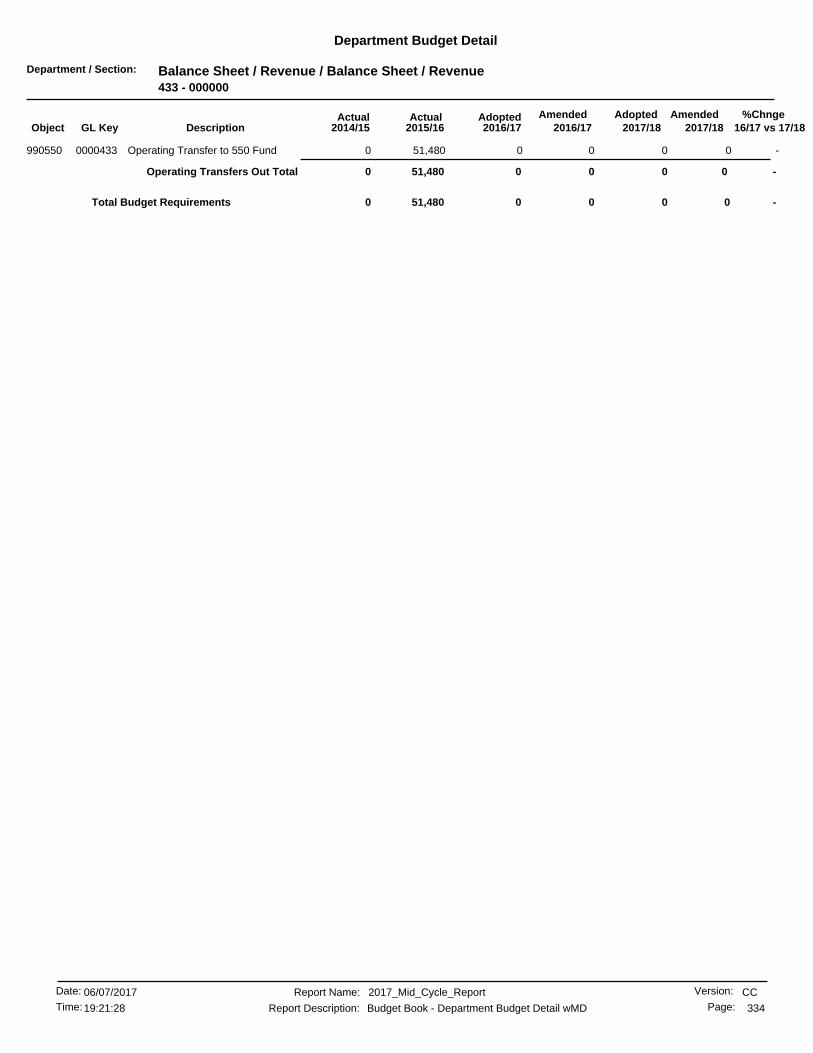
Department / Section: Balance Sheet / Revenue / Balance Sheet / Revenue433 - 000000
Department Budget Detail
%Chnge16/17 vs 17/182017/182017/18
AmendedAdoptedAdopted2016/17
AmendedActualActual2016/172015/162014/15GL KeyObject Description
-0 0051,4800Operating Transfer to 550 Fund0000433990550 0
-0 0Operating Transfers Out Total 0051,4800
-00 0051,480Total Budget Requirements 0
CCReport Name: 2017_Mid_Cycle_Report
Report Description: Budget Book - Department Budget Detail wMD
06/07/2017Date:
Time: 334
Version:
Page:19:21:28
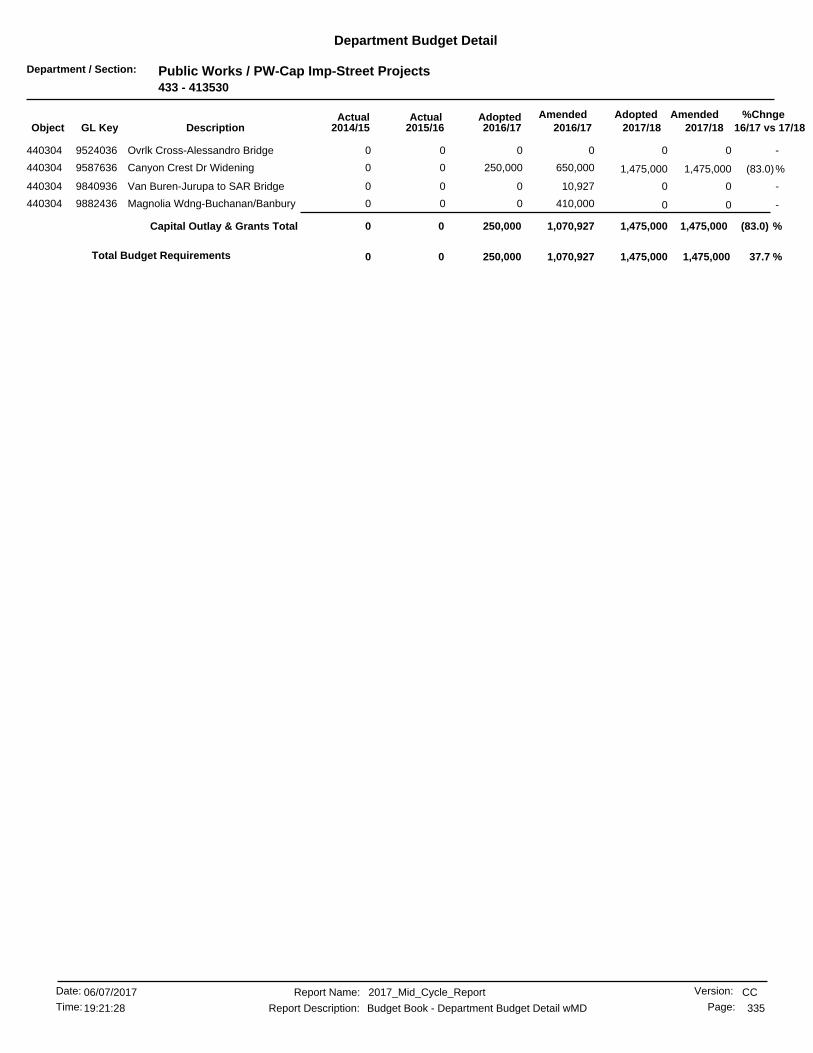
Department / Section: Public Works / PW-Cap Imp-Street Projects433 - 413530
Department Budget Detail
%Chnge16/17 vs 17/182017/182017/18
AmendedAdoptedAdopted2016/17
AmendedActualActual2016/172015/162014/15GL KeyObject Description
-0 0000Ovrlk Cross-Alessandro Bridge9524036440304 0
(83.0)%250,000 1,475,000650,00000Canyon Crest Dr Widening9587636440304 1,475,000
-0 010,92700Van Buren-Jurupa to SAR Bridge9840936440304 0
-0 0410,00000Magnolia Wdng-Buchanan/Banbury9882436440304 0
(83.0) %250,000 1,475,000Capital Outlay & Grants Total 1,475,0001,070,92700
37.7 %1,475,000250,000 1,475,0001,070,9270Total Budget Requirements 0
CCReport Name: 2017_Mid_Cycle_Report
Report Description: Budget Book - Department Budget Detail wMD
06/07/2017Date:
Time: 335
Version:
Page:19:21:28

Department / Section: Public Works / PW-Cap Imp-Traffic Signal Proj433 - 413540
Department Budget Detail
%Chnge16/17 vs 17/182017/182017/18
AmendedAdoptedAdopted2016/17
AmendedActualActual2016/172015/162014/15GL KeyObject Description
-0 0225,00000University-Fairmount9862536440303 0
-0 0190,00000New Signal-Buchanan & Indiana9888236440303 0
-0 0Capital Outlay & Grants Total 0415,00000
(100.0) %00 0415,0000Total Budget Requirements 0
CCReport Name: 2017_Mid_Cycle_Report
Report Description: Budget Book - Department Budget Detail wMD
06/07/2017Date:
Time: 336
Version:
Page:19:21:28
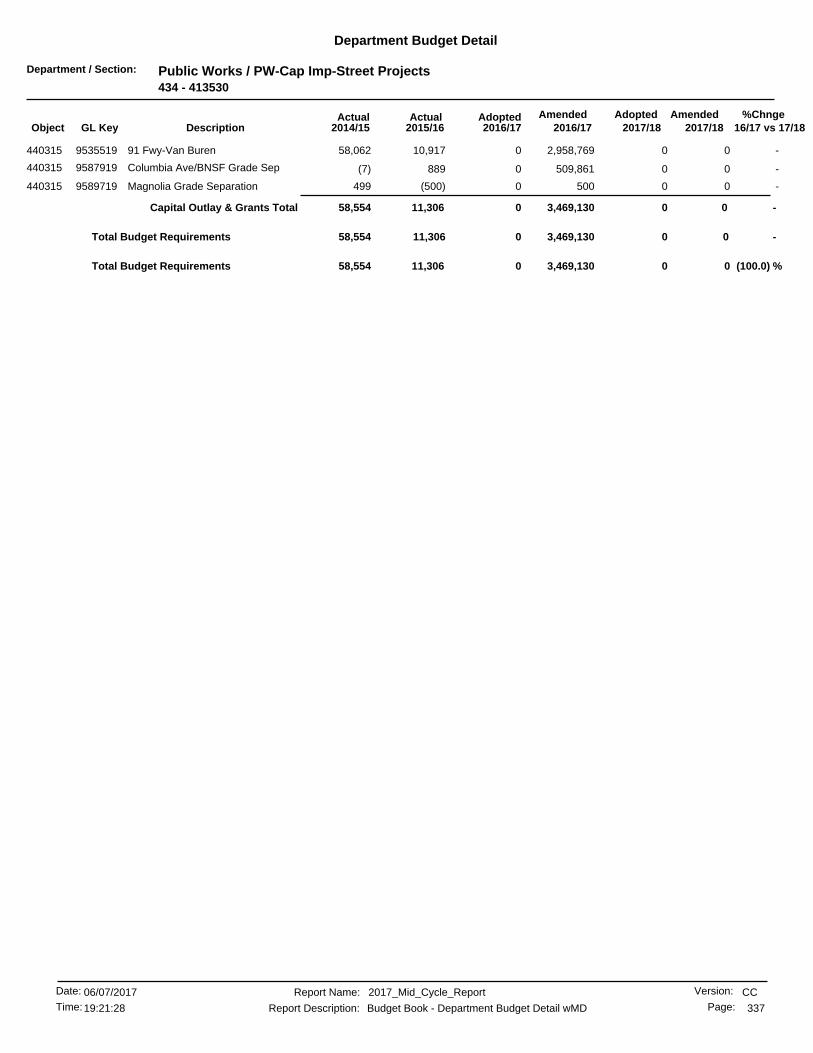
Department / Section: Public Works / PW-Cap Imp-Street Projects434 - 413530
Department Budget Detail
%Chnge16/17 vs 17/182017/182017/18
AmendedAdoptedAdopted2016/17
AmendedActualActual2016/172015/162014/15GL KeyObject Description
-00 02,958,76910,917440315 91 Fwy-Van Buren9535519 58,062
-00 0509,861889440315 Columbia Ave/BNSF Grade Sep9587919 (7)
-00 0500(500)440315 Magnolia Grade Separation9589719 499
-0 0Capital Outlay & Grants Total 03,469,13011,30658,554
-0 003,469,13011,30658,554Total Budget Requirements
(100.0) %00 03,469,13011,306Total Budget Requirements 58,554
CCReport Name: 2017_Mid_Cycle_Report
Report Description: Budget Book - Department Budget Detail wMD
06/07/2017Date:
Time: 337
Version:
Page:19:21:28

Department / Section: Finance / Finance-Street Lighting442 - 238000
Department Budget Detail
%Chnge16/17 vs 17/182017/182017/18
AmendedAdoptedAdopted2016/17
AmendedActualActual2016/172015/162014/15GL KeyObject Description
-0 001,5366,107Hunter Pk Master Drainage Plan9754100455060 0
-0 082,69500Hunter Pk-Street Imp9754120455060 0
-0 0Special Projects Total 082,6951,5366,107
-0 0082,6951,5366,107Total Budget Requirements
(100.0) %00 082,6951,536Total Budget Requirements 6,107
CCReport Name: 2017_Mid_Cycle_Report
Report Description: Budget Book - Department Budget Detail wMD
06/07/2017Date:
Time: 338
Version:
Page:19:21:28
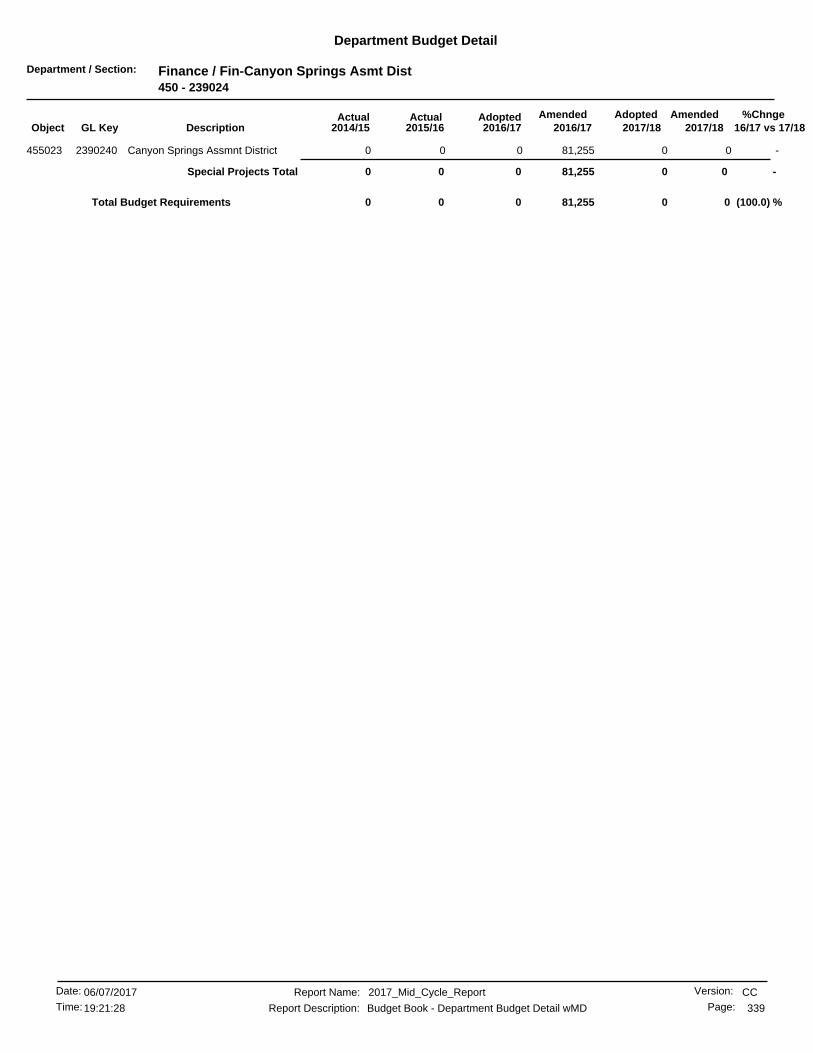
Department / Section: Finance / Fin-Canyon Springs Asmt Dist450 - 239024
Department Budget Detail
%Chnge16/17 vs 17/182017/182017/18
AmendedAdoptedAdopted2016/17
AmendedActualActual2016/172015/162014/15GL KeyObject Description
-0 081,25500Canyon Springs Assmnt District2390240455023 0
-0 0Special Projects Total 081,25500
(100.0) %00 081,2550Total Budget Requirements 0
CCReport Name: 2017_Mid_Cycle_Report
Report Description: Budget Book - Department Budget Detail wMD
06/07/2017Date:
Time: 339
Version:
Page:19:21:28
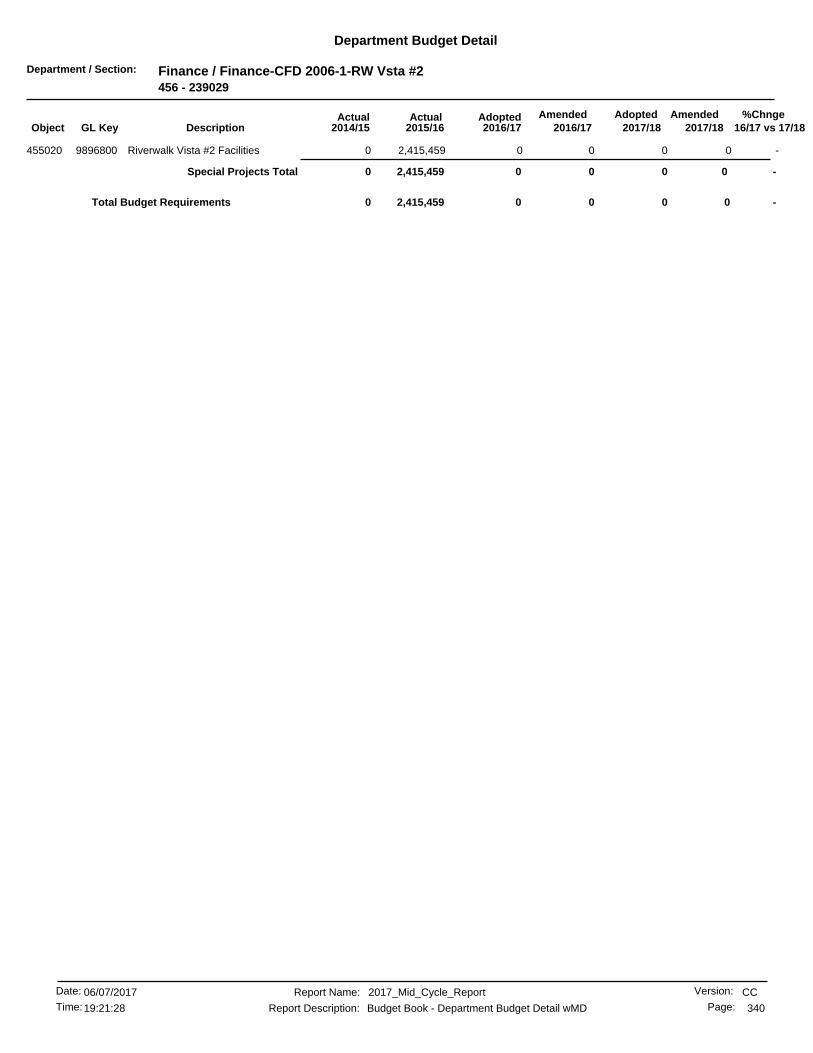
Department / Section: Finance / Finance-CFD 2006-1-RW Vsta #2456 - 239029
Department Budget Detail
%Chnge16/17 vs 17/182017/182017/18
AmendedAdoptedAdopted2016/17
AmendedActualActual2016/172015/162014/15GL KeyObject Description
-0 002,415,4590Riverwalk Vista #2 Facilities9896800455020 0
-0 0Special Projects Total 002,415,4590
-00 002,415,459Total Budget Requirements 0
CCReport Name: 2017_Mid_Cycle_Report
Report Description: Budget Book - Department Budget Detail wMD
06/07/2017Date:
Time: 340
Version:
Page:19:21:28
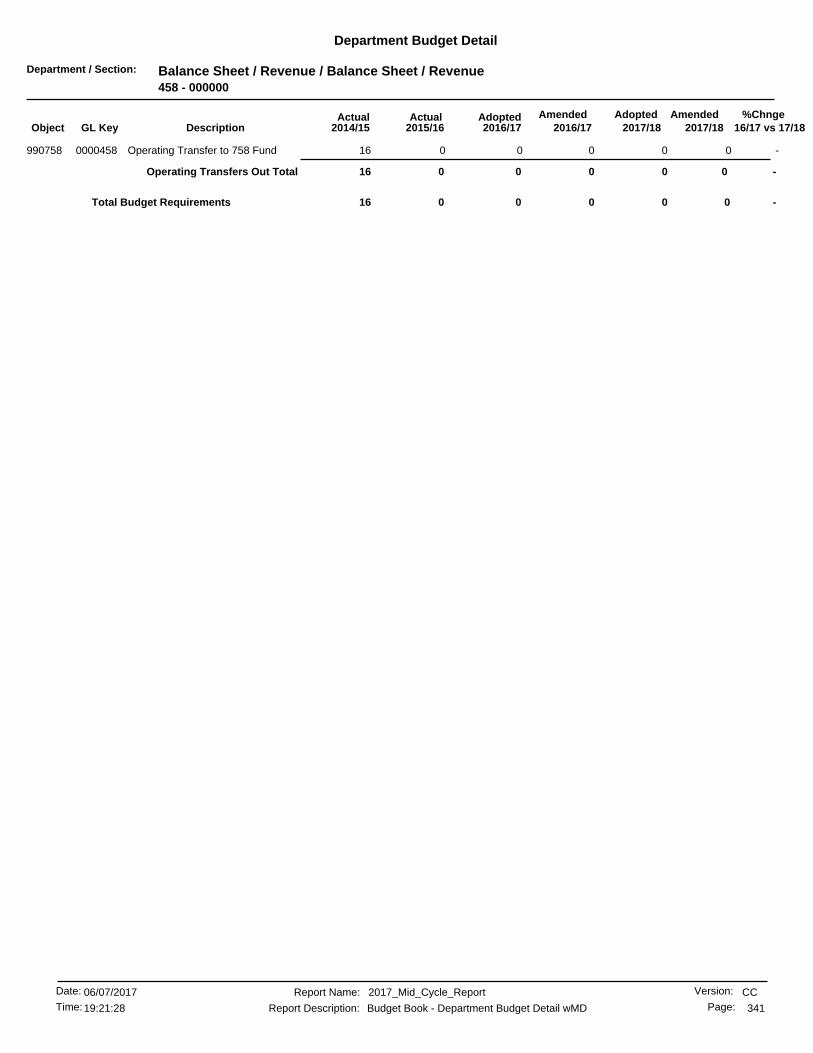
Department / Section: Balance Sheet / Revenue / Balance Sheet / Revenue458 - 000000
Department Budget Detail
%Chnge16/17 vs 17/182017/182017/18
AmendedAdoptedAdopted2016/17
AmendedActualActual2016/172015/162014/15GL KeyObject Description
-0 00016Operating Transfer to 758 Fund0000458990758 0
-0 0Operating Transfers Out Total 00016
-00 000Total Budget Requirements 16
CCReport Name: 2017_Mid_Cycle_Report
Report Description: Budget Book - Department Budget Detail wMD
06/07/2017Date:
Time: 341
Version:
Page:19:21:28
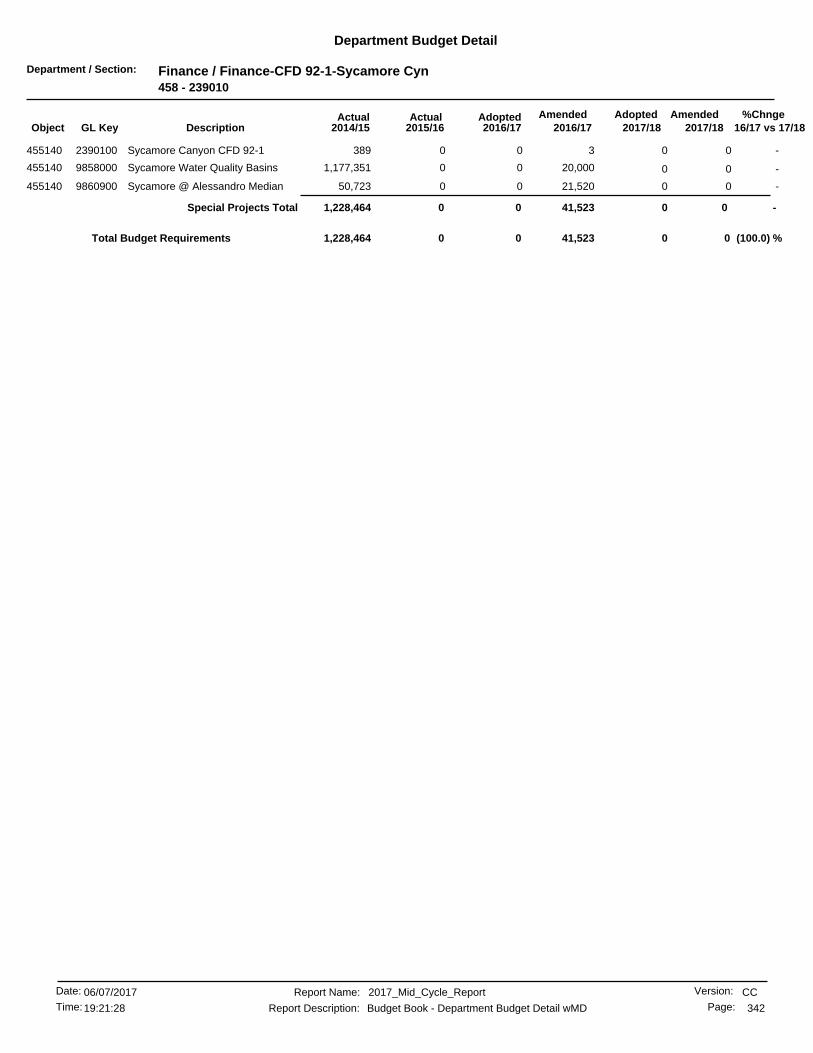
Department / Section: Finance / Finance-CFD 92-1-Sycamore Cyn458 - 239010
Department Budget Detail
%Chnge16/17 vs 17/182017/182017/18
AmendedAdoptedAdopted2016/17
AmendedActualActual2016/172015/162014/15GL KeyObject Description
-0 030389Sycamore Canyon CFD 92-12390100455140 0
-0 020,00001,177,351Sycamore Water Quality Basins9858000455140 0
-0 021,520050,723Sycamore @ Alessandro Median9860900455140 0
-0 0Special Projects Total 041,52301,228,464
(100.0) %00 041,5230Total Budget Requirements 1,228,464
CCReport Name: 2017_Mid_Cycle_Report
Report Description: Budget Book - Department Budget Detail wMD
06/07/2017Date:
Time: 342
Version:
Page:19:21:28

Department / Section: Balance Sheet / Revenue / RDSA RORF-Arlington471 - 000000
Department Budget Detail
%Chnge16/17 vs 17/182017/182017/18
AmendedAdoptedAdopted2016/17
AmendedActualActual2016/172015/162014/15GL KeyObject Description
-0 0005Operating Transfer to 371 Fund0000471990371 0
-0 006,149,5660Operating Transfer to 480 Fund0000471990480 0
-0 0Operating Transfers Out Total 006,149,5665
-00 006,149,566Total Budget Requirements 5
CCReport Name: 2017_Mid_Cycle_Report
Report Description: Budget Book - Department Budget Detail wMD
06/07/2017Date:
Time: 343
Version:
Page:19:21:28
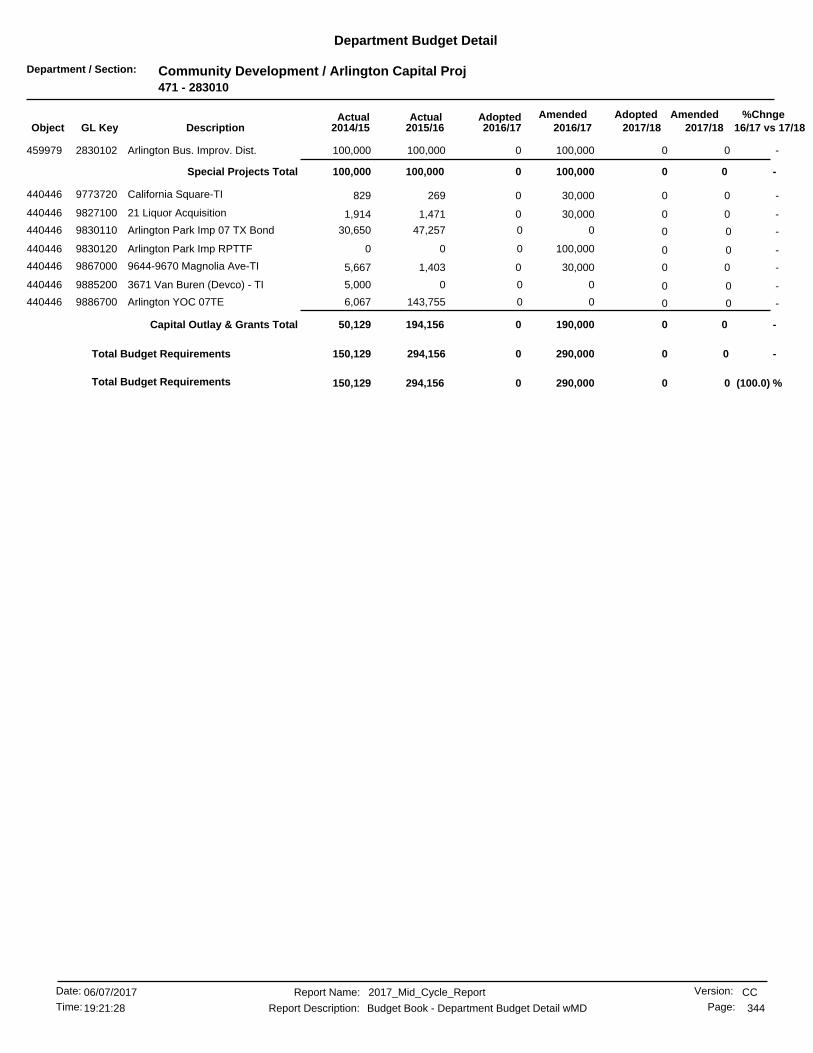
Department / Section: Community Development / Arlington Capital Proj471 - 283010
Department Budget Detail
%Chnge16/17 vs 17/182017/182017/18
AmendedAdoptedAdopted2016/17
AmendedActualActual2016/172015/162014/15GL KeyObject Description
-00 0100,000100,000459979 Arlington Bus. Improv. Dist.2830102 100,000
-0 0Special Projects Total 0100,000100,000100,000
-00 030,000269440446 California Square-TI9773720 829
-00 030,0001,471440446 21 Liquor Acquisition9827100 1,914
-0 0047,25730,650Arlington Park Imp 07 TX Bond9830110440446 0
-0 0100,00000Arlington Park Imp RPTTF9830120440446 0
-00 030,0001,403440446 9644-9670 Magnolia Ave-TI9867000 5,667
-0 0005,0003671 Van Buren (Devco) - TI9885200440446 0
-0 00143,7556,067Arlington YOC 07TE9886700440446 0
-0 0Capital Outlay & Grants Total 0190,000194,15650,129
-0 00290,000294,156150,129Total Budget Requirements
(100.0) %00 0290,000294,156Total Budget Requirements 150,129
CCReport Name: 2017_Mid_Cycle_Report
Report Description: Budget Book - Department Budget Detail wMD
06/07/2017Date:
Time: 344
Version:
Page:19:21:28

Department / Section: Community Development / Auto Center Capital Projects471 - 283011
Department Budget Detail
%Chnge16/17 vs 17/182017/182017/18
AmendedAdoptedAdopted2016/17
AmendedActualActual2016/172015/162014/15GL KeyObject Description
-0 00031,616Auto Center BID Ltigiation2830112450072 0
-0 0Special Projects Total 00031,616
-00 000Total Budget Requirements 31,616
CCReport Name: 2017_Mid_Cycle_Report
Report Description: Budget Book - Department Budget Detail wMD
06/07/2017Date:
Time: 345
Version:
Page:19:21:28
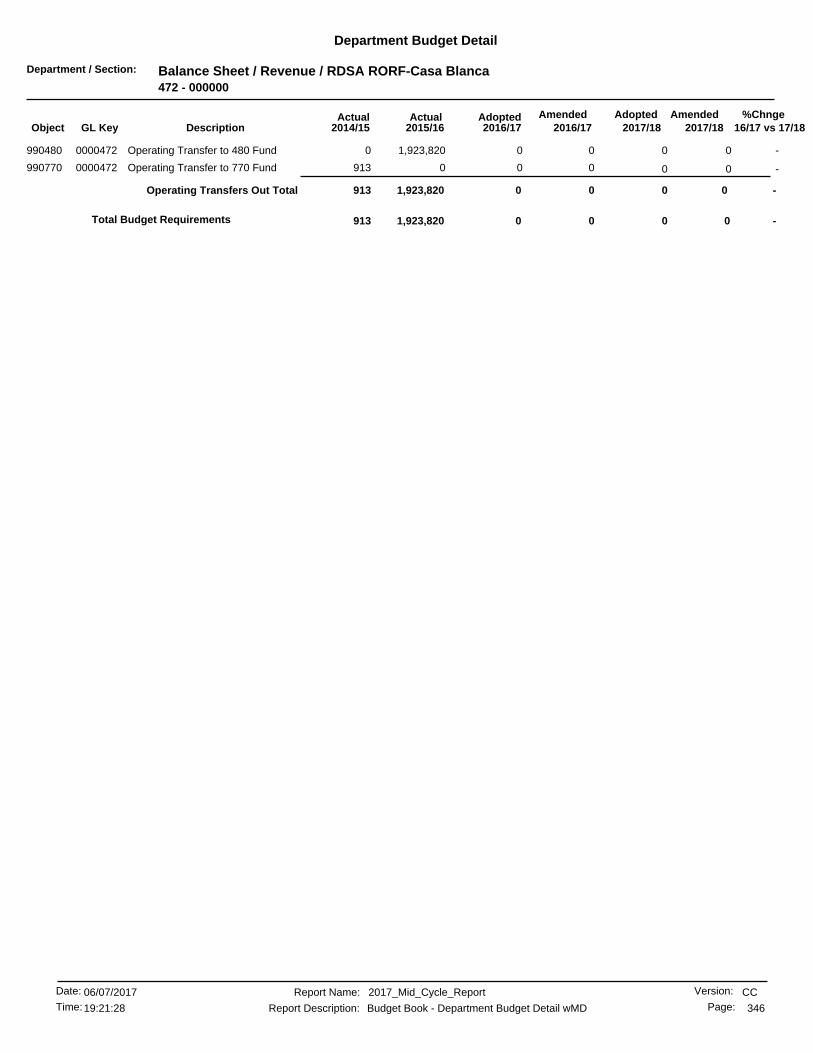
Department / Section: Balance Sheet / Revenue / RDSA RORF-Casa Blanca472 - 000000
Department Budget Detail
%Chnge16/17 vs 17/182017/182017/18
AmendedAdoptedAdopted2016/17
AmendedActualActual2016/172015/162014/15GL KeyObject Description
-0 001,923,8200Operating Transfer to 480 Fund0000472990480 0
-0 000913Operating Transfer to 770 Fund0000472990770 0
-0 0Operating Transfers Out Total 001,923,820913
-00 001,923,820Total Budget Requirements 913
CCReport Name: 2017_Mid_Cycle_Report
Report Description: Budget Book - Department Budget Detail wMD
06/07/2017Date:
Time: 346
Version:
Page:19:21:28
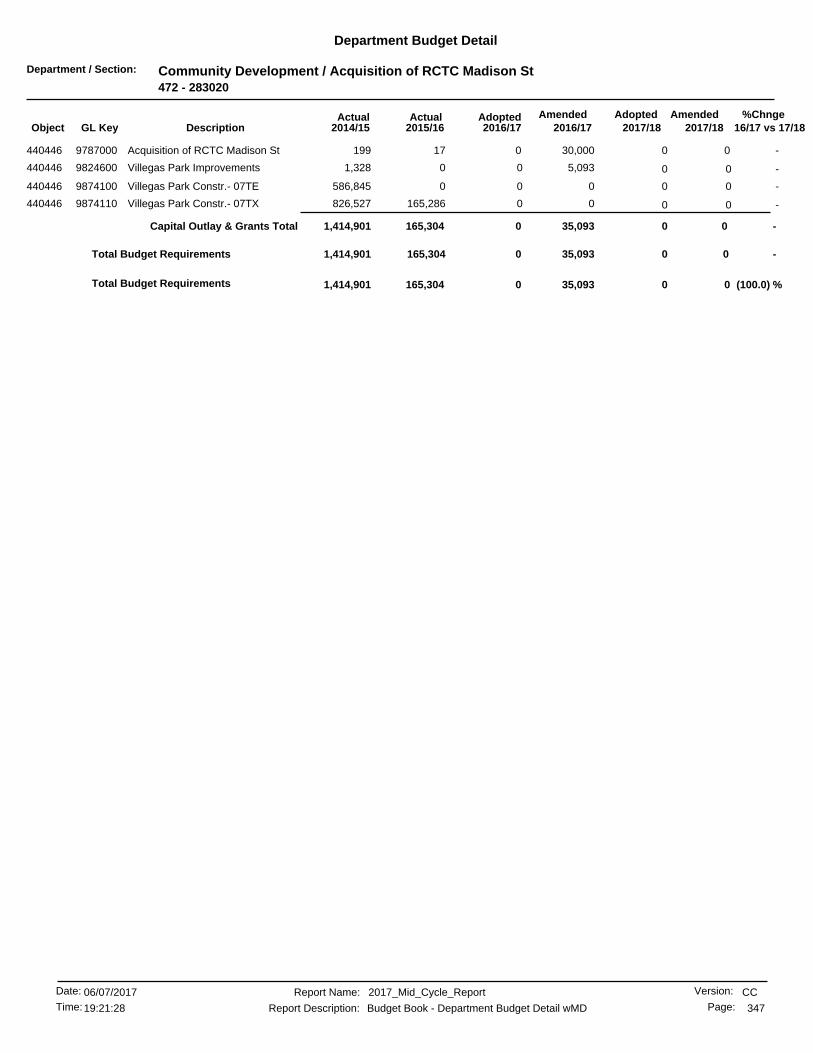
Department / Section: Community Development / Acquisition of RCTC Madison St472 - 283020
Department Budget Detail
%Chnge16/17 vs 17/182017/182017/18
AmendedAdoptedAdopted2016/17
AmendedActualActual2016/172015/162014/15GL KeyObject Description
-00 030,00017440446 Acquisition of RCTC Madison St9787000 199
-0 05,09301,328Villegas Park Improvements9824600440446 0
-0 000586,845Villegas Park Constr.- 07TE9874100440446 0
-0 00165,286826,527Villegas Park Constr.- 07TX9874110440446 0
-0 0Capital Outlay & Grants Total 035,093165,3041,414,901
-0 0035,093165,3041,414,901Total Budget Requirements
(100.0) %00 035,093165,304Total Budget Requirements 1,414,901
CCReport Name: 2017_Mid_Cycle_Report
Report Description: Budget Book - Department Budget Detail wMD
06/07/2017Date:
Time: 347
Version:
Page:19:21:28

Department / Section: Balance Sheet / Revenue / RDSA RORF-Magnolia Ctr474 - 000000
Department Budget Detail
%Chnge16/17 vs 17/182017/182017/18
AmendedAdoptedAdopted2016/17
AmendedActualActual2016/172015/162014/15GL KeyObject Description
-0 0057,6010Operating Transfer to 480 Fund0000474990480 0
-0 0Operating Transfers Out Total 0057,6010
-00 0057,601Total Budget Requirements 0
CCReport Name: 2017_Mid_Cycle_Report
Report Description: Budget Book - Department Budget Detail wMD
06/07/2017Date:
Time: 348
Version:
Page:19:21:28
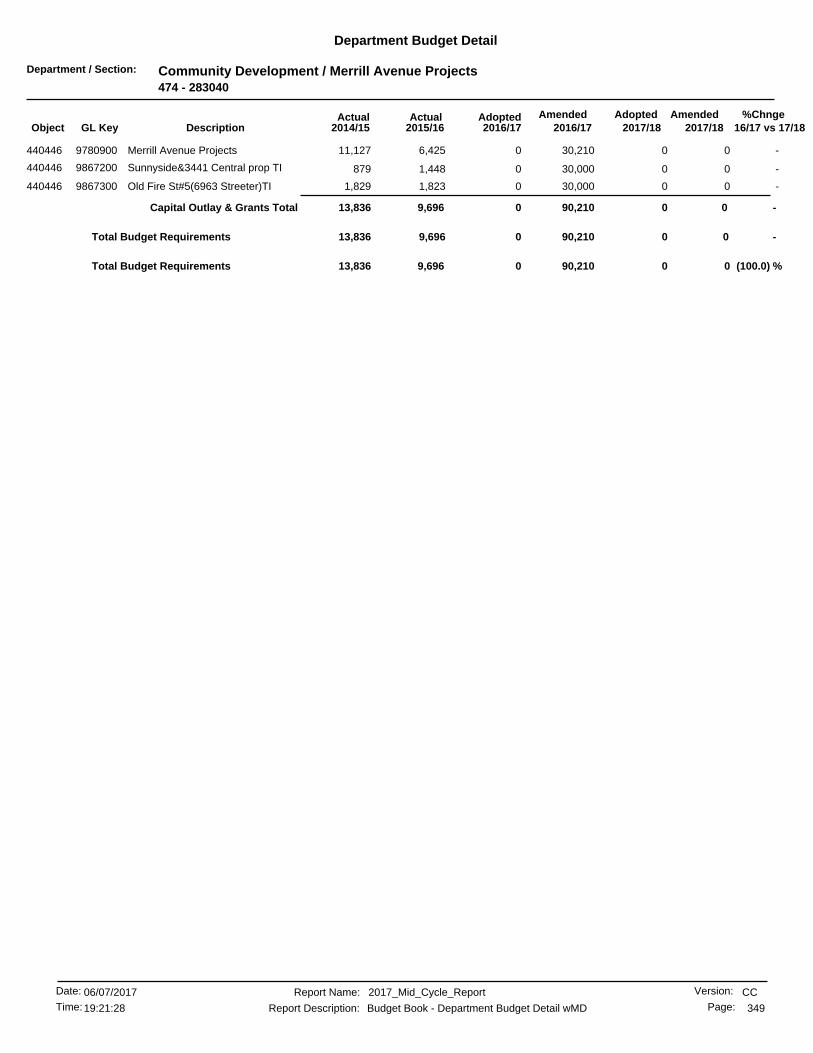
Department / Section: Community Development / Merrill Avenue Projects474 - 283040
Department Budget Detail
%Chnge16/17 vs 17/182017/182017/18
AmendedAdoptedAdopted2016/17
AmendedActualActual2016/172015/162014/15GL KeyObject Description
-00 030,2106,425440446 Merrill Avenue Projects9780900 11,127
-00 030,0001,448440446 Sunnyside&3441 Central prop TI9867200 879
-00 030,0001,823440446 Old Fire St#5(6963 Streeter)TI9867300 1,829
-0 0Capital Outlay & Grants Total 090,2109,69613,836
-0 0090,2109,69613,836Total Budget Requirements
(100.0) %00 090,2109,696Total Budget Requirements 13,836
CCReport Name: 2017_Mid_Cycle_Report
Report Description: Budget Book - Department Budget Detail wMD
06/07/2017Date:
Time: 349
Version:
Page:19:21:28
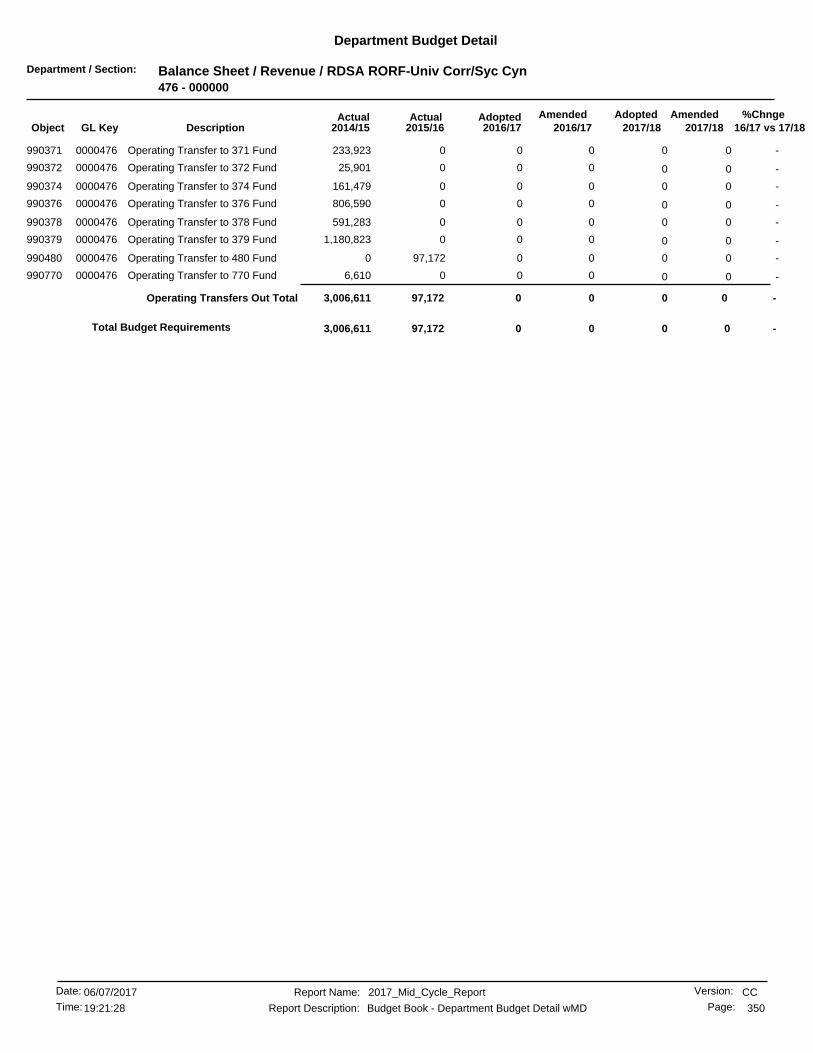
Department / Section: Balance Sheet / Revenue / RDSA RORF-Univ Corr/Syc Cyn476 - 000000
Department Budget Detail
%Chnge16/17 vs 17/182017/182017/18
AmendedAdoptedAdopted2016/17
AmendedActualActual2016/172015/162014/15GL KeyObject Description
-0 000233,923Operating Transfer to 371 Fund0000476990371 0
-0 00025,901Operating Transfer to 372 Fund0000476990372 0
-0 000161,479Operating Transfer to 374 Fund0000476990374 0
-0 000806,590Operating Transfer to 376 Fund0000476990376 0
-0 000591,283Operating Transfer to 378 Fund0000476990378 0
-0 0001,180,823Operating Transfer to 379 Fund0000476990379 0
-0 0097,1720Operating Transfer to 480 Fund0000476990480 0
-0 0006,610Operating Transfer to 770 Fund0000476990770 0
-0 0Operating Transfers Out Total 0097,1723,006,611
-00 0097,172Total Budget Requirements 3,006,611
CCReport Name: 2017_Mid_Cycle_Report
Report Description: Budget Book - Department Budget Detail wMD
06/07/2017Date:
Time: 350
Version:
Page:19:21:28

Department / Section: Community Development / Univ Corridor/Syc Cyn Debt476 - 283060
Department Budget Detail
%Chnge16/17 vs 17/182017/182017/18
AmendedAdoptedAdopted2016/17
AmendedActualActual2016/172015/162014/15GL KeyObject Description
-00 050,00050,000459977 Riverside Downtown Partnership2830602 50,000
-0 0Special Projects Total 050,00050,00050,000
-0 0027,65719,521Riverside Scrap Iron-TI9865200440440 0
-0 020,00000Univ Village Pylon Sign-TI9818610440446 0
-0 0100,00000CIP-TI9847150440446 0
-00 0914,411101,772440446 Riverside Scrap Iron-TI9865200 6,802
-00 034,0002,423440446 2015, 2025 & 2039 University9869400 1,550
-00 034,0002,927440446 2227 - 2243 University Ave-TI9869500 2,425
-00 010,0002,423440446 2771 University -TI9874500 5,141
-00 034,0006,077440446 2731, 2871, 2881&2891 Univ -TI9874600 4,800
-00 034,0003,277440446 1910 University-TI9874700 2,200
-00 034,0007,254440446 3870 Ottawa-TI9874800 2,988
-00 034,0003,851440446 2585-2617 University-TI9874900 2,815
-0 0008,9301953-1971 University-TI9875000440446 0
-0 00015,0001393 University-TI9875100440446 0
-00 024,000735440446 4307 Park Ave-TI9875200 1,675
-0 0Capital Outlay & Grants Total 01,272,411158,39973,848
-0 001,322,411208,399123,848Total Budget Requirements
(100.0) %00 01,322,411208,399Total Budget Requirements 123,848
CCReport Name: 2017_Mid_Cycle_Report
Report Description: Budget Book - Department Budget Detail wMD
06/07/2017Date:
Time: 351
Version:
Page:19:21:28
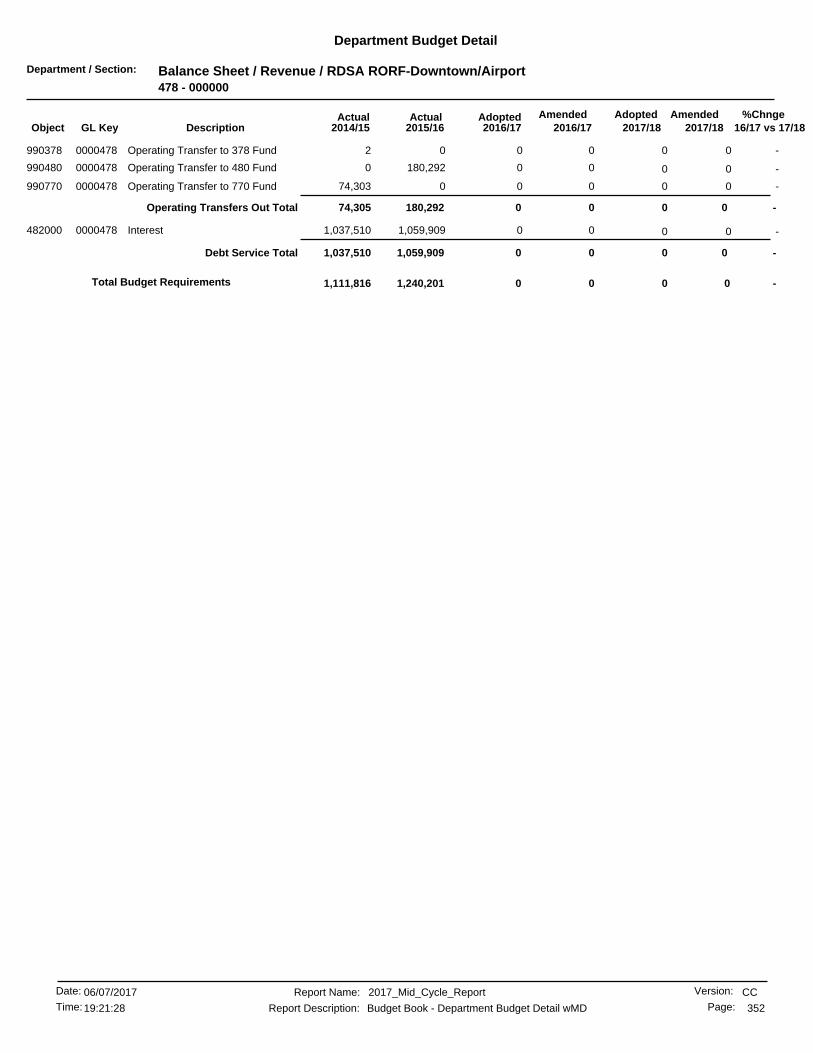
Department / Section: Balance Sheet / Revenue / RDSA RORF-Downtown/Airport478 - 000000
Department Budget Detail
%Chnge16/17 vs 17/182017/182017/18
AmendedAdoptedAdopted2016/17
AmendedActualActual2016/172015/162014/15GL KeyObject Description
-0 0002Operating Transfer to 378 Fund0000478990378 0
-0 00180,2920Operating Transfer to 480 Fund0000478990480 0
-0 00074,303Operating Transfer to 770 Fund0000478990770 0
-0 0Operating Transfers Out Total 00180,29274,305
-0 001,059,9091,037,510Interest0000478482000 0
-0 0Debt Service Total 001,059,9091,037,510
-00 001,240,201Total Budget Requirements 1,111,816
CCReport Name: 2017_Mid_Cycle_Report
Report Description: Budget Book - Department Budget Detail wMD
06/07/2017Date:
Time: 352
Version:
Page:19:21:28
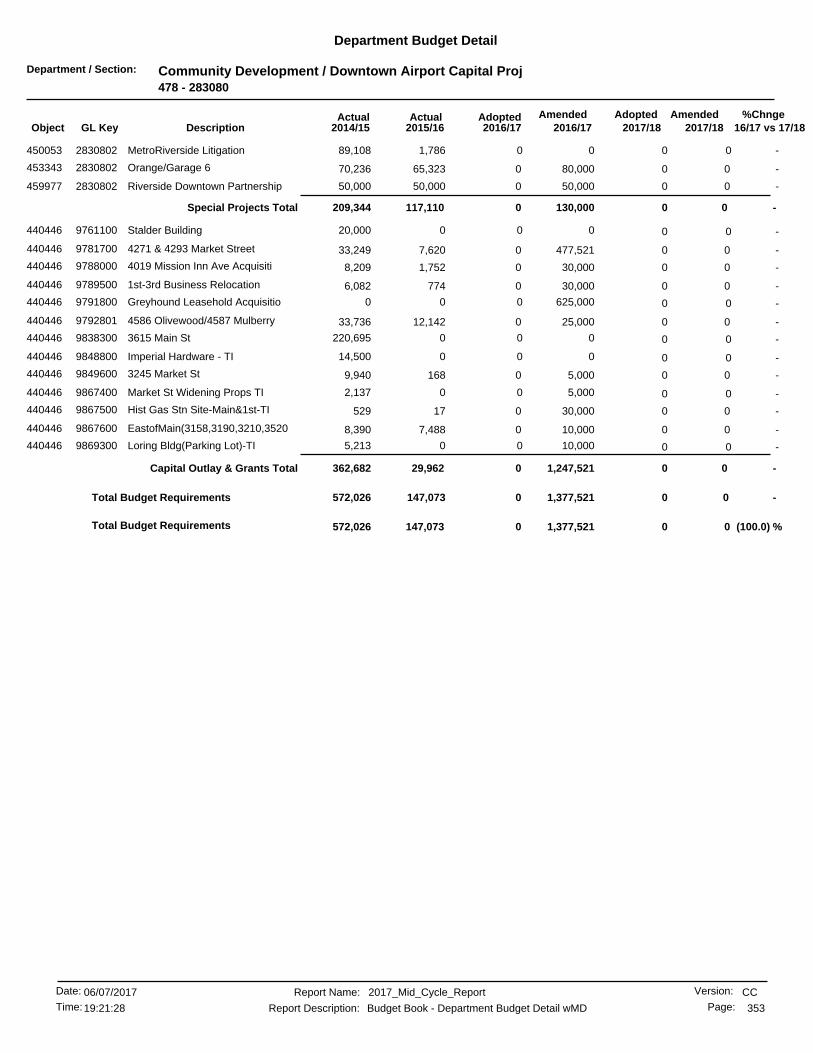
Department / Section: Community Development / Downtown Airport Capital Proj478 - 283080
Department Budget Detail
%Chnge16/17 vs 17/182017/182017/18
AmendedAdoptedAdopted2016/17
AmendedActualActual2016/172015/162014/15GL KeyObject Description
-0 001,78689,108MetroRiverside Litigation2830802450053 0
-00 080,00065,323453343 Orange/Garage 62830802 70,236
-00 050,00050,000459977 Riverside Downtown Partnership2830802 50,000
-0 0Special Projects Total 0130,000117,110209,344
-0 00020,000Stalder Building9761100440446 0
-00 0477,5217,620440446 4271 & 4293 Market Street9781700 33,249
-00 030,0001,752440446 4019 Mission Inn Ave Acquisiti9788000 8,209
-00 030,000774440446 1st-3rd Business Relocation9789500 6,082
-0 0625,00000Greyhound Leasehold Acquisitio9791800440446 0
-00 025,00012,142440446 4586 Olivewood/4587 Mulberry9792801 33,736
-0 000220,6953615 Main St9838300440446 0
-0 00014,500Imperial Hardware - TI9848800440446 0
-00 05,000168440446 3245 Market St9849600 9,940
-0 05,00002,137Market St Widening Props TI9867400440446 0
-00 030,00017440446 Hist Gas Stn Site-Main&1st-TI9867500 529
-00 010,0007,488440446 EastofMain(3158,3190,3210,35209867600 8,390
-0 010,00005,213Loring Bldg(Parking Lot)-TI9869300440446 0
-0 0Capital Outlay & Grants Total 01,247,52129,962362,682
-0 001,377,521147,073572,026Total Budget Requirements
(100.0) %00 01,377,521147,073Total Budget Requirements 572,026
CCReport Name: 2017_Mid_Cycle_Report
Report Description: Budget Book - Department Budget Detail wMD
06/07/2017Date:
Time: 353
Version:
Page:19:21:28
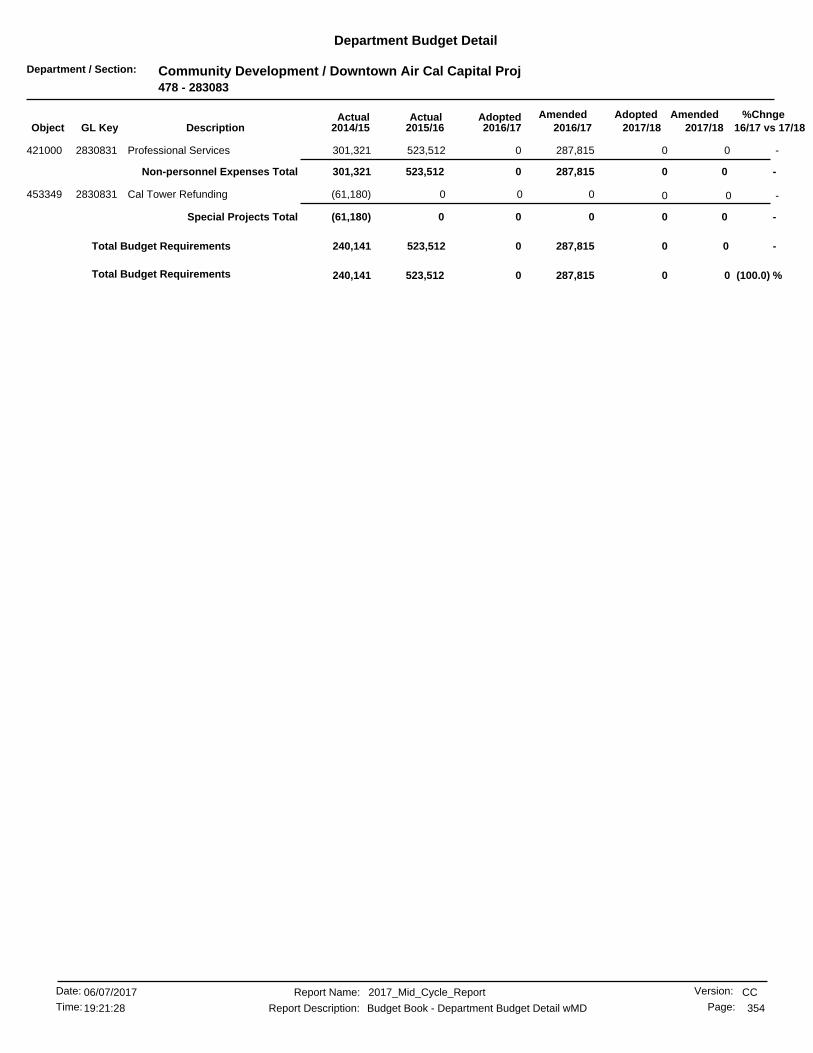
Department / Section: Community Development / Downtown Air Cal Capital Proj478 - 283083
Department Budget Detail
%Chnge16/17 vs 17/182017/182017/18
AmendedAdoptedAdopted2016/17
AmendedActualActual2016/172015/162014/15GL KeyObject Description
-00 0287,815523,512421000 Professional Services2830831 301,321
-0 0Non-personnel Expenses Total 0287,815523,512301,321
-0 000(61,180)Cal Tower Refunding2830831453349 0
-0 0Special Projects Total 000(61,180)
-0 00287,815523,512240,141Total Budget Requirements
(100.0) %00 0287,815523,512Total Budget Requirements 240,141
CCReport Name: 2017_Mid_Cycle_Report
Report Description: Budget Book - Department Budget Detail wMD
06/07/2017Date:
Time: 354
Version:
Page:19:21:28

Department / Section: Balance Sheet / Revenue / Balance Sheet / Revenue479 - 000000
Department Budget Detail
%Chnge16/17 vs 17/182017/182017/18
AmendedAdoptedAdopted2016/17
AmendedActualActual2016/172015/162014/15GL KeyObject Description
-0 0001,047,112Operating Transfer to 379 Fund0000479990379 0
-0 001,738,0410Operating Transfer to 480 Fund0000479990480 0
-0 0Operating Transfers Out Total 001,738,0411,047,112
-00 001,738,041Total Budget Requirements 1,047,112
CCReport Name: 2017_Mid_Cycle_Report
Report Description: Budget Book - Department Budget Detail wMD
06/07/2017Date:
Time: 355
Version:
Page:19:21:28

Department / Section: Community Development / La Sierra/Arlanza Proj Area479 - 283090
Department Budget Detail
%Chnge16/17 vs 17/182017/182017/18
AmendedAdoptedAdopted2016/17
AmendedActualActual2016/172015/162014/15GL KeyObject Description
-0 01,14200Five Point St Imp-TI9830200440440 0
-0 06950011134/11144 Pierce St-TI9854010440445 0
-0 00024,760Five Points Namini Property9823100440446 0
-0 0001,280Gould and Gramercy St Imp9837800440446 0
-00 030,0002,704440446 11134/11144 Pierce St-TI9854010 854
-0 00098,178Camp Anza Officers Club -07TX9855900440446 0
-0 0179,99901,620,001Camp Anza Officers Club -07TE9855910440446 0
-00 030,0002,936440446 10920 Magnolia-TI9875300 2,579
-00 030,0004,390440446 La Sierra/Pierce(Site B)-TI9875400 5,800
-00 030,0002,824440446 11089-11099 Hole/11079 BushTI9875500 2,589
-0 005,0661,382,309Collett Expansion-07TE9876400440446 0
-0 0Capital Outlay & Grants Total 0301,83717,9223,138,352
-0 00301,83717,9223,138,352Total Budget Requirements
(100.0) %00 0301,83717,922Total Budget Requirements 3,138,352
CCReport Name: 2017_Mid_Cycle_Report
Report Description: Budget Book - Department Budget Detail wMD
06/07/2017Date:
Time: 356
Version:
Page:19:21:28

Department / Section: Community Development / Arlington Project Area480 - 283010
Department Budget Detail
%Chnge16/17 vs 17/182017/182017/18
AmendedAdoptedAdopted2016/17
AmendedActualActual2016/172015/162014/15GL KeyObject Description
-0 0200,17600Arlington YOC 07TE9886710440446 0
-0 0165,23800Unprogrammed 2007 Tax-Exempt B9991271440446 0
-0 05,593,13600Unprogrammed 2007 Taxable Bond9991371440446 0
-0 0Capital Outlay & Grants Total 05,958,55100
(100.0) %00 05,958,5510Total Budget Requirements 0
CCReport Name: 2017_Mid_Cycle_Report
Report Description: Budget Book - Department Budget Detail wMD
06/07/2017Date:
Time: 357
Version:
Page:19:21:28
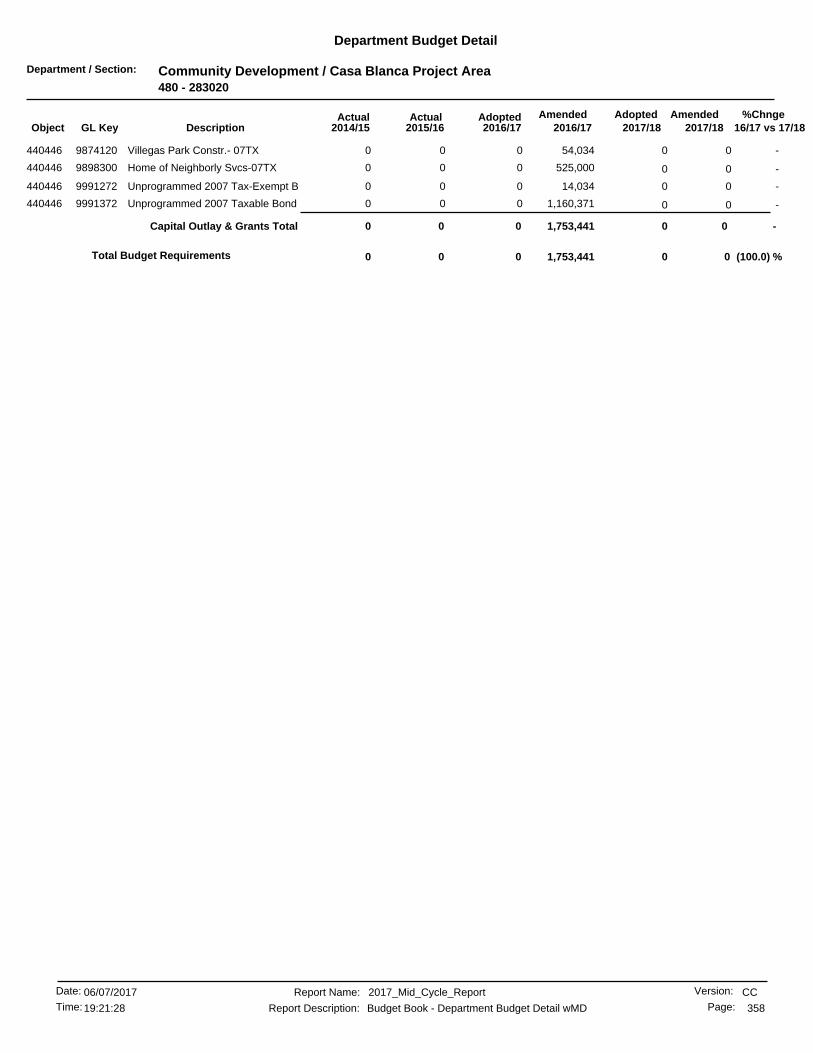
Department / Section: Community Development / Casa Blanca Project Area480 - 283020
Department Budget Detail
%Chnge16/17 vs 17/182017/182017/18
AmendedAdoptedAdopted2016/17
AmendedActualActual2016/172015/162014/15GL KeyObject Description
-0 054,03400Villegas Park Constr.- 07TX9874120440446 0
-0 0525,00000Home of Neighborly Svcs-07TX9898300440446 0
-0 014,03400Unprogrammed 2007 Tax-Exempt B9991272440446 0
-0 01,160,37100Unprogrammed 2007 Taxable Bond9991372440446 0
-0 0Capital Outlay & Grants Total 01,753,44100
(100.0) %00 01,753,4410Total Budget Requirements 0
CCReport Name: 2017_Mid_Cycle_Report
Report Description: Budget Book - Department Budget Detail wMD
06/07/2017Date:
Time: 358
Version:
Page:19:21:28

Department / Section: Community Development / Magnolia Center Project Area480 - 283040
Department Budget Detail
%Chnge16/17 vs 17/182017/182017/18
AmendedAdoptedAdopted2016/17
AmendedActualActual2016/172015/162014/15GL KeyObject Description
-0 094400Unprogrammed 2007 Tax-Exempt B9991274440446 0
-0 056,65800Unprogrammed 2007 Taxable Bond9991374440446 0
-0 0Capital Outlay & Grants Total 057,60200
(100.0) %00 057,6020Total Budget Requirements 0
CCReport Name: 2017_Mid_Cycle_Report
Report Description: Budget Book - Department Budget Detail wMD
06/07/2017Date:
Time: 359
Version:
Page:19:21:28

Department / Section: Community Development / Univ Corr/Syc Canyon480 - 283060
Department Budget Detail
%Chnge16/17 vs 17/182017/182017/18
AmendedAdoptedAdopted2016/17
AmendedActualActual2016/172015/162014/15GL KeyObject Description
-0 078,93700Unprogrammed 2007 Tax-Exempt B9991276440446 0
-0 018,23500Unprogrammed 2007 Taxable Bond9991376440446 0
-0 0Capital Outlay & Grants Total 097,17200
(100.0) %00 097,1720Total Budget Requirements 0
CCReport Name: 2017_Mid_Cycle_Report
Report Description: Budget Book - Department Budget Detail wMD
06/07/2017Date:
Time: 360
Version:
Page:19:21:28
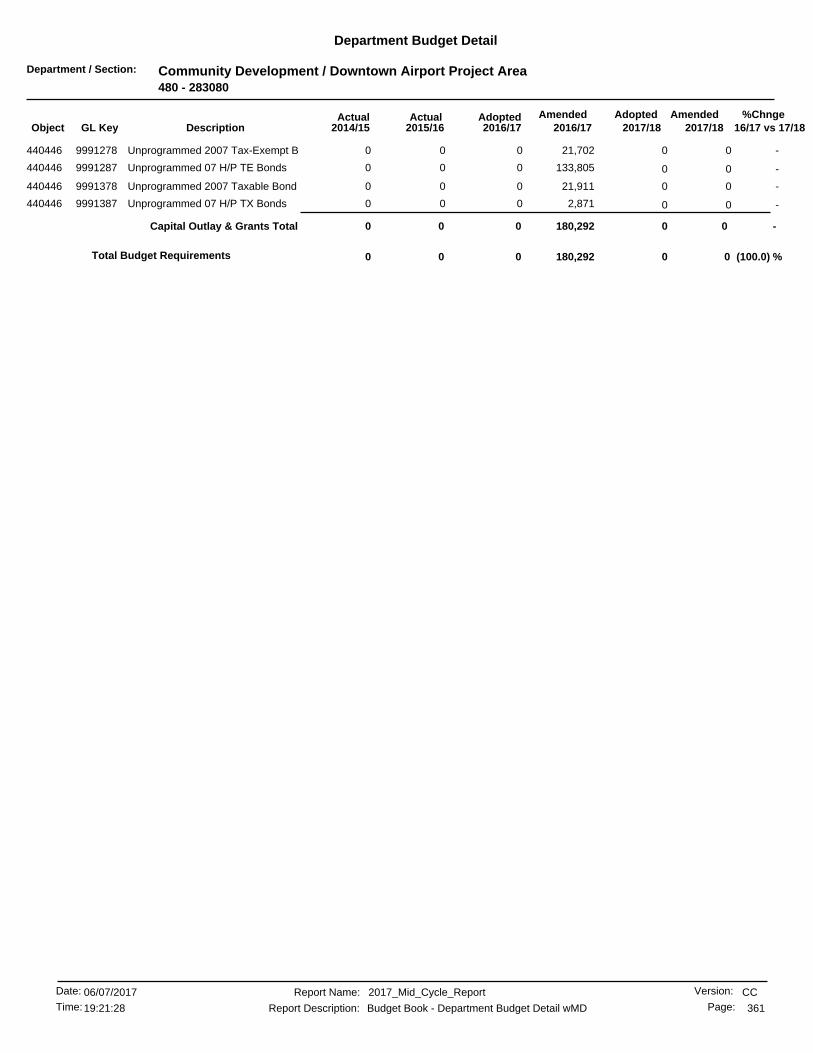
Department / Section: Community Development / Downtown Airport Project Area480 - 283080
Department Budget Detail
%Chnge16/17 vs 17/182017/182017/18
AmendedAdoptedAdopted2016/17
AmendedActualActual2016/172015/162014/15GL KeyObject Description
-0 021,70200Unprogrammed 2007 Tax-Exempt B9991278440446 0
-0 0133,80500Unprogrammed 07 H/P TE Bonds9991287440446 0
-0 021,91100Unprogrammed 2007 Taxable Bond9991378440446 0
-0 02,87100Unprogrammed 07 H/P TX Bonds9991387440446 0
-0 0Capital Outlay & Grants Total 0180,29200
(100.0) %00 0180,2920Total Budget Requirements 0
CCReport Name: 2017_Mid_Cycle_Report
Report Description: Budget Book - Department Budget Detail wMD
06/07/2017Date:
Time: 361
Version:
Page:19:21:28

Department / Section: Community Development / La Sierra/Arlanza Proj Area480 - 283090
Department Budget Detail
%Chnge16/17 vs 17/182017/182017/18
AmendedAdoptedAdopted2016/17
AmendedActualActual2016/172015/162014/15GL KeyObject Description
-0 0179,99900Camp Anza Officers Club -07TE9855920440446 0
-0 01,287,26500Unprogrammed 2007 Tax-Exempt B9991279440446 0
-0 0265,70900Unprogrammed 2007 Taxable Bond9991379440446 0
-0 0Capital Outlay & Grants Total 01,732,97500
(100.0) %00 01,732,9750Total Budget Requirements 0
CCReport Name: 2017_Mid_Cycle_Report
Report Description: Budget Book - Department Budget Detail wMD
06/07/2017Date:
Time: 362
Version:
Page:19:21:28

Department / Section: Public Utilities-Admin / Pub Util Admin-Mgmt Service510 - 600000
Department Budget Detail
%Chnge16/17 vs 17/182017/182017/18
AmendedAdoptedAdopted2016/17
AmendedActualActual2016/172015/162014/15GL KeyObject Description
(1.2) %3,974,7493,923,569 3,974,7493,923,5693,058,173411100 Salaries - Regular6000000 2,719,149
(5.1) %129,541122,877 129,541122,87717,149411110 Salaries-Temp & Part Time6000000 21,036
-0 00(4,697)5,621Compensatory Time6000000411130 0
-0 00181,482192,597Vacation6000000411210 0
-0 00149,616136,101Holidays & Special Days Off6000000411220 0
-0 0072,35397,346Sick Leave6000000411240 0
-0 0016,73023,018Family Illness Sick Leave6000000411245 0
-0 003,99833,605Industrial Accident6000000411250 0
-0 007,5184,681Bereavement Leave6000000411260 0
-0 009752,306Jury Duty6000000411280 0
-0 0058,18759,911Administrative Leave6000000411292 0
-0 0045,14360,183Vacation Payoffs6000000411410 0
-0 00079,695Sick Leave Payoff6000000411420 0
-0 003,6122,381Compensatory Time Payoff6000000411430 0
(3.0) %22,78122,095 22,78122,095(143,604)411510 Accrued Payroll6000000 16,328
-0 0043,673(58,253)Accrued Sick Leave Yr End Only6000000411521 0
-0 0060,98914,751Accrued Vacation Year-End Only6000000411522 0
-0 00(38,466)28,219Accrued Comp. Time Earned6000000411530 0
(1.4) %88,65687,405 88,65687,40578,963412210 Workers Compensation Ins6000000 77,191
(3.7) %401,479386,387 401,479386,387286,186412220 Health Insurance6000000 252,454
(1.4) %18,42118,161 18,42118,16114,594412222 Dental Insurance6000000 14,002
(1.2) %21,11620,856 21,11620,85617,964412230 Life Insurance6000000 15,439
(1.4) %2,2932,260 2,2932,2602,077412240 Unemployment Insurance6000000 2,455
-1,6321,632 1,6321,6321,365412250 Disability Insurance6000000 1,527
(7.4) %1,293,7311,197,553 1,293,7311,197,5531,006,304412310 PERS Retirement6000000 885,440
-0 00(5,035,650)(2,594,048)Pension Expense - GASB686000000412312 0
-0 0065,29588,574OPEB Annual Req Cont Expense6000000412313 0
(1.4) %55,59954,790 55,59954,79050,750412320 Medicare OASDI6000000 45,613
(6.2) %1,2481,170 1,2481,170141412330 City Retirement Plan6000000 264
(20.0) %40,50032,400 40,50032,40019,800412400 Deferred Compensation6000000 12,250
-21,60021,600 21,60021,60019,525412500 Automobile/Expense Allowance6000000 17,472
-0 000207Overtime At Straight Rate6000000413110 0
-9,0009,000 9,0009,00026,401413120 Overtime At 1.5 Rate6000000 27,829
-0 000162Holiday O/T-1.5 Rate/Non-Sched6000000413220 0
(100.0)%0 119,123000Ptr. Comp. Model6000000419996 0
(4.8) %6,201,4695,901,7555,901,755 6,082,346Personnel Services Total 86,5542,285,520
.8 %740,540746,725 740,5401,348,258746,070421000 Professional Services6000000 384,675
-0 00166,40293,981Prof Services/Internal6000000421001 0
-00 0114,8446,058421100 Outside Legal Services6000000 0
-10,00010,000 10,00010,00010,240422100 Telephone6000000 8,020
-25,00025,000 25,00025,00022,932422120 Telephone - Cellular6000000 25,008
-0 000440Refuse/Disposal Fees6000000422700 0
-0 006450Land and Building Rental6000000423200 0
(2.9) %50,76849,289 50,76849,28948,673423400 Motor Pool Equipment Rental6000000 47,153
-00 0250179424130 Maint/Repair of Bldgs & Improv6000000 523
-2,5002,500 2,5002,6234,549424220 All Other Equip Maint/Repair6000000 659
CCReport Name: 2017_Mid_Cycle_Report
Report Description: Budget Book - Department Budget Detail wMD
06/07/2017Date:
Time: 363
Version:
Page:19:21:28

Department / Section: Public Utilities-Admin / Pub Util Admin-Mgmt Service510 - 600000
Department Budget Detail
%Chnge16/17 vs 17/182017/182017/18
AmendedAdoptedAdopted2016/17
AmendedActualActual2016/172015/162014/15GL KeyObject Description
-0 001,0950Software Maintenance/Support6000000424310 0
-5,0005,000 5,0005,61822,301425100 Advertising Expense6000000 1,933
(2.2) %277,100270,915 277,100270,915236,493425200 Periodicals & Dues6000000 185,708
-90,00090,000 90,00090,000124,286425400 General Office Expense6000000 117,335
-5,0005,000 5,0005,0001,763425500 Postage6000000 7,139
-0 000111Central Printing Charges6000000425600 0
-10,00010,000 10,00010,00011,950425610 Outside Printing Expense6000000 5,288
-15,00015,000 15,00017,1002,036425700 Software Purchase/Licensing6000000 3,050
-28,00028,000 28,00079,00038,897425800 Computer Equip Purc Undr $50006000000 23,578
-0 002460Janitorial Supplies6000000426100 0
-0 009257Clothing/Linen/Safety Supplies6000000426200 0
-25,00025,000 25,00035,00036,629426800 Special Department Supplies6000000 25,025
-135,600135,600 135,600135,600122,727427100 Travel & Meeting Expense6000000 119,198
-25,00025,000 25,00025,00023,712427110 Mayor C Mgr D/Head Travel Mtg6000000 17,755
-154,550154,550 154,550154,55032,718427200 Training6000000 33,191
-50,00050,000 50,00050,00049,773427400 Employee Loyalty6000000 44,812
(1.4) %64,84663,932 64,84663,93259,967428400 Liability Insurance6000000 66,315
-20,00020,000 20,00020,00016,439447020 PU Board Travel6000000 10,649
( .1) %1,733,9042,511,9801,731,511 1,733,904Non-personnel Expenses Total 1,786,7951,221,815
-12,00012,000 12,00012,0001,363457004 Property Management6000000 8,802
-12,00012,00012,000 12,000Special Projects Total 1,3638,802
-0 0951,91400Machine and Equipment6000000462200 0
-0 0000Office Furniture & Equipment6000000462300 0
-200,000200,000 200,0001,178,676330462308 Off Furn & Eq/Computer Acqustn6000000 203,014
-200,0002,130,591200,000 200,000Equipment Outlay Total 330203,014
(20.1) %6,811,2395,442,042 5,442,0425,442,0422,460,387881100 General Fund Allocation Chgs6000000 1,724,107
(30.0) %80,00056,000 80,00056,00087,190882101 Utilization Chgs from 101 Fund6000000 87,490
(9.0) %768,455698,537 768,455698,537463,632882510 Utilization Chgs from 510 Fund6000000 615,271
(19.1) %7,659,6946,196,5796,196,579 6,290,497Charges From Others Total 3,011,2102,426,869
-(332,424)(332,424) (332,424)(332,424)(338,289)892101 Utilization Chgs to 101 Fund6000000 (325,614)
-(7,370) (7,370)(7,370)00Utilization Chgs to 511 Fund6000000892511 (7,370)
(16.8) %(2,435,000)(2,025,000) (2,435,000)(2,025,000)(2,223,000)892520 Utilization Chgs to 520 Fund6000000 (1,947,000)
-(1,447) (1,447)(1,447)00Utilization Chgs to 521 Fund6000000892521 (1,447)
-(4,764)(4,764) (4,764)(4,764)(4,764)892530 Utilization Chgs to 530 Fund6000000 (4,764)
-(62,280)(62,280) (62,280)(62,280)(62,280)892550 Utilization Chgs to 550 Fund6000000 (62,280)
-(768)(768) (768)(768)(768)892560 Utilization Chgs to 560 Fund6000000 (768)
-(7,200)(7,200) (7,200)(7,200)(7,200)892570 Utilization Chgs to 570 Fund6000000 (7,200)
-(4,272)(4,272) (4,272)(4,272)(4,272)892650 Utilization Chgs to 650 Fund6000000 (4,272)
-(917,000)(917,000) (917,000)(917,000)(1,118,230)894510 Interfund Services to 510 Fund6000000 (1,465,507)
-0 000(9,058)Interfund Services to 520 Fund6000000894520 0
(10.8) %(3,772,525)(3,362,525)(3,362,525) (3,772,525)Charges to Others Total (3,758,803)(3,826,463)
(11.2) %10,679,320 12,034,54210,546,22213,390,3811,127,4502,319,558Total Budget Requirements
CCReport Name: 2017_Mid_Cycle_Report
Report Description: Budget Book - Department Budget Detail wMD
06/07/2017Date:
Time: 364
Version:
Page:19:21:28
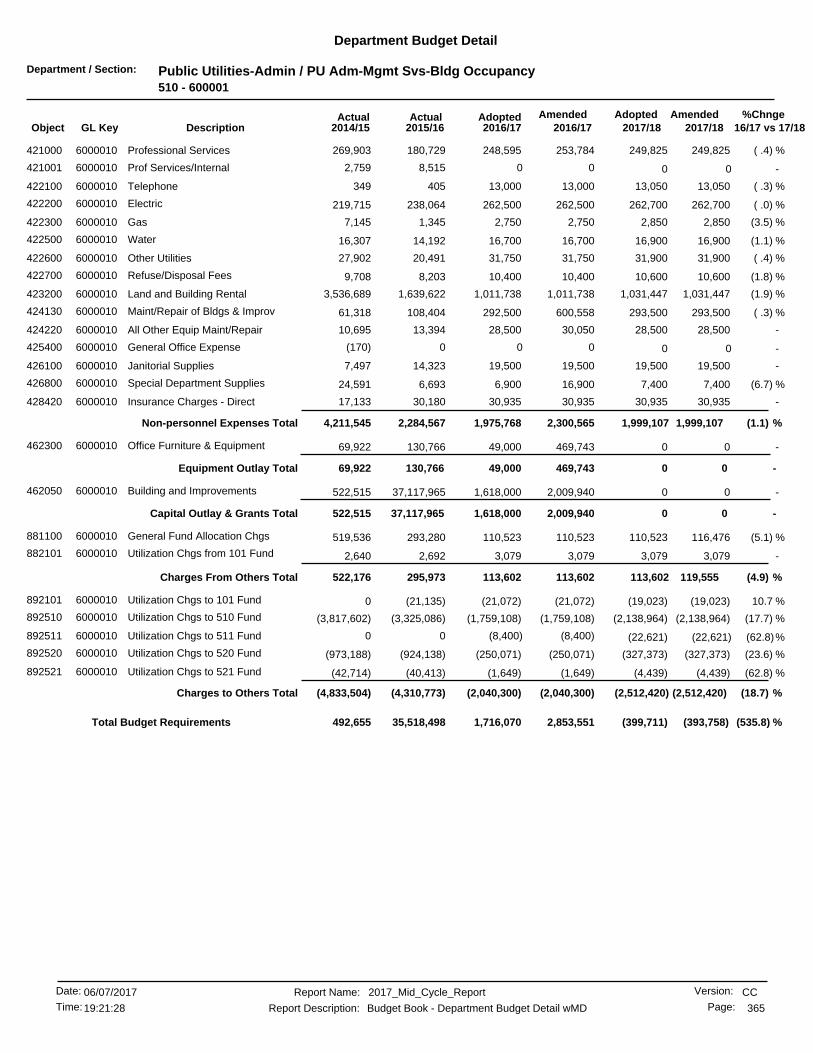
Department / Section: Public Utilities-Admin / PU Adm-Mgmt Svs-Bldg Occupancy510 - 600001
Department Budget Detail
%Chnge16/17 vs 17/182017/182017/18
AmendedAdoptedAdopted2016/17
AmendedActualActual2016/172015/162014/15GL KeyObject Description
( .4) %249,825248,595 249,825253,784180,729421000 Professional Services6000010 269,903
-0 008,5152,759Prof Services/Internal6000010421001 0
( .3) %13,05013,000 13,05013,000405422100 Telephone6000010 349
( .0) %262,700262,500 262,700262,500238,064422200 Electric6000010 219,715
(3.5) %2,8502,750 2,8502,7501,345422300 Gas6000010 7,145
(1.1) %16,90016,700 16,90016,70014,192422500 Water6000010 16,307
( .4) %31,90031,750 31,90031,75020,491422600 Other Utilities6000010 27,902
(1.8) %10,60010,400 10,60010,4008,203422700 Refuse/Disposal Fees6000010 9,708
(1.9) %1,031,4471,011,738 1,031,4471,011,7381,639,622423200 Land and Building Rental6000010 3,536,689
( .3) %293,500292,500 293,500600,558108,404424130 Maint/Repair of Bldgs & Improv6000010 61,318
-28,50028,500 28,50030,05013,394424220 All Other Equip Maint/Repair6000010 10,695
-0 000(170)General Office Expense6000010425400 0
-19,50019,500 19,50019,50014,323426100 Janitorial Supplies6000010 7,497
(6.7) %7,4006,900 7,40016,9006,693426800 Special Department Supplies6000010 24,591
-30,93530,935 30,93530,93530,180428420 Insurance Charges - Direct6000010 17,133
(1.1) %1,999,1072,300,5651,975,768 1,999,107Non-personnel Expenses Total 2,284,5674,211,545
-049,000 0469,743130,766462300 Office Furniture & Equipment6000010 69,922
-49,000 0Equipment Outlay Total 0469,743130,76669,922
-01,618,000 02,009,94037,117,965462050 Building and Improvements6000010 522,515
-1,618,000 0Capital Outlay & Grants Total 02,009,94037,117,965522,515
(5.1) %116,476110,523 110,523110,523293,280881100 General Fund Allocation Chgs6000010 519,536
-3,0793,079 3,0793,0792,692882101 Utilization Chgs from 101 Fund6000010 2,640
(4.9) %119,555113,602113,602 113,602Charges From Others Total 295,973522,176
10.7 %(19,023)(21,072) (19,023)(21,072)(21,135)892101 Utilization Chgs to 101 Fund6000010 0
(17.7) %(2,138,964)(1,759,108) (2,138,964)(1,759,108)(3,325,086)892510 Utilization Chgs to 510 Fund6000010 (3,817,602)
(62.8)%(8,400) (22,621)(8,400)00Utilization Chgs to 511 Fund6000010892511 (22,621)
(23.6) %(327,373)(250,071) (327,373)(250,071)(924,138)892520 Utilization Chgs to 520 Fund6000010 (973,188)
(62.8) %(4,439)(1,649) (4,439)(1,649)(40,413)892521 Utilization Chgs to 521 Fund6000010 (42,714)
(18.7) %(2,512,420)(2,040,300)(2,040,300) (2,512,420)Charges to Others Total (4,310,773)(4,833,504)
(535.8) %1,716,070 (393,758)(399,711)2,853,55135,518,498492,655Total Budget Requirements
CCReport Name: 2017_Mid_Cycle_Report
Report Description: Budget Book - Department Budget Detail wMD
06/07/2017Date:
Time: 365
Version:
Page:19:21:28
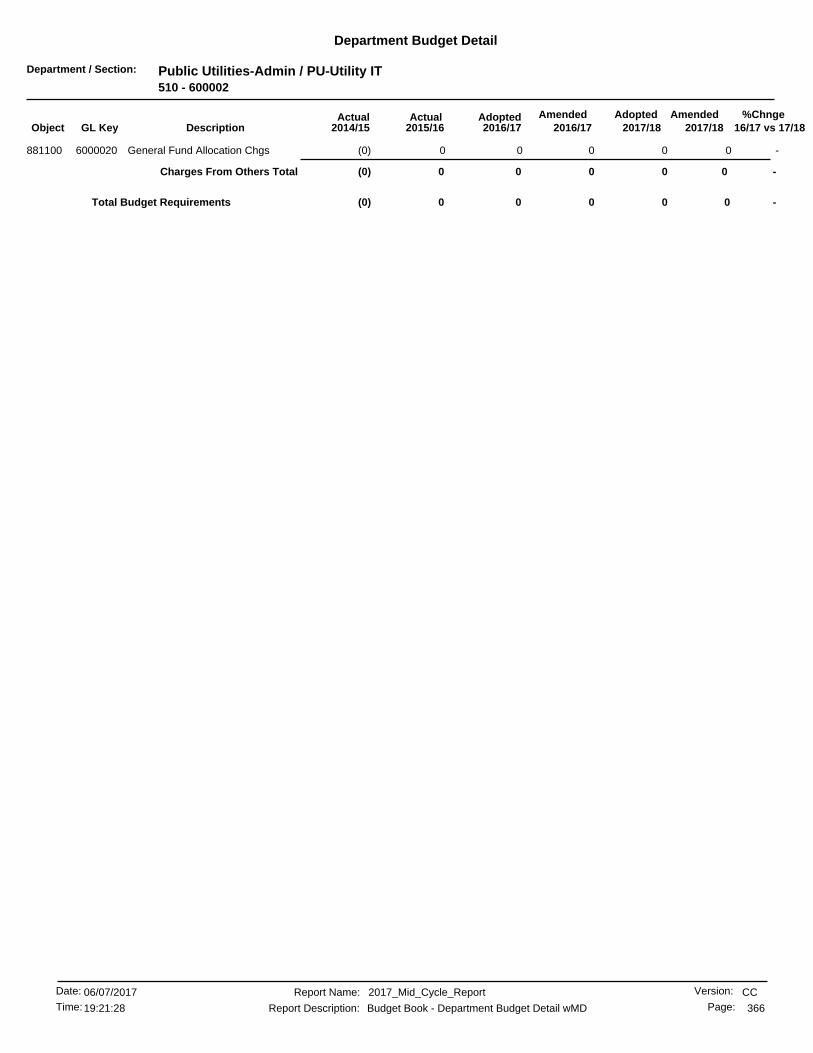
Department / Section: Public Utilities-Admin / PU-Utility IT510 - 600002
Department Budget Detail
%Chnge16/17 vs 17/182017/182017/18
AmendedAdoptedAdopted2016/17
AmendedActualActual2016/172015/162014/15GL KeyObject Description
-0 000(0)General Fund Allocation Chgs6000020881100 0
-0 0Charges From Others Total 000(0)
-00 000Total Budget Requirements (0)
CCReport Name: 2017_Mid_Cycle_Report
Report Description: Budget Book - Department Budget Detail wMD
06/07/2017Date:
Time: 366
Version:
Page:19:21:28
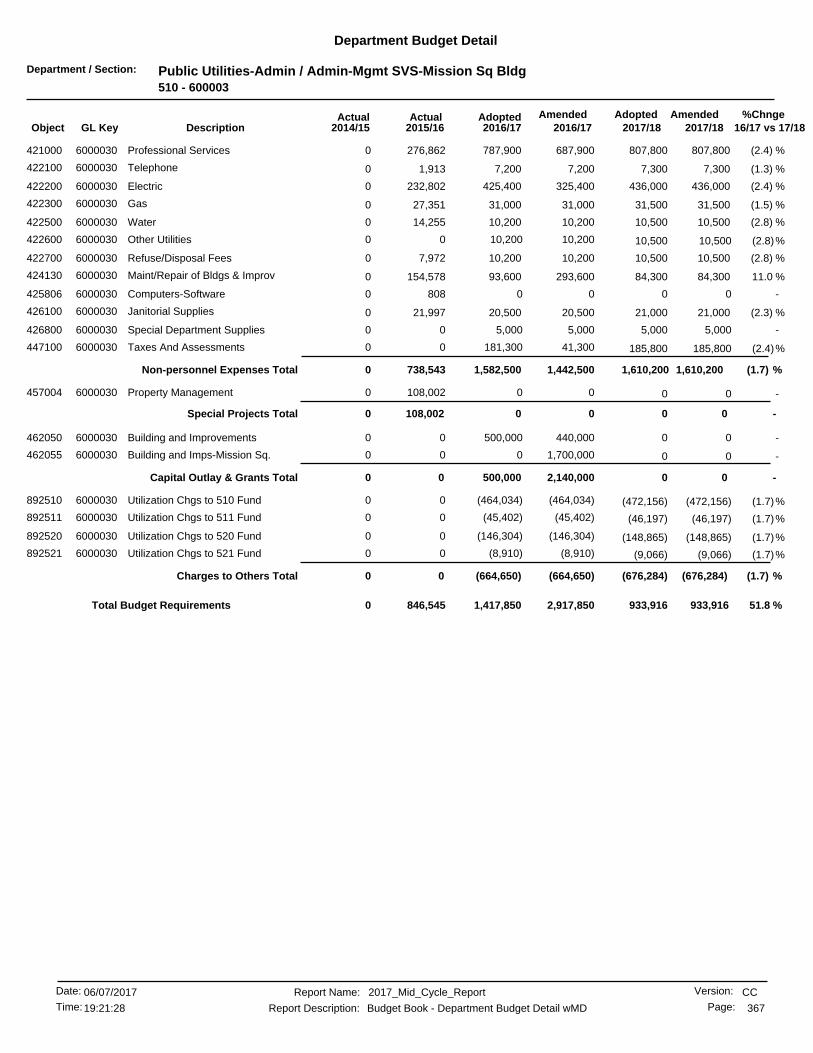
Department / Section: Public Utilities-Admin / Admin-Mgmt SVS-Mission Sq Bldg510 - 600003
Department Budget Detail
%Chnge16/17 vs 17/182017/182017/18
AmendedAdoptedAdopted2016/17
AmendedActualActual2016/172015/162014/15GL KeyObject Description
(2.4) %807,800787,900 807,800687,900276,862421000 Professional Services6000030 0
(1.3) %7,3007,200 7,3007,2001,913422100 Telephone6000030 0
(2.4) %436,000425,400 436,000325,400232,802422200 Electric6000030 0
(1.5) %31,50031,000 31,50031,00027,351422300 Gas6000030 0
(2.8) %10,50010,200 10,50010,20014,255422500 Water6000030 0
(2.8)%10,200 10,50010,20000Other Utilities6000030422600 10,500
(2.8) %10,50010,200 10,50010,2007,972422700 Refuse/Disposal Fees6000030 0
11.0 %84,30093,600 84,300293,600154,578424130 Maint/Repair of Bldgs & Improv6000030 0
-0 008080Computers-Software6000030425806 0
(2.3) %21,00020,500 21,00020,50021,997426100 Janitorial Supplies6000030 0
-5,000 5,0005,00000Special Department Supplies6000030426800 5,000
(2.4)%181,300 185,80041,30000Taxes And Assessments6000030447100 185,800
(1.7) %1,610,2001,442,5001,582,500 1,610,200Non-personnel Expenses Total 738,5430
-0 00108,0020Property Management6000030457004 0
-0 0Special Projects Total 00108,0020
-500,000 0440,00000Building and Improvements6000030462050 0
-0 01,700,00000Building and Imps-Mission Sq.6000030462055 0
-500,000 0Capital Outlay & Grants Total 02,140,00000
(1.7)%(464,034) (472,156)(464,034)00Utilization Chgs to 510 Fund6000030892510 (472,156)
(1.7)%(45,402) (46,197)(45,402)00Utilization Chgs to 511 Fund6000030892511 (46,197)
(1.7)%(146,304) (148,865)(146,304)00Utilization Chgs to 520 Fund6000030892520 (148,865)
(1.7)%(8,910) (9,066)(8,910)00Utilization Chgs to 521 Fund6000030892521 (9,066)
(1.7) %(664,650) (676,284)Charges to Others Total (676,284)(664,650)00
51.8 %1,417,850 933,916933,9162,917,850846,5450Total Budget Requirements
CCReport Name: 2017_Mid_Cycle_Report
Report Description: Budget Book - Department Budget Detail wMD
06/07/2017Date:
Time: 367
Version:
Page:19:21:28

Department / Section: Public Utilities-Admin / Pub Util Work Force Developmnt510 - 600200
Department Budget Detail
%Chnge16/17 vs 17/182017/182017/18
AmendedAdoptedAdopted2016/17
AmendedActualActual2016/172015/162014/15GL KeyObject Description
-202,989 202,989202,98900Salaries - Regular6002000411100 202,989
(1.9)%1,171 1,1941,17100Accrued Payroll6002000411510 1,194
(4.2)%25,829 26,96925,82900Health Insurance6002000412220 26,969
-1,080 1,0801,08000Dental Insurance6002000412222 1,080
-1,259 1,2591,25900Life Insurance6002000412230 1,259
-113 11311300Unemployment Insurance6002000412240 113
(5.8)%67,912 72,12667,91200PERS Retirement6002000412310 72,126
-2,943 2,9432,94300Medicare OASDI6002000412320 2,943
(20.0)%2,400 3,0002,40000Deferred Compensation6002000412400 3,000
(100.0)%0 4,714000Ptr. Comp. Model6002000419996 0
(3.3) %305,696 316,387Personnel Services Total 311,673305,69600
-14,000 14,00014,00000Professional Services6002000421000 14,000
-540 54054000Telephone - Cellular6002000422120 540
(11.1)%2,000 2,2502,00000Periodicals & Dues6002000425200 2,250
-1,200 1,2001,20000General Office Expense6002000425400 1,200
-2,500 2,5002,50000Outside Printing Expense6002000425610 2,500
-400 40040000Software Purchase/Licensing6002000425700 400
-7,500 7,5007,50000Travel & Meeting Expense6002000427100 7,500
-2,000 2,0002,00000Training6002000427200 2,000
-200,000 200,000100,00000Education Sponsorship Program6002000427201 200,000
-100,000 100,000100,00000Contract Education Program6002000427202 100,000
-3,207 3,2073,20700Liability Insurance6002000428400 3,207
( .0) %333,347 333,597Non-personnel Expenses Total 333,597233,34700
-0 0100,00000Off Furn & Eq/Computer Acqustn6002000462308 0
-0 0Equipment Outlay Total 0100,00000
(7.2)%81,984 88,40981,98400Utilization Chgs from 510 Fund6002000882510 88,409
(7.2) %81,984 88,409Charges From Others Total 88,40981,98400
(5.6)%(7,183) (7,616)(7,183)00Utilization Chgs to 511 Fund6002000892511 (7,616)
(5.1)%(93,000) (98,000)(93,000)00Utilization Chgs to 520 Fund6002000892520 (98,000)
(5.6)%(1,410) (1,495)(1,410)00Utilization Chgs to 521 Fund6002000892521 (1,495)
(5.1) %(101,593) (107,111)Charges to Others Total (107,111)(101,593)00
1.1 %631,282619,434 626,568619,4340Total Budget Requirements 0
CCReport Name: 2017_Mid_Cycle_Report
Report Description: Budget Book - Department Budget Detail wMD
06/07/2017Date:
Time: 368
Version:
Page:19:21:28
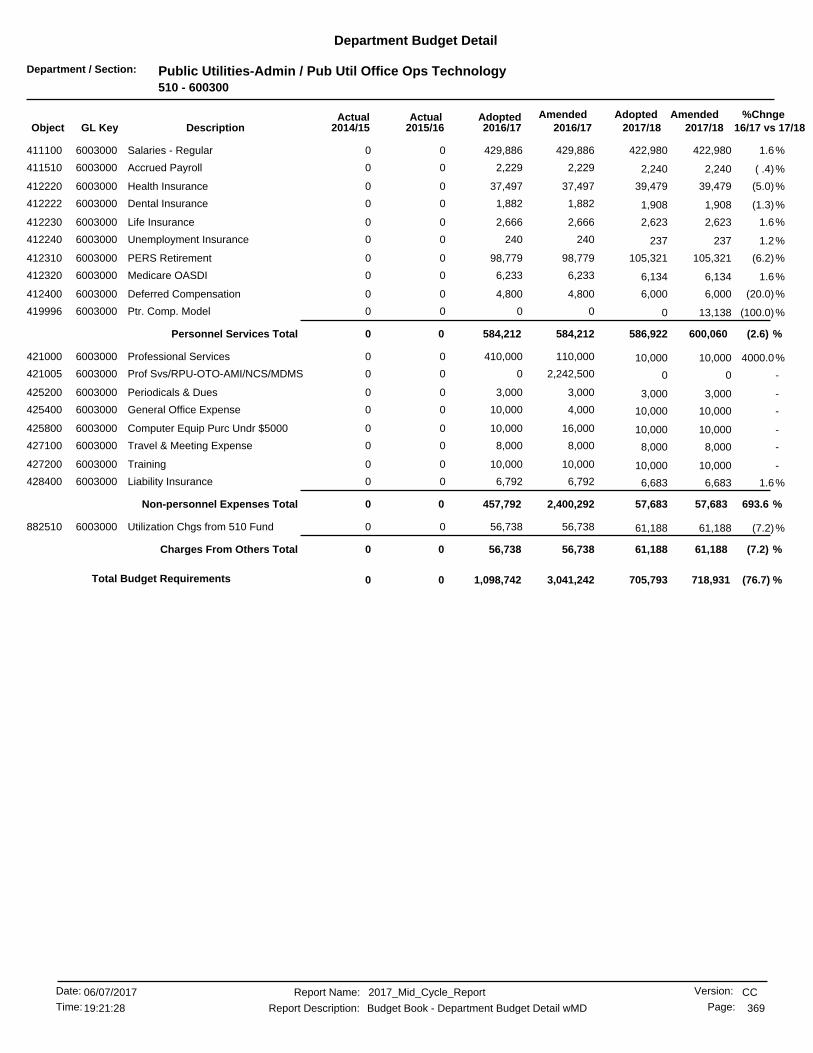
Department / Section: Public Utilities-Admin / Pub Util Office Ops Technology510 - 600300
Department Budget Detail
%Chnge16/17 vs 17/182017/182017/18
AmendedAdoptedAdopted2016/17
AmendedActualActual2016/172015/162014/15GL KeyObject Description
1.6%429,886 422,980429,88600Salaries - Regular6003000411100 422,980
( .4)%2,229 2,2402,22900Accrued Payroll6003000411510 2,240
(5.0)%37,497 39,47937,49700Health Insurance6003000412220 39,479
(1.3)%1,882 1,9081,88200Dental Insurance6003000412222 1,908
1.6%2,666 2,6232,66600Life Insurance6003000412230 2,623
1.2%240 23724000Unemployment Insurance6003000412240 237
(6.2)%98,779 105,32198,77900PERS Retirement6003000412310 105,321
1.6%6,233 6,1346,23300Medicare OASDI6003000412320 6,134
(20.0)%4,800 6,0004,80000Deferred Compensation6003000412400 6,000
(100.0)%0 13,138000Ptr. Comp. Model6003000419996 0
(2.6) %584,212 600,060Personnel Services Total 586,922584,21200
4000.0%410,000 10,000110,00000Professional Services6003000421000 10,000
-0 02,242,50000Prof Svs/RPU-OTO-AMI/NCS/MDMS6003000421005 0
-3,000 3,0003,00000Periodicals & Dues6003000425200 3,000
-10,000 10,0004,00000General Office Expense6003000425400 10,000
-10,000 10,00016,00000Computer Equip Purc Undr $50006003000425800 10,000
-8,000 8,0008,00000Travel & Meeting Expense6003000427100 8,000
-10,000 10,00010,00000Training6003000427200 10,000
1.6%6,792 6,6836,79200Liability Insurance6003000428400 6,683
693.6 %457,792 57,683Non-personnel Expenses Total 57,6832,400,29200
(7.2)%56,738 61,18856,73800Utilization Chgs from 510 Fund6003000882510 61,188
(7.2) %56,738 61,188Charges From Others Total 61,18856,73800
(76.7) %718,9311,098,742 705,7933,041,2420Total Budget Requirements 0
CCReport Name: 2017_Mid_Cycle_Report
Report Description: Budget Book - Department Budget Detail wMD
06/07/2017Date:
Time: 369
Version:
Page:19:21:28

Department / Section: Public Utilities-Admin / Pub Util Business Support510 - 600400
Department Budget Detail
%Chnge16/17 vs 17/182017/182017/18
AmendedAdoptedAdopted2016/17
AmendedActualActual2016/172015/162014/15GL KeyObject Description
(1.5) %691,208680,161 691,208680,161412,176411100 Salaries - Regular6004000 306,741
-0 003,980578Compensatory Time6004000411130 0
-0 0030,93815,688Vacation6004000411210 0
-0 0019,44113,854Holidays & Special Days Off6004000411220 0
-0 0021,8608,834Sick Leave6004000411240 0
-0 008,0941,478Family Illness Sick Leave6004000411245 0
-0 001,8380Bereavement Leave6004000411260 0
-0 005,9994,552Administrative Leave6004000411292 0
-0 003,688165Vacation Payoffs6004000411410 0
-0 00099Sick Leave Payoff6004000411420 0
-0 001860Compensatory Time Payoff6004000411430 0
(3.2) %4,0433,912 4,0433,912(19,498)411510 Accrued Payroll6004000 7,797
-0 00(1,814)4,093Accrued Sick Leave Yr End Only6004000411521 0
-0 005,36219,633Accrued Vacation Year-End Only6004000411522 0
-0 00(7,053)7,151Accrued Comp. Time Earned6004000411530 0
(1.6) %14,93014,691 14,93014,69113,300412210 Workers Compensation Ins6004000 14,388
(3.7) %114,283109,999 114,283109,99961,226412220 Health Insurance6004000 33,043
( .5) %4,6084,582 4,6084,5822,954412222 Dental Insurance6004000 1,809
(2.4) %2,8252,757 2,8252,7571,815412230 Life Insurance6004000 1,323
(1.5) %385379 385379349412240 Unemployment Insurance6004000 457
-544544 544544402412250 Disability Insurance6004000 214
(7.6) %221,438204,543 221,438204,543143,279412310 PERS Retirement6004000 97,782
-0 0013,96911,593OPEB Annual Req Cont Expense6004000412313 0
(1.8) %8,6948,533 8,6948,5335,934412320 Medicare OASDI6004000 4,280
(20.0) %7,5006,000 7,5006,0001,875412400 Deferred Compensation6004000 1,200
-0 00393808Overtime At 1.5 Rate6004000413120 0
(100.0)%0 23,914000Ptr. Comp. Model6004000419996 0
(5.3) %1,094,3721,036,1011,036,101 1,070,458Personnel Services Total 730,534557,632
16.6 %420,000490,000 420,000557,393566,378421000 Professional Services6004000 346,171
-0 00026Prof Services/Internal6004000421001 0
-0 00946511Telephone6004000422100 0
-2,3002,300 2,3002,3002,580422120 Telephone - Cellular6004000 1,194
-1,0001,000 1,0001,000234425400 General Office Expense6004000 1,868
(2.9) %758,100736,000 758,100736,000735,851425500 Postage6004000 711,296
(3.2) %372,000360,000 372,000356,00068,987425700 Software Purchase/Licensing6004000 46,247
-1,0001,000 1,0005,0001,147425800 Computer Equip Purc Undr $50006004000 0
-246,100246,100 246,100246,100189,303426800 Special Department Supplies6004000 218,063
-0 0001,230Travel & Meeting Expense6004000427100 0
-15,000 15,00015,000025Training6004000427200 15,000
(1.6) %10,92110,746 10,92110,74610,101428400 Liability Insurance6004000 12,360
1.9 %1,826,4211,929,5391,862,146 1,826,421Non-personnel Expenses Total 1,575,5311,338,995
20.2 %52,13462,696 62,69662,6961,171,312881100 General Fund Allocation Chgs6004000 911,541
(12.2) %178,120156,275 178,120156,275206,224882510 Utilization Chgs from 510 Fund6004000 123,286
(4.9) %230,254218,971218,971 240,816Charges From Others Total 1,377,5371,034,827
8.5 %(774,000)(840,000) (774,000)(840,000)(543,999)892520 Utilization Chgs to 520 Fund6004000 (309,999)
CCReport Name: 2017_Mid_Cycle_Report
Report Description: Budget Book - Department Budget Detail wMD
06/07/2017Date:
Time: 370
Version:
Page:19:21:28

Department / Section: Public Utilities-Admin / Pub Util Business Support510 - 600400
Department Budget Detail
%Chnge16/17 vs 17/182017/182017/18
AmendedAdoptedAdopted2016/17
AmendedActualActual2016/172015/162014/15GL KeyObject Description
11.3 %(559,119)(622,377) (559,119)(622,377)(549,000)892540 Utilization Chgs to 540 Fund6004000 (288,999)
9.7 %(731,156)(802,404) (731,156)(802,404)(579,999)892550 Utilization Chgs to 550 Fund6004000 (330,999)
-0 00(6,252)0Interfund Services to 510 Fund6004000894510 0
9.7 %(2,064,275)(2,264,781)(2,264,781) (2,064,275)Charges to Others Total (1,679,252)(929,999)
(21.5) %852,437 1,086,7721,073,420919,8302,004,3512,001,456Total Budget Requirements
CCReport Name: 2017_Mid_Cycle_Report
Report Description: Budget Book - Department Budget Detail wMD
06/07/2017Date:
Time: 371
Version:
Page:19:21:28

Department / Section: Public Utilities-Admin / Pub Util Admin-Utility Billing510 - 600500
Department Budget Detail
%Chnge16/17 vs 17/182017/182017/18
AmendedAdoptedAdopted2016/17
AmendedActualActual2016/172015/162014/15GL KeyObject Description
( .6) %601,847598,223 601,847598,223426,611411100 Salaries - Regular6005000 406,696
(1.0) %46,34745,852 46,34745,85232,297411110 Salaries-Temp & Part Time6005000 30,197
-0 003,1691,256Compensatory Time6005000411130 0
-0 0037,47128,885Vacation6005000411210 0
-0 0021,93921,242Holidays & Special Days Off6005000411220 0
-0 0014,56912,166Sick Leave6005000411240 0
-0 002,2092,251Family Illness Sick Leave6005000411245 0
-0 003,3473,026Bereavement Leave6005000411260 0
-0 000364Jury Duty6005000411280 0
-0 008781,039Administrative Leave6005000411292 0
-0 001,3351,328Vacation Payoffs6005000411410 0
(2.3) %3,8013,713 3,8013,713(22,904)411510 Accrued Payroll6005000 6,787
-0 001,1063,630Accrued Sick Leave Yr End Only6005000411521 0
-0 004,2694,570Accrued Vacation Year-End Only6005000411522 0
-0 001,676750Accrued Comp. Time Earned6005000411530 0
( .6) %14,00413,914 14,00413,91412,838412210 Workers Compensation Ins6005000 13,059
(3.8) %123,826119,114 123,826119,11483,750412220 Health Insurance6005000 76,450
( .6) %6,5796,533 6,5796,5335,706412222 Dental Insurance6005000 5,125
(2.9) %784761 784761730412230 Life Insurance6005000 666
( .5) %363361 363361337412240 Unemployment Insurance6005000 415
-1,6321,632 1,6321,6321,413412250 Disability Insurance6005000 1,325
(7.0) %200,630186,547 200,630186,547136,902412310 PERS Retirement6005000 126,114
-0 0019,10826,823OPEB Annual Req Cont Expense6005000412313 0
( .6) %9,4009,341 9,4009,3418,450412320 Medicare OASDI6005000 8,091
(20.0) %1,5001,200 1,5001,200937412400 Deferred Compensation6005000 600
-0 000237Overtime At Straight Rate6005000413110 0
-7,9007,900 7,9007,90024,872413120 Overtime At 1.5 Rate6005000 34,505
-0 000117Overtime At Double Time Rate6005000413130 0
-0 000264Holiday O/T-Strt/Subj To Retir6005000413230 0
(100.0)%0 33,926000Ptr. Comp. Model6005000419996 0
(5.4) %1,052,539995,091995,091 1,018,613Personnel Services Total 823,026817,991
-0 0016,5240Professional Services6005000421000 0
-1,5001,500 1,5001,500401422100 Telephone6005000 295
-4,000 4,0004,00000All Other Equip Maint/Repair6005000424220 4,000
-8,0008,000 8,0008,0003,180425400 General Office Expense6005000 3,520
-7,0007,000 7,0007,0007,767425500 Postage6005000 4,859
-7,0007,000 7,0007,0001,606425800 Computer Equip Purc Undr $50006005000 0
-5,000 5,0005,00000Special Department Supplies6005000426800 5,000
-4,000 4,0004,00000Training6005000427200 4,000
( .6) %10,24010,174 10,24010,1749,750428400 Liability Insurance6005000 11,218
( .1) %46,74046,67446,674 46,740Non-personnel Expenses Total 39,23219,893
41.4 %37,75753,394 53,39453,394167,431881100 General Fund Allocation Chgs6005000 167,995
-63,46263,462 63,46263,46263,462882101 Utilization Chgs from 101 Fund6005000 63,462
(12.2) %207,806182,321 207,806182,321110,527882510 Utilization Chgs from 510 Fund6005000 157,098
(3.1) %309,025299,177299,177 324,662Charges From Others Total 341,421388,556
CCReport Name: 2017_Mid_Cycle_Report
Report Description: Budget Book - Department Budget Detail wMD
06/07/2017Date:
Time: 372
Version:
Page:19:21:28

Department / Section: Public Utilities-Admin / Pub Util Admin-Utility Billing510 - 600500
Department Budget Detail
%Chnge16/17 vs 17/182017/182017/18
AmendedAdoptedAdopted2016/17
AmendedActualActual2016/172015/162014/15GL KeyObject Description
12.2 %(228,000)(256,000) (228,000)(256,000)(177,000)892520 Utilization Chgs to 520 Fund6005000 (206,000)
(19.2) %(227,790)(183,849) (227,790)(183,849)(180,000)892540 Utilization Chgs to 540 Fund6005000 (192,000)
(6.5) %(258,162)(241,187) (258,162)(241,187)(189,000)892550 Utilization Chgs to 550 Fund6005000 (219,999)
-0 00(131,590)(164,625)Interfund Services to 510 Fund6005000894510 0
(4.6) %(713,952)(681,036)(681,036) (713,952)Charges to Others Total (677,590)(782,625)
(4.9) %659,906 694,352676,063659,906526,088443,815Total Budget Requirements
CCReport Name: 2017_Mid_Cycle_Report
Report Description: Budget Book - Department Budget Detail wMD
06/07/2017Date:
Time: 373
Version:
Page:19:21:28

Department / Section: Public Utilities-Admin / Pub Util Admin-Field Services510 - 601000
Department Budget Detail
%Chnge16/17 vs 17/182017/182017/18
AmendedAdoptedAdopted2016/17
AmendedActualActual2016/172015/162014/15GL KeyObject Description
(1.4) %2,361,1912,327,017 2,361,1912,327,0171,748,834411100 Salaries - Regular6010000 1,577,015
(4.7) %88,30584,069 88,30584,069240411110 Salaries-Temp & Part Time6010000 3,351
-0 0017,84813,521Compensatory Time6010000411130 0
-0 00129,599118,788Vacation6010000411210 0
-0 0084,50478,747Holidays & Special Days Off6010000411220 0
-0 0064,47764,479Sick Leave6010000411240 0
-0 0022,9619,219Family Illness Sick Leave6010000411245 0
-0 004,506878Industrial Accident6010000411250 0
-0 004,1132,451Bereavement Leave6010000411260 0
-0 006913,778Jury Duty6010000411280 0
-0 001,46614Administrative Leave6010000411292 0
-0 001,82712,336Vacation Payoffs6010000411410 0
-0 00029,083Sick Leave Payoff6010000411420 0
(3.0) %14,17813,740 14,17813,740(90,251)411510 Accrued Payroll6010000 15,423
-0 002,249(19,267)Accrued Sick Leave Yr End Only6010000411521 0
-0 0021,65072Accrued Vacation Year-End Only6010000411522 0
-0 00(4,220)4,090Accrued Comp. Time Earned6010000411530 0
(1.5) %52,90652,079 52,90652,07952,806412210 Workers Compensation Ins6010000 54,804
(4.2) %468,860449,080 468,860449,080351,082412220 Health Insurance6010000 318,404
(2.3) %20,33619,868 20,33619,86816,804412222 Dental Insurance6010000 15,989
( .1) %2,5822,579 2,5822,5792,477412230 Life Insurance6010000 2,122
(1.3) %1,3621,343 1,3621,3431,389412240 Unemployment Insurance6010000 1,743
-5,9165,916 5,9165,9165,104412250 Disability Insurance6010000 4,968
(7.7) %709,278654,621 709,278654,621505,366412310 PERS Retirement6010000 456,719
-0 0080,101111,713OPEB Annual Req Cont Expense6010000412313 0
(1.5) %31,88731,378 31,88731,37827,904412320 Medicare OASDI6010000 24,132
(4.8)%2,572 2,7032,57200City Retirement Plan6010000412330 2,703
(20.0) %4,5003,600 4,5003,6002,812412400 Deferred Compensation6010000 1,575
-0 00925224Overtime At Straight Rate6010000413110 0
-219,605219,605 219,605219,60570,050413120 Overtime At 1.5 Rate6010000 105,935
-0 0001,257Overtime At Double Time Rate6010000413130 0
(100.0)%0 123,637000Ptr. Comp. Model6010000419996 0
(5.8) %4,107,2463,867,4673,867,467 3,983,609Personnel Services Total 3,127,3273,013,577
-0 001,5401,680Professional Services6010000421000 0
-0 00511,324Prof Services/Internal6010000421001 0
-2,0002,000 2,0002,000435422100 Telephone6010000 475
-17,40017,400 17,40017,40027,322422120 Telephone - Cellular6010000 22,155
(2.9) %253,127245,754 253,127245,754275,821423400 Motor Pool Equipment Rental6010000 247,121
-0 002,7680Maint/Repair of Bldgs & Improv6010000424130 0
-40,00040,000 40,00043,10022,601424220 All Other Equip Maint/Repair6010000 20,445
-0 00408182Central Garage Charges6010000424230 0
-12,50012,500 12,50012,50010,915425400 General Office Expense6010000 12,030
-2,4502,450 2,4502,4502,098425500 Postage6010000 1,561
-3,0003,000 3,0003,00063425600 Central Printing Charges6010000 395
-0 001562,001Outside Printing Expense6010000425610 0
-5,8005,800 5,8005,80080425700 Software Purchase/Licensing6010000 0
CCReport Name: 2017_Mid_Cycle_Report
Report Description: Budget Book - Department Budget Detail wMD
06/07/2017Date:
Time: 374
Version:
Page:19:21:28
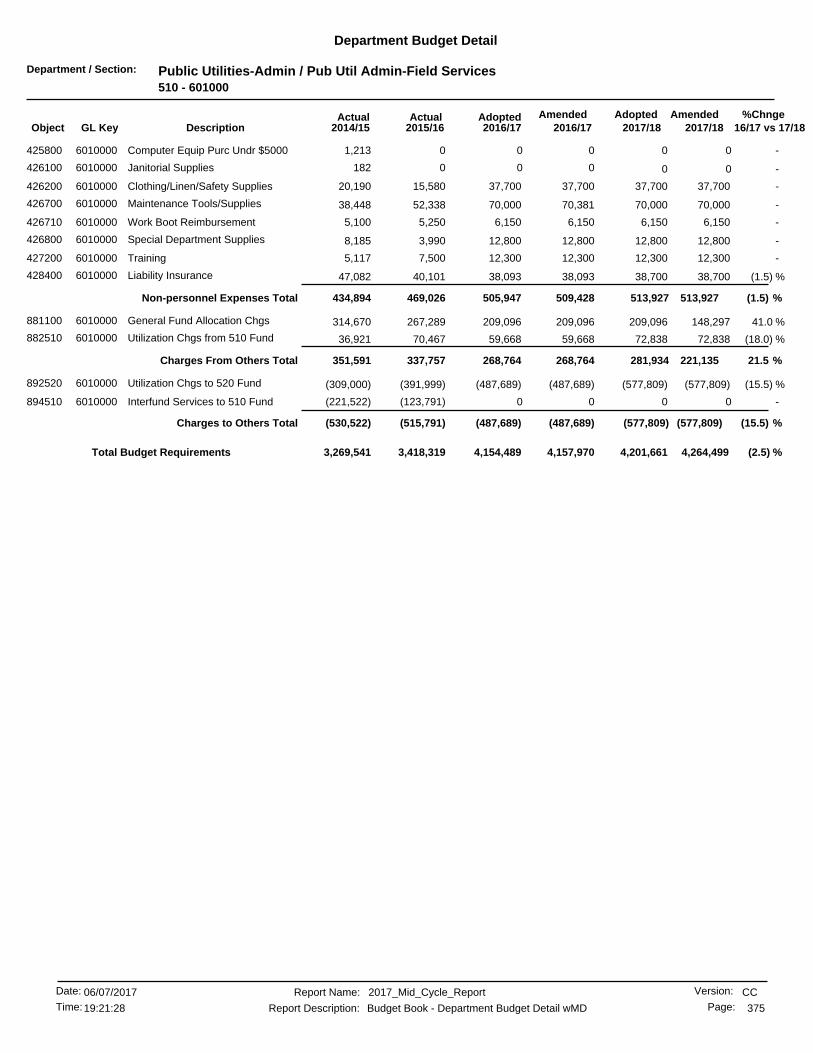
Department / Section: Public Utilities-Admin / Pub Util Admin-Field Services510 - 601000
Department Budget Detail
%Chnge16/17 vs 17/182017/182017/18
AmendedAdoptedAdopted2016/17
AmendedActualActual2016/172015/162014/15GL KeyObject Description
-0 0001,213Computer Equip Purc Undr $50006010000425800 0
-0 000182Janitorial Supplies6010000426100 0
-37,70037,700 37,70037,70015,580426200 Clothing/Linen/Safety Supplies6010000 20,190
-70,00070,000 70,00070,38152,338426700 Maintenance Tools/Supplies6010000 38,448
-6,1506,150 6,1506,1505,250426710 Work Boot Reimbursement6010000 5,100
-12,80012,800 12,80012,8003,990426800 Special Department Supplies6010000 8,185
-12,30012,300 12,30012,3007,500427200 Training6010000 5,117
(1.5) %38,70038,093 38,70038,09340,101428400 Liability Insurance6010000 47,082
(1.5) %513,927509,428505,947 513,927Non-personnel Expenses Total 469,026434,894
41.0 %148,297209,096 209,096209,096267,289881100 General Fund Allocation Chgs6010000 314,670
(18.0) %72,83859,668 72,83859,66870,467882510 Utilization Chgs from 510 Fund6010000 36,921
21.5 %221,135268,764268,764 281,934Charges From Others Total 337,757351,591
(15.5) %(577,809)(487,689) (577,809)(487,689)(391,999)892520 Utilization Chgs to 520 Fund6010000 (309,000)
-0 00(123,791)(221,522)Interfund Services to 510 Fund6010000894510 0
(15.5) %(577,809)(487,689)(487,689) (577,809)Charges to Others Total (515,791)(530,522)
(2.5) %4,154,489 4,264,4994,201,6614,157,9703,418,3193,269,541Total Budget Requirements
CCReport Name: 2017_Mid_Cycle_Report
Report Description: Budget Book - Department Budget Detail wMD
06/07/2017Date:
Time: 375
Version:
Page:19:21:28
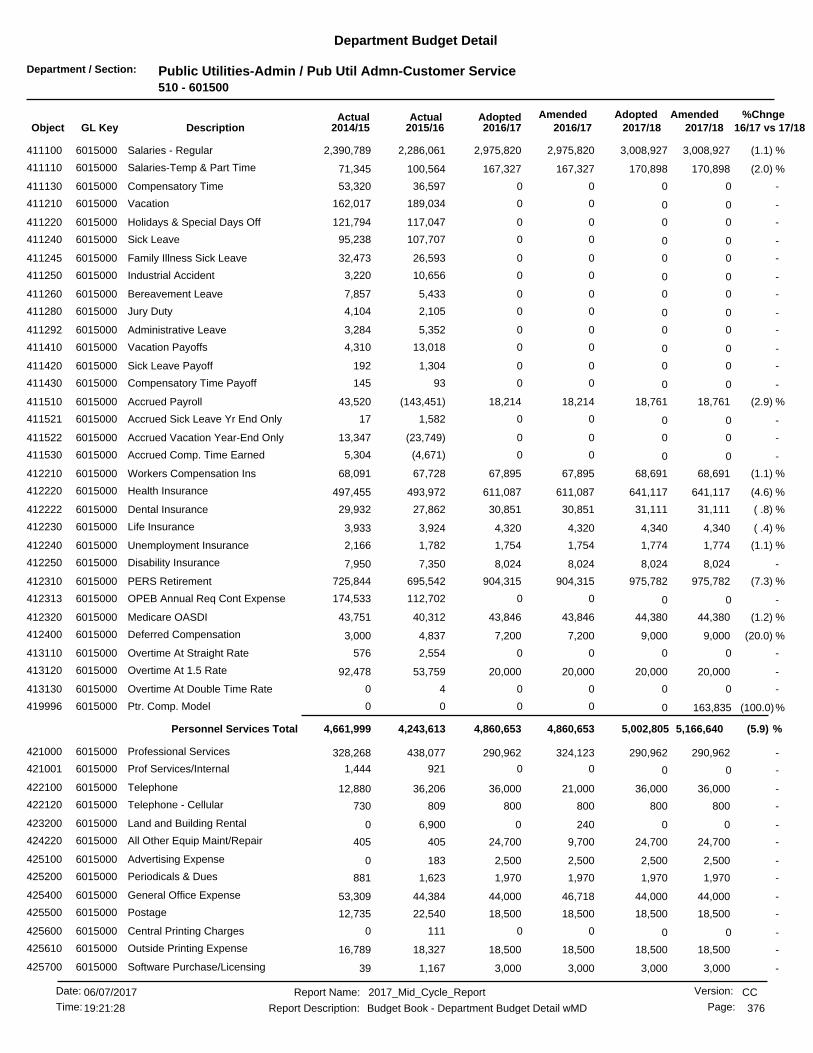
Department / Section: Public Utilities-Admin / Pub Util Admn-Customer Service510 - 601500
Department Budget Detail
%Chnge16/17 vs 17/182017/182017/18
AmendedAdoptedAdopted2016/17
AmendedActualActual2016/172015/162014/15GL KeyObject Description
(1.1) %3,008,9272,975,820 3,008,9272,975,8202,286,061411100 Salaries - Regular6015000 2,390,789
(2.0) %170,898167,327 170,898167,327100,564411110 Salaries-Temp & Part Time6015000 71,345
-0 0036,59753,320Compensatory Time6015000411130 0
-0 00189,034162,017Vacation6015000411210 0
-0 00117,047121,794Holidays & Special Days Off6015000411220 0
-0 00107,70795,238Sick Leave6015000411240 0
-0 0026,59332,473Family Illness Sick Leave6015000411245 0
-0 0010,6563,220Industrial Accident6015000411250 0
-0 005,4337,857Bereavement Leave6015000411260 0
-0 002,1054,104Jury Duty6015000411280 0
-0 005,3523,284Administrative Leave6015000411292 0
-0 0013,0184,310Vacation Payoffs6015000411410 0
-0 001,304192Sick Leave Payoff6015000411420 0
-0 0093145Compensatory Time Payoff6015000411430 0
(2.9) %18,76118,214 18,76118,214(143,451)411510 Accrued Payroll6015000 43,520
-0 001,58217Accrued Sick Leave Yr End Only6015000411521 0
-0 00(23,749)13,347Accrued Vacation Year-End Only6015000411522 0
-0 00(4,671)5,304Accrued Comp. Time Earned6015000411530 0
(1.1) %68,69167,895 68,69167,89567,728412210 Workers Compensation Ins6015000 68,091
(4.6) %641,117611,087 641,117611,087493,972412220 Health Insurance6015000 497,455
( .8) %31,11130,851 31,11130,85127,862412222 Dental Insurance6015000 29,932
( .4) %4,3404,320 4,3404,3203,924412230 Life Insurance6015000 3,933
(1.1) %1,7741,754 1,7741,7541,782412240 Unemployment Insurance6015000 2,166
-8,0248,024 8,0248,0247,350412250 Disability Insurance6015000 7,950
(7.3) %975,782904,315 975,782904,315695,542412310 PERS Retirement6015000 725,844
-0 00112,702174,533OPEB Annual Req Cont Expense6015000412313 0
(1.2) %44,38043,846 44,38043,84640,312412320 Medicare OASDI6015000 43,751
(20.0) %9,0007,200 9,0007,2004,837412400 Deferred Compensation6015000 3,000
-0 002,554576Overtime At Straight Rate6015000413110 0
-20,00020,000 20,00020,00053,759413120 Overtime At 1.5 Rate6015000 92,478
-0 0040Overtime At Double Time Rate6015000413130 0
(100.0)%0 163,835000Ptr. Comp. Model6015000419996 0
(5.9) %5,166,6404,860,6534,860,653 5,002,805Personnel Services Total 4,243,6134,661,999
-290,962290,962 290,962324,123438,077421000 Professional Services6015000 328,268
-0 009211,444Prof Services/Internal6015000421001 0
-36,00036,000 36,00021,00036,206422100 Telephone6015000 12,880
-800800 800800809422120 Telephone - Cellular6015000 730
-00 02406,900423200 Land and Building Rental6015000 0
-24,70024,700 24,7009,700405424220 All Other Equip Maint/Repair6015000 405
-2,5002,500 2,5002,500183425100 Advertising Expense6015000 0
-1,9701,970 1,9701,9701,623425200 Periodicals & Dues6015000 881
-44,00044,000 44,00046,71844,384425400 General Office Expense6015000 53,309
-18,50018,500 18,50018,50022,540425500 Postage6015000 12,735
-0 001110Central Printing Charges6015000425600 0
-18,50018,500 18,50018,50018,327425610 Outside Printing Expense6015000 16,789
-3,0003,000 3,0003,0001,167425700 Software Purchase/Licensing6015000 39
CCReport Name: 2017_Mid_Cycle_Report
Report Description: Budget Book - Department Budget Detail wMD
06/07/2017Date:
Time: 376
Version:
Page:19:21:28

Department / Section: Public Utilities-Admin / Pub Util Admn-Customer Service510 - 601500
Department Budget Detail
%Chnge16/17 vs 17/182017/182017/18
AmendedAdoptedAdopted2016/17
AmendedActualActual2016/172015/162014/15GL KeyObject Description
-9,5009,500 9,5009,5001,389425800 Computer Equip Purc Undr $50006015000 59,616
4.8 %40,92342,923 40,92342,92357,166426800 Special Department Supplies6015000 22,015
-9,0009,000 9,0009,0004,855427100 Travel & Meeting Expense6015000 743
-6,6506,650 6,6506,6502,702427200 Training6015000 6,132
(1.1) %50,22949,652 50,22949,65251,435428400 Liability Insurance6015000 58,497
-1,200,0001,200,000 1,200,0001,200,000769,429443300 Uncollect Accounts-Bad Debts6015000 1,016,367
.0 %1,757,2341,764,7761,758,657 1,757,234Non-personnel Expenses Total 1,458,6361,590,855
41.7 %173,216245,540 245,540245,540597,559881100 General Fund Allocation Chgs6015000 515,554
(7.0) %1,197,3731,113,470 1,197,3731,113,4701,261,420882101 Utilization Chgs from 101 Fund6015000 1,012,237
(8.8) %740,538675,239 740,538675,239693,766882510 Utilization Chgs from 510 Fund6015000 898,938
(3.6) %2,111,1272,034,2492,034,249 2,183,451Charges From Others Total 2,552,7462,426,731
(4.8) %(608,500)(578,900) (608,500)(578,900)(589,099)892101 Utilization Chgs to 101 Fund6015000 (734,400)
-(600)(600) (600)(600)(499)892170 Utilization Chgs to 170 Fund6015000 (600)
(4.6)%(20,400) (21,400)(20,400)00Utilization Chgs to 511 Fund6015000892511 (21,400)
5.2 %(1,270,685)(1,337,584) (1,270,685)(1,337,584)(1,224,600)892520 Utilization Chgs to 520 Fund6015000 (1,063,899)
(5.7)%(4,900) (5,200)(4,900)00Utilization Chgs to 521 Fund6015000892521 (5,200)
1.6 %(618,501)(628,688) (618,501)(628,688)(560,199)892540 Utilization Chgs to 540 Fund6015000 (572,100)
3.4 %(832,023)(860,756) (832,023)(860,756)(754,899)892550 Utilization Chgs to 550 Fund6015000 (548,199)
-0 00(149,661)(329,015)Interfund Services to 510 Fund6015000894510 0
2.2 %(3,356,909)(3,431,828)(3,431,828) (3,356,909)Charges to Others Total (3,278,961)(3,248,215)
(8.0) %5,221,731 5,678,0925,586,5815,227,8504,976,0355,431,370Total Budget Requirements
CCReport Name: 2017_Mid_Cycle_Report
Report Description: Budget Book - Department Budget Detail wMD
06/07/2017Date:
Time: 377
Version:
Page:19:21:28

Department / Section: Public Utilities-Admin / Pub Util Adm-Marketing Service510 - 602000
Department Budget Detail
%Chnge16/17 vs 17/182017/182017/18
AmendedAdoptedAdopted2016/17
AmendedActualActual2016/172015/162014/15GL KeyObject Description
(1.4) %806,491794,598 806,491794,5981,248,313411100 Salaries - Regular6020000 1,166,286
(7.0) %36,87734,277 36,87734,27718,069411110 Salaries-Temp & Part Time6020000 33,252
-0 004,35910,510Compensatory Time6020000411130 0
-0 0068,11971,606Vacation6020000411210 0
-0 0056,24856,641Holidays & Special Days Off6020000411220 0
-0 0037,93428,136Sick Leave6020000411240 0
-0 004,58114,650Family Illness Sick Leave6020000411245 0
-0 000221Industrial Accident6020000411250 0
-0 001331,814Bereavement Leave6020000411260 0
-0 004,8202,126Jury Duty6020000411280 0
-0 0012,7877,042Administrative Leave6020000411292 0
-0 0043321,696Vacation Payoffs6020000411410 0
-0 0001,509Sick Leave Payoff6020000411420 0
-0 0002,282Compensatory Time Payoff6020000411430 0
(3.3) %4,6914,536 4,6914,536(58,714)411510 Accrued Payroll6020000 (712)
-0 007,608(1,103)Accrued Sick Leave Yr End Only6020000411521 0
-0 0020,8273,023Accrued Vacation Year-End Only6020000411522 0
-0 00(5,296)10,561Accrued Comp. Time Earned6020000411530 0
(1.7) %18,21617,902 18,21617,90235,905412210 Workers Compensation Ins6020000 36,072
(5.0) %114,812108,984 114,812108,984165,859412220 Health Insurance6020000 149,121
(1.1) %5,5845,519 5,5845,5199,116412222 Dental Insurance6020000 8,908
-1,5211,521 1,5211,5213,344412230 Life Insurance6020000 3,225
(2.1) %469459 469459945412240 Unemployment Insurance6020000 1,147
-1,3601,360 1,3601,3602,175412250 Disability Insurance6020000 2,034
(7.9) %238,954219,961 238,954219,961349,923412310 PERS Retirement6020000 333,065
-0 0037,84152,319OPEB Annual Req Cont Expense6020000412313 0
(1.5) %11,89811,717 11,89811,71721,769412320 Medicare OASDI6020000 20,922
(7.0) %1,3821,285 1,3821,285711412330 City Retirement Plan6020000 1,248
(20.0) %3,0002,400 3,0002,4004,012412400 Deferred Compensation6020000 2,925
-500 50050000Overtime At Straight Rate6020000413110 500
-15,00015,000 15,00015,00014,404413120 Overtime At 1.5 Rate6020000 5,036
-1,500 1,5001,50000Overtime At Double Time Rate6020000413130 1,500
(100.0)%0 36,778000Ptr. Comp. Model6020000419996 0
(5.9) %1,299,0331,221,5191,221,519 1,262,255Personnel Services Total 2,066,2362,045,572
-300,000300,000 300,000300,363199,987421000 Professional Services6020000 152,631
-4,0004,000 4,0004,0002,102421001 Prof Services/Internal6020000 3,271
-1,5001,500 1,5001,5001,051422100 Telephone6020000 925
-10,00010,000 10,00010,0006,932422120 Telephone - Cellular6020000 7,695
-3,0003,000 3,0003,0002,299423200 Land and Building Rental6020000 2,299
(2.9) %4,0453,927 4,0453,9273,391423400 Motor Pool Equipment Rental6020000 3,087
-1,500 1,5001,5000800Vehicle Usage Reimb Employee6020000423500 1,500
-00 01576424220 All Other Equip Maint/Repair6020000 0
-0 001,743245Central Garage Charges6020000424230 0
-235,000235,000 235,000235,205258,298425100 Advertising Expense6020000 252,074
-10,00010,000 10,00010,0009,839425200 Periodicals & Dues6020000 4,860
-20,00020,000 20,00020,00016,492425400 General Office Expense6020000 19,236
CCReport Name: 2017_Mid_Cycle_Report
Report Description: Budget Book - Department Budget Detail wMD
06/07/2017Date:
Time: 378
Version:
Page:19:21:28

Department / Section: Public Utilities-Admin / Pub Util Adm-Marketing Service510 - 602000
Department Budget Detail
%Chnge16/17 vs 17/182017/182017/18
AmendedAdoptedAdopted2016/17
AmendedActualActual2016/172015/162014/15GL KeyObject Description
-2,5002,500 2,5002,5001,024425500 Postage6020000 535
-250 25025000Central Printing Charges6020000425600 250
-900900 90090088425610 Outside Printing Expense6020000 655
-5,0005,000 5,0005,0001,395425700 Software Purchase/Licensing6020000 882
-7,0007,000 7,0007,0008,602425800 Computer Equip Purc Undr $50006020000 3,064
-0 003000Work Boot Reimbursement6020000426710 0
-45,55145,551 45,55146,74646,143426800 Special Department Supplies6020000 63,404
-15,00015,000 15,00015,00015,958427100 Travel & Meeting Expense6020000 15,138
-3,0003,000 3,0003,000506427200 Training6020000 858
(1.7) %13,32513,096 13,32513,09627,267428400 Liability Insurance6020000 30,990
( .0) %681,571683,004681,224 681,571Non-personnel Expenses Total 603,503562,658
-24,13324,133 24,13324,13324,133450126 Chambers Of Commerce6020000 24,133
-250,000250,000 250,000253,409209,839456022 Commty Supprt Outrch/Educatn6020000 219,595
-274,133277,542274,133 274,133Special Projects Total 233,972243,728
-00 024,6758,274440210 State Operating Grants6900090 0
-0 020,00000State Operating Grants6900100440210 0
-0 0Operating Grants Total 044,6758,2740
-0 024,000021,610Automotive Equipment6020000462100 0
-0 0Equipment Outlay Total 024,000021,610
-0 010,00000Misc Agency Funding6900110440309 0
-0 0Capital Outlay & Grants Total 010,00000
52.6 %94,101143,630 143,630143,630187,758881100 General Fund Allocation Chgs6020000 189,728
-0 00042,795Utilization Chgs from 101 Fund6020000882101 0
(7.2) %206,736191,720 206,736191,720396,505882510 Utilization Chgs from 510 Fund6020000 451,324
11.4 %300,837335,350335,350 350,366Charges From Others Total 584,264683,848
(29.7) %(878,000)(617,000) (878,000)(617,000)(1,377,000)892520 Utilization Chgs to 520 Fund6020000 (1,214,000)
-0 000(210)Interfund Services to 101 Fund6020000894101 0
-0 00(33,515)(126,418)Interfund Services to 510 Fund6020000894510 0
-0 00(530)(476)Interfund Services to 511 Fund6020000894511 0
(29.7) %(878,000)(617,000)(617,000) (878,000)Charges to Others Total (1,411,046)(1,341,105)
12.9 %1,895,226 1,677,5741,690,3251,979,0912,085,2042,216,311Total Budget Requirements
CCReport Name: 2017_Mid_Cycle_Report
Report Description: Budget Book - Department Budget Detail wMD
06/07/2017Date:
Time: 379
Version:
Page:19:21:28
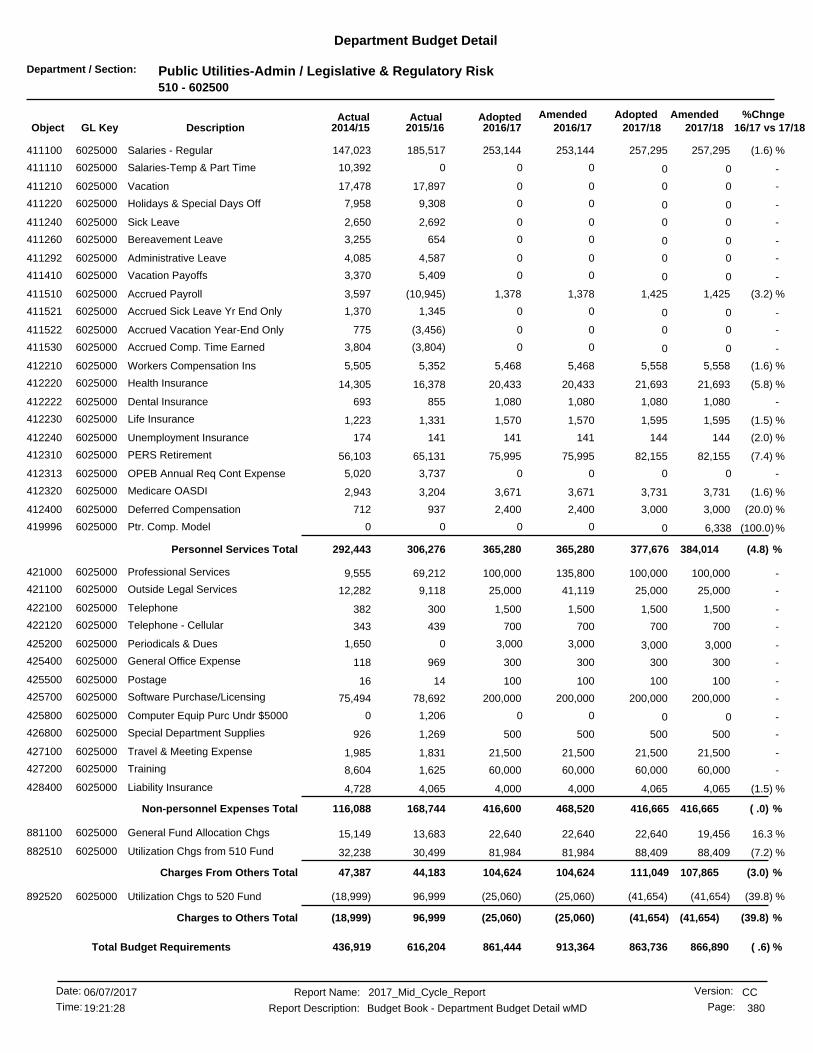
Department / Section: Public Utilities-Admin / Legislative & Regulatory Risk510 - 602500
Department Budget Detail
%Chnge16/17 vs 17/182017/182017/18
AmendedAdoptedAdopted2016/17
AmendedActualActual2016/172015/162014/15GL KeyObject Description
(1.6) %257,295253,144 257,295253,144185,517411100 Salaries - Regular6025000 147,023
-0 00010,392Salaries-Temp & Part Time6025000411110 0
-0 0017,89717,478Vacation6025000411210 0
-0 009,3087,958Holidays & Special Days Off6025000411220 0
-0 002,6922,650Sick Leave6025000411240 0
-0 006543,255Bereavement Leave6025000411260 0
-0 004,5874,085Administrative Leave6025000411292 0
-0 005,4093,370Vacation Payoffs6025000411410 0
(3.2) %1,4251,378 1,4251,378(10,945)411510 Accrued Payroll6025000 3,597
-0 001,3451,370Accrued Sick Leave Yr End Only6025000411521 0
-0 00(3,456)775Accrued Vacation Year-End Only6025000411522 0
-0 00(3,804)3,804Accrued Comp. Time Earned6025000411530 0
(1.6) %5,5585,468 5,5585,4685,352412210 Workers Compensation Ins6025000 5,505
(5.8) %21,69320,433 21,69320,43316,378412220 Health Insurance6025000 14,305
-1,0801,080 1,0801,080855412222 Dental Insurance6025000 693
(1.5) %1,5951,570 1,5951,5701,331412230 Life Insurance6025000 1,223
(2.0) %144141 144141141412240 Unemployment Insurance6025000 174
(7.4) %82,15575,995 82,15575,99565,131412310 PERS Retirement6025000 56,103
-0 003,7375,020OPEB Annual Req Cont Expense6025000412313 0
(1.6) %3,7313,671 3,7313,6713,204412320 Medicare OASDI6025000 2,943
(20.0) %3,0002,400 3,0002,400937412400 Deferred Compensation6025000 712
(100.0)%0 6,338000Ptr. Comp. Model6025000419996 0
(4.8) %384,014365,280365,280 377,676Personnel Services Total 306,276292,443
-100,000100,000 100,000135,80069,212421000 Professional Services6025000 9,555
-25,00025,000 25,00041,1199,118421100 Outside Legal Services6025000 12,282
-1,5001,500 1,5001,500300422100 Telephone6025000 382
-700700 700700439422120 Telephone - Cellular6025000 343
-3,000 3,0003,00001,650Periodicals & Dues6025000425200 3,000
-300300 300300969425400 General Office Expense6025000 118
-100100 10010014425500 Postage6025000 16
-200,000200,000 200,000200,00078,692425700 Software Purchase/Licensing6025000 75,494
-0 001,2060Computer Equip Purc Undr $50006025000425800 0
-500500 5005001,269426800 Special Department Supplies6025000 926
-21,50021,500 21,50021,5001,831427100 Travel & Meeting Expense6025000 1,985
-60,00060,000 60,00060,0001,625427200 Training6025000 8,604
(1.5) %4,0654,000 4,0654,0004,065428400 Liability Insurance6025000 4,728
( .0) %416,665468,520416,600 416,665Non-personnel Expenses Total 168,744116,088
16.3 %19,45622,640 22,64022,64013,683881100 General Fund Allocation Chgs6025000 15,149
(7.2) %88,40981,984 88,40981,98430,499882510 Utilization Chgs from 510 Fund6025000 32,238
(3.0) %107,865104,624104,624 111,049Charges From Others Total 44,18347,387
(39.8) %(41,654)(25,060) (41,654)(25,060)96,999892520 Utilization Chgs to 520 Fund6025000 (18,999)
(39.8) %(41,654)(25,060)(25,060) (41,654)Charges to Others Total 96,999(18,999)
( .6) %861,444 866,890863,736913,364616,204436,919Total Budget Requirements
CCReport Name: 2017_Mid_Cycle_Report
Report Description: Budget Book - Department Budget Detail wMD
06/07/2017Date:
Time: 380
Version:
Page:19:21:28
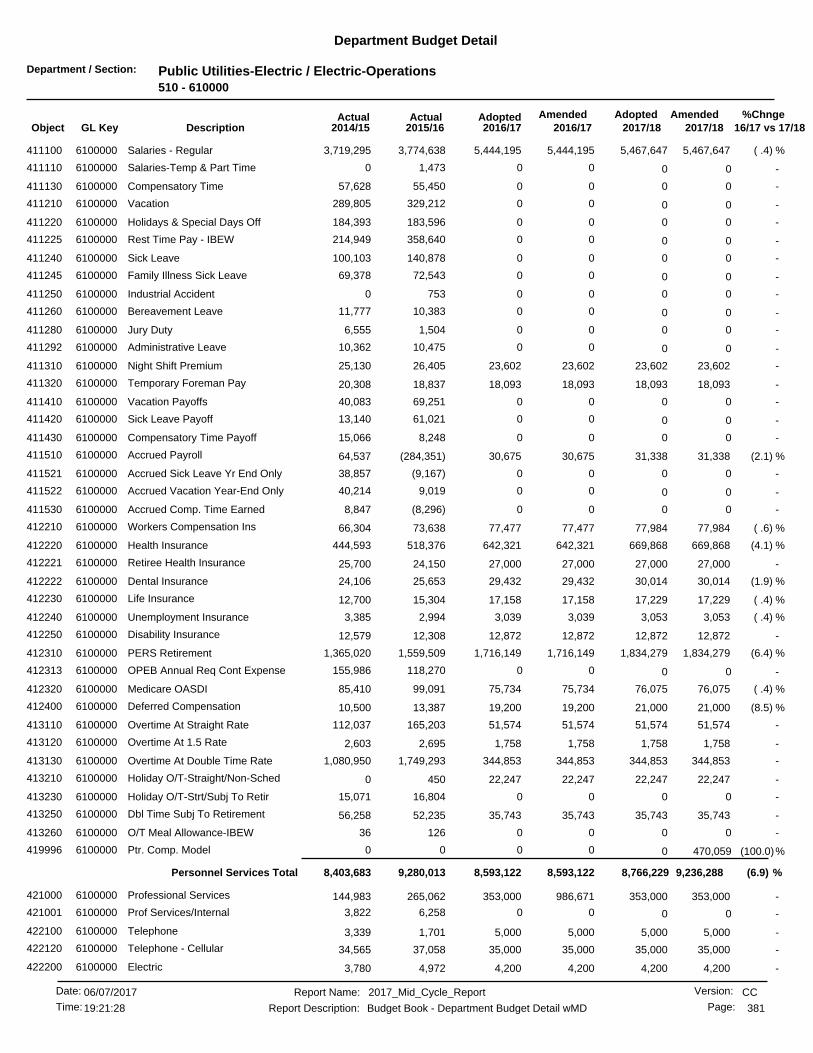
Department / Section: Public Utilities-Electric / Electric-Operations510 - 610000
Department Budget Detail
%Chnge16/17 vs 17/182017/182017/18
AmendedAdoptedAdopted2016/17
AmendedActualActual2016/172015/162014/15GL KeyObject Description
( .4) %5,467,6475,444,195 5,467,6475,444,1953,774,638411100 Salaries - Regular6100000 3,719,295
-0 001,4730Salaries-Temp & Part Time6100000411110 0
-0 0055,45057,628Compensatory Time6100000411130 0
-0 00329,212289,805Vacation6100000411210 0
-0 00183,596184,393Holidays & Special Days Off6100000411220 0
-0 00358,640214,949Rest Time Pay - IBEW6100000411225 0
-0 00140,878100,103Sick Leave6100000411240 0
-0 0072,54369,378Family Illness Sick Leave6100000411245 0
-0 007530Industrial Accident6100000411250 0
-0 0010,38311,777Bereavement Leave6100000411260 0
-0 001,5046,555Jury Duty6100000411280 0
-0 0010,47510,362Administrative Leave6100000411292 0
-23,60223,602 23,60223,60226,405411310 Night Shift Premium6100000 25,130
-18,09318,093 18,09318,09318,837411320 Temporary Foreman Pay6100000 20,308
-0 0069,25140,083Vacation Payoffs6100000411410 0
-0 0061,02113,140Sick Leave Payoff6100000411420 0
-0 008,24815,066Compensatory Time Payoff6100000411430 0
(2.1) %31,33830,675 31,33830,675(284,351)411510 Accrued Payroll6100000 64,537
-0 00(9,167)38,857Accrued Sick Leave Yr End Only6100000411521 0
-0 009,01940,214Accrued Vacation Year-End Only6100000411522 0
-0 00(8,296)8,847Accrued Comp. Time Earned6100000411530 0
( .6) %77,98477,477 77,98477,47773,638412210 Workers Compensation Ins6100000 66,304
(4.1) %669,868642,321 669,868642,321518,376412220 Health Insurance6100000 444,593
-27,00027,000 27,00027,00024,150412221 Retiree Health Insurance6100000 25,700
(1.9) %30,01429,432 30,01429,43225,653412222 Dental Insurance6100000 24,106
( .4) %17,22917,158 17,22917,15815,304412230 Life Insurance6100000 12,700
( .4) %3,0533,039 3,0533,0392,994412240 Unemployment Insurance6100000 3,385
-12,87212,872 12,87212,87212,308412250 Disability Insurance6100000 12,579
(6.4) %1,834,2791,716,149 1,834,2791,716,1491,559,509412310 PERS Retirement6100000 1,365,020
-0 00118,270155,986OPEB Annual Req Cont Expense6100000412313 0
( .4) %76,07575,734 76,07575,73499,091412320 Medicare OASDI6100000 85,410
(8.5) %21,00019,200 21,00019,20013,387412400 Deferred Compensation6100000 10,500
-51,57451,574 51,57451,574165,203413110 Overtime At Straight Rate6100000 112,037
-1,7581,758 1,7581,7582,695413120 Overtime At 1.5 Rate6100000 2,603
-344,853344,853 344,853344,8531,749,293413130 Overtime At Double Time Rate6100000 1,080,950
-22,24722,247 22,24722,247450413210 Holiday O/T-Straight/Non-Sched6100000 0
-0 0016,80415,071Holiday O/T-Strt/Subj To Retir6100000413230 0
-35,74335,743 35,74335,74352,235413250 Dbl Time Subj To Retirement6100000 56,258
-0 0012636O/T Meal Allowance-IBEW6100000413260 0
(100.0)%0 470,059000Ptr. Comp. Model6100000419996 0
(6.9) %9,236,2888,593,1228,593,122 8,766,229Personnel Services Total 9,280,0138,403,683
-353,000353,000 353,000986,671265,062421000 Professional Services6100000 144,983
-0 006,2583,822Prof Services/Internal6100000421001 0
-5,0005,000 5,0005,0001,701422100 Telephone6100000 3,339
-35,00035,000 35,00035,00037,058422120 Telephone - Cellular6100000 34,565
-4,2004,200 4,2004,2004,972422200 Electric6100000 3,780
CCReport Name: 2017_Mid_Cycle_Report
Report Description: Budget Book - Department Budget Detail wMD
06/07/2017Date:
Time: 381
Version:
Page:19:21:28

Department / Section: Public Utilities-Electric / Electric-Operations510 - 610000
Department Budget Detail
%Chnge16/17 vs 17/182017/182017/18
AmendedAdoptedAdopted2016/17
AmendedActualActual2016/172015/162014/15GL KeyObject Description
-14,10014,100 14,10014,1005,032422500 Water6100000 12,986
-2,2002,200 2,2002,2001,614422600 Other Utilities6100000 1,717
-0 006540Freight/Express & Cartage6100000423300 0
(2.9) %217,637211,298 217,637211,298224,686423400 Motor Pool Equipment Rental6100000 221,596
-70,00070,000 70,00071,160148,235424130 Maint/Repair of Bldgs & Improv6100000 43,014
(4.8) %176,230167,730 176,230232,873212,779424220 All Other Equip Maint/Repair6100000 146,101
(2.9) %14,66514,238 14,66514,23819,010424230 Central Garage Charges6100000 11,755
-9,0009,000 9,0009,0142,140424240 Central Communications Chg6100000 314
-0 070,00000Software Maintenance/Support6100000424310 0
-400400 400400340425200 Periodicals & Dues6100000 390
-25,00025,000 25,00026,42930,304425400 General Office Expense6100000 22,539
-1,5001,500 1,5001,500145425500 Postage6100000 1,500
-0 00765890Outside Printing Expense6100000425610 0
-8,0008,000 8,00038,39615,129425700 Software Purchase/Licensing6100000 3,040
17.0 %47,00055,000 47,00073,09236,513425800 Computer Equip Purc Undr $50006100000 25,305
-900900 900900542426100 Janitorial Supplies6100000 826
-34,45034,450 34,450103,15432,165426200 Clothing/Linen/Safety Supplies6100000 30,315
(2.9) %1,4711,428 1,4711,4282,939426300 Motor Fuels & Lubricants6100000 2,505
-36,90036,900 36,90071,9009,807426700 Maintenance Tools/Supplies6100000 5,083
4.3 %11,40011,900 11,40011,90011,000426710 Work Boot Reimbursement6100000 11,400
-5,0005,000 5,00015,0003,271426800 Special Department Supplies6100000 3,181
-7,1207,120 7,1207,1203,215427100 Travel & Meeting Expense6100000 2,800
-42,00042,000 42,00062,00037,955427200 Training6100000 25,591
( .4) %86,39286,021 86,39286,0216,651428400 Liability Insurance6100000 11,686
-140,279140,279 140,279140,27994,811428420 Insurance Charges - Direct6100000 79,662
-00 06,000654449100 Equipment Rental Charges6100000 (5,639)
( .5) %1,348,8442,301,2751,341,664 1,348,844Non-personnel Expenses Total 1,215,417849,061
-0 0029,0590Automotive Equipment6100000462100 0
-00 0202,952128,955462200 Machine and Equipment6100000 0
-0 0Equipment Outlay Total 0202,952158,0150
26.1 %242,232305,469 305,469305,469336,458881100 General Fund Allocation Chgs6100000 375,452
-127,407127,407 127,407127,407127,407882101 Utilization Chgs from 101 Fund6100000 0
(3.7) %311,246299,431 311,246299,431309,886882510 Utilization Chgs from 510 Fund6100000 440,308
-0 000127,407Interfund Services from 101 Fd6100000884101 0
7.5 %680,885732,307732,307 744,122Charges From Others Total 773,751943,168
19.9 %(1,016,495)(1,219,562) (1,016,495)(1,219,562)(967,999)892520 Utilization Chgs to 520 Fund6100000 (915,000)
-0 000(478)Interfund Services to 101 Fund6100000894101 0
-0 00(2,593)0Interfund Services to 432 Fund6100000894432 0
(2.4) %(1,533,000)(1,495,000) (1,533,000)(1,495,000)(1,587,164)894510 Interfund Services to 510 Fund6100000 (1,713,602)
-0 00(704)(1,746)Interfund Services to 520 Fund6100000894520 0
6.4 %(2,549,495)(2,714,562)(2,714,562) (2,549,495)Charges to Others Total (2,558,463)(2,630,827)
(8.7) %7,952,531 8,716,5228,309,7009,115,0958,868,7357,565,086Total Budget Requirements
CCReport Name: 2017_Mid_Cycle_Report
Report Description: Budget Book - Department Budget Detail wMD
06/07/2017Date:
Time: 382
Version:
Page:19:21:28

Department / Section: Public Utilities-Electric / PU Electric Field Operations510 - 610500
Department Budget Detail
%Chnge16/17 vs 17/182017/182017/18
AmendedAdoptedAdopted2016/17
AmendedActualActual2016/172015/162014/15GL KeyObject Description
( .6) %7,804,2527,754,524 7,804,2527,754,5244,990,255411100 Salaries - Regular6105000 4,917,314
(6.2)%124,800 133,120124,80002,984Salaries-Temp & Part Time6105000411110 133,120
-0 00139,688148,916Compensatory Time6105000411130 0
-0 00411,657377,479Vacation6105000411210 0
-0 00212,572250,557Holidays & Special Days Off6105000411220 0
-0 00219,346173,150Rest Time Pay - IBEW6105000411225 0
-0 004,0444,825Military Leave6105000411230 0
-0 00163,142220,156Sick Leave6105000411240 0
-0 00109,259109,612Family Illness Sick Leave6105000411245 0
-0 0069,98288,523Industrial Accident6105000411250 0
-0 0014,65612,357Bereavement Leave6105000411260 0
-0 003,6645,090Jury Duty6105000411280 0
-0 0010,6808,486Administrative Leave6105000411292 0
-17,26417,264 17,26417,26410,927411310 Night Shift Premium6105000 10,788
-11,08411,084 11,08411,08425,133411320 Temporary Foreman Pay6105000 10,917
-0 0029,32615,780Vacation Payoffs6105000411410 0
-0 0058,1514,800Sick Leave Payoff6105000411420 0
-0 0012,52021,698Compensatory Time Payoff6105000411430 0
(2.2) %44,92143,907 44,92143,907(336,538)411510 Accrued Payroll6105000 65,151
-0 00(119,573)(12,095)Accrued Sick Leave Yr End Only6105000411521 0
-0 00(49,133)42,194Accrued Vacation Year-End Only6105000411522 0
-0 002,07117,185Accrued Comp. Time Earned6105000411530 0
( .7) %171,444170,193 171,444170,193166,707412210 Workers Compensation Ins6105000 165,904
(3.6) %963,310927,863 963,310927,863694,384412220 Health Insurance6105000 636,272
-36,60036,600 36,60036,60029,100412221 Retiree Health Insurance6105000 29,150
(2.2) %44,93243,911 44,93243,91135,345412222 Dental Insurance6105000 34,451
( .4) %24,73924,621 24,73924,62121,089412230 Life Insurance6105000 19,962
( .9) %4,4394,399 4,4394,3994,387412240 Unemployment Insurance6105000 5,278
-16,15216,152 16,15216,15213,183412250 Disability Insurance6105000 12,520
(6.7) %2,506,7062,337,283 2,506,7062,337,2831,893,365412310 PERS Retirement6105000 1,774,461
-0 00158,428223,236OPEB Annual Req Cont Expense6105000412313 0
( .6) %109,210108,490 109,210108,490114,840412320 Medicare OASDI6105000 105,846
(6.2)%4,680 4,9924,680063City Retirement Plan6105000412330 4,992
(4.2) %42,00040,200 42,00040,20036,700412400 Deferred Compensation6105000 34,400
-800800 800800170,070413110 Overtime At Straight Rate6105000 136,654
-1,0061,006 1,0061,00625,009413120 Overtime At 1.5 Rate6105000 37,268
-600,000600,000 600,000600,0001,678,733413130 Overtime At Double Time Rate6105000 1,147,410
-1,9081,908 1,9081,9083,558413230 Holiday O/T-Strt/Subj To Retir6105000 8,418
-20,99120,991 20,99120,99120,437413250 Dbl Time Subj To Retirement6105000 26,106
-3,5003,500 3,5003,5004,932413260 O/T Meal Allowance-IBEW6105000 2,934
(100.0)%0 694,915000Ptr. Comp. Model6105000419996 0
(7.2) %13,258,28512,294,17612,294,176 12,563,370Personnel Services Total 11,052,10910,896,217
( .1) %2,278,2802,275,000 2,278,280371,499254,425421000 Professional Services6105000 360,557
-0 0049,04515,839Prof Services/Internal6105000421001 0
-2,710,5002,710,500 2,710,5002,372,8931,528,635421201 Line Clearance Contract6105000 1,466,538
-850850 8508501,260422100 Telephone6105000 1,101
CCReport Name: 2017_Mid_Cycle_Report
Report Description: Budget Book - Department Budget Detail wMD
06/07/2017Date:
Time: 383
Version:
Page:19:21:28

Department / Section: Public Utilities-Electric / PU Electric Field Operations510 - 610500
Department Budget Detail
%Chnge16/17 vs 17/182017/182017/18
AmendedAdoptedAdopted2016/17
AmendedActualActual2016/172015/162014/15GL KeyObject Description
-31,70031,700 31,70031,70023,746422120 Telephone - Cellular6105000 27,378
(10.7) %28,00025,000 28,00025,00020,127422700 Refuse/Disposal Fees6105000 15,997
-79,88079,880 79,88079,880133,130423100 Equipment Rental6105000 43,067
(8.9) %14,50013,200 14,50013,20012,809423200 Land and Building Rental6105000 12,831
(2.9) %477,593463,683 477,593463,683514,976423400 Motor Pool Equipment Rental6105000 540,963
-0 001,9188Constr & Maint Materials6105000424120 0
-1,125,0001,125,000 1,125,0001,125,000877,335424130 Maint/Repair of Bldgs & Improv6105000 710,104
2.0 %100,000102,000 100,000103,54192,255424220 All Other Equip Maint/Repair6105000 64,015
(2.9) %76,34874,125 76,34874,12569,644424230 Central Garage Charges6105000 63,587
(20.0) %5,0004,000 5,0004,0001,970425100 Advertising Expense6105000 0
-400400 400400396425200 Periodicals & Dues6105000 71
-50,00050,000 50,00051,30523,875425400 General Office Expense6105000 24,805
-500500 500500347425500 Postage6105000 6,241
(16.6) %3,0002,500 3,0002,500145425600 Central Printing Charges6105000 60
20.0%3,000 2,5003,00003,816Outside Printing Expense6105000425610 2,500
38.1%82,880 60,00082,88007,050Software Purchase/Licensing6105000425700 60,000
(33.3) %30,00020,000 30,00020,00010,634425800 Computer Equip Purc Undr $50006105000 28,573
(16.6) %600500 600500458426100 Janitorial Supplies6105000 113
-255,000255,000 255,000155,000126,425426200 Clothing/Linen/Safety Supplies6105000 100,512
(2.9) %42,57941,339 42,57941,33940,575426300 Motor Fuels & Lubricants6105000 48,931
-210,000210,000 210,000110,000219,704426700 Maintenance Tools/Supplies6105000 123,187
(7.4) %16,20015,000 16,20015,00013,550426710 Work Boot Reimbursement6105000 13,050
-30,00030,000 30,00030,00021,211426800 Special Department Supplies6105000 10,821
-0 00350Travel & Meeting Expense6105000427100 0
(3.0) %165,000160,000 165,00032,50048,668427200 Training6105000 60,669
( .7) %125,419124,498 125,419124,498126,603428400 Liability Insurance6105000 142,527
-0 002,449(43,061)Equipment Rental Charges6105000449100 0
( .2) %7,918,8495,334,7957,900,555 7,918,849Non-personnel Expenses Total 4,216,3643,849,362
-00 0156,71729,031462100 Automotive Equipment6105000 0
-00 0810,31094,860462200 Machine and Equipment6105000 64,114
-0 0000Off Furn & Eq/Computer Acqustn6105000462308 0
-0 0Equipment Outlay Total 0967,028123,89264,114
38.6 %301,461417,971 417,971417,971569,800881100 General Fund Allocation Chgs6105000 737,801
(2.1) %271,753265,840 271,753265,840252,474882101 Utilization Chgs from 101 Fund6105000 281,129
-0 0049,49755,215Utilization Chgs from 260 Fund6105000882260 0
(3.7) %113,734109,429 113,734109,429112,819882510 Utilization Chgs from 510 Fund6105000 160,378
15.4 %686,948793,240793,240 803,458Charges From Others Total 984,5911,234,526
-0 00(4,982)(708)Interfund Services to 101 Fund6105000894101 0
-0 000(1,959)Interfund Services to 230 Fund6105000894230 0
-0 000(1,962)Interfund Services to 430 Fund6105000894430 0
-0 00(1,826)0Interfund Services to 432 Fund6105000894432 0
-(2,922,000)(2,922,000) (2,922,000)(2,922,000)(3,224,567)894510 Interfund Services to 510 Fund6105000 (3,535,936)
-0 00(989)(2,756)Interfund Services to 520 Fund6105000894520 0
-(2,922,000)(2,922,000)(2,922,000) (2,922,000)Charges to Others Total (3,232,366)(3,543,323)
CCReport Name: 2017_Mid_Cycle_Report
Report Description: Budget Book - Department Budget Detail wMD
06/07/2017Date:
Time: 384
Version:
Page:19:21:28

Department / Section: Public Utilities-Electric / PU Electric Field Operations510 - 610500
Department Budget Detail
%Chnge16/17 vs 17/182017/182017/18
AmendedAdoptedAdopted2016/17
AmendedActualActual2016/172015/162014/15GL KeyObject Description
(4.6) %18,065,971 18,942,08218,363,67716,467,23913,144,59112,500,897Total Budget Requirements
CCReport Name: 2017_Mid_Cycle_Report
Report Description: Budget Book - Department Budget Detail wMD
06/07/2017Date:
Time: 385
Version:
Page:19:21:28

Department / Section: Public Utilities-Electric / Energy Deliv Engineering510 - 611000
Department Budget Detail
%Chnge16/17 vs 17/182017/182017/18
AmendedAdoptedAdopted2016/17
AmendedActualActual2016/172015/162014/15GL KeyObject Description
(1.6) %5,797,2795,701,392 5,797,2795,701,3924,370,606411100 Salaries - Regular6110000 2,528,229
(4.9) %33,28031,633 33,28031,63312,907411110 Salaries-Temp & Part Time6110000 16,467
-0 0010,8953,777Compensatory Time6110000411130 0
-0 00327,120187,827Vacation6110000411210 0
-0 00214,966129,401Holidays & Special Days Off6110000411220 0
-0 00200,655107,505Sick Leave6110000411240 0
-0 0054,11927,754Family Illness Sick Leave6110000411245 0
-0 004012,278Industrial Accident6110000411250 0
-0 006,319502Bereavement Leave6110000411260 0
-0 006,9321,561Jury Duty6110000411280 0
-0 0052,26822,907Administrative Leave6110000411292 0
-0 0038,3259,333Vacation Payoffs6110000411410 0
-0 002140Sick Leave Payoff6110000411420 0
(3.2) %33,09032,006 33,09032,006(231,158)411510 Accrued Payroll6110000 123,447
-0 0034,3499,170Accrued Sick Leave Yr End Only6110000411521 0
-0 0010,31910,567Accrued Vacation Year-End Only6110000411522 0
-0 00(27,725)15,736Accrued Comp. Time Earned6110000411530 0
(1.7) %127,351125,175 127,351125,175128,934412210 Workers Compensation Ins6110000 71,818
(4.3) %793,118758,696 793,118758,696622,440412220 Health Insurance6110000 308,854
( .6) %32,01231,804 32,01231,80428,961412222 Dental Insurance6110000 16,050
(1.6) %18,08217,782 18,08217,78215,192412230 Life Insurance6110000 9,426
(1.6) %3,2463,192 3,2463,1923,393412240 Unemployment Insurance6110000 2,284
-5,8485,848 5,8485,8485,575412250 Disability Insurance6110000 2,923
(7.7) %1,811,8361,671,161 1,811,8361,671,1611,362,280412310 PERS Retirement6110000 767,709
-0 00142,013108,362OPEB Annual Req Cont Expense6110000412313 0
(1.6) %82,62081,230 82,62081,23073,902412320 Medicare OASDI6110000 41,996
(4.9) %1,2481,186 1,2481,186484412330 City Retirement Plan6110000 617
(20.0) %34,50027,600 34,50027,60015,975412400 Deferred Compensation6110000 7,174
-0 00613112Overtime At Straight Rate6110000413110 0
-81,50081,500 81,50081,50027,028413120 Overtime At 1.5 Rate6110000 12,319
(100.0)%0 209,345000Ptr. Comp. Model6110000419996 0
(5.4) %9,064,3558,570,2058,570,205 8,855,010Personnel Services Total 7,508,3164,546,121
-27,00027,000 27,00086,920401,401421000 Professional Services6110000 383,857
-0 0018,030203,820Prof Services/Internal6110000421001 0
-7,0007,000 7,0007,0007,632422100 Telephone6110000 4,418
-13,00013,000 13,00013,00013,889422120 Telephone - Cellular6110000 6,342
(2.9) %51,57850,076 51,57850,07650,779423400 Motor Pool Equipment Rental6110000 12,819
-0 0010198Maint/Repair of Bldgs & Improv6110000424130 0
-18,00018,000 18,00018,1667,012424220 All Other Equip Maint/Repair6110000 5,974
-25 252500Central Garage Charges6110000424230 25
-0 001,405331Advertising Expense6110000425100 0
-4,0004,000 4,0004,0004,668425200 Periodicals & Dues6110000 4,541
-86,00086,000 86,00086,00064,478425400 General Office Expense6110000 33,859
-2,0002,000 2,0002,0001,614425500 Postage6110000 492
200.0 %1,0003,000 1,0003,000166425600 Central Printing Charges6110000 0
-0 00509581Outside Printing Expense6110000425610 0
CCReport Name: 2017_Mid_Cycle_Report
Report Description: Budget Book - Department Budget Detail wMD
06/07/2017Date:
Time: 386
Version:
Page:19:21:28

Department / Section: Public Utilities-Electric / Energy Deliv Engineering510 - 611000
Department Budget Detail
%Chnge16/17 vs 17/182017/182017/18
AmendedAdoptedAdopted2016/17
AmendedActualActual2016/172015/162014/15GL KeyObject Description
-69,00069,000 69,00069,92192,970425700 Software Purchase/Licensing6110000 45,794
-24,00024,000 24,00024,95219,873425800 Computer Equip Purc Undr $50006110000 16,005
-5,0005,000 5,0005,0004,405426200 Clothing/Linen/Safety Supplies6110000 4,581
(2.9)%299 30829900Motor Fuels & Lubricants6110000426300 308
-8,0008,000 8,0008,00013,693426800 Special Department Supplies6110000 5,643
-8,0008,000 8,0008,000815427100 Travel & Meeting Expense6110000 822
(2.3) %86,00084,000 86,00084,00093,074427200 Training6110000 50,442
(1.7) %93,06791,482 93,06791,48297,917428400 Liability Insurance6110000 61,698
( .6) %502,978561,842499,882 502,978Non-personnel Expenses Total 894,350842,228
-0 0000Office Furniture & Equipment6110000462300 0
-0 06,11500Computer System Upgrades6110000462305 0
-0 0Equipment Outlay Total 06,11500
56.6 %178,647279,769 279,769279,769788,474881100 General Fund Allocation Chgs6110000 373,198
(7.2) %1,181,6501,095,834 1,181,6501,095,8341,021,765882510 Utilization Chgs from 510 Fund6110000 612,513
1.1 %1,360,2971,375,6031,375,603 1,461,419Charges From Others Total 1,810,240985,711
-0 00(1,493)(310)Interfund Services to 101 Fund6110000894101 0
-0 000(109)Interfund Services to 230 Fund6110000894230 0
-0 00(608)(691)Interfund Services to 432 Fund6110000894432 0
-(3,017,000)(3,017,000) (3,017,000)(3,017,000)(2,552,388)894510 Interfund Services to 510 Fund6110000 (1,965,523)
-0 00(335)(299)Interfund Services to 520 Fund6110000894520 0
-(3,017,000)(3,017,000)(3,017,000) (3,017,000)Charges to Others Total (2,554,826)(1,966,935)
(6.0) %7,428,690 7,910,6307,802,4077,496,7657,658,0804,407,126Total Budget Requirements
CCReport Name: 2017_Mid_Cycle_Report
Report Description: Budget Book - Department Budget Detail wMD
06/07/2017Date:
Time: 387
Version:
Page:19:21:28

Department / Section: Public Utilities-Electric / Customer Engineering-GIS510 - 611500
Department Budget Detail
%Chnge16/17 vs 17/182017/182017/18
AmendedAdoptedAdopted2016/17
AmendedActualActual2016/172015/162014/15GL KeyObject Description
-0 0001,615,407Salaries - Regular6115000411100 0
-0 0001,704Compensatory Time6115000411130 0
-0 000103,774Vacation6115000411210 0
-0 00083,051Holidays & Special Days Off6115000411220 0
-0 00052,406Sick Leave6115000411240 0
-0 00021,854Family Illness Sick Leave6115000411245 0
-0 000214Industrial Accident6115000411250 0
-0 0006,435Bereavement Leave6115000411260 0
-0 0001,697Jury Duty6115000411280 0
-0 00014,609Administrative Leave6115000411292 0
-0 0002,564Vacation Payoffs6115000411410 0
-0 0008,495Sick Leave Payoff6115000411420 0
-0 000(53,896)Accrued Payroll6115000411510 0
-0 000(8,157)Accrued Sick Leave Yr End Only6115000411521 0
-0 00033,804Accrued Vacation Year-End Only6115000411522 0
-0 00011,892Accrued Comp. Time Earned6115000411530 0
-0 00052,410Workers Compensation Ins6115000412210 0
-0 000238,151Health Insurance6115000412220 0
-0 00012,230Dental Insurance6115000412222 0
-0 0004,797Life Insurance6115000412230 0
-0 0001,668Unemployment Insurance6115000412240 0
-0 0002,615Disability Insurance6115000412250 0
-0 000492,491PERS Retirement6115000412310 0
-0 00083,555OPEB Annual Req Cont Expense6115000412313 0
-0 00029,053Medicare OASDI6115000412320 0
-0 0002,775Deferred Compensation6115000412400 0
-0 00010,943Overtime At 1.5 Rate6115000413120 0
-0 0Personnel Services Total 0002,826,552
-0 0003,333Professional Services6115000421000 0
-0 0006,979Prof Services/Internal6115000421001 0
-0 0002,823Telephone6115000422100 0
-0 0005,857Telephone - Cellular6115000422120 0
-0 00044,076Motor Pool Equipment Rental6115000423400 0
-0 0006,461Maint/Repair of Bldgs & Improv6115000424130 0
-0 00013,777All Other Equip Maint/Repair6115000424220 0
-0 000115Periodicals & Dues6115000425200 0
-0 0001,020Photo & Recording Supplies6115000425300 0
-0 00027,245General Office Expense6115000425400 0
-0 0001,141Postage6115000425500 0
-0 0008,497Central Printing Charges6115000425600 0
-0 000657Outside Printing Expense6115000425610 0
-0 00018,463Software Purchase/Licensing6115000425700 0
-0 00011,556Computer Equip Purc Undr $50006115000425800 0
-0 000524Clothing/Linen/Safety Supplies6115000426200 0
-0 0004,140Special Department Supplies6115000426800 0
-0 0002,723Travel & Meeting Expense6115000427100 0
CCReport Name: 2017_Mid_Cycle_Report
Report Description: Budget Book - Department Budget Detail wMD
06/07/2017Date:
Time: 388
Version:
Page:19:21:28
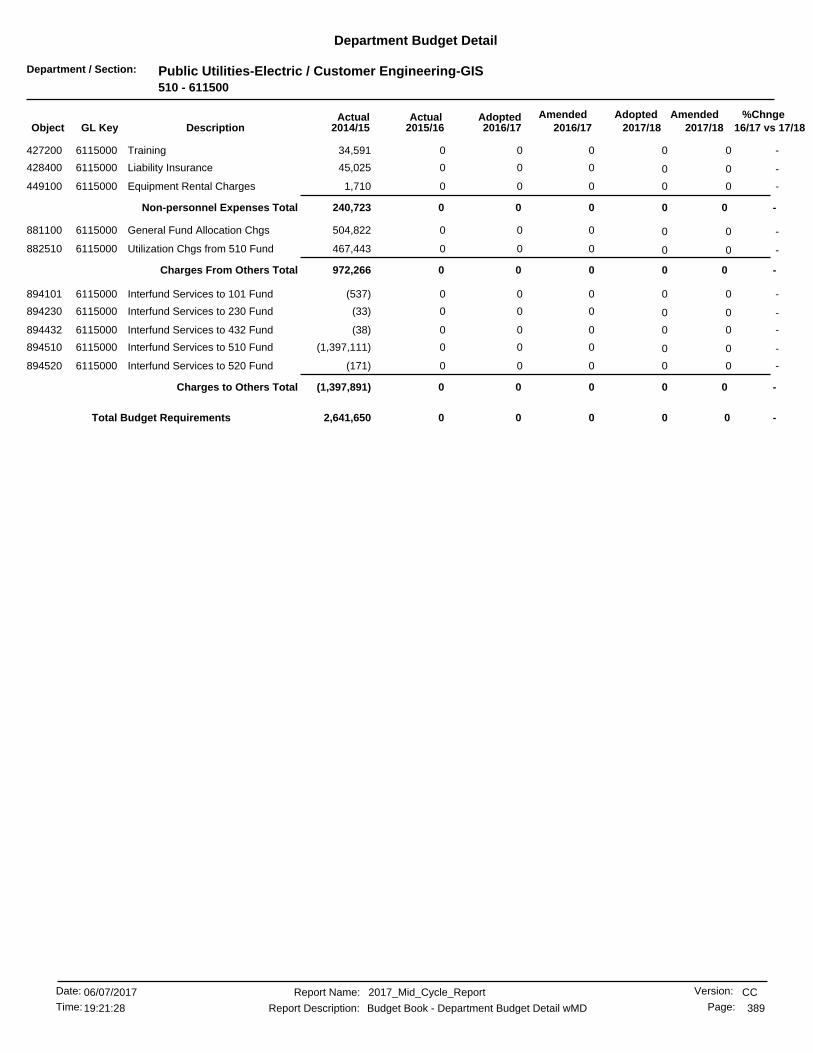
Department / Section: Public Utilities-Electric / Customer Engineering-GIS510 - 611500
Department Budget Detail
%Chnge16/17 vs 17/182017/182017/18
AmendedAdoptedAdopted2016/17
AmendedActualActual2016/172015/162014/15GL KeyObject Description
-0 00034,591Training6115000427200 0
-0 00045,025Liability Insurance6115000428400 0
-0 0001,710Equipment Rental Charges6115000449100 0
-0 0Non-personnel Expenses Total 000240,723
-0 000504,822General Fund Allocation Chgs6115000881100 0
-0 000467,443Utilization Chgs from 510 Fund6115000882510 0
-0 0Charges From Others Total 000972,266
-0 000(537)Interfund Services to 101 Fund6115000894101 0
-0 000(33)Interfund Services to 230 Fund6115000894230 0
-0 000(38)Interfund Services to 432 Fund6115000894432 0
-0 000(1,397,111)Interfund Services to 510 Fund6115000894510 0
-0 000(171)Interfund Services to 520 Fund6115000894520 0
-0 0Charges to Others Total 000(1,397,891)
-00 000Total Budget Requirements 2,641,650
CCReport Name: 2017_Mid_Cycle_Report
Report Description: Budget Book - Department Budget Detail wMD
06/07/2017Date:
Time: 389
Version:
Page:19:21:28

Department / Section: Public Utilities-Electric / PU Elec Power Supply Operation510 - 612000
Department Budget Detail
%Chnge16/17 vs 17/182017/182017/18
AmendedAdoptedAdopted2016/17
AmendedActualActual2016/172015/162014/15GL KeyObject Description
(1.8) %4,392,5854,312,270 4,392,5854,312,2703,637,753411100 Salaries - Regular6120000 3,299,600
(6.2)%31,200 33,28031,20000Salaries-Temp & Part Time6120000411110 33,280
-0 00279,414195,631Vacation6120000411210 0
-0 00162,151149,627Holidays & Special Days Off6120000411220 0
-0 0086,281102,517Sick Leave6120000411240 0
-0 0030,02630,728Family Illness Sick Leave6120000411245 0
-0 000708Industrial Accident6120000411250 0
-0 008,7804,463Bereavement Leave6120000411260 0
-0 001,7784,076Jury Duty6120000411280 0
-0 0051,66943,022Administrative Leave6120000411292 0
-7,6007,600 7,6007,60037,215411310 Night Shift Premium6120000 37,740
-2,8002,800 2,8002,80014411320 Temporary Foreman Pay6120000 0
-0 0048,30443,625Vacation Payoffs6120000411410 0
-0 0043,42951,896Sick Leave Payoff6120000411420 0
-0 000123Compensatory Time Payoff6120000411430 0
(3.5) %24,60823,743 24,60823,743(176,405)411510 Accrued Payroll6120000 5,229
-0 00(17,501)80,078Accrued Sick Leave Yr End Only6120000411521 0
-0 0029,16591,328Accrued Vacation Year-End Only6120000411522 0
-0 00(33,393)33,452Accrued Comp. Time Earned6120000411530 0
(1.8) %95,60193,815 95,60193,81585,467412210 Workers Compensation Ins6120000 91,056
(4.6) %380,866363,064 380,866363,064332,012412220 Health Insurance6120000 285,245
(1.1) %17,43217,224 17,43217,22417,425412222 Dental Insurance6120000 15,712
(1.8) %27,23226,739 27,23226,73924,858412230 Life Insurance6120000 21,318
(1.9) %2,4702,423 2,4702,4232,250412240 Unemployment Insurance6120000 2,896
-0 00141135Disability Insurance6120000412250 0
(7.7) %1,442,3461,330,067 1,442,3461,330,0671,254,693412310 PERS Retirement6120000 1,074,116
-0 0075,751100,079OPEB Annual Req Cont Expense6120000412313 0
(1.8) %61,68160,516 61,68160,51662,325412320 Medicare OASDI6120000 59,353
(6.2)%1,170 1,2481,17000City Retirement Plan6120000412330 1,248
(20.0) %54,00043,200 54,00043,20031,425412400 Deferred Compensation6120000 19,299
-0 002370Overtime At Straight Rate6120000413110 0
-21,00021,000 21,00021,00021,470413120 Overtime At 1.5 Rate6120000 26,226
-11,00011,000 11,00011,0002,934413130 Overtime At Double Time Rate6120000 2,361
-6,000 6,0006,00000Holiday O/T-Straight/Non-Sched6120000413210 6,000
-7,5007,500 7,5007,50011,000413230 Holiday O/T-Strt/Subj To Retir6120000 10,388
(100.0)%0 107,049000Ptr. Comp. Model6120000419996 0
(5.0) %6,696,2986,361,3316,361,331 6,589,249Personnel Services Total 6,110,6755,882,042
(1.3) %746,500736,283 746,500842,626466,480421000 Professional Services6120000 657,306
-00 0104,400(2,299)421001 Prof Services/Internal6120000 4,550
-550,000550,000 550,000762,071411,059421100 Outside Legal Services6120000 305,808
-59,60059,600 59,60059,60011,423421200 Regulatory/Market Compliance6120000 10,953
-50,00050,000 50,00050,00054,283422100 Telephone6120000 43,105
-11,80011,800 11,80011,8009,603422120 Telephone - Cellular6120000 9,955
-0 0011,4830Electric Transmission Charges6120000422912 0
(2.8) %2,2762,210 2,2762,2104,230423400 Motor Pool Equipment Rental6120000 4,067
-0 00710Maint/Repair of Bldgs & Improv6120000424130 0
CCReport Name: 2017_Mid_Cycle_Report
Report Description: Budget Book - Department Budget Detail wMD
06/07/2017Date:
Time: 390
Version:
Page:19:21:28
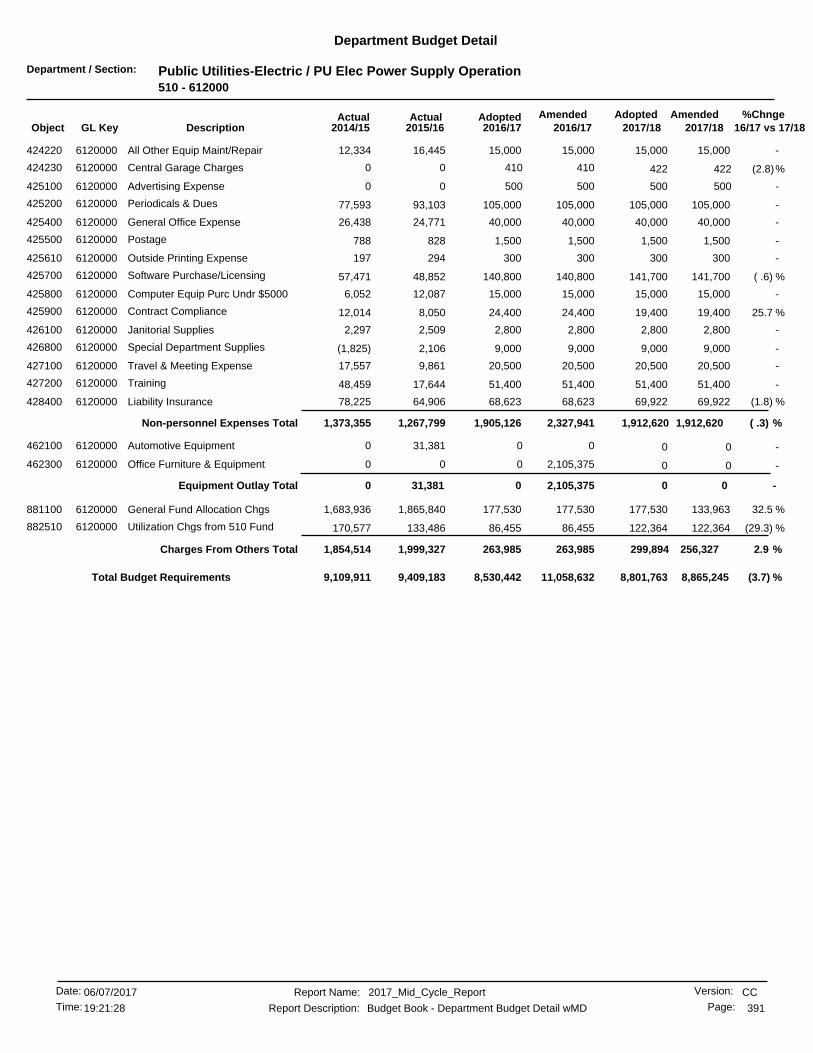
Department / Section: Public Utilities-Electric / PU Elec Power Supply Operation510 - 612000
Department Budget Detail
%Chnge16/17 vs 17/182017/182017/18
AmendedAdoptedAdopted2016/17
AmendedActualActual2016/172015/162014/15GL KeyObject Description
-15,00015,000 15,00015,00016,445424220 All Other Equip Maint/Repair6120000 12,334
(2.8)%410 42241000Central Garage Charges6120000424230 422
-500 50050000Advertising Expense6120000425100 500
-105,000105,000 105,000105,00093,103425200 Periodicals & Dues6120000 77,593
-40,00040,000 40,00040,00024,771425400 General Office Expense6120000 26,438
-1,5001,500 1,5001,500828425500 Postage6120000 788
-300300 300300294425610 Outside Printing Expense6120000 197
( .6) %141,700140,800 141,700140,80048,852425700 Software Purchase/Licensing6120000 57,471
-15,00015,000 15,00015,00012,087425800 Computer Equip Purc Undr $50006120000 6,052
25.7 %19,40024,400 19,40024,4008,050425900 Contract Compliance6120000 12,014
-2,8002,800 2,8002,8002,509426100 Janitorial Supplies6120000 2,297
-9,0009,000 9,0009,0002,106426800 Special Department Supplies6120000 (1,825)
-20,50020,500 20,50020,5009,861427100 Travel & Meeting Expense6120000 17,557
-51,40051,400 51,40051,40017,644427200 Training6120000 48,459
(1.8) %69,92268,623 69,92268,62364,906428400 Liability Insurance6120000 78,225
( .3) %1,912,6202,327,9411,905,126 1,912,620Non-personnel Expenses Total 1,267,7991,373,355
-0 0031,3810Automotive Equipment6120000462100 0
-0 02,105,37500Office Furniture & Equipment6120000462300 0
-0 0Equipment Outlay Total 02,105,37531,3810
32.5 %133,963177,530 177,530177,5301,865,840881100 General Fund Allocation Chgs6120000 1,683,936
(29.3) %122,36486,455 122,36486,455133,486882510 Utilization Chgs from 510 Fund6120000 170,577
2.9 %256,327263,985263,985 299,894Charges From Others Total 1,999,3271,854,514
(3.7) %8,530,442 8,865,2458,801,76311,058,6329,409,1839,109,911Total Budget Requirements
CCReport Name: 2017_Mid_Cycle_Report
Report Description: Budget Book - Department Budget Detail wMD
06/07/2017Date:
Time: 391
Version:
Page:19:21:28
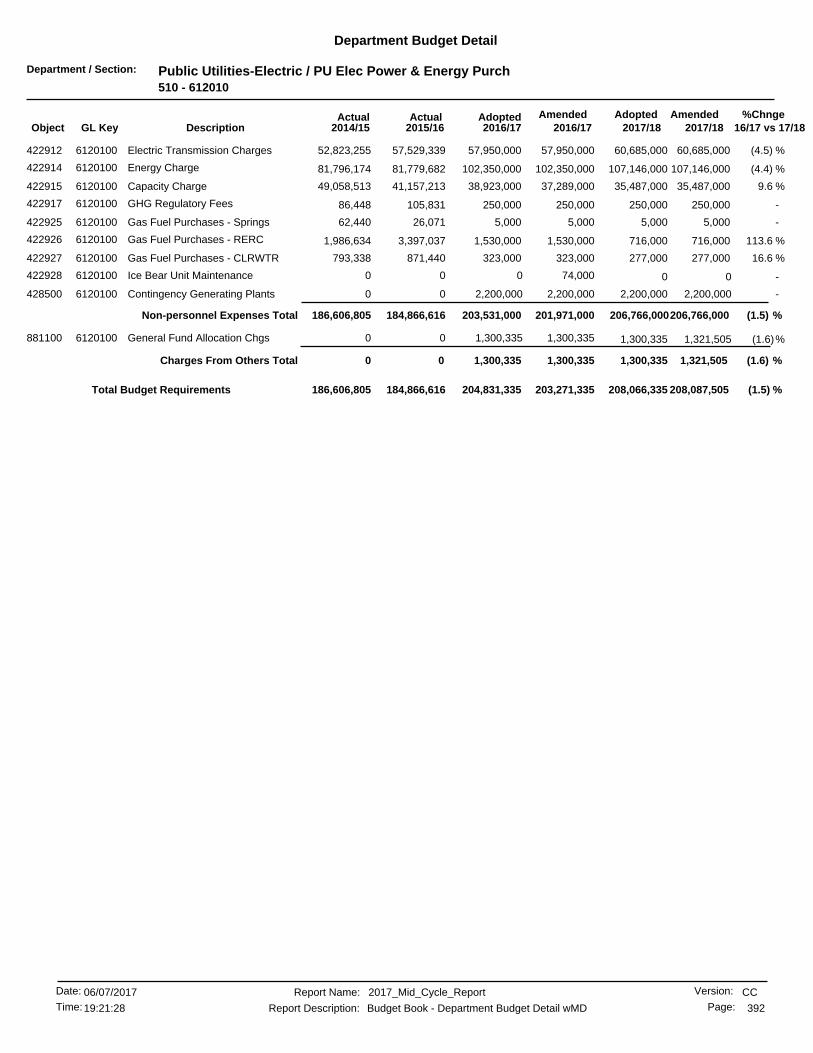
Department / Section: Public Utilities-Electric / PU Elec Power & Energy Purch510 - 612010
Department Budget Detail
%Chnge16/17 vs 17/182017/182017/18
AmendedAdoptedAdopted2016/17
AmendedActualActual2016/172015/162014/15GL KeyObject Description
(4.5) %60,685,00057,950,000 60,685,00057,950,00057,529,339422912 Electric Transmission Charges6120100 52,823,255
(4.4) %107,146,000102,350,000 107,146,000102,350,00081,779,682422914 Energy Charge6120100 81,796,174
9.6 %35,487,00038,923,000 35,487,00037,289,00041,157,213422915 Capacity Charge6120100 49,058,513
-250,000250,000 250,000250,000105,831422917 GHG Regulatory Fees6120100 86,448
-5,0005,000 5,0005,00026,071422925 Gas Fuel Purchases - Springs6120100 62,440
113.6 %716,0001,530,000 716,0001,530,0003,397,037422926 Gas Fuel Purchases - RERC6120100 1,986,634
16.6 %277,000323,000 277,000323,000871,440422927 Gas Fuel Purchases - CLRWTR6120100 793,338
-0 074,00000Ice Bear Unit Maintenance6120100422928 0
-2,200,000 2,200,0002,200,00000Contingency Generating Plants6120100428500 2,200,000
(1.5) %206,766,000201,971,000203,531,000 206,766,000Non-personnel Expenses Total 184,866,616186,606,805
(1.6)%1,300,335 1,321,5051,300,33500General Fund Allocation Chgs6120100881100 1,300,335
(1.6) %1,300,335 1,321,505Charges From Others Total 1,300,3351,300,33500
(1.5) %204,831,335 208,087,505208,066,335203,271,335184,866,616186,606,805Total Budget Requirements
CCReport Name: 2017_Mid_Cycle_Report
Report Description: Budget Book - Department Budget Detail wMD
06/07/2017Date:
Time: 392
Version:
Page:19:21:28
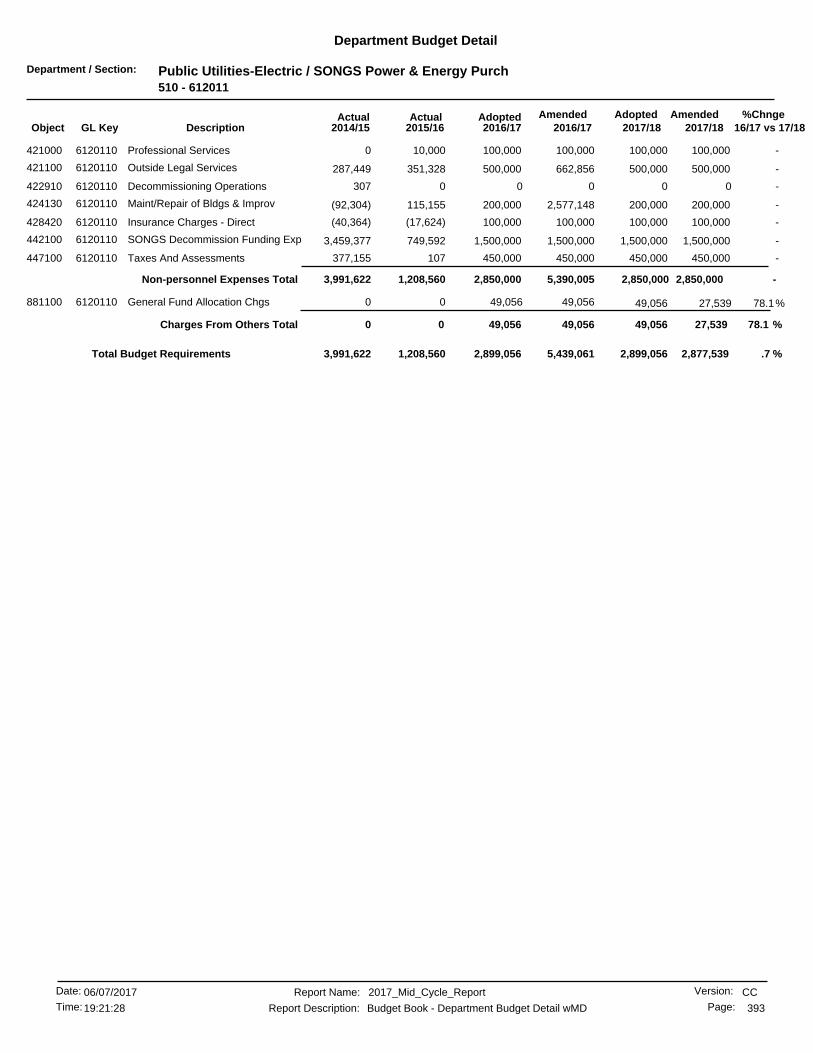
Department / Section: Public Utilities-Electric / SONGS Power & Energy Purch510 - 612011
Department Budget Detail
%Chnge16/17 vs 17/182017/182017/18
AmendedAdoptedAdopted2016/17
AmendedActualActual2016/172015/162014/15GL KeyObject Description
-100,000100,000 100,000100,00010,000421000 Professional Services6120110 0
-500,000500,000 500,000662,856351,328421100 Outside Legal Services6120110 287,449
-0 000307Decommissioning Operations6120110422910 0
-200,000200,000 200,0002,577,148115,155424130 Maint/Repair of Bldgs & Improv6120110 (92,304)
-100,000100,000 100,000100,000(17,624)428420 Insurance Charges - Direct6120110 (40,364)
-1,500,0001,500,000 1,500,0001,500,000749,592442100 SONGS Decommission Funding Exp6120110 3,459,377
-450,000450,000 450,000450,000107447100 Taxes And Assessments6120110 377,155
-2,850,0005,390,0052,850,000 2,850,000Non-personnel Expenses Total 1,208,5603,991,622
78.1%49,056 27,53949,05600General Fund Allocation Chgs6120110881100 49,056
78.1 %49,056 27,539Charges From Others Total 49,05649,05600
.7 %2,899,056 2,877,5392,899,0565,439,0611,208,5603,991,622Total Budget Requirements
CCReport Name: 2017_Mid_Cycle_Report
Report Description: Budget Book - Department Budget Detail wMD
06/07/2017Date:
Time: 393
Version:
Page:19:21:28
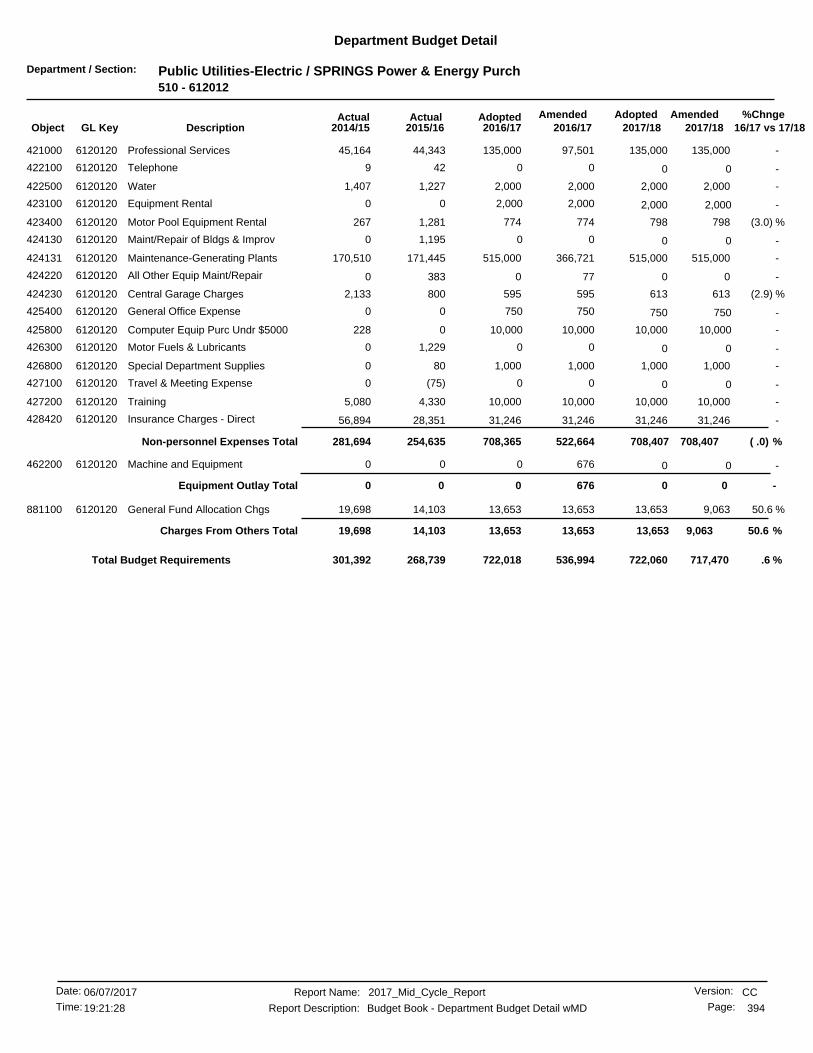
Department / Section: Public Utilities-Electric / SPRINGS Power & Energy Purch510 - 612012
Department Budget Detail
%Chnge16/17 vs 17/182017/182017/18
AmendedAdoptedAdopted2016/17
AmendedActualActual2016/172015/162014/15GL KeyObject Description
-135,000135,000 135,00097,50144,343421000 Professional Services6120120 45,164
-0 00429Telephone6120120422100 0
-2,0002,000 2,0002,0001,227422500 Water6120120 1,407
-2,000 2,0002,00000Equipment Rental6120120423100 2,000
(3.0) %798774 7987741,281423400 Motor Pool Equipment Rental6120120 267
-0 001,1950Maint/Repair of Bldgs & Improv6120120424130 0
-515,000515,000 515,000366,721171,445424131 Maintenance-Generating Plants6120120 170,510
-00 077383424220 All Other Equip Maint/Repair6120120 0
(2.9) %613595 613595800424230 Central Garage Charges6120120 2,133
-750 75075000General Office Expense6120120425400 750
-10,000 10,00010,0000228Computer Equip Purc Undr $50006120120425800 10,000
-0 001,2290Motor Fuels & Lubricants6120120426300 0
-1,0001,000 1,0001,00080426800 Special Department Supplies6120120 0
-0 00(75)0Travel & Meeting Expense6120120427100 0
-10,00010,000 10,00010,0004,330427200 Training6120120 5,080
-31,24631,246 31,24631,24628,351428420 Insurance Charges - Direct6120120 56,894
( .0) %708,407522,664708,365 708,407Non-personnel Expenses Total 254,635281,694
-0 067600Machine and Equipment6120120462200 0
-0 0Equipment Outlay Total 067600
50.6 %9,06313,653 13,65313,65314,103881100 General Fund Allocation Chgs6120120 19,698
50.6 %9,06313,65313,653 13,653Charges From Others Total 14,10319,698
.6 %722,018 717,470722,060536,994268,739301,392Total Budget Requirements
CCReport Name: 2017_Mid_Cycle_Report
Report Description: Budget Book - Department Budget Detail wMD
06/07/2017Date:
Time: 394
Version:
Page:19:21:28
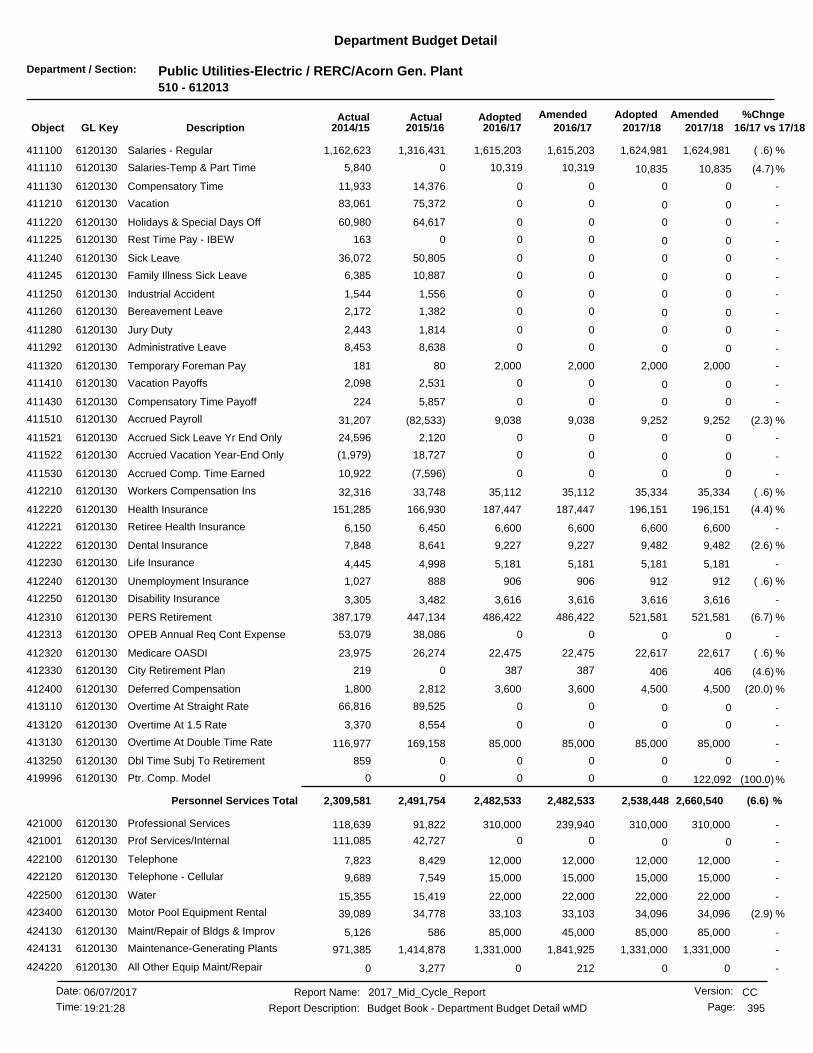
Department / Section: Public Utilities-Electric / RERC/Acorn Gen. Plant510 - 612013
Department Budget Detail
%Chnge16/17 vs 17/182017/182017/18
AmendedAdoptedAdopted2016/17
AmendedActualActual2016/172015/162014/15GL KeyObject Description
( .6) %1,624,9811,615,203 1,624,9811,615,2031,316,431411100 Salaries - Regular6120130 1,162,623
(4.7)%10,319 10,83510,31905,840Salaries-Temp & Part Time6120130411110 10,835
-0 0014,37611,933Compensatory Time6120130411130 0
-0 0075,37283,061Vacation6120130411210 0
-0 0064,61760,980Holidays & Special Days Off6120130411220 0
-0 000163Rest Time Pay - IBEW6120130411225 0
-0 0050,80536,072Sick Leave6120130411240 0
-0 0010,8876,385Family Illness Sick Leave6120130411245 0
-0 001,5561,544Industrial Accident6120130411250 0
-0 001,3822,172Bereavement Leave6120130411260 0
-0 001,8142,443Jury Duty6120130411280 0
-0 008,6388,453Administrative Leave6120130411292 0
-2,0002,000 2,0002,00080411320 Temporary Foreman Pay6120130 181
-0 002,5312,098Vacation Payoffs6120130411410 0
-0 005,857224Compensatory Time Payoff6120130411430 0
(2.3) %9,2529,038 9,2529,038(82,533)411510 Accrued Payroll6120130 31,207
-0 002,12024,596Accrued Sick Leave Yr End Only6120130411521 0
-0 0018,727(1,979)Accrued Vacation Year-End Only6120130411522 0
-0 00(7,596)10,922Accrued Comp. Time Earned6120130411530 0
( .6) %35,33435,112 35,33435,11233,748412210 Workers Compensation Ins6120130 32,316
(4.4) %196,151187,447 196,151187,447166,930412220 Health Insurance6120130 151,285
-6,6006,600 6,6006,6006,450412221 Retiree Health Insurance6120130 6,150
(2.6) %9,4829,227 9,4829,2278,641412222 Dental Insurance6120130 7,848
-5,1815,181 5,1815,1814,998412230 Life Insurance6120130 4,445
( .6) %912906 912906888412240 Unemployment Insurance6120130 1,027
-3,6163,616 3,6163,6163,482412250 Disability Insurance6120130 3,305
(6.7) %521,581486,422 521,581486,422447,134412310 PERS Retirement6120130 387,179
-0 0038,08653,079OPEB Annual Req Cont Expense6120130412313 0
( .6) %22,61722,475 22,61722,47526,274412320 Medicare OASDI6120130 23,975
(4.6)%387 4063870219City Retirement Plan6120130412330 406
(20.0) %4,5003,600 4,5003,6002,812412400 Deferred Compensation6120130 1,800
-0 0089,52566,816Overtime At Straight Rate6120130413110 0
-0 008,5543,370Overtime At 1.5 Rate6120130413120 0
-85,00085,000 85,00085,000169,158413130 Overtime At Double Time Rate6120130 116,977
-0 000859Dbl Time Subj To Retirement6120130413250 0
(100.0)%0 122,092000Ptr. Comp. Model6120130419996 0
(6.6) %2,660,5402,482,5332,482,533 2,538,448Personnel Services Total 2,491,7542,309,581
-310,000310,000 310,000239,94091,822421000 Professional Services6120130 118,639
-0 0042,727111,085Prof Services/Internal6120130421001 0
-12,00012,000 12,00012,0008,429422100 Telephone6120130 7,823
-15,00015,000 15,00015,0007,549422120 Telephone - Cellular6120130 9,689
-22,00022,000 22,00022,00015,419422500 Water6120130 15,355
(2.9) %34,09633,103 34,09633,10334,778423400 Motor Pool Equipment Rental6120130 39,089
-85,00085,000 85,00045,000586424130 Maint/Repair of Bldgs & Improv6120130 5,126
-1,331,0001,331,000 1,331,0001,841,9251,414,878424131 Maintenance-Generating Plants6120130 971,385
-00 02123,277424220 All Other Equip Maint/Repair6120130 0
CCReport Name: 2017_Mid_Cycle_Report
Report Description: Budget Book - Department Budget Detail wMD
06/07/2017Date:
Time: 395
Version:
Page:19:21:28

Department / Section: Public Utilities-Electric / RERC/Acorn Gen. Plant510 - 612013
Department Budget Detail
%Chnge16/17 vs 17/182017/182017/18
AmendedAdoptedAdopted2016/17
AmendedActualActual2016/172015/162014/15GL KeyObject Description
(2.9) %3,6203,515 3,6203,5155,124424230 Central Garage Charges6120130 5,336
-1,000 1,0001,00000Advertising Expense6120130425100 1,000
-0 0044264Periodicals & Dues6120130425200 0
-5,0005,000 5,0005,00012,769425400 General Office Expense6120130 16,443
-2,0002,000 2,0002,0001,376425500 Postage6120130 1,717
-0 0088231Outside Printing Expense6120130425610 0
-10,00010,000 10,00010,0002,119425800 Computer Equip Purc Undr $50006120130 14,750
-1,0001,000 1,0001,0001,395426100 Janitorial Supplies6120130 1,132
-17,00017,000 17,00017,00016,257426200 Clothing/Linen/Safety Supplies6120130 13,219
(2.7) %221215 2212151,659426300 Motor Fuels & Lubricants6120130 387
-2,000 2,0002,00001,115Maintenance Tools/Supplies6120130426700 2,000
-3,5003,500 3,5003,5002,773426710 Work Boot Reimbursement6120130 2,650
-4,5004,500 4,5004,500887426800 Special Department Supplies6120130 4,979
-0 00507871Travel & Meeting Expense6120130427100 0
-30,00030,000 30,00030,00021,684427200 Training6120130 26,433
( .6) %25,84625,683 25,84625,68325,629428400 Liability Insurance6120130 27,762
-109,356109,356 109,356109,35699,223428420 Insurance Charges - Direct6120130 199,085
( .0) %2,024,1392,423,9512,022,872 2,024,139Non-personnel Expenses Total 1,811,4091,594,373
-0 067900Machine and Equipment6120130462200 0
-0 0Equipment Outlay Total 067900
67.0 %92,896155,154 155,154155,154184,261881100 General Fund Allocation Chgs6120130 222,239
67.0 %92,896155,154155,154 155,154Charges From Others Total 184,261222,239
-0 00(23,622)0Interfund Services to 510 Fund6120130894510 0
-0 0Charges to Others Total 00(23,622)0
(2.4) %4,660,559 4,777,5754,717,7415,062,3174,463,8034,126,194Total Budget Requirements
CCReport Name: 2017_Mid_Cycle_Report
Report Description: Budget Book - Department Budget Detail wMD
06/07/2017Date:
Time: 396
Version:
Page:19:21:28
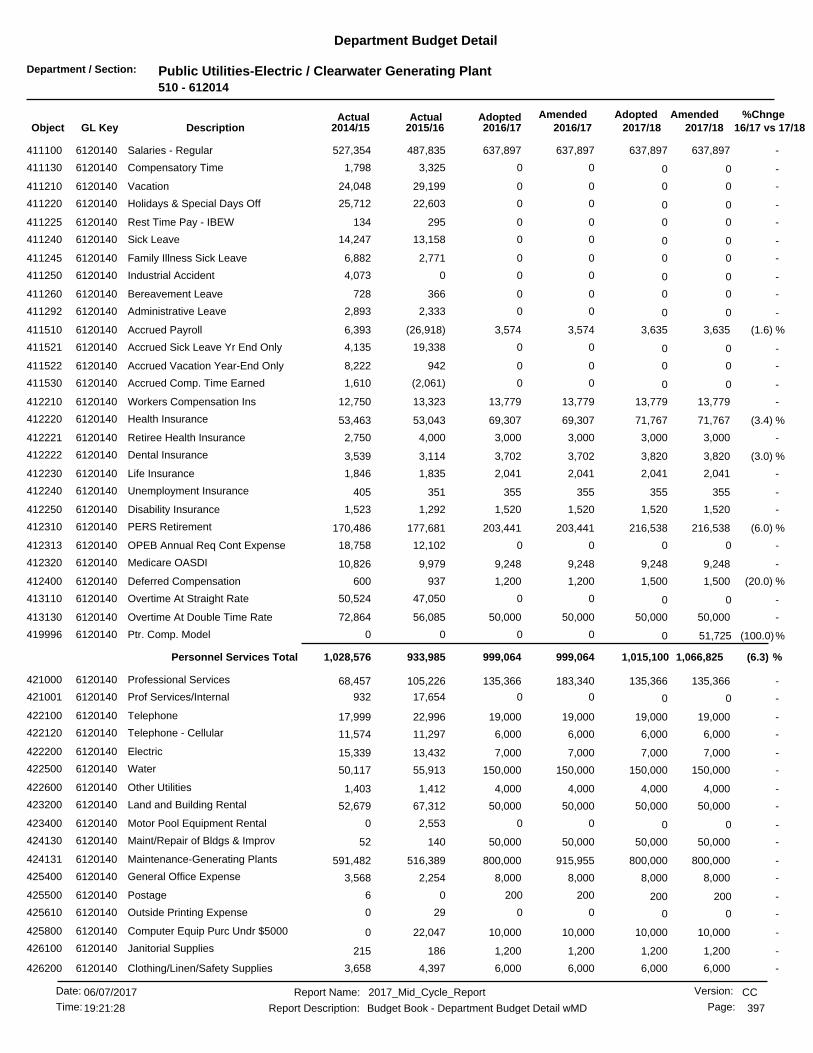
Department / Section: Public Utilities-Electric / Clearwater Generating Plant510 - 612014
Department Budget Detail
%Chnge16/17 vs 17/182017/182017/18
AmendedAdoptedAdopted2016/17
AmendedActualActual2016/172015/162014/15GL KeyObject Description
-637,897637,897 637,897637,897487,835411100 Salaries - Regular6120140 527,354
-0 003,3251,798Compensatory Time6120140411130 0
-0 0029,19924,048Vacation6120140411210 0
-0 0022,60325,712Holidays & Special Days Off6120140411220 0
-0 00295134Rest Time Pay - IBEW6120140411225 0
-0 0013,15814,247Sick Leave6120140411240 0
-0 002,7716,882Family Illness Sick Leave6120140411245 0
-0 0004,073Industrial Accident6120140411250 0
-0 00366728Bereavement Leave6120140411260 0
-0 002,3332,893Administrative Leave6120140411292 0
(1.6) %3,6353,574 3,6353,574(26,918)411510 Accrued Payroll6120140 6,393
-0 0019,3384,135Accrued Sick Leave Yr End Only6120140411521 0
-0 009428,222Accrued Vacation Year-End Only6120140411522 0
-0 00(2,061)1,610Accrued Comp. Time Earned6120140411530 0
-13,77913,779 13,77913,77913,323412210 Workers Compensation Ins6120140 12,750
(3.4) %71,76769,307 71,76769,30753,043412220 Health Insurance6120140 53,463
-3,0003,000 3,0003,0004,000412221 Retiree Health Insurance6120140 2,750
(3.0) %3,8203,702 3,8203,7023,114412222 Dental Insurance6120140 3,539
-2,0412,041 2,0412,0411,835412230 Life Insurance6120140 1,846
-355355 355355351412240 Unemployment Insurance6120140 405
-1,5201,520 1,5201,5201,292412250 Disability Insurance6120140 1,523
(6.0) %216,538203,441 216,538203,441177,681412310 PERS Retirement6120140 170,486
-0 0012,10218,758OPEB Annual Req Cont Expense6120140412313 0
-9,2489,248 9,2489,2489,979412320 Medicare OASDI6120140 10,826
(20.0) %1,5001,200 1,5001,200937412400 Deferred Compensation6120140 600
-0 0047,05050,524Overtime At Straight Rate6120140413110 0
-50,00050,000 50,00050,00056,085413130 Overtime At Double Time Rate6120140 72,864
(100.0)%0 51,725000Ptr. Comp. Model6120140419996 0
(6.3) %1,066,825999,064999,064 1,015,100Personnel Services Total 933,9851,028,576
-135,366135,366 135,366183,340105,226421000 Professional Services6120140 68,457
-0 0017,654932Prof Services/Internal6120140421001 0
-19,00019,000 19,00019,00022,996422100 Telephone6120140 17,999
-6,0006,000 6,0006,00011,297422120 Telephone - Cellular6120140 11,574
-7,0007,000 7,0007,00013,432422200 Electric6120140 15,339
-150,000150,000 150,000150,00055,913422500 Water6120140 50,117
-4,0004,000 4,0004,0001,412422600 Other Utilities6120140 1,403
-50,00050,000 50,00050,00067,312423200 Land and Building Rental6120140 52,679
-0 002,5530Motor Pool Equipment Rental6120140423400 0
-50,00050,000 50,00050,000140424130 Maint/Repair of Bldgs & Improv6120140 52
-800,000800,000 800,000915,955516,389424131 Maintenance-Generating Plants6120140 591,482
-8,0008,000 8,0008,0002,254425400 General Office Expense6120140 3,568
-200 20020006Postage6120140425500 200
-0 00290Outside Printing Expense6120140425610 0
-10,00010,000 10,00010,00022,047425800 Computer Equip Purc Undr $50006120140 0
-1,2001,200 1,2001,200186426100 Janitorial Supplies6120140 215
-6,0006,000 6,0006,0004,397426200 Clothing/Linen/Safety Supplies6120140 3,658
CCReport Name: 2017_Mid_Cycle_Report
Report Description: Budget Book - Department Budget Detail wMD
06/07/2017Date:
Time: 397
Version:
Page:19:21:28
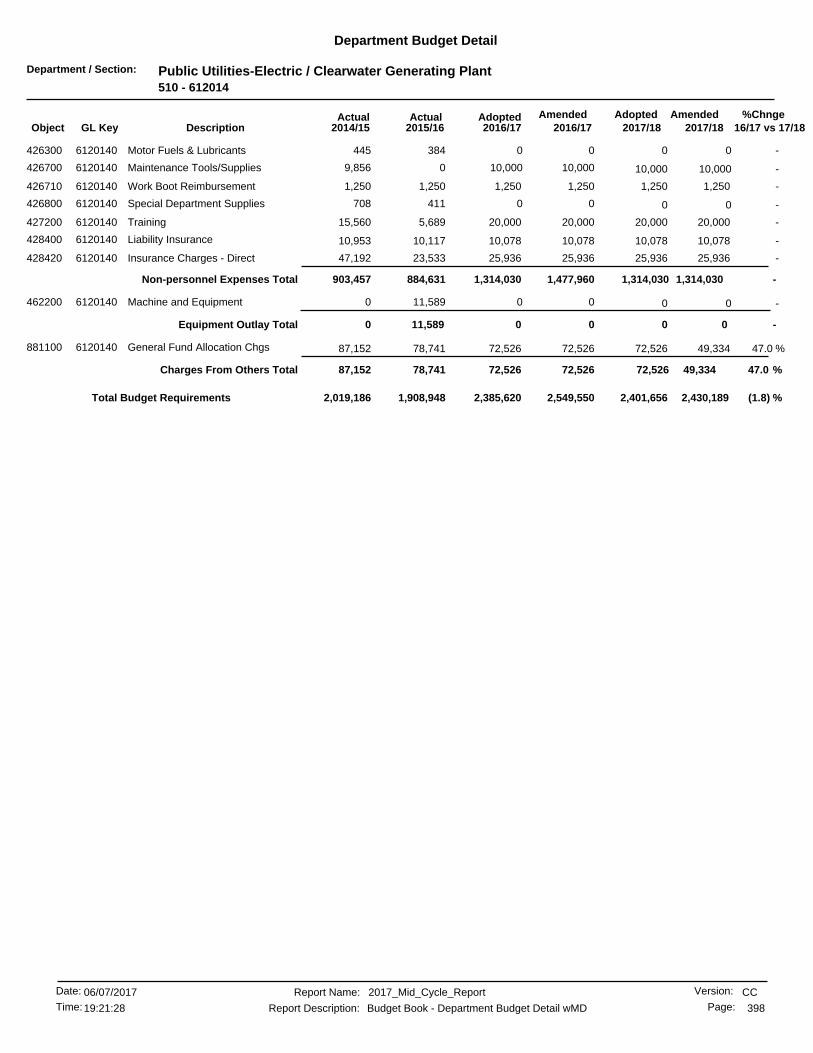
Department / Section: Public Utilities-Electric / Clearwater Generating Plant510 - 612014
Department Budget Detail
%Chnge16/17 vs 17/182017/182017/18
AmendedAdoptedAdopted2016/17
AmendedActualActual2016/172015/162014/15GL KeyObject Description
-0 00384445Motor Fuels & Lubricants6120140426300 0
-10,000 10,00010,00009,856Maintenance Tools/Supplies6120140426700 10,000
-1,2501,250 1,2501,2501,250426710 Work Boot Reimbursement6120140 1,250
-0 00411708Special Department Supplies6120140426800 0
-20,00020,000 20,00020,0005,689427200 Training6120140 15,560
-10,07810,078 10,07810,07810,117428400 Liability Insurance6120140 10,953
-25,93625,936 25,93625,93623,533428420 Insurance Charges - Direct6120140 47,192
-1,314,0301,477,9601,314,030 1,314,030Non-personnel Expenses Total 884,631903,457
-0 0011,5890Machine and Equipment6120140462200 0
-0 0Equipment Outlay Total 0011,5890
47.0 %49,33472,526 72,52672,52678,741881100 General Fund Allocation Chgs6120140 87,152
47.0 %49,33472,52672,526 72,526Charges From Others Total 78,74187,152
(1.8) %2,385,620 2,430,1892,401,6562,549,5501,908,9482,019,186Total Budget Requirements
CCReport Name: 2017_Mid_Cycle_Report
Report Description: Budget Book - Department Budget Detail wMD
06/07/2017Date:
Time: 398
Version:
Page:19:21:28

Department / Section: Public Utilities-Electric / PU Electric Revenue Bond510 - 612500
Department Budget Detail
%Chnge16/17 vs 17/182017/182017/18
AmendedAdoptedAdopted2016/17
AmendedActualActual2016/172015/162014/15GL KeyObject Description
(3.8) %14,590,00014,032,000 14,590,00014,032,00016,460,444481000 Principal6125000 15,484,712
(2.1) %809,000792,000 809,000792,000674,469481010 Capital Lease Principal6125000 0
2.1 %31,109,00031,765,000 31,109,00031,640,00029,027,261482000 Interest6125000 29,767,410
-0 00(1,674,705)(1,718,422)Capitalized Interest6125000482010 0
-(3,235,000)(3,235,000) (3,235,000)(3,235,000)(3,247,341)482020 Treasury Credit6125000 (3,235,153)
52.5 %291,000444,000 291,000444,000373,885485000 Amortization Cost of Issuance6125000 72,772
-50,00050,000 50,000175,00072,118487000 Debt Related Fiscal Charges6125000 62,190
.5 %43,614,00043,848,00043,848,000 43,614,000Debt Service Total 41,686,13340,433,509
31.7 %280,811370,078 370,078370,078429,186881100 General Fund Allocation Chgs6125000 362,107
31.7 %280,811370,078370,078 370,078Charges From Others Total 429,186362,107
1.4 %(1,530,373)(1,552,473) (1,530,373)(1,552,473)(224,499)892510 Utilization Chgs to 510 Fund6125000 (348,699)
-(137,918) (137,918)(137,918)00Utilization Chgs to 511 Fund6125000892511 (137,918)
3.3 %(544,048)(562,248) (544,048)(562,248)(184,899)892520 Utilization Chgs to 520 Fund6125000 (287,199)
-(27,059) (27,059)(27,059)00Utilization Chgs to 521 Fund6125000892521 (27,059)
1.7 %(2,239,398)(2,279,698)(2,279,698) (2,239,398)Charges to Others Total (409,399)(635,899)
.6 %41,938,380 41,655,41341,744,68041,938,38041,705,92040,159,717Total Budget Requirements
CCReport Name: 2017_Mid_Cycle_Report
Report Description: Budget Book - Department Budget Detail wMD
06/07/2017Date:
Time: 399
Version:
Page:19:21:28

Department / Section: Public Utilities-Electric / Electric-GFT510 - 612600
Department Budget Detail
%Chnge16/17 vs 17/182017/182017/18
AmendedAdoptedAdopted2016/17
AmendedActualActual2016/172015/162014/15GL KeyObject Description
(1.2) %40,114,20039,600,400 40,114,20039,229,90038,359,800990101 Operating Transfer to 101 Fund6126000 38,178,400
(1.2) %40,114,20039,229,90039,600,400 40,114,200Operating Transfers Out Total 38,359,80038,178,400
(1.2) %39,600,400 40,114,20040,114,20039,229,90038,359,80038,178,400Total Budget Requirements
CCReport Name: 2017_Mid_Cycle_Report
Report Description: Budget Book - Department Budget Detail wMD
06/07/2017Date:
Time: 400
Version:
Page:19:21:28
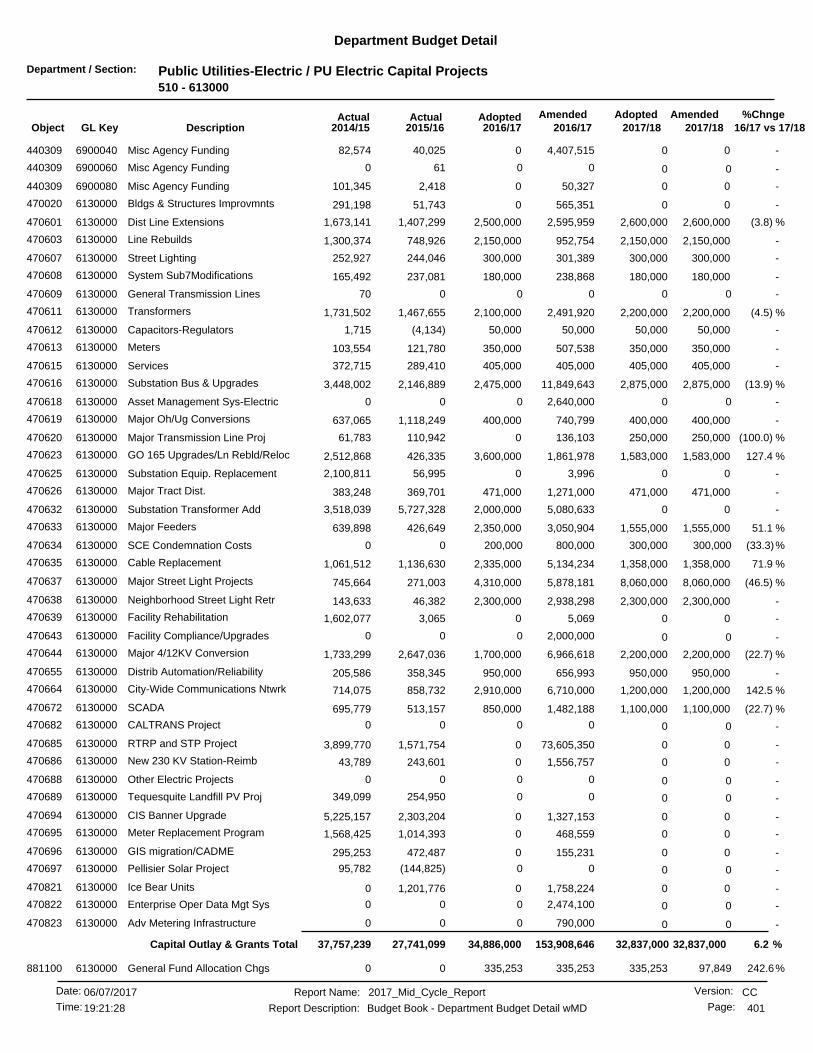
Department / Section: Public Utilities-Electric / PU Electric Capital Projects510 - 613000
Department Budget Detail
%Chnge16/17 vs 17/182017/182017/18
AmendedAdoptedAdopted2016/17
AmendedActualActual2016/172015/162014/15GL KeyObject Description
-00 04,407,51540,025440309 Misc Agency Funding6900040 82,574
-0 00610Misc Agency Funding6900060440309 0
-00 050,3272,418440309 Misc Agency Funding6900080 101,345
-00 0565,35151,743470020 Bldgs & Structures Improvmnts6130000 291,198
(3.8) %2,600,0002,500,000 2,600,0002,595,9591,407,299470601 Dist Line Extensions6130000 1,673,141
-2,150,0002,150,000 2,150,000952,754748,926470603 Line Rebuilds6130000 1,300,374
-300,000300,000 300,000301,389244,046470607 Street Lighting6130000 252,927
-180,000180,000 180,000238,868237,081470608 System Sub7Modifications6130000 165,492
-0 00070General Transmission Lines6130000470609 0
(4.5) %2,200,0002,100,000 2,200,0002,491,9201,467,655470611 Transformers6130000 1,731,502
-50,00050,000 50,00050,000(4,134)470612 Capacitors-Regulators6130000 1,715
-350,000350,000 350,000507,538121,780470613 Meters6130000 103,554
-405,000405,000 405,000405,000289,410470615 Services6130000 372,715
(13.9) %2,875,0002,475,000 2,875,00011,849,6432,146,889470616 Substation Bus & Upgrades6130000 3,448,002
-0 02,640,00000Asset Management Sys-Electric6130000470618 0
-400,000400,000 400,000740,7991,118,249470619 Major Oh/Ug Conversions6130000 637,065
(100.0) %250,0000 250,000136,103110,942470620 Major Transmission Line Proj6130000 61,783
127.4 %1,583,0003,600,000 1,583,0001,861,978426,335470623 GO 165 Upgrades/Ln Rebld/Reloc6130000 2,512,868
-00 03,99656,995470625 Substation Equip. Replacement6130000 2,100,811
-471,000471,000 471,0001,271,000369,701470626 Major Tract Dist.6130000 383,248
-02,000,000 05,080,6335,727,328470632 Substation Transformer Add6130000 3,518,039
51.1 %1,555,0002,350,000 1,555,0003,050,904426,649470633 Major Feeders6130000 639,898
(33.3)%200,000 300,000800,00000SCE Condemnation Costs6130000470634 300,000
71.9 %1,358,0002,335,000 1,358,0005,134,2341,136,630470635 Cable Replacement6130000 1,061,512
(46.5) %8,060,0004,310,000 8,060,0005,878,181271,003470637 Major Street Light Projects6130000 745,664
-2,300,0002,300,000 2,300,0002,938,29846,382470638 Neighborhood Street Light Retr6130000 143,633
-00 05,0693,065470639 Facility Rehabilitation6130000 1,602,077
-0 02,000,00000Facility Compliance/Upgrades6130000470643 0
(22.7) %2,200,0001,700,000 2,200,0006,966,6182,647,036470644 Major 4/12KV Conversion6130000 1,733,299
-950,000950,000 950,000656,993358,345470655 Distrib Automation/Reliability6130000 205,586
142.5 %1,200,0002,910,000 1,200,0006,710,000858,732470664 City-Wide Communications Ntwrk6130000 714,075
(22.7) %1,100,000850,000 1,100,0001,482,188513,157470672 SCADA6130000 695,779
-0 0000CALTRANS Project6130000470682 0
-00 073,605,3501,571,754470685 RTRP and STP Project6130000 3,899,770
-00 01,556,757243,601470686 New 230 KV Station-Reimb6130000 43,789
-0 0000Other Electric Projects6130000470688 0
-0 00254,950349,099Tequesquite Landfill PV Proj6130000470689 0
-00 01,327,1532,303,204470694 CIS Banner Upgrade6130000 5,225,157
-00 0468,5591,014,393470695 Meter Replacement Program6130000 1,568,425
-00 0155,231472,487470696 GIS migration/CADME6130000 295,253
-0 00(144,825)95,782Pellisier Solar Project6130000470697 0
-00 01,758,2241,201,776470821 Ice Bear Units6130000 0
-0 02,474,10000Enterprise Oper Data Mgt Sys6130000470822 0
-0 0790,00000Adv Metering Infrastructure6130000470823 0
6.2 %32,837,000153,908,64634,886,000 32,837,000Capital Outlay & Grants Total 27,741,09937,757,239
242.6%335,253 97,849335,25300General Fund Allocation Chgs6130000881100 335,253
CCReport Name: 2017_Mid_Cycle_Report
Report Description: Budget Book - Department Budget Detail wMD
06/07/2017Date:
Time: 401
Version:
Page:19:21:28
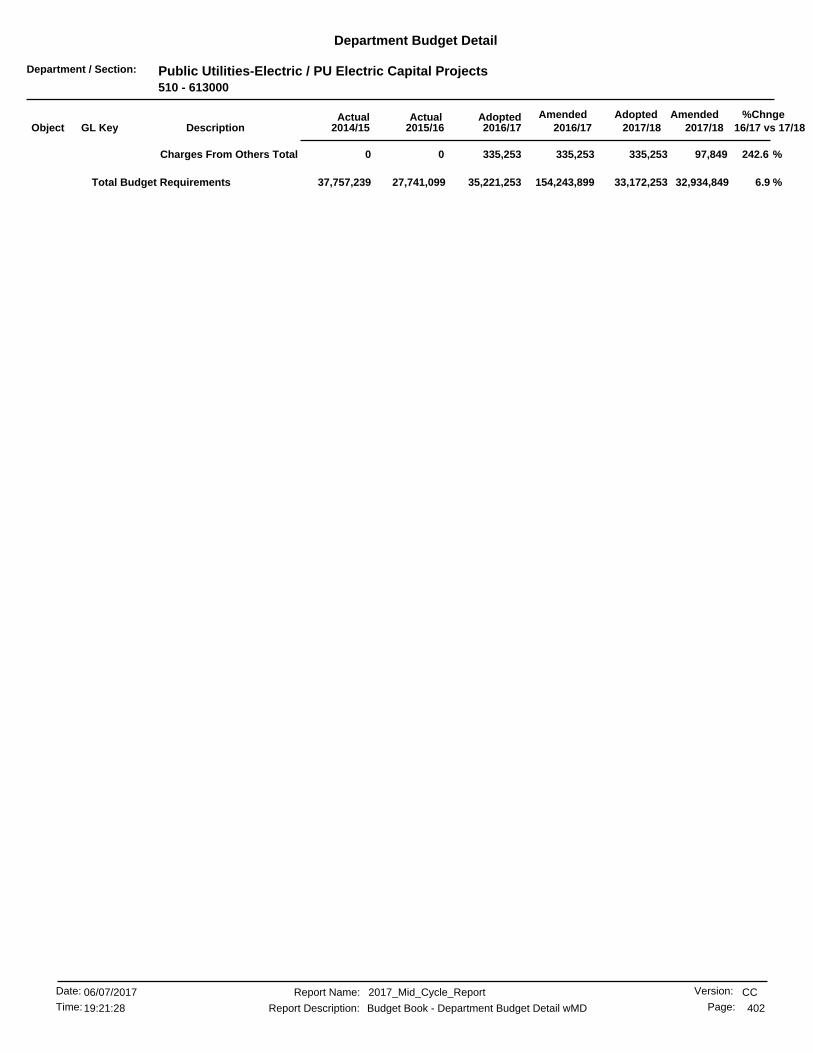
Department / Section: Public Utilities-Electric / PU Electric Capital Projects510 - 613000
Department Budget Detail
%Chnge16/17 vs 17/182017/182017/18
AmendedAdoptedAdopted2016/17
AmendedActualActual2016/172015/162014/15GL KeyObject Description
242.6 %335,253 97,849Charges From Others Total 335,253335,25300
6.9 %35,221,253 32,934,84933,172,253154,243,89927,741,09937,757,239Total Budget Requirements
CCReport Name: 2017_Mid_Cycle_Report
Report Description: Budget Book - Department Budget Detail wMD
06/07/2017Date:
Time: 402
Version:
Page:19:21:28
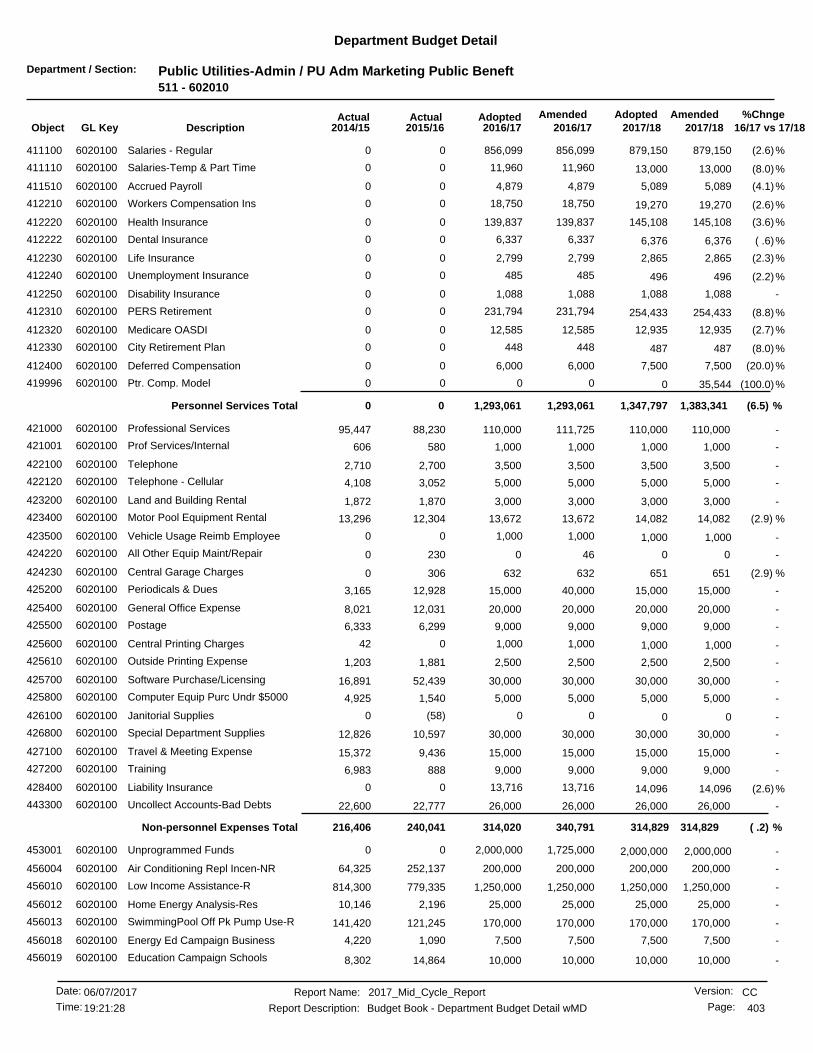
Department / Section: Public Utilities-Admin / PU Adm Marketing Public Beneft511 - 602010
Department Budget Detail
%Chnge16/17 vs 17/182017/182017/18
AmendedAdoptedAdopted2016/17
AmendedActualActual2016/172015/162014/15GL KeyObject Description
(2.6)%856,099 879,150856,09900Salaries - Regular6020100411100 879,150
(8.0)%11,960 13,00011,96000Salaries-Temp & Part Time6020100411110 13,000
(4.1)%4,879 5,0894,87900Accrued Payroll6020100411510 5,089
(2.6)%18,750 19,27018,75000Workers Compensation Ins6020100412210 19,270
(3.6)%139,837 145,108139,83700Health Insurance6020100412220 145,108
( .6)%6,337 6,3766,33700Dental Insurance6020100412222 6,376
(2.3)%2,799 2,8652,79900Life Insurance6020100412230 2,865
(2.2)%485 49648500Unemployment Insurance6020100412240 496
-1,088 1,0881,08800Disability Insurance6020100412250 1,088
(8.8)%231,794 254,433231,79400PERS Retirement6020100412310 254,433
(2.7)%12,585 12,93512,58500Medicare OASDI6020100412320 12,935
(8.0)%448 48744800City Retirement Plan6020100412330 487
(20.0)%6,000 7,5006,00000Deferred Compensation6020100412400 7,500
(100.0)%0 35,544000Ptr. Comp. Model6020100419996 0
(6.5) %1,293,061 1,383,341Personnel Services Total 1,347,7971,293,06100
-110,000110,000 110,000111,72588,230421000 Professional Services6020100 95,447
-1,0001,000 1,0001,000580421001 Prof Services/Internal6020100 606
-3,5003,500 3,5003,5002,700422100 Telephone6020100 2,710
-5,0005,000 5,0005,0003,052422120 Telephone - Cellular6020100 4,108
-3,0003,000 3,0003,0001,870423200 Land and Building Rental6020100 1,872
(2.9) %14,08213,672 14,08213,67212,304423400 Motor Pool Equipment Rental6020100 13,296
-1,000 1,0001,00000Vehicle Usage Reimb Employee6020100423500 1,000
-00 046230424220 All Other Equip Maint/Repair6020100 0
(2.9) %651632 651632306424230 Central Garage Charges6020100 0
-15,00015,000 15,00040,00012,928425200 Periodicals & Dues6020100 3,165
-20,00020,000 20,00020,00012,031425400 General Office Expense6020100 8,021
-9,0009,000 9,0009,0006,299425500 Postage6020100 6,333
-1,000 1,0001,000042Central Printing Charges6020100425600 1,000
-2,5002,500 2,5002,5001,881425610 Outside Printing Expense6020100 1,203
-30,00030,000 30,00030,00052,439425700 Software Purchase/Licensing6020100 16,891
-5,0005,000 5,0005,0001,540425800 Computer Equip Purc Undr $50006020100 4,925
-0 00(58)0Janitorial Supplies6020100426100 0
-30,00030,000 30,00030,00010,597426800 Special Department Supplies6020100 12,826
-15,00015,000 15,00015,0009,436427100 Travel & Meeting Expense6020100 15,372
-9,0009,000 9,0009,000888427200 Training6020100 6,983
(2.6)%13,716 14,09613,71600Liability Insurance6020100428400 14,096
-26,00026,000 26,00026,00022,777443300 Uncollect Accounts-Bad Debts6020100 22,600
( .2) %314,829340,791314,020 314,829Non-personnel Expenses Total 240,041216,406
-2,000,000 2,000,0001,725,00000Unprogrammed Funds6020100453001 2,000,000
-200,000200,000 200,000200,000252,137456004 Air Conditioning Repl Incen-NR6020100 64,325
-1,250,0001,250,000 1,250,0001,250,000779,335456010 Low Income Assistance-R6020100 814,300
-25,00025,000 25,00025,0002,196456012 Home Energy Analysis-Res6020100 10,146
-170,000170,000 170,000170,000121,245456013 SwimmingPool Off Pk Pump Use-R6020100 141,420
-7,5007,500 7,5007,5001,090456018 Energy Ed Campaign Business6020100 4,220
-10,00010,000 10,00010,00014,864456019 Education Campaign Schools6020100 8,302
CCReport Name: 2017_Mid_Cycle_Report
Report Description: Budget Book - Department Budget Detail wMD
06/07/2017Date:
Time: 403
Version:
Page:19:21:28

Department / Section: Public Utilities-Admin / PU Adm Marketing Public Beneft511 - 602010
Department Budget Detail
%Chnge16/17 vs 17/182017/182017/18
AmendedAdoptedAdopted2016/17
AmendedActualActual2016/172015/162014/15GL KeyObject Description
-250,000250,000 250,000250,000196,937456025 Air Conditioning Repl Incent-R6020100 138,225
-50,000 50,00095,00000EE Research & Demonstration6020100456026 50,000
-25,00025,000 25,00025,0004,986456028 Energy Mgmt Serv-Tech Asst-NR6020100 2,495
-300,000300,000 300,000300,000188,158456031 Incentive/Lighting Efficien-NR6020100 190,488
-150,000 150,000150,00000New Constr Efficiency Incen-NR6020100456033 150,000
-1,000 1,0001,0000300Shade Tree Cooling Efficien-NR6020100456035 1,000
-750,000750,000 750,000803,325357,655456038 Shade Tree Cooling Effic-R6020100 417,186
-2,000,0002,000,000 2,000,0003,241,356874,568456041 Photovoltaic Incentives-R6020100 1,422,827
-150,000150,000 150,000150,00085,137456042 Refrigerator Recycling-R6020100 125,250
-500,000500,000 500,000500,000211,397456045 Energy Star-R6020100 334,950
-100,000100,000 100,000100,00070,196456047 Weatherization Inc Rebate-R6020100 72,563
-200,000200,000 200,000200,00050,000456048 Energy Innovation Grant Prg-NR6020100 50,000
-100,000 100,000100,000017,500Custom Energy Tech Grant - NR6020100456049 100,000
-40,000 40,00040,00000Efficient Motors Inc-NR6020100456050 40,000
-50,00050,000 50,00050,00031,600456054 Energy Efficient Pool Pump Prg6020100 31,600
-5,0005,000 5,0005,0001,850456055 Energy Star - NR6020100 2,915
-30,00030,000 30,00030,00031,630456056 Auto Meter Reading - NR6020100 17,270
-500,000500,000 500,0002,415,792218,055456064 Photovoltaic Incentives-NR6020100 339,270
-250,000250,000 250,000250,0003,910456066 Performance Based Savings- NR6020100 161,310
-25,00025,000 25,00025,00019,218456075 Low-Inc Snr/Disab Rlblty Refnd6020100 21,370
-400,000400,000 400,000400,000252,458456078 Whole House Rebate6020100 341,015
-1,500,0001,500,000 1,500,0001,500,0001,640,206456080 Small Business Direct Install6020100 930,169
-400,000400,000 400,000400,000165,489456081 HID Lighting - NR6020100 394,520
-100,000100,000 100,000100,00058,537456082 Weatherization- NR6020100 78,238
-100,000100,000 100,000100,00050,166456083 Energy Savings Assistance Prog6020100 65,997
-00 074,0724,470456086 Affordable Solar Energy Riv6020100 0
-150,000150,000 150,000150,00096,343456091 Upstream HVAC Program6020100 98,540
-150,000150,000 150,000150,000192,286456092 Multi-Family Direct Install Pr6020100 152,684
-100,000100,000 100,000100,00013,250456094 Key Acct Energy Efficiency6020100 85,180
-300,000300,000 300,000300,000300,536456096 LED Buy Down Program6020100 0
-0 0250,00000Res-Elec Insight & Engagement6020100456097 0
-12,338,50015,643,04612,338,500 12,338,500Special Projects Total 6,289,9156,534,583
17.9 %183,459216,351 216,351216,351127,517881100 General Fund Allocation Chgs6020100 119,187
(6.7)%226,673 243,122226,67300Utilization Chgs from 510 Fund6020100882510 243,122
3.8 %426,581443,024443,024 459,473Charges From Others Total 127,517119,187
( .5) %14,388,605 14,463,25114,460,59917,719,9226,657,4746,870,176Total Budget Requirements
CCReport Name: 2017_Mid_Cycle_Report
Report Description: Budget Book - Department Budget Detail wMD
06/07/2017Date:
Time: 404
Version:
Page:19:21:28
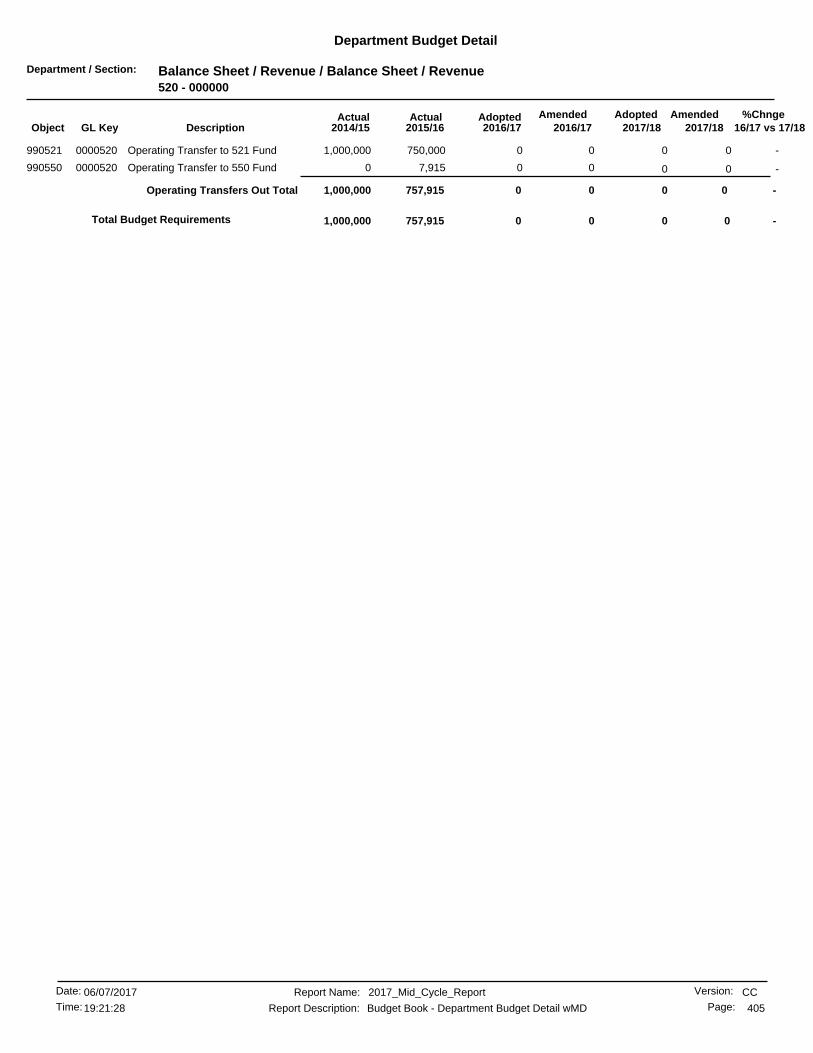
Department / Section: Balance Sheet / Revenue / Balance Sheet / Revenue520 - 000000
Department Budget Detail
%Chnge16/17 vs 17/182017/182017/18
AmendedAdoptedAdopted2016/17
AmendedActualActual2016/172015/162014/15GL KeyObject Description
-0 00750,0001,000,000Operating Transfer to 521 Fund0000520990521 0
-0 007,9150Operating Transfer to 550 Fund0000520990550 0
-0 0Operating Transfers Out Total 00757,9151,000,000
-00 00757,915Total Budget Requirements 1,000,000
CCReport Name: 2017_Mid_Cycle_Report
Report Description: Budget Book - Department Budget Detail wMD
06/07/2017Date:
Time: 405
Version:
Page:19:21:28
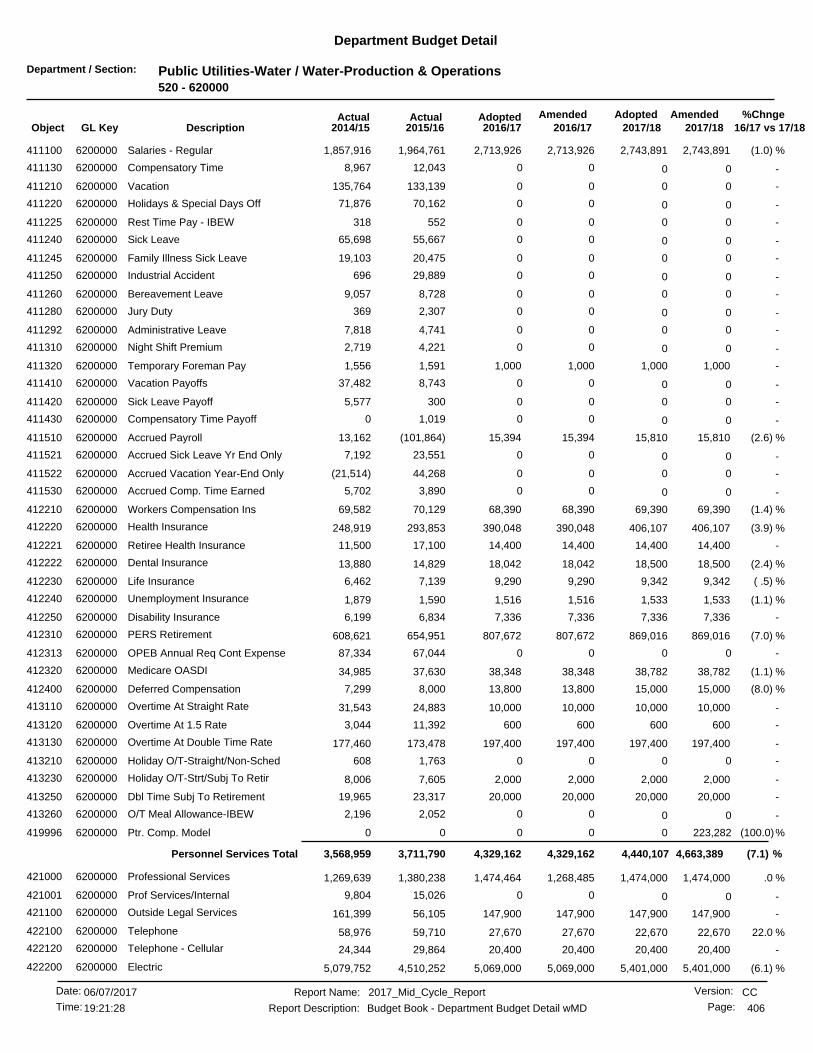
Department / Section: Public Utilities-Water / Water-Production & Operations520 - 620000
Department Budget Detail
%Chnge16/17 vs 17/182017/182017/18
AmendedAdoptedAdopted2016/17
AmendedActualActual2016/172015/162014/15GL KeyObject Description
(1.0) %2,743,8912,713,926 2,743,8912,713,9261,964,761411100 Salaries - Regular6200000 1,857,916
-0 0012,0438,967Compensatory Time6200000411130 0
-0 00133,139135,764Vacation6200000411210 0
-0 0070,16271,876Holidays & Special Days Off6200000411220 0
-0 00552318Rest Time Pay - IBEW6200000411225 0
-0 0055,66765,698Sick Leave6200000411240 0
-0 0020,47519,103Family Illness Sick Leave6200000411245 0
-0 0029,889696Industrial Accident6200000411250 0
-0 008,7289,057Bereavement Leave6200000411260 0
-0 002,307369Jury Duty6200000411280 0
-0 004,7417,818Administrative Leave6200000411292 0
-0 004,2212,719Night Shift Premium6200000411310 0
-1,0001,000 1,0001,0001,591411320 Temporary Foreman Pay6200000 1,556
-0 008,74337,482Vacation Payoffs6200000411410 0
-0 003005,577Sick Leave Payoff6200000411420 0
-0 001,0190Compensatory Time Payoff6200000411430 0
(2.6) %15,81015,394 15,81015,394(101,864)411510 Accrued Payroll6200000 13,162
-0 0023,5517,192Accrued Sick Leave Yr End Only6200000411521 0
-0 0044,268(21,514)Accrued Vacation Year-End Only6200000411522 0
-0 003,8905,702Accrued Comp. Time Earned6200000411530 0
(1.4) %69,39068,390 69,39068,39070,129412210 Workers Compensation Ins6200000 69,582
(3.9) %406,107390,048 406,107390,048293,853412220 Health Insurance6200000 248,919
-14,40014,400 14,40014,40017,100412221 Retiree Health Insurance6200000 11,500
(2.4) %18,50018,042 18,50018,04214,829412222 Dental Insurance6200000 13,880
( .5) %9,3429,290 9,3429,2907,139412230 Life Insurance6200000 6,462
(1.1) %1,5331,516 1,5331,5161,590412240 Unemployment Insurance6200000 1,879
-7,3367,336 7,3367,3366,834412250 Disability Insurance6200000 6,199
(7.0) %869,016807,672 869,016807,672654,951412310 PERS Retirement6200000 608,621
-0 0067,04487,334OPEB Annual Req Cont Expense6200000412313 0
(1.1) %38,78238,348 38,78238,34837,630412320 Medicare OASDI6200000 34,985
(8.0) %15,00013,800 15,00013,8008,000412400 Deferred Compensation6200000 7,299
-10,00010,000 10,00010,00024,883413110 Overtime At Straight Rate6200000 31,543
-600600 60060011,392413120 Overtime At 1.5 Rate6200000 3,044
-197,400197,400 197,400197,400173,478413130 Overtime At Double Time Rate6200000 177,460
-0 001,763608Holiday O/T-Straight/Non-Sched6200000413210 0
-2,0002,000 2,0002,0007,605413230 Holiday O/T-Strt/Subj To Retir6200000 8,006
-20,00020,000 20,00020,00023,317413250 Dbl Time Subj To Retirement6200000 19,965
-0 002,0522,196O/T Meal Allowance-IBEW6200000413260 0
(100.0)%0 223,282000Ptr. Comp. Model6200000419996 0
(7.1) %4,663,3894,329,1624,329,162 4,440,107Personnel Services Total 3,711,7903,568,959
.0 %1,474,0001,474,464 1,474,0001,268,4851,380,238421000 Professional Services6200000 1,269,639
-0 0015,0269,804Prof Services/Internal6200000421001 0
-147,900147,900 147,900147,90056,105421100 Outside Legal Services6200000 161,399
22.0 %22,67027,670 22,67027,67059,710422100 Telephone6200000 58,976
-20,40020,400 20,40020,40029,864422120 Telephone - Cellular6200000 24,344
(6.1) %5,401,0005,069,000 5,401,0005,069,0004,510,252422200 Electric6200000 5,079,752
CCReport Name: 2017_Mid_Cycle_Report
Report Description: Budget Book - Department Budget Detail wMD
06/07/2017Date:
Time: 406
Version:
Page:19:21:28

Department / Section: Public Utilities-Water / Water-Production & Operations520 - 620000
Department Budget Detail
%Chnge16/17 vs 17/182017/182017/18
AmendedAdoptedAdopted2016/17
AmendedActualActual2016/172015/162014/15GL KeyObject Description
-6,000 6,0006,00000Gas6200000422300 6,000
-11,40011,400 11,40011,40017,185422500 Water6200000 12,807
-90,00090,000 90,00090,0008,360422600 Other Utilities6200000 57,249
-50,000 050,00000Imported Water6200000422922 0
-03,640 03,6403,990422923 IW Capacity/Standby Charges6200000 3,707
-335,000335,000 335,000335,000353,422422924 Production Costs6200000 354,457
(2.9) %296,945288,296 296,945288,296275,581423400 Motor Pool Equipment Rental6200000 290,169
-581,000581,000 581,000589,936326,314424130 Maint/Repair of Bldgs & Improv6200000 459,879
-3,0003,000 3,0003,7834,650424220 All Other Equip Maint/Repair6200000 1,675
(2.9) %12,85812,483 12,85812,48311,671424230 Central Garage Charges6200000 17,220
-5,0005,000 5,0005,000271424240 Central Communications Chg6200000 3,934
-1,0001,000 1,0001,000776425100 Advertising Expense6200000 0
-35,00035,000 35,00035,00030,625425200 Periodicals & Dues6200000 26,272
-500 50050000Photo & Recording Supplies6200000425300 500
-25,00025,000 25,00025,92424,356425400 General Office Expense6200000 24,065
-5,0005,000 5,0005,0001,712425500 Postage6200000 639
-500 50050000Central Printing Charges6200000425600 500
-0 000921Outside Printing Expense6200000425610 0
66.6 %15,00025,000 15,00025,0001,033425700 Software Purchase/Licensing6200000 3,094
50.0 %20,00030,000 20,00030,00010,402425800 Computer Equip Purc Undr $50006200000 12,462
-0 000685Janitorial Supplies6200000426100 0
17.3 %12,08014,180 12,08014,18014,836426200 Clothing/Linen/Safety Supplies6200000 11,431
-0 002,0070Motor Fuels & Lubricants6200000426300 0
(6.6) %639,800597,000 639,800597,000163,934426600 Chemical Supplies6200000 568,547
-15,00015,000 15,00015,0005,379426700 Maintenance Tools/Supplies6200000 6,389
-6,0006,000 6,0006,0005,700426710 Work Boot Reimbursement6200000 5,350
-0 00010,359Special Department Supplies6200000426800 0
-15,00015,000 15,00015,0001,055427100 Travel & Meeting Expense6200000 8,927
-20,00020,000 20,00020,0008,382427200 Training6200000 5,573
(1.0) %57,34756,722 57,34756,72225,653428400 Liability Insurance6200000 34,006
-146,609146,609 146,609146,609107,918428420 Insurance Charges - Direct6200000 90,262
-1,771,8761,771,876 1,771,8761,771,8761,977,978447100 Taxes And Assessments6200000 1,667,384
-0 001,991160Equipment Rental Charges6200000449100 0
(2.7) %11,192,88510,694,30510,889,640 11,192,885Non-personnel Expenses Total 9,436,39210,281,552
-0 022,000014,239Machine and Equipment6200000462200 0
-0 00017,359Office Furniture & Equipment6200000462300 0
-0 0Equipment Outlay Total 022,000031,599
(20.7) %2,875,8912,279,882 2,279,8822,279,882784,315881100 General Fund Allocation Chgs6200000 457,137
-0 00010,068Utilization Chgs from 101 Fund6200000882101 0
(12.0) %1,001,073879,967 1,001,073879,9671,053,163882510 Utilization Chgs from 510 Fund6200000 906,792
(18.4) %3,876,9643,159,8493,159,849 3,280,955Charges From Others Total 1,837,4791,373,997
-0 00(3,903)(844)Interfund Services to 101 Fund6200000894101 0
-0 00(21,623)(12,756)Interfund Services to 510 Fund6200000894510 0
-(236,000)(236,000) (236,000)(236,000)(312,073)894520 Interfund Services to 520 Fund6200000 (227,613)
CCReport Name: 2017_Mid_Cycle_Report
Report Description: Budget Book - Department Budget Detail wMD
06/07/2017Date:
Time: 407
Version:
Page:19:21:28
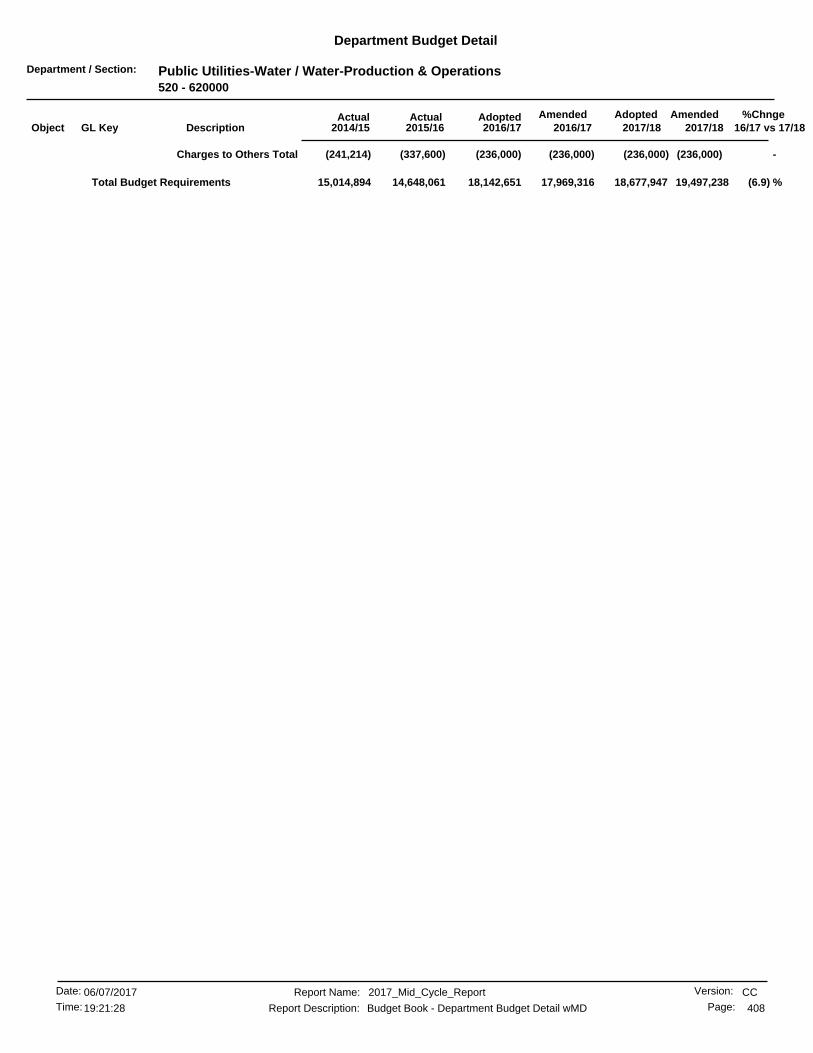
Department / Section: Public Utilities-Water / Water-Production & Operations520 - 620000
Department Budget Detail
%Chnge16/17 vs 17/182017/182017/18
AmendedAdoptedAdopted2016/17
AmendedActualActual2016/172015/162014/15GL KeyObject Description
-(236,000)(236,000)(236,000) (236,000)Charges to Others Total (337,600)(241,214)
(6.9) %18,142,651 19,497,23818,677,94717,969,31614,648,06115,014,894Total Budget Requirements
CCReport Name: 2017_Mid_Cycle_Report
Report Description: Budget Book - Department Budget Detail wMD
06/07/2017Date:
Time: 408
Version:
Page:19:21:28
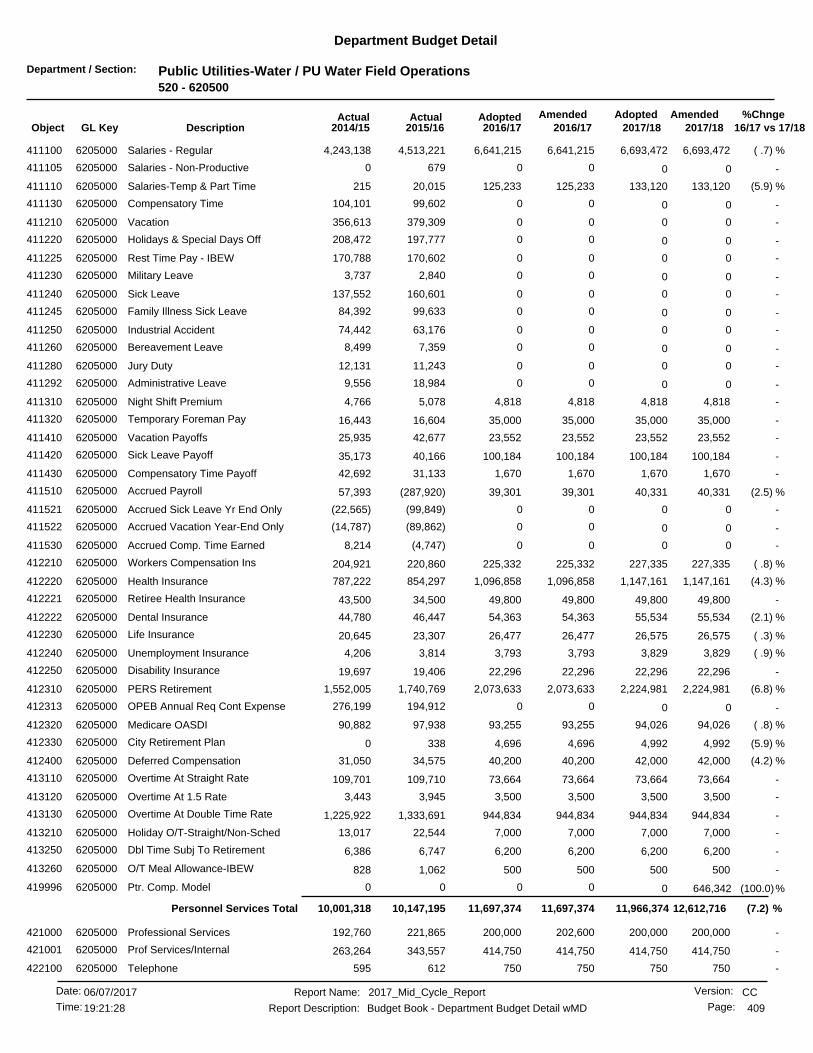
Department / Section: Public Utilities-Water / PU Water Field Operations520 - 620500
Department Budget Detail
%Chnge16/17 vs 17/182017/182017/18
AmendedAdoptedAdopted2016/17
AmendedActualActual2016/172015/162014/15GL KeyObject Description
( .7) %6,693,4726,641,215 6,693,4726,641,2154,513,221411100 Salaries - Regular6205000 4,243,138
-0 006790Salaries - Non-Productive6205000411105 0
(5.9) %133,120125,233 133,120125,23320,015411110 Salaries-Temp & Part Time6205000 215
-0 0099,602104,101Compensatory Time6205000411130 0
-0 00379,309356,613Vacation6205000411210 0
-0 00197,777208,472Holidays & Special Days Off6205000411220 0
-0 00170,602170,788Rest Time Pay - IBEW6205000411225 0
-0 002,8403,737Military Leave6205000411230 0
-0 00160,601137,552Sick Leave6205000411240 0
-0 0099,63384,392Family Illness Sick Leave6205000411245 0
-0 0063,17674,442Industrial Accident6205000411250 0
-0 007,3598,499Bereavement Leave6205000411260 0
-0 0011,24312,131Jury Duty6205000411280 0
-0 0018,9849,556Administrative Leave6205000411292 0
-4,8184,818 4,8184,8185,078411310 Night Shift Premium6205000 4,766
-35,00035,000 35,00035,00016,604411320 Temporary Foreman Pay6205000 16,443
-23,55223,552 23,55223,55242,677411410 Vacation Payoffs6205000 25,935
-100,184100,184 100,184100,18440,166411420 Sick Leave Payoff6205000 35,173
-1,6701,670 1,6701,67031,133411430 Compensatory Time Payoff6205000 42,692
(2.5) %40,33139,301 40,33139,301(287,920)411510 Accrued Payroll6205000 57,393
-0 00(99,849)(22,565)Accrued Sick Leave Yr End Only6205000411521 0
-0 00(89,862)(14,787)Accrued Vacation Year-End Only6205000411522 0
-0 00(4,747)8,214Accrued Comp. Time Earned6205000411530 0
( .8) %227,335225,332 227,335225,332220,860412210 Workers Compensation Ins6205000 204,921
(4.3) %1,147,1611,096,858 1,147,1611,096,858854,297412220 Health Insurance6205000 787,222
-49,80049,800 49,80049,80034,500412221 Retiree Health Insurance6205000 43,500
(2.1) %55,53454,363 55,53454,36346,447412222 Dental Insurance6205000 44,780
( .3) %26,57526,477 26,57526,47723,307412230 Life Insurance6205000 20,645
( .9) %3,8293,793 3,8293,7933,814412240 Unemployment Insurance6205000 4,206
-22,29622,296 22,29622,29619,406412250 Disability Insurance6205000 19,697
(6.8) %2,224,9812,073,633 2,224,9812,073,6331,740,769412310 PERS Retirement6205000 1,552,005
-0 00194,912276,199OPEB Annual Req Cont Expense6205000412313 0
( .8) %94,02693,255 94,02693,25597,938412320 Medicare OASDI6205000 90,882
(5.9) %4,9924,696 4,9924,696338412330 City Retirement Plan6205000 0
(4.2) %42,00040,200 42,00040,20034,575412400 Deferred Compensation6205000 31,050
-73,66473,664 73,66473,664109,710413110 Overtime At Straight Rate6205000 109,701
-3,5003,500 3,5003,5003,945413120 Overtime At 1.5 Rate6205000 3,443
-944,834944,834 944,834944,8341,333,691413130 Overtime At Double Time Rate6205000 1,225,922
-7,0007,000 7,0007,00022,544413210 Holiday O/T-Straight/Non-Sched6205000 13,017
-6,2006,200 6,2006,2006,747413250 Dbl Time Subj To Retirement6205000 6,386
-500500 5005001,062413260 O/T Meal Allowance-IBEW6205000 828
(100.0)%0 646,342000Ptr. Comp. Model6205000419996 0
(7.2) %12,612,71611,697,37411,697,374 11,966,374Personnel Services Total 10,147,19510,001,318
-200,000200,000 200,000202,600221,865421000 Professional Services6205000 192,760
-414,750414,750 414,750414,750343,557421001 Prof Services/Internal6205000 263,264
-750750 750750612422100 Telephone6205000 595
CCReport Name: 2017_Mid_Cycle_Report
Report Description: Budget Book - Department Budget Detail wMD
06/07/2017Date:
Time: 409
Version:
Page:19:21:28
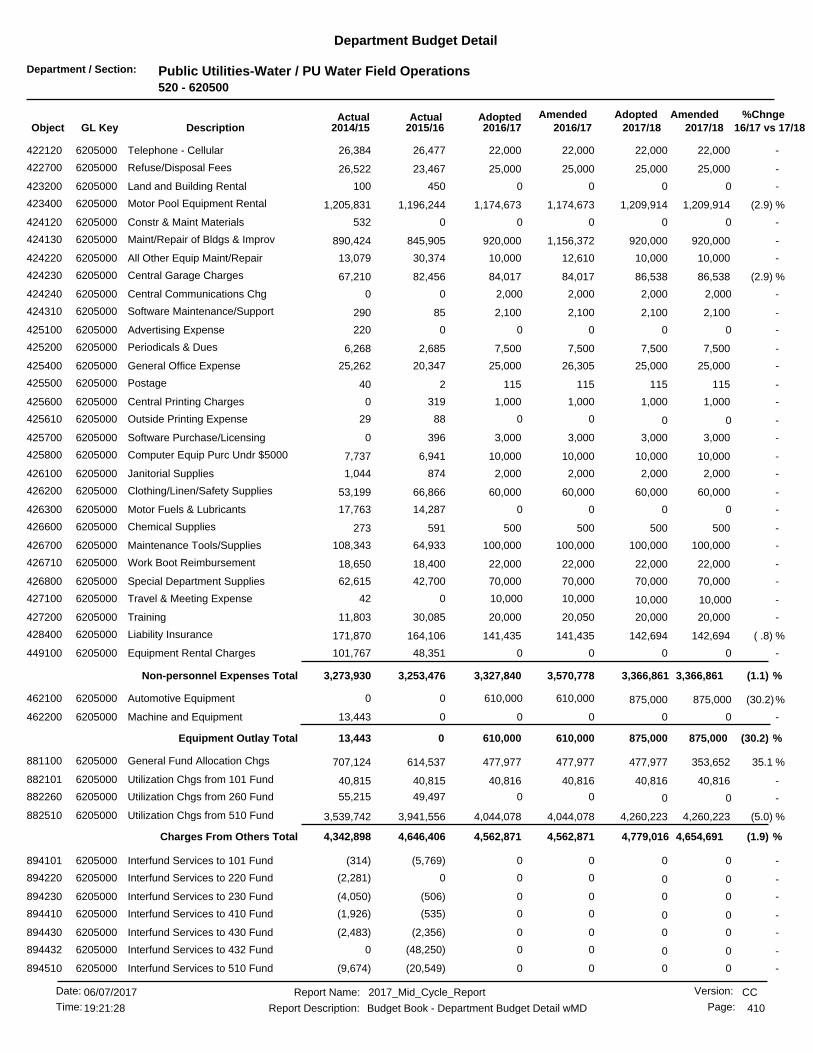
Department / Section: Public Utilities-Water / PU Water Field Operations520 - 620500
Department Budget Detail
%Chnge16/17 vs 17/182017/182017/18
AmendedAdoptedAdopted2016/17
AmendedActualActual2016/172015/162014/15GL KeyObject Description
-22,00022,000 22,00022,00026,477422120 Telephone - Cellular6205000 26,384
-25,00025,000 25,00025,00023,467422700 Refuse/Disposal Fees6205000 26,522
-0 00450100Land and Building Rental6205000423200 0
(2.9) %1,209,9141,174,673 1,209,9141,174,6731,196,244423400 Motor Pool Equipment Rental6205000 1,205,831
-0 000532Constr & Maint Materials6205000424120 0
-920,000920,000 920,0001,156,372845,905424130 Maint/Repair of Bldgs & Improv6205000 890,424
-10,00010,000 10,00012,61030,374424220 All Other Equip Maint/Repair6205000 13,079
(2.9) %86,53884,017 86,53884,01782,456424230 Central Garage Charges6205000 67,210
-2,000 2,0002,00000Central Communications Chg6205000424240 2,000
-2,1002,100 2,1002,10085424310 Software Maintenance/Support6205000 290
-0 000220Advertising Expense6205000425100 0
-7,5007,500 7,5007,5002,685425200 Periodicals & Dues6205000 6,268
-25,00025,000 25,00026,30520,347425400 General Office Expense6205000 25,262
-115115 1151152425500 Postage6205000 40
-1,0001,000 1,0001,000319425600 Central Printing Charges6205000 0
-0 008829Outside Printing Expense6205000425610 0
-3,0003,000 3,0003,000396425700 Software Purchase/Licensing6205000 0
-10,00010,000 10,00010,0006,941425800 Computer Equip Purc Undr $50006205000 7,737
-2,0002,000 2,0002,000874426100 Janitorial Supplies6205000 1,044
-60,00060,000 60,00060,00066,866426200 Clothing/Linen/Safety Supplies6205000 53,199
-0 0014,28717,763Motor Fuels & Lubricants6205000426300 0
-500500 500500591426600 Chemical Supplies6205000 273
-100,000100,000 100,000100,00064,933426700 Maintenance Tools/Supplies6205000 108,343
-22,00022,000 22,00022,00018,400426710 Work Boot Reimbursement6205000 18,650
-70,00070,000 70,00070,00042,700426800 Special Department Supplies6205000 62,615
-10,000 10,00010,000042Travel & Meeting Expense6205000427100 10,000
-20,00020,000 20,00020,05030,085427200 Training6205000 11,803
( .8) %142,694141,435 142,694141,435164,106428400 Liability Insurance6205000 171,870
-0 0048,351101,767Equipment Rental Charges6205000449100 0
(1.1) %3,366,8613,570,7783,327,840 3,366,861Non-personnel Expenses Total 3,253,4763,273,930
(30.2)%610,000 875,000610,00000Automotive Equipment6205000462100 875,000
-0 00013,443Machine and Equipment6205000462200 0
(30.2) %610,000 875,000Equipment Outlay Total 875,000610,000013,443
35.1 %353,652477,977 477,977477,977614,537881100 General Fund Allocation Chgs6205000 707,124
-40,81640,816 40,81640,81640,815882101 Utilization Chgs from 101 Fund6205000 40,815
-0 0049,49755,215Utilization Chgs from 260 Fund6205000882260 0
(5.0) %4,260,2234,044,078 4,260,2234,044,0783,941,556882510 Utilization Chgs from 510 Fund6205000 3,539,742
(1.9) %4,654,6914,562,8714,562,871 4,779,016Charges From Others Total 4,646,4064,342,898
-0 00(5,769)(314)Interfund Services to 101 Fund6205000894101 0
-0 000(2,281)Interfund Services to 220 Fund6205000894220 0
-0 00(506)(4,050)Interfund Services to 230 Fund6205000894230 0
-0 00(535)(1,926)Interfund Services to 410 Fund6205000894410 0
-0 00(2,356)(2,483)Interfund Services to 430 Fund6205000894430 0
-0 00(48,250)0Interfund Services to 432 Fund6205000894432 0
-0 00(20,549)(9,674)Interfund Services to 510 Fund6205000894510 0
CCReport Name: 2017_Mid_Cycle_Report
Report Description: Budget Book - Department Budget Detail wMD
06/07/2017Date:
Time: 410
Version:
Page:19:21:28

Department / Section: Public Utilities-Water / PU Water Field Operations520 - 620500
Department Budget Detail
%Chnge16/17 vs 17/182017/182017/18
AmendedAdoptedAdopted2016/17
AmendedActualActual2016/172015/162014/15GL KeyObject Description
-(4,141,000)(4,141,000) (4,141,000)(4,141,000)(4,356,652)894520 Interfund Services to 520 Fund6205000 (4,050,540)
-(4,141,000)(4,141,000)(4,141,000) (4,141,000)Charges to Others Total (4,434,619)(4,071,271)
(7.5) %16,057,085 17,368,26816,846,25116,300,02313,612,45913,560,319Total Budget Requirements
CCReport Name: 2017_Mid_Cycle_Report
Report Description: Budget Book - Department Budget Detail wMD
06/07/2017Date:
Time: 411
Version:
Page:19:21:28
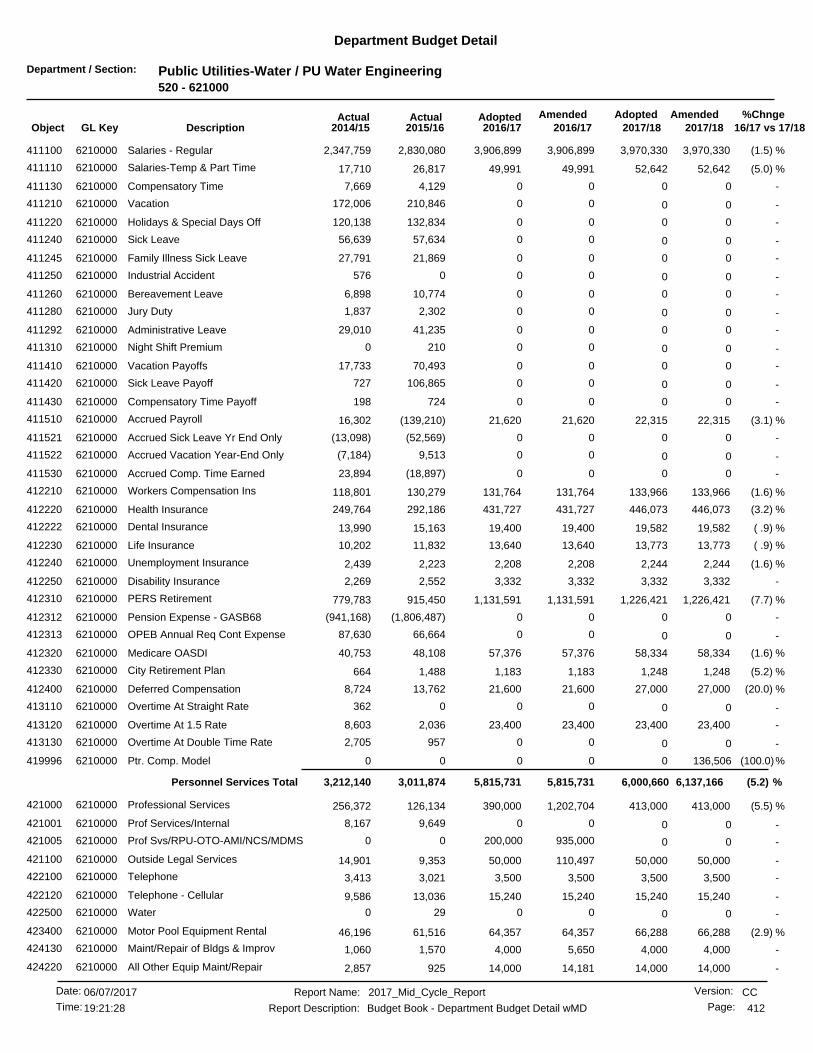
Department / Section: Public Utilities-Water / PU Water Engineering520 - 621000
Department Budget Detail
%Chnge16/17 vs 17/182017/182017/18
AmendedAdoptedAdopted2016/17
AmendedActualActual2016/172015/162014/15GL KeyObject Description
(1.5) %3,970,3303,906,899 3,970,3303,906,8992,830,080411100 Salaries - Regular6210000 2,347,759
(5.0) %52,64249,991 52,64249,99126,817411110 Salaries-Temp & Part Time6210000 17,710
-0 004,1297,669Compensatory Time6210000411130 0
-0 00210,846172,006Vacation6210000411210 0
-0 00132,834120,138Holidays & Special Days Off6210000411220 0
-0 0057,63456,639Sick Leave6210000411240 0
-0 0021,86927,791Family Illness Sick Leave6210000411245 0
-0 000576Industrial Accident6210000411250 0
-0 0010,7746,898Bereavement Leave6210000411260 0
-0 002,3021,837Jury Duty6210000411280 0
-0 0041,23529,010Administrative Leave6210000411292 0
-0 002100Night Shift Premium6210000411310 0
-0 0070,49317,733Vacation Payoffs6210000411410 0
-0 00106,865727Sick Leave Payoff6210000411420 0
-0 00724198Compensatory Time Payoff6210000411430 0
(3.1) %22,31521,620 22,31521,620(139,210)411510 Accrued Payroll6210000 16,302
-0 00(52,569)(13,098)Accrued Sick Leave Yr End Only6210000411521 0
-0 009,513(7,184)Accrued Vacation Year-End Only6210000411522 0
-0 00(18,897)23,894Accrued Comp. Time Earned6210000411530 0
(1.6) %133,966131,764 133,966131,764130,279412210 Workers Compensation Ins6210000 118,801
(3.2) %446,073431,727 446,073431,727292,186412220 Health Insurance6210000 249,764
( .9) %19,58219,400 19,58219,40015,163412222 Dental Insurance6210000 13,990
( .9) %13,77313,640 13,77313,64011,832412230 Life Insurance6210000 10,202
(1.6) %2,2442,208 2,2442,2082,223412240 Unemployment Insurance6210000 2,439
-3,3323,332 3,3323,3322,552412250 Disability Insurance6210000 2,269
(7.7) %1,226,4211,131,591 1,226,4211,131,591915,450412310 PERS Retirement6210000 779,783
-0 00(1,806,487)(941,168)Pension Expense - GASB686210000412312 0
-0 0066,66487,630OPEB Annual Req Cont Expense6210000412313 0
(1.6) %58,33457,376 58,33457,37648,108412320 Medicare OASDI6210000 40,753
(5.2) %1,2481,183 1,2481,1831,488412330 City Retirement Plan6210000 664
(20.0) %27,00021,600 27,00021,60013,762412400 Deferred Compensation6210000 8,724
-0 000362Overtime At Straight Rate6210000413110 0
-23,40023,400 23,40023,4002,036413120 Overtime At 1.5 Rate6210000 8,603
-0 009572,705Overtime At Double Time Rate6210000413130 0
(100.0)%0 136,506000Ptr. Comp. Model6210000419996 0
(5.2) %6,137,1665,815,7315,815,731 6,000,660Personnel Services Total 3,011,8743,212,140
(5.5) %413,000390,000 413,0001,202,704126,134421000 Professional Services6210000 256,372
-0 009,6498,167Prof Services/Internal6210000421001 0
-200,000 0935,00000Prof Svs/RPU-OTO-AMI/NCS/MDMS6210000421005 0
-50,00050,000 50,000110,4979,353421100 Outside Legal Services6210000 14,901
-3,5003,500 3,5003,5003,021422100 Telephone6210000 3,413
-15,24015,240 15,24015,24013,036422120 Telephone - Cellular6210000 9,586
-0 00290Water6210000422500 0
(2.9) %66,28864,357 66,28864,35761,516423400 Motor Pool Equipment Rental6210000 46,196
-4,0004,000 4,0005,6501,570424130 Maint/Repair of Bldgs & Improv6210000 1,060
-14,00014,000 14,00014,181925424220 All Other Equip Maint/Repair6210000 2,857
CCReport Name: 2017_Mid_Cycle_Report
Report Description: Budget Book - Department Budget Detail wMD
06/07/2017Date:
Time: 412
Version:
Page:19:21:28
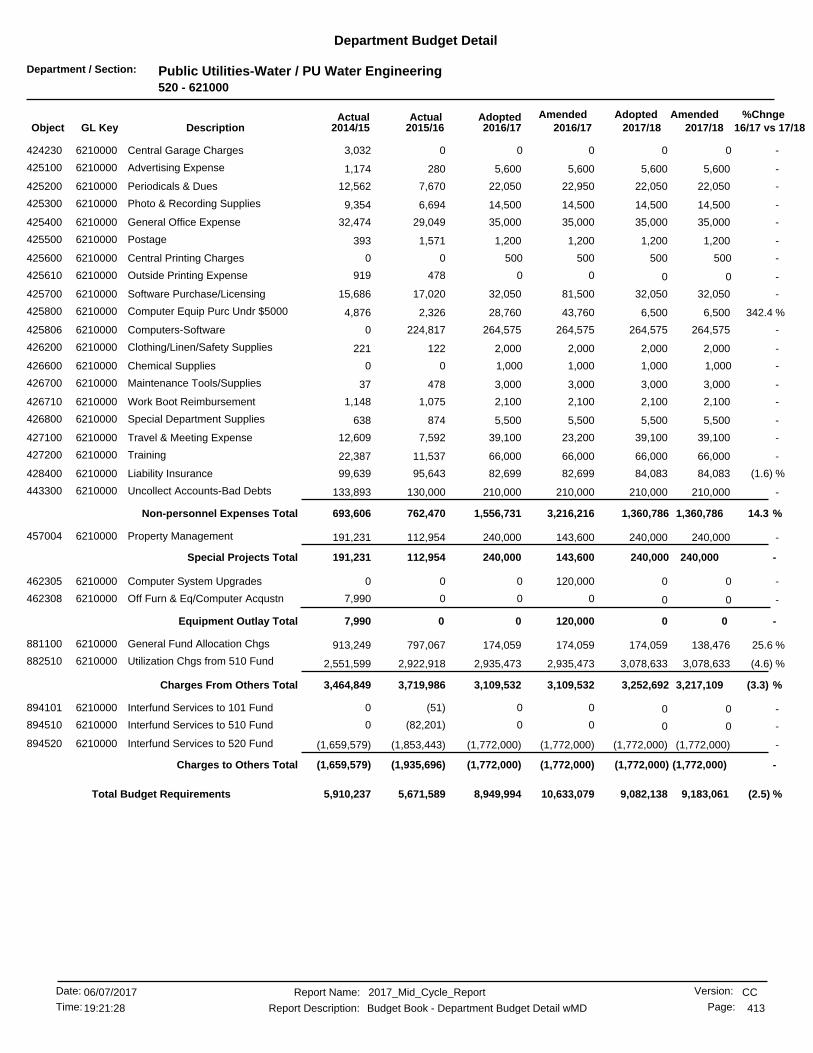
Department / Section: Public Utilities-Water / PU Water Engineering520 - 621000
Department Budget Detail
%Chnge16/17 vs 17/182017/182017/18
AmendedAdoptedAdopted2016/17
AmendedActualActual2016/172015/162014/15GL KeyObject Description
-0 0003,032Central Garage Charges6210000424230 0
-5,6005,600 5,6005,600280425100 Advertising Expense6210000 1,174
-22,05022,050 22,05022,9507,670425200 Periodicals & Dues6210000 12,562
-14,50014,500 14,50014,5006,694425300 Photo & Recording Supplies6210000 9,354
-35,00035,000 35,00035,00029,049425400 General Office Expense6210000 32,474
-1,2001,200 1,2001,2001,571425500 Postage6210000 393
-500 50050000Central Printing Charges6210000425600 500
-0 00478919Outside Printing Expense6210000425610 0
-32,05032,050 32,05081,50017,020425700 Software Purchase/Licensing6210000 15,686
342.4 %6,50028,760 6,50043,7602,326425800 Computer Equip Purc Undr $50006210000 4,876
-264,575264,575 264,575264,575224,817425806 Computers-Software6210000 0
-2,0002,000 2,0002,000122426200 Clothing/Linen/Safety Supplies6210000 221
-1,000 1,0001,00000Chemical Supplies6210000426600 1,000
-3,0003,000 3,0003,000478426700 Maintenance Tools/Supplies6210000 37
-2,1002,100 2,1002,1001,075426710 Work Boot Reimbursement6210000 1,148
-5,5005,500 5,5005,500874426800 Special Department Supplies6210000 638
-39,10039,100 39,10023,2007,592427100 Travel & Meeting Expense6210000 12,609
-66,00066,000 66,00066,00011,537427200 Training6210000 22,387
(1.6) %84,08382,699 84,08382,69995,643428400 Liability Insurance6210000 99,639
-210,000210,000 210,000210,000130,000443300 Uncollect Accounts-Bad Debts6210000 133,893
14.3 %1,360,7863,216,2161,556,731 1,360,786Non-personnel Expenses Total 762,470693,606
-240,000240,000 240,000143,600112,954457004 Property Management6210000 191,231
-240,000143,600240,000 240,000Special Projects Total 112,954191,231
-0 0120,00000Computer System Upgrades6210000462305 0
-0 0007,990Off Furn & Eq/Computer Acqustn6210000462308 0
-0 0Equipment Outlay Total 0120,00007,990
25.6 %138,476174,059 174,059174,059797,067881100 General Fund Allocation Chgs6210000 913,249
(4.6) %3,078,6332,935,473 3,078,6332,935,4732,922,918882510 Utilization Chgs from 510 Fund6210000 2,551,599
(3.3) %3,217,1093,109,5323,109,532 3,252,692Charges From Others Total 3,719,9863,464,849
-0 00(51)0Interfund Services to 101 Fund6210000894101 0
-0 00(82,201)0Interfund Services to 510 Fund6210000894510 0
-(1,772,000)(1,772,000) (1,772,000)(1,772,000)(1,853,443)894520 Interfund Services to 520 Fund6210000 (1,659,579)
-(1,772,000)(1,772,000)(1,772,000) (1,772,000)Charges to Others Total (1,935,696)(1,659,579)
(2.5) %8,949,994 9,183,0619,082,13810,633,0795,671,5895,910,237Total Budget Requirements
CCReport Name: 2017_Mid_Cycle_Report
Report Description: Budget Book - Department Budget Detail wMD
06/07/2017Date:
Time: 413
Version:
Page:19:21:28
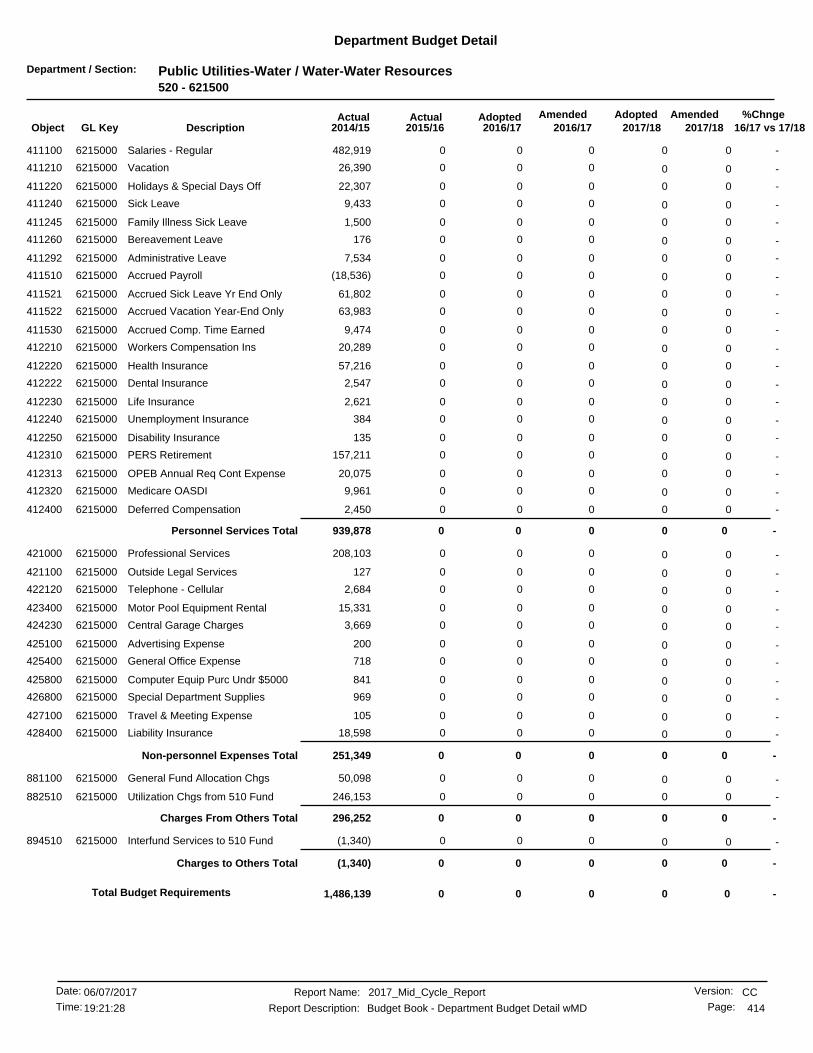
Department / Section: Public Utilities-Water / Water-Water Resources520 - 621500
Department Budget Detail
%Chnge16/17 vs 17/182017/182017/18
AmendedAdoptedAdopted2016/17
AmendedActualActual2016/172015/162014/15GL KeyObject Description
-0 000482,919Salaries - Regular6215000411100 0
-0 00026,390Vacation6215000411210 0
-0 00022,307Holidays & Special Days Off6215000411220 0
-0 0009,433Sick Leave6215000411240 0
-0 0001,500Family Illness Sick Leave6215000411245 0
-0 000176Bereavement Leave6215000411260 0
-0 0007,534Administrative Leave6215000411292 0
-0 000(18,536)Accrued Payroll6215000411510 0
-0 00061,802Accrued Sick Leave Yr End Only6215000411521 0
-0 00063,983Accrued Vacation Year-End Only6215000411522 0
-0 0009,474Accrued Comp. Time Earned6215000411530 0
-0 00020,289Workers Compensation Ins6215000412210 0
-0 00057,216Health Insurance6215000412220 0
-0 0002,547Dental Insurance6215000412222 0
-0 0002,621Life Insurance6215000412230 0
-0 000384Unemployment Insurance6215000412240 0
-0 000135Disability Insurance6215000412250 0
-0 000157,211PERS Retirement6215000412310 0
-0 00020,075OPEB Annual Req Cont Expense6215000412313 0
-0 0009,961Medicare OASDI6215000412320 0
-0 0002,450Deferred Compensation6215000412400 0
-0 0Personnel Services Total 000939,878
-0 000208,103Professional Services6215000421000 0
-0 000127Outside Legal Services6215000421100 0
-0 0002,684Telephone - Cellular6215000422120 0
-0 00015,331Motor Pool Equipment Rental6215000423400 0
-0 0003,669Central Garage Charges6215000424230 0
-0 000200Advertising Expense6215000425100 0
-0 000718General Office Expense6215000425400 0
-0 000841Computer Equip Purc Undr $50006215000425800 0
-0 000969Special Department Supplies6215000426800 0
-0 000105Travel & Meeting Expense6215000427100 0
-0 00018,598Liability Insurance6215000428400 0
-0 0Non-personnel Expenses Total 000251,349
-0 00050,098General Fund Allocation Chgs6215000881100 0
-0 000246,153Utilization Chgs from 510 Fund6215000882510 0
-0 0Charges From Others Total 000296,252
-0 000(1,340)Interfund Services to 510 Fund6215000894510 0
-0 0Charges to Others Total 000(1,340)
-00 000Total Budget Requirements 1,486,139
CCReport Name: 2017_Mid_Cycle_Report
Report Description: Budget Book - Department Budget Detail wMD
06/07/2017Date:
Time: 414
Version:
Page:19:21:28
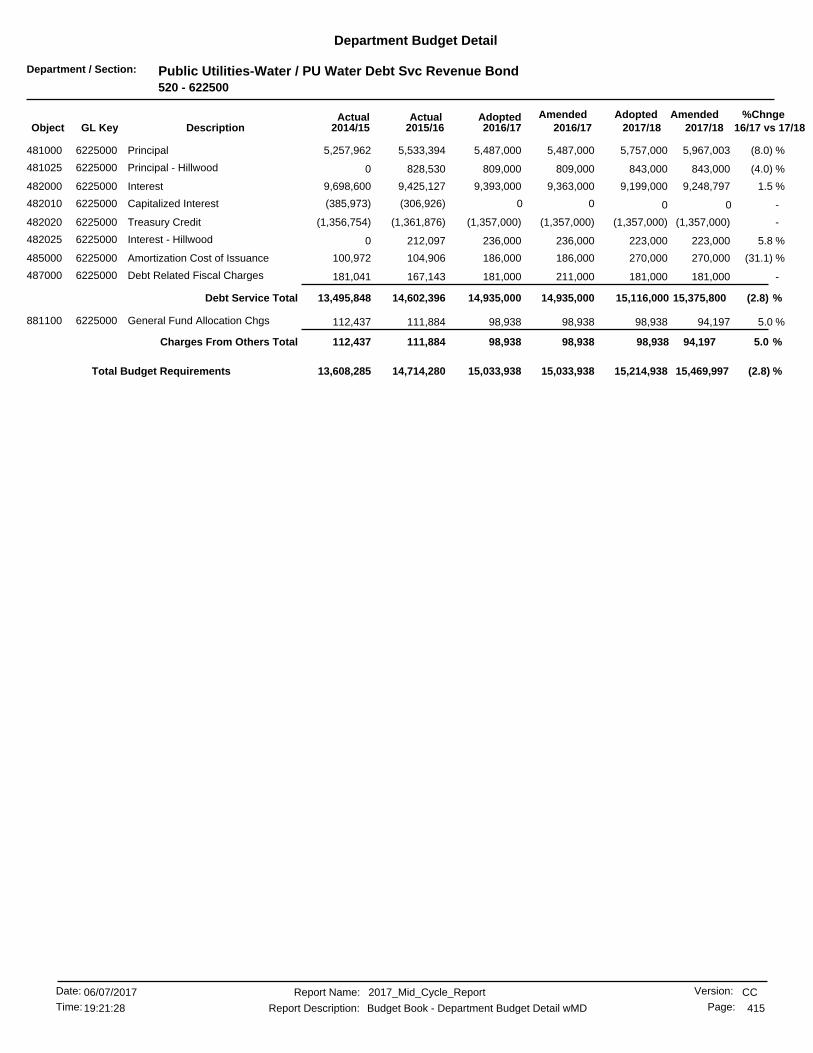
Department / Section: Public Utilities-Water / PU Water Debt Svc Revenue Bond520 - 622500
Department Budget Detail
%Chnge16/17 vs 17/182017/182017/18
AmendedAdoptedAdopted2016/17
AmendedActualActual2016/172015/162014/15GL KeyObject Description
(8.0) %5,967,0035,487,000 5,757,0005,487,0005,533,394481000 Principal6225000 5,257,962
(4.0) %843,000809,000 843,000809,000828,530481025 Principal - Hillwood6225000 0
1.5 %9,248,7979,393,000 9,199,0009,363,0009,425,127482000 Interest6225000 9,698,600
-0 00(306,926)(385,973)Capitalized Interest6225000482010 0
-(1,357,000)(1,357,000) (1,357,000)(1,357,000)(1,361,876)482020 Treasury Credit6225000 (1,356,754)
5.8 %223,000236,000 223,000236,000212,097482025 Interest - Hillwood6225000 0
(31.1) %270,000186,000 270,000186,000104,906485000 Amortization Cost of Issuance6225000 100,972
-181,000181,000 181,000211,000167,143487000 Debt Related Fiscal Charges6225000 181,041
(2.8) %15,375,80014,935,00014,935,000 15,116,000Debt Service Total 14,602,39613,495,848
5.0 %94,19798,938 98,93898,938111,884881100 General Fund Allocation Chgs6225000 112,437
5.0 %94,19798,93898,938 98,938Charges From Others Total 111,884112,437
(2.8) %15,033,938 15,469,99715,214,93815,033,93814,714,28013,608,285Total Budget Requirements
CCReport Name: 2017_Mid_Cycle_Report
Report Description: Budget Book - Department Budget Detail wMD
06/07/2017Date:
Time: 415
Version:
Page:19:21:28
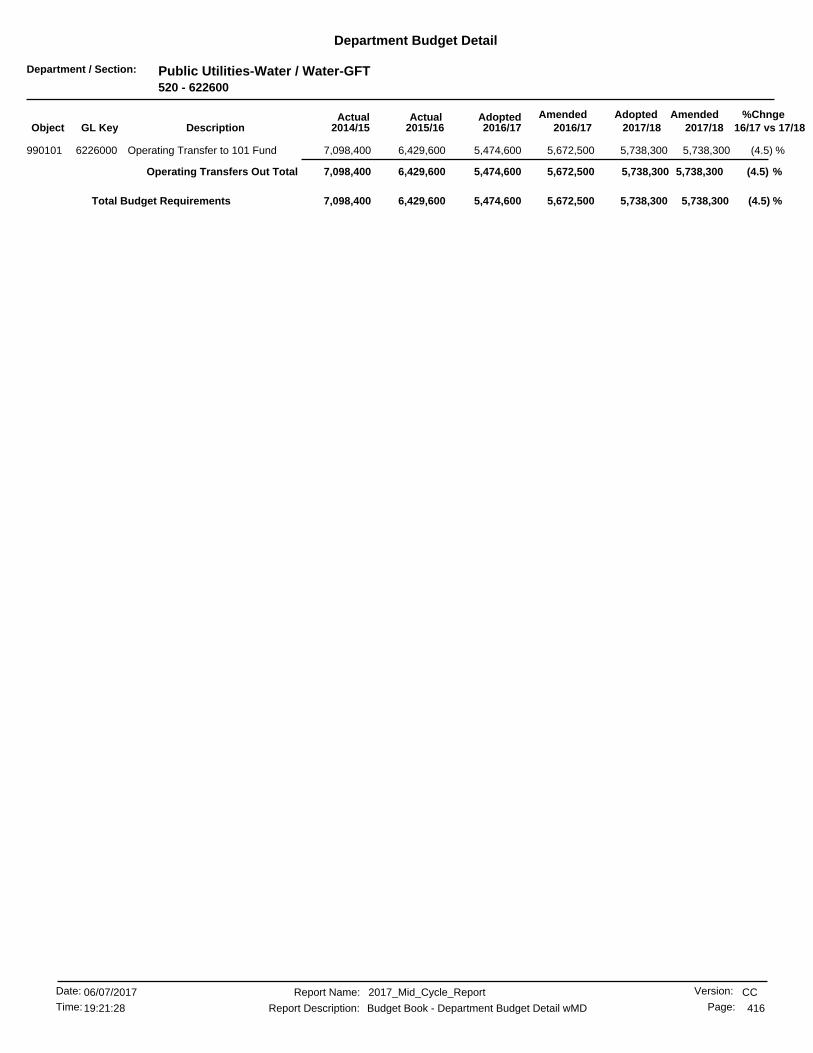
Department / Section: Public Utilities-Water / Water-GFT520 - 622600
Department Budget Detail
%Chnge16/17 vs 17/182017/182017/18
AmendedAdoptedAdopted2016/17
AmendedActualActual2016/172015/162014/15GL KeyObject Description
(4.5) %5,738,3005,474,600 5,738,3005,672,5006,429,600990101 Operating Transfer to 101 Fund6226000 7,098,400
(4.5) %5,738,3005,672,5005,474,600 5,738,300Operating Transfers Out Total 6,429,6007,098,400
(4.5) %5,474,600 5,738,3005,738,3005,672,5006,429,6007,098,400Total Budget Requirements
CCReport Name: 2017_Mid_Cycle_Report
Report Description: Budget Book - Department Budget Detail wMD
06/07/2017Date:
Time: 416
Version:
Page:19:21:28
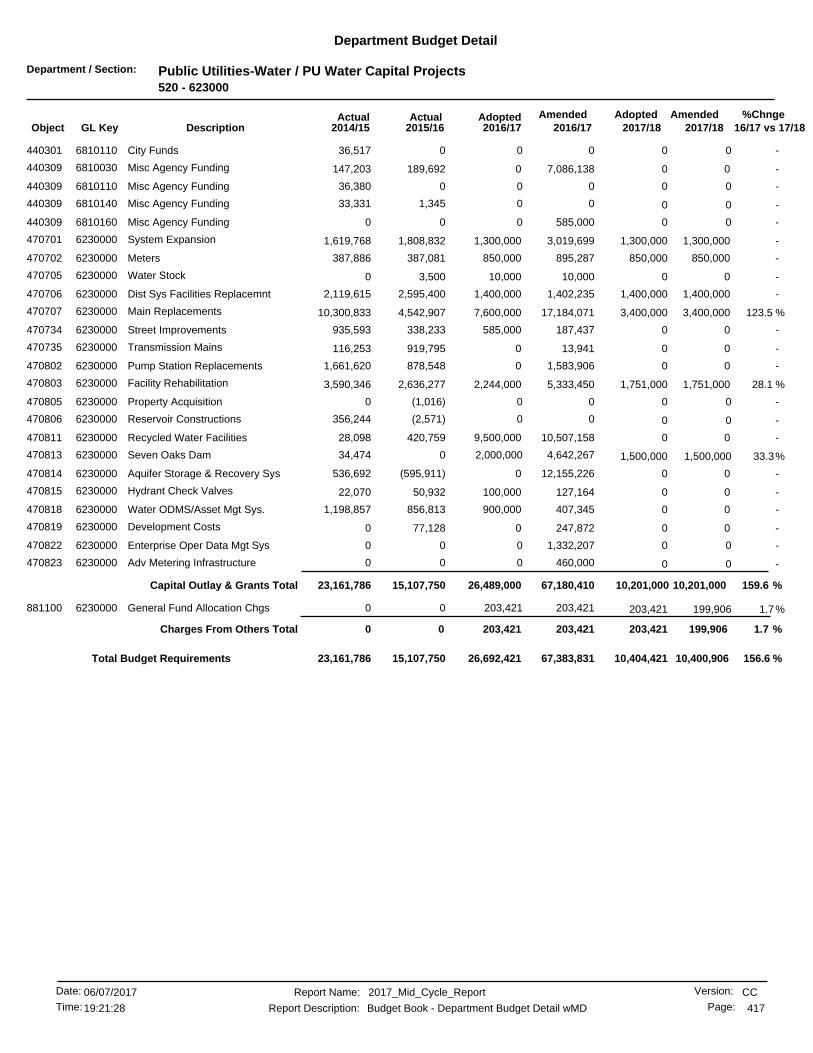
Department / Section: Public Utilities-Water / PU Water Capital Projects520 - 623000
Department Budget Detail
%Chnge16/17 vs 17/182017/182017/18
AmendedAdoptedAdopted2016/17
AmendedActualActual2016/172015/162014/15GL KeyObject Description
-0 00036,517City Funds6810110440301 0
-00 07,086,138189,692440309 Misc Agency Funding6810030 147,203
-0 00036,380Misc Agency Funding6810110440309 0
-0 001,34533,331Misc Agency Funding6810140440309 0
-0 0585,00000Misc Agency Funding6810160440309 0
-1,300,0001,300,000 1,300,0003,019,6991,808,832470701 System Expansion6230000 1,619,768
-850,000850,000 850,000895,287387,081470702 Meters6230000 387,886
-010,000 010,0003,500470705 Water Stock6230000 0
-1,400,0001,400,000 1,400,0001,402,2352,595,400470706 Dist Sys Facilities Replacemnt6230000 2,119,615
123.5 %3,400,0007,600,000 3,400,00017,184,0714,542,907470707 Main Replacements6230000 10,300,833
-0585,000 0187,437338,233470734 Street Improvements6230000 935,593
-00 013,941919,795470735 Transmission Mains6230000 116,253
-00 01,583,906878,548470802 Pump Station Replacements6230000 1,661,620
28.1 %1,751,0002,244,000 1,751,0005,333,4502,636,277470803 Facility Rehabilitation6230000 3,590,346
-0 00(1,016)0Property Acquisition6230000470805 0
-0 00(2,571)356,244Reservoir Constructions6230000470806 0
-09,500,000 010,507,158420,759470811 Recycled Water Facilities6230000 28,098
33.3%2,000,000 1,500,0004,642,267034,474Seven Oaks Dam6230000470813 1,500,000
-00 012,155,226(595,911)470814 Aquifer Storage & Recovery Sys6230000 536,692
-0100,000 0127,16450,932470815 Hydrant Check Valves6230000 22,070
-0900,000 0407,345856,813470818 Water ODMS/Asset Mgt Sys.6230000 1,198,857
-00 0247,87277,128470819 Development Costs6230000 0
-0 01,332,20700Enterprise Oper Data Mgt Sys6230000470822 0
-0 0460,00000Adv Metering Infrastructure6230000470823 0
159.6 %10,201,00067,180,41026,489,000 10,201,000Capital Outlay & Grants Total 15,107,75023,161,786
1.7%203,421 199,906203,42100General Fund Allocation Chgs6230000881100 203,421
1.7 %203,421 199,906Charges From Others Total 203,421203,42100
156.6 %26,692,421 10,400,90610,404,42167,383,83115,107,75023,161,786Total Budget Requirements
CCReport Name: 2017_Mid_Cycle_Report
Report Description: Budget Book - Department Budget Detail wMD
06/07/2017Date:
Time: 417
Version:
Page:19:21:28
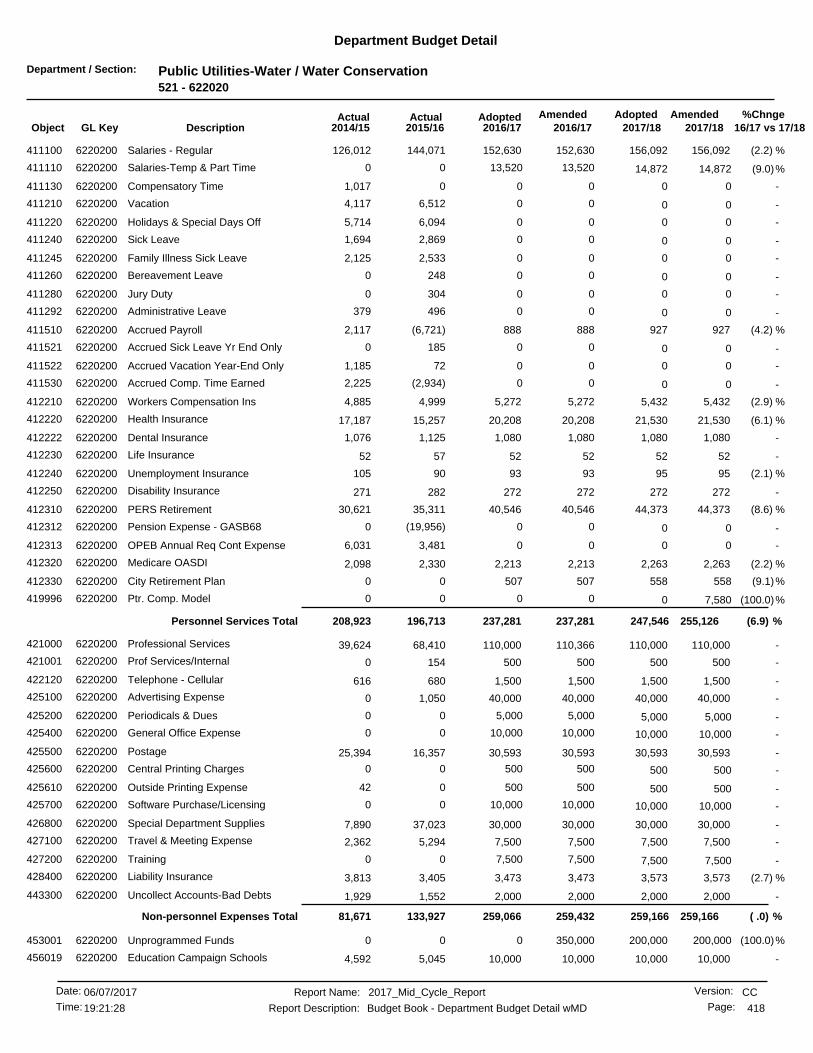
Department / Section: Public Utilities-Water / Water Conservation521 - 622020
Department Budget Detail
%Chnge16/17 vs 17/182017/182017/18
AmendedAdoptedAdopted2016/17
AmendedActualActual2016/172015/162014/15GL KeyObject Description
(2.2) %156,092152,630 156,092152,630144,071411100 Salaries - Regular6220200 126,012
(9.0)%13,520 14,87213,52000Salaries-Temp & Part Time6220200411110 14,872
-0 0001,017Compensatory Time6220200411130 0
-0 006,5124,117Vacation6220200411210 0
-0 006,0945,714Holidays & Special Days Off6220200411220 0
-0 002,8691,694Sick Leave6220200411240 0
-0 002,5332,125Family Illness Sick Leave6220200411245 0
-0 002480Bereavement Leave6220200411260 0
-0 003040Jury Duty6220200411280 0
-0 00496379Administrative Leave6220200411292 0
(4.2) %927888 927888(6,721)411510 Accrued Payroll6220200 2,117
-0 001850Accrued Sick Leave Yr End Only6220200411521 0
-0 00721,185Accrued Vacation Year-End Only6220200411522 0
-0 00(2,934)2,225Accrued Comp. Time Earned6220200411530 0
(2.9) %5,4325,272 5,4325,2724,999412210 Workers Compensation Ins6220200 4,885
(6.1) %21,53020,208 21,53020,20815,257412220 Health Insurance6220200 17,187
-1,0801,080 1,0801,0801,125412222 Dental Insurance6220200 1,076
-5252 525257412230 Life Insurance6220200 52
(2.1) %9593 959390412240 Unemployment Insurance6220200 105
-272272 272272282412250 Disability Insurance6220200 271
(8.6) %44,37340,546 44,37340,54635,311412310 PERS Retirement6220200 30,621
-0 00(19,956)0Pension Expense - GASB686220200412312 0
-0 003,4816,031OPEB Annual Req Cont Expense6220200412313 0
(2.2) %2,2632,213 2,2632,2132,330412320 Medicare OASDI6220200 2,098
(9.1)%507 55850700City Retirement Plan6220200412330 558
(100.0)%0 7,580000Ptr. Comp. Model6220200419996 0
(6.9) %255,126237,281237,281 247,546Personnel Services Total 196,713208,923
-110,000110,000 110,000110,36668,410421000 Professional Services6220200 39,624
-500500 500500154421001 Prof Services/Internal6220200 0
-1,5001,500 1,5001,500680422120 Telephone - Cellular6220200 616
-40,00040,000 40,00040,0001,050425100 Advertising Expense6220200 0
-5,000 5,0005,00000Periodicals & Dues6220200425200 5,000
-10,000 10,00010,00000General Office Expense6220200425400 10,000
-30,59330,593 30,59330,59316,357425500 Postage6220200 25,394
-500 50050000Central Printing Charges6220200425600 500
-500 500500042Outside Printing Expense6220200425610 500
-10,000 10,00010,00000Software Purchase/Licensing6220200425700 10,000
-30,00030,000 30,00030,00037,023426800 Special Department Supplies6220200 7,890
-7,5007,500 7,5007,5005,294427100 Travel & Meeting Expense6220200 2,362
-7,500 7,5007,50000Training6220200427200 7,500
(2.7) %3,5733,473 3,5733,4733,405428400 Liability Insurance6220200 3,813
-2,0002,000 2,0002,0001,552443300 Uncollect Accounts-Bad Debts6220200 1,929
( .0) %259,166259,432259,066 259,166Non-personnel Expenses Total 133,92781,671
(100.0)%0 200,000350,00000Unprogrammed Funds6220200453001 200,000
-10,00010,000 10,00010,0005,045456019 Education Campaign Schools6220200 4,592
CCReport Name: 2017_Mid_Cycle_Report
Report Description: Budget Book - Department Budget Detail wMD
06/07/2017Date:
Time: 418
Version:
Page:19:21:28

Department / Section: Public Utilities-Water / Water Conservation521 - 622020
Department Budget Detail
%Chnge16/17 vs 17/182017/182017/18
AmendedAdoptedAdopted2016/17
AmendedActualActual2016/172015/162014/15GL KeyObject Description
-7,5007,500 7,5007,5001,600456022 Commty Supprt Outrch/Educatn6220200 2,500
-125,000125,000 125,000125,00063,700457003 High Efficiency Clothes Washer6220200 70,420
-10,00010,000 10,00010,00012,216457008 Weather Based Irrigation Contr6220200 1,838
-30,00030,000 30,00030,00014,181457009 Water Mgmt Syst.-Technical Ass6220200 22,799
-50,00050,000 50,00050,000456,943457011 Waterwise Landscape Incentive6220200 1,187,718
-5,0005,000 5,0005,000422457015 Landscape Rotating Nozzle Ince6220200 1,114
-60,00060,000 60,00060,00079,481457017 High Efficiency/Dual Flush Toi6220200 33,450
-0 0033,214211,362Artificial Turf Incentive-R6220200457018 0
-50,000 50,00050,00000Free Sprinkler Nozzle Program6220200457020 50,000
-50,00050,000 50,00050,00011,880457021 Whole House Program 5216220200 20,985
-0 00077,490HET Direct Install Prog6220200457022 0
-0200,000 0334,71365,286457023 Smart Irrigatn Dir Instl Prog6220200 262,977
-100,000100,000 100,000100,000702,090457024 Commercial Wtr Wise Landscape6220200 3,060,365
-0 000109,621Small Business Dir Install6220200457025 0
-25,000 25,00025,00000Community Education6220200457026 25,000
-2,500 2,5002,50001,392Res On-Line Wtr Audit Tool6220200457027 2,500
-00 0299,890110457032 Comm Lndsc Demonstration Prog6220200 0
-00 0113,60786,392457033 15/16 Comm Wtr Wise Landscape6220200 0
-00 0202,44447,555457034 15/16 Resi Wtr Wise Landscape6220200 0
-725,0001,825,656725,000 725,000Special Projects Total 1,580,1185,068,628
-0 02,50000Misc Agency Funding6820000440309 0
-0 0Capital Outlay & Grants Total 02,50000
(68.0) %93,21929,747 29,74729,74725,284881100 General Fund Allocation Chgs6220200 32,527
(6.8) %48,70645,375 48,70645,37540,413882510 Utilization Chgs from 510 Fund6220200 42,714
(47.0) %141,92575,12275,122 78,453Charges From Others Total 65,69775,242
(6.1) %1,296,469 1,381,2171,310,1652,399,9921,976,4575,434,466Total Budget Requirements
CCReport Name: 2017_Mid_Cycle_Report
Report Description: Budget Book - Department Budget Detail wMD
06/07/2017Date:
Time: 419
Version:
Page:19:21:28

Department / Section: Balance Sheet / Revenue / Balance Sheet / Revenue530 - 000000
Department Budget Detail
%Chnge16/17 vs 17/182017/182017/18
AmendedAdoptedAdopted2016/17
AmendedActualActual2016/172015/162014/15GL KeyObject Description
-0 00(427)0Water0000530422500 0
-0 00(106)0Other Utilities0000530422600 0
-0 00500Motor Fuels & Lubricants0000530426300 0
-0 0Non-personnel Expenses Total 00(483)0
-00 00(483)Total Budget Requirements 0
CCReport Name: 2017_Mid_Cycle_Report
Report Description: Budget Book - Department Budget Detail wMD
06/07/2017Date:
Time: 420
Version:
Page:19:21:28
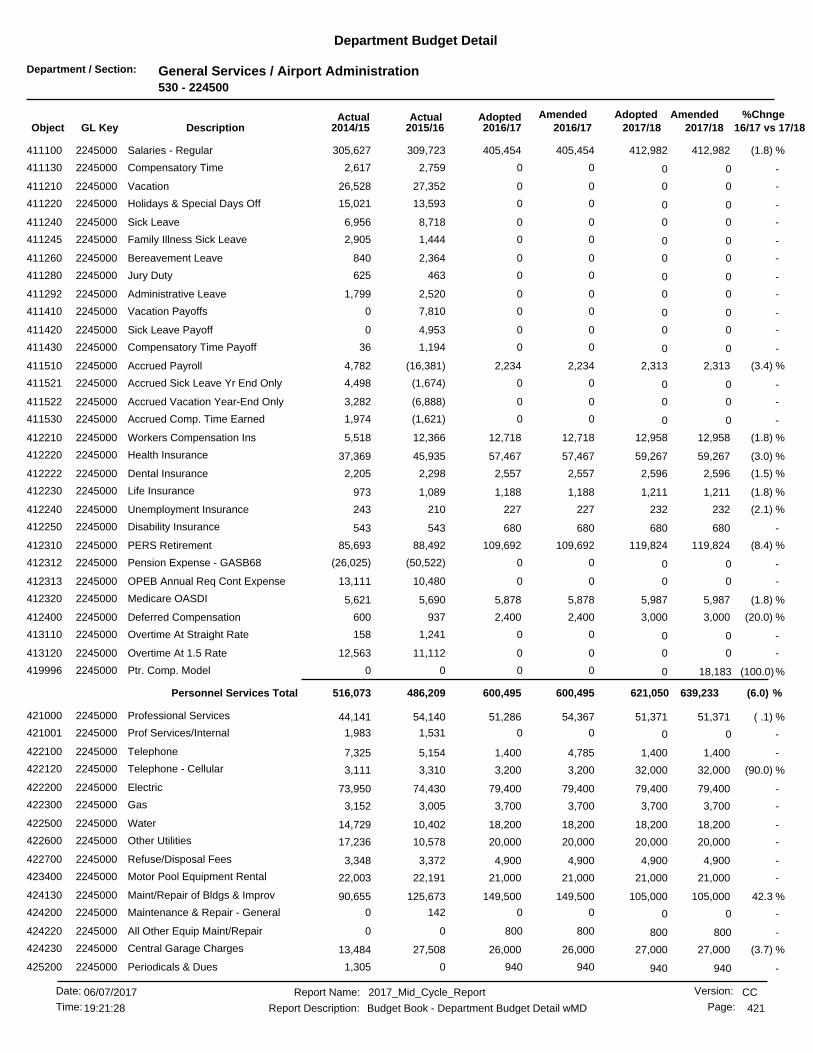
Department / Section: General Services / Airport Administration530 - 224500
Department Budget Detail
%Chnge16/17 vs 17/182017/182017/18
AmendedAdoptedAdopted2016/17
AmendedActualActual2016/172015/162014/15GL KeyObject Description
(1.8) %412,982405,454 412,982405,454309,723411100 Salaries - Regular2245000 305,627
-0 002,7592,617Compensatory Time2245000411130 0
-0 0027,35226,528Vacation2245000411210 0
-0 0013,59315,021Holidays & Special Days Off2245000411220 0
-0 008,7186,956Sick Leave2245000411240 0
-0 001,4442,905Family Illness Sick Leave2245000411245 0
-0 002,364840Bereavement Leave2245000411260 0
-0 00463625Jury Duty2245000411280 0
-0 002,5201,799Administrative Leave2245000411292 0
-0 007,8100Vacation Payoffs2245000411410 0
-0 004,9530Sick Leave Payoff2245000411420 0
-0 001,19436Compensatory Time Payoff2245000411430 0
(3.4) %2,3132,234 2,3132,234(16,381)411510 Accrued Payroll2245000 4,782
-0 00(1,674)4,498Accrued Sick Leave Yr End Only2245000411521 0
-0 00(6,888)3,282Accrued Vacation Year-End Only2245000411522 0
-0 00(1,621)1,974Accrued Comp. Time Earned2245000411530 0
(1.8) %12,95812,718 12,95812,71812,366412210 Workers Compensation Ins2245000 5,518
(3.0) %59,26757,467 59,26757,46745,935412220 Health Insurance2245000 37,369
(1.5) %2,5962,557 2,5962,5572,298412222 Dental Insurance2245000 2,205
(1.8) %1,2111,188 1,2111,1881,089412230 Life Insurance2245000 973
(2.1) %232227 232227210412240 Unemployment Insurance2245000 243
-680680 680680543412250 Disability Insurance2245000 543
(8.4) %119,824109,692 119,824109,69288,492412310 PERS Retirement2245000 85,693
-0 00(50,522)(26,025)Pension Expense - GASB682245000412312 0
-0 0010,48013,111OPEB Annual Req Cont Expense2245000412313 0
(1.8) %5,9875,878 5,9875,8785,690412320 Medicare OASDI2245000 5,621
(20.0) %3,0002,400 3,0002,400937412400 Deferred Compensation2245000 600
-0 001,241158Overtime At Straight Rate2245000413110 0
-0 0011,11212,563Overtime At 1.5 Rate2245000413120 0
(100.0)%0 18,183000Ptr. Comp. Model2245000419996 0
(6.0) %639,233600,495600,495 621,050Personnel Services Total 486,209516,073
( .1) %51,37151,286 51,37154,36754,140421000 Professional Services2245000 44,141
-0 001,5311,983Prof Services/Internal2245000421001 0
-1,4001,400 1,4004,7855,154422100 Telephone2245000 7,325
(90.0) %32,0003,200 32,0003,2003,310422120 Telephone - Cellular2245000 3,111
-79,40079,400 79,40079,40074,430422200 Electric2245000 73,950
-3,7003,700 3,7003,7003,005422300 Gas2245000 3,152
-18,20018,200 18,20018,20010,402422500 Water2245000 14,729
-20,00020,000 20,00020,00010,578422600 Other Utilities2245000 17,236
-4,9004,900 4,9004,9003,372422700 Refuse/Disposal Fees2245000 3,348
-21,00021,000 21,00021,00022,191423400 Motor Pool Equipment Rental2245000 22,003
42.3 %105,000149,500 105,000149,500125,673424130 Maint/Repair of Bldgs & Improv2245000 90,655
-0 001420Maintenance & Repair - General2245000424200 0
-800 80080000All Other Equip Maint/Repair2245000424220 800
(3.7) %27,00026,000 27,00026,00027,508424230 Central Garage Charges2245000 13,484
-940 94094001,305Periodicals & Dues2245000425200 940
CCReport Name: 2017_Mid_Cycle_Report
Report Description: Budget Book - Department Budget Detail wMD
06/07/2017Date:
Time: 421
Version:
Page:19:21:28

Department / Section: General Services / Airport Administration530 - 224500
Department Budget Detail
%Chnge16/17 vs 17/182017/182017/18
AmendedAdoptedAdopted2016/17
AmendedActualActual2016/172015/162014/15GL KeyObject Description
-1,5001,500 1,5001,5005,396425300 Photo & Recording Supplies2245000 4,767
-5,0005,000 5,0005,0003,323425400 General Office Expense2245000 2,667
-0 002,272549Merchant Fees2245000425410 0
-600600 600600279425500 Postage2245000 418
400.0 %2001,000 2001,000383425610 Outside Printing Expense2245000 220
-4,0004,000 4,0004,0004,755426100 Janitorial Supplies2245000 4,307
-1,4001,400 1,4001,400550426200 Clothing/Linen/Safety Supplies2245000 1,041
-2,0002,000 2,0002,0001,972426300 Motor Fuels & Lubricants2245000 2,156
-3,8003,800 3,8003,800248426600 Chemical Supplies2245000 0
(14.8) %23,50020,000 23,50020,00017,117426700 Maintenance Tools/Supplies2245000 3,560
-0 006000Work Boot Reimbursement2245000426710 0
-10,00010,000 10,00010,0009,354426800 Special Department Supplies2245000 5,549
-6,0006,000 6,0006,0001,958427100 Travel & Meeting Expense2245000 244
-2,0002,000 2,0002,000522427200 Training2245000 2,452
(1.8) %7,9717,825 7,9717,8257,236428400 Liability Insurance2245000 3,874
-20,94020,940 20,94020,94022,470428420 Insurance Charges - Direct2245000 19,829
2.5 %454,622472,858466,391 454,622Non-personnel Expenses Total 419,884348,066
(10.3) %14,96413,416 14,96413,41611,975481000 Principal2245000 10,642
13.5 %4,7445,385 4,7445,3854,294482000 Interest2245000 4,615
(4.6) %19,70818,80118,801 19,708Debt Service Total 16,27015,257
(3.0) %183,469177,853 177,853177,853177,852881100 General Fund Allocation Chgs2245000 176,979
-4,7644,764 4,7644,7644,764882510 Utilization Chgs from 510 Fund2245000 4,764
(2.9) %188,233182,617182,617 182,617Charges From Others Total 182,616181,743
-0 000(2,498)Interfund Services to 650 Fund2245000894650 0
-0 0Charges to Others Total 000(2,498)
(2.5) %1,268,304 1,301,7961,277,9971,274,7711,104,9811,058,643Total Budget Requirements
CCReport Name: 2017_Mid_Cycle_Report
Report Description: Budget Book - Department Budget Detail wMD
06/07/2017Date:
Time: 422
Version:
Page:19:21:28
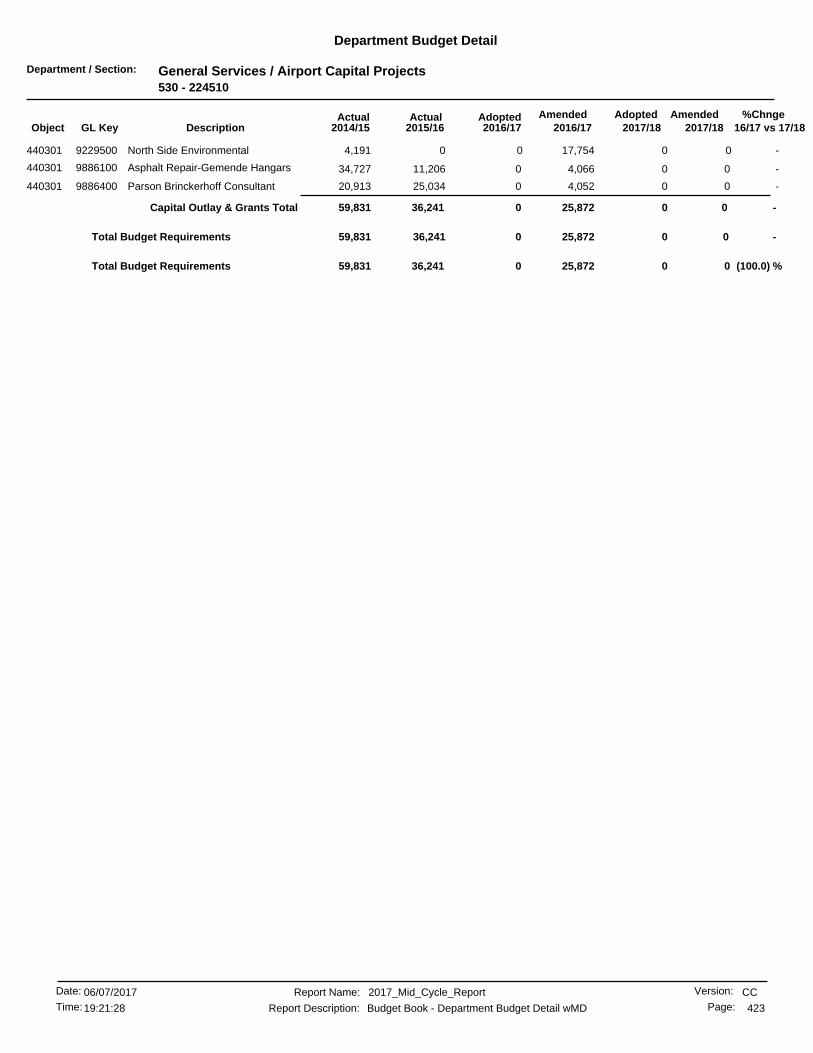
Department / Section: General Services / Airport Capital Projects530 - 224510
Department Budget Detail
%Chnge16/17 vs 17/182017/182017/18
AmendedAdoptedAdopted2016/17
AmendedActualActual2016/172015/162014/15GL KeyObject Description
-0 017,75404,191North Side Environmental9229500440301 0
-00 04,06611,206440301 Asphalt Repair-Gemende Hangars9886100 34,727
-00 04,05225,034440301 Parson Brinckerhoff Consultant9886400 20,913
-0 0Capital Outlay & Grants Total 025,87236,24159,831
-0 0025,87236,24159,831Total Budget Requirements
(100.0) %00 025,87236,241Total Budget Requirements 59,831
CCReport Name: 2017_Mid_Cycle_Report
Report Description: Budget Book - Department Budget Detail wMD
06/07/2017Date:
Time: 423
Version:
Page:19:21:28
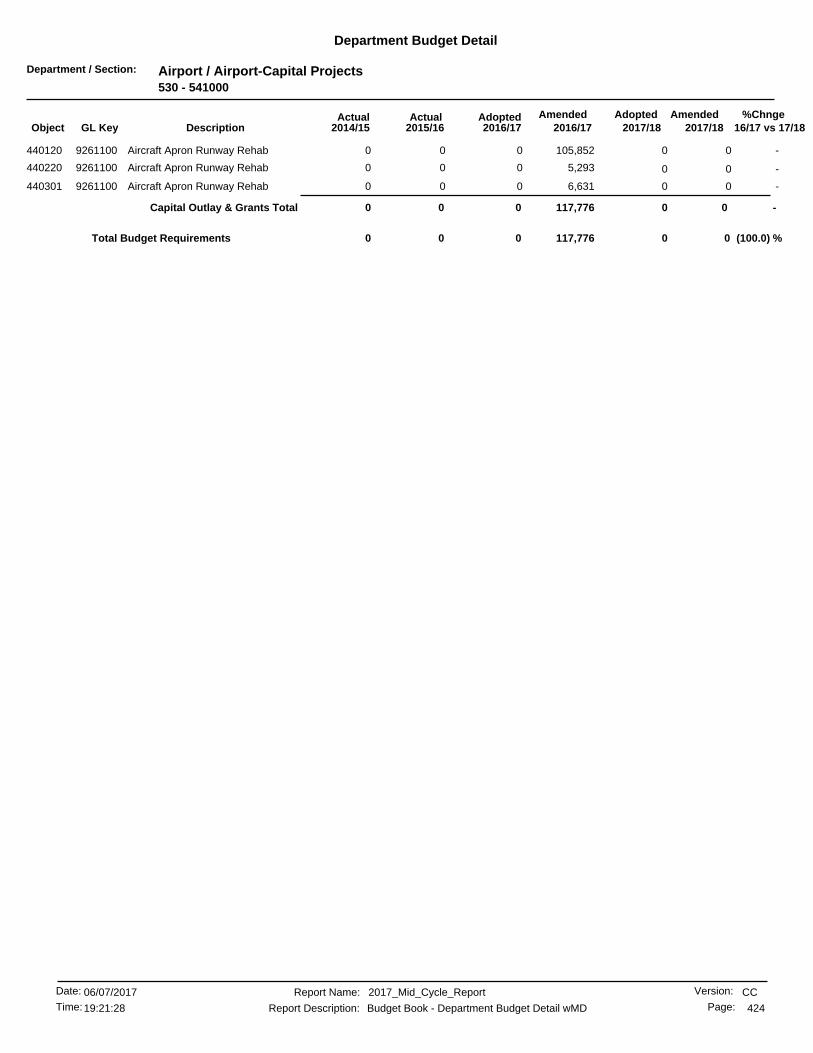
Department / Section: Airport / Airport-Capital Projects530 - 541000
Department Budget Detail
%Chnge16/17 vs 17/182017/182017/18
AmendedAdoptedAdopted2016/17
AmendedActualActual2016/172015/162014/15GL KeyObject Description
-0 0105,85200Aircraft Apron Runway Rehab9261100440120 0
-0 05,29300Aircraft Apron Runway Rehab9261100440220 0
-0 06,63100Aircraft Apron Runway Rehab9261100440301 0
-0 0Capital Outlay & Grants Total 0117,77600
(100.0) %00 0117,7760Total Budget Requirements 0
CCReport Name: 2017_Mid_Cycle_Report
Report Description: Budget Book - Department Budget Detail wMD
06/07/2017Date:
Time: 424
Version:
Page:19:21:28
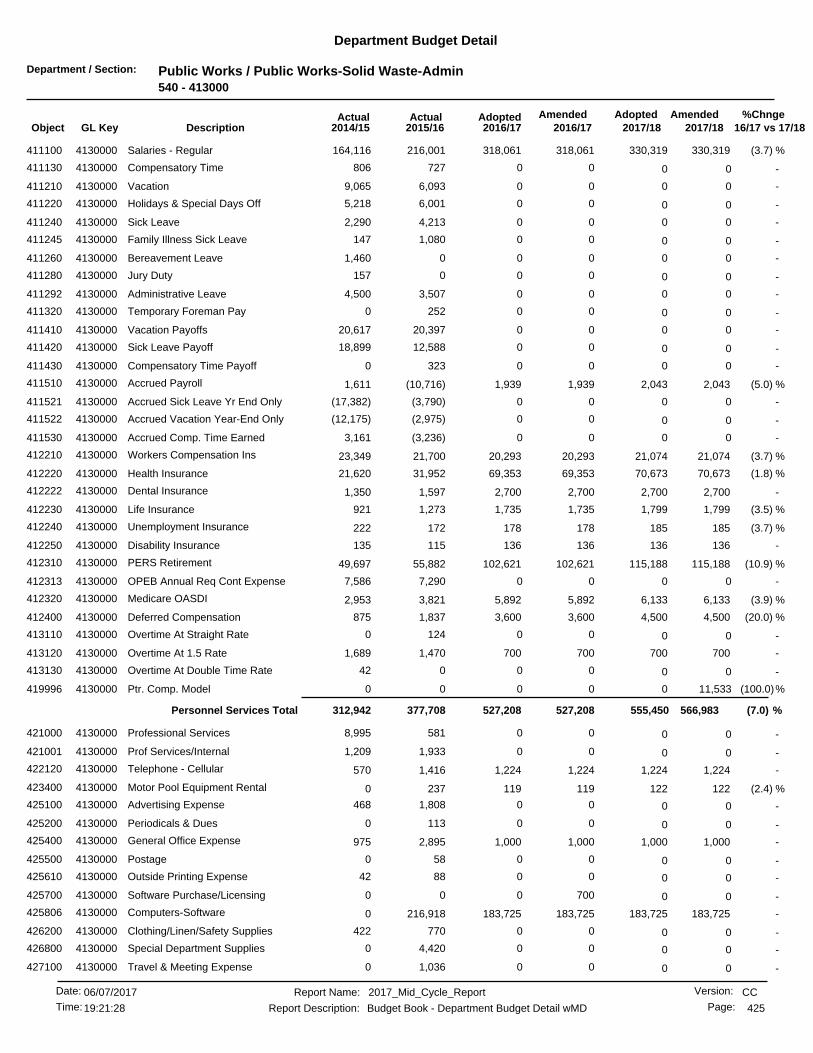
Department / Section: Public Works / Public Works-Solid Waste-Admin540 - 413000
Department Budget Detail
%Chnge16/17 vs 17/182017/182017/18
AmendedAdoptedAdopted2016/17
AmendedActualActual2016/172015/162014/15GL KeyObject Description
(3.7) %330,319318,061 330,319318,061216,001411100 Salaries - Regular4130000 164,116
-0 00727806Compensatory Time4130000411130 0
-0 006,0939,065Vacation4130000411210 0
-0 006,0015,218Holidays & Special Days Off4130000411220 0
-0 004,2132,290Sick Leave4130000411240 0
-0 001,080147Family Illness Sick Leave4130000411245 0
-0 0001,460Bereavement Leave4130000411260 0
-0 000157Jury Duty4130000411280 0
-0 003,5074,500Administrative Leave4130000411292 0
-0 002520Temporary Foreman Pay4130000411320 0
-0 0020,39720,617Vacation Payoffs4130000411410 0
-0 0012,58818,899Sick Leave Payoff4130000411420 0
-0 003230Compensatory Time Payoff4130000411430 0
(5.0) %2,0431,939 2,0431,939(10,716)411510 Accrued Payroll4130000 1,611
-0 00(3,790)(17,382)Accrued Sick Leave Yr End Only4130000411521 0
-0 00(2,975)(12,175)Accrued Vacation Year-End Only4130000411522 0
-0 00(3,236)3,161Accrued Comp. Time Earned4130000411530 0
(3.7) %21,07420,293 21,07420,29321,700412210 Workers Compensation Ins4130000 23,349
(1.8) %70,67369,353 70,67369,35331,952412220 Health Insurance4130000 21,620
-2,7002,700 2,7002,7001,597412222 Dental Insurance4130000 1,350
(3.5) %1,7991,735 1,7991,7351,273412230 Life Insurance4130000 921
(3.7) %185178 185178172412240 Unemployment Insurance4130000 222
-136136 136136115412250 Disability Insurance4130000 135
(10.9) %115,188102,621 115,188102,62155,882412310 PERS Retirement4130000 49,697
-0 007,2907,586OPEB Annual Req Cont Expense4130000412313 0
(3.9) %6,1335,892 6,1335,8923,821412320 Medicare OASDI4130000 2,953
(20.0) %4,5003,600 4,5003,6001,837412400 Deferred Compensation4130000 875
-0 001240Overtime At Straight Rate4130000413110 0
-700700 7007001,470413120 Overtime At 1.5 Rate4130000 1,689
-0 00042Overtime At Double Time Rate4130000413130 0
(100.0)%0 11,533000Ptr. Comp. Model4130000419996 0
(7.0) %566,983527,208527,208 555,450Personnel Services Total 377,708312,942
-0 005818,995Professional Services4130000421000 0
-0 001,9331,209Prof Services/Internal4130000421001 0
-1,2241,224 1,2241,2241,416422120 Telephone - Cellular4130000 570
(2.4) %122119 122119237423400 Motor Pool Equipment Rental4130000 0
-0 001,808468Advertising Expense4130000425100 0
-0 001130Periodicals & Dues4130000425200 0
-1,0001,000 1,0001,0002,895425400 General Office Expense4130000 975
-0 00580Postage4130000425500 0
-0 008842Outside Printing Expense4130000425610 0
-0 070000Software Purchase/Licensing4130000425700 0
-183,725183,725 183,725183,725216,918425806 Computers-Software4130000 0
-0 00770422Clothing/Linen/Safety Supplies4130000426200 0
-0 004,4200Special Department Supplies4130000426800 0
-0 001,0360Travel & Meeting Expense4130000427100 0
CCReport Name: 2017_Mid_Cycle_Report
Report Description: Budget Book - Department Budget Detail wMD
06/07/2017Date:
Time: 425
Version:
Page:19:21:28
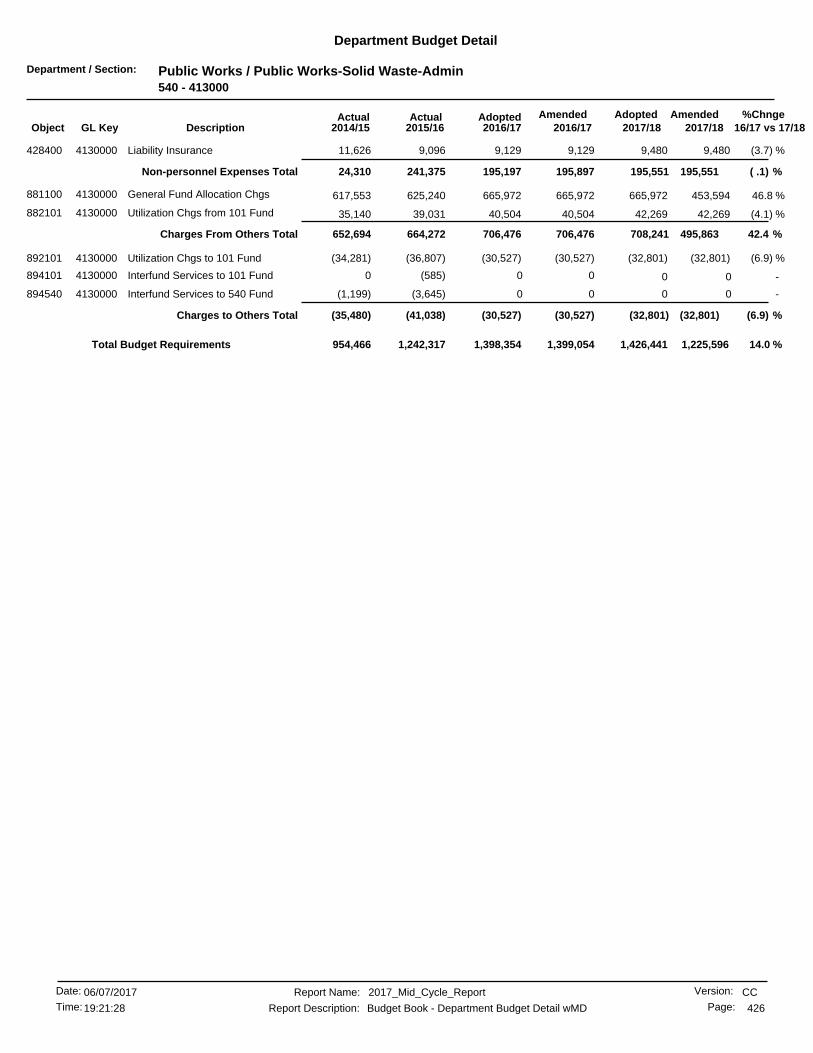
Department / Section: Public Works / Public Works-Solid Waste-Admin540 - 413000
Department Budget Detail
%Chnge16/17 vs 17/182017/182017/18
AmendedAdoptedAdopted2016/17
AmendedActualActual2016/172015/162014/15GL KeyObject Description
(3.7) %9,4809,129 9,4809,1299,096428400 Liability Insurance4130000 11,626
( .1) %195,551195,897195,197 195,551Non-personnel Expenses Total 241,37524,310
46.8 %453,594665,972 665,972665,972625,240881100 General Fund Allocation Chgs4130000 617,553
(4.1) %42,26940,504 42,26940,50439,031882101 Utilization Chgs from 101 Fund4130000 35,140
42.4 %495,863706,476706,476 708,241Charges From Others Total 664,272652,694
(6.9) %(32,801)(30,527) (32,801)(30,527)(36,807)892101 Utilization Chgs to 101 Fund4130000 (34,281)
-0 00(585)0Interfund Services to 101 Fund4130000894101 0
-0 00(3,645)(1,199)Interfund Services to 540 Fund4130000894540 0
(6.9) %(32,801)(30,527)(30,527) (32,801)Charges to Others Total (41,038)(35,480)
14.0 %1,398,354 1,225,5961,426,4411,399,0541,242,317954,466Total Budget Requirements
CCReport Name: 2017_Mid_Cycle_Report
Report Description: Budget Book - Department Budget Detail wMD
06/07/2017Date:
Time: 426
Version:
Page:19:21:28
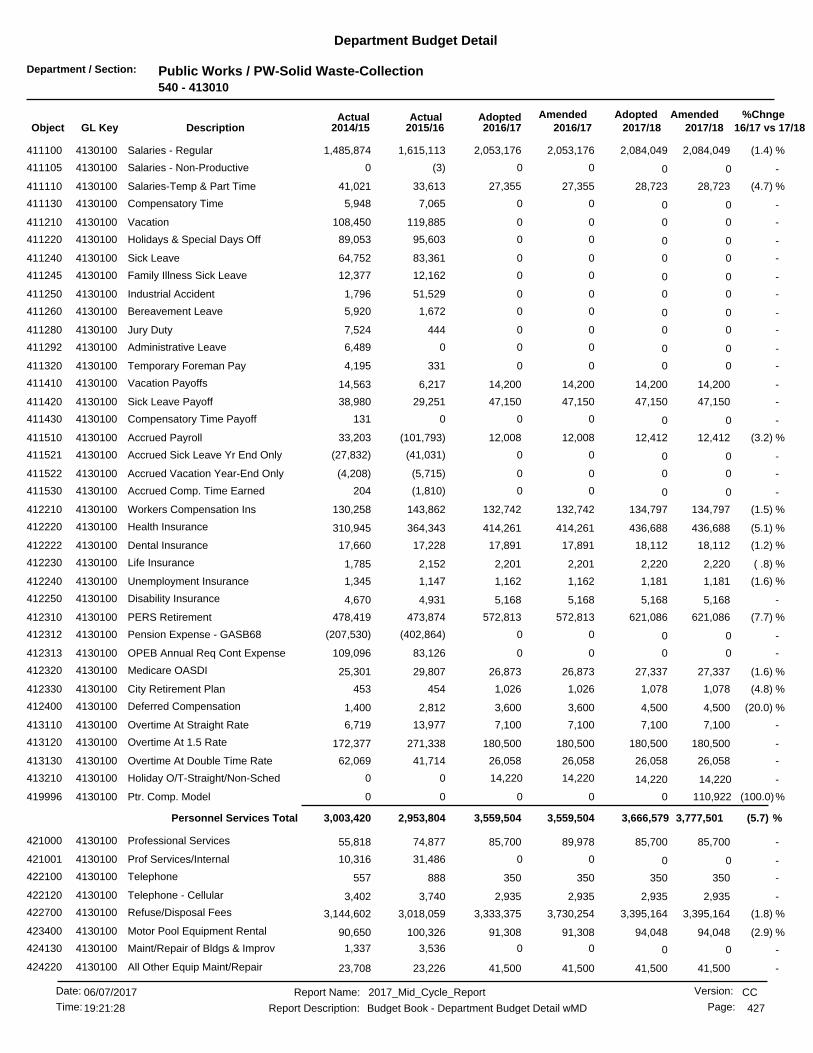
Department / Section: Public Works / PW-Solid Waste-Collection540 - 413010
Department Budget Detail
%Chnge16/17 vs 17/182017/182017/18
AmendedAdoptedAdopted2016/17
AmendedActualActual2016/172015/162014/15GL KeyObject Description
(1.4) %2,084,0492,053,176 2,084,0492,053,1761,615,113411100 Salaries - Regular4130100 1,485,874
-0 00(3)0Salaries - Non-Productive4130100411105 0
(4.7) %28,72327,355 28,72327,35533,613411110 Salaries-Temp & Part Time4130100 41,021
-0 007,0655,948Compensatory Time4130100411130 0
-0 00119,885108,450Vacation4130100411210 0
-0 0095,60389,053Holidays & Special Days Off4130100411220 0
-0 0083,36164,752Sick Leave4130100411240 0
-0 0012,16212,377Family Illness Sick Leave4130100411245 0
-0 0051,5291,796Industrial Accident4130100411250 0
-0 001,6725,920Bereavement Leave4130100411260 0
-0 004447,524Jury Duty4130100411280 0
-0 0006,489Administrative Leave4130100411292 0
-0 003314,195Temporary Foreman Pay4130100411320 0
-14,20014,200 14,20014,2006,217411410 Vacation Payoffs4130100 14,563
-47,15047,150 47,15047,15029,251411420 Sick Leave Payoff4130100 38,980
-0 000131Compensatory Time Payoff4130100411430 0
(3.2) %12,41212,008 12,41212,008(101,793)411510 Accrued Payroll4130100 33,203
-0 00(41,031)(27,832)Accrued Sick Leave Yr End Only4130100411521 0
-0 00(5,715)(4,208)Accrued Vacation Year-End Only4130100411522 0
-0 00(1,810)204Accrued Comp. Time Earned4130100411530 0
(1.5) %134,797132,742 134,797132,742143,862412210 Workers Compensation Ins4130100 130,258
(5.1) %436,688414,261 436,688414,261364,343412220 Health Insurance4130100 310,945
(1.2) %18,11217,891 18,11217,89117,228412222 Dental Insurance4130100 17,660
( .8) %2,2202,201 2,2202,2012,152412230 Life Insurance4130100 1,785
(1.6) %1,1811,162 1,1811,1621,147412240 Unemployment Insurance4130100 1,345
-5,1685,168 5,1685,1684,931412250 Disability Insurance4130100 4,670
(7.7) %621,086572,813 621,086572,813473,874412310 PERS Retirement4130100 478,419
-0 00(402,864)(207,530)Pension Expense - GASB684130100412312 0
-0 0083,126109,096OPEB Annual Req Cont Expense4130100412313 0
(1.6) %27,33726,873 27,33726,87329,807412320 Medicare OASDI4130100 25,301
(4.8) %1,0781,026 1,0781,026454412330 City Retirement Plan4130100 453
(20.0) %4,5003,600 4,5003,6002,812412400 Deferred Compensation4130100 1,400
-7,1007,100 7,1007,10013,977413110 Overtime At Straight Rate4130100 6,719
-180,500180,500 180,500180,500271,338413120 Overtime At 1.5 Rate4130100 172,377
-26,05826,058 26,05826,05841,714413130 Overtime At Double Time Rate4130100 62,069
-14,220 14,22014,22000Holiday O/T-Straight/Non-Sched4130100413210 14,220
(100.0)%0 110,922000Ptr. Comp. Model4130100419996 0
(5.7) %3,777,5013,559,5043,559,504 3,666,579Personnel Services Total 2,953,8043,003,420
-85,70085,700 85,70089,97874,877421000 Professional Services4130100 55,818
-0 0031,48610,316Prof Services/Internal4130100421001 0
-350350 350350888422100 Telephone4130100 557
-2,9352,935 2,9352,9353,740422120 Telephone - Cellular4130100 3,402
(1.8) %3,395,1643,333,375 3,395,1643,730,2543,018,059422700 Refuse/Disposal Fees4130100 3,144,602
(2.9) %94,04891,308 94,04891,308100,326423400 Motor Pool Equipment Rental4130100 90,650
-0 003,5361,337Maint/Repair of Bldgs & Improv4130100424130 0
-41,50041,500 41,50041,50023,226424220 All Other Equip Maint/Repair4130100 23,708
CCReport Name: 2017_Mid_Cycle_Report
Report Description: Budget Book - Department Budget Detail wMD
06/07/2017Date:
Time: 427
Version:
Page:19:21:28
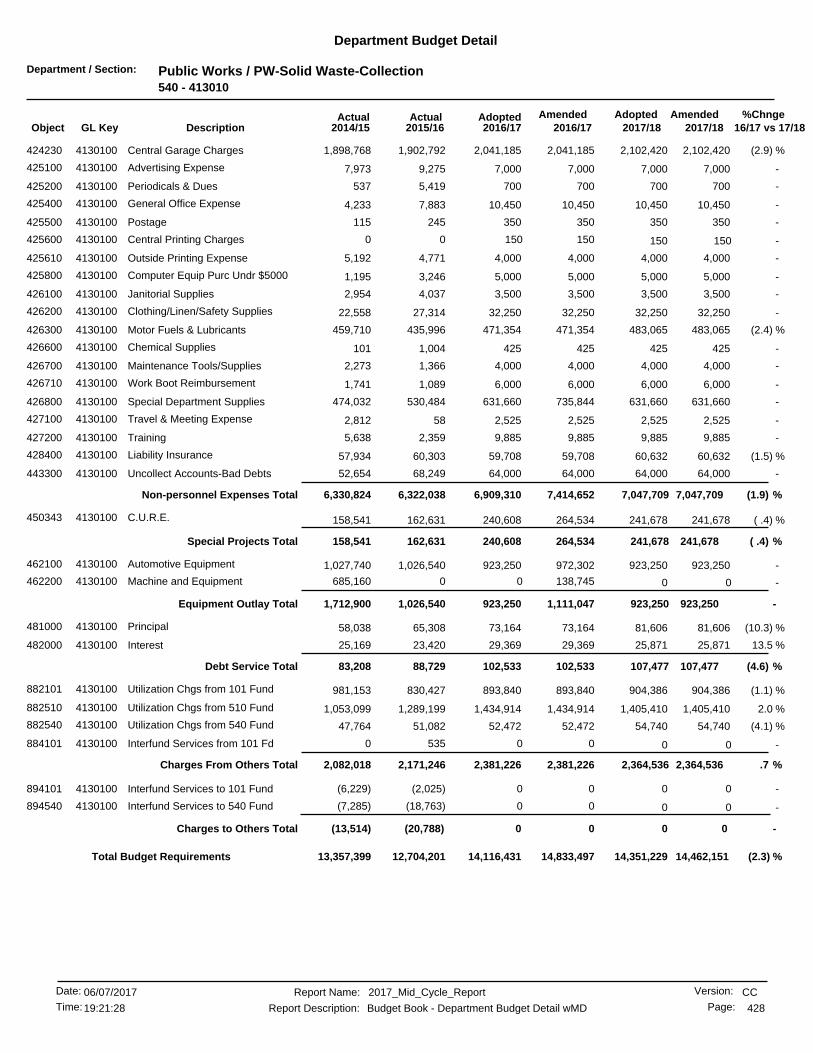
Department / Section: Public Works / PW-Solid Waste-Collection540 - 413010
Department Budget Detail
%Chnge16/17 vs 17/182017/182017/18
AmendedAdoptedAdopted2016/17
AmendedActualActual2016/172015/162014/15GL KeyObject Description
(2.9) %2,102,4202,041,185 2,102,4202,041,1851,902,792424230 Central Garage Charges4130100 1,898,768
-7,0007,000 7,0007,0009,275425100 Advertising Expense4130100 7,973
-700700 7007005,419425200 Periodicals & Dues4130100 537
-10,45010,450 10,45010,4507,883425400 General Office Expense4130100 4,233
-350350 350350245425500 Postage4130100 115
-150 15015000Central Printing Charges4130100425600 150
-4,0004,000 4,0004,0004,771425610 Outside Printing Expense4130100 5,192
-5,0005,000 5,0005,0003,246425800 Computer Equip Purc Undr $50004130100 1,195
-3,5003,500 3,5003,5004,037426100 Janitorial Supplies4130100 2,954
-32,25032,250 32,25032,25027,314426200 Clothing/Linen/Safety Supplies4130100 22,558
(2.4) %483,065471,354 483,065471,354435,996426300 Motor Fuels & Lubricants4130100 459,710
-425425 4254251,004426600 Chemical Supplies4130100 101
-4,0004,000 4,0004,0001,366426700 Maintenance Tools/Supplies4130100 2,273
-6,0006,000 6,0006,0001,089426710 Work Boot Reimbursement4130100 1,741
-631,660631,660 631,660735,844530,484426800 Special Department Supplies4130100 474,032
-2,5252,525 2,5252,52558427100 Travel & Meeting Expense4130100 2,812
-9,8859,885 9,8859,8852,359427200 Training4130100 5,638
(1.5) %60,63259,708 60,63259,70860,303428400 Liability Insurance4130100 57,934
-64,00064,000 64,00064,00068,249443300 Uncollect Accounts-Bad Debts4130100 52,654
(1.9) %7,047,7097,414,6526,909,310 7,047,709Non-personnel Expenses Total 6,322,0386,330,824
( .4) %241,678240,608 241,678264,534162,631450343 C.U.R.E.4130100 158,541
( .4) %241,678264,534240,608 241,678Special Projects Total 162,631158,541
-923,250923,250 923,250972,3021,026,540462100 Automotive Equipment4130100 1,027,740
-0 0138,7450685,160Machine and Equipment4130100462200 0
-923,2501,111,047923,250 923,250Equipment Outlay Total 1,026,5401,712,900
(10.3) %81,60673,164 81,60673,16465,308481000 Principal4130100 58,038
13.5 %25,87129,369 25,87129,36923,420482000 Interest4130100 25,169
(4.6) %107,477102,533102,533 107,477Debt Service Total 88,72983,208
(1.1) %904,386893,840 904,386893,840830,427882101 Utilization Chgs from 101 Fund4130100 981,153
2.0 %1,405,4101,434,914 1,405,4101,434,9141,289,199882510 Utilization Chgs from 510 Fund4130100 1,053,099
(4.1) %54,74052,472 54,74052,47251,082882540 Utilization Chgs from 540 Fund4130100 47,764
-0 005350Interfund Services from 101 Fd4130100884101 0
.7 %2,364,5362,381,2262,381,226 2,364,536Charges From Others Total 2,171,2462,082,018
-0 00(2,025)(6,229)Interfund Services to 101 Fund4130100894101 0
-0 00(18,763)(7,285)Interfund Services to 540 Fund4130100894540 0
-0 0Charges to Others Total 00(20,788)(13,514)
(2.3) %14,116,431 14,462,15114,351,22914,833,49712,704,20113,357,399Total Budget Requirements
CCReport Name: 2017_Mid_Cycle_Report
Report Description: Budget Book - Department Budget Detail wMD
06/07/2017Date:
Time: 428
Version:
Page:19:21:28

Department / Section: Public Works / PW-Solid Waste-Refuse Disposal540 - 413020
Department Budget Detail
%Chnge16/17 vs 17/182017/182017/18
AmendedAdoptedAdopted2016/17
AmendedActualActual2016/172015/162014/15GL KeyObject Description
-50,90050,900 50,900120,666432421043 Prof Svcs Regulatory Comp4130200 24,502
-28,00028,000 28,00028,00025,068422200 Electric4130200 0
-750750 750750833422500 Water4130200 0
-1,000 1,0001,00000Other Utilities4130200422600 1,000
-80,650150,41680,650 80,650Non-personnel Expenses Total 26,33324,502
(13.1) %51,00044,315 51,00055,76639,278440301 Landfill Capping & Landscaping9719724 16,315
-55,00055,000 55,000106,54826,701440301 Landfill Water Quality Testing9723724 50,238
-127,655127,655 127,655169,34188,630440301 Rule 1150.1 Compliance-Surf Gs9762124 120,476
-0 0012,93816,636Landfill Ops & Maint9767624440301 0
-35,00035,000 35,000527,20768,636440301 Landfill Flare Station9770224 47,113
(2.4) %268,655858,863261,970 268,655Capital Outlay & Grants Total 236,186250,779
(1.9) %342,620 349,305349,3051,009,279262,520275,281Total Budget Requirements
CCReport Name: 2017_Mid_Cycle_Report
Report Description: Budget Book - Department Budget Detail wMD
06/07/2017Date:
Time: 429
Version:
Page:19:21:28

Department / Section: Public Works / PW-Solid Waste-Private Hauler540 - 413030
Department Budget Detail
%Chnge16/17 vs 17/182017/182017/18
AmendedAdoptedAdopted2016/17
AmendedActualActual2016/172015/162014/15GL KeyObject Description
-4,133,5774,133,577 4,133,5774,528,6553,738,498459014 Burrtec Waste Ind, Inc4130300 3,993,309
-4,133,5774,528,6554,133,577 4,133,577Special Projects Total 3,738,4983,993,309
-4,133,577 4,133,5774,133,5774,528,6553,738,4983,993,309Total Budget Requirements
CCReport Name: 2017_Mid_Cycle_Report
Report Description: Budget Book - Department Budget Detail wMD
06/07/2017Date:
Time: 430
Version:
Page:19:21:28

Department / Section: Public Works / PW-Solid Waste-Street Sweeping540 - 413040
Department Budget Detail
%Chnge16/17 vs 17/182017/182017/18
AmendedAdoptedAdopted2016/17
AmendedActualActual2016/172015/162014/15GL KeyObject Description
( .3) %679,681677,061 679,681677,061564,653411100 Salaries - Regular4130400 521,552
(4.7) %43,38741,320 43,38741,32041,956411110 Salaries-Temp & Part Time4130400 32,977
-0 0010,7318,295Compensatory Time4130400411130 0
-0 0042,25047,277Vacation4130400411210 0
-0 0017,16215,794Holidays & Special Days Off4130400411220 0
-0 0046,50827,400Sick Leave4130400411240 0
-0 003293,813Family Illness Sick Leave4130400411245 0
-0 003,5362,769Bereavement Leave4130400411260 0
-0 001,4211,707Jury Duty4130400411280 0
-0 0005,686Administrative Leave4130400411292 0
-0 00320Night Shift Premium4130400411310 0
-0 00184366Temporary Foreman Pay4130400411320 0
-0 002,8217,900Vacation Payoffs4130400411410 0
-0 006530Sick Leave Payoff4130400411420 0
-0 001,3642,674Compensatory Time Payoff4130400411430 0
(2.3) %4,1574,061 4,1574,061(32,438)411510 Accrued Payroll4130400 5,630
-0 00(2,358)2,807Accrued Sick Leave Yr End Only4130400411521 0
-0 005,431(12,485)Accrued Vacation Year-End Only4130400411522 0
-0 00(2,181)1,028Accrued Comp. Time Earned4130400411530 0
( .6) %46,13445,834 46,13445,83450,470412210 Workers Compensation Ins4130400 52,056
(4.8) %126,151120,087 126,151120,087107,962412220 Health Insurance4130400 100,171
(1.2) %5,0444,979 5,0444,9795,050412222 Dental Insurance4130400 4,917
-758758 758758787412230 Life Insurance4130400 720
( .7) %404401 404401402412240 Unemployment Insurance4130400 496
-1,3601,360 1,3601,3601,396412250 Disability Insurance4130400 1,307
(6.5) %213,812199,817 213,812199,817167,582412310 PERS Retirement4130400 158,364
-0 0024,63235,146OPEB Annual Req Cont Expense4130400412313 0
( .7) %9,6239,555 9,6239,5559,095412320 Medicare OASDI4130400 8,013
(4.7) %1,6271,549 1,6271,5491,614412330 City Retirement Plan4130400 1,275
(20.0) %1,5001,200 1,5001,200937412400 Deferred Compensation4130400 600
-1,7421,742 1,7421,7421,769413110 Overtime At Straight Rate4130400 1,874
-15,13715,137 15,13715,13721,219413120 Overtime At 1.5 Rate4130400 14,077
-25,40025,400 25,40025,40037,207413130 Overtime At Double Time Rate4130400 32,819
-1,2161,216 1,2161,2161,575413210 Holiday O/T-Straight/Non-Sched4130400 922
(100.0)%0 34,107000Ptr. Comp. Model4130400419996 0
(4.9) %1,211,2401,151,4771,151,477 1,177,133Personnel Services Total 1,133,7661,087,962
-00 04223,827421000 Professional Services4130400 172
-7,0007,000 7,0007,00026,123421001 Prof Services/Internal4130400 11,487
-2,9702,970 2,9702,9703,216422120 Telephone - Cellular4130400 4,076
-4,5004,500 4,5004,5002,459422500 Water4130400 3,119
-150 150150029Other Utilities4130400422600 150
(1.4) %273,745269,780 273,745334,135194,817422700 Refuse/Disposal Fees4130400 194,211
(2.9) %30,78929,892 30,78929,89228,577423400 Motor Pool Equipment Rental4130400 29,556
-0 000211Const. Maint. Materials- St. M4130400424121 0
-0 00501,062Maint/Repair of Bldgs & Improv4130400424130 0
-74,50074,500 74,50074,50049,849424141 Street Sweeper Supplies4130400 53,728
CCReport Name: 2017_Mid_Cycle_Report
Report Description: Budget Book - Department Budget Detail wMD
06/07/2017Date:
Time: 431
Version:
Page:19:21:28

Department / Section: Public Works / PW-Solid Waste-Street Sweeping540 - 413040
Department Budget Detail
%Chnge16/17 vs 17/182017/182017/18
AmendedAdoptedAdopted2016/17
AmendedActualActual2016/172015/162014/15GL KeyObject Description
-500 50050000Signing Supplies4130400424143 500
-2,5002,500 2,5002,50035424220 All Other Equip Maint/Repair4130400 47
(2.9) %433,383420,760 433,383420,760465,516424230 Central Garage Charges4130400 420,237
-2,500 2,5002,50000Advertising Expense4130400425100 2,500
-0 001800Periodicals & Dues4130400425200 0
-1,6001,600 1,6001,60031425400 General Office Expense4130400 2,470
-100100 10010088425500 Postage4130400 64
-0 000100Central Printing Charges4130400425600 0
-0 0001,521Outside Printing Expense4130400425610 0
-100 10010000Janitorial Supplies4130400426100 100
-5,8485,848 5,8485,8484,575426200 Clothing/Linen/Safety Supplies4130400 7,182
(2.9) %96,01593,218 96,01593,21886,945426300 Motor Fuels & Lubricants4130400 78,095
-1,227 1,2271,22702,217Maintenance Tools/Supplies4130400426700 1,227
-1,6501,650 1,6501,6501,500426710 Work Boot Reimbursement4130400 1,500
-5,8005,800 5,8005,8002,988426800 Special Department Supplies4130400 6,205
-3,7083,708 3,7083,708834427200 Training4130400 1,419
( .6) %20,75020,616 20,75020,61621,156428400 Liability Insurance4130400 25,921
(2.1) %969,3351,013,696948,919 969,335Non-personnel Expenses Total 892,772844,638
-334,000334,000 334,0001,140,895354,231462100 Automotive Equipment4130400 233,270
-334,0001,140,895334,000 334,000Equipment Outlay Total 354,231233,270
(13.0) %388,128337,402 388,128337,402364,072882101 Utilization Chgs from 101 Fund4130400 352,107
-0 0018,00018,000Utilization Chgs from 260 Fund4130400882260 0
(3.7) %896,231862,788 896,231862,788755,943882570 Utilization Chgs from 570 Fund4130400 722,719
-2,500 2,5002,50000Interfund Services from 101 Fd4130400884101 2,500
(6.5) %1,286,8591,202,6901,202,690 1,286,859Charges From Others Total 1,138,0151,092,826
18.6 %(317,208)(376,367) (317,208)(376,367)(440,007)892260 Utilization Chgs to 260 Fund4130400 (421,475)
-(36,055)(36,055) (36,055)(36,055)(36,054)892550 Utilization Chgs to 550 Fund4130400 (36,054)
-0 00(3,089)(5,693)Interfund Services to 101 Fund4130400894101 0
-0 00(17,288)(16,491)Interfund Services to 540 Fund4130400894540 0
16.7 %(353,263)(412,422)(412,422) (353,263)Charges to Others Total (496,440)(479,714)
(6.4) %3,224,664 3,448,1713,414,0644,096,3373,022,3462,778,984Total Budget Requirements
CCReport Name: 2017_Mid_Cycle_Report
Report Description: Budget Book - Department Budget Detail wMD
06/07/2017Date:
Time: 432
Version:
Page:19:21:28

Department / Section: Public Works / PW-Solid Waste-Sundry/GG540 - 413050
Department Budget Detail
%Chnge16/17 vs 17/182017/182017/18
AmendedAdoptedAdopted2016/17
AmendedActualActual2016/172015/162014/15GL KeyObject Description
-0 00910C.U.R.E.4130500450343 0
( .4) %138,946138,272 138,946152,947134,045459022 Keep Riv Clean Cham of Commrc4130500 (47,250)
( .4) %138,946152,947138,272 138,946Special Projects Total 134,136(47,250)
( .4) %138,272 138,946138,946152,947134,136(47,250)Total Budget Requirements
CCReport Name: 2017_Mid_Cycle_Report
Report Description: Budget Book - Department Budget Detail wMD
06/07/2017Date:
Time: 433
Version:
Page:19:21:28
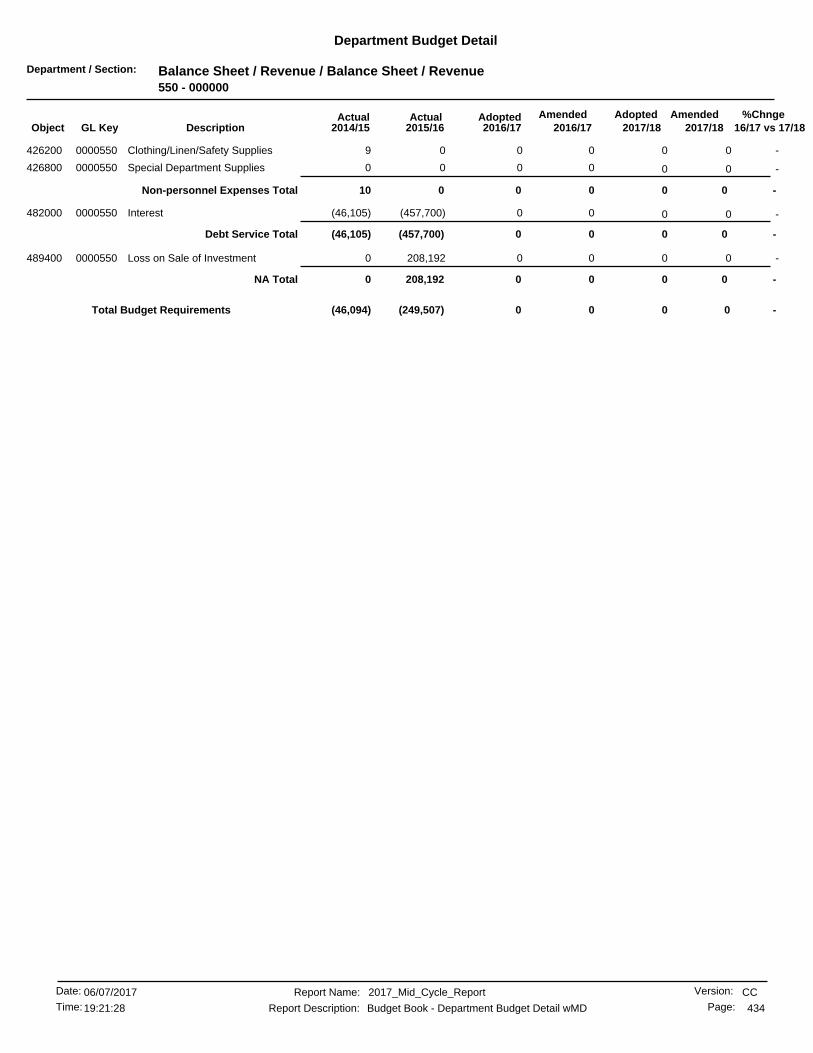
Department / Section: Balance Sheet / Revenue / Balance Sheet / Revenue550 - 000000
Department Budget Detail
%Chnge16/17 vs 17/182017/182017/18
AmendedAdoptedAdopted2016/17
AmendedActualActual2016/172015/162014/15GL KeyObject Description
-0 0009Clothing/Linen/Safety Supplies0000550426200 0
-0 0000Special Department Supplies0000550426800 0
-0 0Non-personnel Expenses Total 00010
-0 00(457,700)(46,105)Interest0000550482000 0
-0 0Debt Service Total 00(457,700)(46,105)
-0 00208,1920Loss on Sale of Investment0000550489400 0
-0 0NA Total 00208,1920
-00 00(249,507)Total Budget Requirements (46,094)
CCReport Name: 2017_Mid_Cycle_Report
Report Description: Budget Book - Department Budget Detail wMD
06/07/2017Date:
Time: 434
Version:
Page:19:21:28

Department / Section: Public Works / PW-Sewer Sys-Admin & Reg Compl550 - 412500
Department Budget Detail
%Chnge16/17 vs 17/182017/182017/18
AmendedAdoptedAdopted2016/17
AmendedActualActual2016/172015/162014/15GL KeyObject Description
(1.2) %1,368,7761,351,111 1,368,7761,351,1111,068,022411100 Salaries - Regular4125000 805,642
-0 001,060528Compensatory Time4125000411130 0
-0 0055,95454,414Vacation4125000411210 0
-0 0045,04139,005Holidays & Special Days Off4125000411220 0
-0 0018,84312,648Sick Leave4125000411240 0
-0 0013,2509,221Family Illness Sick Leave4125000411245 0
-0 002,423567Bereavement Leave4125000411260 0
-0 003572,158Jury Duty4125000411280 0
-0 0017,56217,436Administrative Leave4125000411292 0
-0 004,75224,353Vacation Payoffs4125000411410 0
(2.9) %7,8747,640 7,8747,640(44,827)411510 Accrued Payroll4125000 10,199
-0 002,81323,211Accrued Sick Leave Yr End Only4125000411521 0
-0 0018,345(18,100)Accrued Vacation Year-End Only4125000411522 0
-0 00(13,729)14,828Accrued Comp. Time Earned4125000411530 0
(1.2) %29,83929,454 29,83929,45433,340412210 Workers Compensation Ins4125000 21,985
(3.7) %199,178191,738 199,178191,738147,909412220 Health Insurance4125000 115,557
-8,1008,100 8,1008,1007,020412222 Dental Insurance4125000 6,055
(1.1) %7,1137,028 7,1137,0286,279412230 Life Insurance4125000 4,489
(1.1) %764755 764755759412240 Unemployment Insurance4125000 903
-680680 680680564412250 Disability Insurance4125000 549
(7.4) %431,019398,755 431,019398,755362,777412310 PERS Retirement4125000 266,672
-0 0033,74640,543OPEB Annual Req Cont Expense4125000412313 0
(1.2) %19,84819,593 19,84819,59318,026412320 Medicare OASDI4125000 14,479
(20.0) %16,50013,200 16,50013,2007,687412400 Deferred Compensation4125000 4,250
-0 00100Overtime At Straight Rate4125000413110 0
-0 0054(731)Overtime At 1.5 Rate4125000413120 0
-0 000(119)Overtime At Double Time Rate4125000413130 0
(100.0)%0 42,843000Ptr. Comp. Model4125000419996 0
(4.8) %2,132,5342,028,0542,028,054 2,089,691Personnel Services Total 1,808,0461,470,750
-15,00015,000 15,00019,7256,801421000 Professional Services4125000 146,211
-20,00020,000 20,00020,0002,909421000 Professional Services4125001 8,813
-3,0003,000 3,0003,0006,742421043 Prof Svcs Regulatory Comp4125000 0
( .3) %266,890265,944 266,890269,309233,188421043 Prof Svcs Regulatory Comp4125001 251,297
-7,630 7,6307,63001,200Prof Svcs Regulatory Comp4125002421043 7,630
-350,000350,000 350,000350,0001,739,203421100 Outside Legal Services4125000 448,225
-0 08,75000Ag Park Cleanup9767500421100 0
-4,5004,500 4,5004,5005,976422100 Telephone4125000 4,218
-6,5006,500 6,5006,5005,751422120 Telephone - Cellular4125000 4,672
-1,5611,561 1,5611,5612,892422120 Telephone - Cellular4125003 2,962
-0 000164Electric4125000422200 0
-0 000164Gas4125000422300 0
-25,00025,000 25,00025,00026,564423400 Motor Pool Equipment Rental4125000 24,485
-0 00350Maint/Repair of Bldgs & Improv4125000424130 0
-8,6508,650 8,6508,65015,483424220 All Other Equip Maint/Repair4125000 9,644
-3,500 3,5003,5000134Central Garage Charges4125000424230 3,500
-0 000475Advertising Expense4125000425100 0
CCReport Name: 2017_Mid_Cycle_Report
Report Description: Budget Book - Department Budget Detail wMD
06/07/2017Date:
Time: 435
Version:
Page:19:21:28
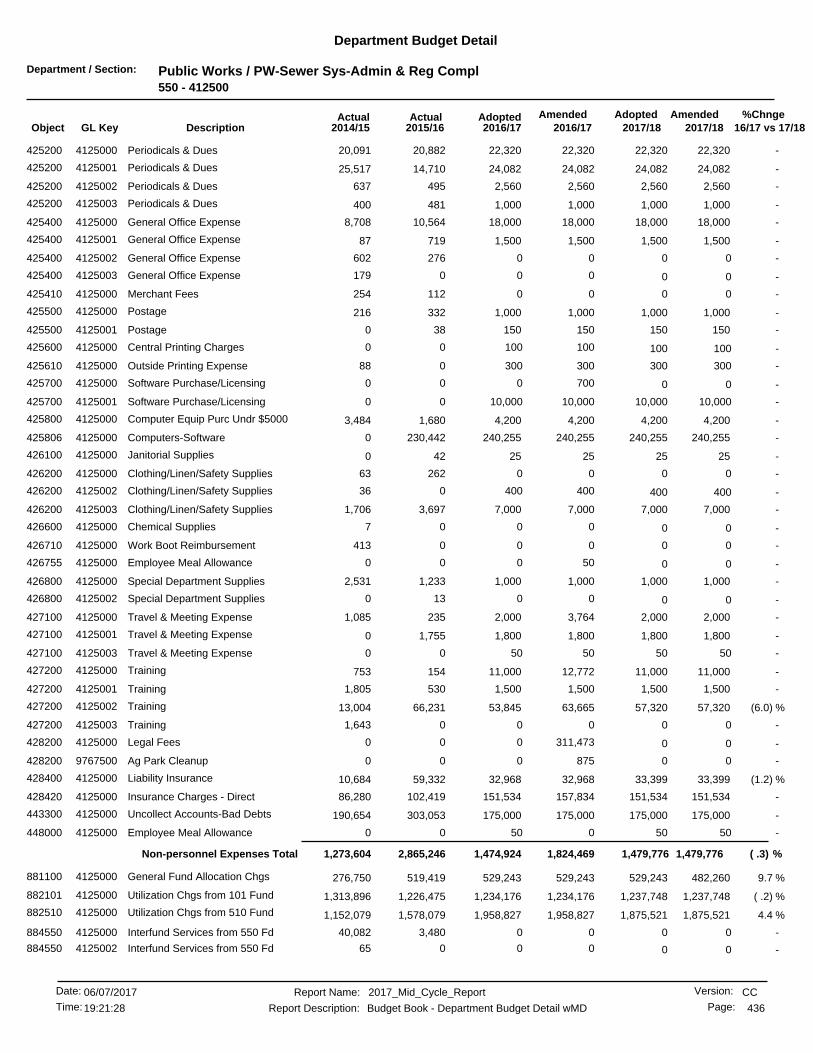
Department / Section: Public Works / PW-Sewer Sys-Admin & Reg Compl550 - 412500
Department Budget Detail
%Chnge16/17 vs 17/182017/182017/18
AmendedAdoptedAdopted2016/17
AmendedActualActual2016/172015/162014/15GL KeyObject Description
-22,32022,320 22,32022,32020,882425200 Periodicals & Dues4125000 20,091
-24,08224,082 24,08224,08214,710425200 Periodicals & Dues4125001 25,517
-2,5602,560 2,5602,560495425200 Periodicals & Dues4125002 637
-1,0001,000 1,0001,000481425200 Periodicals & Dues4125003 400
-18,00018,000 18,00018,00010,564425400 General Office Expense4125000 8,708
-1,5001,500 1,5001,500719425400 General Office Expense4125001 87
-0 00276602General Office Expense4125002425400 0
-0 000179General Office Expense4125003425400 0
-0 00112254Merchant Fees4125000425410 0
-1,0001,000 1,0001,000332425500 Postage4125000 216
-150150 15015038425500 Postage4125001 0
-100 10010000Central Printing Charges4125000425600 100
-300 300300088Outside Printing Expense4125000425610 300
-0 070000Software Purchase/Licensing4125000425700 0
-10,000 10,00010,00000Software Purchase/Licensing4125001425700 10,000
-4,2004,200 4,2004,2001,680425800 Computer Equip Purc Undr $50004125000 3,484
-240,255240,255 240,255240,255230,442425806 Computers-Software4125000 0
-2525 252542426100 Janitorial Supplies4125000 0
-0 0026263Clothing/Linen/Safety Supplies4125000426200 0
-400 400400036Clothing/Linen/Safety Supplies4125002426200 400
-7,0007,000 7,0007,0003,697426200 Clothing/Linen/Safety Supplies4125003 1,706
-0 0007Chemical Supplies4125000426600 0
-0 000413Work Boot Reimbursement4125000426710 0
-0 05000Employee Meal Allowance4125000426755 0
-1,0001,000 1,0001,0001,233426800 Special Department Supplies4125000 2,531
-0 00130Special Department Supplies4125002426800 0
-2,0002,000 2,0003,764235427100 Travel & Meeting Expense4125000 1,085
-1,8001,800 1,8001,8001,755427100 Travel & Meeting Expense4125001 0
-50 505000Travel & Meeting Expense4125003427100 50
-11,00011,000 11,00012,772154427200 Training4125000 753
-1,5001,500 1,5001,500530427200 Training4125001 1,805
(6.0) %57,32053,845 57,32063,66566,231427200 Training4125002 13,004
-0 0001,643Training4125003427200 0
-0 0311,47300Legal Fees4125000428200 0
-0 087500Ag Park Cleanup9767500428200 0
(1.2) %33,39932,968 33,39932,96859,332428400 Liability Insurance4125000 10,684
-151,534151,534 151,534157,834102,419428420 Insurance Charges - Direct4125000 86,280
-175,000175,000 175,000175,000303,053443300 Uncollect Accounts-Bad Debts4125000 190,654
-50 50000Employee Meal Allowance4125000448000 50
( .3) %1,479,7761,824,4691,474,924 1,479,776Non-personnel Expenses Total 2,865,2461,273,604
9.7 %482,260529,243 529,243529,243519,419881100 General Fund Allocation Chgs4125000 276,750
( .2) %1,237,7481,234,176 1,237,7481,234,1761,226,475882101 Utilization Chgs from 101 Fund4125000 1,313,896
4.4 %1,875,5211,958,827 1,875,5211,958,8271,578,079882510 Utilization Chgs from 510 Fund4125000 1,152,079
-0 003,48040,082Interfund Services from 550 Fd4125000884550 0
-0 00065Interfund Services from 550 Fd4125002884550 0
CCReport Name: 2017_Mid_Cycle_Report
Report Description: Budget Book - Department Budget Detail wMD
06/07/2017Date:
Time: 436
Version:
Page:19:21:28
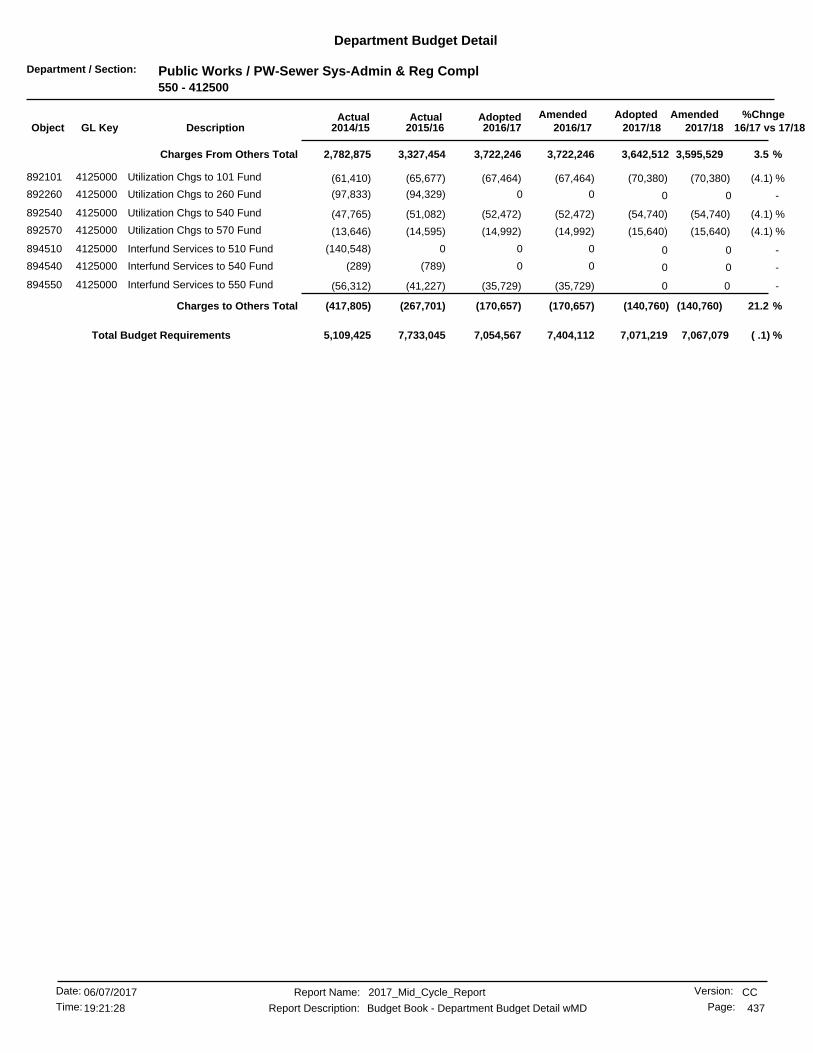
Department / Section: Public Works / PW-Sewer Sys-Admin & Reg Compl550 - 412500
Department Budget Detail
%Chnge16/17 vs 17/182017/182017/18
AmendedAdoptedAdopted2016/17
AmendedActualActual2016/172015/162014/15GL KeyObject Description
3.5 %3,595,5293,722,2463,722,246 3,642,512Charges From Others Total 3,327,4542,782,875
(4.1) %(70,380)(67,464) (70,380)(67,464)(65,677)892101 Utilization Chgs to 101 Fund4125000 (61,410)
-0 00(94,329)(97,833)Utilization Chgs to 260 Fund4125000892260 0
(4.1) %(54,740)(52,472) (54,740)(52,472)(51,082)892540 Utilization Chgs to 540 Fund4125000 (47,765)
(4.1) %(15,640)(14,992) (15,640)(14,992)(14,595)892570 Utilization Chgs to 570 Fund4125000 (13,646)
-0 000(140,548)Interfund Services to 510 Fund4125000894510 0
-0 00(789)(289)Interfund Services to 540 Fund4125000894540 0
-0(35,729) 0(35,729)(41,227)894550 Interfund Services to 550 Fund4125000 (56,312)
21.2 %(140,760)(170,657)(170,657) (140,760)Charges to Others Total (267,701)(417,805)
( .1) %7,054,567 7,067,0797,071,2197,404,1127,733,0455,109,425Total Budget Requirements
CCReport Name: 2017_Mid_Cycle_Report
Report Description: Budget Book - Department Budget Detail wMD
06/07/2017Date:
Time: 437
Version:
Page:19:21:28

Department / Section: Public Works / PW-Sewer-Collection Syst Maint550 - 412510
Department Budget Detail
%Chnge16/17 vs 17/182017/182017/18
AmendedAdoptedAdopted2016/17
AmendedActualActual2016/172015/162014/15GL KeyObject Description
(2.8) %971,450943,626 971,450943,626700,426411100 Salaries - Regular4125100 821,921
-0 000599Salaries-Temp & Part Time4125100411110 0
-0 0019,64018,899Compensatory Time4125100411130 0
-0 0043,72361,107Vacation4125100411210 0
-0 0032,80642,493Holidays & Special Days Off4125100411220 0
-0 0094829Rest Time Pay - IBEW4125100411225 0
-0 0018,01828,802Sick Leave4125100411240 0
-0 0010,38314,126Family Illness Sick Leave4125100411245 0
-0 005,375103Industrial Accident4125100411250 0
-0 00503466Bereavement Leave4125100411260 0
-0 001,7941,706Jury Duty4125100411280 0
-0 002,59523,516Administrative Leave4125100411292 0
-0 00562,191Night Shift Premium4125100411310 0
-0 009,37719,489Vacation Payoffs4125100411410 0
-0 00017,110Sick Leave Payoff4125100411420 0
-0 001,7540Compensatory Time Payoff4125100411430 0
(4.3) %5,6875,441 5,6875,441(39,750)411510 Accrued Payroll4125100 2,915
-0 00(1,428)(17,272)Accrued Sick Leave Yr End Only4125100411521 0
-0 00(6,852)(16,139)Accrued Vacation Year-End Only4125100411522 0
-0 00(7,260)2,214Accrued Comp. Time Earned4125100411530 0
(2.8) %21,17920,571 21,17920,57126,275412210 Workers Compensation Ins4125100 27,955
(4.0) %193,983186,057 193,983186,057146,491412220 Health Insurance4125100 172,413
( .7) %8,2848,219 8,2848,2197,143412222 Dental Insurance4125100 8,269
(2.0) %2,3872,337 2,3872,3371,821412230 Life Insurance4125100 2,000
(3.1) %543526 543526597412240 Unemployment Insurance4125100 718
-1,6321,632 1,6321,6321,600412250 Disability Insurance4125100 1,924
(9.2) %280,574254,687 280,574254,687203,351412310 PERS Retirement4125100 244,492
-0 0033,42360,491OPEB Annual Req Cont Expense4125100412313 0
(2.8) %14,08513,683 14,08513,68312,605412320 Medicare OASDI4125100 14,260
(20.0) %6,0004,800 6,0004,8001,050412400 Deferred Compensation4125100 925
-23,10023,100 23,10023,10026,687413110 Overtime At Straight Rate4125100 20,396
-70,00070,000 70,00070,00055,906413120 Overtime At 1.5 Rate4125100 58,129
-8,5008,500 8,5008,5005,369413130 Overtime At Double Time Rate4125100 8,524
-0 00880Holiday O/T-Straight/Non-Sched4125100413210 0
-0 00920Holiday O/T-Strt/Subj To Retir4125100413230 0
(100.0)%0 42,975000Ptr. Comp. Model4125100419996 0
(6.4) %1,650,3791,543,1791,543,179 1,607,404Personnel Services Total 1,313,7651,645,584
(1.8) %269,965265,090 269,965296,766249,030421000 Professional Services4125100 136,187
-0 003,319609Prof Services/Internal4125100421001 0
-1,6201,620 1,6201,620655422100 Telephone4125100 1,418
-10,00010,000 10,00010,00011,839422120 Telephone - Cellular4125100 10,881
-152,000152,000 152,000152,000166,107422200 Electric4125100 153,194
-500500 5005006,743422300 Gas4125100 1,174
-17,30017,300 17,30017,30017,278422500 Water4125100 19,021
-5,850 5,8505,85003,156Other Utilities4125100422600 5,850
-3,000 3,0003,00000Refuse/Disposal Fees4125100422700 3,000
CCReport Name: 2017_Mid_Cycle_Report
Report Description: Budget Book - Department Budget Detail wMD
06/07/2017Date:
Time: 438
Version:
Page:19:21:28

Department / Section: Public Works / PW-Sewer-Collection Syst Maint550 - 412510
Department Budget Detail
%Chnge16/17 vs 17/182017/182017/18
AmendedAdoptedAdopted2016/17
AmendedActualActual2016/172015/162014/15GL KeyObject Description
-4,0004,000 4,0004,0003,851423100 Equipment Rental4125100 877
(4.5) %110,000105,000 110,000105,000100,391423400 Motor Pool Equipment Rental4125100 107,069
(3.7) %13,60513,100 13,60513,51014,091424120 Constr & Maint Materials4125100 11,465
-0 002950Const. Maint. Materials- Storm4125100424124 0
-1,5001,500 1,5001,500622424130 Maint/Repair of Bldgs & Improv4125100 534
-0 00151,8960Maintenance & Repair - General4125100424200 0
-595,500595,500 595,500937,60785,392424220 All Other Equip Maint/Repair4125100 255,143
(2.7) %180,000175,000 180,000175,000156,899424230 Central Garage Charges4125100 135,350
-2,000 2,0002,00000Central Communications Chg4125100424240 2,000
-2,8002,800 2,8002,8004,076425200 Periodicals & Dues4125100 4,043
-1,000 1,0001,0000168Photo & Recording Supplies4125100425300 1,000
-3,0003,000 3,0003,0002,501425400 General Office Expense4125100 895
-50 505000Postage4125100425500 50
-1,500 1,5001,500044Central Printing Charges4125100425600 1,500
-0 00290Outside Printing Expense4125100425610 0
-3,000 3,0003,00000Software Purchase/Licensing4125100425700 3,000
-21,00021,000 21,00030,8011,148425800 Computer Equip Purc Undr $50004125100 2,052
-100100 100100305426100 Janitorial Supplies4125100 69
( .2) %23,61323,546 23,61323,54614,893426200 Clothing/Linen/Safety Supplies4125100 13,956
(9.0) %55,00050,000 55,00050,00035,000426300 Motor Fuels & Lubricants4125100 37,619
(1.0) %104,390103,300 104,390103,30047,003426600 Chemical Supplies4125100 58,147
-68,50068,500 68,50093,84731,969426700 Maintenance Tools/Supplies4125100 32,451
-2,8502,850 2,8502,8502,529426710 Work Boot Reimbursement4125100 2,301
-0 05000Employee Meal Allowance4125100426755 0
-5,5005,500 5,5005,5003,496426800 Special Department Supplies4125100 12,123
-17,67017,670 17,67017,6709,124427200 Training4125100 5,860
(2.8) %23,70423,024 23,70423,02446,761428400 Liability Insurance4125100 38,952
-50 50000Employee Meal Allowance4125100448000 50
(1.3) %1,700,5672,087,6931,678,350 1,700,567Non-personnel Expenses Total 1,167,2541,044,768
( .9) %1,804,2811,786,417 1,804,2811,786,4171,751,388450095 Street Replacement Charge4125100 1,739,214
( .9) %1,804,2811,786,4171,786,417 1,804,281Special Projects Total 1,751,3881,739,214
(100.0)%0 482,774281,88000Automotive Equipment4125100462100 482,774
1202.3%130,236 10,000138,537015,083Machine and Equipment4125100462200 10,000
-250,000 250,000240,37500Sewer Equip Replacement/Const4125100462210 250,000
(48.8) %380,236 742,774Equipment Outlay Total 742,774660,792015,083
53.1 %76,829117,638 117,638117,638106,179881100 General Fund Allocation Chgs4125100 114,654
-120,000120,000 120,000120,000120,000882101 Utilization Chgs from 101 Fund4125100 120,000
(100.0)%0 93,000000Utilization Chgs from 260 Fund4125100882260 0
-10,00010,000 10,00010,0001,255884101 Interfund Services from 101 Fd4125100 88
-0 0054,494157,038Interfund Services from 550 Fd4125100884550 0
(17.4) %299,829247,638247,638 247,638Charges From Others Total 281,929391,781
-0 00(70,002)0Utilization Chgs to 260 Fund4125100892260 0
-0 00(78,991)(109,769)Interfund Services to 101 Fund4125100894101 0
-0 000(43)Interfund Services to 510 Fund4125100894510 0
CCReport Name: 2017_Mid_Cycle_Report
Report Description: Budget Book - Department Budget Detail wMD
06/07/2017Date:
Time: 439
Version:
Page:19:21:28
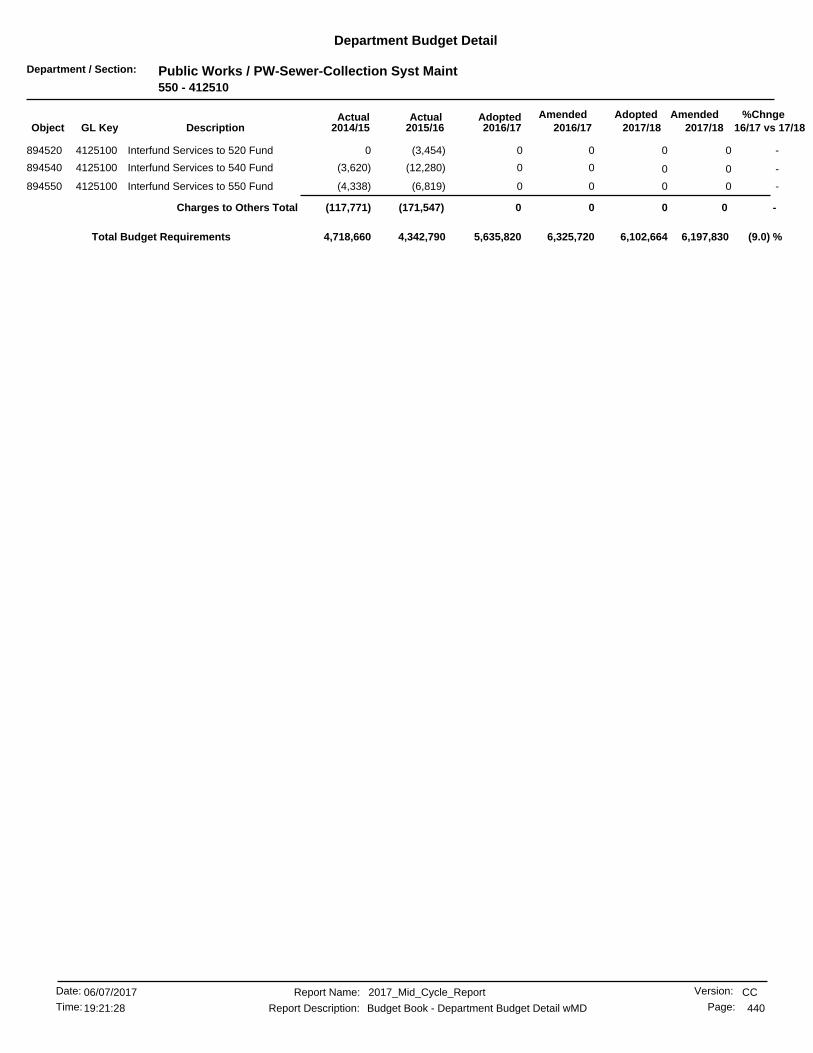
Department / Section: Public Works / PW-Sewer-Collection Syst Maint550 - 412510
Department Budget Detail
%Chnge16/17 vs 17/182017/182017/18
AmendedAdoptedAdopted2016/17
AmendedActualActual2016/172015/162014/15GL KeyObject Description
-0 00(3,454)0Interfund Services to 520 Fund4125100894520 0
-0 00(12,280)(3,620)Interfund Services to 540 Fund4125100894540 0
-0 00(6,819)(4,338)Interfund Services to 550 Fund4125100894550 0
-0 0Charges to Others Total 00(171,547)(117,771)
(9.0) %5,635,820 6,197,8306,102,6646,325,7204,342,7904,718,660Total Budget Requirements
CCReport Name: 2017_Mid_Cycle_Report
Report Description: Budget Book - Department Budget Detail wMD
06/07/2017Date:
Time: 440
Version:
Page:19:21:28
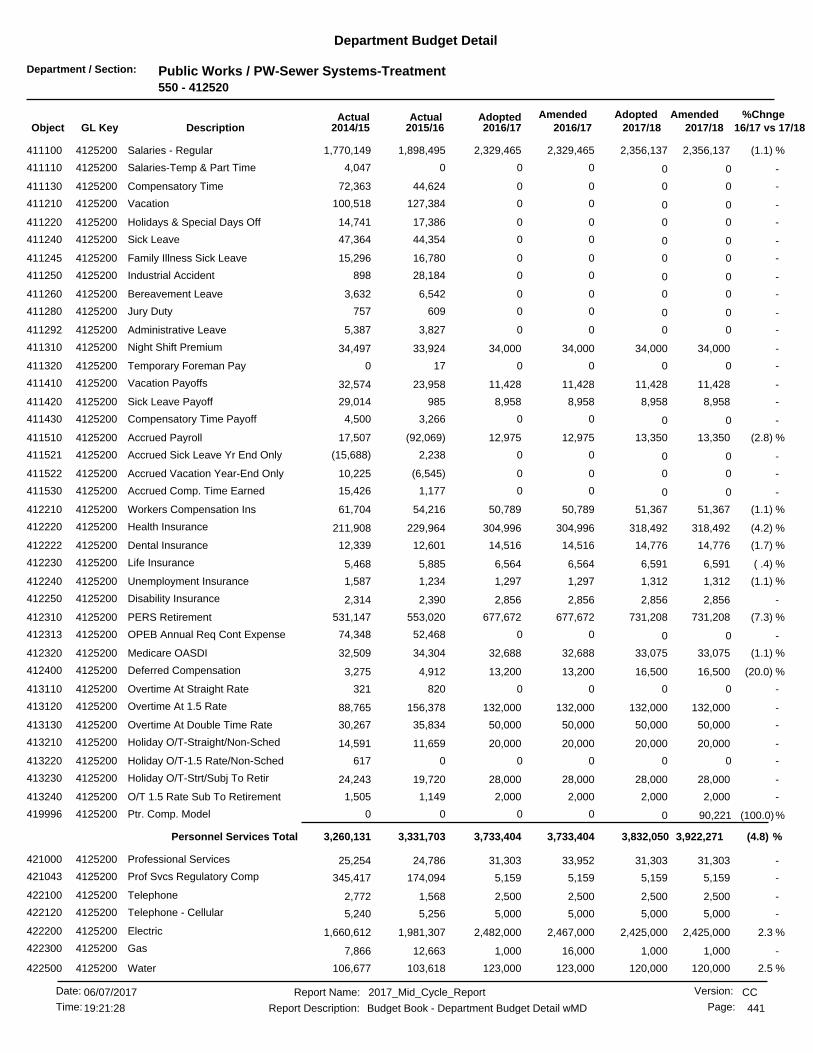
Department / Section: Public Works / PW-Sewer Systems-Treatment550 - 412520
Department Budget Detail
%Chnge16/17 vs 17/182017/182017/18
AmendedAdoptedAdopted2016/17
AmendedActualActual2016/172015/162014/15GL KeyObject Description
(1.1) %2,356,1372,329,465 2,356,1372,329,4651,898,495411100 Salaries - Regular4125200 1,770,149
-0 0004,047Salaries-Temp & Part Time4125200411110 0
-0 0044,62472,363Compensatory Time4125200411130 0
-0 00127,384100,518Vacation4125200411210 0
-0 0017,38614,741Holidays & Special Days Off4125200411220 0
-0 0044,35447,364Sick Leave4125200411240 0
-0 0016,78015,296Family Illness Sick Leave4125200411245 0
-0 0028,184898Industrial Accident4125200411250 0
-0 006,5423,632Bereavement Leave4125200411260 0
-0 00609757Jury Duty4125200411280 0
-0 003,8275,387Administrative Leave4125200411292 0
-34,00034,000 34,00034,00033,924411310 Night Shift Premium4125200 34,497
-0 00170Temporary Foreman Pay4125200411320 0
-11,42811,428 11,42811,42823,958411410 Vacation Payoffs4125200 32,574
-8,9588,958 8,9588,958985411420 Sick Leave Payoff4125200 29,014
-0 003,2664,500Compensatory Time Payoff4125200411430 0
(2.8) %13,35012,975 13,35012,975(92,069)411510 Accrued Payroll4125200 17,507
-0 002,238(15,688)Accrued Sick Leave Yr End Only4125200411521 0
-0 00(6,545)10,225Accrued Vacation Year-End Only4125200411522 0
-0 001,17715,426Accrued Comp. Time Earned4125200411530 0
(1.1) %51,36750,789 51,36750,78954,216412210 Workers Compensation Ins4125200 61,704
(4.2) %318,492304,996 318,492304,996229,964412220 Health Insurance4125200 211,908
(1.7) %14,77614,516 14,77614,51612,601412222 Dental Insurance4125200 12,339
( .4) %6,5916,564 6,5916,5645,885412230 Life Insurance4125200 5,468
(1.1) %1,3121,297 1,3121,2971,234412240 Unemployment Insurance4125200 1,587
-2,8562,856 2,8562,8562,390412250 Disability Insurance4125200 2,314
(7.3) %731,208677,672 731,208677,672553,020412310 PERS Retirement4125200 531,147
-0 0052,46874,348OPEB Annual Req Cont Expense4125200412313 0
(1.1) %33,07532,688 33,07532,68834,304412320 Medicare OASDI4125200 32,509
(20.0) %16,50013,200 16,50013,2004,912412400 Deferred Compensation4125200 3,275
-0 00820321Overtime At Straight Rate4125200413110 0
-132,000132,000 132,000132,000156,378413120 Overtime At 1.5 Rate4125200 88,765
-50,00050,000 50,00050,00035,834413130 Overtime At Double Time Rate4125200 30,267
-20,00020,000 20,00020,00011,659413210 Holiday O/T-Straight/Non-Sched4125200 14,591
-0 000617Holiday O/T-1.5 Rate/Non-Sched4125200413220 0
-28,00028,000 28,00028,00019,720413230 Holiday O/T-Strt/Subj To Retir4125200 24,243
-2,0002,000 2,0002,0001,149413240 O/T 1.5 Rate Sub To Retirement4125200 1,505
(100.0)%0 90,221000Ptr. Comp. Model4125200419996 0
(4.8) %3,922,2713,733,4043,733,404 3,832,050Personnel Services Total 3,331,7033,260,131
-31,30331,303 31,30333,95224,786421000 Professional Services4125200 25,254
-5,1595,159 5,1595,159174,094421043 Prof Svcs Regulatory Comp4125200 345,417
-2,5002,500 2,5002,5001,568422100 Telephone4125200 2,772
-5,0005,000 5,0005,0005,256422120 Telephone - Cellular4125200 5,240
2.3 %2,425,0002,482,000 2,425,0002,467,0001,981,307422200 Electric4125200 1,660,612
-1,0001,000 1,00016,00012,663422300 Gas4125200 7,866
2.5 %120,000123,000 120,000123,000103,618422500 Water4125200 106,677
CCReport Name: 2017_Mid_Cycle_Report
Report Description: Budget Book - Department Budget Detail wMD
06/07/2017Date:
Time: 441
Version:
Page:19:21:28
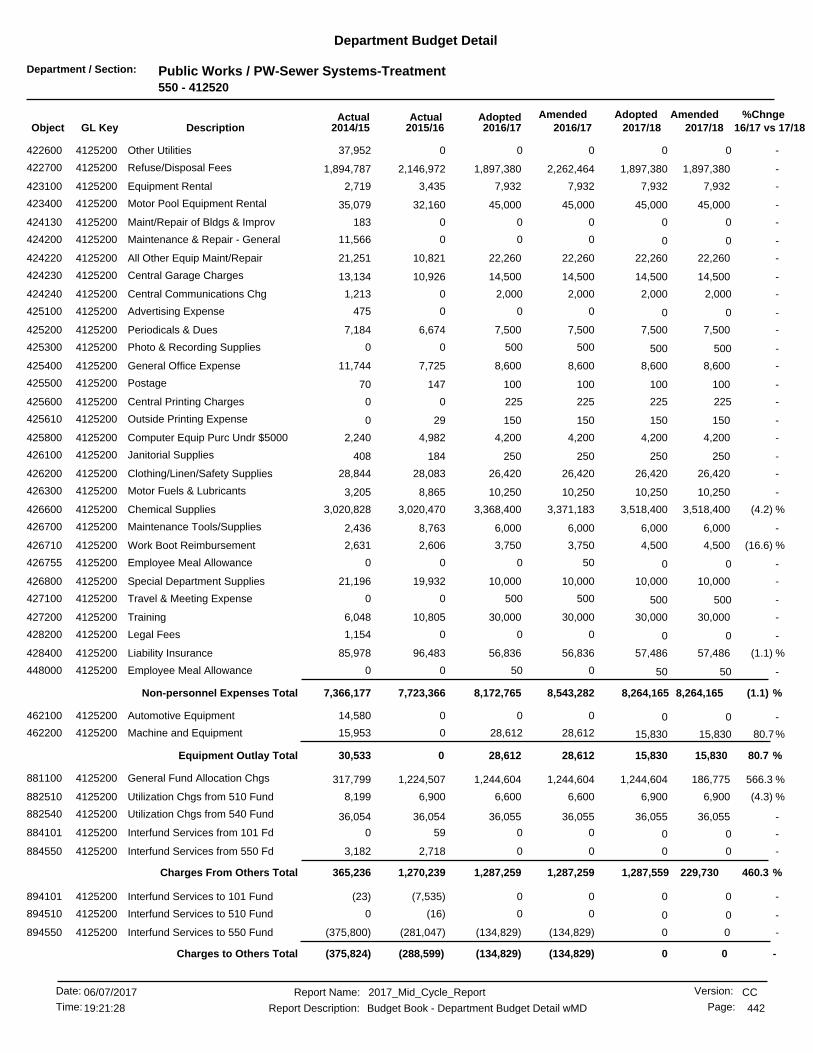
Department / Section: Public Works / PW-Sewer Systems-Treatment550 - 412520
Department Budget Detail
%Chnge16/17 vs 17/182017/182017/18
AmendedAdoptedAdopted2016/17
AmendedActualActual2016/172015/162014/15GL KeyObject Description
-0 00037,952Other Utilities4125200422600 0
-1,897,3801,897,380 1,897,3802,262,4642,146,972422700 Refuse/Disposal Fees4125200 1,894,787
-7,9327,932 7,9327,9323,435423100 Equipment Rental4125200 2,719
-45,00045,000 45,00045,00032,160423400 Motor Pool Equipment Rental4125200 35,079
-0 000183Maint/Repair of Bldgs & Improv4125200424130 0
-0 00011,566Maintenance & Repair - General4125200424200 0
-22,26022,260 22,26022,26010,821424220 All Other Equip Maint/Repair4125200 21,251
-14,50014,500 14,50014,50010,926424230 Central Garage Charges4125200 13,134
-2,000 2,0002,00001,213Central Communications Chg4125200424240 2,000
-0 000475Advertising Expense4125200425100 0
-7,5007,500 7,5007,5006,674425200 Periodicals & Dues4125200 7,184
-500 50050000Photo & Recording Supplies4125200425300 500
-8,6008,600 8,6008,6007,725425400 General Office Expense4125200 11,744
-100100 100100147425500 Postage4125200 70
-225 22522500Central Printing Charges4125200425600 225
-150150 15015029425610 Outside Printing Expense4125200 0
-4,2004,200 4,2004,2004,982425800 Computer Equip Purc Undr $50004125200 2,240
-250250 250250184426100 Janitorial Supplies4125200 408
-26,42026,420 26,42026,42028,083426200 Clothing/Linen/Safety Supplies4125200 28,844
-10,25010,250 10,25010,2508,865426300 Motor Fuels & Lubricants4125200 3,205
(4.2) %3,518,4003,368,400 3,518,4003,371,1833,020,470426600 Chemical Supplies4125200 3,020,828
-6,0006,000 6,0006,0008,763426700 Maintenance Tools/Supplies4125200 2,436
(16.6) %4,5003,750 4,5003,7502,606426710 Work Boot Reimbursement4125200 2,631
-0 05000Employee Meal Allowance4125200426755 0
-10,00010,000 10,00010,00019,932426800 Special Department Supplies4125200 21,196
-500 50050000Travel & Meeting Expense4125200427100 500
-30,00030,000 30,00030,00010,805427200 Training4125200 6,048
-0 0001,154Legal Fees4125200428200 0
(1.1) %57,48656,836 57,48656,83696,483428400 Liability Insurance4125200 85,978
-50 50000Employee Meal Allowance4125200448000 50
(1.1) %8,264,1658,543,2828,172,765 8,264,165Non-personnel Expenses Total 7,723,3667,366,177
-0 00014,580Automotive Equipment4125200462100 0
80.7%28,612 15,83028,612015,953Machine and Equipment4125200462200 15,830
80.7 %28,612 15,830Equipment Outlay Total 15,83028,612030,533
566.3 %186,7751,244,604 1,244,6041,244,6041,224,507881100 General Fund Allocation Chgs4125200 317,799
(4.3) %6,9006,600 6,9006,6006,900882510 Utilization Chgs from 510 Fund4125200 8,199
-36,05536,055 36,05536,05536,054882540 Utilization Chgs from 540 Fund4125200 36,054
-0 00590Interfund Services from 101 Fd4125200884101 0
-0 002,7183,182Interfund Services from 550 Fd4125200884550 0
460.3 %229,7301,287,2591,287,259 1,287,559Charges From Others Total 1,270,239365,236
-0 00(7,535)(23)Interfund Services to 101 Fund4125200894101 0
-0 00(16)0Interfund Services to 510 Fund4125200894510 0
-0(134,829) 0(134,829)(281,047)894550 Interfund Services to 550 Fund4125200 (375,800)
-(134,829) 0Charges to Others Total 0(134,829)(288,599)(375,824)
CCReport Name: 2017_Mid_Cycle_Report
Report Description: Budget Book - Department Budget Detail wMD
06/07/2017Date:
Time: 442
Version:
Page:19:21:28

Department / Section: Public Works / PW-Sewer Systems-Treatment550 - 412520
Department Budget Detail
%Chnge16/17 vs 17/182017/182017/18
AmendedAdoptedAdopted2016/17
AmendedActualActual2016/172015/162014/15GL KeyObject Description
5.2 %13,087,211 12,431,99613,399,60413,457,72812,036,71010,646,254Total Budget Requirements
CCReport Name: 2017_Mid_Cycle_Report
Report Description: Budget Book - Department Budget Detail wMD
06/07/2017Date:
Time: 443
Version:
Page:19:21:28
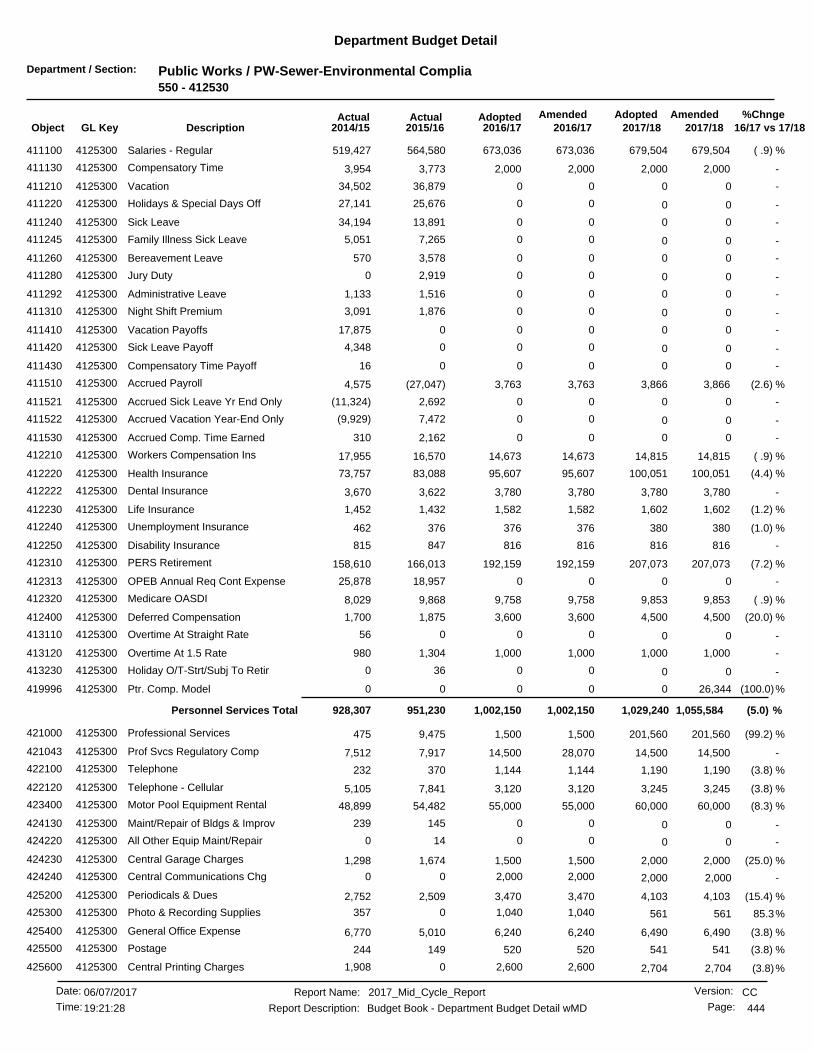
Department / Section: Public Works / PW-Sewer-Environmental Complia550 - 412530
Department Budget Detail
%Chnge16/17 vs 17/182017/182017/18
AmendedAdoptedAdopted2016/17
AmendedActualActual2016/172015/162014/15GL KeyObject Description
( .9) %679,504673,036 679,504673,036564,580411100 Salaries - Regular4125300 519,427
-2,0002,000 2,0002,0003,773411130 Compensatory Time4125300 3,954
-0 0036,87934,502Vacation4125300411210 0
-0 0025,67627,141Holidays & Special Days Off4125300411220 0
-0 0013,89134,194Sick Leave4125300411240 0
-0 007,2655,051Family Illness Sick Leave4125300411245 0
-0 003,578570Bereavement Leave4125300411260 0
-0 002,9190Jury Duty4125300411280 0
-0 001,5161,133Administrative Leave4125300411292 0
-0 001,8763,091Night Shift Premium4125300411310 0
-0 00017,875Vacation Payoffs4125300411410 0
-0 0004,348Sick Leave Payoff4125300411420 0
-0 00016Compensatory Time Payoff4125300411430 0
(2.6) %3,8663,763 3,8663,763(27,047)411510 Accrued Payroll4125300 4,575
-0 002,692(11,324)Accrued Sick Leave Yr End Only4125300411521 0
-0 007,472(9,929)Accrued Vacation Year-End Only4125300411522 0
-0 002,162310Accrued Comp. Time Earned4125300411530 0
( .9) %14,81514,673 14,81514,67316,570412210 Workers Compensation Ins4125300 17,955
(4.4) %100,05195,607 100,05195,60783,088412220 Health Insurance4125300 73,757
-3,7803,780 3,7803,7803,622412222 Dental Insurance4125300 3,670
(1.2) %1,6021,582 1,6021,5821,432412230 Life Insurance4125300 1,452
(1.0) %380376 380376376412240 Unemployment Insurance4125300 462
-816816 816816847412250 Disability Insurance4125300 815
(7.2) %207,073192,159 207,073192,159166,013412310 PERS Retirement4125300 158,610
-0 0018,95725,878OPEB Annual Req Cont Expense4125300412313 0
( .9) %9,8539,758 9,8539,7589,868412320 Medicare OASDI4125300 8,029
(20.0) %4,5003,600 4,5003,6001,875412400 Deferred Compensation4125300 1,700
-0 00056Overtime At Straight Rate4125300413110 0
-1,0001,000 1,0001,0001,304413120 Overtime At 1.5 Rate4125300 980
-0 00360Holiday O/T-Strt/Subj To Retir4125300413230 0
(100.0)%0 26,344000Ptr. Comp. Model4125300419996 0
(5.0) %1,055,5841,002,1501,002,150 1,029,240Personnel Services Total 951,230928,307
(99.2) %201,5601,500 201,5601,5009,475421000 Professional Services4125300 475
-14,50014,500 14,50028,0707,917421043 Prof Svcs Regulatory Comp4125300 7,512
(3.8) %1,1901,144 1,1901,144370422100 Telephone4125300 232
(3.8) %3,2453,120 3,2453,1207,841422120 Telephone - Cellular4125300 5,105
(8.3) %60,00055,000 60,00055,00054,482423400 Motor Pool Equipment Rental4125300 48,899
-0 00145239Maint/Repair of Bldgs & Improv4125300424130 0
-0 00140All Other Equip Maint/Repair4125300424220 0
(25.0) %2,0001,500 2,0001,5001,674424230 Central Garage Charges4125300 1,298
-2,000 2,0002,00000Central Communications Chg4125300424240 2,000
(15.4) %4,1033,470 4,1033,4702,509425200 Periodicals & Dues4125300 2,752
85.3%1,040 5611,0400357Photo & Recording Supplies4125300425300 561
(3.8) %6,4906,240 6,4906,2405,010425400 General Office Expense4125300 6,770
(3.8) %541520 541520149425500 Postage4125300 244
(3.8)%2,600 2,7042,60001,908Central Printing Charges4125300425600 2,704
CCReport Name: 2017_Mid_Cycle_Report
Report Description: Budget Book - Department Budget Detail wMD
06/07/2017Date:
Time: 444
Version:
Page:19:21:28
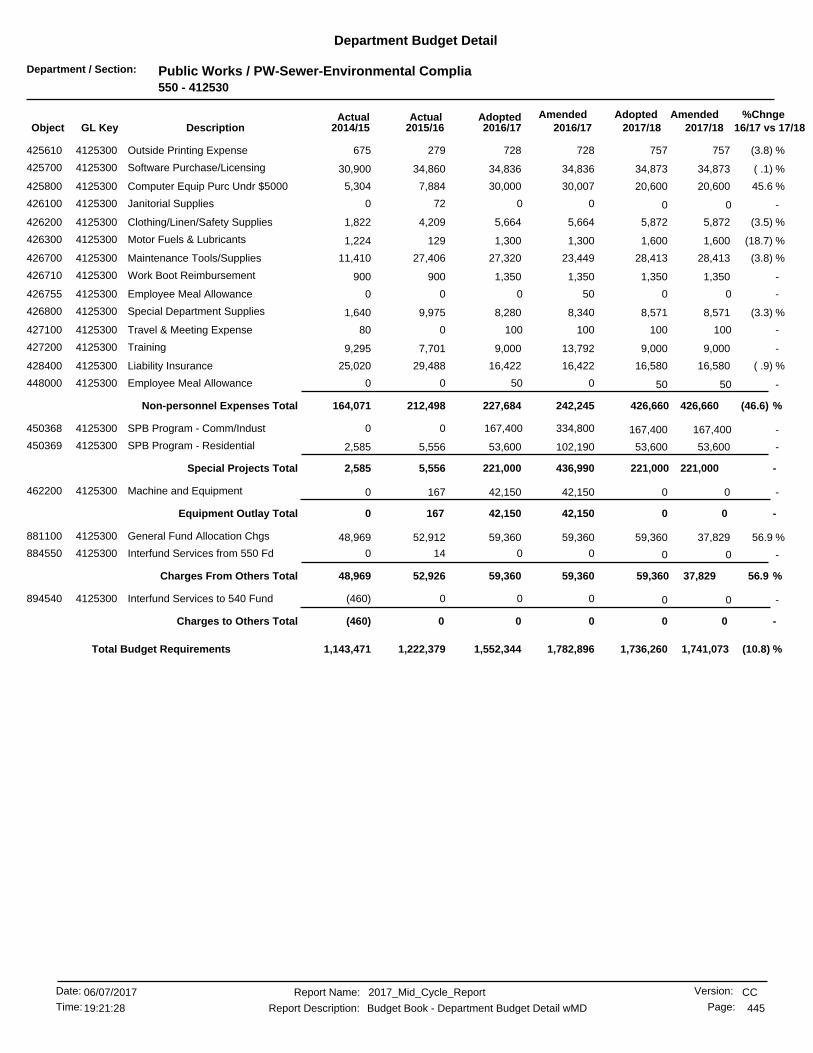
Department / Section: Public Works / PW-Sewer-Environmental Complia550 - 412530
Department Budget Detail
%Chnge16/17 vs 17/182017/182017/18
AmendedAdoptedAdopted2016/17
AmendedActualActual2016/172015/162014/15GL KeyObject Description
(3.8) %757728 757728279425610 Outside Printing Expense4125300 675
( .1) %34,87334,836 34,87334,83634,860425700 Software Purchase/Licensing4125300 30,900
45.6 %20,60030,000 20,60030,0077,884425800 Computer Equip Purc Undr $50004125300 5,304
-0 00720Janitorial Supplies4125300426100 0
(3.5) %5,8725,664 5,8725,6644,209426200 Clothing/Linen/Safety Supplies4125300 1,822
(18.7) %1,6001,300 1,6001,300129426300 Motor Fuels & Lubricants4125300 1,224
(3.8) %28,41327,320 28,41323,44927,406426700 Maintenance Tools/Supplies4125300 11,410
-1,3501,350 1,3501,350900426710 Work Boot Reimbursement4125300 900
-0 05000Employee Meal Allowance4125300426755 0
(3.3) %8,5718,280 8,5718,3409,975426800 Special Department Supplies4125300 1,640
-100 100100080Travel & Meeting Expense4125300427100 100
-9,0009,000 9,00013,7927,701427200 Training4125300 9,295
( .9) %16,58016,422 16,58016,42229,488428400 Liability Insurance4125300 25,020
-50 50000Employee Meal Allowance4125300448000 50
(46.6) %426,660242,245227,684 426,660Non-personnel Expenses Total 212,498164,071
-167,400 167,400334,80000SPB Program - Comm/Indust4125300450368 167,400
-53,60053,600 53,600102,1905,556450369 SPB Program - Residential4125300 2,585
-221,000436,990221,000 221,000Special Projects Total 5,5562,585
-042,150 042,150167462200 Machine and Equipment4125300 0
-42,150 0Equipment Outlay Total 042,1501670
56.9 %37,82959,360 59,36059,36052,912881100 General Fund Allocation Chgs4125300 48,969
-0 00140Interfund Services from 550 Fd4125300884550 0
56.9 %37,82959,36059,360 59,360Charges From Others Total 52,92648,969
-0 000(460)Interfund Services to 540 Fund4125300894540 0
-0 0Charges to Others Total 000(460)
(10.8) %1,552,344 1,741,0731,736,2601,782,8961,222,3791,143,471Total Budget Requirements
CCReport Name: 2017_Mid_Cycle_Report
Report Description: Budget Book - Department Budget Detail wMD
06/07/2017Date:
Time: 445
Version:
Page:19:21:28

Department / Section: Public Works / PW-Sewer Systems-Plant Maint550 - 412540
Department Budget Detail
%Chnge16/17 vs 17/182017/182017/18
AmendedAdoptedAdopted2016/17
AmendedActualActual2016/172015/162014/15GL KeyObject Description
(1.2) %1,075,5361,061,995 1,075,5361,061,995834,187411100 Salaries - Regular4125400 753,097
-0 005586,997Compensatory Time4125400411130 0
-0 0056,85258,602Vacation4125400411210 0
-0 0038,60136,616Holidays & Special Days Off4125400411220 0
-0 000145Rest Time Pay - IBEW4125400411225 0
-0 0018,88525,902Sick Leave4125400411240 0
-0 005,2046,049Family Illness Sick Leave4125400411245 0
-0 003,8101,296Bereavement Leave4125400411260 0
-0 000262Jury Duty4125400411280 0
-0 009,30810,838Administrative Leave4125400411292 0
-0 000(2)Night Shift Premium4125400411310 0
-0 005,9413,164Vacation Payoffs4125400411410 0
-0 001380Sick Leave Payoff4125400411420 0
-0 003730Compensatory Time Payoff4125400411430 0
(2.8) %6,3946,209 6,3946,209(41,576)411510 Accrued Payroll4125400 5,883
-0 0013,46310,602Accrued Sick Leave Yr End Only4125400411521 0
-0 004,405(2,232)Accrued Vacation Year-End Only4125400411522 0
-0 002,196(2,674)Accrued Comp. Time Earned4125400411530 0
(1.2) %23,44823,153 23,44823,15326,376412210 Workers Compensation Ins4125400 28,443
(3.9) %217,273208,749 217,273208,749157,933412220 Health Insurance4125400 153,473
(1.6) %8,6168,473 8,6168,4736,947412222 Dental Insurance4125400 7,079
-2,1872,187 2,1872,1872,153412230 Life Insurance4125400 1,771
(1.8) %605594 605594600412240 Unemployment Insurance4125400 732
-1,9041,904 1,9041,9041,579412250 Disability Insurance4125400 1,767
(7.3) %338,164313,412 338,164313,412250,846412310 PERS Retirement4125400 228,818
-0 0036,03453,846OPEB Annual Req Cont Expense4125400412313 0
(1.3) %14,60914,412 14,60914,41214,152412320 Medicare OASDI4125400 12,862
(20.0) %6,0004,800 6,0004,8003,187412400 Deferred Compensation4125400 1,425
-20,00020,000 20,00020,00020,066413110 Overtime At Straight Rate4125400 17,440
-21,00021,000 21,00021,00018,666413120 Overtime At 1.5 Rate4125400 16,264
-7,5007,500 7,5007,50013,045413130 Overtime At Double Time Rate4125400 11,740
-0 00092Holiday O/T-Straight/Non-Sched4125400413210 0
-0 000457Holiday O/T-Strt/Subj To Retir4125400413230 0
(100.0)%0 47,599000Ptr. Comp. Model4125400419996 0
(5.3) %1,790,8351,694,3881,694,388 1,743,236Personnel Services Total 1,503,9411,450,763
(3.9) %218,059209,435 218,059228,88152,816421000 Professional Services4125400 90,268
-1,5501,550 1,5501,550918422100 Telephone4125400 1,002
-5,8005,800 5,8005,8006,358422120 Telephone - Cellular4125400 10,522
-10,00010,000 10,00010,0006,683422700 Refuse/Disposal Fees4125400 14,370
-22,00022,000 22,00040,56047,620423100 Equipment Rental4125400 13,262
(12.5) %80,00070,000 80,00070,00067,002423400 Motor Pool Equipment Rental4125400 64,750
-7,5507,550 7,5507,5502,663424120 Constr & Maint Materials4125400 629
-0 004150Const. Maint. Materials- Storm4125400424124 0
-334,000334,000 334,000342,999262,952424130 Maint/Repair of Bldgs & Improv4125400 129,875
-0 002138,770Maintenance & Repair - General4125400424200 0
(6.8) %454,900423,900 454,900429,819279,243424220 All Other Equip Maint/Repair4125400 354,546
CCReport Name: 2017_Mid_Cycle_Report
Report Description: Budget Book - Department Budget Detail wMD
06/07/2017Date:
Time: 446
Version:
Page:19:21:28

Department / Section: Public Works / PW-Sewer Systems-Plant Maint550 - 412540
Department Budget Detail
%Chnge16/17 vs 17/182017/182017/18
AmendedAdoptedAdopted2016/17
AmendedActualActual2016/172015/162014/15GL KeyObject Description
(11.1) %45,00040,000 45,00040,00031,043424230 Central Garage Charges4125400 31,717
-2,000 2,0002,00000Central Communications Chg4125400424240 2,000
-3,3003,300 3,3003,3002,569425200 Periodicals & Dues4125400 3,040
-4,0004,000 4,0004,0003,071425400 General Office Expense4125400 2,741
-600600 600600154425500 Postage4125400 70
-7575 757529425610 Outside Printing Expense4125400 0
-1,000 1,0001,00000Software Purchase/Licensing4125400425700 1,000
-1,3001,300 1,3001,30027425800 Computer Equip Purc Undr $50004125400 1,262
(5.1) %9,7009,200 9,7009,2008,955426100 Janitorial Supplies4125400 5,759
(1.2) %37,72937,260 37,72937,26030,334426200 Clothing/Linen/Safety Supplies4125400 34,898
(9.0) %11,00010,000 11,00010,0006,562426300 Motor Fuels & Lubricants4125400 6,743
-51,50051,500 51,50052,02918,927426400 Horticultural Supplies4125400 13,229
-12,00012,000 12,00012,00010,258426600 Chemical Supplies4125400 9,746
-10,00010,000 10,00010,00011,696426700 Maintenance Tools/Supplies4125400 8,304
-3,0003,000 3,0003,0002,086426710 Work Boot Reimbursement4125400 2,384
-0 05000Employee Meal Allowance4125400426755 0
-8,5008,500 8,5008,5004,511426800 Special Department Supplies4125400 20,314
-0 001515Travel & Meeting Expense4125400427100 0
-20,00020,000 20,00020,00025,221427200 Training4125400 9,976
(1.2) %26,24225,909 26,24225,90946,938428400 Liability Insurance4125400 39,630
-50 50000Employee Meal Allowance4125400448000 50
(4.1) %1,380,8551,377,3851,323,929 1,380,855Non-personnel Expenses Total 929,098907,833
60.0 %25,00040,000 25,00040,0009,579462200 Machine and Equipment4125400 9,929
7.2 %345,000370,000 345,000445,421162,950462210 Sewer Equip Replacement/Const4125400 10,765
10.8 %370,000485,421410,000 370,000Equipment Outlay Total 172,53020,695
(50.0) %20,00010,000 20,00010,000108462050 Building and Improvements4125400 10,102
(50.0) %20,00010,00010,000 20,000Capital Outlay & Grants Total 10810,102
75.7 %62,532109,888 109,888109,88894,107881100 General Fund Allocation Chgs4125400 71,500
-1,2001,200 1,2001,2001,200882510 Utilization Chgs from 510 Fund4125400 1,200
-0 0041,77117,368Interfund Services from 550 Fd4125400884550 0
74.3 %63,732111,088111,088 111,088Charges From Others Total 137,07990,069
-0 00(22)(3,282)Interfund Services to 101 Fund4125400894101 0
-0 00(847)(131)Interfund Services to 520 Fund4125400894520 0
-0 00(5,312)(3,541)Interfund Services to 540 Fund4125400894540 0
-0 00(112,843)(48,153)Interfund Services to 550 Fund4125400894550 0
-0 0Charges to Others Total 00(119,025)(55,110)
(2.0) %3,549,405 3,625,4223,625,1793,678,2832,623,7322,424,354Total Budget Requirements
CCReport Name: 2017_Mid_Cycle_Report
Report Description: Budget Book - Department Budget Detail wMD
06/07/2017Date:
Time: 447
Version:
Page:19:21:28

Department / Section: Public Works / PW-Sewer-Electrical & Instrum550 - 412541
Department Budget Detail
%Chnge16/17 vs 17/182017/182017/18
AmendedAdoptedAdopted2016/17
AmendedActualActual2016/172015/162014/15GL KeyObject Description
(1.4) %661,471652,104 661,471652,104483,268411100 Salaries - Regular4125410 457,964
-0 0029,62231,039Compensatory Time4125410411130 0
-0 0040,59337,707Vacation4125410411210 0
-0 0024,61124,009Holidays & Special Days Off4125410411220 0
-0 0015,28512,830Sick Leave4125410411240 0
-0 005,9526,880Family Illness Sick Leave4125410411245 0
-0 002901,867Bereavement Leave4125410411260 0
-0 002,2502,866Jury Duty4125410411280 0
-0 001,5931,079Administrative Leave4125410411292 0
-16,24416,244 16,24416,2441,614411410 Vacation Payoffs4125410 1,641
-26,265 26,26526,26500Sick Leave Payoff4125410411420 26,265
(3.0) %3,8073,690 3,8073,690(26,027)411510 Accrued Payroll4125410 (11,650)
-0 004,5541,884Accrued Sick Leave Yr End Only4125410411521 0
-0 001,699(3,399)Accrued Vacation Year-End Only4125410411522 0
-0 00(156)(3,384)Accrued Comp. Time Earned4125410411530 0
(1.4) %14,42014,216 14,42014,21616,398412210 Workers Compensation Ins4125410 17,982
(4.6) %105,847100,901 105,847100,90182,434412220 Health Insurance4125410 79,352
-4,8604,860 4,8604,8604,320412222 Dental Insurance4125410 4,106
(1.7) %1,1171,097 1,1171,097969412230 Life Insurance4125410 932
(1.3) %369364 369364379412240 Unemployment Insurance4125410 462
-952952 952952847412250 Disability Insurance4125410 821
(7.5) %203,046187,682 203,046187,682148,273412310 PERS Retirement4125410 145,676
-0 0018,80727,841OPEB Annual Req Cont Expense4125410412313 0
(1.4) %9,5939,456 9,5939,4569,849412320 Medicare OASDI4125410 9,129
(20.0) %3,0002,400 3,0002,400937412400 Deferred Compensation4125410 600
-23,00023,000 23,00023,00038,247413110 Overtime At Straight Rate4125410 28,614
-24,00024,000 24,00024,00019,386413120 Overtime At 1.5 Rate4125410 14,130
-8,0008,000 8,0008,0004,471413130 Overtime At Double Time Rate4125410 5,659
(100.0)%0 27,402000Ptr. Comp. Model4125410419996 0
(5.1) %1,133,3931,075,2311,075,231 1,105,991Personnel Services Total 930,474896,645
(1.7) %170,420167,375 170,420167,5179,458421000 Professional Services4125410 44,435
-3,6003,600 3,6003,6003,539422120 Telephone - Cellular4125410 30
-6,0006,000 6,0006,0006,046423100 Equipment Rental4125410 0
(16.6) %30,00025,000 30,00025,00025,660423400 Motor Pool Equipment Rental4125410 24,644
-10,00010,000 10,00010,00011,845424130 Maint/Repair of Bldgs & Improv4125410 27,018
(5.0) %258,000245,000 258,000292,840186,915424220 All Other Equip Maint/Repair4125410 171,965
(16.6) %1,2001,000 1,2001,000199424230 Central Garage Charges4125410 0
-2,0002,000 2,0002,00064424240 Central Communications Chg4125410 0
-0 00664156Periodicals & Dues4125410425200 0
-2,2502,250 2,2502,2501,993425400 General Office Expense4125410 508
-0 005896Postage4125410425500 0
-0 00290Outside Printing Expense4125410425610 0
-1,5001,500 1,5001,500212425800 Computer Equip Purc Undr $50004125410 652
-0 001,097878Janitorial Supplies4125410426100 0
-9,0009,000 9,0009,0004,004426200 Clothing/Linen/Safety Supplies4125410 5,085
(50.0) %10050 10050187426300 Motor Fuels & Lubricants4125410 27
CCReport Name: 2017_Mid_Cycle_Report
Report Description: Budget Book - Department Budget Detail wMD
06/07/2017Date:
Time: 448
Version:
Page:19:21:28
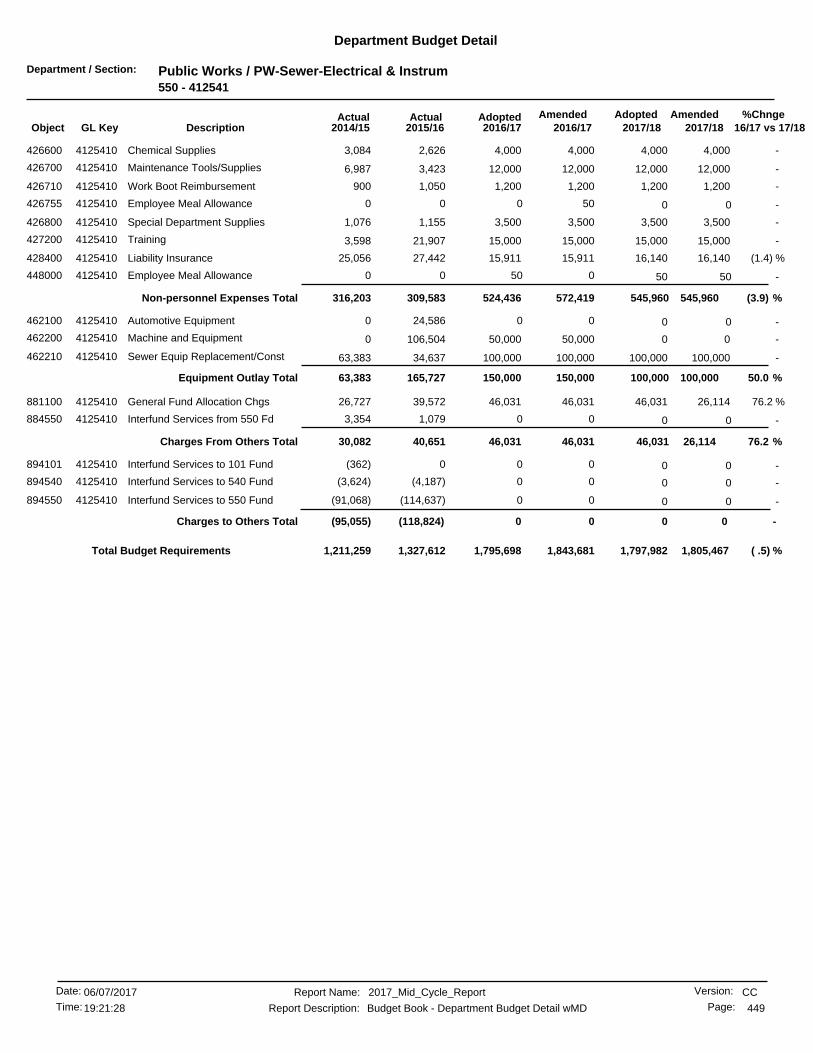
Department / Section: Public Works / PW-Sewer-Electrical & Instrum550 - 412541
Department Budget Detail
%Chnge16/17 vs 17/182017/182017/18
AmendedAdoptedAdopted2016/17
AmendedActualActual2016/172015/162014/15GL KeyObject Description
-4,0004,000 4,0004,0002,626426600 Chemical Supplies4125410 3,084
-12,00012,000 12,00012,0003,423426700 Maintenance Tools/Supplies4125410 6,987
-1,2001,200 1,2001,2001,050426710 Work Boot Reimbursement4125410 900
-0 05000Employee Meal Allowance4125410426755 0
-3,5003,500 3,5003,5001,155426800 Special Department Supplies4125410 1,076
-15,00015,000 15,00015,00021,907427200 Training4125410 3,598
(1.4) %16,14015,911 16,14015,91127,442428400 Liability Insurance4125410 25,056
-50 50000Employee Meal Allowance4125410448000 50
(3.9) %545,960572,419524,436 545,960Non-personnel Expenses Total 309,583316,203
-0 0024,5860Automotive Equipment4125410462100 0
-050,000 050,000106,504462200 Machine and Equipment4125410 0
-100,000100,000 100,000100,00034,637462210 Sewer Equip Replacement/Const4125410 63,383
50.0 %100,000150,000150,000 100,000Equipment Outlay Total 165,72763,383
76.2 %26,11446,031 46,03146,03139,572881100 General Fund Allocation Chgs4125410 26,727
-0 001,0793,354Interfund Services from 550 Fd4125410884550 0
76.2 %26,11446,03146,031 46,031Charges From Others Total 40,65130,082
-0 000(362)Interfund Services to 101 Fund4125410894101 0
-0 00(4,187)(3,624)Interfund Services to 540 Fund4125410894540 0
-0 00(114,637)(91,068)Interfund Services to 550 Fund4125410894550 0
-0 0Charges to Others Total 00(118,824)(95,055)
( .5) %1,795,698 1,805,4671,797,9821,843,6811,327,6121,211,259Total Budget Requirements
CCReport Name: 2017_Mid_Cycle_Report
Report Description: Budget Book - Department Budget Detail wMD
06/07/2017Date:
Time: 449
Version:
Page:19:21:28
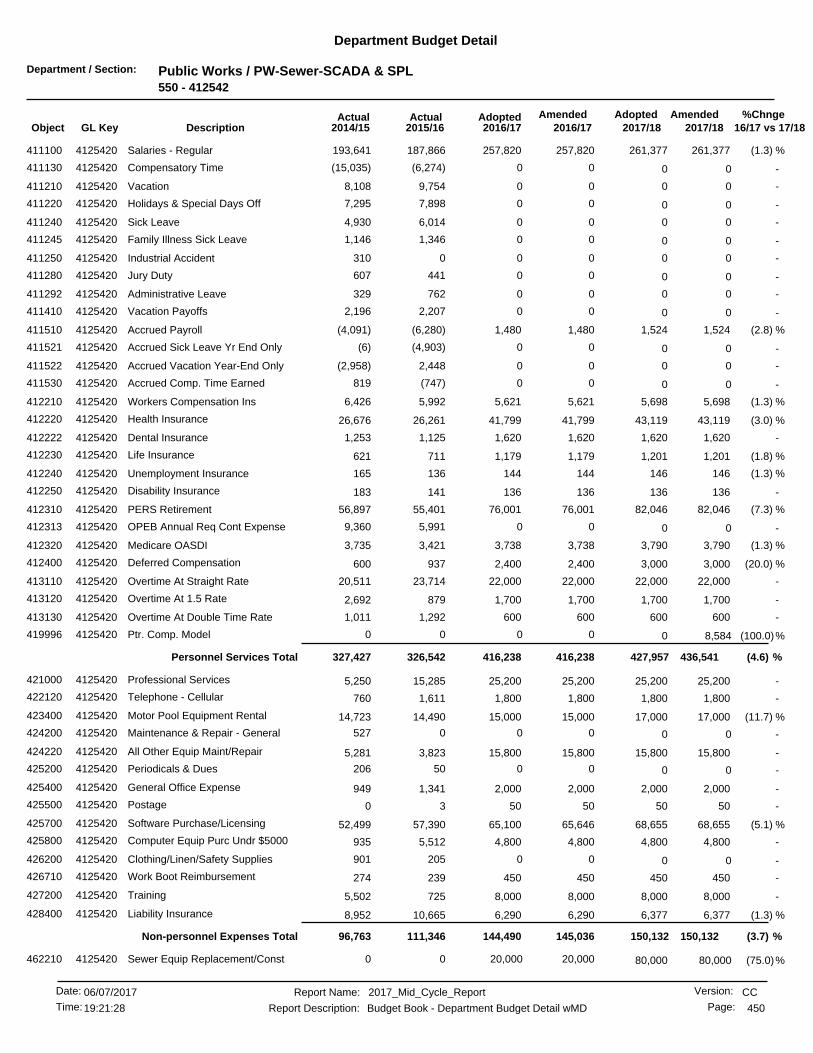
Department / Section: Public Works / PW-Sewer-SCADA & SPL550 - 412542
Department Budget Detail
%Chnge16/17 vs 17/182017/182017/18
AmendedAdoptedAdopted2016/17
AmendedActualActual2016/172015/162014/15GL KeyObject Description
(1.3) %261,377257,820 261,377257,820187,866411100 Salaries - Regular4125420 193,641
-0 00(6,274)(15,035)Compensatory Time4125420411130 0
-0 009,7548,108Vacation4125420411210 0
-0 007,8987,295Holidays & Special Days Off4125420411220 0
-0 006,0144,930Sick Leave4125420411240 0
-0 001,3461,146Family Illness Sick Leave4125420411245 0
-0 000310Industrial Accident4125420411250 0
-0 00441607Jury Duty4125420411280 0
-0 00762329Administrative Leave4125420411292 0
-0 002,2072,196Vacation Payoffs4125420411410 0
(2.8) %1,5241,480 1,5241,480(6,280)411510 Accrued Payroll4125420 (4,091)
-0 00(4,903)(6)Accrued Sick Leave Yr End Only4125420411521 0
-0 002,448(2,958)Accrued Vacation Year-End Only4125420411522 0
-0 00(747)819Accrued Comp. Time Earned4125420411530 0
(1.3) %5,6985,621 5,6985,6215,992412210 Workers Compensation Ins4125420 6,426
(3.0) %43,11941,799 43,11941,79926,261412220 Health Insurance4125420 26,676
-1,6201,620 1,6201,6201,125412222 Dental Insurance4125420 1,253
(1.8) %1,2011,179 1,2011,179711412230 Life Insurance4125420 621
(1.3) %146144 146144136412240 Unemployment Insurance4125420 165
-136136 136136141412250 Disability Insurance4125420 183
(7.3) %82,04676,001 82,04676,00155,401412310 PERS Retirement4125420 56,897
-0 005,9919,360OPEB Annual Req Cont Expense4125420412313 0
(1.3) %3,7903,738 3,7903,7383,421412320 Medicare OASDI4125420 3,735
(20.0) %3,0002,400 3,0002,400937412400 Deferred Compensation4125420 600
-22,00022,000 22,00022,00023,714413110 Overtime At Straight Rate4125420 20,511
-1,7001,700 1,7001,700879413120 Overtime At 1.5 Rate4125420 2,692
-600600 6006001,292413130 Overtime At Double Time Rate4125420 1,011
(100.0)%0 8,584000Ptr. Comp. Model4125420419996 0
(4.6) %436,541416,238416,238 427,957Personnel Services Total 326,542327,427
-25,20025,200 25,20025,20015,285421000 Professional Services4125420 5,250
-1,8001,800 1,8001,8001,611422120 Telephone - Cellular4125420 760
(11.7) %17,00015,000 17,00015,00014,490423400 Motor Pool Equipment Rental4125420 14,723
-0 000527Maintenance & Repair - General4125420424200 0
-15,80015,800 15,80015,8003,823424220 All Other Equip Maint/Repair4125420 5,281
-0 0050206Periodicals & Dues4125420425200 0
-2,0002,000 2,0002,0001,341425400 General Office Expense4125420 949
-5050 50503425500 Postage4125420 0
(5.1) %68,65565,100 68,65565,64657,390425700 Software Purchase/Licensing4125420 52,499
-4,8004,800 4,8004,8005,512425800 Computer Equip Purc Undr $50004125420 935
-0 00205901Clothing/Linen/Safety Supplies4125420426200 0
-450450 450450239426710 Work Boot Reimbursement4125420 274
-8,0008,000 8,0008,000725427200 Training4125420 5,502
(1.3) %6,3776,290 6,3776,29010,665428400 Liability Insurance4125420 8,952
(3.7) %150,132145,036144,490 150,132Non-personnel Expenses Total 111,34696,763
(75.0)%20,000 80,00020,00000Sewer Equip Replacement/Const4125420462210 80,000
CCReport Name: 2017_Mid_Cycle_Report
Report Description: Budget Book - Department Budget Detail wMD
06/07/2017Date:
Time: 450
Version:
Page:19:21:28
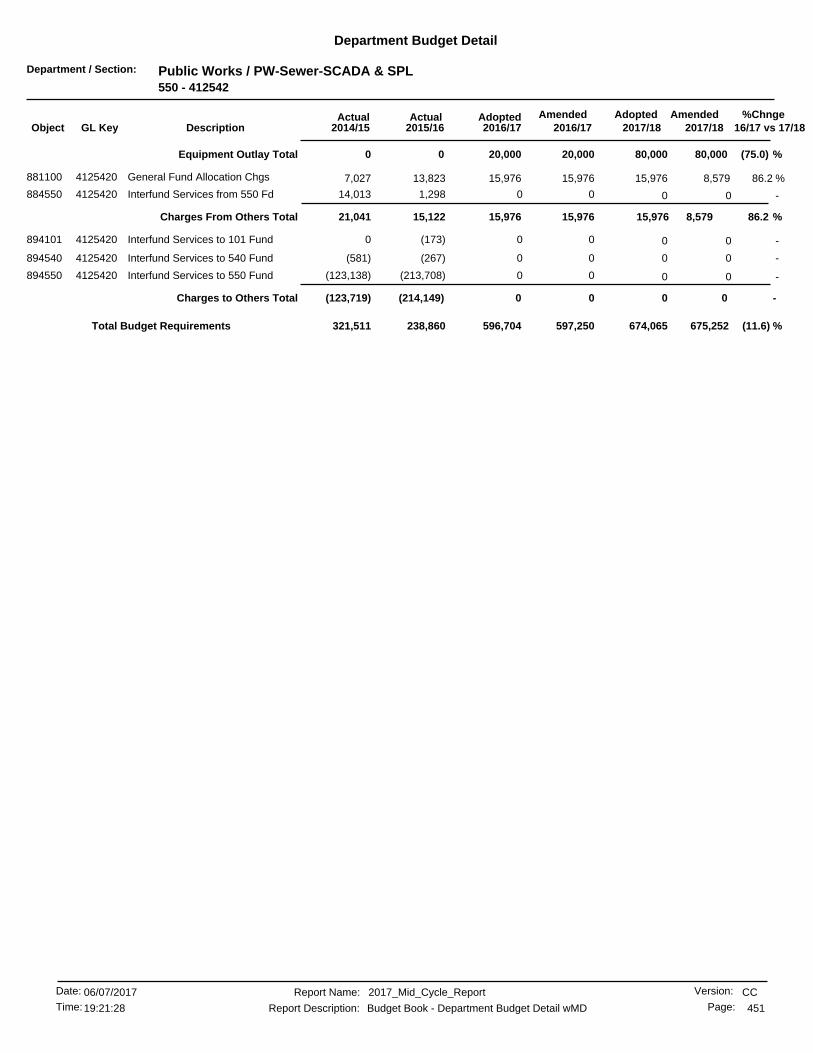
Department / Section: Public Works / PW-Sewer-SCADA & SPL550 - 412542
Department Budget Detail
%Chnge16/17 vs 17/182017/182017/18
AmendedAdoptedAdopted2016/17
AmendedActualActual2016/172015/162014/15GL KeyObject Description
(75.0) %20,000 80,000Equipment Outlay Total 80,00020,00000
86.2 %8,57915,976 15,97615,97613,823881100 General Fund Allocation Chgs4125420 7,027
-0 001,29814,013Interfund Services from 550 Fd4125420884550 0
86.2 %8,57915,97615,976 15,976Charges From Others Total 15,12221,041
-0 00(173)0Interfund Services to 101 Fund4125420894101 0
-0 00(267)(581)Interfund Services to 540 Fund4125420894540 0
-0 00(213,708)(123,138)Interfund Services to 550 Fund4125420894550 0
-0 0Charges to Others Total 00(214,149)(123,719)
(11.6) %596,704 675,252674,065597,250238,860321,511Total Budget Requirements
CCReport Name: 2017_Mid_Cycle_Report
Report Description: Budget Book - Department Budget Detail wMD
06/07/2017Date:
Time: 451
Version:
Page:19:21:28

Department / Section: Public Works / PW-Sewer-Warehouse550 - 412543
Department Budget Detail
%Chnge16/17 vs 17/182017/182017/18
AmendedAdoptedAdopted2016/17
AmendedActualActual2016/172015/162014/15GL KeyObject Description
-99,26499,264 99,26499,26486,650411100 Salaries - Regular4125430 79,721
-0 0060Compensatory Time4125430411130 0
-0 006,7556,596Vacation4125430411210 0
-0 004,1103,956Holidays & Special Days Off4125430411220 0
-0 002,8732,563Sick Leave4125430411240 0
-0 00277434Family Illness Sick Leave4125430411245 0
-0 00272173Administrative Leave4125430411292 0
(1.9) %526516 526516(4,160)411510 Accrued Payroll4125430 976
-0 00307123Accrued Sick Leave Yr End Only4125430411521 0
-0 00(923)(982)Accrued Vacation Year-End Only4125430411522 0
-0 002810Accrued Comp. Time Earned4125430411530 0
-2,1642,164 2,1642,1642,361412210 Workers Compensation Ins4125430 2,419
(7.1) %9,2858,623 9,2858,6238,241412220 Health Insurance4125430 7,098
(9.0) %288262 288262254412222 Dental Insurance4125430 238
-5252 525257412230 Life Insurance4125430 52
-5656 565654412240 Unemployment Insurance4125430 61
-272272 272272282412250 Disability Insurance4125430 271
(6.8) %28,09826,171 28,09826,17122,752412310 PERS Retirement4125430 20,443
-0 001,8812,490OPEB Annual Req Cont Expense4125430412313 0
-1,4391,439 1,4391,4391,496412320 Medicare OASDI4125430 1,379
-0 000776Overtime At 1.5 Rate4125430413120 0
(100.0)%0 5,073000Ptr. Comp. Model4125430419996 0
(5.2) %146,517138,819138,819 141,444Personnel Services Total 133,833128,796
-0 003760Telephone - Cellular4125430422120 0
-100100 100100(1)424130 Maint/Repair of Bldgs & Improv4125430 1,103
-250250 25025036,545424220 All Other Equip Maint/Repair4125430 50
-1,0001,000 1,0001,0002,357425400 General Office Expense4125430 694
-500500 50050049425500 Postage4125430 167
-2,4002,400 2,4002,9141,963425800 Computer Equip Purc Undr $50004125430 0
-400400 400400389426100 Janitorial Supplies4125430 372
-600600 600600224426200 Clothing/Linen/Safety Supplies4125430 338
-100100 100100234426700 Maintenance Tools/Supplies4125430 49
-300300 300300300426710 Work Boot Reimbursement4125430 300
-3,5003,500 3,5003,5002,809426800 Special Department Supplies4125430 1,378
-2,000 2,0002,00000Training4125430427200 2,000
-2,4222,422 2,4222,4224,203428400 Liability Insurance4125430 3,372
-13,57214,08613,572 13,572Non-personnel Expenses Total 49,4517,826
62.2 %2,8704,656 4,6564,6563,938881100 General Fund Allocation Chgs4125430 36,229
-0 001,757120Interfund Services from 550 Fd4125430884550 0
62.2 %2,8704,6564,656 4,656Charges From Others Total 5,69636,350
-0 000(647)Interfund Services to 540 Fund4125430894540 0
-0 00(1,024)(465)Interfund Services to 550 Fund4125430894550 0
-0 0Charges to Others Total 00(1,024)(1,113)
(3.6) %157,047 162,959159,672157,561187,956171,860Total Budget Requirements
CCReport Name: 2017_Mid_Cycle_Report
Report Description: Budget Book - Department Budget Detail wMD
06/07/2017Date:
Time: 452
Version:
Page:19:21:28

Department / Section: Public Works / PW-Sewer-Laboratory Services550 - 412550
Department Budget Detail
%Chnge16/17 vs 17/182017/182017/18
AmendedAdoptedAdopted2016/17
AmendedActualActual2016/172015/162014/15GL KeyObject Description
( .8) %357,348354,276 357,348354,276309,616411100 Salaries - Regular4125500 333,556
-0 001,3102,050Compensatory Time4125500411130 0
-0 0020,04427,078Vacation4125500411210 0
-0 0010,63211,441Holidays & Special Days Off4125500411220 0
-0 009,1387,273Sick Leave4125500411240 0
-0 002,5775,082Family Illness Sick Leave4125500411245 0
-0 001,0821,315Industrial Accident4125500411250 0
-0 0001,180Bereavement Leave4125500411260 0
-0 001,050808Administrative Leave4125500411292 0
-0 0040027Night Shift Premium4125500411310 0
-0 0087134Temporary Foreman Pay4125500411320 0
-0 002,6521,721Vacation Payoffs4125500411410 0
-0 001,79112,996Sick Leave Payoff4125500411420 0
-0 0063213Compensatory Time Payoff4125500411430 0
(2.5) %2,0461,993 2,0461,993(16,275)411510 Accrued Payroll4125500 1,227
-0 00(2,013)(12,284)Accrued Sick Leave Yr End Only4125500411521 0
-0 00(1,219)556Accrued Vacation Year-End Only4125500411522 0
-0 00(155)445Accrued Comp. Time Earned4125500411530 0
( .8) %7,7907,723 7,7907,7238,919412210 Workers Compensation Ins4125500 11,607
(4.6) %56,83754,193 56,83754,19345,674412220 Health Insurance4125500 45,867
(2.3) %2,1962,144 2,1962,1441,912412222 Dental Insurance4125500 2,080
-667667 667667679412230 Life Insurance4125500 643
( .5) %199198 199198202412240 Unemployment Insurance4125500 298
-544544 544544533412250 Disability Insurance4125500 611
(7.2) %107,69199,924 107,69199,92490,478412310 PERS Retirement4125500 100,765
-0 0010,42116,093OPEB Annual Req Cont Expense4125500412313 0
( .8) %5,1805,135 5,1805,1354,811412320 Medicare OASDI4125500 4,833
(20.0) %1,5001,200 1,5001,200937412400 Deferred Compensation4125500 600
-0 000209Overtime At Straight Rate4125500413110 0
-2,0002,000 2,0002,00013,125413120 Overtime At 1.5 Rate4125500 3,544
-0 00263788Holiday O/T-Straight/Non-Sched4125500413210 0
-0 001,5882,579Holiday O/T-1.5 Rate/Non-Sched4125500413220 0
-4,0004,000 4,0004,0001,068413230 Holiday O/T-Strt/Subj To Retir4125500 992
-0 00444385O/T 1.5 Rate Sub To Retirement4125500413240 0
(100.0)%0 14,542000Ptr. Comp. Model4125500419996 0
(5.0) %562,540533,997533,997 547,998Personnel Services Total 522,413586,530
-63,00063,000 63,00076,17338,829421000 Professional Services4125500 53,859
(1.2) %8,2008,100 8,2008,1005,118421043 Prof Svcs Regulatory Comp4125500 4,931
-300300 300300363422100 Telephone4125500 434
-575575 575575926422120 Telephone - Cellular4125500 715
( .1) %61,95061,860 61,95069,90039,381424220 All Other Equip Maint/Repair4125500 44,966
-7,5007,500 7,5007,5006,966425200 Periodicals & Dues4125500 1,869
-5,0005,000 5,0005,0002,584425400 General Office Expense4125500 3,427
-1,0001,000 1,0001,0002,632425500 Postage4125500 291
-150 15015000Outside Printing Expense4125500425610 150
-7,7007,700 7,7007,7001,159425800 Computer Equip Purc Undr $50004125500 1,348
CCReport Name: 2017_Mid_Cycle_Report
Report Description: Budget Book - Department Budget Detail wMD
06/07/2017Date:
Time: 453
Version:
Page:19:21:28
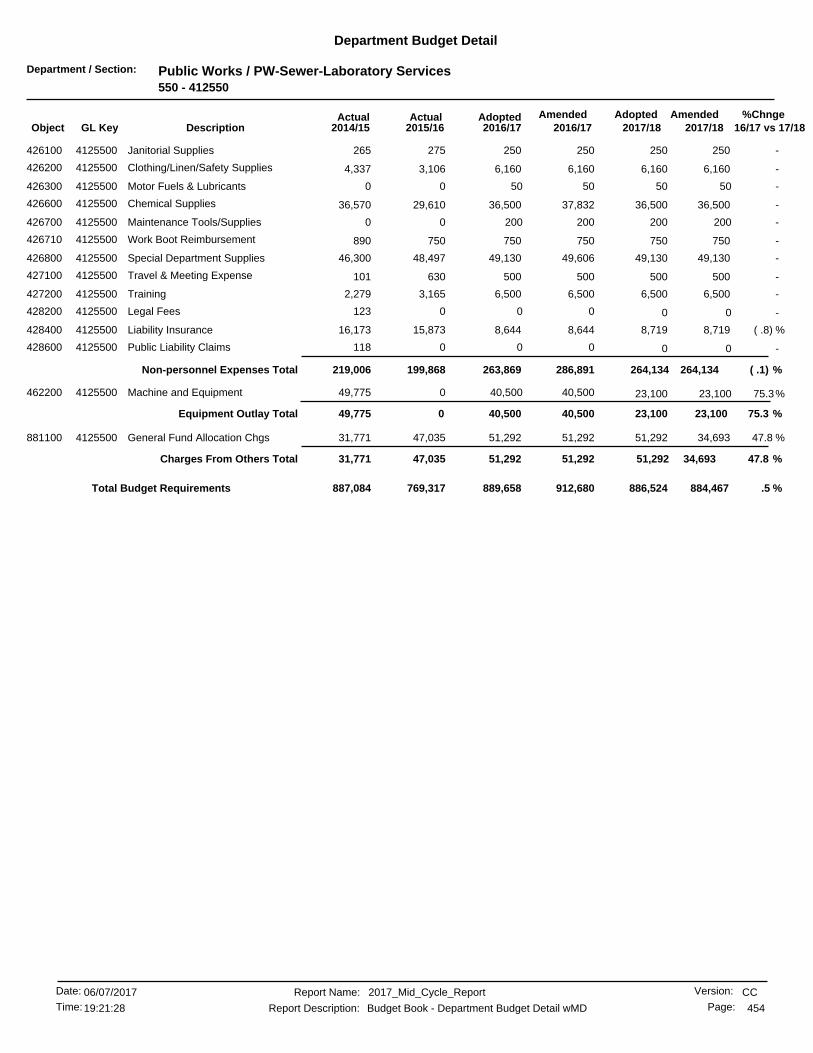
Department / Section: Public Works / PW-Sewer-Laboratory Services550 - 412550
Department Budget Detail
%Chnge16/17 vs 17/182017/182017/18
AmendedAdoptedAdopted2016/17
AmendedActualActual2016/172015/162014/15GL KeyObject Description
-250250 250250275426100 Janitorial Supplies4125500 265
-6,1606,160 6,1606,1603,106426200 Clothing/Linen/Safety Supplies4125500 4,337
-50 505000Motor Fuels & Lubricants4125500426300 50
-36,50036,500 36,50037,83229,610426600 Chemical Supplies4125500 36,570
-200 20020000Maintenance Tools/Supplies4125500426700 200
-750750 750750750426710 Work Boot Reimbursement4125500 890
-49,13049,130 49,13049,60648,497426800 Special Department Supplies4125500 46,300
-500500 500500630427100 Travel & Meeting Expense4125500 101
-6,5006,500 6,5006,5003,165427200 Training4125500 2,279
-0 000123Legal Fees4125500428200 0
( .8) %8,7198,644 8,7198,64415,873428400 Liability Insurance4125500 16,173
-0 000118Public Liability Claims4125500428600 0
( .1) %264,134286,891263,869 264,134Non-personnel Expenses Total 199,868219,006
75.3%40,500 23,10040,500049,775Machine and Equipment4125500462200 23,100
75.3 %40,500 23,100Equipment Outlay Total 23,10040,500049,775
47.8 %34,69351,292 51,29251,29247,035881100 General Fund Allocation Chgs4125500 31,771
47.8 %34,69351,29251,292 51,292Charges From Others Total 47,03531,771
.5 %889,658 884,467886,524912,680769,317887,084Total Budget Requirements
CCReport Name: 2017_Mid_Cycle_Report
Report Description: Budget Book - Department Budget Detail wMD
06/07/2017Date:
Time: 454
Version:
Page:19:21:28
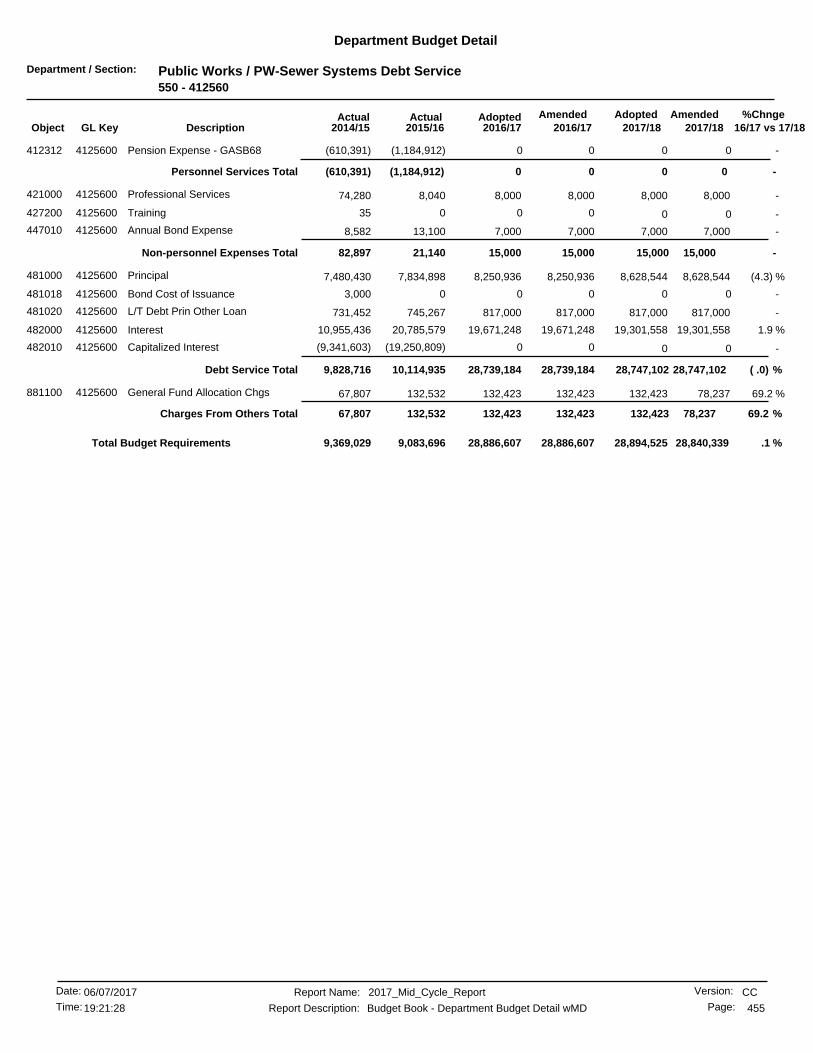
Department / Section: Public Works / PW-Sewer Systems Debt Service550 - 412560
Department Budget Detail
%Chnge16/17 vs 17/182017/182017/18
AmendedAdoptedAdopted2016/17
AmendedActualActual2016/172015/162014/15GL KeyObject Description
-0 00(1,184,912)(610,391)Pension Expense - GASB684125600412312 0
-0 0Personnel Services Total 00(1,184,912)(610,391)
-8,0008,000 8,0008,0008,040421000 Professional Services4125600 74,280
-0 00035Training4125600427200 0
-7,0007,000 7,0007,00013,100447010 Annual Bond Expense4125600 8,582
-15,00015,00015,000 15,000Non-personnel Expenses Total 21,14082,897
(4.3) %8,628,5448,250,936 8,628,5448,250,9367,834,898481000 Principal4125600 7,480,430
-0 0003,000Bond Cost of Issuance4125600481018 0
-817,000817,000 817,000817,000745,267481020 L/T Debt Prin Other Loan4125600 731,452
1.9 %19,301,55819,671,248 19,301,55819,671,24820,785,579482000 Interest4125600 10,955,436
-0 00(19,250,809)(9,341,603)Capitalized Interest4125600482010 0
( .0) %28,747,10228,739,18428,739,184 28,747,102Debt Service Total 10,114,9359,828,716
69.2 %78,237132,423 132,423132,423132,532881100 General Fund Allocation Chgs4125600 67,807
69.2 %78,237132,423132,423 132,423Charges From Others Total 132,53267,807
.1 %28,886,607 28,840,33928,894,52528,886,6079,083,6969,369,029Total Budget Requirements
CCReport Name: 2017_Mid_Cycle_Report
Report Description: Budget Book - Department Budget Detail wMD
06/07/2017Date:
Time: 455
Version:
Page:19:21:28
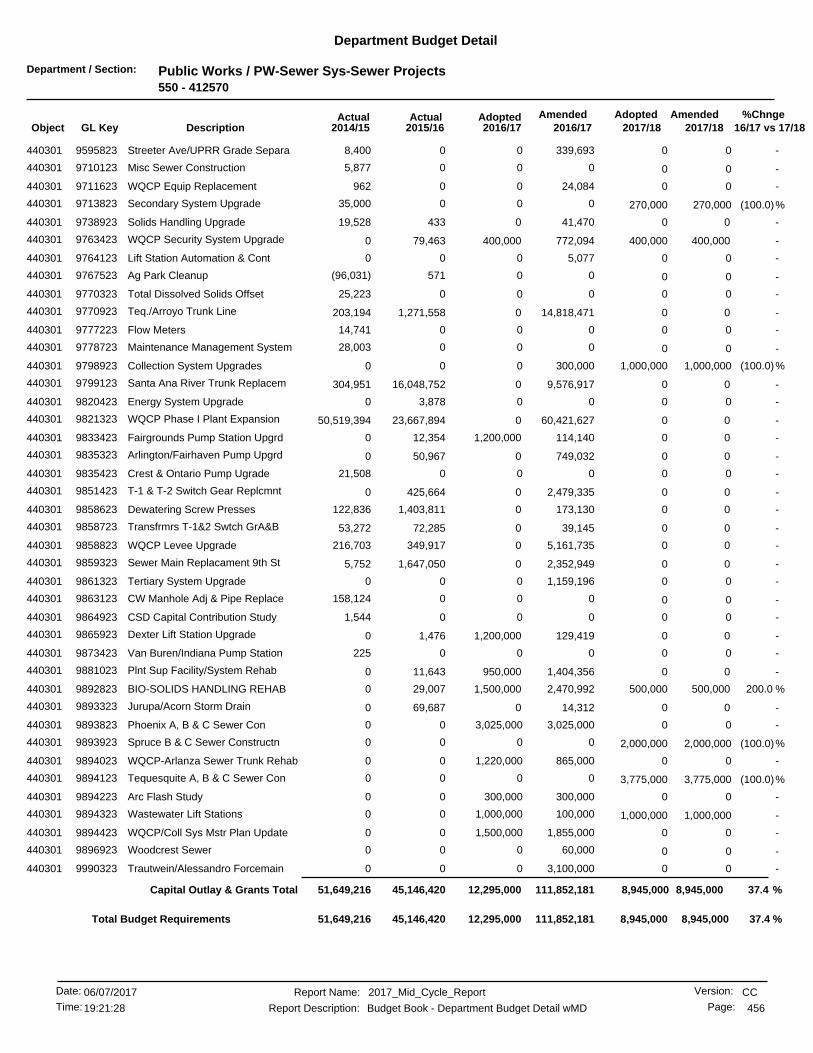
Department / Section: Public Works / PW-Sewer Sys-Sewer Projects550 - 412570
Department Budget Detail
%Chnge16/17 vs 17/182017/182017/18
AmendedAdoptedAdopted2016/17
AmendedActualActual2016/172015/162014/15GL KeyObject Description
-0 0339,69308,400Streeter Ave/UPRR Grade Separa9595823440301 0
-0 0005,877Misc Sewer Construction9710123440301 0
-0 024,0840962WQCP Equip Replacement9711623440301 0
(100.0)%0 270,0000035,000Secondary System Upgrade9713823440301 270,000
-00 041,470433440301 Solids Handling Upgrade9738923 19,528
-400,000400,000 400,000772,09479,463440301 WQCP Security System Upgrade9763423 0
-0 05,07700Lift Station Automation & Cont9764123440301 0
-0 00571(96,031)Ag Park Cleanup9767523440301 0
-0 00025,223Total Dissolved Solids Offset9770323440301 0
-00 014,818,4711,271,558440301 Teq./Arroyo Trunk Line9770923 203,194
-0 00014,741Flow Meters9777223440301 0
-0 00028,003Maintenance Management System9778723440301 0
(100.0)%0 1,000,000300,00000Collection System Upgrades9798923440301 1,000,000
-00 09,576,91716,048,752440301 Santa Ana River Trunk Replacem9799123 304,951
-0 003,8780Energy System Upgrade9820423440301 0
-00 060,421,62723,667,894440301 WQCP Phase I Plant Expansion9821323 50,519,394
-01,200,000 0114,14012,354440301 Fairgrounds Pump Station Upgrd9833423 0
-00 0749,03250,967440301 Arlington/Fairhaven Pump Upgrd9835323 0
-0 00021,508Crest & Ontario Pump Ugrade9835423440301 0
-00 02,479,335425,664440301 T-1 & T-2 Switch Gear Replcmnt9851423 0
-00 0173,1301,403,811440301 Dewatering Screw Presses9858623 122,836
-00 039,14572,285440301 Transfrmrs T-1&2 Swtch GrA&B9858723 53,272
-00 05,161,735349,917440301 WQCP Levee Upgrade9858823 216,703
-00 02,352,9491,647,050440301 Sewer Main Replacament 9th St9859323 5,752
-0 01,159,19600Tertiary System Upgrade9861323440301 0
-0 000158,124CW Manhole Adj & Pipe Replace9863123440301 0
-0 0001,544CSD Capital Contribution Study9864923440301 0
-01,200,000 0129,4191,476440301 Dexter Lift Station Upgrade9865923 0
-0 000225Van Buren/Indiana Pump Station9873423440301 0
-0950,000 01,404,35611,643440301 Plnt Sup Facility/System Rehab9881023 0
200.0 %500,0001,500,000 500,0002,470,99229,007440301 BIO-SOLIDS HANDLING REHAB9892823 0
-00 014,31269,687440301 Jurupa/Acorn Storm Drain9893323 0
-3,025,000 03,025,00000Phoenix A, B & C Sewer Con9893823440301 0
(100.0)%0 2,000,000000Spruce B & C Sewer Constructn9893923440301 2,000,000
-1,220,000 0865,00000WQCP-Arlanza Sewer Trunk Rehab9894023440301 0
(100.0)%0 3,775,000000Tequesquite A, B & C Sewer Con9894123440301 3,775,000
-300,000 0300,00000Arc Flash Study9894223440301 0
-1,000,000 1,000,000100,00000Wastewater Lift Stations9894323440301 1,000,000
-1,500,000 01,855,00000WQCP/Coll Sys Mstr Plan Update9894423440301 0
-0 060,00000Woodcrest Sewer9896923440301 0
-0 03,100,00000Trautwein/Alessandro Forcemain9990323440301 0
37.4 %8,945,000111,852,18112,295,000 8,945,000Capital Outlay & Grants Total 45,146,42051,649,216
37.4 %12,295,000 8,945,0008,945,000111,852,18145,146,42051,649,216Total Budget Requirements
CCReport Name: 2017_Mid_Cycle_Report
Report Description: Budget Book - Department Budget Detail wMD
06/07/2017Date:
Time: 456
Version:
Page:19:21:28
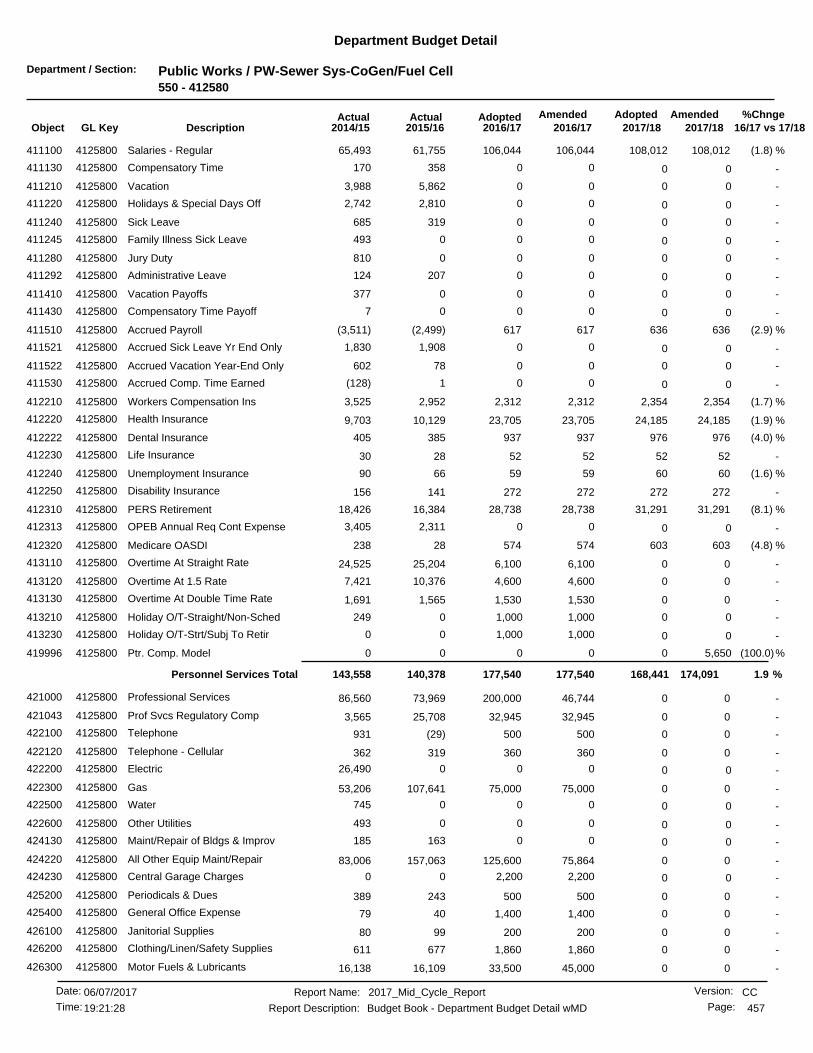
Department / Section: Public Works / PW-Sewer Sys-CoGen/Fuel Cell550 - 412580
Department Budget Detail
%Chnge16/17 vs 17/182017/182017/18
AmendedAdoptedAdopted2016/17
AmendedActualActual2016/172015/162014/15GL KeyObject Description
(1.8) %108,012106,044 108,012106,04461,755411100 Salaries - Regular4125800 65,493
-0 00358170Compensatory Time4125800411130 0
-0 005,8623,988Vacation4125800411210 0
-0 002,8102,742Holidays & Special Days Off4125800411220 0
-0 00319685Sick Leave4125800411240 0
-0 000493Family Illness Sick Leave4125800411245 0
-0 000810Jury Duty4125800411280 0
-0 00207124Administrative Leave4125800411292 0
-0 000377Vacation Payoffs4125800411410 0
-0 0007Compensatory Time Payoff4125800411430 0
(2.9) %636617 636617(2,499)411510 Accrued Payroll4125800 (3,511)
-0 001,9081,830Accrued Sick Leave Yr End Only4125800411521 0
-0 0078602Accrued Vacation Year-End Only4125800411522 0
-0 001(128)Accrued Comp. Time Earned4125800411530 0
(1.7) %2,3542,312 2,3542,3122,952412210 Workers Compensation Ins4125800 3,525
(1.9) %24,18523,705 24,18523,70510,129412220 Health Insurance4125800 9,703
(4.0) %976937 976937385412222 Dental Insurance4125800 405
-5252 525228412230 Life Insurance4125800 30
(1.6) %6059 605966412240 Unemployment Insurance4125800 90
-272272 272272141412250 Disability Insurance4125800 156
(8.1) %31,29128,738 31,29128,73816,384412310 PERS Retirement4125800 18,426
-0 002,3113,405OPEB Annual Req Cont Expense4125800412313 0
(4.8) %603574 60357428412320 Medicare OASDI4125800 238
-06,100 06,10025,204413110 Overtime At Straight Rate4125800 24,525
-04,600 04,60010,376413120 Overtime At 1.5 Rate4125800 7,421
-01,530 01,5301,565413130 Overtime At Double Time Rate4125800 1,691
-1,000 01,0000249Holiday O/T-Straight/Non-Sched4125800413210 0
-1,000 01,00000Holiday O/T-Strt/Subj To Retir4125800413230 0
(100.0)%0 5,650000Ptr. Comp. Model4125800419996 0
1.9 %174,091177,540177,540 168,441Personnel Services Total 140,378143,558
-0200,000 046,74473,969421000 Professional Services4125800 86,560
-032,945 032,94525,708421043 Prof Svcs Regulatory Comp4125800 3,565
-0500 0500(29)422100 Telephone4125800 931
-0360 0360319422120 Telephone - Cellular4125800 362
-0 00026,490Electric4125800422200 0
-075,000 075,000107,641422300 Gas4125800 53,206
-0 000745Water4125800422500 0
-0 000493Other Utilities4125800422600 0
-0 00163185Maint/Repair of Bldgs & Improv4125800424130 0
-0125,600 075,864157,063424220 All Other Equip Maint/Repair4125800 83,006
-2,200 02,20000Central Garage Charges4125800424230 0
-0500 0500243425200 Periodicals & Dues4125800 389
-01,400 01,40040425400 General Office Expense4125800 79
-0200 020099426100 Janitorial Supplies4125800 80
-01,860 01,860677426200 Clothing/Linen/Safety Supplies4125800 611
-033,500 045,00016,109426300 Motor Fuels & Lubricants4125800 16,138
CCReport Name: 2017_Mid_Cycle_Report
Report Description: Budget Book - Department Budget Detail wMD
06/07/2017Date:
Time: 457
Version:
Page:19:21:28

Department / Section: Public Works / PW-Sewer Sys-CoGen/Fuel Cell550 - 412580
Department Budget Detail
%Chnge16/17 vs 17/182017/182017/18
AmendedAdoptedAdopted2016/17
AmendedActualActual2016/172015/162014/15GL KeyObject Description
-03,500 03,50015,613426600 Chemical Supplies4125800 8,600
-02,500 02,500806426700 Maintenance Tools/Supplies4125800 214
-0150 0150150426710 Work Boot Reimbursement4125800 300
-0 05000Employee Meal Allowance4125800426755 0
-0600 060081426800 Special Department Supplies4125800 254
-2,000 02,00000Training4125800427200 0
(1.8) %2,6362,588 2,6362,5885,256428400 Liability Insurance4125800 4,911
-50 0000Employee Meal Allowance4125800448000 0
(###.#) %2,636293,962485,453 2,636Non-personnel Expenses Total 403,913287,128
-0 0000Machine and Equipment4125800462200 0
-0 0Equipment Outlay Total 0000
43.3 %12,52617,955 017,95516,533881100 General Fund Allocation Chgs4125800 33,690
-0 0055,24528,005Interfund Services from 550 Fd4125800884550 0
43.3 %12,52617,95517,955 0Charges From Others Total 71,77961,696
-0 00(83)0Interfund Services to 101 Fund4125800894101 0
-0 00(8,362)(7,484)Interfund Services to 540 Fund4125800894540 0
-0 00(3,427)(3,406)Interfund Services to 550 Fund4125800894550 0
-0 0Charges to Others Total 00(11,873)(10,890)
259.8 %680,948 189,253171,077489,457604,197481,493Total Budget Requirements
CCReport Name: 2017_Mid_Cycle_Report
Report Description: Budget Book - Department Budget Detail wMD
06/07/2017Date:
Time: 458
Version:
Page:19:21:28
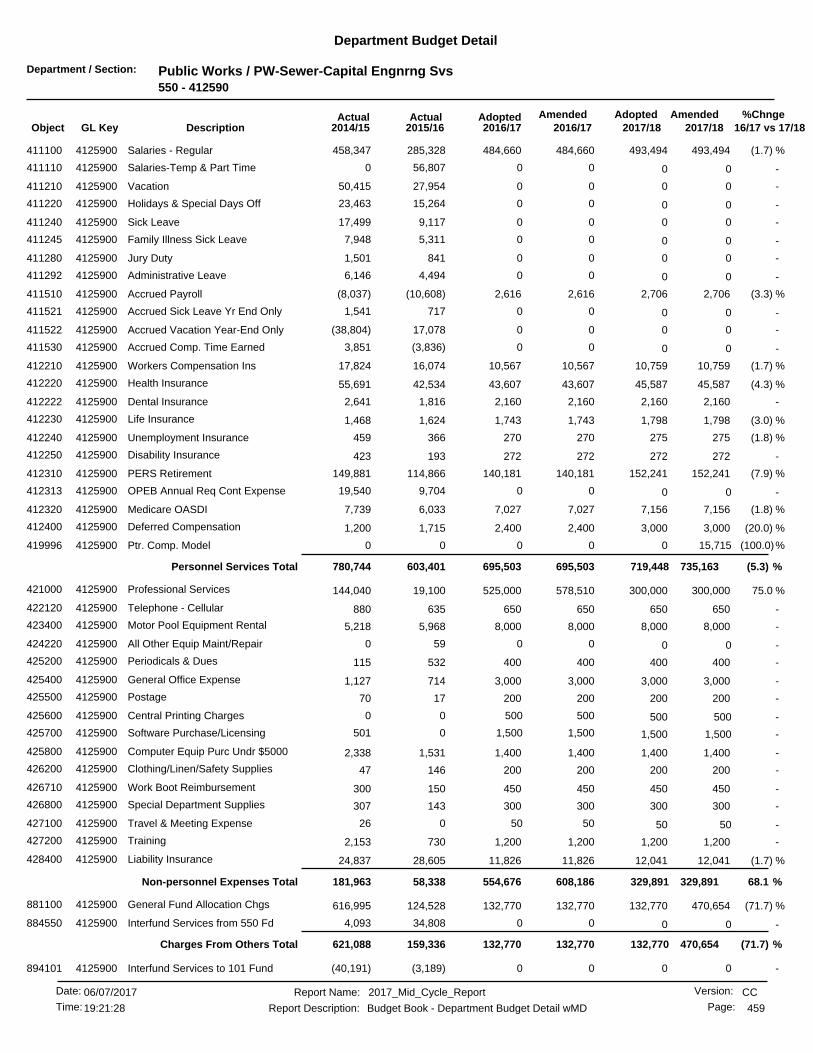
Department / Section: Public Works / PW-Sewer-Capital Engnrng Svs550 - 412590
Department Budget Detail
%Chnge16/17 vs 17/182017/182017/18
AmendedAdoptedAdopted2016/17
AmendedActualActual2016/172015/162014/15GL KeyObject Description
(1.7) %493,494484,660 493,494484,660285,328411100 Salaries - Regular4125900 458,347
-0 0056,8070Salaries-Temp & Part Time4125900411110 0
-0 0027,95450,415Vacation4125900411210 0
-0 0015,26423,463Holidays & Special Days Off4125900411220 0
-0 009,11717,499Sick Leave4125900411240 0
-0 005,3117,948Family Illness Sick Leave4125900411245 0
-0 008411,501Jury Duty4125900411280 0
-0 004,4946,146Administrative Leave4125900411292 0
(3.3) %2,7062,616 2,7062,616(10,608)411510 Accrued Payroll4125900 (8,037)
-0 007171,541Accrued Sick Leave Yr End Only4125900411521 0
-0 0017,078(38,804)Accrued Vacation Year-End Only4125900411522 0
-0 00(3,836)3,851Accrued Comp. Time Earned4125900411530 0
(1.7) %10,75910,567 10,75910,56716,074412210 Workers Compensation Ins4125900 17,824
(4.3) %45,58743,607 45,58743,60742,534412220 Health Insurance4125900 55,691
-2,1602,160 2,1602,1601,816412222 Dental Insurance4125900 2,641
(3.0) %1,7981,743 1,7981,7431,624412230 Life Insurance4125900 1,468
(1.8) %275270 275270366412240 Unemployment Insurance4125900 459
-272272 272272193412250 Disability Insurance4125900 423
(7.9) %152,241140,181 152,241140,181114,866412310 PERS Retirement4125900 149,881
-0 009,70419,540OPEB Annual Req Cont Expense4125900412313 0
(1.8) %7,1567,027 7,1567,0276,033412320 Medicare OASDI4125900 7,739
(20.0) %3,0002,400 3,0002,4001,715412400 Deferred Compensation4125900 1,200
(100.0)%0 15,715000Ptr. Comp. Model4125900419996 0
(5.3) %735,163695,503695,503 719,448Personnel Services Total 603,401780,744
75.0 %300,000525,000 300,000578,51019,100421000 Professional Services4125900 144,040
-650650 650650635422120 Telephone - Cellular4125900 880
-8,0008,000 8,0008,0005,968423400 Motor Pool Equipment Rental4125900 5,218
-0 00590All Other Equip Maint/Repair4125900424220 0
-400400 400400532425200 Periodicals & Dues4125900 115
-3,0003,000 3,0003,000714425400 General Office Expense4125900 1,127
-200200 20020017425500 Postage4125900 70
-500 50050000Central Printing Charges4125900425600 500
-1,500 1,5001,5000501Software Purchase/Licensing4125900425700 1,500
-1,4001,400 1,4001,4001,531425800 Computer Equip Purc Undr $50004125900 2,338
-200200 200200146426200 Clothing/Linen/Safety Supplies4125900 47
-450450 450450150426710 Work Boot Reimbursement4125900 300
-300300 300300143426800 Special Department Supplies4125900 307
-50 5050026Travel & Meeting Expense4125900427100 50
-1,2001,200 1,2001,200730427200 Training4125900 2,153
(1.7) %12,04111,826 12,04111,82628,605428400 Liability Insurance4125900 24,837
68.1 %329,891608,186554,676 329,891Non-personnel Expenses Total 58,338181,963
(71.7) %470,654132,770 132,770132,770124,528881100 General Fund Allocation Chgs4125900 616,995
-0 0034,8084,093Interfund Services from 550 Fd4125900884550 0
(71.7) %470,654132,770132,770 132,770Charges From Others Total 159,336621,088
-0 00(3,189)(40,191)Interfund Services to 101 Fund4125900894101 0
CCReport Name: 2017_Mid_Cycle_Report
Report Description: Budget Book - Department Budget Detail wMD
06/07/2017Date:
Time: 459
Version:
Page:19:21:28

Department / Section: Public Works / PW-Sewer-Capital Engnrng Svs550 - 412590
Department Budget Detail
%Chnge16/17 vs 17/182017/182017/18
AmendedAdoptedAdopted2016/17
AmendedActualActual2016/172015/162014/15GL KeyObject Description
-0 00(26,623)(63,435)Interfund Services to 230 Fund4125900894230 0
-0 00(14,119)0Interfund Services to 240 Fund4125900894240 0
-0 00(91,517)(74,490)Interfund Services to 410 Fund4125900894410 0
-0 00(2,563)(3,504)Interfund Services to 430 Fund4125900894430 0
-0 00(6,138)(46,498)Interfund Services to 432 Fund4125900894432 0
-0 000(3,848)Interfund Services to 442 Fund4125900894442 0
-0 00(7,664)0Interfund Services to 520 Fund4125900894520 0
-0 00(13,359)(28,282)Interfund Services to 540 Fund4125900894540 0
(6.3) %(438,141)(410,111) (438,141)(410,111)(289,405)894550 Interfund Services to 550 Fund4125900 (267,591)
(6.3) %(438,141)(410,111)(410,111) (438,141)Charges to Others Total (454,580)(527,843)
(11.3) %972,838 1,097,567743,9681,026,348366,4951,055,952Total Budget Requirements
CCReport Name: 2017_Mid_Cycle_Report
Report Description: Budget Book - Department Budget Detail wMD
06/07/2017Date:
Time: 460
Version:
Page:19:21:28
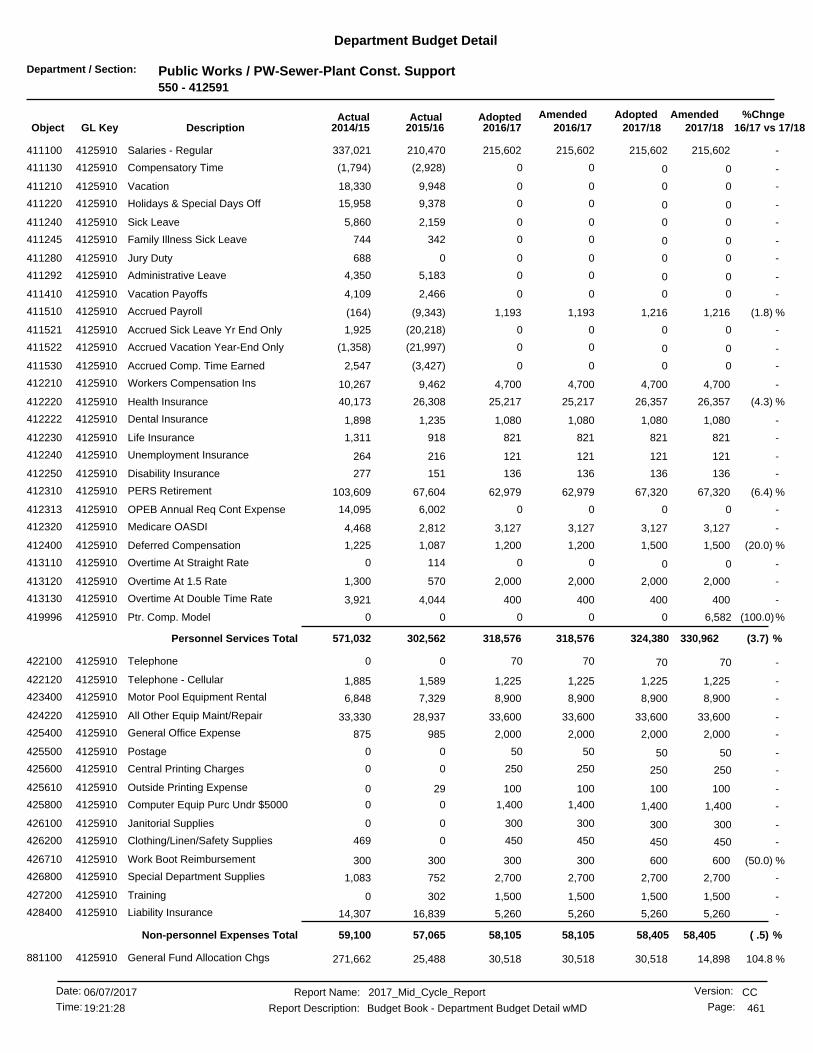
Department / Section: Public Works / PW-Sewer-Plant Const. Support550 - 412591
Department Budget Detail
%Chnge16/17 vs 17/182017/182017/18
AmendedAdoptedAdopted2016/17
AmendedActualActual2016/172015/162014/15GL KeyObject Description
-215,602215,602 215,602215,602210,470411100 Salaries - Regular4125910 337,021
-0 00(2,928)(1,794)Compensatory Time4125910411130 0
-0 009,94818,330Vacation4125910411210 0
-0 009,37815,958Holidays & Special Days Off4125910411220 0
-0 002,1595,860Sick Leave4125910411240 0
-0 00342744Family Illness Sick Leave4125910411245 0
-0 000688Jury Duty4125910411280 0
-0 005,1834,350Administrative Leave4125910411292 0
-0 002,4664,109Vacation Payoffs4125910411410 0
(1.8) %1,2161,193 1,2161,193(9,343)411510 Accrued Payroll4125910 (164)
-0 00(20,218)1,925Accrued Sick Leave Yr End Only4125910411521 0
-0 00(21,997)(1,358)Accrued Vacation Year-End Only4125910411522 0
-0 00(3,427)2,547Accrued Comp. Time Earned4125910411530 0
-4,7004,700 4,7004,7009,462412210 Workers Compensation Ins4125910 10,267
(4.3) %26,35725,217 26,35725,21726,308412220 Health Insurance4125910 40,173
-1,0801,080 1,0801,0801,235412222 Dental Insurance4125910 1,898
-821821 821821918412230 Life Insurance4125910 1,311
-121121 121121216412240 Unemployment Insurance4125910 264
-136136 136136151412250 Disability Insurance4125910 277
(6.4) %67,32062,979 67,32062,97967,604412310 PERS Retirement4125910 103,609
-0 006,00214,095OPEB Annual Req Cont Expense4125910412313 0
-3,1273,127 3,1273,1272,812412320 Medicare OASDI4125910 4,468
(20.0) %1,5001,200 1,5001,2001,087412400 Deferred Compensation4125910 1,225
-0 001140Overtime At Straight Rate4125910413110 0
-2,0002,000 2,0002,000570413120 Overtime At 1.5 Rate4125910 1,300
-400400 4004004,044413130 Overtime At Double Time Rate4125910 3,921
(100.0)%0 6,582000Ptr. Comp. Model4125910419996 0
(3.7) %330,962318,576318,576 324,380Personnel Services Total 302,562571,032
-70 707000Telephone4125910422100 70
-1,2251,225 1,2251,2251,589422120 Telephone - Cellular4125910 1,885
-8,9008,900 8,9008,9007,329423400 Motor Pool Equipment Rental4125910 6,848
-33,60033,600 33,60033,60028,937424220 All Other Equip Maint/Repair4125910 33,330
-2,0002,000 2,0002,000985425400 General Office Expense4125910 875
-50 505000Postage4125910425500 50
-250 25025000Central Printing Charges4125910425600 250
-100100 10010029425610 Outside Printing Expense4125910 0
-1,400 1,4001,40000Computer Equip Purc Undr $50004125910425800 1,400
-300 30030000Janitorial Supplies4125910426100 300
-450 4504500469Clothing/Linen/Safety Supplies4125910426200 450
(50.0) %600300 600300300426710 Work Boot Reimbursement4125910 300
-2,7002,700 2,7002,700752426800 Special Department Supplies4125910 1,083
-1,5001,500 1,5001,500302427200 Training4125910 0
-5,2605,260 5,2605,26016,839428400 Liability Insurance4125910 14,307
( .5) %58,40558,10558,105 58,405Non-personnel Expenses Total 57,06559,100
104.8 %14,89830,518 30,51830,51825,488881100 General Fund Allocation Chgs4125910 271,662
CCReport Name: 2017_Mid_Cycle_Report
Report Description: Budget Book - Department Budget Detail wMD
06/07/2017Date:
Time: 461
Version:
Page:19:21:28
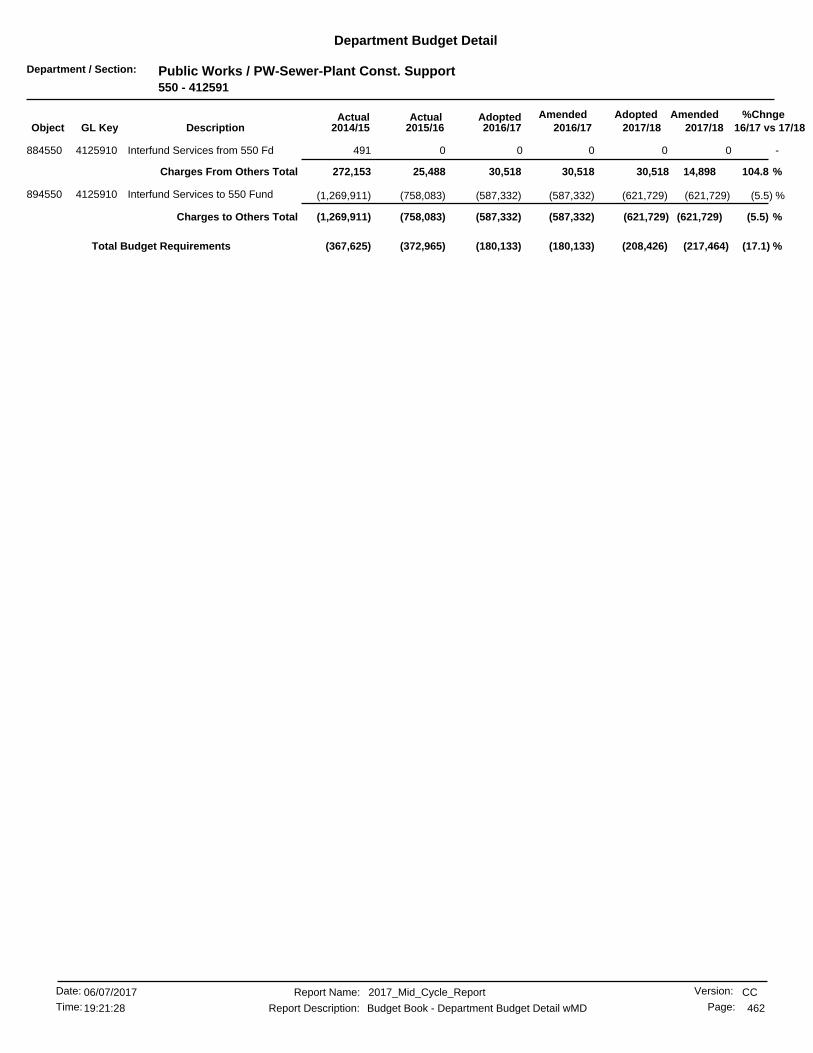
Department / Section: Public Works / PW-Sewer-Plant Const. Support550 - 412591
Department Budget Detail
%Chnge16/17 vs 17/182017/182017/18
AmendedAdoptedAdopted2016/17
AmendedActualActual2016/172015/162014/15GL KeyObject Description
-0 000491Interfund Services from 550 Fd4125910884550 0
104.8 %14,89830,51830,518 30,518Charges From Others Total 25,488272,153
(5.5) %(621,729)(587,332) (621,729)(587,332)(758,083)894550 Interfund Services to 550 Fund4125910 (1,269,911)
(5.5) %(621,729)(587,332)(587,332) (621,729)Charges to Others Total (758,083)(1,269,911)
(17.1) %(180,133) (217,464)(208,426)(180,133)(372,965)(367,625)Total Budget Requirements
CCReport Name: 2017_Mid_Cycle_Report
Report Description: Budget Book - Department Budget Detail wMD
06/07/2017Date:
Time: 462
Version:
Page:19:21:28
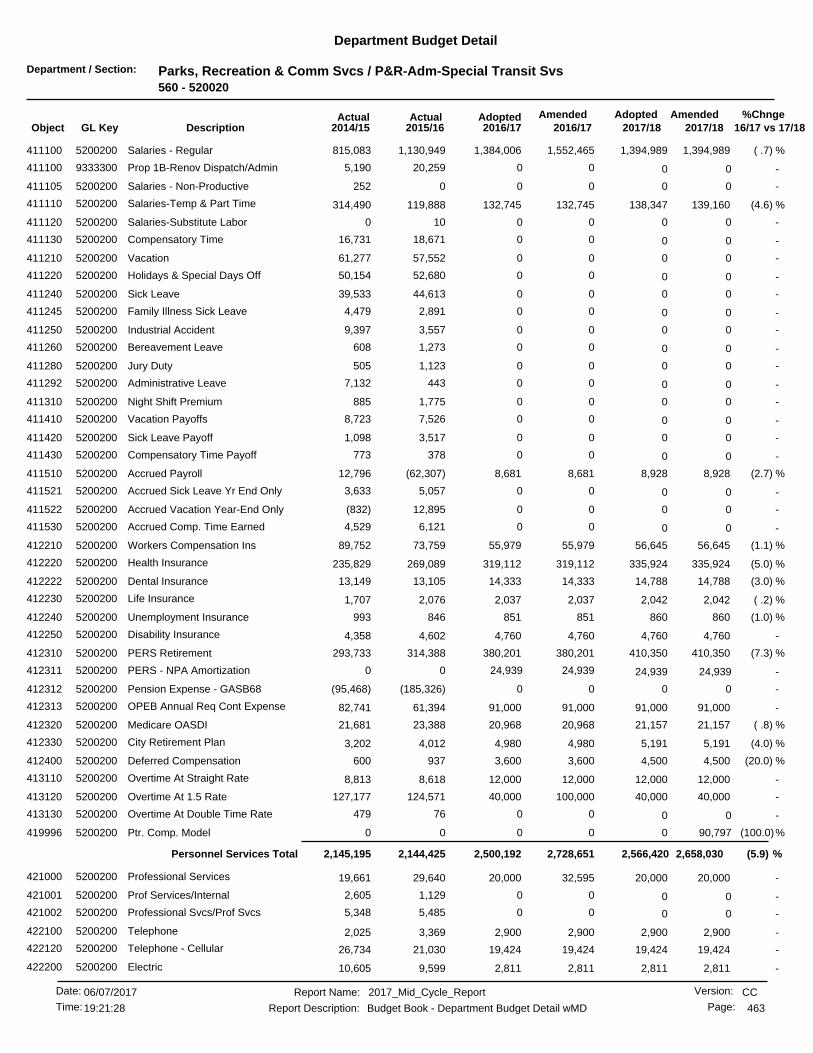
Department / Section: Parks, Recreation & Comm Svcs / P&R-Adm-Special Transit Svs560 - 520020
Department Budget Detail
%Chnge16/17 vs 17/182017/182017/18
AmendedAdoptedAdopted2016/17
AmendedActualActual2016/172015/162014/15GL KeyObject Description
( .7) %1,394,9891,384,006 1,394,9891,552,4651,130,949411100 Salaries - Regular5200200 815,083
-0 0020,2595,190Prop 1B-Renov Dispatch/Admin9333300411100 0
-0 000252Salaries - Non-Productive5200200411105 0
(4.6) %139,160132,745 138,347132,745119,888411110 Salaries-Temp & Part Time5200200 314,490
-0 00100Salaries-Substitute Labor5200200411120 0
-0 0018,67116,731Compensatory Time5200200411130 0
-0 0057,55261,277Vacation5200200411210 0
-0 0052,68050,154Holidays & Special Days Off5200200411220 0
-0 0044,61339,533Sick Leave5200200411240 0
-0 002,8914,479Family Illness Sick Leave5200200411245 0
-0 003,5579,397Industrial Accident5200200411250 0
-0 001,273608Bereavement Leave5200200411260 0
-0 001,123505Jury Duty5200200411280 0
-0 004437,132Administrative Leave5200200411292 0
-0 001,775885Night Shift Premium5200200411310 0
-0 007,5268,723Vacation Payoffs5200200411410 0
-0 003,5171,098Sick Leave Payoff5200200411420 0
-0 00378773Compensatory Time Payoff5200200411430 0
(2.7) %8,9288,681 8,9288,681(62,307)411510 Accrued Payroll5200200 12,796
-0 005,0573,633Accrued Sick Leave Yr End Only5200200411521 0
-0 0012,895(832)Accrued Vacation Year-End Only5200200411522 0
-0 006,1214,529Accrued Comp. Time Earned5200200411530 0
(1.1) %56,64555,979 56,64555,97973,759412210 Workers Compensation Ins5200200 89,752
(5.0) %335,924319,112 335,924319,112269,089412220 Health Insurance5200200 235,829
(3.0) %14,78814,333 14,78814,33313,105412222 Dental Insurance5200200 13,149
( .2) %2,0422,037 2,0422,0372,076412230 Life Insurance5200200 1,707
(1.0) %860851 860851846412240 Unemployment Insurance5200200 993
-4,7604,760 4,7604,7604,602412250 Disability Insurance5200200 4,358
(7.3) %410,350380,201 410,350380,201314,388412310 PERS Retirement5200200 293,733
-24,939 24,93924,93900PERS - NPA Amortization5200200412311 24,939
-0 00(185,326)(95,468)Pension Expense - GASB685200200412312 0
-91,00091,000 91,00091,00061,394412313 OPEB Annual Req Cont Expense5200200 82,741
( .8) %21,15720,968 21,15720,96823,388412320 Medicare OASDI5200200 21,681
(4.0) %5,1914,980 5,1914,9804,012412330 City Retirement Plan5200200 3,202
(20.0) %4,5003,600 4,5003,600937412400 Deferred Compensation5200200 600
-12,00012,000 12,00012,0008,618413110 Overtime At Straight Rate5200200 8,813
-40,00040,000 40,000100,000124,571413120 Overtime At 1.5 Rate5200200 127,177
-0 0076479Overtime At Double Time Rate5200200413130 0
(100.0)%0 90,797000Ptr. Comp. Model5200200419996 0
(5.9) %2,658,0302,728,6512,500,192 2,566,420Personnel Services Total 2,144,4252,145,195
-20,00020,000 20,00032,59529,640421000 Professional Services5200200 19,661
-0 001,1292,605Prof Services/Internal5200200421001 0
-0 005,4855,348Professional Svcs/Prof Svcs5200200421002 0
-2,9002,900 2,9002,9003,369422100 Telephone5200200 2,025
-19,42419,424 19,42419,42421,030422120 Telephone - Cellular5200200 26,734
-2,8112,811 2,8112,8119,599422200 Electric5200200 10,605
CCReport Name: 2017_Mid_Cycle_Report
Report Description: Budget Book - Department Budget Detail wMD
06/07/2017Date:
Time: 463
Version:
Page:19:21:28

Department / Section: Parks, Recreation & Comm Svcs / P&R-Adm-Special Transit Svs560 - 520020
Department Budget Detail
%Chnge16/17 vs 17/182017/182017/18
AmendedAdoptedAdopted2016/17
AmendedActualActual2016/172015/162014/15GL KeyObject Description
-231231 231231476422500 Water5200200 1,437
-366366 366366618422600 Other Utilities5200200 2,747
-5,3835,383 5,3835,3836,399423400 Motor Pool Equipment Rental5200200 5,774
-200 2002000254Vehicle Usage Reimb Employee5200200423500 200
-00 010,000218424130 Maint/Repair of Bldgs & Improv5200200 83
-0 0506,26300Prop 1B-Repaint 35 Mini-Buses9333200424210 0
-1,3001,300 1,3001,3004,634424220 All Other Equip Maint/Repair5200200 1,611
-0 000316FTA-09/10 Support Equipment9246556424220 0
-400,000400,000 400,000400,0000424230 Central Garage Charges5200200 (0)
-00 0184,386215,614424230 FTA-13/14 Prev Maint-Z2089259456 0
-10,00010,000 10,00010,00015,174424240 Central Communications Chg5200200 8,000
-18,50018,500 18,50018,09521,760424250 Sublet Repairs-Automotive5200200 19,791
-0 000464,578FTA-Prev Maint-08/099244856424250 0
-00 0285,495114,505424250 FTA-12/13 Preventive Maintenan9254456 0
-52,00052,000 52,00054,52046,187424310 Software Maintenance/Support5200200 61,629
-7,0007,000 7,0007,0002,005425100 Advertising Expense5200200 4,607
-1,0001,000 1,0001,000610425200 Periodicals & Dues5200200 580
-11,90011,900 11,90011,90012,608425400 General Office Expense5200200 11,247
-500500 500500493425500 Postage5200200 598
-1,0001,000 1,0001,000340425600 Central Printing Charges5200200 296
-0 00120140Outside Printing Expense5200200425610 0
-0 0007,124Computer Equip Purc Undr $50005200200425800 0
-0 00910Janitorial Supplies5200200426100 0
-25,00025,000 25,00025,00010,017426200 Clothing/Linen/Safety Supplies5200200 6,147
-0 000492CalEma Security Safety Imps9406856426200 0
-225,000225,000 225,000257,661200,328426300 Motor Fuels & Lubricants5200200 224,272
-0 00(90)0Horticultural Supplies5200200426400 0
-0 005574,862Recreation Supplies5200200426500 0
-3,0003,000 3,0003,0007,130426800 Special Department Supplies5200200 1,103
-1,5001,500 1,5001,5006,841427100 Travel & Meeting Expense5200200 5,989
-6,7006,700 6,7006,7003,391427200 Training5200200 7,474
(1.0) %46,00245,506 46,00245,50639,732428400 Liability Insurance5200200 36,526
-5,000 5,0005,00000Insurance Charges - Direct5200200428420 5,000
( .0) %866,7171,899,736866,221 866,717Non-personnel Expenses Total 780,022944,668
-0 01,87000FTA-Replace Veh-08/099245256462100 0
-0 000441,412FTA-Replace Veh-11/129251356462100 0
-0 000537Prop 1B-11 Vehicles9323400462100 0
-0 067708,213Vehicle Replacement Prop 1B9406556462100 0
-0 058,9400551,765PTMISEA Vehicle Replacement9406956462100 0
-0 0Equipment Outlay Total 061,48701,001,928
(10.3) %39,26635,204 39,26635,20431,424481000 Principal5200200 27,926
13.5 %12,44814,131 12,44814,13114,018482000 Interest5200200 12,110
(4.6) %51,71449,33549,335 51,714Debt Service Total 45,44240,037
-0 00014,835CA Transit Security Grant9324300440220 0
-00 015,3332,889440220 CalEma Security Safety Imps9406856 8,284
CCReport Name: 2017_Mid_Cycle_Report
Report Description: Budget Book - Department Budget Detail wMD
06/07/2017Date:
Time: 464
Version:
Page:19:21:28
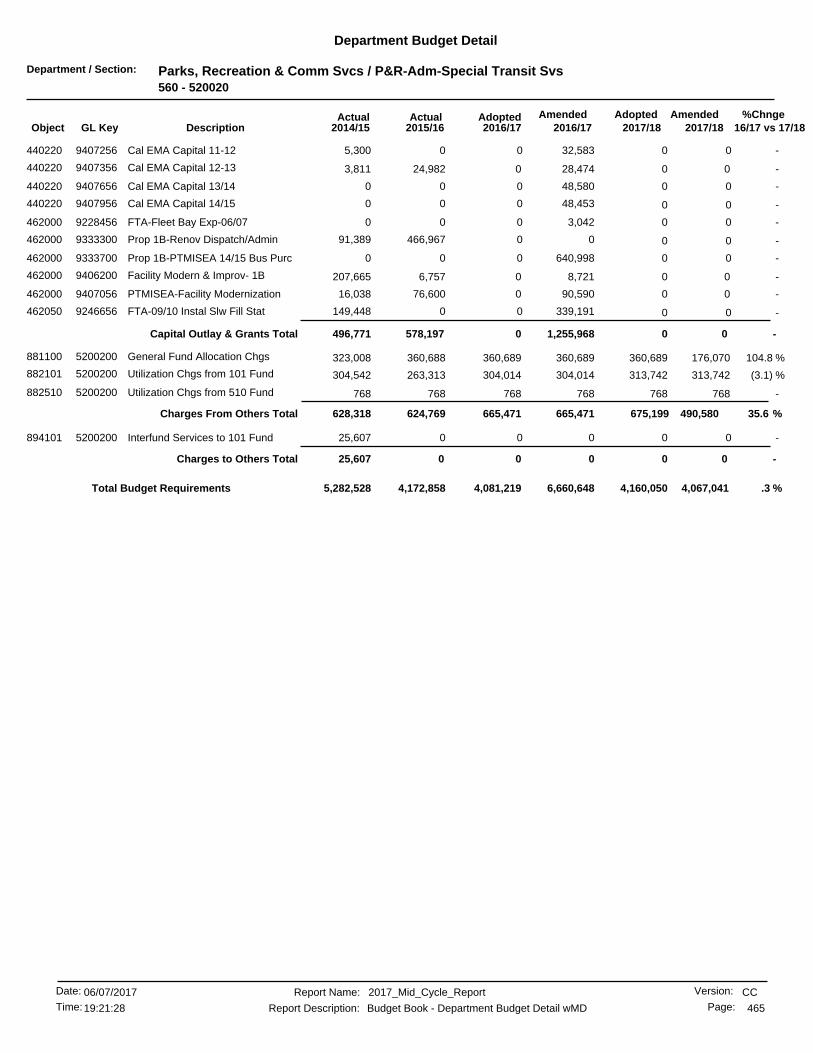
Department / Section: Parks, Recreation & Comm Svcs / P&R-Adm-Special Transit Svs560 - 520020
Department Budget Detail
%Chnge16/17 vs 17/182017/182017/18
AmendedAdoptedAdopted2016/17
AmendedActualActual2016/172015/162014/15GL KeyObject Description
-0 032,58305,300Cal EMA Capital 11-129407256440220 0
-00 028,47424,982440220 Cal EMA Capital 12-139407356 3,811
-0 048,58000Cal EMA Capital 13/149407656440220 0
-0 048,45300Cal EMA Capital 14/159407956440220 0
-0 03,04200FTA-Fleet Bay Exp-06/079228456462000 0
-0 00466,96791,389Prop 1B-Renov Dispatch/Admin9333300462000 0
-0 0640,99800Prop 1B-PTMISEA 14/15 Bus Purc9333700462000 0
-00 08,7216,757462000 Facility Modern & Improv- 1B9406200 207,665
-00 090,59076,600462000 PTMISEA-Facility Modernization9407056 16,038
-0 0339,1910149,448FTA-09/10 Instal Slw Fill Stat9246656462050 0
-0 0Capital Outlay & Grants Total 01,255,968578,197496,771
104.8 %176,070360,689 360,689360,689360,688881100 General Fund Allocation Chgs5200200 323,008
(3.1) %313,742304,014 313,742304,014263,313882101 Utilization Chgs from 101 Fund5200200 304,542
-768768 768768768882510 Utilization Chgs from 510 Fund5200200 768
35.6 %490,580665,471665,471 675,199Charges From Others Total 624,769628,318
-0 00025,607Interfund Services to 101 Fund5200200894101 0
-0 0Charges to Others Total 00025,607
.3 %4,081,219 4,067,0414,160,0506,660,6484,172,8585,282,528Total Budget Requirements
CCReport Name: 2017_Mid_Cycle_Report
Report Description: Budget Book - Department Budget Detail wMD
06/07/2017Date:
Time: 465
Version:
Page:19:21:28

Department / Section: Public Works / Public Works-Public Parking570 - 415000
Department Budget Detail
%Chnge16/17 vs 17/182017/182017/18
AmendedAdoptedAdopted2016/17
AmendedActualActual2016/172015/162014/15GL KeyObject Description
302.2 %203,247817,476 832,383811,734615,516411100 Salaries - Regular4150000 661,548
-0 000(331)Salaries-Temp & Part Time4150000411110 0
-0 0018,62117,055Compensatory Time4150000411130 0
-0 0046,56835,595Vacation4150000411210 0
-0 0030,05132,994Holidays & Special Days Off4150000411220 0
-0 000156Military Leave4150000411230 0
-0 0035,32225,081Sick Leave4150000411240 0
-0 005,7604,225Family Illness Sick Leave4150000411245 0
-0 004011,087Industrial Accident4150000411250 0
-0 00850361Bereavement Leave4150000411260 0
-0 00577441Jury Duty4150000411280 0
-0 003,56114,353Administrative Leave4150000411292 0
-0 003442,718Vacation Payoffs4150000411410 0
-0 000664Compensatory Time Payoff4150000411430 0
318.8 %1,1484,808 4,9814,808(37,254)411510 Accrued Payroll4150000 7,800
-0 00(1,477)1,303Accrued Sick Leave Yr End Only4150000411521 0
-0 00(3,971)7,493Accrued Vacation Year-End Only4150000411522 0
-0 00(2,061)1,334Accrued Comp. Time Earned4150000411530 0
305.8 %6,91028,043 28,55328,04330,414412210 Workers Compensation Ins4150000 29,335
500.1 %30,417182,548 191,082182,548138,137412220 Health Insurance4150000 138,092
422.0 %1,6208,457 8,6528,4577,369412222 Dental Insurance4150000 7,382
36.8 %9941,360 1,3841,3601,297412230 Life Insurance4150000 1,184
305.3 %113458 467458462412240 Unemployment Insurance4150000 558
1500.0 %1362,176 2,1762,1762,029412250 Disability Insurance4150000 2,170
287.2 %57,880224,132 243,942224,132179,139412310 PERS Retirement4150000 183,868
-0 00(110,744)(57,048)Pension Expense - GASB684150000412312 0
-0 0031,51648,450OPEB Annual Req Cont Expense4150000412313 0
305.8 %2,92111,854 12,07111,85412,032412320 Medicare OASDI4150000 12,847
(20.0) %3,0002,400 3,0002,4001,875412400 Deferred Compensation4150000 1,175
-0 005,96760Overtime At Straight Rate4150000413110 0
-073,359 75,50073,35967,538413120 Overtime At 1.5 Rate4150000 74,227
-0 003,9243,351Overtime At Double Time Rate4150000413130 0
-0 007230O/T 1.5 Rate Sub To Retirement4150000413240 0
(100.0)%0 44,890000Ptr. Comp. Model4150000419996 0
284.1 %353,2761,351,3291,357,071 1,404,191Personnel Services Total 1,084,4921,259,541
181.9 %95,983270,600 287,983324,124240,619421000 Professional Services4150000 244,979
-0 003861,781Prof Services/Internal4150000421001 0
(10.2) %1,524,2601,368,000 1,384,2601,368,0001,328,261421002 Professional Svcs/Prof Svcs4150000 1,335,874
-0 0015,0690Purchase Services4150000421019 0
-0960,000 984,000960,000800,366421043 Prof Svcs Regulatory Comp4150000 959,488
138.9 %226540 564540618422100 Telephone4150000 524
366.0 %2,62112,216 12,53212,21611,642422120 Telephone - Cellular4150000 9,531
(3.1) %126,000122,000 126,000122,00097,067422200 Electric4150000 72,876
(2.4) %9,9609,720 9,9609,72010,851422500 Water4150000 2,290
(1.4) %5,7485,664 5,7485,6644,848422600 Other Utilities4150000 2,637
(1.4) %178,784176,266 178,784185,337149,233423200 Land and Building Rental4150000 150,678
CCReport Name: 2017_Mid_Cycle_Report
Report Description: Budget Book - Department Budget Detail wMD
06/07/2017Date:
Time: 466
Version:
Page:19:21:28
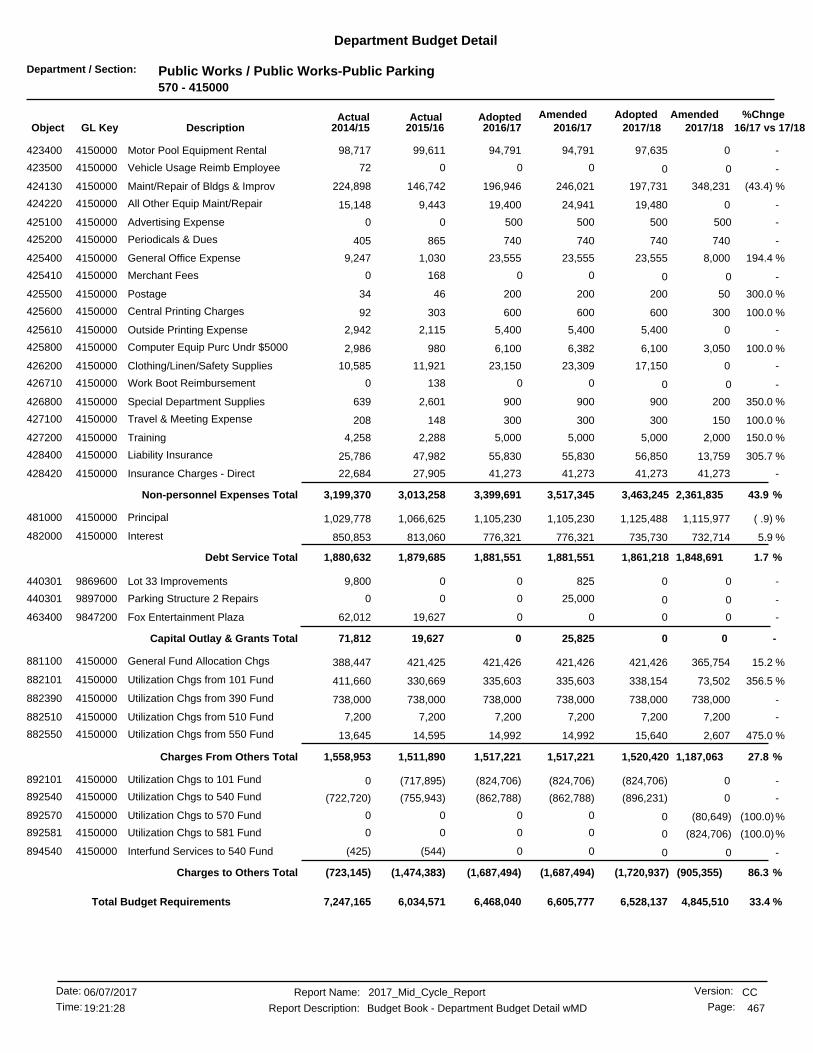
Department / Section: Public Works / Public Works-Public Parking570 - 415000
Department Budget Detail
%Chnge16/17 vs 17/182017/182017/18
AmendedAdoptedAdopted2016/17
AmendedActualActual2016/172015/162014/15GL KeyObject Description
-094,791 97,63594,79199,611423400 Motor Pool Equipment Rental4150000 98,717
-0 00072Vehicle Usage Reimb Employee4150000423500 0
(43.4) %348,231196,946 197,731246,021146,742424130 Maint/Repair of Bldgs & Improv4150000 224,898
-019,400 19,48024,9419,443424220 All Other Equip Maint/Repair4150000 15,148
-500 50050000Advertising Expense4150000425100 500
-740740 740740865425200 Periodicals & Dues4150000 405
194.4 %8,00023,555 23,55523,5551,030425400 General Office Expense4150000 9,247
-0 001680Merchant Fees4150000425410 0
300.0 %50200 20020046425500 Postage4150000 34
100.0 %300600 600600303425600 Central Printing Charges4150000 92
-05,400 5,4005,4002,115425610 Outside Printing Expense4150000 2,942
100.0 %3,0506,100 6,1006,382980425800 Computer Equip Purc Undr $50004150000 2,986
-023,150 17,15023,30911,921426200 Clothing/Linen/Safety Supplies4150000 10,585
-0 001380Work Boot Reimbursement4150000426710 0
350.0 %200900 9009002,601426800 Special Department Supplies4150000 639
100.0 %150300 300300148427100 Travel & Meeting Expense4150000 208
150.0 %2,0005,000 5,0005,0002,288427200 Training4150000 4,258
305.7 %13,75955,830 56,85055,83047,982428400 Liability Insurance4150000 25,786
-41,27341,273 41,27341,27327,905428420 Insurance Charges - Direct4150000 22,684
43.9 %2,361,8353,517,3453,399,691 3,463,245Non-personnel Expenses Total 3,013,2583,199,370
( .9) %1,115,9771,105,230 1,125,4881,105,2301,066,625481000 Principal4150000 1,029,778
5.9 %732,714776,321 735,730776,321813,060482000 Interest4150000 850,853
1.7 %1,848,6911,881,5511,881,551 1,861,218Debt Service Total 1,879,6851,880,632
-0 082509,800Lot 33 Improvements9869600440301 0
-0 025,00000Parking Structure 2 Repairs9897000440301 0
-0 0019,62762,012Fox Entertainment Plaza9847200463400 0
-0 0Capital Outlay & Grants Total 025,82519,62771,812
15.2 %365,754421,426 421,426421,426421,425881100 General Fund Allocation Chgs4150000 388,447
356.5 %73,502335,603 338,154335,603330,669882101 Utilization Chgs from 101 Fund4150000 411,660
-738,000738,000 738,000738,000738,000882390 Utilization Chgs from 390 Fund4150000 738,000
-7,2007,200 7,2007,2007,200882510 Utilization Chgs from 510 Fund4150000 7,200
475.0 %2,60714,992 15,64014,99214,595882550 Utilization Chgs from 550 Fund4150000 13,645
27.8 %1,187,0631,517,2211,517,221 1,520,420Charges From Others Total 1,511,8901,558,953
-0(824,706) (824,706)(824,706)(717,895)892101 Utilization Chgs to 101 Fund4150000 0
-0(862,788) (896,231)(862,788)(755,943)892540 Utilization Chgs to 540 Fund4150000 (722,720)
(100.0)%0 (80,649)000Utilization Chgs to 570 Fund4150000892570 0
(100.0)%0 (824,706)000Utilization Chgs to 581 Fund4150000892581 0
-0 00(544)(425)Interfund Services to 540 Fund4150000894540 0
86.3 %(905,355)(1,687,494)(1,687,494) (1,720,937)Charges to Others Total (1,474,383)(723,145)
33.4 %6,468,040 4,845,5106,528,1376,605,7776,034,5717,247,165Total Budget Requirements
CCReport Name: 2017_Mid_Cycle_Report
Report Description: Budget Book - Department Budget Detail wMD
06/07/2017Date:
Time: 467
Version:
Page:19:21:28

Department / Section: Public Works / Public Works-Parking Enforcmnt570 - 415100
Department Budget Detail
%Chnge16/17 vs 17/182017/182017/18
AmendedAdoptedAdopted2016/17
AmendedActualActual2016/172015/162014/15GL KeyObject Description
(100.0)%0 629,136000Salaries - Regular4151000411100 0
(100.0)%0 3,833000Accrued Payroll4151000411510 0
(100.0)%0 21,643000Workers Compensation Ins4151000412210 0
(100.0)%0 160,665000Health Insurance4151000412220 0
(100.0)%0 7,032000Dental Insurance4151000412222 0
(100.0)%0 390000Life Insurance4151000412230 0
(100.0)%0 354000Unemployment Insurance4151000412240 0
(100.0)%0 2,040000Disability Insurance4151000412250 0
(100.0)%0 186,062000PERS Retirement4151000412310 0
(100.0)%0 9,150000Medicare OASDI4151000412320 0
(100.0)%0 75,500000Overtime At 1.5 Rate4151000413120 0
(100.0) %0 1,095,805Personnel Services Total 0000
(100.0)%0 267,000000Professional Services4151000421000 0
(100.0)%0 984,000000Prof Svcs Regulatory Comp4151000421043 0
(100.0)%0 338000Telephone4151000422100 0
(100.0)%0 9,911000Telephone - Cellular4151000422120 0
(100.0)%0 97,635000Motor Pool Equipment Rental4151000423400 0
(100.0)%0 500000Maint/Repair of Bldgs & Improv4151000424130 0
(100.0)%0 19,480000All Other Equip Maint/Repair4151000424220 0
(100.0)%0 15,555000General Office Expense4151000425400 0
(100.0)%0 150000Postage4151000425500 0
(100.0)%0 300000Central Printing Charges4151000425600 0
(100.0)%0 5,400000Outside Printing Expense4151000425610 0
(100.0)%0 3,050000Computer Equip Purc Undr $50004151000425800 0
(100.0)%0 17,150000Clothing/Linen/Safety Supplies4151000426200 0
(100.0)%0 700000Special Department Supplies4151000426800 0
(100.0)%0 150000Travel & Meeting Expense4151000427100 0
(100.0)%0 3,000000Training4151000427200 0
(100.0)%0 43,091000Liability Insurance4151000428400 0
(100.0) %0 1,467,410Non-personnel Expenses Total 0000
(100.0)%0 9,511000Principal4151000481000 0
(100.0)%0 3,016000Interest4151000482000 0
(100.0) %0 12,527Debt Service Total 0000
(100.0)%0 351,188000General Fund Allocation Chgs4151000881100 0
(100.0)%0 264,652000Utilization Chgs from 101 Fund4151000882101 0
(100.0)%0 13,033000Utilization Chgs from 550 Fund4151000882550 0
(100.0)%0 80,649000Utilization Chgs from 570 Fund4151000882570 0
(100.0) %0 709,522Charges From Others Total 0000
(100.0)%0 (896,231)000Utilization Chgs to 540 Fund4151000892540 0
(100.0) %0 (896,231)Charges to Others Total 0000
-2,389,0330 000Total Budget Requirements 0
CCReport Name: 2017_Mid_Cycle_Report
Report Description: Budget Book - Department Budget Detail wMD
06/07/2017Date:
Time: 468
Version:
Page:19:21:28

Department / Section: General Services / Convention Center580 - 225000
Department Budget Detail
%Chnge16/17 vs 17/182017/182017/18
AmendedAdoptedAdopted2016/17
AmendedActualActual2016/172015/162014/15GL KeyObject Description
(100.0)%0 184,379000Insurance Charges - Direct2250000428420 0
(100.0) %0 184,379Non-personnel Expenses Total 0000
(100.0)%0 40,000000Convention Center Improvements2250000450310 0
(100.0)%0 604,005000Convention Center Mgmt Fee2250000459971 0
(100.0)%0 5,315,264000Convention Ctr Operating Exp2250000459972 0
(100.0) %0 5,959,269Special Projects Total 0000
(100.0)%0 2,341,324000Principal2250000481000 0
(100.0)%0 1,254,354000Interest2250000482000 0
(100.0) %0 3,595,678Debt Service Total 0000
(100.0)%0 14,118000Utilization Chgs from 390 Fund2250000882390 0
(100.0) %0 14,118Charges From Others Total 0000
(100.0)%0 (30,499)000Utilization Chgs to 101 Fund2250000892101 0
(100.0)%0 (129,623)000Utilization Chgs to 581 Fund2250000892581 0
(100.0) %0 (160,122)Charges to Others Total 0000
-9,593,3220 000Total Budget Requirements 0
CCReport Name: 2017_Mid_Cycle_Report
Report Description: Budget Book - Department Budget Detail wMD
06/07/2017Date:
Time: 469
Version:
Page:19:21:28

Department / Section: General Services / Sports Commisssion/CVB580 - 225010
Department Budget Detail
%Chnge16/17 vs 17/182017/182017/18
AmendedAdoptedAdopted2016/17
AmendedActualActual2016/172015/162014/15GL KeyObject Description
(100.0)%0 154,822000Riverside Sports Commision2250100459973 0
(100.0)%0 1,397,763000Riverside CVB2250100459974 0
(100.0) %0 1,552,585Special Projects Total 0000
-1,552,5850 000Total Budget Requirements 0
CCReport Name: 2017_Mid_Cycle_Report
Report Description: Budget Book - Department Budget Detail wMD
06/07/2017Date:
Time: 470
Version:
Page:19:21:28

Department / Section: Museum / Fox Performing Arts Theater581 - 531010
Department Budget Detail
%Chnge16/17 vs 17/182017/182017/18
AmendedAdoptedAdopted2016/17
AmendedActualActual2016/172015/162014/15GL KeyObject Description
(100.0)%0 3,500,000000Professional Services5310100421000 0
(100.0)%0 75,674000Insurance Charges - Direct5310100428420 0
(100.0) %0 3,575,674Non-personnel Expenses Total 0000
(100.0)%0 550,000000Live Nation Management Fee5310100459965 0
(100.0) %0 550,000Special Projects Total 0000
(100.0)%0 514000Utilization Chgs from 101 Fund5310100882101 0
(100.0)%0 2,257,932000Utilization Chgs from 390 Fund5310100882390 0
(100.0)%0 85,344000Utilization Chgs from 570 Fund5310100882570 0
(100.0) %0 2,343,790Charges From Others Total 0000
-6,469,4640 000Total Budget Requirements 0
CCReport Name: 2017_Mid_Cycle_Report
Report Description: Budget Book - Department Budget Detail wMD
06/07/2017Date:
Time: 471
Version:
Page:19:21:28

Department / Section: Museum / Riverside Municipal Auditorium581 - 531020
Department Budget Detail
%Chnge16/17 vs 17/182017/182017/18
AmendedAdoptedAdopted2016/17
AmendedActualActual2016/172015/162014/15GL KeyObject Description
(100.0)%0 2,000,000000Professional Services5310200421000 0
(100.0) %0 2,000,000Non-personnel Expenses Total 0000
(100.0)%0 15,000000Municipal Auditorium Improvmnt5310200450112 0
(100.0)%0 147,000000Live Nation Management Fee5310200459965 0
(100.0) %0 162,000Special Projects Total 0000
(100.0)%0 17,647000Utilization Chgs from 390 Fund5310200882390 0
(100.0)%0 129,623000Utilization Chgs from 580 Fund5310200882580 0
(100.0) %0 147,270Charges From Others Total 0000
-2,309,2700 000Total Budget Requirements 0
CCReport Name: 2017_Mid_Cycle_Report
Report Description: Budget Book - Department Budget Detail wMD
06/07/2017Date:
Time: 472
Version:
Page:19:21:28

Department / Section: Museum / The Box581 - 531030
Department Budget Detail
%Chnge16/17 vs 17/182017/182017/18
AmendedAdoptedAdopted2016/17
AmendedActualActual2016/172015/162014/15GL KeyObject Description
(100.0)%0 175,000000Professional Services5310300421000 0
(100.0) %0 175,000Non-personnel Expenses Total 0000
(100.0)%0 739,362000Utilization Chgs from 570 Fund5310300882570 0
(100.0) %0 739,362Charges From Others Total 0000
-914,3620 000Total Budget Requirements 0
CCReport Name: 2017_Mid_Cycle_Report
Report Description: Budget Book - Department Budget Detail wMD
06/07/2017Date:
Time: 473
Version:
Page:19:21:28
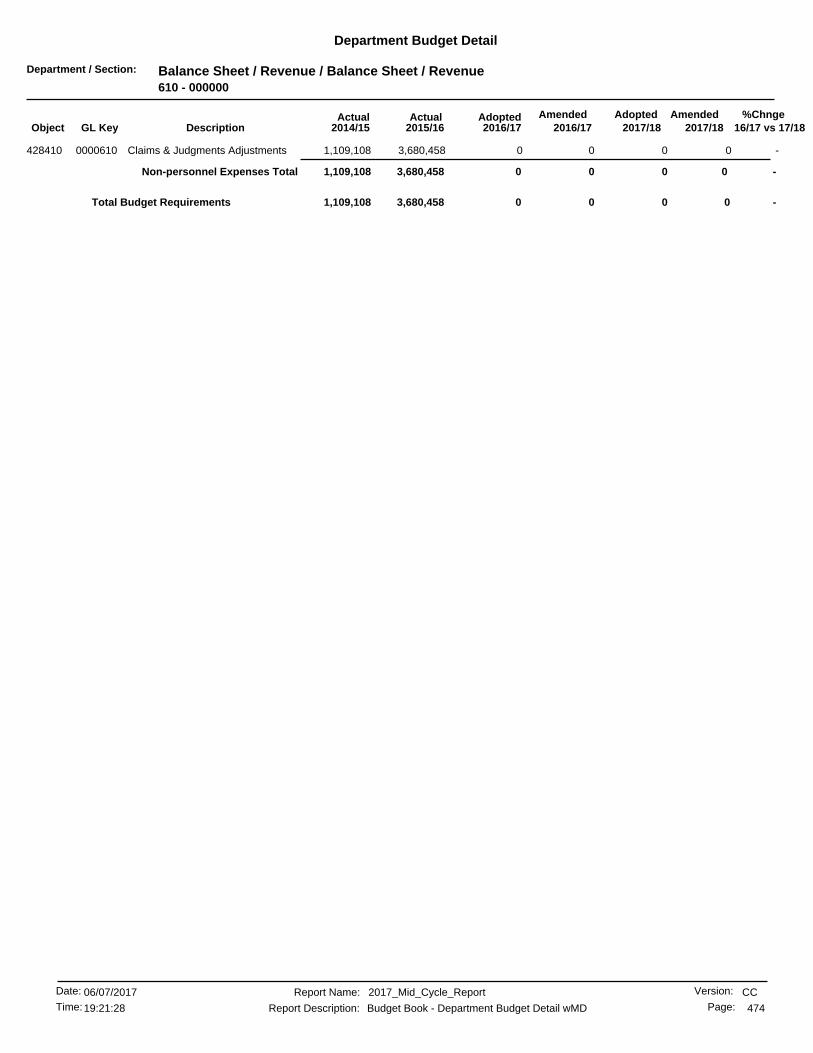
Department / Section: Balance Sheet / Revenue / Balance Sheet / Revenue610 - 000000
Department Budget Detail
%Chnge16/17 vs 17/182017/182017/18
AmendedAdoptedAdopted2016/17
AmendedActualActual2016/172015/162014/15GL KeyObject Description
-0 003,680,4581,109,108Claims & Judgments Adjustments0000610428410 0
-0 0Non-personnel Expenses Total 003,680,4581,109,108
-00 003,680,458Total Budget Requirements 1,109,108
CCReport Name: 2017_Mid_Cycle_Report
Report Description: Budget Book - Department Budget Detail wMD
06/07/2017Date:
Time: 474
Version:
Page:19:21:28
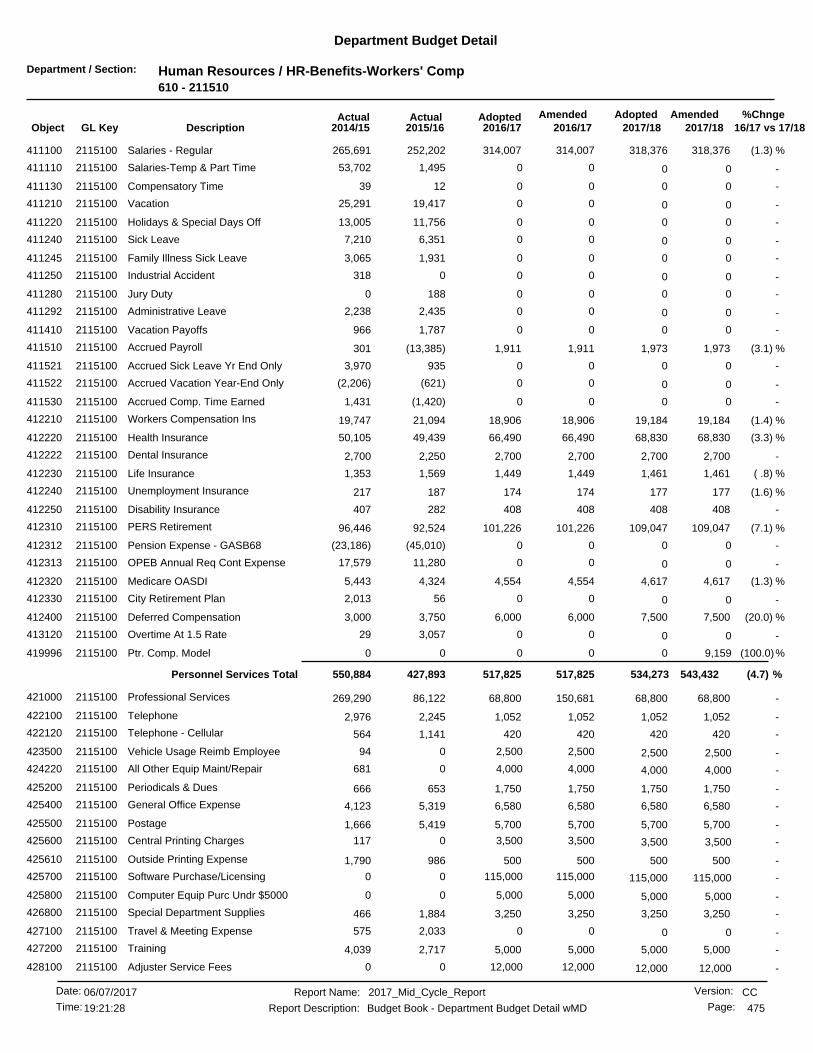
Department / Section: Human Resources / HR-Benefits-Workers' Comp610 - 211510
Department Budget Detail
%Chnge16/17 vs 17/182017/182017/18
AmendedAdoptedAdopted2016/17
AmendedActualActual2016/172015/162014/15GL KeyObject Description
(1.3) %318,376314,007 318,376314,007252,202411100 Salaries - Regular2115100 265,691
-0 001,49553,702Salaries-Temp & Part Time2115100411110 0
-0 001239Compensatory Time2115100411130 0
-0 0019,41725,291Vacation2115100411210 0
-0 0011,75613,005Holidays & Special Days Off2115100411220 0
-0 006,3517,210Sick Leave2115100411240 0
-0 001,9313,065Family Illness Sick Leave2115100411245 0
-0 000318Industrial Accident2115100411250 0
-0 001880Jury Duty2115100411280 0
-0 002,4352,238Administrative Leave2115100411292 0
-0 001,787966Vacation Payoffs2115100411410 0
(3.1) %1,9731,911 1,9731,911(13,385)411510 Accrued Payroll2115100 301
-0 009353,970Accrued Sick Leave Yr End Only2115100411521 0
-0 00(621)(2,206)Accrued Vacation Year-End Only2115100411522 0
-0 00(1,420)1,431Accrued Comp. Time Earned2115100411530 0
(1.4) %19,18418,906 19,18418,90621,094412210 Workers Compensation Ins2115100 19,747
(3.3) %68,83066,490 68,83066,49049,439412220 Health Insurance2115100 50,105
-2,7002,700 2,7002,7002,250412222 Dental Insurance2115100 2,700
( .8) %1,4611,449 1,4611,4491,569412230 Life Insurance2115100 1,353
(1.6) %177174 177174187412240 Unemployment Insurance2115100 217
-408408 408408282412250 Disability Insurance2115100 407
(7.1) %109,047101,226 109,047101,22692,524412310 PERS Retirement2115100 96,446
-0 00(45,010)(23,186)Pension Expense - GASB682115100412312 0
-0 0011,28017,579OPEB Annual Req Cont Expense2115100412313 0
(1.3) %4,6174,554 4,6174,5544,324412320 Medicare OASDI2115100 5,443
-0 00562,013City Retirement Plan2115100412330 0
(20.0) %7,5006,000 7,5006,0003,750412400 Deferred Compensation2115100 3,000
-0 003,05729Overtime At 1.5 Rate2115100413120 0
(100.0)%0 9,159000Ptr. Comp. Model2115100419996 0
(4.7) %543,432517,825517,825 534,273Personnel Services Total 427,893550,884
-68,80068,800 68,800150,68186,122421000 Professional Services2115100 269,290
-1,0521,052 1,0521,0522,245422100 Telephone2115100 2,976
-420420 4204201,141422120 Telephone - Cellular2115100 564
-2,500 2,5002,500094Vehicle Usage Reimb Employee2115100423500 2,500
-4,000 4,0004,0000681All Other Equip Maint/Repair2115100424220 4,000
-1,7501,750 1,7501,750653425200 Periodicals & Dues2115100 666
-6,5806,580 6,5806,5805,319425400 General Office Expense2115100 4,123
-5,7005,700 5,7005,7005,419425500 Postage2115100 1,666
-3,500 3,5003,5000117Central Printing Charges2115100425600 3,500
-500500 500500986425610 Outside Printing Expense2115100 1,790
-115,000 115,000115,00000Software Purchase/Licensing2115100425700 115,000
-5,000 5,0005,00000Computer Equip Purc Undr $50002115100425800 5,000
-3,2503,250 3,2503,2501,884426800 Special Department Supplies2115100 466
-0 002,033575Travel & Meeting Expense2115100427100 0
-5,0005,000 5,0005,0002,717427200 Training2115100 4,039
-12,000 12,00012,00000Adjuster Service Fees2115100428100 12,000
CCReport Name: 2017_Mid_Cycle_Report
Report Description: Budget Book - Department Budget Detail wMD
06/07/2017Date:
Time: 475
Version:
Page:19:21:28
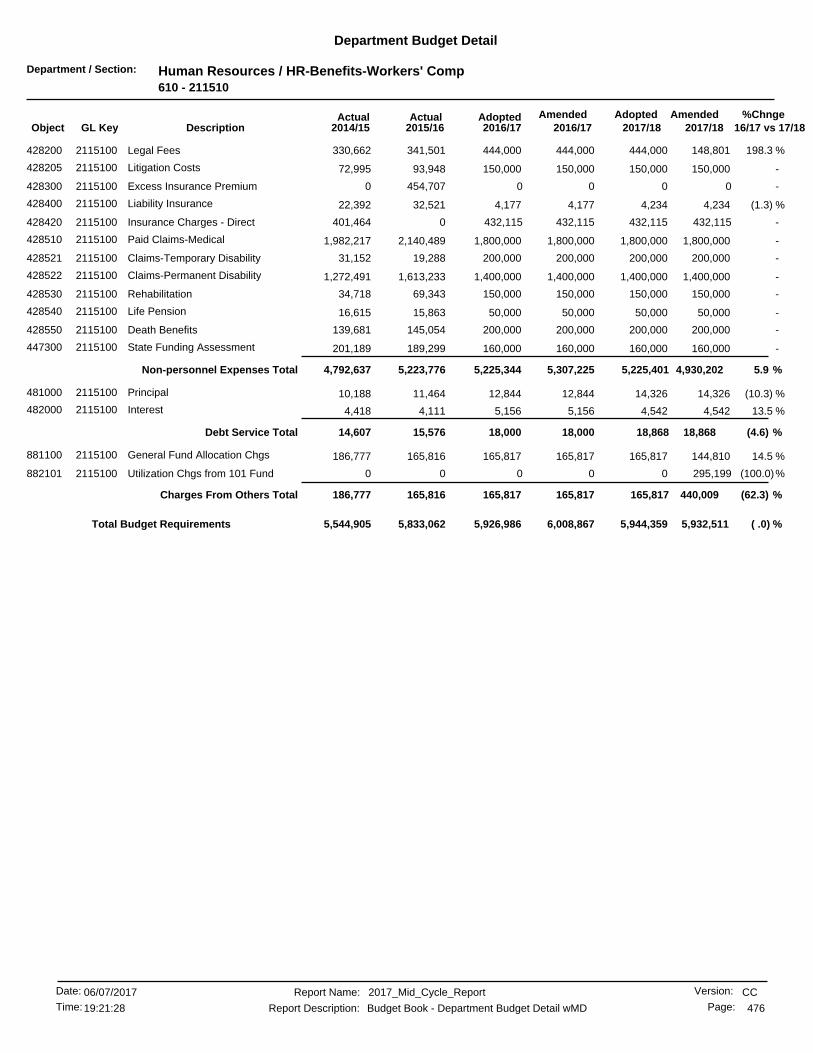
Department / Section: Human Resources / HR-Benefits-Workers' Comp610 - 211510
Department Budget Detail
%Chnge16/17 vs 17/182017/182017/18
AmendedAdoptedAdopted2016/17
AmendedActualActual2016/172015/162014/15GL KeyObject Description
198.3 %148,801444,000 444,000444,000341,501428200 Legal Fees2115100 330,662
-150,000150,000 150,000150,00093,948428205 Litigation Costs2115100 72,995
-0 00454,7070Excess Insurance Premium2115100428300 0
(1.3) %4,2344,177 4,2344,17732,521428400 Liability Insurance2115100 22,392
-432,115 432,115432,1150401,464Insurance Charges - Direct2115100428420 432,115
-1,800,0001,800,000 1,800,0001,800,0002,140,489428510 Paid Claims-Medical2115100 1,982,217
-200,000200,000 200,000200,00019,288428521 Claims-Temporary Disability2115100 31,152
-1,400,0001,400,000 1,400,0001,400,0001,613,233428522 Claims-Permanent Disability2115100 1,272,491
-150,000150,000 150,000150,00069,343428530 Rehabilitation2115100 34,718
-50,00050,000 50,00050,00015,863428540 Life Pension2115100 16,615
-200,000200,000 200,000200,000145,054428550 Death Benefits2115100 139,681
-160,000160,000 160,000160,000189,299447300 State Funding Assessment2115100 201,189
5.9 %4,930,2025,307,2255,225,344 5,225,401Non-personnel Expenses Total 5,223,7764,792,637
(10.3) %14,32612,844 14,32612,84411,464481000 Principal2115100 10,188
13.5 %4,5425,156 4,5425,1564,111482000 Interest2115100 4,418
(4.6) %18,86818,00018,000 18,868Debt Service Total 15,57614,607
14.5 %144,810165,817 165,817165,817165,816881100 General Fund Allocation Chgs2115100 186,777
(100.0)%0 295,199000Utilization Chgs from 101 Fund2115100882101 0
(62.3) %440,009165,817165,817 165,817Charges From Others Total 165,816186,777
( .0) %5,926,986 5,932,5115,944,3596,008,8675,833,0625,544,905Total Budget Requirements
CCReport Name: 2017_Mid_Cycle_Report
Report Description: Budget Book - Department Budget Detail wMD
06/07/2017Date:
Time: 476
Version:
Page:19:21:28

Department / Section: Balance Sheet / Revenue / Balance Sheet / Revenue620 - 000000
Department Budget Detail
%Chnge16/17 vs 17/182017/182017/18
AmendedAdoptedAdopted2016/17
AmendedActualActual2016/172015/162014/15GL KeyObject Description
-0 00(41,943)(34,724)Claims & Judgments Adjustments0000620428410 0
-0 0Non-personnel Expenses Total 00(41,943)(34,724)
-00 00(41,943)Total Budget Requirements (34,724)
CCReport Name: 2017_Mid_Cycle_Report
Report Description: Budget Book - Department Budget Detail wMD
06/07/2017Date:
Time: 477
Version:
Page:19:21:28
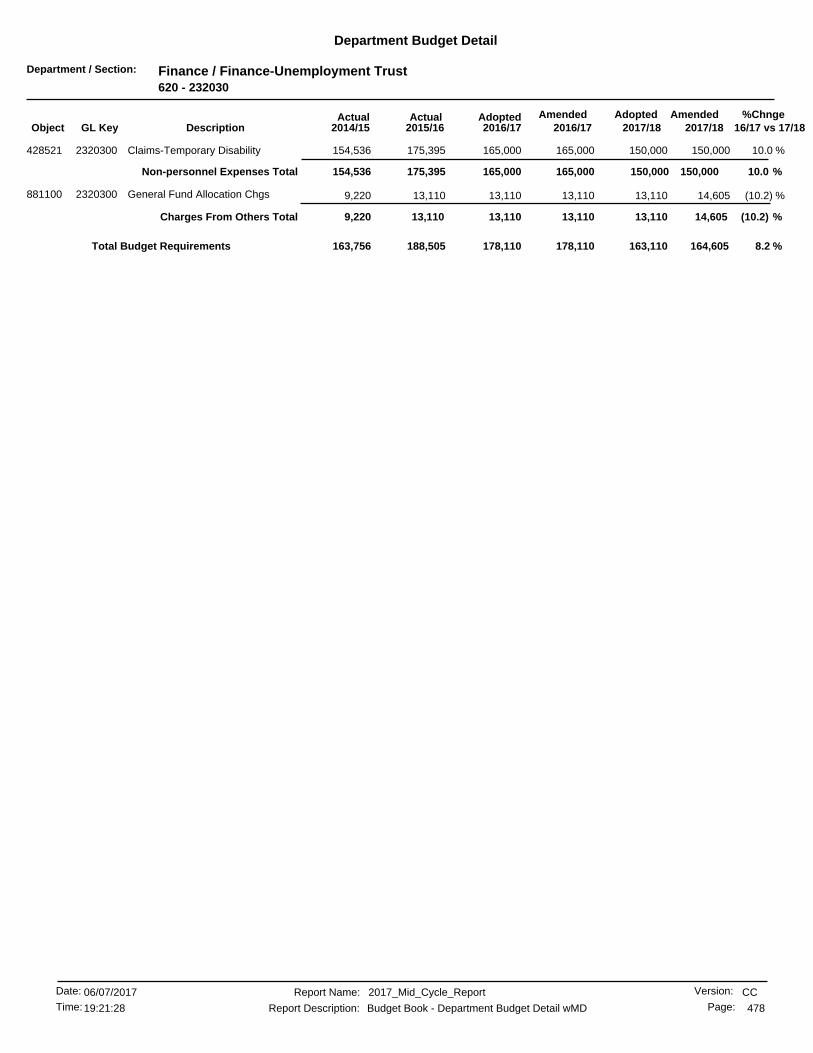
Department / Section: Finance / Finance-Unemployment Trust620 - 232030
Department Budget Detail
%Chnge16/17 vs 17/182017/182017/18
AmendedAdoptedAdopted2016/17
AmendedActualActual2016/172015/162014/15GL KeyObject Description
10.0 %150,000165,000 150,000165,000175,395428521 Claims-Temporary Disability2320300 154,536
10.0 %150,000165,000165,000 150,000Non-personnel Expenses Total 175,395154,536
(10.2) %14,60513,110 13,11013,11013,110881100 General Fund Allocation Chgs2320300 9,220
(10.2) %13,110 14,605Charges From Others Total 13,11013,11013,1109,220
8.2 %178,110 164,605163,110178,110188,505163,756Total Budget Requirements
CCReport Name: 2017_Mid_Cycle_Report
Report Description: Budget Book - Department Budget Detail wMD
06/07/2017Date:
Time: 478
Version:
Page:19:21:28
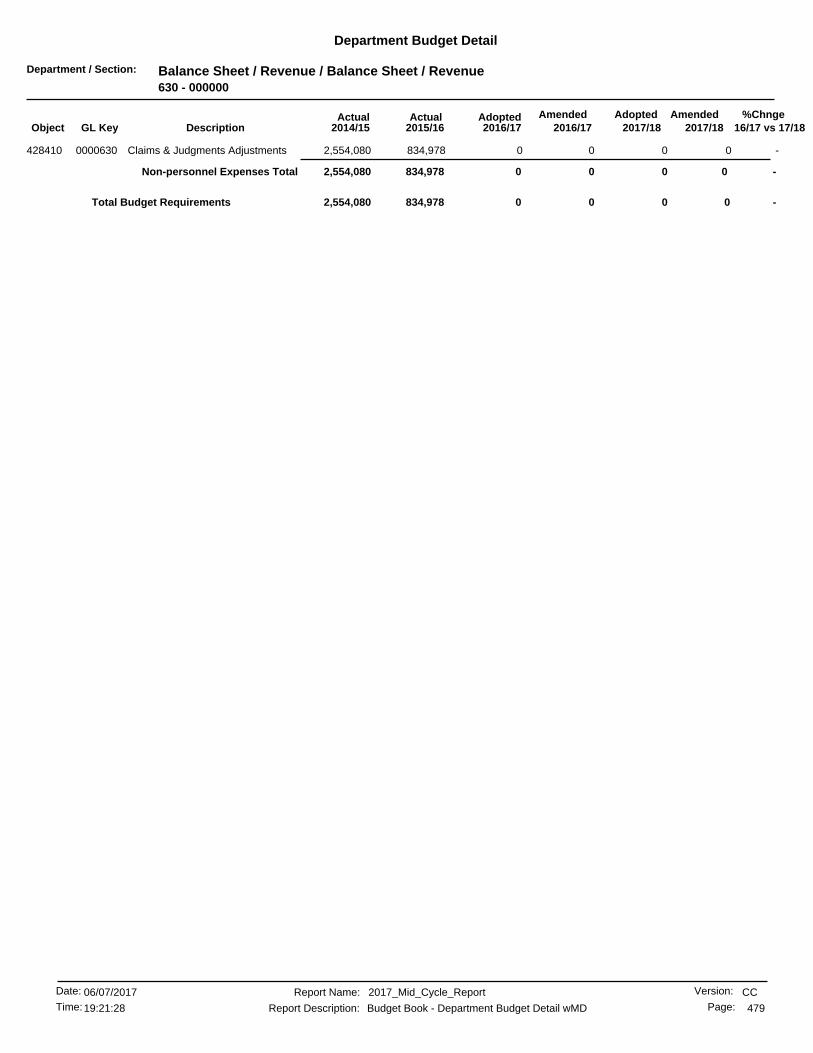
Department / Section: Balance Sheet / Revenue / Balance Sheet / Revenue630 - 000000
Department Budget Detail
%Chnge16/17 vs 17/182017/182017/18
AmendedAdoptedAdopted2016/17
AmendedActualActual2016/172015/162014/15GL KeyObject Description
-0 00834,9782,554,080Claims & Judgments Adjustments0000630428410 0
-0 0Non-personnel Expenses Total 00834,9782,554,080
-00 00834,978Total Budget Requirements 2,554,080
CCReport Name: 2017_Mid_Cycle_Report
Report Description: Budget Book - Department Budget Detail wMD
06/07/2017Date:
Time: 479
Version:
Page:19:21:28
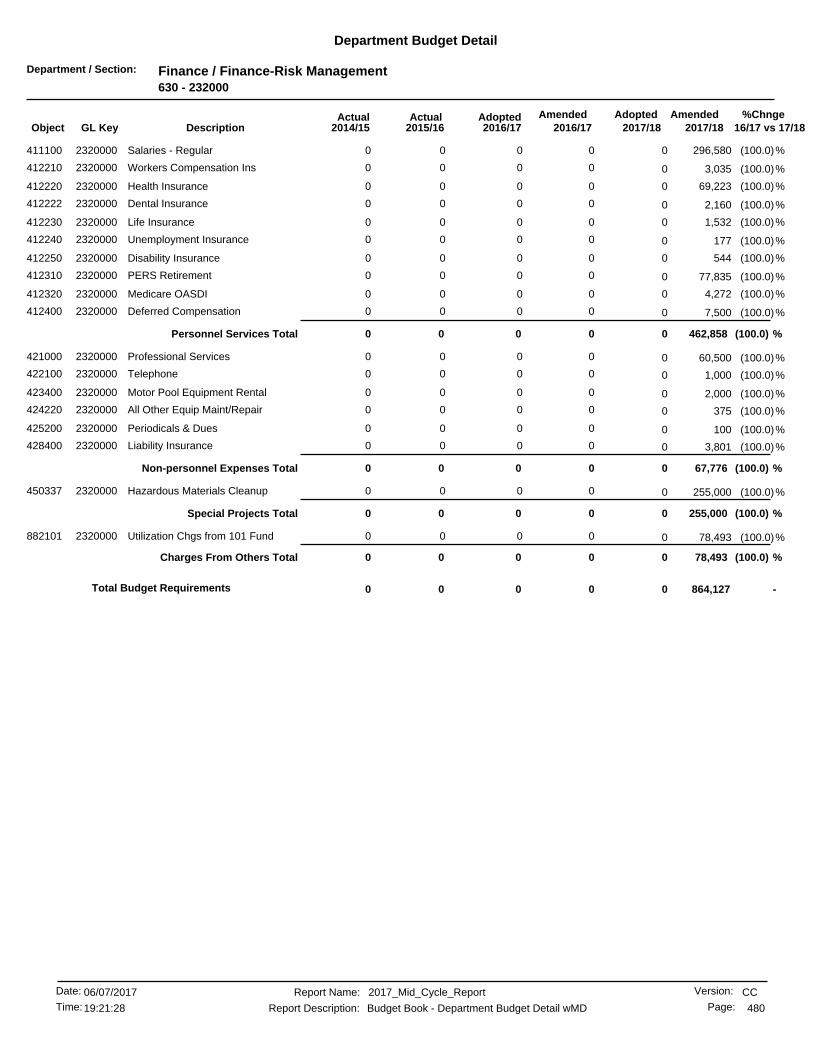
Department / Section: Finance / Finance-Risk Management630 - 232000
Department Budget Detail
%Chnge16/17 vs 17/182017/182017/18
AmendedAdoptedAdopted2016/17
AmendedActualActual2016/172015/162014/15GL KeyObject Description
(100.0)%0 296,580000Salaries - Regular2320000411100 0
(100.0)%0 3,035000Workers Compensation Ins2320000412210 0
(100.0)%0 69,223000Health Insurance2320000412220 0
(100.0)%0 2,160000Dental Insurance2320000412222 0
(100.0)%0 1,532000Life Insurance2320000412230 0
(100.0)%0 177000Unemployment Insurance2320000412240 0
(100.0)%0 544000Disability Insurance2320000412250 0
(100.0)%0 77,835000PERS Retirement2320000412310 0
(100.0)%0 4,272000Medicare OASDI2320000412320 0
(100.0)%0 7,500000Deferred Compensation2320000412400 0
(100.0) %0 462,858Personnel Services Total 0000
(100.0)%0 60,500000Professional Services2320000421000 0
(100.0)%0 1,000000Telephone2320000422100 0
(100.0)%0 2,000000Motor Pool Equipment Rental2320000423400 0
(100.0)%0 375000All Other Equip Maint/Repair2320000424220 0
(100.0)%0 100000Periodicals & Dues2320000425200 0
(100.0)%0 3,801000Liability Insurance2320000428400 0
(100.0) %0 67,776Non-personnel Expenses Total 0000
(100.0)%0 255,000000Hazardous Materials Cleanup2320000450337 0
(100.0) %0 255,000Special Projects Total 0000
(100.0)%0 78,493000Utilization Chgs from 101 Fund2320000882101 0
(100.0) %0 78,493Charges From Others Total 0000
-864,1270 000Total Budget Requirements 0
CCReport Name: 2017_Mid_Cycle_Report
Report Description: Budget Book - Department Budget Detail wMD
06/07/2017Date:
Time: 480
Version:
Page:19:21:28

Department / Section: Finance / Finance-Liability Trust630 - 232020
Department Budget Detail
%Chnge16/17 vs 17/182017/182017/18
AmendedAdoptedAdopted2016/17
AmendedActualActual2016/172015/162014/15GL KeyObject Description
(100.0)%0 296,580000Salaries - Regular2320200411100 0
(100.0)%0 3,035000Workers Compensation Ins2320200412210 0
(100.0)%0 69,223000Health Insurance2320200412220 0
(100.0)%0 2,160000Dental Insurance2320200412222 0
(100.0)%0 1,532000Life Insurance2320200412230 0
(100.0)%0 177000Unemployment Insurance2320200412240 0
(100.0)%0 544000Disability Insurance2320200412250 0
(100.0)%0 77,835000PERS Retirement2320200412310 0
(100.0)%0 4,272000Medicare OASDI2320200412320 0
(100.0)%0 7,500000Deferred Compensation2320200412400 0
(100.0)%0 5,145000Ptr. Comp. Model2320200419996 0
(100.0) %0 468,003Personnel Services Total 0000
-0 00726,4930Prof Services/Internal2320200421001 0
-00 01,573,847253,106421100 Outside Legal Services2320200 0
-0 001825Postage2320200425500 0
(1.9) %204,000200,000 204,000200,000199,283428100 Adjuster Service Fees2320200 179,520
-1,300,0001,300,000 1,300,0001,573,472925,997428200 Legal Fees2320200 1,858,732
-0 009580Excess Insurance Premium2320200428300 0
(100.0)%0 (100,199)000Liability Insurance2320200428400 0
-498,428498,428 498,428498,428444,306428420 Insurance Charges - Direct2320200 439,348
-1,500,0001,500,000 1,500,0001,500,0001,900,118428610 Bodily Injury Claims2320200 725,521
-1,900,0001,900,000 1,900,0001,926,2542,413,908428630 Property Damage Claims2320200 1,637,194
1.8 %5,302,2297,272,0025,398,428 5,402,428Non-personnel Expenses Total 6,864,1894,840,342
-0 0030,62327,022Interest2320200482000 0
-0 0Debt Service Total 0030,62327,022
.7 %241,359243,144 243,144243,144243,144881100 General Fund Allocation Chgs2320200 314,581
27.9 %700,000895,840 895,840895,840195,840882101 Utilization Chgs from 101 Fund2320200 0
20.9 %941,3591,138,9841,138,984 1,138,984Charges From Others Total 438,984314,581
(2.5) %6,537,412 6,711,5916,541,4128,410,9867,333,7965,181,946Total Budget Requirements
CCReport Name: 2017_Mid_Cycle_Report
Report Description: Budget Book - Department Budget Detail wMD
06/07/2017Date:
Time: 481
Version:
Page:19:21:28

Department / Section: Public Utilities-Cent Stores / Public Utilities-Cent Stores640 - 640000
Department Budget Detail
%Chnge16/17 vs 17/182017/182017/18
AmendedAdoptedAdopted2016/17
AmendedActualActual2016/172015/162014/15GL KeyObject Description
(2.1) %417,892409,069 417,892409,069348,331411100 Salaries - Regular6400000 309,083
-0 001,375(1,140)Compensatory Time6400000411130 0
-0 0024,35823,085Vacation6400000411210 0
-0 0016,58715,902Holidays & Special Days Off6400000411220 0
-0 0011,22314,184Sick Leave6400000411240 0
-0 005,26311,332Family Illness Sick Leave6400000411245 0
-0 001,3320Bereavement Leave6400000411260 0
-0 00270769Jury Duty6400000411280 0
-0 00481254Administrative Leave6400000411292 0
-0 00015,582Vacation Payoffs6400000411410 0
-0 00010,516Sick Leave Payoff6400000411420 0
-0 0002,428Compensatory Time Payoff6400000411430 0
(3.8) %2,4502,356 2,4502,356(16,074)411510 Accrued Payroll6400000 (222)
-0 003,714(14,085)Accrued Sick Leave Yr End Only6400000411521 0
-0 003,351(9,817)Accrued Vacation Year-End Only6400000411522 0
-0 00(596)(1,461)Accrued Comp. Time Earned6400000411530 0
(2.2) %8,5608,370 8,5608,3708,224412210 Workers Compensation Ins6400000 8,872
(5.7) %77,83073,384 77,83073,38467,354412220 Health Insurance6400000 54,280
( .9) %4,2164,177 4,2164,1774,165412222 Dental Insurance6400000 3,380
-604604 604604623412230 Life Insurance6400000 553
(1.7) %235231 235231228412240 Unemployment Insurance6400000 297
-952952 952952957412250 Disability Insurance6400000 805
(8.2) %129,080118,484 129,080118,484100,471412310 PERS Retirement6400000 93,043
-0 00(54,790)(28,224)Pension Expense - GASB686400000412312 0
-0 0015,36719,044OPEB Annual Req Cont Expense6400000412313 0
(2.5) %5,0724,944 5,0724,9445,438412320 Medicare OASDI6400000 4,383
(20.0) %1,5001,200 1,5001,200937412400 Deferred Compensation6400000 600
-14,28014,280 14,28014,28017,476413110 Overtime At Straight Rate6400000 16,278
-3,6003,600 3,6003,6008,290413120 Overtime At 1.5 Rate6400000 5,369
-1,6001,600 1,6001,6001,333413130 Overtime At Double Time Rate6400000 1,110
-0 00071Holiday O/T-Straight/Non-Sched6400000413210 0
-0 003310Holiday O/T-1.5 Rate/Non-Sched6400000413220 0
-0 00747722Holiday O/T-Strt/Subj To Retir6400000413230 0
(100.0)%0 20,158000Ptr. Comp. Model6400000419996 0
(6.5) %688,029643,251643,251 667,871Personnel Services Total 576,778557,001
-283283 283283416422100 Telephone6400000 350
-1,200 1,2001,2000482Telephone - Cellular6400000422120 1,200
-200 20020000Other Utilities6400000422600 200
-3,4973,497 3,4973,4971,636422700 Refuse/Disposal Fees6400000 1,883
-200 20020000Freight/Express & Cartage6400000423300 200
(2.9) %7,2437,032 7,2437,0328,564423400 Motor Pool Equipment Rental6400000 7,145
-4,1864,186 4,1864,1869,552424130 Maint/Repair of Bldgs & Improv6400000 1,780
-10,46310,463 10,46315,16013,704424220 All Other Equip Maint/Repair6400000 7,543
-7,0007,000 7,0002,5006,730424230 Central Garage Charges6400000 2,742
-100 10010000Central Communications Chg6400000424240 100
-3,3003,300 3,3003,3003,892425400 General Office Expense6400000 3,850
CCReport Name: 2017_Mid_Cycle_Report
Report Description: Budget Book - Department Budget Detail wMD
06/07/2017Date:
Time: 482
Version:
Page:19:21:28

Department / Section: Public Utilities-Cent Stores / Public Utilities-Cent Stores640 - 640000
Department Budget Detail
%Chnge16/17 vs 17/182017/182017/18
AmendedAdoptedAdopted2016/17
AmendedActualActual2016/172015/162014/15GL KeyObject Description
-200 20020000Postage6400000425500 200
-330 3303300106Central Printing Charges6400000425600 330
-0 00290Outside Printing Expense6400000425610 0
-270 27027000Software Purchase/Licensing6400000425700 270
-1,5001,500 1,5001,5001,499425800 Computer Equip Purc Undr $50006400000 323
-300300 300300475426100 Janitorial Supplies6400000 542
-3,7013,701 3,7013,7013,618426200 Clothing/Linen/Safety Supplies6400000 3,732
-1,5001,500 1,5001,500953426300 Motor Fuels & Lubricants6400000 797
-1,3201,320 1,3201,3201,246426700 Maintenance Tools/Supplies6400000 80
-1,0501,050 1,0501,0501,050426710 Work Boot Reimbursement6400000 1,050
-9,3939,393 9,3939,3938,003426800 Special Department Supplies6400000 4,152
-0 0015425Training6400000427200 0
(2.0) %6,6016,463 6,6016,4635,671428400 Liability Insurance6400000 7,095
( .5) %63,83763,68563,488 63,837Non-personnel Expenses Total 67,20243,686
(10.3) %15,02213,468 15,02213,46812,021481000 Principal6400000 10,683
13.5 %4,7625,406 4,7625,4064,311482000 Interest6400000 20,022
(4.5) %19,78418,87418,874 19,784Debt Service Total 16,33330,706
(10.0) %371,581334,197 334,197334,197334,197881100 General Fund Allocation Chgs6400000 322,842
(10.0) %334,197 371,581Charges From Others Total 334,197334,197334,197322,842
-0 00(515)(980)Interfund Services to 510 Fund6400000894510 0
-0 0Charges to Others Total 00(515)(980)
(7.2) %1,059,810 1,143,2311,085,6891,060,007993,995953,256Total Budget Requirements
CCReport Name: 2017_Mid_Cycle_Report
Report Description: Budget Book - Department Budget Detail wMD
06/07/2017Date:
Time: 483
Version:
Page:19:21:28
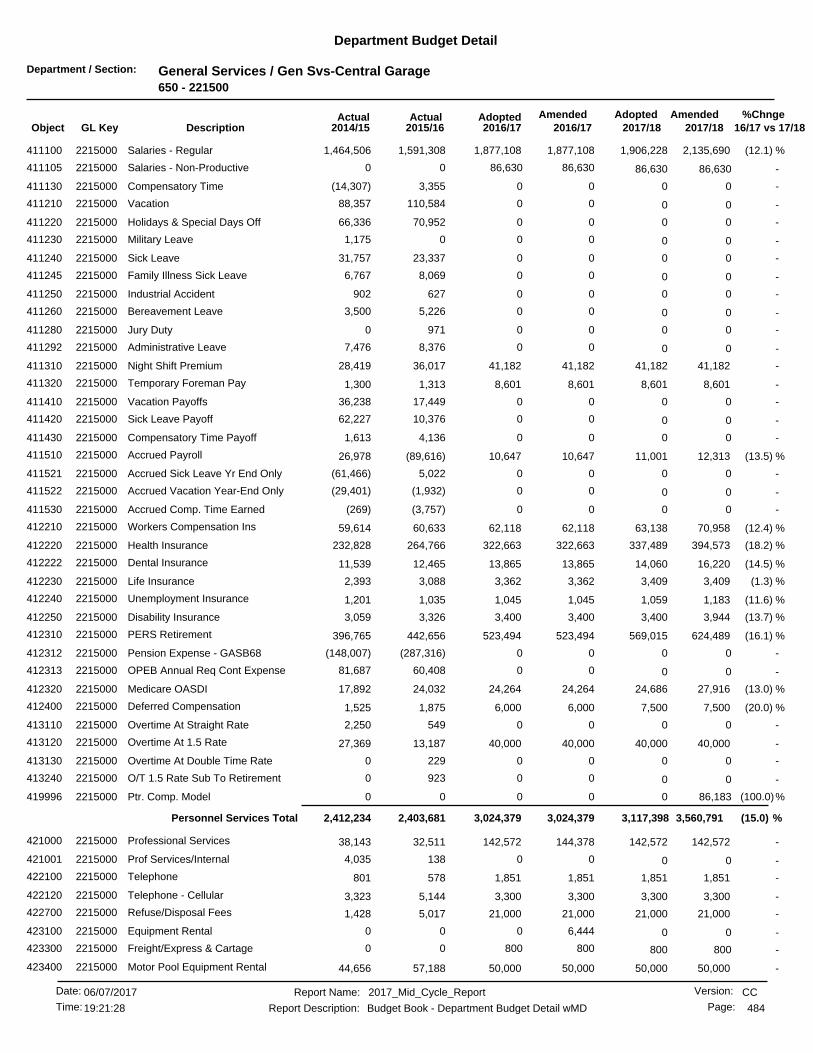
Department / Section: General Services / Gen Svs-Central Garage650 - 221500
Department Budget Detail
%Chnge16/17 vs 17/182017/182017/18
AmendedAdoptedAdopted2016/17
AmendedActualActual2016/172015/162014/15GL KeyObject Description
(12.1) %2,135,6901,877,108 1,906,2281,877,1081,591,308411100 Salaries - Regular2215000 1,464,506
-86,630 86,63086,63000Salaries - Non-Productive2215000411105 86,630
-0 003,355(14,307)Compensatory Time2215000411130 0
-0 00110,58488,357Vacation2215000411210 0
-0 0070,95266,336Holidays & Special Days Off2215000411220 0
-0 0001,175Military Leave2215000411230 0
-0 0023,33731,757Sick Leave2215000411240 0
-0 008,0696,767Family Illness Sick Leave2215000411245 0
-0 00627902Industrial Accident2215000411250 0
-0 005,2263,500Bereavement Leave2215000411260 0
-0 009710Jury Duty2215000411280 0
-0 008,3767,476Administrative Leave2215000411292 0
-41,18241,182 41,18241,18236,017411310 Night Shift Premium2215000 28,419
-8,6018,601 8,6018,6011,313411320 Temporary Foreman Pay2215000 1,300
-0 0017,44936,238Vacation Payoffs2215000411410 0
-0 0010,37662,227Sick Leave Payoff2215000411420 0
-0 004,1361,613Compensatory Time Payoff2215000411430 0
(13.5) %12,31310,647 11,00110,647(89,616)411510 Accrued Payroll2215000 26,978
-0 005,022(61,466)Accrued Sick Leave Yr End Only2215000411521 0
-0 00(1,932)(29,401)Accrued Vacation Year-End Only2215000411522 0
-0 00(3,757)(269)Accrued Comp. Time Earned2215000411530 0
(12.4) %70,95862,118 63,13862,11860,633412210 Workers Compensation Ins2215000 59,614
(18.2) %394,573322,663 337,489322,663264,766412220 Health Insurance2215000 232,828
(14.5) %16,22013,865 14,06013,86512,465412222 Dental Insurance2215000 11,539
(1.3) %3,4093,362 3,4093,3623,088412230 Life Insurance2215000 2,393
(11.6) %1,1831,045 1,0591,0451,035412240 Unemployment Insurance2215000 1,201
(13.7) %3,9443,400 3,4003,4003,326412250 Disability Insurance2215000 3,059
(16.1) %624,489523,494 569,015523,494442,656412310 PERS Retirement2215000 396,765
-0 00(287,316)(148,007)Pension Expense - GASB682215000412312 0
-0 0060,40881,687OPEB Annual Req Cont Expense2215000412313 0
(13.0) %27,91624,264 24,68624,26424,032412320 Medicare OASDI2215000 17,892
(20.0) %7,5006,000 7,5006,0001,875412400 Deferred Compensation2215000 1,525
-0 005492,250Overtime At Straight Rate2215000413110 0
-40,00040,000 40,00040,00013,187413120 Overtime At 1.5 Rate2215000 27,369
-0 002290Overtime At Double Time Rate2215000413130 0
-0 009230O/T 1.5 Rate Sub To Retirement2215000413240 0
(100.0)%0 86,183000Ptr. Comp. Model2215000419996 0
(15.0) %3,560,7913,024,3793,024,379 3,117,398Personnel Services Total 2,403,6812,412,234
-142,572142,572 142,572144,37832,511421000 Professional Services2215000 38,143
-0 001384,035Prof Services/Internal2215000421001 0
-1,8511,851 1,8511,851578422100 Telephone2215000 801
-3,3003,300 3,3003,3005,144422120 Telephone - Cellular2215000 3,323
-21,00021,000 21,00021,0005,017422700 Refuse/Disposal Fees2215000 1,428
-0 06,44400Equipment Rental2215000423100 0
-800 80080000Freight/Express & Cartage2215000423300 800
-50,00050,000 50,00050,00057,188423400 Motor Pool Equipment Rental2215000 44,656
CCReport Name: 2017_Mid_Cycle_Report
Report Description: Budget Book - Department Budget Detail wMD
06/07/2017Date:
Time: 484
Version:
Page:19:21:28
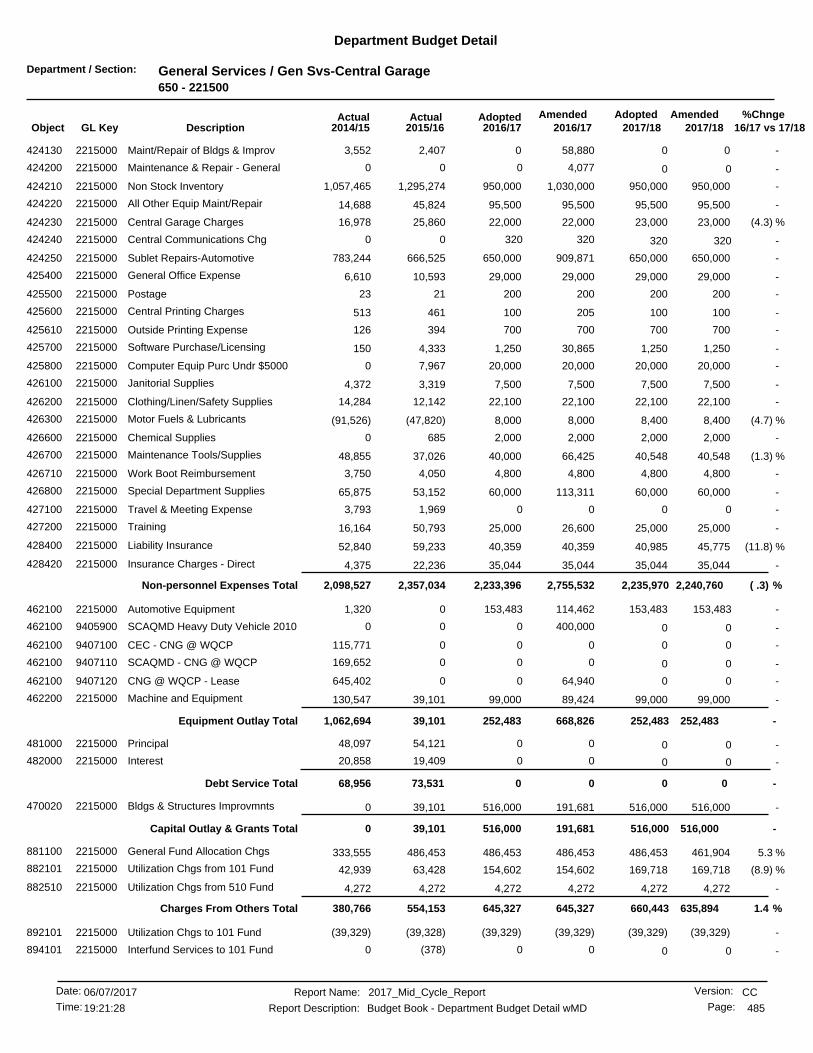
Department / Section: General Services / Gen Svs-Central Garage650 - 221500
Department Budget Detail
%Chnge16/17 vs 17/182017/182017/18
AmendedAdoptedAdopted2016/17
AmendedActualActual2016/172015/162014/15GL KeyObject Description
-00 058,8802,407424130 Maint/Repair of Bldgs & Improv2215000 3,552
-0 04,07700Maintenance & Repair - General2215000424200 0
-950,000950,000 950,0001,030,0001,295,274424210 Non Stock Inventory2215000 1,057,465
-95,50095,500 95,50095,50045,824424220 All Other Equip Maint/Repair2215000 14,688
(4.3) %23,00022,000 23,00022,00025,860424230 Central Garage Charges2215000 16,978
-320 32032000Central Communications Chg2215000424240 320
-650,000650,000 650,000909,871666,525424250 Sublet Repairs-Automotive2215000 783,244
-29,00029,000 29,00029,00010,593425400 General Office Expense2215000 6,610
-200200 20020021425500 Postage2215000 23
-100100 100205461425600 Central Printing Charges2215000 513
-700700 700700394425610 Outside Printing Expense2215000 126
-1,2501,250 1,25030,8654,333425700 Software Purchase/Licensing2215000 150
-20,00020,000 20,00020,0007,967425800 Computer Equip Purc Undr $50002215000 0
-7,5007,500 7,5007,5003,319426100 Janitorial Supplies2215000 4,372
-22,10022,100 22,10022,10012,142426200 Clothing/Linen/Safety Supplies2215000 14,284
(4.7) %8,4008,000 8,4008,000(47,820)426300 Motor Fuels & Lubricants2215000 (91,526)
-2,0002,000 2,0002,000685426600 Chemical Supplies2215000 0
(1.3) %40,54840,000 40,54866,42537,026426700 Maintenance Tools/Supplies2215000 48,855
-4,8004,800 4,8004,8004,050426710 Work Boot Reimbursement2215000 3,750
-60,00060,000 60,000113,31153,152426800 Special Department Supplies2215000 65,875
-0 001,9693,793Travel & Meeting Expense2215000427100 0
-25,00025,000 25,00026,60050,793427200 Training2215000 16,164
(11.8) %45,77540,359 40,98540,35959,233428400 Liability Insurance2215000 52,840
-35,04435,044 35,04435,04422,236428420 Insurance Charges - Direct2215000 4,375
( .3) %2,240,7602,755,5322,233,396 2,235,970Non-personnel Expenses Total 2,357,0342,098,527
-153,483 153,483114,46201,320Automotive Equipment2215000462100 153,483
-0 0400,00000SCAQMD Heavy Duty Vehicle 20109405900462100 0
-0 000115,771CEC - CNG @ WQCP9407100462100 0
-0 000169,652SCAQMD - CNG @ WQCP9407110462100 0
-0 064,9400645,402CNG @ WQCP - Lease9407120462100 0
-99,00099,000 99,00089,42439,101462200 Machine and Equipment2215000 130,547
-252,483668,826252,483 252,483Equipment Outlay Total 39,1011,062,694
-0 0054,12148,097Principal2215000481000 0
-0 0019,40920,858Interest2215000482000 0
-0 0Debt Service Total 0073,53168,956
-516,000516,000 516,000191,68139,101470020 Bldgs & Structures Improvmnts2215000 0
-516,000191,681516,000 516,000Capital Outlay & Grants Total 39,1010
5.3 %461,904486,453 486,453486,453486,453881100 General Fund Allocation Chgs2215000 333,555
(8.9) %169,718154,602 169,718154,60263,428882101 Utilization Chgs from 101 Fund2215000 42,939
-4,2724,272 4,2724,2724,272882510 Utilization Chgs from 510 Fund2215000 4,272
1.4 %635,894645,327645,327 660,443Charges From Others Total 554,153380,766
-(39,329)(39,329) (39,329)(39,329)(39,328)892101 Utilization Chgs to 101 Fund2215000 (39,329)
-0 00(378)0Interfund Services to 101 Fund2215000894101 0
CCReport Name: 2017_Mid_Cycle_Report
Report Description: Budget Book - Department Budget Detail wMD
06/07/2017Date:
Time: 485
Version:
Page:19:21:28

Department / Section: General Services / Gen Svs-Central Garage650 - 221500
Department Budget Detail
%Chnge16/17 vs 17/182017/182017/18
AmendedAdoptedAdopted2016/17
AmendedActualActual2016/172015/162014/15GL KeyObject Description
-(39,329)(39,329)(39,329) (39,329)Charges to Others Total (39,707)(39,329)
(7.4) %6,632,256 7,166,5996,742,9657,246,4185,426,8965,983,848Total Budget Requirements
CCReport Name: 2017_Mid_Cycle_Report
Report Description: Budget Book - Department Budget Detail wMD
06/07/2017Date:
Time: 486
Version:
Page:19:21:28
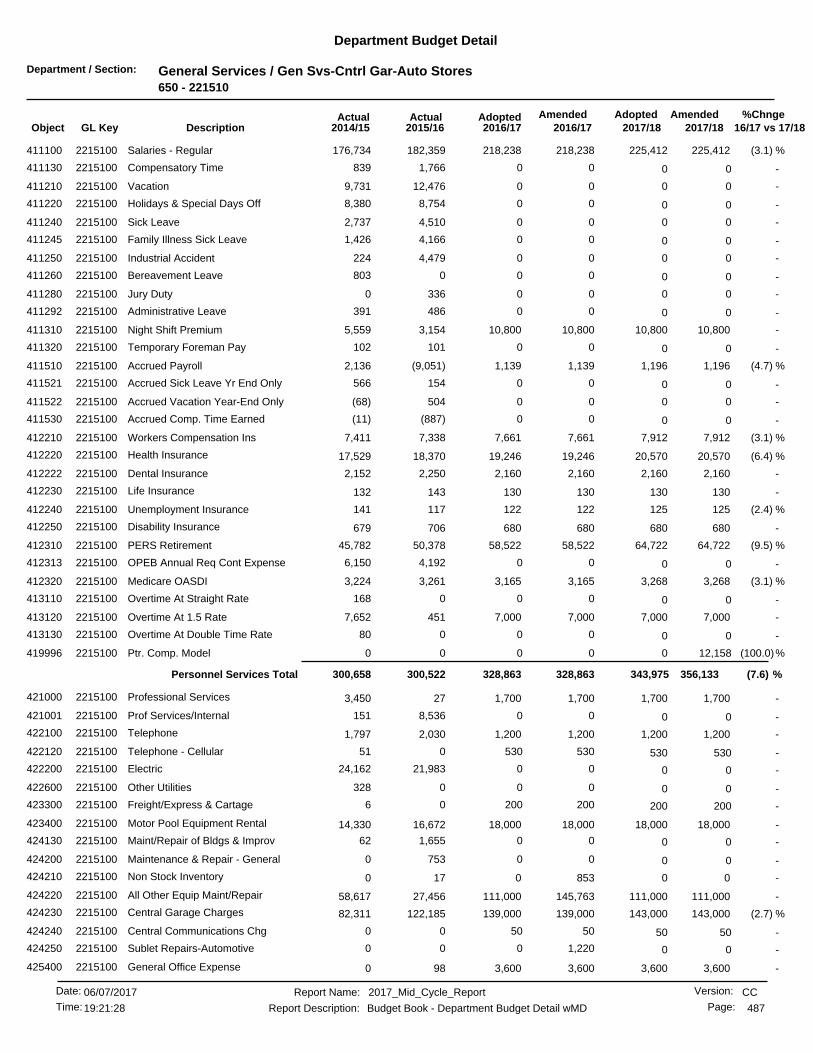
Department / Section: General Services / Gen Svs-Cntrl Gar-Auto Stores650 - 221510
Department Budget Detail
%Chnge16/17 vs 17/182017/182017/18
AmendedAdoptedAdopted2016/17
AmendedActualActual2016/172015/162014/15GL KeyObject Description
(3.1) %225,412218,238 225,412218,238182,359411100 Salaries - Regular2215100 176,734
-0 001,766839Compensatory Time2215100411130 0
-0 0012,4769,731Vacation2215100411210 0
-0 008,7548,380Holidays & Special Days Off2215100411220 0
-0 004,5102,737Sick Leave2215100411240 0
-0 004,1661,426Family Illness Sick Leave2215100411245 0
-0 004,479224Industrial Accident2215100411250 0
-0 000803Bereavement Leave2215100411260 0
-0 003360Jury Duty2215100411280 0
-0 00486391Administrative Leave2215100411292 0
-10,80010,800 10,80010,8003,154411310 Night Shift Premium2215100 5,559
-0 00101102Temporary Foreman Pay2215100411320 0
(4.7) %1,1961,139 1,1961,139(9,051)411510 Accrued Payroll2215100 2,136
-0 00154566Accrued Sick Leave Yr End Only2215100411521 0
-0 00504(68)Accrued Vacation Year-End Only2215100411522 0
-0 00(887)(11)Accrued Comp. Time Earned2215100411530 0
(3.1) %7,9127,661 7,9127,6617,338412210 Workers Compensation Ins2215100 7,411
(6.4) %20,57019,246 20,57019,24618,370412220 Health Insurance2215100 17,529
-2,1602,160 2,1602,1602,250412222 Dental Insurance2215100 2,152
-130130 130130143412230 Life Insurance2215100 132
(2.4) %125122 125122117412240 Unemployment Insurance2215100 141
-680680 680680706412250 Disability Insurance2215100 679
(9.5) %64,72258,522 64,72258,52250,378412310 PERS Retirement2215100 45,782
-0 004,1926,150OPEB Annual Req Cont Expense2215100412313 0
(3.1) %3,2683,165 3,2683,1653,261412320 Medicare OASDI2215100 3,224
-0 000168Overtime At Straight Rate2215100413110 0
-7,0007,000 7,0007,000451413120 Overtime At 1.5 Rate2215100 7,652
-0 00080Overtime At Double Time Rate2215100413130 0
(100.0)%0 12,158000Ptr. Comp. Model2215100419996 0
(7.6) %356,133328,863328,863 343,975Personnel Services Total 300,522300,658
-1,7001,700 1,7001,70027421000 Professional Services2215100 3,450
-0 008,536151Prof Services/Internal2215100421001 0
-1,2001,200 1,2001,2002,030422100 Telephone2215100 1,797
-530 530530051Telephone - Cellular2215100422120 530
-0 0021,98324,162Electric2215100422200 0
-0 000328Other Utilities2215100422600 0
-200 20020006Freight/Express & Cartage2215100423300 200
-18,00018,000 18,00018,00016,672423400 Motor Pool Equipment Rental2215100 14,330
-0 001,65562Maint/Repair of Bldgs & Improv2215100424130 0
-0 007530Maintenance & Repair - General2215100424200 0
-00 085317424210 Non Stock Inventory2215100 0
-111,000111,000 111,000145,76327,456424220 All Other Equip Maint/Repair2215100 58,617
(2.7) %143,000139,000 143,000139,000122,185424230 Central Garage Charges2215100 82,311
-50 505000Central Communications Chg2215100424240 50
-0 01,22000Sublet Repairs-Automotive2215100424250 0
-3,6003,600 3,6003,60098425400 General Office Expense2215100 0
CCReport Name: 2017_Mid_Cycle_Report
Report Description: Budget Book - Department Budget Detail wMD
06/07/2017Date:
Time: 487
Version:
Page:19:21:28

Department / Section: General Services / Gen Svs-Cntrl Gar-Auto Stores650 - 221510
Department Budget Detail
%Chnge16/17 vs 17/182017/182017/18
AmendedAdoptedAdopted2016/17
AmendedActualActual2016/172015/162014/15GL KeyObject Description
-100100 10010012425500 Postage2215100 0
-1,000 1,0001,0000196Central Printing Charges2215100425600 1,000
-200 20020000Software Purchase/Licensing2215100425700 200
-3,0003,000 3,0003,0002,232425800 Computer Equip Purc Undr $50002215100 0
-800800 8002,946799426100 Janitorial Supplies2215100 1,739
-5,2505,250 5,2505,250704426200 Clothing/Linen/Safety Supplies2215100 808
-500500 50050026426300 Motor Fuels & Lubricants2215100 3,362
-300 30030001,859Maintenance Tools/Supplies2215100426700 300
-750750 750750600426710 Work Boot Reimbursement2215100 600
-20,00020,000 20,00020,45450,338426800 Special Department Supplies2215100 7,050
-7,000 7,0007,00000Training2215100427200 7,000
(3.1) %4,8474,693 4,8474,6937,675428400 Liability Insurance2215100 7,129
-0 0083,57466,650Misc Expenses Unclassified2215100447000 0
(1.2) %323,027358,311318,873 323,027Non-personnel Expenses Total 347,382274,668
-050,000 051,651117,355462100 Automotive Equipment2215100 466,277
-0 000152,871CNG @ WQCP - Lease9407130462100 0
-7,0007,000 7,0007,0003,310462200 Machine and Equipment2215100 0
714.2 %7,00058,65157,000 7,000Equipment Outlay Total 120,665619,149
(2.1) %409,206400,496 409,206400,496337,187481000 Principal2215100 335,559
-0 0012,81214,440Interest2215100482000 0
(2.1) %409,206400,496400,496 409,206Debt Service Total 350,000350,000
-0 0240,00000Ethanol (E85) Project9859800440301 0
-0 02,44100Bldgs & Structures Improvmnts2215100470020 0
-0 0Capital Outlay & Grants Total 0242,44100
-0 00(34)0Interfund Services to 650 Fund2215100894650 0
-0 0Charges to Others Total 00(34)0
.9 %1,105,232 1,095,3661,083,2081,388,7631,118,5351,544,476Total Budget Requirements
CCReport Name: 2017_Mid_Cycle_Report
Report Description: Budget Book - Department Budget Detail wMD
06/07/2017Date:
Time: 488
Version:
Page:19:21:28

Department / Section: General Services / Gen Svs-Cntrl Gar-Motor Pool650 - 221520
Department Budget Detail
%Chnge16/17 vs 17/182017/182017/18
AmendedAdoptedAdopted2016/17
AmendedActualActual2016/172015/162014/15GL KeyObject Description
(1.7) %91,09289,476 91,09289,47673,909411100 Salaries - Regular2215200 65,066
-0 00062Compensatory Time2215200411130 0
-0 004,1393,034Vacation2215200411210 0
-0 003,4382,223Holidays & Special Days Off2215200411220 0
-0 002,161515Sick Leave2215200411240 0
-0 00650155Family Illness Sick Leave2215200411245 0
-0 001150Jury Duty2215200411280 0
-0 0024147Administrative Leave2215200411292 0
(3.3) %533515 533515(3,679)411510 Accrued Payroll2215200 1,889
-0 00(48)447Accrued Sick Leave Yr End Only2215200411521 0
-0 001,0601,187Accrued Vacation Year-End Only2215200411522 0
-0 006921Accrued Comp. Time Earned2215200411530 0
(1.7) %3,1973,140 3,1973,1402,866412210 Workers Compensation Ins2215200 3,493
(6.1) %18,54517,403 18,54517,40316,484412220 Health Insurance2215200 10,441
(4.0) %976937 976937948412222 Dental Insurance2215200 495
-5252 525257412230 Life Insurance2215200 33
(1.9) %5150 515045412240 Unemployment Insurance2215200 66
-272272 272272282412250 Disability Insurance2215200 177
(8.0) %26,48224,338 26,48224,33819,281412310 PERS Retirement2215200 13,771
-0 003,7623,664OPEB Annual Req Cont Expense2215200412313 0
(1.7) %1,3211,298 1,3211,2981,252412320 Medicare OASDI2215200 872
-0 003140Overtime At 1.5 Rate2215200413120 0
(100.0)%0 5,063000Ptr. Comp. Model2215200419996 0
(6.8) %147,584137,481137,481 142,521Personnel Services Total 127,353107,668
-0 003,55410,530Prof Services/Internal2215200421001 0
-1,5001,500 1,5001,500(4,983)423400 Motor Pool Equipment Rental2215200 0
-0 00520Non Stock Inventory2215200424210 0
-2,090,0002,090,000 2,090,0002,090,0002,022,243424230 Central Garage Charges2215200 1,786,496
-2,000 2,0002,00000Computer Equip Purc Undr $50002215200425800 2,000
-1,300,0001,300,000 1,300,0001,300,0001,055,688426300 Motor Fuels & Lubricants2215200 1,211,497
-0 00411,098Special Department Supplies2215200426800 0
(1.7) %1,9591,924 1,9591,9242,998428400 Liability Insurance2215200 3,360
( .0) %3,395,4593,395,4243,395,424 3,395,459Non-personnel Expenses Total 3,079,5943,012,984
12.3 %1,406,0991,579,794 1,406,0995,329,51098,895462100 Automotive Equipment2215200 492,037
-0 027,22300SCAQMD Heavy Duty Vehicle 20109405910462100 0
-00 0241,96517,610462100 Epoxy Flooring System9894500 0
-00 0242,5007,500462100 New Central Garage HVAC System9894600 0
12.3 %1,406,0995,841,1991,579,794 1,406,099Equipment Outlay Total 124,005492,037
-0 027,22300SCAQMD Heavy Duty Vehicle 20109405920440301 0
-0 0Capital Outlay & Grants Total 027,22300
-0 0021,26719,398Utilization Chgs from 101 Fund2215200882101 0
-0 0Charges From Others Total 0021,26719,398
3.3 %5,112,699 4,949,1424,944,0799,401,3273,352,2193,632,089Total Budget Requirements
CCReport Name: 2017_Mid_Cycle_Report
Report Description: Budget Book - Department Budget Detail wMD
06/07/2017Date:
Time: 489
Version:
Page:19:21:28

Department / Section: Finance / Finance-Asmt District Misc741 - 239021
Department Budget Detail
%Chnge16/17 vs 17/182017/182017/18
AmendedAdoptedAdopted2016/17
AmendedActualActual2016/172015/162014/15GL KeyObject Description
-0 0003,668Professional Services2390210421000 0
.6 %7,4507,500 7,4507,5006,869447010 Annual Bond Expense2390210 1,430
.6 %7,4507,5007,500 7,450Non-personnel Expenses Total 6,8695,098
(3.3) %295,000285,000 295,000285,000280,000481000 Principal2390210 275,000
8.8 %108,856118,472 108,856118,472127,125482000 Interest2390210 134,762
( .0) %403,856403,472403,472 403,856Debt Service Total 407,125409,762
(5.2) %7,2096,830 6,8306,8306,829881100 General Fund Allocation Chgs2390210 9,420
(5.2) %7,2096,8306,830 6,830Charges From Others Total 6,8299,420
( .1) %417,802 418,515418,136417,802420,824424,282Total Budget Requirements
CCReport Name: 2017_Mid_Cycle_Report
Report Description: Budget Book - Department Budget Detail wMD
06/07/2017Date:
Time: 490
Version:
Page:19:21:28

Department / Section: Finance / Finance-Hunter Park Asmt Dist742 - 239027
Department Budget Detail
%Chnge16/17 vs 17/182017/182017/18
AmendedAdoptedAdopted2016/17
AmendedActualActual2016/172015/162014/15GL KeyObject Description
-15,00015,000 15,00015,00011,674447010 Annual Bond Expense2390270 12,052
-15,00015,00015,000 15,000Non-personnel Expenses Total 11,67412,052
(4.0) %370,000355,000 370,000355,000340,000481000 Principal2390270 325,000
2.7 %623,795641,106 623,795641,106657,527482000 Interest2390270 672,992
.2 %993,795996,106996,106 993,795Debt Service Total 997,527997,992
25.4 %11,93414,977 14,97714,97714,976881100 General Fund Allocation Chgs2390270 14,034
-2,0002,000 2,0002,0001,999882390 Utilization Chgs from 390 Fund2390270 1,999
21.8 %13,93416,97716,977 16,977Charges From Others Total 16,97616,034
.5 %1,028,083 1,022,7291,025,7721,028,0831,026,1781,026,080Total Budget Requirements
CCReport Name: 2017_Mid_Cycle_Report
Report Description: Budget Book - Department Budget Detail wMD
06/07/2017Date:
Time: 491
Version:
Page:19:21:28
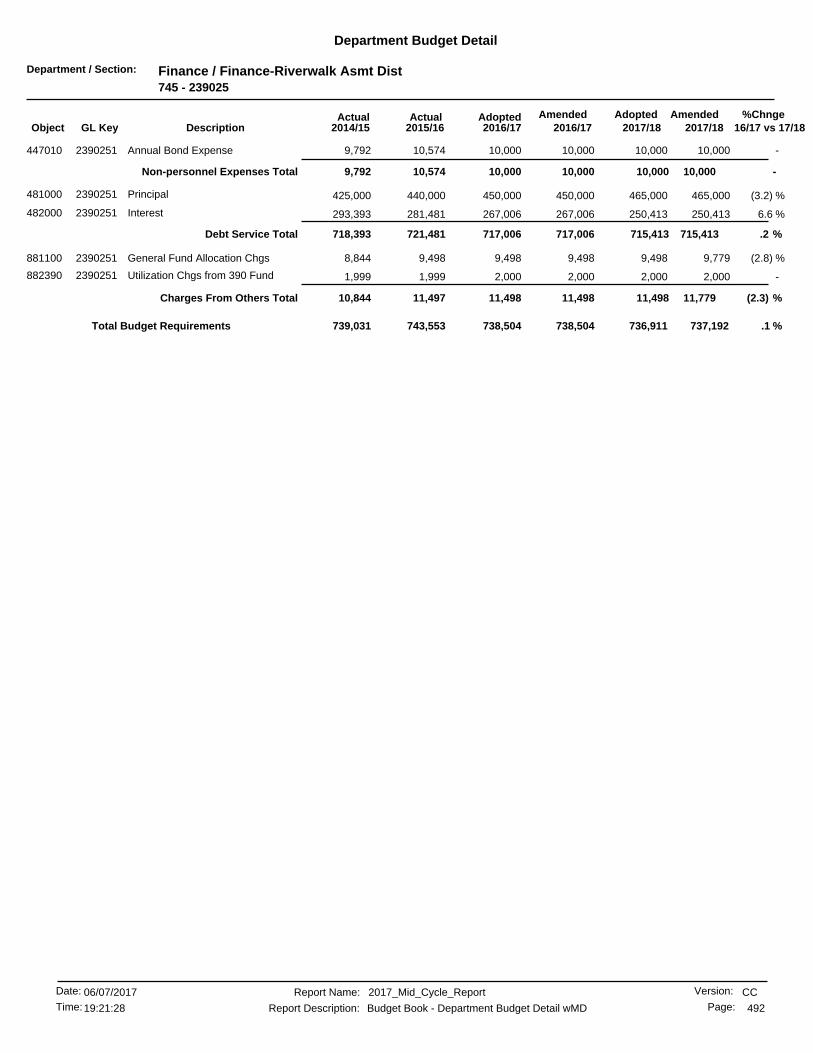
Department / Section: Finance / Finance-Riverwalk Asmt Dist745 - 239025
Department Budget Detail
%Chnge16/17 vs 17/182017/182017/18
AmendedAdoptedAdopted2016/17
AmendedActualActual2016/172015/162014/15GL KeyObject Description
-10,00010,000 10,00010,00010,574447010 Annual Bond Expense2390251 9,792
-10,00010,00010,000 10,000Non-personnel Expenses Total 10,5749,792
(3.2) %465,000450,000 465,000450,000440,000481000 Principal2390251 425,000
6.6 %250,413267,006 250,413267,006281,481482000 Interest2390251 293,393
.2 %715,413717,006717,006 715,413Debt Service Total 721,481718,393
(2.8) %9,7799,498 9,4989,4989,498881100 General Fund Allocation Chgs2390251 8,844
-2,0002,000 2,0002,0001,999882390 Utilization Chgs from 390 Fund2390251 1,999
(2.3) %11,77911,49811,498 11,498Charges From Others Total 11,49710,844
.1 %738,504 737,192736,911738,504743,553739,031Total Budget Requirements
CCReport Name: 2017_Mid_Cycle_Report
Report Description: Budget Book - Department Budget Detail wMD
06/07/2017Date:
Time: 492
Version:
Page:19:21:28

Department / Section: Finance / Finance-Riverwak Bus Asmt Dist746 - 239026
Department Budget Detail
%Chnge16/17 vs 17/182017/182017/18
AmendedAdoptedAdopted2016/17
AmendedActualActual2016/172015/162014/15GL KeyObject Description
-10,00010,000 10,00010,0007,484447010 Annual Bond Expense2390261 7,445
-10,00010,00010,000 10,000Non-personnel Expenses Total 7,4847,445
(3.7) %135,000130,000 135,000130,000120,000481000 Principal2390261 115,000
4.9 %152,205159,693 152,205159,693166,602482000 Interest2390261 172,920
.8 %287,205289,693289,693 287,205Debt Service Total 286,602287,920
(7.7) %6,6626,145 6,1456,1456,144881100 General Fund Allocation Chgs2390261 5,602
-2,0002,000 2,0002,0001,999882390 Utilization Chgs from 390 Fund2390261 1,999
(5.9) %8,6628,1458,145 8,145Charges From Others Total 8,1447,602
.6 %307,838 305,867305,350307,838302,231302,968Total Budget Requirements
CCReport Name: 2017_Mid_Cycle_Report
Report Description: Budget Book - Department Budget Detail wMD
06/07/2017Date:
Time: 493
Version:
Page:19:21:28
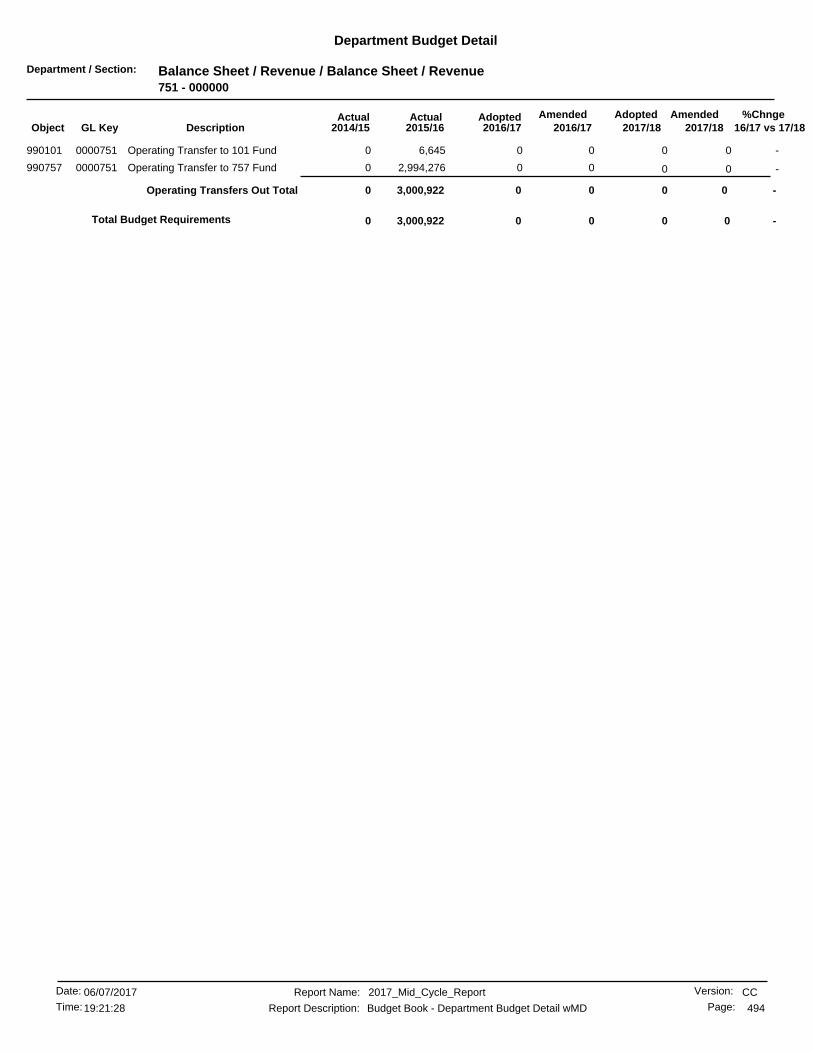
Department / Section: Balance Sheet / Revenue / Balance Sheet / Revenue751 - 000000
Department Budget Detail
%Chnge16/17 vs 17/182017/182017/18
AmendedAdoptedAdopted2016/17
AmendedActualActual2016/172015/162014/15GL KeyObject Description
-0 006,6450Operating Transfer to 101 Fund0000751990101 0
-0 002,994,2760Operating Transfer to 757 Fund0000751990757 0
-0 0Operating Transfers Out Total 003,000,9220
-00 003,000,922Total Budget Requirements 0
CCReport Name: 2017_Mid_Cycle_Report
Report Description: Budget Book - Department Budget Detail wMD
06/07/2017Date:
Time: 494
Version:
Page:19:21:28

Department / Section: Finance / Finance-CFD 86-1-Orangecrest751 - 239013
Department Budget Detail
%Chnge16/17 vs 17/182017/182017/18
AmendedAdoptedAdopted2016/17
AmendedActualActual2016/172015/162014/15GL KeyObject Description
-0 00019,486Annual Bond Expense2390131447010 0
-0 0Non-personnel Expenses Total 00019,486
-0 00071,649Interest2390131482000 0
-0 0Debt Service Total 00071,649
-0 00012,111General Fund Allocation Chgs2390131881100 0
-0 0001,999Utilization Chgs from 390 Fund2390131882390 0
-0 0Charges From Others Total 00014,110
-00 000Total Budget Requirements 105,246
CCReport Name: 2017_Mid_Cycle_Report
Report Description: Budget Book - Department Budget Detail wMD
06/07/2017Date:
Time: 495
Version:
Page:19:21:28

Department / Section: Finance / Finance-CFD 90-1-Highlander753 - 239014
Department Budget Detail
%Chnge16/17 vs 17/182017/182017/18
AmendedAdoptedAdopted2016/17
AmendedActualActual2016/172015/162014/15GL KeyObject Description
-0 0001,750Annual Bond Expense2390141447010 0
-0 0Non-personnel Expenses Total 0001,750
-0 0002,640,000L/T Bond Debt Principal2390141481015 0
-0 00072,600Interest2390141482000 0
-0 0Debt Service Total 0002,712,600
-0 00013,755General Fund Allocation Chgs2390141881100 0
-0 0001,999Utilization Chgs from 390 Fund2390141882390 0
-0 0Charges From Others Total 00015,754
-00 000Total Budget Requirements 2,730,104
CCReport Name: 2017_Mid_Cycle_Report
Report Description: Budget Book - Department Budget Detail wMD
06/07/2017Date:
Time: 496
Version:
Page:19:21:28
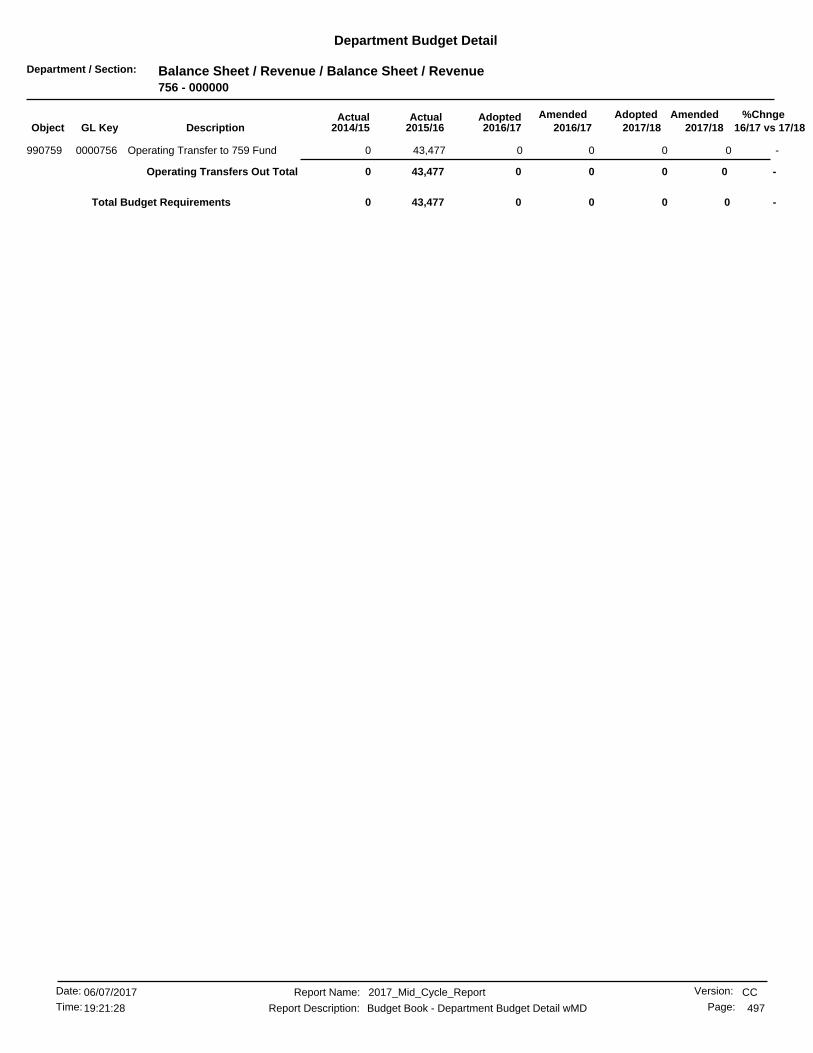
Department / Section: Balance Sheet / Revenue / Balance Sheet / Revenue756 - 000000
Department Budget Detail
%Chnge16/17 vs 17/182017/182017/18
AmendedAdoptedAdopted2016/17
AmendedActualActual2016/172015/162014/15GL KeyObject Description
-0 0043,4770Operating Transfer to 759 Fund0000756990759 0
-0 0Operating Transfers Out Total 0043,4770
-00 0043,477Total Budget Requirements 0
CCReport Name: 2017_Mid_Cycle_Report
Report Description: Budget Book - Department Budget Detail wMD
06/07/2017Date:
Time: 497
Version:
Page:19:21:28

Department / Section: Finance / Finance-CFD 2006-1Rvrwlk Vista756 - 239028
Department Budget Detail
%Chnge16/17 vs 17/182017/182017/18
AmendedAdoptedAdopted2016/17
AmendedActualActual2016/172015/162014/15GL KeyObject Description
-15,00015,000 15,00015,0006,349447010 Annual Bond Expense2390280 6,237
-15,00015,00015,000 15,000Non-personnel Expenses Total 6,3496,237
-85,00085,000 85,00085,00080,000481015 L/T Bond Debt Principal2390280 45,000
1.0 %202,794204,919 202,794204,919206,568482000 Interest2390280 207,818
.7 %287,794289,919289,919 287,794Debt Service Total 286,568252,818
457.8 %4,46024,878 24,87824,87824,877881100 General Fund Allocation Chgs2390280 34,968
-2,0002,000 2,0002,0001,999882390 Utilization Chgs from 390 Fund2390280 1,999
316.0 %6,46026,87826,878 26,878Charges From Others Total 26,87736,967
7.2 %331,797 309,254329,672331,797319,796296,024Total Budget Requirements
CCReport Name: 2017_Mid_Cycle_Report
Report Description: Budget Book - Department Budget Detail wMD
06/07/2017Date:
Time: 498
Version:
Page:19:21:28
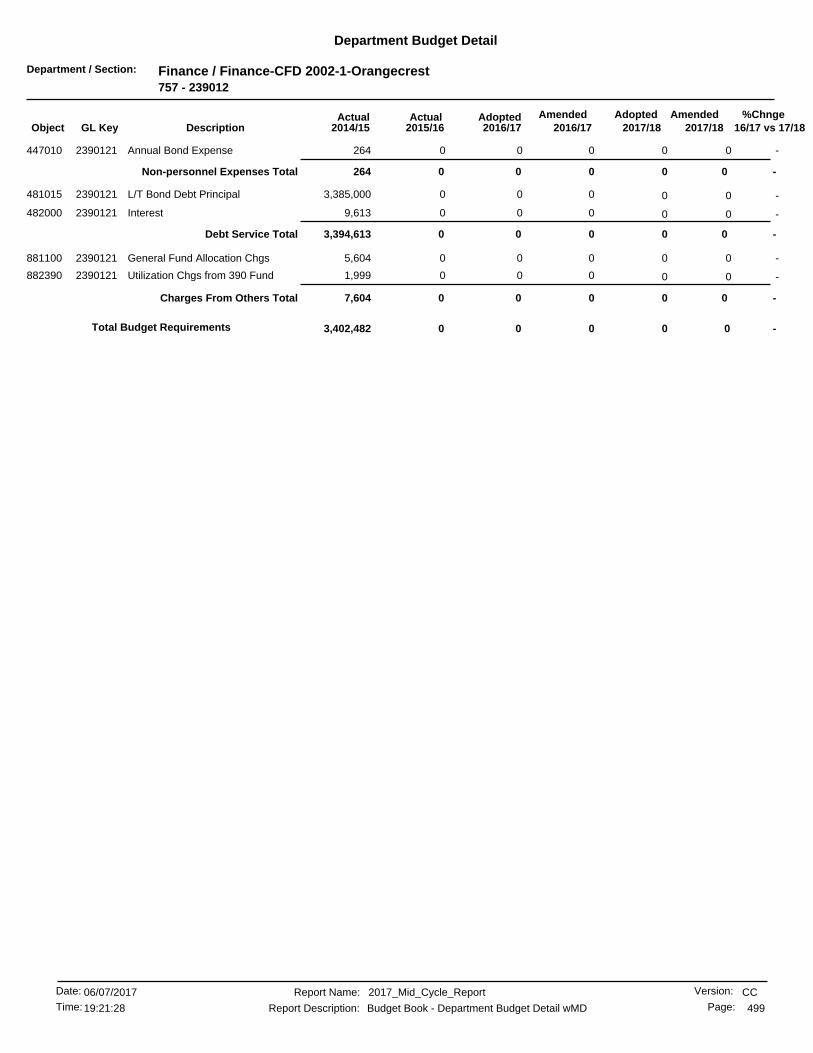
Department / Section: Finance / Finance-CFD 2002-1-Orangecrest757 - 239012
Department Budget Detail
%Chnge16/17 vs 17/182017/182017/18
AmendedAdoptedAdopted2016/17
AmendedActualActual2016/172015/162014/15GL KeyObject Description
-0 000264Annual Bond Expense2390121447010 0
-0 0Non-personnel Expenses Total 000264
-0 0003,385,000L/T Bond Debt Principal2390121481015 0
-0 0009,613Interest2390121482000 0
-0 0Debt Service Total 0003,394,613
-0 0005,604General Fund Allocation Chgs2390121881100 0
-0 0001,999Utilization Chgs from 390 Fund2390121882390 0
-0 0Charges From Others Total 0007,604
-00 000Total Budget Requirements 3,402,482
CCReport Name: 2017_Mid_Cycle_Report
Report Description: Budget Book - Department Budget Detail wMD
06/07/2017Date:
Time: 499
Version:
Page:19:21:28

Department / Section: Finance / Finance-CFD 92-1-Sycamore Cyn758 - 239010
Department Budget Detail
%Chnge16/17 vs 17/182017/182017/18
AmendedAdoptedAdopted2016/17
AmendedActualActual2016/172015/162014/15GL KeyObject Description
-10,00010,000 10,00010,0008,224447010 Annual Bond Expense2390101 8,617
-10,00010,00010,000 10,000Non-personnel Expenses Total 8,2248,617
(3.8) %260,000250,000 260,000250,000240,000481015 L/T Bond Debt Principal2390101 225,000
3.1 %381,034392,990 381,034392,990404,171482000 Interest2390101 414,493
.3 %641,034642,990642,990 641,034Debt Service Total 644,171639,493
(12.0) %25,66222,575 22,57522,57522,575881100 General Fund Allocation Chgs2390101 10,348
-2,0002,000 2,0002,0001,999882390 Utilization Chgs from 390 Fund2390101 1,999
(11.1) %27,66224,57524,575 24,575Charges From Others Total 24,57412,348
( .1) %677,565 678,696675,609677,565676,970660,459Total Budget Requirements
CCReport Name: 2017_Mid_Cycle_Report
Report Description: Budget Book - Department Budget Detail wMD
06/07/2017Date:
Time: 500
Version:
Page:19:21:28

Department / Section: Balance Sheet / Revenue / Balance Sheet / Revenue759 - 000000
Department Budget Detail
%Chnge16/17 vs 17/182017/182017/18
AmendedAdoptedAdopted2016/17
AmendedActualActual2016/172015/162014/15GL KeyObject Description
-0 006,224,9190Operating Transfer to 459 Fund0000759990459 0
-0 0Operating Transfers Out Total 006,224,9190
-00 006,224,919Total Budget Requirements 0
CCReport Name: 2017_Mid_Cycle_Report
Report Description: Budget Book - Department Budget Detail wMD
06/07/2017Date:
Time: 501
Version:
Page:19:21:28

Department / Section: Finance / Finance-CFD 2006-1-RW Vsta #2759 - 239029
Department Budget Detail
%Chnge16/17 vs 17/182017/182017/18
AmendedAdoptedAdopted2016/17
AmendedActualActual2016/172015/162014/15GL KeyObject Description
-8,500 8,5008,50000Annual Bond Expense2390290447010 8,500
-8,500 8,500Non-personnel Expenses Total 8,5008,50000
(38.4)%80,000 130,00080,00000L/T Bond Debt Principal2390290481015 130,000
-0 00226,4360Bond Cost of Issuance2390290481018 0
(5.1)%221,939 234,013221,93900Interest2390290482000 234,013
(17.0) %364,013301,939301,939 364,013Debt Service Total 226,4360
-2,000 2,0002,00000Utilization Chgs from 390 Fund2390290882390 2,000
-2,000 2,000Charges From Others Total 2,0002,00000
(16.5) %312,439 374,513374,513312,439226,4360Total Budget Requirements
CCReport Name: 2017_Mid_Cycle_Report
Report Description: Budget Book - Department Budget Detail wMD
06/07/2017Date:
Time: 502
Version:
Page:19:21:28

Department / Section: Balance Sheet / Revenue / Balance Sheet / Revenue760 - 000000
Department Budget Detail
%Chnge16/17 vs 17/182017/182017/18
AmendedAdoptedAdopted2016/17
AmendedActualActual2016/172015/162014/15GL KeyObject Description
-0 00549,6700Operating Transfer to 550 Fund0000760990550 0
-0 0Operating Transfers Out Total 00549,6700
-0 0035,9680Bond Cost of Issuance0000760481018 0
-0 0Debt Service Total 0035,9680
-00 00585,638Total Budget Requirements 0
CCReport Name: 2017_Mid_Cycle_Report
Report Description: Budget Book - Department Budget Detail wMD
06/07/2017Date:
Time: 503
Version:
Page:19:21:28
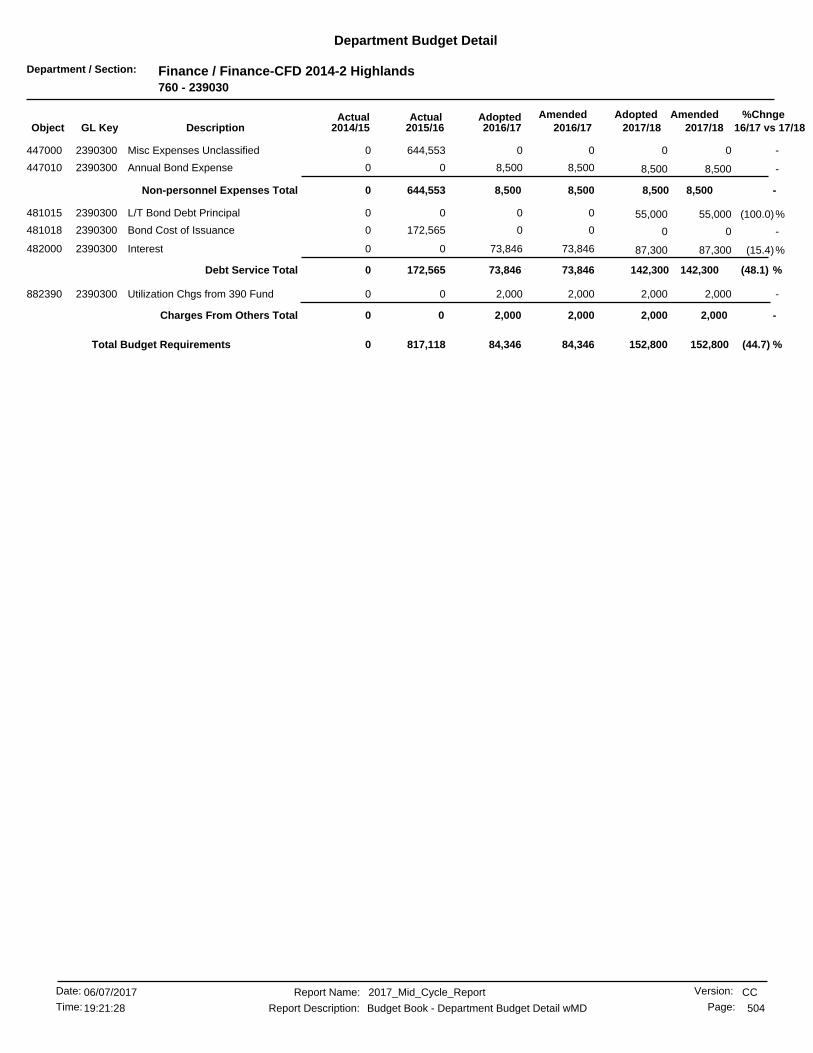
Department / Section: Finance / Finance-CFD 2014-2 Highlands760 - 239030
Department Budget Detail
%Chnge16/17 vs 17/182017/182017/18
AmendedAdoptedAdopted2016/17
AmendedActualActual2016/172015/162014/15GL KeyObject Description
-0 00644,5530Misc Expenses Unclassified2390300447000 0
-8,500 8,5008,50000Annual Bond Expense2390300447010 8,500
-8,5008,5008,500 8,500Non-personnel Expenses Total 644,5530
(100.0)%0 55,000000L/T Bond Debt Principal2390300481015 55,000
-0 00172,5650Bond Cost of Issuance2390300481018 0
(15.4)%73,846 87,30073,84600Interest2390300482000 87,300
(48.1) %142,30073,84673,846 142,300Debt Service Total 172,5650
-2,000 2,0002,00000Utilization Chgs from 390 Fund2390300882390 2,000
-2,000 2,000Charges From Others Total 2,0002,00000
(44.7) %84,346 152,800152,80084,346817,1180Total Budget Requirements
CCReport Name: 2017_Mid_Cycle_Report
Report Description: Budget Book - Department Budget Detail wMD
06/07/2017Date:
Time: 504
Version:
Page:19:21:28
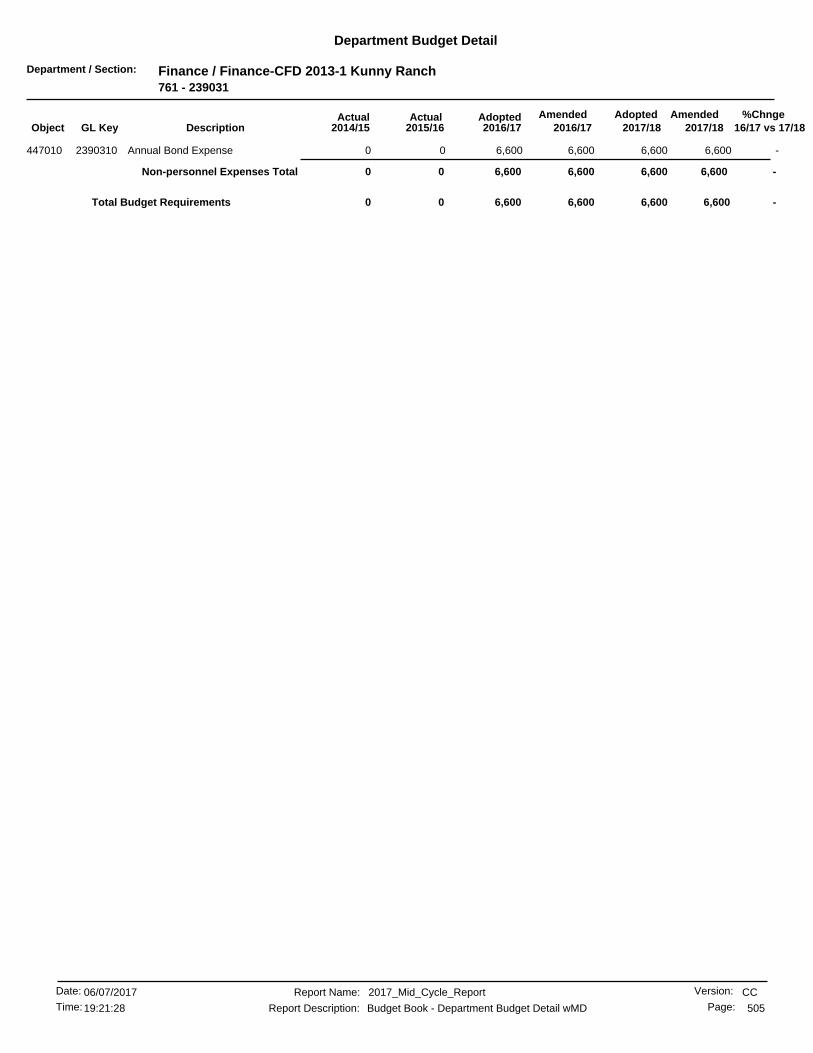
Department / Section: Finance / Finance-CFD 2013-1 Kunny Ranch761 - 239031
Department Budget Detail
%Chnge16/17 vs 17/182017/182017/18
AmendedAdoptedAdopted2016/17
AmendedActualActual2016/172015/162014/15GL KeyObject Description
-6,600 6,6006,60000Annual Bond Expense2390310447010 6,600
-6,600 6,600Non-personnel Expenses Total 6,6006,60000
-6,6006,600 6,6006,6000Total Budget Requirements 0
CCReport Name: 2017_Mid_Cycle_Report
Report Description: Budget Book - Department Budget Detail wMD
06/07/2017Date:
Time: 505
Version:
Page:19:21:28

Department / Section: Balance Sheet / Revenue / Balance Sheet / Revenue770 - 000000
Department Budget Detail
%Chnge16/17 vs 17/182017/182017/18
AmendedAdoptedAdopted2016/17
AmendedActualActual2016/172015/162014/15GL KeyObject Description
-0 000798,344Bond Cost of Issuance0000770481018 0
-0 001,683,488921,021Interest0000770482000 0
-0 0Debt Service Total 001,683,4881,719,365
-00 001,683,488Total Budget Requirements 1,719,365
CCReport Name: 2017_Mid_Cycle_Report
Report Description: Budget Book - Department Budget Detail wMD
06/07/2017Date:
Time: 506
Version:
Page:19:21:28
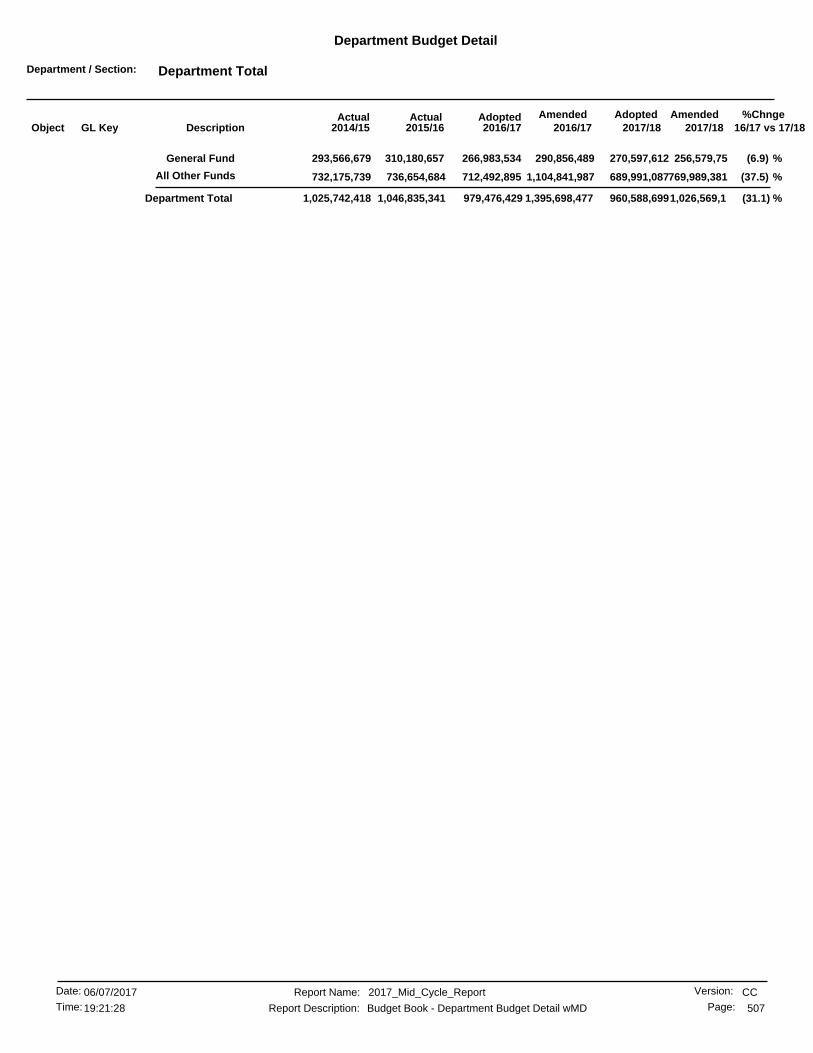
Department / Section: Department Total
Department Budget Detail
%Chnge16/17 vs 17/182017/182017/18
AmendedAdoptedAdopted2016/17
AmendedActualActual2016/172015/162014/15GL KeyObject Description
(37.5)
(6.9)
%
%
(31.1) %
769,989,381689,991,087
256,579,75
1,026,569,1
270,597,612290,856,489
1,104,841,987
960,588,6991,395,698,477
712,492,895
266,983,534
979,476,429
310,180,657
736,654,684
1,046,835,341
732,175,739
293,566,679
1,025,742,418
General Fund
All Other Funds
Department Total
CCReport Name: 2017_Mid_Cycle_Report
Report Description: Budget Book - Department Budget Detail wMD
06/07/2017Date:
Time: 507
Version:
Page:19:21:28

Department / Section: Balance Sheet / Revenue / Balance Sheet / Revenue101 - 000000
Department Budget Detail
%Chnge16/17 vs 17/182017/182017/18
AmendedAdoptedAdopted2016/17
AmendedActualActual2016/172015/162014/15GL KeyObject Description
(3.9) %22,820,16021,923,680 23,151,40621,923,68020,680,700311100 Curr Real & Secured Property0000101 19,848,138
4.8 %3,812,1603,997,600 4,221,4663,997,6003,316,891311101 Sucessor Agency-Property Taxes0000101 4,042,648
(5.3) %524,350496,544 524,350496,544426,517311110 Supplemental Property Tax0000101 429,218
(5.1) %27,889,35626,445,922 27,926,89326,445,92225,138,708311120 Property Taxes In Lieu0000101 24,050,636
(1.3) %1,654,2981,632,023 1,654,2981,632,0231,534,213311130 Property Taxes-Fire Bond0000101 1,593,557
(5.5) %900,000850,000 850,000850,000887,069311200 Current Unsecured Property Tax0000101 904,773
6.0 %2,530,0002,684,000 2,952,4002,684,0002,208,090311500 Property Transfer Tax0000101 1,893,951
2.2 %1,355,0001,385,000 1,385,0001,385,0001,353,108311550 Library Parcel Tax-Measure I0000101 1,387,712
.2 %64,806,45064,956,942 68,529,57464,956,94247,162,230312000 General Sales & Use Taxes0000101 43,964,116
-1,611,0001,611,000 1,611,0001,611,0001,566,919312020 Public Safety 1/2% Sales Tax0000101 1,540,471
-0 0012,246,89613,932,895Sales Tax Compensation Fund0000101312030 0
(4.7) %6,868,5756,541,500 6,868,5756,541,5006,093,429313000 Transient Occupancy Tax0000101 5,279,656
1.2 %16,768,83616,979,901 17,161,12316,979,90116,432,689314100 Utility Users Tax - Electric0000101 16,204,849
34.9 %2,096,0502,828,000 2,912,0002,828,0002,460,856314200 Utility Users Tax - Pac Bell0000101 2,564,667
(11.1) %2,901,1202,579,000 2,475,0002,579,0002,934,717314300 Utility Users Tax - Gas0000101 2,888,846
13.9 %162,740185,400 190,962185,400169,001314400 Utility Users Tax - Edison0000101 198,511
6.5 %1,339,0001,426,550 1,469,3471,426,5501,400,093314500 Utility Users Tax - Cable TV0000101 1,309,496
-1,000,0001,000,000 1,000,0001,000,0001,051,491314600 Utility Users-Other Phone Sys0000101 1,075,519
10.7 %720,300798,000 821,000798,000617,413314700 Utility Users Tax-Western Muni0000101 730,148
(15.8) %3,303,3782,780,258 3,151,3322,780,2582,761,746314900 Utility Users Tax - Water0000101 3,104,265
(7.6) %3,347,5003,090,000 3,182,7003,090,0003,353,019315000 Franchise Tax0000101 3,085,033
(4.1) %1,200,0001,150,000 1,150,0001,150,0001,174,748315100 Franchise Tax- Cable TV0000101 1,156,176
63.6 %825,0001,350,000 1,350,0001,350,0001,201,877315110 Franchise Fees-ATT Cable0000101 1,301,293
(1.0) %168,435,273166,691,320166,691,320 174,538,426Taxes Total 156,172,433152,486,587
(4.9) %7,388,5557,023,308 7,628,4457,023,3086,473,455320000 Business License Tax0000101 6,190,774
40.1 %26,19336,715 38,80836,71530,516320100 Bus License Tax-Misc Vendors0000101 35,268
-0 00(0)(4,168)Bus License Tax-Downtown BID0000101320200 0
-0 000(21,132)Bus License Tax-Arlington BID0000101320300 0
-0 00016,000Bus License Tax-Auto Ctr BID0000101320400 0
(16.3) %1,076,166900,000 850,000900,000750,668321000 Animal Licenses - County0000101 706,681
(5.3) %26,16824,756 26,16824,75623,433321010 Animal Licenses - City Hall0000101 31,147
(5.4) %3,1052,937 3,1052,9373,500321040 Residential Kennel Permits0000101 3,100
-0 00154,4251,087Animal Shelter - County0000101321080 0
(5.3) %97,22591,982 97,22591,98284,488321085 Animal Licenses - Rev Experts0000101 93,574
(5.3) %7,3036,909 7,3036,90910,194321091 Animal License-Penalty-City Hl0000101 13,716
(13.5) %173,432150,000 155,000150,000154,075321120 Building Permits Issuance Fee0000101 124,848
( .4) %1,368,3041,362,000 1,455,0001,362,0001,129,221321130 Building Permits0000101 1,109,340
(29.5) %17,02412,000 13,00012,00013,933321140 Plumbing Permits0000101 9,694
(36.0) %50,00832,000 33,00032,00039,199321150 Electrical Permits0000101 24,068
(50.5) %80,86440,000 42,00040,00060,679321170 Heating & Air Cond Permit0000101 24,946
(43.6) %9,3025,245 5,5445,2457,499321220 Sewer Permits0000101 20,784
12.7 %46,50852,450 55,44052,45043,036321230 Massage Permits0000101 28,839
115.7 %2,4315,245 5,5445,2454,179321240 Gun Permits0000101 6,527
(5.3) %25,50224,127 25,50224,12723,351321250 Taxi Permits0000101 20,851
(66.0) %4,0161,364 1,4411,3643,904321420 Fireworks Display Permit Fee0000101 1,072
(25.9) %31,60423,393 24,72623,39329,174321430 Uniform Fire Code Insp Permit0000101 24,189
CCReport Name: 2017_Mid_Cycle_Report_Revenues
Report Description: Budget Book - Department Budget Detail wMD
06/07/2017Date:
Time: 1
Version:
Page:19:21:42
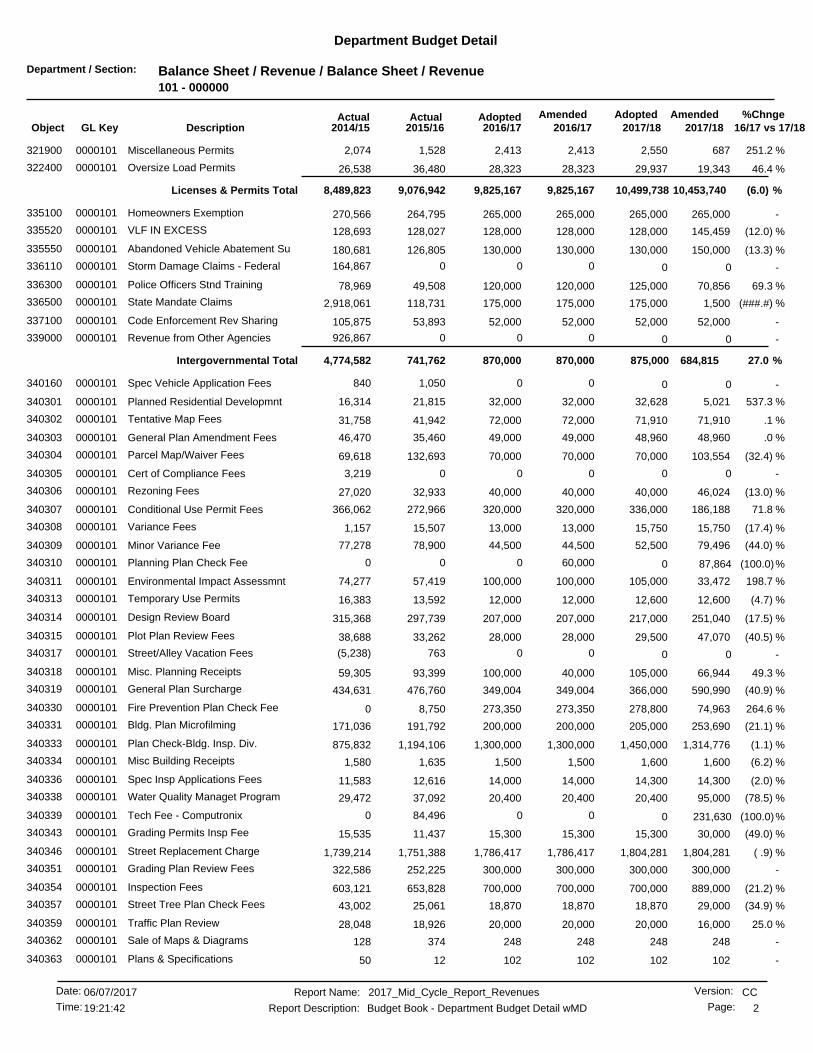
Department / Section: Balance Sheet / Revenue / Balance Sheet / Revenue101 - 000000
Department Budget Detail
%Chnge16/17 vs 17/182017/182017/18
AmendedAdoptedAdopted2016/17
AmendedActualActual2016/172015/162014/15GL KeyObject Description
251.2 %6872,413 2,5502,4131,528321900 Miscellaneous Permits0000101 2,074
46.4 %19,34328,323 29,93728,32336,480322400 Oversize Load Permits0000101 26,538
(6.0) %10,453,7409,825,1679,825,167 10,499,738Licenses & Permits Total 9,076,9428,489,823
-265,000265,000 265,000265,000264,795335100 Homeowners Exemption0000101 270,566
(12.0) %145,459128,000 128,000128,000128,027335520 VLF IN EXCESS0000101 128,693
(13.3) %150,000130,000 130,000130,000126,805335550 Abandoned Vehicle Abatement Su0000101 180,681
-0 000164,867Storm Damage Claims - Federal0000101336110 0
69.3 %70,856120,000 125,000120,00049,508336300 Police Officers Stnd Training0000101 78,969
(###.#) %1,500175,000 175,000175,000118,731336500 State Mandate Claims0000101 2,918,061
-52,00052,000 52,00052,00053,893337100 Code Enforcement Rev Sharing0000101 105,875
-0 000926,867Revenue from Other Agencies0000101339000 0
27.0 %684,815870,000870,000 875,000Intergovernmental Total 741,7624,774,582
-0 001,050840Spec Vehicle Application Fees0000101340160 0
537.3 %5,02132,000 32,62832,00021,815340301 Planned Residential Developmnt0000101 16,314
.1 %71,91072,000 71,91072,00041,942340302 Tentative Map Fees0000101 31,758
.0 %48,96049,000 48,96049,00035,460340303 General Plan Amendment Fees0000101 46,470
(32.4) %103,55470,000 70,00070,000132,693340304 Parcel Map/Waiver Fees0000101 69,618
-0 0003,219Cert of Compliance Fees0000101340305 0
(13.0) %46,02440,000 40,00040,00032,933340306 Rezoning Fees0000101 27,020
71.8 %186,188320,000 336,000320,000272,966340307 Conditional Use Permit Fees0000101 366,062
(17.4) %15,75013,000 15,75013,00015,507340308 Variance Fees0000101 1,157
(44.0) %79,49644,500 52,50044,50078,900340309 Minor Variance Fee0000101 77,278
(100.0)%0 87,86460,00000Planning Plan Check Fee0000101340310 0
198.7 %33,472100,000 105,000100,00057,419340311 Environmental Impact Assessmnt0000101 74,277
(4.7) %12,60012,000 12,60012,00013,592340313 Temporary Use Permits0000101 16,383
(17.5) %251,040207,000 217,000207,000297,739340314 Design Review Board0000101 315,368
(40.5) %47,07028,000 29,50028,00033,262340315 Plot Plan Review Fees0000101 38,688
-0 00763(5,238)Street/Alley Vacation Fees0000101340317 0
49.3 %66,944100,000 105,00040,00093,399340318 Misc. Planning Receipts0000101 59,305
(40.9) %590,990349,004 366,000349,004476,760340319 General Plan Surcharge0000101 434,631
264.6 %74,963273,350 278,800273,3508,750340330 Fire Prevention Plan Check Fee0000101 0
(21.1) %253,690200,000 205,000200,000191,792340331 Bldg. Plan Microfilming0000101 171,036
(1.1) %1,314,7761,300,000 1,450,0001,300,0001,194,106340333 Plan Check-Bldg. Insp. Div.0000101 875,832
(6.2) %1,6001,500 1,6001,5001,635340334 Misc Building Receipts0000101 1,580
(2.0) %14,30014,000 14,30014,00012,616340336 Spec Insp Applications Fees0000101 11,583
(78.5) %95,00020,400 20,40020,40037,092340338 Water Quality Managet Program0000101 29,472
(100.0)%0 231,630084,4960Tech Fee - Computronix0000101340339 0
(49.0) %30,00015,300 15,30015,30011,437340343 Grading Permits Insp Fee0000101 15,535
( .9) %1,804,2811,786,417 1,804,2811,786,4171,751,388340346 Street Replacement Charge0000101 1,739,214
-300,000300,000 300,000300,000252,225340351 Grading Plan Review Fees0000101 322,586
(21.2) %889,000700,000 700,000700,000653,828340354 Inspection Fees0000101 603,121
(34.9) %29,00018,870 18,87018,87025,061340357 Street Tree Plan Check Fees0000101 43,002
25.0 %16,00020,000 20,00020,00018,926340359 Traffic Plan Review0000101 28,048
-248248 248248374340362 Sale of Maps & Diagrams0000101 128
-102102 10210212340363 Plans & Specifications0000101 50
CCReport Name: 2017_Mid_Cycle_Report_Revenues
Report Description: Budget Book - Department Budget Detail wMD
06/07/2017Date:
Time: 2
Version:
Page:19:21:42

Department / Section: Balance Sheet / Revenue / Balance Sheet / Revenue101 - 000000
Department Budget Detail
%Chnge16/17 vs 17/182017/182017/18
AmendedAdoptedAdopted2016/17
AmendedActualActual2016/172015/162014/15GL KeyObject Description
(64.2) %28,00010,000 10,00010,00033,905340391 Misc Engineering Receipts0000101 13,987
(26.7) %163,725120,000 110,000120,000173,168340401 Sec/Boarding up of Structures0000101 171,287
(41.4) %22,20013,000 13,00013,00016,872340402 Demolition of Structures0000101 22,770
(8.2) %354,412325,000 325,000325,000360,895341100 Special Police Services0000101 325,093
-71,37671,376 71,37671,37671,376341101 Police Reimb Galleria at Tyler0000101 71,376
1.3 %172,688175,000 180,000175,000159,895341130 Emergency Services for DUI0000101 175,748
-260,000260,000 260,000260,000250,636341170 Police False Alarm Fees0000101 207,591
285.9 %16,06462,000 65,00062,00032,910341180 Police Alarm Registration Fees0000101 62,979
(19.2) %1,047,673845,920 846,420862,420481,825341190 Misc. Police Receipts0000101 849,207
-626,628626,628 626,628626,628626,627341193 Police-RUSD Res. Offcr0000101 771,627
(1.6) %577,842568,302 658,100568,302569,417341210 Haz Material Disclosure Fee0000101 448,666
(43.8) %169,15495,000 90,00095,00022,216341215 Fire False Alarm Fees0000101 127,450
-60,00060,000 60,00060,00062,029341220 Misc Fire Receipts0000101 61,321
(38.5) %367,000225,512 234,593225,512261,942341240 Plan Chk & Insp Prog Fee Fire0000101 173,190
36.7 %292,453400,000 410,000400,000430,766341245 Inspection Fees - Fire Dept.0000101 367,559
(1.8) %1,734,6851,702,341 1,739,2751,702,3411,645,635341250 AMR Paramedics Program0000101 1,662,399
-6,5006,500 6,5006,5009,080342100 Street and Alley Repair Fees0000101 12,042
-6,5006,500 6,5006,5009,663342200 Street Sign Repair Fees0000101 8,604
(68.2) %47,28215,000 15,00015,00085,647342300 Traffic Signal Repairs0000101 35,404
210.6 %16,09650,000 50,00050,00058,427342900 Misc Street Receipts0000101 75,653
-0 004,6764,922Payment Plan Fee0000101343010 0
(5.3) %360,680341,530 341,530341,530385,376343200 Swimming Pool Fees0000101 293,946
(5.8) %8,5008,000 8,5008,00010,638343420 St Tree Svc & Damage Chgs0000101 7,899
(5.5) %1,452,8801,372,000 1,396,0001,372,0001,361,989343510 Special Recreational Programs0000101 1,142,159
-10,00010,000 10,00010,00019,740343512 Non-Res Park Use Fee0000101 16,389
-0 002,2800Wellness Donations0000101343600 0
.4 %1,127,7601,133,000 1,158,0001,133,0001,087,227343610 Park Rentals0000101 1,006,099
-0 0015,63410,774Misc Park Receipts0000101343620 0
-0 007,4975,555Recrtn Vending Mach % Receipts0000101343635 0
(1.1) %90,00089,000 90,00089,00086,618343839 Misc Library Receipts-Printing0000101 92,702
(7.0) %15,791,57114,694,80014,678,300 15,113,171Charges for Services Total 14,194,56813,638,754
15.4 %160,680185,500 191,065185,500156,459351010 Library Fines - City0000101 173,378
53.8 %650,0001,000,000 1,000,0001,000,000837,563352100 California Vehicle Code Fines0000101 1,163,783
-0 00147,484634,660Photo Red Light Fines0000101352200 0
100.0 %37,00074,000 74,00074,00071,954353100 General & Misdemeanor Fines0000101 74,123
-0 000(110)Parking Fines0000101353200 0
-0 009021,258Parking Fines-Code Citations0000101353225 0
52.1 %23,00035,000 35,00035,00026,883353300 Vehicle Abatement Fees0000101 58,080
-0 00170Late Payment Penalties0000101353400 0
(38.0) %210,000130,000 130,000130,000284,612353600 Administrative Citation Rev0000101 387,506
(15.0) %1,060,000900,000 900,000900,0001,373,989353700 Administrative Civil Penalties0000101 3,088,347
(83.5) %(167,141)(27,500) (25,000)(27,500)(143,221)353795 Code Receiverships0000101 (49,099)
-(200,000)(200,000) (200,000)(200,000)(236,880)353799 Code Rehab & Settlements0000101 (604,676)
-(360,000)(360,000) (360,000)(360,000)(582,558)353999 NPA Deferred Rev0000101 (970,456)
22.8 %1,413,5391,737,0001,737,000 1,745,065Fines & Forfeits Total 1,937,2063,956,794
CCReport Name: 2017_Mid_Cycle_Report_Revenues
Report Description: Budget Book - Department Budget Detail wMD
06/07/2017Date:
Time: 3
Version:
Page:19:21:42
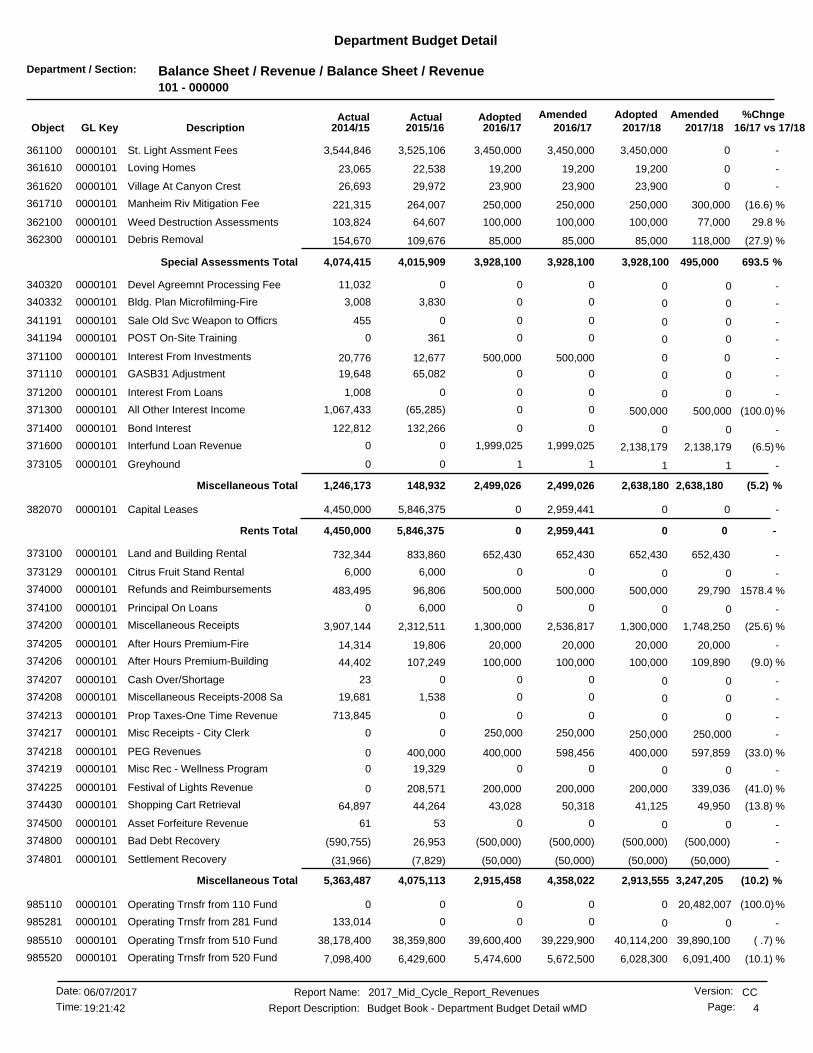
Department / Section: Balance Sheet / Revenue / Balance Sheet / Revenue101 - 000000
Department Budget Detail
%Chnge16/17 vs 17/182017/182017/18
AmendedAdoptedAdopted2016/17
AmendedActualActual2016/172015/162014/15GL KeyObject Description
-03,450,000 3,450,0003,450,0003,525,106361100 St. Light Assment Fees0000101 3,544,846
-019,200 19,20019,20022,538361610 Loving Homes0000101 23,065
-023,900 23,90023,90029,972361620 Village At Canyon Crest0000101 26,693
(16.6) %300,000250,000 250,000250,000264,007361710 Manheim Riv Mitigation Fee0000101 221,315
29.8 %77,000100,000 100,000100,00064,607362100 Weed Destruction Assessments0000101 103,824
(27.9) %118,00085,000 85,00085,000109,676362300 Debris Removal0000101 154,670
693.5 %495,0003,928,1003,928,100 3,928,100Special Assessments Total 4,015,9094,074,415
-0 00011,032Devel Agreemnt Processing Fee0000101340320 0
-0 003,8303,008Bldg. Plan Microfilming-Fire0000101340332 0
-0 000455Sale Old Svc Weapon to Officrs0000101341191 0
-0 003610POST On-Site Training0000101341194 0
-0500,000 0500,00012,677371100 Interest From Investments0000101 20,776
-0 0065,08219,648GASB31 Adjustment0000101371110 0
-0 0001,008Interest From Loans0000101371200 0
(100.0)%0 500,0000(65,285)1,067,433All Other Interest Income0000101371300 500,000
-0 00132,266122,812Bond Interest0000101371400 0
(6.5)%1,999,025 2,138,1791,999,02500Interfund Loan Revenue0000101371600 2,138,179
-1 1100Greyhound0000101373105 1
(5.2) %2,638,1802,499,0262,499,026 2,638,180Miscellaneous Total 148,9321,246,173
-00 02,959,4415,846,375382070 Capital Leases0000101 4,450,000
-0 0Rents Total 02,959,4415,846,3754,450,000
-652,430652,430 652,430652,430833,860373100 Land and Building Rental0000101 732,344
-0 006,0006,000Citrus Fruit Stand Rental0000101373129 0
1578.4 %29,790500,000 500,000500,00096,806374000 Refunds and Reimbursements0000101 483,495
-0 006,0000Principal On Loans0000101374100 0
(25.6) %1,748,2501,300,000 1,300,0002,536,8172,312,511374200 Miscellaneous Receipts0000101 3,907,144
-20,00020,000 20,00020,00019,806374205 After Hours Premium-Fire0000101 14,314
(9.0) %109,890100,000 100,000100,000107,249374206 After Hours Premium-Building0000101 44,402
-0 00023Cash Over/Shortage0000101374207 0
-0 001,53819,681Miscellaneous Receipts-2008 Sa0000101374208 0
-0 000713,845Prop Taxes-One Time Revenue0000101374213 0
-250,000 250,000250,00000Misc Receipts - City Clerk0000101374217 250,000
(33.0) %597,859400,000 400,000598,456400,000374218 PEG Revenues0000101 0
-0 0019,3290Misc Rec - Wellness Program0000101374219 0
(41.0) %339,036200,000 200,000200,000208,571374225 Festival of Lights Revenue0000101 0
(13.8) %49,95043,028 41,12550,31844,264374430 Shopping Cart Retrieval0000101 64,897
-0 005361Asset Forfeiture Revenue0000101374500 0
-(500,000)(500,000) (500,000)(500,000)26,953374800 Bad Debt Recovery0000101 (590,755)
-(50,000)(50,000) (50,000)(50,000)(7,829)374801 Settlement Recovery0000101 (31,966)
(10.2) %3,247,2054,358,0222,915,458 2,913,555Miscellaneous Total 4,075,1135,363,487
(100.0)%0 20,482,007000Operating Trnsfr from 110 Fund0000101985110 0
-0 000133,014Operating Trnsfr from 281 Fund0000101985281 0
( .7) %39,890,10039,600,400 40,114,20039,229,90038,359,800985510 Operating Trnsfr from 510 Fund0000101 38,178,400
(10.1) %6,091,4005,474,600 6,028,3005,672,5006,429,600985520 Operating Trnsfr from 520 Fund0000101 7,098,400
CCReport Name: 2017_Mid_Cycle_Report_Revenues
Report Description: Budget Book - Department Budget Detail wMD
06/07/2017Date:
Time: 4
Version:
Page:19:21:42
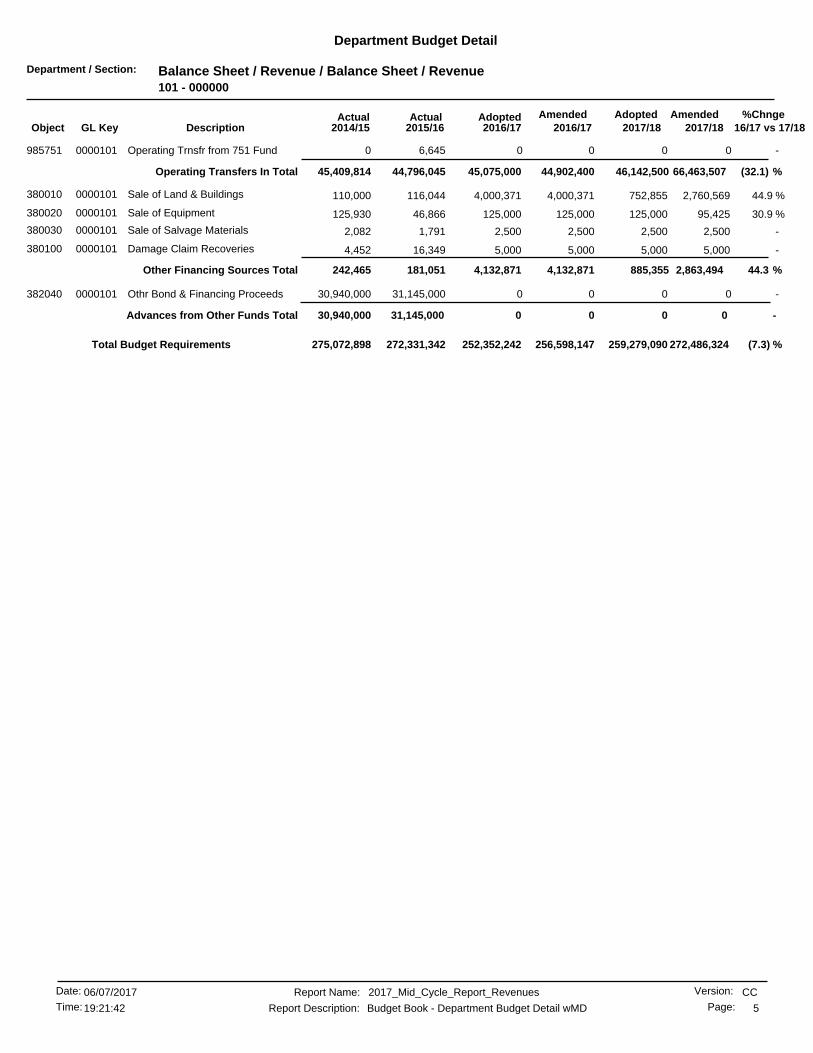
Department / Section: Balance Sheet / Revenue / Balance Sheet / Revenue101 - 000000
Department Budget Detail
%Chnge16/17 vs 17/182017/182017/18
AmendedAdoptedAdopted2016/17
AmendedActualActual2016/172015/162014/15GL KeyObject Description
-0 006,6450Operating Trnsfr from 751 Fund0000101985751 0
(32.1) %66,463,50744,902,40045,075,000 46,142,500Operating Transfers In Total 44,796,04545,409,814
44.9 %2,760,5694,000,371 752,8554,000,371116,044380010 Sale of Land & Buildings0000101 110,000
30.9 %95,425125,000 125,000125,00046,866380020 Sale of Equipment0000101 125,930
-2,5002,500 2,5002,5001,791380030 Sale of Salvage Materials0000101 2,082
-5,0005,000 5,0005,00016,349380100 Damage Claim Recoveries0000101 4,452
44.3 %2,863,4944,132,8714,132,871 885,355Other Financing Sources Total 181,051242,465
-0 0031,145,00030,940,000Othr Bond & Financing Proceeds0000101382040 0
-0 0Advances from Other Funds Total 0031,145,00030,940,000
(7.3) %252,352,242 272,486,324259,279,090256,598,147272,331,342275,072,898Total Budget Requirements
CCReport Name: 2017_Mid_Cycle_Report_Revenues
Report Description: Budget Book - Department Budget Detail wMD
06/07/2017Date:
Time: 5
Version:
Page:19:21:42

Department / Section: Mayor / Mayor-Community Relations101 - 012000
Department Budget Detail
%Chnge16/17 vs 17/182017/182017/18
AmendedAdoptedAdopted2016/17
AmendedActualActual2016/172015/162014/15GL KeyObject Description
-0 040,00000CHAMPS9899500339000 0
-0 0Intergovernmental Total 040,00000
(100.0) %00 040,0000Total Budget Requirements 0
CCReport Name: 2017_Mid_Cycle_Report_Revenues
Report Description: Budget Book - Department Budget Detail wMD
06/07/2017Date:
Time: 6
Version:
Page:19:21:42

Department / Section: City Manager / CM-Sundry/Gen Govt101 - 113500
Department Budget Detail
%Chnge16/17 vs 17/182017/182017/18
AmendedAdoptedAdopted2016/17
AmendedActualActual2016/172015/162014/15GL KeyObject Description
-0 00(2,738)364Homeless Street Outreach9125100331100 0
-0 0Intergovernmental Total 00(2,738)364
-00 00(2,738)Total Budget Requirements 364
CCReport Name: 2017_Mid_Cycle_Report_Revenues
Report Description: Budget Book - Department Budget Detail wMD
06/07/2017Date:
Time: 7
Version:
Page:19:21:42

Department / Section: City Manager / CM-Communications Office101 - 114000
Department Budget Detail
%Chnge16/17 vs 17/182017/182017/18
AmendedAdoptedAdopted2016/17
AmendedActualActual2016/172015/162014/15GL KeyObject Description
-0 008,0000Sponsorships1140000374215 0
-0 0000TV Production Service Revenue1140000374221 0
-0 0Miscellaneous Total 008,0000
-00 008,000Total Budget Requirements 0
CCReport Name: 2017_Mid_Cycle_Report_Revenues
Report Description: Budget Book - Department Budget Detail wMD
06/07/2017Date:
Time: 8
Version:
Page:19:21:42
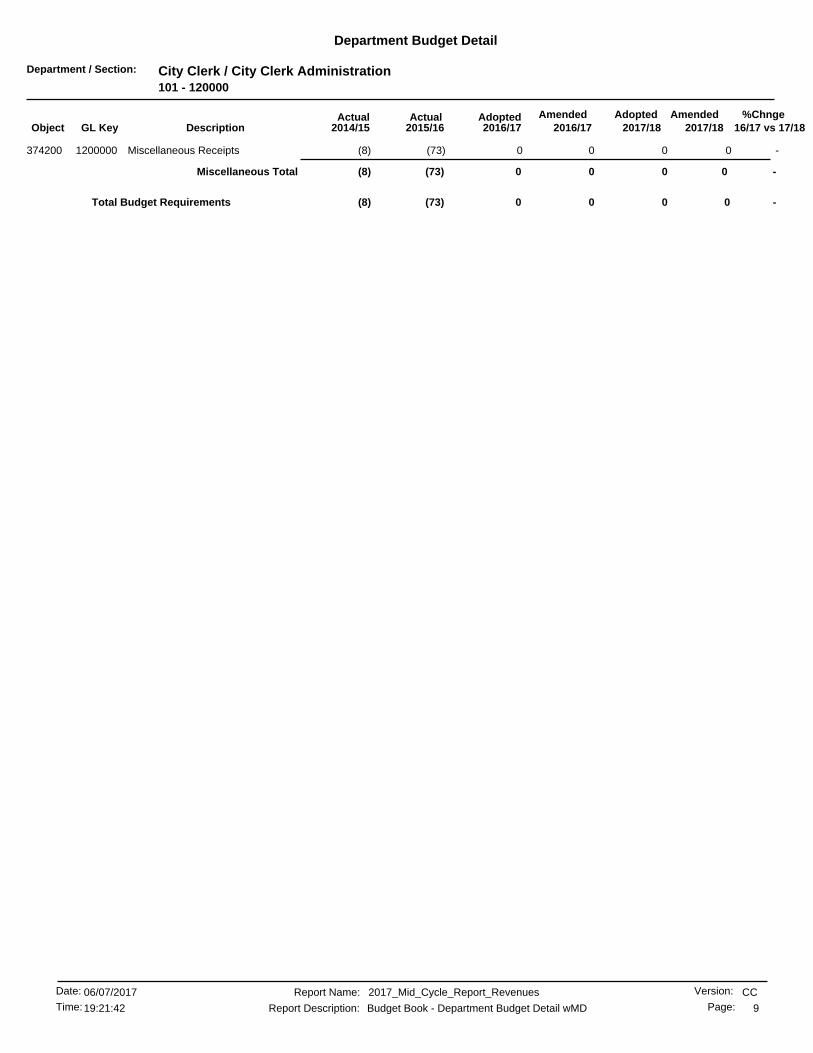
Department / Section: City Clerk / City Clerk Administration101 - 120000
Department Budget Detail
%Chnge16/17 vs 17/182017/182017/18
AmendedAdoptedAdopted2016/17
AmendedActualActual2016/172015/162014/15GL KeyObject Description
-0 00(73)(8)Miscellaneous Receipts1200000374200 0
-0 0Miscellaneous Total 00(73)(8)
-00 00(73)Total Budget Requirements (8)
CCReport Name: 2017_Mid_Cycle_Report_Revenues
Report Description: Budget Book - Department Budget Detail wMD
06/07/2017Date:
Time: 9
Version:
Page:19:21:42
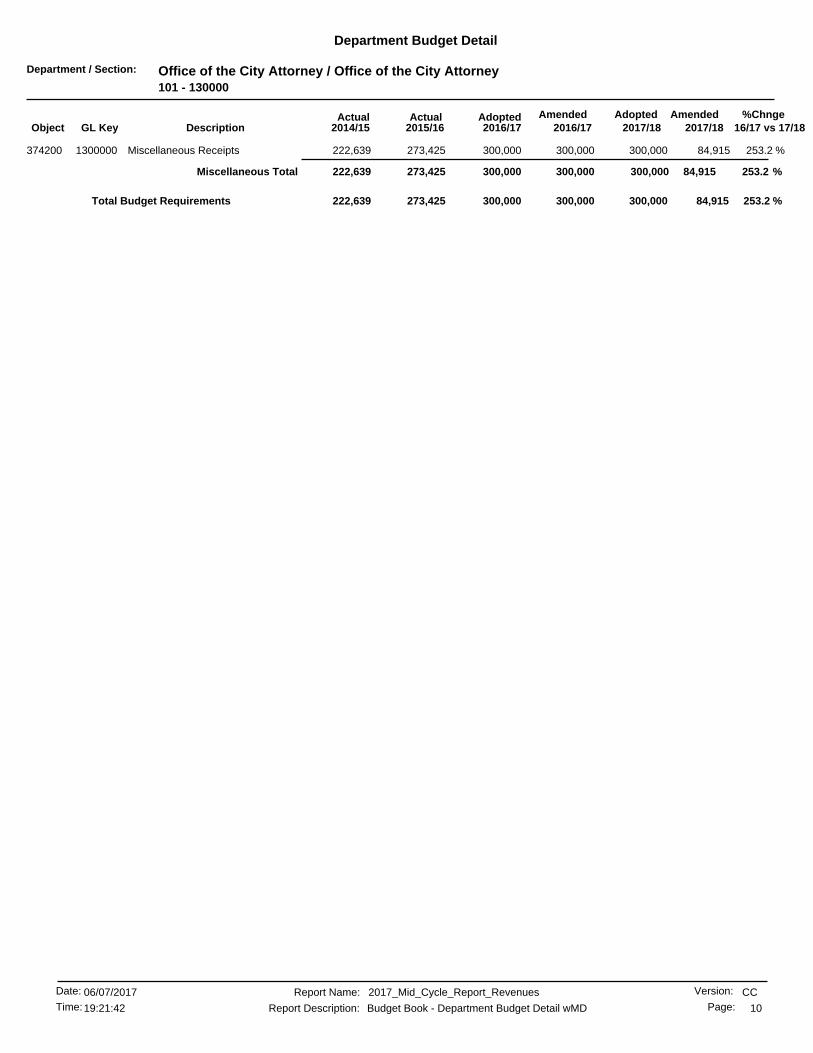
Department / Section: Office of the City Attorney / Office of the City Attorney101 - 130000
Department Budget Detail
%Chnge16/17 vs 17/182017/182017/18
AmendedAdoptedAdopted2016/17
AmendedActualActual2016/172015/162014/15GL KeyObject Description
253.2 %84,915300,000 300,000300,000273,425374200 Miscellaneous Receipts1300000 222,639
253.2 %84,915300,000300,000 300,000Miscellaneous Total 273,425222,639
253.2 %300,000 84,915300,000300,000273,425222,639Total Budget Requirements
CCReport Name: 2017_Mid_Cycle_Report_Revenues
Report Description: Budget Book - Department Budget Detail wMD
06/07/2017Date:
Time: 10
Version:
Page:19:21:42

Department / Section: Human Resources / Human Resources-Administration101 - 210000
Department Budget Detail
%Chnge16/17 vs 17/182017/182017/18
AmendedAdoptedAdopted2016/17
AmendedActualActual2016/172015/162014/15GL KeyObject Description
298.2%22,000 5,52422,00000Misc Rec - Wellness Program2100000374219 22,000
298.2 %22,000 5,524Miscellaneous Total 22,00022,00000
-5,52422,000 22,00022,0000Total Budget Requirements 0
CCReport Name: 2017_Mid_Cycle_Report_Revenues
Report Description: Budget Book - Department Budget Detail wMD
06/07/2017Date:
Time: 11
Version:
Page:19:21:42

Department / Section: General Services / Gen Svs-Bldg Svs-Maintenance101 - 221000
Department Budget Detail
%Chnge16/17 vs 17/182017/182017/18
AmendedAdoptedAdopted2016/17
AmendedActualActual2016/172015/162014/15GL KeyObject Description
(10.1) %114,684103,000 103,000103,000110,091373100 Homeless Acquisition - Hulen9781500 104,120
-0 0(3,976)027,362SB1186-Accesibility Projects9890400374200 0
(10.1) %114,68499,023103,000 103,000Miscellaneous Total 110,091131,483
(10.1) %103,000 114,684103,00099,023110,091131,483Total Budget Requirements
CCReport Name: 2017_Mid_Cycle_Report_Revenues
Report Description: Budget Book - Department Budget Detail wMD
06/07/2017Date:
Time: 12
Version:
Page:19:21:42

Department / Section: Finance / Finance-Administration101 - 230000
Department Budget Detail
%Chnge16/17 vs 17/182017/182017/18
AmendedAdoptedAdopted2016/17
AmendedActualActual2016/172015/162014/15GL KeyObject Description
-68,40068,400 68,40068,40071,175373100 Arlanza Resource-Operating9776300 69,290
-68,40068,40068,400 68,400Miscellaneous Total 71,17569,290
-68,400 68,40068,40068,40071,17569,290Total Budget Requirements
CCReport Name: 2017_Mid_Cycle_Report_Revenues
Report Description: Budget Book - Department Budget Detail wMD
06/07/2017Date:
Time: 13
Version:
Page:19:21:42

Department / Section: Finance / Finance-Budget and Revenue101 - 231000
Department Budget Detail
%Chnge16/17 vs 17/182017/182017/18
AmendedAdoptedAdopted2016/17
AmendedActualActual2016/172015/162014/15GL KeyObject Description
-0 00(86)81Cash Over/Shortage2310000374207 0
-0 0Miscellaneous Total 00(86)81
-00 00(86)Total Budget Requirements 81
CCReport Name: 2017_Mid_Cycle_Report_Revenues
Report Description: Budget Book - Department Budget Detail wMD
06/07/2017Date:
Time: 14
Version:
Page:19:21:42

Department / Section: Finance / Finance-Purchasing101 - 231500
Department Budget Detail
%Chnge16/17 vs 17/182017/182017/18
AmendedAdoptedAdopted2016/17
AmendedActualActual2016/172015/162014/15GL KeyObject Description
-0 009,4963,048Refunds and Reimbursements2315000374000 0
-0 0Miscellaneous Total 009,4963,048
-00 009,496Total Budget Requirements 3,048
CCReport Name: 2017_Mid_Cycle_Report_Revenues
Report Description: Budget Book - Department Budget Detail wMD
06/07/2017Date:
Time: 15
Version:
Page:19:21:42

Department / Section: Innovation and Technology / IT-Administration101 - 240000
Department Budget Detail
%Chnge16/17 vs 17/182017/182017/18
AmendedAdoptedAdopted2016/17
AmendedActualActual2016/172015/162014/15GL KeyObject Description
-00 05,31740,319331300 Video Security Grant9242500 157,938
-0 0Intergovernmental Total 05,31740,319157,938
-0 00139146Sale of CADME Paper Products2400000340365 0
-0 0Miscellaneous Total 00139146
-0 005,31740,459158,084Total Budget Requirements
(100.0) %00 05,31740,459Total Budget Requirements 158,084
CCReport Name: 2017_Mid_Cycle_Report_Revenues
Report Description: Budget Book - Department Budget Detail wMD
06/07/2017Date:
Time: 16
Version:
Page:19:21:42

Department / Section: Community Development / CD-Administration101 - 280000
Department Budget Detail
%Chnge16/17 vs 17/182017/182017/18
AmendedAdoptedAdopted2016/17
AmendedActualActual2016/172015/162014/15GL KeyObject Description
-70,000 0140,00000Grow Riverside9878200343660 70,000
-70,000 0Charges for Services Total 70,000140,00000
-0 0041,6712,500Grow Riverside9878200374200 0
(100.0)%0 70,000071,55563,285Grow Riverside9878200374215 0
(100.0) %0 70,000Miscellaneous Total 00113,22665,785
-70,000 70,00070,000140,000113,22665,785Total Budget Requirements
CCReport Name: 2017_Mid_Cycle_Report_Revenues
Report Description: Budget Book - Department Budget Detail wMD
06/07/2017Date:
Time: 17
Version:
Page:19:21:42

Department / Section: Community Development / CD-Planning101 - 281000
Department Budget Detail
%Chnge16/17 vs 17/182017/182017/18
AmendedAdoptedAdopted2016/17
AmendedActualActual2016/172015/162014/15GL KeyObject Description
-0 00275275Miscellaneous Receipts2810000374200 0
-0 0Miscellaneous Total 00275275
-00 00275Total Budget Requirements 275
CCReport Name: 2017_Mid_Cycle_Report_Revenues
Report Description: Budget Book - Department Budget Detail wMD
06/07/2017Date:
Time: 18
Version:
Page:19:21:42

Department / Section: Community Development / Comm Dev-Plng-Hist Pres101 - 281025
Department Budget Detail
%Chnge16/17 vs 17/182017/182017/18
AmendedAdoptedAdopted2016/17
AmendedActualActual2016/172015/162014/15GL KeyObject Description
-0 000(64)Other Property Rental2810250373120 0
-0 0Miscellaneous Total 000(64)
-00 000Total Budget Requirements (64)
CCReport Name: 2017_Mid_Cycle_Report_Revenues
Report Description: Budget Book - Department Budget Detail wMD
06/07/2017Date:
Time: 19
Version:
Page:19:21:42

Department / Section: Community Development / Comm Dev-Plng-Hist Pres Awards101 - 281026
Department Budget Detail
%Chnge16/17 vs 17/182017/182017/18
AmendedAdoptedAdopted2016/17
AmendedActualActual2016/172015/162014/15GL KeyObject Description
-0 025,00000Heritage Hse-HPO Grant9895400339000 0
-0 025,00000Harada Hse-HPO Grant9895500339000 0
-0 009,7300Historical Preservation Awards9895600339000 0
-0 025,00000St Francis Falls-HPF9895700339000 0
-0 0Intergovernmental Total 075,0009,7300
-0 0075,0009,7300Total Budget Requirements
(100.0) %00 075,0009,730Total Budget Requirements 0
CCReport Name: 2017_Mid_Cycle_Report_Revenues
Report Description: Budget Book - Department Budget Detail wMD
06/07/2017Date:
Time: 20
Version:
Page:19:21:42

Department / Section: Community Development / Comm Dev-Building & Safety101 - 282500
Department Budget Detail
%Chnge16/17 vs 17/182017/182017/18
AmendedAdoptedAdopted2016/17
AmendedActualActual2016/172015/162014/15GL KeyObject Description
-0 001,4351,070Seismic Education & Traning9723110340337 0
-0 0Charges for Services Total 001,4351,070
-0 03,97600SB1186-Training9890410374200 0
-0 0Miscellaneous Total 03,97600
-0 003,9761,4351,070Total Budget Requirements
(100.0) %00 03,9761,435Total Budget Requirements 1,070
CCReport Name: 2017_Mid_Cycle_Report_Revenues
Report Description: Budget Book - Department Budget Detail wMD
06/07/2017Date:
Time: 21
Version:
Page:19:21:42
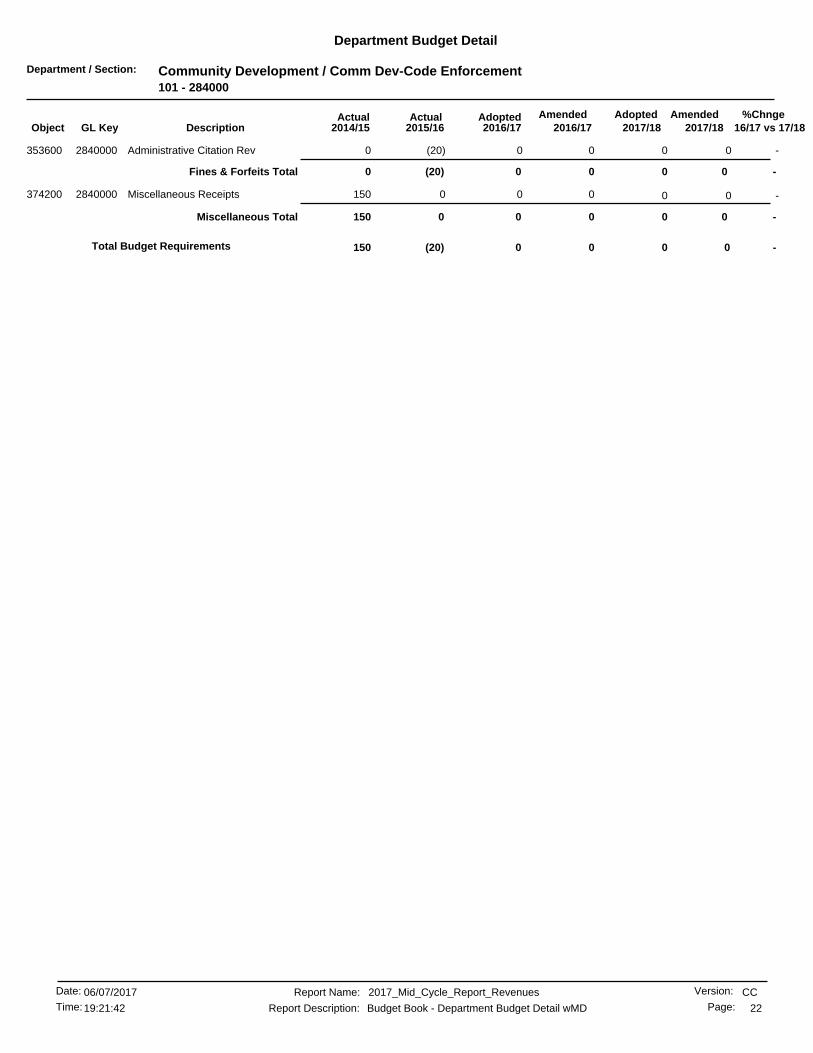
Department / Section: Community Development / Comm Dev-Code Enforcement101 - 284000
Department Budget Detail
%Chnge16/17 vs 17/182017/182017/18
AmendedAdoptedAdopted2016/17
AmendedActualActual2016/172015/162014/15GL KeyObject Description
-0 00(20)0Administrative Citation Rev2840000353600 0
-0 0Fines & Forfeits Total 00(20)0
-0 000150Miscellaneous Receipts2840000374200 0
-0 0Miscellaneous Total 000150
-00 00(20)Total Budget Requirements 150
CCReport Name: 2017_Mid_Cycle_Report_Revenues
Report Description: Budget Book - Department Budget Detail wMD
06/07/2017Date:
Time: 22
Version:
Page:19:21:42

Department / Section: Community Development / CD-Property Services101 - 284500
Department Budget Detail
%Chnge16/17 vs 17/182017/182017/18
AmendedAdoptedAdopted2016/17
AmendedActualActual2016/172015/162014/15GL KeyObject Description
-0 00124150Miscellaneous Receipts2845000374200 0
-0 0010,00003615 Main Street9894900374200 0
-0 0Miscellaneous Total 0010,124150
-00 0010,124Total Budget Requirements 150
CCReport Name: 2017_Mid_Cycle_Report_Revenues
Report Description: Budget Book - Department Budget Detail wMD
06/07/2017Date:
Time: 23
Version:
Page:19:21:42

Department / Section: Police / Police-Office of the Chief101 - 310000
Department Budget Detail
%Chnge16/17 vs 17/182017/182017/18
AmendedAdoptedAdopted2016/17
AmendedActualActual2016/172015/162014/15GL KeyObject Description
-0 00377,733(31,860)Asset Forfeiture-DOJ-clearing9129900331100 0
-0 0083,156(26)Asset Forfeiture-Treas-clrng9129910331100 0
-0 00117,871(521,566)Asset Forfeiture-State-clrng9129920334100 0
-0 0008,000Get Home Safe Program Grant9886000339000 0
-0 0Intergovernmental Total 00578,761(545,453)
-00 00578,761Total Budget Requirements (545,453)
CCReport Name: 2017_Mid_Cycle_Report_Revenues
Report Description: Budget Book - Department Budget Detail wMD
06/07/2017Date:
Time: 24
Version:
Page:19:21:42

Department / Section: Police / Police-Community Svcs Bureau101 - 310100
Department Budget Detail
%Chnge16/17 vs 17/182017/182017/18
AmendedAdoptedAdopted2016/17
AmendedActualActual2016/172015/162014/15GL KeyObject Description
-0 00(1,014)7,056OTS CarFit Program9151800331100 0
-0 000(52)CHP Every 15 Minutes 20149331500334100 0
-0 002604,650CHP Every 15 Minutes 20159333000334100 0
-0 005,3220CHP Every 15 Minutes 20169334400334100 0
-00 011,779220334100 Bicycle & Pedestrian Safety Ed9334700 0
-0 06,00000CHP Every 15 Minutes 20179335700334100 0
-0 0Intergovernmental Total 017,7794,78811,653
-0 0017,7794,78811,653Total Budget Requirements
(100.0) %00 017,7794,788Total Budget Requirements 11,653
CCReport Name: 2017_Mid_Cycle_Report_Revenues
Report Description: Budget Book - Department Budget Detail wMD
06/07/2017Date:
Time: 25
Version:
Page:19:21:42

Department / Section: Police / Police-Support Services101 - 310200
Department Budget Detail
%Chnge16/17 vs 17/182017/182017/18
AmendedAdoptedAdopted2016/17
AmendedActualActual2016/172015/162014/15GL KeyObject Description
-0 0150,00000Body-Worn Camera9261300331300 0
-0 0Intergovernmental Total 0150,00000
(100.0) %00 0150,0000Total Budget Requirements 0
CCReport Name: 2017_Mid_Cycle_Report_Revenues
Report Description: Budget Book - Department Budget Detail wMD
06/07/2017Date:
Time: 26
Version:
Page:19:21:42

Department / Section: Police / Police-Administrative Services101 - 310500
Department Budget Detail
%Chnge16/17 vs 17/182017/182017/18
AmendedAdoptedAdopted2016/17
AmendedActualActual2016/172015/162014/15GL KeyObject Description
-0 0000Secure Our Schools 20119142300331100 0
-0 00850134,123JAG-20129144700331100 0
-0 0Intergovernmental Total 00850134,123
-0 000283,925STATE COPS 13/14-AB32299330100374510 0
-0 0080,329458,649STATE COPS 14/15-AB32299331700374510 0
-0 00488,43138,367STATE COPS 15/16-AB32299333100374510 0
-0 0639,35700STATE COPS 16/17-AB32299334500374510 0
-0 0500,04900STATE COPS 17/18-AB32299335600374510 0
-0 0Miscellaneous Total 01,139,406568,761780,942
-0 001,139,406569,611915,066Total Budget Requirements
(100.0) %00 01,139,406569,611Total Budget Requirements 915,066
CCReport Name: 2017_Mid_Cycle_Report_Revenues
Report Description: Budget Book - Department Budget Detail wMD
06/07/2017Date:
Time: 27
Version:
Page:19:21:42
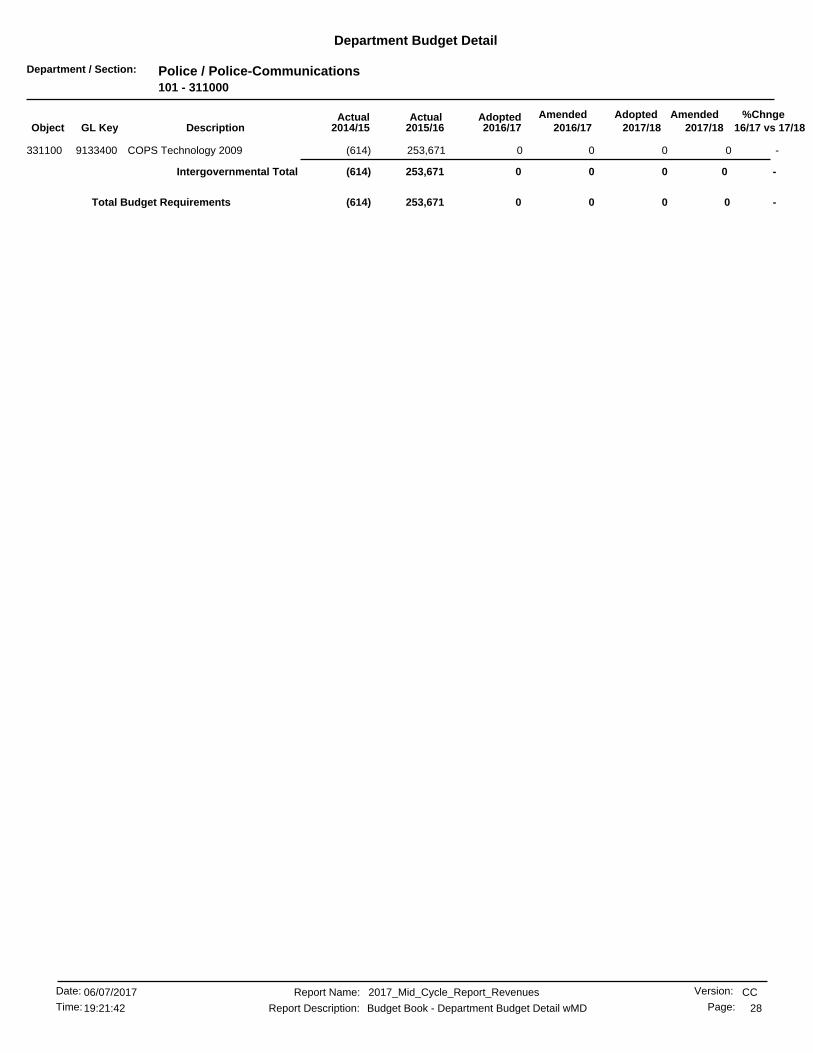
Department / Section: Police / Police-Communications101 - 311000
Department Budget Detail
%Chnge16/17 vs 17/182017/182017/18
AmendedAdoptedAdopted2016/17
AmendedActualActual2016/172015/162014/15GL KeyObject Description
-0 00253,671(614)COPS Technology 20099133400331100 0
-0 0Intergovernmental Total 00253,671(614)
-00 00253,671Total Budget Requirements (614)
CCReport Name: 2017_Mid_Cycle_Report_Revenues
Report Description: Budget Book - Department Budget Detail wMD
06/07/2017Date:
Time: 28
Version:
Page:19:21:42
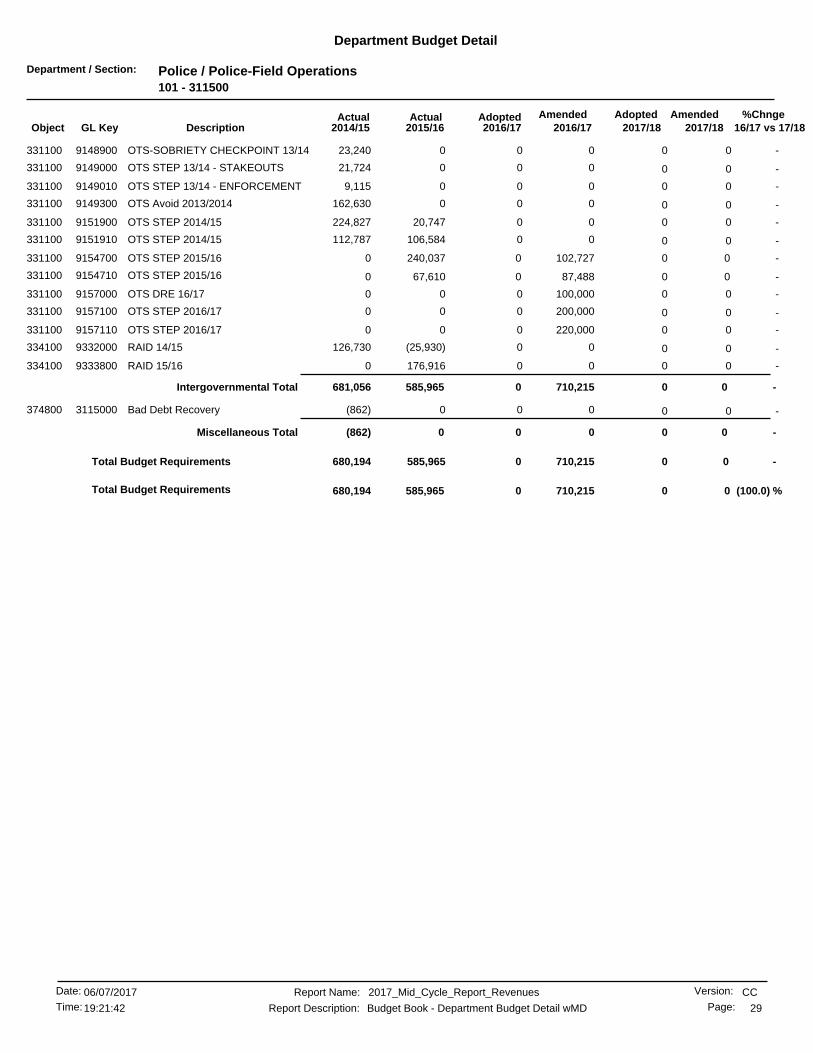
Department / Section: Police / Police-Field Operations101 - 311500
Department Budget Detail
%Chnge16/17 vs 17/182017/182017/18
AmendedAdoptedAdopted2016/17
AmendedActualActual2016/172015/162014/15GL KeyObject Description
-0 00023,240OTS-SOBRIETY CHECKPOINT 13/149148900331100 0
-0 00021,724OTS STEP 13/14 - STAKEOUTS9149000331100 0
-0 0009,115OTS STEP 13/14 - ENFORCEMENT9149010331100 0
-0 000162,630OTS Avoid 2013/20149149300331100 0
-0 0020,747224,827OTS STEP 2014/159151900331100 0
-0 00106,584112,787OTS STEP 2014/159151910331100 0
-00 0102,727240,037331100 OTS STEP 2015/169154700 0
-00 087,48867,610331100 OTS STEP 2015/169154710 0
-0 0100,00000OTS DRE 16/179157000331100 0
-0 0200,00000OTS STEP 2016/179157100331100 0
-0 0220,00000OTS STEP 2016/179157110331100 0
-0 00(25,930)126,730RAID 14/159332000334100 0
-0 00176,9160RAID 15/169333800334100 0
-0 0Intergovernmental Total 0710,215585,965681,056
-0 000(862)Bad Debt Recovery3115000374800 0
-0 0Miscellaneous Total 000(862)
-0 00710,215585,965680,194Total Budget Requirements
(100.0) %00 0710,215585,965Total Budget Requirements 680,194
CCReport Name: 2017_Mid_Cycle_Report_Revenues
Report Description: Budget Book - Department Budget Detail wMD
06/07/2017Date:
Time: 29
Version:
Page:19:21:42
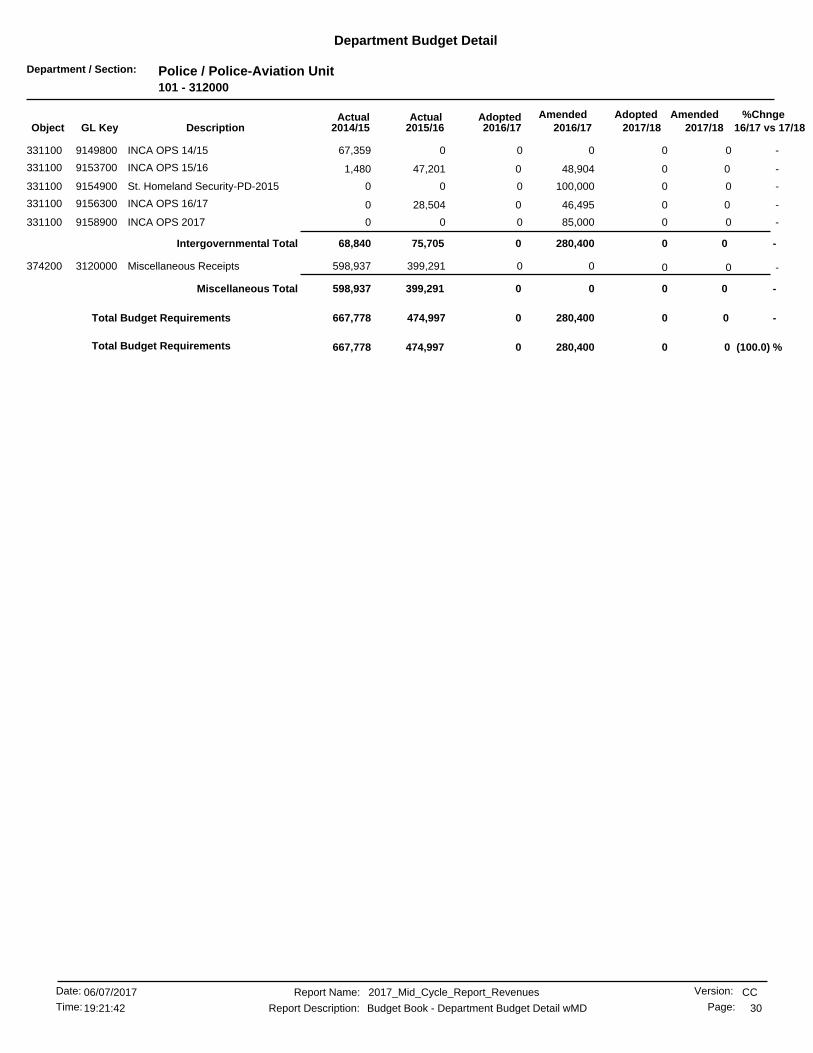
Department / Section: Police / Police-Aviation Unit101 - 312000
Department Budget Detail
%Chnge16/17 vs 17/182017/182017/18
AmendedAdoptedAdopted2016/17
AmendedActualActual2016/172015/162014/15GL KeyObject Description
-0 00067,359INCA OPS 14/159149800331100 0
-00 048,90447,201331100 INCA OPS 15/169153700 1,480
-0 0100,00000St. Homeland Security-PD-20159154900331100 0
-00 046,49528,504331100 INCA OPS 16/179156300 0
-0 085,00000INCA OPS 20179158900331100 0
-0 0Intergovernmental Total 0280,40075,70568,840
-0 00399,291598,937Miscellaneous Receipts3120000374200 0
-0 0Miscellaneous Total 00399,291598,937
-0 00280,400474,997667,778Total Budget Requirements
(100.0) %00 0280,400474,997Total Budget Requirements 667,778
CCReport Name: 2017_Mid_Cycle_Report_Revenues
Report Description: Budget Book - Department Budget Detail wMD
06/07/2017Date:
Time: 30
Version:
Page:19:21:42

Department / Section: Police / Police-Special Operations101 - 312500
Department Budget Detail
%Chnge16/17 vs 17/182017/182017/18
AmendedAdoptedAdopted2016/17
AmendedActualActual2016/172015/162014/15GL KeyObject Description
-00 021,61410,441331100 Safe Routes,2010-20129137400 1,273
-00 01,422(1,422)331100 DUI Youth Safety,2010-20119137800 0
-0 00(165)0CHP Every 15 Minutes 20139146900331100 0
-0 00011,002ATF GUN/GANG TASK 14/159149700331100 0
-0 00(0)40,081St. Homeland Security-PD-20139150400331100 0
-0 00023,445US Marshal Fugitive Task Force9151000331100 0
-0 00079,303St. Homeland Security-PD-20149152200331100 0
-00 014,2812,662331100 ATF GUN/GANG TASK 15/169153300 11,598
-0 0045,07454,925US Marshal Fugitive TF 15/169153400331100 0
-00 013,75486,245331100 US Marshal Fugitive TF 16/179156100 0
-00 08,33021,669331100 ATF GUN/GANG TASK 16/179156700 0
-0 030,00000ATF GUN/GANG TASK 20179158800331100 0
-0 080,00000US Marshal Fugitive TF 20179159200331100 0
-0 0003,121RAID 13/149330900334100 0
-00 027,47714,018334100 ARCCOPS-PACT Funds 15/169334600 0
-0 0144,60400RAID 16/179335200334100 0
-0 000180,676ARCCOPS-PACT Funds FY 13/149879300339000 0
-0 00051,472RCP-PACT Funds FY 13/149879400339000 0
-0 00215,0000PACT-Riv County Prob 15/169895000339000 0
-0 0Intergovernmental Total 0341,485393,522456,901
-0 00341,485393,522456,901Total Budget Requirements
(100.0) %00 0341,485393,522Total Budget Requirements 456,901
CCReport Name: 2017_Mid_Cycle_Report_Revenues
Report Description: Budget Book - Department Budget Detail wMD
06/07/2017Date:
Time: 31
Version:
Page:19:21:42

Department / Section: Police / Police-Central Investigations101 - 313000
Department Budget Detail
%Chnge16/17 vs 17/182017/182017/18
AmendedAdoptedAdopted2016/17
AmendedActualActual2016/172015/162014/15GL KeyObject Description
-0 0094,4873,555JAG-20139149100331100 0
-0 0004,300IRAT 14/159150100331100 0
-00 089,82732,610331100 JAG-20149151500 66,061
-00 06,975(1,735)331100 IRAT 15/169153500 12,134
-00 050,32939,009331100 JAG-20159154300 0
-00 07,25510,292331100 IRAT 16/179156500 0
-0 0429,94200JAG-20169157300331100 0
-0 017,75300IRAT 20179159100331100 0
-00 0408,4462,984339000 2015 Sexual Assault Kit Backlg9892400 0
-0 0Intergovernmental Total 01,010,529177,64886,051
-0 001,010,529177,64886,051Total Budget Requirements
(100.0) %00 01,010,529177,648Total Budget Requirements 86,051
CCReport Name: 2017_Mid_Cycle_Report_Revenues
Report Description: Budget Book - Department Budget Detail wMD
06/07/2017Date:
Time: 32
Version:
Page:19:21:42
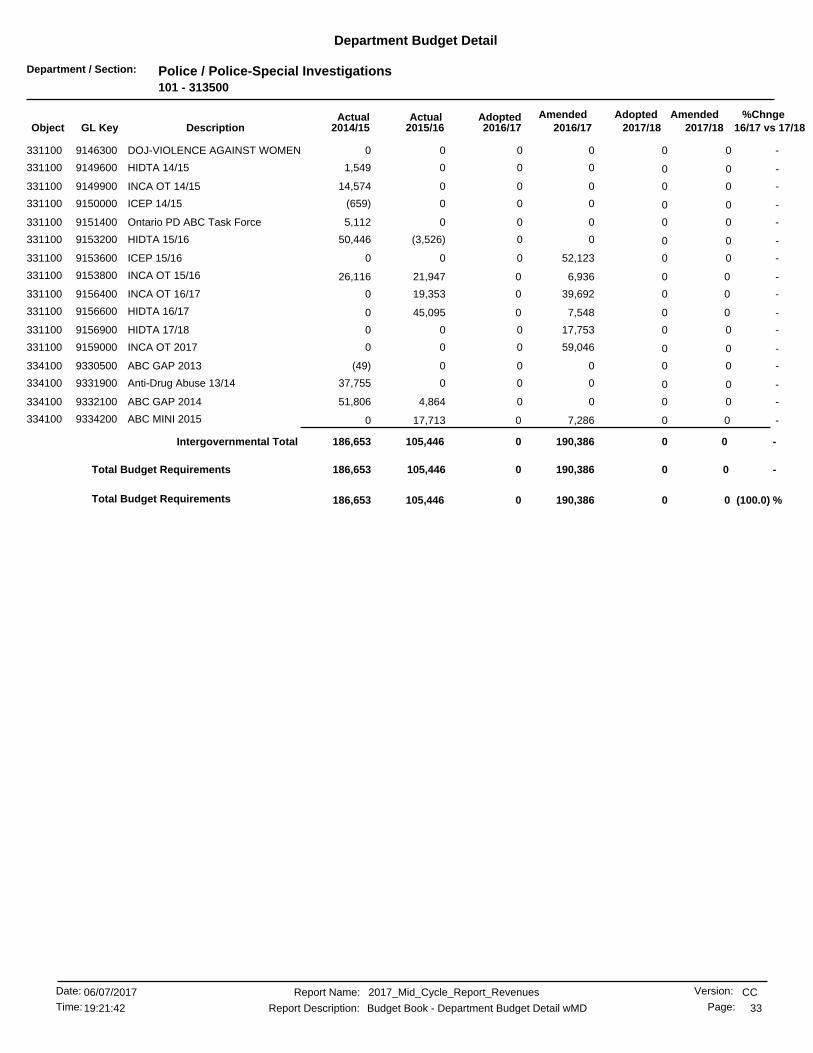
Department / Section: Police / Police-Special Investigations101 - 313500
Department Budget Detail
%Chnge16/17 vs 17/182017/182017/18
AmendedAdoptedAdopted2016/17
AmendedActualActual2016/172015/162014/15GL KeyObject Description
-0 0000DOJ-VIOLENCE AGAINST WOMEN9146300331100 0
-0 0001,549HIDTA 14/159149600331100 0
-0 00014,574INCA OT 14/159149900331100 0
-0 000(659)ICEP 14/159150000331100 0
-0 0005,112Ontario PD ABC Task Force9151400331100 0
-0 00(3,526)50,446HIDTA 15/169153200331100 0
-0 052,12300ICEP 15/169153600331100 0
-00 06,93621,947331100 INCA OT 15/169153800 26,116
-00 039,69219,353331100 INCA OT 16/179156400 0
-00 07,54845,095331100 HIDTA 16/179156600 0
-0 017,75300HIDTA 17/189156900331100 0
-0 059,04600INCA OT 20179159000331100 0
-0 000(49)ABC GAP 20139330500334100 0
-0 00037,755Anti-Drug Abuse 13/149331900334100 0
-0 004,86451,806ABC GAP 20149332100334100 0
-00 07,28617,713334100 ABC MINI 20159334200 0
-0 0Intergovernmental Total 0190,386105,446186,653
-0 00190,386105,446186,653Total Budget Requirements
(100.0) %00 0190,386105,446Total Budget Requirements 186,653
CCReport Name: 2017_Mid_Cycle_Report_Revenues
Report Description: Budget Book - Department Budget Detail wMD
06/07/2017Date:
Time: 33
Version:
Page:19:21:42

Department / Section: Police / COPS Hiring Grant101 - 315010
Department Budget Detail
%Chnge16/17 vs 17/182017/182017/18
AmendedAdoptedAdopted2016/17
AmendedActualActual2016/172015/162014/15GL KeyObject Description
-00 01,130,584486,460331100 COPS Hiring Grant9137500 693,372
-0 0Intergovernmental Total 01,130,584486,460693,372
-0 001,130,584486,460693,372Total Budget Requirements
(100.0) %00 01,130,584486,460Total Budget Requirements 693,372
CCReport Name: 2017_Mid_Cycle_Report_Revenues
Report Description: Budget Book - Department Budget Detail wMD
06/07/2017Date:
Time: 34
Version:
Page:19:21:42

Department / Section: Fire / Fire-Administration101 - 350000
Department Budget Detail
%Chnge16/17 vs 17/182017/182017/18
AmendedAdoptedAdopted2016/17
AmendedActualActual2016/172015/162014/15GL KeyObject Description
-0 001,0000Rotary Club Donation9890500374200 0
-0 0Miscellaneous Total 001,0000
-00 001,000Total Budget Requirements 0
CCReport Name: 2017_Mid_Cycle_Report_Revenues
Report Description: Budget Book - Department Budget Detail wMD
06/07/2017Date:
Time: 35
Version:
Page:19:21:42

Department / Section: Fire / Fire-Operations101 - 351000
Department Budget Detail
%Chnge16/17 vs 17/182017/182017/18
AmendedAdoptedAdopted2016/17
AmendedActualActual2016/172015/162014/15GL KeyObject Description
-0 000(2,448)FEMA-Hurricane Reimb 20059124500331100 0
-0 00022,729FEMA/Firefighters Asst 20129148400331100 0
-0 000540,588USAR 13/159149200331100 0
-0 0014,88514,098County-Wide HazMat (CHOG),20129151200331100 0
-0 00342,138168,502Asst to Firefighters 2013-FEMA9151300331100 0
-00 09,030595,078331100 USAR 2014/20169151600 641,522
-0 0060,5247,139County-Wide HazMat (CHOG),20149152400331100 0
-0 00874,7510Asst to Firefighters 2014-FEMA9154100331100 0
-00 0360,591759,468331100 USAR 20159154400 0
-0 067,00000County-Wide HazMat (CHOG),20159155200331100 0
-0 01,269,08200USAR 20169156800331100 0
-0 049,15100USAR 2015 (A)9158000331100 0
-0 067,00000County-Wide HazMat (CHOG),20169159600331100 0
-0 0002,000FM Global Fire Prevention Grnt9887900339000 0
-0 0Intergovernmental Total 01,821,8542,646,8461,394,132
-0 000(1,860)Bad Debt Recovery3510000374800 0
-0 0Miscellaneous Total 000(1,860)
-0 001,821,8542,646,8461,392,271Total Budget Requirements
(100.0) %00 01,821,8542,646,846Total Budget Requirements 1,392,271
CCReport Name: 2017_Mid_Cycle_Report_Revenues
Report Description: Budget Book - Department Budget Detail wMD
06/07/2017Date:
Time: 36
Version:
Page:19:21:42

Department / Section: Fire / Fire-Operations-Mutual Aid101 - 351020
Department Budget Detail
%Chnge16/17 vs 17/182017/182017/18
AmendedAdoptedAdopted2016/17
AmendedActualActual2016/172015/162014/15GL KeyObject Description
(27.7) %900,000650,000 650,000650,0002,157,995339000 Revenue from Other Agencies3510200 0
(27.7) %900,000650,000650,000 650,000Intergovernmental Total 2,157,9950
(27.7) %650,000 900,000650,000650,0002,157,9950Total Budget Requirements
CCReport Name: 2017_Mid_Cycle_Report_Revenues
Report Description: Budget Book - Department Budget Detail wMD
06/07/2017Date:
Time: 37
Version:
Page:19:21:42

Department / Section: Fire / Fire-Special Services101 - 351500
Department Budget Detail
%Chnge16/17 vs 17/182017/182017/18
AmendedAdoptedAdopted2016/17
AmendedActualActual2016/172015/162014/15GL KeyObject Description
-0 000(183)Emerg Mgmnt Perf Grant 20139149400331100 0
-0 00069,711St. Homeland Security-OES-20139150500331100 0
-0 00(86)70,832Emerg Mgmnt Perf Grant 20149152000331100 0
-0 0064,6116,179St Homeland Security-OES-20149152300331100 0
-00 041,08692,550331100 St Homeland Security-OES-20159155000 0
-00 09,19554,596331100 Emerg Mgmnt Perf Grant 20159155100 0
-0 077,61600Emerg Mgmnt Perf Grant 20169158200331100 0
-0 048,10900St Homeland Security-OES-20169159700331100 0
-0 0Intergovernmental Total 0176,007211,671146,539
-0 00176,007211,671146,539Total Budget Requirements
(100.0) %00 0176,007211,671Total Budget Requirements 146,539
CCReport Name: 2017_Mid_Cycle_Report_Revenues
Report Description: Budget Book - Department Budget Detail wMD
06/07/2017Date:
Time: 38
Version:
Page:19:21:42

Department / Section: Fire / Fire-Training101 - 352000
Department Budget Detail
%Chnge16/17 vs 17/182017/182017/18
AmendedAdoptedAdopted2016/17
AmendedActualActual2016/172015/162014/15GL KeyObject Description
-0 068,24200Rancho Santiago ISA9891700339000 0
-0 0Intergovernmental Total 068,24200
-00 0(13,968)25,000374200 CFFJAC Firefighter Apprent.9773400 35,000
-0 0Miscellaneous Total 0(13,968)25,00035,000
-0 0054,27325,00035,000Total Budget Requirements
(100.0) %00 054,27325,000Total Budget Requirements 35,000
CCReport Name: 2017_Mid_Cycle_Report_Revenues
Report Description: Budget Book - Department Budget Detail wMD
06/07/2017Date:
Time: 39
Version:
Page:19:21:42
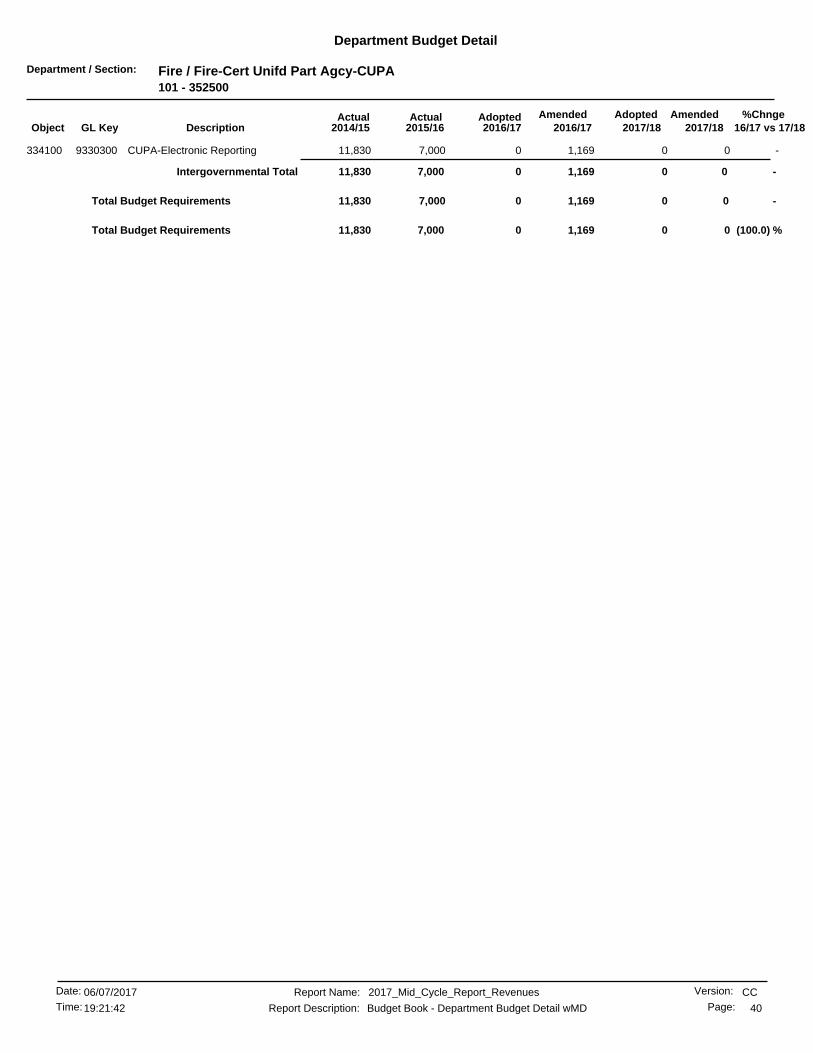
Department / Section: Fire / Fire-Cert Unifd Part Agcy-CUPA101 - 352500
Department Budget Detail
%Chnge16/17 vs 17/182017/182017/18
AmendedAdoptedAdopted2016/17
AmendedActualActual2016/172015/162014/15GL KeyObject Description
-00 01,1697,000334100 CUPA-Electronic Reporting9330300 11,830
-0 0Intergovernmental Total 01,1697,00011,830
-0 001,1697,00011,830Total Budget Requirements
(100.0) %00 01,1697,000Total Budget Requirements 11,830
CCReport Name: 2017_Mid_Cycle_Report_Revenues
Report Description: Budget Book - Department Budget Detail wMD
06/07/2017Date:
Time: 40
Version:
Page:19:21:42
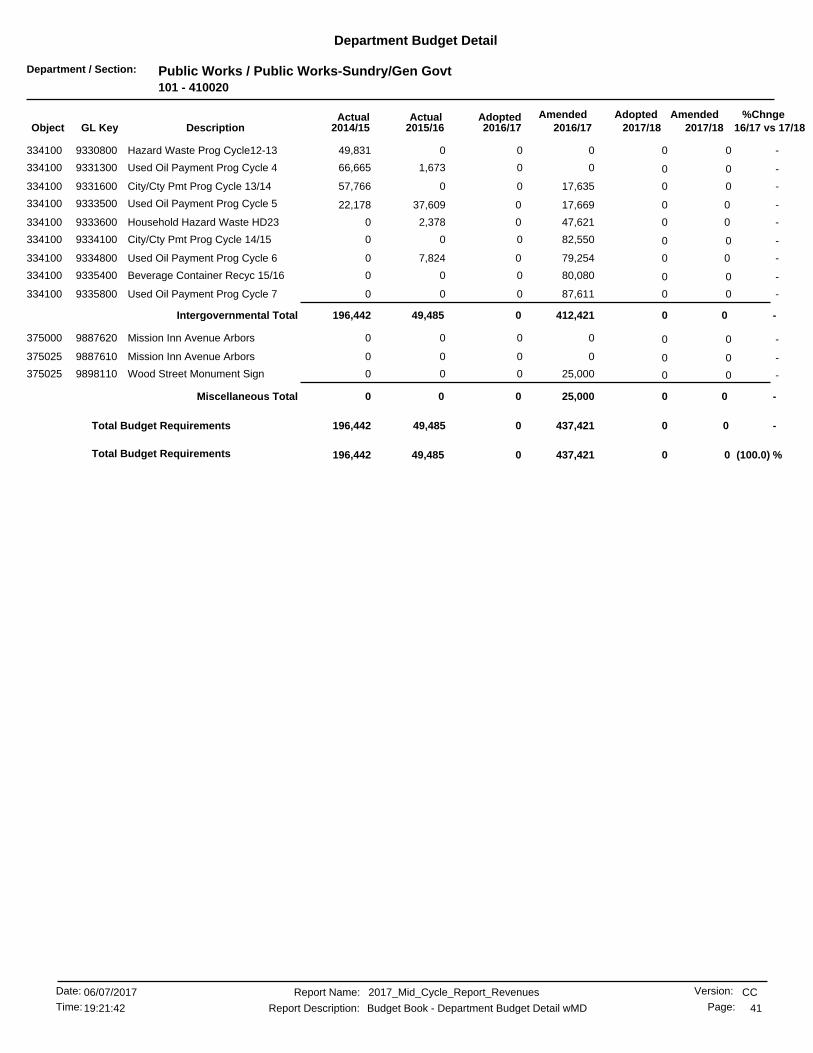
Department / Section: Public Works / Public Works-Sundry/Gen Govt101 - 410020
Department Budget Detail
%Chnge16/17 vs 17/182017/182017/18
AmendedAdoptedAdopted2016/17
AmendedActualActual2016/172015/162014/15GL KeyObject Description
-0 00049,831Hazard Waste Prog Cycle12-139330800334100 0
-0 001,67366,665Used Oil Payment Prog Cycle 49331300334100 0
-0 017,635057,766City/Cty Pmt Prog Cycle 13/149331600334100 0
-00 017,66937,609334100 Used Oil Payment Prog Cycle 59333500 22,178
-00 047,6212,378334100 Household Hazard Waste HD239333600 0
-0 082,55000City/Cty Pmt Prog Cycle 14/159334100334100 0
-00 079,2547,824334100 Used Oil Payment Prog Cycle 69334800 0
-0 080,08000Beverage Container Recyc 15/169335400334100 0
-0 087,61100Used Oil Payment Prog Cycle 79335800334100 0
-0 0Intergovernmental Total 0412,42149,485196,442
-0 0000Mission Inn Avenue Arbors9887620375000 0
-0 0000Mission Inn Avenue Arbors9887610375025 0
-0 025,00000Wood Street Monument Sign9898110375025 0
-0 0Miscellaneous Total 025,00000
-0 00437,42149,485196,442Total Budget Requirements
(100.0) %00 0437,42149,485Total Budget Requirements 196,442
CCReport Name: 2017_Mid_Cycle_Report_Revenues
Report Description: Budget Book - Department Budget Detail wMD
06/07/2017Date:
Time: 41
Version:
Page:19:21:42
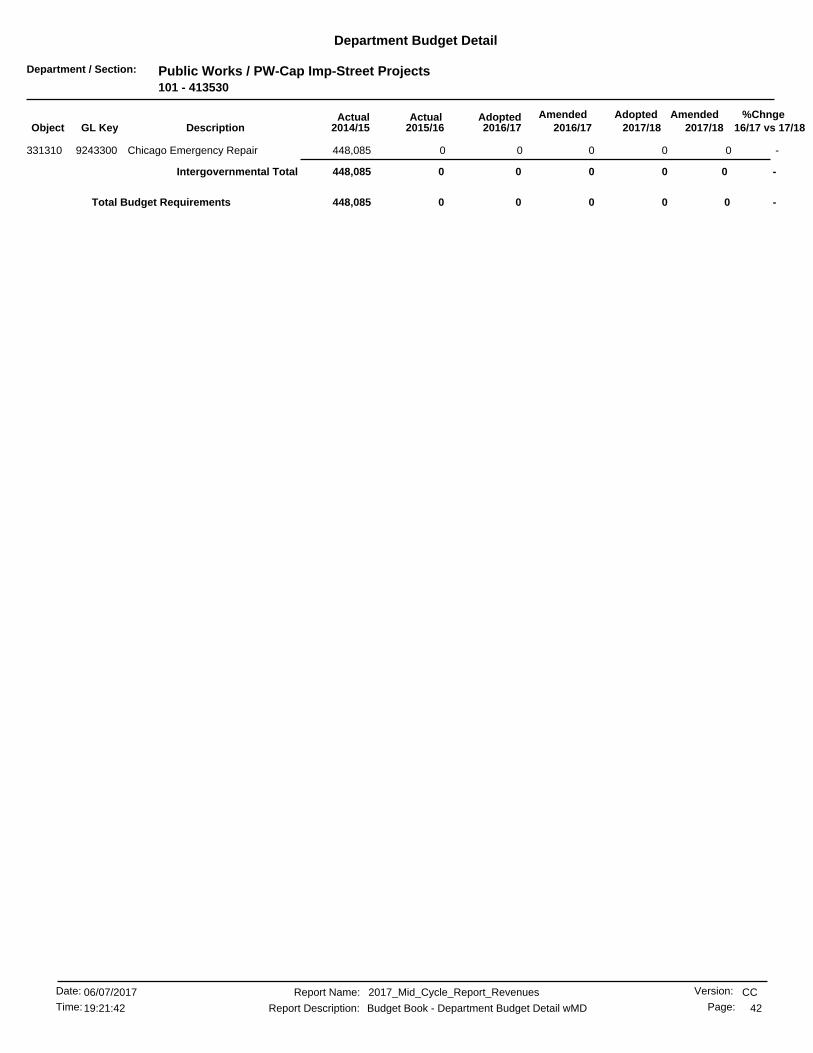
Department / Section: Public Works / PW-Cap Imp-Street Projects101 - 413530
Department Budget Detail
%Chnge16/17 vs 17/182017/182017/18
AmendedAdoptedAdopted2016/17
AmendedActualActual2016/172015/162014/15GL KeyObject Description
-0 000448,085Chicago Emergency Repair9243300331310 0
-0 0Intergovernmental Total 000448,085
-00 000Total Budget Requirements 448,085
CCReport Name: 2017_Mid_Cycle_Report_Revenues
Report Description: Budget Book - Department Budget Detail wMD
06/07/2017Date:
Time: 42
Version:
Page:19:21:42

Department / Section: Library / Library-Neighborhood Services101 - 513500
Department Budget Detail
%Chnge16/17 vs 17/182017/182017/18
AmendedAdoptedAdopted2016/17
AmendedActualActual2016/172015/162014/15GL KeyObject Description
-0 000(25)LSTA-STAYCATION STATION9148800331100 0
-0 000(35,836)Public Library Fund 2003/049316010334100 0
-0 0000Calif Lib Lit Srvcs Grnt-10/119328200334100 0
-0 000(335)Calif Lib Lit Srvcs Grnt-12/139330000334100 0
-0 0001,470Calif Lib Lit Srvcs Grnt-13/149331100334100 0
-0 0007,500California Reads 20149332400334100 0
-0 001,64617,931Calif Lib Lit Srvcs Grnt-14/159332600334100 0
-0 007864,213The American Dream Delayed9332700334100 0
-0 001,8203,179Community Gardens in Libraries9332800334100 0
-0 0049,78735,212Neighborhood Strategies 26/269332900334100 0
-00 020,8273,246334100 Calif Libr Adlt Litercy 15/169334300 0
-0 018,00000Calif Libr Adlt Litercy 16/179335100334100 0
-0 090,00000CA Libr Broadband Project9335300334100 0
-0 0000Cal Council 4 Humanities Grant9862800339000 0
-0 040,00000Carpenter Fdtn Grant-Polaris9885400339000 0
-0 07,50000Best Buy Foundation Comm Grnt9898600339000 0
-0 050000Bourns Foundation Grant9898900339000 0
-0 0Intergovernmental Total 0176,82757,28833,309
-0 00176,82757,28833,309Total Budget Requirements
(100.0) %00 0176,82757,288Total Budget Requirements 33,309
CCReport Name: 2017_Mid_Cycle_Report_Revenues
Report Description: Budget Book - Department Budget Detail wMD
06/07/2017Date:
Time: 43
Version:
Page:19:21:42

Department / Section: Parks, Recreation & Comm Svcs / Park & Rec-Administration101 - 520000
Department Budget Detail
%Chnge16/17 vs 17/182017/182017/18
AmendedAdoptedAdopted2016/17
AmendedActualActual2016/172015/162014/15GL KeyObject Description
-0 00136,52321,143HEAL Zone-PRCS Admin9877010339000 0
-0 0Intergovernmental Total 00136,52321,143
-0 001,577281Cash Over/Shortage5200000374207 0
-0 0Miscellaneous Total 001,577281
-00 00138,101Total Budget Requirements 21,425
CCReport Name: 2017_Mid_Cycle_Report_Revenues
Report Description: Budget Book - Department Budget Detail wMD
06/07/2017Date:
Time: 44
Version:
Page:19:21:42

Department / Section: Parks, Recreation & Comm Svcs / P&R-Adm-Plan & Des-Park Proj101 - 520011
Department Budget Detail
%Chnge16/17 vs 17/182017/182017/18
AmendedAdoptedAdopted2016/17
AmendedActualActual2016/172015/162014/15GL KeyObject Description
-0 0000Arlanza EDI9227651331300 0
-00 078,197(29,408)334100 Sycamore Canyon Nature Center9330251 29,237
-0 00(252)5,000Sycamore Canyon Nature Ctr CAP9330200334300 0
-0 0008,171Syc Cyn Wildness Nature Center9406151334300 0
-0 0Intergovernmental Total 078,197(29,660)42,409
-00 07,516(16)374200 Park Land Acquisition9779251 0
-0 0Miscellaneous Total 07,516(16)0
-0 0085,714(29,677)42,409Total Budget Requirements
(100.0) %00 085,714(29,677)Total Budget Requirements 42,409
CCReport Name: 2017_Mid_Cycle_Report_Revenues
Report Description: Budget Book - Department Budget Detail wMD
06/07/2017Date:
Time: 45
Version:
Page:19:21:42
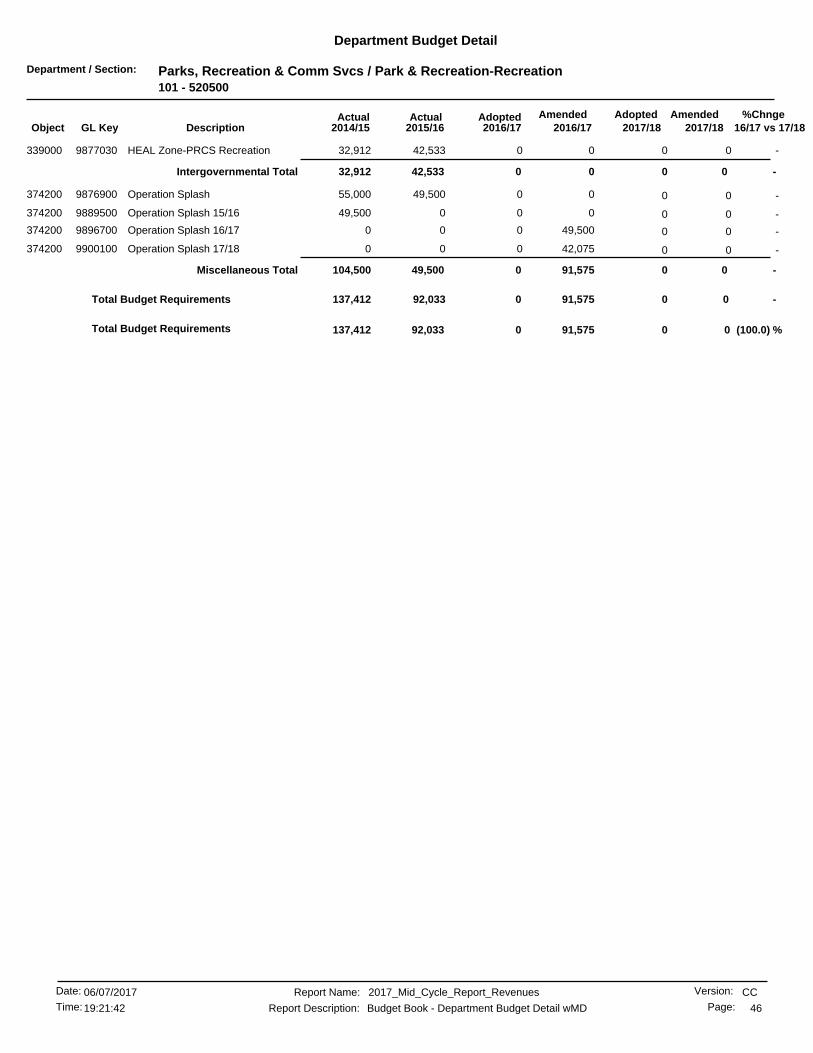
Department / Section: Parks, Recreation & Comm Svcs / Park & Recreation-Recreation101 - 520500
Department Budget Detail
%Chnge16/17 vs 17/182017/182017/18
AmendedAdoptedAdopted2016/17
AmendedActualActual2016/172015/162014/15GL KeyObject Description
-0 0042,53332,912HEAL Zone-PRCS Recreation9877030339000 0
-0 0Intergovernmental Total 0042,53332,912
-0 0049,50055,000Operation Splash9876900374200 0
-0 00049,500Operation Splash 15/169889500374200 0
-0 049,50000Operation Splash 16/179896700374200 0
-0 042,07500Operation Splash 17/189900100374200 0
-0 0Miscellaneous Total 091,57549,500104,500
-0 0091,57592,033137,412Total Budget Requirements
(100.0) %00 091,57592,033Total Budget Requirements 137,412
CCReport Name: 2017_Mid_Cycle_Report_Revenues
Report Description: Budget Book - Department Budget Detail wMD
06/07/2017Date:
Time: 46
Version:
Page:19:21:42
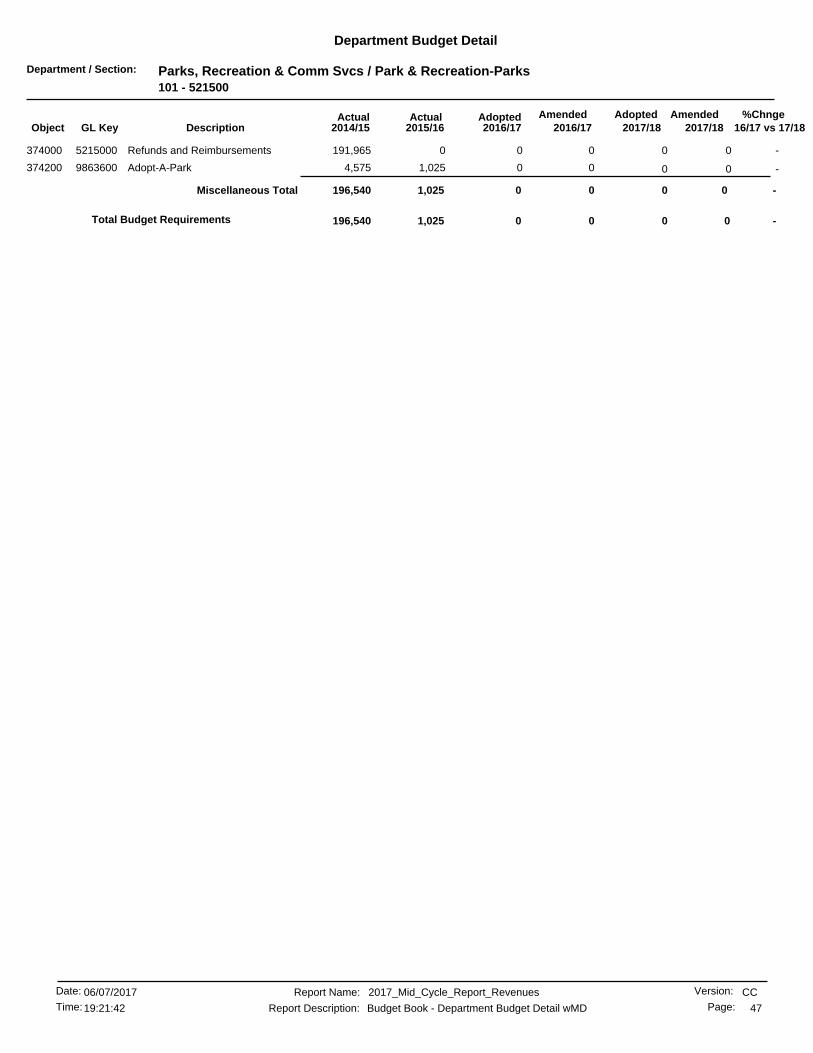
Department / Section: Parks, Recreation & Comm Svcs / Park & Recreation-Parks101 - 521500
Department Budget Detail
%Chnge16/17 vs 17/182017/182017/18
AmendedAdoptedAdopted2016/17
AmendedActualActual2016/172015/162014/15GL KeyObject Description
-0 000191,965Refunds and Reimbursements5215000374000 0
-0 001,0254,575Adopt-A-Park9863600374200 0
-0 0Miscellaneous Total 001,025196,540
-00 001,025Total Budget Requirements 196,540
CCReport Name: 2017_Mid_Cycle_Report_Revenues
Report Description: Budget Book - Department Budget Detail wMD
06/07/2017Date:
Time: 47
Version:
Page:19:21:42
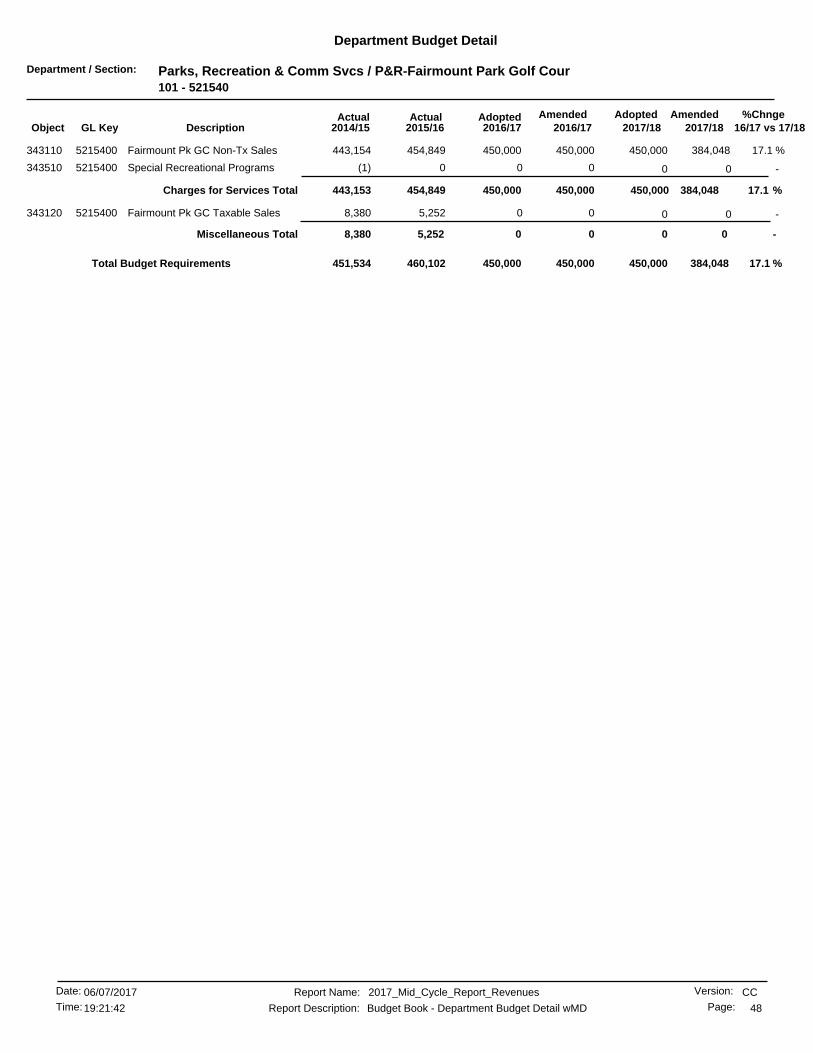
Department / Section: Parks, Recreation & Comm Svcs / P&R-Fairmount Park Golf Cour101 - 521540
Department Budget Detail
%Chnge16/17 vs 17/182017/182017/18
AmendedAdoptedAdopted2016/17
AmendedActualActual2016/172015/162014/15GL KeyObject Description
17.1 %384,048450,000 450,000450,000454,849343110 Fairmount Pk GC Non-Tx Sales5215400 443,154
-0 000(1)Special Recreational Programs5215400343510 0
17.1 %384,048450,000450,000 450,000Charges for Services Total 454,849443,153
-0 005,2528,380Fairmount Pk GC Taxable Sales5215400343120 0
-0 0Miscellaneous Total 005,2528,380
17.1 %450,000 384,048450,000450,000460,102451,534Total Budget Requirements
CCReport Name: 2017_Mid_Cycle_Report_Revenues
Report Description: Budget Book - Department Budget Detail wMD
06/07/2017Date:
Time: 48
Version:
Page:19:21:42

Department / Section: Parks, Recreation & Comm Svcs / Park & Recreation-Parks101 - 521500
Department Budget Detail
%Chnge16/17 vs 17/182017/182017/18
AmendedAdoptedAdopted2016/17
AmendedActualActual2016/172015/162014/15GL KeyObject Description
-0 093,00000Mt Rubidoux Trail Amenities-ST9895200334300 0
-0 0Intergovernmental Total 093,00000
(100.0) %00 093,0000Total Budget Requirements 0
CCReport Name: 2017_Mid_Cycle_Report_Revenues
Report Description: Budget Book - Department Budget Detail wMD
06/07/2017Date:
Time: 49
Version:
Page:19:21:42
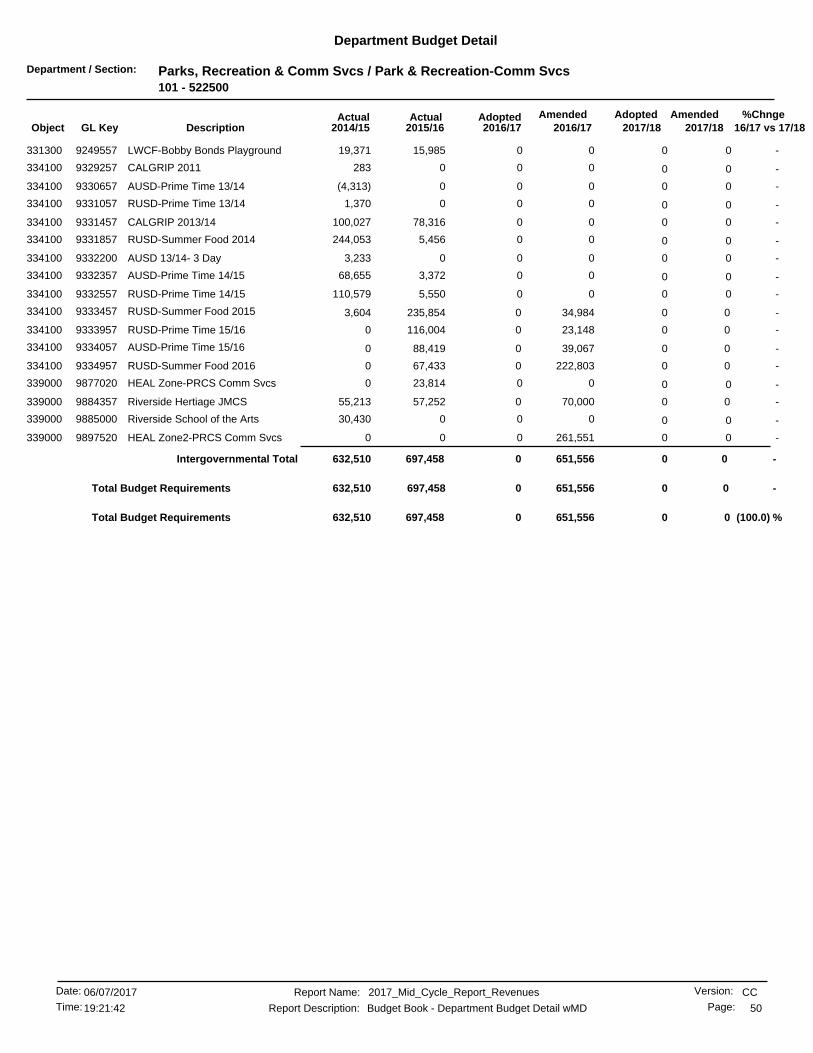
Department / Section: Parks, Recreation & Comm Svcs / Park & Recreation-Comm Svcs101 - 522500
Department Budget Detail
%Chnge16/17 vs 17/182017/182017/18
AmendedAdoptedAdopted2016/17
AmendedActualActual2016/172015/162014/15GL KeyObject Description
-0 0015,98519,371LWCF-Bobby Bonds Playground9249557331300 0
-0 000283CALGRIP 20119329257334100 0
-0 000(4,313)AUSD-Prime Time 13/149330657334100 0
-0 0001,370RUSD-Prime Time 13/149331057334100 0
-0 0078,316100,027CALGRIP 2013/149331457334100 0
-0 005,456244,053RUSD-Summer Food 20149331857334100 0
-0 0003,233AUSD 13/14- 3 Day9332200334100 0
-0 003,37268,655AUSD-Prime Time 14/159332357334100 0
-0 005,550110,579RUSD-Prime Time 14/159332557334100 0
-00 034,984235,854334100 RUSD-Summer Food 20159333457 3,604
-00 023,148116,004334100 RUSD-Prime Time 15/169333957 0
-00 039,06788,419334100 AUSD-Prime Time 15/169334057 0
-00 0222,80367,433334100 RUSD-Summer Food 20169334957 0
-0 0023,8140HEAL Zone-PRCS Comm Svcs9877020339000 0
-00 070,00057,252339000 Riverside Hertiage JMCS9884357 55,213
-0 00030,430Riverside School of the Arts9885000339000 0
-0 0261,55100HEAL Zone2-PRCS Comm Svcs9897520339000 0
-0 0Intergovernmental Total 0651,556697,458632,510
-0 00651,556697,458632,510Total Budget Requirements
(100.0) %00 0651,556697,458Total Budget Requirements 632,510
CCReport Name: 2017_Mid_Cycle_Report_Revenues
Report Description: Budget Book - Department Budget Detail wMD
06/07/2017Date:
Time: 50
Version:
Page:19:21:42

Department / Section: Museum / Museum Facilities and Operatns101 - 530500
Department Budget Detail
%Chnge16/17 vs 17/182017/182017/18
AmendedAdoptedAdopted2016/17
AmendedActualActual2016/172015/162014/15GL KeyObject Description
-0 014,62700Connect Riverside w/Nature9150900331100 0
-0 0003,000Harada House-Comm Forum-NTHP9885700339000 0
-0 0005,000Harada House-Comm Forum-RMA9885710339000 0
-0 008,3940Cal Naturalist Training Prog9894800339000 0
-0 0Intergovernmental Total 014,6278,3948,000
-0 02,00000Miscellaneous Receipts5305000374200 0
-0 0Miscellaneous Total 02,00000
-0 0016,6278,3948,000Total Budget Requirements
(100.0) %00 016,6278,394Total Budget Requirements 8,000
CCReport Name: 2017_Mid_Cycle_Report_Revenues
Report Description: Budget Book - Department Budget Detail wMD
06/07/2017Date:
Time: 51
Version:
Page:19:21:42
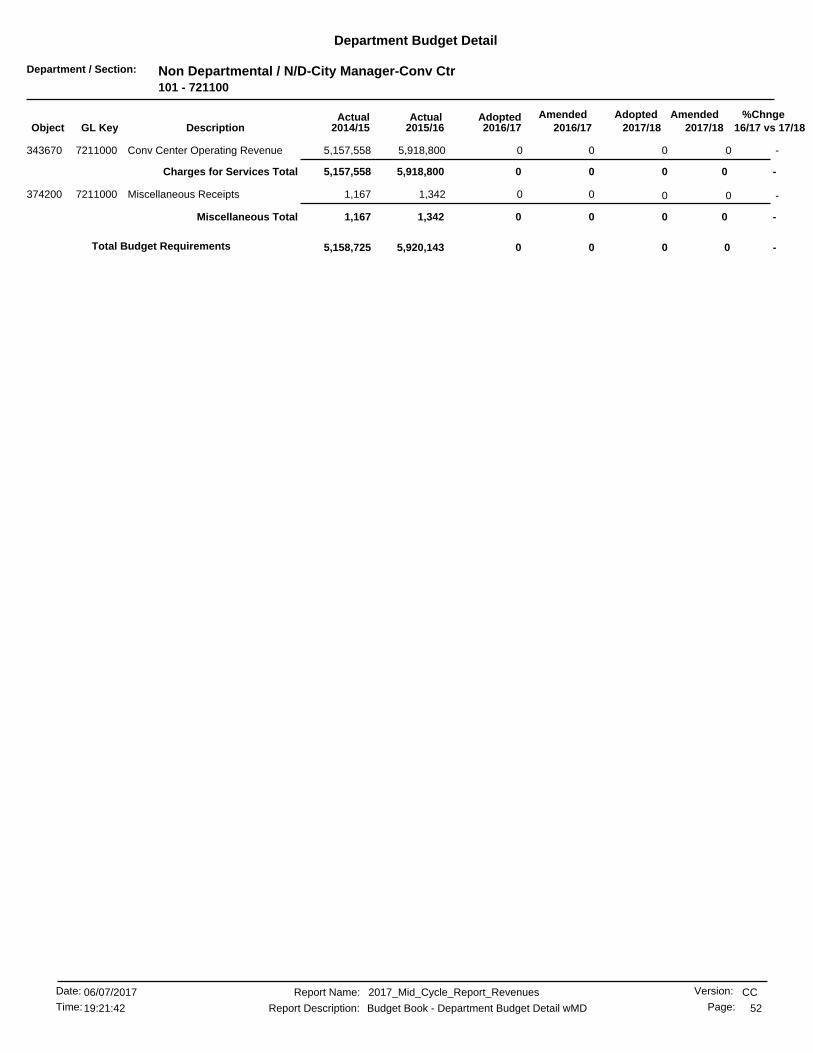
Department / Section: Non Departmental / N/D-City Manager-Conv Ctr101 - 721100
Department Budget Detail
%Chnge16/17 vs 17/182017/182017/18
AmendedAdoptedAdopted2016/17
AmendedActualActual2016/172015/162014/15GL KeyObject Description
-0 005,918,8005,157,558Conv Center Operating Revenue7211000343670 0
-0 0Charges for Services Total 005,918,8005,157,558
-0 001,3421,167Miscellaneous Receipts7211000374200 0
-0 0Miscellaneous Total 001,3421,167
-00 005,920,143Total Budget Requirements 5,158,725
CCReport Name: 2017_Mid_Cycle_Report_Revenues
Report Description: Budget Book - Department Budget Detail wMD
06/07/2017Date:
Time: 52
Version:
Page:19:21:42

Department / Section: Non Departmental / N/D-Gen Svs-Magnolia Property101 - 722200
Department Budget Detail
%Chnge16/17 vs 17/182017/182017/18
AmendedAdoptedAdopted2016/17
AmendedActualActual2016/172015/162014/15GL KeyObject Description
(4.5) %734,380701,000 710,000701,000701,949373100 Land and Building Rental7222000 710,225
(4.5) %734,380701,000701,000 710,000Miscellaneous Total 701,949710,225
(4.5) %701,000 734,380710,000701,000701,949710,225Total Budget Requirements
CCReport Name: 2017_Mid_Cycle_Report_Revenues
Report Description: Budget Book - Department Budget Detail wMD
06/07/2017Date:
Time: 53
Version:
Page:19:21:42

Department / Section: Non Departmental / N/D-Gen Svs-Convention Center101 - 722230
Department Budget Detail
%Chnge16/17 vs 17/182017/182017/18
AmendedAdoptedAdopted2016/17
AmendedActualActual2016/172015/162014/15GL KeyObject Description
-5,338,690 05,338,69000Conv Center Operating Revenue7222300343670 5,476,982
-5,338,690 0Charges for Services Total 5,476,9825,338,69000
2.5 %05,338,690 5,476,9825,338,6900Total Budget Requirements 0
CCReport Name: 2017_Mid_Cycle_Report_Revenues
Report Description: Budget Book - Department Budget Detail wMD
06/07/2017Date:
Time: 54
Version:
Page:19:21:42

Department / Section: Non Departmental / N/D-Pub Works-Landscape Dist101 - 724110
Department Budget Detail
%Chnge16/17 vs 17/182017/182017/18
AmendedAdoptedAdopted2016/17
AmendedActualActual2016/172015/162014/15GL KeyObject Description
-092,521 92,52192,52184,968363001 Highlander Lndscp Maint Area9716820 84,111
-0483,616 473,408483,616322,802363001 Riverwalk Landscape Maint Dist9760340 321,847
-576,137 0Special Assessments Total 565,929576,137407,770405,959
-576,137 0565,929576,137407,770405,959Total Budget Requirements
(1.7) %0576,137 565,929576,137407,770Total Budget Requirements 405,959
CCReport Name: 2017_Mid_Cycle_Report_Revenues
Report Description: Budget Book - Department Budget Detail wMD
06/07/2017Date:
Time: 55
Version:
Page:19:21:42
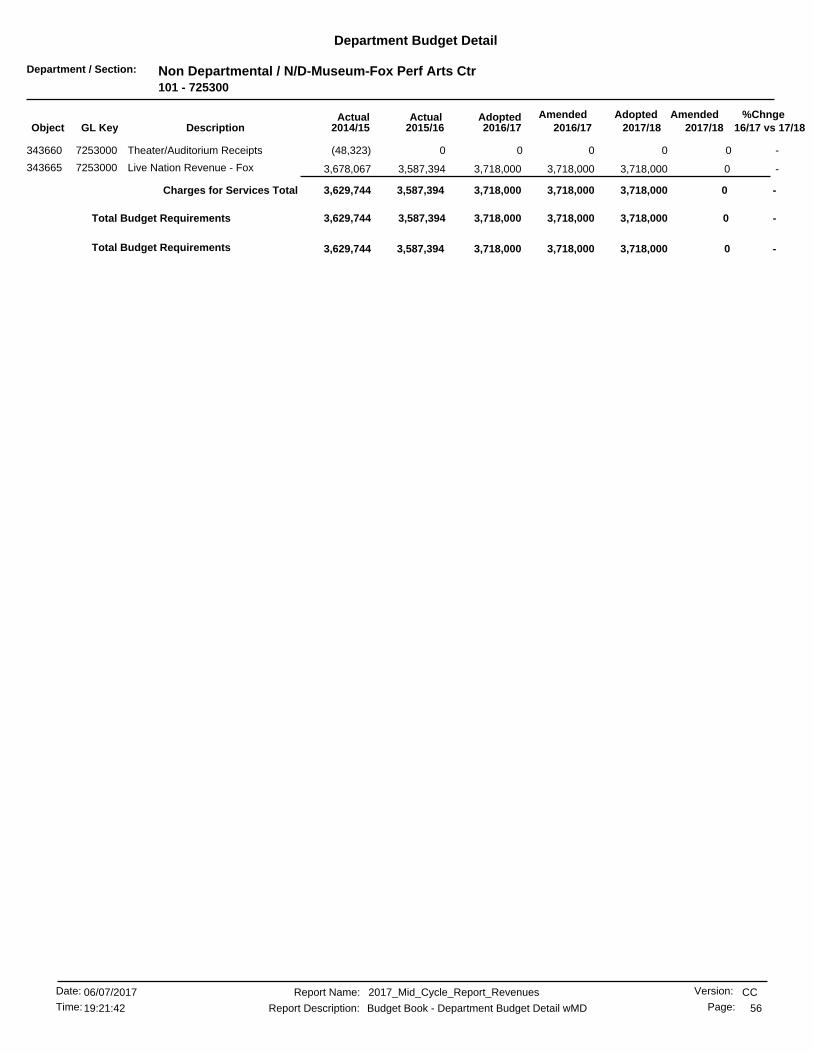
Department / Section: Non Departmental / N/D-Museum-Fox Perf Arts Ctr101 - 725300
Department Budget Detail
%Chnge16/17 vs 17/182017/182017/18
AmendedAdoptedAdopted2016/17
AmendedActualActual2016/172015/162014/15GL KeyObject Description
-0 000(48,323)Theater/Auditorium Receipts7253000343660 0
-03,718,000 3,718,0003,718,0003,587,394343665 Live Nation Revenue - Fox7253000 3,678,067
-3,718,000 0Charges for Services Total 3,718,0003,718,0003,587,3943,629,744
-3,718,000 03,718,0003,718,0003,587,3943,629,744Total Budget Requirements
-03,718,000 3,718,0003,718,0003,587,394Total Budget Requirements 3,629,744
CCReport Name: 2017_Mid_Cycle_Report_Revenues
Report Description: Budget Book - Department Budget Detail wMD
06/07/2017Date:
Time: 56
Version:
Page:19:21:42

Department / Section: Non Departmental / N/D-Museum-Municipal Aud101 - 725310
Department Budget Detail
%Chnge16/17 vs 17/182017/182017/18
AmendedAdoptedAdopted2016/17
AmendedActualActual2016/172015/162014/15GL KeyObject Description
-02,000,000 2,000,0002,000,0002,219,338343666 Live Nation Revenue- Muni Aud7253100 1,750,985
-2,000,000 0Charges for Services Total 2,000,0002,000,0002,219,3381,750,985
-2,000,000 02,000,0002,000,0002,219,3381,750,985Total Budget Requirements
-02,000,000 2,000,0002,000,0002,219,338Total Budget Requirements 1,750,985
CCReport Name: 2017_Mid_Cycle_Report_Revenues
Report Description: Budget Book - Department Budget Detail wMD
06/07/2017Date:
Time: 57
Version:
Page:19:21:42
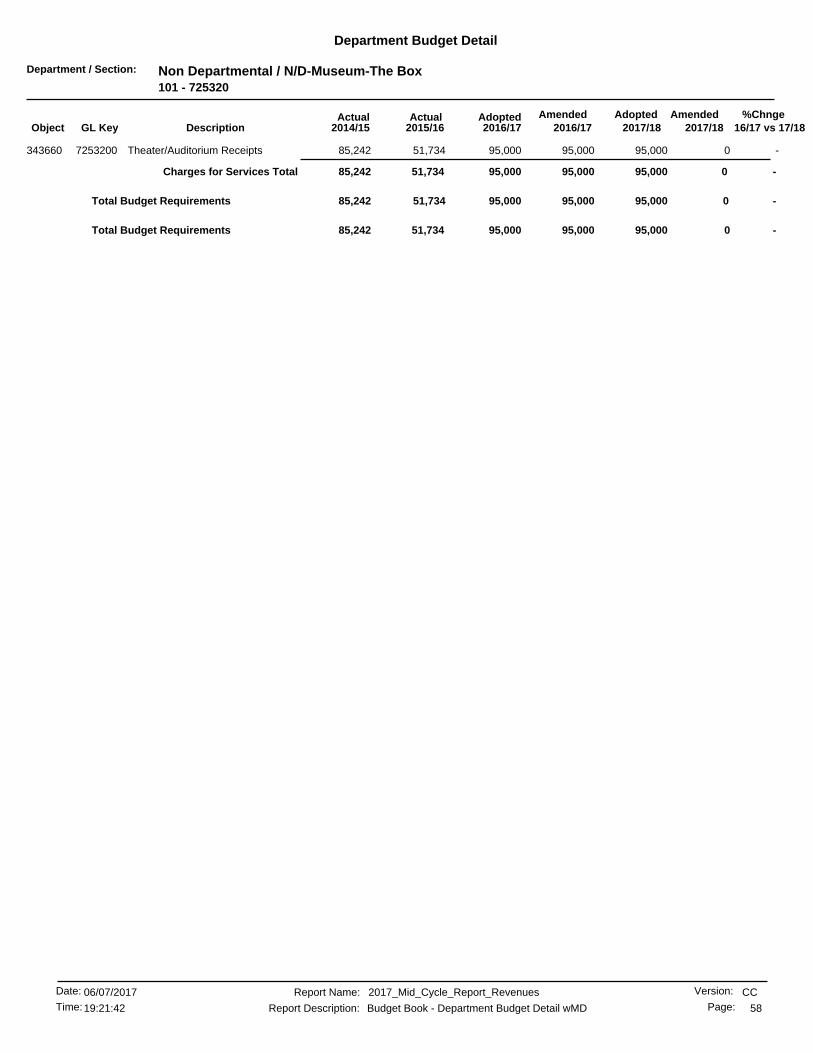
Department / Section: Non Departmental / N/D-Museum-The Box101 - 725320
Department Budget Detail
%Chnge16/17 vs 17/182017/182017/18
AmendedAdoptedAdopted2016/17
AmendedActualActual2016/172015/162014/15GL KeyObject Description
-095,000 95,00095,00051,734343660 Theater/Auditorium Receipts7253200 85,242
-95,000 0Charges for Services Total 95,00095,00051,73485,242
-95,000 095,00095,00051,73485,242Total Budget Requirements
-095,000 95,00095,00051,734Total Budget Requirements 85,242
CCReport Name: 2017_Mid_Cycle_Report_Revenues
Report Description: Budget Book - Department Budget Detail wMD
06/07/2017Date:
Time: 58
Version:
Page:19:21:42
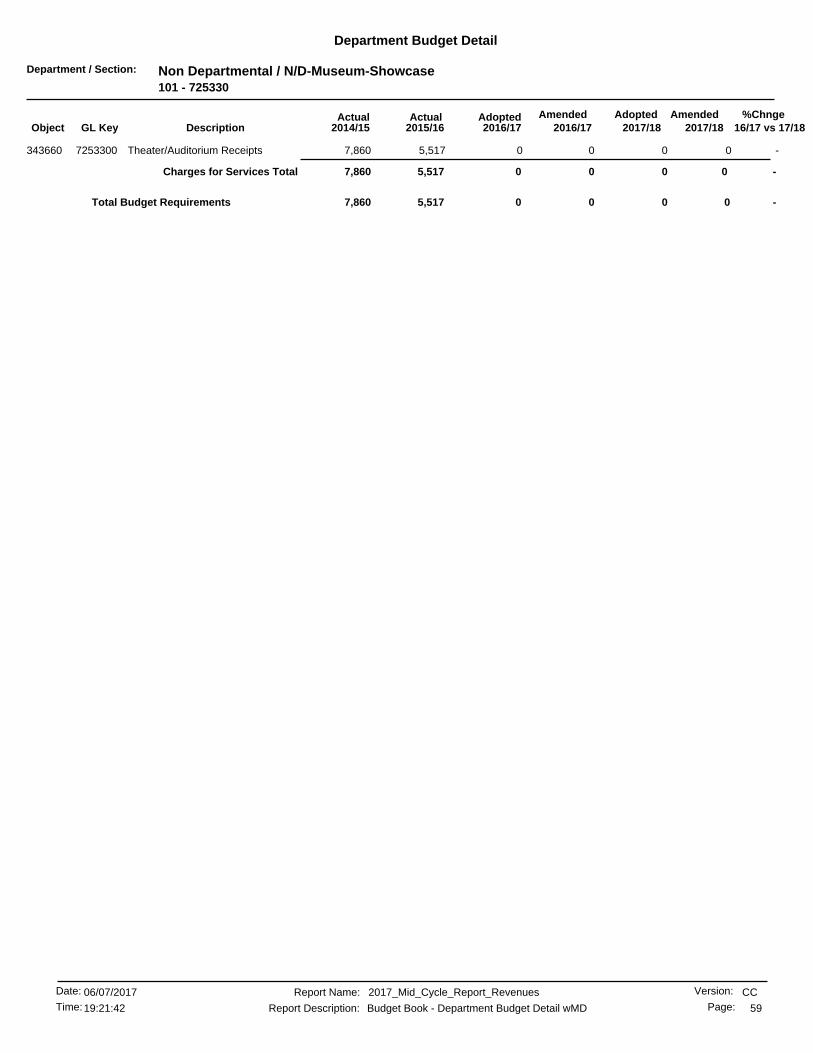
Department / Section: Non Departmental / N/D-Museum-Showcase101 - 725330
Department Budget Detail
%Chnge16/17 vs 17/182017/182017/18
AmendedAdoptedAdopted2016/17
AmendedActualActual2016/172015/162014/15GL KeyObject Description
-0 005,5177,860Theater/Auditorium Receipts7253300343660 0
-0 0Charges for Services Total 005,5177,860
-00 005,517Total Budget Requirements 7,860
CCReport Name: 2017_Mid_Cycle_Report_Revenues
Report Description: Budget Book - Department Budget Detail wMD
06/07/2017Date:
Time: 59
Version:
Page:19:21:42
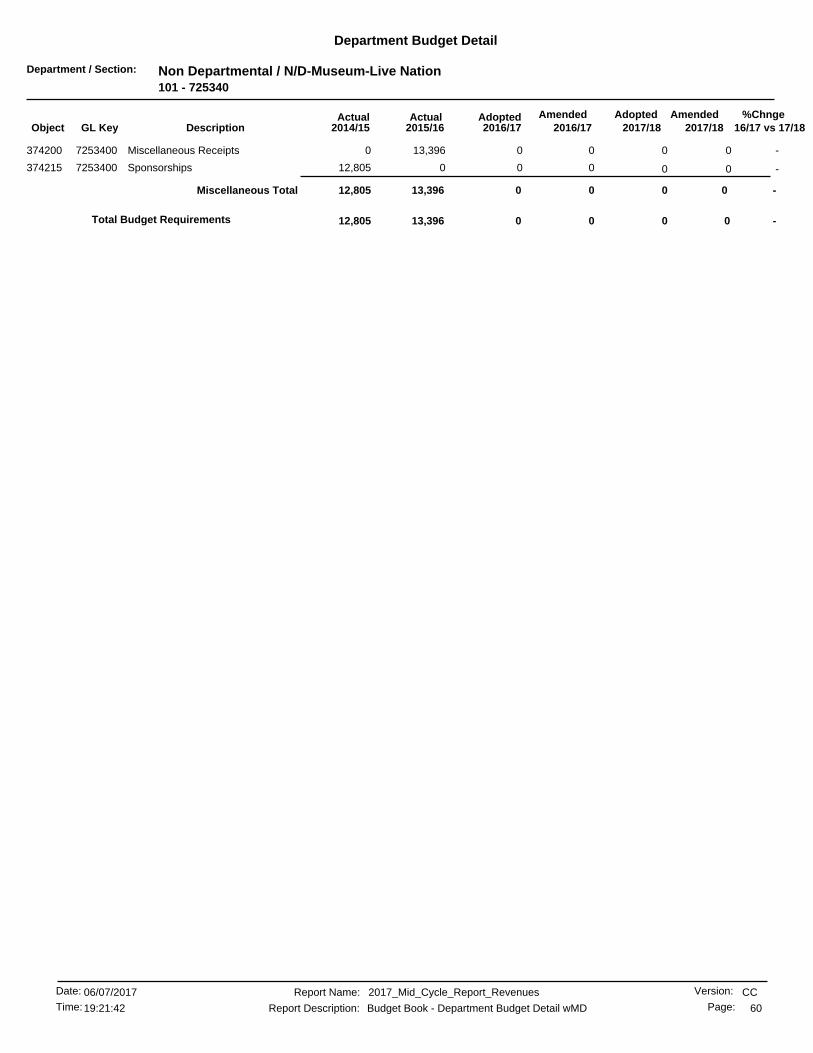
Department / Section: Non Departmental / N/D-Museum-Live Nation101 - 725340
Department Budget Detail
%Chnge16/17 vs 17/182017/182017/18
AmendedAdoptedAdopted2016/17
AmendedActualActual2016/172015/162014/15GL KeyObject Description
-0 0013,3960Miscellaneous Receipts7253400374200 0
-0 00012,805Sponsorships7253400374215 0
-0 0Miscellaneous Total 0013,39612,805
-00 0013,396Total Budget Requirements 12,805
CCReport Name: 2017_Mid_Cycle_Report_Revenues
Report Description: Budget Book - Department Budget Detail wMD
06/07/2017Date:
Time: 60
Version:
Page:19:21:42

Department / Section: Balance Sheet / Revenue / Balance Sheet / Revenue110 - 000000
Department Budget Detail
%Chnge16/17 vs 17/182017/182017/18
AmendedAdoptedAdopted2016/17
AmendedActualActual2016/172015/162014/15GL KeyObject Description
(100.0)%0 51,557,000000Measure Z Transaction/Use Tax0000110312040 0
(100.0) %0 51,557,000Taxes Total 0000
-51,557,0000 000Total Budget Requirements 0
CCReport Name: 2017_Mid_Cycle_Report_Revenues
Report Description: Budget Book - Department Budget Detail wMD
06/07/2017Date:
Time: 61
Version:
Page:19:21:42

Department / Section: Balance Sheet / Revenue / Balance Sheet / Revenue170 - 000000
Department Budget Detail
%Chnge16/17 vs 17/182017/182017/18
AmendedAdoptedAdopted2016/17
AmendedActualActual2016/172015/162014/15GL KeyObject Description
(1.7) %1,079,6721,060,926 1,079,6721,060,9261,671,592311101 Sucessor Agency-Property Taxes0000170 1,403,753
(1.7) %1,079,6721,060,9261,060,926 1,079,672Taxes Total 1,671,5921,403,753
(1.7) %1,060,926 1,079,6721,079,6721,060,9261,671,5921,403,753Total Budget Requirements
CCReport Name: 2017_Mid_Cycle_Report_Revenues
Report Description: Budget Book - Department Budget Detail wMD
06/07/2017Date:
Time: 62
Version:
Page:19:21:42

Department / Section: Fire / Fire-UASI-Riverside205 - 353010
Department Budget Detail
%Chnge16/17 vs 17/182017/182017/18
AmendedAdoptedAdopted2016/17
AmendedActualActual2016/172015/162014/15GL KeyObject Description
-0 000808,104UASI-Riverside,20119142510331100 0
-0 000404,785UASI-Riverside,20129147110331100 0
-00 05,470682,940331100 UASI-Riverside,20149151710 141,588
-00 02,119,788280,211331100 UASI-Riverside,20159154810 0
-0 02,369,60000UASI-Riverside,20169158110331100 0
-0 0Intergovernmental Total 04,494,858963,1521,354,479
-0 004,494,858963,1521,354,479Total Budget Requirements
(100.0) %00 04,494,858963,152Total Budget Requirements 1,354,479
CCReport Name: 2017_Mid_Cycle_Report_Revenues
Report Description: Budget Book - Department Budget Detail wMD
06/07/2017Date:
Time: 63
Version:
Page:19:21:42
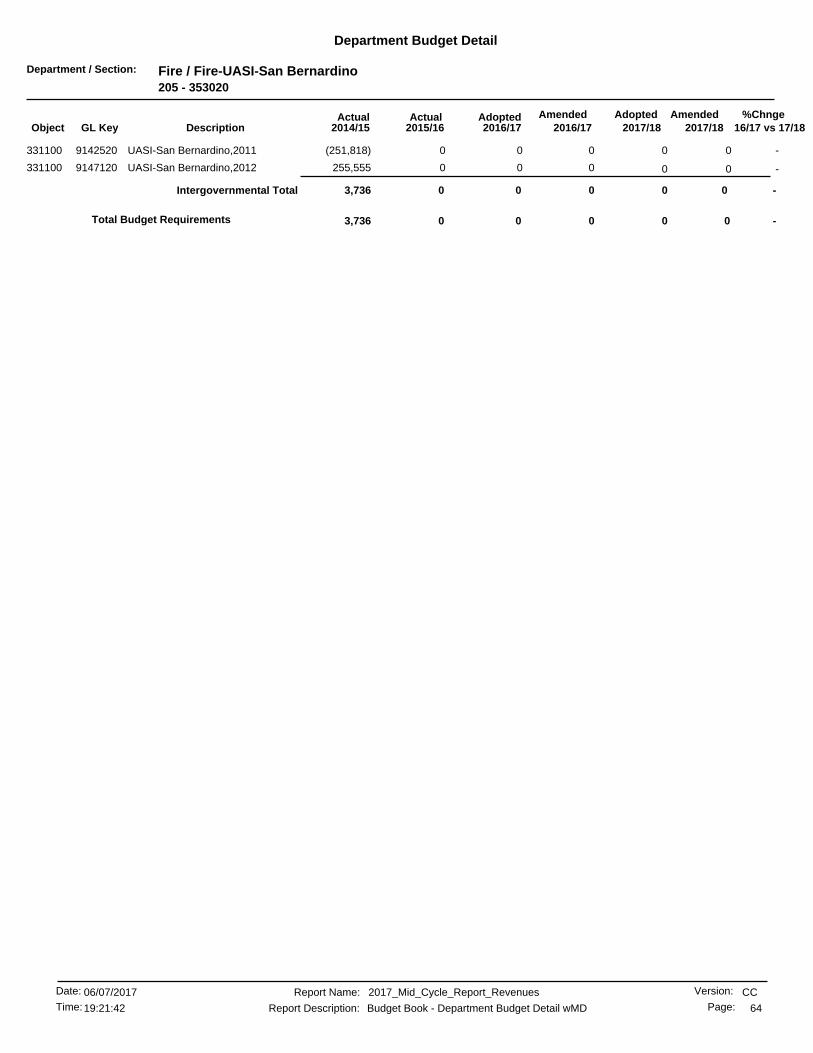
Department / Section: Fire / Fire-UASI-San Bernardino205 - 353020
Department Budget Detail
%Chnge16/17 vs 17/182017/182017/18
AmendedAdoptedAdopted2016/17
AmendedActualActual2016/172015/162014/15GL KeyObject Description
-0 000(251,818)UASI-San Bernardino,20119142520331100 0
-0 000255,555UASI-San Bernardino,20129147120331100 0
-0 0Intergovernmental Total 0003,736
-00 000Total Budget Requirements 3,736
CCReport Name: 2017_Mid_Cycle_Report_Revenues
Report Description: Budget Book - Department Budget Detail wMD
06/07/2017Date:
Time: 64
Version:
Page:19:21:42

Department / Section: Fire / Fire-UASI-Ontario205 - 353030
Department Budget Detail
%Chnge16/17 vs 17/182017/182017/18
AmendedAdoptedAdopted2016/17
AmendedActualActual2016/172015/162014/15GL KeyObject Description
-0 000(347,882)UASI-Ontario,20119142530331100 0
-0 0001,936UASI-Ontario,20129147130331100 0
-0 0000UASI-Ontario,20149151730331100 0
-0 0Intergovernmental Total 000(345,945)
-00 000Total Budget Requirements (345,945)
CCReport Name: 2017_Mid_Cycle_Report_Revenues
Report Description: Budget Book - Department Budget Detail wMD
06/07/2017Date:
Time: 65
Version:
Page:19:21:42

Department / Section: Balance Sheet / Revenue / Balance Sheet / Revenue220 - 000000
Department Budget Detail
%Chnge16/17 vs 17/182017/182017/18
AmendedAdoptedAdopted2016/17
AmendedActualActual2016/172015/162014/15GL KeyObject Description
-3,068,7053,068,705 3,068,7053,068,7052,869,484331100 Federal Operating Grants0000220 2,231,473
-3,068,7053,068,7053,068,705 3,068,705Intergovernmental Total 2,869,4842,231,473
-0 0017Late Payment Penalties0000220353400 0
-0 0Fines & Forfeits Total 0017
-0 001,6562,628Interest From Investments0000220371100 0
-0 00130140Int Income Casa Blanca Hm Imp0000220371212 0
-0 007,621757Int Income Eastside Home Imp0000220371214 0
-0 001,3880Int Income Citywide Home Imp0000220371216 0
-0 0Miscellaneous Total 0010,7963,526
-0 00270250Prin Casa Blanca Home Imp0000220374122 0
-0 0020,179684Prin Eastside Home Imp Loan0000220374124 0
-0 007,4150Prin Citywide Home Imp Loans0000220374126 0
-0 002120Miscellaneous Receipts0000220374200 0
-0 0Miscellaneous Total 0028,076934
-3,068,705 3,068,7053,068,7053,068,7052,908,3602,235,942Total Budget Requirements
CCReport Name: 2017_Mid_Cycle_Report_Revenues
Report Description: Budget Book - Department Budget Detail wMD
06/07/2017Date:
Time: 66
Version:
Page:19:21:42
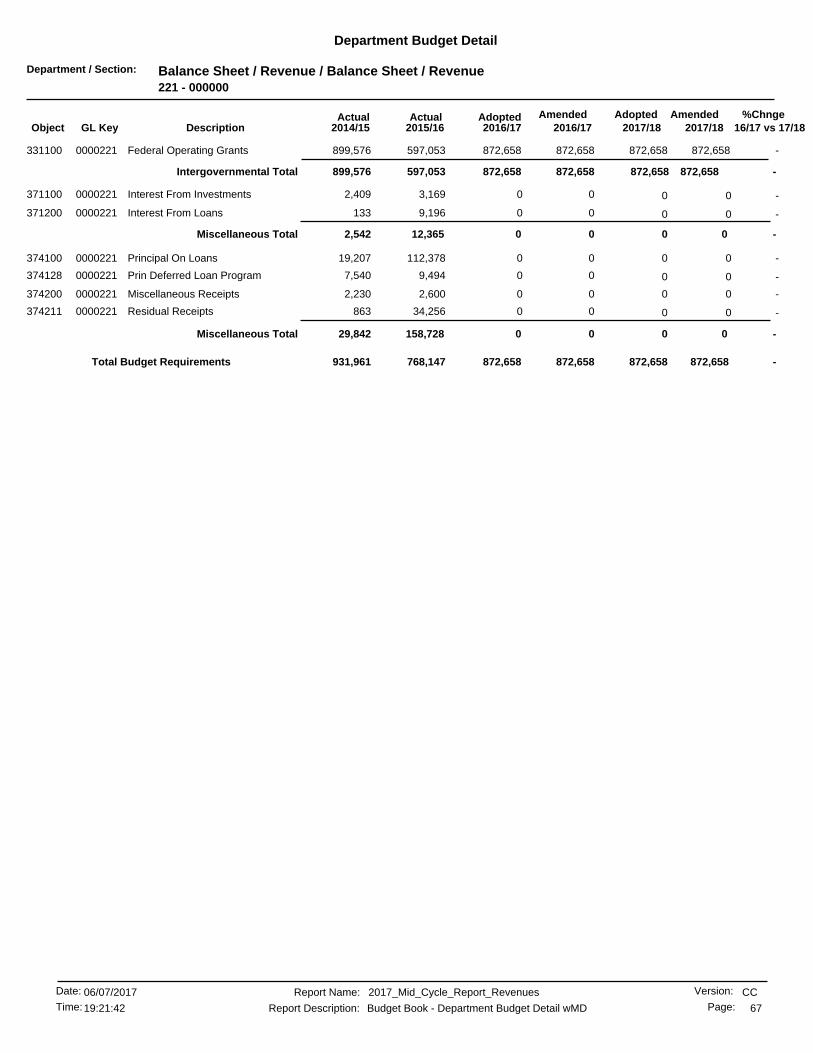
Department / Section: Balance Sheet / Revenue / Balance Sheet / Revenue221 - 000000
Department Budget Detail
%Chnge16/17 vs 17/182017/182017/18
AmendedAdoptedAdopted2016/17
AmendedActualActual2016/172015/162014/15GL KeyObject Description
-872,658872,658 872,658872,658597,053331100 Federal Operating Grants0000221 899,576
-872,658872,658872,658 872,658Intergovernmental Total 597,053899,576
-0 003,1692,409Interest From Investments0000221371100 0
-0 009,196133Interest From Loans0000221371200 0
-0 0Miscellaneous Total 0012,3652,542
-0 00112,37819,207Principal On Loans0000221374100 0
-0 009,4947,540Prin Deferred Loan Program0000221374128 0
-0 002,6002,230Miscellaneous Receipts0000221374200 0
-0 0034,256863Residual Receipts0000221374211 0
-0 0Miscellaneous Total 00158,72829,842
-872,658 872,658872,658872,658768,147931,961Total Budget Requirements
CCReport Name: 2017_Mid_Cycle_Report_Revenues
Report Description: Budget Book - Department Budget Detail wMD
06/07/2017Date:
Time: 67
Version:
Page:19:21:42

Department / Section: Balance Sheet / Revenue / Balance Sheet / Revenue222 - 000000
Department Budget Detail
%Chnge16/17 vs 17/182017/182017/18
AmendedAdoptedAdopted2016/17
AmendedActualActual2016/172015/162014/15GL KeyObject Description
-2,004,5162,004,516 2,004,5162,004,5162,291,595331100 Federal Operating Grants0000222 1,902,476
-2,004,5162,004,5162,004,516 2,004,516Intergovernmental Total 2,291,5951,902,476
-2,004,516 2,004,5162,004,5162,004,5162,291,5951,902,476Total Budget Requirements
CCReport Name: 2017_Mid_Cycle_Report_Revenues
Report Description: Budget Book - Department Budget Detail wMD
06/07/2017Date:
Time: 68
Version:
Page:19:21:42

Department / Section: Balance Sheet / Revenue / Balance Sheet / Revenue223 - 000000
Department Budget Detail
%Chnge16/17 vs 17/182017/182017/18
AmendedAdoptedAdopted2016/17
AmendedActualActual2016/172015/162014/15GL KeyObject Description
-0 0017,04322Interest From Investments0000223371100 0
-0 0Miscellaneous Total 0017,04322
-0 000960,670Operating Trnsfr from 281 Fund0000223985281 0
-0 0Operating Transfers In Total 000960,670
-00 0017,043Total Budget Requirements 960,692
CCReport Name: 2017_Mid_Cycle_Report_Revenues
Report Description: Budget Book - Department Budget Detail wMD
06/07/2017Date:
Time: 69
Version:
Page:19:21:42

Department / Section: Community Development / CD-Grants223 - 287000
Department Budget Detail
%Chnge16/17 vs 17/182017/182017/18
AmendedAdoptedAdopted2016/17
AmendedActualActual2016/172015/162014/15GL KeyObject Description
-0 00020,995Homeless St Outreach 13/149129140331100 0
-0 0010,94613,472Emergency Shelter 11/129133320331100 0
-0 0048019,805ESG Grant Em Solutions 11/129133321331100 0
-0 00(27,053)113,591ESG 12/13 Cold Weather/Admin9145800331100 0
-0 0021,42511,287ESG 12/13 HPRP Activities9145810331100 0
-0 000(18,228)Chronic Homeless SHP 12/139146600331100 0
-0 00070,095SHP 14/15-Indiana9147210331100 0
-0 00101,36317,554SHP 15/16-Indiana9147220331100 0
-0 0046,3800SHP 16/17-Indiana9147230331100 0
-0 00(115,250)119,864FY 13/14 ESG Emergency Shelter9149500331100 0
-0 0067,0000FY 13/14 ESG Cold Weather9149510331100 0
-0 0061,7630FY 13/14 ESG HPRP9149520331100 0
-0 00014,899FY 13/14 ESG Admin9149530331100 0
-0 0019,2350ESG 14/15-Rapid Re-housing9152100331100 0
-0 00067,635ESG 14/15-Cold Weather Shelter9152110331100 0
-0 0034,59144,753ESG 14/15-Emergency Shelter9152120331100 0
-0 0018,3720ESG 14/15-Admin9152130331100 0
-0 0095,3230ESG 15/16-Emergency Shelter9154500331100 0
-0 0067,6350ESG 15/16-Cold Weather Shelter9154510331100 0
-0 0000ESG 15/16-Outreach9154520331100 0
-0 0019,9290ESG 15/16-Admin9154530331100 0
-0 0000ESG 15/16-Rapid Re-Housing9154540331100 0
-0 079,73000ESG 16/17-Emergency Shelter9157200331100 0
-0 067,60000ESG 16/17-Cold Weather Shelter9157210331100 0
-0 014,47600ESG 16/17-Outreach9157220331100 0
-0 020,22500ESG 16/17-Admin9157230331100 0
-0 072,64600ESG 16/17-Rapid Re-Housing9157240331100 0
-0 015,00000ESG 16/17-HMIS9157250331100 0
-0 0122,75400SHP 17/18-Indiana9158400331100 0
-0 05,0000015/16 UCC - Latino History Grn9158500331100 0
-0 000116,5707th Street SHP 14/159229740331100 0
-0 00110,35607th Street SHP 15/169229750331100 0
-0 0120,768007th Street SHP 16/179229760331100 0
-0 00179,45130,221COC 13-14 Rapid Re-Housing9256100331100 0
-0 00159,5920Rapid Re-Housing 15/169258900331100 0
-0 0225,01300COC Rapid Re-Housing 17/189263700331100 0
-0 001,30012,106Cal Home Housing Rehab 10/119229910334100 0
-0 0027,8710Cal Home DPA 10/119229920334100 0
-0 0043,500013/14 Cal Home Housing Rehab9229930334100 0
-0 0025,397402,69913/14 Cal Home Morgage DPA9229940334100 0
-0 0000Cal Home Housing Rehab 14/159229950334100 0
-0 0000CalHme Program (DPA)9229960334100 0
-0 0010,8040Chinese American Historic HPF9259300334100 0
-0 0052,5610HEAL Zone-CDD9877000339000 0
-0 0040,0000StartUp in a Day9891900339000 0
-0 002,6390Invest Health Strategies9896500339000 0
CCReport Name: 2017_Mid_Cycle_Report_Revenues
Report Description: Budget Book - Department Budget Detail wMD
06/07/2017Date:
Time: 70
Version:
Page:19:21:42
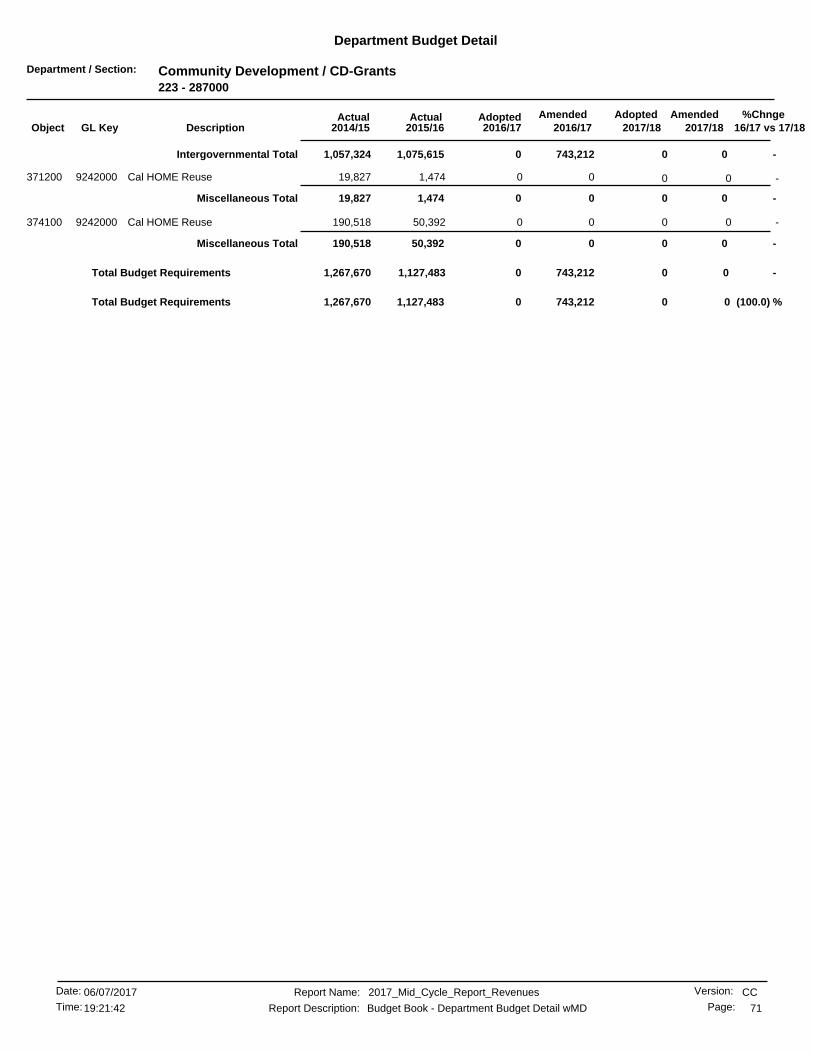
Department / Section: Community Development / CD-Grants223 - 287000
Department Budget Detail
%Chnge16/17 vs 17/182017/182017/18
AmendedAdoptedAdopted2016/17
AmendedActualActual2016/172015/162014/15GL KeyObject Description
-0 0Intergovernmental Total 0743,2121,075,6151,057,324
-0 001,47419,827Cal HOME Reuse9242000371200 0
-0 0Miscellaneous Total 001,47419,827
-0 0050,392190,518Cal HOME Reuse9242000374100 0
-0 0Miscellaneous Total 0050,392190,518
-0 00743,2121,127,4831,267,670Total Budget Requirements
(100.0) %00 0743,2121,127,483Total Budget Requirements 1,267,670
CCReport Name: 2017_Mid_Cycle_Report_Revenues
Report Description: Budget Book - Department Budget Detail wMD
06/07/2017Date:
Time: 71
Version:
Page:19:21:42

Department / Section: Community Development / CD-Grants - Other223 - 287010
Department Budget Detail
%Chnge16/17 vs 17/182017/182017/18
AmendedAdoptedAdopted2016/17
AmendedActualActual2016/172015/162014/15GL KeyObject Description
-0 00641,815709,266Nutritional Ed & Obseity Prev9150300331100 0
-0 0520,23100NEOP II Grant9150310331100 0
-0 0Intergovernmental Total 0520,231641,815709,266
-0 00520,231641,815709,266Total Budget Requirements
(100.0) %00 0520,231641,815Total Budget Requirements 709,266
CCReport Name: 2017_Mid_Cycle_Report_Revenues
Report Description: Budget Book - Department Budget Detail wMD
06/07/2017Date:
Time: 72
Version:
Page:19:21:42

Department / Section: Balance Sheet / Revenue / Balance Sheet / Revenue225 - 000000
Department Budget Detail
%Chnge16/17 vs 17/182017/182017/18
AmendedAdoptedAdopted2016/17
AmendedActualActual2016/172015/162014/15GL KeyObject Description
-0 001,222873Interest From Investments0000225371100 0
-0 0Miscellaneous Total 001,222873
-0 0001Acquisition/Rehab/Resale0000225373119 0
-0 0Miscellaneous Total 0001
-00 001,222Total Budget Requirements 874
CCReport Name: 2017_Mid_Cycle_Report_Revenues
Report Description: Budget Book - Department Budget Detail wMD
06/07/2017Date:
Time: 73
Version:
Page:19:21:42
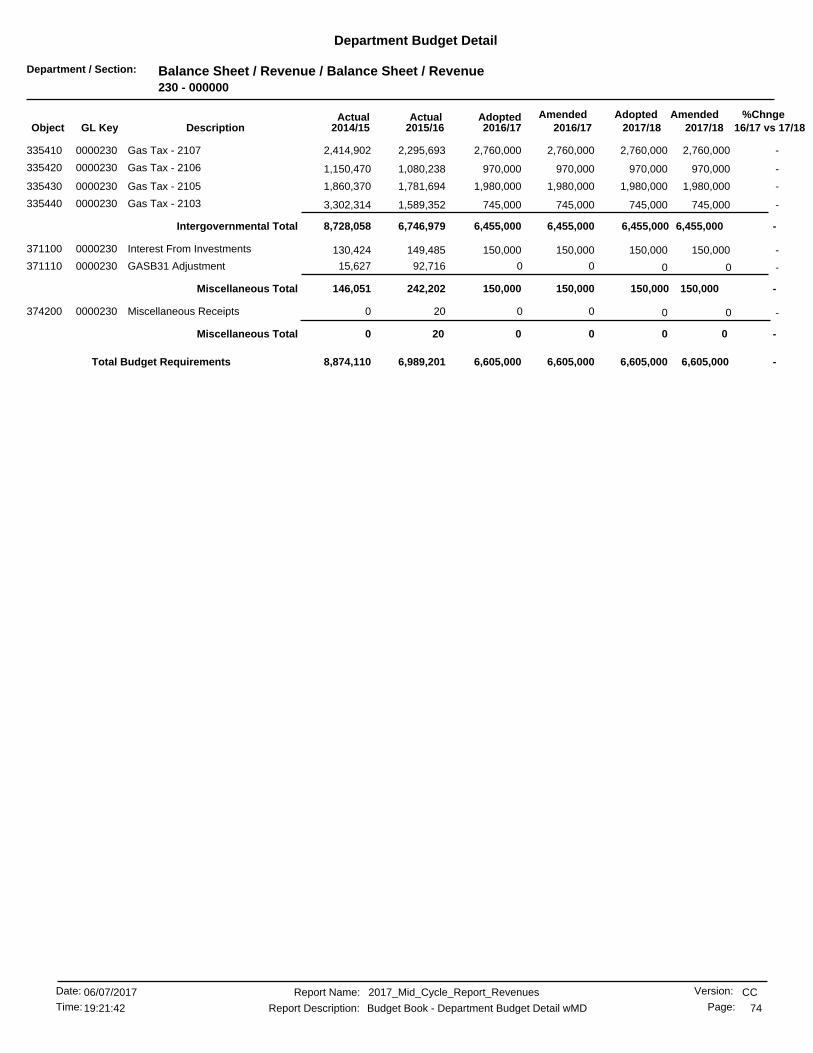
Department / Section: Balance Sheet / Revenue / Balance Sheet / Revenue230 - 000000
Department Budget Detail
%Chnge16/17 vs 17/182017/182017/18
AmendedAdoptedAdopted2016/17
AmendedActualActual2016/172015/162014/15GL KeyObject Description
-2,760,0002,760,000 2,760,0002,760,0002,295,693335410 Gas Tax - 21070000230 2,414,902
-970,000970,000 970,000970,0001,080,238335420 Gas Tax - 21060000230 1,150,470
-1,980,0001,980,000 1,980,0001,980,0001,781,694335430 Gas Tax - 21050000230 1,860,370
-745,000745,000 745,000745,0001,589,352335440 Gas Tax - 21030000230 3,302,314
-6,455,0006,455,0006,455,000 6,455,000Intergovernmental Total 6,746,9798,728,058
-150,000150,000 150,000150,000149,485371100 Interest From Investments0000230 130,424
-0 0092,71615,627GASB31 Adjustment0000230371110 0
-150,000150,000150,000 150,000Miscellaneous Total 242,202146,051
-0 00200Miscellaneous Receipts0000230374200 0
-0 0Miscellaneous Total 00200
-6,605,000 6,605,0006,605,0006,605,0006,989,2018,874,110Total Budget Requirements
CCReport Name: 2017_Mid_Cycle_Report_Revenues
Report Description: Budget Book - Department Budget Detail wMD
06/07/2017Date:
Time: 74
Version:
Page:19:21:42

Department / Section: Balance Sheet / Revenue / Balance Sheet / Revenue240 - 000000
Department Budget Detail
%Chnge16/17 vs 17/182017/182017/18
AmendedAdoptedAdopted2016/17
AmendedActualActual2016/172015/162014/15GL KeyObject Description
( .5) %393,900391,760 393,900391,760400,233335540 Air Quality Program Revenue0000240 387,888
-254,000254,000 254,000254,000230,327335542 Rivrside Go Transit Pass Sales0000240 252,956
( .3) %647,900645,760645,760 647,900Intergovernmental Total 630,561640,844
-0 005,9294,396Interest From Investments0000240371100 0
-0 003,762682GASB31 Adjustment0000240371110 0
-0 0Miscellaneous Total 009,6915,079
( .3) %645,760 647,900647,900645,760640,253645,924Total Budget Requirements
CCReport Name: 2017_Mid_Cycle_Report_Revenues
Report Description: Budget Book - Department Budget Detail wMD
06/07/2017Date:
Time: 75
Version:
Page:19:21:42
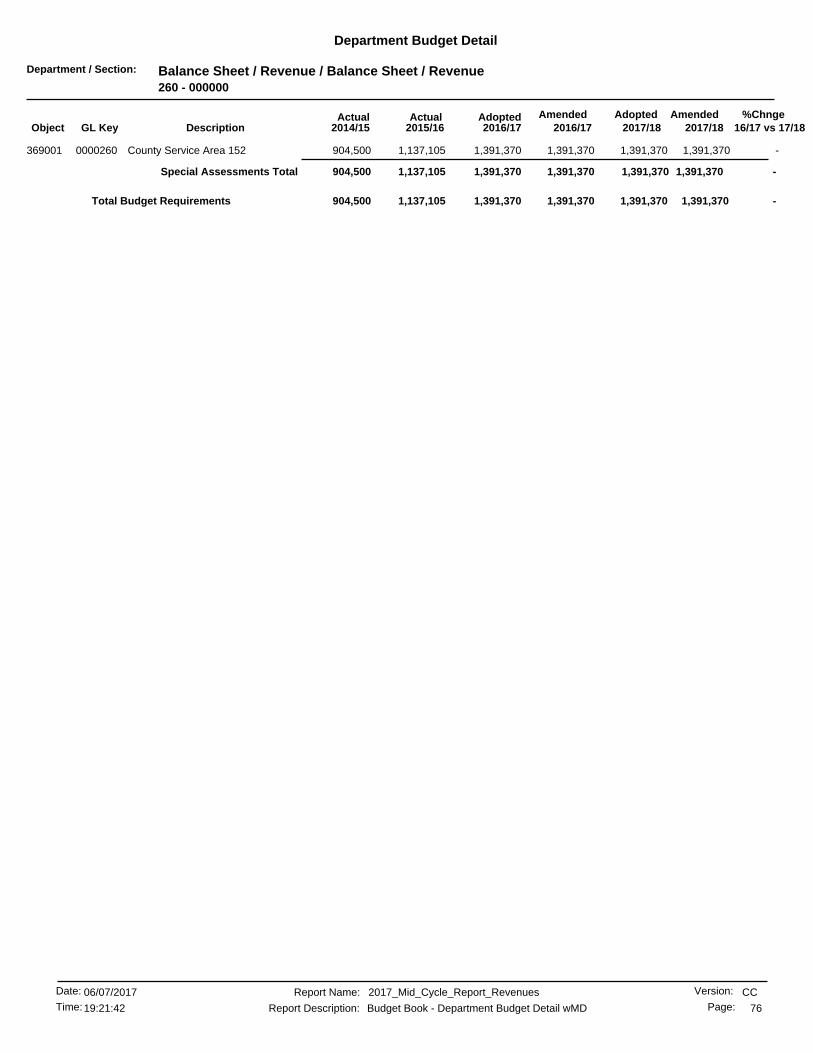
Department / Section: Balance Sheet / Revenue / Balance Sheet / Revenue260 - 000000
Department Budget Detail
%Chnge16/17 vs 17/182017/182017/18
AmendedAdoptedAdopted2016/17
AmendedActualActual2016/172015/162014/15GL KeyObject Description
-1,391,3701,391,370 1,391,3701,391,3701,137,105369001 County Service Area 1520000260 904,500
-1,391,3701,391,3701,391,370 1,391,370Special Assessments Total 1,137,105904,500
-1,391,370 1,391,3701,391,3701,391,3701,137,105904,500Total Budget Requirements
CCReport Name: 2017_Mid_Cycle_Report_Revenues
Report Description: Budget Book - Department Budget Detail wMD
06/07/2017Date:
Time: 76
Version:
Page:19:21:42

Department / Section: Balance Sheet / Revenue / Balance Sheet / Revenue280 - 000000
Department Budget Detail
%Chnge16/17 vs 17/182017/182017/18
AmendedAdoptedAdopted2016/17
AmendedActualActual2016/172015/162014/15GL KeyObject Description
-0 003110Late Payment Penalties0000280353400 0
-0 0Fines & Forfeits Total 003110
-0 0034,7524,681Interest From Investments0000280371100 0
-0 0023,073(76)GASB31 Adjustment0000280371110 0
-0 003,8811,880Interest From Loans0000280371200 0
-0 0Miscellaneous Total 0061,7076,485
-0 0077Land and Building Rental0000280373100 0
-0 004,5243,014Principal On Loans0000280374100 0
-0 00(88,001)3,750Miscellaneous Receipts0000280374200 0
-0 0Miscellaneous Total 00(83,470)6,771
(4.7) %1,098,9281,046,256 1,098,9281,046,2562,942,000985281 Operating Trnsfr from 281 Fund0000280 3,641,800
(4.7) %1,098,9281,046,2561,046,256 1,098,928Operating Transfers In Total 2,942,0003,641,800
(4.7) %1,046,256 1,098,9281,098,9281,046,2562,920,2683,655,067Total Budget Requirements
CCReport Name: 2017_Mid_Cycle_Report_Revenues
Report Description: Budget Book - Department Budget Detail wMD
06/07/2017Date:
Time: 77
Version:
Page:19:21:42

Department / Section: Balance Sheet / Revenue / Balance Sheet / Revenue281 - 000000
Department Budget Detail
%Chnge16/17 vs 17/182017/182017/18
AmendedAdoptedAdopted2016/17
AmendedActualActual2016/172015/162014/15GL KeyObject Description
-0 00549489Late Payment Penalties0000281353400 0
-0 0Fines & Forfeits Total 00549489
-0 002,42634,178Interest From Investments0000281371100 0
-0 00605,773GASB31 Adjustment0000281371110 0
-0 00120,54529,976Interest From Loans0000281371200 0
-0 0013,11024,160Int Income Deferred Loan Prog0000281371218 0
-0 0014284Int Income Magnolia Ctr Hsg0000281371219 0
-0 00019,482Int-Breezewood Loan0000281371224 0
-0 00013All Other Interest Income0000281371300 0
-0 0Miscellaneous Total 00136,285113,671
-0 00292,30194,054Principal On Loans0000281374100 0
-0 0054,299127,772Prin Deferred Loan Program0000281374128 0
-0 001,213593Prin Magnolia Ctr Housing0000281374129 0
-0 000115,553Principal - Breezewood0000281374133 0
-0 002,12418,033Miscellaneous Receipts0000281374200 0
-0 0031,49576,480Residual Receipts0000281374211 0
-0 0Miscellaneous Total 00381,433432,488
-0 0052,6760Operating Trnsfr from 280 Fund0000281985280 0
-0 0Operating Transfers In Total 0052,6760
-0 000(356,460)Sale of Land & Buildings0000281380010 0
-0 0Other Financing Sources Total 000(356,460)
-00 00570,944Total Budget Requirements 190,188
CCReport Name: 2017_Mid_Cycle_Report_Revenues
Report Description: Budget Book - Department Budget Detail wMD
06/07/2017Date:
Time: 78
Version:
Page:19:21:42
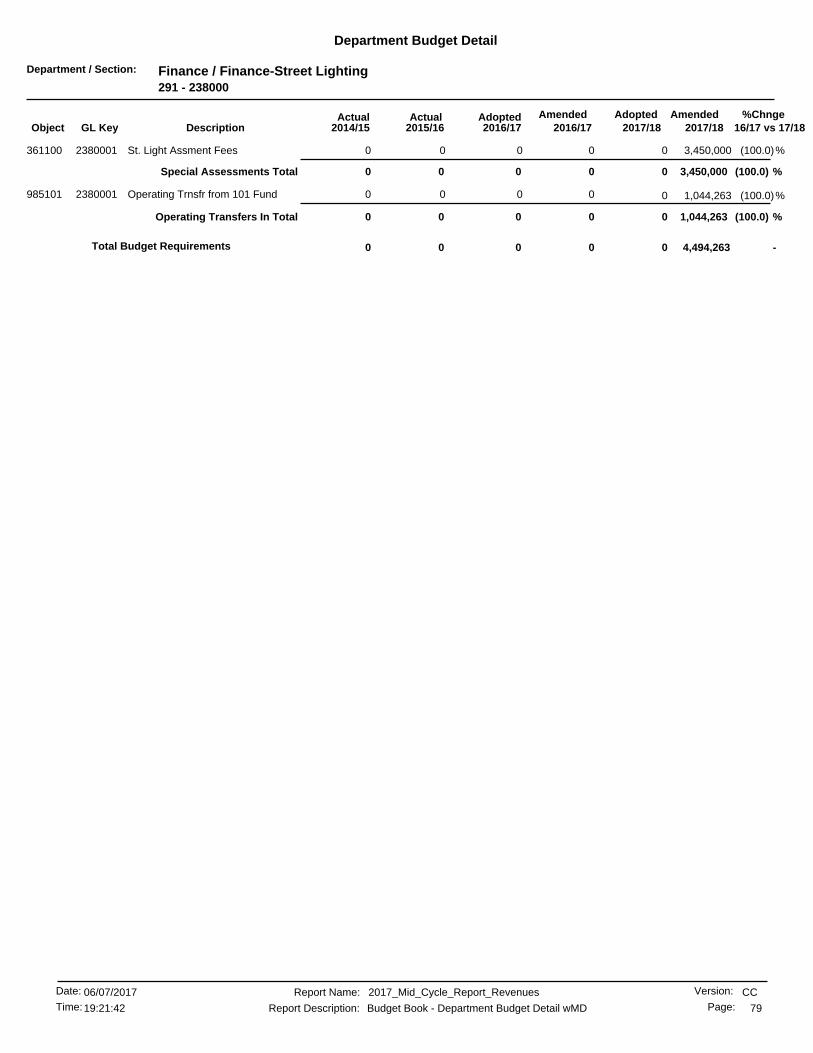
Department / Section: Finance / Finance-Street Lighting291 - 238000
Department Budget Detail
%Chnge16/17 vs 17/182017/182017/18
AmendedAdoptedAdopted2016/17
AmendedActualActual2016/172015/162014/15GL KeyObject Description
(100.0)%0 3,450,000000St. Light Assment Fees2380001361100 0
(100.0) %0 3,450,000Special Assessments Total 0000
(100.0)%0 1,044,263000Operating Trnsfr from 101 Fund2380001985101 0
(100.0) %0 1,044,263Operating Transfers In Total 0000
-4,494,2630 000Total Budget Requirements 0
CCReport Name: 2017_Mid_Cycle_Report_Revenues
Report Description: Budget Book - Department Budget Detail wMD
06/07/2017Date:
Time: 79
Version:
Page:19:21:42
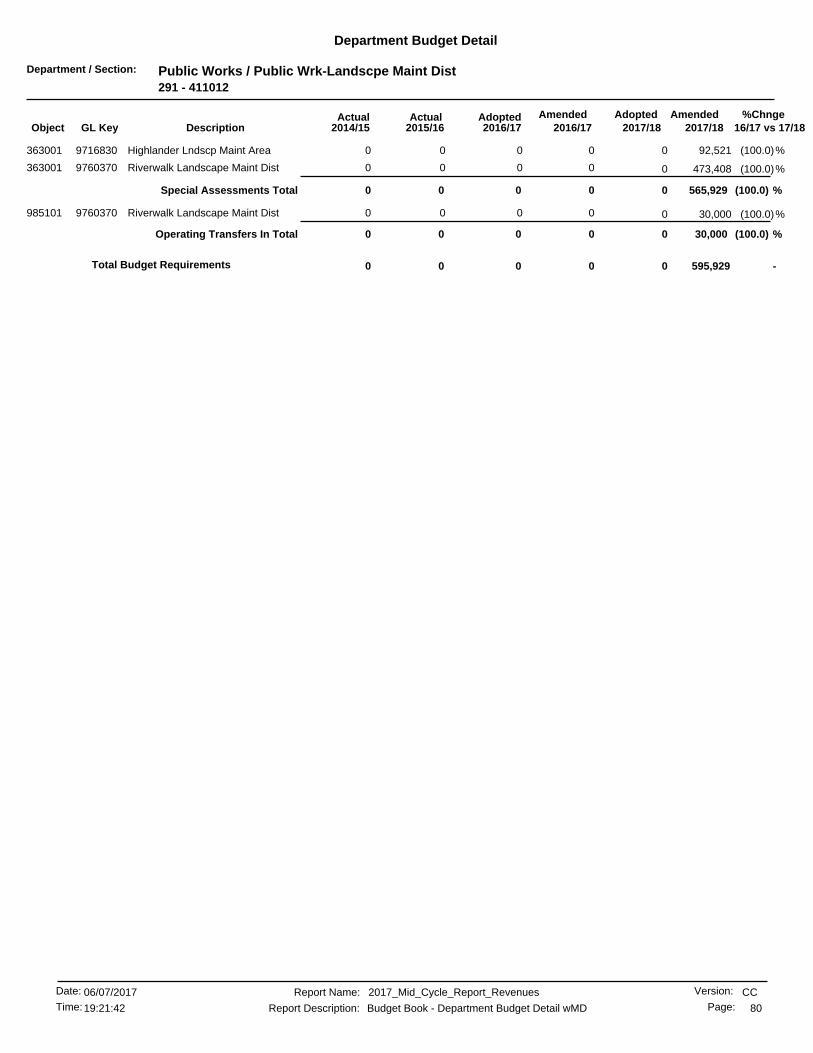
Department / Section: Public Works / Public Wrk-Landscpe Maint Dist291 - 411012
Department Budget Detail
%Chnge16/17 vs 17/182017/182017/18
AmendedAdoptedAdopted2016/17
AmendedActualActual2016/172015/162014/15GL KeyObject Description
(100.0)%0 92,521000Highlander Lndscp Maint Area9716830363001 0
(100.0)%0 473,408000Riverwalk Landscape Maint Dist9760370363001 0
(100.0) %0 565,929Special Assessments Total 0000
(100.0)%0 30,000000Riverwalk Landscape Maint Dist9760370985101 0
(100.0) %0 30,000Operating Transfers In Total 0000
-595,9290 000Total Budget Requirements 0
CCReport Name: 2017_Mid_Cycle_Report_Revenues
Report Description: Budget Book - Department Budget Detail wMD
06/07/2017Date:
Time: 80
Version:
Page:19:21:42

Department / Section: Parks, Recreation & Comm Svcs / P&R Spec District Park Maint291 - 521520
Department Budget Detail
%Chnge16/17 vs 17/182017/182017/18
AmendedAdoptedAdopted2016/17
AmendedActualActual2016/172015/162014/15GL KeyObject Description
(100.0)%0 19,200000Loving Homes5215202361610 0
(100.0)%0 23,900000Village At Canyon Crest5215202361620 0
(100.0) %0 43,100Special Assessments Total 0000
-43,1000 000Total Budget Requirements 0
CCReport Name: 2017_Mid_Cycle_Report_Revenues
Report Description: Budget Book - Department Budget Detail wMD
06/07/2017Date:
Time: 81
Version:
Page:19:21:42

Department / Section: Balance Sheet / Revenue / RDSA RORF-Arlington371 - 000000
Department Budget Detail
%Chnge16/17 vs 17/182017/182017/18
AmendedAdoptedAdopted2016/17
AmendedActualActual2016/172015/162014/15GL KeyObject Description
.0 %2,071,7242,071,777 2,071,7242,071,7772,258,500311101 Sucessor Agency-Property Taxes0000371 1,891,119
.0 %2,071,7242,071,7772,071,777 2,071,724Taxes Total 2,258,5001,891,119
-0 0011,65517,360Interest From Investments0000371371100 0
-0 007,67826,282GASB31 Adjustment0000371371110 0
-0 0040(22,011)All Other Interest Income0000371371300 0
-0 0Miscellaneous Total 0019,37421,631
-0 00810Miscellaneous Receipts0000371374200 0
-0 0Miscellaneous Total 00810
-0 0005Operating Trnsfr from 471 Fund0000371985471 0
-0 000233,923Operating Trnsfr from 476 Fund0000371985476 0
-0 0Operating Transfers In Total 000233,928
.0 %2,071,777 2,071,7242,071,7242,071,7772,277,9562,146,678Total Budget Requirements
CCReport Name: 2017_Mid_Cycle_Report_Revenues
Report Description: Budget Book - Department Budget Detail wMD
06/07/2017Date:
Time: 82
Version:
Page:19:21:42
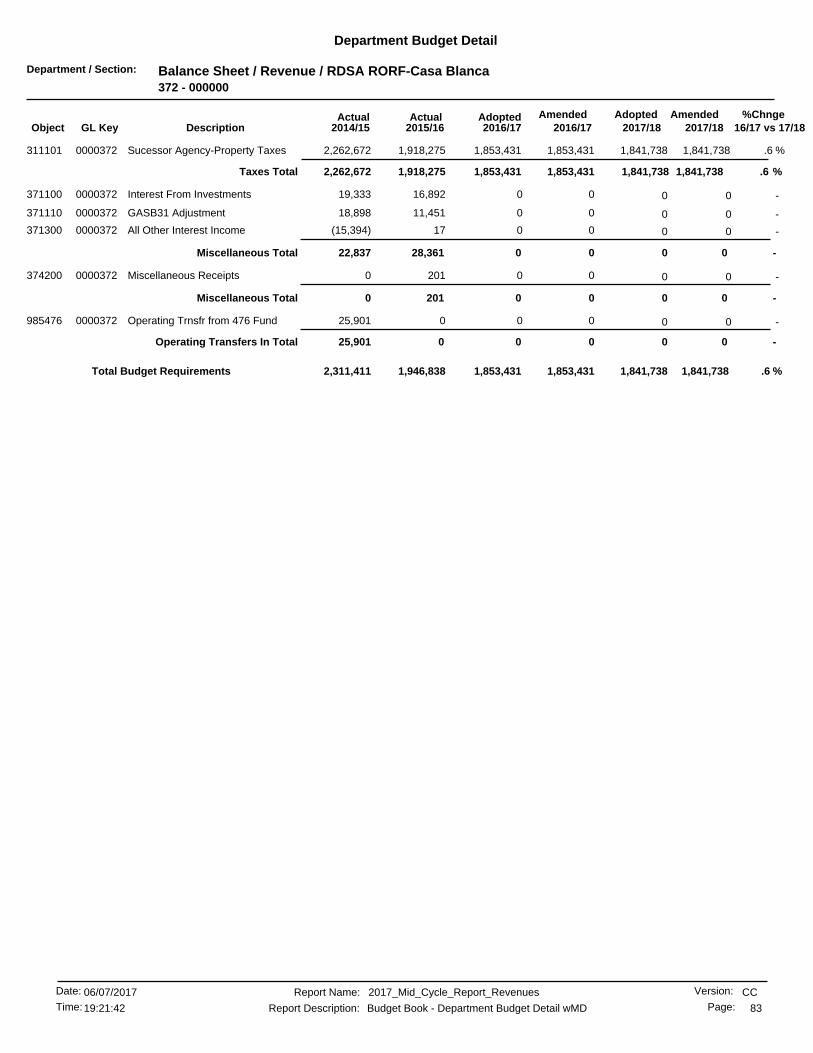
Department / Section: Balance Sheet / Revenue / RDSA RORF-Casa Blanca372 - 000000
Department Budget Detail
%Chnge16/17 vs 17/182017/182017/18
AmendedAdoptedAdopted2016/17
AmendedActualActual2016/172015/162014/15GL KeyObject Description
.6 %1,841,7381,853,431 1,841,7381,853,4311,918,275311101 Sucessor Agency-Property Taxes0000372 2,262,672
.6 %1,841,7381,853,4311,853,431 1,841,738Taxes Total 1,918,2752,262,672
-0 0016,89219,333Interest From Investments0000372371100 0
-0 0011,45118,898GASB31 Adjustment0000372371110 0
-0 0017(15,394)All Other Interest Income0000372371300 0
-0 0Miscellaneous Total 0028,36122,837
-0 002010Miscellaneous Receipts0000372374200 0
-0 0Miscellaneous Total 002010
-0 00025,901Operating Trnsfr from 476 Fund0000372985476 0
-0 0Operating Transfers In Total 00025,901
.6 %1,853,431 1,841,7381,841,7381,853,4311,946,8382,311,411Total Budget Requirements
CCReport Name: 2017_Mid_Cycle_Report_Revenues
Report Description: Budget Book - Department Budget Detail wMD
06/07/2017Date:
Time: 83
Version:
Page:19:21:42

Department / Section: Balance Sheet / Revenue / RDSA RORF-Eastside373 - 000000
Department Budget Detail
%Chnge16/17 vs 17/182017/182017/18
AmendedAdoptedAdopted2016/17
AmendedActualActual2016/172015/162014/15GL KeyObject Description
(11.5) %29,50026,100 29,50026,1004,300311101 Sucessor Agency-Property Taxes0000373 0
(11.5) %29,50026,10026,100 29,500Taxes Total 4,3000
-0 004,4906,973Interest From Investments0000373371100 0
-0 001,700(664)GASB31 Adjustment0000373371110 0
-0 001,2491,249All Other Interest Income0000373371300 0
-0 0Miscellaneous Total 007,4407,557
-0 0060Miscellaneous Receipts0000373374200 0
-0 0Miscellaneous Total 0060
(11.5) %26,100 29,50029,50026,10011,7467,557Total Budget Requirements
CCReport Name: 2017_Mid_Cycle_Report_Revenues
Report Description: Budget Book - Department Budget Detail wMD
06/07/2017Date:
Time: 84
Version:
Page:19:21:42

Department / Section: Balance Sheet / Revenue / RDSA RORF-Magnolia Center374 - 000000
Department Budget Detail
%Chnge16/17 vs 17/182017/182017/18
AmendedAdoptedAdopted2016/17
AmendedActualActual2016/172015/162014/15GL KeyObject Description
.3 %1,355,9471,361,268 1,355,9471,361,2681,520,759311101 Sucessor Agency-Property Taxes0000374 1,416,283
.3 %1,355,9471,361,2681,361,268 1,355,947Taxes Total 1,520,7591,416,283
-0 008,88711,253Interest From Investments0000374371100 0
-0 005,6831,405GASB31 Adjustment0000374371110 0
-0 002633All Other Interest Income0000374371300 0
-0 0Miscellaneous Total 0014,59612,691
-0 00540Miscellaneous Receipts0000374374200 0
-0 0Miscellaneous Total 00540
-0 000161,479Operating Trnsfr from 476 Fund0000374985476 0
-0 0Operating Transfers In Total 000161,479
.3 %1,361,268 1,355,9471,355,9471,361,2681,535,4101,590,454Total Budget Requirements
CCReport Name: 2017_Mid_Cycle_Report_Revenues
Report Description: Budget Book - Department Budget Detail wMD
06/07/2017Date:
Time: 85
Version:
Page:19:21:42
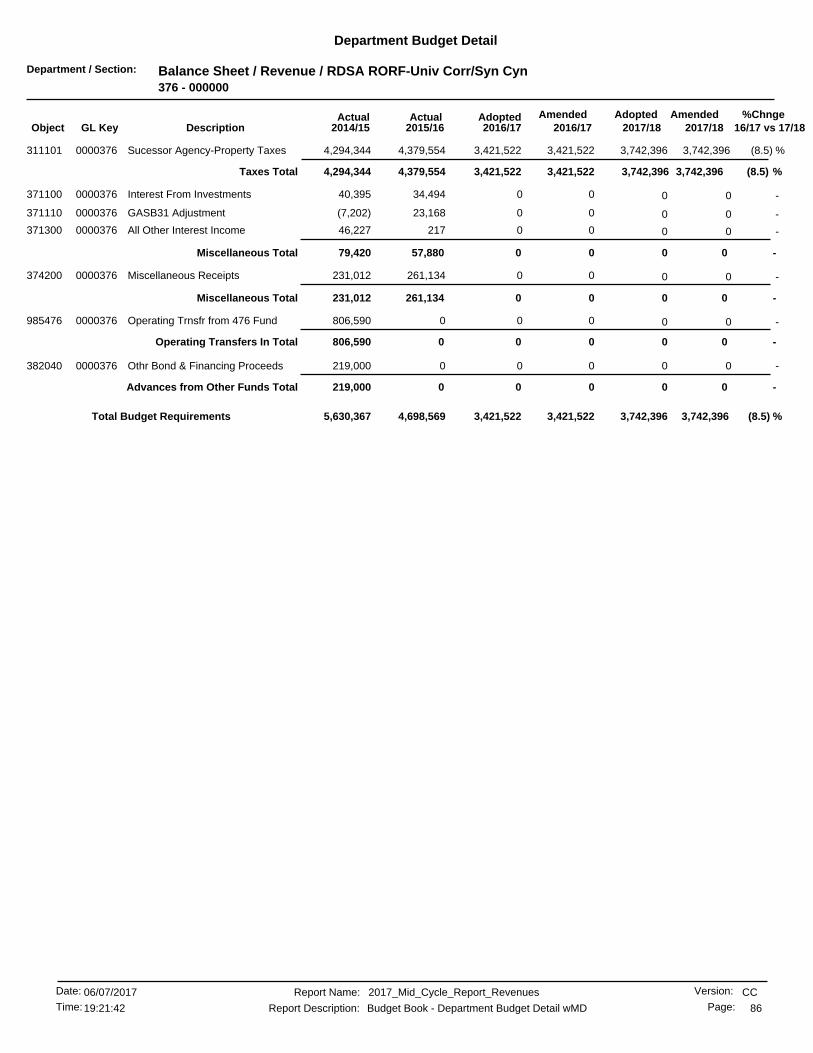
Department / Section: Balance Sheet / Revenue / RDSA RORF-Univ Corr/Syn Cyn376 - 000000
Department Budget Detail
%Chnge16/17 vs 17/182017/182017/18
AmendedAdoptedAdopted2016/17
AmendedActualActual2016/172015/162014/15GL KeyObject Description
(8.5) %3,742,3963,421,522 3,742,3963,421,5224,379,554311101 Sucessor Agency-Property Taxes0000376 4,294,344
(8.5) %3,742,3963,421,5223,421,522 3,742,396Taxes Total 4,379,5544,294,344
-0 0034,49440,395Interest From Investments0000376371100 0
-0 0023,168(7,202)GASB31 Adjustment0000376371110 0
-0 0021746,227All Other Interest Income0000376371300 0
-0 0Miscellaneous Total 0057,88079,420
-0 00261,134231,012Miscellaneous Receipts0000376374200 0
-0 0Miscellaneous Total 00261,134231,012
-0 000806,590Operating Trnsfr from 476 Fund0000376985476 0
-0 0Operating Transfers In Total 000806,590
-0 000219,000Othr Bond & Financing Proceeds0000376382040 0
-0 0Advances from Other Funds Total 000219,000
(8.5) %3,421,522 3,742,3963,742,3963,421,5224,698,5695,630,367Total Budget Requirements
CCReport Name: 2017_Mid_Cycle_Report_Revenues
Report Description: Budget Book - Department Budget Detail wMD
06/07/2017Date:
Time: 86
Version:
Page:19:21:42

Department / Section: Balance Sheet / Revenue / RDSA RORF-Downtown/Airport378 - 000000
Department Budget Detail
%Chnge16/17 vs 17/182017/182017/18
AmendedAdoptedAdopted2016/17
AmendedActualActual2016/172015/162014/15GL KeyObject Description
61.4 %7,448,90412,027,735 7,448,90412,027,73516,949,556311101 Sucessor Agency-Property Taxes0000378 6,659,002
61.4 %7,448,90412,027,73512,027,735 7,448,904Taxes Total 16,949,5566,659,002
-0 0025,00746,422Interest From Investments0000378371100 0
-0 0015,9707,072GASB31 Adjustment0000378371110 0
-0 0049126All Other Interest Income0000378371300 0
-0 0Miscellaneous Total 0041,02753,621
-0 007800Miscellaneous Receipts0000378374200 0
-0 0Miscellaneous Total 007800
-0 000591,283Operating Trnsfr from 476 Fund0000378985476 0
-0 0002Operating Trnsfr from 478 Fund0000378985478 0
-0 0Operating Transfers In Total 000591,285
-0 00049,609Proceeds of Adv from Fund 5100000378381510 0
-0 00037,942Proceeds of Adv from Fund 5500000378381550 0
-0 0039,77848,184Proceeds of Adv from Fund 6100000378381610 0
-0 0Advances from Other Funds Total 0039,778135,737
61.4 %12,027,735 7,448,9047,448,90412,027,73517,031,1437,439,646Total Budget Requirements
CCReport Name: 2017_Mid_Cycle_Report_Revenues
Report Description: Budget Book - Department Budget Detail wMD
06/07/2017Date:
Time: 87
Version:
Page:19:21:42

Department / Section: Community Development / Downtown Air Cal Debt Service378 - 283083
Department Budget Detail
%Chnge16/17 vs 17/182017/182017/18
AmendedAdoptedAdopted2016/17
AmendedActualActual2016/172015/162014/15GL KeyObject Description
-0 0034,16640,789All Other Interest Income2830830371300 0
(1.3) %2,401,9832,369,349 2,401,9832,369,349837,150373122 St Lease Pmt Calif Tower2830830 914,850
(1.3) %2,401,9832,369,3492,369,349 2,401,983Miscellaneous Total 871,316955,639
(1.3) %2,369,349 2,401,9832,401,9832,369,349871,316955,639Total Budget Requirements
CCReport Name: 2017_Mid_Cycle_Report_Revenues
Report Description: Budget Book - Department Budget Detail wMD
06/07/2017Date:
Time: 88
Version:
Page:19:21:42
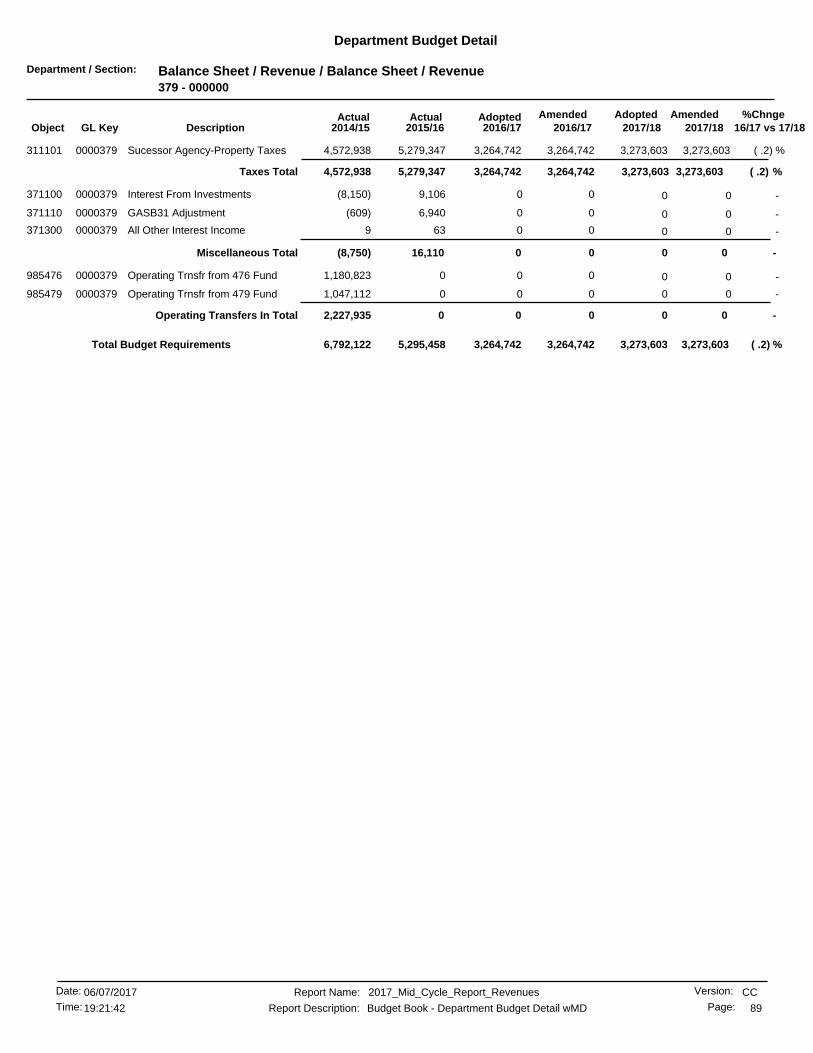
Department / Section: Balance Sheet / Revenue / Balance Sheet / Revenue379 - 000000
Department Budget Detail
%Chnge16/17 vs 17/182017/182017/18
AmendedAdoptedAdopted2016/17
AmendedActualActual2016/172015/162014/15GL KeyObject Description
( .2) %3,273,6033,264,742 3,273,6033,264,7425,279,347311101 Sucessor Agency-Property Taxes0000379 4,572,938
( .2) %3,273,6033,264,7423,264,742 3,273,603Taxes Total 5,279,3474,572,938
-0 009,106(8,150)Interest From Investments0000379371100 0
-0 006,940(609)GASB31 Adjustment0000379371110 0
-0 00639All Other Interest Income0000379371300 0
-0 0Miscellaneous Total 0016,110(8,750)
-0 0001,180,823Operating Trnsfr from 476 Fund0000379985476 0
-0 0001,047,112Operating Trnsfr from 479 Fund0000379985479 0
-0 0Operating Transfers In Total 0002,227,935
( .2) %3,264,742 3,273,6033,273,6033,264,7425,295,4586,792,122Total Budget Requirements
CCReport Name: 2017_Mid_Cycle_Report_Revenues
Report Description: Budget Book - Department Budget Detail wMD
06/07/2017Date:
Time: 89
Version:
Page:19:21:42
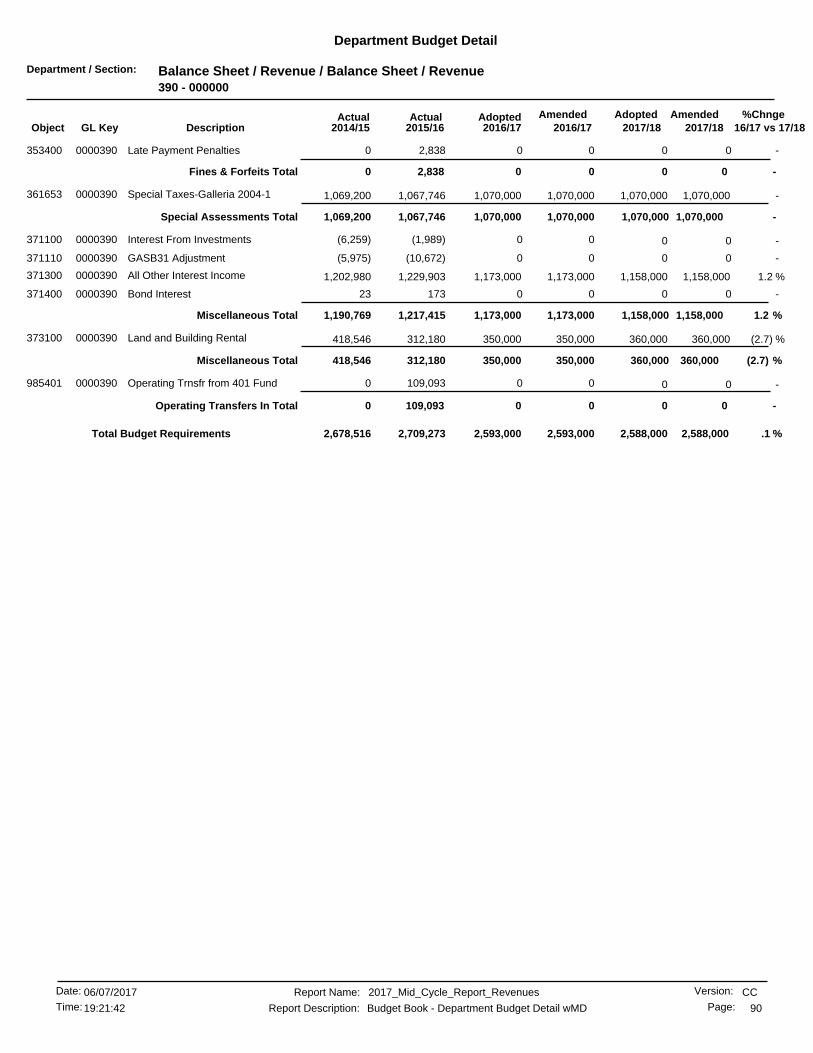
Department / Section: Balance Sheet / Revenue / Balance Sheet / Revenue390 - 000000
Department Budget Detail
%Chnge16/17 vs 17/182017/182017/18
AmendedAdoptedAdopted2016/17
AmendedActualActual2016/172015/162014/15GL KeyObject Description
-0 002,8380Late Payment Penalties0000390353400 0
-0 0Fines & Forfeits Total 002,8380
-1,070,0001,070,000 1,070,0001,070,0001,067,746361653 Special Taxes-Galleria 2004-10000390 1,069,200
-1,070,0001,070,0001,070,000 1,070,000Special Assessments Total 1,067,7461,069,200
-0 00(1,989)(6,259)Interest From Investments0000390371100 0
-0 00(10,672)(5,975)GASB31 Adjustment0000390371110 0
1.2 %1,158,0001,173,000 1,158,0001,173,0001,229,903371300 All Other Interest Income0000390 1,202,980
-0 0017323Bond Interest0000390371400 0
1.2 %1,158,0001,173,0001,173,000 1,158,000Miscellaneous Total 1,217,4151,190,769
(2.7) %360,000350,000 360,000350,000312,180373100 Land and Building Rental0000390 418,546
(2.7) %360,000350,000350,000 360,000Miscellaneous Total 312,180418,546
-0 00109,0930Operating Trnsfr from 401 Fund0000390985401 0
-0 0Operating Transfers In Total 00109,0930
.1 %2,593,000 2,588,0002,588,0002,593,0002,709,2732,678,516Total Budget Requirements
CCReport Name: 2017_Mid_Cycle_Report_Revenues
Report Description: Budget Book - Department Budget Detail wMD
06/07/2017Date:
Time: 90
Version:
Page:19:21:42
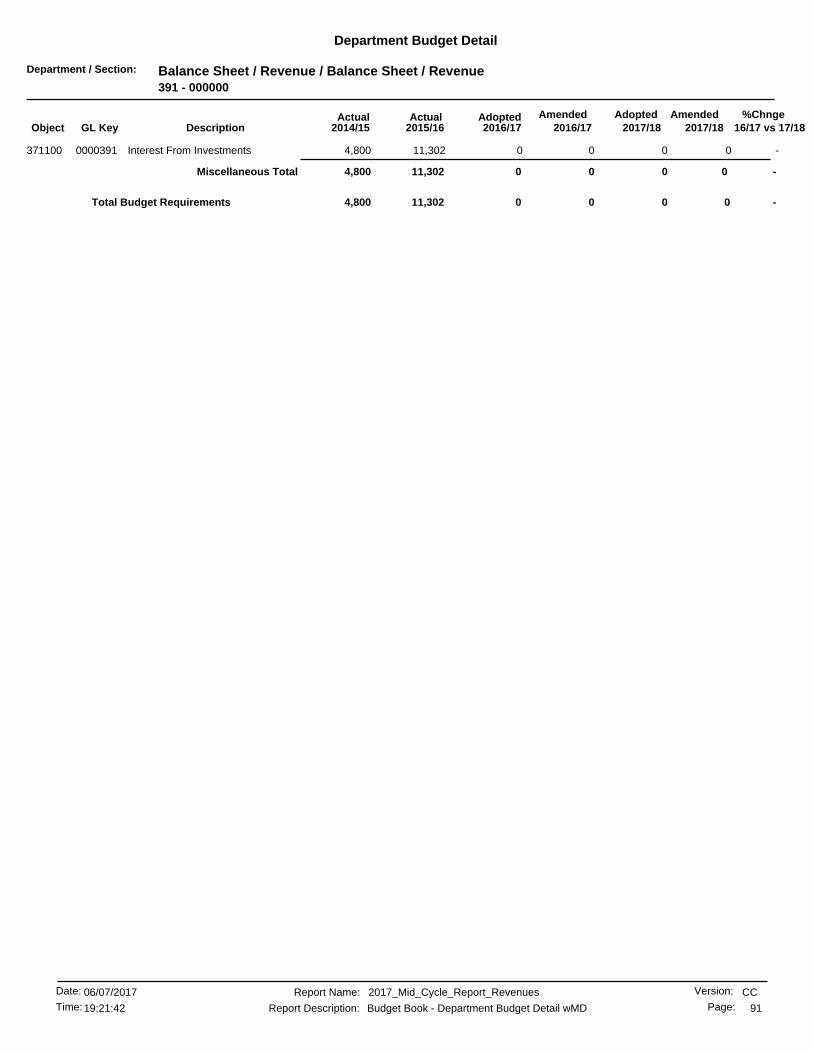
Department / Section: Balance Sheet / Revenue / Balance Sheet / Revenue391 - 000000
Department Budget Detail
%Chnge16/17 vs 17/182017/182017/18
AmendedAdoptedAdopted2016/17
AmendedActualActual2016/172015/162014/15GL KeyObject Description
-0 0011,3024,800Interest From Investments0000391371100 0
-0 0Miscellaneous Total 0011,3024,800
-00 0011,302Total Budget Requirements 4,800
CCReport Name: 2017_Mid_Cycle_Report_Revenues
Report Description: Budget Book - Department Budget Detail wMD
06/07/2017Date:
Time: 91
Version:
Page:19:21:42

Department / Section: Balance Sheet / Revenue / Balance Sheet / Revenue401 - 000000
Department Budget Detail
%Chnge16/17 vs 17/182017/182017/18
AmendedAdoptedAdopted2016/17
AmendedActualActual2016/172015/162014/15GL KeyObject Description
-0 000512Interest From Investments0000401371100 0
-0 002,4042,117All Other Interest Income0000401371300 0
-0 0Miscellaneous Total 002,4042,630
-0 00100Miscellaneous Receipts0000401374200 0
-0 0Miscellaneous Total 00100
-00 002,414Total Budget Requirements 2,630
CCReport Name: 2017_Mid_Cycle_Report_Revenues
Report Description: Budget Book - Department Budget Detail wMD
06/07/2017Date:
Time: 92
Version:
Page:19:21:42

Department / Section: Balance Sheet / Revenue / Balance Sheet / Revenue410 - 000000
Department Budget Detail
%Chnge16/17 vs 17/182017/182017/18
AmendedAdoptedAdopted2016/17
AmendedActualActual2016/172015/162014/15GL KeyObject Description
-100,000100,000 100,000100,000150,960348520 Storm Drain Fees0000410 226,574
-30,00030,000 30,00030,00027,238348530 Acreage Drainage Fees0000410 14,079
-130,000130,000130,000 130,000Licenses & Permits Total 178,199240,654
-20,00020,000 20,00020,00014,209371100 Interest From Investments0000410 13,185
-0 0010,8471,445GASB31 Adjustment0000410371110 0
-20,00020,00020,000 20,000Miscellaneous Total 25,05714,630
-0 001680Miscellaneous Receipts0000410374200 0
-0 0Miscellaneous Total 001680
-150,000 150,000150,000150,000203,424255,284Total Budget Requirements
CCReport Name: 2017_Mid_Cycle_Report_Revenues
Report Description: Budget Book - Department Budget Detail wMD
06/07/2017Date:
Time: 93
Version:
Page:19:21:42
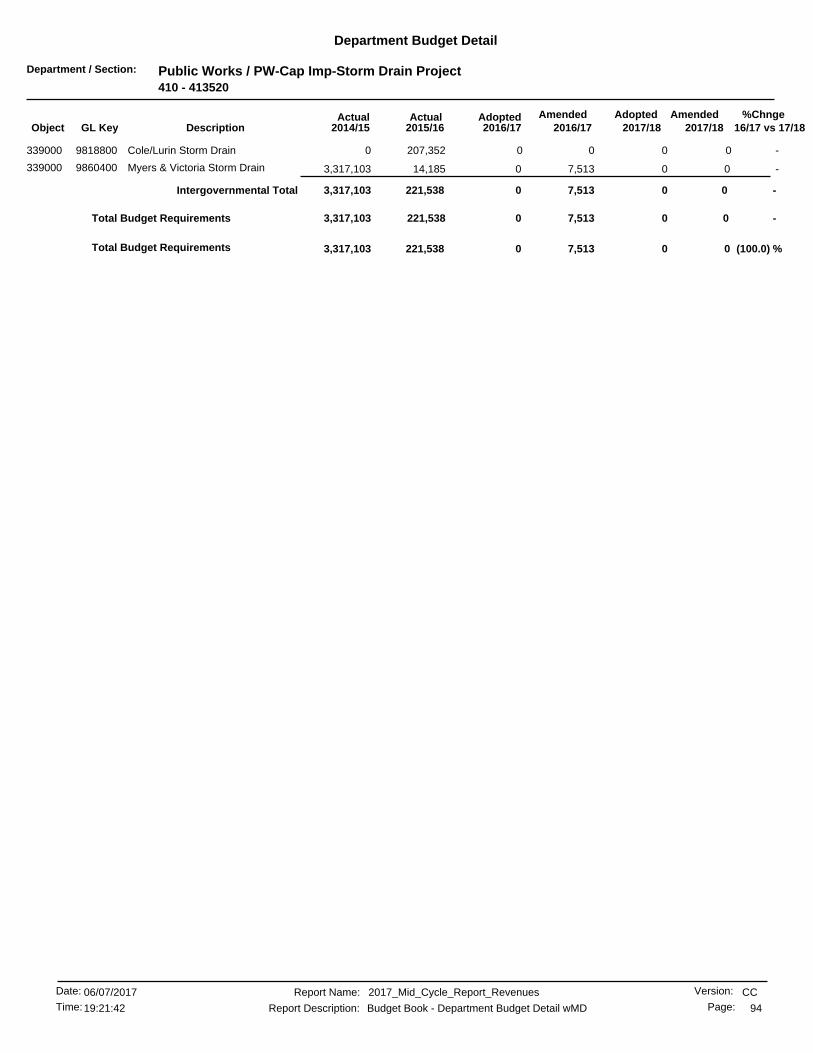
Department / Section: Public Works / PW-Cap Imp-Storm Drain Project410 - 413520
Department Budget Detail
%Chnge16/17 vs 17/182017/182017/18
AmendedAdoptedAdopted2016/17
AmendedActualActual2016/172015/162014/15GL KeyObject Description
-0 00207,3520Cole/Lurin Storm Drain9818800339000 0
-00 07,51314,185339000 Myers & Victoria Storm Drain9860400 3,317,103
-0 0Intergovernmental Total 07,513221,5383,317,103
-0 007,513221,5383,317,103Total Budget Requirements
(100.0) %00 07,513221,538Total Budget Requirements 3,317,103
CCReport Name: 2017_Mid_Cycle_Report_Revenues
Report Description: Budget Book - Department Budget Detail wMD
06/07/2017Date:
Time: 94
Version:
Page:19:21:42
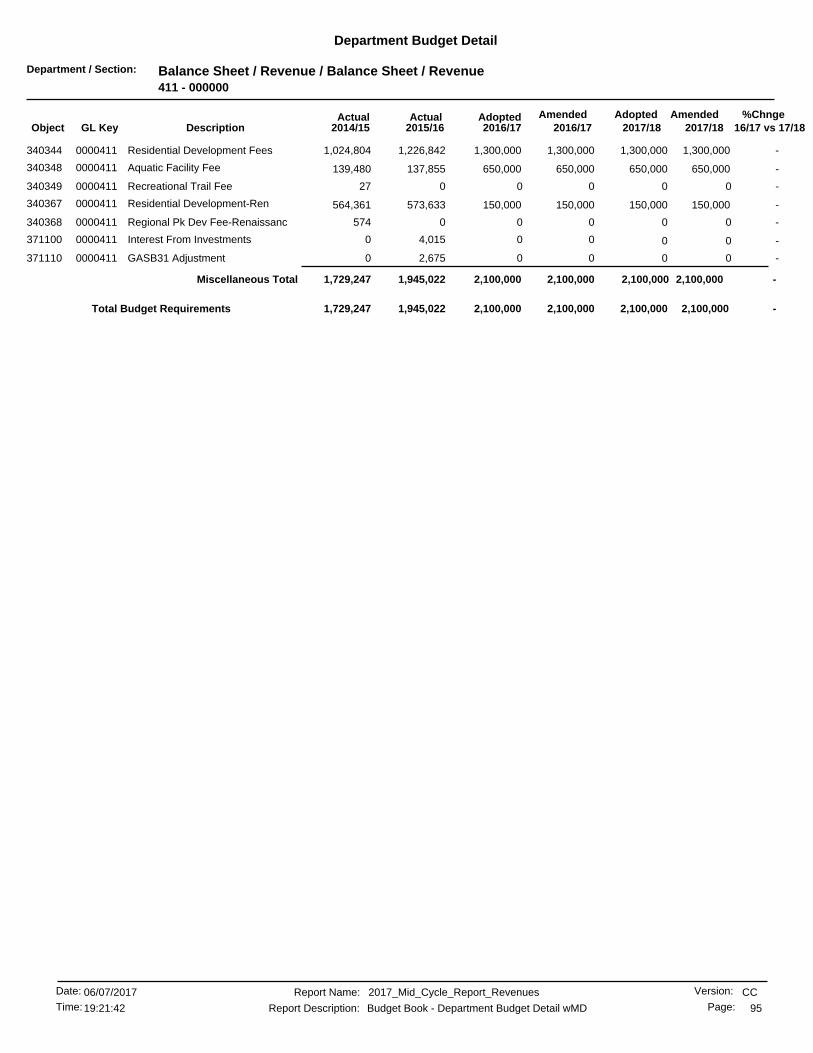
Department / Section: Balance Sheet / Revenue / Balance Sheet / Revenue411 - 000000
Department Budget Detail
%Chnge16/17 vs 17/182017/182017/18
AmendedAdoptedAdopted2016/17
AmendedActualActual2016/172015/162014/15GL KeyObject Description
-1,300,0001,300,000 1,300,0001,300,0001,226,842340344 Residential Development Fees0000411 1,024,804
-650,000650,000 650,000650,000137,855340348 Aquatic Facility Fee0000411 139,480
-0 00027Recreational Trail Fee0000411340349 0
-150,000150,000 150,000150,000573,633340367 Residential Development-Ren0000411 564,361
-0 000574Regional Pk Dev Fee-Renaissanc0000411340368 0
-0 004,0150Interest From Investments0000411371100 0
-0 002,6750GASB31 Adjustment0000411371110 0
-2,100,0002,100,0002,100,000 2,100,000Miscellaneous Total 1,945,0221,729,247
-2,100,000 2,100,0002,100,0002,100,0001,945,0221,729,247Total Budget Requirements
CCReport Name: 2017_Mid_Cycle_Report_Revenues
Report Description: Budget Book - Department Budget Detail wMD
06/07/2017Date:
Time: 95
Version:
Page:19:21:42

Department / Section: Balance Sheet / Revenue / Balance Sheet / Revenue413 - 000000
Department Budget Detail
%Chnge16/17 vs 17/182017/182017/18
AmendedAdoptedAdopted2016/17
AmendedActualActual2016/172015/162014/15GL KeyObject Description
-210,000210,000 210,000210,000193,680340345 Regional Park Development Fees0000413 362,446
-0 005,7558,542Recreational Trail Fee0000413340349 0
-290,000290,000 290,000290,000217,970340368 Regional Pk Dev Fee-Renaissanc0000413 326,996
-0 0017,75211,256Interest From Investments0000413371100 0
-0 0011,5111,818GASB31 Adjustment0000413371110 0
-500,000500,000500,000 500,000Miscellaneous Total 446,670711,061
-500,000 500,000500,000500,000446,670711,061Total Budget Requirements
CCReport Name: 2017_Mid_Cycle_Report_Revenues
Report Description: Budget Book - Department Budget Detail wMD
06/07/2017Date:
Time: 96
Version:
Page:19:21:42
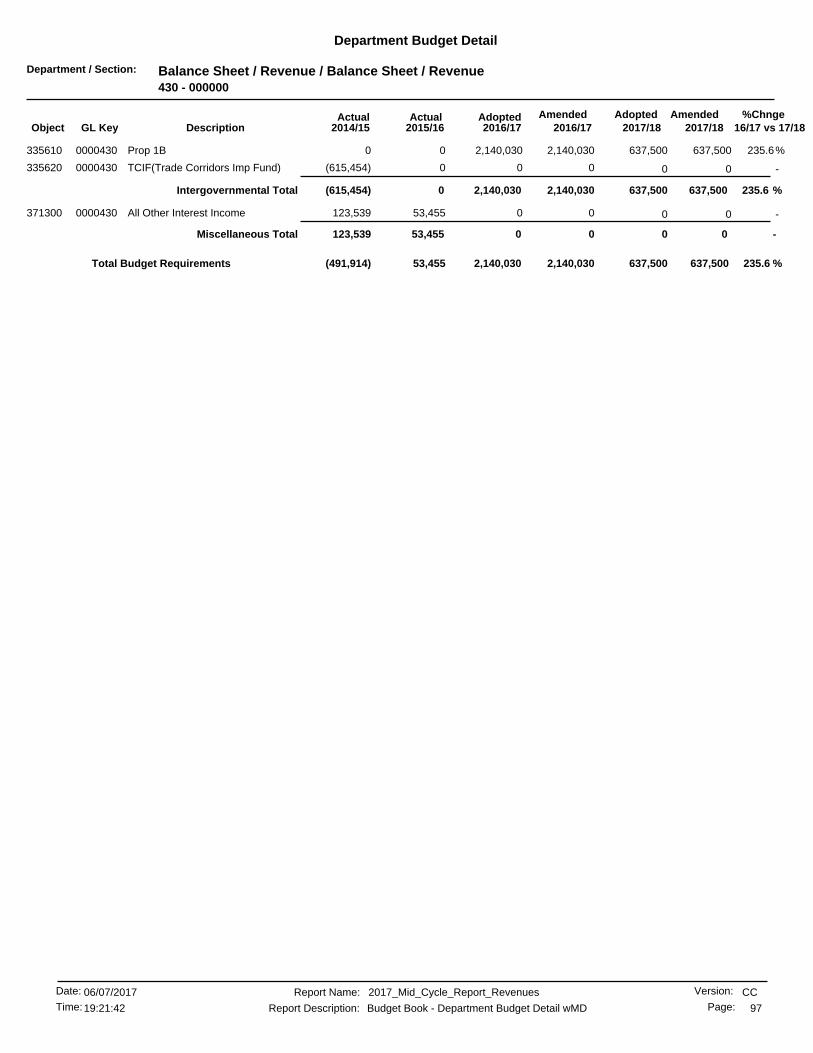
Department / Section: Balance Sheet / Revenue / Balance Sheet / Revenue430 - 000000
Department Budget Detail
%Chnge16/17 vs 17/182017/182017/18
AmendedAdoptedAdopted2016/17
AmendedActualActual2016/172015/162014/15GL KeyObject Description
235.6%2,140,030 637,5002,140,03000Prop 1B0000430335610 637,500
-0 000(615,454)TCIF(Trade Corridors Imp Fund)0000430335620 0
235.6 %2,140,030 637,500Intergovernmental Total 637,5002,140,0300(615,454)
-0 0053,455123,539All Other Interest Income0000430371300 0
-0 0Miscellaneous Total 0053,455123,539
235.6 %2,140,030 637,500637,5002,140,03053,455(491,914)Total Budget Requirements
CCReport Name: 2017_Mid_Cycle_Report_Revenues
Report Description: Budget Book - Department Budget Detail wMD
06/07/2017Date:
Time: 97
Version:
Page:19:21:42
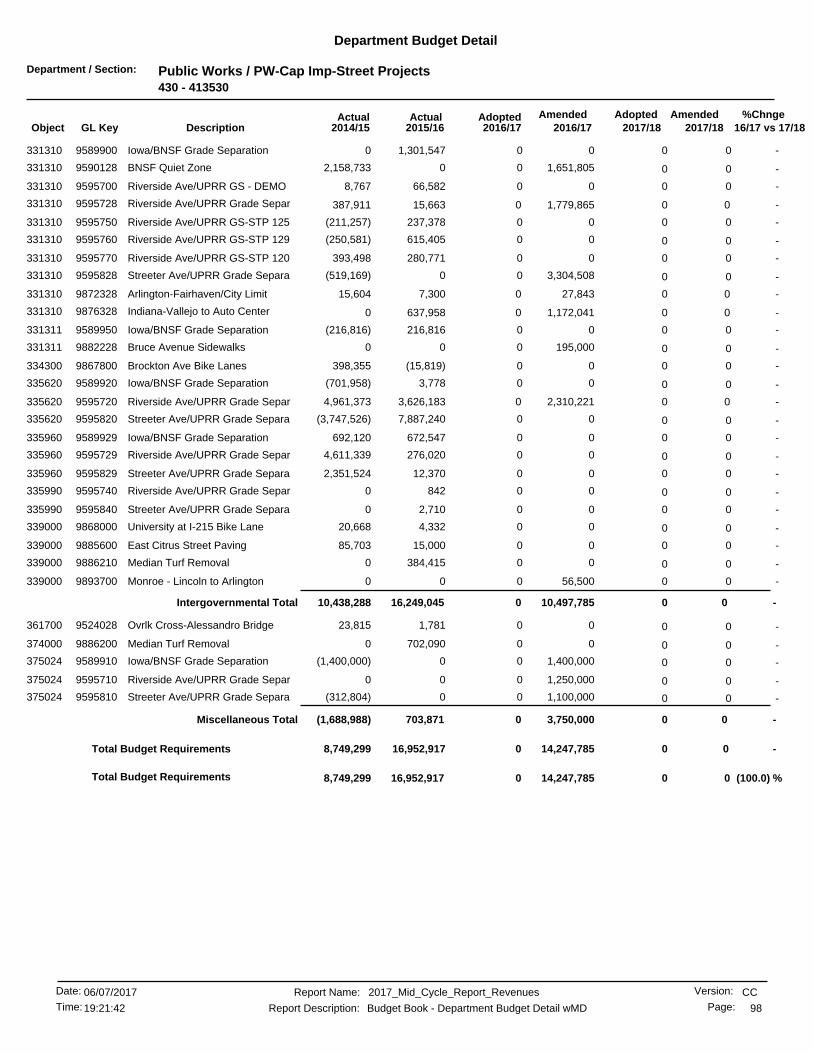
Department / Section: Public Works / PW-Cap Imp-Street Projects430 - 413530
Department Budget Detail
%Chnge16/17 vs 17/182017/182017/18
AmendedAdoptedAdopted2016/17
AmendedActualActual2016/172015/162014/15GL KeyObject Description
-0 001,301,5470Iowa/BNSF Grade Separation9589900331310 0
-0 01,651,80502,158,733BNSF Quiet Zone9590128331310 0
-0 0066,5828,767Riverside Ave/UPRR GS - DEMO9595700331310 0
-00 01,779,86515,663331310 Riverside Ave/UPRR Grade Separ9595728 387,911
-0 00237,378(211,257)Riverside Ave/UPRR GS-STP 1259595750331310 0
-0 00615,405(250,581)Riverside Ave/UPRR GS-STP 1299595760331310 0
-0 00280,771393,498Riverside Ave/UPRR GS-STP 1209595770331310 0
-0 03,304,5080(519,169)Streeter Ave/UPRR Grade Separa9595828331310 0
-00 027,8437,300331310 Arlington-Fairhaven/City Limit9872328 15,604
-00 01,172,041637,958331310 Indiana-Vallejo to Auto Center9876328 0
-0 00216,816(216,816)Iowa/BNSF Grade Separation9589950331311 0
-0 0195,00000Bruce Avenue Sidewalks9882228331311 0
-0 00(15,819)398,355Brockton Ave Bike Lanes9867800334300 0
-0 003,778(701,958)Iowa/BNSF Grade Separation9589920335620 0
-00 02,310,2213,626,183335620 Riverside Ave/UPRR Grade Separ9595720 4,961,373
-0 007,887,240(3,747,526)Streeter Ave/UPRR Grade Separa9595820335620 0
-0 00672,547692,120Iowa/BNSF Grade Separation9589929335960 0
-0 00276,0204,611,339Riverside Ave/UPRR Grade Separ9595729335960 0
-0 0012,3702,351,524Streeter Ave/UPRR Grade Separa9595829335960 0
-0 008420Riverside Ave/UPRR Grade Separ9595740335990 0
-0 002,7100Streeter Ave/UPRR Grade Separa9595840335990 0
-0 004,33220,668University at I-215 Bike Lane9868000339000 0
-0 0015,00085,703East Citrus Street Paving9885600339000 0
-0 00384,4150Median Turf Removal9886210339000 0
-0 056,50000Monroe - Lincoln to Arlington9893700339000 0
-0 0Intergovernmental Total 010,497,78516,249,04510,438,288
-0 001,78123,815Ovrlk Cross-Alessandro Bridge9524028361700 0
-0 00702,0900Median Turf Removal9886200374000 0
-0 01,400,0000(1,400,000)Iowa/BNSF Grade Separation9589910375024 0
-0 01,250,00000Riverside Ave/UPRR Grade Separ9595710375024 0
-0 01,100,0000(312,804)Streeter Ave/UPRR Grade Separa9595810375024 0
-0 0Miscellaneous Total 03,750,000703,871(1,688,988)
-0 0014,247,78516,952,9178,749,299Total Budget Requirements
(100.0) %00 014,247,78516,952,917Total Budget Requirements 8,749,299
CCReport Name: 2017_Mid_Cycle_Report_Revenues
Report Description: Budget Book - Department Budget Detail wMD
06/07/2017Date:
Time: 98
Version:
Page:19:21:42

Department / Section: Public Works / PW-Cap Imp-Traffic Signal Proj430 - 413540
Department Budget Detail
%Chnge16/17 vs 17/182017/182017/18
AmendedAdoptedAdopted2016/17
AmendedActualActual2016/172015/162014/15GL KeyObject Description
-0 00(12,564)423,676Canyon Crest Traffic Signals9880428331310 0
-0 0339,3730229,8983rd/Blaine Bike Lanes9881928331310 0
-00 0691,167707331310 3rd/BNSF RR Xing Improvements9891428 0
-00 0720,240659331310 Spruce/BNSF RR Xing Improvemts9891528 0
-0 0563,62500Chicago/BNSF RR Xing Improvmts9894728331310 0
-0 01,012,50000Magnolia-Buchanan to 1st9882028331311 0
-0 0240,00000Bicycle Share Program9882328331311 0
-0 0375,00000Magnolia-Buchanan to 1st9882034339000 0
-0 060,00000New Signal-Buchanan & Indiana9888200339000 0
-0 0Intergovernmental Total 04,001,906(11,197)653,575
-0 004,001,906(11,197)653,575Total Budget Requirements
(100.0) %00 04,001,906(11,197)Total Budget Requirements 653,575
CCReport Name: 2017_Mid_Cycle_Report_Revenues
Report Description: Budget Book - Department Budget Detail wMD
06/07/2017Date:
Time: 99
Version:
Page:19:21:42
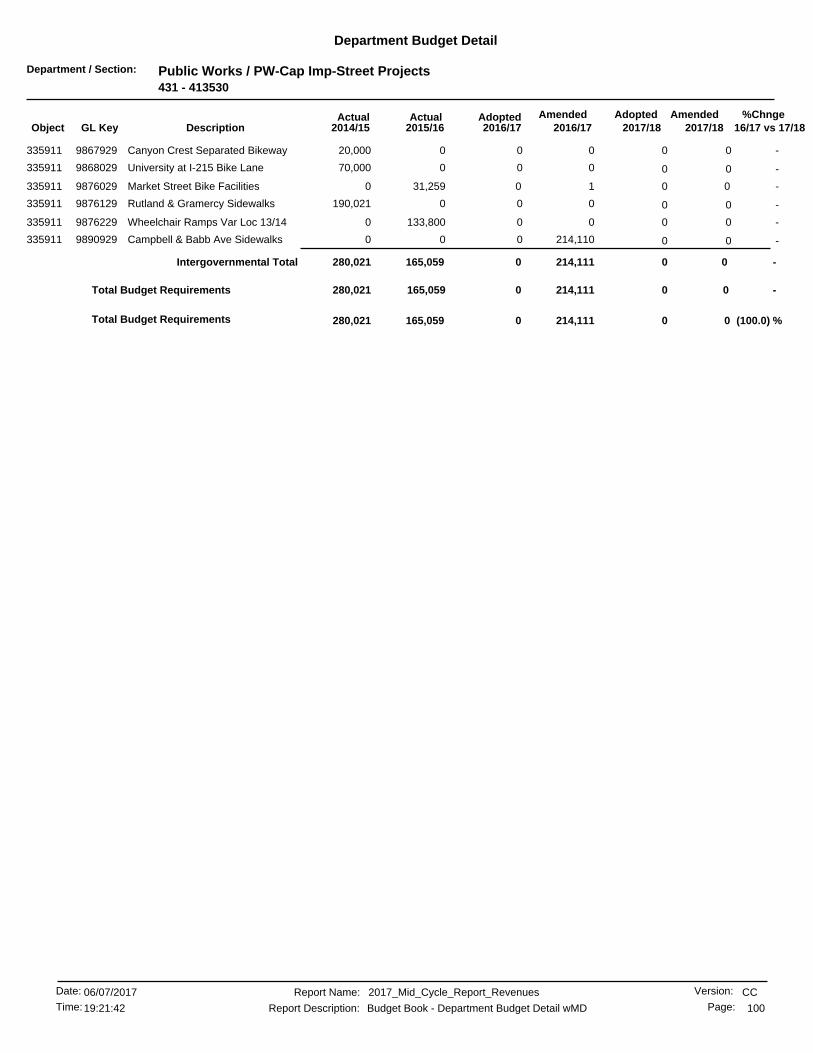
Department / Section: Public Works / PW-Cap Imp-Street Projects431 - 413530
Department Budget Detail
%Chnge16/17 vs 17/182017/182017/18
AmendedAdoptedAdopted2016/17
AmendedActualActual2016/172015/162014/15GL KeyObject Description
-0 00020,000Canyon Crest Separated Bikeway9867929335911 0
-0 00070,000University at I-215 Bike Lane9868029335911 0
-00 0131,259335911 Market Street Bike Facilities9876029 0
-0 000190,021Rutland & Gramercy Sidewalks9876129335911 0
-0 00133,8000Wheelchair Ramps Var Loc 13/149876229335911 0
-0 0214,11000Campbell & Babb Ave Sidewalks9890929335911 0
-0 0Intergovernmental Total 0214,111165,059280,021
-0 00214,111165,059280,021Total Budget Requirements
(100.0) %00 0214,111165,059Total Budget Requirements 280,021
CCReport Name: 2017_Mid_Cycle_Report_Revenues
Report Description: Budget Book - Department Budget Detail wMD
06/07/2017Date:
Time: 100
Version:
Page:19:21:42
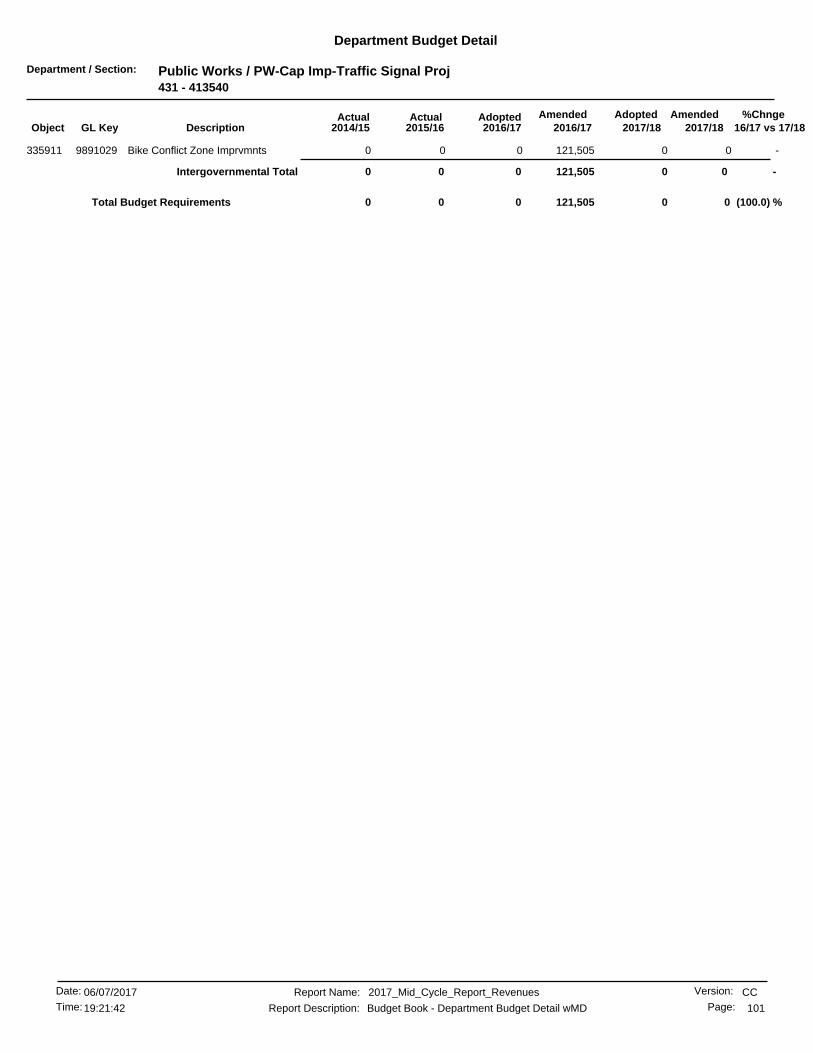
Department / Section: Public Works / PW-Cap Imp-Traffic Signal Proj431 - 413540
Department Budget Detail
%Chnge16/17 vs 17/182017/182017/18
AmendedAdoptedAdopted2016/17
AmendedActualActual2016/172015/162014/15GL KeyObject Description
-0 0121,50500Bike Conflict Zone Imprvmnts9891029335911 0
-0 0Intergovernmental Total 0121,50500
(100.0) %00 0121,5050Total Budget Requirements 0
CCReport Name: 2017_Mid_Cycle_Report_Revenues
Report Description: Budget Book - Department Budget Detail wMD
06/07/2017Date:
Time: 101
Version:
Page:19:21:42
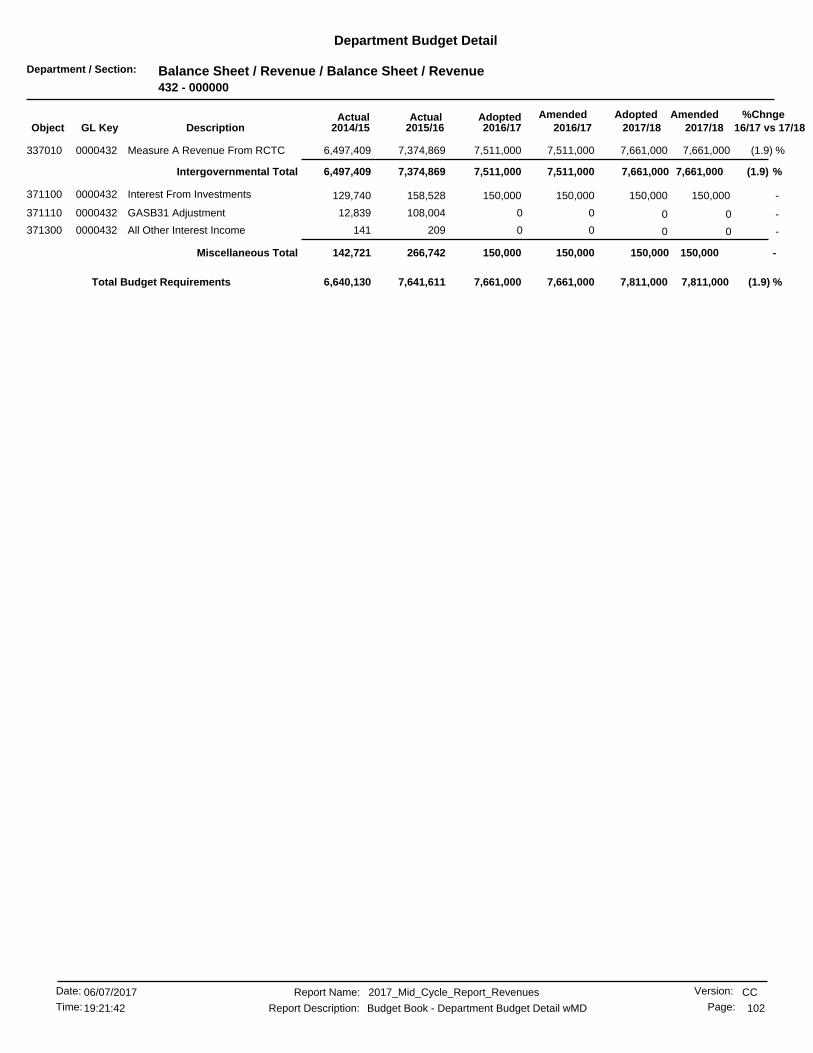
Department / Section: Balance Sheet / Revenue / Balance Sheet / Revenue432 - 000000
Department Budget Detail
%Chnge16/17 vs 17/182017/182017/18
AmendedAdoptedAdopted2016/17
AmendedActualActual2016/172015/162014/15GL KeyObject Description
(1.9) %7,661,0007,511,000 7,661,0007,511,0007,374,869337010 Measure A Revenue From RCTC0000432 6,497,409
(1.9) %7,661,0007,511,0007,511,000 7,661,000Intergovernmental Total 7,374,8696,497,409
-150,000150,000 150,000150,000158,528371100 Interest From Investments0000432 129,740
-0 00108,00412,839GASB31 Adjustment0000432371110 0
-0 00209141All Other Interest Income0000432371300 0
-150,000150,000150,000 150,000Miscellaneous Total 266,742142,721
(1.9) %7,661,000 7,811,0007,811,0007,661,0007,641,6116,640,130Total Budget Requirements
CCReport Name: 2017_Mid_Cycle_Report_Revenues
Report Description: Budget Book - Department Budget Detail wMD
06/07/2017Date:
Time: 102
Version:
Page:19:21:42
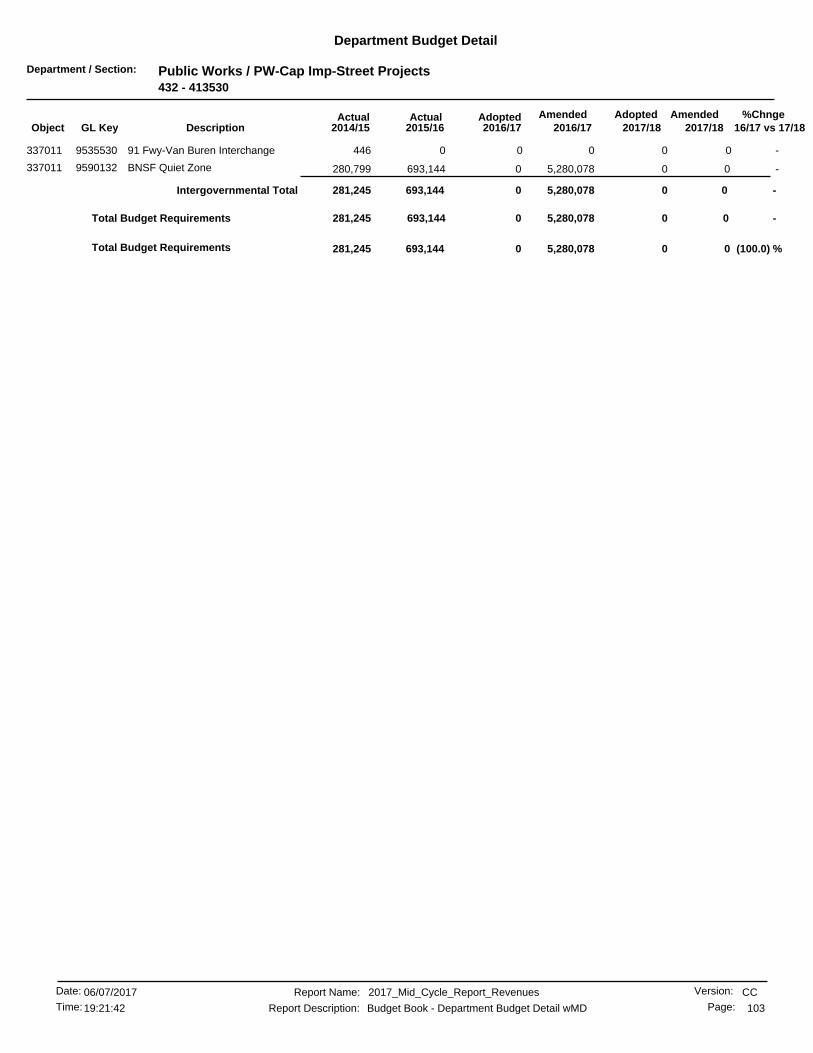
Department / Section: Public Works / PW-Cap Imp-Street Projects432 - 413530
Department Budget Detail
%Chnge16/17 vs 17/182017/182017/18
AmendedAdoptedAdopted2016/17
AmendedActualActual2016/172015/162014/15GL KeyObject Description
-0 00044691 Fwy-Van Buren Interchange9535530337011 0
-00 05,280,078693,144337011 BNSF Quiet Zone9590132 280,799
-0 0Intergovernmental Total 05,280,078693,144281,245
-0 005,280,078693,144281,245Total Budget Requirements
(100.0) %00 05,280,078693,144Total Budget Requirements 281,245
CCReport Name: 2017_Mid_Cycle_Report_Revenues
Report Description: Budget Book - Department Budget Detail wMD
06/07/2017Date:
Time: 103
Version:
Page:19:21:42
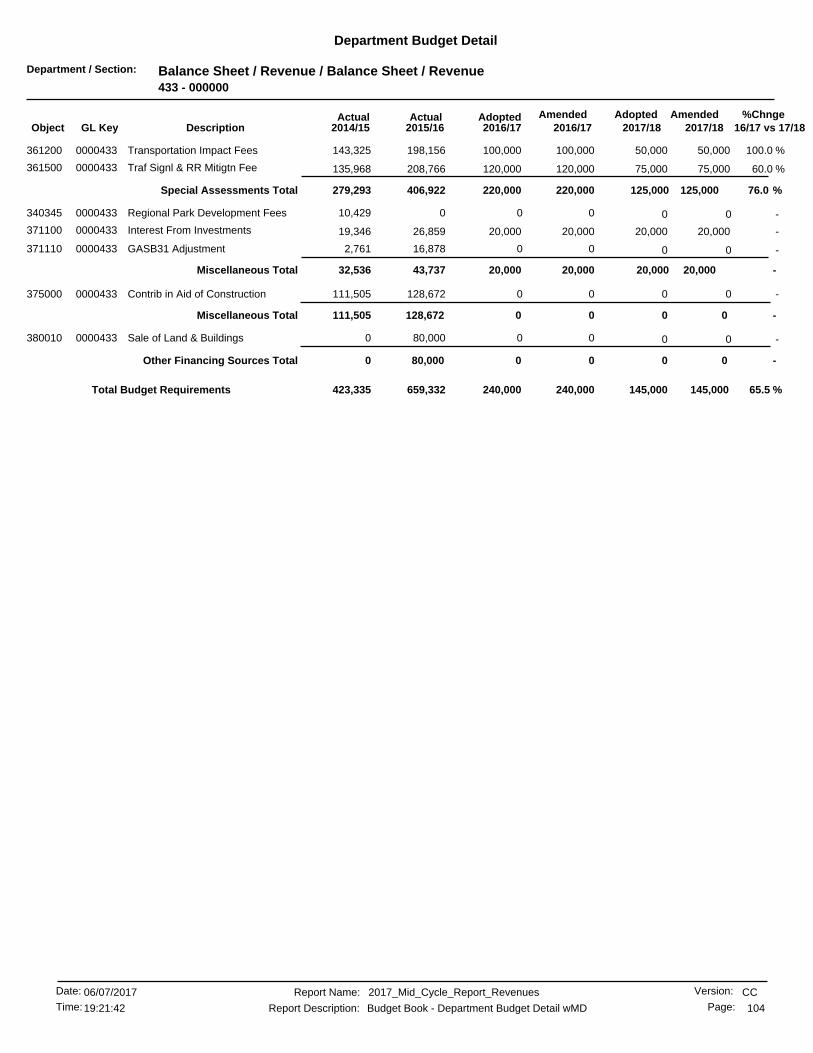
Department / Section: Balance Sheet / Revenue / Balance Sheet / Revenue433 - 000000
Department Budget Detail
%Chnge16/17 vs 17/182017/182017/18
AmendedAdoptedAdopted2016/17
AmendedActualActual2016/172015/162014/15GL KeyObject Description
100.0 %50,000100,000 50,000100,000198,156361200 Transportation Impact Fees0000433 143,325
60.0 %75,000120,000 75,000120,000208,766361500 Traf Signl & RR Mitigtn Fee0000433 135,968
76.0 %125,000220,000220,000 125,000Special Assessments Total 406,922279,293
-0 00010,429Regional Park Development Fees0000433340345 0
-20,00020,000 20,00020,00026,859371100 Interest From Investments0000433 19,346
-0 0016,8782,761GASB31 Adjustment0000433371110 0
-20,00020,00020,000 20,000Miscellaneous Total 43,73732,536
-0 00128,672111,505Contrib in Aid of Construction0000433375000 0
-0 0Miscellaneous Total 00128,672111,505
-0 0080,0000Sale of Land & Buildings0000433380010 0
-0 0Other Financing Sources Total 0080,0000
65.5 %240,000 145,000145,000240,000659,332423,335Total Budget Requirements
CCReport Name: 2017_Mid_Cycle_Report_Revenues
Report Description: Budget Book - Department Budget Detail wMD
06/07/2017Date:
Time: 104
Version:
Page:19:21:42

Department / Section: Public Works / PW-Cap Imp-Street Projects433 - 413530
Department Budget Detail
%Chnge16/17 vs 17/182017/182017/18
AmendedAdoptedAdopted2016/17
AmendedActualActual2016/172015/162014/15GL KeyObject Description
-0 003128Ovrlk Cross-Alessandro Bridge9524036361700 0
-0 0Miscellaneous Total 003128
-00 0031Total Budget Requirements 28
CCReport Name: 2017_Mid_Cycle_Report_Revenues
Report Description: Budget Book - Department Budget Detail wMD
06/07/2017Date:
Time: 105
Version:
Page:19:21:42

Department / Section: Balance Sheet / Revenue / Balance Sheet / Revenue434 - 000000
Department Budget Detail
%Chnge16/17 vs 17/182017/182017/18
AmendedAdoptedAdopted2016/17
AmendedActualActual2016/172015/162014/15GL KeyObject Description
-0 0058,2140Operating Trnsfr from 431 Fund0000434985431 0
-0 0Operating Transfers In Total 0058,2140
-00 0058,214Total Budget Requirements 0
CCReport Name: 2017_Mid_Cycle_Report_Revenues
Report Description: Budget Book - Department Budget Detail wMD
06/07/2017Date:
Time: 106
Version:
Page:19:21:42

Department / Section: Public Works / PW-Cap Imp-Street Projects434 - 413530
Department Budget Detail
%Chnge16/17 vs 17/182017/182017/18
AmendedAdoptedAdopted2016/17
AmendedActualActual2016/172015/162014/15GL KeyObject Description
-00 02,958,76910,917339100 91 Fwy-Van Buren9535519 58,062
-0 00889(7)Columbia Ave/BNSF Grade Sep9587919339100 0
-00 01,660,0001,600,000339100 Magnolia Grade Separation9589719 1,600,000
-0 0Intergovernmental Total 04,618,7691,611,8061,658,054
-0 004,618,7691,611,8061,658,054Total Budget Requirements
(100.0) %00 04,618,7691,611,806Total Budget Requirements 1,658,054
CCReport Name: 2017_Mid_Cycle_Report_Revenues
Report Description: Budget Book - Department Budget Detail wMD
06/07/2017Date:
Time: 107
Version:
Page:19:21:42
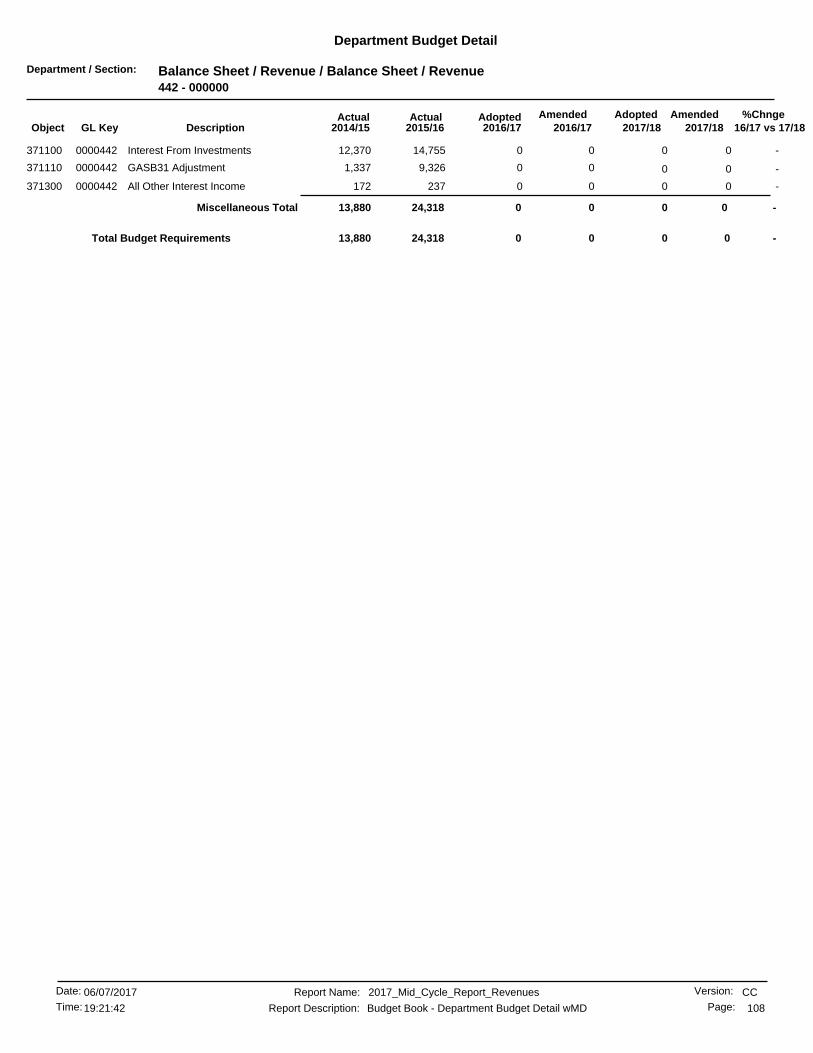
Department / Section: Balance Sheet / Revenue / Balance Sheet / Revenue442 - 000000
Department Budget Detail
%Chnge16/17 vs 17/182017/182017/18
AmendedAdoptedAdopted2016/17
AmendedActualActual2016/172015/162014/15GL KeyObject Description
-0 0014,75512,370Interest From Investments0000442371100 0
-0 009,3261,337GASB31 Adjustment0000442371110 0
-0 00237172All Other Interest Income0000442371300 0
-0 0Miscellaneous Total 0024,31813,880
-00 0024,318Total Budget Requirements 13,880
CCReport Name: 2017_Mid_Cycle_Report_Revenues
Report Description: Budget Book - Department Budget Detail wMD
06/07/2017Date:
Time: 108
Version:
Page:19:21:42

Department / Section: Balance Sheet / Revenue / Balance Sheet / Revenue450 - 000000
Department Budget Detail
%Chnge16/17 vs 17/182017/182017/18
AmendedAdoptedAdopted2016/17
AmendedActualActual2016/172015/162014/15GL KeyObject Description
-0 001,5261,268Interest From Investments0000450371100 0
-0 00963134GASB31 Adjustment0000450371110 0
-0 0Miscellaneous Total 002,4891,403
-00 002,489Total Budget Requirements 1,403
CCReport Name: 2017_Mid_Cycle_Report_Revenues
Report Description: Budget Book - Department Budget Detail wMD
06/07/2017Date:
Time: 109
Version:
Page:19:21:42
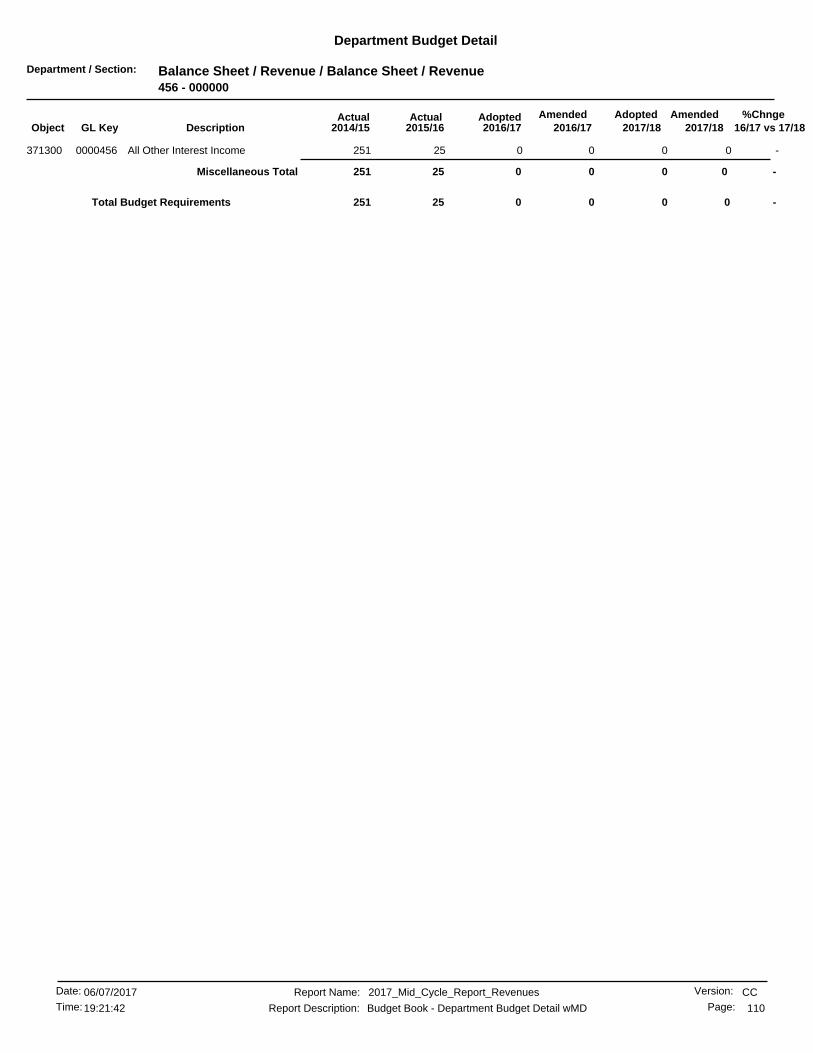
Department / Section: Balance Sheet / Revenue / Balance Sheet / Revenue456 - 000000
Department Budget Detail
%Chnge16/17 vs 17/182017/182017/18
AmendedAdoptedAdopted2016/17
AmendedActualActual2016/172015/162014/15GL KeyObject Description
-0 0025251All Other Interest Income0000456371300 0
-0 0Miscellaneous Total 0025251
-00 0025Total Budget Requirements 251
CCReport Name: 2017_Mid_Cycle_Report_Revenues
Report Description: Budget Book - Department Budget Detail wMD
06/07/2017Date:
Time: 110
Version:
Page:19:21:42

Department / Section: Balance Sheet / Revenue / Balance Sheet / Revenue458 - 000000
Department Budget Detail
%Chnge16/17 vs 17/182017/182017/18
AmendedAdoptedAdopted2016/17
AmendedActualActual2016/172015/162014/15GL KeyObject Description
-0 004570Interest From Investments0000458371100 0
-0 003990GASB31 Adjustment0000458371110 0
-0 000463All Other Interest Income0000458371300 0
-0 0Miscellaneous Total 00857463
-00 00857Total Budget Requirements 463
CCReport Name: 2017_Mid_Cycle_Report_Revenues
Report Description: Budget Book - Department Budget Detail wMD
06/07/2017Date:
Time: 111
Version:
Page:19:21:42

Department / Section: Balance Sheet / Revenue / Balance Sheet / Revenue459 - 000000
Department Budget Detail
%Chnge16/17 vs 17/182017/182017/18
AmendedAdoptedAdopted2016/17
AmendedActualActual2016/172015/162014/15GL KeyObject Description
-0 009770All Other Interest Income0000459371300 0
-0 0Miscellaneous Total 009770
-0 006,224,9190Operating Transfer fm 759 Fund0000459985759 0
-0 0Operating Transfers In Total 006,224,9190
-00 006,225,896Total Budget Requirements 0
CCReport Name: 2017_Mid_Cycle_Report_Revenues
Report Description: Budget Book - Department Budget Detail wMD
06/07/2017Date:
Time: 112
Version:
Page:19:21:42
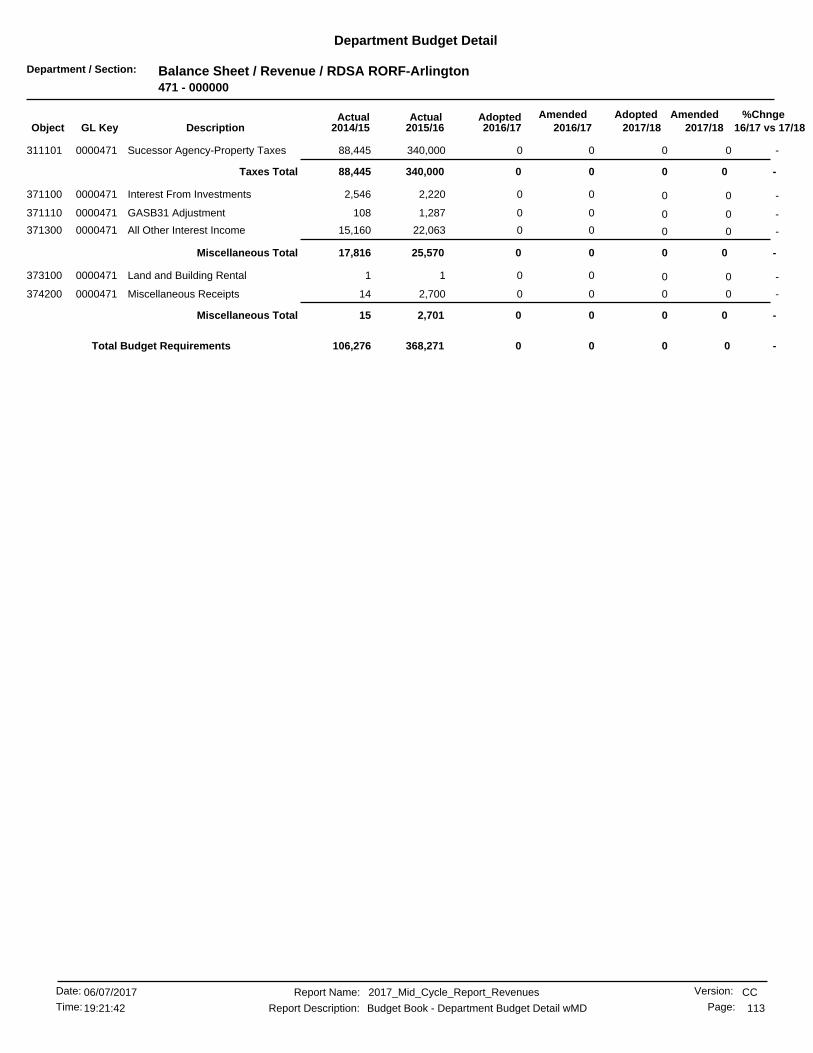
Department / Section: Balance Sheet / Revenue / RDSA RORF-Arlington471 - 000000
Department Budget Detail
%Chnge16/17 vs 17/182017/182017/18
AmendedAdoptedAdopted2016/17
AmendedActualActual2016/172015/162014/15GL KeyObject Description
-0 00340,00088,445Sucessor Agency-Property Taxes0000471311101 0
-0 0Taxes Total 00340,00088,445
-0 002,2202,546Interest From Investments0000471371100 0
-0 001,287108GASB31 Adjustment0000471371110 0
-0 0022,06315,160All Other Interest Income0000471371300 0
-0 0Miscellaneous Total 0025,57017,816
-0 0011Land and Building Rental0000471373100 0
-0 002,70014Miscellaneous Receipts0000471374200 0
-0 0Miscellaneous Total 002,70115
-00 00368,271Total Budget Requirements 106,276
CCReport Name: 2017_Mid_Cycle_Report_Revenues
Report Description: Budget Book - Department Budget Detail wMD
06/07/2017Date:
Time: 113
Version:
Page:19:21:42

Department / Section: Balance Sheet / Revenue / RDSA RORF-Casa Blanca472 - 000000
Department Budget Detail
%Chnge16/17 vs 17/182017/182017/18
AmendedAdoptedAdopted2016/17
AmendedActualActual2016/172015/162014/15GL KeyObject Description
-0 0030,00015,000Sucessor Agency-Property Taxes0000472311101 0
-0 0Taxes Total 0030,00015,000
-0 001,356(9,598)Interest From Investments0000472371100 0
-0 007,48710,942All Other Interest Income0000472371300 0
-0 0Miscellaneous Total 008,8431,343
-0 00150Miscellaneous Receipts0000472374200 0
-0 0Miscellaneous Total 00150
-00 0038,859Total Budget Requirements 16,343
CCReport Name: 2017_Mid_Cycle_Report_Revenues
Report Description: Budget Book - Department Budget Detail wMD
06/07/2017Date:
Time: 114
Version:
Page:19:21:42
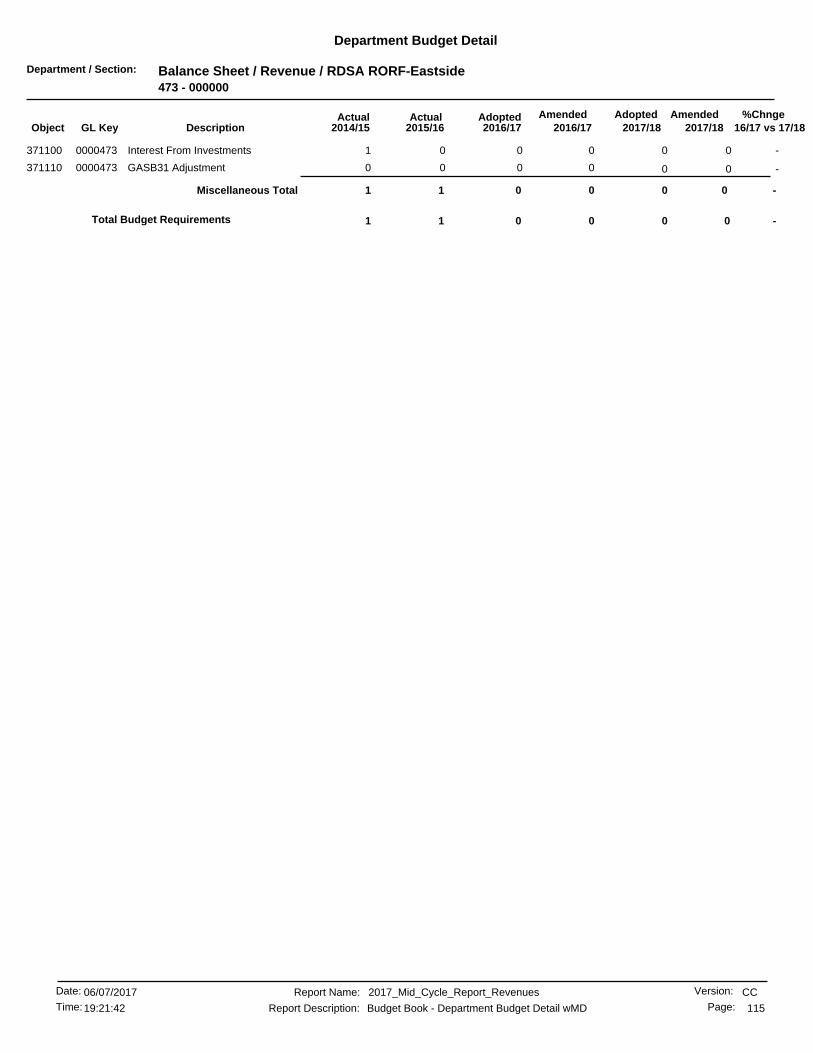
Department / Section: Balance Sheet / Revenue / RDSA RORF-Eastside473 - 000000
Department Budget Detail
%Chnge16/17 vs 17/182017/182017/18
AmendedAdoptedAdopted2016/17
AmendedActualActual2016/172015/162014/15GL KeyObject Description
-0 0001Interest From Investments0000473371100 0
-0 0000GASB31 Adjustment0000473371110 0
-0 0Miscellaneous Total 0011
-00 001Total Budget Requirements 1
CCReport Name: 2017_Mid_Cycle_Report_Revenues
Report Description: Budget Book - Department Budget Detail wMD
06/07/2017Date:
Time: 115
Version:
Page:19:21:42
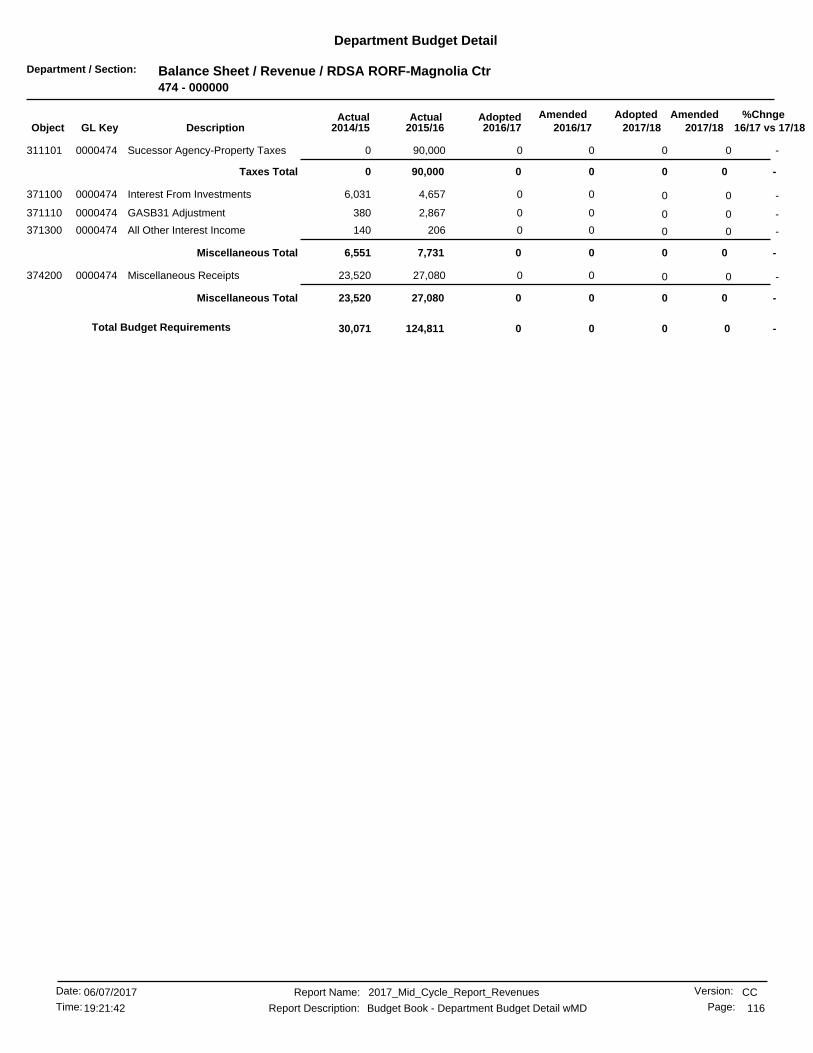
Department / Section: Balance Sheet / Revenue / RDSA RORF-Magnolia Ctr474 - 000000
Department Budget Detail
%Chnge16/17 vs 17/182017/182017/18
AmendedAdoptedAdopted2016/17
AmendedActualActual2016/172015/162014/15GL KeyObject Description
-0 0090,0000Sucessor Agency-Property Taxes0000474311101 0
-0 0Taxes Total 0090,0000
-0 004,6576,031Interest From Investments0000474371100 0
-0 002,867380GASB31 Adjustment0000474371110 0
-0 00206140All Other Interest Income0000474371300 0
-0 0Miscellaneous Total 007,7316,551
-0 0027,08023,520Miscellaneous Receipts0000474374200 0
-0 0Miscellaneous Total 0027,08023,520
-00 00124,811Total Budget Requirements 30,071
CCReport Name: 2017_Mid_Cycle_Report_Revenues
Report Description: Budget Book - Department Budget Detail wMD
06/07/2017Date:
Time: 116
Version:
Page:19:21:42

Department / Section: Balance Sheet / Revenue / RDSA RORF-Univ Corr/Syc Cyn476 - 000000
Department Budget Detail
%Chnge16/17 vs 17/182017/182017/18
AmendedAdoptedAdopted2016/17
AmendedActualActual2016/172015/162014/15GL KeyObject Description
-0 001,008,202227,152Sucessor Agency-Property Taxes0000476311101 0
-0 0Taxes Total 001,008,202227,152
-0 0021,10223,140Interest From Investments0000476371100 0
-0 0010,576(1,132)GASB31 Adjustment0000476371110 0
-0 00040,885Interest From Loans0000476371200 0
-0 00348237All Other Interest Income0000476371300 0
-0 0Miscellaneous Total 0032,02763,131
-0 0026,80022,800Land and Building Rental0000476373100 0
-0 00(111,377)(82,254)Miscellaneous Receipts0000476374200 0
-0 0Miscellaneous Total 00(84,577)(59,454)
-0 000(394,619)Sale of Land & Buildings0000476380010 0
-0 0Other Financing Sources Total 000(394,619)
-00 00955,652Total Budget Requirements (163,791)
CCReport Name: 2017_Mid_Cycle_Report_Revenues
Report Description: Budget Book - Department Budget Detail wMD
06/07/2017Date:
Time: 117
Version:
Page:19:21:42
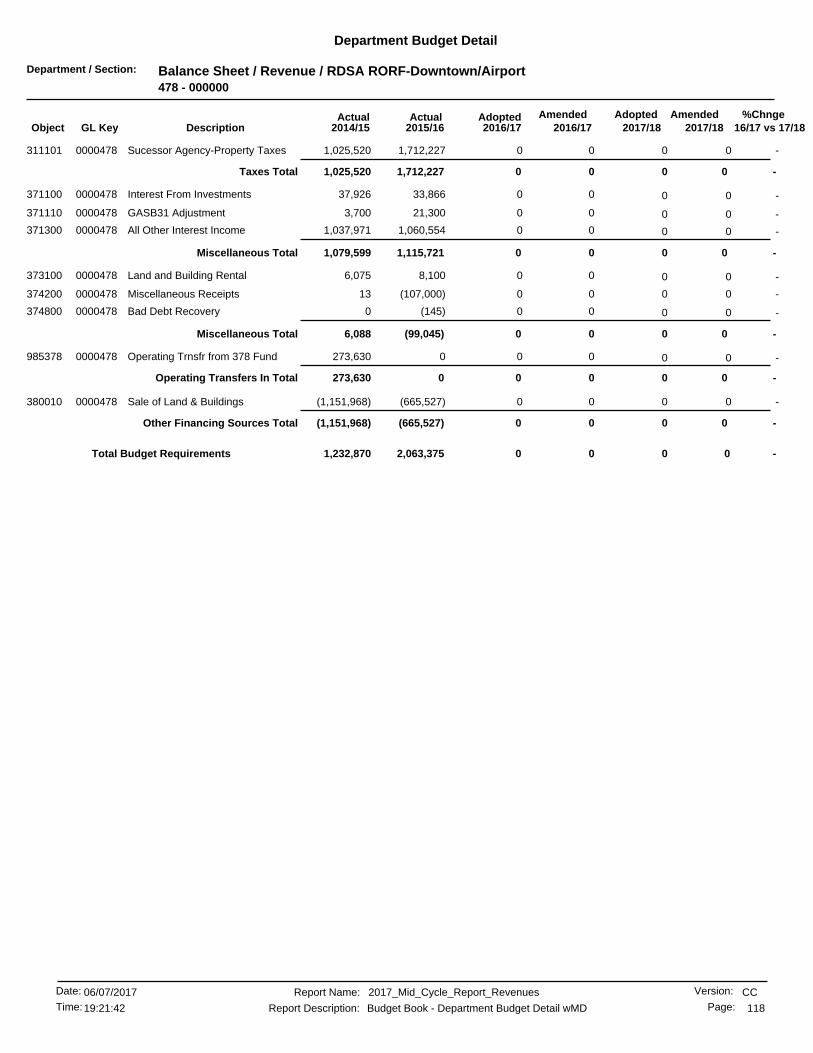
Department / Section: Balance Sheet / Revenue / RDSA RORF-Downtown/Airport478 - 000000
Department Budget Detail
%Chnge16/17 vs 17/182017/182017/18
AmendedAdoptedAdopted2016/17
AmendedActualActual2016/172015/162014/15GL KeyObject Description
-0 001,712,2271,025,520Sucessor Agency-Property Taxes0000478311101 0
-0 0Taxes Total 001,712,2271,025,520
-0 0033,86637,926Interest From Investments0000478371100 0
-0 0021,3003,700GASB31 Adjustment0000478371110 0
-0 001,060,5541,037,971All Other Interest Income0000478371300 0
-0 0Miscellaneous Total 001,115,7211,079,599
-0 008,1006,075Land and Building Rental0000478373100 0
-0 00(107,000)13Miscellaneous Receipts0000478374200 0
-0 00(145)0Bad Debt Recovery0000478374800 0
-0 0Miscellaneous Total 00(99,045)6,088
-0 000273,630Operating Trnsfr from 378 Fund0000478985378 0
-0 0Operating Transfers In Total 000273,630
-0 00(665,527)(1,151,968)Sale of Land & Buildings0000478380010 0
-0 0Other Financing Sources Total 00(665,527)(1,151,968)
-00 002,063,375Total Budget Requirements 1,232,870
CCReport Name: 2017_Mid_Cycle_Report_Revenues
Report Description: Budget Book - Department Budget Detail wMD
06/07/2017Date:
Time: 118
Version:
Page:19:21:42
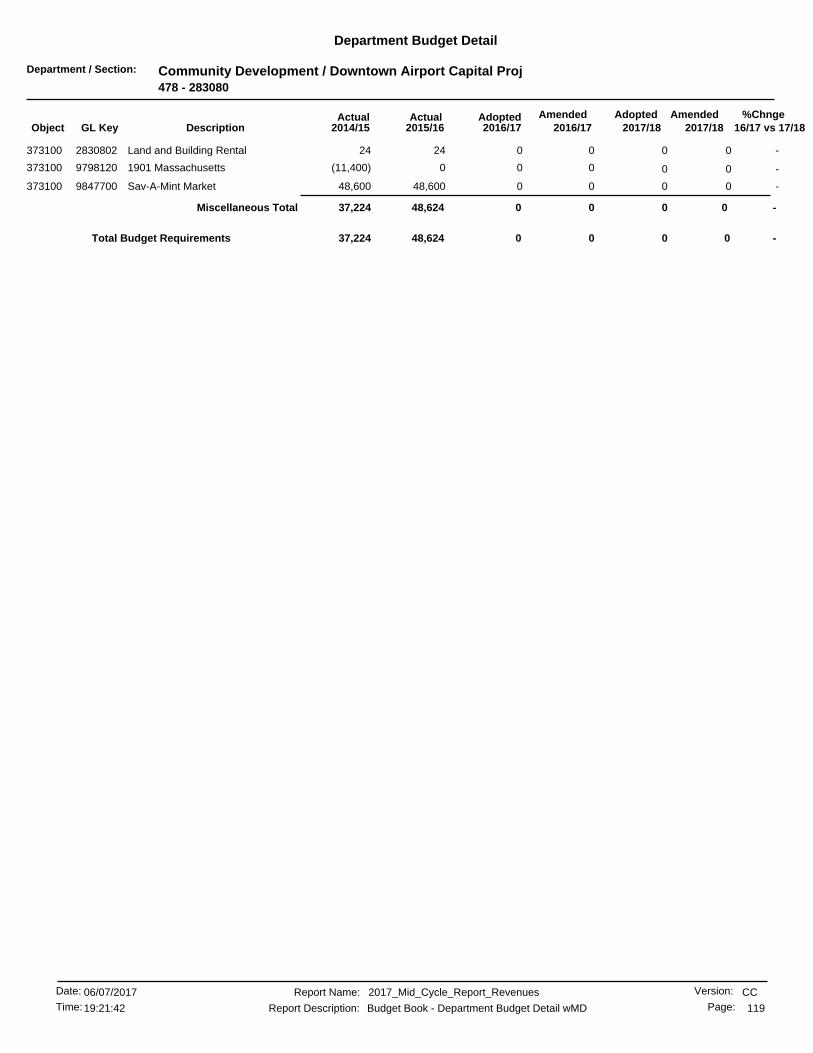
Department / Section: Community Development / Downtown Airport Capital Proj478 - 283080
Department Budget Detail
%Chnge16/17 vs 17/182017/182017/18
AmendedAdoptedAdopted2016/17
AmendedActualActual2016/172015/162014/15GL KeyObject Description
-0 002424Land and Building Rental2830802373100 0
-0 000(11,400)1901 Massachusetts9798120373100 0
-0 0048,60048,600Sav-A-Mint Market9847700373100 0
-0 0Miscellaneous Total 0048,62437,224
-00 0048,624Total Budget Requirements 37,224
CCReport Name: 2017_Mid_Cycle_Report_Revenues
Report Description: Budget Book - Department Budget Detail wMD
06/07/2017Date:
Time: 119
Version:
Page:19:21:42

Department / Section: Community Development / Downtown Air Cal Capital Proj478 - 283083
Department Budget Detail
%Chnge16/17 vs 17/182017/182017/18
AmendedAdoptedAdopted2016/17
AmendedActualActual2016/172015/162014/15GL KeyObject Description
-0 0003All Other Interest Income2830831371300 0
-0 0Miscellaneous Total 0003
-00 000Total Budget Requirements 3
CCReport Name: 2017_Mid_Cycle_Report_Revenues
Report Description: Budget Book - Department Budget Detail wMD
06/07/2017Date:
Time: 120
Version:
Page:19:21:42

Department / Section: Balance Sheet / Revenue / Balance Sheet / Revenue479 - 000000
Department Budget Detail
%Chnge16/17 vs 17/182017/182017/18
AmendedAdoptedAdopted2016/17
AmendedActualActual2016/172015/162014/15GL KeyObject Description
-0 00120,000286,492Sucessor Agency-Property Taxes0000479311101 0
-0 0Taxes Total 00120,000286,492
-0 0045,2981,004Interest From Investments0000479371100 0
-0 0028,671(1,573)GASB31 Adjustment0000479371110 0
-0 007,99713,410All Other Interest Income0000479371300 0
-0 0Miscellaneous Total 0081,96712,841
-0 00(1,457,892)0Sale of Land & Buildings0000479380010 0
-0 0Other Financing Sources Total 00(1,457,892)0
-00 00(1,255,925)Total Budget Requirements 299,333
CCReport Name: 2017_Mid_Cycle_Report_Revenues
Report Description: Budget Book - Department Budget Detail wMD
06/07/2017Date:
Time: 121
Version:
Page:19:21:42

Department / Section: Community Development / La Sierra/Arlanza Proj Area479 - 283090
Department Budget Detail
%Chnge16/17 vs 17/182017/182017/18
AmendedAdoptedAdopted2016/17
AmendedActualActual2016/172015/162014/15GL KeyObject Description
-0 0075Five Point St Imp-TI9830200371300 0
-0 0Miscellaneous Total 0075
-0 0011,28011,28011134/11144 Pierce St-TI9854010373100 0
-0 0Miscellaneous Total 0011,28011,280
-00 0011,287Total Budget Requirements 11,285
CCReport Name: 2017_Mid_Cycle_Report_Revenues
Report Description: Budget Book - Department Budget Detail wMD
06/07/2017Date:
Time: 122
Version:
Page:19:21:42
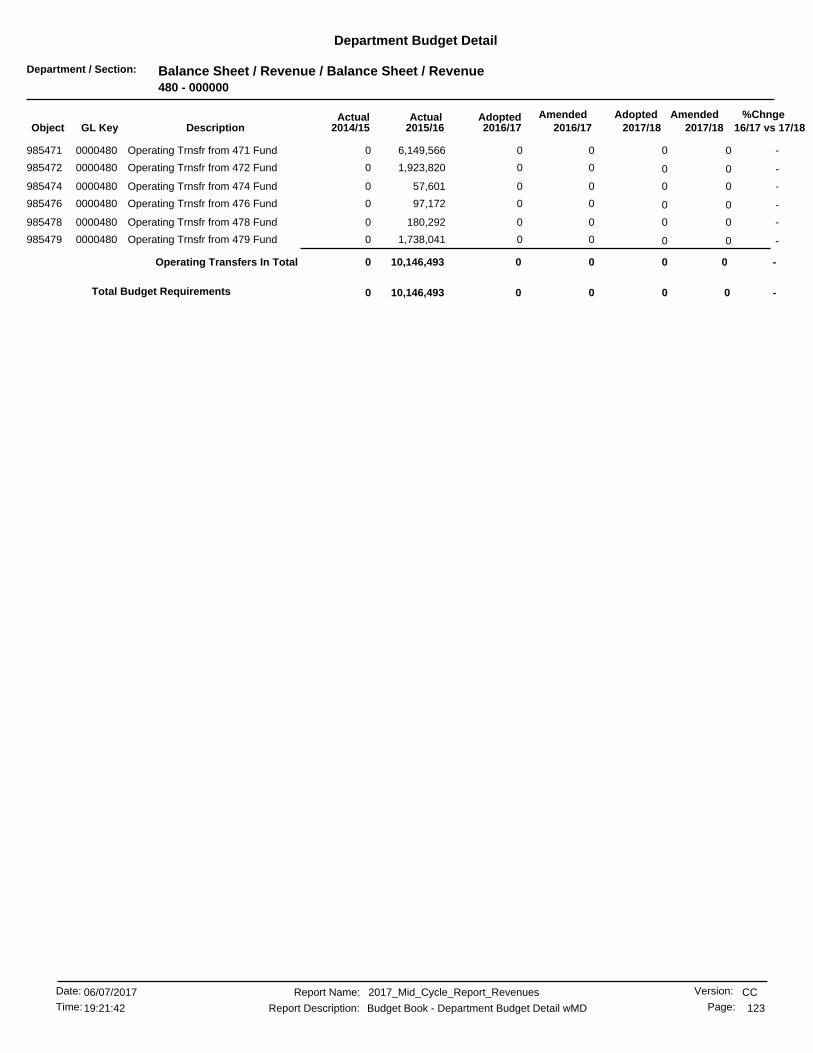
Department / Section: Balance Sheet / Revenue / Balance Sheet / Revenue480 - 000000
Department Budget Detail
%Chnge16/17 vs 17/182017/182017/18
AmendedAdoptedAdopted2016/17
AmendedActualActual2016/172015/162014/15GL KeyObject Description
-0 006,149,5660Operating Trnsfr from 471 Fund0000480985471 0
-0 001,923,8200Operating Trnsfr from 472 Fund0000480985472 0
-0 0057,6010Operating Trnsfr from 474 Fund0000480985474 0
-0 0097,1720Operating Trnsfr from 476 Fund0000480985476 0
-0 00180,2920Operating Trnsfr from 478 Fund0000480985478 0
-0 001,738,0410Operating Trnsfr from 479 Fund0000480985479 0
-0 0Operating Transfers In Total 0010,146,4930
-00 0010,146,493Total Budget Requirements 0
CCReport Name: 2017_Mid_Cycle_Report_Revenues
Report Description: Budget Book - Department Budget Detail wMD
06/07/2017Date:
Time: 123
Version:
Page:19:21:42

Department / Section: Balance Sheet / Revenue / Balance Sheet / Revenue510 - 000000
Department Budget Detail
%Chnge16/17 vs 17/182017/182017/18
AmendedAdoptedAdopted2016/17
AmendedActualActual2016/172015/162014/15GL KeyObject Description
( .0) %107,168,900107,144,200 107,168,900107,144,200110,819,274344110 General Residential Sales0000510 108,000,943
-778,400778,400 778,400778,400744,080344120 All-Electric Homes0000510 807,094
-787,100787,100 787,100787,100795,683344130 Electric Water Heating0000510 796,466
-340,700340,700 340,700340,700321,846344140 Electric Space Heating0000510 351,416
-103,400103,400 103,400103,400104,984344150 Outdoor/Private Area Lighting0000510 103,825
-20,30020,300 20,30020,300337,942344160 Domestic Time Of Use0000510 439,425
-1,999,3001,999,300 1,999,3001,999,3002,246,119344170 Lifeline Patients0000510 1,949,834
-1,739,0001,739,000 1,739,0001,739,0001,731,575344180 Domestic Multi-Family0000510 1,766,917
(1.8) %48,574,30047,687,500 48,574,30047,687,50045,752,664344210 Gen. Service Connected Load0000510 45,125,178
(1.7) %24,988,00024,556,000 24,988,00024,556,00023,766,368344211 General Service Demand Rate0000510 23,263,359
-179,600179,600 179,600179,600179,596344212 Unmetered Commercial Sales0000510 179,596
-8,1008,100 8,1008,10060,362344240 Wind Machines0000510 3,993
-2,0002,000 2,0002,0001,706344245 Green Power Premium0000510 2,378
-122,300122,300 122,300122,300105,345344250 Power Agriculture & Pumping0000510 1,030,773
.9 %27,822,30028,089,300 27,822,30028,089,30025,917,959344265 Contract Customers0000510 28,866,254
(2.3) %94,894,80092,652,500 94,894,80092,652,50087,560,864344270 Schedule Time Of Use0000510 83,142,138
-274,900274,900 274,900274,900277,487344272 Stand-by Charge0000510 275,064
-4,380,1004,380,100 4,380,1004,380,1004,404,408344380 Street & Highway Lighting0000510 4,390,807
-122,500122,500 122,500122,500120,588344390 Traffic Signals0000510 126,098
-371,000371,000 371,000371,000925,792344410 Service Connect Charges-Elec0000510 465,139
-2,861,0002,861,000 2,861,0002,861,0002,129,178344491 Misc Service Revenues-Electric0000510 2,029,614
-17,80017,800 17,80017,80027,624344492 Misc Operating Revenues-Elec0000510 19,648
-20,00020,000 20,00020,0001,254344493 Corona Fees- Rev0000510 1,090
(4.6) %5,000,0004,767,000 5,000,0004,767,0003,697,889344511 Cap and Trade Auction0000510 4,282,502
(3.8) %749,100720,500 749,100720,500644,071344513 Non Energy Recpts ABC Admin OH0000510 856,011
(1.2) %35,514,00035,062,000 35,514,00035,062,00032,923,558344518 Transmission Revenue Requiremt0000510 30,587,469
-0 002,60560,111Outside Sales - Wholesale0000510344519 0
(1.1) %358,838,900354,806,500354,806,500 358,838,900Charges for Services Total 345,600,831338,923,158
(19.9) %3,072,0002,458,000 3,072,0002,458,0002,235,579371100 Interest From Investments0000510 1,843,367
-0 001,366,747(854,965)GASB31 Adjustment0000510371110 0
(2.5) %2,228,0002,171,000 2,228,0002,171,000939,969371300 All Other Interest Income0000510 2,033,441
23.9 %568,000704,000 568,000704,000600,335371400 Bond Interest0000510 799,166
(9.1) %5,868,0005,333,0005,333,000 5,868,000Miscellaneous Total 5,142,6313,821,011
1.9%1,994,080 1,955,1600334,050477,654Land and Building Rental0000510373100 1,955,160
(4.0) %74,00071,000 74,00071,00081,931373120 Other Property Rental0000510 68,324
-216,900216,900 216,900216,900238,789373125 Pole Attachments0000510 215,697
-391,000391,000 391,000391,000423,807373126 Substation Operation & Maint0000510 423,367
-588,400588,400 588,400588,400670,931373127 Substation Leasing0000510 628,338
-268,200268,200 268,200268,200262,298373128 Communication Services0000510 271,351
-688,600688,600 688,600688,600671,299373132 CIS User Fee0000510 0
-0 00025Refunds and Reimbursements0000510374000 0
-115,000115,000 115,000115,000126,383374200 Miscellaneous Receipts0000510 98,560
-0 00(352)(271)Cash Over/Shortage0000510374207 0
-0 009441,097Asset Forfeiture Revenue0000510374500 0
-4,3004,300 4,3004,3006,168374800 Bad Debt Recovery0000510 1,963
CCReport Name: 2017_Mid_Cycle_Report_Revenues
Report Description: Budget Book - Department Budget Detail wMD
06/07/2017Date:
Time: 124
Version:
Page:19:21:42

Department / Section: Balance Sheet / Revenue / Balance Sheet / Revenue510 - 000000
Department Budget Detail
%Chnge16/17 vs 17/182017/182017/18
AmendedAdoptedAdopted2016/17
AmendedActualActual2016/172015/162014/15GL KeyObject Description
-0 001,676,02713,339Settlement Recovery0000510374801 0
-0 009,457,1861,197,878Settlement Recovery - SONGS0000510374802 0
-0 002,327,8920Liquidated Damages0000510374810 0
(10.5) %1,900,0001,700,000 1,900,0001,700,0002,827,394375000 Contrib in Aid of Construction0000510 1,955,562
-0 0012,439,706450,522Contrib in Aid Contr - NonCash0000510375030 0
(2.6) %6,201,5604,043,4006,037,480 6,201,560Miscellaneous Total 31,544,4585,803,412
-51,00051,000 51,00051,00025,177380030 Sale of Salvage Materials0000510 23,433
-431,000431,000 431,000431,000457,292380100 Damage Claim Recoveries0000510 319,646
-482,000482,000482,000 482,000Other Financing Sources Total 482,470343,079
(1.2) %366,658,980 371,390,460371,390,460364,664,900382,770,391348,890,660Total Budget Requirements
CCReport Name: 2017_Mid_Cycle_Report_Revenues
Report Description: Budget Book - Department Budget Detail wMD
06/07/2017Date:
Time: 125
Version:
Page:19:21:42
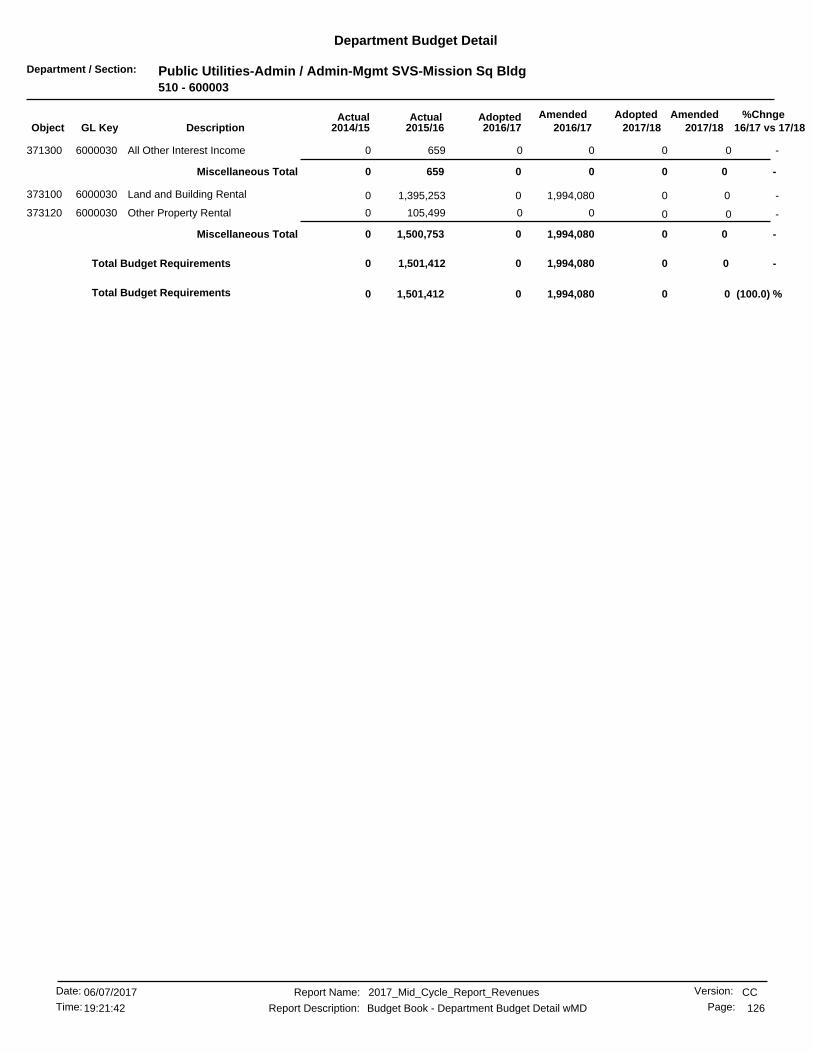
Department / Section: Public Utilities-Admin / Admin-Mgmt SVS-Mission Sq Bldg510 - 600003
Department Budget Detail
%Chnge16/17 vs 17/182017/182017/18
AmendedAdoptedAdopted2016/17
AmendedActualActual2016/172015/162014/15GL KeyObject Description
-0 006590All Other Interest Income6000030371300 0
-0 0Miscellaneous Total 006590
-00 01,994,0801,395,253373100 Land and Building Rental6000030 0
-0 00105,4990Other Property Rental6000030373120 0
-0 0Miscellaneous Total 01,994,0801,500,7530
-0 001,994,0801,501,4120Total Budget Requirements
(100.0) %00 01,994,0801,501,412Total Budget Requirements 0
CCReport Name: 2017_Mid_Cycle_Report_Revenues
Report Description: Budget Book - Department Budget Detail wMD
06/07/2017Date:
Time: 126
Version:
Page:19:21:42
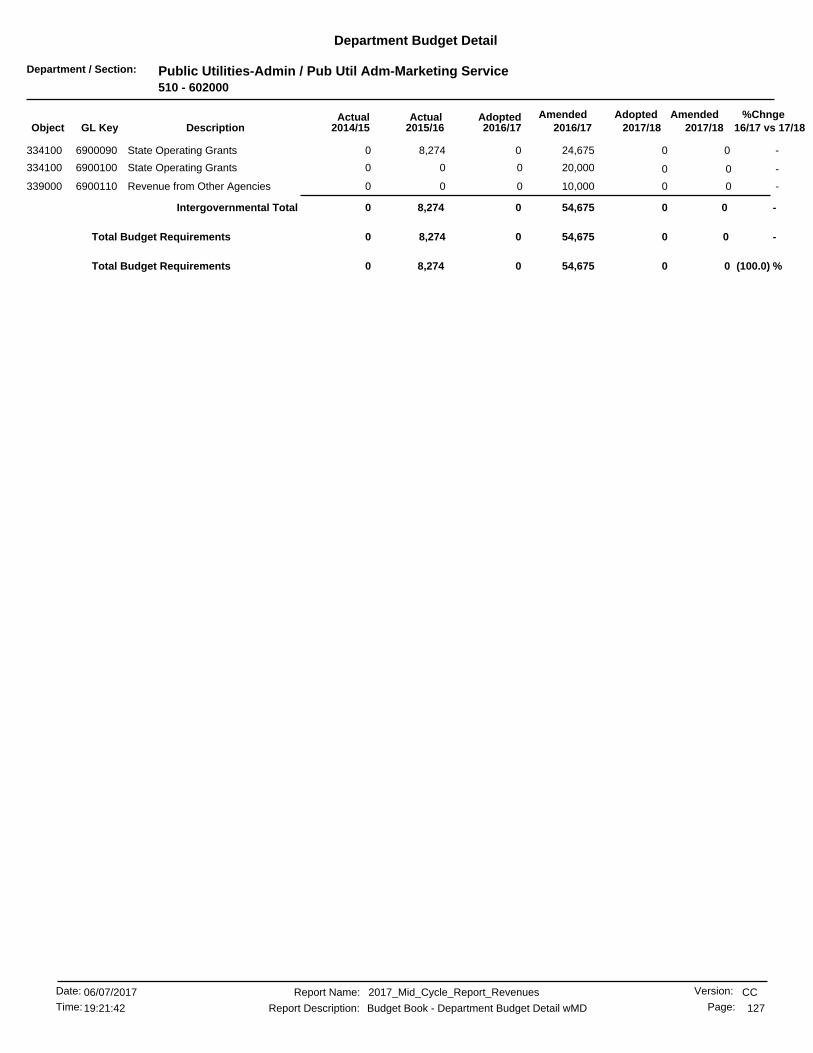
Department / Section: Public Utilities-Admin / Pub Util Adm-Marketing Service510 - 602000
Department Budget Detail
%Chnge16/17 vs 17/182017/182017/18
AmendedAdoptedAdopted2016/17
AmendedActualActual2016/172015/162014/15GL KeyObject Description
-00 024,6758,274334100 State Operating Grants6900090 0
-0 020,00000State Operating Grants6900100334100 0
-0 010,00000Revenue from Other Agencies6900110339000 0
-0 0Intergovernmental Total 054,6758,2740
-0 0054,6758,2740Total Budget Requirements
(100.0) %00 054,6758,274Total Budget Requirements 0
CCReport Name: 2017_Mid_Cycle_Report_Revenues
Report Description: Budget Book - Department Budget Detail wMD
06/07/2017Date:
Time: 127
Version:
Page:19:21:42

Department / Section: Public Utilities-Electric / PU Electric Capital Projects510 - 613000
Department Budget Detail
%Chnge16/17 vs 17/182017/182017/18
AmendedAdoptedAdopted2016/17
AmendedActualActual2016/172015/162014/15GL KeyObject Description
-00 04,842,789(395,249)339000 Revenue from Other Agencies6900040 82,574
-0 00610Revenue from Other Agencies6900060339000 0
-00 050,3272,418339000 Revenue from Other Agencies6900080 101,345
-0 0Intergovernmental Total 04,893,116(392,769)183,920
-0 004,893,116(392,769)183,920Total Budget Requirements
(100.0) %00 04,893,116(392,769)Total Budget Requirements 183,920
CCReport Name: 2017_Mid_Cycle_Report_Revenues
Report Description: Budget Book - Department Budget Detail wMD
06/07/2017Date:
Time: 128
Version:
Page:19:21:42

Department / Section: Balance Sheet / Revenue / Balance Sheet / Revenue511 - 000000
Department Budget Detail
%Chnge16/17 vs 17/182017/182017/18
AmendedAdoptedAdopted2016/17
AmendedActualActual2016/172015/162014/15GL KeyObject Description
(1.0) %8,958,0008,863,000 8,958,0008,863,0008,727,925344440 Public Benefit Chgs Riverside0000511 8,604,423
(1.0) %8,958,0008,863,0008,863,000 8,958,000Charges for Services Total 8,727,9258,604,423
59.7 %49,43678,959 49,43678,959122,941371100 Interest From Investments0000511 85,069
-0 0076,19010,313GASB31 Adjustment0000511371110 0
59.7 %49,43678,95978,959 49,436Miscellaneous Total 199,13195,383
-0 002,313(500)Miscellaneous Receipts0000511374200 0
-0 0Miscellaneous Total 002,313(500)
( .7) %8,941,959 9,007,4369,007,4368,941,9598,929,3708,699,306Total Budget Requirements
CCReport Name: 2017_Mid_Cycle_Report_Revenues
Report Description: Budget Book - Department Budget Detail wMD
06/07/2017Date:
Time: 129
Version:
Page:19:21:42
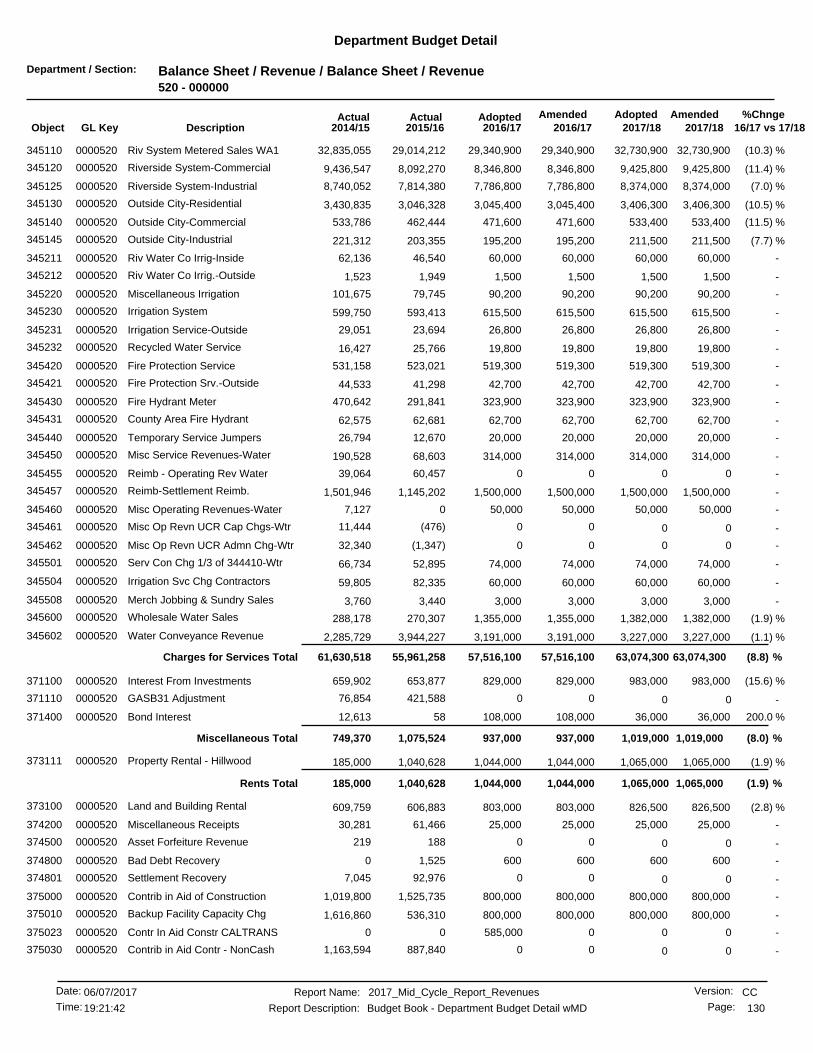
Department / Section: Balance Sheet / Revenue / Balance Sheet / Revenue520 - 000000
Department Budget Detail
%Chnge16/17 vs 17/182017/182017/18
AmendedAdoptedAdopted2016/17
AmendedActualActual2016/172015/162014/15GL KeyObject Description
(10.3) %32,730,90029,340,900 32,730,90029,340,90029,014,212345110 Riv System Metered Sales WA10000520 32,835,055
(11.4) %9,425,8008,346,800 9,425,8008,346,8008,092,270345120 Riverside System-Commercial0000520 9,436,547
(7.0) %8,374,0007,786,800 8,374,0007,786,8007,814,380345125 Riverside System-Industrial0000520 8,740,052
(10.5) %3,406,3003,045,400 3,406,3003,045,4003,046,328345130 Outside City-Residential0000520 3,430,835
(11.5) %533,400471,600 533,400471,600462,444345140 Outside City-Commercial0000520 533,786
(7.7) %211,500195,200 211,500195,200203,355345145 Outside City-Industrial0000520 221,312
-60,00060,000 60,00060,00046,540345211 Riv Water Co Irrig-Inside0000520 62,136
-1,5001,500 1,5001,5001,949345212 Riv Water Co Irrig.-Outside0000520 1,523
-90,20090,200 90,20090,20079,745345220 Miscellaneous Irrigation0000520 101,675
-615,500615,500 615,500615,500593,413345230 Irrigation System0000520 599,750
-26,80026,800 26,80026,80023,694345231 Irrigation Service-Outside0000520 29,051
-19,80019,800 19,80019,80025,766345232 Recycled Water Service0000520 16,427
-519,300519,300 519,300519,300523,021345420 Fire Protection Service0000520 531,158
-42,70042,700 42,70042,70041,298345421 Fire Protection Srv.-Outside0000520 44,533
-323,900323,900 323,900323,900291,841345430 Fire Hydrant Meter0000520 470,642
-62,70062,700 62,70062,70062,681345431 County Area Fire Hydrant0000520 62,575
-20,00020,000 20,00020,00012,670345440 Temporary Service Jumpers0000520 26,794
-314,000314,000 314,000314,00068,603345450 Misc Service Revenues-Water0000520 190,528
-0 0060,45739,064Reimb - Operating Rev Water0000520345455 0
-1,500,0001,500,000 1,500,0001,500,0001,145,202345457 Reimb-Settlement Reimb.0000520 1,501,946
-50,000 50,00050,00007,127Misc Operating Revenues-Water0000520345460 50,000
-0 00(476)11,444Misc Op Revn UCR Cap Chgs-Wtr0000520345461 0
-0 00(1,347)32,340Misc Op Revn UCR Admn Chg-Wtr0000520345462 0
-74,00074,000 74,00074,00052,895345501 Serv Con Chg 1/3 of 344410-Wtr0000520 66,734
-60,00060,000 60,00060,00082,335345504 Irrigation Svc Chg Contractors0000520 59,805
-3,0003,000 3,0003,0003,440345508 Merch Jobbing & Sundry Sales0000520 3,760
(1.9) %1,382,0001,355,000 1,382,0001,355,000270,307345600 Wholesale Water Sales0000520 288,178
(1.1) %3,227,0003,191,000 3,227,0003,191,0003,944,227345602 Water Conveyance Revenue0000520 2,285,729
(8.8) %63,074,30057,516,10057,516,100 63,074,300Charges for Services Total 55,961,25861,630,518
(15.6) %983,000829,000 983,000829,000653,877371100 Interest From Investments0000520 659,902
-0 00421,58876,854GASB31 Adjustment0000520371110 0
200.0 %36,000108,000 36,000108,00058371400 Bond Interest0000520 12,613
(8.0) %1,019,000937,000937,000 1,019,000Miscellaneous Total 1,075,524749,370
(1.9) %1,065,0001,044,000 1,065,0001,044,0001,040,628373111 Property Rental - Hillwood0000520 185,000
(1.9) %1,065,0001,044,0001,044,000 1,065,000Rents Total 1,040,628185,000
(2.8) %826,500803,000 826,500803,000606,883373100 Land and Building Rental0000520 609,759
-25,00025,000 25,00025,00061,466374200 Miscellaneous Receipts0000520 30,281
-0 00188219Asset Forfeiture Revenue0000520374500 0
-600600 6006001,525374800 Bad Debt Recovery0000520 0
-0 0092,9767,045Settlement Recovery0000520374801 0
-800,000800,000 800,000800,0001,525,735375000 Contrib in Aid of Construction0000520 1,019,800
-800,000800,000 800,000800,000536,310375010 Backup Facility Capacity Chg0000520 1,616,860
-585,000 0000Contr In Aid Constr CALTRANS0000520375023 0
-0 00887,8401,163,594Contrib in Aid Contr - NonCash0000520375030 0
CCReport Name: 2017_Mid_Cycle_Report_Revenues
Report Description: Budget Book - Department Budget Detail wMD
06/07/2017Date:
Time: 130
Version:
Page:19:21:42
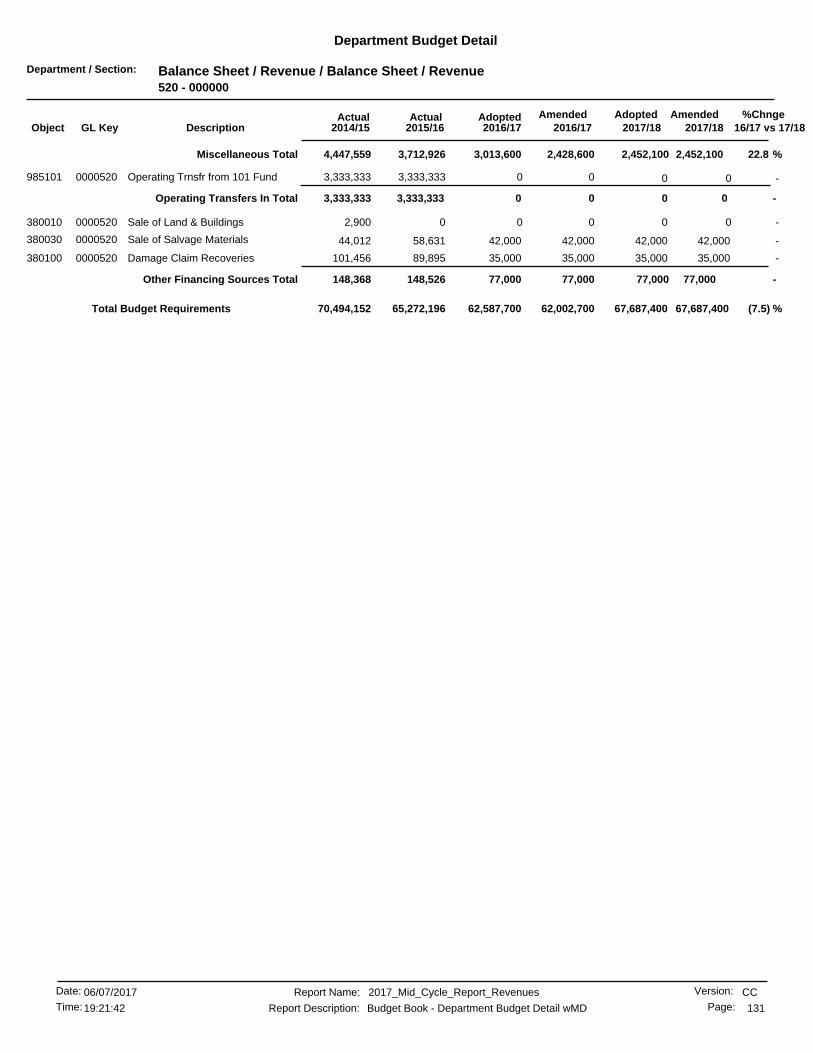
Department / Section: Balance Sheet / Revenue / Balance Sheet / Revenue520 - 000000
Department Budget Detail
%Chnge16/17 vs 17/182017/182017/18
AmendedAdoptedAdopted2016/17
AmendedActualActual2016/172015/162014/15GL KeyObject Description
22.8 %2,452,1002,428,6003,013,600 2,452,100Miscellaneous Total 3,712,9264,447,559
-0 003,333,3333,333,333Operating Trnsfr from 101 Fund0000520985101 0
-0 0Operating Transfers In Total 003,333,3333,333,333
-0 0002,900Sale of Land & Buildings0000520380010 0
-42,00042,000 42,00042,00058,631380030 Sale of Salvage Materials0000520 44,012
-35,00035,000 35,00035,00089,895380100 Damage Claim Recoveries0000520 101,456
-77,00077,00077,000 77,000Other Financing Sources Total 148,526148,368
(7.5) %62,587,700 67,687,40067,687,40062,002,70065,272,19670,494,152Total Budget Requirements
CCReport Name: 2017_Mid_Cycle_Report_Revenues
Report Description: Budget Book - Department Budget Detail wMD
06/07/2017Date:
Time: 131
Version:
Page:19:21:42

Department / Section: Public Utilities-Water / PU Water Capital Projects520 - 623000
Department Budget Detail
%Chnge16/17 vs 17/182017/182017/18
AmendedAdoptedAdopted2016/17
AmendedActualActual2016/172015/162014/15GL KeyObject Description
-1,000,000 01,000,00000State Capital Grants6810150334300 0
-00 07,210,783189,692339000 Revenue from Other Agencies6810030 147,203
-0 00036,380Revenue from Other Agencies6810110339000 0
-0 001,34533,331Revenue from Other Agencies6810140339000 0
-0 0585,00000Revenue from Other Agencies6810160339000 0
-1,000,000 0Intergovernmental Total 08,795,783191,037216,915
-1,000,000 008,795,783191,037216,915Total Budget Requirements
(100.0) %01,000,000 08,795,783191,037Total Budget Requirements 216,915
CCReport Name: 2017_Mid_Cycle_Report_Revenues
Report Description: Budget Book - Department Budget Detail wMD
06/07/2017Date:
Time: 132
Version:
Page:19:21:42

Department / Section: Balance Sheet / Revenue / Balance Sheet / Revenue521 - 000000
Department Budget Detail
%Chnge16/17 vs 17/182017/182017/18
AmendedAdoptedAdopted2016/17
AmendedActualActual2016/172015/162014/15GL KeyObject Description
(9.7) %847,000764,000 847,000764,000754,833344440 Public Benefit Chgs Riverside0000521 869,086
-00 0300,000487,613345456 Reimb-Other Agencies-WMWD0000521 3,531,557
(9.7) %847,0001,064,000764,000 847,000Charges for Services Total 1,242,4474,400,644
68.4 %5,6469,508 5,6469,50829,567371100 Interest From Investments0000521 16,772
-0 0016,4952,144GASB31 Adjustment0000521371110 0
68.4 %5,6469,5089,508 5,646Miscellaneous Total 46,06218,917
-0 000369Miscellaneous Receipts0000521374200 0
-0 0Miscellaneous Total 000369
-0 00750,0001,000,000Operating Trnsfr from 520 Fund0000521985520 0
-0 0Operating Transfers In Total 00750,0001,000,000
(9.2) %773,508 852,646852,6461,073,5082,038,5105,419,930Total Budget Requirements
CCReport Name: 2017_Mid_Cycle_Report_Revenues
Report Description: Budget Book - Department Budget Detail wMD
06/07/2017Date:
Time: 133
Version:
Page:19:21:42
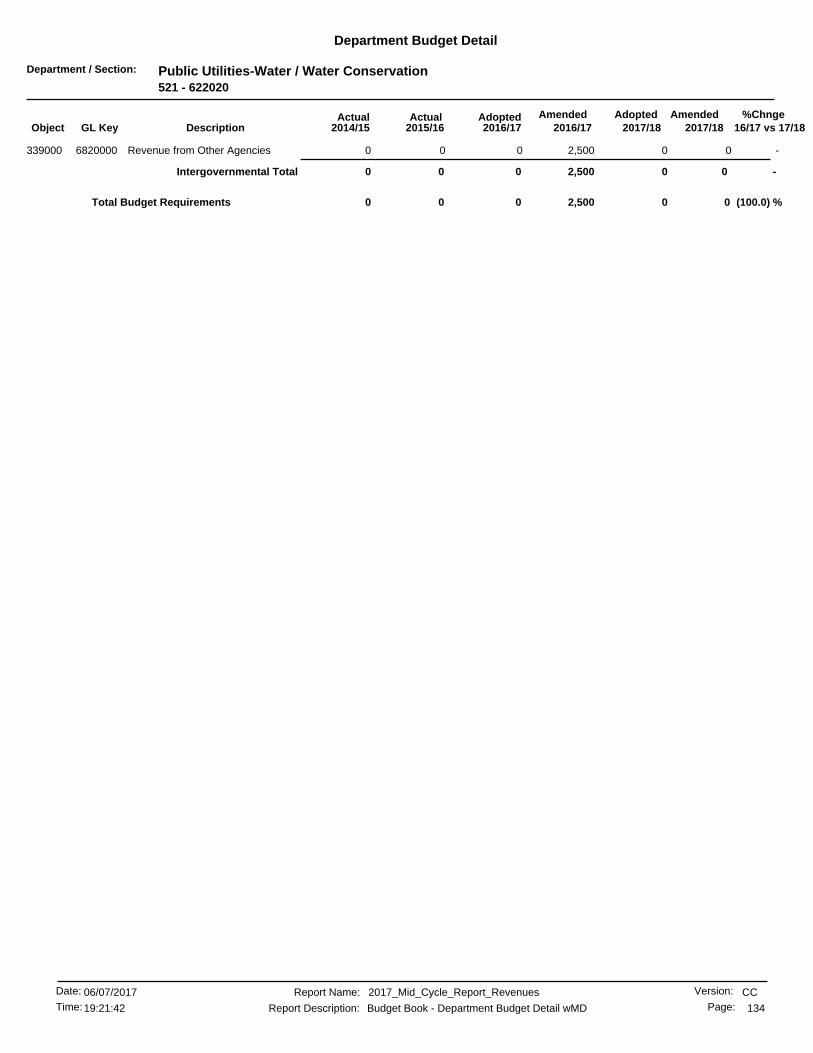
Department / Section: Public Utilities-Water / Water Conservation521 - 622020
Department Budget Detail
%Chnge16/17 vs 17/182017/182017/18
AmendedAdoptedAdopted2016/17
AmendedActualActual2016/172015/162014/15GL KeyObject Description
-0 02,50000Revenue from Other Agencies6820000339000 0
-0 0Intergovernmental Total 02,50000
(100.0) %00 02,5000Total Budget Requirements 0
CCReport Name: 2017_Mid_Cycle_Report_Revenues
Report Description: Budget Book - Department Budget Detail wMD
06/07/2017Date:
Time: 134
Version:
Page:19:21:42

Department / Section: Balance Sheet / Revenue / Balance Sheet / Revenue530 - 000000
Department Budget Detail
%Chnge16/17 vs 17/182017/182017/18
AmendedAdoptedAdopted2016/17
AmendedActualActual2016/172015/162014/15GL KeyObject Description
-0 0023,87311,606Non Commercial Aircraft0000530311300 0
-0 0Taxes Total 0023,87311,606
(1.2) %77,00076,000 77,00076,00093,827346110 Teminal Building Rentals0000530 116,214
-12,00012,000 12,00012,00012,895346111 Tenant Utility Surcharges0000530 7,500
8.0 %747,000807,000 747,000807,000939,244346120 Airport Bldg & Ground Rental0000530 673,076
( .9) %51,00050,500 51,00050,50049,846346123 FBO Building & Ground Rental0000530 52,679
( .5) %397,000395,000 397,000395,000398,038346125 Storage Hangar Rental0000530 396,908
(5.4) %37,00035,000 37,00035,00036,731346130 Aircraft Storage Space Rental0000530 11,013
(15.0) %2,0001,700 2,0001,7002,413346200 Airport Landing & Tie Down Fee0000530 1,197
-20,00020,000 20,00020,00016,324346300 Airport Gasoline Percentage0000530 0
4.0 %1,343,0001,397,2001,397,200 1,343,000Charges for Services Total 1,549,3211,258,590
-0 006,6523,351Late Payment Penalties0000530353400 0
-0 0Fines & Forfeits Total 006,6523,351
-0 002,9901,817Interest From Investments0000530371100 0
-0 002,3470GASB31 Adjustment0000530371110 0
-0 0Miscellaneous Total 005,3381,817
-0 00731(31,333)Miscellaneous Receipts0000530374200 0
-0 00025FBO Miscellaneous Receipts0000530374209 0
-0 000(1,188)Bad Debt Recovery0000530374800 0
-0 0Miscellaneous Total 00731(32,496)
4.0 %1,397,200 1,343,0001,343,0001,397,2001,585,9181,242,870Total Budget Requirements
CCReport Name: 2017_Mid_Cycle_Report_Revenues
Report Description: Budget Book - Department Budget Detail wMD
06/07/2017Date:
Time: 135
Version:
Page:19:21:42
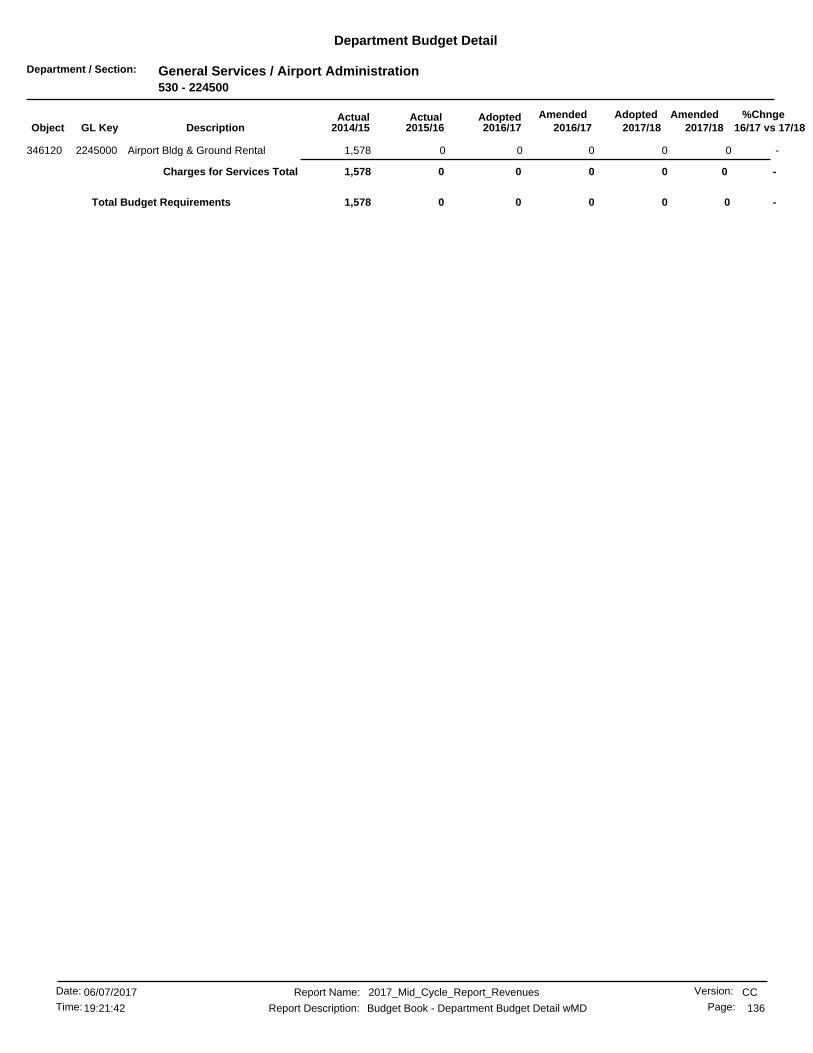
Department / Section: General Services / Airport Administration530 - 224500
Department Budget Detail
%Chnge16/17 vs 17/182017/182017/18
AmendedAdoptedAdopted2016/17
AmendedActualActual2016/172015/162014/15GL KeyObject Description
-0 0001,578Airport Bldg & Ground Rental2245000346120 0
-0 0Charges for Services Total 0001,578
-00 000Total Budget Requirements 1,578
CCReport Name: 2017_Mid_Cycle_Report_Revenues
Report Description: Budget Book - Department Budget Detail wMD
06/07/2017Date:
Time: 136
Version:
Page:19:21:42

Department / Section: Airport / Airport-Capital Projects530 - 541000
Department Budget Detail
%Chnge16/17 vs 17/182017/182017/18
AmendedAdoptedAdopted2016/17
AmendedActualActual2016/172015/162014/15GL KeyObject Description
-0 0105,85200Aircraft Apron Runway Rehab9261100331300 0
-0 05,29300Aircraft Apron Runway Rehab9261100334300 0
-0 0Intergovernmental Total 0111,14500
(100.0) %00 0111,1450Total Budget Requirements 0
CCReport Name: 2017_Mid_Cycle_Report_Revenues
Report Description: Budget Book - Department Budget Detail wMD
06/07/2017Date:
Time: 137
Version:
Page:19:21:42

Department / Section: Balance Sheet / Revenue / Balance Sheet / Revenue540 - 000000
Department Budget Detail
%Chnge16/17 vs 17/182017/182017/18
AmendedAdoptedAdopted2016/17
AmendedActualActual2016/172015/162014/15GL KeyObject Description
(1.1) %65,45864,729 65,45864,729107,558347102 City - Recycling Fee0000540 54,636
(1.9) %10,869,48610,653,226 10,869,48610,653,22610,274,300347110 Curbside Residential0000540 10,138,838
(2.8) %210,913204,999 210,913204,999214,729347111 City Addl Automated Waste0000540 212,240
(1.4) %104,517102,981 104,517102,981100,964347120 Driveway Residential0000540 100,106
( .7) %25,54025,355 25,54025,35525,989347130 Backyard Residential0000540 25,783
(1.7) %136,956134,534 136,956134,534130,211347140 Disabled Residential0000540 124,214
(2.9) %23,38622,689 23,38622,68921,907347200 Mobile Home Park0000540 21,564
(1.0) %57,31956,742 57,31956,74256,552347250 Private Hauler Multi-Fam Units0000540 50,604
(2.4) %401,075391,128 401,075391,128412,946347270 City Multi-Family Units0000540 405,042
-0 000267,804Refuse Coll-Street Sweeping0000540347330 0
(1.9) %4,238,0194,153,699 4,238,0194,153,6994,011,496347430 Outside Contract - Hauler0000540 3,936,446
-16,00016,000 16,00016,00013,851347610 City Sale Addl Auto Container0000540 12,710
(1.9) %5,385,4065,278,257 5,385,4065,278,2575,259,931347902 Administrative Fees - Refuse0000540 4,872,924
(2.0) %21,534,07521,104,33921,104,339 21,534,075Charges for Services Total 20,630,44120,222,916
(2.1) %1,110,2581,086,597 1,110,2581,086,5971,175,180353250 Parking Fines-Street Sweeping0000540 1,136,999
(2.1) %1,110,2581,086,5971,086,597 1,110,258Fines & Forfeits Total 1,175,1801,136,999
-40,00040,000 40,00040,00043,372371100 Interest From Investments0000540 44,805
-0 0028,1226,864GASB31 Adjustment0000540371110 0
-40,00040,00040,000 40,000Miscellaneous Total 71,49451,670
-45,00045,000 45,00045,00051,199374200 Miscellaneous Receipts0000540 58,201
(1.9) %312,120306,000 312,120306,000282,812374421 Curbside Material Revenue0000540 327,102
-0 005665Asset Forfeiture Revenue0000540374500 0
-0 00(4,390)(3,000)Bad Debt Recovery0000540374800 0
-0 000(5,672)Settlement Recovery0000540374801 0
(1.7) %357,120351,000351,000 357,120Miscellaneous Total 329,677376,696
-0 005,84815,212Damage Claim Recoveries0000540380100 0
-0 0Other Financing Sources Total 005,84815,212
(1.9) %22,581,936 23,041,45323,041,45322,581,93622,212,64321,803,495Total Budget Requirements
CCReport Name: 2017_Mid_Cycle_Report_Revenues
Report Description: Budget Book - Department Budget Detail wMD
06/07/2017Date:
Time: 138
Version:
Page:19:21:42

Department / Section: Balance Sheet / Revenue / Balance Sheet / Revenue550 - 000000
Department Budget Detail
%Chnge16/17 vs 17/182017/182017/18
AmendedAdoptedAdopted2016/17
AmendedActualActual2016/172015/162014/15GL KeyObject Description
(3.8) %6,4296,183 6,4296,1835,765340351 Grading Plan Review Fees0000550 6,540
(3.8) %195,684188,194 195,684188,194462,465344441 Pub Benefit Chg-Sewer-Comm0000550 155,297
(3.8) %62,65660,258 62,65660,25855,209344442 Pub Benefit Chg-Sewer-Res0000550 54,998
-0 001750Irrigation Svc Chg Contractors0000550345504 0
(3.8) %1,171,4141,126,576 1,171,4141,126,576618,455348010 Sewer Connection Fees0000550 1,772,582
(3.8)%11,242 11,69011,242030,082Sewer Unit of Benefit Fee0000550348020 11,690
-13,56413,564 13,56413,56413,563348031 Rubidoux CSD Improvement Fees0000550 13,563
-20,79820,798 20,79820,79820,797348032 Jurupa CSD Improvement Fees0000550 20,797
-6,6926,692 6,6926,6926,691348033 Edgemont CSD Improvement Fees0000550 6,691
(8.7) %10,067,9659,189,176 10,067,9659,189,1766,825,647348110 Commercial0000550 7,402,378
(8.7) %31,501,43828,751,816 31,501,43828,751,81626,034,202348130 Residential Sewage0000550 23,797,371
(6.9) %1,683,7321,566,539 1,683,7321,566,5391,336,603348170 Rubidoux Community Service0000550 1,368,108
(6.9) %2,502,8462,328,638 2,502,8462,328,6381,746,789348180 Jurupa Community Service0000550 1,908,455
(6.9) %364,050338,711 364,050338,711251,844348190 Edgemont Community Service0000550 276,276
(8.7) %3,087,6562,818,148 3,087,6562,818,1482,484,113348253 Commercial Sewer Spec Billing0000550 2,759,111
(8.7) %13,434,59412,261,947 13,434,59412,261,94711,327,531348401 Residential Pumping0000550 10,302,084
(8.7) %2,472,3402,256,540 2,472,3402,256,5401,766,843348403 Commercial Pumping0000550 1,854,727
( .9) %44,45144,020 44,45144,02049,977348410 Recycled Water0000550 47,779
(3.8) %350,688337,265 350,688337,265283,733348510 Waste Disposal Fees0000550 321,441
(3.8) %27,30726,262 27,30726,26226,851348550 Industrial Waste Permits0000550 45,110
-0 005,50028,420Enforcemnt Notice of Violation0000550348553 0
-0 0001,000Enforcement Cease & Desist Ord0000550348556 0
-0 008,3799,835Enforcement - Inspection Fees0000550348558 0
-0 0003,217Misc Receipts-Other Charges0000550349012 0
(8.4) %67,025,99461,352,56961,352,569 67,025,994Charges for Services Total 53,331,14152,185,871
(6.2) %263,300246,963 263,300246,963402,207371100 Interest From Investments0000550 122,822
-0 00(90,640)(71,445)GASB31 Adjustment0000550371110 0
-0 0066,076100,238All Other Interest Income0000550371300 0
(6.2) %511,113479,399 511,113479,399208,192371400 Bond Interest0000550 532,176
(6.2) %774,413726,362726,362 774,413Miscellaneous Total 585,835683,792
-0 0072,73668,607Miscellaneous Receipts0000550374200 0
-0 00126147Asset Forfeiture Revenue0000550374500 0
-0 00(47,833)(3,879)Bad Debt Recovery0000550374800 0
-0 0Miscellaneous Total 0025,02964,875
-0 003,0240Operating Trnsfr from 101 Fund0000550985101 0
-0 0050,9120Operating Trnsfr from 410 Fund0000550985410 0
-0 0031,3200Operating Trnsfr from 411 Fund0000550985411 0
-0 00124,8510Operating Trnsfr from 413 Fund0000550985413 0
-0 0051,4800Operating Trnsfr from 433 Fund0000550985433 0
-0 007,9150Operating Trnsfr from 520 Fund0000550985520 0
-0 00549,6700Operating Transfer fm 760 Fund0000550985760 0
-0 0Operating Transfers In Total 00819,1730
-0 0007,170Damage Claim Recoveries0000550380100 0
-0 0Other Financing Sources Total 0007,170
CCReport Name: 2017_Mid_Cycle_Report_Revenues
Report Description: Budget Book - Department Budget Detail wMD
06/07/2017Date:
Time: 139
Version:
Page:19:21:42

Department / Section: Balance Sheet / Revenue / Balance Sheet / Revenue550 - 000000
Department Budget Detail
%Chnge16/17 vs 17/182017/182017/18
AmendedAdoptedAdopted2016/17
AmendedActualActual2016/172015/162014/15GL KeyObject Description
(8.4) %62,078,931 67,800,40767,800,40762,078,93154,761,18052,941,710Total Budget Requirements
CCReport Name: 2017_Mid_Cycle_Report_Revenues
Report Description: Budget Book - Department Budget Detail wMD
06/07/2017Date:
Time: 140
Version:
Page:19:21:42

Department / Section: Public Works / PW-Sewer Sys-Admin & Reg Compl550 - 412500
Department Budget Detail
%Chnge16/17 vs 17/182017/182017/18
AmendedAdoptedAdopted2016/17
AmendedActualActual2016/172015/162014/15GL KeyObject Description
-0 00(1,056)0Bad Debt Recovery4125000374800 0
-0 0Miscellaneous Total 00(1,056)0
-00 00(1,056)Total Budget Requirements 0
CCReport Name: 2017_Mid_Cycle_Report_Revenues
Report Description: Budget Book - Department Budget Detail wMD
06/07/2017Date:
Time: 141
Version:
Page:19:21:42

Department / Section: Balance Sheet / Revenue / Balance Sheet / Revenue560 - 000000
Department Budget Detail
%Chnge16/17 vs 17/182017/182017/18
AmendedAdoptedAdopted2016/17
AmendedActualActual2016/172015/162014/15GL KeyObject Description
(4.0) %3,410,2943,272,194 3,410,2943,555,7942,230,975335912 SB325 Article 40000560 3,195,230
(4.0) %3,410,2943,555,7943,272,194 3,410,294Intergovernmental Total 2,230,9753,195,230
(17.7) %534,823439,823 534,823439,823376,960343530 Trans Fare Dial-A-Ride0000560 384,630
(17.7) %534,823439,823439,823 534,823Charges for Services Total 376,960384,630
-0 006,511424GASB31 Adjustment0000560371110 0
-0 0Miscellaneous Total 006,511424
-0 00(1,538)0Settlement Recovery0000560374801 0
-0 0Miscellaneous Total 00(1,538)0
-0 00139(88)Damage Claim Recoveries0000560380100 0
-0 0Other Financing Sources Total 00139(88)
(5.9) %3,712,017 3,945,1173,945,1173,995,6172,613,0473,580,196Total Budget Requirements
CCReport Name: 2017_Mid_Cycle_Report_Revenues
Report Description: Budget Book - Department Budget Detail wMD
06/07/2017Date:
Time: 142
Version:
Page:19:21:42
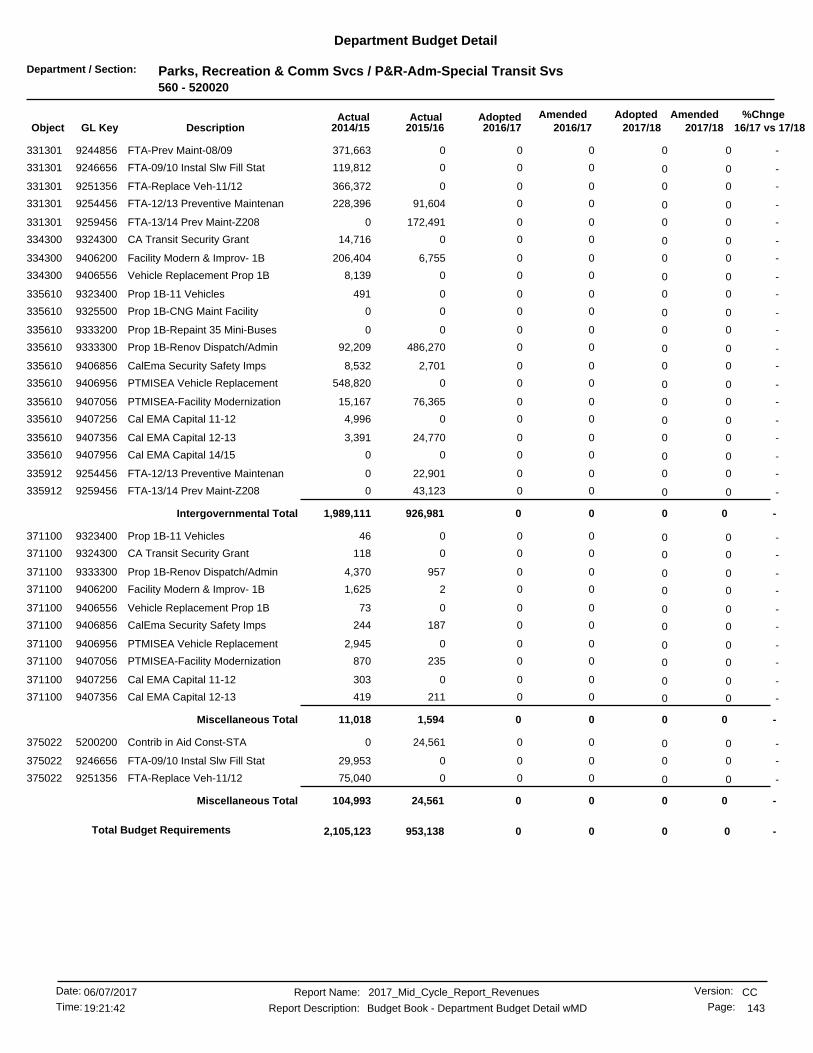
Department / Section: Parks, Recreation & Comm Svcs / P&R-Adm-Special Transit Svs560 - 520020
Department Budget Detail
%Chnge16/17 vs 17/182017/182017/18
AmendedAdoptedAdopted2016/17
AmendedActualActual2016/172015/162014/15GL KeyObject Description
-0 000371,663FTA-Prev Maint-08/099244856331301 0
-0 000119,812FTA-09/10 Instal Slw Fill Stat9246656331301 0
-0 000366,372FTA-Replace Veh-11/129251356331301 0
-0 0091,604228,396FTA-12/13 Preventive Maintenan9254456331301 0
-0 00172,4910FTA-13/14 Prev Maint-Z2089259456331301 0
-0 00014,716CA Transit Security Grant9324300334300 0
-0 006,755206,404Facility Modern & Improv- 1B9406200334300 0
-0 0008,139Vehicle Replacement Prop 1B9406556334300 0
-0 000491Prop 1B-11 Vehicles9323400335610 0
-0 0000Prop 1B-CNG Maint Facility9325500335610 0
-0 0000Prop 1B-Repaint 35 Mini-Buses9333200335610 0
-0 00486,27092,209Prop 1B-Renov Dispatch/Admin9333300335610 0
-0 002,7018,532CalEma Security Safety Imps9406856335610 0
-0 000548,820PTMISEA Vehicle Replacement9406956335610 0
-0 0076,36515,167PTMISEA-Facility Modernization9407056335610 0
-0 0004,996Cal EMA Capital 11-129407256335610 0
-0 0024,7703,391Cal EMA Capital 12-139407356335610 0
-0 0000Cal EMA Capital 14/159407956335610 0
-0 0022,9010FTA-12/13 Preventive Maintenan9254456335912 0
-0 0043,1230FTA-13/14 Prev Maint-Z2089259456335912 0
-0 0Intergovernmental Total 00926,9811,989,111
-0 00046Prop 1B-11 Vehicles9323400371100 0
-0 000118CA Transit Security Grant9324300371100 0
-0 009574,370Prop 1B-Renov Dispatch/Admin9333300371100 0
-0 0021,625Facility Modern & Improv- 1B9406200371100 0
-0 00073Vehicle Replacement Prop 1B9406556371100 0
-0 00187244CalEma Security Safety Imps9406856371100 0
-0 0002,945PTMISEA Vehicle Replacement9406956371100 0
-0 00235870PTMISEA-Facility Modernization9407056371100 0
-0 000303Cal EMA Capital 11-129407256371100 0
-0 00211419Cal EMA Capital 12-139407356371100 0
-0 0Miscellaneous Total 001,59411,018
-0 0024,5610Contrib in Aid Const-STA5200200375022 0
-0 00029,953FTA-09/10 Instal Slw Fill Stat9246656375022 0
-0 00075,040FTA-Replace Veh-11/129251356375022 0
-0 0Miscellaneous Total 0024,561104,993
-00 00953,138Total Budget Requirements 2,105,123
CCReport Name: 2017_Mid_Cycle_Report_Revenues
Report Description: Budget Book - Department Budget Detail wMD
06/07/2017Date:
Time: 143
Version:
Page:19:21:42

Department / Section: Balance Sheet / Revenue / Balance Sheet / Revenue570 - 000000
Department Budget Detail
%Chnge16/17 vs 17/182017/182017/18
AmendedAdoptedAdopted2016/17
AmendedActualActual2016/172015/162014/15GL KeyObject Description
46.6 %223,000327,078 198,000327,078479,419322100 Monthly Rentals Parking Lots0000570 290,784
(22.8) %215,146166,000 171,000166,000158,774322210 Garage 1 - 3743 Orange0000570 145,099
(25.8) %226,566168,000 172,000168,000169,757322220 Garage 2 - 3851 Orange0000570 147,344
(15.6) %323,816273,000 277,000273,000279,685322230 Garage 3 - 3750 Market0000570 268,388
-43,68043,680 46,80043,68040,560322240 Garage 4 - 3750 University0000570 40,560
230.5 %57,406189,762 195,984189,762182,459322260 Garage 3 Office Lease0000570 175,708
(8.9) %414,360377,100 399,240377,100334,200322270 Garage 6 - 3901 Orange Street0000570 309,054
(17.2) %241,580200,000 213,000200,000219,822322280 Garage 7 - Fox Ent Plaza0000570 167,946
(2.5) %3,9003,800 3,9003,8003,596322300 Other Parking Receipts0000570 3,566
( .5) %1,442,4001,435,000 1,314,0001,435,0001,243,502322303 Metered Parking Zone0000570 1,354,712
( .2) %3,191,8543,183,4203,183,420 2,990,924Licenses & Permits Total 3,111,7772,903,164
(6.6) %3,763,0003,512,000 3,763,0003,512,0003,722,332353200 Parking Fines0000570 3,782,369
(1.9) %(1,184,000)(1,161,000) (1,184,000)(1,161,000)(1,116,021)353250 Parking Fines-Street Sweeping0000570 (1,116,622)
(8.8) %2,579,0002,351,0002,351,000 2,579,000Fines & Forfeits Total 2,606,3102,665,747
-0 003860Interest From Investments0000570371100 0
-0 00(758)359GASB31 Adjustment0000570371110 0
(1.9) %750,352735,639 750,352735,639716,930373124 Garage 6 Office Lease0000570 707,765
(1.9) %750,352735,639735,639 750,352Miscellaneous Total 716,558708,124
-0 005871,999Miscellaneous Receipts0000570374200 0
-0 000(160)Asset Forfeiture Revenue0000570374500 0
-0 00(41)41Bad Debt Recovery0000570374800 0
-0 0Miscellaneous Total 005461,880
-0 000260Damage Claim Recoveries0000570380100 0
-0 0Other Financing Sources Total 000260
(3.8) %6,270,059 6,521,2066,320,2766,270,0596,435,1926,279,178Total Budget Requirements
CCReport Name: 2017_Mid_Cycle_Report_Revenues
Report Description: Budget Book - Department Budget Detail wMD
06/07/2017Date:
Time: 144
Version:
Page:19:21:42
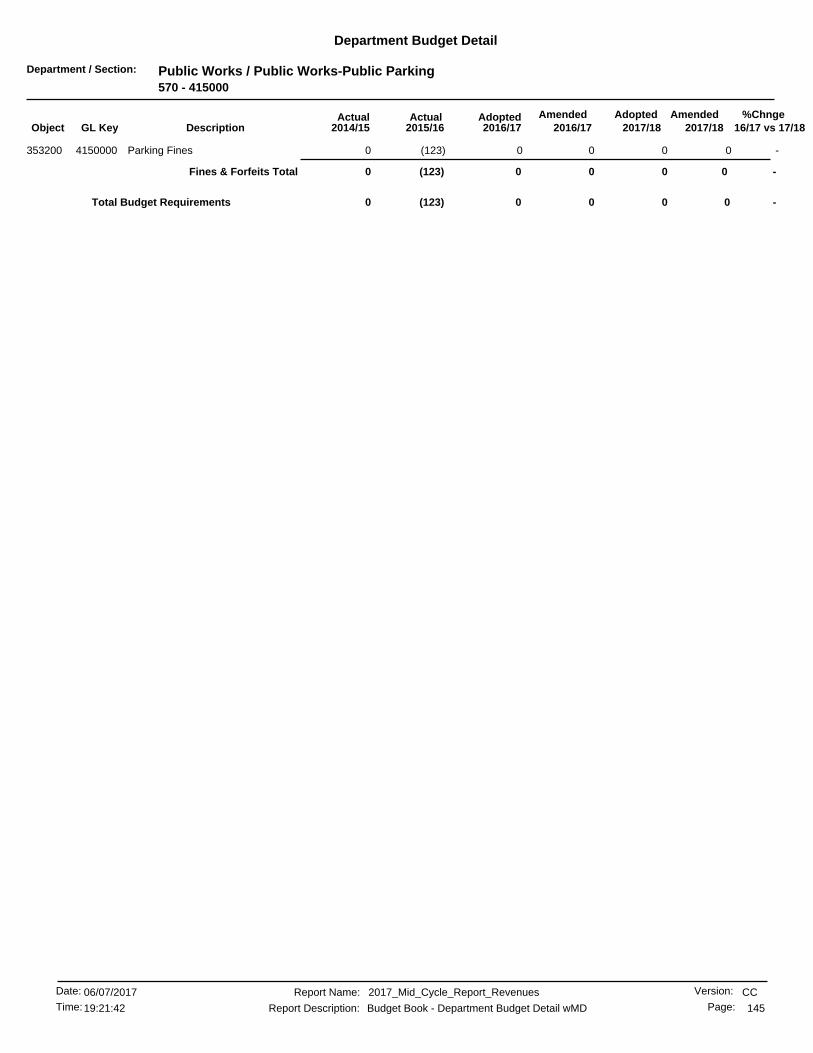
Department / Section: Public Works / Public Works-Public Parking570 - 415000
Department Budget Detail
%Chnge16/17 vs 17/182017/182017/18
AmendedAdoptedAdopted2016/17
AmendedActualActual2016/172015/162014/15GL KeyObject Description
-0 00(123)0Parking Fines4150000353200 0
-0 0Fines & Forfeits Total 00(123)0
-00 00(123)Total Budget Requirements 0
CCReport Name: 2017_Mid_Cycle_Report_Revenues
Report Description: Budget Book - Department Budget Detail wMD
06/07/2017Date:
Time: 145
Version:
Page:19:21:42
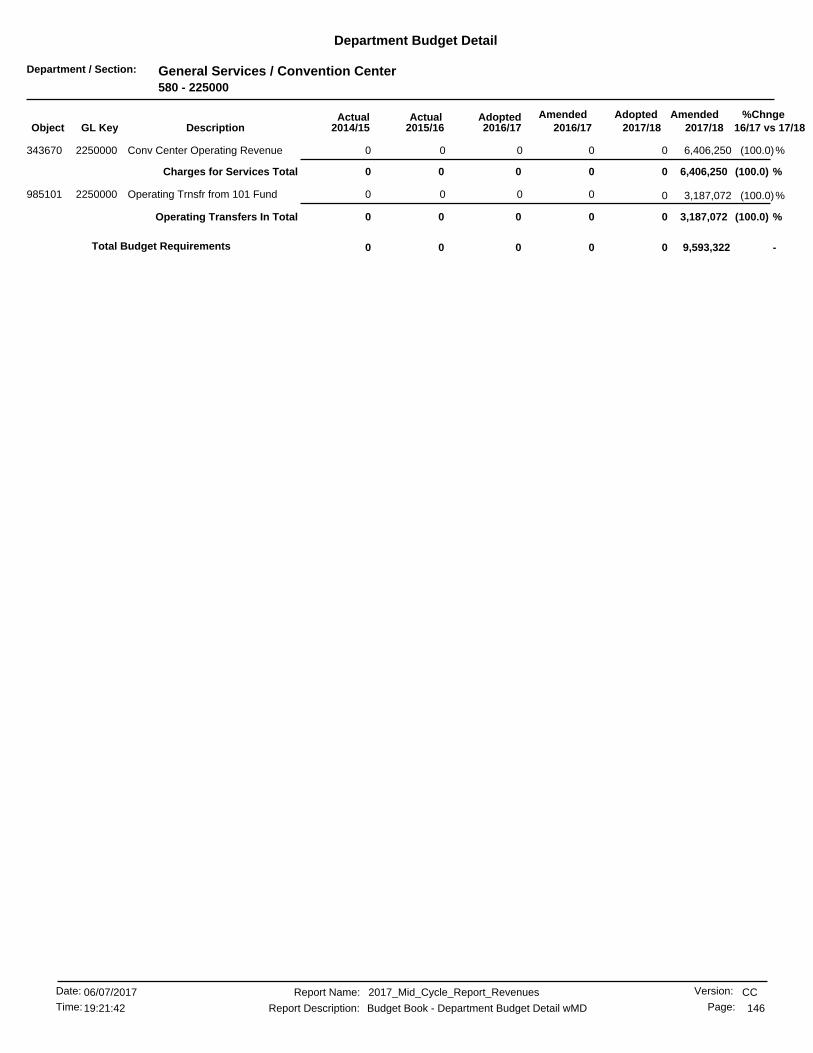
Department / Section: General Services / Convention Center580 - 225000
Department Budget Detail
%Chnge16/17 vs 17/182017/182017/18
AmendedAdoptedAdopted2016/17
AmendedActualActual2016/172015/162014/15GL KeyObject Description
(100.0)%0 6,406,250000Conv Center Operating Revenue2250000343670 0
(100.0) %0 6,406,250Charges for Services Total 0000
(100.0)%0 3,187,072000Operating Trnsfr from 101 Fund2250000985101 0
(100.0) %0 3,187,072Operating Transfers In Total 0000
-9,593,3220 000Total Budget Requirements 0
CCReport Name: 2017_Mid_Cycle_Report_Revenues
Report Description: Budget Book - Department Budget Detail wMD
06/07/2017Date:
Time: 146
Version:
Page:19:21:42
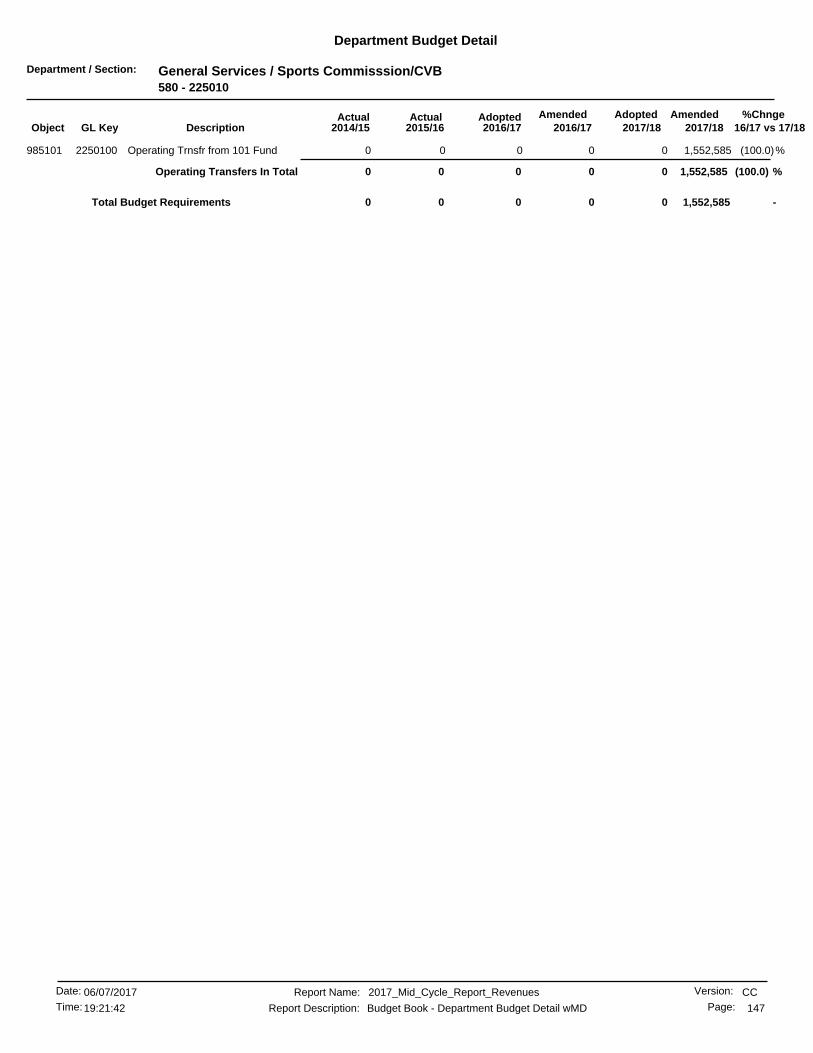
Department / Section: General Services / Sports Commisssion/CVB580 - 225010
Department Budget Detail
%Chnge16/17 vs 17/182017/182017/18
AmendedAdoptedAdopted2016/17
AmendedActualActual2016/172015/162014/15GL KeyObject Description
(100.0)%0 1,552,585000Operating Trnsfr from 101 Fund2250100985101 0
(100.0) %0 1,552,585Operating Transfers In Total 0000
-1,552,5850 000Total Budget Requirements 0
CCReport Name: 2017_Mid_Cycle_Report_Revenues
Report Description: Budget Book - Department Budget Detail wMD
06/07/2017Date:
Time: 147
Version:
Page:19:21:42
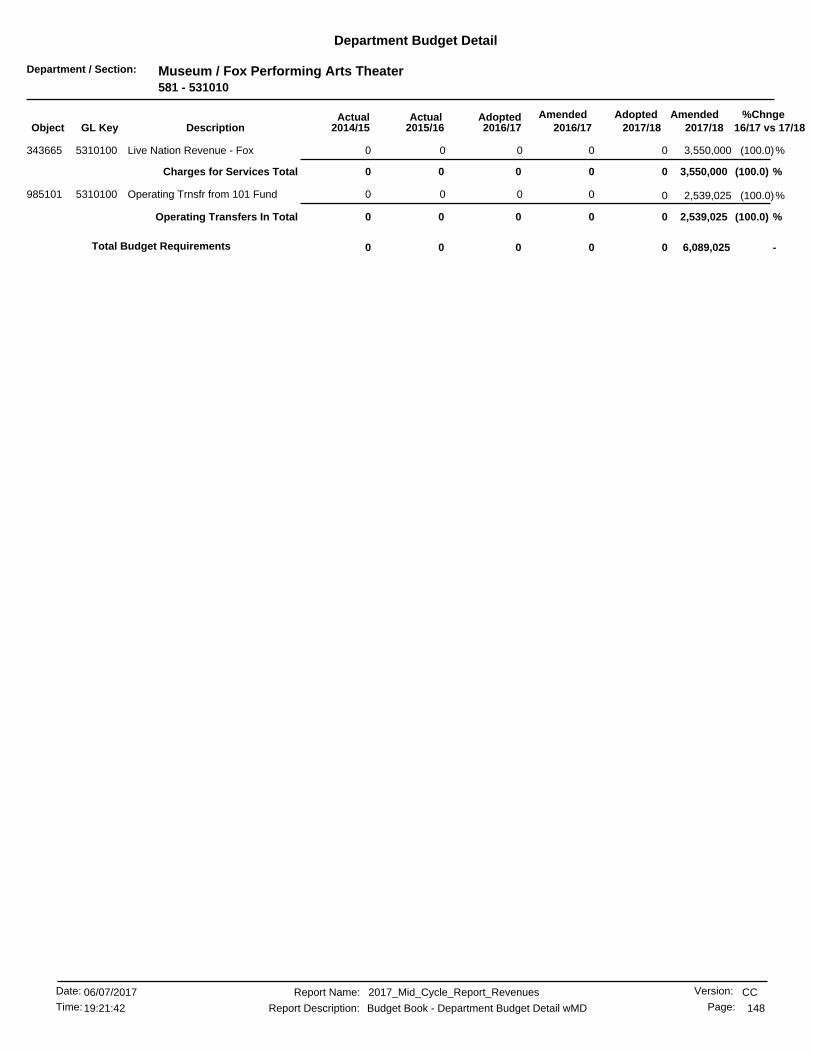
Department / Section: Museum / Fox Performing Arts Theater581 - 531010
Department Budget Detail
%Chnge16/17 vs 17/182017/182017/18
AmendedAdoptedAdopted2016/17
AmendedActualActual2016/172015/162014/15GL KeyObject Description
(100.0)%0 3,550,000000Live Nation Revenue - Fox5310100343665 0
(100.0) %0 3,550,000Charges for Services Total 0000
(100.0)%0 2,539,025000Operating Trnsfr from 101 Fund5310100985101 0
(100.0) %0 2,539,025Operating Transfers In Total 0000
-6,089,0250 000Total Budget Requirements 0
CCReport Name: 2017_Mid_Cycle_Report_Revenues
Report Description: Budget Book - Department Budget Detail wMD
06/07/2017Date:
Time: 148
Version:
Page:19:21:42

Department / Section: Museum / Riverside Municipal Auditorium581 - 531020
Department Budget Detail
%Chnge16/17 vs 17/182017/182017/18
AmendedAdoptedAdopted2016/17
AmendedActualActual2016/172015/162014/15GL KeyObject Description
(100.0)%0 2,800,000000Live Nation Revenue- Muni Aud5310200343666 0
(100.0) %0 2,800,000Charges for Services Total 0000
-2,800,0000 000Total Budget Requirements 0
CCReport Name: 2017_Mid_Cycle_Report_Revenues
Report Description: Budget Book - Department Budget Detail wMD
06/07/2017Date:
Time: 149
Version:
Page:19:21:42
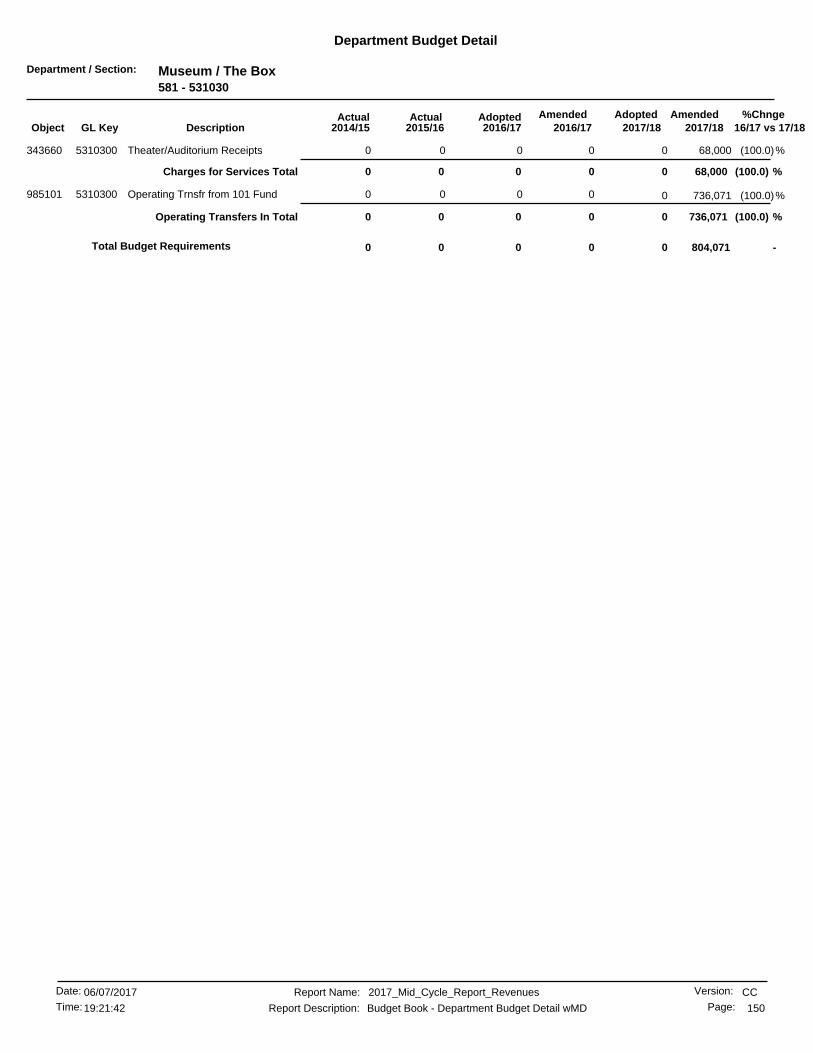
Department / Section: Museum / The Box581 - 531030
Department Budget Detail
%Chnge16/17 vs 17/182017/182017/18
AmendedAdoptedAdopted2016/17
AmendedActualActual2016/172015/162014/15GL KeyObject Description
(100.0)%0 68,000000Theater/Auditorium Receipts5310300343660 0
(100.0) %0 68,000Charges for Services Total 0000
(100.0)%0 736,071000Operating Trnsfr from 101 Fund5310300985101 0
(100.0) %0 736,071Operating Transfers In Total 0000
-804,0710 000Total Budget Requirements 0
CCReport Name: 2017_Mid_Cycle_Report_Revenues
Report Description: Budget Book - Department Budget Detail wMD
06/07/2017Date:
Time: 150
Version:
Page:19:21:42
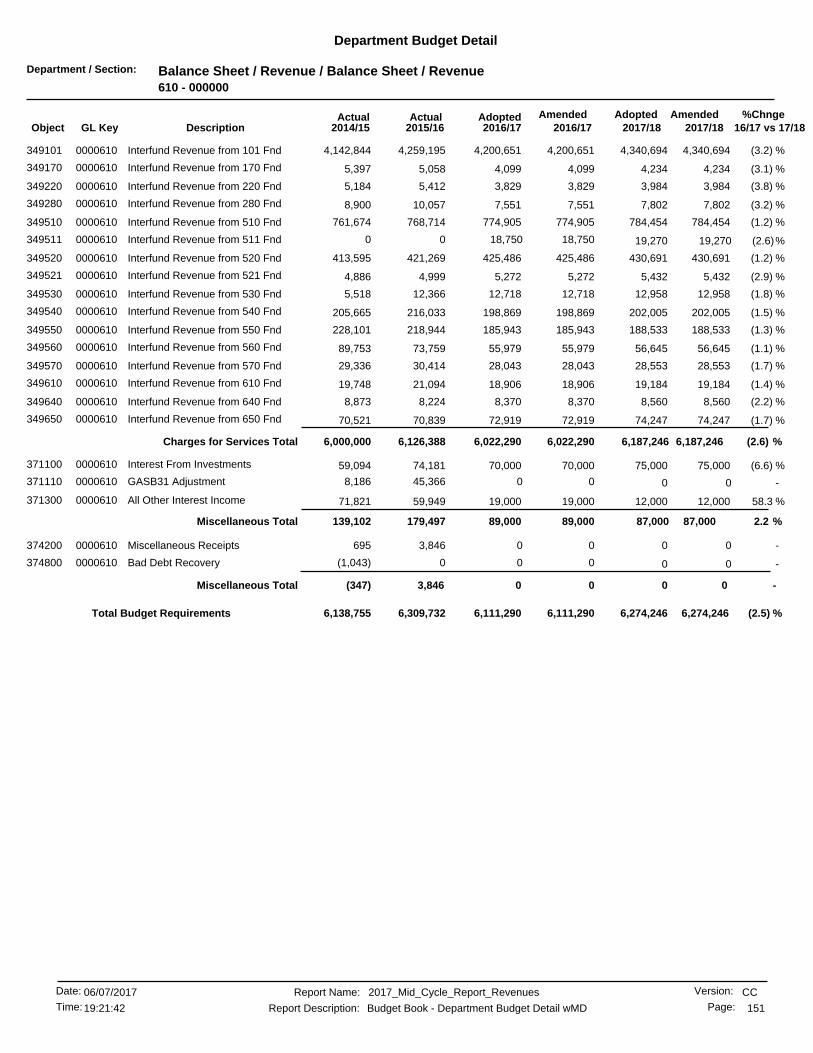
Department / Section: Balance Sheet / Revenue / Balance Sheet / Revenue610 - 000000
Department Budget Detail
%Chnge16/17 vs 17/182017/182017/18
AmendedAdoptedAdopted2016/17
AmendedActualActual2016/172015/162014/15GL KeyObject Description
(3.2) %4,340,6944,200,651 4,340,6944,200,6514,259,195349101 Interfund Revenue from 101 Fnd0000610 4,142,844
(3.1) %4,2344,099 4,2344,0995,058349170 Interfund Revenue from 170 Fnd0000610 5,397
(3.8) %3,9843,829 3,9843,8295,412349220 Interfund Revenue from 220 Fnd0000610 5,184
(3.2) %7,8027,551 7,8027,55110,057349280 Interfund Revenue from 280 Fnd0000610 8,900
(1.2) %784,454774,905 784,454774,905768,714349510 Interfund Revenue from 510 Fnd0000610 761,674
(2.6)%18,750 19,27018,75000Interfund Revenue from 511 Fnd0000610349511 19,270
(1.2) %430,691425,486 430,691425,486421,269349520 Interfund Revenue from 520 Fnd0000610 413,595
(2.9) %5,4325,272 5,4325,2724,999349521 Interfund Revenue from 521 Fnd0000610 4,886
(1.8) %12,95812,718 12,95812,71812,366349530 Interfund Revenue from 530 Fnd0000610 5,518
(1.5) %202,005198,869 202,005198,869216,033349540 Interfund Revenue from 540 Fnd0000610 205,665
(1.3) %188,533185,943 188,533185,943218,944349550 Interfund Revenue from 550 Fnd0000610 228,101
(1.1) %56,64555,979 56,64555,97973,759349560 Interfund Revenue from 560 Fnd0000610 89,753
(1.7) %28,55328,043 28,55328,04330,414349570 Interfund Revenue from 570 Fnd0000610 29,336
(1.4) %19,18418,906 19,18418,90621,094349610 Interfund Revenue from 610 Fnd0000610 19,748
(2.2) %8,5608,370 8,5608,3708,224349640 Interfund Revenue from 640 Fnd0000610 8,873
(1.7) %74,24772,919 74,24772,91970,839349650 Interfund Revenue from 650 Fnd0000610 70,521
(2.6) %6,187,2466,022,2906,022,290 6,187,246Charges for Services Total 6,126,3886,000,000
(6.6) %75,00070,000 75,00070,00074,181371100 Interest From Investments0000610 59,094
-0 0045,3668,186GASB31 Adjustment0000610371110 0
58.3 %12,00019,000 12,00019,00059,949371300 All Other Interest Income0000610 71,821
2.2 %87,00089,00089,000 87,000Miscellaneous Total 179,497139,102
-0 003,846695Miscellaneous Receipts0000610374200 0
-0 000(1,043)Bad Debt Recovery0000610374800 0
-0 0Miscellaneous Total 003,846(347)
(2.5) %6,111,290 6,274,2466,274,2466,111,2906,309,7326,138,755Total Budget Requirements
CCReport Name: 2017_Mid_Cycle_Report_Revenues
Report Description: Budget Book - Department Budget Detail wMD
06/07/2017Date:
Time: 151
Version:
Page:19:21:42
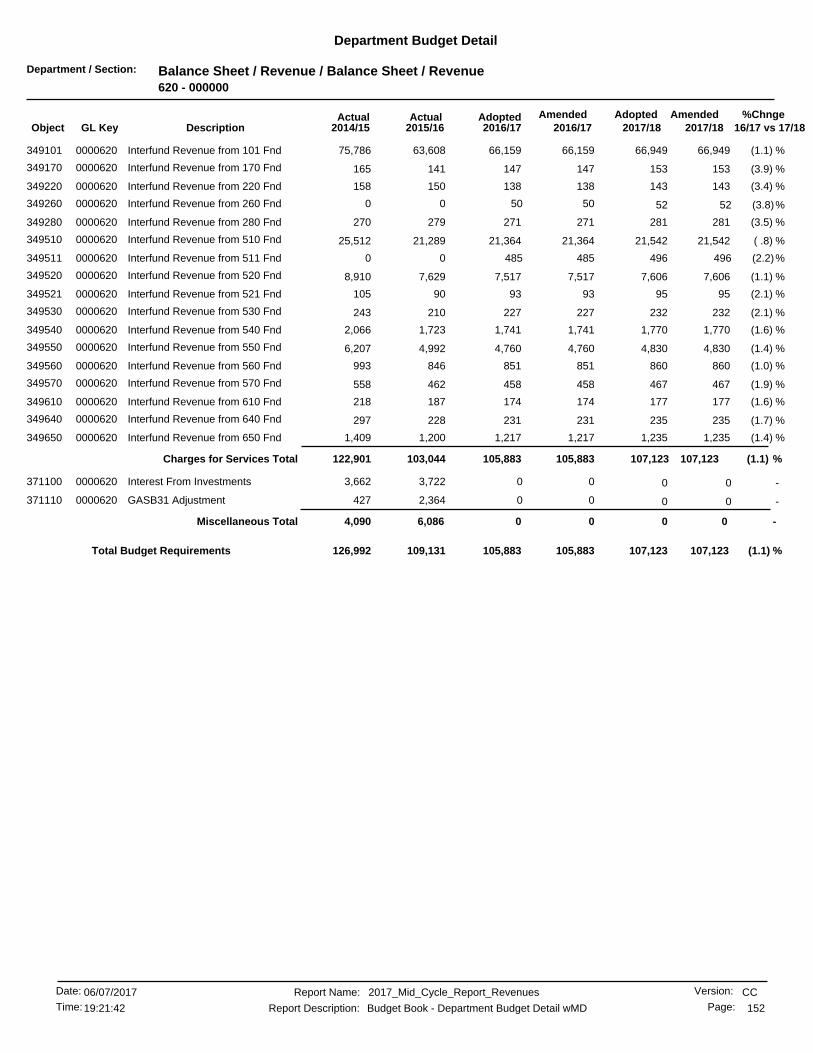
Department / Section: Balance Sheet / Revenue / Balance Sheet / Revenue620 - 000000
Department Budget Detail
%Chnge16/17 vs 17/182017/182017/18
AmendedAdoptedAdopted2016/17
AmendedActualActual2016/172015/162014/15GL KeyObject Description
(1.1) %66,94966,159 66,94966,15963,608349101 Interfund Revenue from 101 Fnd0000620 75,786
(3.9) %153147 153147141349170 Interfund Revenue from 170 Fnd0000620 165
(3.4) %143138 143138150349220 Interfund Revenue from 220 Fnd0000620 158
(3.8)%50 525000Interfund Revenue from 260 Fnd0000620349260 52
(3.5) %281271 281271279349280 Interfund Revenue from 280 Fnd0000620 270
( .8) %21,54221,364 21,54221,36421,289349510 Interfund Revenue from 510 Fnd0000620 25,512
(2.2)%485 49648500Interfund Revenue from 511 Fnd0000620349511 496
(1.1) %7,6067,517 7,6067,5177,629349520 Interfund Revenue from 520 Fnd0000620 8,910
(2.1) %9593 959390349521 Interfund Revenue from 521 Fnd0000620 105
(2.1) %232227 232227210349530 Interfund Revenue from 530 Fnd0000620 243
(1.6) %1,7701,741 1,7701,7411,723349540 Interfund Revenue from 540 Fnd0000620 2,066
(1.4) %4,8304,760 4,8304,7604,992349550 Interfund Revenue from 550 Fnd0000620 6,207
(1.0) %860851 860851846349560 Interfund Revenue from 560 Fnd0000620 993
(1.9) %467458 467458462349570 Interfund Revenue from 570 Fnd0000620 558
(1.6) %177174 177174187349610 Interfund Revenue from 610 Fnd0000620 218
(1.7) %235231 235231228349640 Interfund Revenue from 640 Fnd0000620 297
(1.4) %1,2351,217 1,2351,2171,200349650 Interfund Revenue from 650 Fnd0000620 1,409
(1.1) %107,123105,883105,883 107,123Charges for Services Total 103,044122,901
-0 003,7223,662Interest From Investments0000620371100 0
-0 002,364427GASB31 Adjustment0000620371110 0
-0 0Miscellaneous Total 006,0864,090
(1.1) %105,883 107,123107,123105,883109,131126,992Total Budget Requirements
CCReport Name: 2017_Mid_Cycle_Report_Revenues
Report Description: Budget Book - Department Budget Detail wMD
06/07/2017Date:
Time: 152
Version:
Page:19:21:42

Department / Section: Balance Sheet / Revenue / Balance Sheet / Revenue630 - 000000
Department Budget Detail
%Chnge16/17 vs 17/182017/182017/18
AmendedAdoptedAdopted2016/17
AmendedActualActual2016/172015/162014/15GL KeyObject Description
(2.5) %6,239,2126,081,162 6,239,2126,081,1625,962,053349101 Interfund Revenue from 101 Fnd0000630 5,893,356
(3.2) %5,5745,395 5,5745,3956,573349170 Interfund Revenue from 170 Fnd0000630 4,784
(3.8) %5,2425,038 5,2425,0387,050349220 Interfund Revenue from 220 Fnd0000630 4,595
(3.1) %10,2679,939 10,2679,93913,123349280 Interfund Revenue from 280 Fnd0000630 7,887
( .7) %610,882606,077 610,882606,077534,516349510 Interfund Revenue from 510 Fnd0000630 609,075
(2.6)%13,716 14,09613,71600Interfund Revenue from 511 Fnd0000630349511 14,096
(1.1) %284,124280,856 284,124280,856285,402349520 Interfund Revenue from 520 Fnd0000630 324,116
(2.7) %3,5733,473 3,5733,4733,405349521 Interfund Revenue from 521 Fnd0000630 3,813
(1.8) %7,9717,825 7,9717,8257,236349530 Interfund Revenue from 530 Fnd0000630 3,874
(1.5) %90,86289,453 90,86289,45390,555349540 Interfund Revenue from 540 Fnd0000630 95,484
(1.3) %211,006208,100 211,006208,100387,892349550 Interfund Revenue from 550 Fnd0000630 297,879
(1.0) %46,00245,506 46,00245,50639,732349560 Interfund Revenue from 560 Fnd0000630 36,527
(1.7) %56,85055,830 56,85055,83047,982349570 Interfund Revenue from 570 Fnd0000630 25,786
(1.3) %4,2344,177 4,2344,17732,521349610 Interfund Revenue from 610 Fnd0000630 22,392
(2.0) %6,6016,463 6,6016,4635,671349640 Interfund Revenue from 640 Fnd0000630 7,095
(1.7) %47,79146,976 47,79146,97669,909349650 Interfund Revenue from 650 Fnd0000630 63,332
(2.2) %7,644,2877,469,9867,469,986 7,644,287Charges for Services Total 7,493,6287,399,999
-0 004400Miscellaneous Receipts0000630374200 0
-0 0Miscellaneous Total 004400
(2.2) %7,469,986 7,644,2877,644,2877,469,9867,494,0687,399,999Total Budget Requirements
CCReport Name: 2017_Mid_Cycle_Report_Revenues
Report Description: Budget Book - Department Budget Detail wMD
06/07/2017Date:
Time: 153
Version:
Page:19:21:42

Department / Section: Balance Sheet / Revenue / Balance Sheet / Revenue640 - 000000
Department Budget Detail
%Chnge16/17 vs 17/182017/182017/18
AmendedAdoptedAdopted2016/17
AmendedActualActual2016/172015/162014/15GL KeyObject Description
-1,453,2331,453,233 1,453,2331,453,2331,297,352349010 Sales To Departments0000640 1,368,115
-76,07576,075 76,07576,07525,077349012 Misc Receipts-Other Charges0000640 114,628
-1,529,3081,529,3081,529,308 1,529,308Charges for Services Total 1,322,4301,482,744
-1,529,308 1,529,3081,529,3081,529,3081,322,4301,482,744Total Budget Requirements
CCReport Name: 2017_Mid_Cycle_Report_Revenues
Report Description: Budget Book - Department Budget Detail wMD
06/07/2017Date:
Time: 154
Version:
Page:19:21:42
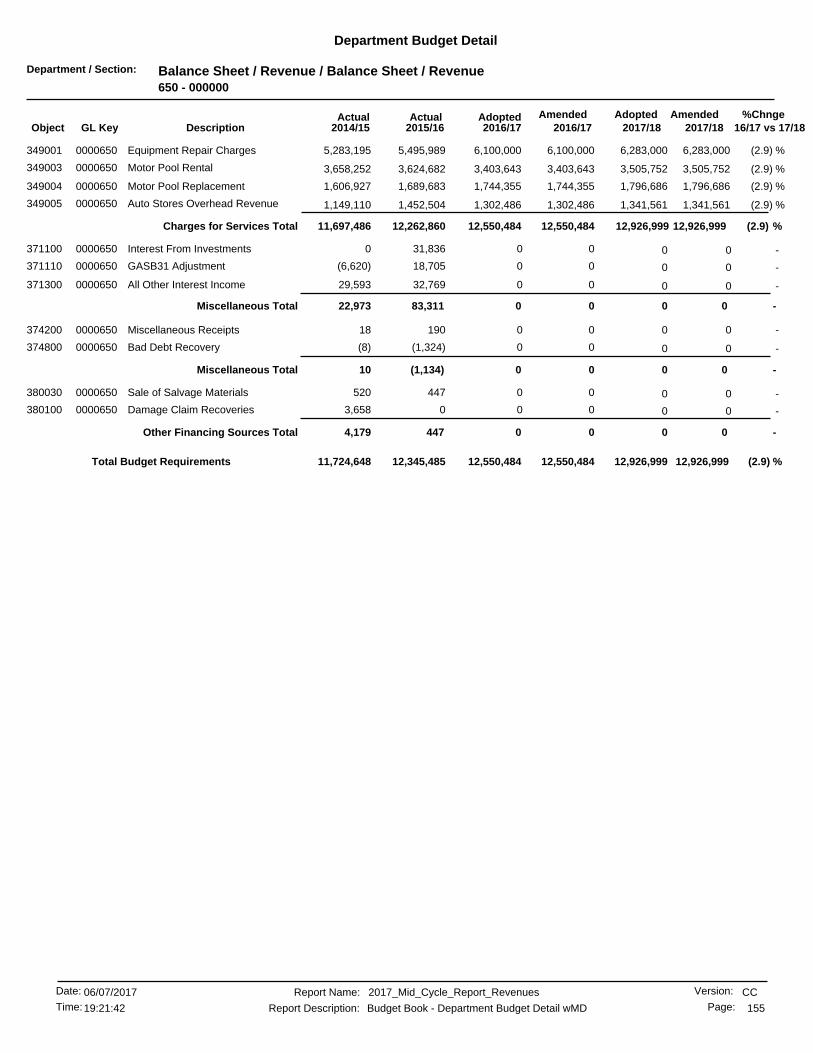
Department / Section: Balance Sheet / Revenue / Balance Sheet / Revenue650 - 000000
Department Budget Detail
%Chnge16/17 vs 17/182017/182017/18
AmendedAdoptedAdopted2016/17
AmendedActualActual2016/172015/162014/15GL KeyObject Description
(2.9) %6,283,0006,100,000 6,283,0006,100,0005,495,989349001 Equipment Repair Charges0000650 5,283,195
(2.9) %3,505,7523,403,643 3,505,7523,403,6433,624,682349003 Motor Pool Rental0000650 3,658,252
(2.9) %1,796,6861,744,355 1,796,6861,744,3551,689,683349004 Motor Pool Replacement0000650 1,606,927
(2.9) %1,341,5611,302,486 1,341,5611,302,4861,452,504349005 Auto Stores Overhead Revenue0000650 1,149,110
(2.9) %12,926,99912,550,48412,550,484 12,926,999Charges for Services Total 12,262,86011,697,486
-0 0031,8360Interest From Investments0000650371100 0
-0 0018,705(6,620)GASB31 Adjustment0000650371110 0
-0 0032,76929,593All Other Interest Income0000650371300 0
-0 0Miscellaneous Total 0083,31122,973
-0 0019018Miscellaneous Receipts0000650374200 0
-0 00(1,324)(8)Bad Debt Recovery0000650374800 0
-0 0Miscellaneous Total 00(1,134)10
-0 00447520Sale of Salvage Materials0000650380030 0
-0 0003,658Damage Claim Recoveries0000650380100 0
-0 0Other Financing Sources Total 004474,179
(2.9) %12,550,484 12,926,99912,926,99912,550,48412,345,48511,724,648Total Budget Requirements
CCReport Name: 2017_Mid_Cycle_Report_Revenues
Report Description: Budget Book - Department Budget Detail wMD
06/07/2017Date:
Time: 155
Version:
Page:19:21:42

Department / Section: General Services / Gen Svs-Central Garage650 - 221500
Department Budget Detail
%Chnge16/17 vs 17/182017/182017/18
AmendedAdoptedAdopted2016/17
AmendedActualActual2016/172015/162014/15GL KeyObject Description
-0 0400,00000SCAQMD Heavy Duty Vehicle 20109405900334300 0
-0 000200,000CEC - CNG @ WQCP9407100334300 0
-0 000400,000SCAQMD - CNG @ WQCP9407110334300 0
-0 0Intergovernmental Total 0400,0000600,000
(100.0) %00 0400,0000Total Budget Requirements 600,000
CCReport Name: 2017_Mid_Cycle_Report_Revenues
Report Description: Budget Book - Department Budget Detail wMD
06/07/2017Date:
Time: 156
Version:
Page:19:21:42
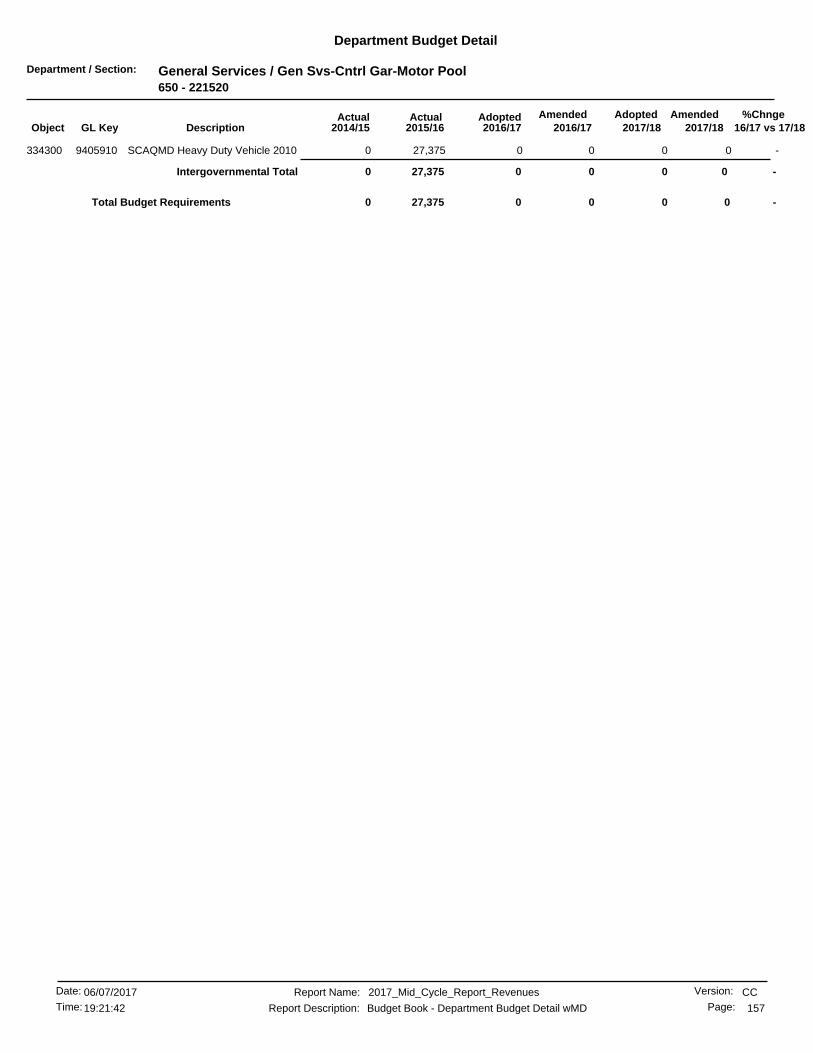
Department / Section: General Services / Gen Svs-Cntrl Gar-Motor Pool650 - 221520
Department Budget Detail
%Chnge16/17 vs 17/182017/182017/18
AmendedAdoptedAdopted2016/17
AmendedActualActual2016/172015/162014/15GL KeyObject Description
-0 0027,3750SCAQMD Heavy Duty Vehicle 20109405910334300 0
-0 0Intergovernmental Total 0027,3750
-00 0027,375Total Budget Requirements 0
CCReport Name: 2017_Mid_Cycle_Report_Revenues
Report Description: Budget Book - Department Budget Detail wMD
06/07/2017Date:
Time: 157
Version:
Page:19:21:42
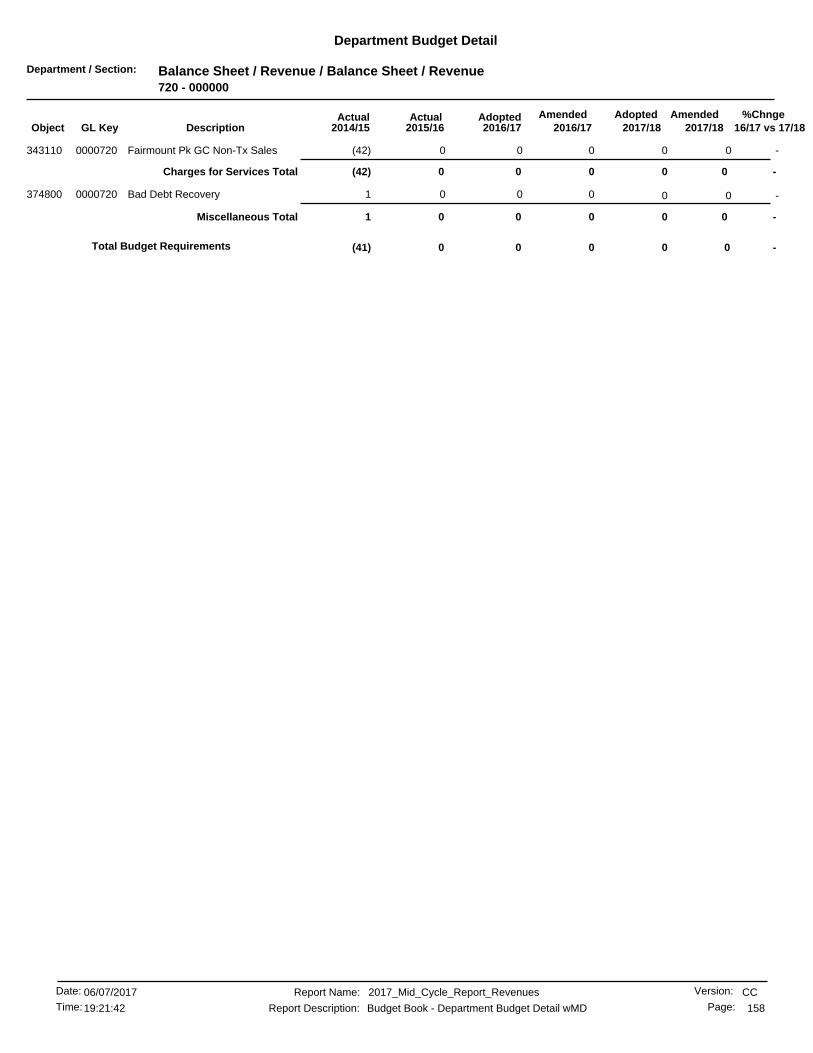
Department / Section: Balance Sheet / Revenue / Balance Sheet / Revenue720 - 000000
Department Budget Detail
%Chnge16/17 vs 17/182017/182017/18
AmendedAdoptedAdopted2016/17
AmendedActualActual2016/172015/162014/15GL KeyObject Description
-0 000(42)Fairmount Pk GC Non-Tx Sales0000720343110 0
-0 0Charges for Services Total 000(42)
-0 0001Bad Debt Recovery0000720374800 0
-0 0Miscellaneous Total 0001
-00 000Total Budget Requirements (41)
CCReport Name: 2017_Mid_Cycle_Report_Revenues
Report Description: Budget Book - Department Budget Detail wMD
06/07/2017Date:
Time: 158
Version:
Page:19:21:42

Department / Section: Balance Sheet / Revenue / Balance Sheet / Revenue722 - 000000
Department Budget Detail
%Chnge16/17 vs 17/182017/182017/18
AmendedAdoptedAdopted2016/17
AmendedActualActual2016/172015/162014/15GL KeyObject Description
-0 00(3,106)3,106Bad Debt Recovery0000722374800 0
-0 0Miscellaneous Total 00(3,106)3,106
-00 00(3,106)Total Budget Requirements 3,106
CCReport Name: 2017_Mid_Cycle_Report_Revenues
Report Description: Budget Book - Department Budget Detail wMD
06/07/2017Date:
Time: 159
Version:
Page:19:21:42

Department / Section: Balance Sheet / Revenue / Balance Sheet / Revenue741 - 000000
Department Budget Detail
%Chnge16/17 vs 17/182017/182017/18
AmendedAdoptedAdopted2016/17
AmendedActualActual2016/172015/162014/15GL KeyObject Description
( .0) %403,856403,472 403,856403,472438,155361033 Auto Center Assessment Distrct0000741 408,697
( .0) %403,856403,472403,472 403,856Special Assessments Total 438,155408,697
-0 00346134Interest From Investments0000741371100 0
-0 00(4,506)(3,627)GASB31 Adjustment0000741371110 0
.6 %14,30014,400 14,30014,4006,484371300 All Other Interest Income0000741 5,928
.6 %14,30014,40014,400 14,300Miscellaneous Total 2,3242,435
( .0) %417,872 418,156418,156417,872440,480411,133Total Budget Requirements
CCReport Name: 2017_Mid_Cycle_Report_Revenues
Report Description: Budget Book - Department Budget Detail wMD
06/07/2017Date:
Time: 160
Version:
Page:19:21:42
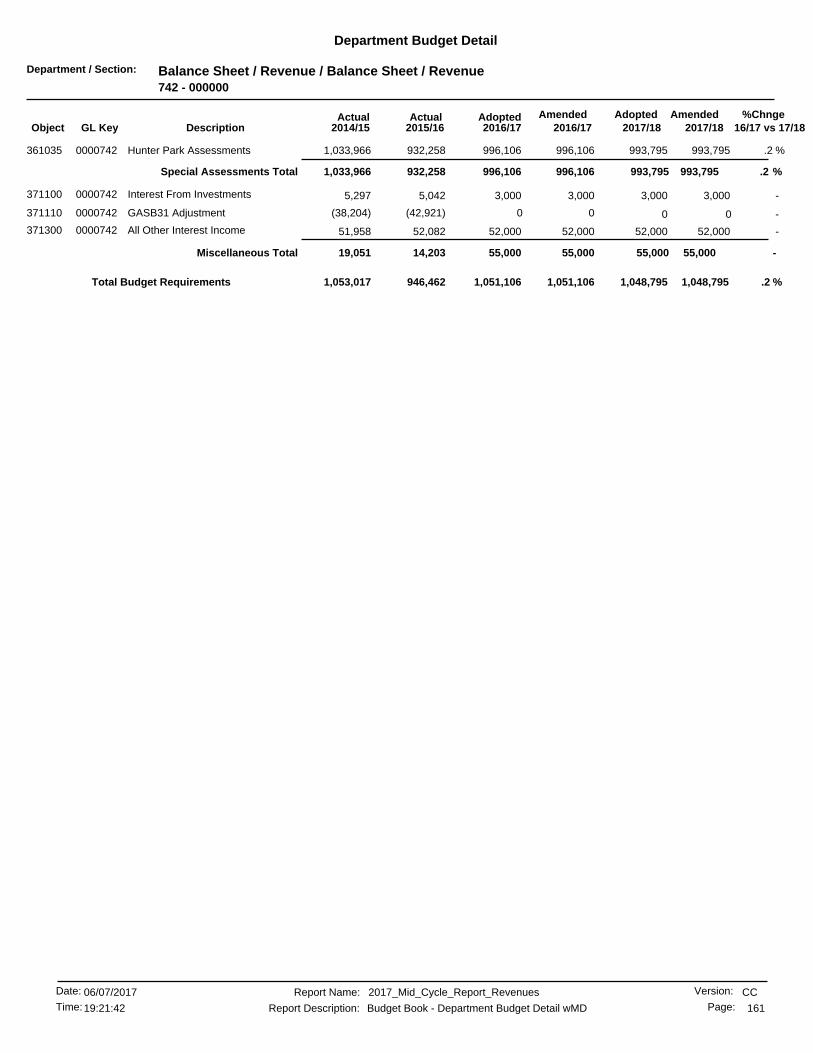
Department / Section: Balance Sheet / Revenue / Balance Sheet / Revenue742 - 000000
Department Budget Detail
%Chnge16/17 vs 17/182017/182017/18
AmendedAdoptedAdopted2016/17
AmendedActualActual2016/172015/162014/15GL KeyObject Description
.2 %993,795996,106 993,795996,106932,258361035 Hunter Park Assessments0000742 1,033,966
.2 %993,795996,106996,106 993,795Special Assessments Total 932,2581,033,966
-3,0003,000 3,0003,0005,042371100 Interest From Investments0000742 5,297
-0 00(42,921)(38,204)GASB31 Adjustment0000742371110 0
-52,00052,000 52,00052,00052,082371300 All Other Interest Income0000742 51,958
-55,00055,00055,000 55,000Miscellaneous Total 14,20319,051
.2 %1,051,106 1,048,7951,048,7951,051,106946,4621,053,017Total Budget Requirements
CCReport Name: 2017_Mid_Cycle_Report_Revenues
Report Description: Budget Book - Department Budget Detail wMD
06/07/2017Date:
Time: 161
Version:
Page:19:21:42

Department / Section: Balance Sheet / Revenue / Balance Sheet / Revenue745 - 000000
Department Budget Detail
%Chnge16/17 vs 17/182017/182017/18
AmendedAdoptedAdopted2016/17
AmendedActualActual2016/172015/162014/15GL KeyObject Description
.2 %715,413717,006 715,413717,006723,083361034 Riverwalk Assessment District0000745 691,955
.2 %715,413717,006717,006 715,413Special Assessments Total 723,083691,955
-5,0005,000 5,0005,0002,694371100 Interest From Investments0000745 2,573
-0 00(350)201GASB31 Adjustment0000745371110 0
-16,50016,500 16,50016,5006,815371300 All Other Interest Income0000745 8,216
-21,50021,50021,500 21,500Miscellaneous Total 9,15910,991
.2 %738,506 736,913736,913738,506732,243702,947Total Budget Requirements
CCReport Name: 2017_Mid_Cycle_Report_Revenues
Report Description: Budget Book - Department Budget Detail wMD
06/07/2017Date:
Time: 162
Version:
Page:19:21:42
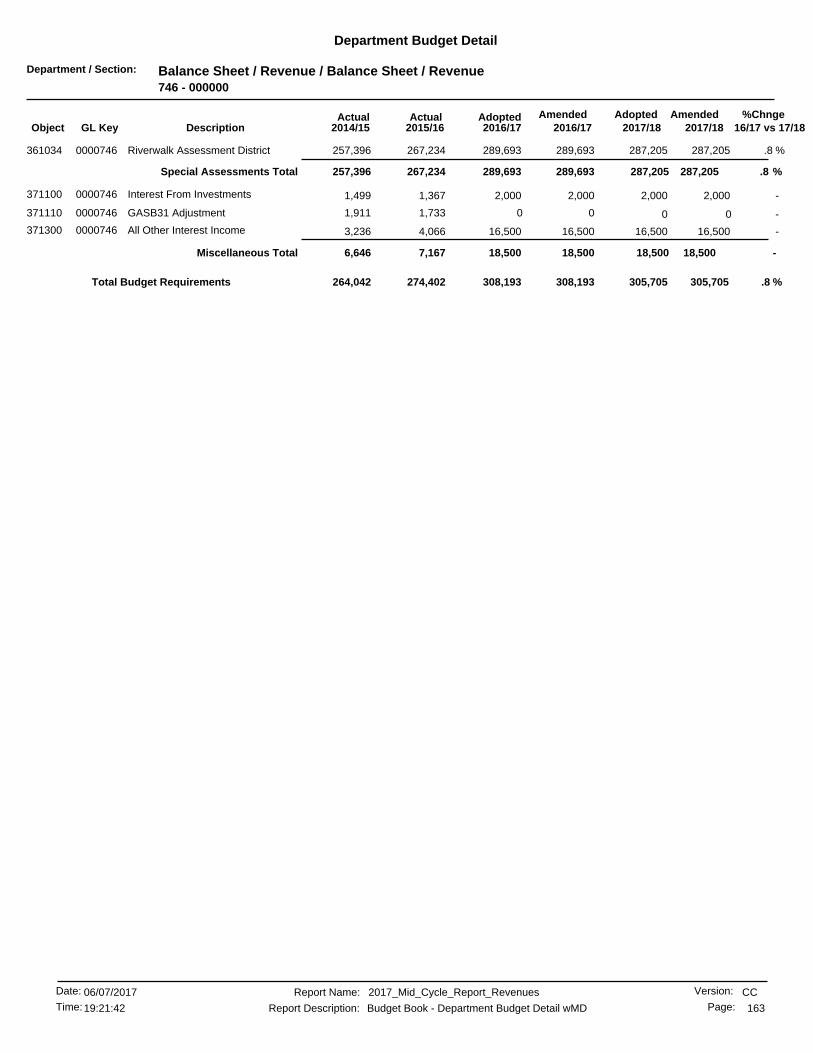
Department / Section: Balance Sheet / Revenue / Balance Sheet / Revenue746 - 000000
Department Budget Detail
%Chnge16/17 vs 17/182017/182017/18
AmendedAdoptedAdopted2016/17
AmendedActualActual2016/172015/162014/15GL KeyObject Description
.8 %287,205289,693 287,205289,693267,234361034 Riverwalk Assessment District0000746 257,396
.8 %287,205289,693289,693 287,205Special Assessments Total 267,234257,396
-2,0002,000 2,0002,0001,367371100 Interest From Investments0000746 1,499
-0 001,7331,911GASB31 Adjustment0000746371110 0
-16,50016,500 16,50016,5004,066371300 All Other Interest Income0000746 3,236
-18,50018,50018,500 18,500Miscellaneous Total 7,1676,646
.8 %308,193 305,705305,705308,193274,402264,042Total Budget Requirements
CCReport Name: 2017_Mid_Cycle_Report_Revenues
Report Description: Budget Book - Department Budget Detail wMD
06/07/2017Date:
Time: 163
Version:
Page:19:21:42
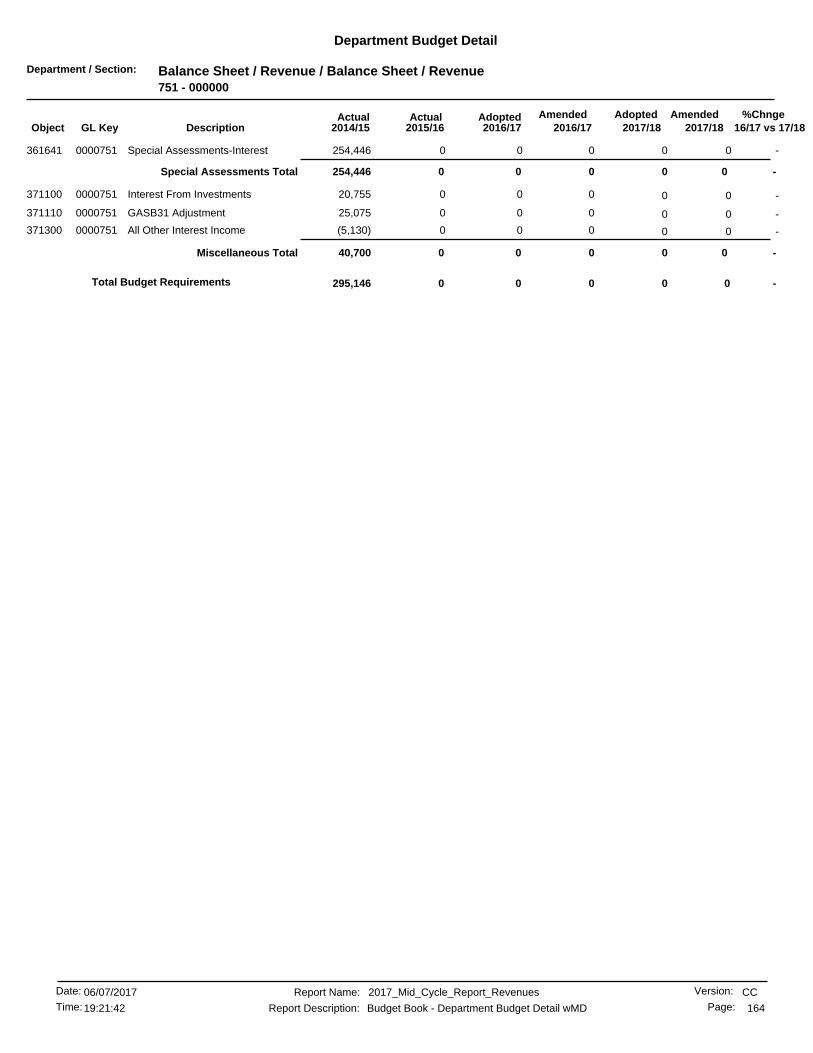
Department / Section: Balance Sheet / Revenue / Balance Sheet / Revenue751 - 000000
Department Budget Detail
%Chnge16/17 vs 17/182017/182017/18
AmendedAdoptedAdopted2016/17
AmendedActualActual2016/172015/162014/15GL KeyObject Description
-0 000254,446Special Assessments-Interest0000751361641 0
-0 0Special Assessments Total 000254,446
-0 00020,755Interest From Investments0000751371100 0
-0 00025,075GASB31 Adjustment0000751371110 0
-0 000(5,130)All Other Interest Income0000751371300 0
-0 0Miscellaneous Total 00040,700
-00 000Total Budget Requirements 295,146
CCReport Name: 2017_Mid_Cycle_Report_Revenues
Report Description: Budget Book - Department Budget Detail wMD
06/07/2017Date:
Time: 164
Version:
Page:19:21:42
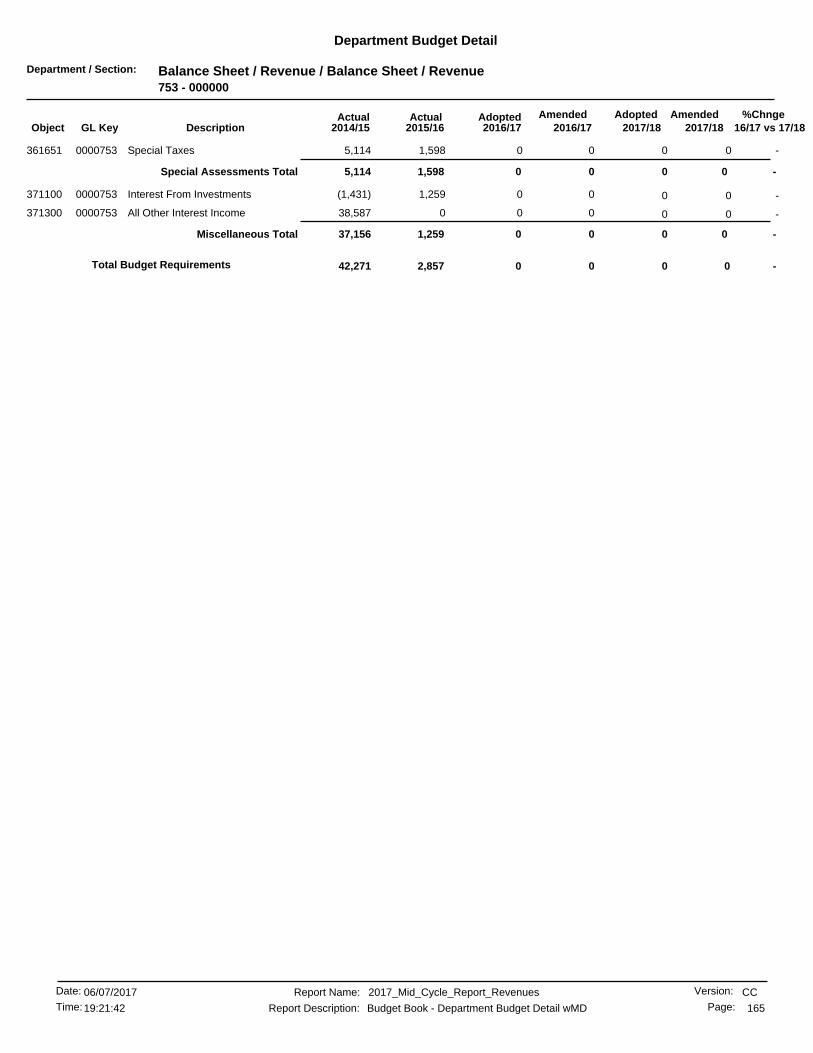
Department / Section: Balance Sheet / Revenue / Balance Sheet / Revenue753 - 000000
Department Budget Detail
%Chnge16/17 vs 17/182017/182017/18
AmendedAdoptedAdopted2016/17
AmendedActualActual2016/172015/162014/15GL KeyObject Description
-0 001,5985,114Special Taxes0000753361651 0
-0 0Special Assessments Total 001,5985,114
-0 001,259(1,431)Interest From Investments0000753371100 0
-0 00038,587All Other Interest Income0000753371300 0
-0 0Miscellaneous Total 001,25937,156
-00 002,857Total Budget Requirements 42,271
CCReport Name: 2017_Mid_Cycle_Report_Revenues
Report Description: Budget Book - Department Budget Detail wMD
06/07/2017Date:
Time: 165
Version:
Page:19:21:42

Department / Section: Balance Sheet / Revenue / Balance Sheet / Revenue756 - 000000
Department Budget Detail
%Chnge16/17 vs 17/182017/182017/18
AmendedAdoptedAdopted2016/17
AmendedActualActual2016/172015/162014/15GL KeyObject Description
-0 00318,732358,633Riverwalk Vista0000756361036 0
.7%289,919 287,794289,91900Special Taxes0000756361651 287,794
.7 %287,794289,919289,919 287,794Special Assessments Total 318,732358,633
-0 00434803Interest From Investments0000756371100 0
-0 002,1832,448GASB31 Adjustment0000756371110 0
-42,00042,000 42,00042,0003,688371300 All Other Interest Income0000756 3,687
-42,00042,00042,000 42,000Miscellaneous Total 6,3056,939
.6 %331,919 329,794329,794331,919325,038365,573Total Budget Requirements
CCReport Name: 2017_Mid_Cycle_Report_Revenues
Report Description: Budget Book - Department Budget Detail wMD
06/07/2017Date:
Time: 166
Version:
Page:19:21:42
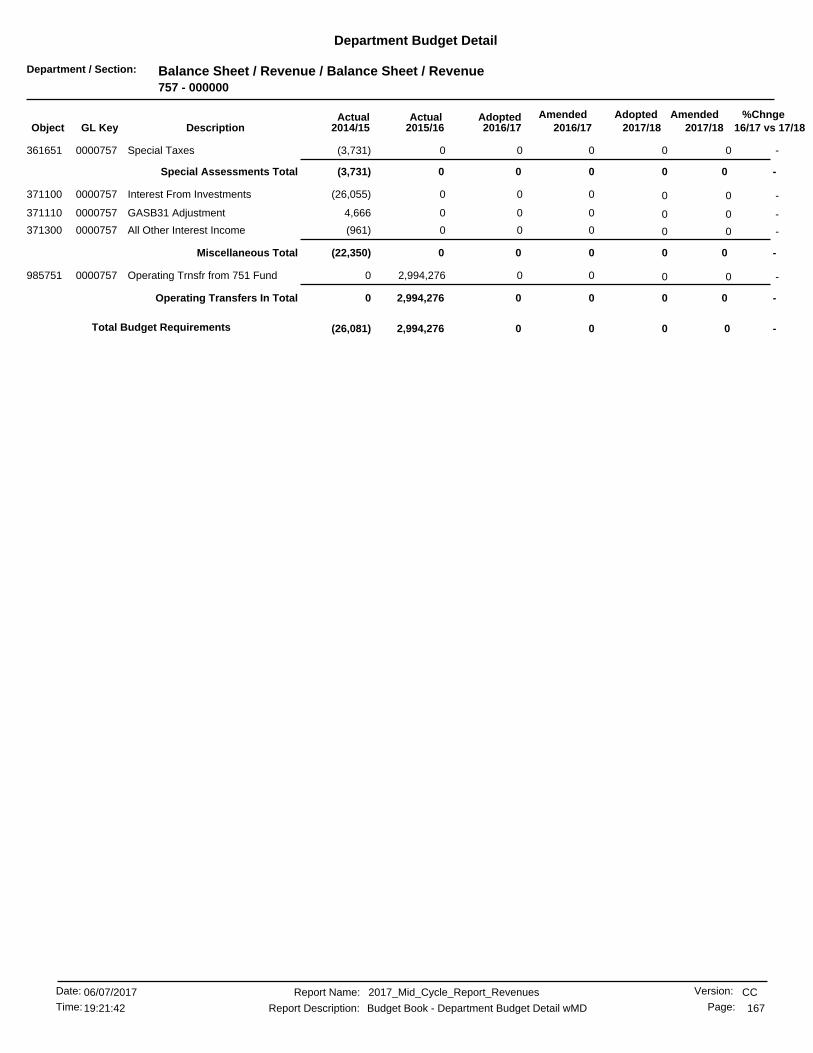
Department / Section: Balance Sheet / Revenue / Balance Sheet / Revenue757 - 000000
Department Budget Detail
%Chnge16/17 vs 17/182017/182017/18
AmendedAdoptedAdopted2016/17
AmendedActualActual2016/172015/162014/15GL KeyObject Description
-0 000(3,731)Special Taxes0000757361651 0
-0 0Special Assessments Total 000(3,731)
-0 000(26,055)Interest From Investments0000757371100 0
-0 0004,666GASB31 Adjustment0000757371110 0
-0 000(961)All Other Interest Income0000757371300 0
-0 0Miscellaneous Total 000(22,350)
-0 002,994,2760Operating Trnsfr from 751 Fund0000757985751 0
-0 0Operating Transfers In Total 002,994,2760
-00 002,994,276Total Budget Requirements (26,081)
CCReport Name: 2017_Mid_Cycle_Report_Revenues
Report Description: Budget Book - Department Budget Detail wMD
06/07/2017Date:
Time: 167
Version:
Page:19:21:42

Department / Section: Balance Sheet / Revenue / Balance Sheet / Revenue758 - 000000
Department Budget Detail
%Chnge16/17 vs 17/182017/182017/18
AmendedAdoptedAdopted2016/17
AmendedActualActual2016/172015/162014/15GL KeyObject Description
.3 %641,034642,990 641,034642,990656,113361651 Special Taxes0000758 644,917
.3 %641,034642,990642,990 641,034Special Assessments Total 656,113644,917
-0 002,1391,676Interest From Investments0000758371100 0
-0 00(418)240GASB31 Adjustment0000758371110 0
-35,00035,000 35,00035,0008,200371300 All Other Interest Income0000758 9,780
-35,00035,00035,000 35,000Miscellaneous Total 9,92111,697
-0 00016Operating Trans from 458 Fund0000758985458 0
-0 0Operating Transfers In Total 00016
.2 %677,990 676,034676,034677,990666,035656,630Total Budget Requirements
CCReport Name: 2017_Mid_Cycle_Report_Revenues
Report Description: Budget Book - Department Budget Detail wMD
06/07/2017Date:
Time: 168
Version:
Page:19:21:42

Department / Section: Balance Sheet / Revenue / Balance Sheet / Revenue759 - 000000
Department Budget Detail
%Chnge16/17 vs 17/182017/182017/18
AmendedAdoptedAdopted2016/17
AmendedActualActual2016/172015/162014/15GL KeyObject Description
-0 00379,7010Riverwalk Vista0000759361036 0
(17.0)%301,939 364,013301,93900Special Taxes0000759361651 364,013
(17.0) %364,013301,939301,939 364,013Special Assessments Total 379,7010
-0 001,2250Interest From Investments0000759371100 0
-0 004,1070GASB31 Adjustment0000759371110 0
-10,50010,500 10,50010,500(471)371300 All Other Interest Income0000759 0
-10,50010,50010,500 10,500Miscellaneous Total 4,8610
-0 0043,4770Operating Trnsfr from 756 Fund0000759985756 0
-0 0Operating Transfers In Total 0043,4770
-0 006,780,0000Othr Bond & Financing Proceeds0000759382040 0
-0 00(117,719)0Discount on Bond Issuance0000759382050 0
-0 0Advances from Other Funds Total 006,662,2800
(16.5) %312,439 374,513374,513312,4397,090,3210Total Budget Requirements
CCReport Name: 2017_Mid_Cycle_Report_Revenues
Report Description: Budget Book - Department Budget Detail wMD
06/07/2017Date:
Time: 169
Version:
Page:19:21:42

Department / Section: Balance Sheet / Revenue / Balance Sheet / Revenue760 - 000000
Department Budget Detail
%Chnge16/17 vs 17/182017/182017/18
AmendedAdoptedAdopted2016/17
AmendedActualActual2016/172015/162014/15GL KeyObject Description
(48.1)%73,846 142,30073,84600Special Taxes0000760361651 142,300
(48.1) %73,846 142,300Special Assessments Total 142,30073,84600
-0 004440Interest From Investments0000760371100 0
-10,50010,500 10,50010,500316371300 All Other Interest Income0000760 0
-10,50010,50010,500 10,500Miscellaneous Total 7610
-0 002,610,0000Othr Bond & Financing Proceeds0000760382040 0
-0 00(55,668)0Discount on Bond Issuance0000760382050 0
-0 0Advances from Other Funds Total 002,554,3310
(44.7) %84,346 152,800152,80084,3462,555,0930Total Budget Requirements
CCReport Name: 2017_Mid_Cycle_Report_Revenues
Report Description: Budget Book - Department Budget Detail wMD
06/07/2017Date:
Time: 170
Version:
Page:19:21:42
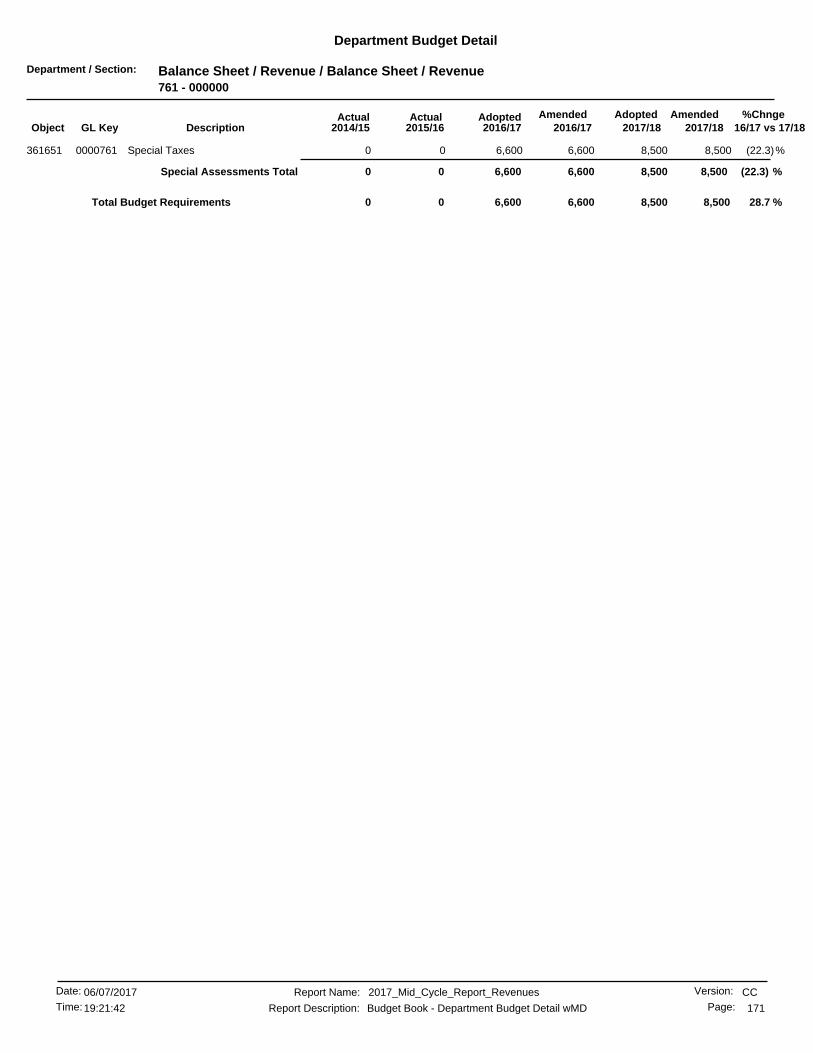
Department / Section: Balance Sheet / Revenue / Balance Sheet / Revenue761 - 000000
Department Budget Detail
%Chnge16/17 vs 17/182017/182017/18
AmendedAdoptedAdopted2016/17
AmendedActualActual2016/172015/162014/15GL KeyObject Description
(22.3)%6,600 8,5006,60000Special Taxes0000761361651 8,500
(22.3) %6,600 8,500Special Assessments Total 8,5006,60000
28.7 %8,5006,600 8,5006,6000Total Budget Requirements 0
CCReport Name: 2017_Mid_Cycle_Report_Revenues
Report Description: Budget Book - Department Budget Detail wMD
06/07/2017Date:
Time: 171
Version:
Page:19:21:42

Department / Section: Balance Sheet / Revenue / Balance Sheet / Revenue770 - 000000
Department Budget Detail
%Chnge16/17 vs 17/182017/182017/18
AmendedAdoptedAdopted2016/17
AmendedActualActual2016/172015/162014/15GL KeyObject Description
-0 005186All Other Interest Income0000770371300 0
-0 0Miscellaneous Total 005186
-0 000324Operating Trnsfr from 281 Fund0000770985281 0
-00 0837,553871,185985371 Operating Trnsfr from 371 Fund0000770 901,954
-00 0998,4611,042,151985372 Operating Trnsfr from 372 Fund0000770 495,737
-00 0156,542163,392985374 Operating Trnsfr from 374 Fund0000770 195,648
-00 01,765,7731,843,041985376 Operating Trnsfr from 376 Fund0000770 2,690,334
-00 02,817,1262,940,397985378 Operating Trnsfr from 378 Fund0000770 1,145,274
-0 000913Operating Trnsfr from 472 Fund0000770985472 0
-0 0006,610Operating Trnsfr from 476 Fund0000770985476 0
-0 00074,303Operating Trnsfr from 478 Fund0000770985478 0
-0 0Operating Transfers In Total 06,575,4576,860,1695,511,102
-0 006,575,4576,860,2205,511,188Total Budget Requirements
(100.0) %00 06,575,4576,860,220Total Budget Requirements 5,511,188
CCReport Name: 2017_Mid_Cycle_Report_Revenues
Report Description: Budget Book - Department Budget Detail wMD
06/07/2017Date:
Time: 172
Version:
Page:19:21:42

Department / Section: Balance Sheet / Revenue / Balance Sheet / Revenue999 - 000000
Department Budget Detail
%Chnge16/17 vs 17/182017/182017/18
AmendedAdoptedAdopted2016/17
AmendedActualActual2016/172015/162014/15GL KeyObject Description
-0 004,735,0953,894,458Interest Income0000999371500 0
-0 0Miscellaneous Total 004,735,0953,894,458
-00 004,735,095Total Budget Requirements 3,894,458
CCReport Name: 2017_Mid_Cycle_Report_Revenues
Report Description: Budget Book - Department Budget Detail wMD
06/07/2017Date:
Time: 173
Version:
Page:19:21:42
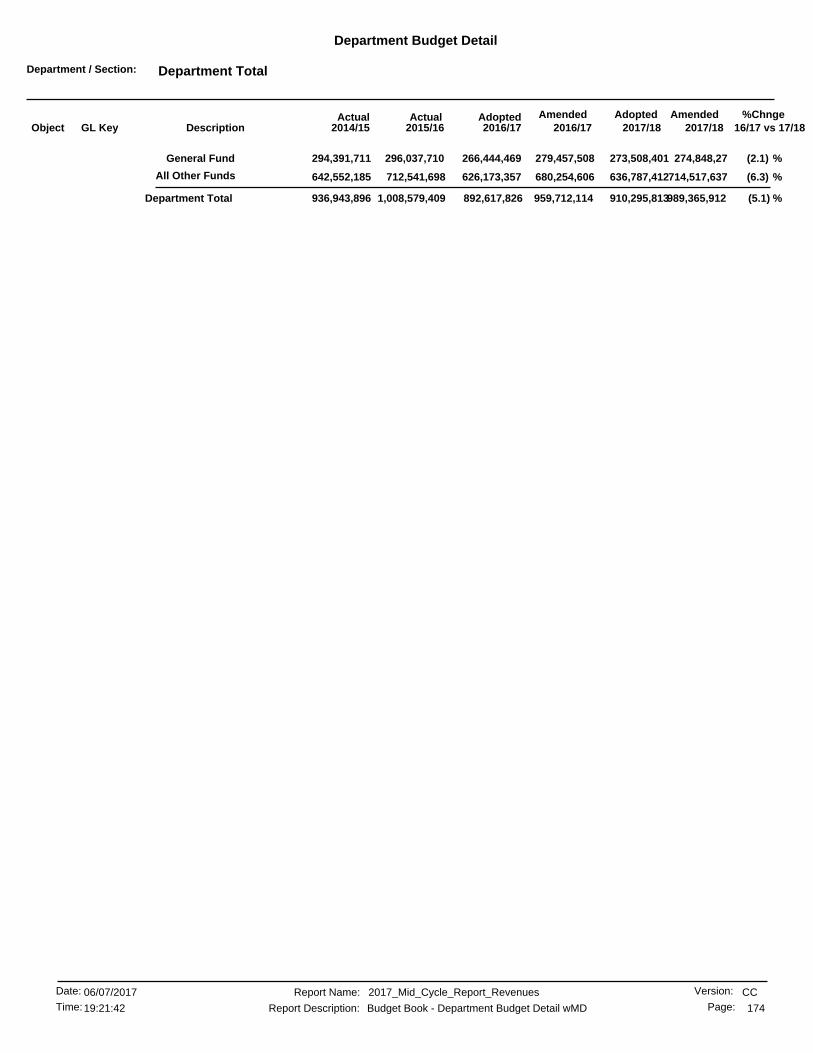
Department / Section: Department Total
Department Budget Detail
%Chnge16/17 vs 17/182017/182017/18
AmendedAdoptedAdopted2016/17
AmendedActualActual2016/172015/162014/15GL KeyObject Description
(6.3)
(2.1)
%
%
(5.1) %
714,517,637636,787,412
274,848,27
989,365,912
273,508,401279,457,508
680,254,606
910,295,813959,712,114
626,173,357
266,444,469
892,617,826
296,037,710
712,541,698
1,008,579,409
642,552,185
294,391,711
936,943,896
General Fund
All Other Funds
Department Total
CCReport Name: 2017_Mid_Cycle_Report_Revenues
Report Description: Budget Book - Department Budget Detail wMD
06/07/2017Date:
Time: 174
Version:
Page:19:21:42

Planning Commission Memorandum
Community & Economic Development Department Planning Division 3900 Main Street, Riverside, CA 92522 | Phone: (951) 826-5371 | RiversideCA.gov
Page 1 May 18, 2017 PSP17-0018
PLANNING COMMISSION HEARING DATE: MAY 18, 2017
AGENDA ITEM NO.: 2
PROPOSED PROJECT
RECOMMENDATIONS Staff Recommends that the City Planning Commission:
1. DETERMINE that Review of the City of Riverside’s FY 2017/18 Capital Improvement Program(CIP)(PSP17-0018) is not subject to the California Environmental Quality Act (CEQA) reviewpursuant to CEQA Guidelines Section 15061(b)(3) because the review is not considered a“project”, as defined by section 15378(b)(4), and the determination of consistency by thePlanning Commission has no potential to result in a direct or indirect physical change inthe environment.
2. FIND that the FY 2017/18 Capital Improvement Program is consistent with the City’s GeneralPlan 2025; and
3. REPORT to the City Council that the FY 2017/18 Capital Improvement Program is consistentwith the City’s General Plan 2025.
BACKGROUND
The City of Riverside Charter and the Riverside Municipal Code require that the Planning Commission review the City’s proposed Capital Improvement Program (CIP) and determine that the program is consistent with the City’s General Plan. California Government Code Section 65401 also requires that the Planning Commission review the City’s Capital Improvement Program (CIP) for the upcoming fiscal year, and report its findings to the City Council.
Case Numbers PSP17-0018
Request Review of the City of Riverside’s FY 2017/18 Capital Improvement Program (CIP) for consistency with General Plan 2025
Applicant City of Riverside Finance Department
Project Location Citywide
Ward Citywide
Staff Planner David Murray, Senior Planner; 951-826-5773; [email protected]
Attachment H

Page 2 May 18, 2017 PSP17-0018
On June 21, 2016 the City Council approved a two-year budget for fiscal year (FY) 2016/2017 through 2017/2018; and a five-year capital improvement program (CIP) from FY 2016/2017 through FY 2020/2021. The Planning Commission reviewed the budget and CIP in its entirety on May 5, 2016, and reported that the FY 2016/17 projects were in conformity with the General Plan. PROPOSAL/REQUEST
Staff is requesting that the Planning Commission review the CIP projects for FY 2017/18 and report as to whether the projects conform to the City’s General Plan. Exhibit 2 is a listing of all capital improvement projects contemplated for approval during Fiscal Year (FY) 2017/2018. Included on the attached list for FY 2017/2018 are 65 funded projects at a total estimated cost of $62,635,500. Of the 65 funded projects listed, 54 are projects that are continued from FY 2016/2017, and 11 are new projects for FY 2017/2018. PROJECT ANALYSIS
The Planning Division has reviewed the listed projects for conformance with General Plan 2025. Staff created two tables to correlate the General Plan 2025 Objectives and Policies that support Fiscal Year (FY) 2017/18 projects. Table 1 is comprised of projects related to the maintenance and replacement of existing facilities, as well improvements to new facilities that are needed to comply with State and Federal mandates, such as water conservation measures and accessibility for the disabled. In contrast, Table 2 lists new capital improvement projects.
Staff has listed the budgeted FY 17/18 expenditure in both tables, and included the total five-year budget for the FY 16/17 through FY 20/21 five year budget cycle. While project costs have been provided, it is important to recognize the role of the Planning Commission, per City Ordinance and State law, is to report on project consistency with the General Plan. MAINTENANCE, REPAIR AND MANDATED PROJECTS The City’s General Plan 2025, is a “vision document” intended to provide guidance for managing the City’s growth. While most of General Plan 2025 is focused on policies related to new infrastructure and programs, it does identify the necessity of maintaining and repairing existing infrastructure, as illustrated on page PF-1:
“Well-designed and maintained infrastructure systems are critical to a community’s economic development goals, and they enhance the quality of neighborhoods. Infrastructure, such as sewer and water lines, broadband communications networks and solid waste collection and disposal must be sufficient to accommodate the present and future needs of the community. As infrastructure ages or growth outpaces capacity, isolated failures represent a real potential. Providing quality public facilities such as libraries, hospitals and community centers are also of vital importance, as they contribute to the health, education and quality of life for all residents.”
Additionally, page PR-16 underlines with City’s commitment to maintaining existing park facilities while expanding new opportunities:
“Enhancing Riverside’s existing park and recreation facilities, as well as creating new recreational opportunities, will be carried out through the following objectives and policies. The City will continue to maintain its existing recreation programs and facilities, as well as making those resources available to all Riversiders.”

Page 3 May 18, 2017 PSP17-0018
Table 1 below lists forty-four (44) capital improvement projects in Fiscal Year 2017/18 that are necessary to maintain or rehabilitate existing infrastructure, or modify existing facilities to meet State or Federal mandates. This list does not include rehabilitation projects that are intended to expand a facility for the purposes of accommodating future growth.
TABLE 1 MAINTENANCE, REHABILITATION AND MANDATED PROJECTS
Ref No. Funded Projects by Department and Project FY 16/17
Project? FY 17/18
Budget ($)
Total 5-Year Budget
16–21 ($)
Remaining Budget Outlay
After 17/18 ($)
General Services 1 Airport Facilities - Terminal Patio Deck No 50,000 50,000 0 2 City Buildings - HVAC Replacement at Various City
Facilities Yes 15,000 75,000 45,000
3 City Buildings - Miscellaneous Improvements at City Facilities (1 of 2, Funded Portion) Yes 7,000 177,000 165,000
4 City Buildings - Police Department Improvements (1 of 2, Funded Portion) Yes 10,000 60,000 40,000
5 City Buildings -La Sierra Library Main Entry Door Replacement No 25,000 25,000 0
6 CNG Dispenser drive-off protection No 30,000 30,000 0 7 Convention Center Minor Facility Repairs (Ongoing) Yes 50,000 210,000 120,000 8 Fleet Facilities - Fleet Building Lighting
Upgrade/Replacement No 80,000 80,000 0
9 Fleet Facilities - Fleet Install E85 Fueling Station No 240,000 240,000 0 Parks, Recreation and Community Services 10 Fairmount Park Signage No 10,000 10,000 0
Public Utilities 11 Cable Replacement Yes 1,358,000 10,595,000 6,902,000 12 Capacitors-Regulators Yes 50,000 250,000 150,000 13 Distribution System Facilities Replacements Yes 1,400,000 8,200,000 5,400,000 14 Facility Rehabilitation Yes 1,751,000 13,295,000 9,300,000 15 GO 165 Upgrades /Line Rebuilds / Relocate Yes 1,583,000 15,983,000 10,800,000 16 Lines Rebuilds / Relocate Yes 2,150,000 10,750,000 6,450,000 17 Main Replacements Yes 3,400,000 36,800,000 25,800,000 18 Major 4-12 kV Conversion Yes 2,200,000 9,706,000 5,806,000 19 SCADA Yes 1,100,000 4,944,000 2,994,000 20 SCE Condemnation Costs Yes 300,000 1,900,000 1,400,000 21 Street Lighting Yes 300,000 1,500,000 900,000 22 Substation Bus & Upgrades Yes 2,875,000 16,793,000 11,443,000 23 System Substation Modifications Yes 180,000 900,000 540,000
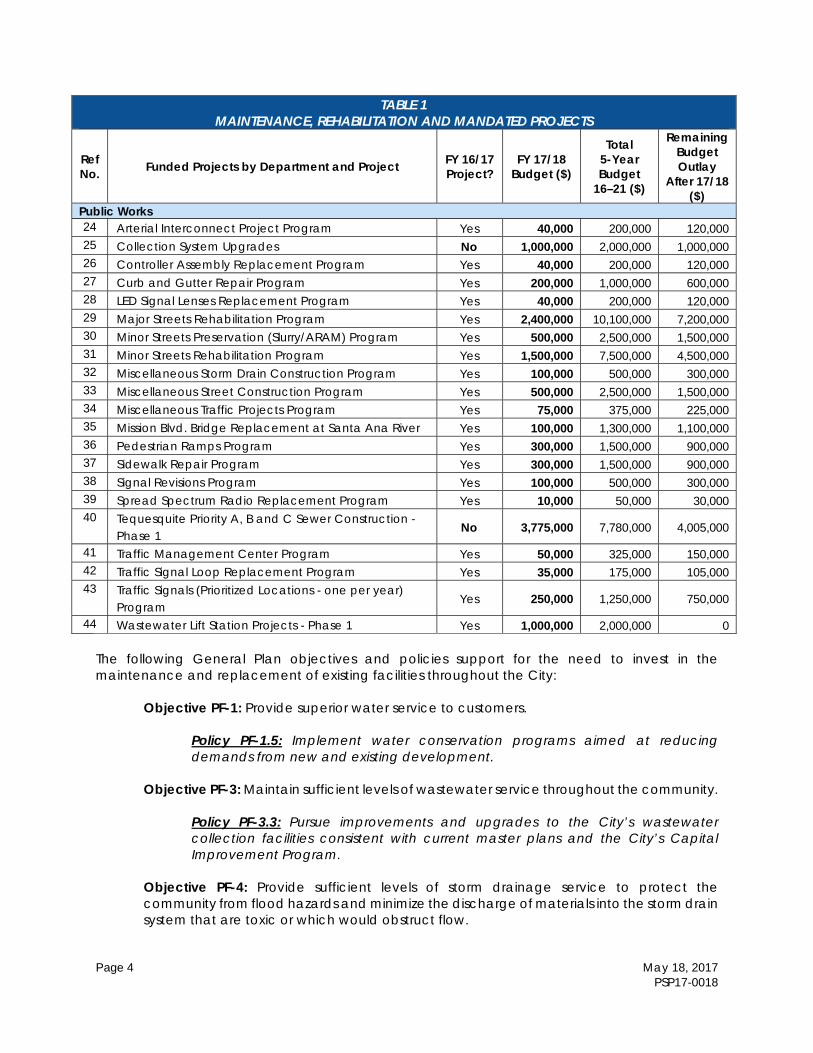
Page 4 May 18, 2017 PSP17-0018
TABLE 1 MAINTENANCE, REHABILITATION AND MANDATED PROJECTS
Ref No. Funded Projects by Department and Project FY 16/17
Project? FY 17/18
Budget ($)
Total 5-Year Budget
16–21 ($)
Remaining Budget Outlay
After 17/18 ($)
Public Works 24 Arterial Interconnect Project Program Yes 40,000 200,000 120,000 25 Collection System Upgrades No 1,000,000 2,000,000 1,000,000 26 Controller Assembly Replacement Program Yes 40,000 200,000 120,000 27 Curb and Gutter Repair Program Yes 200,000 1,000,000 600,000 28 LED Signal Lenses Replacement Program Yes 40,000 200,000 120,000 29 Major Streets Rehabilitation Program Yes 2,400,000 10,100,000 7,200,000 30 Minor Streets Preservation (Slurry/ARAM) Program Yes 500,000 2,500,000 1,500,000 31 Minor Streets Rehabilitation Program Yes 1,500,000 7,500,000 4,500,000 32 Miscellaneous Storm Drain Construction Program Yes 100,000 500,000 300,000 33 Miscellaneous Street Construction Program Yes 500,000 2,500,000 1,500,000 34 Miscellaneous Traffic Projects Program Yes 75,000 375,000 225,000 35 Mission Blvd. Bridge Replacement at Santa Ana River Yes 100,000 1,300,000 1,100,000 36 Pedestrian Ramps Program Yes 300,000 1,500,000 900,000 37 Sidewalk Repair Program Yes 300,000 1,500,000 900,000 38 Signal Revisions Program Yes 100,000 500,000 300,000 39 Spread Spectrum Radio Replacement Program Yes 10,000 50,000 30,000 40 Tequesquite Priority A, B and C Sewer Construction -
Phase 1 No 3,775,000 7,780,000 4,005,000
41 Traffic Management Center Program Yes 50,000 325,000 150,000 42 Traffic Signal Loop Replacement Program Yes 35,000 175,000 105,000 43 Traffic Signals (Prioritized Locations - one per year)
Program Yes 250,000 1,250,000 750,000
44 Wastewater Lift Station Projects - Phase 1 Yes 1,000,000 2,000,000 0 The following General Plan objectives and policies support for the need to invest in the maintenance and replacement of existing facilities throughout the City:
Objective PF-1: Provide superior water service to customers. Policy PF-1.5: Implement water conservation programs aimed at reducing demands from new and existing development.
Objective PF-3: Maintain sufficient levels of wastewater service throughout the community.
Policy PF-3.3: Pursue improvements and upgrades to the City’s wastewater collection facilities consistent with current master plans and the City’s Capital Improvement Program.
Objective PF-4: Provide sufficient levels of storm drainage service to protect the community from flood hazards and minimize the discharge of materials into the storm drain system that are toxic or which would obstruct flow.

Page 5 May 18, 2017 PSP17-0018
Policy PF-4.1: Continue to fund and undertake storm drain improvement projects as identified in the City of Riverside Capital Improvement Plan. Policy PF-4.3: Continue to routinely monitor and evaluate the effectiveness of the storm drain system and make adjustments as needed.
Objective PF-6: Provide affordable, reliable and, to the extent practical, environmentally sensitive energy resources to residents and businesses.
Policy PF-6.2: Ensure that adequate back-up facilities are available to meet critical electric power needs in the event of shortages or temporary outages.
Objective PF-10: Meet the varied recreational and service needs of Riverside’s diverse population. Objective OS-1: Preserve and expand open space areas and linkages throughout the City and sphere of influence to protect the natural and visual character of the community and provide for appropriate active and passive recreational uses.
Policy OS-1.9: Promote open space and recreation resource as key reasons to live in Riverside. Policy OS-1.12: Ensure that areas acquired as part of the Open Space System are developed, operated and maintained to provide the City with a permanent publicly accessible open space system. Policy OS-1.13: Design Capital Improvement Program projects which affect identified open space areas to support these area’s value as open space.
NEW OR EXPANDED INFRASTRUCTURE AND FACILITIES Of the sixty-five (65) funded projects for Fiscal Year 2017/18, twenty-one (21) are new or expanded facilities that are necessary to accommodate the City’s growth. It is important to note that some of these projects are multi-year efforts, and therefore were reviewed by the Planning Commission last year. The facilities are listed below in Table 2.
TABLE 2 NEW AND EXPANDED FACILITIES
Ref No. Funded Projects by Department and Project FY 16/17
Project? FY 17/18
Budget ($)
Total 5-Year Budget
16–21 ($)
Remaining Budget Outlay
After 17/18 ($)
Public Utilities 45 City-wide Communications Yes 1,200,000 6,810,000 2,700,000 46 Distribution Automation/Reliability Yes 950,000 4,050,000 2,150,000 47 Distribution Line Extensions Yes 2,600,000 13,500,000 8,400,000 48 Major Feeders Yes 1,555,000 10,005,000 6,100,000 49 Major OH/UG Conversions Yes 400,000 2,000,000 1,200,000 50 Major Street Light Projects Yes 8,060,000 17,800,000 5,430,000 51 Major Tract Distribution Yes 471,000 2,452,000 1,510,000 52 Major Transmission Line Projects No 250,000 2,200,000 1,720,000
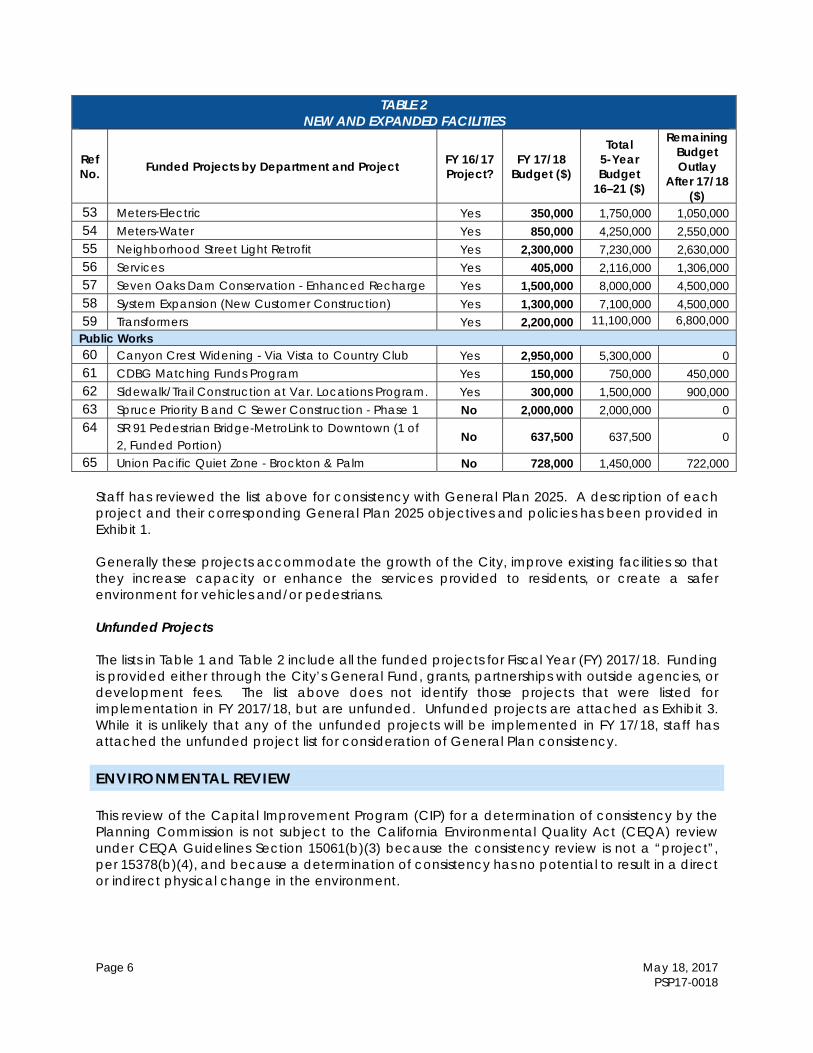
Page 6 May 18, 2017 PSP17-0018
TABLE 2 NEW AND EXPANDED FACILITIES
Ref No. Funded Projects by Department and Project FY 16/17
Project? FY 17/18
Budget ($)
Total 5-Year Budget
16–21 ($)
Remaining Budget Outlay
After 17/18 ($)
53 Meters-Electric Yes 350,000 1,750,000 1,050,000 54 Meters-Water Yes 850,000 4,250,000 2,550,000 55 Neighborhood Street Light Retrofit Yes 2,300,000 7,230,000 2,630,000 56 Services Yes 405,000 2,116,000 1,306,000 57 Seven Oaks Dam Conservation - Enhanced Recharge Yes 1,500,000 8,000,000 4,500,000 58 System Expansion (New Customer Construction) Yes 1,300,000 7,100,000 4,500,000 59 Transformers Yes 2,200,000 11,100,000 6,800,000 Public Works 60 Canyon Crest Widening - Via Vista to Country Club Yes 2,950,000 5,300,000 0 61 CDBG Matching Funds Program Yes 150,000 750,000 450,000 62 Sidewalk/Trail Construction at Var. Locations Program. Yes 300,000 1,500,000 900,000 63 Spruce Priority B and C Sewer Construction - Phase 1 No 2,000,000 2,000,000 0 64 SR 91 Pedestrian Bridge-MetroLink to Downtown (1 of
2, Funded Portion) No 637,500 637,500 0
65 Union Pacific Quiet Zone - Brockton & Palm No 728,000 1,450,000 722,000 Staff has reviewed the list above for consistency with General Plan 2025. A description of each project and their corresponding General Plan 2025 objectives and policies has been provided in Exhibit 1. Generally these projects accommodate the growth of the City, improve existing facilities so that they increase capacity or enhance the services provided to residents, or create a safer environment for vehicles and/or pedestrians. Unfunded Projects The lists in Table 1 and Table 2 include all the funded projects for Fiscal Year (FY) 2017/18. Funding is provided either through the City’s General Fund, grants, partnerships with outside agencies, or development fees. The list above does not identify those projects that were listed for implementation in FY 2017/18, but are unfunded. Unfunded projects are attached as Exhibit 3. While it is unlikely that any of the unfunded projects will be implemented in FY 17/18, staff has attached the unfunded project list for consideration of General Plan consistency.
ENVIRONMENTAL REVIEW
This review of the Capital Improvement Program (CIP) for a determination of consistency by the Planning Commission is not subject to the California Environmental Quality Act (CEQA) review under CEQA Guidelines Section 15061(b)(3) because the consistency review is not a “project”, per 15378(b)(4), and because a determination of consistency has no potential to result in a direct or indirect physical change in the environment.

Page 7 May 18, 2017 PSP17-0018
PUBLIC NOTICE AND COMMENTS
On May 5, 2017 a public hearing notice for the project was advertised in the Press Enterprise. No comments related to this request were received at the time this report was prepared.
APPEAL INFORMATION
Actions by the City Planning Commission, including any environmental finding, may be appealed to the City Council within ten calendar days after the decision. Appeal filing and processing information may be obtained from the Planning Department Public Information Section, 3rd Floor, City Hall.
EXHIBITS LIST
1. New/Expanded Project Description & Consistency Evaluation 2. CIP Funded Project List, FY 2016/17 to FY 2020/21 3. Fiscal Year 2017/18 Unfunded Projects
Report and Recommendations Prepared by: David Murray, Senior Planner Report and Recommendations Reviewed by: Ted White, City Planner Report and Recommendations Approved by: Rafael Guzman,
Community & Economic Development Director

EXHIBIT 1 – New/Expanded Projects - Descriptions & Consistency Evaluation May 18, 2017 Page 8 PSP17-0018
The following provides a brief description of projects from Table 2 in the Planning Commission staff report. Additionally, the Planning Division staff has identified criteria to support a determination that the projects are consistent with General Plan 2025. 45. City-Wide Communications This project will provide the design and installation for extensions of the City’s fiber optic system between the Orangecrest and Freeman Substations, and an extension to the Orange Terrace Library. The expansion of the fiber optic network is necessary to maintain the reliable operation of the electric system. The project also includes network upgrades to enhance cyber-security. The following Objectives and Policies most directly relate to this project: Objective PF-6: Provide affordable, reliable and, to the extent practical, environmentally sensitive energy resources to residents and businesses.
Policy PF-6.2: Ensure that adequate back-up facilities are available to meet critical electric power needs in the event of shortages or temporary outages.
Objective PF-7: Ensure that Riverside residents, the business community and educational institutions have easy access to state-of-the-art internet series and modern telecommunications technology.
Policy PF-7.1: Provide innovative, targeted technology projects and related economic development incentives. Policy PF-7.9: Continue to work with Riverside Public Utilities and private telecommunications infrastructure operators and owners to ensure that Riverside has state-of-the-art internet and telecommunication facilities, system upgrades, features and coverages.
Objective PF-8: Expand the accessibility of internet and similar communications services throughout the community.
Policy PF-8.3: Expand development of cybraries. 46. Distribution Automation/Rehabilitation This is a project to provide for the design and installation of remote sensing devices and remotely controlled equipment on the Riverside electric grid. The new equipment monitors the electric network, and remotely reports information immediately to the electric control center. The equipment reduces personnel costs and improves response times to system disturbances; this optimizes ratepayer returns, and reduces the potential of electrical outages. The following Objective and Policy most directly relate to this project: Objective PF-6: Provide affordable, reliable and, to the extent practical, environmentally sensitive energy resources to residents and business.
Policy PF-6.2: Ensure that adequate back-up facilities are available to meet critical electrical power needs in the event of shortages or temporary outages.
EXHIBIT 1 – New/Expanded Project Description & Consistency Evaluation
COMMUNITY & ECONOMIC DEVELOPMENTDEPARTMENT PLANNING DIVISION
EXHIBIT 1 – New/Expanded Projects - Descriptions & Consistency Evaluation May 18, 2017 Page 9 PSP17-0018
47, 48, 50, 51, 52, 53, 54, 56, 58 & 59. Utility Infrastructure Programs – Major Tract Distribution, Major Transmission Line Projects, Major Street Light Projects, Distribution Line Extensions, System Expansion, Major Feeders, Electric and Water Meters, Transformers, and Services. The City of Riverside Public Utilities Department maintains multiple funding accounts to support the installation of infrastructure when new development is proposed. Planning staff has grouped these accounts together because, for General Plan purposes, they all serve to accommodate customer growth (new development). Additionally, the funds are used on an as-needed basis, versus allocation to a specific site or project. Also, many of the funding programs contribute to replacing existing equipment that is outdated or underperforming; and the Distribution Line Extension provides lines to service new Electric Vehicle (EV) charging stations. The following Objective and Policy most directly relate to this project: Objective LU-10: Provide for appropriate timing of development in accordance with the future land uses designated in this Land Use Element.
Policy LU-10.3: Time the provisions of capital improvements to ensure that all necessary public services and facilities for an area planned for new urban development are in place when development in the area occur.
49. Major Overhead/Underground Conversions This is an on-going program that allows for the undergrounding of overhead electrical lines when an opportunity occurs as part of other projects. This program optimizes undergrounding on a case-by-case basis, and is not site specific. Typically the undergrounding of lines by Riverside Public Utilities occurs in conjunction with Public Works projects, such as road widenings. The following Objective and Policy most directly relate to this project: Objective LU-29: Minimize the visual impact of aerial facilities on the City’s landscape.
Policy LU-29.3: Investigate funding sources to underground existing City-owned utility facilities.
55. Neighborhood Street Light Retrofit This project replaces the streetlight system in the Wood Streets area. This street light system is oldest in the City (over 90 years). Due to the poor condition and age of the existing concrete light fixtures, the system is costly to maintain and operate, and presents safety concerns. New light standards, fixtures and power feeds will be installed to replicate the look of the existing historical system. However, the new fixtures will include light emitting diodes (LED) for energy efficiency. The following Objectives and Policies most directly relate to this project: Objective HP-1: To use historic preservation principles as an equal component in the planning and development process.
Policy HP-1.2: The City shall assume its direct responsibility for historic preservation by protecting and maintaining its publicly owned culture resources. Such resources may include, but are not limited to, buildings, monuments, landscapes, and right-of-way improvements, such as retaining walls, granite curbs, entry monuments, light standards, street trees, and the scoring, dimensions, and patterns of sidewalks, driveways, curbs and gutters.
Objective HP-7: To encourage both public and private stewardship of the City’s cultural resources. Policy HP-7.3: The City shall coordinate historic preservation with other activities within its government structure.
Objective PF-6: Provide affordable, reliable and, to the extent practical, environmentally sensitive energy resources to residents and businesses.
Policy PF-6.3: Promote and encourage energy conservation.

EXHIBIT 1 – New/Expanded Projects - Descriptions & Consistency Evaluation May 18, 2017 Page 10 PSP17-0018
57. Seven Oaks Dam Conservation – Enhanced Recharge This project constructs facilities downstream of the Seven Oaks Dam to capture and divert up to 500 cubic feet per second of local stormwater. It also includes the construction and/or enhancement of spreading grounds for groundwater recharge on property owned by the San Bernardino Valley Water Conservation District. The project location is 4-miles northeast of Redlands, near Mentone. This project will generate about 2,000 acre-feet of new water supply for the City from the Bunker Hill Basin. The following Objective and Policies most directly relate to this project: Objective OS-10: Preserve the quantity and quality of all water resources throughout Riverside.
Policy OS-10.1: Support the development and promotion of water conservation programs. Policy OS-10.2: Coordinate plans, regulations and programs with those of other public and private entities which affect the consumption and quality of water resources within Riverside. Policy OS-10.8: Cooperate with Riverside and San Bernardino Counties and adjacent jurisdictions in the review and approval of new developments which affect the quality and quantity of basin-wide groundwater and surface water resources. Policy OS-10.10: Protect aquifer recharge features and areas of important aquifers from degradation of water quality and reduction of recharge.
60. Canyon Crest Drive Road Widening – Via Vista Drive to Country Club Drive Canyon Crest Dr. is currently a 4-lane arterial street with landscaped medians south of Via Vista Drive and north of Country Club Drive. However, between these two streets Canyon Crest Dr. is a 2-lane roadway with no landscaped median. This project will complete the 4-lane arterial roadway. Canyon Crest Dr. is designed as a 4-lane divided arterial parkway in General Plan 2025 (Fig. CCM-4, p. CCM-17); therefore the project will bring Canyon Crest into conformance with the City’s General Plan. The following Objectives and Policies most directly relate to this project: Objective LU-18: Recognize Canyon Crest Drive as a vital parkway connection for the eastern portion of the City.
Policy LU-18.1: Develop streetscape, bicycle and pedestrian improvements that will solidify Canyon Crest Drive’s role as a parkway.
Objective CCM-2: Build and maintain a transportation system that combines a mix of transportation nodes and transportation system management techniques, and that is designed to meet the needs of Riverside’s resident and businesses, while minimizing the transportation system’s impact on air quality, the environment and adjacent development.
Policy CCM-2.1: Complete the Master Plan of Roadways shown on Figure CCM-4 (Master Plan of Roadways). Policy CCM-2.10: Emphasize the landscaping of parkways and boulevards.
61. CDBG Matching Funds Program The City receives Federal funds under the Community Development Block Grant (CBDG) program. These funds are provided to address development needs in eligible areas through the City. The City often uses CDBG funds to complete various street improvement projects, including asphalt resurfacing, construction of pedestrian ramps in sidewalks with detectable warning surfaces, and new sidewalks to improve pedestrian access and circulation. The CBDG Matching Funds Program is needed to meet Federal funding requirements, and is not site specific. While the CBDG Matching Funds are often used to rehabilitate existing facilities, the Planning staff did not include this program in the maintenance & rehabilitation table (Staff Report Table 1) because the program can fund new infrastructure.
EXHIBIT 1 – New/Expanded Projects - Descriptions & Consistency Evaluation May 18, 2017 Page 11 PSP17-0018
The following Objectives and Policies most directly relate to this project: Objective CCM-2: Build and maintain a transportation system that combines a mix of transportation nodes and transportation system management techniques, and that is designed to meet the needs of Riverside’s residents and businesses, while minimizing the transportation system’s impacts on air quality, the environment and adjacent development.
Policy CCM-2.9: Design all street improvement projects in a comprehensive fashion to include consideration of street trees, pedestrian walkways, bicycle lanes, equestrian pathways, signing, lighting, noise and air quality wherever any of these factors are applicable.
Objective CCM-10: Provide an extensive and regionally linked public bicycle, pedestrian and equestrian trail system.
Policy CCM-10.4: Identify and seek to eliminate hazards to safe, efficient bicycle and pedestrian movement citywide. Policy CCM-10.6: Encourage pedestrian travel through the creation of sidewalks and street crossings.
62. Sidewalk/Trail Construction at Various Locations Program This is a citywide program that facilitates the construction of new concrete sidewalks and trails that improve pedestrian access and circulation. The program is not site specific; but rather attempts to complete sidewalk and trail projects based on need and opportunity. This program is intended to reduce the risk of potential injury and improve circulation. Planning staff did not include this program in the maintenance and rehabilitation table (Staff Report Table 1) because it will include new facilities, rather than maintenance and rehabilitation. It also provides facilities that better accommodate persons with limited accessibility. The following Objectives and Policies most directly relate to this project: Objective CCM-10: Provide an extensive and regionally linked public bicycle, pedestrian and equestrian trails system.
Policy CCM-10.1: Ensure the provisions of bicycle facilities consistent with the Bicycle Master Plan. Policy CCM-10.4: Identify and seek to eliminate hazards to safe, efficient bicycle or pedestrian movement citywide. Policy CCM-10.6: Encourage pedestrian travel through the creation of sidewalks and street crossings.
Objective PR-2: Increase access to existing and future parks and expand pedestrian linkages between park and recreation facilities throughout Riverside.
Policy PR-2.3: Improve and create more connections and increase the safety of the bicycling, equestrian and pedestrian trail system within the City.
63. Spruce Priority B and C Sewer Construction – Phase 1 This project proposes to replace the under-capacity 18-inch sewer main with 21-inch sewer main on Spruce Street and the undersized 12-inch and 15-inch sewer mains with 15-inch and 18-inch on Chicago Avenue. The increased capacity will minimize sewage overflow and accommodate future growth. The Planning staff did not include this project in the maintenance and rehabilitation table (Staff Report Table 1) because the project accommodates future development in the area, and therefore is not maintenance and upkeep. The following Objective and Policy most directly relate to this project: Objective PF-3: Maintain sufficient levels of wastewater service throughout the community.
Policy PF-3.3: Pursue improvements and upgrades to the City’s wastewater collection facilities consistent with current master plans and the City’s Capital Improvement Program.
EXHIBIT 1 – New/Expanded Projects - Descriptions & Consistency Evaluation May 18, 2017 Page 12 PSP17-0018
64. SR 91 Pedestrian Bridge-Metrolink to Downtown (1 of 2, Funded Portion) Preliminary engineering study (project approval and environmental documents) to construct a bicycle/pedestrian bridge across State Route 91 (SR-91) linking the Downtown Riverside MetroLink station to the Downtown area. The following Objectives and Policies most directly relate to this project: Objective CCM-9: Promote and support an efficient public multi-modal transportation network that connects activity centers in Riverside to each other and to the region.
Policy CCM-9.9: Improve and enhance pedestrian connections between Downtown Riverside and the Downtown Metrolink station through use of walkways and the City’s Green Line Trolley service.
Objective PS-5: Provide safe pedestrian and bicyclist environments Citywide.
Policy PS-5.1: Enhance and maintain pedestrian safety through the inclusion of well-designed streets, sidewalks, crosswalks, traffic control devices and school routes throughout the City. Reasonable means of pedestrian accessibility shall be an important consideration in the approval of new development.
65. Union Pacific Quite Zone – Brockton Avenue & Palm Avenue The Federal Railroad Administration (FRA) regulates the operation of freight trains on the Union Pacific (UP) railroad tracks. These regulations include the requirement for conductors to sound train horns at roadway crossings. This requirement can be eliminated when the at-grade crossing is enhanced with safety measures that render train horns unnecessary. This CIP project will install new concrete curb, gutter and sidewalk, tactile strips, directional fencing, warning signs and devices at the Brockton Avenue and Palm Avenue roadway-rail crossings. The elimination of horns will improve the quality of life for many residents near the grade crossings, and will enhance pedestrian and vehicle safety. The following Objectives and Policies most directly relate to this project: Objective PS-4: Protect the community from hazards related to air and ground transportation.
Policy PS-4.10: Use technology to improve safety at grade crossings that cause the least environmental harm, including Quiet Zone improvements such as upgraded and updated warning devices, additional gate arms, extended and raised medians, improved signage and coordinated traffic signals.
Objective N-4: Minimize ground transportation-related noise impacts. Policy N-4.2: Investigate and pursue innovative approaches to reducing noise from railroad sources.

PSP17-0018 - Exhibit 2 Page 1 Capital Improvement Program 5-Year Funded Project List, FY 2016/2017 to FY 2020/2021
Funded CIP Projects by Department and Project
FY 2016/17
FY 2017/18
FY 2018/19
FY 2019/20
FY 2020/21
Funded CIP Total 5 Years
General Services
AIM2 Wireless devices for FMU's 50,000 - - - - 50,000 Airport Facilities - Fuel Pit Removal - - 100,000 - - 100,000 Airport Facilities - Sidewalk/Landscaping Airport Dr - - 150,000 - - 150,000 Airport Facilities - Terminal Patio Deck - 50,000 - - - 50,000 Airport Runway Construction - Design Apron Rehab 117,613 - - - - 117,613 Airport Runway Construction - Design Runway 9/27 Rehab 45,000 - - - - 45,000 City Buildings - Americans with Disabilities Act Modifications at Various City Facilities (1 of 2, Funded Portion)
56,000
-
-
-
-
56,000
City Buildings - Automation Systems (Energy Efficiency) (1 of 2, Funded Portion) 15,000 - - - - 15,000 City Buildings - Eastside Restroom Rehab 15,000 - - 10,000 - 25,000 City Buildings - Fire Station 3 Flooring Replacement (Carpet to Tile) (reprogrammed from Station 2)
10,000
-
-
-
-
10,000
City Buildings - Fire Station 7 Flooring Replacement (Carpet to Tile) 10,000 - - - - 10,000 City Buildings - Fire Station 8 Flooring Replacement (Carpet to Tile) 10,000 - - - - 10,000 City Buildings - Fire Station Improvements (All) (1 of 2, Funded Portion) - - - 50,000 50,000 100,000 City Buildings - Harada House - Robinson House Garage Demo/Rehab 25,000 - - - - 25,000 City Buildings - HVAC Replacement at Various City Facilities 15,000 15,000 15,000 15,000 15,000 75,000 City Buildings - La Sierra Library LED Retrofit Parking Lot Lighting 12,000 - - - - 12,000 City Buildings - Miscellaneous Improvements at City Facilities (1 of 2, Funded Portion) 5,000 7,000 55,000 60,000 50,000 177,000 City Buildings - Orange Terrace Library Replacement Carpet 30,000 - - - - 30,000 City Buildings - Police Department Improvements (1 of 2, Funded Portion) 10,000 10,000 20,000 - 20,000 60,000 City Buildings -La Sierra Library Main Entry Door Replacement - 25,000 - - - 25,000 City Hall Floor Reprogramming (2, 3, 5) 500,000 - - - - 500,000 CNG Dispenser drive-off protection - 30,000 - - - 30,000 Convention Center Minor Facility Repairs (Ongoing) 40,000 50,000 40,000 40,000 40,000 210,000 Fleet Facilities - Fleet Building Lighting Upgrade/Replacement - 80,000 - - - 80,000 Fleet Facilities - Fleet Epoxy Flooring project - - - - - - Fleet Facilities - Fleet HVAC/Gas Detection System Project - - - - - - Fleet Facilities - Fleet Install E85 Fueling Station - 240,000 - - - 240,000 Fleet Facilities - Fleet Install EV Charging Stations for City Vehicles (Various Facilities) - - 200,000 - - 200,000 La Sierra Library HVAC / Fans - - - - - - General Services Total 965,613 507,000 580,000 175,000 175,000 2,402,613 Innovation and Technology Data Network Upgrades (Funding Proposed) - - 250,000 - - 250,000 Datacenter Capital Improvements (Funding Proposed) - - 250,000 - 250,000 500,000 Enterprise Resource Planning System Replacement (Funding Proposed) - - 1,000,000 - 1,000,000 2,000,000 Innovation and Technology Total - - 1,500,000 - 1,250,000 2,750,000 Parks, Recreation, and Community Services Arlanza Community Garden - Community Garden fencing only 18,604 - - - - 18,604 Arlington Park - Youth Innovation Center (AYIC) 3,800,000 - - - - 3,800,000 Arlington Park Renovation - - - - - - Bergamont Park - Replace Playground wood chips, on-going 5,520 - - - - 5,520 Bobby Bonds Reader Board - - - - - - Bordwell Park - Nati Fuentes Centro de Ninos - Playground Poured-in-place surfacing replacement
19,866
-
-
-
19,866
Bordwell Park - Playground poured-in-place surfacing replacement 128,500 - - - - 128,500 Bryant Park - CDBG 2013 - Design and construction of rehabilitated Playground, HVAC and Kitchen
-
-
-
-
-
-
Bryant Park Tennis and Basketball Renovation - - - - - - Building Refurbishing Program – Emergency Pole and Netting Repair at FPGC - - - - - - Building Refurbishing Program – Install new HVAC units at Cesar Chavez CC - - - - - - Building Refurbishing Program – Paint - - - - - - Building Refurbishing Program – Pool Filters - - - - - - Building Refurbishing Program – Roof and Ceiling Repairs - - - - - - Building Refurbishing Program - Shamel Pool Heater - - - - - - Building Refurbishing Program – Theft, Vandalism, and Miscellaneous Repairs - - - - - - Building Refurbishing Program –Annual Floor Refinishing - - - - - - Castleview Park - Replace Playground wood chips, on-going 8,400 - - - - 8,400 City-wide - Park Master plan Update - Update the 2003 Park Master Plan 350,000 - - - - 350,000 Collett Park - Replace Playground wood chips, on-going 11,760 - - - 11,760 Don Derr Park - Playground Poured-in-place surfacing replacement 81,568 - - - - 81,568 Doty Trust Park - Replace Playground wood chips, on-going 4,800 - - - 4,800 El Dorado Park - Phase I - Design and Construction of Walking/jogging Path 2400l.f. - - - - - - Fairmount Park - Replace Playground wood chips, on-going 14,640 - - - - 14,640 Fairmount Park ADA Boat Launch - - - - - - Fairmount Park Signage - 10,000 - - - 10,000 Goeske Center / Streeter Park Turf Conversion 300,000 - - - - 300,000 Goeske Senior Center - Design and construction to renovate the old restrooms interior and exterior (replacement of tile, paint, partitiions, fixtures and signage, ceiling, lights)
50,000
-
-
-
-
50,000 Hunter Park - Design and construction of a Railroad Interpretive Kiosk / signage 68,000 - - - - 68,000 Hunter Park - Replace Playground wood chips, on-going 12,960 - - - - 12,960
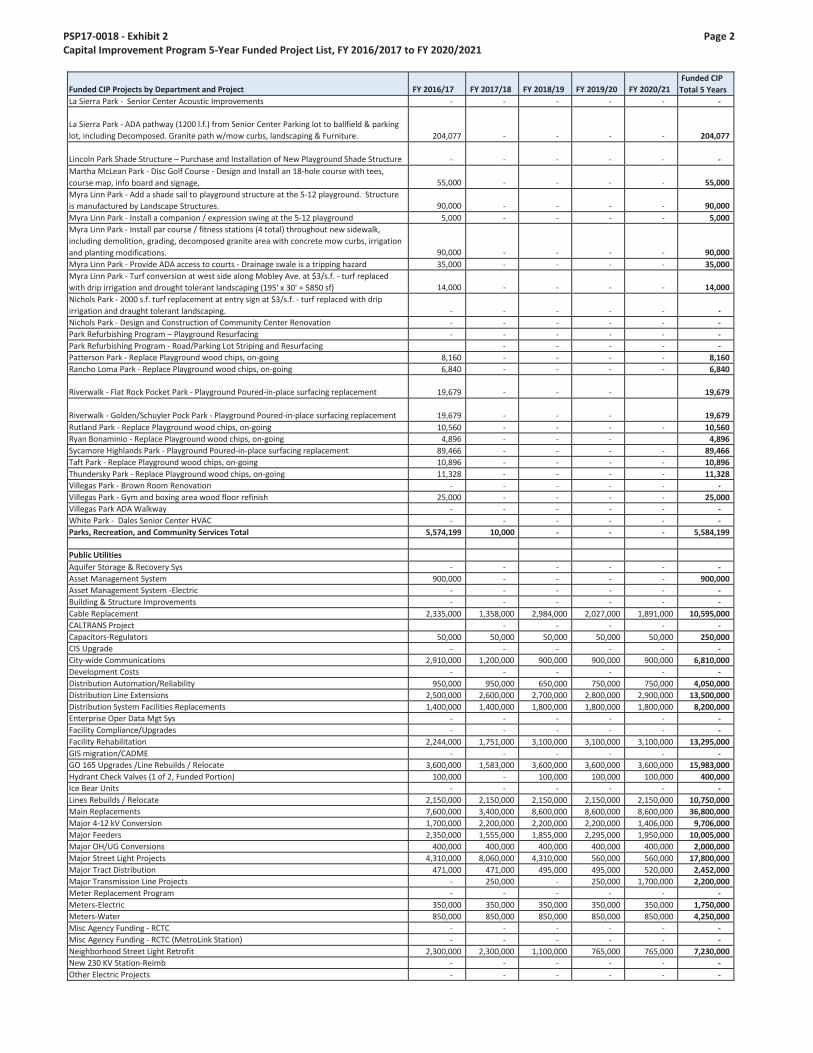
PSP17-0018 - Exhibit 2 Page 2 Capital Improvement Program 5-Year Funded Project List, FY 2016/2017 to FY 2020/2021
Funded CIP Projects by Department and Project
FY 2016/17
FY 2017/18
FY 2018/19
FY 2019/20
FY 2020/21
Funded CIP Total 5 Years
La Sierra Park - Senior Center Acoustic Improvements - - - - - - La Sierra Park - ADA pathway (1200 l.f.) from Senior Center Parking lot to ballfield & parking lot, including Decomposed. Granite path w/mow curbs, landscaping & Furniture.
204,077
-
-
-
-
204,077 Lincoln Park Shade Structure – Purchase and Installation of New Playground Shade Structure
-
-
-
-
-
-
Martha McLean Park - Disc Golf Course - Design and Install an 18-hole course with tees, course map, info board and signage,
55,000
-
-
-
-
55,000
Myra Linn Park - Add a shade sail to playground structure at the 5-12 playground. Structure is manufactured by Landscape Structures.
90,000
-
-
-
-
90,000
Myra Linn Park - Install a companion / expression swing at the 5-12 playground 5,000 - - - - 5,000 Myra Linn Park - Install par course / fitness stations (4 total) throughout new sidewalk, including demolition, grading, decomposed granite area with concrete mow curbs, irrigation and planting modifications.
90,000
-
-
-
-
90,000 Myra Linn Park - Provide ADA access to courts - Drainage swale is a tripping hazard 35,000 - - - - 35,000 Myra Linn Park - Turf conversion at west side along Mobley Ave. at $3/s.f. - turf replaced with drip irrigation and drought tolerant landscaping (195' x 30' = 5850 sf)
14,000
-
-
-
-
14,000
Nichols Park - 2000 s.f. turf replacement at entry sign at $3/s.f. - turf replaced with drip irrigation and draught tolerant landscaping.
-
-
-
-
-
-
Nichols Park - Design and Construction of Community Center Renovation - - - - - - Park Refurbishing Program – Playground Resurfacing - - - - - - Park Refurbishing Program - Road/Parking Lot Striping and Resurfacing - - - - - Patterson Park - Replace Playground wood chips, on-going 8,160 - - - - 8,160 Rancho Loma Park - Replace Playground wood chips, on-going 6,840 - - - - 6,840 Riverwalk - Flat Rock Pocket Park - Playground Poured-in-place surfacing replacement
19,679
-
-
-
19,679
Riverwalk - Golden/Schuyler Pock Park - Playground Poured-in-place surfacing replacement
19,679
-
-
-
19,679
Rutland Park - Replace Playground wood chips, on-going 10,560 - - - - 10,560 Ryan Bonaminio - Replace Playground wood chips, on-going 4,896 - - - 4,896 Sycamore Highlands Park - Playground Poured-in-place surfacing replacement 89,466 - - - - 89,466 Taft Park - Replace Playground wood chips, on-going 10,896 - - - - 10,896 Thundersky Park - Replace Playground wood chips, on-going 11,328 - - - - 11,328 Villegas Park - Brown Room Renovation - - - - - - Villegas Park - Gym and boxing area wood floor refinish 25,000 - - - - 25,000 Villegas Park ADA Walkway - - - - - - White Park - Dales Senior Center HVAC - - - - - - Parks, Recreation, and Community Services Total 5,574,199 10,000 - - - 5,584,199 Public Utilities Aquifer Storage & Recovery Sys - - - - - - Asset Management System 900,000 - - - - 900,000 Asset Management System -Electric - - - - - - Building & Structure Improvements - - - - - - Cable Replacement 2,335,000 1,358,000 2,984,000 2,027,000 1,891,000 10,595,000 CALTRANS Project - - - - - Capacitors-Regulators 50,000 50,000 50,000 50,000 50,000 250,000 CIS Upgrade - - - - - - City-wide Communications 2,910,000 1,200,000 900,000 900,000 900,000 6,810,000 Development Costs - - - - - - Distribution Automation/Reliability 950,000 950,000 650,000 750,000 750,000 4,050,000 Distribution Line Extensions 2,500,000 2,600,000 2,700,000 2,800,000 2,900,000 13,500,000 Distribution System Facilities Replacements 1,400,000 1,400,000 1,800,000 1,800,000 1,800,000 8,200,000 Enterprise Oper Data Mgt Sys - - - - - - Facility Compliance/Upgrades - - - - - - Facility Rehabilitation 2,244,000 1,751,000 3,100,000 3,100,000 3,100,000 13,295,000 GIS migration/CADME - - - - - - GO 165 Upgrades /Line Rebuilds / Relocate 3,600,000 1,583,000 3,600,000 3,600,000 3,600,000 15,983,000 Hydrant Check Valves (1 of 2, Funded Portion) 100,000 - 100,000 100,000 100,000 400,000 Ice Bear Units - - - - - - Lines Rebuilds / Relocate 2,150,000 2,150,000 2,150,000 2,150,000 2,150,000 10,750,000 Main Replacements 7,600,000 3,400,000 8,600,000 8,600,000 8,600,000 36,800,000 Major 4-12 kV Conversion 1,700,000 2,200,000 2,200,000 2,200,000 1,406,000 9,706,000 Major Feeders 2,350,000 1,555,000 1,855,000 2,295,000 1,950,000 10,005,000 Major OH/UG Conversions 400,000 400,000 400,000 400,000 400,000 2,000,000 Major Street Light Projects 4,310,000 8,060,000 4,310,000 560,000 560,000 17,800,000 Major Tract Distribution 471,000 471,000 495,000 495,000 520,000 2,452,000 Major Transmission Line Projects - 250,000 - 250,000 1,700,000 2,200,000 Meter Replacement Program - - - - - - Meters-Electric 350,000 350,000 350,000 350,000 350,000 1,750,000 Meters-Water 850,000 850,000 850,000 850,000 850,000 4,250,000 Misc Agency Funding - RCTC - - - - - - Misc Agency Funding - RCTC (MetroLink Station) - - - - - - Neighborhood Street Light Retrofit 2,300,000 2,300,000 1,100,000 765,000 765,000 7,230,000 New 230 KV Station-Reimb - - - - - - Other Electric Projects - - - - - -
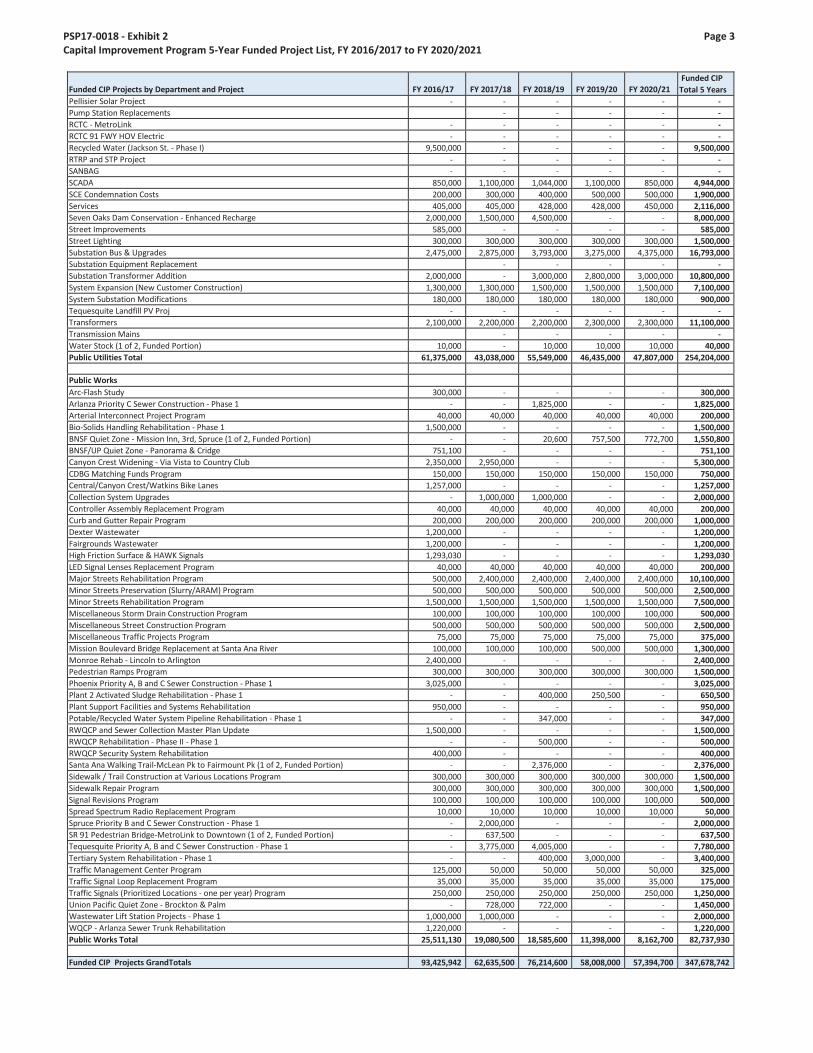
PSP17-0018 - Exhibit 2 Page 3 Capital Improvement Program 5-Year Funded Project List, FY 2016/2017 to FY 2020/2021
Funded CIP Projects by Department and Project
FY 2016/17
FY 2017/18
FY 2018/19
FY 2019/20
FY 2020/21
Funded CIP Total 5 Years
Pellisier Solar Project - - - - - - Pump Station Replacements - - - - - RCTC - MetroLink - - - - - - RCTC 91 FWY HOV Electric - - - - - - Recycled Water (Jackson St. - Phase I) 9,500,000 - - - - 9,500,000 RTRP and STP Project - - - - - - SANBAG - - - - - - SCADA 850,000 1,100,000 1,044,000 1,100,000 850,000 4,944,000 SCE Condemnation Costs 200,000 300,000 400,000 500,000 500,000 1,900,000 Services 405,000 405,000 428,000 428,000 450,000 2,116,000 Seven Oaks Dam Conservation - Enhanced Recharge 2,000,000 1,500,000 4,500,000 - - 8,000,000 Street Improvements 585,000 - - - - 585,000 Street Lighting 300,000 300,000 300,000 300,000 300,000 1,500,000 Substation Bus & Upgrades 2,475,000 2,875,000 3,793,000 3,275,000 4,375,000 16,793,000 Substation Equipment Replacement - - - - - Substation Transformer Addition 2,000,000 - 3,000,000 2,800,000 3,000,000 10,800,000 System Expansion (New Customer Construction) 1,300,000 1,300,000 1,500,000 1,500,000 1,500,000 7,100,000 System Substation Modifications 180,000 180,000 180,000 180,000 180,000 900,000 Tequesquite Landfill PV Proj - - - - - - Transformers 2,100,000 2,200,000 2,200,000 2,300,000 2,300,000 11,100,000 Transmission Mains - - - - - Water Stock (1 of 2, Funded Portion) 10,000 - 10,000 10,000 10,000 40,000 Public Utilities Total 61,375,000 43,038,000 55,549,000 46,435,000 47,807,000 254,204,000 Public Works Arc-Flash Study 300,000 - - - - 300,000 Arlanza Priority C Sewer Construction - Phase 1 - - 1,825,000 - - 1,825,000 Arterial Interconnect Project Program 40,000 40,000 40,000 40,000 40,000 200,000 Bio-Solids Handling Rehabilitation - Phase 1 1,500,000 - - - - 1,500,000 BNSF Quiet Zone - Mission Inn, 3rd, Spruce (1 of 2, Funded Portion) - - 20,600 757,500 772,700 1,550,800 BNSF/UP Quiet Zone - Panorama & Cridge 751,100 - - - - 751,100 Canyon Crest Widening - Via Vista to Country Club 2,350,000 2,950,000 - - - 5,300,000 CDBG Matching Funds Program 150,000 150,000 150,000 150,000 150,000 750,000 Central/Canyon Crest/Watkins Bike Lanes 1,257,000 - - - - 1,257,000 Collection System Upgrades - 1,000,000 1,000,000 - - 2,000,000 Controller Assembly Replacement Program 40,000 40,000 40,000 40,000 40,000 200,000 Curb and Gutter Repair Program 200,000 200,000 200,000 200,000 200,000 1,000,000 Dexter Wastewater 1,200,000 - - - - 1,200,000 Fairgrounds Wastewater 1,200,000 - - - - 1,200,000 High Friction Surface & HAWK Signals 1,293,030 - - - - 1,293,030 LED Signal Lenses Replacement Program 40,000 40,000 40,000 40,000 40,000 200,000 Major Streets Rehabilitation Program 500,000 2,400,000 2,400,000 2,400,000 2,400,000 10,100,000 Minor Streets Preservation (Slurry/ARAM) Program 500,000 500,000 500,000 500,000 500,000 2,500,000 Minor Streets Rehabilitation Program 1,500,000 1,500,000 1,500,000 1,500,000 1,500,000 7,500,000 Miscellaneous Storm Drain Construction Program 100,000 100,000 100,000 100,000 100,000 500,000 Miscellaneous Street Construction Program 500,000 500,000 500,000 500,000 500,000 2,500,000 Miscellaneous Traffic Projects Program 75,000 75,000 75,000 75,000 75,000 375,000 Mission Boulevard Bridge Replacement at Santa Ana River 100,000 100,000 100,000 500,000 500,000 1,300,000 Monroe Rehab - Lincoln to Arlington 2,400,000 - - - - 2,400,000 Pedestrian Ramps Program 300,000 300,000 300,000 300,000 300,000 1,500,000 Phoenix Priority A, B and C Sewer Construction - Phase 1 3,025,000 - - - - 3,025,000 Plant 2 Activated Sludge Rehabilitation - Phase 1 - - 400,000 250,500 - 650,500 Plant Support Facilities and Systems Rehabilitation 950,000 - - - - 950,000 Potable/Recycled Water System Pipeline Rehabilitation - Phase 1 - - 347,000 - - 347,000 RWQCP and Sewer Collection Master Plan Update 1,500,000 - - - - 1,500,000 RWQCP Rehabilitation - Phase II - Phase 1 - - 500,000 - - 500,000 RWQCP Security System Rehabilitation 400,000 - - - - 400,000 Santa Ana Walking Trail-McLean Pk to Fairmount Pk (1 of 2, Funded Portion) - - 2,376,000 - - 2,376,000 Sidewalk / Trail Construction at Various Locations Program 300,000 300,000 300,000 300,000 300,000 1,500,000 Sidewalk Repair Program 300,000 300,000 300,000 300,000 300,000 1,500,000 Signal Revisions Program 100,000 100,000 100,000 100,000 100,000 500,000 Spread Spectrum Radio Replacement Program 10,000 10,000 10,000 10,000 10,000 50,000 Spruce Priority B and C Sewer Construction - Phase 1 - 2,000,000 - - - 2,000,000 SR 91 Pedestrian Bridge-MetroLink to Downtown (1 of 2, Funded Portion) - 637,500 - - - 637,500 Tequesquite Priority A, B and C Sewer Construction - Phase 1 - 3,775,000 4,005,000 - - 7,780,000 Tertiary System Rehabilitation - Phase 1 - - 400,000 3,000,000 - 3,400,000 Traffic Management Center Program 125,000 50,000 50,000 50,000 50,000 325,000 Traffic Signal Loop Replacement Program 35,000 35,000 35,000 35,000 35,000 175,000 Traffic Signals (Prioritized Locations - one per year) Program 250,000 250,000 250,000 250,000 250,000 1,250,000 Union Pacific Quiet Zone - Brockton & Palm - 728,000 722,000 - - 1,450,000 Wastewater Lift Station Projects - Phase 1 1,000,000 1,000,000 - - - 2,000,000 WQCP - Arlanza Sewer Trunk Rehabilitation 1,220,000 - - - - 1,220,000 Public Works Total 25,511,130 19,080,500 18,585,600 11,398,000 8,162,700 82,737,930 Funded CIP Projects GrandTotals 93,425,942 62,635,500 76,214,600 58,008,000 57,394,700 347,678,742

PSP17-0018 - Exhibit 3 Page 1 Fiscal Year 2017/18 Unfunded CIP Projects
Unfunded CIP Projects by Department and Project
FY 2016/17
FY 2017/18
FY 2018/19 FY 2019/20
FY 2020/21
Unfunded
5 -Year Total
Unfunded
Beyond 5 -Years
Unfunded CIP Total All Years
General Services
Airfield Lighting Systems - - - 40,000 - 40,000 - 40,000 Airport Facilities - Airport Hangar Painting - 100,000 - - - 100,000 - 100,000 Airport Facilities - Terminal Patio Deck - 50,000 - - - 50,000 - 50,000 Airport Runway Construction - Construct Twy J Rehab - - 900,000 - - 900,000 - 900,000 Airport Runway Construction - Construct Apron Rehab - 233,322 - - - 233,322 - 233,322 Airport Runway Construction - Construct Runway 16/34 Rehab - - - 455,000 - 455,000 - 455,000 Airport Runway Construction - Construct Runway 9/27 Rehab - 738,559 - - - 738,559 - 738,559 Airport Runway Construction - Design Runway 16/34 Rehab - - 45,000 - - 45,000 - 45,000 Airport Runway Construction - Design Twy J Rehab - 54,000 - - - 54,000 - 54,000 Arlington Library Garden Area Renovation - - - 20,000 - 20,000 - 20,000 Automation Systems (Energy Efficiency) - 60,000 60,000 - - 120,000 - 120,000 Branch Library Improvements (Misc) - 100,000 100,000 100,000 100,000 400,000 - 400,000 Casa Blanca Library Drywall Repair - 5,000 - - - 5,000 - 5,000 City Buildings - Americans with Disabilities Act Modifications at Various City Facilities (2 of 2, Unfunded Portion)
-
110,000
150,000 150,000
150,000
560,000
-
560,000
City Buildings - Automation Systems (Energy Efficiency) (2 of 2, Unfunded Portion) - 15,000 15,000 - - 30,000 - 30,000 City Buildings - Fire Station Improvements (All) (2 of 2, Unfunded Portion) - 50,000 50,000 - - 100,000 - 100,000 City Buildings - Fox Theater Facility Repairs (Ongoing) - - 30,000 - - 30,000 - 30,000 City Buildings - Miscellaneous Improvements at City Facilities (2 of 2, Unfunded Portion) - 110,000 110,000 110,000 110,000 440,000 - 440,000 City Buildings - Police Department Improvements (2 of 2, Unfunded Portion) - 30,000 30,000 50,000 30,000 140,000 - 140,000 City Hall - Install Fire Suppression System in Basement (IT System) - - 250,000 - - 250,000 - 250,000 City Hall Carpet Replacements (incl Chambers) - 32,000 32,000 32,000 64,000 160,000 - 160,000 City Hall Fan/HVAC - 100,000 - - - 100,000 - 100,000 City Hall Parking Garage Elevator Replacement - - - - 100,000 100,000 - 100,000 City Hall Parking Lot Rehab - 30,000 - - - 30,000 - 30,000 Convention Center Annex/Expansion/Events Center - - - - - - 80,000,000 80,000,000 Corp Yard EV Chargers - 41,000 - - - 41,000 - 41,000 Corp Yard Satellite Building Paint - 12,000 - - - 12,000 - 12,000 Corporation Yard Parking Lot Repaving - 200,000 150,000 250,000 250,000 850,000 - 850,000 Downtown Library Renovation - - - - - - 15,000,000 15,000,000 Eastside Carpet Replacement - - - - 46,000 46,000 - 46,000 Fire Department USAR Building Roof Repairs - 30,000 - - - 30,000 - 30,000 Fire Station 10 Bath & Recreation Room Remodel - 10,700 - - - 10,700 - 10,700 Fire Station 10 Security Fencing - 40,000 - - - 40,000 - 40,000 Fire Station 11 Gender Modifications - 750,000 - - - 750,000 - 750,000 Fire Station 2 Battalion 2 office & bath remodel - 40,000 - - - 40,000 - 40,000 Fire Station 3 Metal Parking Structure/Cover - - 178,000 - - 178,000 - 178,000 Fire Station 4 Generator & Transfer Switch Replacement - 47,000 - - - 47,000 - 47,000 Fire Station 4 Kitchen Remodel (cabinets, flooring, paint & appliances) - 45,000 - - - 45,000 - 45,000 Fire Station 4 Security Fencing - 40,000 - - - 40,000 - 40,000 Fire Station 5 Install waterwise landscaping - - - - 15,000 15,000 - 15,000 Fire Station 7 Generator & Transfer Switch Replacement - 47,000 - - - 47,000 - 47,000 Fire Station 7 Install waterwise landscaping - - - - 15,000 15,000 - 15,000 Fire Station 7 Kitchen Remodel (Cabinets, flooring, paint & appliances - 45,000 - - - 45,000 - 45,000 Fire Station 8 Concrete Driveway Replacement - 42,000 - - - 42,000 - 42,000 Fire Station 8 Generator & Transfer Switch Replacement - 47,000 - - - 47,000 - 47,000 Fire Station 8 Kitchen Remodel (cabinets, flooring, paint & appliances) - 45,000 - - - 45,000 - 45,000 Fire Station 8 New Roof - 35,000 - - - 35,000 - 35,000 Fire Station 9 Install Waterwise Landscaping - - - - 15,000 15,000 - 15,000 Fire Station 9 Security Fencing - 40,000 - - - 40,000 - 40,000 Fire Station Security Systems (All) - 20,000 20,000 20,000 20,000 80,000 - 80,000 Fox Theater Carpet Replacement - 300,000 - - - 300,000 - 300,000 Fox Theater Facility Repairs (Ongoing) - 40,000 40,000 40,000 40,000 160,000 - 160,000 Harada House - Foundation Repairs - 500,000 - - - 500,000 - 500,000 Harada House - Restoration and Historic Preservation - - - - 3,000,000 3,000,000 - 3,000,000 Harada House - Robinson House Construct Interpretive Center - - - - 500,000 500,000 - 500,000 Harada House - Robinson House Foundation Repairs - - - 20,000 - 20,000 - 20,000 Harada House - Robinson House Preservation (Int and Ext) - - - 50,000 - 50,000 - 50,000 Harada House Full Rehabilitation - - - - - - 5,000,000 5,000,000 Heritage House - ADA Elevator - - - 20,000 - 20,000 - 20,000 Heritage House - Exterior Lighting for Barn, Carriage House, Path Replacement - 200,000 - - - 200,000 - 200,000 Heritage House - Repaint - 60,000 - - - 60,000 - 60,000 Heritage House - Replace HVAC with Custom System - 25,000 25,000 25,000 25,000 100,000 - 100,000 Heritage House - Rewiring, Period Lighting - 150,000 - - - 150,000 - 150,000 Heritage House - Soffit/gutter/exterior wood repairs - 18,000 18,000 18,000 36,000 90,000 - 90,000 Heritage House - Structural Assessments - 15,000 - - - 15,000 - 15,000 Heritage House - Various Security Enhancements - 50,000 - - - 50,000 - 50,000 Heritage House-Perimeter Fencing - 60,000 - - - 60,000 - 60,000 La Sierra Interior Renovation - - 40,000 - - 40,000 - 40,000 La Sierra Library Roof Replacement - 85,000 - - - 85,000 - 85,000 La Sierra Window Replacement - 20,000 5,000 - - 25,000 - 25,000 Magnolia Shopping Center Lighting Upgrade - 5,000 - - 5,000 - 5,000 Magnolia Shopping Center Parking Lot Rehab - - 20,000 - 20,000 - 20,000 Magnolia Shopping Center Roof Repair - 40,000 40,000 - 80,000 - 80,000 Marcy Carpet Replacement - 30,000 - - - 30,000 - 30,000 Marcy HVAC Replacement - - - - 125,000 125,000 - 125,000 Metropolitan Museum - Copper Roof Repair - 40,000 - - - 40,000 - 40,000 Metropolitan Museum Improvements - Medallion Relocation - 40,000 - - - 40,000 - 40,000 Metropolitan Museum Improvements (reconfigure basement, waterproof basement walls, security, key system, flooring)
-
75,000
75,000 75,000
75,000
300,000
-
300,000
Municipal Auditorium - Install elevator/lift for ADA Access to Third Floor - - - - 300,000 300,000 - 300,000 Municipal Auditorium Carpet Replacement - - - 45,000 - 45,000 - 45,000 Municipal Auditorium New Electronic Sign - - - - 35,000 35,000 - 35,000 Municipal Auditorium Replace / Repair Wood Floors - - - - 20,000 20,000 - 20,000 Museum Storage Collection Facility - - - - - - 8,000,000 8,000,000 New Downtown Library 500,000 1,500,000 11,000,000 12,000,000 5,000,000 30,000,000 - 30,000,000 New Museum - - 1,500,000 9,500,000 9,000,000 20,000,000 - 20,000,000 Orange Terrace HVAC Upgrades/Replacements - 25,000 - - - 25,000 - 25,000 Orange Terrace Library Security Camera - - 10,000 - - 10,000 - 10,000 Parking 1 1,000,000 11,250,000 2,750,000 15,000,000 - 15,000,000 Police Department Headquarters 2,800,000 21,800,000 16,000,000 40,600,000 - 40,600,000 Police Department - Flooring for Magnolia & Lincoln - - - - 180,000 180,000 - 180,000 Police Department - Orange Street Material Abatement - - - - - - - -

PSP17-0018 - Exhibit 3 Page 2 Fiscal Year 2017/18 Unfunded CIP Projects
Unfunded CIP Projects by Department and Project
FY 2016/17
FY 2017/18
FY 2018/19 FY 2019/20
FY 2020/21
Unfunded
5 -Year Total
Unfunded
Beyond 5 -Years
Unfunded CIP Total All Years
Police Department - Orange Street Roof Repair - - - - - - - - Police Department Surveillance Cameras - 30,000 - - - 30,000 - 30,000 Police Department Aviation Fuel Tank Assessment and Replacement - 220,000 - - - 220,000 - 220,000 Police Department Improvements - Unfunded Component - - - - - - 30,000,000 30,000,000 Police Department Magnolia Sprinkler Line Removal and Security Improvements - 40,000 - - - 40,000 - 40,000 Replace Carpet - - - - 350,000 350,000 - 350,000 Security System Improvements Citywide - 150,000 - - - 150,000 - 150,000 Terminal Parking Lot Slurry Seal - - - 150,000 - 150,000 - 150,000 TV Screen in main shop to monitor Lincoln & Acorn cameras - 6,500 - - - 6,500 - 6,500 Upgrade Security Cameras - 50,000 - - - 50,000 - 50,000 Upgrade Terminal Restrooms ADA - 60,000 - - - 60,000 - 60,000
General Services Total 500,000 7,184,081 18,678,000 56,280,000 38,351,000 120,993,081 138,000,000 258,993,081
Innovation and Technology - Computer Workstation Replacement - 1,175,000 1,233,750 1,295,438 1,360,210 5,064,398 - 5,064,398 Data Network Upgrades (Unfunded) - 120,000 2,325,000 160,000 2,605,000 - 2,605,000 Datacenter Capital Improvements (Unfunded) - 80,000 64,200 47,300 29,100 220,600 - 220,600 Datacenter: COOP - 116,500 925,700 - - 1,042,200 - 1,042,200 Email Retention: 2-Year Option - 410,000 - - - 410,000 - 410,000 Enterprise Resource Planning System Replacement (Unfunded) - - 8,000,000 6,000,000 2,000,000 16,000,000 - 16,000,000 Hardware: PC, Laptop, Tablet Replacement - 140,000 - - - 140,000 - 140,000 Video Retention: 1-Year Option - 450,000 - - - 450,000 - 450,000 Voice over IP (VoIP) Telecommunications System Upgrades - 315,000 805,000 200,000 - 1,320,000 - 1,320,000 Work-Order/Asset Management System Major Upgrade - 125,000 130,000 1,136,500 1,843,400 3,234,900 - 3,234,900
Innovation and Technology Total - 2,931,500 13,483,650 8,839,238 5,232,710 30,487,098 - 30,487,098 Parks, Recreation, and Community Services -
Ab Brown - Parking lot pavement and other ADA improvements - - - - - - 500,000 500,000 Ab Brown -Construct Playground - - - - - - 600,000 600,000 Andulka Park - Drainage and landscaping improvements around tennis courts - - - - - - 100,000 100,000 Andulka Park - Wading pool recirculating filtration system for splash pad, equipment, Health Dept. requirements and water savings
-
-
- -
-
-
325,000
325,000
Arlanza Community Garden - Community Garden Entry Sign, Gazebo, fountain, demonstration garden and accessible pathway
-
-
- -
-
-
120,000
120,000
Arlington Heights Sports Park - Secure bioswale with decorative permanent fencing - - - - - - 75,000 75,000 Arlington Heights Sports Park - Wading pool recirculating filtration system for splash pad, equipment, Health Dept. requirements and water savings
-
-
- -
-
-
325,000
325,000
Arlington Park - Youth Innovation Center (AYIC) - 200,000 200,000 Arlington Park - Challenge Course - Pro 4000 with 40 yard dash - - - - - - 350,000 350,000 Arlington Park - Construction of pool building renovation including chemical room structural rehabilitation, painting, surrounding landscape and lighting
-
-
- -
-
-
225,000
225,000
Arlington Park - Design and const. of park additional walkway/area lighting improvements and LED Conversion of existing.
-
-
- -
-
-
275,000
275,000
Arlington Park - Design and const. to replace existing small shade shelter with a new 24' Hex. shade shelter, including 2 picnic tables, trash cans and lighting.
-
-
- -
-
-
94,000
94,000
Arlington Park - Design and Construction of a new 36" Hex. Shade shelter with 2 trash cans, 4 picnic tables and lighting. Using extra Structure in Maint. Yard.
-
-
- -
-
-
115,000
115,000
Arlington Park - Tennis court resurfacing of existing AC courts (2 courts) - - - - - - 125,000 125,000 Bergamont Park - Playground Shade Sails - - - - - - 85,000 85,000 Bergamont Park - Replace Playground Equipment and Surface - - - - - - 350,000 350,000 Bobby Bonds Park - Cesar Chavez Auditorium - Acoustics and Sound System - - - - - - 103,000 103,000 Bobby Bonds Park - Cesar Chavez Auditorium - Stage Lighting - - - - - - 77,000 77,000 Bobby Bonds Park - Cesar Chavez Auditorium wood floor refinish, including stage - - - - - - 15,500 15,500
Bobby Bonds Park - Cesar Chavez Community Center HVAC Installation only. 22 units @ $5,00ea.
-
-
- -
-
-
110,000
110,000
Bobby Bonds Park - Cesar Chavez Interior and Exterior paint with matching historic colors - - - - - - 62,000 62,000 Bobby Bonds Park - Cesar Chavez Roof Replacement - - - - - - 335,000 335,000 Bobby Bonds Park - Gymnasium automatic adjustment for basketball hoops. Provides a safer way to adjust hoops to serve ea. division of youth sports & adults.
-
-
- -
-
-
15,000
15,000
Bobby Bonds Park - Playground area lighting improvement - - - - - - 35,000 35,000 Bobby Bonds Park - Pool Filter replacement (8 remaining) - - - - - - 133,333 133,333 Bobby Bonds Park - Refurbish artificial turf field. Included removal and replacement of surface. Which should be scheduled every 10 years
-
-
- -
-
-
450,000
450,000
Bobby Bonds Park - Restoration / Repair of auditorium chairs - - - - - - 5,000 5,000 Bobby Bonds Park - Youth Opportunity Center Gym floor refurbishment - - - - - - 30,000 30,000 Bobby Bonds Park - Youth Opportunity Center roof skylight repair - - - - - - 35,500 35,500
Bobby Bonds Parks - Cesar Chavez upstairs restroom renovation, partitions and wall separation
-
-
- -
-
-
150,000
150,000
Bordwell Park - Additional ADA parking stalls - - - - - - - - Bordwell Park - Challenge Course - Pro 4000 with 40 yard dash - - - - - - 350,000 350,000 Bordwell Park - Design and construction of gymnasium - - - - - - 4,738,000 4,738,000 Bordwell Park - Modernize park restrooms (Kansas side) - - - - - - 150,000 150,000
Bordwell Park - Nati Fuentes Centro de Ninos - Playground Poured-in-place surfacing replacement
-
105,134
105,134
Bordwell Park - Nati Fuentes Centro de Ninos - VCT Replacement & Sealing - - - - - - 210,000 210,000 Bordwell Park - New ADA accessible walkway to serve ballfield and picnic shelter at corner of MLK and Kansas
-
-
- -
-
-
32,000
32,000
Bordwell Park - Playground poured-in-place surfacing replacement - 14,121 14,121 Bordwell Park - R&R existing basketball court with post tension court to fix drainage (standing water) and safety (cracks) issues. 6000 sf @ $23/sf
-
-
- -
-
-
165,000
165,000
Bryant Park - Gym Floor wood refinishing - - - - - - 10,500 10,500 Bryant Park - Gymnasium automatic adjustment for basketball hoops. Provides a safer way to adjust hoops to serve ea. division of youth sports & adults.
-
-
- -
-
-
15,000
15,000
Bryant Park - Tennis court lighting - Design and Construction, with input from adjacent residential prop. required.
-
-
- -
-
-
190,000
190,000
Building Refurbishing Program - Annual Deferred Maintenance Projects - 400,000 200,000 200,000 200,000 1,000,000 - 1,000,000 Carlson Park - Install new meter and backflow connection for Irrigation. Required to separate domestic water from Irrigation as well as to increase efficiency.
-
-
- -
-
-
125,000
125,000
Carlson Park - St. Francis Falls Restoration and Improvement in addition to $94,000 Grant funding in 2015.
-
-
- -
-
-
600,000
600,000
Castleview Park - Design and construction of park. - - - - - - 11,506,000 11,506,000 Castleview Park - Playground Surfacing Replacement - - - - - - 100,000 100,000 Challen Park - Passive Recreational development and improvements; such as, trails, viewpoint, signage, picnic shelter, maybe a playground, parking, etc.
-
-
- -
-
-
1,875,000
1,875,000

PSP17-0018 - Exhibit 3 Page 3 Fiscal Year 2017/18 Unfunded CIP Projects
Unfunded CIP Projects by Department and Project
FY 2016/17
FY 2017/18
FY 2018/19 FY 2019/20
FY 2020/21
Unfunded
5 -Year Total
Unfunded
Beyond 5 -Years
Unfunded CIP Total All Years
City-wide - Acquisition of Park Land - Acquisition of 4 AC Holcomb property adjacent to Ryan Bonaminio Park
-
-
- -
-
-
110,000
110,000
City-wide - Acquisition of Park Land - Acquisition of various park lands 30AC Regional to meet General Plan goal 3 acres/1000
-
-
- -
-
-
7,500,000
7,500,000
City-wide - Acquisition of Park Land - Acquisition of various park lands 60AC local to meet General Plan goal 3 acres/1000
-
-
- -
-
-
30,000,000
30,000,000
City-wide - Action Skate Parks - Planning, Design and Construction of two new action skate parks at future undetermined locations.
-
-
- -
-
-
6,000,000
6,000,000
City-wide - Automatic Door Locking System for all parks - Add automated door locking system for 40 doors
-
-
- -
-
-
280,000
280,000
City-wide - Park Master plan Update - GIS Inventory database model - - - - - - 25,000 25,000 City-wide - Parking Lot Rehabilitation - Grind, overlay and restripe various Park parking lots in all wards
-
-
- -
-
-
500,000
500,000
City-wide - Pool Refurbishment - Replace plaster, cracked deck, equipment, etc. at various Pools in all wards.
-
-
- -
-
-
1,300,000
1,300,000
City-wide - Trails - Gage Canal Trail Improvements - - - - - - 2,770,000 2,770,000 City-wide - Trails - MWD box Springs Feeder Trail Improvements - - - - - - 5,900,000 5,900,000 City-wide - Trails - Seven Mile Trail Improvements - - - - - - 19,625,000 19,625,000 City-wide - Water Conservation Projects - Remove and replace turf with drip irrigation and draught tolerant planting at various park sites.
-
-
- -
-
-
500,000
500,000
City-wide - Wi-Fi at Community Centers - installation of wifi hot spots at all community centers (Bobby Bonds, Bordwell, Bryant, Hunt, La Sierra, La Sierra Senior Center, Dales, Nichols, Orange Terrace, Reid, Patterson, Lincoln) for public and programming use. Estimated $12K per center.
-
-
- -
-
-
156,000
156,000 Collett Park - Install par course / fitness stations (4 total), incl. demo, grading, D.G. area with concrete mow curbs, irrigation. & planting modifications.
-
-
- -
-
-
90,000
90,000
Collett Park - Playground Equipment Replacement with new surfacing. Over 20 years old. - - - - - - 295,000 295,000 Collett Park - Shade Shelter wood lattice roof replacement - Three total - - - - - - 32,000 32,000 Dario Vasquez Park - Playground Surfacing Replacement - - - - - 100,000 100,000 Don Derr Park - Basketball Court Resurfacing - - - - - - 30,000 30,000 Don Derr Park - Design and Const. to replace existing restroom and concession building with a new building
-
-
- -
-
-
1,100,000
1,100,000
Don Derr Park - Playground Poured-in-place surfacing replacement - 43,432 43,432 Don Jones Park - Challenge Course Teen Playground - Pro 4000 with 40 yard dash (challenge course might not fit on site).
-
-
- -
-
-
350,000
350,000
Don Jones Park - Decomposed path 10' wide around park - Phase I approx. 450 L.F. with mow curbs, d.g., irrigation adjustments, etc.
-
-
- -
-
-
50,000
50,000
Don Jones Park - Decomposed path 10' wide around park - Phase I approx. 650 L.F. with mow curbs, d.g., irrigation adjustments, etc.
-
-
- -
-
-
75,000
75,000
Don Jones Park - Exercise Stations at three areas along pathway (six pieces of equipment) with d.g., mow curbs and landscape modifications.
-
-
- -
-
-
120,000
120,000
Don Jones Park - Remove and replace existing concession building - - - - - - 450,000 450,000
Don Jones Park - Remove and replace School property line fence (1,315 l.f.) with 6'-7' high fence adjacent to park to secure park site and add vehicular access gate ($9,000) to control park access.
-
-
- -
-
-
84,000
84,000 Don Lorenzi Park - Design and Const. to replace existing restroom with a new restroom - - - - - - 412,000 412,000 Don Lorenzi Park - Design and Construction of ADA parking, ramp, retaining walls, and R&R of stairs. Landscape and irrigation improvments
-
-
- -
-
-
80,000
80,000
Don Lorenzi Park - Design and Construction of exercise path around field, 850 linear feet of 10' wide d.g. ($26,000) with 1,700 l.f. of 6" concrete mow curbs ($28,000). (2) dog bag dispensers ($1,000). Allowance for clear, grub, grading, export, mobilizing, landscape ($25K) plus design, admin. contingency 40%.
-
-
- -
-
-
115,000
115,000 Don Lorenzi Park - Design and Construction of four fitness areas (9 pieces of equipmetn total) Each piece $15,000 including demo, grading, d.g., mow curb, etc - must be done with d.g. path or as a second phase
-
-
- -
-
-
135,000
135,000 Don Lorenzi Park - Design and Construction of new 2-5 and 5-12 playground with 12' foul ball fence to protect playground
-
-
- -
-
-
650,000
650,000
Doty Trust Park - Slope stabilization at back open space trail connections. - - - - - - 60,000 60,000 Doty Trust Park - Wading pool recirculating filtration system for splash pad, equipment, Health Dept. requirements and water savings
-
-
- -
-
-
325,000
325,000
Eldorado Park - Phase II -design and construction of three fitness areas (6 pieces of equipment total)
-
-
- -
-
-
100,000
100,000
Eldorado Park - Phase II -design and construction of walking/jogging path remaining 800 l.f.
-
-
- -
-
-
90,000
90,000
Eldorado Park - Phase II- Turf Conversion between new path and residents (approx. 40,000 s.f.)
-
-
- -
-
-
140,000
140,000
Fairmount Park - Boathouse deck repairs - - - - 150,000 150,000 Fairmount Park - Design and construct new Visitor Center 2500 SF - - - - - - 500,000 500,000 Fairmount Park - Dexter Parking Lot(NW of Lake Evans) & lights w/120 spaces - - - - - - 504,000 504,000 Fairmount Park - Duck Island cleanup/controlled burn - - - - - - 12,000 12,000 Fairmount Park - Expand Golf Course to 18 Holes - Not Economically Feasible and recommend addition of putting course per item above in lieu of 9 hole expansion.
-
-
- -
-
-
500,000
500,000
Fairmount Park - Fairmount Court Parking Lot (by the Tennis Courts) with lights (40 spaces)
-
-
- -
-
-
250,000
250,000
Fairmount Park - Fairmount Park Banks Intersection/Pedestrian Access - - - - - - 350,000 350,000 Fairmount Park - Fairmount/Historic Core Phase I (Band shell, Amphitheater Renovation) - - - - - - 1,250,000 1,250,000 Fairmount Park - Fairmount/Historic Core Phase II (Restroom replacement) - - - - - - 700,000 700,000 Fairmount Park - Fairmount/Historic Core Phase III (Lake Fairmount Pedestrian lakeshore Access, Special Event Access Road, Lighting, Parking Improvements)
-
-
- -
-
-
2,250,000
2,250,000
Fairmount Park - Fairmount/Lighting & Lakeshore Access Improvements Lake Evans-Phase II
-
-
- -
-
-
825,000
825,000
Fairmount Park - Future Quarry Area Improvements - TBD - - - - - - 1,500,000 1,500,000 Fairmount Park - Golf Course - Add 50' Netting along Freeway (2000 lf) - - - - - - 300,000 300,000 Fairmount Park - Golf Course - Expand and Renovate Cart Paths - - - - - - 250,000 250,000 Fairmount Park - Golf Course - New 75' net/post along Field Lane (450 lf) - - - - - - 204,077 204,077 Fairmount Park - Golf Course - Pitch and Putt Course - - - - - - 950,000 950,000
Fairmount Park - Golf Course - Replace Back Driving Range Net/Post w/75' high Net (320 lf)
-
-
- -
-
-
65,000
65,000
Fairmount Park - Golf Course - Replace Driving Range 50' Netting & adding 2 poles on Right Side
-
-
- -
-
-
45,000
45,000
Fairmount Park - Izaak Walton Kitchen and Restroom Modernization - - - - - - 75,000 75,000 Fairmount Park - Izaak Walton Sound Attenuation / Roof Insulation - - - - - - 50,000 50,000 Fairmount Park - Kitchen upgrade at the Boathouse - - - - - - 65,000 65,000 Fairmount Park - Lake Dredging (20,000 CY) every 5 years to improve lake water quality. - - - - - - 400,000 400,000 Fairmount Park - Lake Evans Spillway Improvements, Erosion Control - - - - - - 150,000 150,000

PSP17-0018 - Exhibit 3 Page 4 Fiscal Year 2017/18 Unfunded CIP Projects
Unfunded CIP Projects by Department and Project
FY 2016/17
FY 2017/18
FY 2018/19 FY 2019/20
FY 2020/21
Unfunded
5 -Year Total
Unfunded
Beyond 5 -Years
Unfunded CIP Total All Years
Fairmount Park - Lake Evans Weir box repair - - - - - - 115,000 115,000 Fairmount Park - Lakeside Room - Paint In & Out + Out Bldgs - - - - - - 75,000 75,000 Fairmount Park - Lakeside Room - Refinish Wood Floors - - - - - - 15,000 15,000 Fairmount Park - Lawn Bowling Building Replacement and site improvements - - - - - - 650,000 650,000 Fairmount Park - Locomotive repairs/painting (specialty paint) - - - - - - 100,000 100,000 Fairmount Park - Market Street Frontage Improvement - Enhance Entry at Redwood. - - - - - - 65,000 65,000 Fairmount Park - Market Street Frontage Improvement - New decorative fencing - - - - - - 100,000 100,000
Fairmount Park - Market Street Frontage Improvement - New landscaping and turf conversion
-
-
- -
-
-
125,000
125,000
Fairmount Park - Market Street Frontage Improvement - New pedestrian access sidewalk - - - - - - 60,000 60,000 Fairmount Park - Move Armory and construct New 12,000 SF PRCSD Admin Office - Might not be needed now that we have a new location at Marcy
-
-
- -
-
-
3,500,000
3,500,000
Fairmount Park - North Hill (curb and gutter, sidewalk, trail, picnic table) - - - - - - 750,000 750,000 Fairmount Park - paint picnic shelters - - - - - - 30,000 30,000 Fairmount Park - Paint rose garden fence - - - - - - 20,000 20,000
Fairmount Park - Park outbuilding painting (int/ext of restrooms, ext. stables, ext. old pool house).
-
-
- -
-
-
30,000
30,000
Fairmount Park - Pathway lighting repairs near bowling green fence/Carousel Playground (not connected at construction)
-
-
- -
-
-
15,000
15,000
Fairmount Park - R&R rose garden gazebo and arches - - - - - - 75,000 75,000 Fairmount Park - Recreational Adventure Park expansion (West Side of Lake Evans) Mitigate impact at 2008 dredging spoils site.
-
-
- -
-
-
4,500,000
4,500,000
Fairmount Park - Renovate the old bldg. for bike rental - - - - - - 35,000 35,000 Fairmount Park - Repair or replace lumber fishing pier - - - - - - 20,000 20,000 Fairmount Park - Repair plaster walking bridge - - - - - - 10,000 10,000 Fairmount Park - Repair plaster/paint old RR building - - - - - - 25,000 25,000 Fairmount Park - Repair plaster/paint old stables - - - - - - 25,000 25,000 Fairmount Park - Repair Wagner Lake area - - - - - - 300,000 300,000 Fairmount Park - Replace lifted concrete fishing pier - - - - - - 10,000 10,000 Fairmount Park - Replace missing rose bushes in Rose Garden - - - - - - 1,500 1,500 Fairmount Park - Replace Playground wood chips, on-going - - - - - - 4,640 4,640 Fairmount Park - Re-Roof old restroom building - - - - - - 15,000 15,000 Fairmount Park - Re-Roof old stables - - - - - - 15,000 15,000 Fairmount Park - Road maintenance on Dexter east side of lake - - - - - - 225,000 225,000 Fairmount Park - Road maintenance on other Streets - - - - - - 225,000 225,000 Fairmount Park - Scout Camp Renovation (Ropes challenge course) - - - - - - 220,000 220,000 Fairmount Park - Security Cameras - 6 exterior @ $2,000 ea and 6 interior @ $1,000 ea New Fiber installation (4,300 l.f.) from 1st & Orange to Boathouse - $175,000
-
-
- -
-
-
200,000
200,000
Fairmount Park - Signage Improvements (Directional and Interpretive Signs and kiosks) - - - - - - 190,000 190,000 Fairmount Park - Splash Pad pool recirculating filtration system for splash pad, equipment, Health Dept. requirements and water savings
-
-
- -
-
-
325,000
325,000
Fairmount Park - Spoils Area - Invasive spp. Clearance - - - - - - 75,000 75,000 Fairmount Park - Spring Brook Wash renovation (Renovation. Mitigation area, low flow and high flow basin, inlet)
-
-
- -
-
-
975,000
975,000
Fairmount Park - Storm drain Clearing - Universal Playground Parking Lot - - - - - - 75,000 75,000 Fairmount Park - Tennis court resurfacing - - - - - - 15,000 15,000 Fairmount Park - Wilderness Area Improvements (hiking trails connection to Santa Ana River, spillways, nature center / pavilion); Exchange land area with Fish & Wildlife area near river up north as mitigation.
-
-
- -
-
-
1,500,000
1,500,000 Fairmount Park -Lake Evans Water quality (Solarbee) - - - - - - 65,000 65,000 Goeske Park - Senior Center - New Senior Playground and Fitness Equipment - - - - - - 375,000 375,000 Goeske Park - Senior Center - Replace Skylight and repair roof - - - - - - 75,000 75,000 Goeske Senior Center - Design and construction to add Kitchen AC - review scope - - - - - - 42,000 42,000 Goeske Senior Center - Modernize West Building hall/entry areas with new ceiling tiles, paint, chair rail, base board lighting
-
-
- -
-
-
25,000
25,000
Goeske Senior Center - New Marquee - LED motion sign - review scope - - - - - - 85,000 85,000 Goeske Senior Center - Remove "Disabled" lettering from building and paint - - - - - - 3,000 3,000 Goeske Senior Center - Replace exercise room ("Rod Pacheco" Room?) flooring. 1,500sf of rubber sports flooring at $20/sf
-
-
- -
-
-
30,000
30,000
Goeske Senior Center - Trim all trees - - - - - - 15,000 15,000 Goeske Senor Center - Parking lot slurry coat and striping, ADA parking improvements on the westerly side of the existing parking lot, sidewalk reconfiguration
-
-
- -
-
-
50,000
50,000
Golden Star Future Park - Design and Construction of new 19 AC neighborhood park including equestrian amenities, street improvements, basketball, playground, picnic shelter, multi-purpose field and parking lot.
-
-
- -
-
-
8,880,000
8,880,000 Harrison Park - Playground Engineered wood chips Surfacing top-off. - - - - - - 31,000 31,000 Harrison Park - Rebuild existing sump pump located in the middle of the park - - - - - - 20,000 20,000 Highland Park - Community Center and Site Improvements - - - - - - 1,750,000 1,750,000 Highland Park - Playground Improvements - - - - - - 250,000 250,000 Highland Park - Walking path around park with area lighting - - - - - - 275,000 275,000 Hole Lake Future Park Site - Hole Lake interpretive Area Expansion-non irrigated with pathways and disc golf course (37.6 AC)
-
-
- -
-
-
4,000,000
4,000,000
Hole Lake Future Park Site - Hole Lake mitigation area with grading export included (12 AC)
-
-
- -
-
-
2,000,000
2,000,000
Hole Lake Future Park Site - Rutland park expansion (15.3 AC) with parking lot, soccer fields, restroom, par-course, lighting, landscape, etc.
-
-
- -
-
-
6,000,000
6,000,000
Hole Lake Future Park Site - Trail head improvements on 7.7 AC - - - - - - 850,000 850,000 Hunt Park - 6' high picnic shelter fencing, mow curb, planting at $200/l.f. by 400' - - - - - - 100,000 100,000 Hunt Park - Add exterior painting of community center, pool bldg & park restroom - - - - - - 75,000 75,000 Hunt Park - Paint Community Center Interior - - - - - - 25,000 25,000 Hunt Park - Picnic shelter removal of picnic tables and dseign and construction of Outdoor Community Fitness Area - 10-15 pieces of equipment, drinking fountain, and misc landscape and paving improvements
-
-
- -
-
-
120,000
120,000 Hunt Park - Pool Filter Replacements (3 Tanks) - - - - - - 46,500 46,500 Hunt Park - Replace one partition used to accommodate rentals and classes - - - - - - 30,000 30,000 Hunter Park - Installation of playground shade - - - - - - 75,000 75,000
Hunter Park - Renovate RLS entry fencing with ADA access, mural on bldg. and landscaping.
-
-
- -
-
-
65,000
65,000
Hunter Park - Replace Playground wood chips, on-going - - 312,040 312,040 Indian Hill Acquisition - - - - - - 375,000 375,000 Islander Park - New Playground - - - - - - 600,000 600,000 Islander Park - New playground/ parking, trailhead design - - - - - - 60,000 60,000 Islander Park - Park and Trailhead improve., parking expansion, trail connections, ADA improve., pool building renovation, pool deck replacement, fencing, etc.
-
-
- -
-
-
2,900,000
2,900,000
Islander Park - Pool filter tank replacement (3 tanks) - - - - - - 45,000 45,000

PSP17-0018 - Exhibit 3 Page 5 Fiscal Year 2017/18 Unfunded CIP Projects
Unfunded CIP Projects by Department and Project
FY 2016/17
FY 2017/18
FY 2018/19 FY 2019/20
FY 2020/21
Unfunded
5 -Year Total
Unfunded
Beyond 5 -Years
Unfunded CIP Total All Years
Islander Park - Wading pool replacement with ADA splash pad, equipment, Health Dept. requirements, fencing, etc.
-
-
- -
-
-
375,000
375,000
La Sierra Park - ADA pathway Phase II around ballfields, including Decomposed Granite path w/mow curbs, landscaping & Furniture.
-
-
- -
-
-
30,000
30,000
La Sierra Park - Exercise stations along new walkways (7 total) in d.g. with mow curb and landscaping modifications.
-
-
- -
-
-
125,000
125,000
La Sierra Park - Functional improvements to Community Center - light at entrance door, bright water resistance platns at entry door, roller shades in MPR, middle office and computer lab, glass doors in arts and crafts room, CL, MPR rooms, Acoustic paneling in MPR and Gym and TV at reception to advertise classes
-
-
- -
-
-
90,000
90,000 La Sierra Park - Gymnasium automatic adjustment for basketball hoops. Provides a safer way to adjust hoops to serve ea. division of youth sports & adults.
-
-
- -
-
-
15,000
15,000
La Sierra Park - La Sierra Community Center Gym Floor Resurfacing - - - - - - 10,500 10,500 La Sierra Park - La Sierra Community Center HVAC Replacement - - - - - - 51,500 51,500 La Sierra Park - La Sierra Community Center Paint Interior and Exterior - - - - - - 36,000 36,000 La Sierra Park - Picnic shelter fencing at $200/l.f. by 400' - - - - - - 80,000 80,000 Lincoln Park - Add Photovoltaic panels on the existing park building to serve the building and potentially serve the park lighting
-
-
- -
-
-
-
-
Lincoln Park - Basketball Court Improvements (resurface, furniture, landscaping, etc.) - - - - - - 15,000 15,000 Lincoln Park - Community Fruit Tree Grove Garden Enhancements. Including, decomposed granite pathway, benches, trashcans, and landscaping
-
-
- -
-
-
65,000
65,000
Lincoln Park - New picnic shade shelter near the basketball court with photovolatic panels to serve basketball court lighting. Would need a battery
-
-
- -
-
-
-
-
Lincoln Park - Park Lighting Improvements conversion to LED fixtures (5-16' and 7'-30' poles)
-
-
- -
-
-
14,000
14,000
Lincoln Park - Playground lighting - - - - - - 45,000 45,000
Lincoln Park - Remove and replace playground surfacing. Approx. 6400 sf at $17/sf plus 20% cont.
-
-
- -
-
-
130,000
130,000 Lincoln Park - Renovate Veteran's Memorial - Add lighting, replace missing drinking fountain and improve memorial
-
-
- -
-
-
-
-
Lincoln Park - Security Cameras - - - - - - 75,000 75,000 Lincoln Park - Street light upgrade to LED by RPU - - - - - - - - Low Park and Parent Navel Lot - Playground area next to library with fencing around, shaded, drinking fountain, benches, lighting, etc.
-
-
- -
-
-
650,000
650,000
Martha McLean - Design Study and MP update to bring back the 1970s lakes powered by windmills. Including well rehabilitation study. County doesn't have plans nor the LA(Randy Hublic).
-
-
- -
-
-
50,000
50,000 Martha McLean Park - Remove and replace existing restroom - - - - - - 325,000 325,000 Martha McLean Park - Various Improvements throughout park - - - - - - 2,250,000 2,250,000 Mission Ranch Future Park per MP - Addition of skate park - - - - - - 2,000,000 2,000,000 Mission Ranch Future Park per MP - Community Center - - - - - - 4,000,000 4,000,000 Mission Ranch Future Park per MP - Design and Construction of new 12 AC park including parking lot, street improvements, ballfield, basketball, playground, picnic shelter, multi-purpose field and restroom storage bldg.
-
-
- -
-
-
6,550,000
6,550,000 Mount Rubidoux Park - San Andreas Ave. Entry drainage improvements and trail improvements around entry area
-
-
- -
-
-
175,000
175,000
Mount Rubidoux Park - San Andreas Ave. Streetscape and drainage improvements - - - - - - 175,000 175,000 Mount Rubidoux Park - Trails and Firebreak Repair and Modification - - - - - - 108,000 108,000 Mount Vernon Future Park - Future Park Development - clamshell backstop, picnic shelter, playground, open turf, lighting, walking paths, trail access and street improve.
-
-
- -
-
-
4,000,000
4,000,000
Mount Vernon Open space - Trail Improvements including improvements on Park site - - - - - - 1,700,000 1,700,000 Mountain View Park - Design and install cameras at park. Resident has complained about vandalism and drug activity at Emerson cul-de-sac
-
-
-
Mountain View Park - Playground Poured-in-place Surfacing Replacement - - - - - - 125,000 125,000 Myra Linn Park - ADA Parking Lot Improvements - Add truncated domes on ramps - - - - - - 4,500 4,500 Myra Linn Park - Gate repair - - - - - - 2,500 2,500 Myra Linn Park - Group Picnic shelters (3): Replace tables with concrete ones (3 ea. @ $1100 ea.), install D.G. around the BBQ (300 sf ea.), add ash can for BBQ, replace trash can with concrete one (1 ea.), paint the metal shade structure.
-
-
- -
-
-
65,000
65,000 Myra Linn Park - Install 2 conc. picnic tables, a trash can, and a small shelter next to the 2-5 playground
-
-
- -
-
-
35,000
35,000
Myra Linn Park - Install lighting for the basketball court - - - - - - 100,000 100,000 Myra Linn Park - Install lighting for the tennis court - - - - - - 150,000 150,000 Myra Linn Park - Install mow curb to separate the trail along Cook Ave. (450 l.f.) - - - - - - 12,000 12,000 Myra Linn Park - Install new sidewalk connecting from Cook Ave. to the playground (6'-7' wide) (330 l.f.) = 2310 sf x $10/sf
-
-
- -
-
-
35,000
35,000
Myra Linn Park - Provide ADA path to a group picnic shelter by the playground (45 l.f. x 6' wide = 270 sf)
-
-
- -
-
-
6,500
6,500
Myra Linn Park - Repair Poured-in-place rubberized surfacing at the 2-5 playground. - - - - - - 4,000 4,000 Myra Linn Park - Repair Poured-in-place rubberized surfacing at the 5-12 playgrounds - - - - - - 5,000 5,000 Myra Linn Park - Replace flood light fixtures (4) near the playground - - - - - - 12,000 12,000 Myra Linn Park - Replace old / broken play panels at the 2-5 playground - - - - - - 10,000 10,000 Myra Linn Park - Replace old / broken play panels at the 5-12 playground - - - - - - 10,000 10,000 Myra Linn Park - Replace trash cans with metal ones (B-K Custom); 3 to 10 each - - - - - - 9,600 9,600 Myra Linn Park - Tennis court re-surfacing - - - - - - 8,500 8,500
Myra Linn Park - Turf conversion @ school side of parking lot for water conservation at $3/s.f. - turf replaced with drip irrigation and drought tolerant landscaping (390 l.f. x 6'= 2340 sf)
-
-
- -
-
-
10,000
10,000 Myra Linn Park - Turf conversion at west side along Mobley Ave. at $3/s.f. - turf replaced with drip irrigation and drought tolerant landscaping (195' x 30' = 5850 sf)
-
11,000
11,000
Nichols Park - Add a shade sail to playground structure. Structure is manufactured by Landscape Structures
-
-
- -
-
-
90,000
90,000
Nichols Park - Energy audit recommended Lighting improvements. $840 potential rebate. 3.6 years effective payback
-
-
- -
-
-
13,000
13,000
Nichols Park - Exercise path around field, 2400 linear feet of 10' wide d.g.($50,000) with 3,800 l.f.. of 6" concrete mow curbs ($61,000). 180 l.f.. of 10' wide concrete path ($14,000). (4) Trashcans ($3,400) and (3) dog bag dispensers ($1,000). Allowance for clear, grub, grading, export, mobilizing, landscape ($60k)
-
-
- -
-
-
265,000
265,000 Nichols Park - Exterior Front Entry Lighting for Trellis and Paving and Electrical upgrade - - - - - - 21,000 21,000 Nichols Park - Exterior Storage Container replacement with TuffShed - - - - - - 18,500 18,500 Nichols Park - Front Door removal and replacement with storefront glass door - - - - - - 10,000 10,000 Nichols Park - Front Entry Area Improvements - 500SF Trellis ($38,000), Fountain/statue ($25,000), Raised planters 110LF ($9,000), Foundation planters 500SF ($3,000), R&R 2000SF front A.C and replace with rose garden ($18,000), R&R 4000SF paving ($38,000), Allowance for clear, grub, grading, mobilization, etc. ($45,000)
-
-
- -
-
-
246,000
246,000

PSP17-0018 - Exhibit 3 Page 6 Fiscal Year 2017/18 Unfunded CIP Projects
Unfunded CIP Projects by Department and Project
FY 2016/17
FY 2017/18
FY 2018/19 FY 2019/20
FY 2020/21
Unfunded
5 -Year Total
Unfunded
Beyond 5 -Years
Unfunded CIP Total All Years
Nichols Park - Gymnasium automatic adjustment for basketball hoops. Provides a safer way to adjust hoops to serve ea. division of youth sports & adults.
-
-
- -
-
-
15,000
15,000
Nichols Park - Gymnasium floor refinishing - - - - - 25,000 25,000 Nichols Park - Joyce Jackson Building Paint Interior and Exterior - - - - - - 36,000 36,000 Nichols Park - Joyce Jackson Building Sign. 14" high cast aluminum letters - - - - - - 7,000 7,000
Nichols Park - New 18,000SF Community Center including all exterior improvements ($6.6 million)
-
-
- -
-
-
6,600,000
6,600,000
Nichols Park - New acoustic paneling for walls and repair drop celling in multipurpose room.
-
-
- -
-
-
5,000
5,000
Nichols Park - Par Course exercise stations, 6 total, including demolition, grading, decomposed granite area with concrete mow curbs, irrigation and planting modifications.
-
-
- -
-
-
100,000
100,000 Nichols Park - Rear Entry / Picnic Area Improvements - New 2400SF picnic area with tree arcade ($24,000), 12 arcade 36" box trees w/ grate ($18,000) Misc. 2000SF Paving Expansion / ADA Impv.($19,000), Convert 2500SF turf to drip and shrub/G.C. areas ($12,500), Allowance of ($15,000) for grading, mobilization, etc.
-
-
- -
-
-
125,000
125,000 Nichols Park - Remove and replace 3300SF VCT flooring. - - - - - - 7,000 7,000 Nichols Park - Remove and replace interior solid doors with 6 wood framed glass doors, including new hardware.
-
-
- -
-
-
11,000
11,000
Nichols Park - Replace basketball volleyball court surfacing - - - - - - 30,000 30,000 Nichols Park - Replace Poured-in-place rubberized surfacing. 4,500 sf of removal and replacement of surface coat
-
-
- -
-
-
125,000
125,000
Nichols Park - Sound attenuation and paint - - - - - - 35,000 35,000 North Park - Fence along parking lot to isolate park - - - - - - 100,000 100,000 North Park - Stage or area to allow music, eating lunch, reading, etc. WI-FI - - - - - - 100,000 100,000
Orange Terrace Park - Community Center floor replacement - including moisture test and seal
-
-
- -
-
-
103,000
103,000
Orange Terrace Park - Community Center Gym floor repair and refinish - - - - - - 204,077 204,077 Orange Terrace Park - Community Center Paint Interior and Exterior - - - - - - 42,000 42,000 Orange Terrace Park - Dance Room wood floor Refinish - - - - - - 10,500 10,500 Orange Terrace Park - Exterior Basketball Court Resurfacing - - - - - - 15,000 15,000 Orange Terrace Park - Grease trap and kitchen upgrades for commercial kitchen at Community Center
-
-
- -
-
-
125,000
125,000
Orange Terrace Park - Playground Shade Sails - - - - - - 85,000 85,000 Orange Terrace Park - Replace one partition used to accommodate rentals and classes - - - - - - 30,000 30,000 Orange Terrace Park - Wading pool recirculating filtration system for splash pad, equipment, Health Dept. requirements and water savings
-
-
- -
-
-
325,000
325,000
Parks Refurbishing Program - Annual Deferred Maintenance Projects - 400,000 200,000 200,000 200,000 1,000,000 - 1,000,000 Patterson Park - Park Renovation per Specific Plan with soccer field, picnic shelters, par course, two playgrounds, basketball court and community garden.
-
-
- -
-
-
2,200,000
2,200,000
Patterson Park - Playground Equipment Replacement with new surfacing - - - - - - 450,000 450,000 Patterson Park - Replace Playground wood chips, on-going - 21,840 21,840
Proposed Airport Park - New 4 acre park with playground, walking path, picnic tables and parking lot. Maybe a dog run and open turf area. Park with airplane theme with bike or tricycle runway.
-
-
- -
-
-
1,500,000
1,500,000 Rancho Loma Park - Basketball Court Resurfacing - - - - - - 7,500 7,500 Rancho Loma Park - Replace Playground wood chips, on-going - 24,520 24,520 Reid Park - Clubhouse Kitchen Improvements - - - - - - 85,000 85,000 Reid Park - Clubhouse Renovation to improve multi-purpose room including a new deck awning and energy conservation enhancements(lighting, window covering, etc.)
-
-
- -
-
-
120,000
120,000
Reid Park - Community Center Gym Wood Floor Refinish - - - - - - 11,000 11,000 Reid Park - Community Center Paint Interior and Exterior - - - - - - 36,000 36,000 Reid Park - Community Center Renovation - - - - - - 850,000 850,000 Reid Park - Community Garden Improvements - - - - - - 50,000 50,000 Reid Park - Gymnasium automatic adjustment for basketball hoops. Provides a safer way to adjust hoops to serve ea. division of youth sports & adults.
-
-
- -
-
-
15,000
15,000
Reid Park - Little League / Rugby Restroom / Concession building Sewer improvement to gravity feed to community center
-
-
- -
-
-
85,000
85,000
Reid Park - Little League / Rugby Restroom / include sewer / concession building Remove and replace
-
-
- -
-
-
750,000
750,000
Reid Park - Rugby Field lighting Improvement - - - - - - 275,000 275,000 Reid Park - Sports Complex Expansion on 64 AC - - - - - - 27,000,000 27,000,000 Reid Park - Tennis Court Resurfacing (3 courts) - - - - - - 25,000 25,000 Reid Park - Water conservation Improvement to Calsense Irrigation Controller to connect to network system and upgrade controllers
-
-
- -
-
-
75,000
75,000
Riverwalk - Flat Rock Pocket Park - Playground Poured-in-place surfacing replacement - 105,321 105,321
Riverwalk - Golden/Schuyler Pock Park - Playground Poured-in-place surfacing replacement
-
105,321
105,321 Rutland Park - Basketball court resurfacing - - - - - - 8,000 8,000 Rutland Park - Par Course replacement with new equipment - - - - - - 50,000 50,000 Rutland Park - Replace Playground wood chips, on-going - 20,440 20,440 Ryan Bonaminio - Replace Playground wood chips, on-going - 320,104 320,104 Ryan Bonaminio Park at Tequesquite Arroyo - Interpretive and way finding signage including 6 signs (Arroyo, alkali meadow, native plants, wildlife, trail head, education)
-
- -
-
-
125,000
125,000
Ryan Bonaminio Park at Tequesquite Arroyo - Splash pad water play improvement including recirculating system
-
- -
-
-
550,000
550,000
Shamel Park - Pool deck Shade Canopy over bleachers (1) 10' high Canopy 40'x15' - - - - - - 24,000 24,000 Shamel Park - Pool filter replacement(3 tanks) - - - - - - 46,000 46,000 Shamel Park - Shamel Pool Bldg, solar shad structure, paving and landscaping improvements like at Hunt Park.
-
-
- -
-
-
1,250,000
1,250,000
Shamel Park - Wading pool replacement with ADA splash pad, equipment, Health Dept. requirements, fencing, etc.
-
-
- -
-
-
425,000
425,000
Swanson Park - Exercise stations areas with d.g. mow curbs and two pieces of equipment each(3 total).
-
-
- -
-
-
100,000
100,000
Swanson Park - Small playground features - - - - - - 250,000 250,000
Sycamore Canyon Wilderness Park - Sycamore Canyon Trailhead at Barton and Alessandro
-
-
- -
-
-
1,850,000
1,850,000 Sycamore Canyon Wilderness Park - Trail Maintenance - adjustment of existing trail alignments and fixing ruts and other drainage mitigation
-
-
- -
-
-
79,000
79,000
Sycamore Highlands Park - Playground Poured-in-place surfacing replacement - - 35,534 35,534 Sycamore Highlands Park - Wading pool recirculating filtration system for splash pad, equipment, Health Dept. requirements and water savings
-
-
- -
-
-
325,000
325,000
Taft Park - Existing Tennis court resurfacing - - - - - 8,000 8,000 Taft Park - Replace Playground wood chips, on-going - 20,104 20,104 Taft Park - Replacement of existing playground equipment - - - - - 500,000 500,000

PSP17-0018 - Exhibit 3 Page 7 Fiscal Year 2017/18 Unfunded CIP Projects
Unfunded CIP Projects by Department and Project
FY 2016/17
FY 2017/18
FY 2018/19 FY 2019/20
FY 2020/21
Unfunded
5 -Year Total
Unfunded
Beyond 5 -Years
Unfunded CIP Total All Years
Taft Park - Shade Structure for Playground - - - - - 95,000 95,000 Tequesquite Open Space - Trail head improve. and linear agricultural park on 54.99 AC parcel on S. side of Tequesquite. MSCP conserve easement on westerly portion
-
- -
-
-
2,750,000
2,750,000
Tequesquite Open Space - Trail head improve., nature play and agricultural park on 63.65 AC parcels on N. side of Tequesquite. MSCP conserve easement on westerly portion
-
- -
-
-
3,200,000
3,200,000
Thundersky Park - Replace Playground wood chips, on-going - 19,672 19,672 Thundersky Park - Replacement of existing playground equipment - - - - - 500,000 500,000
Villegas Park - Bleacher replacement at Bunker ballfield. R&R of old wooden bleachers w/ new ADA and Safety compliant Aluminum Bleachers. New aluminum bleachers ($65,000), demolition of old bleachers ($10,000), concrete pad (2800 SF X $8 = $22,500), bleacher installation ($25,000), plus 20% cont. Save $50 with Parks and CalFire crew. $228.62 CalFire daily rate.
-
-
- -
-
-
185,000
185,000 Villegas Park - Community Center area roof replacement. - Needed in year 2020. - - - - - 210,000 210,000 Villegas Park - Community Center Banquet Room roller shades and tinting - - - - - - 4,500 4,500 Villegas Park - Community Center Sound System Improvement to expand into both gyms and to add a DVD connection in sound room.
-
- -
-
-
18,000
18,000
Villegas Park - Gymnasium automatic adjustment for basketball hoops. Provides a safer way to adjust hoops to serve ea. division of youth sports & adults.
-
- -
-
-
18,000
18,000
Villegas Park - MP Phase II - Exercise stations along d.g. pathway (7 total) in d.g. with mow curb and landscaping modifications.
-
- -
-
-
175,000
175,000
Villegas Park - MP Phase II - improv. to decomposed granite jogging path around N. PL. Including drainage, lighting, and landscape.
-
- -
-
-
900,000
900,000
Villegas Park - MP Phase II - Jogging path expansion around playground with mow curb and landscaping modifications.
-
- -
-
-
85,000
85,000
Villegas Park - MP Phase II - Jogging path expansion around softball field with mow curb and landscaping modifications. Connects to Bunker lot.
-
- -
-
-
85,000
85,000
Villegas Park - MP Phase II - New outfield 4' high fencing with mow curb for softball Bunker field, with reduced radius and backstop renovation
-
- -
-
-
105,000
105,000
Villegas Park - MP Phase II - Synthetic Soccer field to replace existing field - - - - - 1,500,000 1,500,000 Villegas Park - Outdoor Basketball Court resurfacing - - - - - - 35,000 35,000 Villegas Park - Replace two partitions used to accommodate rentals and classes - - - - - 60,000 60,000 Villegas Park - Wading pool replacement with ADA splash pad, equipment, Health Dept. requirements, fencing, etc.
-
- -
-
-
450,000
450,000
Villegas Park ADA Walkway - 65,000 65,000 White Park - ADA site concrete replacement to eliminate cracked and lifted concrete. - - - - - - 150,000 150,000 White Park - Senior Center Window wood blind replacement for 28 windows. - - - - - - 15,000 15,000
Parks, Recreation, and Community Services Total - 800,000 400,000 400,000 400,000 2,000,000 243,986,810 245,986,810
Public Utilities Add'l. Main Replacements - - - - - - 19,200,000 19,200,000 Advanced Technology Projects - - - - - - 40,900,000 40,900,000 Cable Replacement - - - - - - 23,253,000 23,253,000 City-wide Communications - - - - - - 18,440,000 18,440,000 Distribution Automation/Reliability - - - - - - 12,338,000 12,338,000 Facility Rehab (Wells, Boosters, Pressure Reducing Valves, Reservoirs, SCADA) - - - - - - 21,600,000 21,600,000 GO 165 Upgrades /Line Rebuilds / Relocate - - - - - - 27,557,000 27,557,000 Hydrant Check Valves (2 of 2, Unfunded Portion) - - - - - - 100,000 100,000 Lines Rebuilds / Relocate - - - - - - 17,050,000 17,050,000 Major 4-12 kV Conversion - - - - - - 9,818,000 9,818,000 Meter Replacement - - - - - - 4,000,000 4,000,000 Operational Database Management System - - - - - - 2,000,000 2,000,000 Pump Station Replacements - - - - - - 3,000,000 3,000,000 Recycled Water - - - - - - 15,340,000 15,340,000 Riverside North Aquifer Storage and Recovery Project - - - - - - 25,000,000 25,000,000 SCADA - - - - - - 2,194,000 2,194,000 Street Light Improvements - - - - - - 6,680,000 6,680,000 Substation Bus & Upgrades - - - - - - 11,865,000 11,865,000 Substation Transformer Addition - - - - - - 10,950,000 10,950,000 System Substation Modifications - - - - - - 1,980,000 1,980,000 Transformers - - - - - - 5,677,000 5,677,000 Transmission Mains - - - - - - 23,350,000 23,350,000 Water Stock (2 of 2, Unfunded Portion) - - - - - - 10,000 10,000 Water Treatment Plants - - - - - - 3,800,000 3,800,000
Public Utilities Total - - - - - - 306,102,000 306,102,000
Public Works 14th Street Widening, SR 91 to Martin Luther King - - - - - - 24,000,000 24,000,000 Adams Street/State Route 91 Interchange Improvements (Unfunded Component) - - - - - - 72,900,000 72,900,000 Arlanza Neighborhood sewer mains rehab - - - - - - 4,800,000 4,800,000 Arlanza Priority C Sewer Construction - Phase 2 - - - - - - 4,010,000 4,010,000 Arlington Avenue Widening, Adams to Van Buren - - - - - - 1,500,000 1,500,000 Arlington Avenue Widening, Victoria to Alessandro - - - - - - 16,600,000 16,600,000 Bio-Solids Handling Rehabilitation - Phase 2 - - - - - - 3,000,000 3,000,000 BNSF Quiet Zone - Mission Inn, 3rd, Spruce (2 of 2, Unfunded Portion) - - - - - - 2,449,200 2,449,200 Chicago Medians - Le Conte to Martin Luther King - - - - - - 1,800,000 1,800,000 Cochran Avenue Strom Drain Improvements - - - - - - 500,000 500,000 Iowa Avenue Widening - Martin Luther King to University - - - - - - 1,000,000 1,000,000 Miscellaneous Bridge Repair - - - - - - 100,000 100,000 Northside Priority C Sewer Construction - - - - - - 2,130,000 2,130,000 Phase 2 Grade Separation Program (3rd, Spruce, Jackson and/or Mary) - - - - - - 109,500,000 109,500,000 Phoenix Priority A, B and C Sewer Construction - Phase 2 - - - - - - 1,920,000 1,920,000 Plant 2 Activated Sludge Rehabilitation - Phase 2 - - - - - - 199,500 199,500 Potable/Recycled Water System Pipeline Rehabilitation - Phase 2 - - - - - - 1,000,000 1,000,000 Replace & Enlarge Garages 1 & 2 - - - - - - 16,000,000 16,000,000 Replace 170 Single Head Meters - - - - - - 124,000 124,000 Replace 32 Version 2 Luke Meters - - - - - - 300,000 300,000 Replace 47 Version 3 Luke Meters - - - - - - 450,000 450,000 RWQCP Rehabilitation - Phase II - Phase 2 - - - - - - 2,000,000 2,000,000 Santa Ana Walking Trail-McLean Pk to Fairmount Pk (2 of 2, Unfunded Portion) - - - - - - 1,094,000 1,094,000 Spruce Priority B and C Sewer Construction - Spruce 2 - - - - - - 290,000 290,000 SR 91 Pedestrian Bridge-MetroLink to Downtown (2 of 2, Unfunded Portion) - - - - - - 512,500 512,500 Tequesquite Priority A, B and C Sewer Construction - Phase 2 - - - - - - 4,700,000 4,700,000 Tertiary System Rehabilitation - Phase 2 - - - - - - 4,800,000 4,800,000 Trautwein/Alessandro Forcemain - - - - - - 5,000,000 5,000,000 Tyler/State Route 91 Interchange Improvements* - - - - - - 75,000,000 75,000,000

PSP17-0018 - Exhibit 3 Page 8 Fiscal Year 2017/18 Unfunded CIP Projects
Unfunded CIP Projects by Department and Project
FY 2016/17
FY 2017/18
FY 2018/19 FY 2019/20
FY 2020/21
Unfunded
5 -Year Total
Unfunded
Beyond 5 -Years
Unfunded CIP Total All Years
Van Buren Widening, Indiana to South City Limit - - - - - - 26,640,352 26,640,352 Wastewater Lift Station Projects - Phase 2 - - - - - - 5,200,000 5,200,000 Woodcrest Sewer Construction- Phase 1 - - - - - - 6,400,000 6,400,000 Woodcrest Sewer Construction- Phase 2 - - - - - - 8,600,000 8,600,000
Public Works Total - - - - - - 404,519,552 404,519,552 Unfunded CIP Projects All Years Grand Total 500,000 10,915,581 32,561,650 65,519,238 43,983,710 153,480,179 1,092,608,362 1,246,088,541
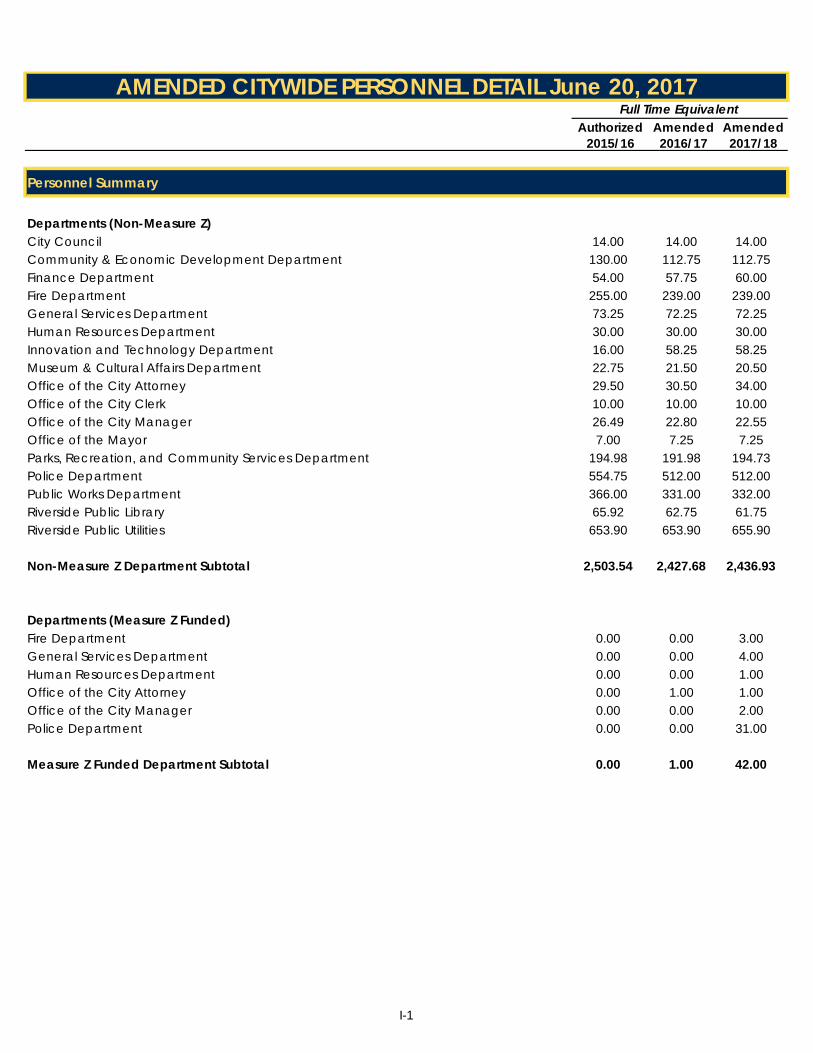
Authorized Amended AmendedGL Key Loc Job Type Job Title 2015/16 2016/17 2017/18
Personnel Summary
Departments (Non-Measure Z)City Council 14.00 14.00 14.00Community & Economic Development Department 130.00 112.75 112.75Finance Department 54.00 57.75 60.00Fire Department 255.00 239.00 239.00General Services Department 73.25 72.25 72.25Human Resources Department 30.00 30.00 30.00Innovation and Technology Department 16.00 58.25 58.25Museum & Cultural Affairs Department 22.75 21.50 20.50Office of the City Attorney 29.50 30.50 34.00Office of the City Clerk 10.00 10.00 10.00Office of the City Manager 26.49 22.80 22.55Office of the Mayor 7.00 7.25 7.25Parks, Recreation, and Community Services Department 194.98 191.98 194.73Police Department 554.75 512.00 512.00Public Works Department 366.00 331.00 332.00Riverside Public Library 65.92 62.75 61.75Riverside Public Utilities 653.90 653.90 655.90
Non-Measure Z Department Subtotal 2,503.54 2,427.68 2,436.93
Departments (Measure Z Funded)Fire Department 0.00 0.00 3.00General Services Department 0.00 0.00 4.00Human Resources Department 0.00 0.00 1.00Office of the City Attorney 0.00 1.00 1.00Office of the City Manager 0.00 0.00 2.00Police Department 0.00 0.00 31.00
Measure Z Funded Department Subtotal 0.00 1.00 42.00
AMENDED CITYWIDE PERSONNEL DETAIL June 20, 2017Full Time Equivalent
PCN
I-1

Authorized Amended AmendedGL Key Loc Job Type Job Title 2015/16 2016/17 2017/18
AMENDED CITYWIDE PERSONNEL DETAIL June 20, 2017Full Time Equivalent
PCN
City Council 14.00 14.00 14.00Community & Economic Development Department 130.00 112.75 112.75Finance Department 54.00 57.75 60.00Fire Department 255.00 239.00 242.00General Services Department 73.25 72.25 76.25Human Resources Department 30.00 30.00 31.00Innovation and Technology Department 16.00 58.25 58.25Museum & Cultural Affairs Department 22.75 21.50 20.50Office of the City Attorney 29.50 31.50 35.00Office of the City Clerk 10.00 10.00 10.00Office of the City Manager 26.49 22.80 24.55Office of the Mayor 7.00 7.25 7.25Parks, Recreation, and Community Services Department 194.98 191.98 194.73Police Department 554.75 512.00 543.00Public Works Department 366.00 331.00 332.00Riverside Public Library 65.92 62.75 61.75Riverside Public Utilities 653.90 653.90 655.90
TOTAL DEPARTMENTAL POSITIONS (ALL FUNDING SOURCES) 2,503.54 2,428.68 2,478.93
I-2

Authorized Amended AmendedGL Key Loc Job Type Job Title 2015/16 2016/17 2017/18
AMENDED CITYWIDE PERSONNEL DETAIL June 20, 2017Full Time Equivalent
PCN
City Council
City Council
Full Time0200000 CC00 0357 F Council Assistant (NC) 7.00 7.00 7.000200000 CC00 9810 F Mayor Pro Tem 1.00 1.00 1.000200000 CC00 9820 F Council Member 6.00 6.00 6.00
Total 14.00 14.00 14.00
Department Total 14.00 14.00 14.00
I-3
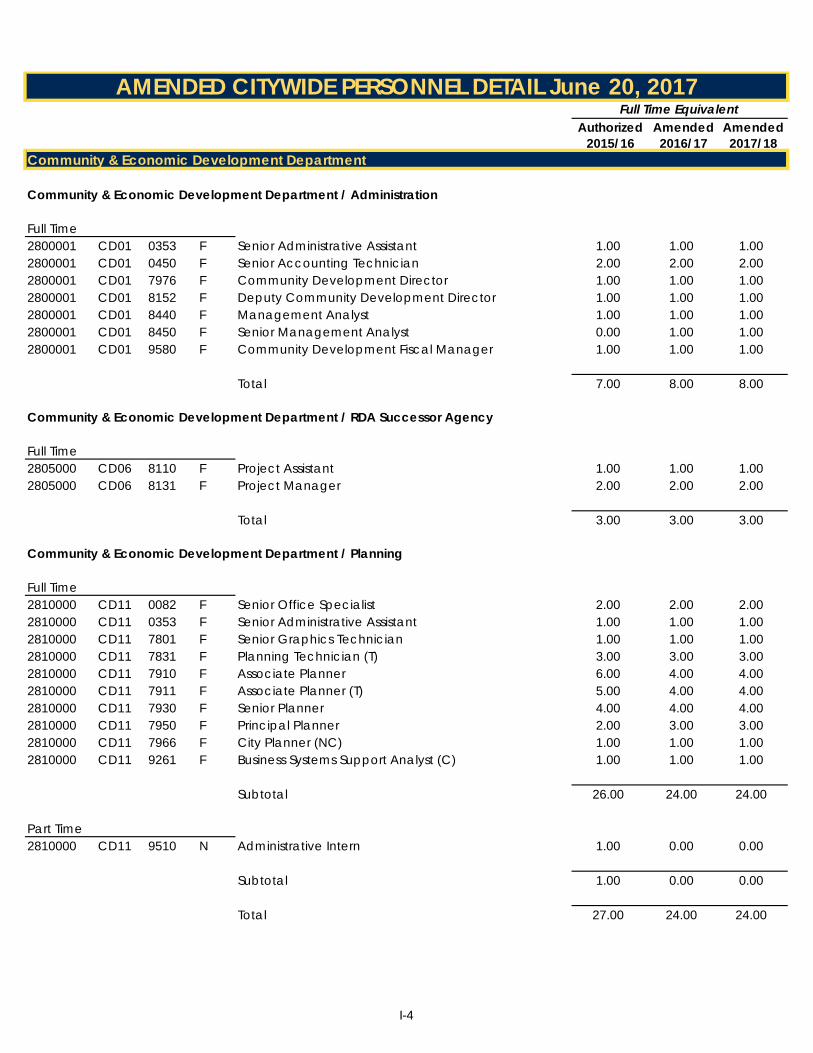
Authorized Amended AmendedGL Key Loc Job Type Job Title 2015/16 2016/17 2017/18
AMENDED CITYWIDE PERSONNEL DETAIL June 20, 2017Full Time Equivalent
PCN
Community & Economic Development Department
Community & Economic Development Department / Administration
Full Time2800001 CD01 0353 F Senior Administrative Assistant 1.00 1.00 1.002800001 CD01 0450 F Senior Accounting Technician 2.00 2.00 2.002800001 CD01 7976 F Community Development Director 1.00 1.00 1.002800001 CD01 8152 F Deputy Community Development Director 1.00 1.00 1.002800001 CD01 8440 F Management Analyst 1.00 1.00 1.002800001 CD01 8450 F Senior Management Analyst 0.00 1.00 1.002800001 CD01 9580 F Community Development Fiscal Manager 1.00 1.00 1.00
Total 7.00 8.00 8.00
Community & Economic Development Department / RDA Successor Agency
Full Time2805000 CD06 8110 F Project Assistant 1.00 1.00 1.002805000 CD06 8131 F Project Manager 2.00 2.00 2.00
Total 3.00 3.00 3.00
Community & Economic Development Department / Planning
Full Time2810000 CD11 0082 F Senior Office Specialist 2.00 2.00 2.002810000 CD11 0353 F Senior Administrative Assistant 1.00 1.00 1.002810000 CD11 7801 F Senior Graphics Technician 1.00 1.00 1.002810000 CD11 7831 F Planning Technician (T) 3.00 3.00 3.002810000 CD11 7910 F Associate Planner 6.00 4.00 4.002810000 CD11 7911 F Associate Planner (T) 5.00 4.00 4.002810000 CD11 7930 F Senior Planner 4.00 4.00 4.002810000 CD11 7950 F Principal Planner 2.00 3.00 3.002810000 CD11 7966 F City Planner (NC) 1.00 1.00 1.002810000 CD11 9261 F Business Systems Support Analyst (C) 1.00 1.00 1.00
Subtotal 26.00 24.00 24.00
Part Time2810000 CD11 9510 N Administrative Intern 1.00 0.00 0.00
Subtotal 1.00 0.00 0.00
Total 27.00 24.00 24.00
I-4
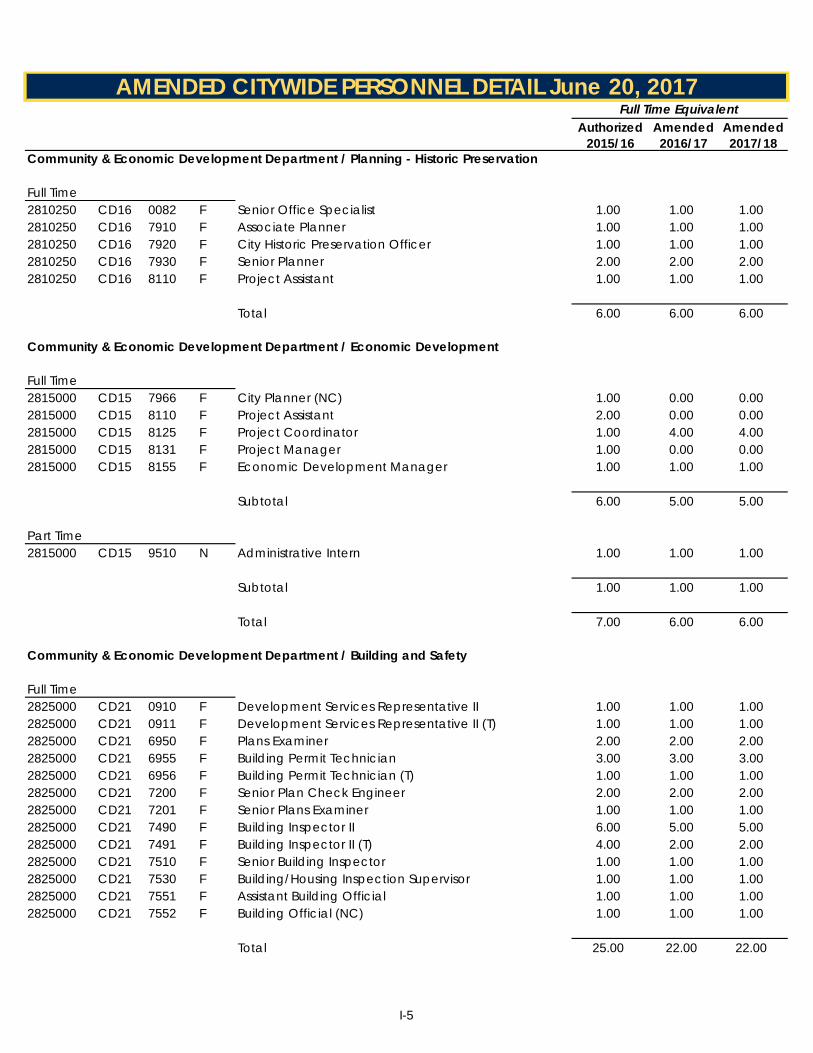
Authorized Amended AmendedGL Key Loc Job Type Job Title 2015/16 2016/17 2017/18
AMENDED CITYWIDE PERSONNEL DETAIL June 20, 2017Full Time Equivalent
PCN
Community & Economic Development Department / Planning - Historic Preservation
Full Time2810250 CD16 0082 F Senior Office Specialist 1.00 1.00 1.002810250 CD16 7910 F Associate Planner 1.00 1.00 1.002810250 CD16 7920 F City Historic Preservation Officer 1.00 1.00 1.002810250 CD16 7930 F Senior Planner 2.00 2.00 2.002810250 CD16 8110 F Project Assistant 1.00 1.00 1.00
Total 6.00 6.00 6.00
Community & Economic Development Department / Economic Development
Full Time2815000 CD15 7966 F City Planner (NC) 1.00 0.00 0.002815000 CD15 8110 F Project Assistant 2.00 0.00 0.002815000 CD15 8125 F Project Coordinator 1.00 4.00 4.002815000 CD15 8131 F Project Manager 1.00 0.00 0.002815000 CD15 8155 F Economic Development Manager 1.00 1.00 1.00
Subtotal 6.00 5.00 5.00
Part Time2815000 CD15 9510 N Administrative Intern 1.00 1.00 1.00
Subtotal 1.00 1.00 1.00
Total 7.00 6.00 6.00
Community & Economic Development Department / Building and Safety
Full Time2825000 CD21 0910 F Development Services Representative II 1.00 1.00 1.002825000 CD21 0911 F Development Services Representative II (T) 1.00 1.00 1.002825000 CD21 6950 F Plans Examiner 2.00 2.00 2.002825000 CD21 6955 F Building Permit Technician 3.00 3.00 3.002825000 CD21 6956 F Building Permit Technician (T) 1.00 1.00 1.002825000 CD21 7200 F Senior Plan Check Engineer 2.00 2.00 2.002825000 CD21 7201 F Senior Plans Examiner 1.00 1.00 1.002825000 CD21 7490 F Building Inspector II 6.00 5.00 5.002825000 CD21 7491 F Building Inspector II (T) 4.00 2.00 2.002825000 CD21 7510 F Senior Building Inspector 1.00 1.00 1.002825000 CD21 7530 F Building/Housing Inspection Supervisor 1.00 1.00 1.002825000 CD21 7551 F Assistant Building Official 1.00 1.00 1.002825000 CD21 7552 F Building Official (NC) 1.00 1.00 1.00
Total 25.00 22.00 22.00
I-5
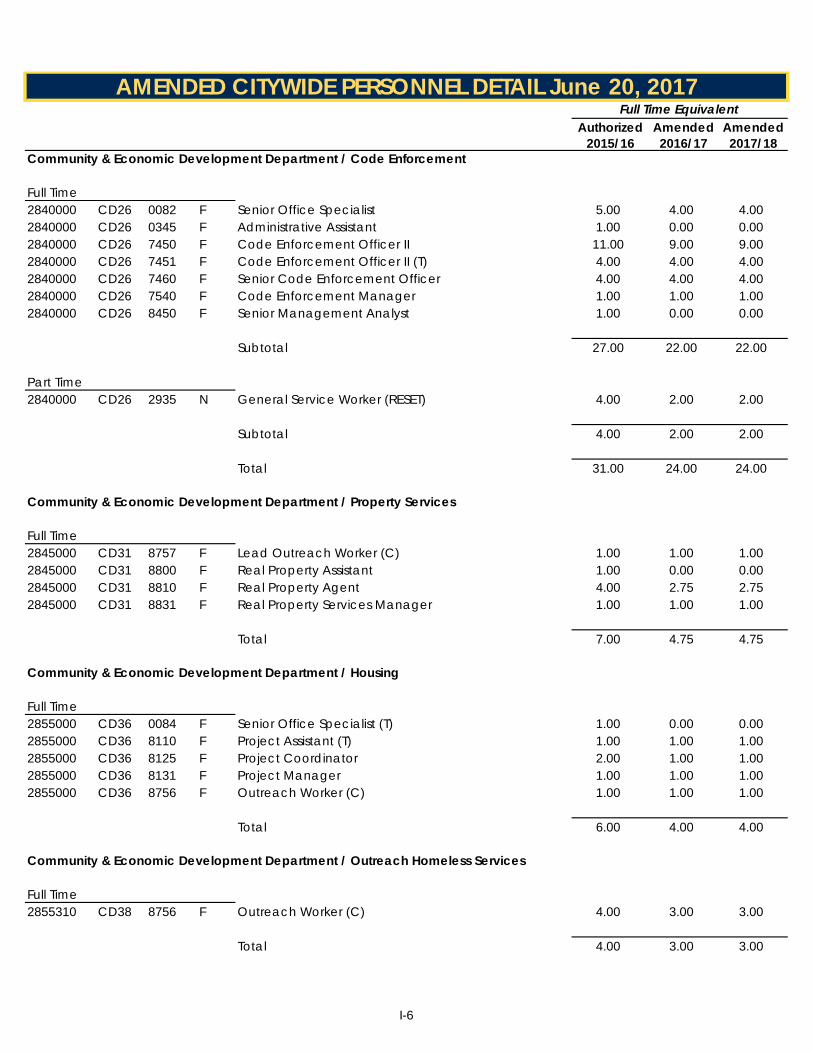
Authorized Amended AmendedGL Key Loc Job Type Job Title 2015/16 2016/17 2017/18
AMENDED CITYWIDE PERSONNEL DETAIL June 20, 2017Full Time Equivalent
PCN
Community & Economic Development Department / Code Enforcement
Full Time2840000 CD26 0082 F Senior Office Specialist 5.00 4.00 4.002840000 CD26 0345 F Administrative Assistant 1.00 0.00 0.002840000 CD26 7450 F Code Enforcement Officer II 11.00 9.00 9.002840000 CD26 7451 F Code Enforcement Officer II (T) 4.00 4.00 4.002840000 CD26 7460 F Senior Code Enforcement Officer 4.00 4.00 4.002840000 CD26 7540 F Code Enforcement Manager 1.00 1.00 1.002840000 CD26 8450 F Senior Management Analyst 1.00 0.00 0.00
Subtotal 27.00 22.00 22.00
Part Time2840000 CD26 2935 N General Service Worker (RESET) 4.00 2.00 2.00
Subtotal 4.00 2.00 2.00
Total 31.00 24.00 24.00
Community & Economic Development Department / Property Services
Full Time2845000 CD31 8757 F Lead Outreach Worker (C) 1.00 1.00 1.002845000 CD31 8800 F Real Property Assistant 1.00 0.00 0.002845000 CD31 8810 F Real Property Agent 4.00 2.75 2.752845000 CD31 8831 F Real Property Services Manager 1.00 1.00 1.00
Total 7.00 4.75 4.75
Community & Economic Development Department / Housing
Full Time2855000 CD36 0084 F Senior Office Specialist (T) 1.00 0.00 0.002855000 CD36 8110 F Project Assistant (T) 1.00 1.00 1.002855000 CD36 8125 F Project Coordinator 2.00 1.00 1.002855000 CD36 8131 F Project Manager 1.00 1.00 1.002855000 CD36 8756 F Outreach Worker (C) 1.00 1.00 1.00
Total 6.00 4.00 4.00
Community & Economic Development Department / Outreach Homeless Services
Full Time2855310 CD38 8756 F Outreach Worker (C) 4.00 3.00 3.00
Total 4.00 3.00 3.00
I-6

Authorized Amended AmendedGL Key Loc Job Type Job Title 2015/16 2016/17 2017/18
AMENDED CITYWIDE PERSONNEL DETAIL June 20, 2017Full Time Equivalent
PCN
Community & Economic Development Department / Housing Authority
Full Time2875000 CD41 0084 F Senior Office Specialist (T) 1.00 2.00 2.002875000 CD41 8110 F Project Assistant 1.00 2.00 2.002875000 CD41 8125 F Project Coordinator 2.00 1.00 1.002875000 CD41 8131 F Project Manager 2.00 2.00 2.002875000 CD41 8165 F Housing Authority Manager 1.00 1.00 1.00
Total 7.00 8.00 8.00
Department Total 130.00 112.75 112.75
I-7

Authorized Amended AmendedGL Key Loc Job Type Job Title 2015/16 2016/17 2017/18
AMENDED CITYWIDE PERSONNEL DETAIL June 20, 2017Full Time Equivalent
PCN
Finance Department
Finance / Administration
Full Time2300000 FN00 0086 F Senior Office Specialist (C) 1.00 0.00 0.002300000 FN00 0353 F Senior Administrative Assistant 1.00 1.00 1.002300000 FN00 8326 F Assistant Chief Financial Officer (NC) 1.00 1.00 1.002300000 FN00 8330 F Chief Financial Officer/City Treasurer 1.00 1.00 1.002310000 FN10 8460 F Principal Management Analyst 0.00 1.00 2.00 2300000 FN00 9256 F Business Systems Support Manager (NC) 1.00 1.00 0.002300000 FN00 9262 F Business Systems Support Technician 0.00 1.00 0.00
Subtotal 5.00 6.00 5.00
Part Time2305000 FN00 8460 H Principal Management Analyst 0.50 0.75 0.002300000 FN00 9510 N Administrative Intern 0.50 0.50 0.50
Subtotal 1.00 1.25 0.50
Total 6.00 7.25 5.50
Finance /Financial Systems
Full Time2302000 FN02 9256 F Business Systems Support Manager (NC) 0.00 0.00 1.002302000 FN02 9262 F Business Systems Support Technician 0.00 0.00 1.00
Total 0.00 0.00 2.00
Finance / Business Tax
Full Time2304000 FN04 0520 F Revenue Specialist 0.00 0.00 1.002304000 FN04 0581 F Senior Business Tax Representative 0.00 0.00 3.002304000 FN04 0583 F Business Tax Representative II (T) 0.00 0.00 3.002304000 FN04 0585 F Business Tax Inspector 0.00 0.00 2.002304000 FN04 0876 F Business Tax/Collections Supervisor 0.00 0.00 1.00
Subtotal 0.00 0.00 10.00
Part Time2304000 FN04 0585 H Business Tax Inspector 0.00 0.00 0.50
Subtotal 0.00 0.00 0.50
Total 0.00 0.00 10.50
I-8

Authorized Amended AmendedGL Key Loc Job Type Job Title 2015/16 2016/17 2017/18
AMENDED CITYWIDE PERSONNEL DETAIL June 20, 2017Full Time Equivalent
PCN
Finance / Accounting
Full Time2305000 FN05 0410 F Account Clerk II 3.00 3.00 2.002305000 FN05 0420 F Account Clerk II (P) 1.00 1.00 1.002305000 FN05 0450 F Senior Accounting Technician 1.00 1.00 1.002305000 FN05 0460 F Accounting Technician 3.00 3.00 3.002305000 FN05 0465 F Accounting Technician (P) 1.00 1.00 1.002305000 FN05 0471 F Treasury Supervisor 1.00 1.00 1.002305000 FN05 0490 F Accounts Payable Supervisor 1.00 1.00 1.002305000 FN05 0500 F Revenue Representative 4.00 4.00 4.002305000 FN05 0501 F Revenue Representative (T) 1.00 1.00 1.002305000 FN05 0521 F Revenue Specialist (T) 1.00 1.00 1.002305000 FN05 0570 F Collection Representative II 1.00 1.00 1.002305000 FN05 8260 F Accountant II 1.00 1.00 2.002305000 FN05 8270 F Accountant II (PR) 1.00 1.00 1.002305000 FN05 8280 F Senior Accountant 3.00 2.00 3.002305000 FN05 8290 F Principal Accountant 1.00 1.00 1.002305000 FN05 8321 F Accounting Manager/Controller (NC) 1.00 1.00 1.002305000 FN05 8460 F Principal Management Analyst 1.00 1.00 1.00
Total 26.00 25.00 26.00
Finance / Budget and Revenue
Full Time2310000 FN10 0520 F Revenue Specialist 1.00 1.00 0.002310000 FN10 0581 F Senior Business Tax Representative 3.00 3.00 0.002310000 FN10 0583 F Business Tax Representative II (T) 3.00 3.00 0.002310000 FN10 0585 F Business Tax Inspector 0.00 2.00 0.002310000 FN10 0876 F Business Tax/Collections Supervisor 1.00 1.00 0.002310000 FN10 8335 F Budget and Revenue Manager (NC) 1.00 1.00 1.002310000 FN10 8460 F Principal Management Analyst 3.00 2.00 2.002310000 FN10 8450 F Senior Management Analyst 0.00 1.00 1.00 2310000 FN10 8440 F Management Analyst 0.00 1.00 1.00
Subtotal 12.00 15.00 5.00
Part Time2310000 FN10 0585 H Business Tax Inspector 0.00 0.50 0.00
Subtotal 0.00 0.50 0.00
Total 12.00 15.50 5.00
I-9

Authorized Amended AmendedGL Key Loc Job Type Job Title 2015/16 2016/17 2017/18
AMENDED CITYWIDE PERSONNEL DETAIL June 20, 2017Full Time Equivalent
PCN
Finance / Purchasing
Full Time2315000 FN15 0024 F Office Specialist (T) 1.00 1.00 0.00
2315000 FN15 0086 F Senior Office Specialist (C) 3.00 3.00 1.00
2315000 FN15 1230 F Procurement & Contract Specialist 1.00 1.00 2.00
2315000 FN15 1231 F Procurement & Contract Specialist (T) 1.00 1.00 1.00
2315000 FN15 1250 F Senior Procurement & Contract Specialist 1.00 1.00 1.00
2315000 FN15 8665 F Risk Management Specialist 1.00 1.002315000 FN15 8669 F Risk Management Supervisor (NC) 1.00 1.002315000 FN15 8676 F Purchasing Manager (NC) 1.00 1.00 1.00
Total 10.00 10.00 6.00
Finance / Risk Management
Full Time2320000 FN20 0024 F Office Specialist (T) 0.00 0.00 0.002320000 FN20 0086 F Senior Office Specialist (C) 0.00 0.00 1.00
2320000 FN20 8665 F Risk Management Specialist 0.00 0.00 2.00
Claims Investivator 0.00 0.00 1.002320000 FN20 8669 F Risk Management Supervisor (NC) 0.00 0.00 0.002320000 FN20 F Risk Manager (NC) 0.00 0.00 1.00
Total 0.00 0.00 5.00
Department Total 54.00 57.75 60.00
I-10
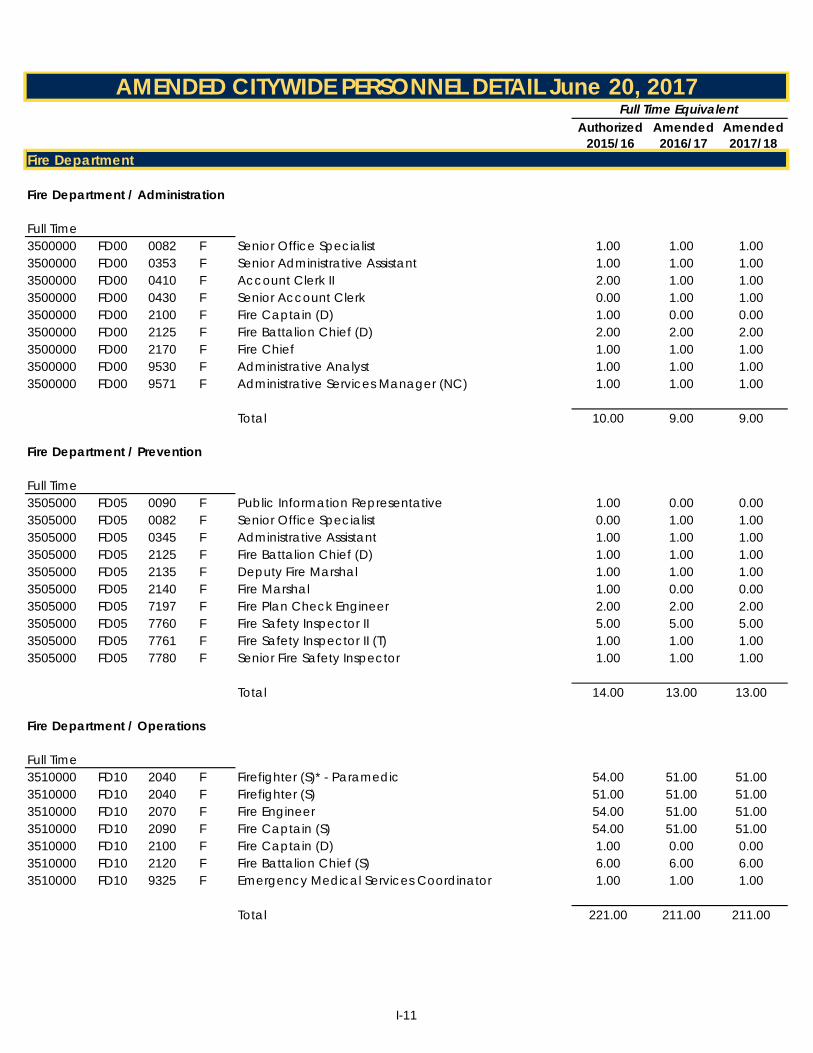
Authorized Amended AmendedGL Key Loc Job Type Job Title 2015/16 2016/17 2017/18
AMENDED CITYWIDE PERSONNEL DETAIL June 20, 2017Full Time Equivalent
PCN
Fire Department
Fire Department / Administration
Full Time3500000 FD00 0082 F Senior Office Specialist 1.00 1.00 1.003500000 FD00 0353 F Senior Administrative Assistant 1.00 1.00 1.003500000 FD00 0410 F Account Clerk II 2.00 1.00 1.003500000 FD00 0430 F Senior Account Clerk 0.00 1.00 1.003500000 FD00 2100 F Fire Captain (D) 1.00 0.00 0.003500000 FD00 2125 F Fire Battalion Chief (D) 2.00 2.00 2.003500000 FD00 2170 F Fire Chief 1.00 1.00 1.003500000 FD00 9530 F Administrative Analyst 1.00 1.00 1.003500000 FD00 9571 F Administrative Services Manager (NC) 1.00 1.00 1.00
Total 10.00 9.00 9.00
Fire Department / Prevention
Full Time3505000 FD05 0090 F Public Information Representative 1.00 0.00 0.003505000 FD05 0082 F Senior Office Specialist 0.00 1.00 1.003505000 FD05 0345 F Administrative Assistant 1.00 1.00 1.003505000 FD05 2125 F Fire Battalion Chief (D) 1.00 1.00 1.003505000 FD05 2135 F Deputy Fire Marshal 1.00 1.00 1.003505000 FD05 2140 F Fire Marshal 1.00 0.00 0.003505000 FD05 7197 F Fire Plan Check Engineer 2.00 2.00 2.003505000 FD05 7760 F Fire Safety Inspector II 5.00 5.00 5.003505000 FD05 7761 F Fire Safety Inspector II (T) 1.00 1.00 1.003505000 FD05 7780 F Senior Fire Safety Inspector 1.00 1.00 1.00
Total 14.00 13.00 13.00
Fire Department / Operations
Full Time3510000 FD10 2040 F Firefighter (S)* - Paramedic 54.00 51.00 51.003510000 FD10 2040 F Firefighter (S) 51.00 51.00 51.003510000 FD10 2070 F Fire Engineer 54.00 51.00 51.003510000 FD10 2090 F Fire Captain (S) 54.00 51.00 51.003510000 FD10 2100 F Fire Captain (D) 1.00 0.00 0.003510000 FD10 2120 F Fire Battalion Chief (S) 6.00 6.00 6.003510000 FD10 9325 F Emergency Medical Services Coordinator 1.00 1.00 1.00
Total 221.00 211.00 211.00
I-11

Authorized Amended AmendedGL Key Loc Job Type Job Title 2015/16 2016/17 2017/18
AMENDED CITYWIDE PERSONNEL DETAIL June 20, 2017Full Time Equivalent
PCN
Fire Department / Special Services
Full Time3515000 FD15 0082 F Senior Office Specialist 1.00 1.00 1.003515000 FD15 2050 F Firefighter (D) 1.00 0.00 0.003515000 FD15 2580 F Emergency Services Coordinator 1.00 1.00 1.003515000 FD15 2585 F Emergency Services Administrator (NC) 1.00 1.00 1.00
Total 4.00 3.00 3.00
Fire Department / Training
Full Time3520000 FD20 0082 F Senior Office Specialist 1.00 1.00 1.003520000 FD20 2100 F Fire Captain (D) 2.00 1.00 1.003520000 FD20 2125 F Fire Battalion Chief (D) 1.00 0.00 0.003520000 FD20 7750 F Fire Safety Inspector I 1.00 1.00 1.003520000 FD20 9660 F Communications Technician 1.00 0.00 0.00
Total 6.00 3.00 3.00
Department Subtotal 255.00 239.00 239.00
Measure Z: Fire Department / Operations
Full Time3510009 FD10Z 2100 F Fire Captain (D) 0.00 0.00 1.00
Total 0.00 0.00 1.00
Measure Z: Fire Department / TrainingFull Time3520009 FD20Z 2100 F Fire Captain (D) 0.00 0.00 1.003520009 FD20Z 2125 F Fire Battalion Chief (D) 0.00 0.00 1.00
Total 0.00 0.00 2.00
Measure Z Subtotal 0.00 0.00 3.00
Department Grand Total 255.00 239.00 242.00
I-12
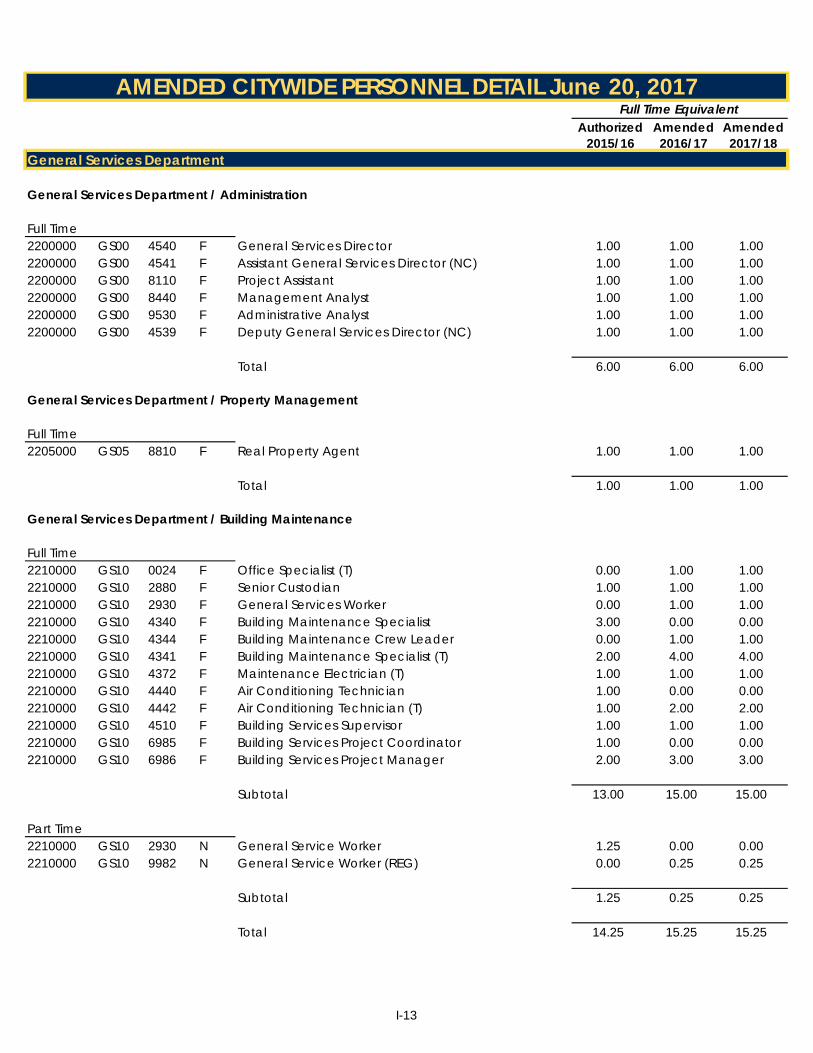
Authorized Amended AmendedGL Key Loc Job Type Job Title 2015/16 2016/17 2017/18
AMENDED CITYWIDE PERSONNEL DETAIL June 20, 2017Full Time Equivalent
PCN
General Services Department
General Services Department / Administration
Full Time2200000 GS00 4540 F General Services Director 1.00 1.00 1.002200000 GS00 4541 F Assistant General Services Director (NC) 1.00 1.00 1.002200000 GS00 8110 F Project Assistant 1.00 1.00 1.002200000 GS00 8440 F Management Analyst 1.00 1.00 1.002200000 GS00 9530 F Administrative Analyst 1.00 1.00 1.002200000 GS00 4539 F Deputy General Services Director (NC) 1.00 1.00 1.00
Total 6.00 6.00 6.00
General Services Department / Property Management
Full Time2205000 GS05 8810 F Real Property Agent 1.00 1.00 1.00
Total 1.00 1.00 1.00
General Services Department / Building Maintenance
Full Time2210000 GS10 0024 F Office Specialist (T) 0.00 1.00 1.002210000 GS10 2880 F Senior Custodian 1.00 1.00 1.002210000 GS10 2930 F General Services Worker 0.00 1.00 1.002210000 GS10 4340 F Building Maintenance Specialist 3.00 0.00 0.002210000 GS10 4344 F Building Maintenance Crew Leader 0.00 1.00 1.002210000 GS10 4341 F Building Maintenance Specialist (T) 2.00 4.00 4.002210000 GS10 4372 F Maintenance Electrician (T) 1.00 1.00 1.002210000 GS10 4440 F Air Conditioning Technician 1.00 0.00 0.002210000 GS10 4442 F Air Conditioning Technician (T) 1.00 2.00 2.002210000 GS10 4510 F Building Services Supervisor 1.00 1.00 1.002210000 GS10 6985 F Building Services Project Coordinator 1.00 0.00 0.002210000 GS10 6986 F Building Services Project Manager 2.00 3.00 3.00
Subtotal 13.00 15.00 15.00
Part Time2210000 GS10 2930 N General Service Worker 1.25 0.00 0.002210000 GS10 9982 N General Service Worker (REG) 0.00 0.25 0.25
Subtotal 1.25 0.25 0.25
Total 14.25 15.25 15.25
I-13
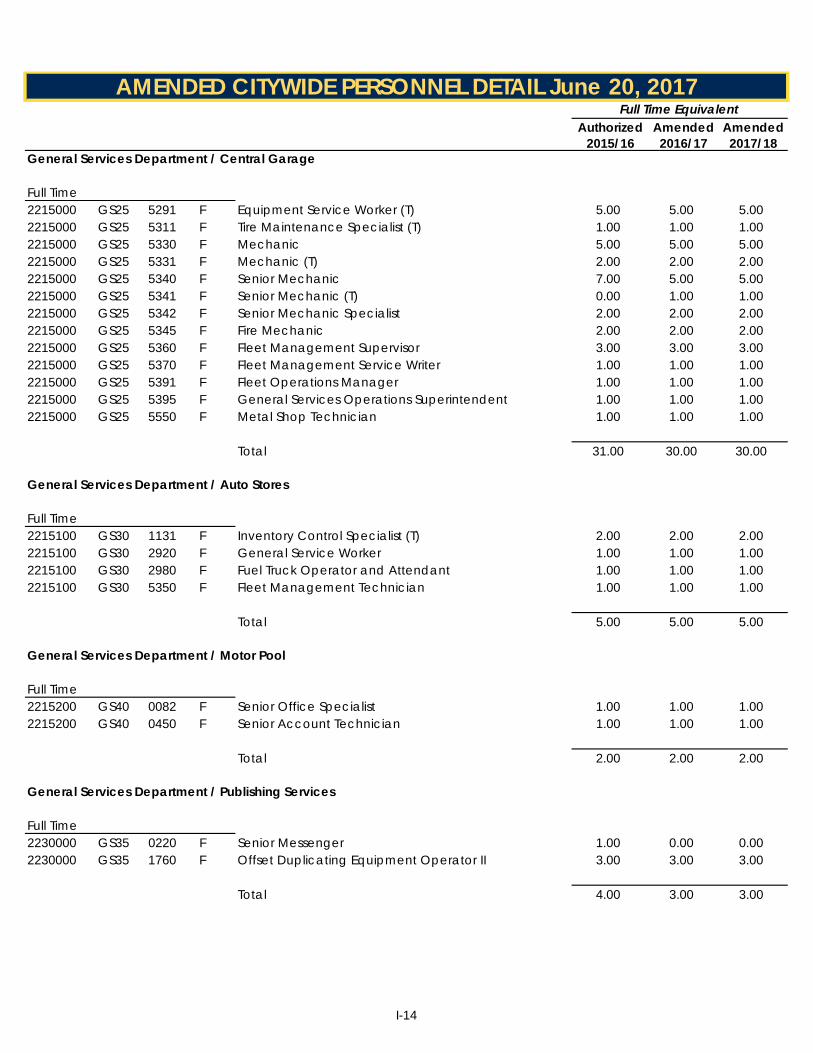
Authorized Amended AmendedGL Key Loc Job Type Job Title 2015/16 2016/17 2017/18
AMENDED CITYWIDE PERSONNEL DETAIL June 20, 2017Full Time Equivalent
PCN
General Services Department / Central Garage
Full Time2215000 GS25 5291 F Equipment Service Worker (T) 5.00 5.00 5.002215000 GS25 5311 F Tire Maintenance Specialist (T) 1.00 1.00 1.002215000 GS25 5330 F Mechanic 5.00 5.00 5.002215000 GS25 5331 F Mechanic (T) 2.00 2.00 2.002215000 GS25 5340 F Senior Mechanic 7.00 5.00 5.002215000 GS25 5341 F Senior Mechanic (T) 0.00 1.00 1.002215000 GS25 5342 F Senior Mechanic Specialist 2.00 2.00 2.002215000 GS25 5345 F Fire Mechanic 2.00 2.00 2.002215000 GS25 5360 F Fleet Management Supervisor 3.00 3.00 3.002215000 GS25 5370 F Fleet Management Service Writer 1.00 1.00 1.002215000 GS25 5391 F Fleet Operations Manager 1.00 1.00 1.002215000 GS25 5395 F General Services Operations Superintendent 1.00 1.00 1.002215000 GS25 5550 F Metal Shop Technician 1.00 1.00 1.00
Total 31.00 30.00 30.00
General Services Department / Auto Stores
Full Time2215100 GS30 1131 F Inventory Control Specialist (T) 2.00 2.00 2.002215100 GS30 2920 F General Service Worker 1.00 1.00 1.002215100 GS30 2980 F Fuel Truck Operator and Attendant 1.00 1.00 1.002215100 GS30 5350 F Fleet Management Technician 1.00 1.00 1.00
Total 5.00 5.00 5.00
General Services Department / Motor Pool
Full Time2215200 GS40 0082 F Senior Office Specialist 1.00 1.00 1.002215200 GS40 0450 F Senior Account Technician 1.00 1.00 1.00
Total 2.00 2.00 2.00
General Services Department / Publishing Services
Full Time2230000 GS35 0220 F Senior Messenger 1.00 0.00 0.002230000 GS35 1760 F Offset Duplicating Equipment Operator II 3.00 3.00 3.00
Total 4.00 3.00 3.00
I-14
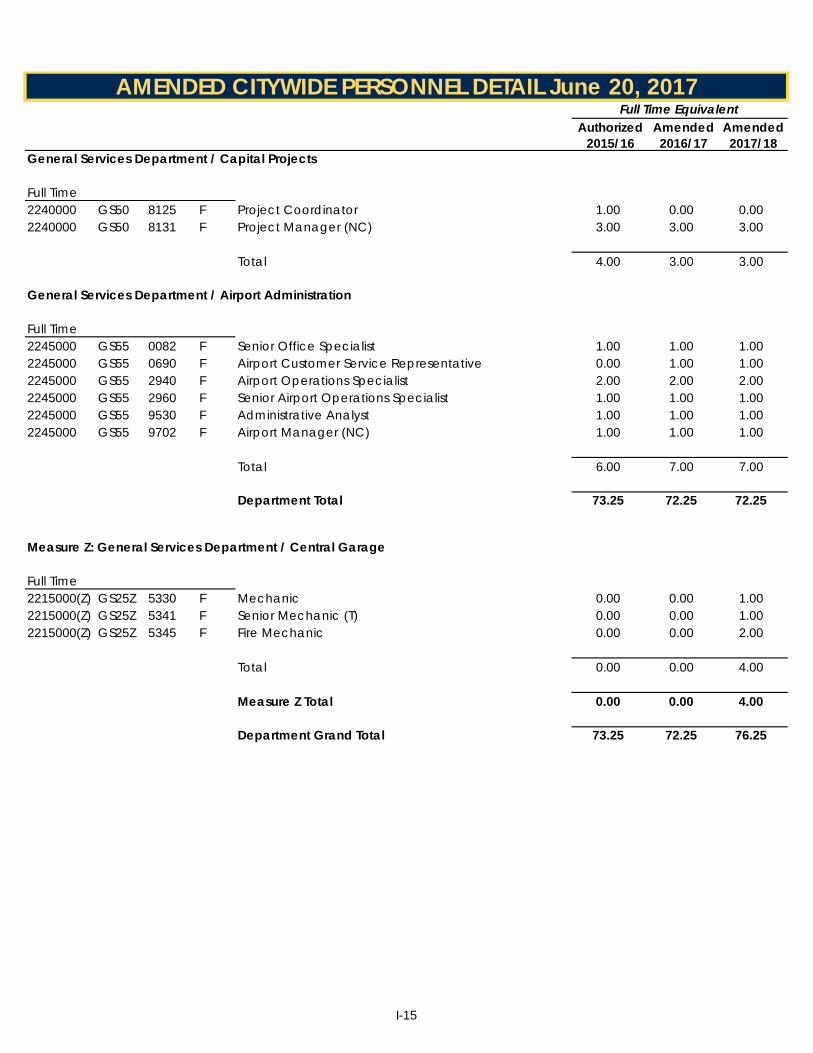
Authorized Amended AmendedGL Key Loc Job Type Job Title 2015/16 2016/17 2017/18
AMENDED CITYWIDE PERSONNEL DETAIL June 20, 2017Full Time Equivalent
PCN
General Services Department / Capital Projects
Full Time2240000 GS50 8125 F Project Coordinator 1.00 0.00 0.002240000 GS50 8131 F Project Manager (NC) 3.00 3.00 3.00
Total 4.00 3.00 3.00
General Services Department / Airport Administration
Full Time2245000 GS55 0082 F Senior Office Specialist 1.00 1.00 1.002245000 GS55 0690 F Airport Customer Service Representative 0.00 1.00 1.002245000 GS55 2940 F Airport Operations Specialist 2.00 2.00 2.002245000 GS55 2960 F Senior Airport Operations Specialist 1.00 1.00 1.002245000 GS55 9530 F Administrative Analyst 1.00 1.00 1.002245000 GS55 9702 F Airport Manager (NC) 1.00 1.00 1.00
Total 6.00 7.00 7.00
Department Total 73.25 72.25 72.25
Measure Z: General Services Department / Central Garage
Full Time2215000(Z) GS25Z 5330 F Mechanic 0.00 0.00 1.002215000(Z) GS25Z 5341 F Senior Mechanic (T) 0.00 0.00 1.002215000(Z) GS25Z 5345 F Fire Mechanic 0.00 0.00 2.00
Total 0.00 0.00 4.00
Measure Z Total 0.00 0.00 4.00
Department Grand Total 73.25 72.25 76.25
I-15
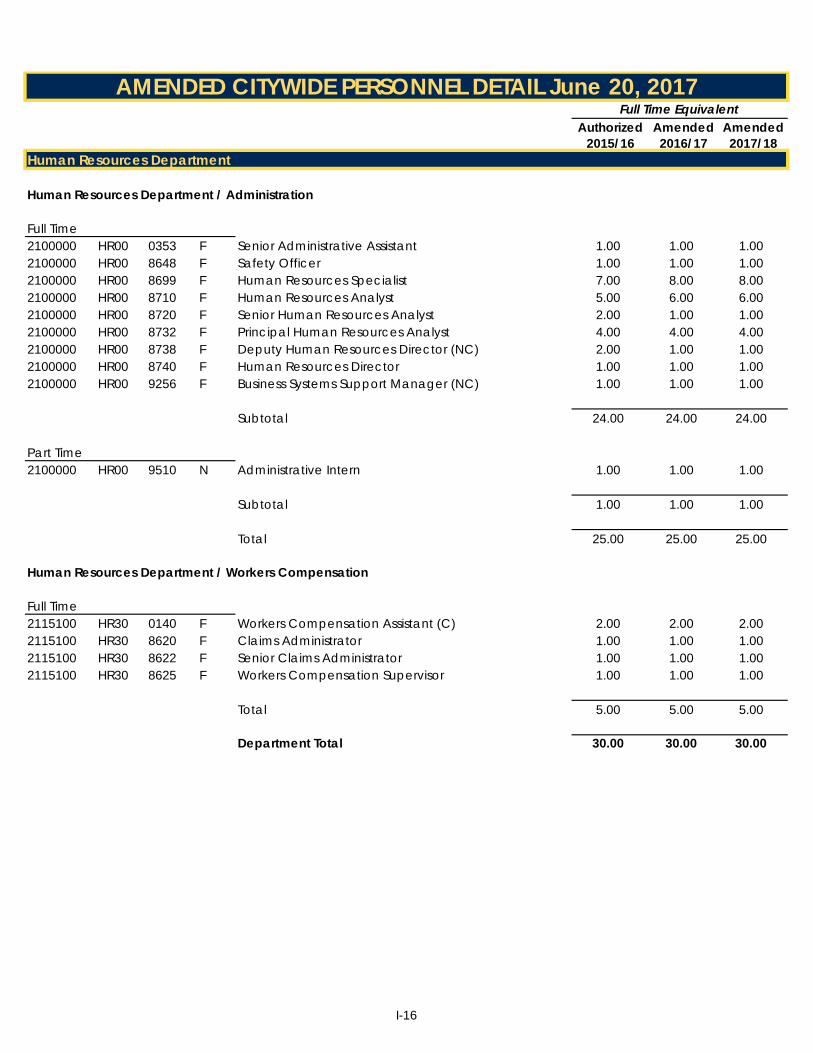
Authorized Amended AmendedGL Key Loc Job Type Job Title 2015/16 2016/17 2017/18
AMENDED CITYWIDE PERSONNEL DETAIL June 20, 2017Full Time Equivalent
PCN
Human Resources Department
Human Resources Department / Administration
Full Time2100000 HR00 0353 F Senior Administrative Assistant 1.00 1.00 1.002100000 HR00 8648 F Safety Officer 1.00 1.00 1.002100000 HR00 8699 F Human Resources Specialist 7.00 8.00 8.002100000 HR00 8710 F Human Resources Analyst 5.00 6.00 6.002100000 HR00 8720 F Senior Human Resources Analyst 2.00 1.00 1.002100000 HR00 8732 F Principal Human Resources Analyst 4.00 4.00 4.002100000 HR00 8738 F Deputy Human Resources Director (NC) 2.00 1.00 1.002100000 HR00 8740 F Human Resources Director 1.00 1.00 1.002100000 HR00 9256 F Business Systems Support Manager (NC) 1.00 1.00 1.00
Subtotal 24.00 24.00 24.00
Part Time2100000 HR00 9510 N Administrative Intern 1.00 1.00 1.00
Subtotal 1.00 1.00 1.00
Total 25.00 25.00 25.00
Human Resources Department / Workers Compensation
Full Time2115100 HR30 0140 F Workers Compensation Assistant (C) 2.00 2.00 2.002115100 HR30 8620 F Claims Administrator 1.00 1.00 1.002115100 HR30 8622 F Senior Claims Administrator 1.00 1.00 1.002115100 HR30 8625 F Workers Compensation Supervisor 1.00 1.00 1.00
Total 5.00 5.00 5.00
Department Total 30.00 30.00 30.00
I-16
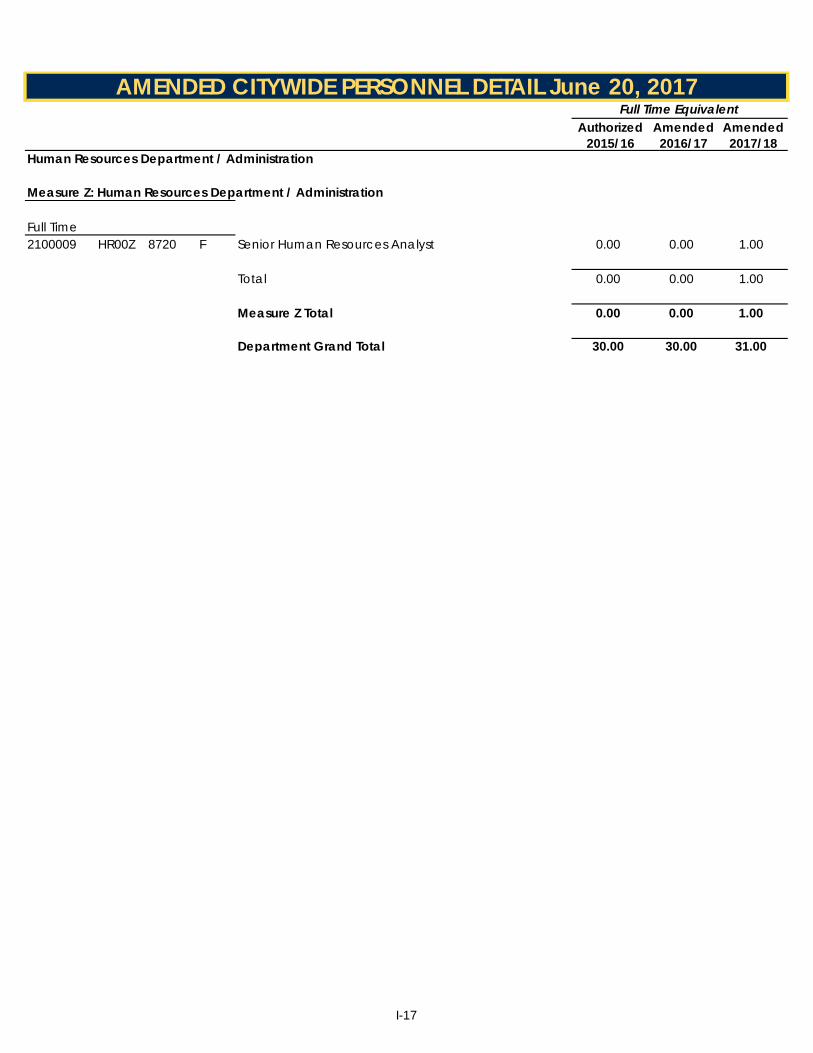
Authorized Amended AmendedGL Key Loc Job Type Job Title 2015/16 2016/17 2017/18
AMENDED CITYWIDE PERSONNEL DETAIL June 20, 2017Full Time Equivalent
PCN
Human Resources Department / Administration
Measure Z: Human Resources Department / Administration
Full Time2100009 HR00Z 8720 F Senior Human Resources Analyst 0.00 0.00 1.00
Total 0.00 0.00 1.00
Measure Z Total 0.00 0.00 1.00
Department Grand Total 30.00 30.00 31.00
I-17
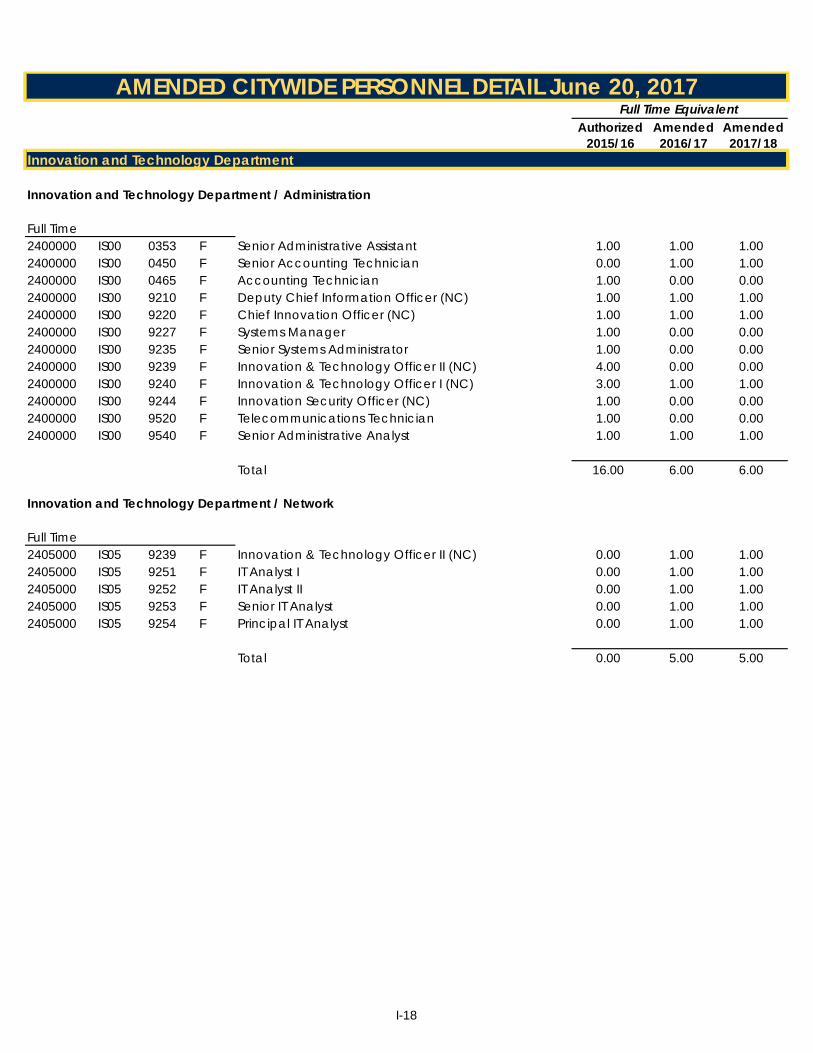
Authorized Amended AmendedGL Key Loc Job Type Job Title 2015/16 2016/17 2017/18
AMENDED CITYWIDE PERSONNEL DETAIL June 20, 2017Full Time Equivalent
PCN
Innovation and Technology Department
Innovation and Technology Department / Administration
Full Time2400000 IS00 0353 F Senior Administrative Assistant 1.00 1.00 1.002400000 IS00 0450 F Senior Accounting Technician 0.00 1.00 1.002400000 IS00 0465 F Accounting Technician 1.00 0.00 0.002400000 IS00 9210 F Deputy Chief Information Officer (NC) 1.00 1.00 1.002400000 IS00 9220 F Chief Innovation Officer (NC) 1.00 1.00 1.002400000 IS00 9227 F Systems Manager 1.00 0.00 0.002400000 IS00 9235 F Senior Systems Administrator 1.00 0.00 0.002400000 IS00 9239 F Innovation & Technology Officer II (NC) 4.00 0.00 0.002400000 IS00 9240 F Innovation & Technology Officer I (NC) 3.00 1.00 1.002400000 IS00 9244 F Innovation Security Officer (NC) 1.00 0.00 0.002400000 IS00 9520 F Telecommunications Technician 1.00 0.00 0.002400000 IS00 9540 F Senior Administrative Analyst 1.00 1.00 1.00
Total 16.00 6.00 6.00
Innovation and Technology Department / Network
Full Time2405000 IS05 9239 F Innovation & Technology Officer II (NC) 0.00 1.00 1.002405000 IS05 9251 F IT Analyst I 0.00 1.00 1.002405000 IS05 9252 F IT Analyst II 0.00 1.00 1.002405000 IS05 9253 F Senior IT Analyst 0.00 1.00 1.002405000 IS05 9254 F Principal IT Analyst 0.00 1.00 1.00
Total 0.00 5.00 5.00
I-18

Authorized Amended AmendedGL Key Loc Job Type Job Title 2015/16 2016/17 2017/18
AMENDED CITYWIDE PERSONNEL DETAIL June 20, 2017Full Time Equivalent
PCN
Innovation and Technology Department / Operations
Full Time2410000 IS10 9227 F Systems Manager (NC) 0.00 1.00 1.002410000 IS10 9239 F Innovation & Technology Officer II (NC) 0.00 1.00 1.002410000 IS10 9252 F IT Analyst II 0.00 1.00 1.002410000 IS10 9253 F Senior IT Analyst 0.00 2.00 2.002410000 IS10 9254 F Principal IT Analyst 0.00 4.00 4.00
Total 0.00 9.00 9.00
Innovation and Technology Department / Applications
Full Time2415000 IS15 9239 F Innovation & Technology Officer II (NC) 0.00 1.00 1.002415000 IS15 9251 F IT Analyst I 0.00 2.00 2.002415000 IS15 9252 F IT Analyst II 0.00 7.00 7.002415000 IS15 9253 F Senior IT Analyst 0.00 6.00 6.002415000 IS15 9254 F Principal IT Analyst 0.00 4.00 4.00
Total 0.00 20.00 20.00
Innovation and Technology Department / Client Services
Full Time2420000 IS20 9240 F Innovation & Technology Officer I (NC) 0.00 1.00 1.002420000 IS20 9247 F IT Technician I 0.00 3.00 3.002420000 IS20 9248 F IT Technician II 0.00 5.00 5.002420000 IS20 9249 F Senior IT Technician 0.00 3.00 3.00
Total 0.00 12.00 12.00
Innovation and Technology Department / Cybersecurity
Full Time2425000 IS25 9244 F Innovation Security Officer (NC) (5) 0.00 1.00 1.002425000 IS25 9253 F Senior IT Analyst 0.00 1.00 1.00
Total 0.00 2.00 2.00
I-19

Authorized Amended AmendedGL Key Loc Job Type Job Title 2015/16 2016/17 2017/18
AMENDED CITYWIDE PERSONNEL DETAIL June 20, 2017Full Time Equivalent
PCN
Innovation and Technology Department / GIS
Full Time2430000 IS30 9240 F Innovation & Technology Officer I (NC) 0.00 1.00 1.002430000 IS30 9259 F GIS Analyst 0.00 1.00 1.002430000 IS30 9264 F Senior GIS Analyst 0.00 1.00 1.00
Subtotal 0.00 3.00 3.00
Part Time2430000 IS30 9264 N Senior GIS Analyst 0.00 0.25 0.25
Subtotal 0.00 0.25 0.25
Total 0.00 3.25 3.25
Innovation and Technology Department / Project Management
Full Time2435000 IS35 9239 F Innovation & Technology Officer II (NC) 0.00 1.00 1.00
Total 0.00 1.00 1.00
Department Total 16.00 58.25 58.25
I-20
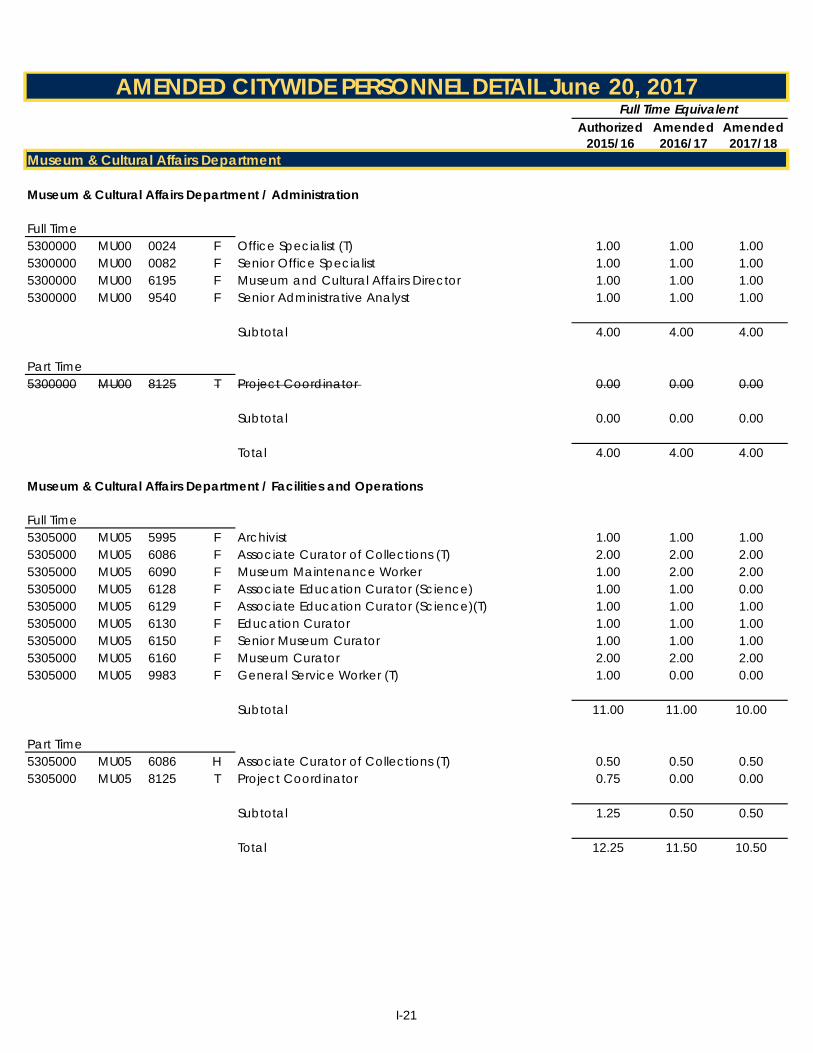
Authorized Amended AmendedGL Key Loc Job Type Job Title 2015/16 2016/17 2017/18
AMENDED CITYWIDE PERSONNEL DETAIL June 20, 2017Full Time Equivalent
PCN
Museum & Cultural Affairs Department
Museum & Cultural Affairs Department / Administration
Full Time5300000 MU00 0024 F Office Specialist (T) 1.00 1.00 1.005300000 MU00 0082 F Senior Office Specialist 1.00 1.00 1.005300000 MU00 6195 F Museum and Cultural Affairs Director 1.00 1.00 1.005300000 MU00 9540 F Senior Administrative Analyst 1.00 1.00 1.00
Subtotal 4.00 4.00 4.00
Part Time5300000 MU00 8125 T Project Coordinator 0.00 0.00 0.00
Subtotal 0.00 0.00 0.00
Total 4.00 4.00 4.00
Museum & Cultural Affairs Department / Facilities and Operations
Full Time5305000 MU05 5995 F Archivist 1.00 1.00 1.005305000 MU05 6086 F Associate Curator of Collections (T) 2.00 2.00 2.005305000 MU05 6090 F Museum Maintenance Worker 1.00 2.00 2.005305000 MU05 6128 F Associate Education Curator (Science) 1.00 1.00 0.005305000 MU05 6129 F Associate Education Curator (Science)(T) 1.00 1.00 1.005305000 MU05 6130 F Education Curator 1.00 1.00 1.005305000 MU05 6150 F Senior Museum Curator 1.00 1.00 1.005305000 MU05 6160 F Museum Curator 2.00 2.00 2.005305000 MU05 9983 F General Service Worker (T) 1.00 0.00 0.00
Subtotal 11.00 11.00 10.00
Part Time5305000 MU05 6086 H Associate Curator of Collections (T) 0.50 0.50 0.505305000 MU05 8125 T Project Coordinator 0.75 0.00 0.00
Subtotal 1.25 0.50 0.50
Total 12.25 11.50 10.50
I-21
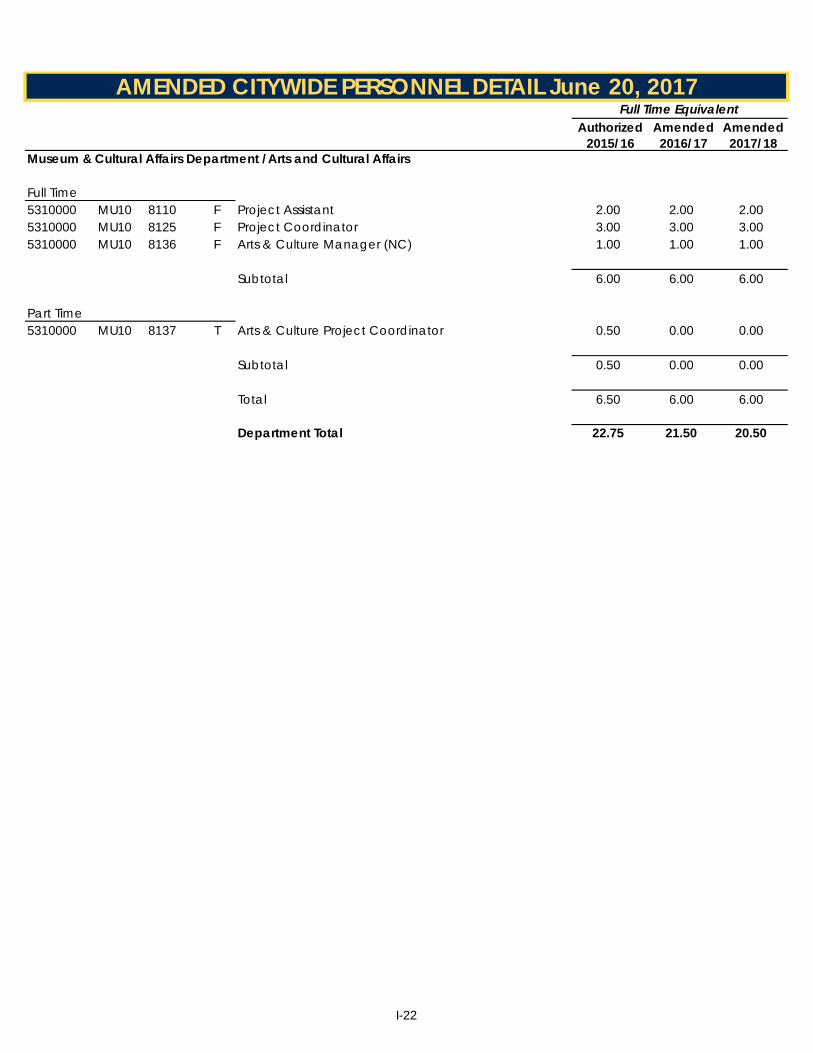
Authorized Amended AmendedGL Key Loc Job Type Job Title 2015/16 2016/17 2017/18
AMENDED CITYWIDE PERSONNEL DETAIL June 20, 2017Full Time Equivalent
PCN
Museum & Cultural Affairs Department /Arts and Cultural Affairs
Full Time5310000 MU10 8110 F Project Assistant 2.00 2.00 2.005310000 MU10 8125 F Project Coordinator 3.00 3.00 3.005310000 MU10 8136 F Arts & Culture Manager (NC) 1.00 1.00 1.00
Subtotal 6.00 6.00 6.00
Part Time5310000 MU10 8137 T Arts & Culture Project Coordinator 0.50 0.00 0.00
Subtotal 0.50 0.00 0.00
Total 6.50 6.00 6.00
Department Total 22.75 21.50 20.50
I-22
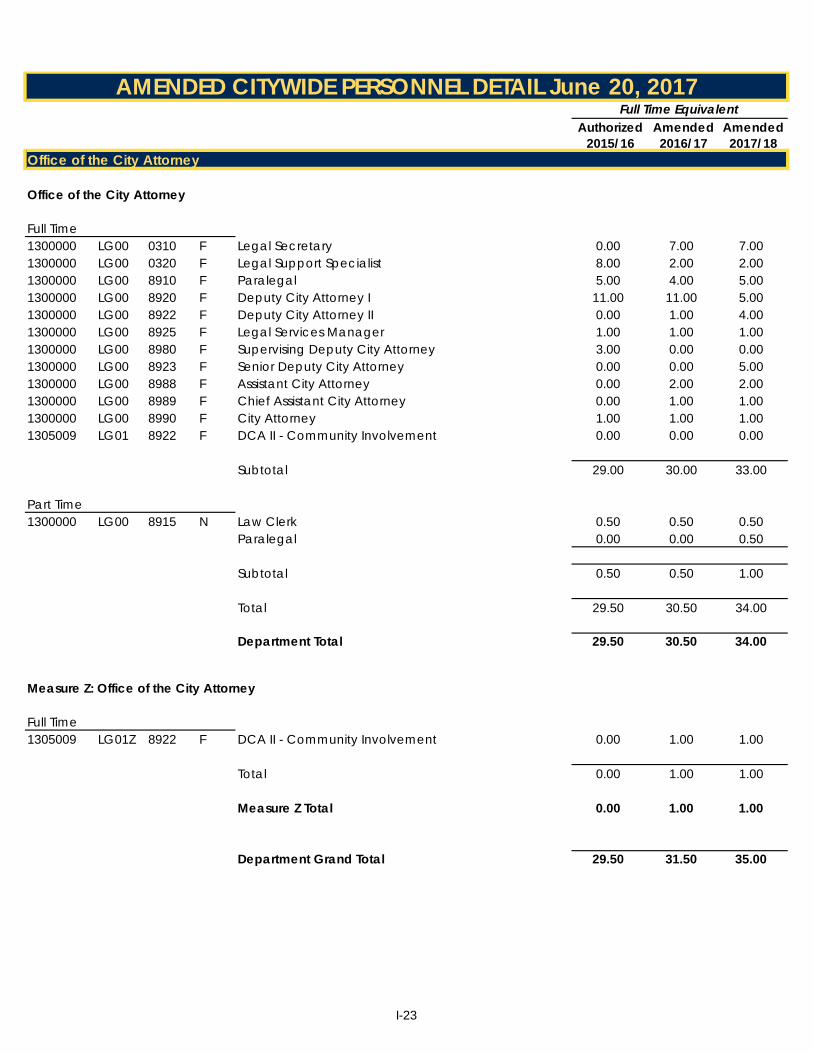
Authorized Amended AmendedGL Key Loc Job Type Job Title 2015/16 2016/17 2017/18
AMENDED CITYWIDE PERSONNEL DETAIL June 20, 2017Full Time Equivalent
PCN
Office of the City Attorney
Office of the City Attorney
Full Time1300000 LG00 0310 F Legal Secretary 0.00 7.00 7.001300000 LG00 0320 F Legal Support Specialist 8.00 2.00 2.001300000 LG00 8910 F Paralegal 5.00 4.00 5.001300000 LG00 8920 F Deputy City Attorney I 11.00 11.00 5.001300000 LG00 8922 F Deputy City Attorney II 0.00 1.00 4.001300000 LG00 8925 F Legal Services Manager 1.00 1.00 1.001300000 LG00 8980 F Supervising Deputy City Attorney 3.00 0.00 0.001300000 LG00 8923 F Senior Deputy City Attorney 0.00 0.00 5.001300000 LG00 8988 F Assistant City Attorney 0.00 2.00 2.001300000 LG00 8989 F Chief Assistant City Attorney 0.00 1.00 1.001300000 LG00 8990 F City Attorney 1.00 1.00 1.001305009 LG01 8922 F DCA II - Community Involvement 0.00 0.00 0.00
Subtotal 29.00 30.00 33.00
Part Time1300000 LG00 8915 N Law Clerk 0.50 0.50 0.50
Paralegal 0.00 0.00 0.50
Subtotal 0.50 0.50 1.00
Total 29.50 30.50 34.00
Department Total 29.50 30.50 34.00
Measure Z: Office of the City Attorney
Full Time1305009 LG01Z 8922 F DCA II - Community Involvement 0.00 1.00 1.00
Total 0.00 1.00 1.00
Measure Z Total 0.00 1.00 1.00
Department Grand Total 29.50 31.50 35.00
I-23

Authorized Amended AmendedGL Key Loc Job Type Job Title 2015/16 2016/17 2017/18
AMENDED CITYWIDE PERSONNEL DETAIL June 20, 2017Full Time Equivalent
PCN
Office of the City Clerk
Office of the City Clerk / Administration and Support
Full Time1200000 CK00 0115 F City Clerk Specialist (C) 4.00 4.00 4.001200000 CK00 0117 F Deputy City Clerk (C) 4.00 4.00 4.001200000 CK00 0131 F Assistant City Clerk (NC) 1.00 1.00 1.001200000 CK00 9720 F City Clerk 1.00 1.00 1.00
Total 10.00 10.00 10.00
Department Total 10.00 10.00 10.00
I-24
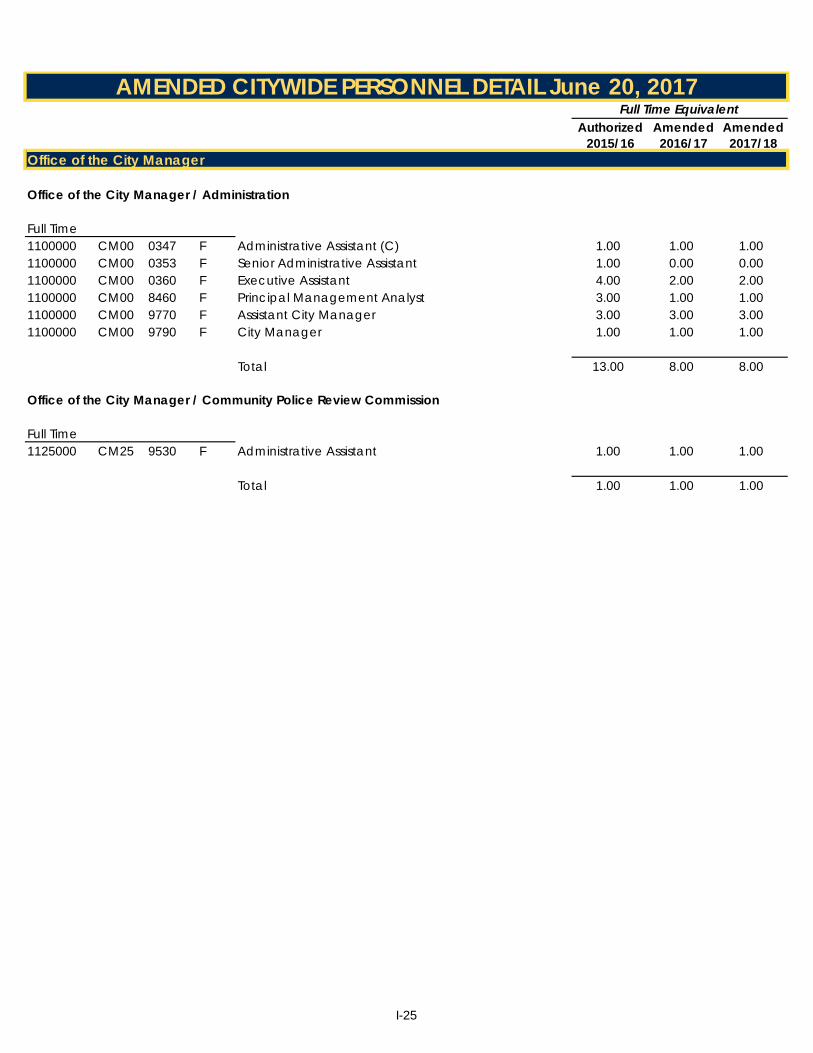
Authorized Amended AmendedGL Key Loc Job Type Job Title 2015/16 2016/17 2017/18
AMENDED CITYWIDE PERSONNEL DETAIL June 20, 2017Full Time Equivalent
PCN
Office of the City Manager
Office of the City Manager / Administration
Full Time1100000 CM00 0347 F Administrative Assistant (C) 1.00 1.00 1.001100000 CM00 0353 F Senior Administrative Assistant 1.00 0.00 0.001100000 CM00 0360 F Executive Assistant 4.00 2.00 2.001100000 CM00 8460 F Principal Management Analyst 3.00 1.00 1.001100000 CM00 9770 F Assistant City Manager 3.00 3.00 3.001100000 CM00 9790 F City Manager 1.00 1.00 1.00
Total 13.00 8.00 8.00
Office of the City Manager / Community Police Review Commission
Full Time1125000 CM25 9530 F Administrative Assistant 1.00 1.00 1.00
Total 1.00 1.00 1.00
I-25

Authorized Amended AmendedGL Key Loc Job Type Job Title 2015/16 2016/17 2017/18
AMENDED CITYWIDE PERSONNEL DETAIL June 20, 2017Full Time Equivalent
PCN
Office of the City Manager / Communications Office
Full Time1140000 CM35 7802 F Principal Graphics Technician 1.00 1.00 1.001140000 CM35 7803 F Graphics Technician 0.00 1.00 1.001140000 CM35 8110 F Project Assistant 0.50 1.00 1.001140000 CM35 8125 F Project Coordinator 1.00 1.00 1.001140000 CM35 8151 F Economic Development Marketing Manager (NC) 1.00 1.00 1.001140000 CM35 8153 F Seizing Our Destiny Project Coordinator (NC) 1.00 0.00 0.001140000 CM35 9161 F Web Designer 0.00 1.00 1.001140000 CM35 9650 F Public Information Officer 1.00 0.00 0.001140000 CM35 9651 F Intergovernmental and Communications Officer (NC) 1.00 0.00 0.001140000 CM35 9661 F Senior Communications Technician 1.00 1.00 1.001140000 CM35 9662 F Communications Technician 0.00 0.00 0.00
Subtotal 7.50 7.00 7.00
Part Time1140000 CM35 9300 N Extra Help 0.00 0.20 1.101140000 CM35 9510 N Administrative Intern 0.50 0.00 0.001140000 CM35 9662 H Communications Technician (T) 1.49 2.60 1.45
Subtotal 1.99 2.80 2.55
Total 9.49 9.80 9.55
Office of the City Manager / Internal Audit
Full Time1145000 CM37 8313 F Senior Internal Auditor 1.00 1.00 1.001145000 CM37 8316 F Internal Audit Manager (NC) 1.00 1.00 1.00
Total 2.00 2.00 2.00
Office of the City Manager / Public Relations
Full Time1150000 CM35 9653 F Communications Officer 0.00 1.00 1.00
Total 0.00 1.00 1.00
I-26

Authorized Amended AmendedGL Key Loc Job Type Job Title 2015/16 2016/17 2017/18
AMENDED CITYWIDE PERSONNEL DETAIL June 20, 2017Full Time Equivalent
PCN
Office of the City Manager / Intergovernmental Relations
Full Time1155000 CM35 9652 F Intergovernmental and Communications Officer (NC) 1.00 1.00 1.00
Total 1.00 1.00 1.00
Department Total 26.49 22.80 22.55
MeasureZ: Office of the City Manager / Administration
Full Time1100009 CM00Z 8460 F Principal Management Analyst 0.00 0.00 1.001100009 F Ward Action Team Community Advocate 0.00 0.00 1.00
Total 0.00 0.00 2.00
Measure Z Total 0.00 0.00 2.00
Department Grand Total 26.49 22.80 24.55
I-27
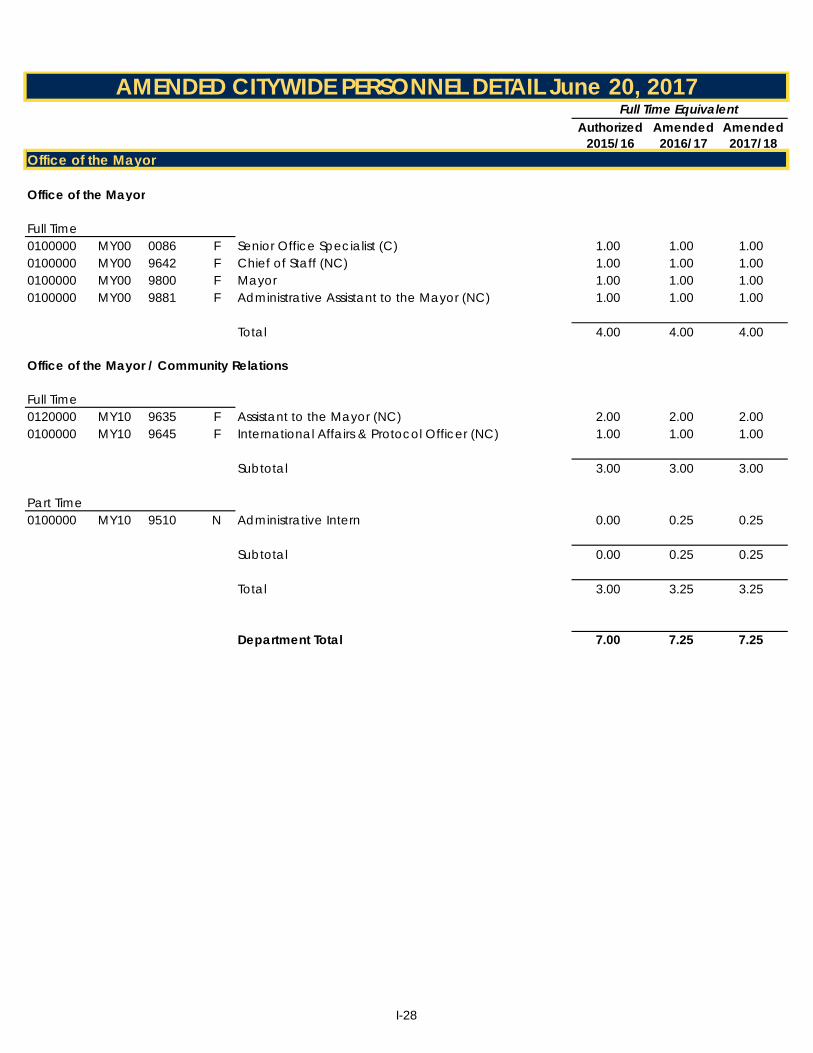
Authorized Amended AmendedGL Key Loc Job Type Job Title 2015/16 2016/17 2017/18
AMENDED CITYWIDE PERSONNEL DETAIL June 20, 2017Full Time Equivalent
PCN
Office of the Mayor
Office of the Mayor
Full Time0100000 MY00 0086 F Senior Office Specialist (C) 1.00 1.00 1.000100000 MY00 9642 F Chief of Staff (NC) 1.00 1.00 1.000100000 MY00 9800 F Mayor 1.00 1.00 1.000100000 MY00 9881 F Administrative Assistant to the Mayor (NC) 1.00 1.00 1.00
Total 4.00 4.00 4.00
Office of the Mayor / Community Relations
Full Time0120000 MY10 9635 F Assistant to the Mayor (NC) 2.00 2.00 2.000100000 MY10 9645 F International Affairs & Protocol Officer (NC) 1.00 1.00 1.00
Subtotal 3.00 3.00 3.00
Part Time0100000 MY10 9510 N Administrative Intern 0.00 0.25 0.25
Subtotal 0.00 0.25 0.25
Total 3.00 3.25 3.25
Department Total 7.00 7.25 7.25
I-28
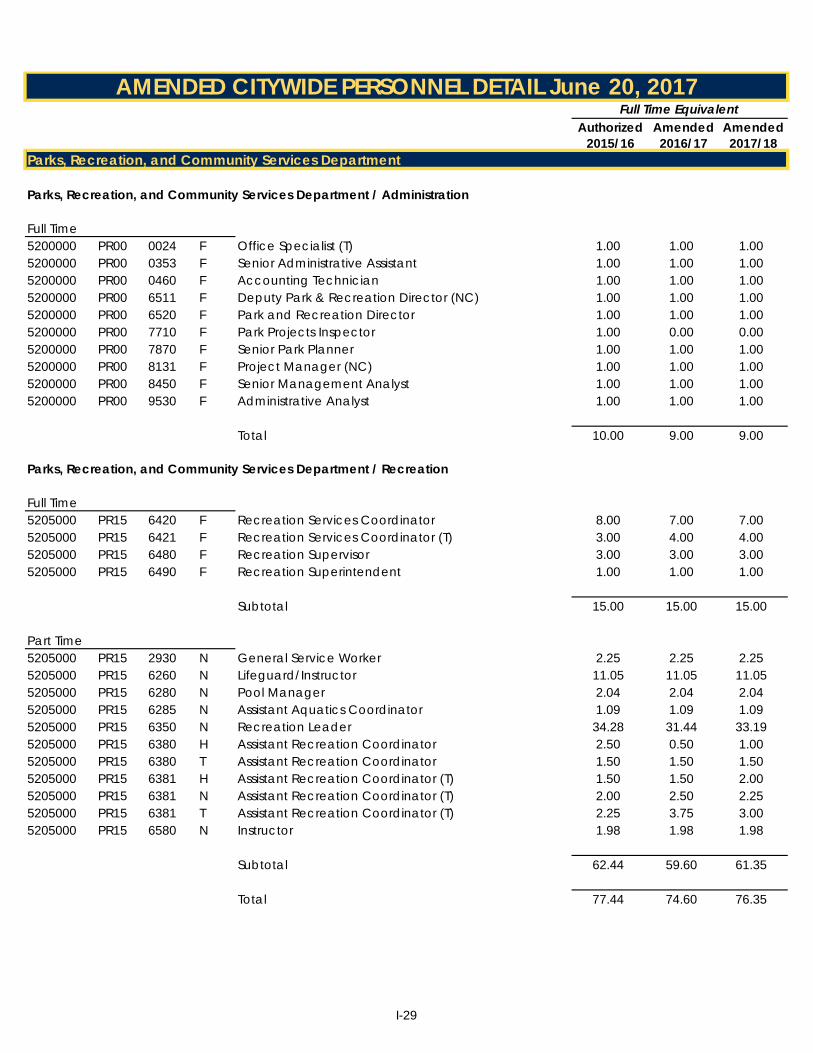
Authorized Amended AmendedGL Key Loc Job Type Job Title 2015/16 2016/17 2017/18
AMENDED CITYWIDE PERSONNEL DETAIL June 20, 2017Full Time Equivalent
PCN
Parks, Recreation, and Community Services Department
Parks, Recreation, and Community Services Department / Administration
Full Time5200000 PR00 0024 F Office Specialist (T) 1.00 1.00 1.005200000 PR00 0353 F Senior Administrative Assistant 1.00 1.00 1.005200000 PR00 0460 F Accounting Technician 1.00 1.00 1.005200000 PR00 6511 F Deputy Park & Recreation Director (NC) 1.00 1.00 1.005200000 PR00 6520 F Park and Recreation Director 1.00 1.00 1.005200000 PR00 7710 F Park Projects Inspector 1.00 0.00 0.005200000 PR00 7870 F Senior Park Planner 1.00 1.00 1.005200000 PR00 8131 F Project Manager (NC) 1.00 1.00 1.005200000 PR00 8450 F Senior Management Analyst 1.00 1.00 1.005200000 PR00 9530 F Administrative Analyst 1.00 1.00 1.00
Total 10.00 9.00 9.00
Parks, Recreation, and Community Services Department / Recreation
Full Time5205000 PR15 6420 F Recreation Services Coordinator 8.00 7.00 7.005205000 PR15 6421 F Recreation Services Coordinator (T) 3.00 4.00 4.005205000 PR15 6480 F Recreation Supervisor 3.00 3.00 3.005205000 PR15 6490 F Recreation Superintendent 1.00 1.00 1.00
Subtotal 15.00 15.00 15.00
Part Time5205000 PR15 2930 N General Service Worker 2.25 2.25 2.255205000 PR15 6260 N Lifeguard/Instructor 11.05 11.05 11.055205000 PR15 6280 N Pool Manager 2.04 2.04 2.045205000 PR15 6285 N Assistant Aquatics Coordinator 1.09 1.09 1.095205000 PR15 6350 N Recreation Leader 34.28 31.44 33.195205000 PR15 6380 H Assistant Recreation Coordinator 2.50 0.50 1.005205000 PR15 6380 T Assistant Recreation Coordinator 1.50 1.50 1.505205000 PR15 6381 H Assistant Recreation Coordinator (T) 1.50 1.50 2.005205000 PR15 6381 N Assistant Recreation Coordinator (T) 2.00 2.50 2.255205000 PR15 6381 T Assistant Recreation Coordinator (T) 2.25 3.75 3.005205000 PR15 6580 N Instructor 1.98 1.98 1.98
Subtotal 62.44 59.60 61.35
Total 77.44 74.60 76.35
I-29
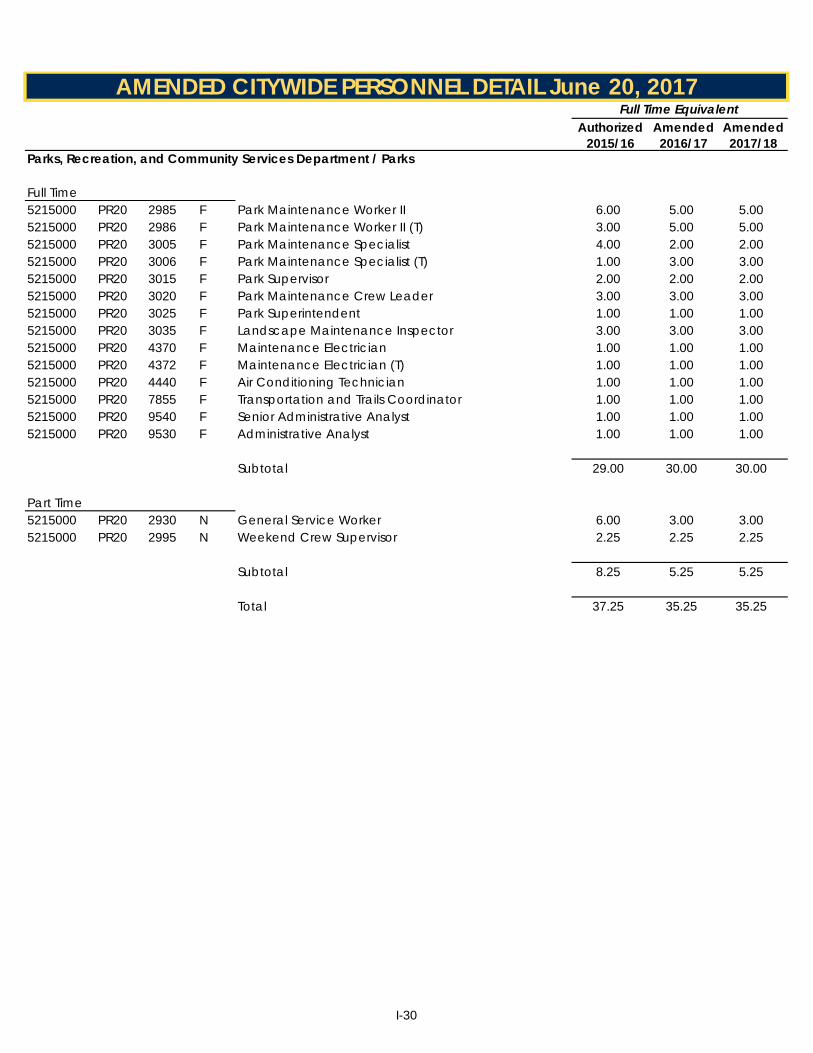
Authorized Amended AmendedGL Key Loc Job Type Job Title 2015/16 2016/17 2017/18
AMENDED CITYWIDE PERSONNEL DETAIL June 20, 2017Full Time Equivalent
PCN
Parks, Recreation, and Community Services Department / Parks
Full Time5215000 PR20 2985 F Park Maintenance Worker II 6.00 5.00 5.005215000 PR20 2986 F Park Maintenance Worker II (T) 3.00 5.00 5.005215000 PR20 3005 F Park Maintenance Specialist 4.00 2.00 2.005215000 PR20 3006 F Park Maintenance Specialist (T) 1.00 3.00 3.005215000 PR20 3015 F Park Supervisor 2.00 2.00 2.005215000 PR20 3020 F Park Maintenance Crew Leader 3.00 3.00 3.005215000 PR20 3025 F Park Superintendent 1.00 1.00 1.005215000 PR20 3035 F Landscape Maintenance Inspector 3.00 3.00 3.005215000 PR20 4370 F Maintenance Electrician 1.00 1.00 1.005215000 PR20 4372 F Maintenance Electrician (T) 1.00 1.00 1.005215000 PR20 4440 F Air Conditioning Technician 1.00 1.00 1.005215000 PR20 7855 F Transportation and Trails Coordinator 1.00 1.00 1.005215000 PR20 9540 F Senior Administrative Analyst 1.00 1.00 1.005215000 PR20 9530 F Administrative Analyst 1.00 1.00 1.00
Subtotal 29.00 30.00 30.00
Part Time5215000 PR20 2930 N General Service Worker 6.00 3.00 3.005215000 PR20 2995 N Weekend Crew Supervisor 2.25 2.25 2.25
Subtotal 8.25 5.25 5.25
Total 37.25 35.25 35.25
I-30

Authorized Amended AmendedGL Key Loc Job Type Job Title 2015/16 2016/17 2017/18
AMENDED CITYWIDE PERSONNEL DETAIL June 20, 2017Full Time Equivalent
PCN
Parks, Recreation, and Community Services Department / Fairmount Park Golf Course
Full Time5215400 PR46 6480 F Recreation Supervisor 1.00 1.00 1.00
Subtotal 1.00 1.00 1.00
Part Time5215400 PR46 2930 N General Service Worker 1.75 0.50 0.505215400 PR46 6350 N Recreation Leader 0.00 0.75 0.755215400 PR46 6381 T Assistant Recreation Coordinator (T) 0.75 0.75 0.755215400 PR46 6580 N Instructor 1.25 1.75 1.75
Subtotal 3.75 3.75 3.75
Total 4.75 4.75 4.75
Parks, Recreation, and Community Services Department / Community Services
Full Time5225000 PR30 6420 F Recreation Services Coordinator 3.00 2.00 2.005225000 PR30 6421 F Recreation Services Coordinator (T) 2.00 3.00 4.005225000 PR30 6480 F Recreation Supervisor 2.00 2.00 2.005225000 PR30 6490 F Recreation Superintendent 1.00 1.00 1.005225000 PR30 8756 F Outreach Worker (NC) 1.00 1.00 1.005225000 PR30 8757 F Lead Outreach Worker (T) 0.00 1.00 1.00
Subtotal 9.00 10.00 11.00
Part Time5225000 PR30 6350 N Recreation Leader 9.99 12.83 12.835225000 PR30 6380 H Assistant Recreation Coordinator 0.50 0.50 0.505225000 PR30 6381 H Assistant Recreation Coordinator (T) 2.00 1.50 1.505225000 PR30 6580 N Instructor 2.30 2.30 2.30
Subtotal 14.79 17.13 17.13
Total 23.79 27.13 28.13
I-31
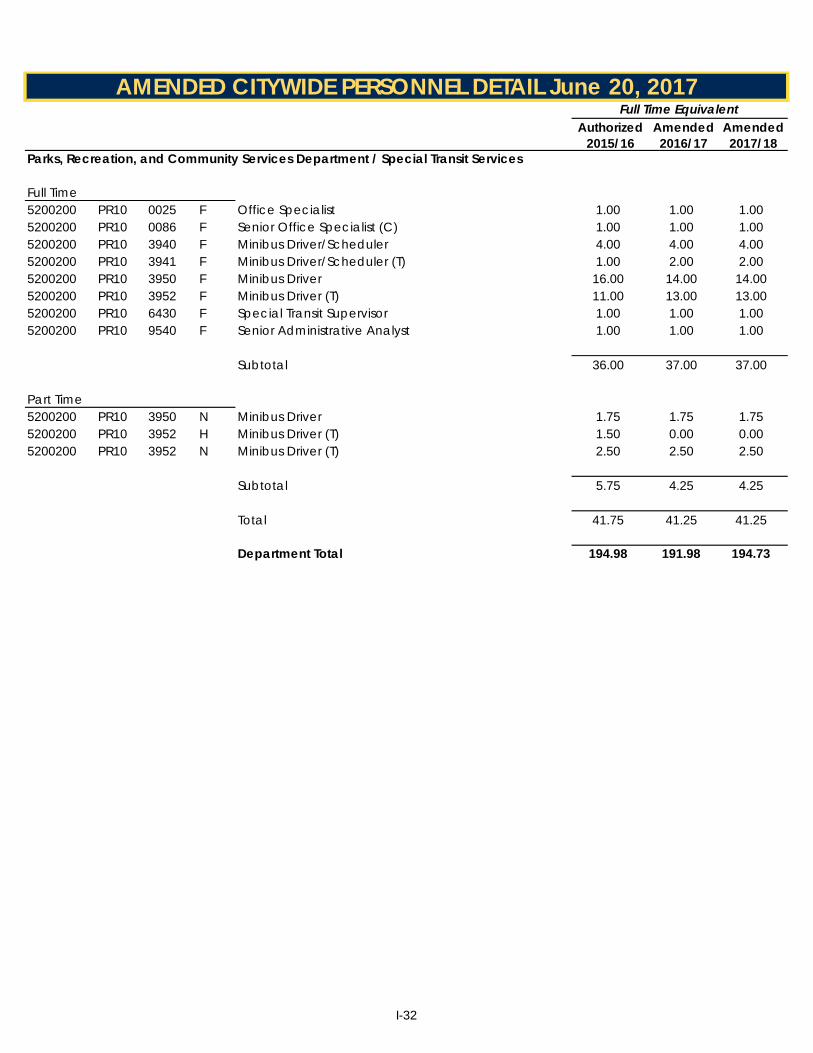
Authorized Amended AmendedGL Key Loc Job Type Job Title 2015/16 2016/17 2017/18
AMENDED CITYWIDE PERSONNEL DETAIL June 20, 2017Full Time Equivalent
PCN
Parks, Recreation, and Community Services Department / Special Transit Services
Full Time5200200 PR10 0025 F Office Specialist 1.00 1.00 1.005200200 PR10 0086 F Senior Office Specialist (C) 1.00 1.00 1.005200200 PR10 3940 F Minibus Driver/Scheduler 4.00 4.00 4.005200200 PR10 3941 F Minibus Driver/Scheduler (T) 1.00 2.00 2.005200200 PR10 3950 F Minibus Driver 16.00 14.00 14.005200200 PR10 3952 F Minibus Driver (T) 11.00 13.00 13.005200200 PR10 6430 F Special Transit Supervisor 1.00 1.00 1.005200200 PR10 9540 F Senior Administrative Analyst 1.00 1.00 1.00
Subtotal 36.00 37.00 37.00
Part Time5200200 PR10 3950 N Minibus Driver 1.75 1.75 1.755200200 PR10 3952 H Minibus Driver (T) 1.50 0.00 0.005200200 PR10 3952 N Minibus Driver (T) 2.50 2.50 2.50
Subtotal 5.75 4.25 4.25
Total 41.75 41.25 41.25
Department Total 194.98 191.98 194.73
I-32
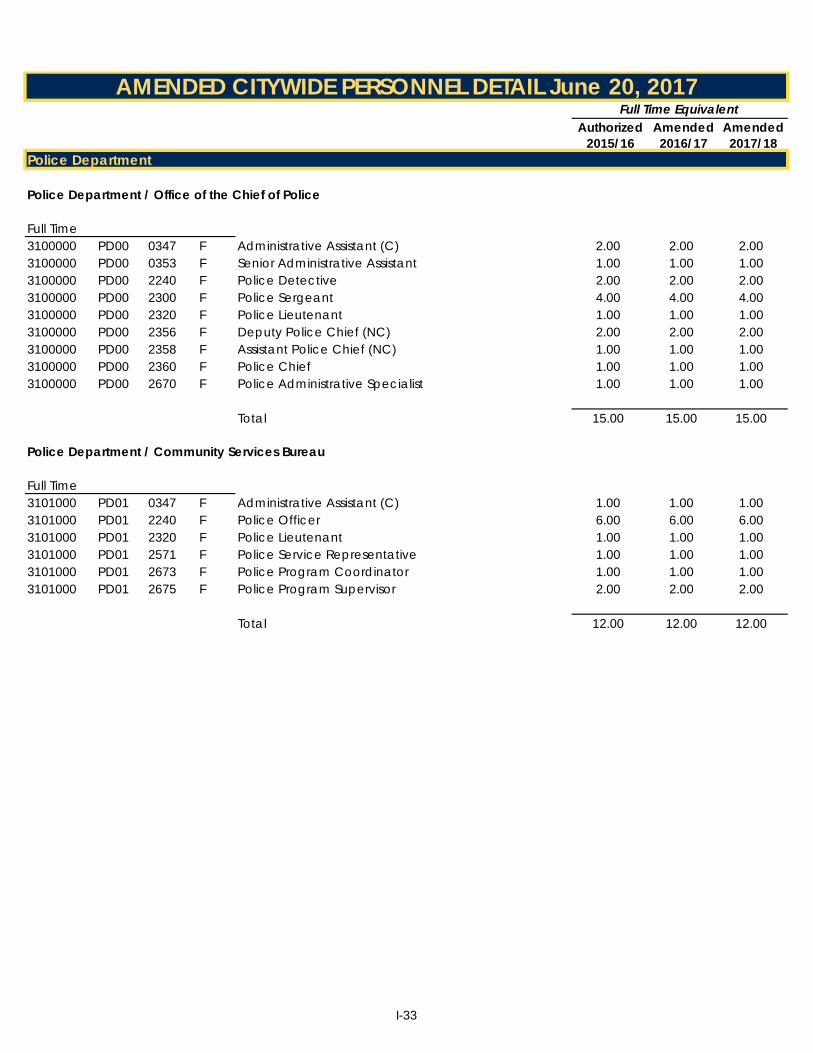
Authorized Amended AmendedGL Key Loc Job Type Job Title 2015/16 2016/17 2017/18
AMENDED CITYWIDE PERSONNEL DETAIL June 20, 2017Full Time Equivalent
PCN
Police Department
Police Department / Office of the Chief of Police
Full Time3100000 PD00 0347 F Administrative Assistant (C) 2.00 2.00 2.003100000 PD00 0353 F Senior Administrative Assistant 1.00 1.00 1.003100000 PD00 2240 F Police Detective 2.00 2.00 2.003100000 PD00 2300 F Police Sergeant 4.00 4.00 4.003100000 PD00 2320 F Police Lieutenant 1.00 1.00 1.003100000 PD00 2356 F Deputy Police Chief (NC) 2.00 2.00 2.003100000 PD00 2358 F Assistant Police Chief (NC) 1.00 1.00 1.003100000 PD00 2360 F Police Chief 1.00 1.00 1.003100000 PD00 2670 F Police Administrative Specialist 1.00 1.00 1.00
Total 15.00 15.00 15.00
Police Department / Community Services Bureau
Full Time3101000 PD01 0347 F Administrative Assistant (C) 1.00 1.00 1.003101000 PD01 2240 F Police Officer 6.00 6.00 6.003101000 PD01 2320 F Police Lieutenant 1.00 1.00 1.003101000 PD01 2571 F Police Service Representative 1.00 1.00 1.003101000 PD01 2673 F Police Program Coordinator 1.00 1.00 1.003101000 PD01 2675 F Police Program Supervisor 2.00 2.00 2.00
Total 12.00 12.00 12.00
I-33

Authorized Amended AmendedGL Key Loc Job Type Job Title 2015/16 2016/17 2017/18
AMENDED CITYWIDE PERSONNEL DETAIL June 20, 2017Full Time Equivalent
PCN
Police Department / Support Services
Full Time3102000 PD02 0082 F Senior Office Specialist 2.00 1.00 1.003105000 PD05 0084 F Senior Office Specialist (T) 1.00 1.00 1.003102000 PD02 2240 F Police Officer 6.00 6.00 6.003102000 PD02 2260 F Police Detective 1.00 1.00 1.003102000 PD02 2300 F Police Sergeant 2.00 2.00 2.003102000 PD02 2320 F Police Lieutenant 2.00 2.00 2.003102000 PD02 2340 F Police Captain 1.00 1.00 1.003102000 PD02 2571 F Police Service Representative 2.00 3.00 3.003102000 PD02 2600 F Range Master 1.00 1.00 1.003102000 PD02 2650 F Police Property Specialist 4.00 4.00 4.003102000 PD02 2651 F Police Property Specialist (T) 2.00 2.00 2.003102000 PD02 2654 F Police Records Specialist (T) 4.00 4.00 4.003102000 PD02 2659 F Senior Police Records Specialist 9.00 8.00 8.003102000 PD02 2662 F Senior Police Records Specialist (T) 1.00 1.00 1.003102000 PD02 2663 F Police Records/Information Manager 1.00 1.00 1.003102000 PD02 2655 F Police Records Specialist 14.00 11.00 11.003102000 PD02 2670 F Police Administrative Specialist 2.00 2.00 2.003102000 PD02 2673 F Police Program Coordinator 2.00 1.00 1.003102000 PD02 2675 F Police Program Supervisor 7.00 6.00 6.003102000 PD02 2700 F Police Records System Analyst 1.00 1.00 1.00
Subtotal 65.00 59.00 59.00
Part Time3102000 PD02 2430 N Police Cadet 7.00 7.00 7.003102000 PD02 2605 T Assistant Range Master 0.75 0.00 0.00
Subtotal 7.75 7.00 7.00
Total 72.75 66.00 66.00
I-34
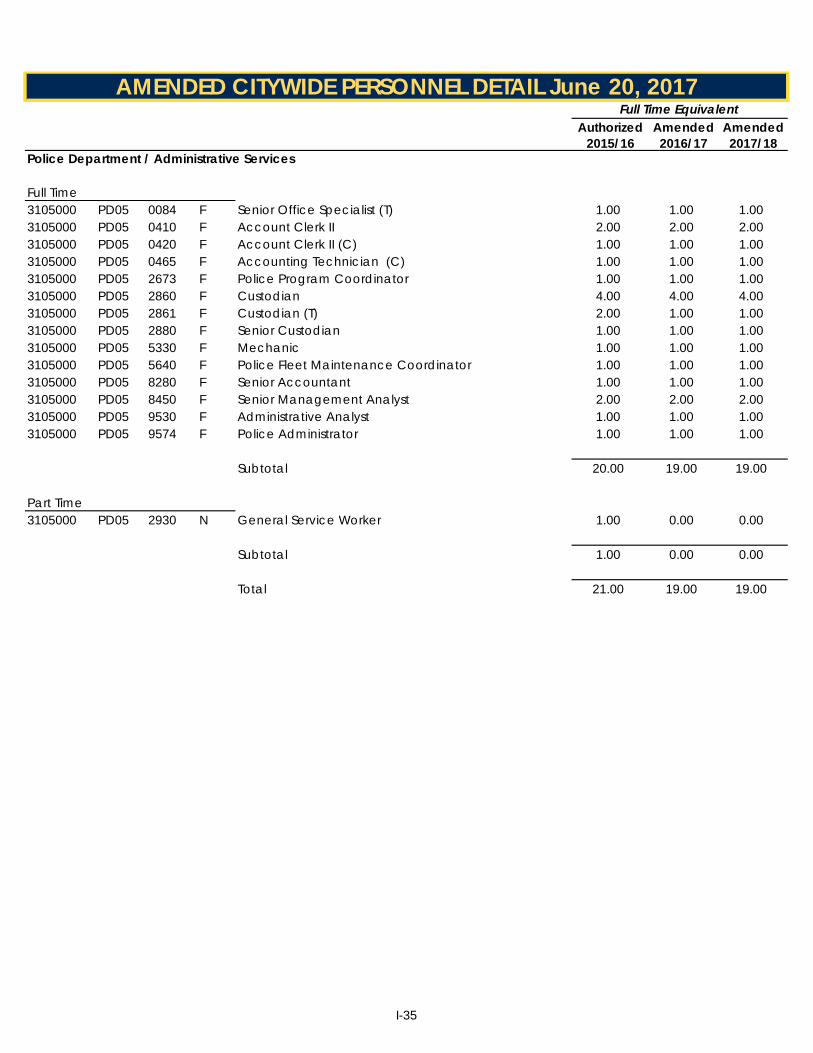
Authorized Amended AmendedGL Key Loc Job Type Job Title 2015/16 2016/17 2017/18
AMENDED CITYWIDE PERSONNEL DETAIL June 20, 2017Full Time Equivalent
PCN
Police Department / Administrative Services
Full Time3105000 PD05 0084 F Senior Office Specialist (T) 1.00 1.00 1.003105000 PD05 0410 F Account Clerk II 2.00 2.00 2.003105000 PD05 0420 F Account Clerk II (C) 1.00 1.00 1.003105000 PD05 0465 F Accounting Technician (C) 1.00 1.00 1.003105000 PD05 2673 F Police Program Coordinator 1.00 1.00 1.003105000 PD05 2860 F Custodian 4.00 4.00 4.003105000 PD05 2861 F Custodian (T) 2.00 1.00 1.003105000 PD05 2880 F Senior Custodian 1.00 1.00 1.003105000 PD05 5330 F Mechanic 1.00 1.00 1.003105000 PD05 5640 F Police Fleet Maintenance Coordinator 1.00 1.00 1.003105000 PD05 8280 F Senior Accountant 1.00 1.00 1.003105000 PD05 8450 F Senior Management Analyst 2.00 2.00 2.003105000 PD05 9530 F Administrative Analyst 1.00 1.00 1.003105000 PD05 9574 F Police Administrator 1.00 1.00 1.00
Subtotal 20.00 19.00 19.00
Part Time3105000 PD05 2930 N General Service Worker 1.00 0.00 0.00
Subtotal 1.00 0.00 0.00
Total 21.00 19.00 19.00
I-35

Authorized Amended AmendedGL Key Loc Job Type Job Title 2015/16 2016/17 2017/18
AMENDED CITYWIDE PERSONNEL DETAIL June 20, 2017Full Time Equivalent
PCN
Police Department / Communications
Full Time3110000 PD10 2300 F Police Sergeant 1.00 1.00 1.003110000 PD10 2490 F Public Safety Dispatcher I 4.00 4.00 4.003110000 PD10 2493 F Public Safety Dispatcher II 41.00 41.00 41.003110000 PD10 2510 F Public Safety Communications Supervisor 6.00 6.00 6.003110000 PD10 2515 F Police Communications System Analyst 1.00 1.00 1.00
Total 53.00 53.00 53.00
Police Department / Field Operations
Full Time3115000 PD15 0082 F Senior Office Specialist 1.00 1.00 1.003115000 PD15 2240 F Police Officer 177.00 152.00 152.003115000 PD15 2260 F Police Detective 5.00 5.00 5.003115000 PD15 2300 F Police Sergeant 27.00 23.00 23.003115000 PD15 2320 F Police Lieutenant 8.00 8.00 8.003115000 PD15 2340 F Police Captain 1.00 1.00 1.003115000 PD15 2422 F Senior Parking Control Representative 3.00 3.00 3.003115000 PD15 2571 F Police Service Representative 2.00 2.00 2.003115000 PD15 2673 F Police Program Coordinator 1.00 1.00 1.003115000 PD15 9530 F Administrative Analyst 1.00 1.00 1.00
Total 226.00 197.00 197.00
Police Department / Aviation
Full Time3120000 PD20 2240 F Police Officer 1.00 1.00 1.003120000 PD20 2280 F Police Pilot 7.00 5.00 5.003120000 PD20 2300 F Police Sergeant 1.00 1.00 1.003120000 PD20 5430 F Helicopter Mechanic 1.00 1.00 1.003120000 PD20 5450 F Senior Helicopter Mechanic 1.00 1.00 1.00
Total 11.00 9.00 9.00
I-36

Authorized Amended AmendedGL Key Loc Job Type Job Title 2015/16 2016/17 2017/18
AMENDED CITYWIDE PERSONNEL DETAIL June 20, 2017Full Time Equivalent
PCN
Police Department / Special Operations
Full Time3125000 PD25 2240 F Police Officer 39.00 39.00 39.003125000 PD25 2260 F Police Detective 15.00 15.00 15.003125000 PD25 2300 F Police Sergeant 7.00 7.00 7.003125000 PD25 2320 F Police Lieutenant 5.00 5.00 5.003125000 PD25 2340 F Police Captain 1.00 1.00 1.003125000 PD25 2571 F Police Service Representative 4.00 4.00 4.003125000 PD25 9137 F Crime Analyst 3.00 3.00 3.003125000 PD25 9139 F Supervising Crime Analyst 1.00 1.00 1.003125000 PD25 9241 F Programmer Analyst 1.00 1.00 1.00
Total 76.00 76.00 76.00
I-37

Authorized Amended AmendedGL Key Loc Job Type Job Title 2015/16 2016/17 2017/18
AMENDED CITYWIDE PERSONNEL DETAIL June 20, 2017Full Time Equivalent
PCN
Police Department / Central Investigations
Full Time3130000 PD30 2240 F Police Officer 1.00 1.00 1.003130000 PD30 2260 F Police Detective 26.00 25.00 25.003130000 PD30 2300 F Police Sergeant 4.00 4.00 4.003130000 PD30 2320 F Police Lieutenant 1.00 1.00 1.003130000 PD30 2340 F Police Captain 1.00 1.00 1.003130000 PD30 2571 F Police Service Representative 1.00 2.00 2.003130000 PD30 2615 F Senior Evidence Technician 3.00 3.00 3.003130000 PD30 2620 F Supervising Evidence Technician 1.00 1.00 1.003130000 PD30 2659 F Police Records Specialist III 1.00 0.00 0.003130000 PD30 2675 F Police Program Supervisor 0.00 1.00 1.00
Total 39.00 39.00 39.00
Police Department / Special Investigations
Full Time3135000 PD30 0024 F Office Specialist (T) 1.00 0.00 0.003135000 PD35 0082 F Senior Office Specialist 1.00 1.00 1.003135000 PD35 2240 F Police Officer 1.00 1.00 1.003135000 PD35 2260 F Police Detective 20.00 19.00 19.003135000 PD35 2300 F Police Sergeant 4.00 3.00 3.003135000 PD35 2320 F Police Lieutenant 1.00 1.00 1.003135000 PD35 2571 F Police Service Representative 1.00 1.00 1.00
Total 29.00 26.00 26.00
Department Total 554.75 512.00 512.00
Measure Z: Police Department / Field Operations
Full Time3115009 PD15Z 2240 F Police Officer 0.00 0.00 17.00
Total 0.00 0.00 17.00
Measure Z: Police Department / Communications
Full Time3110009 PD10Z 2493 F Public Safety Dispatcher II 0.00 0.00 3.00
Total 0.00 0.00 3.00
I-38

Authorized Amended AmendedGL Key Loc Job Type Job Title 2015/16 2016/17 2017/18
AMENDED CITYWIDE PERSONNEL DETAIL June 20, 2017Full Time Equivalent
PCN
Measure Z: Police Department / Support Services
Full Time3102009 PD02Z 2662 F Senior Police Records Specialist (T) 0.00 0.00 2.003102009 PD02Z 0084 F Senior Office Specialist (T) 0.00 0.00 2.003102009 F Police Records Specialist (T) 0.00 0.00 2.00
Subtotal 0.00 0.00 6.00
Part Time3102009 PD02Z 2605 T Assistant Range Master 0.00 0.00 0.753102009 Background Investigator??? 0.00 0.00 1.25
Subtotal 0.00 0.00 2.00
Total 0.00 0.00 8.00
Measure Z: Police Department / Administrative Services
Full Time3105009 F Office Specialist 0.00 0.00 1.003105009 PD05Z 2861 F Custodian (T) 0.00 0.00 1.00
Subtotal 0.00 0.00 2.00
Part Time3105009 PD05Z 2930 N General Service Worker 0.00 0.00 1.00
Subtotal 0.00 0.00 1.00
Total 0.00 0.00 3.00
Total Measure Z 0.00 0.00 31.00
Department Total 554.75 512.00 543.00
I-39
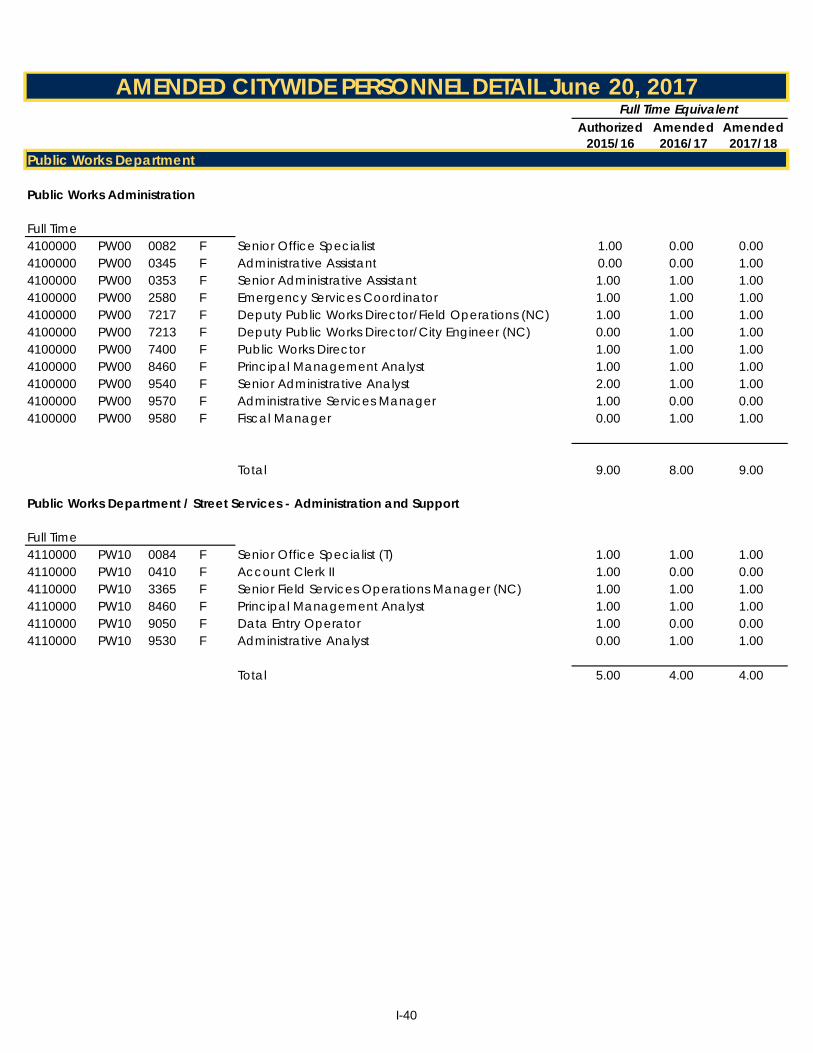
Authorized Amended AmendedGL Key Loc Job Type Job Title 2015/16 2016/17 2017/18
AMENDED CITYWIDE PERSONNEL DETAIL June 20, 2017Full Time Equivalent
PCN
Public Works Department
Public Works Administration
Full Time4100000 PW00 0082 F Senior Office Specialist 1.00 0.00 0.004100000 PW00 0345 F Administrative Assistant 0.00 0.00 1.004100000 PW00 0353 F Senior Administrative Assistant 1.00 1.00 1.004100000 PW00 2580 F Emergency Services Coordinator 1.00 1.00 1.004100000 PW00 7217 F Deputy Public Works Director/Field Operations (NC) 1.00 1.00 1.004100000 PW00 7213 F Deputy Public Works Director/City Engineer (NC) 0.00 1.00 1.004100000 PW00 7400 F Public Works Director 1.00 1.00 1.004100000 PW00 8460 F Principal Management Analyst 1.00 1.00 1.004100000 PW00 9540 F Senior Administrative Analyst 2.00 1.00 1.004100000 PW00 9570 F Administrative Services Manager 1.00 0.00 0.004100000 PW00 9580 F Fiscal Manager 0.00 1.00 1.00
Total 9.00 8.00 9.00
Public Works Department / Street Services - Administration and Support
Full Time4110000 PW10 0084 F Senior Office Specialist (T) 1.00 1.00 1.004110000 PW10 0410 F Account Clerk II 1.00 0.00 0.004110000 PW10 3365 F Senior Field Services Operations Manager (NC) 1.00 1.00 1.004110000 PW10 8460 F Principal Management Analyst 1.00 1.00 1.004110000 PW10 9050 F Data Entry Operator 1.00 0.00 0.004110000 PW10 9530 F Administrative Analyst 0.00 1.00 1.00
Total 5.00 4.00 4.00
I-40
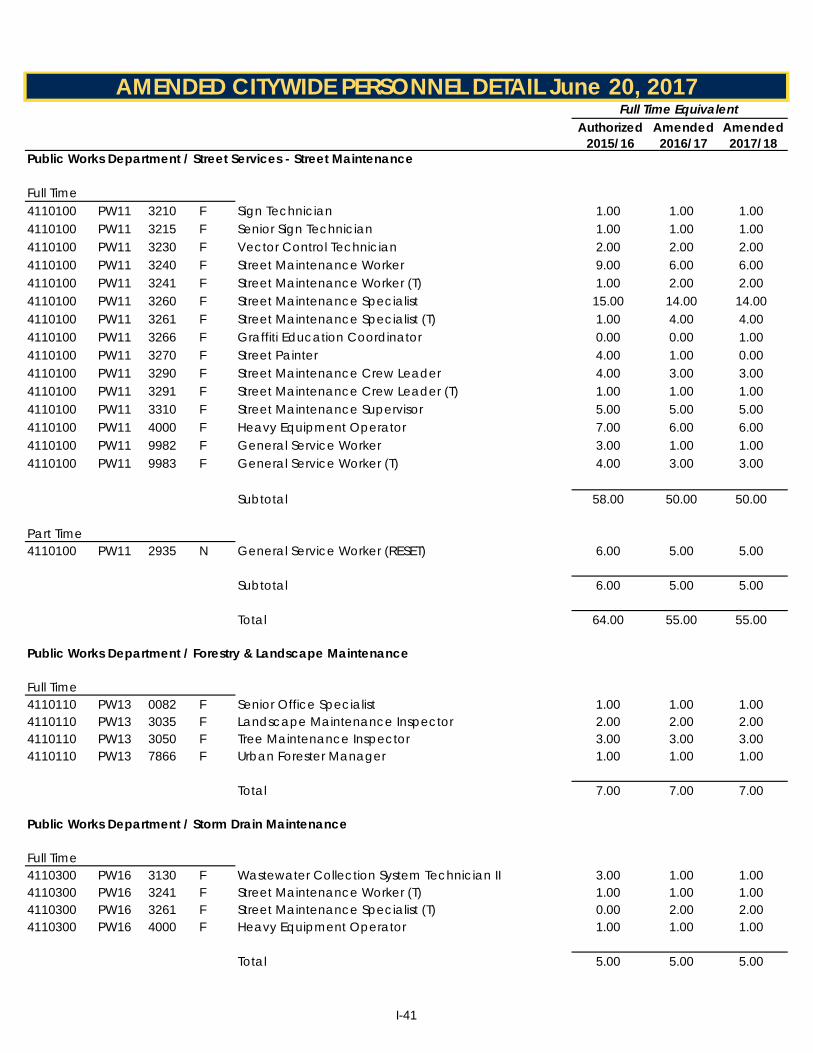
Authorized Amended AmendedGL Key Loc Job Type Job Title 2015/16 2016/17 2017/18
AMENDED CITYWIDE PERSONNEL DETAIL June 20, 2017Full Time Equivalent
PCN
Public Works Department / Street Services - Street Maintenance
Full Time4110100 PW11 3210 F Sign Technician 1.00 1.00 1.004110100 PW11 3215 F Senior Sign Technician 1.00 1.00 1.004110100 PW11 3230 F Vector Control Technician 2.00 2.00 2.004110100 PW11 3240 F Street Maintenance Worker 9.00 6.00 6.004110100 PW11 3241 F Street Maintenance Worker (T) 1.00 2.00 2.004110100 PW11 3260 F Street Maintenance Specialist 15.00 14.00 14.004110100 PW11 3261 F Street Maintenance Specialist (T) 1.00 4.00 4.004110100 PW11 3266 F Graffiti Education Coordinator 0.00 0.00 1.004110100 PW11 3270 F Street Painter 4.00 1.00 0.004110100 PW11 3290 F Street Maintenance Crew Leader 4.00 3.00 3.004110100 PW11 3291 F Street Maintenance Crew Leader (T) 1.00 1.00 1.004110100 PW11 3310 F Street Maintenance Supervisor 5.00 5.00 5.004110100 PW11 4000 F Heavy Equipment Operator 7.00 6.00 6.004110100 PW11 9982 F General Service Worker 3.00 1.00 1.004110100 PW11 9983 F General Service Worker (T) 4.00 3.00 3.00
Subtotal 58.00 50.00 50.00
Part Time4110100 PW11 2935 N General Service Worker (RESET) 6.00 5.00 5.00
Subtotal 6.00 5.00 5.00
Total 64.00 55.00 55.00
Public Works Department / Forestry & Landscape Maintenance
Full Time4110110 PW13 0082 F Senior Office Specialist 1.00 1.00 1.004110110 PW13 3035 F Landscape Maintenance Inspector 2.00 2.00 2.004110110 PW13 3050 F Tree Maintenance Inspector 3.00 3.00 3.004110110 PW13 7866 F Urban Forester Manager 1.00 1.00 1.00
Total 7.00 7.00 7.00
Public Works Department / Storm Drain Maintenance
Full Time4110300 PW16 3130 F Wastewater Collection System Technician II 3.00 1.00 1.004110300 PW16 3241 F Street Maintenance Worker (T) 1.00 1.00 1.004110300 PW16 3261 F Street Maintenance Specialist (T) 0.00 2.00 2.004110300 PW16 4000 F Heavy Equipment Operator 1.00 1.00 1.00
Total 5.00 5.00 5.00
I-41
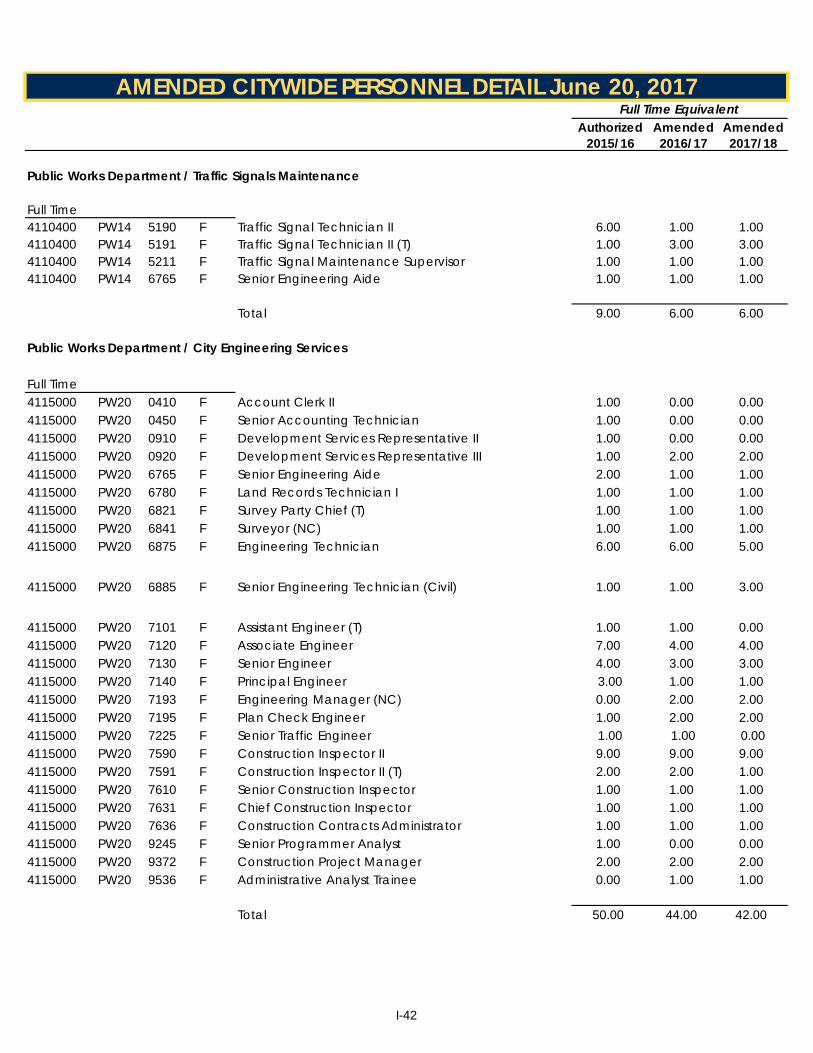
Authorized Amended AmendedGL Key Loc Job Type Job Title 2015/16 2016/17 2017/18
AMENDED CITYWIDE PERSONNEL DETAIL June 20, 2017Full Time Equivalent
PCN
Public Works Department / Traffic Signals Maintenance
Full Time4110400 PW14 5190 F Traffic Signal Technician II 6.00 1.00 1.004110400 PW14 5191 F Traffic Signal Technician II (T) 1.00 3.00 3.004110400 PW14 5211 F Traffic Signal Maintenance Supervisor 1.00 1.00 1.004110400 PW14 6765 F Senior Engineering Aide 1.00 1.00 1.00
Total 9.00 6.00 6.00
Public Works Department / City Engineering Services
Full Time4115000 PW20 0410 F Account Clerk II 1.00 0.00 0.004115000 PW20 0450 F Senior Accounting Technician 1.00 0.00 0.004115000 PW20 0910 F Development Services Representative II 1.00 0.00 0.004115000 PW20 0920 F Development Services Representative III 1.00 2.00 2.004115000 PW20 6765 F Senior Engineering Aide 2.00 1.00 1.004115000 PW20 6780 F Land Records Technician I 1.00 1.00 1.004115000 PW20 6821 F Survey Party Chief (T) 1.00 1.00 1.004115000 PW20 6841 F Surveyor (NC) 1.00 1.00 1.004115000 PW20 6875 F Engineering Technician 6.00 6.00 5.00
4115000 PW20 6885 F Senior Engineering Technician (Civil) 1.00 1.00 3.00
4115000 PW20 7101 F Assistant Engineer (T) 1.00 1.00 0.004115000 PW20 7120 F Associate Engineer 7.00 4.00 4.004115000 PW20 7130 F Senior Engineer 4.00 3.00 3.004115000 PW20 7140 F Principal Engineer 3.00 1.00 1.004115000 PW20 7193 F Engineering Manager (NC) 0.00 2.00 2.004115000 PW20 7195 F Plan Check Engineer 1.00 2.00 2.004115000 PW20 7225 F Senior Traffic Engineer 1.00 1.00 0.00 4115000 PW20 7590 F Construction Inspector II 9.00 9.00 9.004115000 PW20 7591 F Construction Inspector II (T) 2.00 2.00 1.004115000 PW20 7610 F Senior Construction Inspector 1.00 1.00 1.004115000 PW20 7631 F Chief Construction Inspector 1.00 1.00 1.004115000 PW20 7636 F Construction Contracts Administrator 1.00 1.00 1.004115000 PW20 9245 F Senior Programmer Analyst 1.00 0.00 0.004115000 PW20 9372 F Construction Project Manager 2.00 2.00 2.004115000 PW20 9536 F Administrative Analyst Trainee 0.00 1.00 1.00
Total 50.00 44.00 42.00
I-42

Authorized Amended AmendedGL Key Loc Job Type Job Title 2015/16 2016/17 2017/18
AMENDED CITYWIDE PERSONNEL DETAIL June 20, 2017Full Time Equivalent
PCN
Public Works Department / Traffic Engineering
Full Time4120000 PW25 0082 F Senior Office Specialist 1.00 0.00 0.004120000 PW25 0346 F Administrative Assistant 0.00 1.00 0.004120000 PW25 6875 F Engineering Technician 2.00 2.00 1.004120000 PW25 6885 F Senior Engineering Technician (Civil) 0.00 0.00 1.004120000 PW25 7101 F Assistant Engineer (T) 1.00 1.00 0.004120000 PW25 7120 F Associate Engineer 0.00 0.00 2.004120000 PW25 7123 F Associate Traffic Engineer (T) 1.00 0.00 0.004120000 PW25 7210 F City Traffic Engineer 1.00 1.00 1.00 4120000 PW25 7225 F Senior Traffic Engineer 0.00 0.00 1.00
Total 6.00 5.00 6.00
Public Works Department / Sewerage Systems - Administration and Regulatory Compliance
Full Time4125000 PW30 0025 F Office Specialist 1.00 0.00 0.004125000 PW30 0082 F Senior Office Specialist 2.00 1.00 1.004125000 PW30 0084 F Senior Office Specialist (T) 1.00 1.00 1.004125000 PW30 0410 F Account Clerk II 2.00 1.00 1.004125000 PW30 0411 F Account Clerk II (T) 1.00 1.00 1.004125000 PW30 4150 F Wastewater Operations Manager 3.00 3.00 3.00 4125000 PW30 4186 F Wastewater Resources Analyst 2.00 2.00 2.004125000 PW30 7218 F Deputy Public Works Director/Wastewater (NC) 1.00 1.00 1.004125000 PW30 8460 F Principal Management Analyst 0.00 1.00 1.00 4125000 PW30 8648 F Safety Officer 1.00 1.00 1.004125000 PW30 9225 F Systems Analyst 1.00 1.00 1.004125000 PW30 9530 F Administrative Analyst 2.00 2.00 2.004125000 PW30 9540 F Senior Administrative Analyst 2.00 1.00 1.00
Total 19.00 16.00 16.00
I-43
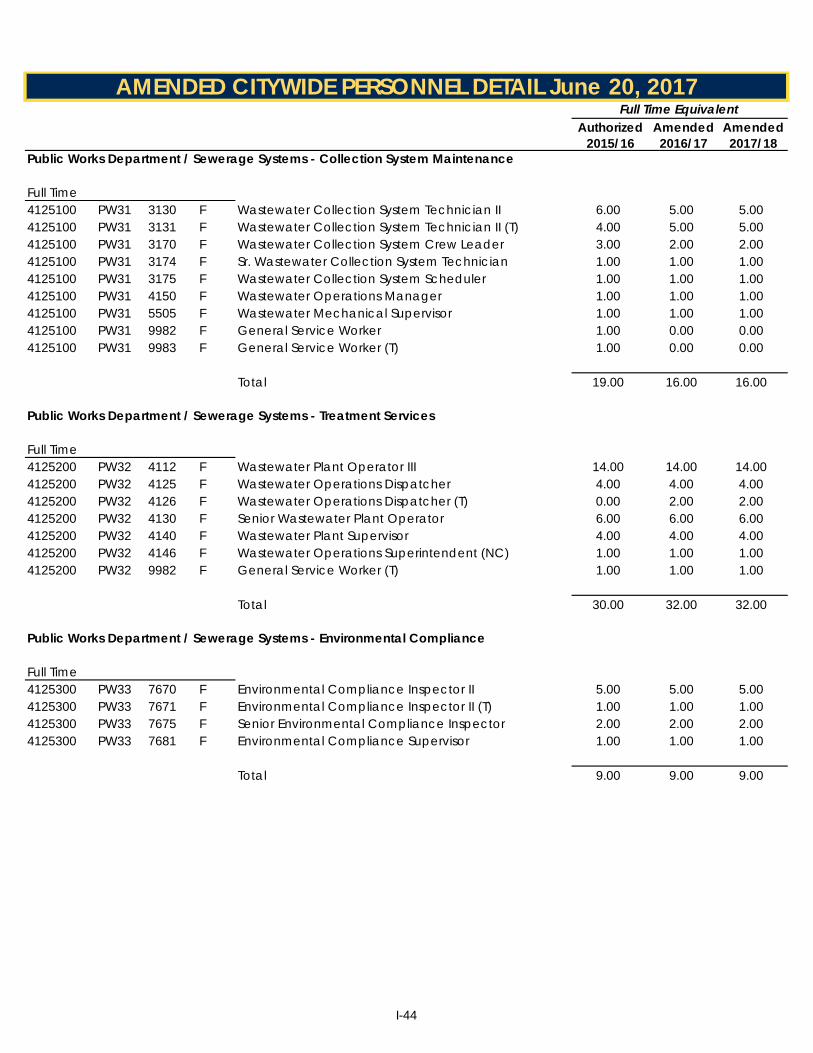
Authorized Amended AmendedGL Key Loc Job Type Job Title 2015/16 2016/17 2017/18
AMENDED CITYWIDE PERSONNEL DETAIL June 20, 2017Full Time Equivalent
PCN
Public Works Department / Sewerage Systems - Collection System Maintenance
Full Time 4125100 PW31 3130 F Wastewater Collection System Technician II 6.00 5.00 5.004125100 PW31 3131 F Wastewater Collection System Technician II (T) 4.00 5.00 5.004125100 PW31 3170 F Wastewater Collection System Crew Leader 3.00 2.00 2.004125100 PW31 3174 F Sr. Wastewater Collection System Technician 1.00 1.00 1.004125100 PW31 3175 F Wastewater Collection System Scheduler 1.00 1.00 1.004125100 PW31 4150 F Wastewater Operations Manager 1.00 1.00 1.004125100 PW31 5505 F Wastewater Mechanical Supervisor 1.00 1.00 1.004125100 PW31 9982 F General Service Worker 1.00 0.00 0.004125100 PW31 9983 F General Service Worker (T) 1.00 0.00 0.00
Total 19.00 16.00 16.00
Public Works Department / Sewerage Systems - Treatment Services
Full Time4125200 PW32 4112 F Wastewater Plant Operator III 14.00 14.00 14.004125200 PW32 4125 F Wastewater Operations Dispatcher 4.00 4.00 4.004125200 PW32 4126 F Wastewater Operations Dispatcher (T) 0.00 2.00 2.004125200 PW32 4130 F Senior Wastewater Plant Operator 6.00 6.00 6.004125200 PW32 4140 F Wastewater Plant Supervisor 4.00 4.00 4.004125200 PW32 4146 F Wastewater Operations Superintendent (NC) 1.00 1.00 1.004125200 PW32 9982 F General Service Worker (T) 1.00 1.00 1.00
Total 30.00 32.00 32.00
Public Works Department / Sewerage Systems - Environmental Compliance
Full Time4125300 PW33 7670 F Environmental Compliance Inspector II 5.00 5.00 5.004125300 PW33 7671 F Environmental Compliance Inspector II (T) 1.00 1.00 1.004125300 PW33 7675 F Senior Environmental Compliance Inspector 2.00 2.00 2.004125300 PW33 7681 F Environmental Compliance Supervisor 1.00 1.00 1.00
Total 9.00 9.00 9.00
I-44
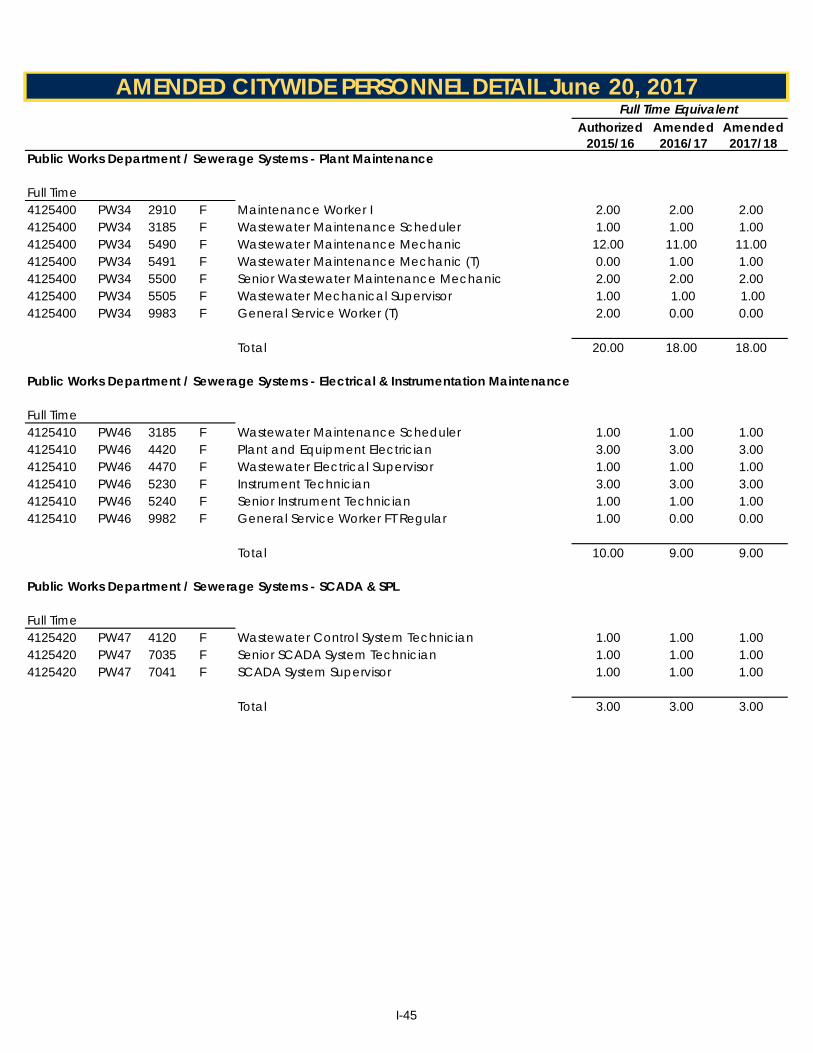
Authorized Amended AmendedGL Key Loc Job Type Job Title 2015/16 2016/17 2017/18
AMENDED CITYWIDE PERSONNEL DETAIL June 20, 2017Full Time Equivalent
PCN
Public Works Department / Sewerage Systems - Plant Maintenance
Full Time4125400 PW34 2910 F Maintenance Worker I 2.00 2.00 2.004125400 PW34 3185 F Wastewater Maintenance Scheduler 1.00 1.00 1.004125400 PW34 5490 F Wastewater Maintenance Mechanic 12.00 11.00 11.004125400 PW34 5491 F Wastewater Maintenance Mechanic (T) 0.00 1.00 1.004125400 PW34 5500 F Senior Wastewater Maintenance Mechanic 2.00 2.00 2.004125400 PW34 5505 F Wastewater Mechanical Supervisor 1.00 1.00 1.00 4125400 PW34 9983 F General Service Worker (T) 2.00 0.00 0.00
Total 20.00 18.00 18.00
Public Works Department / Sewerage Systems - Electrical & Instrumentation Maintenance
Full Time4125410 PW46 3185 F Wastewater Maintenance Scheduler 1.00 1.00 1.004125410 PW46 4420 F Plant and Equipment Electrician 3.00 3.00 3.004125410 PW46 4470 F Wastewater Electrical Supervisor 1.00 1.00 1.004125410 PW46 5230 F Instrument Technician 3.00 3.00 3.004125410 PW46 5240 F Senior Instrument Technician 1.00 1.00 1.004125410 PW46 9982 F General Service Worker FT Regular 1.00 0.00 0.00
Total 10.00 9.00 9.00
Public Works Department / Sewerage Systems - SCADA & SPL
Full Time4125420 PW47 4120 F Wastewater Control System Technician 1.00 1.00 1.004125420 PW47 7035 F Senior SCADA System Technician 1.00 1.00 1.004125420 PW47 7041 F SCADA System Supervisor 1.00 1.00 1.00
Total 3.00 3.00 3.00
I-45

Authorized Amended AmendedGL Key Loc Job Type Job Title 2015/16 2016/17 2017/18
AMENDED CITYWIDE PERSONNEL DETAIL June 20, 2017Full Time Equivalent
PCN
Public Works Department / Sewerage Systems - Warehouse
Full Time4125430 PW48 1130 F Inventory Control Specialist 1.00 1.00 1.004125430 PW48 1131 F Inventory Control Specialist (T) 1.00 1.00 1.00
Total 2.00 2.00 2.00
Public Works Department / Sewerage Systems - Laboratory Services
Full Time4125500 PW35 8025 F Laboratory Analyst III 5.00 4.00 4.004125500 PW35 8030 F Laboratory Supervisor 1.00 1.00 1.00
Total 6.00 5.00 5.00
Public Works Department / Sewerage Systems - CoGen/Fuel Cell
Full Time4125800 PW40 5495 F Wastewater Co-generation Specialist 1.00 1.00 1.004125800 PW40 5496 F Wastewater Co-generation Specialist (T) 1.00 1.00 1.00
Total 2.00 2.00 2.00
Public Works Department / Sewerage Systems - Capital Engineering Services
Full Time4125900 PW42 7120 F Associate Engineer 5.00 3.00 3.004125900 PW42 7130 F Senior Engineer 1.00 0.00 0.004125900 PW42 7140 F Principal Engineer 2.00 2.00 2.00
Total 8.00 5.00 5.00
Public Works Department / Sewerage Systems - Plant Construction Support
Full Time4125910 PW28 6885 F Senior Engineering Technician (Civil) 1.00 0.00 0.004125910 PW28 7590 F Construction Inspector II 2.00 0.00 0.004125910 PW28 7610 F Senior Construction Inspector 0.00 1.00 1.004125910 PW28 7631 F Chief Construction Inspector (NC) 1.00 0.00 0.004125910 PW28 7636 F Construction Contracts Administrator 1.00 1.00 1.004125910 PW28 9372 F Construction Project Manager (NC) 1.00 0.00 0.00
Total 6.00 2.00 2.00
I-46
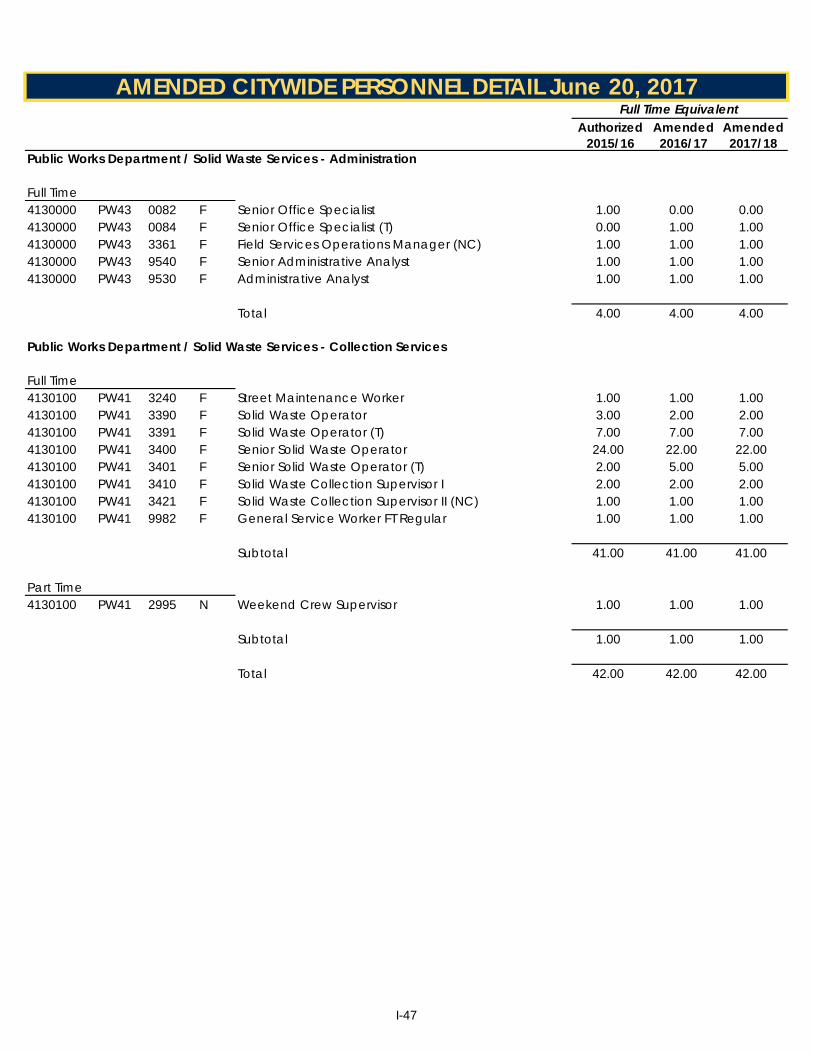
Authorized Amended AmendedGL Key Loc Job Type Job Title 2015/16 2016/17 2017/18
AMENDED CITYWIDE PERSONNEL DETAIL June 20, 2017Full Time Equivalent
PCN
Public Works Department / Solid Waste Services - Administration
Full Time4130000 PW43 0082 F Senior Office Specialist 1.00 0.00 0.004130000 PW43 0084 F Senior Office Specialist (T) 0.00 1.00 1.004130000 PW43 3361 F Field Services Operations Manager (NC) 1.00 1.00 1.004130000 PW43 9540 F Senior Administrative Analyst 1.00 1.00 1.004130000 PW43 9530 F Administrative Analyst 1.00 1.00 1.00
Total 4.00 4.00 4.00
Public Works Department / Solid Waste Services - Collection Services
Full Time4130100 PW41 3240 F Street Maintenance Worker 1.00 1.00 1.004130100 PW41 3390 F Solid Waste Operator 3.00 2.00 2.004130100 PW41 3391 F Solid Waste Operator (T) 7.00 7.00 7.004130100 PW41 3400 F Senior Solid Waste Operator 24.00 22.00 22.004130100 PW41 3401 F Senior Solid Waste Operator (T) 2.00 5.00 5.004130100 PW41 3410 F Solid Waste Collection Supervisor I 2.00 2.00 2.004130100 PW41 3421 F Solid Waste Collection Supervisor II (NC) 1.00 1.00 1.004130100 PW41 9982 F General Service Worker FT Regular 1.00 1.00 1.00
Subtotal 41.00 41.00 41.00
Part Time4130100 PW41 2995 N Weekend Crew Supervisor 1.00 1.00 1.00
Subtotal 1.00 1.00 1.00
Total 42.00 42.00 42.00
I-47

Authorized Amended AmendedGL Key Loc Job Type Job Title 2015/16 2016/17 2017/18
AMENDED CITYWIDE PERSONNEL DETAIL June 20, 2017Full Time Equivalent
PCN
Public Works Department / Solid Waste Services - Street Cleaning
Full Time4130400 PW45 3260 F Street Maintenance Specialist 2.00 1.00 1.004130400 PW45 3261 F Street Maintenance Specialist (T) 0.00 1.00 1.004130400 PW45 3290 F Street Maintenance Crew Leader 1.00 1.00 1.004130400 PW45 3310 F Street Maintenance Supervisor 1.00 1.00 1.004130400 PW45 4030 F Street Sweeper Operator 7.00 7.00 7.00
Subtotal 11.00 11.00 11.00
Part Time4130400 PW45 2935 N General Service Worker (RESET) 2.00 2.00 2.00
Subtotal 2.00 2.00 2.00
Total 13.00 13.00 13.00
Public Works Department / NPDES Urban Run-off
Full Time4140200 PW49 3175 F Wastewater Collection System Scheduler 0.00 0.00 1.004140200 PW49 7695 F Environmental Services Coordinator 0.00 1.00 1.00
Total 0.00 1.00 2.00
I-48

Authorized Amended AmendedGL Key Loc Job Type Job Title 2015/16 2016/17 2017/18
AMENDED CITYWIDE PERSONNEL DETAIL June 20, 2017Full Time Equivalent
PCN
Public Works Department / Public Parking Services
Full Time4150000 PW50 0082 F Senior Office Specialist 1.00 1.00 1.00
4150000 PW50 0084 F Senior Office Specialist (T) 1.00 1.00 0.00
4150000 PW50 2421 F Parking Control Representative 10.00 10.00 0.00
4150000 PW50 2423 F Parking Control Representative (T) 3.00 3.00 0.00
4150000 PW50 2422 F Senior Parking Control Representative 1.00 1.00 0.00
4150000 PW50 9504 F Public Parking Services Supervisor (NC) 1.00 0.00 0.004150000 PW50 9504 F Public Parking Services Manager 0.00 1.00 1.004150000 PW50 9530 F Administrative Analyst 1.00 1.00 1.00
Total 18.00 18.00 3.00
Public Works Department / Parking Enforcement
Full Time4150000 PW50 0084 F Senior Office Specialist (T) 0.00 0.00 1.004150000 PW50 2421 F Parking Control Representative 0.00 0.00 10.004150000 PW50 2423 F Parking Control Representative (T) 0.00 0.00 3.004150000 PW50 2422 F Senior Parking Control Representative 0.00 0.00 1.00
Total 0.00 0.00 15.00
Department Total 366.00 331.00 332.00
I-49
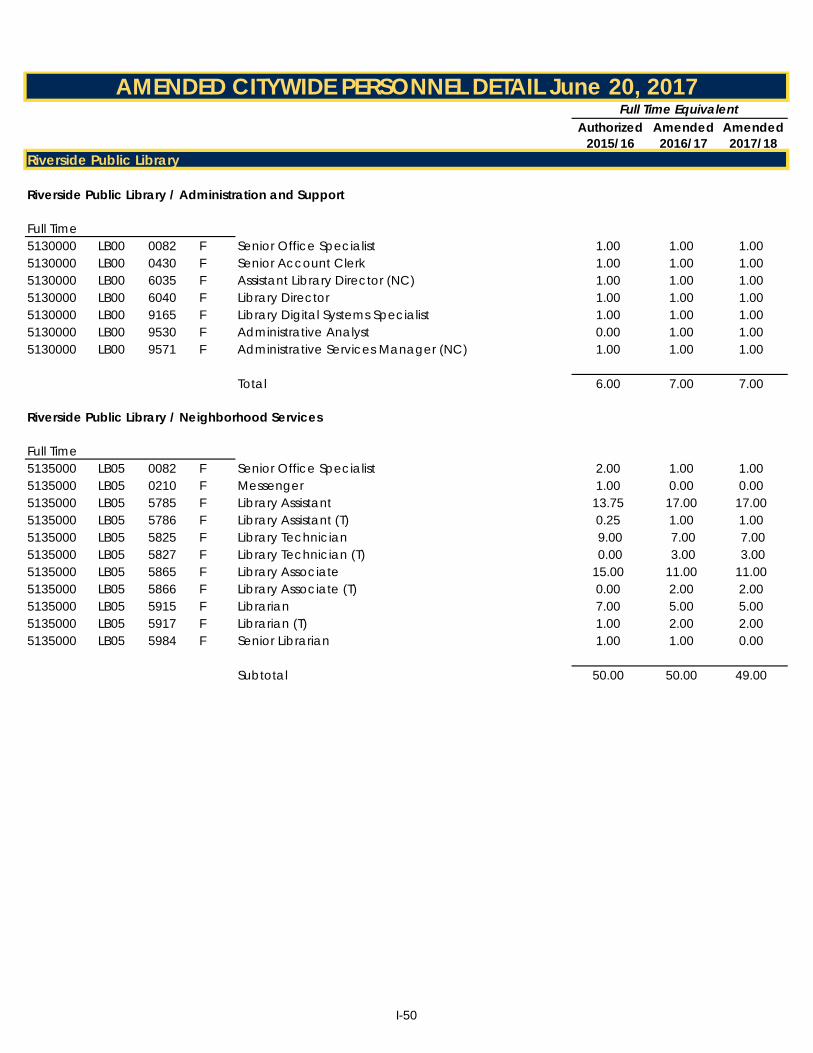
Authorized Amended AmendedGL Key Loc Job Type Job Title 2015/16 2016/17 2017/18
AMENDED CITYWIDE PERSONNEL DETAIL June 20, 2017Full Time Equivalent
PCN
Riverside Public Library
Riverside Public Library / Administration and Support
Full Time5130000 LB00 0082 F Senior Office Specialist 1.00 1.00 1.005130000 LB00 0430 F Senior Account Clerk 1.00 1.00 1.005130000 LB00 6035 F Assistant Library Director (NC) 1.00 1.00 1.005130000 LB00 6040 F Library Director 1.00 1.00 1.005130000 LB00 9165 F Library Digital Systems Specialist 1.00 1.00 1.005130000 LB00 9530 F Administrative Analyst 0.00 1.00 1.005130000 LB00 9571 F Administrative Services Manager (NC) 1.00 1.00 1.00
Total 6.00 7.00 7.00
Riverside Public Library / Neighborhood Services
Full Time5135000 LB05 0082 F Senior Office Specialist 2.00 1.00 1.005135000 LB05 0210 F Messenger 1.00 0.00 0.005135000 LB05 5785 F Library Assistant 13.75 17.00 17.005135000 LB05 5786 F Library Assistant (T) 0.25 1.00 1.005135000 LB05 5825 F Library Technician 9.00 7.00 7.00 5135000 LB05 5827 F Library Technician (T) 0.00 3.00 3.00 5135000 LB05 5865 F Library Associate 15.00 11.00 11.005135000 LB05 5866 F Library Associate (T) 0.00 2.00 2.005135000 LB05 5915 F Librarian 7.00 5.00 5.005135000 LB05 5917 F Librarian (T) 1.00 2.00 2.005135000 LB05 5984 F Senior Librarian 1.00 1.00 0.00
Subtotal 50.00 50.00 49.00
I-50

Authorized Amended AmendedGL Key Loc Job Type Job Title 2015/16 2016/17 2017/18
AMENDED CITYWIDE PERSONNEL DETAIL June 20, 2017Full Time Equivalent
PCN
Part Time5135000 LB05 2930 N General Service Worker 0.00 0.50 0.505135000 LB05 5770 N Library Page 0.75 0.75 0.755135000 LB05 5785 H Library Assistant 2.50 1.50 1.505135000 LB05 5786 H Library Assistant (T) 1.00 0.50 0.505135000 LB05 5786 N Library Assistant (T) 0.50 1.00 1.005135000 LB05 5825 H Library Technician 0.50 0.00 0.005135000 LB05 5825 T Library Technician 0.75 0.00 0.005135000 LB05 5865 H Library Associate 1.00 0.00 0.005135000 LB05 5866 H Library Associate (T) 0.50 0.50 0.505135000 LB05 9950 N Technical Intern 2.42 1.00 1.00
Subtotal 9.92 5.75 5.75
Total 59.92 55.75 54.75
Department Total 65.92 62.75 61.75
I-51

Authorized Amended AmendedGL Key Loc Job Type Job Title 2015/16 2016/17 2017/18
AMENDED CITYWIDE PERSONNEL DETAIL June 20, 2017Full Time Equivalent
PCN
Riverside Public Utilities
Riverside Public Utilities / Electric Utility - Management Services
Full Time6000000 PU00 0082 F Senior Office Specialist 1.00 1.00 1.006000000 PU00 0345 F Administrative Assistant 5.00 5.00 5.006000000 PU00 0346 F Administrative Assistant (T) 0.00 1.00 1.006000000 PU00 0353 F Senior Administrative Assistant 1.00 1.00 1.006000000 PU00 0450 F Senior Accounting Technician 2.00 2.00 2.006000000 PU00 0451 F Senior Accounting Technician (NC) 1.00 0.00 0.006000000 PU00 0460 F Accounting Technician 0.00 1.00 1.00 6000000 PU00 0610 F Utilities Customer Services Representative II 1.00 0.00 0.006000000 PU00 6875 F Engineering Tech 1.00 1.00 0.006000000 PU00 6979 F Building Services Project Assistant 1.00 0.00 0.006000000 PU00 6985 F Building Services Project Coordinator 0.00 1.00 1.006000000 PU00 7247 F Utilities Principal Resources Analyst 0.00 0.00 1.006000000 PU00 7261 F Utilities Projects & Contracts Manager (NC) 1.00 0.00 0.006000000 PU00 7420 F Public Utilities General Manager 1.00 1.00 1.006000000 PU00 7424 F Utilities Assistant General Mgr/Energy Delivery (NC) 1.00 1.00 1.006000000 PU00 7436 F Utilities Assistant General Mgr/Water Delivery (NC) 1.00 2.00 2.006000000 PU00 8131 F Project Manager 0.00 1.00 1.00 6000000 PU00 8260 F Accountant II 0.00 1.00 1.006000000 PU00 8261 F Accountant II (T) 1.00 1.00 1.006000000 PU00 8280 F Senior Accountant 1.00 1.00 2.006000000 PU00 8281 F Senior Accountant (NC) 1.00 0.00 0.006000000 PU00 8301 F Utilities Assistant General Mgr/Operational Technology 0.00 1.00 1.006000000 PU00 8366 F Utilities Assistant General Mgr/Resources (NC) 1.00 1.00 1.006000000 PU00 8376 F Utilities Assistant General Mgr/Finance & Administration 1.00 1.00 1.006000000 PU00 8387 F Utilities Assistant General Mgr/Marketing & Customer Re 1.00 1.00 1.006000000 PU00 8393 F Utilities Senior Analyst 3.00 2.00 1.006000000 PU00 8394 F Utilities Principal Analyst 3.00 5.00 5.006000000 PU00 8396 F Utilities Principal Analyst (NC) 1.00 0.00 0.006000000 PU00 8398 F Utilities Fiscal Manager (NC) 3.00 2.00 2.006000000 PU00 8654 F Utilities Safety & Training Manager (NC) 1.00 1.00 1.006000000 PU00 8460 F Principal Management Analyst 1.00 1.00 1.006000000 PU00 8699 F Human Resources Specialist (NC) 1.00 0.00 0.006000000 PU00 9530 F Administrative Analyst 1.00 0.00 0.006000000 PU00 9571 F Administrative Services Manager 0.00 1.00 1.00
Subtotal 37.00 37.00 37.00
I-52
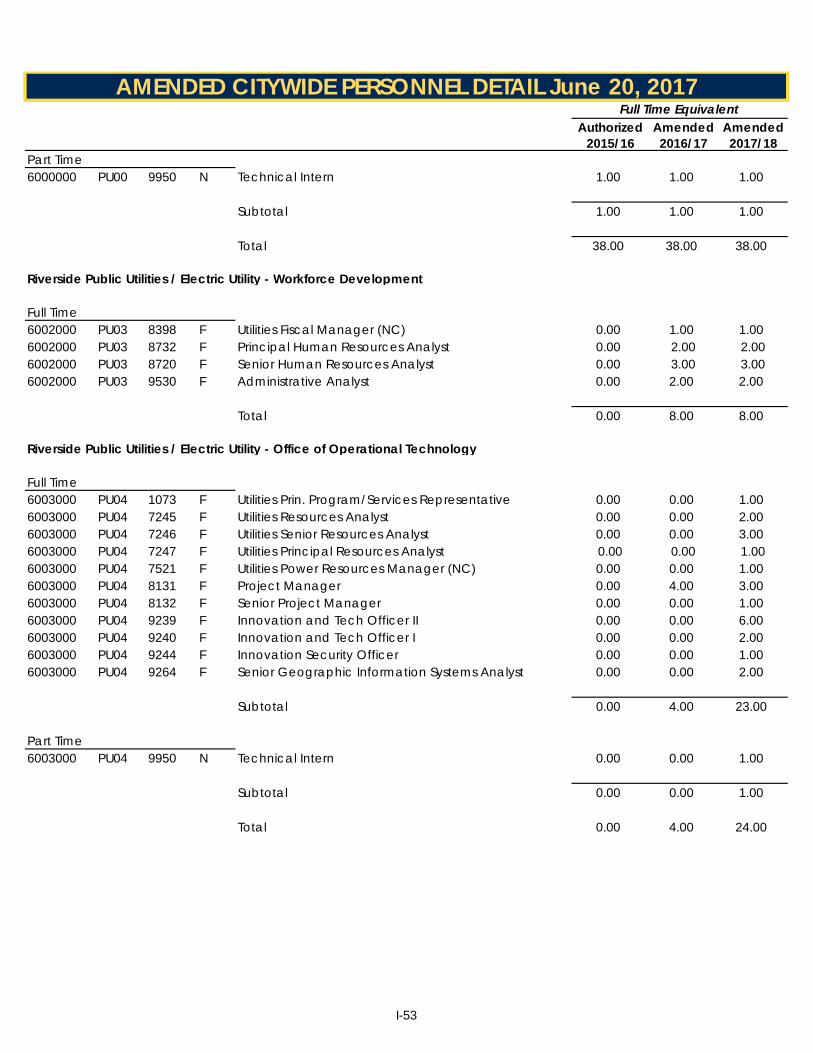
Authorized Amended AmendedGL Key Loc Job Type Job Title 2015/16 2016/17 2017/18
AMENDED CITYWIDE PERSONNEL DETAIL June 20, 2017Full Time Equivalent
PCN
Part Time6000000 PU00 9950 N Technical Intern 1.00 1.00 1.00
Subtotal 1.00 1.00 1.00
Total 38.00 38.00 38.00
Riverside Public Utilities / Electric Utility - Workforce Development
Full Time6002000 PU03 8398 F Utilities Fiscal Manager (NC) 0.00 1.00 1.006002000 PU03 8732 F Principal Human Resources Analyst 0.00 2.00 2.00 6002000 PU03 8720 F Senior Human Resources Analyst 0.00 3.00 3.00 6002000 PU03 9530 F Administrative Analyst 0.00 2.00 2.00
Total 0.00 8.00 8.00
Riverside Public Utilities / Electric Utility - Office of Operational Technology
Full Time6003000 PU04 1073 F Utilities Prin. Program/Services Representative 0.00 0.00 1.006003000 PU04 7245 F Utilities Resources Analyst 0.00 0.00 2.006003000 PU04 7246 F Utilities Senior Resources Analyst 0.00 0.00 3.006003000 PU04 7247 F Utilities Principal Resources Analyst 0.00 0.00 1.00 6003000 PU04 7521 F Utilities Power Resources Manager (NC) 0.00 0.00 1.006003000 PU04 8131 F Project Manager 0.00 4.00 3.006003000 PU04 8132 F Senior Project Manager 0.00 0.00 1.006003000 PU04 9239 F Innovation and Tech Officer II 0.00 0.00 6.006003000 PU04 9240 F Innovation and Tech Officer I 0.00 0.00 2.006003000 PU04 9244 F Innovation Security Officer 0.00 0.00 1.006003000 PU04 9264 F Senior Geographic Information Systems Analyst 0.00 0.00 2.00
Subtotal 0.00 4.00 23.00
Part Time6003000 PU04 9950 N Technical Intern 0.00 0.00 1.00
Subtotal 0.00 0.00 1.00
Total 0.00 4.00 24.00
I-53
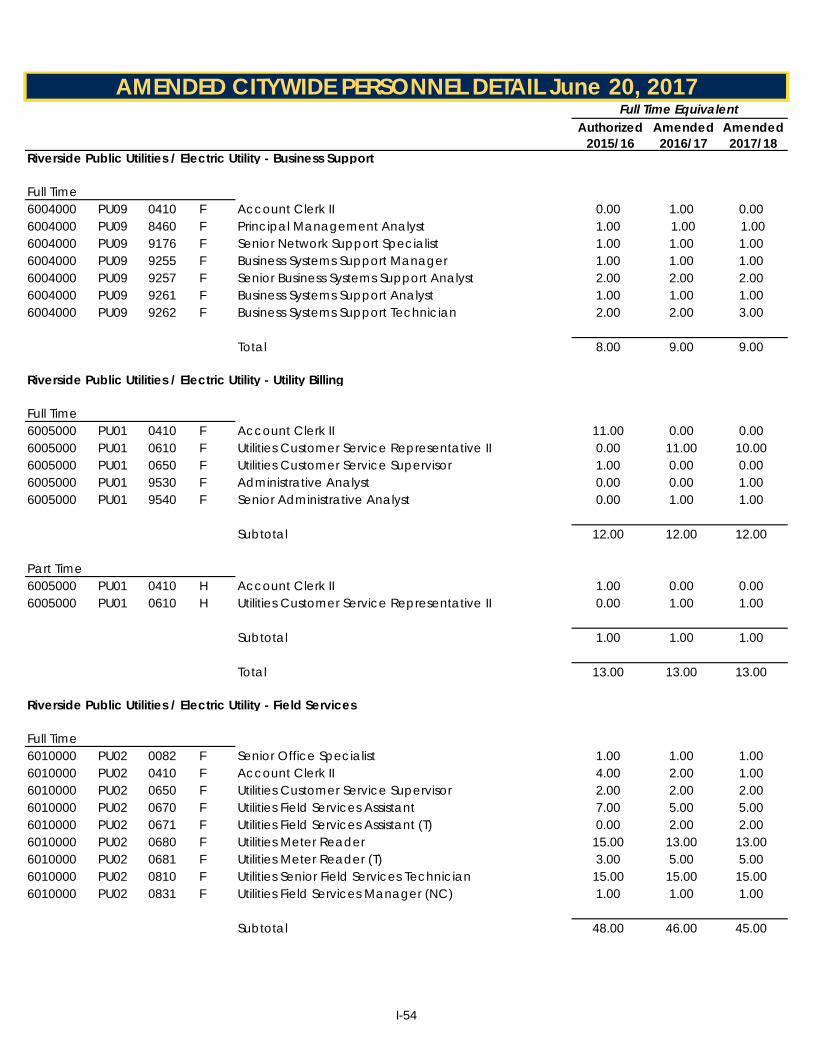
Authorized Amended AmendedGL Key Loc Job Type Job Title 2015/16 2016/17 2017/18
AMENDED CITYWIDE PERSONNEL DETAIL June 20, 2017Full Time Equivalent
PCN
Riverside Public Utilities / Electric Utility - Business Support
Full Time6004000 PU09 0410 F Account Clerk II 0.00 1.00 0.006004000 PU09 8460 F Principal Management Analyst 1.00 1.00 1.00 6004000 PU09 9176 F Senior Network Support Specialist 1.00 1.00 1.006004000 PU09 9255 F Business Systems Support Manager 1.00 1.00 1.006004000 PU09 9257 F Senior Business Systems Support Analyst 2.00 2.00 2.006004000 PU09 9261 F Business Systems Support Analyst 1.00 1.00 1.006004000 PU09 9262 F Business Systems Support Technician 2.00 2.00 3.00
Total 8.00 9.00 9.00
Riverside Public Utilities / Electric Utility - Utility Billing
Full Time6005000 PU01 0410 F Account Clerk II 11.00 0.00 0.006005000 PU01 0610 F Utilities Customer Service Representative II 0.00 11.00 10.006005000 PU01 0650 F Utilities Customer Service Supervisor 1.00 0.00 0.006005000 PU01 9530 F Administrative Analyst 0.00 0.00 1.006005000 PU01 9540 F Senior Administrative Analyst 0.00 1.00 1.00
Subtotal 12.00 12.00 12.00
Part Time6005000 PU01 0410 H Account Clerk II 1.00 0.00 0.006005000 PU01 0610 H Utilities Customer Service Representative II 0.00 1.00 1.00
Subtotal 1.00 1.00 1.00
Total 13.00 13.00 13.00
Riverside Public Utilities / Electric Utility - Field Services
Full Time6010000 PU02 0082 F Senior Office Specialist 1.00 1.00 1.006010000 PU02 0410 F Account Clerk II 4.00 2.00 1.006010000 PU02 0650 F Utilities Customer Service Supervisor 2.00 2.00 2.006010000 PU02 0670 F Utilities Field Services Assistant 7.00 5.00 5.006010000 PU02 0671 F Utilities Field Services Assistant (T) 0.00 2.00 2.006010000 PU02 0680 F Utilities Meter Reader 15.00 13.00 13.006010000 PU02 0681 F Utilities Meter Reader (T) 3.00 5.00 5.006010000 PU02 0810 F Utilities Senior Field Services Technician 15.00 15.00 15.006010000 PU02 0831 F Utilities Field Services Manager (NC) 1.00 1.00 1.00
Subtotal 48.00 46.00 45.00
I-54
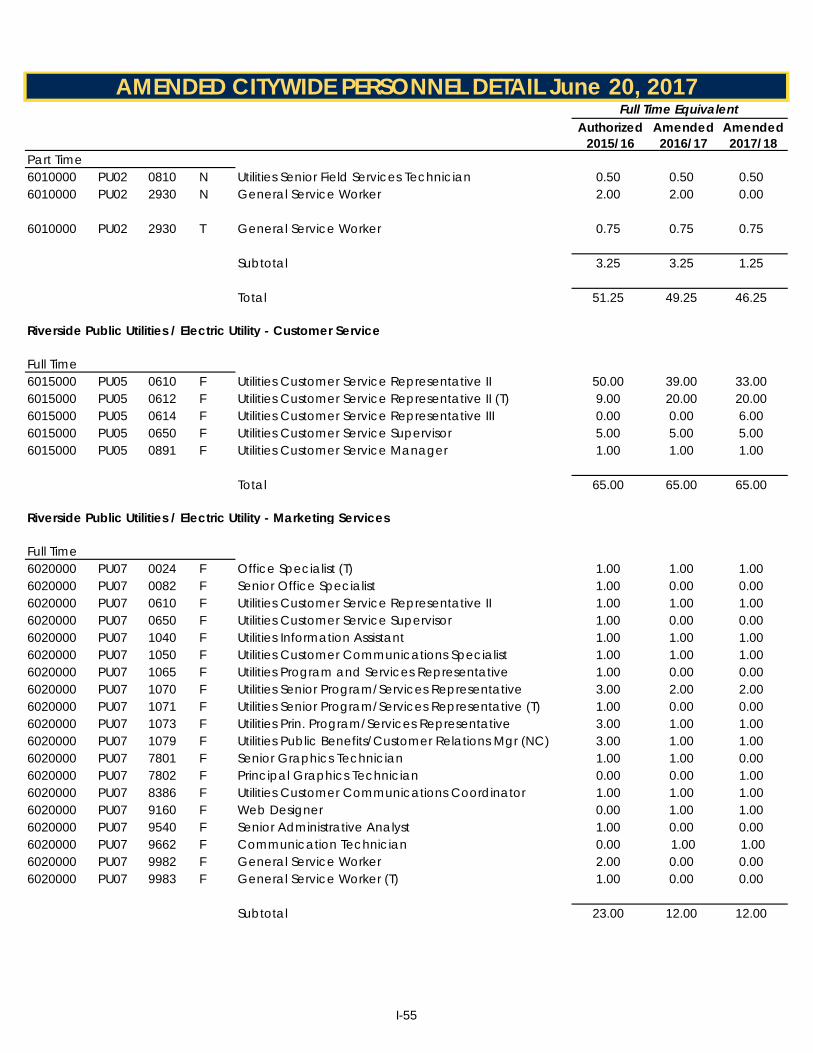
Authorized Amended AmendedGL Key Loc Job Type Job Title 2015/16 2016/17 2017/18
AMENDED CITYWIDE PERSONNEL DETAIL June 20, 2017Full Time Equivalent
PCN
Part Time6010000 PU02 0810 N Utilities Senior Field Services Technician 0.50 0.50 0.506010000 PU02 2930 N General Service Worker 2.00 2.00 0.00
6010000 PU02 2930 T General Service Worker 0.75 0.75 0.75
Subtotal 3.25 3.25 1.25
Total 51.25 49.25 46.25
Riverside Public Utilities / Electric Utility - Customer Service
Full Time6015000 PU05 0610 F Utilities Customer Service Representative II 50.00 39.00 33.006015000 PU05 0612 F Utilities Customer Service Representative II (T) 9.00 20.00 20.006015000 PU05 0614 F Utilities Customer Service Representative III 0.00 0.00 6.006015000 PU05 0650 F Utilities Customer Service Supervisor 5.00 5.00 5.006015000 PU05 0891 F Utilities Customer Service Manager 1.00 1.00 1.00
Total 65.00 65.00 65.00
Riverside Public Utilities / Electric Utility - Marketing Services
Full Time6020000 PU07 0024 F Office Specialist (T) 1.00 1.00 1.006020000 PU07 0082 F Senior Office Specialist 1.00 0.00 0.006020000 PU07 0610 F Utilities Customer Service Representative II 1.00 1.00 1.006020000 PU07 0650 F Utilities Customer Service Supervisor 1.00 0.00 0.006020000 PU07 1040 F Utilities Information Assistant 1.00 1.00 1.006020000 PU07 1050 F Utilities Customer Communications Specialist 1.00 1.00 1.006020000 PU07 1065 F Utilities Program and Services Representative 1.00 0.00 0.006020000 PU07 1070 F Utilities Senior Program/Services Representative 3.00 2.00 2.006020000 PU07 1071 F Utilities Senior Program/Services Representative (T) 1.00 0.00 0.006020000 PU07 1073 F Utilities Prin. Program/Services Representative 3.00 1.00 1.006020000 PU07 1079 F Utilities Public Benefits/Customer Relations Mgr (NC) 3.00 1.00 1.006020000 PU07 7801 F Senior Graphics Technician 1.00 1.00 0.006020000 PU07 7802 F Principal Graphics Technician 0.00 0.00 1.006020000 PU07 8386 F Utilities Customer Communications Coordinator 1.00 1.00 1.006020000 PU07 9160 F Web Designer 0.00 1.00 1.006020000 PU07 9540 F Senior Administrative Analyst 1.00 0.00 0.006020000 PU07 9662 F Communication Technician 0.00 1.00 1.00 6020000 PU07 9982 F General Service Worker 2.00 0.00 0.006020000 PU07 9983 F General Service Worker (T) 1.00 0.00 0.00
Subtotal 23.00 12.00 12.00
I-55

Authorized Amended AmendedGL Key Loc Job Type Job Title 2015/16 2016/17 2017/18
AMENDED CITYWIDE PERSONNEL DETAIL June 20, 2017Full Time Equivalent
PCN
Part Time6020000 PU07 0400 H Account Clerk I 0.50 0.00 0.006020000 PU07 0990 N Utility Surveyor/Installer 2.00 1.50 1.506020000 PU07 9160 H Web Designer 0.50 0.00 0.00
Subtotal 3.00 1.50 1.50
Total 26.00 13.50 13.50
Riverside Public Utilities / Electric Utility - Marketing Public Benefit
Full Time6020100 PU08 0082 F Senior Office Specialist 0.00 1.00 1.006020100 PU08 0610 F Utilities Customer Service Representative II 0.00 1.00 3.006020100 PU08 0650 F Utilities Customer Service Supervisor 0.00 1.00 1.006020100 PU08 1065 F Utilities Program and Services Representative 0.00 1.00 1.006020100 PU08 1070 F Utilities Senior Program/Services Representative 0.00 3.00 3.006020100 PU08 1071 F Utilities Senior Program/Services Representative (T) 0.00 1.00 1.006020100 PU08 1073 F Utilities Prin. Program/Services Representative 0.00 2.00 2.006020100 PU08 1079 F Utilities Public Benefits/Customer Relations Mgr (NC) 0.00 2.00 2.006020100 PU08 9982 F General Service Worker 0.00 1.00 0.006020100 PU08 9983 F General Service Worker (T) 0.00 1.00 0.00
Subtotal 0.00 14.00 14.00
Part Time
6020100 PU08 0990 N Utility Surveyor/Installer 0.00 0.50 0.50
Subtotal 0.00 0.50 0.50
Total 0.00 14.50 14.50
Riverside Public Utilities / Electric Utility - Legislative and Regulatory Risk
Full Time6025000 PU10 1073 F Utilities Principal Program and Services Representative 1.00 0.00 0.006025000 PU10 7521 F Utilities Power Resources Manager (NC) 1.00 1.00 1.006025000 PU10 8394 F Utilities Principal Analyst 0.00 1.00 1.00
Total 2.00 2.00 2.00
I-56
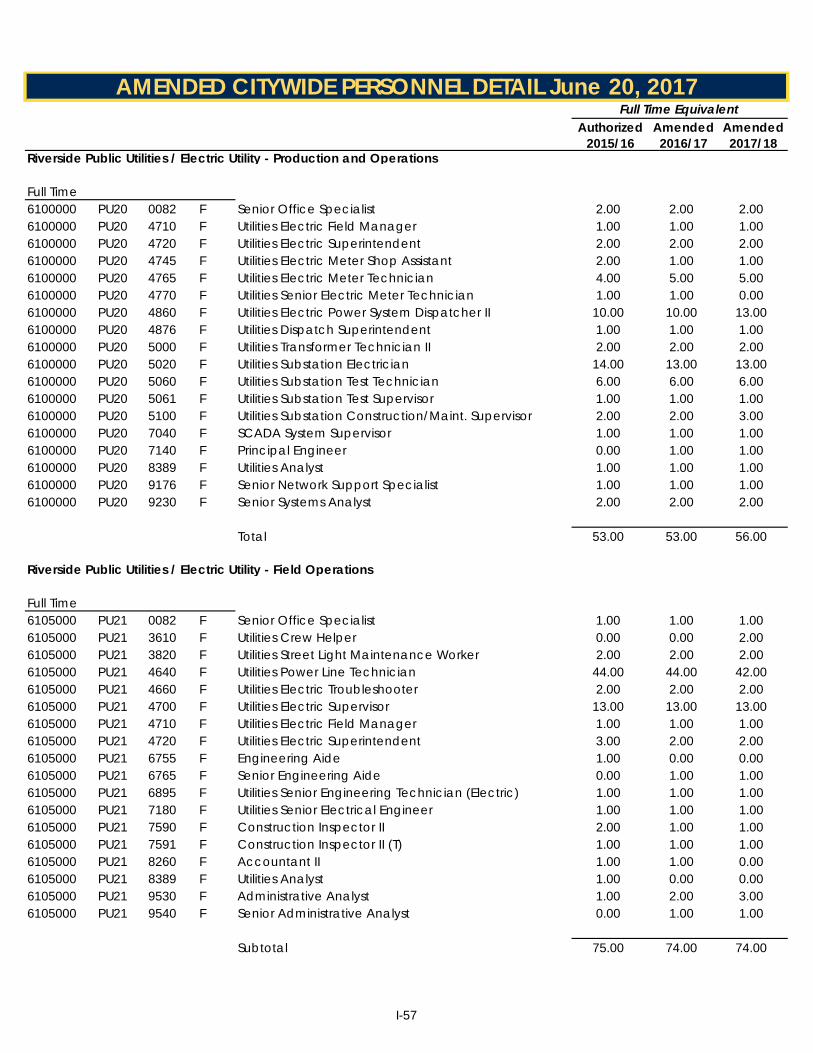
Authorized Amended AmendedGL Key Loc Job Type Job Title 2015/16 2016/17 2017/18
AMENDED CITYWIDE PERSONNEL DETAIL June 20, 2017Full Time Equivalent
PCN
Riverside Public Utilities / Electric Utility - Production and Operations
Full Time6100000 PU20 0082 F Senior Office Specialist 2.00 2.00 2.006100000 PU20 4710 F Utilities Electric Field Manager 1.00 1.00 1.006100000 PU20 4720 F Utilities Electric Superintendent 2.00 2.00 2.006100000 PU20 4745 F Utilities Electric Meter Shop Assistant 2.00 1.00 1.006100000 PU20 4765 F Utilities Electric Meter Technician 4.00 5.00 5.006100000 PU20 4770 F Utilities Senior Electric Meter Technician 1.00 1.00 0.006100000 PU20 4860 F Utilities Electric Power System Dispatcher II 10.00 10.00 13.006100000 PU20 4876 F Utilities Dispatch Superintendent 1.00 1.00 1.006100000 PU20 5000 F Utilities Transformer Technician II 2.00 2.00 2.006100000 PU20 5020 F Utilities Substation Electrician 14.00 13.00 13.006100000 PU20 5060 F Utilities Substation Test Technician 6.00 6.00 6.006100000 PU20 5061 F Utilities Substation Test Supervisor 1.00 1.00 1.006100000 PU20 5100 F Utilities Substation Construction/Maint. Supervisor 2.00 2.00 3.006100000 PU20 7040 F SCADA System Supervisor 1.00 1.00 1.006100000 PU20 7140 F Principal Engineer 0.00 1.00 1.006100000 PU20 8389 F Utilities Analyst 1.00 1.00 1.006100000 PU20 9176 F Senior Network Support Specialist 1.00 1.00 1.006100000 PU20 9230 F Senior Systems Analyst 2.00 2.00 2.00
Total 53.00 53.00 56.00
Riverside Public Utilities / Electric Utility - Field Operations
Full Time6105000 PU21 0082 F Senior Office Specialist 1.00 1.00 1.006105000 PU21 3610 F Utilities Crew Helper 0.00 0.00 2.006105000 PU21 3820 F Utilities Street Light Maintenance Worker 2.00 2.00 2.006105000 PU21 4640 F Utilities Power Line Technician 44.00 44.00 42.006105000 PU21 4660 F Utilities Electric Troubleshooter 2.00 2.00 2.006105000 PU21 4700 F Utilities Electric Supervisor 13.00 13.00 13.006105000 PU21 4710 F Utilities Electric Field Manager 1.00 1.00 1.006105000 PU21 4720 F Utilities Electric Superintendent 3.00 2.00 2.006105000 PU21 6755 F Engineering Aide 1.00 0.00 0.006105000 PU21 6765 F Senior Engineering Aide 0.00 1.00 1.006105000 PU21 6895 F Utilities Senior Engineering Technician (Electric) 1.00 1.00 1.006105000 PU21 7180 F Utilities Senior Electrical Engineer 1.00 1.00 1.006105000 PU21 7590 F Construction Inspector II 2.00 1.00 1.006105000 PU21 7591 F Construction Inspector II (T) 1.00 1.00 1.006105000 PU21 8260 F Accountant II 1.00 1.00 0.006105000 PU21 8389 F Utilities Analyst 1.00 0.00 0.006105000 PU21 9530 F Administrative Analyst 1.00 2.00 3.006105000 PU21 9540 F Senior Administrative Analyst 0.00 1.00 1.00
Subtotal 75.00 74.00 74.00
I-57
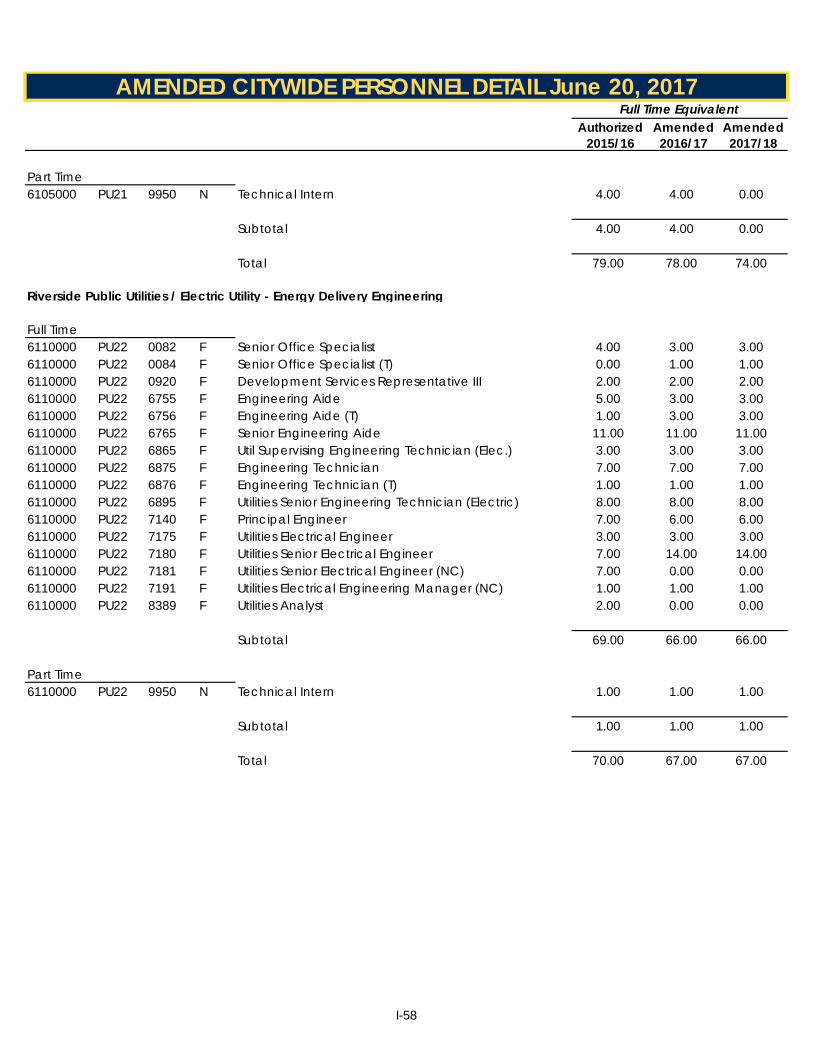
Authorized Amended AmendedGL Key Loc Job Type Job Title 2015/16 2016/17 2017/18
AMENDED CITYWIDE PERSONNEL DETAIL June 20, 2017Full Time Equivalent
PCN
Part Time6105000 PU21 9950 N Technical Intern 4.00 4.00 0.00
Subtotal 4.00 4.00 0.00
Total 79.00 78.00 74.00
Riverside Public Utilities / Electric Utility - Energy Delivery Engineering
Full Time6110000 PU22 0082 F Senior Office Specialist 4.00 3.00 3.006110000 PU22 0084 F Senior Office Specialist (T) 0.00 1.00 1.006110000 PU22 0920 F Development Services Representative III 2.00 2.00 2.006110000 PU22 6755 F Engineering Aide 5.00 3.00 3.006110000 PU22 6756 F Engineering Aide (T) 1.00 3.00 3.006110000 PU22 6765 F Senior Engineering Aide 11.00 11.00 11.006110000 PU22 6865 F Util Supervising Engineering Technician (Elec.) 3.00 3.00 3.006110000 PU22 6875 F Engineering Technician 7.00 7.00 7.006110000 PU22 6876 F Engineering Technician (T) 1.00 1.00 1.006110000 PU22 6895 F Utilities Senior Engineering Technician (Electric) 8.00 8.00 8.006110000 PU22 7140 F Principal Engineer 7.00 6.00 6.006110000 PU22 7175 F Utilities Electrical Engineer 3.00 3.00 3.006110000 PU22 7180 F Utilities Senior Electrical Engineer 7.00 14.00 14.006110000 PU22 7181 F Utilities Senior Electrical Engineer (NC) 7.00 0.00 0.006110000 PU22 7191 F Utilities Electrical Engineering Manager (NC) 1.00 1.00 1.006110000 PU22 8389 F Utilities Analyst 2.00 0.00 0.00
Subtotal 69.00 66.00 66.00
Part Time6110000 PU22 9950 N Technical Intern 1.00 1.00 1.00
Subtotal 1.00 1.00 1.00
Total 70.00 67.00 67.00
I-58

Authorized Amended AmendedGL Key Loc Job Type Job Title 2015/16 2016/17 2017/18
AMENDED CITYWIDE PERSONNEL DETAIL June 20, 2017Full Time Equivalent
PCN
Riverside Public Utilities / Electric Utility - Power Supply Operations
Full Time6120000 PU24 0345 F Administrative Assistant 1.00 0.00 0.006120000 PU24 7235 F Utilities Power Scheduler/Trader 16.00 16.00 16.006120000 PU24 7245 F Utilities Resources Analyst 2.00 2.00 2.006120000 PU24 7246 F Utilities Senior Resources Analyst 8.00 8.00 8.006120000 PU24 7247 F Utilities Principal Resources Analyst 5.00 5.00 7.00 6120000 PU24 7521 F Utilities Power Resources Manager (NC) 3.00 3.00 3.006120000 PU24 8394 F Utilities Principal Analyst 1.00 1.00 1.00
Subtotal 36.00 35.00 37.00
Part Time6120000 PU24 9950 N Technical Intern 1.00 1.00 1.00
Subtotal 1.00 1.00 1.00
Total 37.00 36.00 38.00
I-59

Authorized Amended AmendedGL Key Loc Job Type Job Title 2015/16 2016/17 2017/18
AMENDED CITYWIDE PERSONNEL DETAIL June 20, 2017Full Time Equivalent
PCN
Riverside Public Utilities / Electric Utility - Riverside Energy Resource Center Generating Plant
Full Time6120130 PU26 0082 F Senior Office Specialist 1.00 1.00 1.006120130 PU26 1130 F Inventory Control Specialist 0.00 0.00 1.006120130 PU26 4708 F Utilities Generation Manager (NC) 1.00 1.00 1.006120130 PU26 5020 F Utilities Substation Electrician 1.00 1.00 1.006120130 PU26 5030 F Utilities Generation Technician 6.00 6.00 4.00
6120130 PU26 5035 F Utilities Generation Test Technician 2.00 2.00 2.006120130 PU26 5040 F Utilities Senior Generation Test Technician 1.00 1.00 1.006120130 PU26 5060 F Utilities Substation Test Technician 1.00 0.00 0.006120130 PU26 5100 F Utilities Substation Conservation/Maintenance Sup. 1.00 1.00 1.006120130 PU26 7246 F Utilities Senior Resources Analyst 1.00 1.00 1.006120130 PU26 7411 F Utilities Generation Plant Manager (NC) 1.00 1.00 1.006120130 PU26 9230 F Senior Systems Analyst 0.00 0.00 1.00
Subtotal 16.00 15.00 15.00
Part Time6120130 PU26 2930 N General Service Worker 0.50 0.50 0.00
Subtotal 0.50 0.50 0.00
Total 16.50 15.50 15.00
Riverside Public Utilities / Electric Utility - Clearwater Generating Plant
Full Time6120140 PU27 5030 F Utilities Generation Technician 4.00 3.00 3.006120140 PU27 5031 F Utilities Senior Generation Technician 0.00 1.00 1.006120140 PU27 5035 F Utilities Generation Test Technician 1.00 1.00 1.006120140 PU27 7411 F Utilities Generation Plant Manager (NC) 1.00 1.00 1.00
Total 6.00 6.00 6.00
I-60
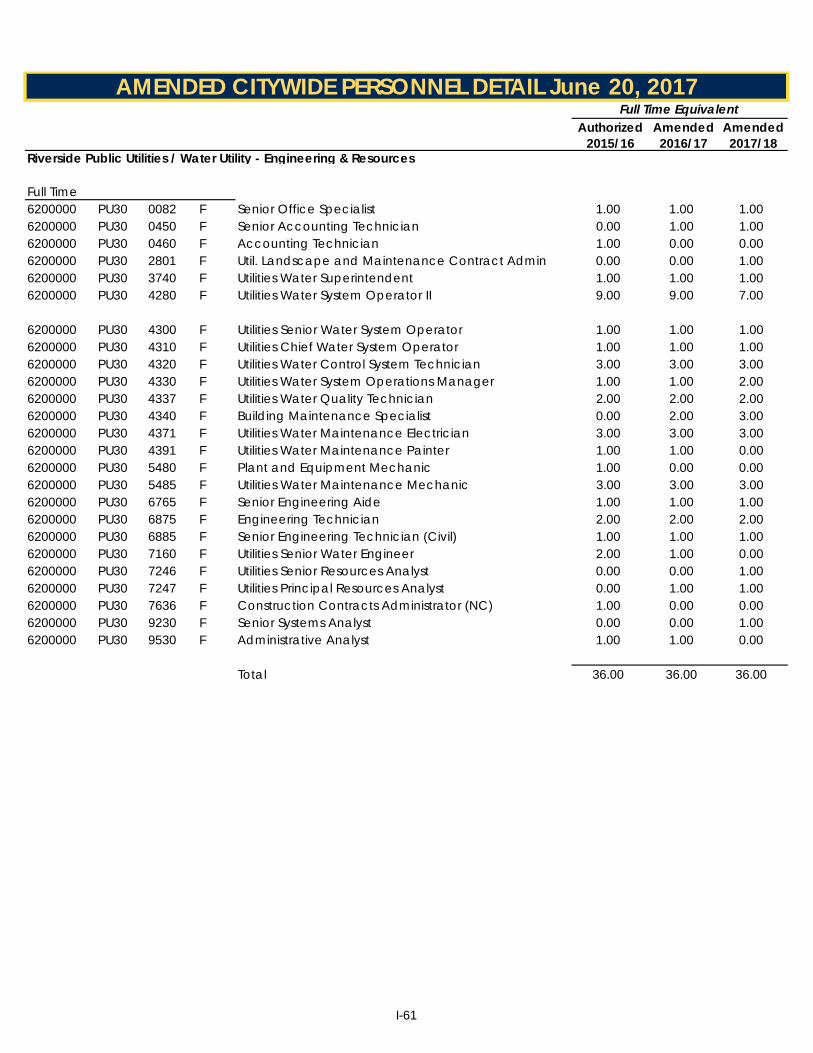
Authorized Amended AmendedGL Key Loc Job Type Job Title 2015/16 2016/17 2017/18
AMENDED CITYWIDE PERSONNEL DETAIL June 20, 2017Full Time Equivalent
PCN
Riverside Public Utilities / Water Utility - Engineering & Resources
Full Time6200000 PU30 0082 F Senior Office Specialist 1.00 1.00 1.006200000 PU30 0450 F Senior Accounting Technician 0.00 1.00 1.006200000 PU30 0460 F Accounting Technician 1.00 0.00 0.006200000 PU30 2801 F Util. Landscape and Maintenance Contract Admin 0.00 0.00 1.006200000 PU30 3740 F Utilities Water Superintendent 1.00 1.00 1.006200000 PU30 4280 F Utilities Water System Operator II 9.00 9.00 7.00
6200000 PU30 4300 F Utilities Senior Water System Operator 1.00 1.00 1.006200000 PU30 4310 F Utilities Chief Water System Operator 1.00 1.00 1.006200000 PU30 4320 F Utilities Water Control System Technician 3.00 3.00 3.006200000 PU30 4330 F Utilities Water System Operations Manager 1.00 1.00 2.006200000 PU30 4337 F Utilities Water Quality Technician 2.00 2.00 2.006200000 PU30 4340 F Building Maintenance Specialist 0.00 2.00 3.006200000 PU30 4371 F Utilities Water Maintenance Electrician 3.00 3.00 3.006200000 PU30 4391 F Utilities Water Maintenance Painter 1.00 1.00 0.006200000 PU30 5480 F Plant and Equipment Mechanic 1.00 0.00 0.006200000 PU30 5485 F Utilities Water Maintenance Mechanic 3.00 3.00 3.006200000 PU30 6765 F Senior Engineering Aide 1.00 1.00 1.006200000 PU30 6875 F Engineering Technician 2.00 2.00 2.006200000 PU30 6885 F Senior Engineering Technician (Civil) 1.00 1.00 1.006200000 PU30 7160 F Utilities Senior Water Engineer 2.00 1.00 0.006200000 PU30 7246 F Utilities Senior Resources Analyst 0.00 0.00 1.006200000 PU30 7247 F Utilities Principal Resources Analyst 0.00 1.00 1.006200000 PU30 7636 F Construction Contracts Administrator (NC) 1.00 0.00 0.006200000 PU30 9230 F Senior Systems Analyst 0.00 0.00 1.006200000 PU30 9530 F Administrative Analyst 1.00 1.00 0.00
Total 36.00 36.00 36.00
I-61
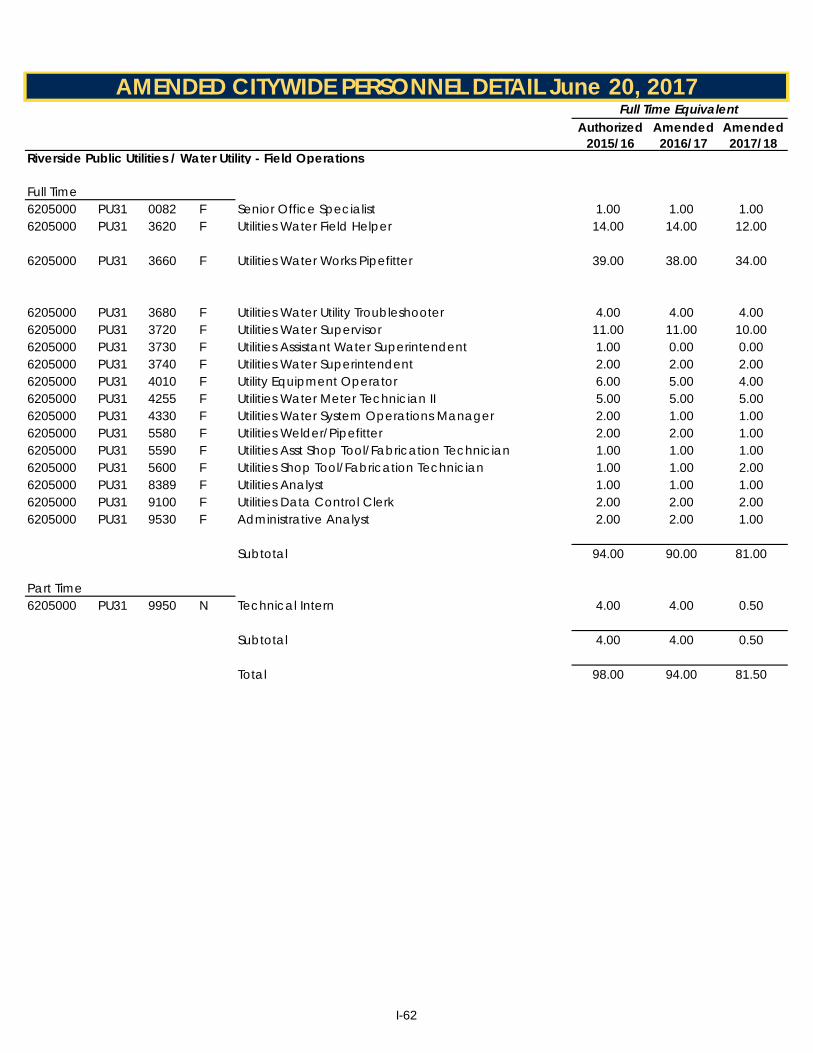
Authorized Amended AmendedGL Key Loc Job Type Job Title 2015/16 2016/17 2017/18
AMENDED CITYWIDE PERSONNEL DETAIL June 20, 2017Full Time Equivalent
PCN
Riverside Public Utilities / Water Utility - Field Operations
Full Time6205000 PU31 0082 F Senior Office Specialist 1.00 1.00 1.006205000 PU31 3620 F Utilities Water Field Helper 14.00 14.00 12.00
6205000 PU31 3660 F Utilities Water Works Pipefitter 39.00 38.00 34.00
6205000 PU31 3680 F Utilities Water Utility Troubleshooter 4.00 4.00 4.006205000 PU31 3720 F Utilities Water Supervisor 11.00 11.00 10.006205000 PU31 3730 F Utilities Assistant Water Superintendent 1.00 0.00 0.006205000 PU31 3740 F Utilities Water Superintendent 2.00 2.00 2.006205000 PU31 4010 F Utility Equipment Operator 6.00 5.00 4.006205000 PU31 4255 F Utilities Water Meter Technician II 5.00 5.00 5.006205000 PU31 4330 F Utilities Water System Operations Manager 2.00 1.00 1.006205000 PU31 5580 F Utilities Welder/Pipefitter 2.00 2.00 1.006205000 PU31 5590 F Utilities Asst Shop Tool/Fabrication Technician 1.00 1.00 1.006205000 PU31 5600 F Utilities Shop Tool/Fabrication Technician 1.00 1.00 2.006205000 PU31 8389 F Utilities Analyst 1.00 1.00 1.006205000 PU31 9100 F Utilities Data Control Clerk 2.00 2.00 2.006205000 PU31 9530 F Administrative Analyst 2.00 2.00 1.00
Subtotal 94.00 90.00 81.00
Part Time6205000 PU31 9950 N Technical Intern 4.00 4.00 0.50
Subtotal 4.00 4.00 0.50
Total 98.00 94.00 81.50
I-62
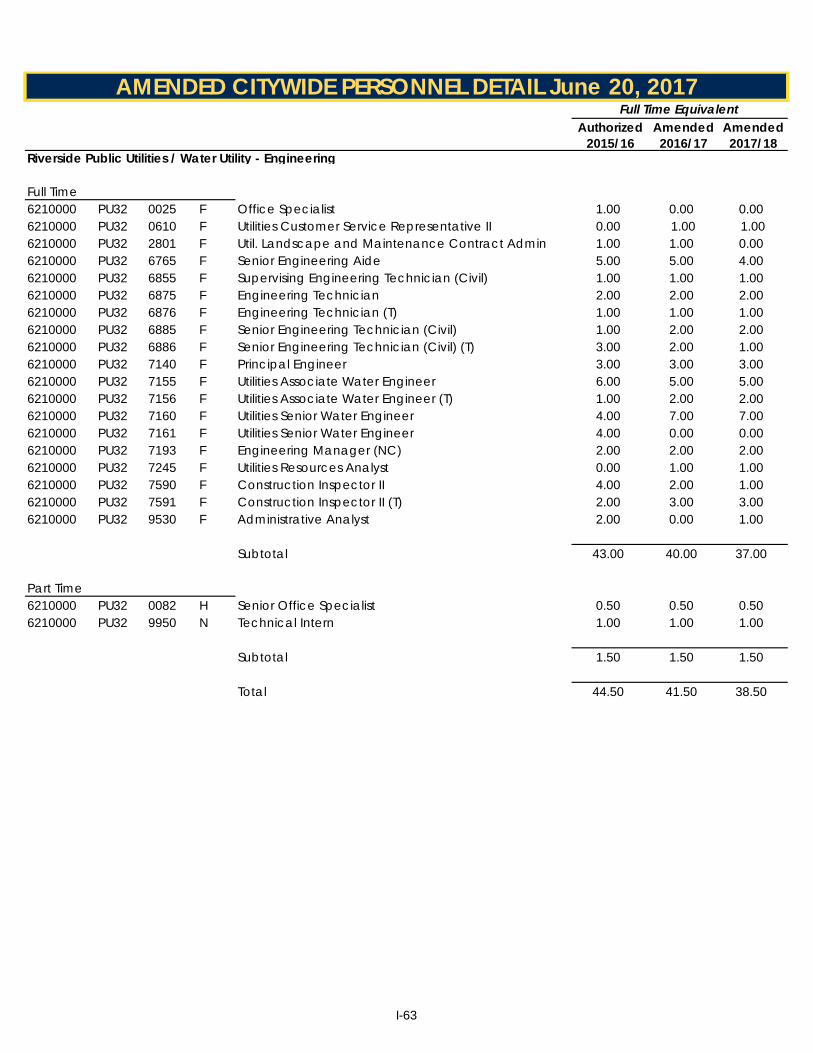
Authorized Amended AmendedGL Key Loc Job Type Job Title 2015/16 2016/17 2017/18
AMENDED CITYWIDE PERSONNEL DETAIL June 20, 2017Full Time Equivalent
PCN
Riverside Public Utilities / Water Utility - Engineering
Full Time6210000 PU32 0025 F Office Specialist 1.00 0.00 0.006210000 PU32 0610 F Utilities Customer Service Representative II 0.00 1.00 1.00 6210000 PU32 2801 F Util. Landscape and Maintenance Contract Admin 1.00 1.00 0.006210000 PU32 6765 F Senior Engineering Aide 5.00 5.00 4.006210000 PU32 6855 F Supervising Engineering Technician (Civil) 1.00 1.00 1.006210000 PU32 6875 F Engineering Technician 2.00 2.00 2.006210000 PU32 6876 F Engineering Technician (T) 1.00 1.00 1.006210000 PU32 6885 F Senior Engineering Technician (Civil) 1.00 2.00 2.006210000 PU32 6886 F Senior Engineering Technician (Civil) (T) 3.00 2.00 1.006210000 PU32 7140 F Principal Engineer 3.00 3.00 3.006210000 PU32 7155 F Utilities Associate Water Engineer 6.00 5.00 5.006210000 PU32 7156 F Utilities Associate Water Engineer (T) 1.00 2.00 2.006210000 PU32 7160 F Utilities Senior Water Engineer 4.00 7.00 7.006210000 PU32 7161 F Utilities Senior Water Engineer 4.00 0.00 0.006210000 PU32 7193 F Engineering Manager (NC) 2.00 2.00 2.006210000 PU32 7245 F Utilities Resources Analyst 0.00 1.00 1.006210000 PU32 7590 F Construction Inspector II 4.00 2.00 1.006210000 PU32 7591 F Construction Inspector II (T) 2.00 3.00 3.006210000 PU32 9530 F Administrative Analyst 2.00 0.00 1.00
Subtotal 43.00 40.00 37.00
Part Time6210000 PU32 0082 H Senior Office Specialist 0.50 0.50 0.506210000 PU32 9950 N Technical Intern 1.00 1.00 1.00
Subtotal 1.50 1.50 1.50
Total 44.50 41.50 38.50
I-63

Authorized Amended AmendedGL Key Loc Job Type Job Title 2015/16 2016/17 2017/18
AMENDED CITYWIDE PERSONNEL DETAIL June 20, 2017Full Time Equivalent
PCN
Riverside Public Utilities / Water Utility - Conservation and Reclamation Program
Full Time6220200 PU34 1065 F Utilities Program/Services Representative 1.00 1.00 1.006220200 PU34 1070 F Utilities Senior Program/Services Representative 1.00 1.00 1.00
2.00 2.00 2.00Subtotal
Part Time6220200 PU34 0990 N Utility Surveyor/Installer 0.65 0.65 0.65
Subtotal 0.65 0.65 0.65
Total 2.65 2.65 2.65
Riverside Public Utilities / Central Stores
Full Time6400000 PU50 0430 F Senior Account Clerk 1.00 0.00 0.006400000 PU50 1130 F Inventory Control Specialist 5.00 3.00 3.006400000 PU50 1131 F Inventory Control Specialist (T) 0.00 2.00 2.00 6400000 PU50 1150 F Senior Inventory Control Specialist 1.00 2.00 2.006400000 PU50 1170 F Warehouse Supervisor 1.00 1.00 1.00
Total 8.00 8.00 8.00
Department Total 653.90 653.90 655.90
GRAND TOTAL AUTHORIZED POSITIONS (AMENDED) 2,503.54 2,428.68 2,478.93
I-64