THIRD QUARTER EARNINGS CALLs1.q4cdn.com › 880135780 › files › doc_presentations › ... ·...
35
THIRD QUARTER EARNINGS CALL October 28, 2014
Transcript of THIRD QUARTER EARNINGS CALLs1.q4cdn.com › 880135780 › files › doc_presentations › ... ·...

THIRD QUARTER EARNINGS CALL October 28, 2014

2
Safe Harbor Statements
Management's statements regarding PG&E Corporation’s 2014 earnings per share; estimated amounts of future non-recoverable pipeline-related costs, capital expenditures, rate base, and equity issuances; and the assumptions and forecasts on which the statements are based, are forward-looking statements. These statements are necessarily subject to various risks and uncertainties, the realization or resolution of which may be outside of management’s control. These statements, and the underlying assumptions and forecasts, reflect management’s judgment and opinions. PG&E Corporation and the Utility are not able to predict all the factors that may affect future results. Some of the factors that could cause actual results to differ materially include: • the timing and outcomes of the pending CPUC investigations, the criminal prosecution, and other investigations relating to the Utility, including the ultimate
amount of fines imposed, whether a monitor is appointed to oversee the Utility’s natural gas operations, and the ultimate amount of costs the Utility incurs that are not recoverable or are disallowed including the cost of required remedial actions;
• the timing and outcome of additional regulatory enforcement actions or criminal investigations that may be or have been commenced relating to the Utility’s natural gas operating practices or compliance with the CPUC’s rules regarding ex parte communications and whether such additional actions or investigations negatively affect the outcome of ratemaking proceedings, such as the 2015 GT&S rate case, or the pending CPUC investigations;
• whether PG&E Corporation and the Utility are able to repair the harm to their reputations caused by the continuing negative publicity about the San Bruno accident, the CPUC investigations, the criminal prosecution, the Utility’s self-reports of noncompliance with certain natural gas safety regulations and the CPUC rules regarding ex parte communications, and the ongoing work to remove encroachments from transmission pipeline rights-of-way;
• the outcome of future investigations, citations, or other enforcement proceedings, that may be commenced relating to the Utility’s compliance with laws, rules, regulations, or orders applicable to its operations, including the construction, expansion or replacement of its electric and gas facilities; inspection and maintenance practices, customer billing and privacy, and physical and cyber security; and whether the current or potentially worsening state regulatory environment increases the likelihood of unfavorable outcomes;
• higher electricity procurement costs and whether the Utility is able to recover such higher costs in a timely way; • the amount and timing of additional common stock issuances by PG&E Corporation; • the ability of PG&E Corporation and the Utility to access capital markets and other sources of debt and equity financing in a timely manner on acceptable
terms; • changes in credit ratings that could result in increased borrowing costs especially if PG&E Corporation or the Utility were to lose its investment grade credit
ratings; • whether the ultimate outcome of the pending investigations and proceedings relating to the Utility’s natural gas operations affects the Utility’s ability to make
distributions to PG&E Corporation, and, in turn, PG&E Corporation’s ability to pay dividends; • the occurrence of events that cause unplanned outages, reduce generating output, disrupt service to customers, damage property owned by the Utility or third
parties, subject the Utility to claims by third parties, or result in the imposition of civil, criminal, or regulatory penalties on the Utility; • the impact of changes in GAAP, standards, rules, or policies, including those related to regulatory accounting, and the impact of changes in their interpretation
or application; and • the other factors disclosed in PG&E Corporation’s and the Utility’s joint 2013 Annual Report and Quarterly Report on Form 10-Q for the quarters ended March
31, June 30, and September 30, 2014.
This presentation is not complete without the accompanying statements made by management during the webcast conference call held on October 28, 2014. This presentation, including Appendices, and the accompanying press release were attached to PG&E Corporation’s Current Report on Form 8-K that was furnished to the Securities and Exchange Commission on October 28, 2014 and, along with the replay of the conference call, is also available on PG&E Corporation’s website at www.pge-corp.com.
3
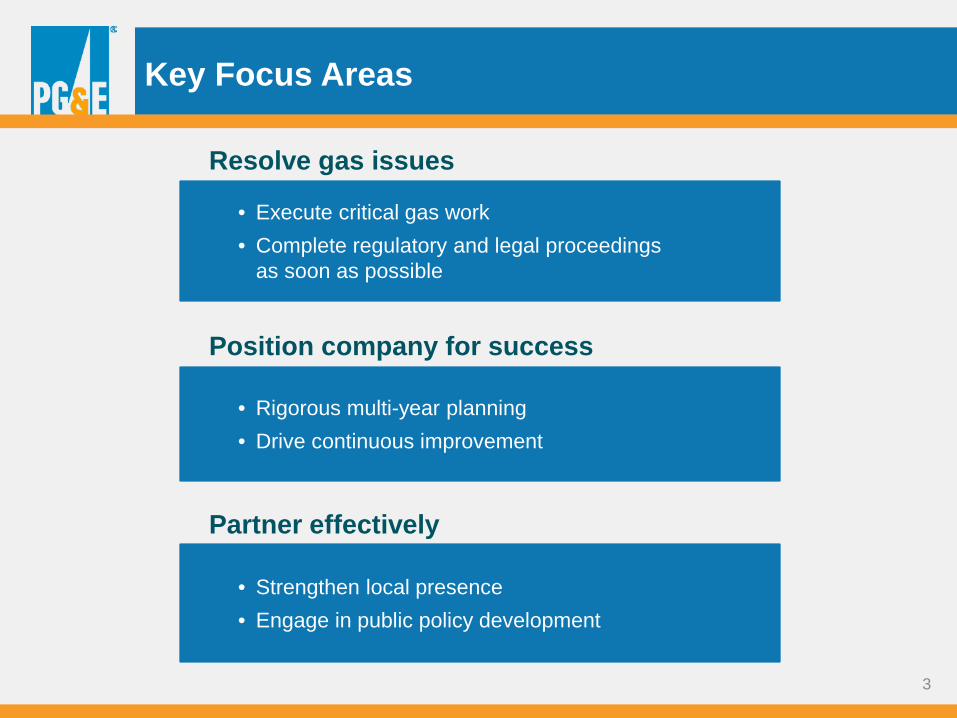
Key Focus Areas
• Execute critical gas work • Complete regulatory and legal proceedings
as soon as possible
• Rigorous multi-year planning • Drive continuous improvement
• Strengthen local presence • Engage in public policy development
Resolve gas issues
Position company for success
Partner effectively

4
• Gas Investigations – Presiding Officers’ Decisions issued Sept 2 • General Rate Case – Final Decision issued August 14 • Gas Transmission and Storage rate case – Testimony filed and
public participation hearings complete; Order to Show Cause launched, ALJ reassigned and schedule suspended following PG&E notice of ex parte communications September 15
• TO 16 – accepted at FERC September 30 • PSEP Update – Proposed Decision affirming settlement October 16
Regulatory Update
Operational and Regulatory Update
Executing on Operations Napa Earthquake Response • Restored electric power to more than 70,000 customers in 24 hours • 6,000 customer gas calls; 2,500 courtesy gas safety checks • In-depth leak surveys using vehicle-mounted detection systems Gas Safety Work in 2014 • Tested, or validated through records, 147 miles of pipe • Replaced or installed 20 miles of pipeline • Installed 44 automated valves

5
Q3 2014: Earnings Results
Earnings from Operations is not calculated in accordance with GAAP and excludes items impacting comparability. See Exhibit A in Appendix 2 for a reconciliation of Earnings per Share (“EPS”) from Operations to EPS on a GAAP basis.
Earnings (millions)
EPS
Earnings from Operations 820$ 1.73$
Items Impacting Comparability
Natural Gas Matters (13) (0.03)
Environmental-Related Costs 4 0.01
Earnings on a GAAP Basis 811$ 1.71$
Q3
Q3 Pipeline-related expenses (108)$ Accrued fines - Third-party liability claims - Insurance recoveries 86 Total (22)$
Natural Gas Matters (millions, pre-tax)
6
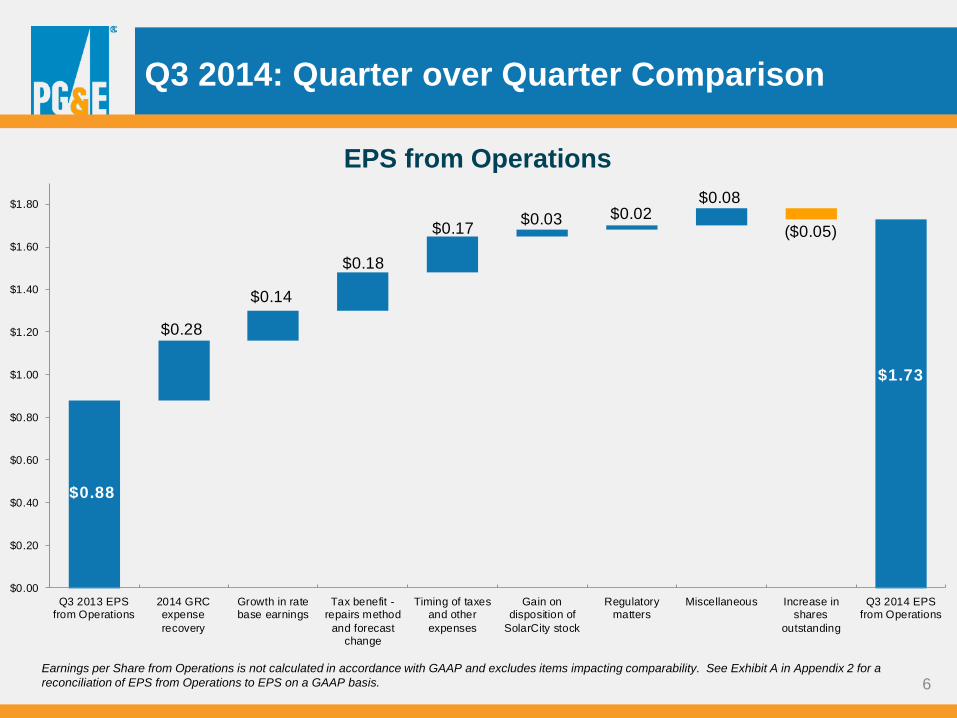
Q3 2014: Quarter over Quarter Comparison
EPS from Operations
Earnings per Share from Operations is not calculated in accordance with GAAP and excludes items impacting comparability. See Exhibit A in Appendix 2 for a reconciliation of EPS from Operations to EPS on a GAAP basis.
$0.88
$1.73
$0.28
$0.14
$0.18
$0.17 $0.03 $0.02 $0.08
($0.05)
$0.00
$0.20
$0.40
$0.60
$0.80
$1.00
$1.20
$1.40
$1.60
$1.80
Q3 2013 EPSfrom Operations
2014 GRCexpenserecovery
Growth in ratebase earnings
Tax benefit -repairs method
and forecastchange
Timing of taxesand otherexpenses
Gain ondisposition of
SolarCity stock
Regulatorymatters
Miscellaneous Increase inshares
outstanding
Q3 2014 EPSfrom Operations

7
Assumptions for 2014
Return on Equity: 10.4% Equity Ratio: 52%
Authorized Cost of Capital*
Authorized Rate Base (weighted average) ($ billions)
Other Factors Affecting Earnings from Operations
- Under-earning on Gas Transmission & Storage • Gas expense • Gas capital • Gas storage revenues
+ Tax benefits – repairs method and forecast change + Monetizing shares in SolarCity + Gas transmission revenues + Incentive revenues
CWIP earnings: offset by below-the-line costs
Capital Expenditures ($ millions)
*Electric Transmission rate base reflects full TO15 request *Includes $400 M previously reserved for limits on PSEP authorized spend
*CPUC authorized
Changes from prior quarter are noted in blue.
See the Safe Harbor Statements for factors that could cause actual results to differ materially from the guidance presented and underlying assumptions.
2014Electric Distribution 1,950Electric Transmission 1,000Gas Transmission 400Gas Distribution 700Generation 650
Separately FundedPSEP* 400Total CapEx ~5.1 billion
2014Electric Distribution 12.3Electric Transmission* 4.6Gas Transmission 1.8Gas Distribution 3.7Generation 5.2
Separately FundedPSEP 0.6Total Rate Base ~28.2
8
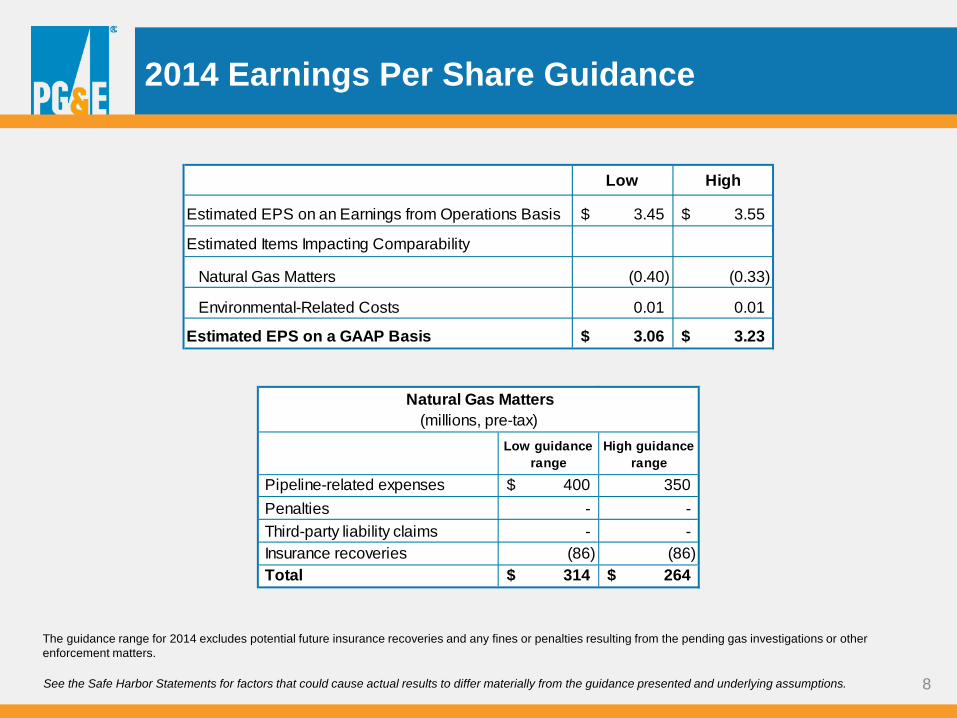
2014 Earnings Per Share Guidance
The guidance range for 2014 excludes potential future insurance recoveries and any fines or penalties resulting from the pending gas investigations or other enforcement matters.
Low High
Estimated EPS on an Earnings from Operations Basis 3.45$ 3.55$
Estimated Items Impacting Comparability
Natural Gas Matters (0.40) (0.33)
Environmental-Related Costs 0.01 0.01
Estimated EPS on a GAAP Basis 3.06$ 3.23$
See the Safe Harbor Statements for factors that could cause actual results to differ materially from the guidance presented and underlying assumptions.
Low guidance range
High guidance range
Pipeline-related expenses 400$ 350 Penalties - - Third-party liability claims - - Insurance recoveries (86) (86) Total 314$ 264$
Natural Gas Matters (millions, pre-tax)

9
($ millions, pre-tax) 2014Unrecovered PSEP Expenses 150 - 175
Non-PSEP Expenses 150 - 175
Rights of Way Encroachment
Integrity Management and Other Work
Legal and Other ~ 50
Pipeline Related Expenses 350 - 400
2014 Natural Gas Matters
Guidance range excludes potential future insurance recoveries and any fines or penalties resulting from the pending gas investigations or other enforcement matters.
See Exhibit E in Appendix 2 for detailed 2014 Natural Gas Matters Item Impacting Comparability guidance.
Changes from prior quarter are noted in blue.
See the Safe Harbor Statements for factors that could cause actual results to differ materially from the guidance presented and underlying assumptions.

10
2014 Equity Issuance
2014
$800M - 1,000M $800M - 900M
2013 EOY shares outstanding: 457M
Does not reflect resolution of pending investigations or other enforcement matters
- Lower capital expenditures
- Lower unrecovered gas costs
- Depreciation rate change
+ Cash impact of delayed GRC resolution
2014
Changes from prior quarter are noted in blue.
See the Safe Harbor Statements for factors that could cause actual results to differ materially from the guidance presented and underlying assumptions.

11
Looking Ahead: Capital Expenditures 2014-2016
~$5.1B
$5.4B - 5.6B $5.3B - 5.8B
2014 (1) 2015 2016
(1) 2014 capex includes ~$400 million that has already been reserved for PSEP capital that exceeds authorized amounts.
The ranges reflect recent regulatory decisions, current or planned regulatory filings, and historic spending patterns.
See the Safe Harbor Statements for factors that could cause actual results to differ materially from the guidance presented and underlying assumptions.
12
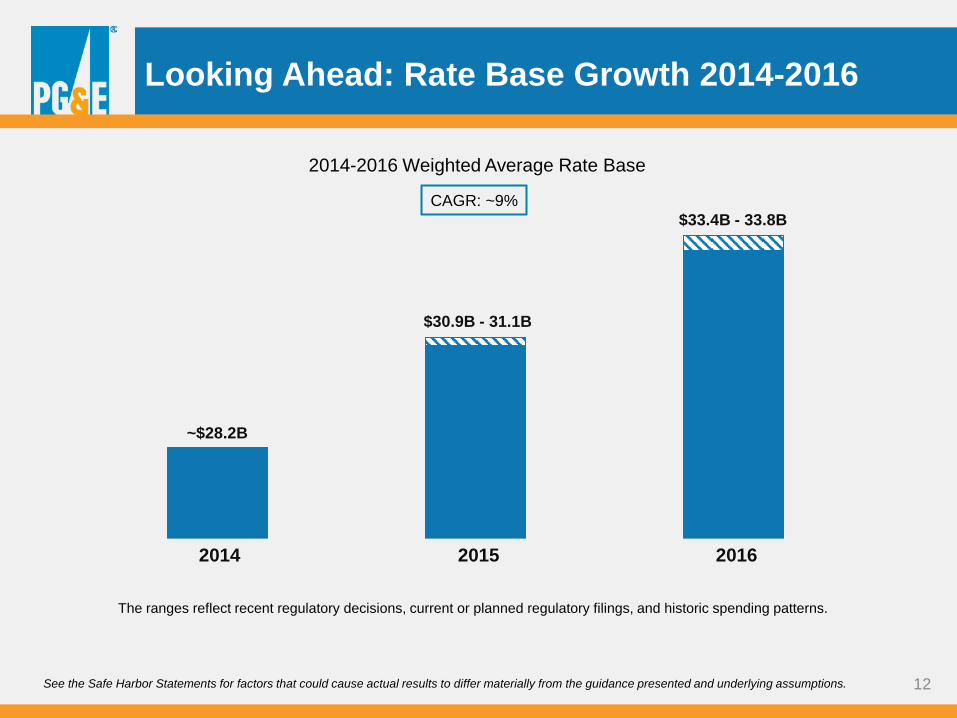
Looking Ahead: Rate Base Growth 2014-2016
$33.4B - 33.8B
~$28.2B
2014 2016 2015
$30.9B - 31.1B
2014-2016 Weighted Average Rate Base
CAGR: ~9%
The ranges reflect recent regulatory decisions, current or planned regulatory filings, and historic spending patterns.
See the Safe Harbor Statements for factors that could cause actual results to differ materially from the guidance presented and underlying assumptions.

13
Appendix 1 – Regulatory and Guidance Matters
• Updates to Appendix 1 Since the Previous Quarter slide 14
Rate Cases
• 2014 CPUC General Rate Case slide 15
• 2015 CPUC Gas Transmission and Storage Rate Case slide 16
• FERC Transmission Owner Rate Cases slide 17
Natural Gas Matters • Gas Regulatory Proceedings Schedule slide 18
• Gas Pipeline Safety Costs slide 19
• Presiding Officers’ Penalty Decisions: Estimated Total Shareholder Impact slide 20
• Incremental Equity Factors slide 21
14
Updates to Appendix 1 Since the Previous Quarter
• Slide 15 2014 CPUC General Rate Case
• Slide 16 2015 CPUC Gas Transmission and Storage Rate Case
• Slide 17 FERC Transmission Owner Rate Cases
• Slide 18 Gas Regulatory Proceedings Schedule
• Slide 19 Gas Pipeline Safety Costs
• Slide 20 Presiding Officers’ Penalty Decisions: Estimated Total Shareholder Impact
15
2014
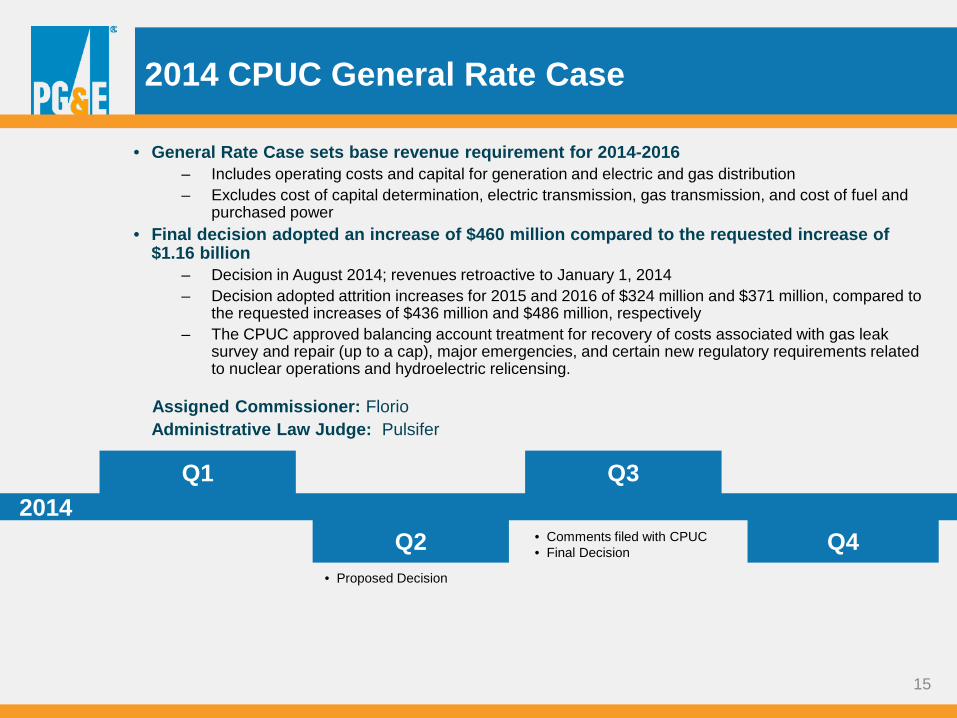
2014 CPUC General Rate Case
• General Rate Case sets base revenue requirement for 2014-2016 – Includes operating costs and capital for generation and electric and gas distribution – Excludes cost of capital determination, electric transmission, gas transmission, and cost of fuel and
purchased power • Final decision adopted an increase of $460 million compared to the requested increase of
$1.16 billion – Decision in August 2014; revenues retroactive to January 1, 2014 – Decision adopted attrition increases for 2015 and 2016 of $324 million and $371 million, compared to
the requested increases of $436 million and $486 million, respectively – The CPUC approved balancing account treatment for recovery of costs associated with gas leak
survey and repair (up to a cap), major emergencies, and certain new regulatory requirements related to nuclear operations and hydroelectric relicensing.
Assigned Commissioner: Florio Administrative Law Judge: Pulsifer
• Comments filed with CPUC • Final Decision
Q1
Q2
Q3
Q4 • Proposed Decision

16
2015 CPUC Gas Transmission and Storage Rate Case
• Application filed with the CPUC on December 19, 2013 • Request for authorized revenue requirement for 2015-2017
– Includes operating costs and capital for CPUC jurisdictional gas transmission and storage • 2015 requested revenue requirement of $1.3 billion includes increase of $555 million
– Request reflects significant expense and capital to comply with new gas regulations – Requested attrition increases of $61 million and $168 million in 2016 and 2017, respectively
• ALJ approved revenue requirement retroactive to January 1, 2015 • Order to Show Cause issued on September 17, 2014 after PG&E self-reported ex parte
communication. Proposed Decision and Alternate PD issued October 16, 2014. Assigned Commissioner: Peterman (Commissioners Peevey and Florio have recused
themselves from proceeding) Administrative Law Judge: Yip-Kikugawa (case reassigned from Wong)
Q4 Q2
Q1 Q3 Q1 2014
• OSC hearing • OSC Proposed
Decision and Alternate PD
• Prehearing conference
• Prehearing conference
• Scoping Memo • Retroactivity motion
approved
• SED risk report • Intervenor testimony • Public participation
hearings • Self-reported ex parte
communication • Schedule suspended
2015

17
FERC Transmission Owner Rate Cases
• September 2013 – FERC accepted TO15 subject to refund
• Requested revenue requirement of $1.072 billion and ROE of 10.9%
• July 15, 2014 – Settlement filed with FERC, with a revenue requirement of $1.0396 billion and a depreciation rate of 2.56%
• Rates effective from October 1, 2013 through February 28, 2015
TO15
• July 30, 2014 – TO16 filed with FERC
• Requested revenue requirement of $1.366 billion and ROE of 11.26%
• September 30, 2014 – TO16 was accepted and rate changes suspended until March 1, 2015
TO16
18
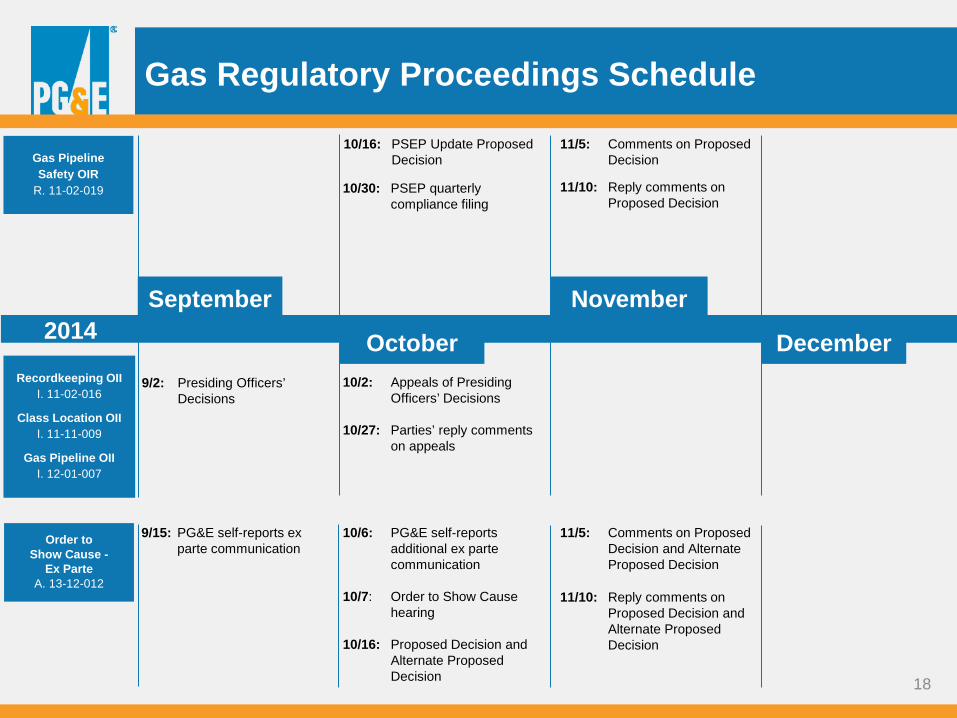
Gas Regulatory Proceedings Schedule
Recordkeeping OII I. 11-02-016
Class Location OII I. 11-11-009
Gas Pipeline OII I. 12-01-007
November September
October December
Gas Pipeline Safety OIR
R. 11-02-019 10/30: PSEP quarterly compliance filing
2014
9/2: Presiding Officers’ Decisions
10/2: Appeals of Presiding Officers’ Decisions 10/27: Parties’ reply comments on appeals
Order to Show Cause -
Ex Parte A. 13-12-012
9/15: PG&E self-reports ex parte communication
10/6: PG&E self-reports additional ex parte communication 10/7: Order to Show Cause hearing 10/16: Proposed Decision and Alternate Proposed Decision
10/16: PSEP Update Proposed Decision
11/5: Comments on Proposed Decision
11/5: Comments on Proposed Decision and Alternate Proposed Decision
11/10: Reply comments on Proposed Decision
11/10: Reply comments on Proposed Decision and Alternate Proposed Decision

19
Gas Pipeline Safety Costs
Expense Capital2011 0 47.22012 2.6 260.32013 73.3 348.22014 89.2 348.0Total $165.0 $1,003.8
Previously Authorized (Dec. 2012)
See the Safe Harbor Statements for factors that could cause actual results to differ materially from the guidance presented and underlying assumptions.
PSEP Costs: Customer Recovery ($ millions)
2010-2013 Total
Pipeline Safety Enhancement Plan (PSEP)PSEP Expense 736 (1)
PSEP Capital 114 (2)
Total PSEP 850 ~615 $1,465
Gas Accord V* ~500 ~760 $1,260
Total Shareholder Funded (PSEP and Gas Accord V) ~$2,700
Shareholder Funded Gas Transmission Safety-Related Costs($ millions)
(1) Assumes high end of 2014 Pipeline-Related Expenses range ($150 - 175 million)(2) Includes PSEP capital charges incurred in Q4 2012 and Q3 2013 * Expenses in excess of amounts authorized in 2011-2014 Gas Transmission & Storage Rate Case ("Gas Accord V")
2014 and BeyondEstimated Forecast
~440
~175
Expense Capital2011 0 42.02012 2.6 194.02013 58.2 354.12014 50.0 176.1Total $110.8 $766.2
Updated for Settlement (Jul. 2014)
Changes from prior quarter are noted in blue.

20
Presiding Officers’ Penalty Decisions: Estimated Total Shareholder Impact
(1) Refer to PG&E Corporation’s and the Utility’s 2013 Annual Report on Form 10-K and Quarterly Report for the quarter ended September 30, 2014 for additional information regarding costs incurred under the Utility’s pipeline safety enhancement plan (“PSEP”).
(2) The Penalty Decision estimates that the Utility would incur at least $50 million to implement remedial measures. Actual costs could differ materially based on the scope and timing of work. In addition, the Penalty Decision requires shareholders to reimburse interveners for legal and litigation expenses.
(3) Actual and forecast costs borne by shareholders for gas pipeline safety work, 2010 and beyond, including previously disallowed PSEP costs. (4) Estimated impact calculated based on the Utility’s statutory tax rate.
See the Safe Harbor Statements for factors that could cause actual results to differ materially from the guidance presented and underlying assumptions.
($ millions)ALJs' penalty
decisionSED penalty
recommendation
Fine payable to the State General Fund 950$ 300
Refund of PSEP (1) revenues previously authorized 400
Additional estimated unrecoverable costs (2) 50 1,515
Total penalty 1,400$
PSEP costs previously disallowed 635 435
Total penalty and PSEP cost disallowance 2,035$ 2,250$
Gas pipeline safety costs incurred or committed (3) ~ 2,700 ~ 2,700
Less: Credit for PSEP costs previously disallowed / shareholder-funded spending (635) (435)
Total estimated shareholder impact before non-deductibility of fines 4,100$ 4,515$
Estimated impact of non-deductibility of fines for tax purposes (4) 650 210
Total estimated shareholder impact (pre-tax) 4,750$ 4,725$
Changes from prior quarter are noted in blue.

21
Incremental Equity Factors
Equity Impacting Event Multiplier Fine paid to state General Fund (1) 100% Unrecovered expenses (2) (3) 60% Capital write-off (3) 30%
Incremental Equity Factors Associated with Gas Matters
(1) Applies to newly issued fines. Fines already accrued: 50% multiplier at time of payment (2) Applies to expenses in the year in which they are incurred (3) Assumes costs tax deductible
Excerpt from Q1 2014 Earnings Presentation
22
Appendix 2 – Supplemental Earnings Materials
Exhibit A: Reconciliation of PG&E Corporation Earnings from Operations to Consolidated slide 23 Income Available for Common Shareholders in Accordance with GAAP
Exhibit B: Key Drivers of PG&E Corporation Earnings per Common Share from Operations slide 24
Exhibit C: Operational Performance Metrics slide 25-26
Exhibit D: Sales and Sources Summary slide 27
Exhibit E: PG&E Corporation Earnings Per Share Guidance slide 28
Exhibit F: General Earnings Sensitivities slide 29
Exhibit G: Summary of Selected Regulatory Cases slide 30-35

23
(pre-tax)
Three Months Ended September 30, 2014
Nine Months Ended September 30, 2014
Pipeline-related costs $ (108) $ (245) Accrued fines - - Third-party liability claims - - Insurance recoveries 86 86 Natural gas matters $ (22) $ (159)
Exhibit A: Reconciliation of PG&E Corporation Earnings from Operations to Consolidated Income Available for Common Shareholders in Accordance with Generally Accepted Accounting Principles (“GAAP”)
Third Quarter and Year to Date (“YTD”), 2014 vs. 2013 (in millions, except per share amounts)
(1) “Earnings from operations” is not calculated in accordance with GAAP and excludes items impacting comparability as described in Note (2) below. (2) Items impacting comparability reconcile earnings from operations with Consolidated Income Available for Common Shareholders as reported in
accordance with GAAP. (3) The Utility incurred net costs of $22 million and $159 million pre-tax, during the three and nine months ended September 30, 2014, respectively, in
connection with natural gas matters. These amounts included pipeline-related costs to perform work under the Utility’s pipeline safety enhancement plan (“PSEP”) and other activities associated with safety improvements to the Utility’s natural gas system, as well as legal and other costs. These costs were partially offset by insurance recoveries. There were no additional charges recorded for these periods related to fines for natural gas matters or third party liability claims.
(4) The Utility recorded a credit of $7 million, pre-tax, during the three and nine months ended September 30, 2014, respectively. After the State of California established a final drinking water standard for hexavalent chromium that became effective on July 1, 2014, the Utility discontinued its whole house water replacement program associated with remediation at the Utility’s natural gas compressor station located near Hinkley, California. Accordingly, the Utility reduced its accrual related to the whole house water program by $7 million in the third quarter of 2014. Guidance does not include potential environmental-related costs that the Utility could incur if the final order for remediation at Hinkley is more onerous than the Utility’s proposal.
Three Months Ended September 30, Nine Months Ended September 30,
Earnings
Earnings per Common Share
(Diluted) Earnings
Earnings per Common Share
(Diluted) 2014 2013 2014 2013 2014 2013 2014 2013 PG&E Corporation’s Earnings
from Operations (1) $ 820 $ 395 $ 1.73 $0.88 $ 1,395 $ 1,019 $ 2.98 $ 2.31 Items Impacting Comparability: (2) Natural gas matters (3) (13) (233) (0.03) (0.52) (94) (287) (0.20) (0.65) Environmental-related costs (4) 4 (1) 0.01 (0.00) 4 (4) 0.01 (0.01) PG&E Corporation’s Earnings
on a GAAP basis $ 811 $ 161 $ 1.71 $ 0.36 $ 1,305 $ 728 $ 2.79 $ 1.65
24
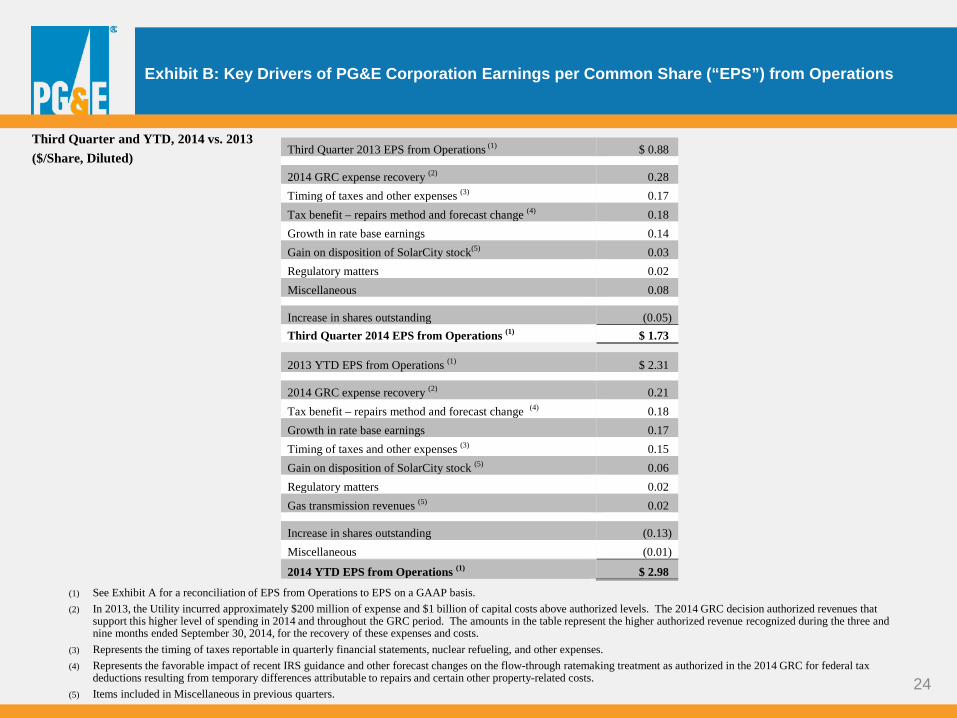
Exhibit B: Key Drivers of PG&E Corporation Earnings per Common Share (“EPS”) from Operations
Third Quarter and YTD, 2014 vs. 2013 ($/Share, Diluted)
(1) See Exhibit A for a reconciliation of EPS from Operations to EPS on a GAAP basis. (2) In 2013, the Utility incurred approximately $200 million of expense and $1 billion of capital costs above authorized levels. The 2014 GRC decision authorized revenues that
support this higher level of spending in 2014 and throughout the GRC period. The amounts in the table represent the higher authorized revenue recognized during the three and nine months ended September 30, 2014, for the recovery of these expenses and costs.
(3) Represents the timing of taxes reportable in quarterly financial statements, nuclear refueling, and other expenses. (4) Represents the favorable impact of recent IRS guidance and other forecast changes on the flow-through ratemaking treatment as authorized in the 2014 GRC for federal tax
deductions resulting from temporary differences attributable to repairs and certain other property-related costs. (5) Items included in Miscellaneous in previous quarters.
Third Quarter 2013 EPS from Operations (1) $ 0.88 2014 GRC expense recovery (2) 0.28 Timing of taxes and other expenses (3) 0.17 Tax benefit – repairs method and forecast change (4) 0.18 Growth in rate base earnings 0.14 Gain on disposition of SolarCity stock(5) 0.03 Regulatory matters 0.02 Miscellaneous 0.08 Increase in shares outstanding (0.05) Third Quarter 2014 EPS from Operations (1) $ 1.73
2013 YTD EPS from Operations (1) $ 2.31
2014 GRC expense recovery (2) 0.21 Tax benefit – repairs method and forecast change (4) 0.18 Growth in rate base earnings 0.17 Timing of taxes and other expenses (3) 0.15 Gain on disposition of SolarCity stock (5) 0.06 Regulatory matters 0.02 Gas transmission revenues (5) 0.02 Increase in shares outstanding (0.13) Miscellaneous (0.01)
2014 YTD EPS from Operations (1) $ 2.98
25
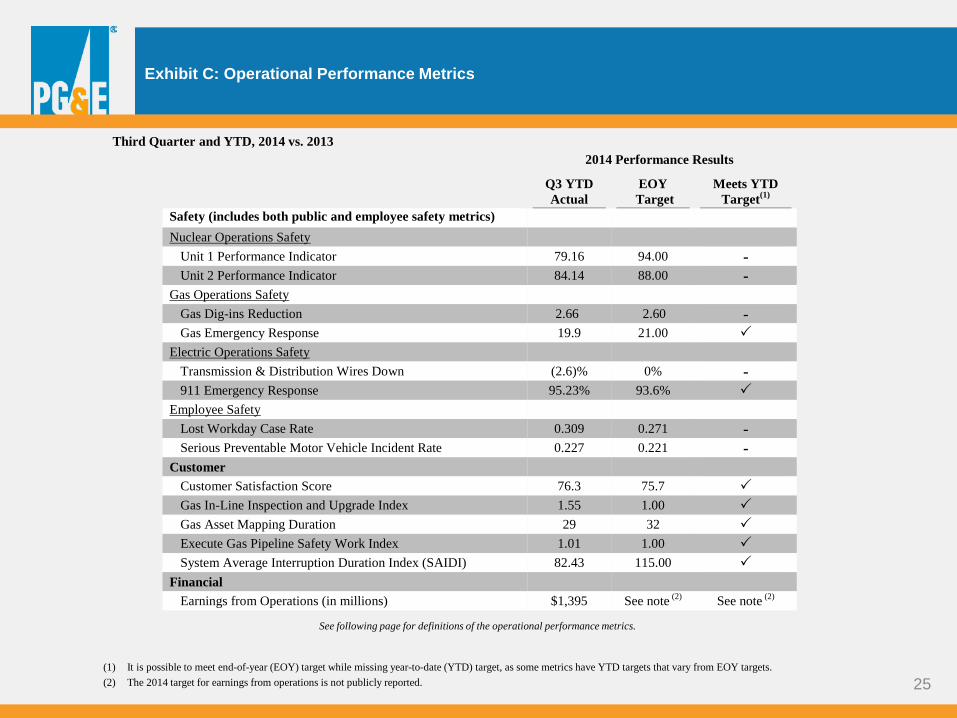
2014 Performance Results Q3 YTD
Actual EOY
Target Meets YTD
Target(1) Safety (includes both public and employee safety metrics) Nuclear Operations Safety
Unit 1 Performance Indicator 79.16 94.00 - Unit 2 Performance Indicator 84.14 88.00 -
Gas Operations Safety
Gas Dig-ins Reduction 2.66 2.60 - Gas Emergency Response 19.9 21.00
Electric Operations Safety Transmission & Distribution Wires Down (2.6)% 0% -
911 Emergency Response 95.23% 93.6% Employee Safety
Lost Workday Case Rate 0.309 0.271 - Serious Preventable Motor Vehicle Incident Rate 0.227 0.221 -
Customer Customer Satisfaction Score 76.3 75.7
Gas In-Line Inspection and Upgrade Index 1.55 1.00 Gas Asset Mapping Duration 29 32
Execute Gas Pipeline Safety Work Index 1.01 1.00
System Average Interruption Duration Index (SAIDI) 82.43 115.00
Financial Earnings from Operations (in millions) $1,395 See note (2) See note (2)
Exhibit C: Operational Performance Metrics
(1) It is possible to meet end-of-year (EOY) target while missing year-to-date (YTD) target, as some metrics have YTD targets that vary from EOY targets. (2) The 2014 target for earnings from operations is not publicly reported.
See following page for definitions of the operational performance metrics.
Third Quarter and YTD, 2014 vs. 2013

26
Definitions of 2014 Operational Performance Metrics from Exhibit C
Safety Public and employee safety are measured in four areas: (1) Nuclear Operations Safety, (2) Gas Operations Safety, (3) Electric Operations Safety, and (4) Employee Safety. 1. The safety of the Utility’s nuclear power operations, Unit 1 and Unit 2, is an index comprised of 12 performance indicators for nuclear power generation that are
regularly benchmarked against other nuclear power generators. 2. The safety of the Utility’s natural gas operations is represented by (a) the number of third party “dig-ins” (i.e., damage resulting in repair or replacement of underground
facility) to Utility gas assets per 1,000 Underground Service Alert tickets; and (b) the timeliness (measured in minutes) of on-site response to gas emergency service calls.
3. The safety of the Utility’s electric operations is represented by (a) the percentage improvement in the number of wire down events with resulting sustained unplanned outages compared to the same report period of the previous year, and (b) the percentage of time that Utility personnel are on site within 60 minutes after receiving a 911 call of a potential PG&E electric hazard.
4. The safety of the Utility’s employees is represented by (a) the number of lost workday cases incurred per 200,000 hours worked (or for approximately every 100 employees), and (b) the number of serious preventable motor vehicle incidents that the driver could have reasonably avoided, per one million miles driven.
Customer Customer satisfaction and service reliability are measured by: 1. The overall satisfaction (measured as a score of zero to 100) of customers with the products and services offered by the Utility, as measured through a quarterly survey
performed by an independent third-party research firm. 2. The Utility’s ability to complete planned in-line inspections and pipeline retrofit projects, measured by two equally weighted components of (a) In-Line Inspections and
(b) In-Line Upgrades. 3. The timeliness (measured in days) of gas asset information being entered into the Utility’s gas mapping system after a gas project is completed. 4. The efficient completion of certain committed work for gas operations-related programs. The index is comprised of three components related to the completion of
committed work and the cost of completing the work. 5. The total time (measured in minutes) the average customer is without electric power during a given time period.
Financial Earnings from operations measures PG&E Corporation’s earnings power from ongoing core operations. It allows investors to compare the underlying financial performance of the business from one period to another, exclusive of items that management believes do not reflect the normal course of operations (items impacting comparability). Earnings from operations is not calculated in accordance with GAAP. For a reconciliation of earnings from operations to earnings in accordance with GAAP, see Exhibit A.

27
Three Months Ended September 30, Nine Months Ended September 30,
2014 2013 2014 2013 Sales from Energy Deliveries (in millions kWh) 25,128 24,682 65,359 65,684 Total Electric Customers at September 30 5,271,000 5,252,000 Total Gas Sales (in millions Mcf) 208 220 656 675 Total Gas Customers at September 30 4,391,000 4,379,000 Sources of Electric Energy (in millions kWh) Total Utility Generation 8,180 8,381 21,350 23,377 Total Purchased Power 14,724 15,460 40,512 39,133 Total Electric Energy Delivered (1) 25,128 24,682 65,359 65,684 Diablo Canyon Performance Overall Capacity Factor (including refuelings) 97% 98% 89% 90% Refueling Outage Period None None 2/9/14-3/13/14 2/3/13-3/23/13 Refueling Outage Duration during the Period (days) None None 33 49 (1) Includes other sources of electric energy totaling 2,224 kWh and 841 kWh for the three months ended September 30, 2014 and 2013,
respectively, and 3,497 kWh and 3,174 kWh for the nine months ended September 30, 2014 and 2013, respectively.
Exhibit D: Pacific Gas and Electric Company Sales and Sources Summary
Third Quarter and YTD, 2014 vs. 2013
Please see the 2013 Annual Report on Form 10-K for additional information about operating statistics.
28
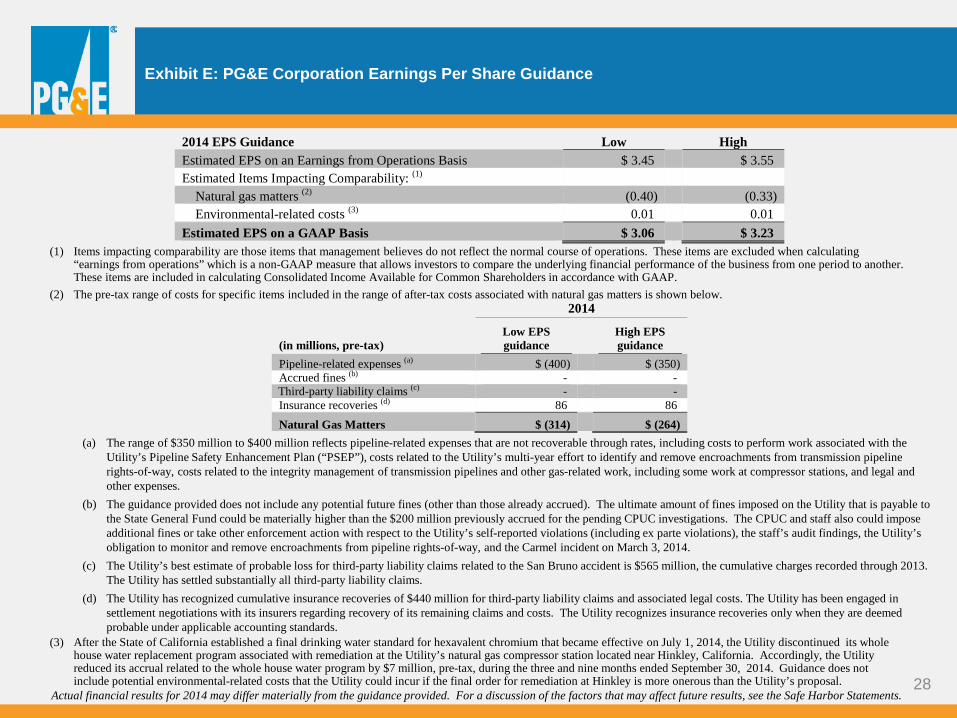
2014
(in millions, pre-tax) Low EPS guidance
High EPS guidance
Pipeline-related expenses (a) $ (400) $ (350) Accrued fines (b) - - Third-party liability claims (c) - - Insurance recoveries (d) 86 86 Natural Gas Matters $ (314) $ (264)
2014 EPS Guidance Low
High Estimated EPS on an Earnings from Operations Basis $ 3.45 $ 3.55 Estimated Items Impacting Comparability: (1)
Natural gas matters (2) (0.40) (0.33) Environmental-related costs (3) 0.01
0.01
Estimated EPS on a GAAP Basis $ 3.06 $ 3.23
Exhibit E: PG&E Corporation Earnings Per Share Guidance
(1) Items impacting comparability are those items that management believes do not reflect the normal course of operations. These items are excluded when calculating “earnings from operations” which is a non-GAAP measure that allows investors to compare the underlying financial performance of the business from one period to another. These items are included in calculating Consolidated Income Available for Common Shareholders in accordance with GAAP.
(2) The pre-tax range of costs for specific items included in the range of after-tax costs associated with natural gas matters is shown below.
(a) The range of $350 million to $400 million reflects pipeline-related expenses that are not recoverable through rates, including costs to perform work associated with the Utility’s Pipeline Safety Enhancement Plan (“PSEP”), costs related to the Utility’s multi-year effort to identify and remove encroachments from transmission pipeline rights-of-way, costs related to the integrity management of transmission pipelines and other gas-related work, including some work at compressor stations, and legal and other expenses.
(b) The guidance provided does not include any potential future fines (other than those already accrued). The ultimate amount of fines imposed on the Utility that is payable to the State General Fund could be materially higher than the $200 million previously accrued for the pending CPUC investigations. The CPUC and staff also could impose additional fines or take other enforcement action with respect to the Utility’s self-reported violations (including ex parte violations), the staff’s audit findings, the Utility’s obligation to monitor and remove encroachments from pipeline rights-of-way, and the Carmel incident on March 3, 2014.
(c) The Utility’s best estimate of probable loss for third-party liability claims related to the San Bruno accident is $565 million, the cumulative charges recorded through 2013. The Utility has settled substantially all third-party liability claims.
(d) The Utility has recognized cumulative insurance recoveries of $440 million for third-party liability claims and associated legal costs. The Utility has been engaged in settlement negotiations with its insurers regarding recovery of its remaining claims and costs. The Utility recognizes insurance recoveries only when they are deemed probable under applicable accounting standards.
(3) After the State of California established a final drinking water standard for hexavalent chromium that became effective on July 1, 2014, the Utility discontinued its whole house water replacement program associated with remediation at the Utility’s natural gas compressor station located near Hinkley, California. Accordingly, the Utility reduced its accrual related to the whole house water program by $7 million, pre-tax, during the three and nine months ended September 30, 2014. Guidance does not include potential environmental-related costs that the Utility could incur if the final order for remediation at Hinkley is more onerous than the Utility’s proposal.
Actual financial results for 2014 may differ materially from the guidance provided. For a discussion of the factors that may affect future results, see the Safe Harbor Statements.

29
Variable Description of Change
Estimated 2014
Earnings Impact Rate base +/- $100 million change in allowed rate base +/- $5 million Return on equity (ROE) +/- 0.1% change in allowed ROE +/- $15 million Share count +/- 1% change in average shares +/- $0.03 per share Revenues +/- $8 million change in at-risk revenue (pre-tax), including
Electric Transmission and Gas Transmission +/- $0.01 per share
Exhibit F: General Earnings Sensitivities PG&E Corporation and Pacific Gas and Electric Company
These general earnings sensitivities on factors that may affect 2014 earnings are forward-looking statements that are based on various assumptions. Actual results may differ materially. For a discussion of the factors that may affect future results, see the Safe Harbor Statements.
30
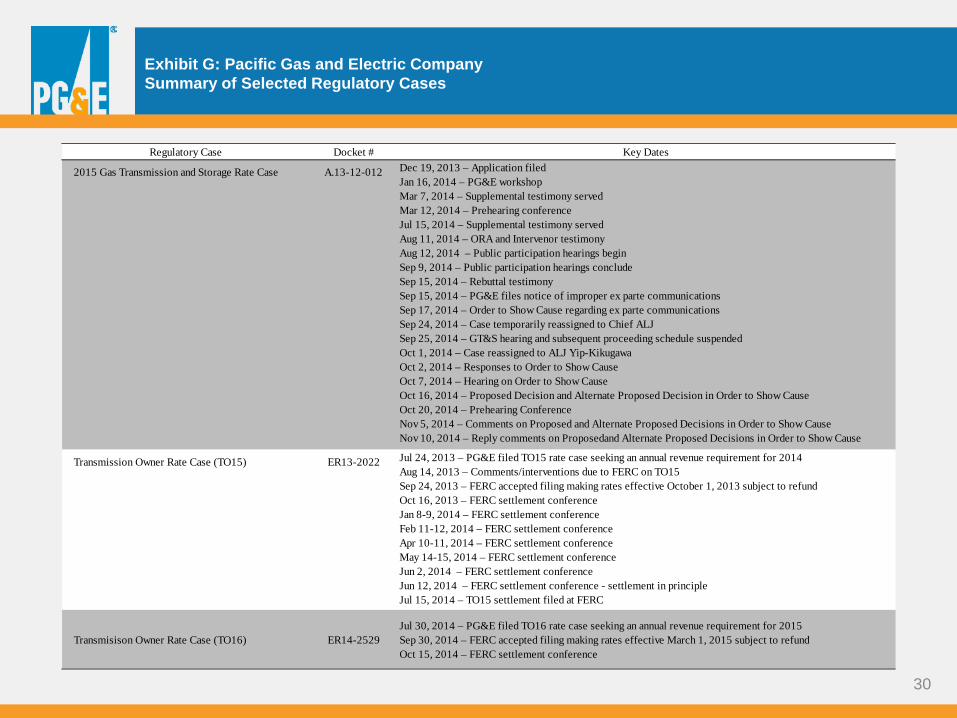
Exhibit G: Pacific Gas and Electric Company Summary of Selected Regulatory Cases
Regulatory Case Docket # Key Dates
2015 Gas Transmission and Storage Rate Case A.13-12-012 Dec 19, 2013 – Application filedJan 16, 2014 – PG&E workshopMar 7, 2014 – Supplemental testimony servedMar 12, 2014 – Prehearing conference Jul 15, 2014 – Supplemental testimony servedAug 11, 2014 – ORA and Intervenor testimonyAug 12, 2014 – Public participation hearings begin Sep 9, 2014 – Public participation hearings concludeSep 15, 2014 – Rebuttal testimonySep 15, 2014 – PG&E files notice of improper ex parte communicationsSep 17, 2014 – Order to Show Cause regarding ex parte communicationsSep 24, 2014 – Case temporarily reassigned to Chief ALJSep 25, 2014 – GT&S hearing and subsequent proceeding schedule suspendedOct 1, 2014 – Case reassigned to ALJ Yip-KikugawaOct 2, 2014 – Responses to Order to Show CauseOct 7, 2014 – Hearing on Order to Show CauseOct 16, 2014 – Proposed Decision and Alternate Proposed Decision in Order to Show CauseOct 20, 2014 – Prehearing ConferenceNov 5, 2014 – Comments on Proposed and Alternate Proposed Decisions in Order to Show CauseNov 10, 2014 – Reply comments on Proposedand Alternate Proposed Decisions in Order to Show Cause
Transmission Owner Rate Case (TO15) ER13-2022 Jul 24, 2013 – PG&E filed TO15 rate case seeking an annual revenue requirement for 2014 Aug 14, 2013 – Comments/interventions due to FERC on TO15Sep 24, 2013 – FERC accepted filing making rates effective October 1, 2013 subject to refund Oct 16, 2013 – FERC settlement conferenceJan 8-9, 2014 – FERC settlement conferenceFeb 11-12, 2014 – FERC settlement conferenceApr 10-11, 2014 – FERC settlement conferenceMay 14-15, 2014 – FERC settlement conferenceJun 2, 2014 – FERC settlement conferenceJun 12, 2014 – FERC settlement conference - settlement in principleJul 15, 2014 – TO15 settlement filed at FERC
Transmisison Owner Rate Case (TO16) ER14-2529Jul 30, 2014 – PG&E filed TO16 rate case seeking an annual revenue requirement for 2015Sep 30, 2014 – FERC accepted filing making rates effective March 1, 2015 subject to refundOct 15, 2014 – FERC settlement conference

31
Exhibit G: Pacific Gas and Electric Company Summary of Selected Regulatory Cases
Regulatory Case Docket # Key Dates
2014 General Rate CasePhase II: Rate Design for 2015-2017
A.13-04-020 Apr 18, 2013 – Application filed (Phase II)Nov 15, 2013 – ORA testimonyDec 13, 2013 – Intervenor testimony Apr 18, 2014 – Update report on settlement discussionsMay 16, 2014 – Update report on settlement discussionsJun 6, 2014 – Update report on settlement discussionsJul 31, 2014 – Update report on settlement discussionsAug 29, 2014 – Update report on settlement discussionsSept 19, 2014 – Rebuttal testimonyOct 8, 2014 – Update report on settlement discussionsOct 9, 2014 – Evidentiary hearingsNov 3, 2014 – Opening briefsNov 21, 2014 – Reply briefsDec 5, 2014 – Request for oral argument
Gas Transmission System Records Order Instituting Investigation
I.11-02-016 Sep 5 - Oct 5, 2012, Jan 7-22, 2013 and Mar 4-5, 2013 – Evidentiary hearingsMar 25, 2013 – Concurrent opening briefsApr 24, 2013 – Concurrent reply briefsSep 2, 2014 – Presiding Officers' DecisionsOct 2, 2014 – Appeals to Presiding Officers' DecisionOct 27, 2014 – Parties' reply comments on appeals
Class Location Designation Order Instituting Investigation
I.11-11-009 Aug 24, 2012, Jan 7, 2013, and Mar 4-5, 2013 – Evidentiary hearingsNov 20, 2012 – Concurrent opening briefsDec 5, 2012 – Concurrent reply briefsSep 2, 2014 – Presiding Officers' DecisionsOct 2, 2014 – Appeals to Presiding Officers' DecisionOct 27, 2014 – Parties' reply comments on appeals
Order Instituting Investigation into PG&E’s Operations and Practices in Connection with the San Bruno Explosion and Fire
I.12-01-007 Sep 25-26, 2012, Oct 3, 2012, Jan 9-17, 2013 and Mar 4-5, 2013 – Evidentiary hearingsApr 3, 2013 – Concurrent opening briefs Apr 25, 2013 – Concurrent reply briefsSep 2, 2014 – Presiding Officers' DecisionsOct 2, 2014 – Appeals to Presiding Officers' DecisionOct 27, 2014 – Parties' reply comments on appeals

32
Exhibit G: Pacific Gas and Electric Company Summary of Selected Regulatory Cases
Regulatory Case Docket # Key Dates
Gas Pipeline Safety Order Instituting Rulemaking R.11-02-019D.11-03-047D.11-06-017D.11-10-010D.11-12-048D.12-04-047D.12-04-010D.12-12-030A.13-10-017D.13-12-042D.13-12-053
(Rule 1.1)D.13-12-052
(Line 147)
Dec 20, 2012 – Final decision on Pipeline Safety Enhancement Plan Jan 28, 2013 – Intervenor requests for rehearingFeb 21, 2013 – Replies to requests for rehearingApr 30, 2013 – PSEP quarterly compliance filingJul 30, 2013 – PSEP quarterly compliance filingAug 19, 2013 – Commission launches Orders to Show Cause on Rule 1.1 and pipeline pressuresAug 30, 2013 – PG&E verified statement on gas pipeline error discovery and subsequent actions Sep 6, 2013 – Order to Show Cause hearingsSep 26, 2013 – Parties’ recommendations on errata filingOct 1, 2013 – Parties’ responses to recommendations on errata filingOct 21, 2013 – Line 147 prehearing conferenceOct 29, 2013 – PSEP Update application and PSEP quarterly compliance filingNov 12, 2013 – Line 147 SED investigation report Nov 18, 2013 – Cross examination of PG&E in Rule 1.1 Order to Show Cause Dec 6, 2013 – Line 147 proposed decisionDec 13, 2013 – Revised alternate proposed decision in Rule 1.1 Order to Show Cause Dec 19, 2013 – Decision on Rule 1.1 Order to Show Cause and decision allowing increased pressure on Line 147Jan 17, 2014 – Pipeline pressure Order to Show Cause opening briefs Jan 23, 2014 – PG&E Application for Rehearing on Rule 1.1 Order to Show Cause decisionJan 23, 2014 – ORA and City of San Carlos Application for Rehearing of Line 147 pressure restoration decision Jan 30, 2014 – PSEP quarterly compliance filingJan 31, 2014 – Pipeline pressure Order to Show Cause reply briefsFeb 7, 2014 – Parties' responses to PG&E Application for RehearingFeb 7, 2014 – Responses to ORA and San Carlos Application for RehearingMar 3, 2014 – PSEP Update prehearing conferenceApril 25, 2014 – Proposed decision in pipeline pressure Order to Show CauseApr 30, 2014 – PSEP quarterly compliance filingMay 16, 2014 – PSEP Update prehearing conferenceJul 25, 2014 – Reply comments on GO 112 rule revisions Jul 25, 2014 – Parties file PSEP Update settlement Jul 30, 2014 – PSEP quarterly compliance filingOct 6, 2014 – PG&E files late notice of ex parte communicationsOct 16, 2014 – Proposed Decision affirming PSEP Update settlementOct 30, 2014 – PSEP quarterly compliance filing

33
Exhibit G: Pacific Gas and Electric Company Summary of Selected Regulatory Cases
Regulatory Case Docket # Key Dates
Safety Citation OIR R.14-05-013 May 21, 2014 – Commission issues OIRJun 20, 2014 – Opening comments on proposed electric citation programJul 1, 2014 – SB 291 deadline for gas citation program Jul 7, 2014 – Reply comments on proposed electric citation programAug 13, 2014 – Prehearing conferenceSep 26, 2014 – Scoping memoOct 31, 2014 – Scheduled proposed decision on electric citation programJan 1, 2015 – SB 291 deadline for electric citation program
Net Energy Metering OIR
R.14-07-002
Jul 17, 2014 – Commission issues OIR to establish net metering successor tariffsAug 11, 2014 – Staff workshop on Public ToolAug 18, 2014 – Comments on OIRAug 26, 2014 – Reply comments on OIROct 6, 2014 – Comments on staff workshop and Public ToolOct 20, 2014 – Reply comments on staff workshop and Public Tool
2014 Long-Term Procurement PlanPhase 1a: system reliability needsPhase 1b: filling system reliability needs, if necessaryPhase 2: bundled procurement plans
R.13-12-010 Phase 1 Aug 13, 2014 – Phase 1a testimony of modeling parties Sep 24, 2014 – Phase 1a testimony of parties not preparing models (includes PG&E) Oct 22, 2014 – Phase 1a reply testimony Nov 13, 2014 – Additional SCE/CAISO Phase 1a testimony (stochastic modeling of Trajectory scenario) Dec 11, 2014 – Reply testimony on additional SCE/CAISO Phase 1a testimony Dec 18, 2014 – Last date to request evidentiary hearings for Phase 1a Phase 2 Oct 3, 2014 – IOUs file bundled procurement plans Oct 31, 2014 – Comments on BPPs Nov 14, 2014 – Reply comments on BPPs Nov 21, 2014 – Deadline for requests for evidentiary hearings
Residential Rate OIRPhase 1: long-term rate designPhase 2: 2014 summer rate relief
R.12-06-013D.14-06-029
Jan 28, 2014 – Summer 2014 rate design reform proposal (Phase 2) filedFeb 28, 2014 – Long-term rate design reform proposal (Phase 1) filedMar 5, 2014 – PG&E, ORA and TURN settle for Summer 2014 rate design issues in Phase 2Mar 12, 2014 – Phase 2 rebuttal testimonyMar 25, 2014 – Phase 2 evidentiary hearingsApr 7, 2014 – Phase 2 opening briefsApr 16, 2014 – Phase 2 reply briefs Jun 12, 2014 – Final decision in Phase 2Sep 15, 2014 – Phase 1 intervenor testimony Sep 22, 2014 – Phase 1 opening brief on default Time-of-Use pilots Oct 3, 2014 – Phase 1 reply brief on default TOU pilotsOct 15, 2014 – Phase 1 rebuttal testimonyNov 3-21, 2014 – Phase 1 evidentiary hearingsDec 8, 2014 – Phase 1 opening briefsJan 5, 2015 – Phase 1 reply briefsMarch 2015 – Phase 1 Proposed Decision

34
Exhibit G: Pacific Gas and Electric Company Summary of Selected Regulatory Cases
Regulatory Case Docket # Key DatesRulemaking to Reform Energy Efficiency Incentive Earnings Mechanism
R.12-01-005 Jun 30, 2014 – PG&E filing for $37.9 million: 2012 and partial 2013 EE program year incentives
Nuclear Decommissioning Cost Triennial Proceeding A.12-12-012D.14-02-024
Dec 21, 2012 – Application filed Mar 17, 2013 – Prehearing conferenceJun 17, 2013 – Scoping memo to bifurcate proceeding
Track 1 – Humboldt Non-Rate Related IssuesJul 12, 2013 – Intervenor testimonyJul 26, 2013 – Rebuttal testimony Aug 7-9, 2013 – Evidentiary hearingsSep 13, 2013 – Concurrent opening briefsSep 27, 2013 – Concurrent reply briefs Jan 28, 2014 – Proposed decisionFeb 18, 2014 – Opening comments on proposed decisionFeb 24, 2014 – Reply comments on proposed decisionFeb 27, 2014 – Final decision
Track 2 – All Remaining IssuesJuly 22, 2013 – SCE supplemental testimonySep 20, 2013 – Intervenor testimonyOct 11, 2013 – Rebuttal testimonyOct 21-25, 2013 – Evidentiary hearingsDec 16, 2013 – Concurrent opening briefsJan 21, 2014 – Concurrent reply briefs
Rate Case Plan Order Instituting RulemakingPhase 1: Safety and RiskPhase 2: Rate Case Plan Efficiency and Effectiveness
R. 13-11-006 Nov 14, 2013 – Commission files rulemakingDec 20, 2013 – Utilities respond to data request on current safety/risk programsJan 15, 2014 – Comments on questions raised in rulemakingJan 30, 2014 – Reply commentsFeb 20, 2014 – Staff straw proposalMar 19-21, 2014 – WorkshopsApr 7, 2014 – Parties provide redline of straw proposalApr 17, 2014 – Staff issues revised straw proposalApr 29, 2014 – Prehearing conferenceMay 23, 2014 – Comments on revised straw proposal (Phase 1)Jun 13, 2014 – Reply comments for Phase 1Jul 25, 2014 – Comments for Phase 2Aug 22, 2014 – Reply comments for Phase 2
35
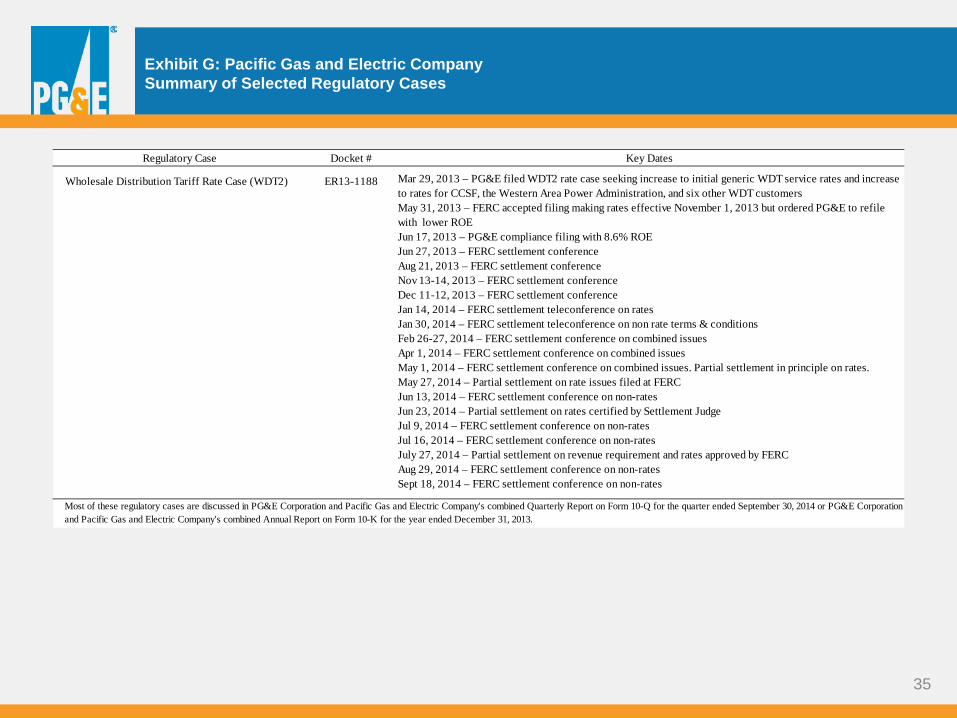
Exhibit G: Pacific Gas and Electric Company Summary of Selected Regulatory Cases
Regulatory Case Docket # Key Dates
Wholesale Distribution Tariff Rate Case (WDT2) ER13-1188 Mar 29, 2013 – PG&E filed WDT2 rate case seeking increase to initial generic WDT service rates and increase to rates for CCSF, the Western Area Power Administration, and six other WDT customersMay 31, 2013 – FERC accepted filing making rates effective November 1, 2013 but ordered PG&E to refile with lower ROE Jun 17, 2013 – PG&E compliance filing with 8.6% ROEJun 27, 2013 – FERC settlement conferenceAug 21, 2013 – FERC settlement conferenceNov 13-14, 2013 – FERC settlement conferenceDec 11-12, 2013 – FERC settlement conferenceJan 14, 2014 – FERC settlement teleconference on ratesJan 30, 2014 – FERC settlement teleconference on non rate terms & conditionsFeb 26-27, 2014 – FERC settlement conference on combined issuesApr 1, 2014 – FERC settlement conference on combined issuesMay 1, 2014 – FERC settlement conference on combined issues. Partial settlement in principle on rates.May 27, 2014 – Partial settlement on rate issues filed at FERCJun 13, 2014 – FERC settlement conference on non-ratesJun 23, 2014 – Partial settlement on rates certified by Settlement JudgeJul 9, 2014 – FERC settlement conference on non-ratesJul 16, 2014 – FERC settlement conference on non-ratesJuly 27, 2014 – Partial settlement on revenue requirement and rates approved by FERCAug 29, 2014 – FERC settlement conference on non-ratesSept 18, 2014 – FERC settlement conference on non-rates
Most of these regulatory cases are discussed in PG&E Corporation and Pacific Gas and Electric Company's combined Quarterly Report on Form 10-Q for the quarter ended September 30, 2014 or PG&E Corporation and Pacific Gas and Electric Company's combined Annual Report on Form 10-K for the year ended December 31, 2013.


![2009 Investor Conference Presentation FINAL.ppt [Read-Only]s1.q4cdn.com/880135780/files/doc_presentations/...26 Capital Expenditure Outlook 2009 2010 2011 Low Case Total CapEx of $3.6B](https://static.fdocuments.in/doc/165x107/5f2fbbe4980b9953500743df/2009-investor-conference-presentation-finalppt-read-onlys1q4cdncom880135780filesdocpresentations.jpg)