Third Quarter 2021 Residential Market Report Manhattan
20
BHSID 21290566 Manhattan Third Quarter 2021 Residential Market Report
Transcript of Third Quarter 2021 Residential Market Report Manhattan

BHSID 21290566 Man
hatt
an
Third Quarter 2021Residential Market Report

BHS 2
BHSID 21320988
Message from Bess Freedman CEO of
The Manhattan apartment market stayed hot in the third quarter, with closings at their highest level
in eight years. The average apartment price was 11% lower than a year ago, but that is due to a rash
of super luxury closings at 220 Central Park South inflating the third quarter of 2020’s figure.
If we look at just resale apartments, the average price rose sharply for both co-ops (+17%) and condos
(+15%) compared to a year ago. After bottoming at the beginning of 2021, prices have started to
come back in a big way. Both the average and median resale apartment prices are now at their
highest levels since 2019’s second quarter, which was aided by a rush of luxury closings due to pending
transfer and mansion tax changes.
Contract signings have remained strong since the spring, which has driven inventory down to the
point where many neighborhoods in Manhattan can be characterized as a seller’s market. Buyers can
still find value, but the dramatic decline in both time on the market and negotiability make it clear
that the fire sale has long ended.
The Manhattan real estate market has made an unbelievable comeback in the past year, which may
surprise the naysayers out there. But those of us who live and work here never had any doubts.

BHS 3
Manhattan All Cooperatives and Condominiums*
Q3 2021
Manhattan apartment prices averaged $1,898,525 in the third quarter, 11% less than a year ago. That decline is misleading however, as the 3Q20 figure was greatly inflated by an extraordinary number of ultra-luxury new development closings, many of which were at 220 Central Park South. There were 10 closings for over $30 million at 220 CPS—including a $99.9 million one—a year ago, something unprecedented in this market. This is also the reason the average condominium price fell sharply compared to the third quarter of 2020.
If we look at the median apartment price, which measures the middle of the market, we see a 7% increase from a year ago to $1,150,000. The number of closings rose to 4,490, their highest level since 2013’s third quarter.
Average and Median Sales Price
$2,13
5,85
0
$1,8
57,9
00
$1,6
52,6
61 $1
,957
,331
$1,8
98,5
25
$1,0
75,0
00
$1,0
68,7
50
$1,0
50,0
00
$1,16
5,00
0
$1,15
0,00
0
$500,000
$1,000,000
$1,500,000
$2,000,000
$2,500,000
3rd Q 20 4th Q 20 1st Q 21 2nd Q 21 3rd Q 21
Average Sale Price Median Sale Price
1,592
2,21
0
2,90
3
4,37
2
4,49
0
500
1,500
2,500
3,500
4,500
5,500
3rd Q 20 4th Q 20 1st Q 21 2nd Q 21 3rd Q 21
Average and Median Sales Price Number of Closings
Cooperative Average and Median Sales Price Condominium Average and Median Sales Price
$1,15
5,77
3
$1,18
9,57
5
$1,18
0,90
4
$1,2
81,7
45
$1,3
33,9
05
$775
,000
$770
,050
$787
,000
$820
,000
$835
,000
$500,000
$750,000
$1,000,000
$1,250,000
$1,500,000
3rd Q 20 4th Q 20 1st Q 21 2nd Q 21 3rd Q 21
Average Sale Price Median Sale Price
$3,3
44,10
9
$2,6
20,7
75
$2,2
52,5
08 $2
,667
,790
$2,6
10,2
90
$1,7
50,0
00
$1,6
50,0
00
$1,5
23,8
13
$1,6
75,0
00
$1,6
65,0
00
$1,000,000
$1,750,000
$2,500,000
$3,250,000
$4,000,000
3rd Q 20 4th Q 20 1st Q 21 2nd Q 21 3rd Q 21
Average Sale Price Median Sale Price
* Includes new development and resale apartments. 3Q21 data is preliminary and subject to revision in future reports. Data from the prior four quarters has been revised to include sales recorded after our initial reports were released.

BHS 4
Since 220 CPS dominated the data a year ago, it’s not surprising that the average new development closing price fell sharply compared to the third quarter of 2020. You also have to remember that virtually all the closings from a year ago had their contracts signed before the COVID-19 pandemic, and are therefore from a much different market. South of 14th Street accounted for 33.5% of new development closings last quarter, by far the most of any market.
Average and Median Sales Price
Manhattan New Developments
Q3 2021
Sales by Area
7.3%
30.4%
5.9%19.9%
9.4%
26.9%
3Q20 3Q21
East Side
West Side
Midtown
Downtown (34th -14th St)
Downtown (South of 14th St)
Upper Manhattan
15.6%
33.5%
11.5%
15.8%
13.2%
10.4%
$2,3
27
$2,0
91
$1,8
54 $2
,020
$1,9
40
$1,800
$2,000
$2,200
$2,400
$2,600
3rd Q 20 4th Q 20 1st Q 21 2nd Q 21 3rd Q 21
Average Price Per Square Foot
$5,17
7,38
1
$3,4
96,3
79
$2,9
09,0
23
$3,2
70,0
45
$2,9
28,4
42
$2,4
65,0
00
$2,2
40,15
0
$1,9
77,5
00
$2,18
9,36
3
$2,10
4,05
9
$0
$2,000,000
$4,000,000
$6,000,000
$8,000,000
3rd Q 20 4th Q 20 1st Q 21 2nd Q 21 3rd Q 21
Average Sale Price Median Sale Price

BHS 5
Manhattan Resale Cooperatives and Condominiums
Q3 2021
Both the average and median resale apartment prices hit their highest levels since 2019’s second quarter. At $1,724,750, the average resale price was 17% higher than a year ago, while the median price rose 9% to $999,250.
Average and Median Sales Price
The average resale co-op price was higher than a year ago for all sizes of apartments except studios. The luxury market has come back in a big way, as the average price for three-bedroom and larger co-ops was 24% higher than a year ago.
Cooperative Average Sales Price
Studios were also the only condo size category with a lower average resale price than during 2020’s third quarter. Like co-ops, condo pricing gains were led by three-bedroom and larger units, which saw an 11% increase in their average price over the past year.
Condominium Average Sales Price
Studio 1-Bedroom 2-Bedroom 3+Bedroom All
3rd Q 20 $676,182 $986,634 $1,931,296 $4,800,766 $2,061,895
4th Q 20 $649,617 $957,113 $1,745,611 $4,565,429 $2,059,238
1st Q 21 $587,503 $946,749 $1,846,938 $3,924,246 $1,858,596
2nd Q 21 $593,698 $1,034,526 $1,834,832 $5,710,682 $2,259,250
3rd Q 21 $617,596 $1,047,345 $1,957,861 $5,332,794 $2,380,760
$1,4
69,7
88
$1,5
33,7
56
$1,4
33,0
13
$1,6
78,0
38
$1,7
24,7
50
$920
,000
$934
,499
$950
,000
$999
,000
$999
,250
$500,000
$1,000,000
$1,500,000
$2,000,000
$2,500,000
3rd Q 20 4th Q 20 1st Q 21 2nd Q 21 3rd Q 21
Average Sale Price Median Sale Price
Studio 1-Bedroom 2-Bedroom 3+Bedroom All
3rd Q 20 $473,161 $718,453 $1,343,872 $2,759,335 $1,147,839
4th Q 20 $489,081 $707,793 $1,304,146 $2,854,757 $1,201,262
1st Q 21 $437,623 $706,299 $1,318,723 $2,862,497 $1,187,924
2nd Q 21 $451,659 $724,612 $1,313,471 $2,971,931 $1,281,523
3rd Q 21 $450,254 $742,282 $1,400,321 $3,416,680 $1,345,225
BHS 6
157
135141 144
117
75
100
125
150
175
3rd Q 20 4th Q 20 1st Q 21 2nd Q 21 3rd Q 21
Average and Median Sales Price Per Square Foot
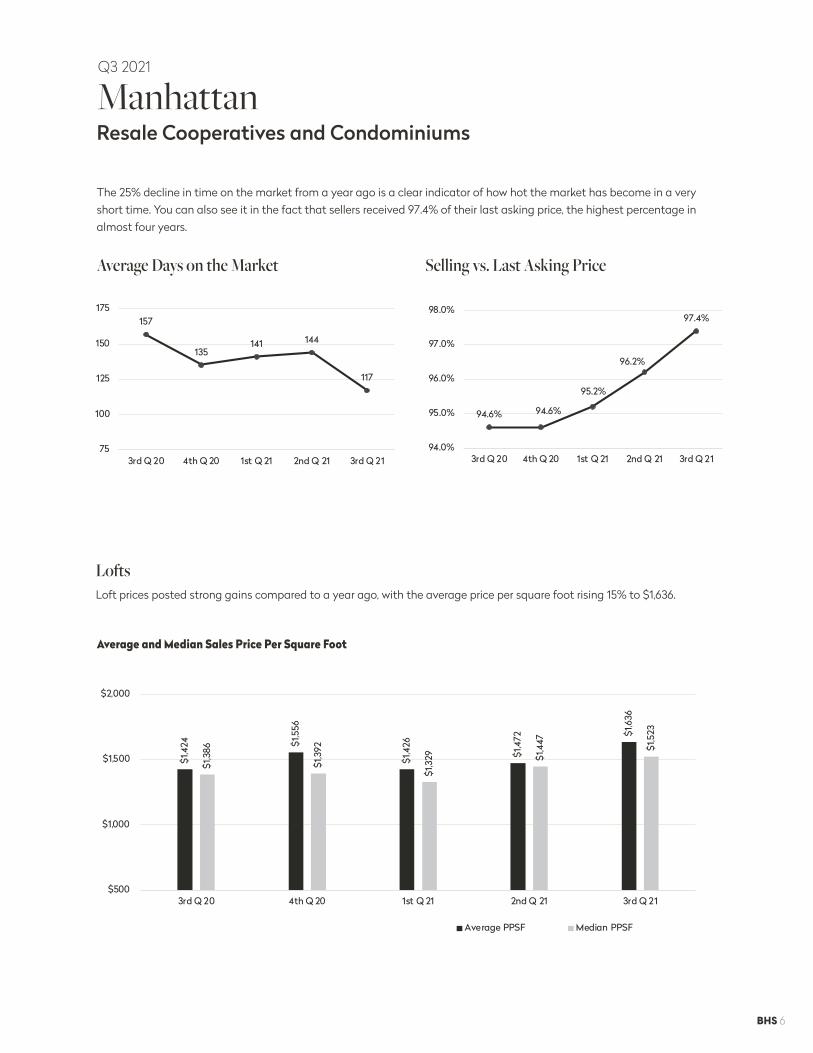
The 25% decline in time on the market from a year ago is a clear indicator of how hot the market has become in a very short time. You can also see it in the fact that sellers received 97.4% of their last asking price, the highest percentage in almost four years.
Loft prices posted strong gains compared to a year ago, with the average price per square foot rising 15% to $1,636.
$1,4
24
$1,5
56
$1,4
26
$1,4
72 $1,6
36
$1,3
86
$1,3
92
$1,3
29
$1,4
47
$1,5
23
$500
$1,000
$1,500
$2,000
3rd Q 20 4th Q 20 1st Q 21 2nd Q 21 3rd Q 21
Average PPSF Median PPSF
Manhattan Resale Cooperatives and Condominiums
Q3 2021
94.6% 94.6%
95.2%
96.2%
97.4%
94.0%
95.0%
96.0%
97.0%
98.0%
3rd Q 20 4th Q 20 1st Q 21 2nd Q 21 3rd Q 21
Average Days on the Market Selling vs. Last Asking Price
Lofts

BHS 7
18.1%
24.2%
6.4%
18.2%
13.0%
20.1%
Upper ManhattanGenerally north of 96th Street on the East Side, 110th Street on the West Side pages 18-19
West SideGenerally 59th Street to 110th Street, Hudson River to west of Fifth Ave. pages 10-11
East SideGenerally 59th Street to 96th Street, Fifth Ave. to the East River pages 8-9
Midtown34th Street to 59th Street, East River to the Hudson River pages 12-13
Downtown34th Street to 14th Street pages 14-15
DowntownSouth of 14th Street pages 16-17
Percentage of Resales in Manhattan
Q3 2021
BHS7

BHS 8
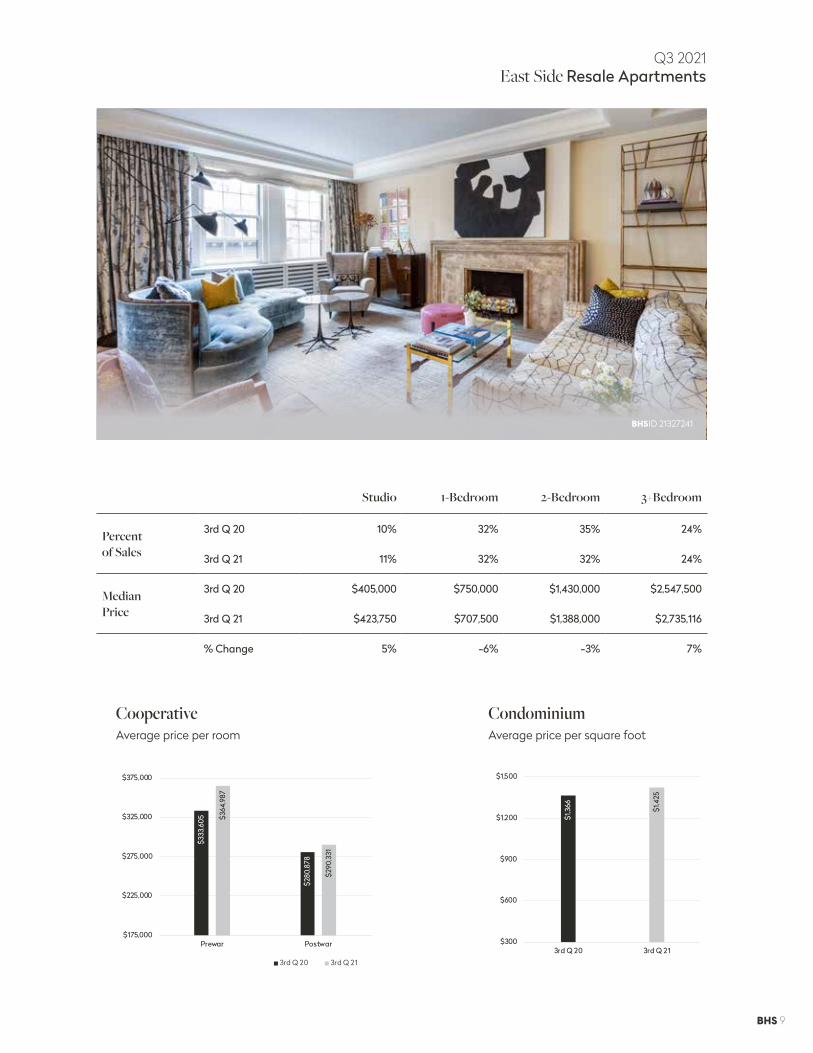
The average price per room
rose 9% for prewar co-ops
compared to a year ago.
Condo prices averaged 4%
more per square foot than
during 2020’s third quarter.
Resale Apartments
Q3 2021
Generally 59th St. to 96th St., Fifth Ave. to the East River
East
Sid
eBHSID 20683398
BHS 9
BHSID 21327241
$333
,605
$280
,878
$364
,987
$290
,331
$175,000
$225,000
$275,000
$325,000
$375,000
Prewar Postwar
3rd Q 20 3rd Q 21
Studio 1-Bedroom 2-Bedroom 3+Bedroom
Percent of Sales
3rd Q 20 10% 32% 35% 24%
3rd Q 21 11% 32% 32% 24%
Median Price
3rd Q 20 $405,000 $750,000 $1,430,000 $2,547,500
3rd Q 21 $423,750 $707,500 $1,388,000 $2,735,116
% Change 5% -6% -3% 7%
CooperativeAverage price per room
Condominium Average price per square foot
BHSWEB#20178493
Q3 2021
East Side Resale Apartments
$1,3
66 $1,4
25
$300
$600
$900
$1,200
$1,500
3rd Q 20 3rd Q 21
BHS 10
Wes
t Sid
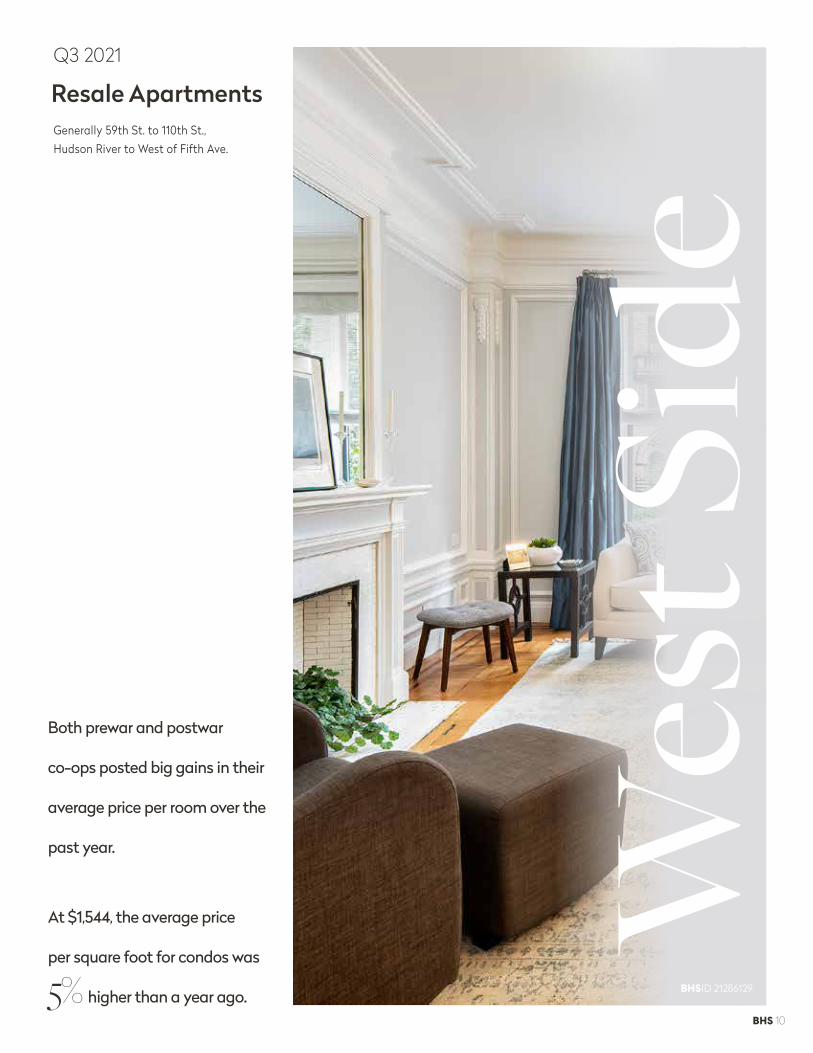
eBoth prewar and postwar
co-ops posted big gains in their
average price per room over the
past year.
At $1,544, the average price
per square foot for condos was 5% higher than a year ago. BHSID 21286129
Resale Apartments
Q3 2021
Generally 59th St. to 110th St., Hudson River to West of Fifth Ave.
BHS 11
BHSID 21334635
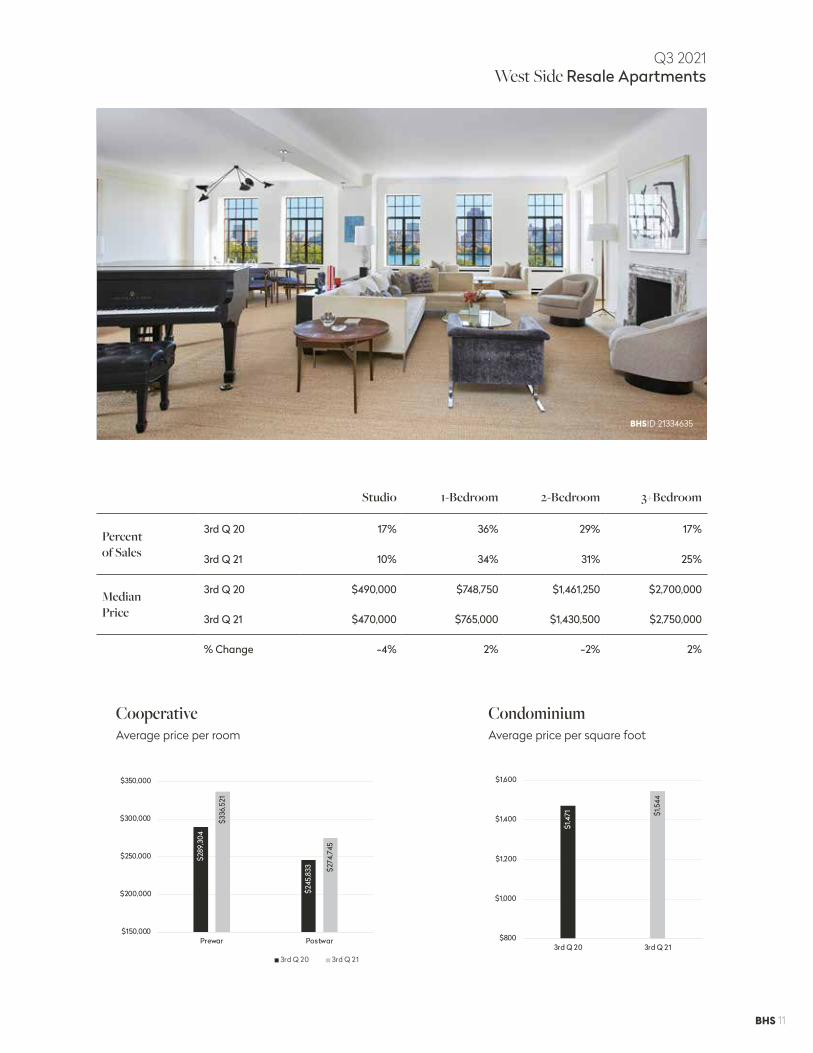
Studio 1-Bedroom 2-Bedroom 3+Bedroom
Percent of Sales
3rd Q 20 17% 36% 29% 17%
3rd Q 21 10% 34% 31% 25%
Median Price
3rd Q 20 $490,000 $748,750 $1,461,250 $2,700,000
3rd Q 21 $470,000 $765,000 $1,430,500 $2,750,000
% Change -4% 2% -2% 2%
CooperativeAverage price per room
Condominium Average price per square foot
Q3 2021
West Side Resale Apartments
$289
,304
$245
,833
$336
,521
$274
,745
$150,000
$200,000
$250,000
$300,000
$350,000
Prewar Postwar
3rd Q 20 3rd Q 21
$1,4
71 $1,5
44
$800
$1,000
$1,200
$1,400
$1,600
3rd Q 20 3rd Q 21
BHS 12
Mid
tow
nThe median resale price was
down compared to 3Q20 for
most sizes of apartments.
Condo prices did average 5% more per square foot
than a year ago. BHSID 21330210
Resale Apartments
Q3 2021
34th St to 59th St, East River to the Hudson River

BHS 13
BHSID 21320957
Studio 1-Bedroom 2-Bedroom 3+Bedroom
Percent of Sales
3rd Q 20 21% 44% 28% 7%
3rd Q 21 22% 40% 26% 12%
Median Price
3rd Q 20 $402,500 $746,250 $1,210,000 $2,440,000
3rd Q 21 $410,000 $725,000 $1,200,000 $2,215,000
% Change 2% -3% -1% -9%
CooperativeAverage price per room
Condominium Average price per square foot
Q3 2021
Midtown Resale Apartments
$196
,934
$209
,634
$220
,610
$219
,035
$50,000
$100,000
$150,000
$200,000
$250,000
Prewar Postwar
3rd Q 20 3rd Q 21
$1,4
27
$1,4
96
$0
$500
$1,000
$1,500
$2,000
3rd Q 20 3rd Q 21

BHS 14
While the median resale price
fell 26% from a year ago for
three-bedroom and larger
apartments, last year’s figure
was based on only eight
closings and must be viewed
with caution.
The average condo price per
square foot jumped 14%
over the past year to $1,647.
Resale Apartments
Q3 2021
34th St. to 14th St.
Dow
ntow
nBHSID 21323584

BHS 15
BHSID 21315825
$304
,545
$247
,134
$298
,196
$265
,874
$125,000
$175,000
$225,000
$275,000
$325,000
Prewar Postwar
3rd Q 20 3rd Q 21
Studio 1-Bedroom 2-Bedroom 3+Bedroom
Percent of Sales
3rd Q 20 23% 40% 32% 6%
3rd Q 21 22% 45% 24% 10%
Median Price
3rd Q 20 $585,000 $785,000 $1,537,500 $4,310,000
3rd Q 21 $527,500 $897,500 $1,950,000 $3,200,000
% Change -10% 14% 27% -26%
CooperativeAverage price per room
Condominium Average price per square foot
$1,4
46
$1,6
47
$600
$900
$1,200
$1,500
$1,800
3rd Q 20 3rd Q 21
34th St. to 14th St.
Q3 2021
Downtown Resale Apartments
BHS 16
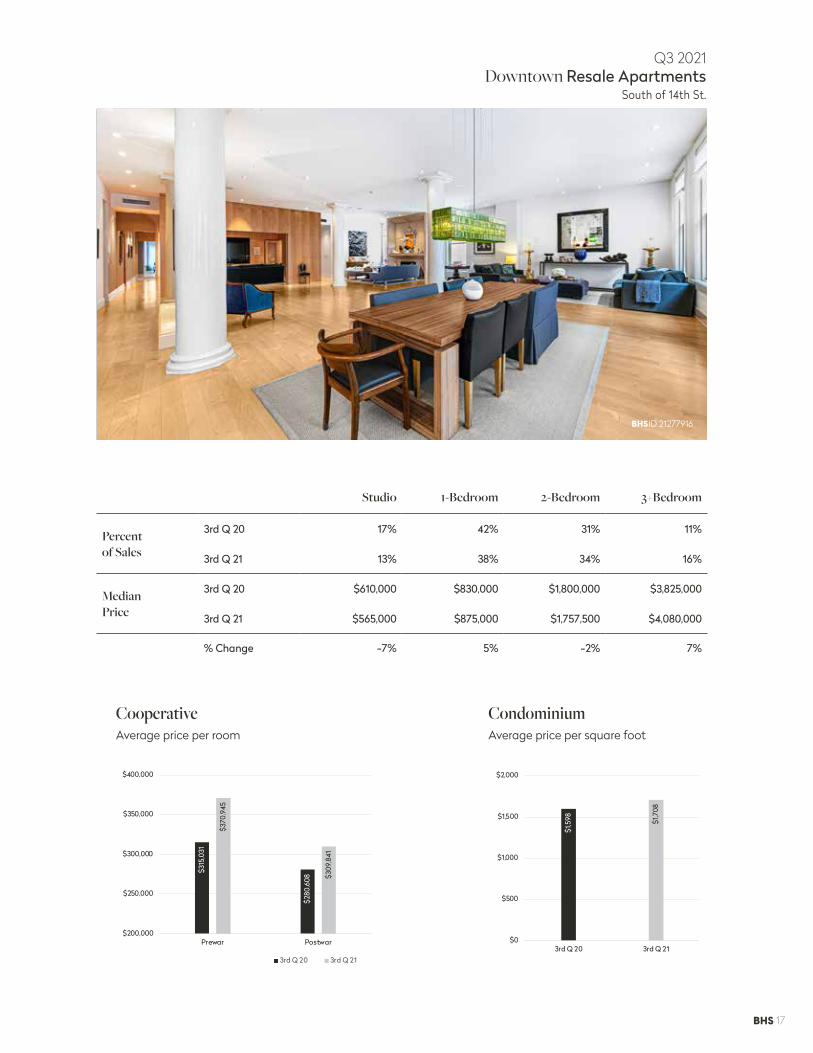
Co-op prices rose sharply
compared to 3Q20, with the
average price per room up 18% for prewar, and 10%
for postwar apartments.
Condo prices averaged 7%
more per square foot than
during 2020’s third quarter.
Resale Apartments
Q3 2021
South of 14th St.
Dow
ntow
nBHSID 19920224
BHS 17
BHSID 21277916
Studio 1-Bedroom 2-Bedroom 3+Bedroom
Percent of Sales
3rd Q 20 17% 42% 31% 11%
3rd Q 21 13% 38% 34% 16%
Median Price
3rd Q 20 $610,000 $830,000 $1,800,000 $3,825,000
3rd Q 21 $565,000 $875,000 $1,757,500 $4,080,000
% Change -7% 5% -2% 7%
CooperativeAverage price per room
Condominium Average price per square foot
South of 14th St.
Q3 2021
Downtown Resale Apartments
$315
,031
$280
,608
$370
,945
$309
,841
$200,000
$250,000
$300,000
$350,000
$400,000
Prewar Postwar
3rd Q 20 3rd Q 21
$1,5
98 $1,7
08
$0
$500
$1,000
$1,500
$2,000
3rd Q 20 3rd Q 21
BHS 18
While the median resale price
rose 44% compared to a
year ago for three-bedroom
and larger apartments, the
small number of closings in
2020’s third quarter makes this
gain less meaningful.
At $960 per square foot, condo
prices were 7% higher than a
year ago.
Resale Apartments
Q3 2021
Generally North of 96th Street on the East Side, and 110th St. on the West Side
Upp
er M
anha
ttan
BHSID 18671558

BHS 19
BHSID 21332926
Studio 1-Bedroom 2-Bedroom 3+Bedroom
Percent of Sales
3rd Q 20 7% 35% 39% 19%
3rd Q 21 5% 33% 40% 22%
Median Price
3rd Q 20 $320,000 $407,500 $702,500 $775,000
3rd Q 21 $287,000 $460,000 $654,000 $1,119,000
% Change -10% 13% -7% 44%
CooperativeAverage price per room
Condominium Average price per square foot
Q3 2021
Upper Manhattan Resale Apartments
$133
,374
$135
,772
$137
,100
$145
,551
$0
$50,000
$100,000
$150,000
$200,000
Prewar Postwar
3rd Q 20 3rd Q 21
$895 $9
60
$200
$400
$600
$800
$1,000
3rd Q 20 3rd Q 21
©2021 by Brown Harris Stevens. All Rights Reserved. This information may not be copied, used or distributed without Brown Harris Stevens’ consent. While information is believed true, no guaranty is made of accuracy.
Prepared by Gregory Heym, Chief Economist, Brown Harris Stevens.
East Side445 Park AvenueNew York, NY 10022 212.906.9200
West Side1926 BroadwayNew York, NY 10023212.588.5600
West Side/Columbus408 Columbus AvenueNew York, NY 10024212.769.3000
Downtown130 Fifth AvenueNew York, NY 10011212.906.0500
Village831 BroadwayNew York, NY 10003212.381.6500
Midtown770 Lexington Avenue, 10th FloorNew York, NY 10065212.508.7200
SoHo451 West BroadwayNew York, NY 10012212.381.4200
Tribeca43 North Moore StreetNew York, NY 10013212.452.4500
Harlem2169 Frederick Douglass BoulevardNew York, NY 10026212.381.2570
Development Marketing451 West BroadwayNew York, NY 10012212.521.5757
Con
tact
UsThird Quarter 2021
Residential Market Report