Third quarter 2019 report...Third quarter 2019 report 3Q19 Odfjell Group | Page Highlights – 3Q19...
31
Third quarter 2019 report November 6, 2019
Transcript of Third quarter 2019 report...Third quarter 2019 report 3Q19 Odfjell Group | Page Highlights – 3Q19...
Third quarter 2019 report
November 6, 2019
Third quarter 2019 report3Q19 Odfjell Group
| Page
Highlights – 3Q19
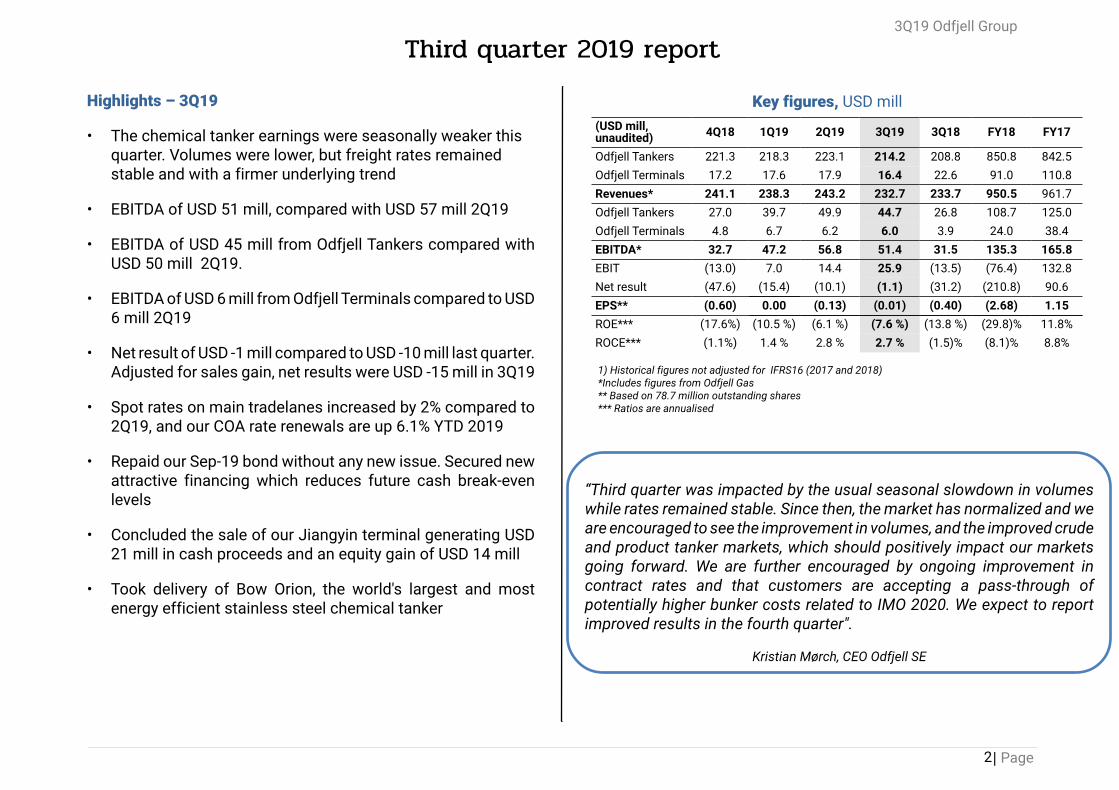
• The chemical tanker earnings were seasonally weaker thisquarter. Volumes were lower, but freight rates remainedstable and with a firmer underlying trend
• EBITDA of USD 51 mill, compared with USD 57 mill 2Q19
• EBITDA of USD 45 mill from Odfjell Tankers compared withUSD 50 mill 2Q19.
• EBITDA of USD 6 mill from Odfjell Terminals compared to USD6 mill 2Q19
• Net result of USD -1 mill compared to USD -10 mill last quarter.Adjusted for sales gain, net results were USD -15 mill in 3Q19
• Spot rates on main tradelanes increased by 2% compared to2Q19, and our COA rate renewals are up 6.1% YTD 2019
• Repaid our Sep-19 bond without any new issue. Secured newattractive financing which reduces future cash break-evenlevels
• Concluded the sale of our Jiangyin terminal generating USD21 mill in cash proceeds and an equity gain of USD 14 mill
• Took delivery of Bow Orion, the world's largest and mostenergy efficient stainless steel chemical tanker
Key figures, USD mill
1) Historical figures not adjusted for IFRS16 (2017 and 2018)*Includes figures from Odfjell Gas** Based on 78.7 million outstanding shares*** Ratios are annualised
“Third quarter was impacted by the usual seasonal slowdown in volumeswhile rates remained stable. Since then, the market has normalized and weare encouraged to see the improvement in volumes, and the improved crudeand product tanker markets, which should positively impact our marketsgoing forward. We are further encouraged by ongoing improvement incontract rates and that customers are accepting a pass-through ofpotentially higher bunker costs related to IMO 2020. We expect to reportimproved results in the fourth quarter".
Kristian Mørch, CEO Odfjell SE
(USD mill,unaudited) 4Q18 1Q19 2Q19 3Q19 3Q18 FY18 FY17
Odfjell Tankers 221.3 218.3 223.1 214.2 208.8 850.8 842.5Odfjell Terminals 17.2 17.6 17.9 16.4 22.6 91.0 110.8Revenues* 241.1 238.3 243.2 232.7 233.7 950.5 961.7Odfjell Tankers 27.0 39.7 49.9 44.7 26.8 108.7 125.0Odfjell Terminals 4.8 6.7 6.2 6.0 3.9 24.0 38.4EBITDA* 32.7 47.2 56.8 51.4 31.5 135.3 165.8EBIT (13.0) 7.0 14.4 25.9 (13.5) (76.4) 132.8Net result (47.6) (15.4) (10.1) (1.1) (31.2) (210.8) 90.6EPS** (0.60) 0.00 (0.13) (0.01) (0.40) (2.68) 1.15ROE*** (17.6%) (10.5 %) (6.1 %) (7.6 %) (13.8 %) (29.8)% 11.8%ROCE*** (1.1%) 1.4 % 2.8 % 2.7 % (1.5)% (8.1)% 8.8%
2
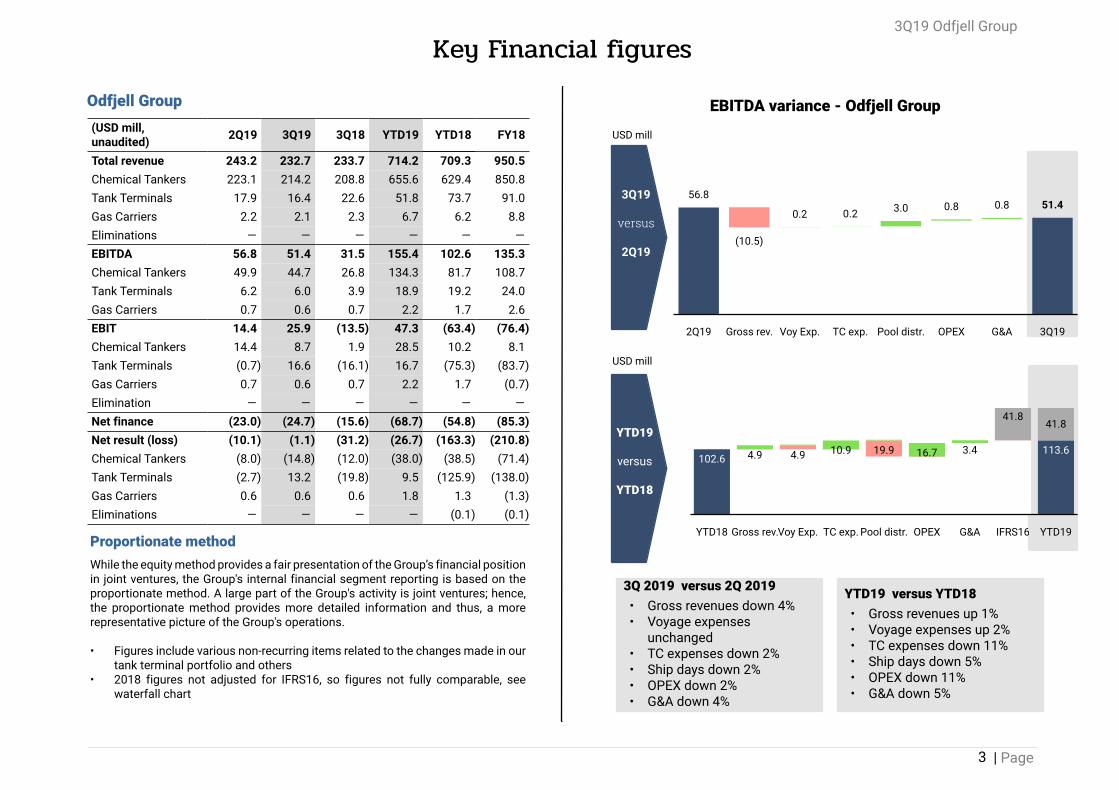
3Q 2019 versus 2Q 2019 • Gross revenues down 4% • Voyage expenses
unchanged • TC expenses down 2% • Ship days down 2% • OPEX down 2% • G&A down 4%
Key Financial figures3Q19 Odfjell Group
| Page
Odfjell Group EBITDA variance - Odfjell Group(USD mill,unaudited) 2Q19 3Q19 3Q18 YTD19 YTD18 FY18
Total revenue 243.2 232.7 233.7 714.2 709.3 950.5Chemical Tankers 223.1 214.2 208.8 655.6 629.4 850.8Tank Terminals 17.9 16.4 22.6 51.8 73.7 91.0Gas Carriers 2.2 2.1 2.3 6.7 6.2 8.8Eliminations — — — — — —EBITDA 56.8 51.4 31.5 155.4 102.6 135.3Chemical Tankers 49.9 44.7 26.8 134.3 81.7 108.7Tank Terminals 6.2 6.0 3.9 18.9 19.2 24.0Gas Carriers 0.7 0.6 0.7 2.2 1.7 2.6EBIT 14.4 25.9 (13.5) 47.3 (63.4) (76.4)Chemical Tankers 14.4 8.7 1.9 28.5 10.2 8.1Tank Terminals (0.7) 16.6 (16.1) 16.7 (75.3) (83.7)Gas Carriers 0.7 0.6 0.7 2.2 1.7 (0.7)Elimination — — — — — —Net finance (23.0) (24.7) (15.6) (68.7) (54.8) (85.3)Net result (loss) (10.1) (1.1) (31.2) (26.7) (163.3) (210.8)Chemical Tankers (8.0) (14.8) (12.0) (38.0) (38.5) (71.4)Tank Terminals (2.7) 13.2 (19.8) 9.5 (125.9) (138.0)Gas Carriers 0.6 0.6 0.6 1.8 1.3 (1.3)Eliminations — — — — (0.1) (0.1)
Proportionate methodWhile the equity method provides a fair presentation of the Group’s financial positionin joint ventures, the Group's internal financial segment reporting is based on theproportionate method. A large part of the Group's activity is joint ventures; hence,the proportionate method provides more detailed information and thus, a morerepresentative picture of the Group's operations.
• Figures include various non-recurring items related to the changes made in ourtank terminal portfolio and others
• 2018 figures not adjusted for IFRS16, so figures not fully comparable, seewaterfall chart
3
YTD19
versus
YTD18
3Q19
versus
2Q19
USD mill
USD mill
YTD19 versus YTD18 • Gross revenues up 1% • Voyage expenses up 2% • TC expenses down 11% • Ship days down 5% • OPEX down 11% • G&A down 5%
2Q19 Gross rev. Voy Exp. TC exp. Pool distr. OPEX G&A 3Q19
56.8
(10.5)
0.2 0.2 3.0 0.8 0.8 51.4
YTD18 Gross rev.Voy Exp. TC exp. Pool distr. OPEX G&A IFRS16 YTD19
113.64.9 19.94.9 10.9 16.7 3.4
41.841.8
102.6
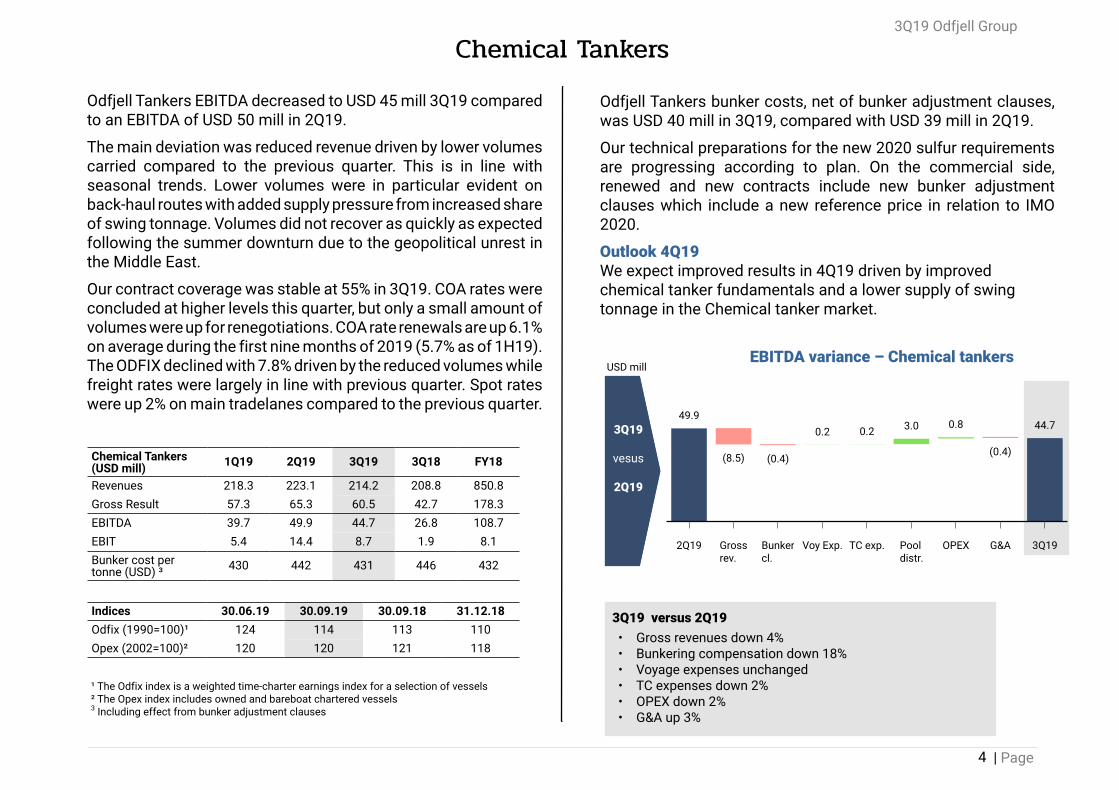
Odfjell Tankers bunker costs, net of bunker adjustment clauses,was USD 40 mill in 3Q19, compared with USD 39 mill in 2Q19.
Our technical preparations for the new 2020 sulfur requirementsare progressing according to plan. On the commercial side,renewed and new contracts include new bunker adjustmentclauses which include a new reference price in relation to IMO2020.
Outlook 4Q19 We expect improved results in 4Q19 driven by improvedchemical tanker fundamentals and a lower supply of swingtonnage in the Chemical tanker market.
EBITDA variance – Chemical tankers
3Q19 Odfjell Group
Odfjell Tankers EBITDA decreased to USD 45 mill 3Q19 comparedto an EBITDA of USD 50 mill in 2Q19.
The main deviation was reduced revenue driven by lower volumescarried compared to the previous quarter. This is in line withseasonal trends. Lower volumes were in particular evident onback-haul routes with added supply pressure from increased shareof swing tonnage. Volumes did not recover as quickly as expectedfollowing the summer downturn due to the geopolitical unrest inthe Middle East.
Our contract coverage was stable at 55% in 3Q19. COA rates wereconcluded at higher levels this quarter, but only a small amount ofvolumes were up for renegotiations. COA rate renewals are up 6.1%on average during the first nine months of 2019 (5.7% as of 1H19).The ODFIX declined with 7.8% driven by the reduced volumes whilefreight rates were largely in line with previous quarter. Spot rateswere up 2% on main tradelanes compared to the previous quarter.
| Page
Chemical Tankers
Chemical Tankers(USD mill) 1Q19 2Q19 3Q19 3Q18 FY18
Revenues 218.3 223.1 214.2 208.8 850.8Gross Result 57.3 65.3 60.5 42.7 178.3EBITDA 39.7 49.9 44.7 26.8 108.7EBIT 5.4 14.4 8.7 1.9 8.1Bunker cost pertonne (USD) ³ 430 442 431 446 432
Indices 30.06.19 30.09.19 30.09.18 31.12.18Odfix (1990=100)¹ 124 114 113 110Opex (2002=100)² 120 120 121 118
¹ The Odfix index is a weighted time-charter earnings index for a selection of vessels² The Opex index includes owned and bareboat chartered vessels3 Including effect from bunker adjustment clauses
4
3Q19
vesus
2Q19
USD mill
3Q19 versus 2Q19 • Gross revenues down 4% • Bunkering compensation down 18% • Voyage expenses unchanged • TC expenses down 2% • OPEX down 2% • G&A up 3%
2Q19 Grossrev.
Bunkercl.
Voy Exp. TC exp. Pooldistr.
OPEX G&A 3Q19
49.9
(8.5) (0.4)
0.2 0.2 3.0 0.8
(0.4)
44.7
3Q19 Odfjell Group
| Page
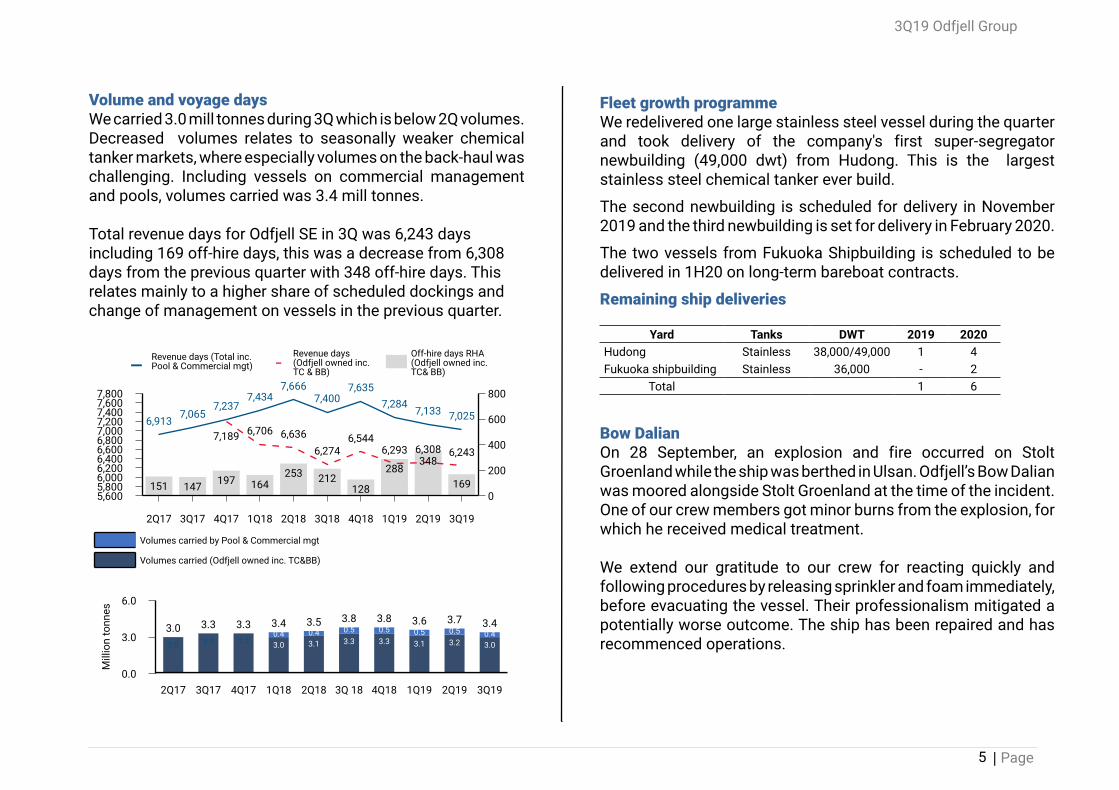
Volume and voyage daysWe carried 3.0 mill tonnes during 3Q which is below 2Q volumes.Decreased volumes relates to seasonally weaker chemicaltanker markets, where especially volumes on the back-haul waschallenging. Including vessels on commercial managementand pools, volumes carried was 3.4 mill tonnes.
Total revenue days for Odfjell SE in 3Q was 6,243 daysincluding 169 off-hire days, this was a decrease from 6,308days from the previous quarter with 348 off-hire days. Thisrelates mainly to a higher share of scheduled dockings andchange of management on vessels in the previous quarter.
Fleet growth programme We redelivered one large stainless steel vessel during the quarterand took delivery of the company's first super-segregatornewbuilding (49,000 dwt) from Hudong. This is the largeststainless steel chemical tanker ever build.
The second newbuilding is scheduled for delivery in November2019 and the third newbuilding is set for delivery in February 2020.
The two vessels from Fukuoka Shipbuilding is scheduled to bedelivered in 1H20 on long-term bareboat contracts.
Remaining ship deliveries
Bow DalianOn 28 September, an explosion and fire occurred on StoltGroenland while the ship was berthed in Ulsan. Odfjell’s Bow Dalianwas moored alongside Stolt Groenland at the time of the incident.One of our crew members got minor burns from the explosion, forwhich he received medical treatment.
We extend our gratitude to our crew for reacting quickly andfollowing procedures by releasing sprinkler and foam immediately,before evacuating the vessel. Their professionalism mitigated apotentially worse outcome. The ship has been repaired and hasrecommenced operations.
Revenue days (Total inc. Pool & Commercial mgt)
Revenue days(Odfjell owned inc.TC & BB)
Off-hire days RHA(Odfjell owned inc.TC& BB)— –
7,8007,6007,4007,2007,0006,8006,6006,4006,2006,0005,8005,600
800
600
400
200
0
2Q17 3Q17 4Q17 1Q18 2Q18 3Q18 4Q18 1Q19 2Q19 3Q19
6,9137,065
7,2377,434
7,6667,400
7,6357,284 7,133 7,025
7,189 6,706 6,6366,274
6,5446,293 6,308 6,243
151 147 197 164253 212
128
288348
169
Volumes carried by Pool & Commercial mgt
Volumes carried (Odfjell owned inc. TC&BB)
6.0
3.0
0.0
Mill
ion
tonn
es
2Q17 3Q17 4Q17 1Q18 2Q18 3Q 18 4Q18 1Q19 2Q19 3Q19
3.0
3.03.3
3.33.3
3.3
3.0 3.1 3.3 3.3 3.1 3.2 3.00.43.4
0.43.5
0.53.8
0.53.8
0.53.6
0.53.7
0.43.4
Yard Tanks DWT 2019 2020Hudong Stainless 38,000/49,000 1 4Fukuoka shipbuilding Stainless 36,000 - 2
Total 1 6
5
3Q19 Odfjell Group
| Page
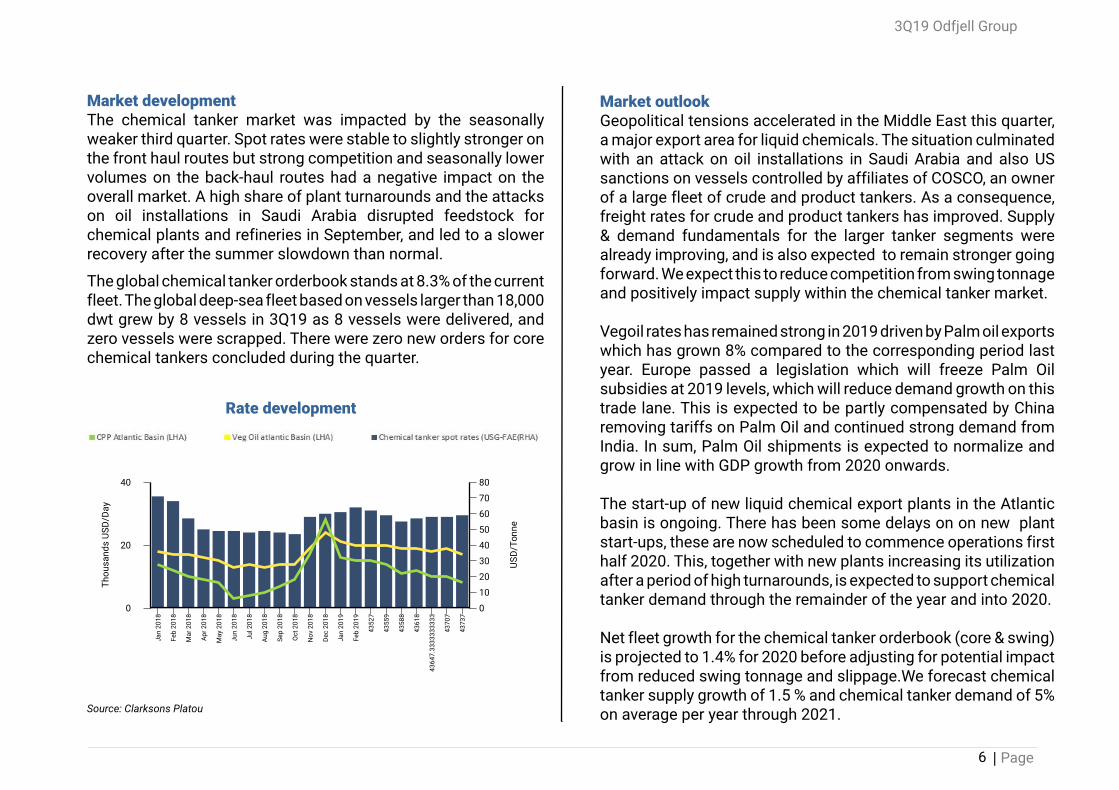
Market developmentThe chemical tanker market was impacted by the seasonallyweaker third quarter. Spot rates were stable to slightly stronger onthe front haul routes but strong competition and seasonally lowervolumes on the back-haul routes had a negative impact on theoverall market. A high share of plant turnarounds and the attackson oil installations in Saudi Arabia disrupted feedstock forchemical plants and refineries in September, and led to a slowerrecovery after the summer slowdown than normal.
The global chemical tanker orderbook stands at 8.3% of the currentfleet. The global deep-sea fleet based on vessels larger than 18,000dwt grew by 8 vessels in 3Q19 as 8 vessels were delivered, andzero vessels were scrapped. There were zero new orders for corechemical tankers concluded during the quarter.
Market outlookGeopolitical tensions accelerated in the Middle East this quarter,a major export area for liquid chemicals. The situation culminatedwith an attack on oil installations in Saudi Arabia and also USsanctions on vessels controlled by affiliates of COSCO, an ownerof a large fleet of crude and product tankers. As a consequence,freight rates for crude and product tankers has improved. Supply& demand fundamentals for the larger tanker segments werealready improving, and is also expected to remain stronger goingforward. We expect this to reduce competition from swing tonnageand positively impact supply within the chemical tanker market.
Vegoil rates has remained strong in 2019 driven by Palm oil exportswhich has grown 8% compared to the corresponding period lastyear. Europe passed a legislation which will freeze Palm Oilsubsidies at 2019 levels, which will reduce demand growth on thistrade lane. This is expected to be partly compensated by Chinaremoving tariffs on Palm Oil and continued strong demand fromIndia. In sum, Palm Oil shipments is expected to normalize andgrow in line with GDP growth from 2020 onwards.
The start-up of new liquid chemical export plants in the Atlanticbasin is ongoing. There has been some delays on on new plantstart-ups, these are now scheduled to commence operations firsthalf 2020. This, together with new plants increasing its utilizationafter a period of high turnarounds, is expected to support chemicaltanker demand through the remainder of the year and into 2020.
Net fleet growth for the chemical tanker orderbook (core & swing)is projected to 1.4% for 2020 before adjusting for potential impactfrom reduced swing tonnage and slippage.We forecast chemicaltanker supply growth of 1.5 % and chemical tanker demand of 5%on average per year through 2021.
40
20
0
Thou
sand
sUS
D/Da
y
80
70
60
50
40
30
20
10
0
USD/
Tonn
e
Jan
2018
Feb
2018
Mar
2018
Apr2
018
May
2018
Jun
2018
Jul2
018
Aug
2018
Sep
2018
Oct
2018
Nov
2018
Dec
2018
Jan
2019
Feb
2019
4352
7
4355
9
4358
8
4361
8
4364
7.33
3333
3333
4370
7
4373
7
Source: Clarksons Platou
6
Rate development
3Q19 Odfjell Group
| Page
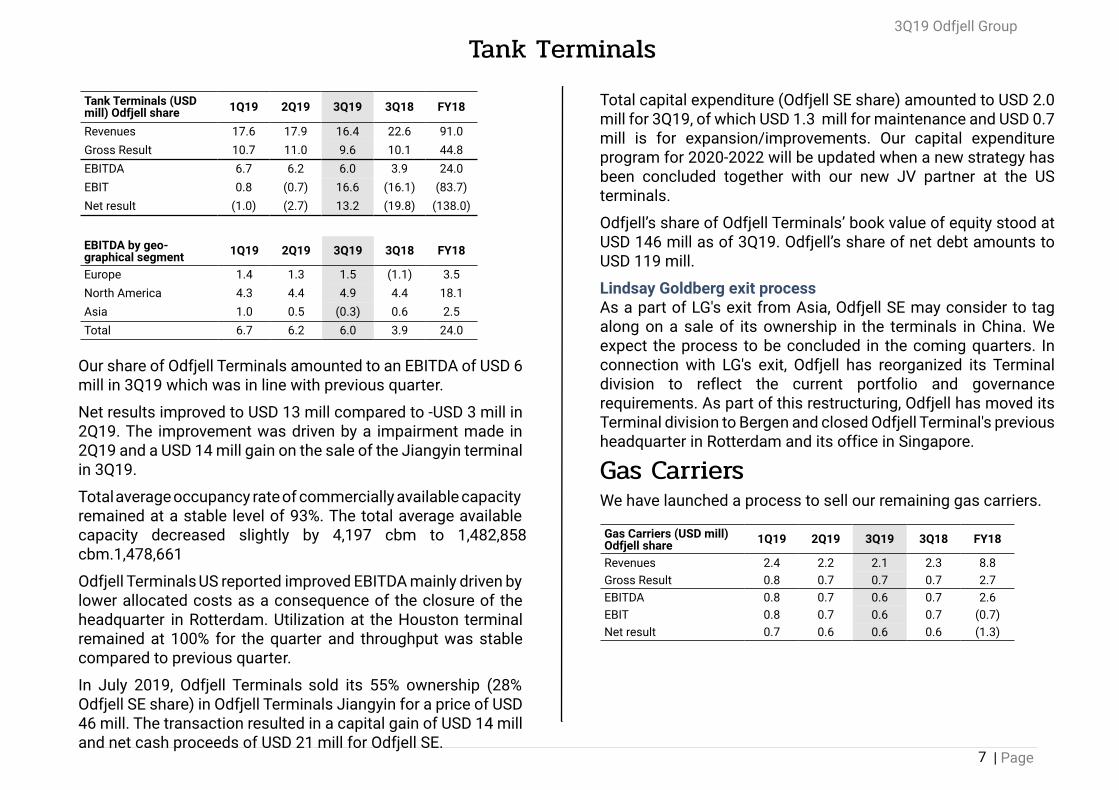
Our share of Odfjell Terminals amounted to an EBITDA of USD 6 mill in 3Q19 which was in line with previous quarter.
Net results improved to USD 13 mill compared to -USD 3 mill in 2Q19. The improvement was driven by a impairment made in 2Q19 and a USD 14 mill gain on the sale of the Jiangyin terminal in 3Q19.
Total average occupancy rate of commercially available capacity remained at a stable level of 93%. The total average available capacity decreased slightly by 4,197 cbm to 1,482,858 cbm.1,478,661
Odfjell Terminals US reported improved EBITDA mainly driven by lower allocated costs as a consequence of the closure of the headquarter in Rotterdam. Utilization at the Houston terminal remained at 100% for the quarter and throughput was stable compared to previous quarter.
In July 2019, Odfjell Terminals sold its 55% ownership (28%Odfjell SE share) in Odfjell Terminals Jiangyin for a price of USD 46 mill. The transaction resulted in a capital gain of USD 14 mill and net cash proceeds of USD 21 mill for Odfjell SE.
Total capital expenditure (Odfjell SE share) amounted to USD 2.0mill for 3Q19, of which USD 1.3 mill for maintenance and USD 0.7mill is for expansion/improvements. Our capital expenditureprogram for 2020-2022 will be updated when a new strategy hasbeen concluded together with our new JV partner at the USterminals.
Odfjell’s share of Odfjell Terminals’ book value of equity stood atUSD 146 mill as of 3Q19. Odfjell’s share of net debt amounts toUSD 119 mill.
Lindsay Goldberg exit processAs a part of LG's exit from Asia, Odfjell SE may consider to tagalong on a sale of its ownership in the terminals in China. Weexpect the process to be concluded in the coming quarters. Inconnection with LG's exit, Odfjell has reorganized its Terminaldivision to reflect the current portfolio and governancerequirements. As part of this restructuring, Odfjell has moved itsTerminal division to Bergen and closed Odfjell Terminal's previousheadquarter in Rotterdam and its office in Singapore.
Gas CarriersWe have launched a process to sell our remaining gas carriers.
Tank TerminalsTank Terminals (USDmill) Odfjell share 1Q19 2Q19 3Q19 3Q18 FY18
Revenues 17.6 17.9 16.4 22.6 91.0Gross Result 10.7 11.0 9.6 10.1 44.8EBITDA 6.7 6.2 6.0 3.9 24.0EBIT 0.8 (0.7) 16.6 (16.1) (83.7)Net result (1.0) (2.7) 13.2 (19.8) (138.0)
EBITDA by geo-graphical segment 1Q19 2Q19 3Q19 3Q18 FY18
Europe 1.4 1.3 1.5 (1.1) 3.5North America 4.3 4.4 4.9 4.4 18.1Asia 1.0 0.5 (0.3) 0.6 2.5Total 6.7 6.2 6.0 3.9 24.0
Gas Carriers (USD mill)Odfjell share 1Q19 2Q19 3Q19 3Q18 FY18
Revenues 2.4 2.2 2.1 2.3 8.8Gross Result 0.8 0.7 0.7 0.7 2.7EBITDA 0.8 0.7 0.6 0.7 2.6EBIT 0.8 0.7 0.6 0.7 (0.7)Net result 0.7 0.6 0.6 0.6 (1.3)
7
3Q19 Odfjell Group
| Page
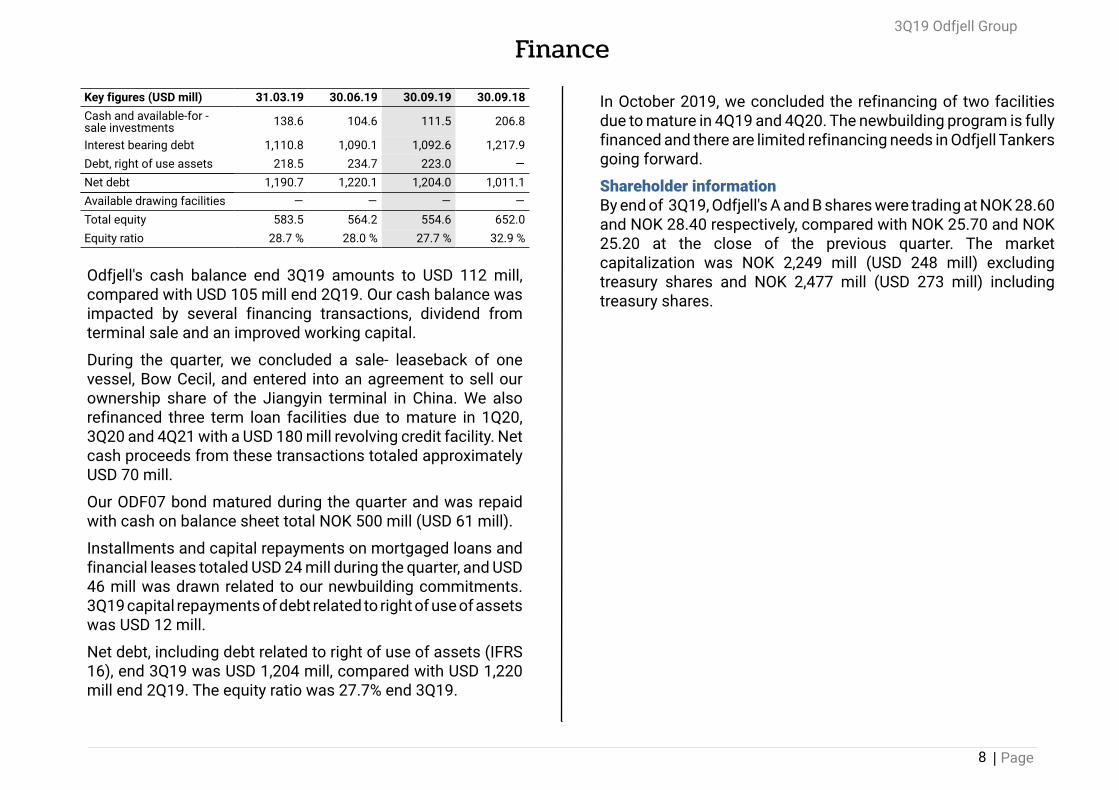
Odfjell's cash balance end 3Q19 amounts to USD 112 mill,compared with USD 105 mill end 2Q19. Our cash balance wasimpacted by several financing transactions, dividend fromterminal sale and an improved working capital.
During the quarter, we concluded a sale- leaseback of onevessel, Bow Cecil, and entered into an agreement to sell ourownership share of the Jiangyin terminal in China. We alsorefinanced three term loan facilities due to mature in 1Q20,3Q20 and 4Q21 with a USD 180 mill revolving credit facility. Netcash proceeds from these transactions totaled approximatelyUSD 70 mill.
Our ODF07 bond matured during the quarter and was repaidwith cash on balance sheet total NOK 500 mill (USD 61 mill).
Installments and capital repayments on mortgaged loans andfinancial leases totaled USD 24 mill during the quarter, and USD46 mill was drawn related to our newbuilding commitments.3Q19 capital repayments of debt related to right of use of assetswas USD 12 mill.
Net debt, including debt related to right of use of assets (IFRS16), end 3Q19 was USD 1,204 mill, compared with USD 1,220mill end 2Q19. The equity ratio was 27.7% end 3Q19.
In October 2019, we concluded the refinancing of two facilitiesdue to mature in 4Q19 and 4Q20. The newbuilding program is fullyfinanced and there are limited refinancing needs in Odfjell Tankersgoing forward.
Shareholder informationBy end of 3Q19, Odfjell's A and B shares were trading at NOK 28.60and NOK 28.40 respectively, compared with NOK 25.70 and NOK25.20 at the close of the previous quarter. The marketcapitalization was NOK 2,249 mill (USD 248 mill) excludingtreasury shares and NOK 2,477 mill (USD 273 mill) includingtreasury shares.
FinanceKey figures (USD mill) 31.03.19 30.06.19 30.09.19 30.09.18Cash and available-for -sale investments 138.6 104.6 111.5 206.8
Interest bearing debt 1,110.8 1,090.1 1,092.6 1,217.9Debt, right of use assets 218.5 234.7 223.0 —Net debt 1,190.7 1,220.1 1,204.0 1,011.1Available drawing facilities — — — —Total equity 583.5 564.2 554.6 652.0Equity ratio 28.7 % 28.0 % 27.7 % 32.9 %
8
160
140
120
100
80
602008 2009 2010 2011 2012 2013 2014 2015 2016 2017 2018
3Q19 Odfjell Group
| Page
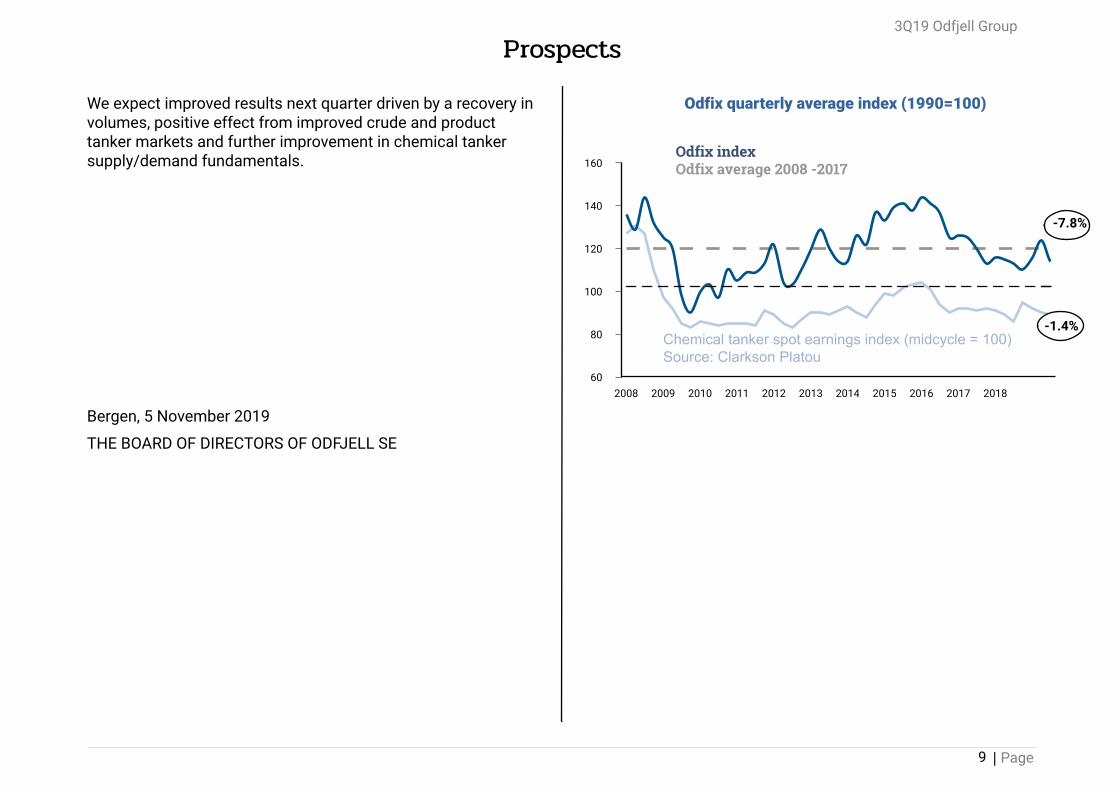
We expect improved results next quarter driven by a recovery involumes, positive effect from improved crude and producttanker markets and further improvement in chemical tankersupply/demand fundamentals.
Bergen, 5 November 2019
THE BOARD OF DIRECTORS OF ODFJELL SE
Odfix quarterly average index (1990=100)
Prospects
9
Chemical tanker spot earnings index (midcycle = 100) Source: Clarkson Platou
Odfix indexOdfix average 2008 -2017
-1.4%
-7.8%
3Q19 Odfjell Group
10 | Page
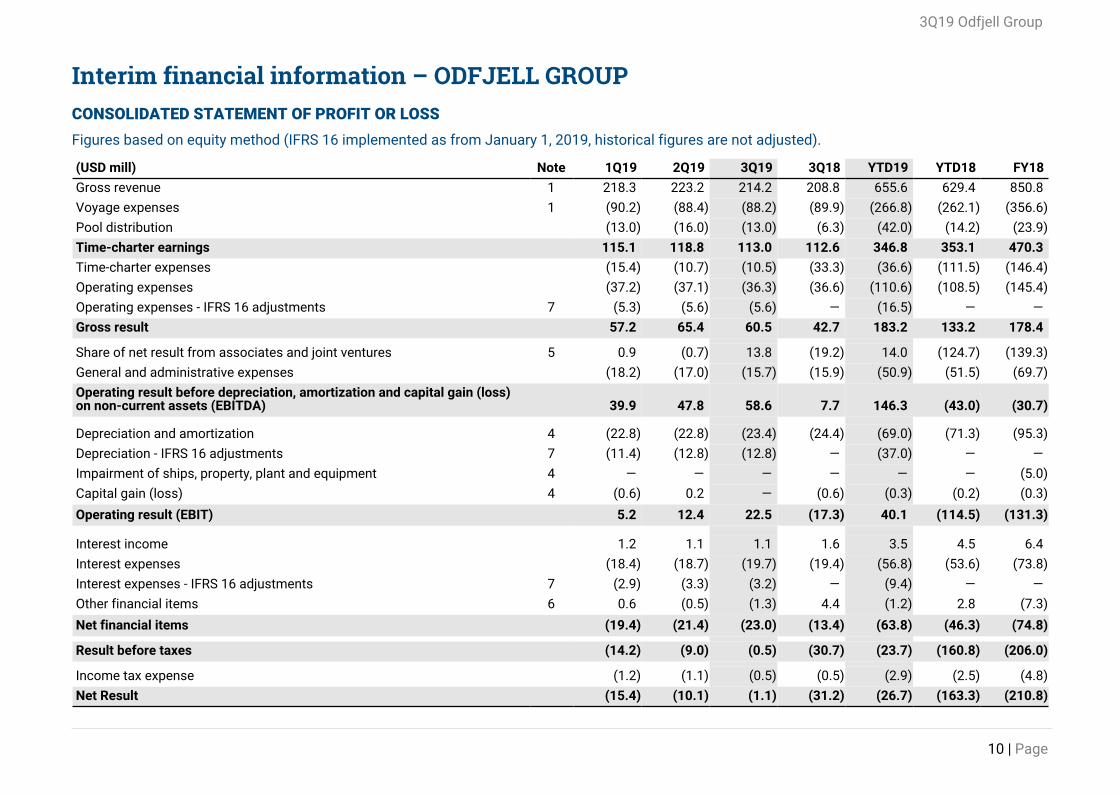
Interim financial information – ODFJELL GROUP
CONSOLIDATED STATEMENT OF PROFIT OR LOSS
Figures based on equity method (IFRS 16 implemented as from January 1, 2019, historical figures are not adjusted).
(USD mill) Note 1Q19 2Q19 3Q19 3Q18 YTD19 YTD18 FY18
Gross revenue 1 218.3 223.2 214.2 208.8 655.6 629.4 850.8
Voyage expenses 1 (90.2) (88.4) (88.2) (89.9) (266.8) (262.1) (356.6)
Pool distribution (13.0) (16.0) (13.0) (6.3) (42.0) (14.2) (23.9)
Time-charter earnings 115.1 118.8 113.0 112.6 346.8 353.1 470.3
Time-charter expenses (15.4) (10.7) (10.5) (33.3) (36.6) (111.5) (146.4)
Operating expenses (37.2) (37.1) (36.3) (36.6) (110.6) (108.5) (145.4)
Operating expenses - IFRS 16 adjustments 7 (5.3) (5.6) (5.6) — (16.5) — —
Gross result 57.2 65.4 60.5 42.7 183.2 133.2 178.4
Share of net result from associates and joint ventures 5 0.9 (0.7) 13.8 (19.2) 14.0 (124.7) (139.3)
General and administrative expenses (18.2) (17.0) (15.7) (15.9) (50.9) (51.5) (69.7)
Operating result before depreciation, amortization and capital gain (loss)on non-current assets (EBITDA) 39.9 47.8 58.6 7.7 146.3 (43.0) (30.7)
Depreciation and amortization 4 (22.8) (22.8) (23.4) (24.4) (69.0) (71.3) (95.3)
Depreciation - IFRS 16 adjustments 7 (11.4) (12.8) (12.8) — (37.0) — —
Impairment of ships, property, plant and equipment 4 — — — — — — (5.0)
Capital gain (loss) 4 (0.6) 0.2 — (0.6) (0.3) (0.2) (0.3)
Operating result (EBIT) 5.2 12.4 22.5 (17.3) 40.1 (114.5) (131.3)
Interest income 1.2 1.1 1.1 1.6 3.5 4.5 6.4
Interest expenses (18.4) (18.7) (19.7) (19.4) (56.8) (53.6) (73.8)
Interest expenses - IFRS 16 adjustments 7 (2.9) (3.3) (3.2) — (9.4) — —
Other financial items 6 0.6 (0.5) (1.3) 4.4 (1.2) 2.8 (7.3)
Net financial items (19.4) (21.4) (23.0) (13.4) (63.8) (46.3) (74.8)
Result before taxes (14.2) (9.0) (0.5) (30.7) (23.7) (160.8) (206.0)
Income tax expense (1.2) (1.1) (0.5) (0.5) (2.9) (2.5) (4.8)
Net Result (15.4) (10.1) (1.1) (31.2) (26.7) (163.3) (210.8)
3Q19 Odfjell Group
11 | Page
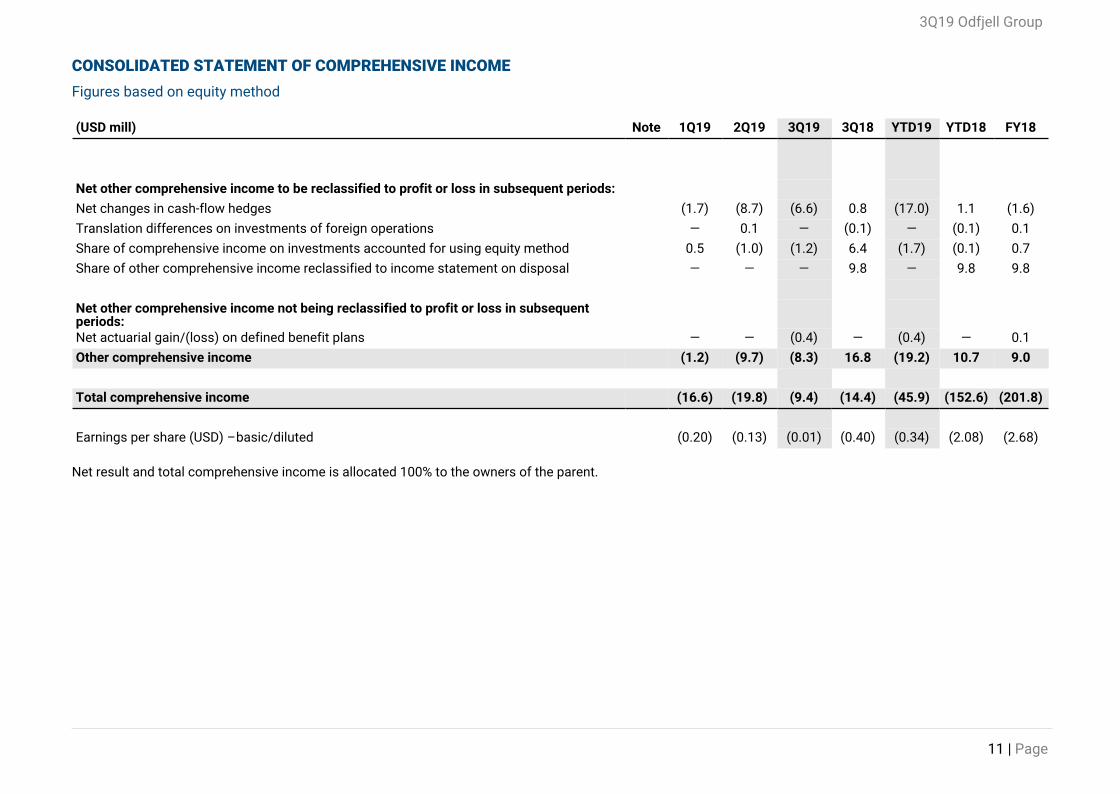
CONSOLIDATED STATEMENT OF COMPREHENSIVE INCOME
Figures based on equity method
(USD mill) Note 1Q19 2Q19 3Q19 3Q18 YTD19 YTD18 FY18
Net other comprehensive income to be reclassified to profit or loss in subsequent periods:
Net changes in cash-flow hedges (1.7) (8.7) (6.6) 0.8 (17.0) 1.1 (1.6)
Translation differences on investments of foreign operations — 0.1 — (0.1) — (0.1) 0.1
Share of comprehensive income on investments accounted for using equity method 0.5 (1.0) (1.2) 6.4 (1.7) (0.1) 0.7
Share of other comprehensive income reclassified to income statement on disposal — — — 9.8 — 9.8 9.8
Net other comprehensive income not being reclassified to profit or loss in subsequentperiods:Net actuarial gain/(loss) on defined benefit plans — — (0.4) — (0.4) — 0.1
Other comprehensive income (1.2) (9.7) (8.3) 16.8 (19.2) 10.7 9.0
Total comprehensive income (16.6) (19.8) (9.4) (14.4) (45.9) (152.6) (201.8)
Earnings per share (USD) – basic/diluted (0.20) (0.13) (0.01) (0.40) (0.34) (2.08) (2.68)
Net result and total comprehensive income is allocated 100% to the owners of the parent.
3Q19 Odfjell Group
12 | Page
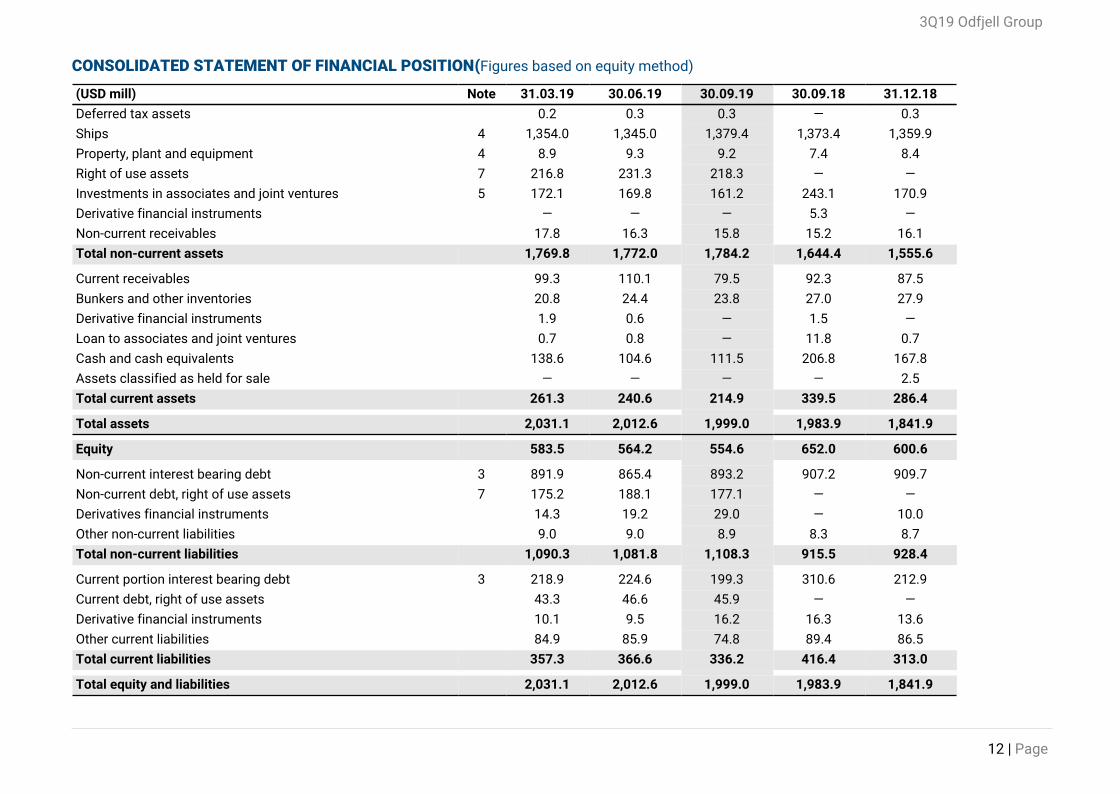
CONSOLIDATED STATEMENT OF FINANCIAL POSITION (Figures based on equity method)
(USD mill) Note 31.03.19 30.06.19 30.09.19 30.09.18 31.12.18
Deferred tax assets 0.2 0.3 0.3 — 0.3
Ships 4 1,354.0 1,345.0 1,379.4 1,373.4 1,359.9
Property, plant and equipment 4 8.9 9.3 9.2 7.4 8.4
Right of use assets 7 216.8 231.3 218.3 — —
Investments in associates and joint ventures 5 172.1 169.8 161.2 243.1 170.9
Derivative financial instruments — — — 5.3 —
Non-current receivables 17.8 16.3 15.8 15.2 16.1
Total non-current assets 1,769.8 1,772.0 1,784.2 1,644.4 1,555.6
Current receivables 99.3 110.1 79.5 92.3 87.5
Bunkers and other inventories 20.8 24.4 23.8 27.0 27.9
Derivative financial instruments 1.9 0.6 — 1.5 —
Loan to associates and joint ventures 0.7 0.8 — 11.8 0.7
Cash and cash equivalents 138.6 104.6 111.5 206.8 167.8
Assets classified as held for sale — — — — 2.5
Total current assets 261.3 240.6 214.9 339.5 286.4
Total assets 2,031.1 2,012.6 1,999.0 1,983.9 1,841.9
Equity 583.5 564.2 554.6 652.0 600.6
Non-current interest bearing debt 3 891.9 865.4 893.2 907.2 909.7
Non-current debt, right of use assets 7 175.2 188.1 177.1 — —
Derivatives financial instruments 14.3 19.2 29.0 — 10.0
Other non-current liabilities 9.0 9.0 8.9 8.3 8.7
Total non-current liabilities 1,090.3 1,081.8 1,108.3 915.5 928.4
Current portion interest bearing debt 3 218.9 224.6 199.3 310.6 212.9
Current debt, right of use assets 43.3 46.6 45.9 — —
Derivative financial instruments 10.1 9.5 16.2 16.3 13.6
Other current liabilities 84.9 85.9 74.8 89.4 86.5
Total current liabilities 357.3 366.6 336.2 416.4 313.0
Total equity and liabilities 2,031.1 2,012.6 1,999.0 1,983.9 1,841.9
3Q19 Odfjell Group
13 | Page
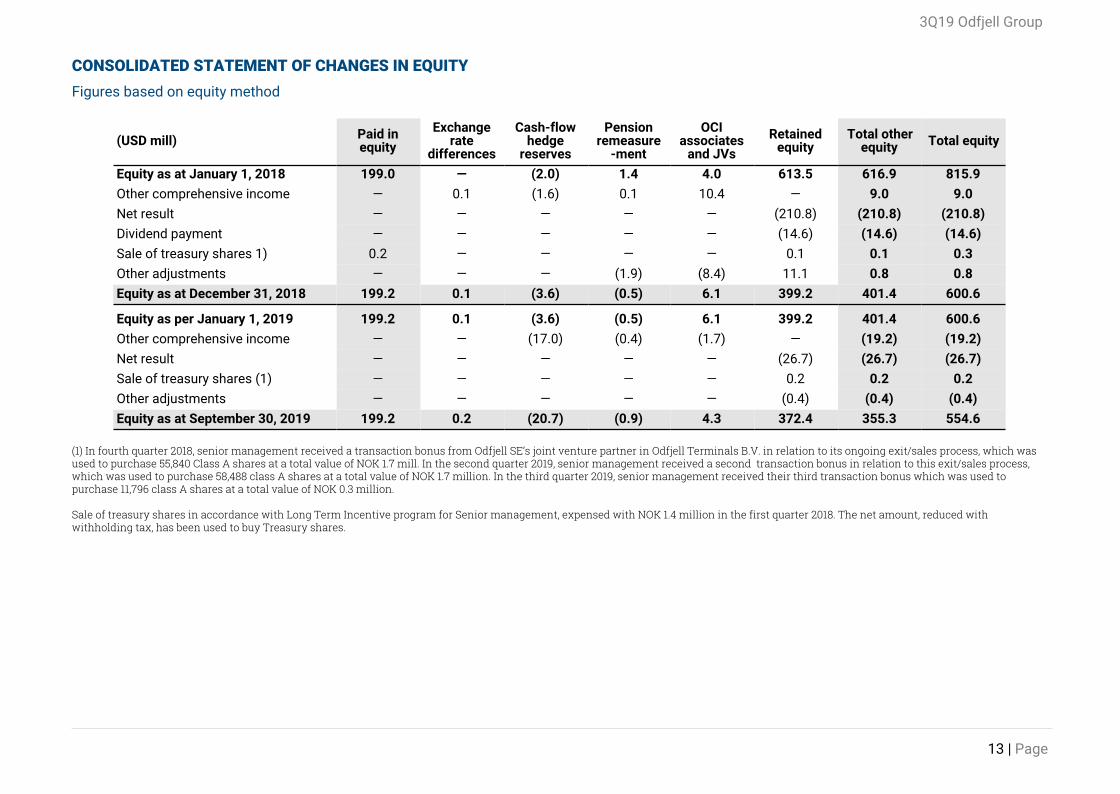
CONSOLIDATED STATEMENT OF CHANGES IN EQUITY
Figures based on equity method
(USD mill) Paid inequity
Exchangerate
differences
Cash-flowhedge
reserves
Pensionremeasure
-ment
OCIassociates
and JVs
Retainedequity
Total otherequity Total equity
Equity as at January 1, 2018 199.0 — (2.0) 1.4 4.0 613.5 616.9 815.9
Other comprehensive income — 0.1 (1.6) 0.1 10.4 — 9.0 9.0
Net result — — — — — (210.8) (210.8) (210.8)
Dividend payment — — — — — (14.6) (14.6) (14.6)
Sale of treasury shares 1) 0.2 — — — — 0.1 0.1 0.3
Other adjustments — — — (1.9) (8.4) 11.1 0.8 0.8
Equity as at December 31, 2018 199.2 0.1 (3.6) (0.5) 6.1 399.2 401.4 600.6
Equity as per January 1, 2019 199.2 0.1 (3.6) (0.5) 6.1 399.2 401.4 600.6
Other comprehensive income — — (17.0) (0.4) (1.7) — (19.2) (19.2)
Net result — — — — — (26.7) (26.7) (26.7)
Sale of treasury shares (1) — — — — — 0.2 0.2 0.2
Other adjustments — — — — — (0.4) (0.4) (0.4)
Equity as at September 30, 2019 199.2 0.2 (20.7) (0.9) 4.3 372.4 355.3 554.6
(1) In fourth quarter 2018, senior management received a transaction bonus from Odfjell SE’s joint venture partner in Odfjell Terminals B.V. in relation to its ongoing exit/sales process, which was used to purchase 55,840 Class A shares at a total value of NOK 1.7 mill. In the second quarter 2019, senior management received a second transaction bonus in relation to this exit/sales process, which was used to purchase 58,488 class A shares at a total value of NOK 1.7 million. In the third quarter 2019, senior management received their third transaction bonus which was used to purchase 11,796 class A shares at a total value of NOK 0.3 million.
Sale of treasury shares in accordance with Long Term Incentive program for Senior management, expensed with NOK 1.4 million in the first quarter 2018. The net amount, reduced with withholding tax, has been used to buy Treasury shares.
3Q19 Odfjell Group
14 | Page
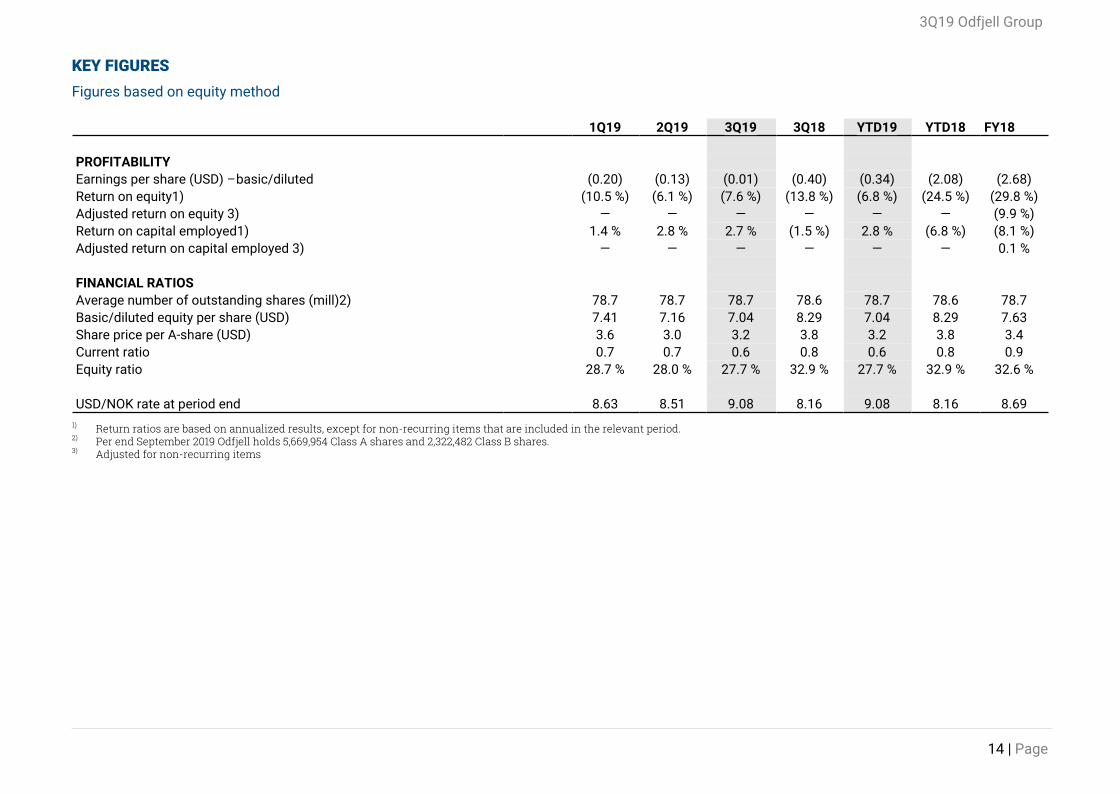
KEY FIGURES
Figures based on equity method
1Q19 2Q19 3Q19 3Q18 YTD19 YTD18 FY18
PROFITABILITYEarnings per share (USD) – basic/diluted (0.20) (0.13) (0.01) (0.40) (0.34) (2.08) (2.68)Return on equity1) (10.5 %) (6.1 %) (7.6 %) (13.8 %) (6.8 %) (24.5 %) (29.8 %)Adjusted return on equity 3) — — — — — — (9.9 %)Return on capital employed1) 1.4 % 2.8 % 2.7 % (1.5 %) 2.8 % (6.8 %) (8.1 %)Adjusted return on capital employed 3) — — — — — — 0.1 %
FINANCIAL RATIOSAverage number of outstanding shares (mill)2) 78.7 78.7 78.7 78.6 78.7 78.6 78.7Basic/diluted equity per share (USD) 7.41 7.16 7.04 8.29 7.04 8.29 7.63Share price per A-share (USD) 3.6 3.0 3.2 3.8 3.2 3.8 3.4Current ratio 0.7 0.7 0.6 0.8 0.6 0.8 0.9Equity ratio 28.7 % 28.0 % 27.7 % 32.9 % 27.7 % 32.9 % 32.6 %
USD/NOK rate at period end 8.63 8.51 9.08 8.16 9.08 8.16 8.691) Return ratios are based on annualized results, except for non-recurring items that are included in the relevant period.2) Per end September 2019 Odfjell holds 5,669,954 Class A shares and 2,322,482 Class B shares. 3) Adjusted for non-recurring items

3Q19 Odfjell Group
15 | Page
CONSOLIDATED CASH FLOW STATEMENT
Figures based on equity method
(USD mill) 1Q19 2Q19 3Q19 3Q18 YTD19 YTD18 FY18
Profit before income taxes (14.2) (9.0) (0.5) (30.7) (23.7) (160.8) (206.0)
Taxes paid in the period (0.7) (0.5) (1.2) (0.2) (2.5) (2.5) (3.2)
Depreciation, impairment and capital (gain) loss fixed assets 34.7 35.4 36.1 24.3 106.2 70.9 99.8
Change in inventory, trade debtors and creditors (increase) decrease (5.8) (14.8) 21.8 (16.9) 1.2 (16.4) (20.5)
Share of net result from associates and JV's (0.9) 0.7 (13.8) 19.2 (14.0) 124.7 139.3
Unrealized changes in derivatives (2.8) (3.1) 10.6 (6.9) 4.7 (10.0) 18.0
Net interest expenses 20.0 20.9 21.8 17.8 62.7 49.1 67.5
Interest received 1.7 0.8 1.1 2.5 3.6 4.2 6.0
Interest paid (22.0) (21.4) (24.2) (20.5) (67.7) (53.4) (73.5)
Effect of exchange differences 1.9 3.5 (7.7) 0.9 (2.3) 3.0 (13.3)
Change in other current accruals (0.7) 4.7 1.5 14.6 5.6 25.7 28.7
Net cash-flow from operating activities 11.2 17.1 45.3 4.1 73.7 34.5 42.7
Sale of ships, property, plant and equipment 2.0 — — — 2.0 — —
Investment in ships, property, plant and equipment (17.4) (14.3) (57.7) (18.3) (89.4) (150.2) (169.1)
Dividend/other from investments in associates and JV’s — — 20.7 — 20.7 — 81.1
Investment in shares — — — — — — (24.8)
Other non-current receivables and investments 0.1 (0.1) 0.8 (1.0) 0.8 2.9 14.0
Net cash-flow from investing activities (15.3) (14.4) (36.1) (19.3) (65.8) (147.3) (98.8)
New interest bearing debt (net of fees paid) 20.5 (0.6) 248.6 64.7 268.5 261.1 299.9
Repayment of interest bearing debt (35.8) (24.8) (238.9) (34.4) (299.5) (133.0) (267.8)
Repayment of lease debt related to right of use assets (9.9) (11.3) (11.7) — (32.9) —
Dividend payment — — — — — (14.6) (14.6)
Sale/purchase of treasury shares — — — — — — 0.2
Net cash-flow from financing activities (25.2) (36.7) (2.0) 30.3 (63.9) 113.6 17.7
Effect on cash balance from currency exchange rate fluctuations — 0.1 (0.3) (1.2) (0.2) (0.5) (0.4)
Net change in cash and cash equivalents (29.2) (34.0) 6.9 13.9 (56.3) 0.3 (38.7)
Opening cash and cash equivalents 167.8 138.6 104.6 192.9 167.8 206.6 206.6
Closing cash and cash equivalents 138.6 104.6 111.5 206.8 111.5 206.8 167.8
3Q19 Odfjell Group
16 | Page
NOTES TO THE INTERIM CONSOLIDATED FINANCIAL STATEMENTS
Note 1 – Accounting principles
Odfjell SE is ultimate parent company of the Odfjell Group. Odfjell SE is a public listed company traded on the Oslo Stock Exchange. The company’s address is Conrad Mohrs veg 29, Bergen, Norway.
Basis of preparation and changes to the Group’s accounting policies
The interim consolidated financial statements ended September 30, 2019 for the Odfjell Group and have been prepared in accordance with International Accounting Standard IAS 34 “Interim Financial Reporting”. The interim financial statements do not include all the information and disclosures required in the annual financial statements and should be read in conjunction with the Group’s annual financial statements as at December 31, 2018. The interim financial statements are unaudited.
The accounting principles used in the preparation of these financial statements are consistent with those used in the annual financial statements for the year ended December 31, 2018, except for the implementation of ‘IFRS 16 Leases’ which is adopted January 1, 2019. Some new standards and amendments to standard and interpretations are not yet effective and have not yet been applied in preparing the consolidated financial statements. The Group’s assessment of the impacts on these new standards is set out below. From January 1, 2019, the Group has also applied hedge accounting for its interest rate swaps.
IFRS 16 Leases – implementation effect January 1, 2019
The Odfjell Group has adopted ‘IFRS 16 Leases’ for reporting periods beginning on and after January 1, 2019. The IFRS 16 supersedes IAS 17, IFRIC 4, SIC 15 and SIC 27.
The Odfjell Group has adopted IFRS 16 using the modified retrospective method of adoption with the date of initial application of January 1, 2019. The Group elected to use the transition practical expedient allowing the standard to be applied only to contracts that were previously identified as leases applying IAS 17 at the date of application. The Group also elected to use the recognition exemptions for lease contracts that, at January 1, 2019, have a lease term of 12 months or less and for low value assets. Low value assets are non strategic assets and comprises coffee machines, copy machines and smaller equipments.
The effect of adoption of IFRS 16 as per January 1, 2019 is as follows: Right of use of assets increases with USD 187.8 million and lease liability increases with similar amount, distributed between current lease liability of USD 47.8 million and non-current lease liability of USD 140 million. The lease liabilities, and the corresponding right of use of assets, represent the present value of the remaining lease payments, discounted using the incremental borrowing rate estimated at January 1, 2019. The discount rate varies from 5.3% to 5.8%. Some of these vessel lease contracts relates to time charter vessels. The Odfjell Group has elected to separate the service element (operating expenses implicit in the time charter hire) and only to capitalize the estimated bareboat element of the lease. Doing so, the Group has applied judgment and estimated the service element to USD 6,500 per day. Estimated expenses to carry out periodic maintenance (docking) for bareboat vessels are capitalized as part of the vessels. Docking are depreciated over the period to when the periodic maintenance is estimated to be done.
The Odfjell Group has in previous years negotiated and concluded several sale and leaseback agreements. These contracts were accounted as finance transactions (new borrowings) without changing the carrying amount of the vessels. These vessels are therefore retained as 'Ships' in the statement of financial position on January 1, 2019.
3Q19 Odfjell Group
17 | Page
IFRS 16 Leases - summary of accounting policies
From the date of application of IFRS 16, the Odfjell Group recognizes right of use of assets at the commencement date of the lease. The commencement date is the date the underlying asset is made available for the Company.
Right of use of assets are measured at cost, less any accumulated depreciation and impairment. The cost of right of use of assets include the amount of lease liabilities recognized, initial direct costs incurred and prepaid leases made at on before the commencement date. Unless the Group is reasonable certain to obtain ownership to the leased asset at the end of the lease term, the right of use of assets are depreciated on a straight line basis over the lease term. Right of use of assets are are subject to impairment.
At the commencement date of the lease, the Group recognizes lease liabilities measured at the present value of lease payments to be made over the lease term. For payment of time charter leases, the service element is estimated and deducted from the payment. As a result, the Odfjell Group only recognizes the estimated bareboat element implicit in the time charter contracts. The service element is estimated based on internal sources of operating expenses for vessels of similar classes as vessels on time charter contracts. Lease payments includes the exercise price of a purchase option if it is reasonable certain that the option will be exercised by the Group.
Variable lease payments that do not depend on and index or a rate are recognized as expense in the period on which the event or condition that triggers payment occurs. Variable lease payments are classified as time charter expense or pool distributions (for external pool vessels).
In calculating the net present value, the Group uses the incremental borrowing rate at the lease commencement date. The nominal lease payments, less the service element, are distributed between interest expense and lease debt repayment. The service element is recognized as an operating expense over the lease term.
The Group applies the short term recognition exemption to its short term leases. Short term leases are leases with lease term of 12 months or less from the commencement date and do not contain purchase options reasonable certain to be exercised. Leases of non strategic assets (minor office equipments) are not capitalized.
The Group determines the lease term as the non cancellable term of the lease, together with any periods covered by an option to extend the lease if it is reasonably certain to be exercised on the prevailing terms.
IFRS 9 - Hedge accounting for interest rate swaps
Applying hedge accounting for interest rate swaps have no impact on the balance sheet as of January 1, 2019. Interest rate swaps are used to hedge interest rate risk arising on variable interest payable on bank loans and financial leasing. Realized gain or loss on interest rate swaps are recognized as part of interest expense. Interest rate swaps are accounted for at fair value in the balance sheet, while changes in fair value prior to maturity is recognized in other comprehensive income. At January 1, 2019, the Group has formally designated and documented the hedge relationship with the risk management objective and hedging policy.
3Q19 Odfjell Group
18 | Page
Note 2 – Segment information
Management has determined the operating segments based on the information regularly review by executive management. In accordance with the internal financial reporting, investments in joint venture are reported by applying the proportionate consolidation method. The Group has three reportable segments:
Chemical Tankers: The Chemical Tankers segment involves a ‘round the world’ transportation of chemicals with ships. The composition of the ships enables the Group to offer both global and regional transportation.
Tank Terminals: The tank terminal segment offers storage and distillation of various chemical and petroleum products. The segment is operated through joint ventures owned by the subsidiary Odfjell Terminals BV.
Gas Carriers: The Group re-entered into the LPG market in 2012 by acquiring two LPG/Ethylene carriers, and Odfjell Gas ordered in 2014 in total eight vessels in addition for agreed delivery between 2016 and 2017. Due to substantially delays, all eight vessels have been cancelled. The Group continues to pursue an exit from gas, and the two existing vessels are assets held for sale. The segment is operated through the joint venture Odfjell Gas AS.
3Q19 Odfjell Group
19 | Page
Note 2 – Segment information - continue
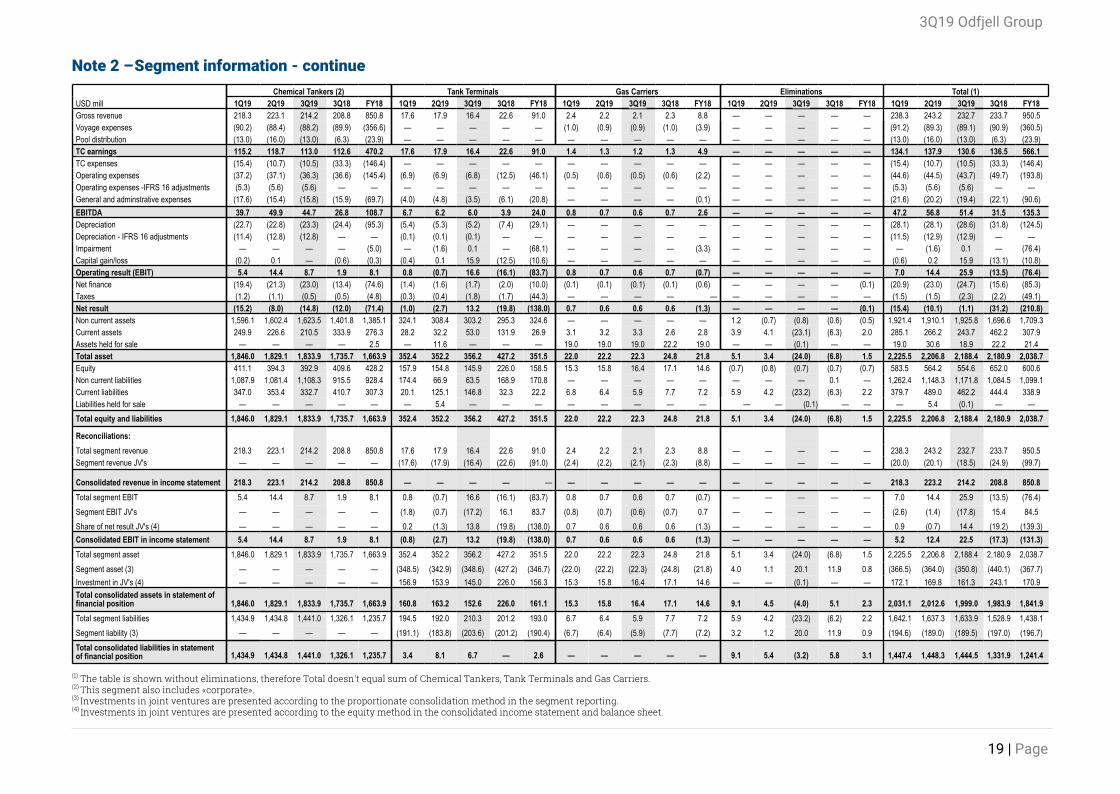
Chemical Tankers (2) Tank Terminals Gas Carriers Eliminations Total (1)USD mill 1Q19 2Q19 3Q19 3Q18 FY18 1Q19 2Q19 3Q19 3Q18 FY18 1Q19 2Q19 3Q19 3Q18 FY18 1Q19 2Q19 3Q19 3Q18 FY18 1Q19 2Q19 3Q19 3Q18 FY18Gross revenue 218.3 223.1 214.2 208.8 850.8 17.6 17.9 16.4 22.6 91.0 2.4 2.2 2.1 2.3 8.8 — — — — — 238.3 243.2 232.7 233.7 950.5Voyage expenses (90.2) (88.4) (88.2) (89.9) (356.6) — — — — — (1.0) (0.9) (0.9) (1.0) (3.9) — — — — — (91.2) (89.3) (89.1) (90.9) (360.5)Pool distribution (13.0) (16.0) (13.0) (6.3) (23.9) — — — — — — — — — — — — — — — (13.0) (16.0) (13.0) (6.3) (23.9)TC earnings 115.2 118.7 113.0 112.6 470.2 17.6 17.9 16.4 22.6 91.0 1.4 1.3 1.2 1.3 4.9 — — — — — 134.1 137.9 130.6 136.5 566.1TC expenses (15.4) (10.7) (10.5) (33.3) (146.4) — — — — — — — — — — — — — — — (15.4) (10.7) (10.5) (33.3) (146.4)Operating expenses (37.2) (37.1) (36.3) (36.6) (145.4) (6.9) (6.9) (6.8) (12.5) (46.1) (0.5) (0.6) (0.5) (0.6) (2.2) — — — — — (44.6) (44.5) (43.7) (49.7) (193.8)Operating expenses -IFRS 16 adjustments (5.3) (5.6) (5.6) — — — — — — — — — — — — — — — — — (5.3) (5.6) (5.6) — —General and adminstrative expenses (17.6) (15.4) (15.8) (15.9) (69.7) (4.0) (4.8) (3.5) (6.1) (20.8) — — — — (0.1) — — — — — (21.6) (20.2) (19.4) (22.1) (90.6)EBITDA 39.7 49.9 44.7 26.8 108.7 6.7 6.2 6.0 3.9 24.0 0.8 0.7 0.6 0.7 2.6 — — — — — 47.2 56.8 51.4 31.5 135.3Depreciation (22.7) (22.8) (23.3) (24.4) (95.3) (5.4) (5.3) (5.2) (7.4) (29.1) — — — — — — — — — — (28.1) (28.1) (28.6) (31.8) (124.5)Depreciation - IFRS 16 adjustments (11.4) (12.8) (12.8) — — (0.1) (0.1) (0.1) — — — — — — — — — — — — (11.5) (12.9) (12.9) — —Impairment — — — — (5.0) — (1.6) 0.1 — (68.1) — — — — (3.3) — — — — — — (1.6) 0.1 — (76.4)Capital gain/loss (0.2) 0.1 — (0.6) (0.3) (0.4) 0.1 15.9 (12.5) (10.6) — — — — — — — — — — (0.6) 0.2 15.9 (13.1) (10.8)Operating result (EBIT) 5.4 14.4 8.7 1.9 8.1 0.8 (0.7) 16.6 (16.1) (83.7) 0.8 0.7 0.6 0.7 (0.7) — — — — — 7.0 14.4 25.9 (13.5) (76.4)Net finance (19.4) (21.3) (23.0) (13.4) (74.6) (1.4) (1.6) (1.7) (2.0) (10.0) (0.1) (0.1) (0.1) (0.1) (0.6) — — — — (0.1) (20.9) (23.0) (24.7) (15.6) (85.3)Taxes (1.2) (1.1) (0.5) (0.5) (4.8) (0.3) (0.4) (1.8) (1.7) (44.3) — — — — — — — — — — (1.5) (1.5) (2.3) (2.2) (49.1)Net result (15.2) (8.0) (14.8) (12.0) (71.4) (1.0) (2.7) 13.2 (19.8) (138.0) 0.7 0.6 0.6 0.6 (1.3) — — — — (0.1) (15.4) (10.1) (1.1) (31.2) (210.8)Non current assets 1,596.1 1,602.4 1,623.5 1,401.8 1,385.1 324.1 308.4 303.2 295.3 324.6 — — — — — 1.2 (0.7) (0.8) (0.6) (0.5) 1,921.4 1,910.1 1,925.8 1,696.6 1,709.3Current assets 249.9 226.6 210.5 333.9 276.3 28.2 32.2 53.0 131.9 26.9 3.1 3.2 3.3 2.6 2.8 3.9 4.1 (23.1) (6.3) 2.0 285.1 266.2 243.7 462.2 307.9Assets held for sale — — — — 2.5 — 11.6 — — — 19.0 19.0 19.0 22.2 19.0 — — (0.1) — — 19.0 30.6 18.9 22.2 21.4Total asset 1,846.0 1,829.1 1,833.9 1,735.7 1,663.9 352.4 352.2 356.2 427.2 351.5 22.0 22.2 22.3 24.8 21.8 5.1 3.4 (24.0) (6.8) 1.5 2,225.5 2,206.8 2,188.4 2,180.9 2,038.7Equity 411.1 394.3 392.9 409.6 428.2 157.9 154.8 145.9 226.0 158.5 15.3 15.8 16.4 17.1 14.6 (0.7) (0.8) (0.7) (0.7) (0.7) 583.5 564.2 554.6 652.0 600.6Non current liabilities 1,087.9 1,081.4 1,108.3 915.5 928.4 174.4 66.9 63.5 168.9 170.8 — — — — — — — — 0.1 — 1,262.4 1,148.3 1,171.8 1,084.5 1,099.1Current liabilities 347.0 353.4 332.7 410.7 307.3 20.1 125.1 146.8 32.3 22.2 6.8 6.4 5.9 7.7 7.2 5.9 4.2 (23.2) (6.3) 2.2 379.7 489.0 462.2 444.4 338.9Liabilities held for sale — — — — — — 5.4 — — — — — — — — — — (0.1) — — — 5.4 (0.1) — —Total equity and liabilities 1,846.0 1,829.1 1,833.9 1,735.7 1,663.9 352.4 352.2 356.2 427.2 351.5 22.0 22.2 22.3 24.8 21.8 5.1 3.4 (24.0) (6.8) 1.5 2,225.5 2,206.8 2,188.4 2,180.9 2,038.7
Reconciliations:Total segment revenue 218.3 223.1 214.2 208.8 850.8 17.6 17.9 16.4 22.6 91.0 2.4 2.2 2.1 2.3 8.8 — — — — — 238.3 243.2 232.7 233.7 950.5Segment revenue JV's — — — — — (17.6) (17.9) (16.4) (22.6) (91.0) (2.4) (2.2) (2.1) (2.3) (8.8) — — — — — (20.0) (20.1) (18.5) (24.9) (99.7)
Consolidated revenue in income statement 218.3 223.1 214.2 208.8 850.8 — — — — — — — — — — — — — — — 218.3 223.2 214.2 208.8 850.8Total segment EBIT 5.4 14.4 8.7 1.9 8.1 0.8 (0.7) 16.6 (16.1) (83.7) 0.8 0.7 0.6 0.7 (0.7) — — — — — 7.0 14.4 25.9 (13.5) (76.4)Segment EBIT JV's — — — — — (1.8) (0.7) (17.2) 16.1 83.7 (0.8) (0.7) (0.6) (0.7) 0.7 — — — — — (2.6) (1.4) (17.8) 15.4 84.5Share of net result JV's (4) — — — — — 0.2 (1.3) 13.8 (19.8) (138.0) 0.7 0.6 0.6 0.6 (1.3) — — — — — 0.9 (0.7) 14.4 (19.2) (139.3)Consolidated EBIT in income statement 5.4 14.4 8.7 1.9 8.1 (0.8) (2.7) 13.2 (19.8) (138.0) 0.7 0.6 0.6 0.6 (1.3) — — — — — 5.2 12.4 22.5 (17.3) (131.3)Total segment asset 1,846.0 1,829.1 1,833.9 1,735.7 1,663.9 352.4 352.2 356.2 427.2 351.5 22.0 22.2 22.3 24.8 21.8 5.1 3.4 (24.0) (6.8) 1.5 2,225.5 2,206.8 2,188.4 2,180.9 2,038.7Segment asset (3) — — — — — (348.5) (342.9) (348.6) (427.2) (346.7) (22.0) (22.2) (22.3) (24.8) (21.8) 4.0 1.1 20.1 11.9 0.8 (366.5) (364.0) (350.8) (440.1) (367.7)Investment in JV's (4) — — — — — 156.9 153.9 145.0 226.0 156.3 15.3 15.8 16.4 17.1 14.6 — — (0.1) — — 172.1 169.8 161.3 243.1 170.9Total consolidated assets in statement offinancial position 1,846.0 1,829.1 1,833.9 1,735.7 1,663.9 160.8 163.2 152.6 226.0 161.1 15.3 15.8 16.4 17.1 14.6 9.1 4.5 (4.0) 5.1 2.3 2,031.1 2,012.6 1,999.0 1,983.9 1,841.9Total segment liabilities 1,434.9 1,434.8 1,441.0 1,326.1 1,235.7 194.5 192.0 210.3 201.2 193.0 6.7 6.4 5.9 7.7 7.2 5.9 4.2 (23.2) (6.2) 2.2 1,642.1 1,637.3 1,633.9 1,528.9 1,438.1Segment liability (3) — — — — — (191.1) (183.8) (203.6) (201.2) (190.4) (6.7) (6.4) (5.9) (7.7) (7.2) 3.2 1.2 20.0 11.9 0.9 (194.6) (189.0) (189.5) (197.0) (196.7)Total consolidated liabilities in statementof financial position 1,434.9 1,434.8 1,441.0 1,326.1 1,235.7 3.4 8.1 6.7 — 2.6 — — — — — 9.1 5.4 (3.2) 5.8 3.1 1,447.4 1,448.3 1,444.5 1,331.9 1,241.4
(1) The table is shown without eliminations, therefore Total doesn't equal sum of Chemical Tankers, Tank Terminals and Gas Carriers. (2) This segment also includes «corporate».(3) Investments in joint ventures are presented according to the proportionate consolidation method in the segment reporting.(4) Investments in joint ventures are presented according to the equity method in the consolidated income statement and balance sheet.
3Q19 Odfjell Group
20 | Page
Note 2 – Segment information - continued
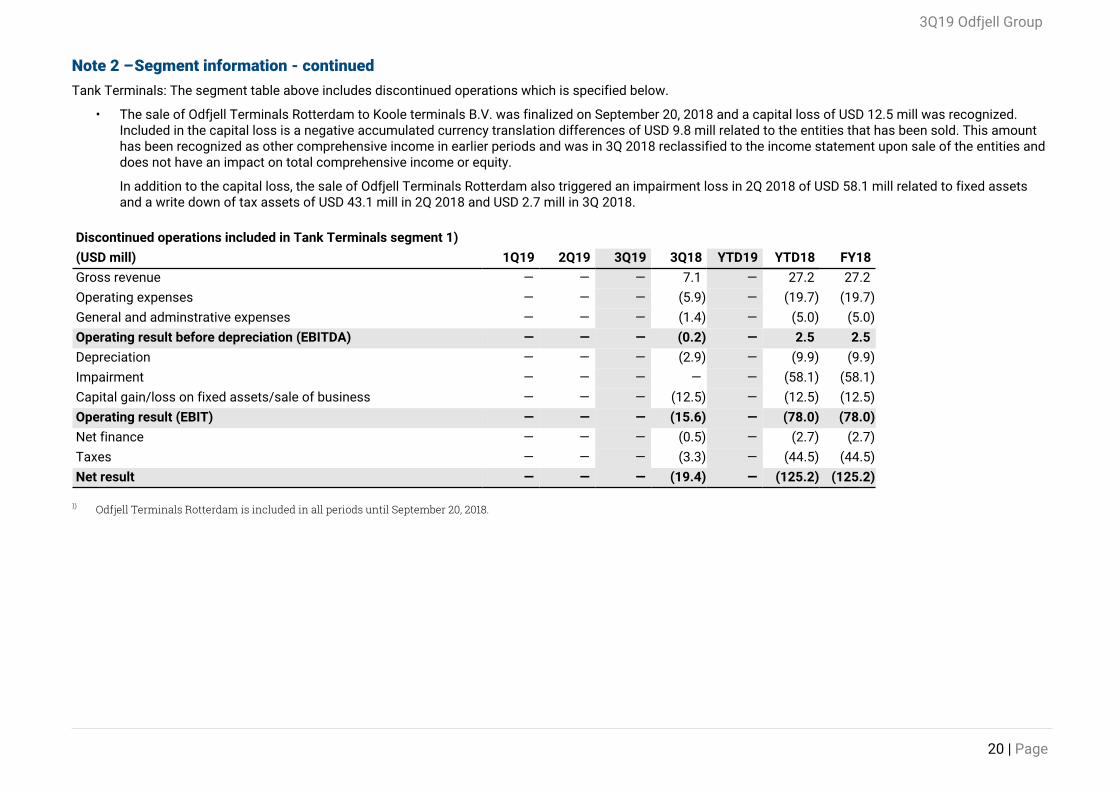
Tank Terminals: The segment table above includes discontinued operations which is specified below.
• The sale of Odfjell Terminals Rotterdam to Koole terminals B.V. was finalized on September 20, 2018 and a capital loss of USD 12.5 mill was recognized.Included in the capital loss is a negative accumulated currency translation differences of USD 9.8 mill related to the entities that has been sold. This amounthas been recognized as other comprehensive income in earlier periods and was in 3Q 2018 reclassified to the income statement upon sale of the entities anddoes not have an impact on total comprehensive income or equity.
In addition to the capital loss, the sale of Odfjell Terminals Rotterdam also triggered an impairment loss in 2Q 2018 of USD 58.1 mill related to fixed assetsand a write down of tax assets of USD 43.1 mill in 2Q 2018 and USD 2.7 mill in 3Q 2018.
Discontinued operations included in Tank Terminals segment 1)
(USD mill) 1Q19 2Q19 3Q19 3Q18 YTD19 YTD18 FY18
Gross revenue — — — 7.1 — 27.2 27.2
Operating expenses — — — (5.9) — (19.7) (19.7)
General and adminstrative expenses — — — (1.4) — (5.0) (5.0)
Operating result before depreciation (EBITDA) — — — (0.2) — 2.5 2.5
Depreciation — — — (2.9) — (9.9) (9.9)
Impairment — — — — — (58.1) (58.1)
Capital gain/loss on fixed assets/sale of business — — — (12.5) — (12.5) (12.5)
Operating result (EBIT) — — — (15.6) — (78.0) (78.0)
Net finance — — — (0.5) — (2.7) (2.7)
Taxes — — — (3.3) — (44.5) (44.5)
Net result — — — (19.4) — (125.2) (125.2)
1) Odfjell Terminals Rotterdam is included in all periods until September 20, 2018.
3Q19 Odfjell Group
21 | Page
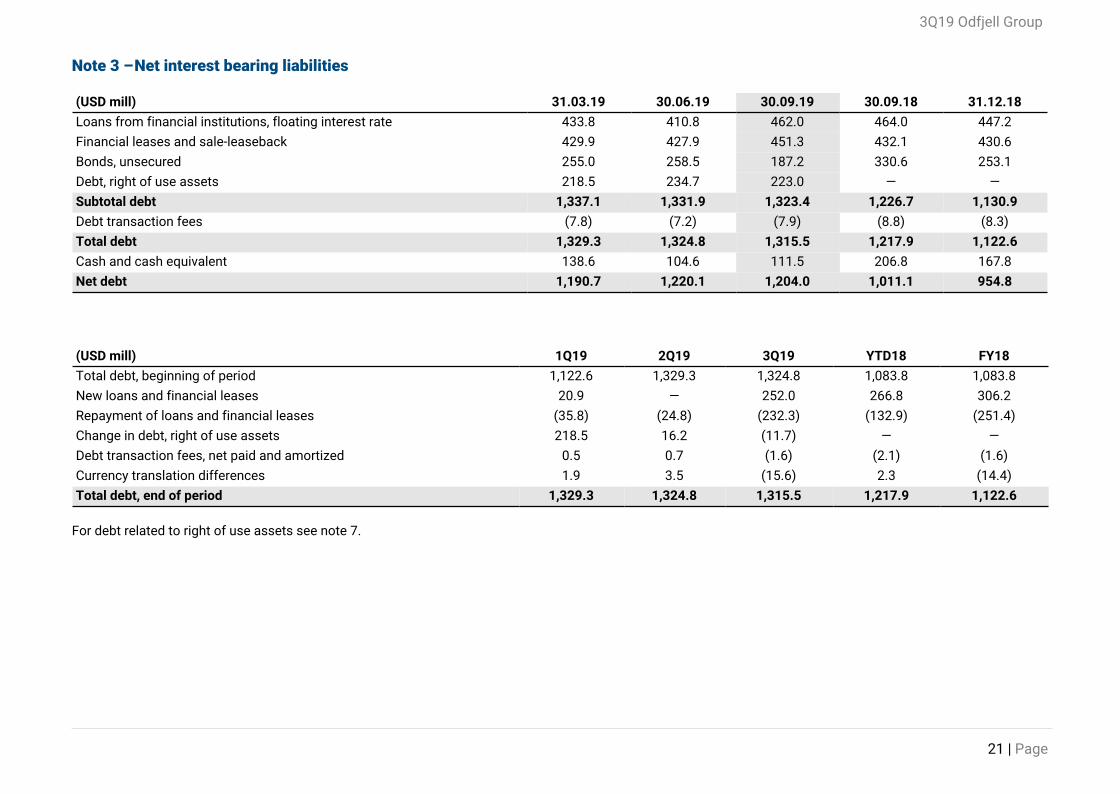
Note 3 – Net interest bearing liabilities
(USD mill) 31.03.19 30.06.19 30.09.19 30.09.18 31.12.18
Loans from financial institutions, floating interest rate 433.8 410.8 462.0 464.0 447.2
Financial leases and sale-leaseback 429.9 427.9 451.3 432.1 430.6
Bonds, unsecured 255.0 258.5 187.2 330.6 253.1
Debt, right of use assets 218.5 234.7 223.0 — —
Subtotal debt 1,337.1 1,331.9 1,323.4 1,226.7 1,130.9
Debt transaction fees (7.8) (7.2) (7.9) (8.8) (8.3)
Total debt 1,329.3 1,324.8 1,315.5 1,217.9 1,122.6
Cash and cash equivalent 138.6 104.6 111.5 206.8 167.8
Net debt 1,190.7 1,220.1 1,204.0 1,011.1 954.8
(USD mill) 1Q19 2Q19 3Q19 YTD18 FY18
Total debt, beginning of period 1,122.6 1,329.3 1,324.8 1,083.8 1,083.8
New loans and financial leases 20.9 — 252.0 266.8 306.2
Repayment of loans and financial leases (35.8) (24.8) (232.3) (132.9) (251.4)
Change in debt, right of use assets 218.5 16.2 (11.7) — —
Debt transaction fees, net paid and amortized 0.5 0.7 (1.6) (2.1) (1.6)
Currency translation differences 1.9 3.5 (15.6) 2.3 (14.4)
Total debt, end of period 1,329.3 1,324.8 1,315.5 1,217.9 1,122.6
For debt related to right of use assets see note 7.
3Q19 Odfjell Group
22 | Page
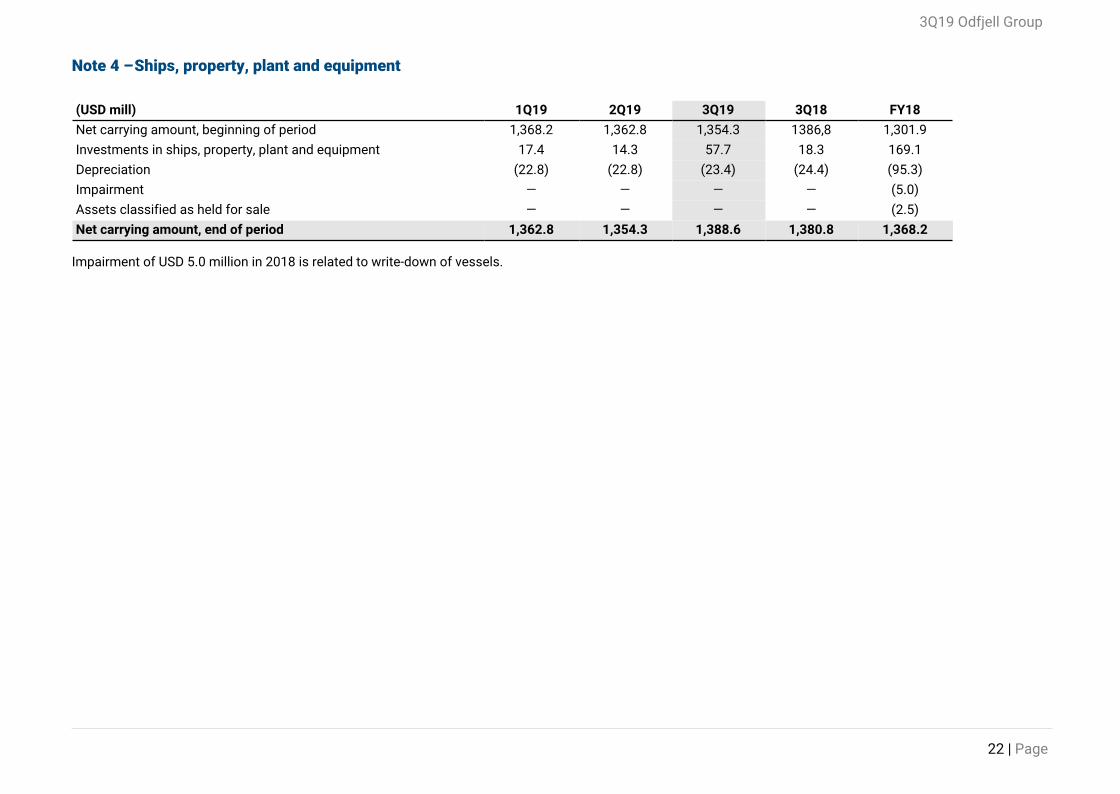
Note 4 – Ships, property, plant and equipment
(USD mill) 1Q19 2Q19 3Q19 3Q18 FY18
Net carrying amount, beginning of period 1,368.2 1,362.8 1,354.3 1386,8 1,301.9
Investments in ships, property, plant and equipment 17.4 14.3 57.7 18.3 169.1
Depreciation (22.8) (22.8) (23.4) (24.4) (95.3)
Impairment — — — — (5.0)
Assets classified as held for sale — — — — (2.5)
Net carrying amount, end of period 1,362.8 1,354.3 1,388.6 1,380.8 1,368.2
Impairment of USD 5.0 million in 2018 is related to write-down of vessels.
3Q19 Odfjell Group
23 | Page
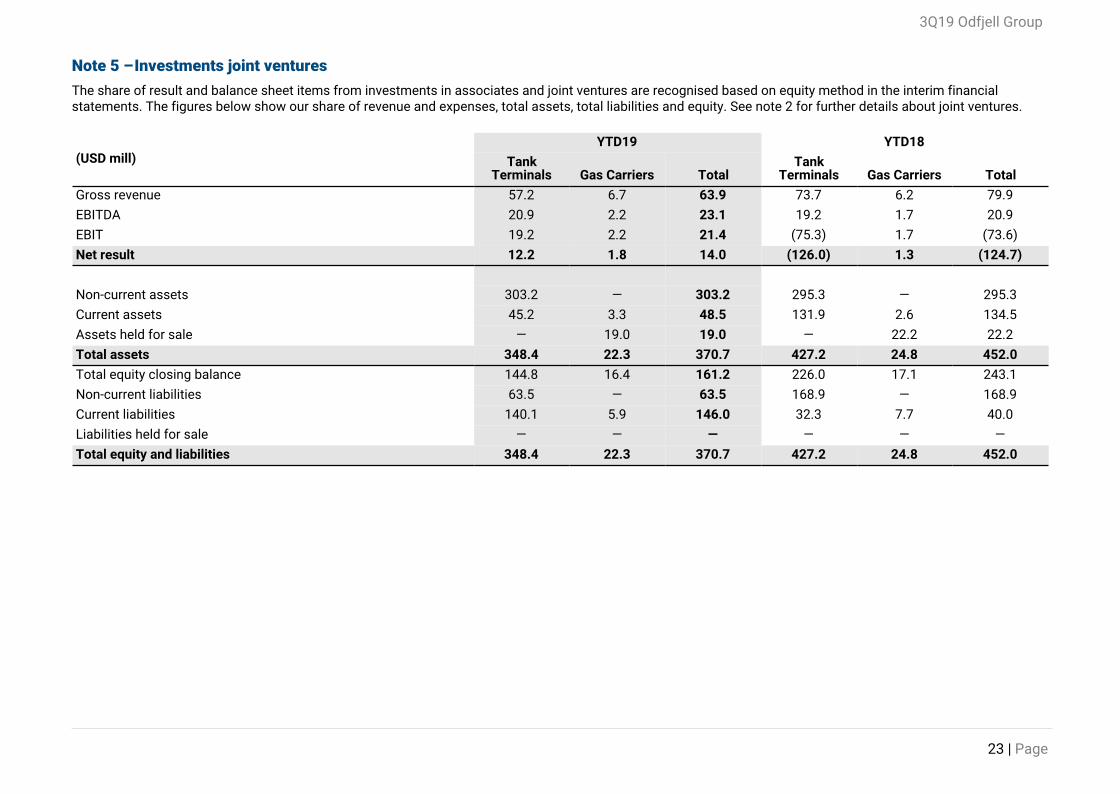
Note 5 – Investments joint ventures
The share of result and balance sheet items from investments in associates and joint ventures are recognised based on equity method in the interim financial statements. The figures below show our share of revenue and expenses, total assets, total liabilities and equity. See note 2 for further details about joint ventures.
(USD mill)YTD19 YTD18
TankTerminals Gas Carriers Total
TankTerminals Gas Carriers Total
Gross revenue 57.2 6.7 63.9 73.7 6.2 79.9
EBITDA 20.9 2.2 23.1 19.2 1.7 20.9
EBIT 19.2 2.2 21.4 (75.3) 1.7 (73.6)
Net result 12.2 1.8 14.0 (126.0) 1.3 (124.7)
Non-current assets 303.2 — 303.2 295.3 — 295.3
Current assets 45.2 3.3 48.5 131.9 2.6 134.5
Assets held for sale — 19.0 19.0 — 22.2 22.2
Total assets 348.4 22.3 370.7 427.2 24.8 452.0
Total equity closing balance 144.8 16.4 161.2 226.0 17.1 243.1
Non-current liabilities 63.5 — 63.5 168.9 — 168.9
Current liabilities 140.1 5.9 146.0 32.3 7.7 40.0
Liabilities held for sale — — — — — —
Total equity and liabilities 348.4 22.3 370.7 427.2 24.8 452.0
3Q19 Odfjell Group
24 | Page
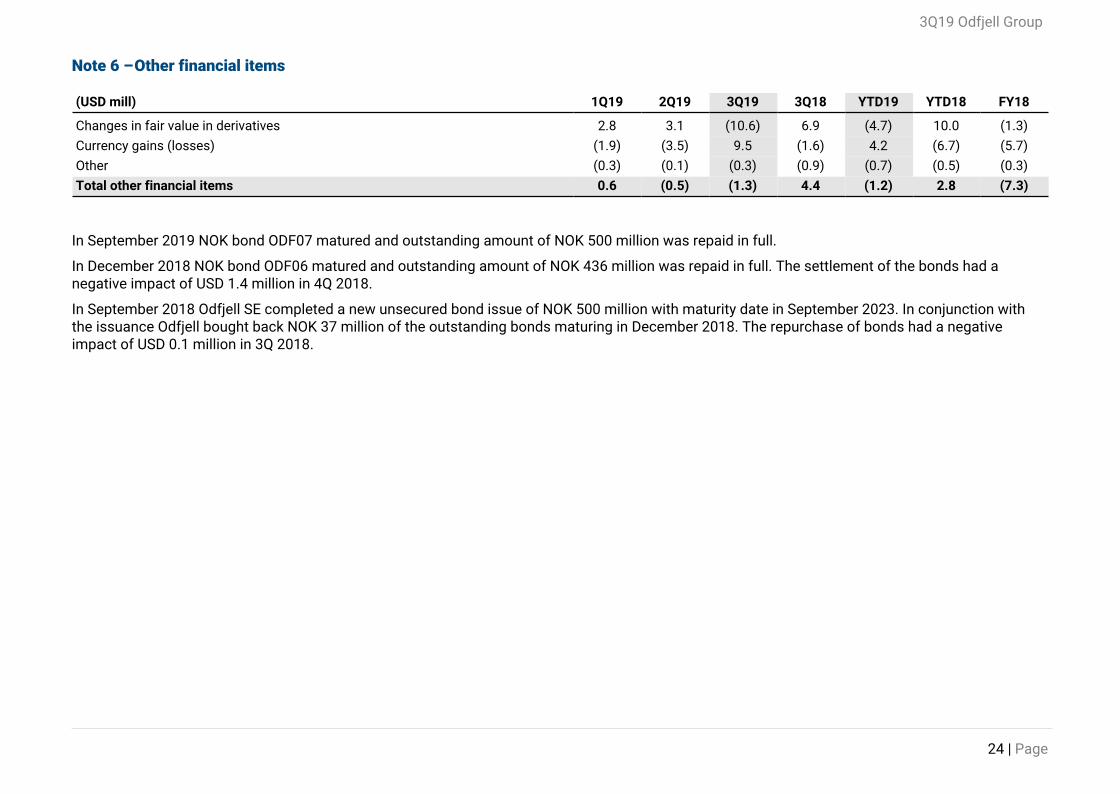
Note 6 – Other financial items
(USD mill) 1Q19 2Q19 3Q19 3Q18 YTD19 YTD18 FY18
Changes in fair value in derivatives 2.8 3.1 (10.6) 6.9 (4.7) 10.0 (1.3)
Currency gains (losses) (1.9) (3.5) 9.5 (1.6) 4.2 (6.7) (5.7)
Other (0.3) (0.1) (0.3) (0.9) (0.7) (0.5) (0.3)
Total other financial items 0.6 (0.5) (1.3) 4.4 (1.2) 2.8 (7.3)
In September 2019 NOK bond ODF07 matured and outstanding amount of NOK 500 million was repaid in full.
In December 2018 NOK bond ODF06 matured and outstanding amount of NOK 436 million was repaid in full. The settlement of the bonds had a negative impact of USD 1.4 million in 4Q 2018.
In September 2018 Odfjell SE completed a new unsecured bond issue of NOK 500 million with maturity date in September 2023. In conjunction with the issuance Odfjell bought back NOK 37 million of the outstanding bonds maturing in December 2018. The repurchase of bonds had a negative impact of USD 0.1 million in 3Q 2018.
3Q19 Odfjell Group
25 | Page
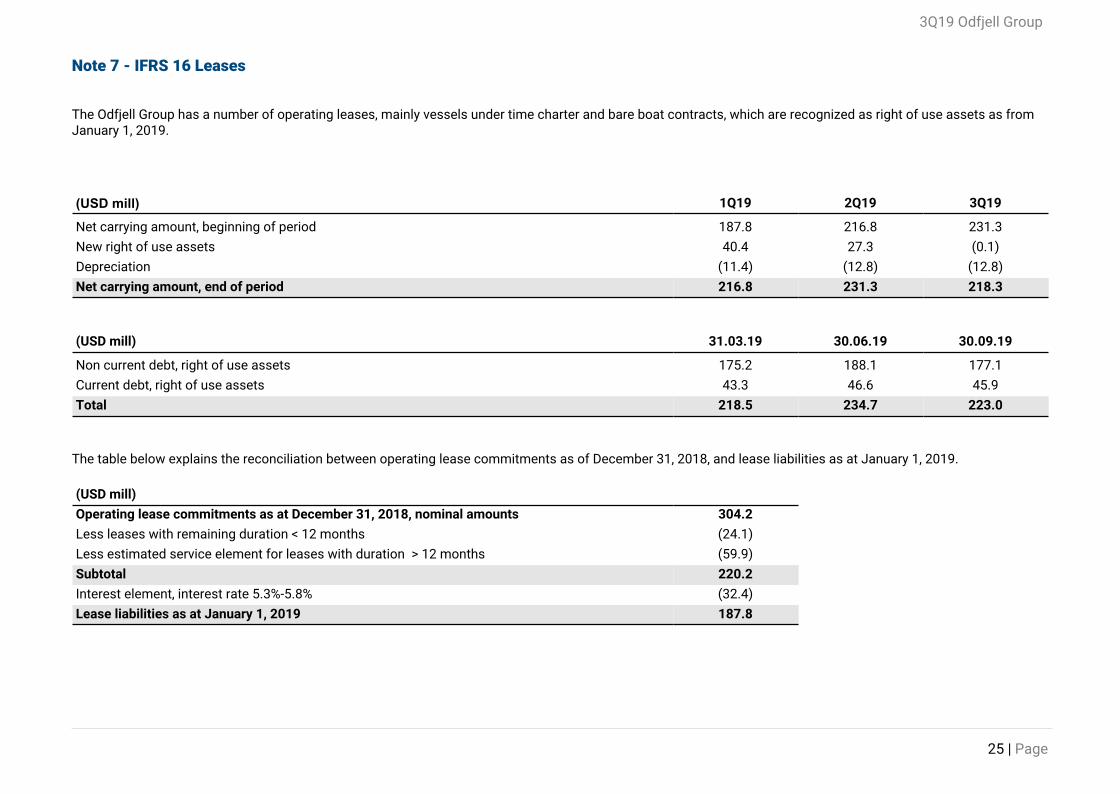
Note 7 - IFRS 16 Leases
The Odfjell Group has a number of operating leases, mainly vessels under time charter and bare boat contracts, which are recognized as right of use assets as from January 1, 2019.
(USD mill) 1Q19 2Q19 3Q19
Net carrying amount, beginning of period 187.8 216.8 231.3
New right of use assets 40.4 27.3 (0.1)
Depreciation (11.4) (12.8) (12.8)
Net carrying amount, end of period 216.8 231.3 218.3
(USD mill) 31.03.19 30.06.19 30.09.19
Non current debt, right of use assets 175.2 188.1 177.1
Current debt, right of use assets 43.3 46.6 45.9
Total 218.5 234.7 223.0
The table below explains the reconciliation between operating lease commitments as of December 31, 2018, and lease liabilities as at January 1, 2019.
(USD mill)
Operating lease commitments as at December 31, 2018, nominal amounts 304.2
Less leases with remaining duration < 12 months (24.1)
Less estimated service element for leases with duration > 12 months (59.9)
Subtotal 220.2
Interest element, interest rate 5.3%-5.8% (32.4)
Lease liabilities as at January 1, 2019 187.8
3Q19 Odfjell Group
26 | Page
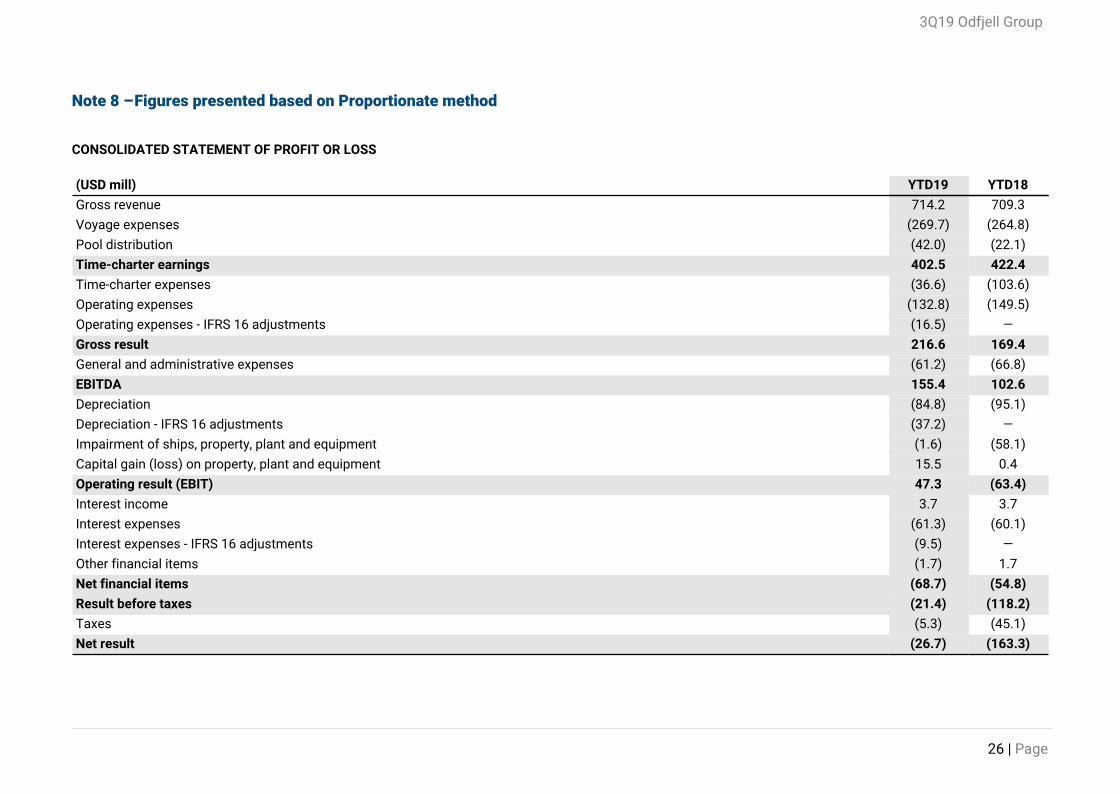
Note 8 – Figures presented based on Proportionate method
CONSOLIDATED STATEMENT OF PROFIT OR LOSS
(USD mill) YTD19 YTD18
Gross revenue 714.2 709.3
Voyage expenses (269.7) (264.8)
Pool distribution (42.0) (22.1)
Time-charter earnings 402.5 422.4
Time-charter expenses (36.6) (103.6)
Operating expenses (132.8) (149.5)
Operating expenses - IFRS 16 adjustments (16.5) —
Gross result 216.6 169.4
General and administrative expenses (61.2) (66.8)
EBITDA 155.4 102.6
Depreciation (84.8) (95.1)
Depreciation - IFRS 16 adjustments (37.2) —
Impairment of ships, property, plant and equipment (1.6) (58.1)
Capital gain (loss) on property, plant and equipment 15.5 0.4
Operating result (EBIT) 47.3 (63.4)
Interest income 3.7 3.7
Interest expenses (61.3) (60.1)
Interest expenses - IFRS 16 adjustments (9.5) —
Other financial items (1.7) 1.7
Net financial items (68.7) (54.8)
Result before taxes (21.4) (118.2)
Taxes (5.3) (45.1)
Net result (26.7) (163.3)
3Q19 Odfjell Group
27 | Page
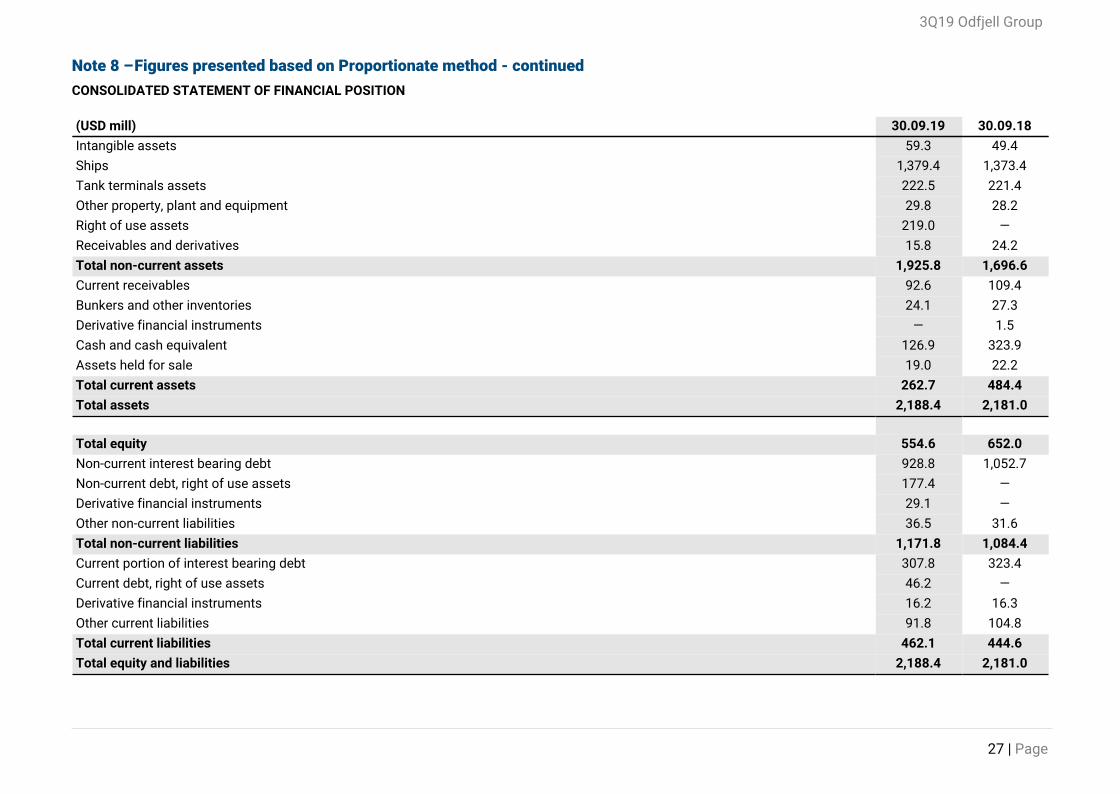
Note 8 – Figures presented based on Proportionate method - continued
CONSOLIDATED STATEMENT OF FINANCIAL POSITION
(USD mill) 30.09.19 30.09.18
Intangible assets 59.3 49.4
Ships 1,379.4 1,373.4
Tank terminals assets 222.5 221.4
Other property, plant and equipment 29.8 28.2
Right of use assets 219.0 —
Receivables and derivatives 15.8 24.2
Total non-current assets 1,925.8 1,696.6
Current receivables 92.6 109.4
Bunkers and other inventories 24.1 27.3
Derivative financial instruments — 1.5
Cash and cash equivalent 126.9 323.9
Assets held for sale 19.0 22.2
Total current assets 262.7 484.4
Total assets 2,188.4 2,181.0
Total equity 554.6 652.0
Non-current interest bearing debt 928.8 1,052.7
Non-current debt, right of use assets 177.4 —
Derivative financial instruments 29.1 —
Other non-current liabilities 36.5 31.6
Total non-current liabilities 1,171.8 1,084.4
Current portion of interest bearing debt 307.8 323.4
Current debt, right of use assets 46.2 —
Derivative financial instruments 16.2 16.3
Other current liabilities 91.8 104.8
Total current liabilities 462.1 444.6
Total equity and liabilities 2,188.4 2,181.0
3Q19 Odfjell Group
28 | Page
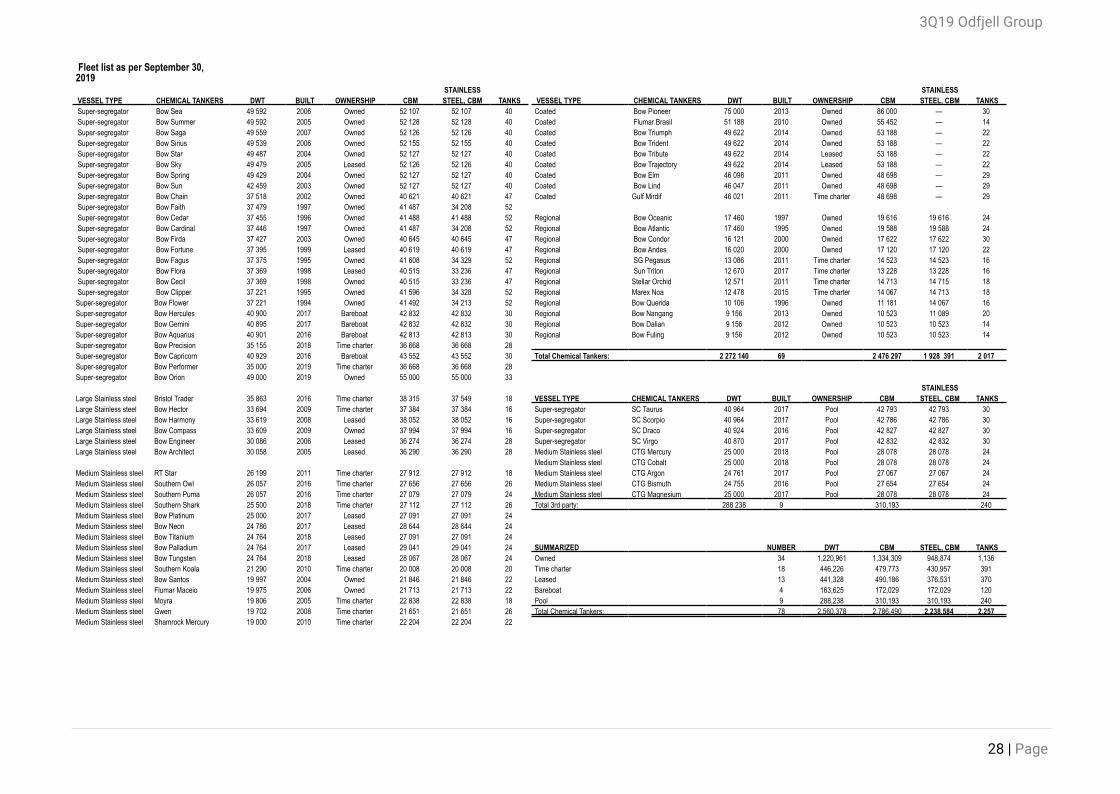
Fleet list as per September 30,2019
STAINLESS VESSEL TYPE CHEMICAL TANKERS DWT BUILT OWNERSHIP CBM STEEL, CBM TANKS Super-segregator Bow Sea 49 592 2006 Owned 52 107 52 107 40 Super-segregator Bow Summer 49 592 2005 Owned 52 128 52 128 40 Super-segregator Bow Saga 49 559 2007 Owned 52 126 52 126 40 Super-segregator Bow Sirius 49 539 2006 Owned 52 155 52 155 40 Super-segregator Bow Star 49 487 2004 Owned 52 127 52 127 40 Super-segregator Bow Sky 49 479 2005 Leased 52 126 52 126 40 Super-segregator Bow Spring 49 429 2004 Owned 52 127 52 127 40 Super-segregator Bow Sun 42 459 2003 Owned 52 127 52 127 40 Super-segregator Bow Chain 37 518 2002 Owned 40 621 40 621 47 Super-segregator Bow Faith 37 479 1997 Owned 41 487 34 208 52 Super-segregator Bow Cedar 37 455 1996 Owned 41 488 41 488 52 Super-segregator Bow Cardinal 37 446 1997 Owned 41 487 34 208 52 Super-segregator Bow Firda 37 427 2003 Owned 40 645 40 645 47 Super-segregator Bow Fortune 37 395 1999 Leased 40 619 40 619 47 Super-segregator Bow Fagus 37 375 1995 Owned 41 608 34 329 52 Super-segregator Bow Flora 37 369 1998 Leased 40 515 33 236 47 Super-segregator Bow Cecil 37 369 1998 Owned 40 515 33 236 47 Super-segregator Bow Clipper 37 221 1995 Owned 41 596 34 328 52Super-segregator Bow Flower 37 221 1994 Owned 41 492 34 213 52Super-segregator Bow Hercules 40 900 2017 Bareboat 42 832 42 832 30Super-segregator Bow Gemini 40 895 2017 Bareboat 42 832 42 832 30Super-segregator Bow Aquarius 40 901 2016 Bareboat 42 813 42 813 30Super-segregator Bow Precision 35 155 2018 Time charter 36 668 36 668 28Super-segregator Bow Capricorn 40 929 2016 Bareboat 43 552 43 552 30Super-segregator Bow Performer 35 000 2019 Time charter 36 668 36 668 28Super-segregator Bow Orion 49 000 2019 Owned 55 000 55 000 33
Large Stainless steel Bristol Trader 35 863 2016 Time charter 38 315 37 549 18Large Stainless steel Bow Hector 33 694 2009 Time charter 37 384 37 384 16Large Stainless steel Bow Harmony 33 619 2008 Leased 38 052 38 052 16Large Stainless steel Bow Compass 33 609 2009 Owned 37 994 37 994 16Large Stainless steel Bow Engineer 30 086 2006 Leased 36 274 36 274 28Large Stainless steel Bow Architect 30 058 2005 Leased 36 290 36 290 28
Medium Stainless steel RT Star 26 199 2011 Time charter 27 912 27 912 18Medium Stainless steel Southern Owl 26 057 2016 Time charter 27 656 27 656 26Medium Stainless steel Southern Puma 26 057 2016 Time charter 27 079 27 079 24Medium Stainless steel Southern Shark 25 500 2018 Time charter 27 112 27 112 26Medium Stainless steel Bow Platinum 25 000 2017 Leased 27 091 27 091 24Medium Stainless steel Bow Neon 24 786 2017 Leased 28 644 28 644 24Medium Stainless steel Bow Titanium 24 764 2018 Leased 27 091 27 091 24Medium Stainless steel Bow Palladium 24 764 2017 Leased 29 041 29 041 24Medium Stainless steel Bow Tungsten 24 764 2018 Leased 28 067 28 067 24Medium Stainless steel Southern Koala 21 290 2010 Time charter 20 008 20 008 20Medium Stainless steel Bow Santos 19 997 2004 Owned 21 846 21 846 22Medium Stainless steel Flumar Maceio 19 975 2006 Owned 21 713 21 713 22Medium Stainless steel Moyra 19 806 2005 Time charter 22 838 22 838 18Medium Stainless steel Gwen 19 702 2008 Time charter 21 651 21 651 26Medium Stainless steel Shamrock Mercury 19 000 2010 Time charter 22 204 22 204 22
STAINLESS VESSEL TYPE CHEMICAL TANKERS DWT BUILT OWNERSHIP CBM STEEL, CBM TANKSCoated Bow Pioneer 75 000 2013 Owned 86 000 — 30Coated Flumar Brasil 51 188 2010 Owned 55 452 — 14Coated Bow Triumph 49 622 2014 Owned 53 188 — 22Coated Bow Trident 49 622 2014 Owned 53 188 — 22Coated Bow Tribute 49 622 2014 Leased 53 188 — 22Coated Bow Trajectory 49 622 2014 Leased 53 188 — 22Coated Bow Elm 46 098 2011 Owned 48 698 — 29Coated Bow Lind 46 047 2011 Owned 48 698 — 29Coated Gulf Mirdif 46 021 2011 Time charter 48 698 — 29
Regional Bow Oceanic 17 460 1997 Owned 19 616 19 616 24Regional Bow Atlantic 17 460 1995 Owned 19 588 19 588 24Regional Bow Condor 16 121 2000 Owned 17 622 17 622 30Regional Bow Andes 16 020 2000 Owned 17 120 17 120 22Regional SG Pegasus 13 086 2011 Time charter 14 523 14 523 16Regional Sun Triton 12 670 2017 Time charter 13 228 13 228 16Regional Stellar Orchid 12 571 2011 Time charter 14 713 14 715 18Regional Marex Noa 12 478 2015 Time charter 14 067 14 713 18Regional Bow Querida 10 106 1996 Owned 11 181 14 067 16Regional Bow Nangang 9 156 2013 Owned 10 523 11 089 20Regional Bow Dalian 9 156 2012 Owned 10 523 10 523 14Regional Bow Fuling 9 156 2012 Owned 10 523 10 523 14
Total Chemical Tankers: 2 272 140 69 2 476 297 1 928 391 2 017
STAINLESSVESSEL TYPE CHEMICAL TANKERS DWT BUILT OWNERSHIP CBM STEEL, CBM TANKSSuper-segregator SC Taurus 40 964 2017 Pool 42 793 42 793 30Super-segregator SC Scorpio 40 964 2017 Pool 42 786 42 786 30Super-segregator SC Draco 40 924 2016 Pool 42 827 42 827 30Super-segregator SC Virgo 40 870 2017 Pool 42 832 42 832 30Medium Stainless steel CTG Mercury 25 000 2018 Pool 28 078 28 078 24Medium Stainless steel CTG Cobalt 25 000 2018 Pool 28 078 28 078 24Medium Stainless steel CTG Argon 24 761 2017 Pool 27 067 27 067 24Medium Stainless steel CTG Bismuth 24 755 2016 Pool 27 654 27 654 24Medium Stainless steel CTG Magnesium 25 000 2017 Pool 28 078 28 078 24Total 3rd party: 288 238 9 310,193 240
SUMMARIZED NUMBER DWT CBM STEEL, CBM TANKSOwned 34 1,220,961 1,334,309 948,874 1,136Time charter 18 446,226 479,773 430,957 391Leased 13 441,328 490,186 376,531 370Bareboat 4 163,625 172,029 172,029 120Pool 9 288,238 310,193 310,193 240Total Chemical Tankers: 78 2,560,378 2,786,490 2,238,584 2,257
3Q19 Odfjell Group
29 | Page
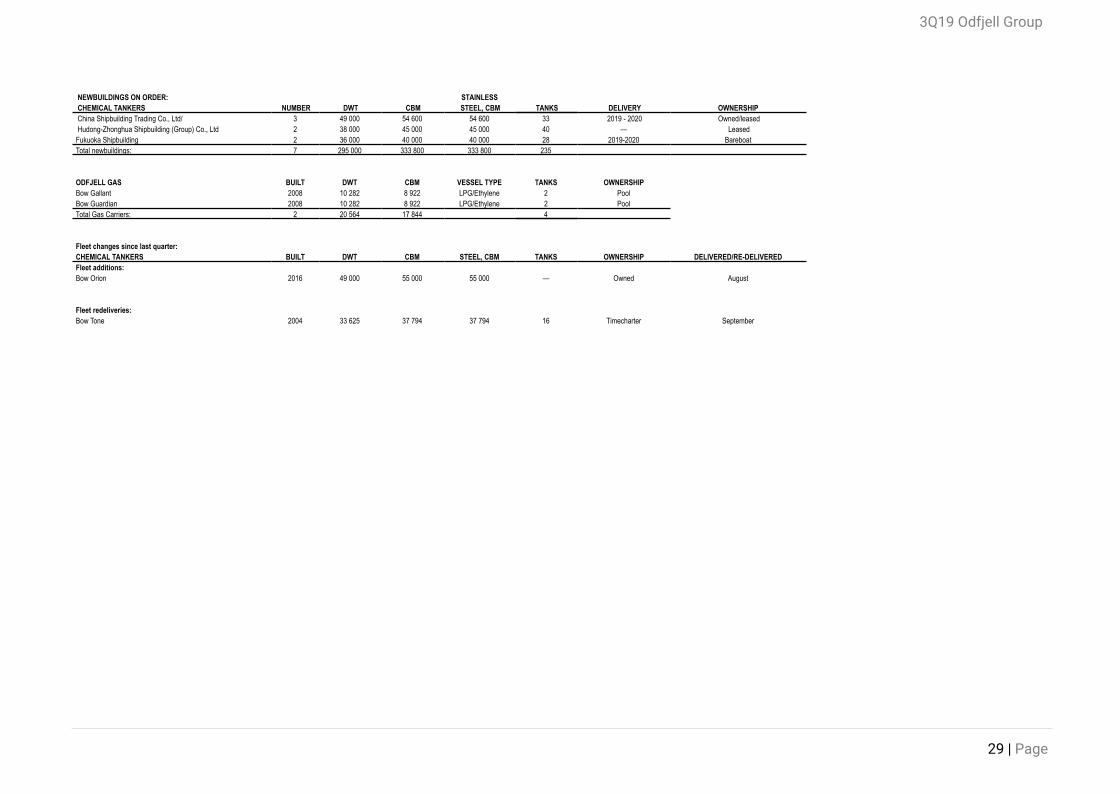
NEWBUILDINGS ON ORDER: STAINLESS CHEMICAL TANKERS NUMBER DWT CBM STEEL, CBM TANKS DELIVERY OWNERSHIP China Shipbuilding Trading Co., Ltd/ 3 49 000 54 600 54 600 33 2019 - 2020 Owned/leased Hudong-Zhonghua Shipbuilding (Group) Co., Ltd 2 38 000 45 000 45 000 40 — LeasedFukuoka Shipbuilding 2 36 000 40 000 40 000 28 2019-2020 BareboatTotal newbuildings: 7 295 000 333 800 333 800 235
ODFJELL GAS BUILT DWT CBM VESSEL TYPE TANKS OWNERSHIPBow Gallant 2008 10 282 8 922 LPG/Ethylene 2 PoolBow Guardian 2008 10 282 8 922 LPG/Ethylene 2 PoolTotal Gas Carriers: 2 20 564 17 844 4
Fleet changes since last quarter:CHEMICAL TANKERS BUILT DWT CBM STEEL, CBM TANKS OWNERSHIP DELIVERED/RE-DELIVEREDFleet additions:Bow Orion 2016 49 000 55 000 55 000 — Owned August
Fleet redeliveries:Bow Tone 2004 33 625 37 794 37 794 16 Timecharter September
3Q19 Odfjell Group
30 | Page
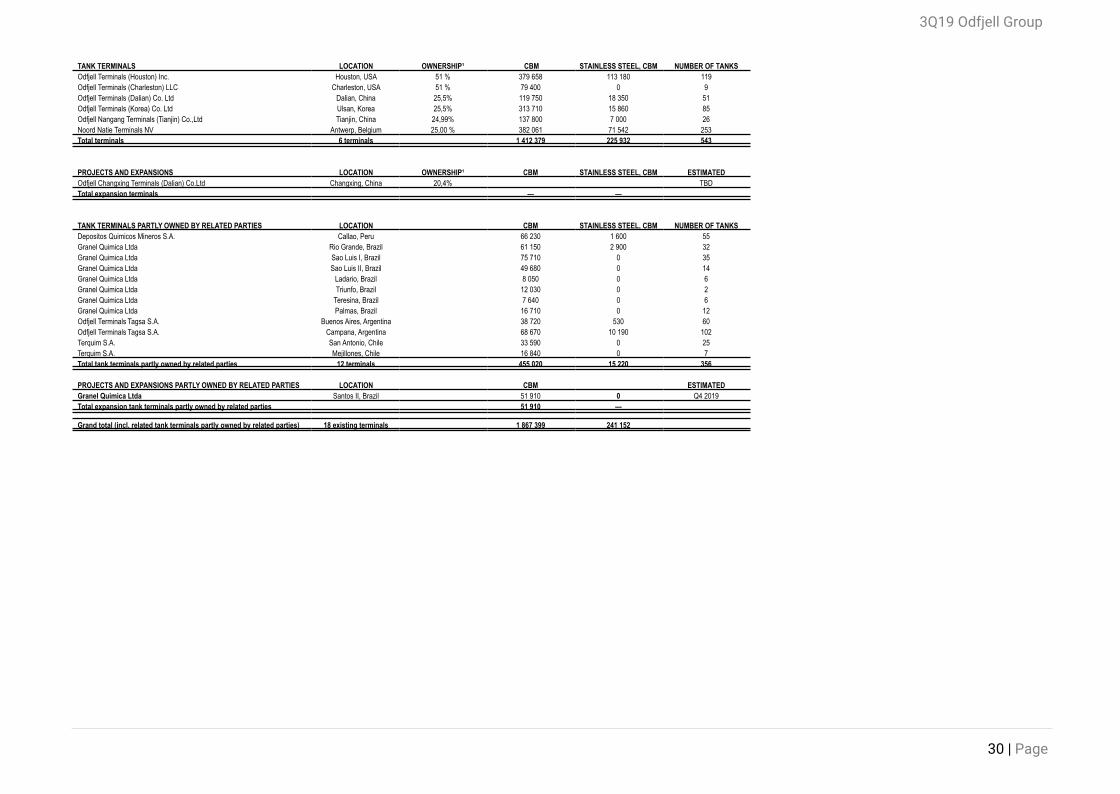
TANK TERMINALS LOCATION OWNERSHIP¹ CBM STAINLESS STEEL, CBM NUMBER OF TANKS Odfjell Terminals (Houston) Inc. Houston, USA 51 % 379 658 113 180 119 Odfjell Terminals (Charleston) LLC Charleston, USA 51 % 79 400 0 9 Odfjell Terminals (Dalian) Co. Ltd Dalian, China 25,5% 119 750 18 350 51 Odfjell Terminals (Korea) Co. Ltd Ulsan, Korea 25,5% 313 710 15 860 85 Odfjell Nangang Terminals (Tianjin) Co.,Ltd Tianjin, China 24,99% 137 800 7 000 26 Noord Natie Terminals NV Antwerp, Belgium 25,00 % 382 061 71 542 253 Total terminals 6 terminals 1 412 379 225 932 543
PROJECTS AND EXPANSIONS LOCATION OWNERSHIP¹ CBM STAINLESS STEEL, CBM ESTIMATED Odfjell Changxing Terminals (Dalian) Co.Ltd Changxing, China 20,4% TBD Total expansion terminals — —
TANK TERMINALS PARTLY OWNED BY RELATED PARTIES LOCATION CBM STAINLESS STEEL, CBM NUMBER OF TANKS Depositos Quimicos Mineros S.A. Callao, Peru 66 230 1 600 55 Granel Quimica Ltda Rio Grande, Brazil 61 150 2 900 32 Granel Quimica Ltda Sao Luis I, Brazil 75 710 0 35 Granel Quimica Ltda Sao Luis II, Brazil 49 680 0 14 Granel Quimica Ltda Ladario, Brazil 8 050 0 6 Granel Quimica Ltda Triunfo, Brazil 12 030 0 2 Granel Quimica Ltda Teresina, Brazil 7 640 0 6 Granel Quimica Ltda Palmas, Brazil 16 710 0 12 Odfjell Terminals Tagsa S.A. Buenos Aires, Argentina 38 720 530 60 Odfjell Terminals Tagsa S.A. Campana, Argentina 68 670 10 190 102 Terquim S.A. San Antonio, Chile 33 590 0 25 Terquim S.A. Mejillones, Chile 16 840 0 7 Total tank terminals partly owned by related parties 12 terminals 455 020 15 220 356
PROJECTS AND EXPANSIONS PARTLY OWNED BY RELATED PARTIES LOCATION CBM ESTIMATED Granel Quimica Ltda Santos II, Brazil 51 910 0 Q4 2019 Total expansion tank terminals partly owned by related parties 51 910 —
Grand total (incl. related tank terminals partly owned by related parties) 18 existing terminals 1 867 399 241 152
3Q19 Odfjell Group
31 | Page