
THIRD QUARTER 2019 EARNINGS REPORT...• 3Q19 leasing activity totaled 1.5 msf, of which 37.6%...
31
Contacts: Francisco Martinez Investor Relations Officer Tel: +52 (55) 5279-8107 E-mail: [email protected] Ana Maria Ybarra Miranda IR Tel: +52 (55) 3660-4037 E-mail: [email protected] THIRD QUARTER 2019 EARNINGS REPORT Mexico City, October 24, 2019 – Terrafina® (“TERRA” or “the Company”) (BMV: TERRA13), a leading Mexican industrial real estate investment trust (“FIBRA”), externally advised by PGIM Real Estate and dedicated to the acquisition, development, leasing and management of industrial real estate properties in Mexico, announced today its third quarter 2019 (3Q19) earnings results. The figures in this report have been prepared in accordance with International Financial Reporting Standards (“IFRS”). Figures presented in this report are presented in millions of Mexican pesos and millions of U.S. dollars, unless otherwise stated. Additionally, figures may vary due to rounding. Terrafina’s financial results included in this report are unaudited. As a result, the mentioned figures in this financial report are preliminary figures and could be adjusted in the future. This document may include forward-looking statements that may imply risks and uncertainties. Terms such as "estimate", "project", "plan", "believe", "expect", "anticipate", "intend", and other similar expressions could be construed as previsions or estimates. Terrafina warns readers that declarations and estimates mentioned in this document, or realized by Terrafina’s management imply risks and uncertainties that could change in function of various factors that are out of Terrafina’s control. Future expectations reflect Terrafina’s judgment at the date of this document. Terrafina reserves the right or obligation to update the information contained in this document or derived from this document. Past or present performance is not an indicator of future performance. Operating and Financial Highlights as of September 30, 2019 Operating • As of September 30, 2019, the occupancy rate was 96.3%, a 110 basis point increase compared to the third quarter of 2018 (3Q18). • Annualized average leasing rate per square foot was US$5.18 in 3Q19, a 1.0% or US$0.05 increase compared to 3Q18. • Terrafina reported a total of 41.8 million square feet (msf) of Gross Leasable Area (GLA) comprised of 289 properties and 294 tenants. • 3Q19 leasing activity totaled 1.5 msf, of which 37.6% corresponded to new leases, 37.8% to lease renewals and 24.6% to early renewals. Leasing activity was concentrated in the Chihuahua, Ramos Arizpe, Monterrey, Guadalajara, Ciudad Juarez, Arteaga, Cuautitlan Izcalli, Silao, San Luis Potosi, Irapuato, Tijuana and Toluca markets.
Transcript of THIRD QUARTER 2019 EARNINGS REPORT...• 3Q19 leasing activity totaled 1.5 msf, of which 37.6%...
Contacts: Francisco Martinez Investor Relations Officer Tel: +52 (55) 5279-8107 E-mail: [email protected]
Ana Maria Ybarra Miranda IR Tel: +52 (55) 3660-4037 E-mail: [email protected]
THIRD QUARTER 2019 EARNINGS REPORT
Mexico City, October 24, 2019 – Terrafina® (“TERRA” or “the Company”) (BMV: TERRA13), a leading Mexican industrial real estate investment trust (“FIBRA”), externally advised by PGIM Real Estate and dedicated to the acquisition, development, leasing and management of industrial real estate properties in Mexico, announced today its third quarter 2019 (3Q19) earnings results. The figures in this report have been prepared in accordance with International Financial Reporting Standards (“IFRS”). Figures presented in this report are presented in millions of Mexican pesos and millions of U.S. dollars, unless otherwise stated. Additionally, figures may vary due to rounding. Terrafina’s financial results included in this report are unaudited. As a result, the mentioned figures in this financial report are preliminary figures and could be adjusted in the future. This document may include forward-looking statements that may imply risks and uncertainties. Terms such as "estimate", "project", "plan", "believe", "expect", "anticipate", "intend", and other similar expressions could be construed as previsions or estimates. Terrafina warns readers that declarations and estimates mentioned in this document, or realized by Terrafina’s management imply risks and uncertainties that could change in function of various factors that are out of Terrafina’s control. Future expectations reflect Terrafina’s judgment at the date of this document. Terrafina reserves the right or obligation to update the information contained in this document or derived from this document. Past or present performance is not an indicator of future performance.
Operating and Financial Highlights as of September 30, 2019
Operating
• As of September 30, 2019, the occupancy rate was 96.3%, a 110 basis point increase compared to the third quarter of 2018 (3Q18).
• Annualized average leasing rate per square foot was US$5.18 in 3Q19, a 1.0% or US$0.05 increase compared to 3Q18.
• Terrafina reported a total of 41.8 million square feet (msf) of Gross Leasable Area (GLA) comprised of 289 properties and 294 tenants.
• 3Q19 leasing activity totaled 1.5 msf, of which 37.6% corresponded to new leases, 37.8% to lease renewals and 24.6% to
early renewals. Leasing activity was concentrated in the Chihuahua, Ramos Arizpe, Monterrey, Guadalajara, Ciudad Juarez, Arteaga, Cuautitlan Izcalli, Silao, San Luis Potosi, Irapuato, Tijuana and Toluca markets.

2
Financial • 3Q19 rental revenues reached US$48.7 million, a 1.3% or US$0.6 million increase compared to 3Q18.
• 3Q19 Net Operating Income (NOI) was US$49.2 million, a 2.3% or US$1.1 million increase compared to 3Q18. NOI
margin reached 94.3%, a 28 basis point increase compared to 3Q18. • 3Q19 EBITDA reached US$44.2 million, an increase of 2.1% or US$0.9 million compared to 3Q18. The EBITDA margin
for 3Q19 was 84.8%, a 11 basis point increase compared to 3Q18. • 3Q19 adjusted funds for operations (AFFO) reached US$28.3 million, a decrease of 2.7% or US$0.8 million compared
to 3Q18. The AFFO margin for 3Q19 was 53.9%, a 271 basis point decrease compared to 3Q18. • 3Q19 distributions totaled US$28.3 million. As a result, Terrafina will distribute Ps.0.6969 per CBFI (US$0.0359 per
CBFI) for distributions corresponding to the period from July 1 to September 30, 2019.
• 3Q19 dividend yield for the quarter was 9.5% considering the average share price for the quarter of US$1.51 (Ps.29.34).
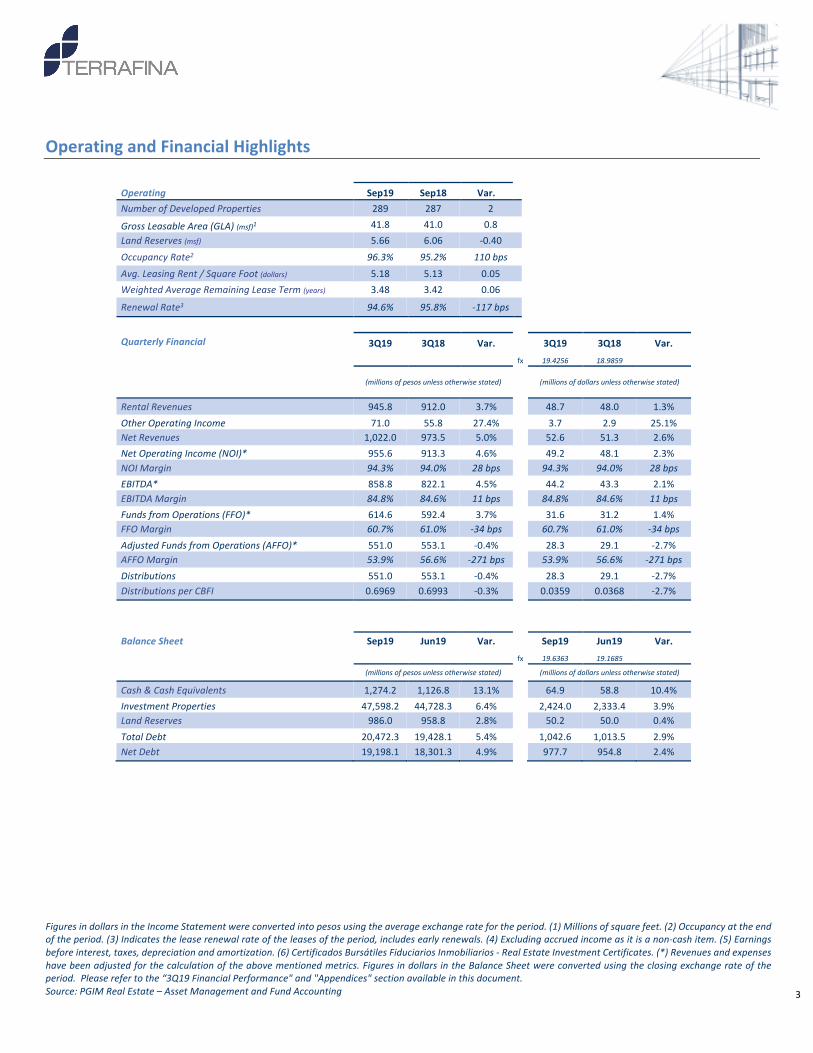
Figures in dollars in the Income Statement were converted into pesos using the average exchange rate for the period. (1) Millions of square feet. (2) Occupancy at the end of the period. (3) Indicates the lease renewal rate of the leases of the period, includes early renewals. (4) Excluding accrued income as it is a non-cash item. (5) Earnings before interest, taxes, depreciation and amortization. (6) Certificados Bursátiles Fiduciarios Inmobiliarios - Real Estate Investment Certificates. (*) Revenues and expenses have been adjusted for the calculation of the above mentioned metrics. Figures in dollars in the Balance Sheet were converted using the closing exchange rate of the period. Please refer to the “3Q19 Financial Performance" and "Appendices" section available in this document. Source: PGIM Real Estate – Asset Management and Fund Accounting
3
Operating and Financial Highlights
Operating Sep19 Sep18 Var. Number of Developed Properties 289 287 2
Gross Leasable Area (GLA) (msf)1 41.8 41.0 0.8 Land Reserves (msf) 5.66 6.06 -0.40 Occupancy Rate2 96.3% 95.2% 110 bps Avg. Leasing Rent / Square Foot (dollars) 5.18 5.13 0.05 Weighted Average Remaining Lease Term (years) 3.48 3.42 0.06
Renewal Rate3 94.6% 95.8% -117 bps
Quarterly Financial 3Q19 3Q18 Var. 3Q19 3Q18 Var.
fx 19.4256 18.9859
(millions of pesos unless otherwise stated)
(millions of dollars unless otherwise stated)
Rental Revenues 945.8 912.0 3.7% 48.7 48.0 1.3% Other Operating Income 71.0 55.8 27.4% 3.7 2.9 25.1% Net Revenues 1,022.0 973.5 5.0% 52.6 51.3 2.6% Net Operating Income (NOI)* 955.6 913.3 4.6% 49.2 48.1 2.3% NOI Margin 94.3% 94.0% 28 bps 94.3% 94.0% 28 bps EBITDA* 858.8 822.1 4.5% 44.2 43.3 2.1% EBITDA Margin 84.8% 84.6% 11 bps 84.8% 84.6% 11 bps Funds from Operations (FFO)* 614.6 592.4 3.7% 31.6 31.2 1.4% FFO Margin 60.7% 61.0% -34 bps 60.7% 61.0% -34 bps Adjusted Funds from Operations (AFFO)* 551.0 553.1 -0.4% 28.3 29.1 -2.7% AFFO Margin 53.9% 56.6% -271 bps 53.9% 56.6% -271 bps Distributions 551.0 553.1 -0.4% 28.3 29.1 -2.7% Distributions per CBFI 0.6969 0.6993 -0.3% 0.0359 0.0368 -2.7%
Balance Sheet Sep19 Jun19 Var. Sep19 Jun19 Var.
fx 19.6363 19.1685
(millions of pesos unless otherwise stated) (millions of dollars unless otherwise stated)
Cash & Cash Equivalents 1,274.2 1,126.8 13.1% 64.9 58.8 10.4% Investment Properties 47,598.2 44,728.3 6.4% 2,424.0 2,333.4 3.9% Land Reserves 986.0 958.8 2.8% 50.2 50.0 0.4% Total Debt 20,472.3 19,428.1 5.4% 1,042.6 1,013.5 2.9% Net Debt 19,198.1 18,301.3 4.9% 977.7 954.8 2.4%

4
Comment by Alberto Chretin, Chief Executive Officer and Chairman of the Board
The operational and financial results for the third quarter of 2019 once again demonstrated the strength of our tenants’ operations. The importance of manufacturing for export activity continues to be a crucial component for growth in the real estate industrial sector. Leasing activity of 1.5 million square feet was a highlight for the quarter. In the last nine months, Terrafina closed more than 5.3 million square feet in leasing contracts or 12.7% of its Gross Leasable Area. Most of the leasing activity occured in the Northern region with one million square feet (Chihuahua, Ramos Arizpe, Monterrey, Ciudad Juarez, Arteaga y Tijuana), followed by the Bajio region with 376,000 square feet (Guadalajara, Silao, San Luis Potosi and IIrapuato) and the Central region with 130,000 square feet (Cuautitlan and Toluca). These leasing activities were divided as follows: renewals accounted for 37.8% , 24.6% of early renewals and 37.6% of new contracts with a weighted average maturity of 5.4 years. Terrafina’s occupancy level for the third quarter of 2019 reached 96.3%, an 80 basis points increase compared to second quarter 2019, as well as a 110 basis points increase compared to same quarter last year. Moreover portfolio occupancy by region increased compared to last quarter, with the main improvement being in the Northern region by a 67 basis points increase, reaching 98.5%. The leading submarket improvements were in: Tijuana, Arteaga, Ramos Arizpe and Monterrey. In the Bajio region, occupancy increased 108 basis points to 88.9%, showing improvements in the San Luis Potosi and Silao submarkets. Finally, occupancy for the Central region increased 43 basis points quarter on quarter to reach 98.0% and most of the activity occurred in the Toluca submarket. Average annual leasing rent for the third quarter of 2019 was US$5.18 per square foot, the same as last quarter and a US$0.05 increase compared to the third quarter of 2018. Average rents remained stable by region, with US$5.11 per square foot in the Northern region, US$5.27 in the Bajio region and US$5.36 in the Central region.
Terrafina’s main financial indicators for the third quarter of 2019 show rental revenues at US$48.7 million, Net Operating Income at US$49.2 million with an NOI Margin of 94.3%, and US$28.3 million in Adjusted Funds from Operations. Lastly, dividend yield for the quarter reached 9.5%, considering the average CBFI price for the third quarter of 2019.
Thank you for your interest in Terrafina. Sincerely,
Alberto Chretin Chief Executive Officer and Chairman of the Board

5
Operating Highlights
Highlights by Region
(as of September 30, 2019) North Bajio Central Total
# Buildings 203 56 30 289
# Tenants 199 54 41 294
GLA (msf) 26.0 9.5 6.2 41.8
Land Reserves (msf) 2.7 0.2 2.7 5.7
Occupancy Rate 98.5% 88.9% 98.0% 96.3%
Average Leasing Rent / Square Foot (dollars) 5.11 5.27 5.36 5.18
Annualized Rental Base % 62.9% 21.4% 15.7% 100.0% Source: PGIM Real Estate - Asset Management
Leasing Activity
3Q19 3Q18 Var.
Operating Portfolio (msf):
Renewals 0.6 1.1 -0.5
Early Renewals 0.4 1.4 -1.1
New Leases 0.6 0.2 0.4
Total Square Feet of Leases Signed 1.5 2.7 -1.2
Source: PGIM Real Estate - Asset Management
NORTH - Baja California - Sonora - Chihuahua - Coahuila - Nuevo Leon - Tamaulipas - Durango
BAJIO - San Luis Potosi - Jalisco - Aguascalientes - Guanajuato - Queretaro
CENTRAL - State of Mexico - Mexico City - Puebla - Tabasco
Terrafina’s 3Q19 Operations
27.4%
72.6%
Composition by Asset Type as of 3Q19
(as a % of total GLA)
Distribution Manufacturing
6
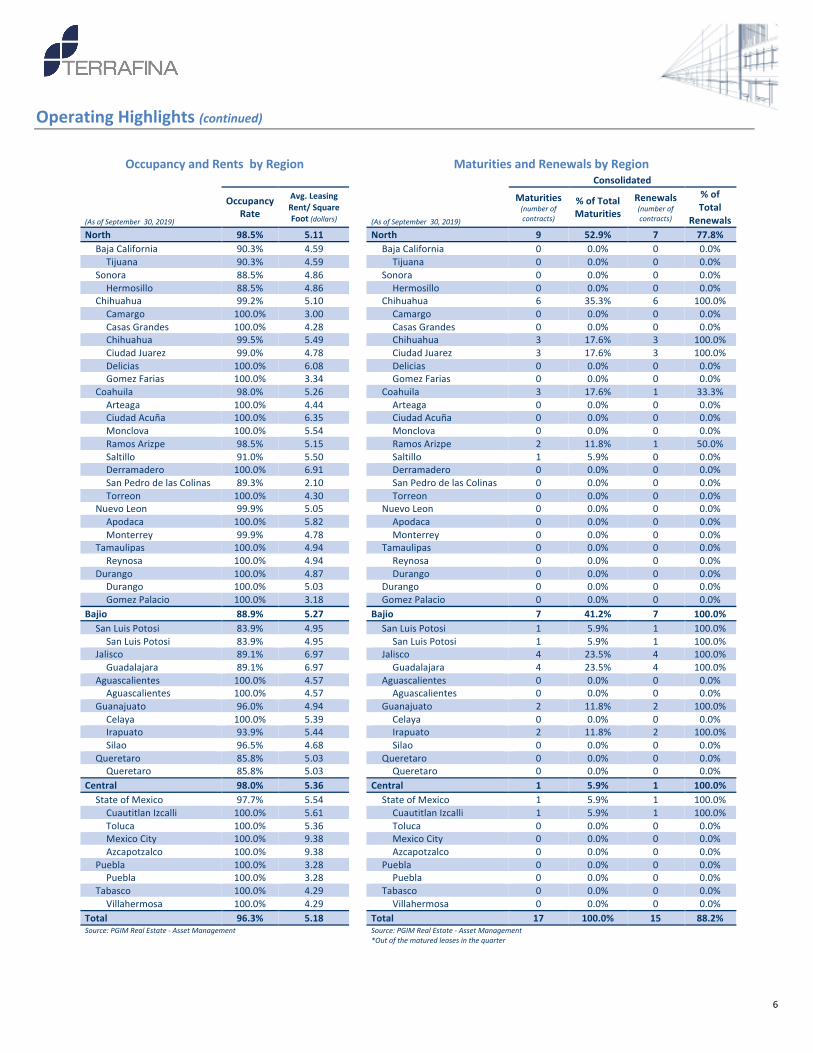
Operating Highlights (continued)
Occupancy and Rents by Region Maturities and Renewals by Region
0 Consolidated
(As of September 30, 2019)
Occupancy Rate
Avg. Leasing Rent/ Square Foot (dollars) (As of September 30, 2019)
Maturities (number of contracts)
% of Total Maturities
Renewals (number of contracts)
% of Total
Renewals North 98.5% 5.11 North 9 52.9% 7 77.8%
Baja California 90.3% 4.59 Baja California 0 0.0% 0 0.0% Tijuana 90.3% 4.59 Tijuana 0 0.0% 0 0.0%
Sonora 88.5% 4.86 Sonora 0 0.0% 0 0.0% Hermosillo 88.5% 4.86 Hermosillo 0 0.0% 0 0.0%
Chihuahua 99.2% 5.10 Chihuahua 6 35.3% 6 100.0% Camargo 100.0% 3.00 Camargo 0 0.0% 0 0.0% Casas Grandes 100.0% 4.28 Casas Grandes 0 0.0% 0 0.0% Chihuahua 99.5% 5.49 Chihuahua 3 17.6% 3 100.0% Ciudad Juarez 99.0% 4.78 Ciudad Juarez 3 17.6% 3 100.0% Delicias 100.0% 6.08 Delicias 0 0.0% 0 0.0% Gomez Farias 100.0% 3.34 Gomez Farias 0 0.0% 0 0.0%
Coahuila 98.0% 5.26 Coahuila 3 17.6% 1 33.3% Arteaga 100.0% 4.44 Arteaga 0 0.0% 0 0.0% Ciudad Acuña 100.0% 6.35 Ciudad Acuña 0 0.0% 0 0.0% Monclova 100.0% 5.54 Monclova 0 0.0% 0 0.0% Ramos Arizpe 98.5% 5.15 Ramos Arizpe 2 11.8% 1 50.0% Saltillo 91.0% 5.50 Saltillo 1 5.9% 0 0.0% Derramadero 100.0% 6.91 Derramadero 0 0.0% 0 0.0% San Pedro de las Colinas 89.3% 2.10 San Pedro de las Colinas 0 0.0% 0 0.0% Torreon 100.0% 4.30 Torreon 0 0.0% 0 0.0%
Nuevo Leon 99.9% 5.05 Nuevo Leon 0 0.0% 0 0.0% Apodaca 100.0% 5.82 Apodaca 0 0.0% 0 0.0% Monterrey 99.9% 4.78 Monterrey 0 0.0% 0 0.0%
Tamaulipas 100.0% 4.94 Tamaulipas 0 0.0% 0 0.0% Reynosa 100.0% 4.94 Reynosa 0 0.0% 0 0.0%
Durango 100.0% 4.87 Durango 0 0.0% 0 0.0% Durango 100.0% 5.03 Durango 0 0.0% 0 0.0% Gomez Palacio 100.0% 3.18 Gomez Palacio 0 0.0% 0 0.0%
Bajio 88.9% 5.27 Bajio 7 41.2% 7 100.0% San Luis Potosi 83.9% 4.95 San Luis Potosi 1 5.9% 1 100.0%
San Luis Potosi 83.9% 4.95 San Luis Potosi 1 5.9% 1 100.0% Jalisco 89.1% 6.97 Jalisco 4 23.5% 4 100.0%
Guadalajara 89.1% 6.97 Guadalajara 4 23.5% 4 100.0% Aguascalientes 100.0% 4.57 Aguascalientes 0 0.0% 0 0.0%
Aguascalientes 100.0% 4.57 Aguascalientes 0 0.0% 0 0.0% Guanajuato 96.0% 4.94 Guanajuato 2 11.8% 2 100.0%
Celaya 100.0% 5.39 Celaya 0 0.0% 0 0.0% Irapuato 93.9% 5.44 Irapuato 2 11.8% 2 100.0% Silao 96.5% 4.68 Silao 0 0.0% 0 0.0%
Queretaro 85.8% 5.03 Queretaro 0 0.0% 0 0.0% Queretaro 85.8% 5.03 Queretaro 0 0.0% 0 0.0%
Central 98.0% 5.36 Central 1 5.9% 1 100.0% State of Mexico 97.7% 5.54 State of Mexico 1 5.9% 1 100.0%
Cuautitlan Izcalli 100.0% 5.61 Cuautitlan Izcalli 1 5.9% 1 100.0% Toluca 100.0% 5.36 Toluca 0 0.0% 0 0.0% Mexico City 100.0% 9.38 Mexico City 0 0.0% 0 0.0% Azcapotzalco 100.0% 9.38 Azcapotzalco 0 0.0% 0 0.0%
Puebla 100.0% 3.28 Puebla 0 0.0% 0 0.0% Puebla 100.0% 3.28 Puebla 0 0.0% 0 0.0%
Tabasco 100.0% 4.29 Tabasco 0 0.0% 0 0.0% Villahermosa 100.0% 4.29 Villahermosa 0 0.0% 0 0.0%
Total 96.3% 5.18 Total 17 100.0% 15 88.2% Source: PGIM Real Estate - Asset Management
Source: PGIM Real Estate - Asset Management *Out of the matured leases in the quarter

7
3Q19 Operational Performance Composition by Geographical Diversification 3Q19 geographic diversification of properties (based on GLA per square foot) was as follows: the Northern region of Mexico represented 62.3% of GLA, while the Bajio and Central regions represented 22.8% and 14.9% of GLA, respectively.
Geographic Distribution by Region and State
3Q19 as a % of Total
GLA 3Q19 3Q18 as a % of Total GLA 3Q18
North 26.04 62.3% 25.66 62.5% Baja California 0.91 2.2% 0.91 2.2%
Tijuana 0.91 2.2% 0.91 2.2% Sonora 0.33 0.8% 0.33 0.8%
Hermosillo 0.33 0.8% 0.33 0.8% Chihuahua 14.54 34.8% 14.40 35.1%
Chihuahua 5.83 14.0% 5.83 14.2% Ciudad Juarez 8.00 19.1% 7.87 19.2% Delicias 0.52 1.2% 0.52 1.3% Gomez Farias 0.08 0.2% 0.08 0.2% Camargo 0.02 0.1% 0.02 0.1% Casas Grandes 0.09 0.2% 0.09 0.2%
Coahuila 6.96 16.7% 6.84 16.7% Arteaga 0.12 0.3% 0.24 0.6% Ciudad Acuña 0.24 0.6% 0.24 0.6% Monclova 0.35 0.8% 0.35 0.8% Ramos Arizpe 4.55 10.9% 4.54 11.1% Saltillo 0.62 1.5% 0.62 1.5% Derramadero 0.54 1.3% 0.54 1.3% San Pedro de las Colinas 0.15 0.4% 0.15 0.4% Torreon 0.39 0.9% 0.39 1.0%
Nuevo Leon 2.06 4.9% 1.94 4.7% Apodaca 0.52 1.2% 0.50 1.2% Monterrey 1.54 3.7% 1.44 3.5%
Tamaulipas 0.47 1.1% 0.47 1.1% Reynosa 0.47 1.1% 0.47 1.1%
Durango 0.78 1.9% 0.78 1.9% Durango 0.71 1.7% 0.71 1.7% Gomez Palacio 0.07 0.2% 0.07 0.2%
Bajio 9.52 22.8% 9.13 22.2% San Luis Potosi 3.33 8.0% 3.32 8.1%
San Luis Potosi 3.33 8.0% 3.32 8.1% Jalisco 1.66 4.0% 1.66 4.0%
Guadalajara 1.66 4.0% 1.66 4.0% Aguascalientes 0.99 2.4% 0.75 1.8%
Aguascalientes 0.99 2.4% 0.75 1.8% Guanajuato 1.57 3.7% 1.42 3.5%
Celaya 0.12 0.3% 0.12 0.3% Irapuato 0.44 1.1% 0.44 1.1% Silao 1.01 2.4% 0.87 2.1%
Queretaro 1.98 4.7% 1.98 4.8% Queretaro 1.98 4.7% 1.98 4.8%
Central 6.25 14.9% 6.25 15.2% State of Mexico 5.39 12.9% 5.40 13.1%
Cuautitlan Izcalli 4.26 10.2% 4.26 10.4% Toluca 0.90 2.2% 0.91 2.2% Huehuetoca 0.23 0.5% 0.23 0.6%
Mexico City 0.02 0.1% 0.02 0.1% Azcapotzalco 0.02 0.1% 0.02 0.1%
Puebla 0.18 0.4% 0.18 0.4% Puebla 0.18 0.4% 0.18 0.4%
Tabasco 0.65 1.6% 0.65 1.6% Villahermosa 0.65 1.6% 0.65 1.6%
Total 41.81 100.0% 41.05 100.0% Total Gross Leasable Area / million square feet. Potential leasable area of land reserves are not included. Source: PGIM Real Estate - Asset Management

8
Composition by Asset Type At the end of 3Q19, 72.6% of Terrafina’s portfolio consisted of properties dedicated to manufacturing activities while 27.4% was dedicated to distribution and logistics activities.
Composition by Sector As of September 30, 2019, tenant diversification by industrial sector was as follows:
Industrial Sector Diversification
3Q19 3Q18 Var.
Automotive 35.0% 34.8% 19 bps
Industrial properties 19.2% 19.9% -67 bps
Consumer goods 14.5% 14.2% 26 bps
Logistics and Trade 10.3% 9.5% 75 bps
Aviation 9.4% 9.8% -41 bps
Non-durable consumer goods 3.6% 3.7% -17 bps
Electronics 8.1% 8.0% 6 bps
Total 100.0% 100.0% Source: PGIM Real Estate - Asset Management
Composition of Top Clients Terrafina has a widely diversified tenant base that leases industrial properties throughout several of Mexico’s main cities. For 3Q19, Terrafina’s top client, top 10 clients and top 20 clients represented 3.2%, 18.1% and 29.0% of total revenues, respectively.
Top Clients (As of September 30, 2019) Leased Square
Feet (millions) % Total GLA % Total
Revenues
Top Client 1.24 3.1% 3.2%
Top 10 Clients 7.40 18.4% 18.1%
Top 20 Clients 11.70 29.1% 29.0% Source: PGIM Real Estate - Asset Management
27.3%
72.6%
Composition by Asset Typeas of 3Q19
(as a % of total GLA)
Distribution Manufacturing
Composition by Asset Type
3Q19 3Q18 Var.
Distribution 27.4% 26.7% 78 bps
Manufacturing 72.6% 73.3% -78 bps Source: PGIM Real Estate - Asset Management

9
Occupancy The 3Q19 occupancy rate was 96.3% a 110 basis point increase compared to 3Q18. It is important to note that occupancy rate indicators presented in this report reflect the quarterly closing rate. For 3Q19, Terrafina’s leasing activity reached 1.5 msf, 37.6% of which corresponded to new leasing contracts (including expansions), 37.8% were contract renewals and 24.6% were early renewals.
Leasing activity mainly took place in the Chihuahua, Ramos Arizpe, Monterrey, Guadalajara, Ciudad Juarez, Arteaga, Cuautitlan Izcalli, Silao, San Luis Potosi, Irapuato, Tijuana and Toluca markets.
Lease Maturities Terrafina had 294 tenants under leasing contracts at the end of 3Q19. These contracts have an average maturity of three to five years for logistics and distribution properties and of five to seven years for manufacturing properties. Annual average maturities (as a percentage of annual base rents) will remain at levels of between 4% to 23% for the next five years.
The following table breaks down Terrafina’s leasing maturity schedule for the upcoming years:
Annual
Base Rent (millions of
dollars) % of Total
Occupied Sq. Ft (millions) % of Total
2019 7.8 3.7% 1.60 4.0% 2020 46.7 22.4% 9.13 22.7% 2021 37.2 17.8% 7.22 17.9% 2022 23.1 11.1% 4.45 11.1% 2023 27.2 13.0% 5.35 13.3% Thereafter 66.6 31.9% 12.49 31.1%
Source: PGIM Real Estate – Asset Management
96.3%
3.7%
Occupancy as of 3T19(as % of Total GLA)
Leased GLA
Vacant GLA
3Q19 3Q18 Var.
Leased GLA 96.3% 95.5% 72 bps
Vacant GLA 3.7% 3.6% 14 bps
Signed Letters of Intent 0.0% 0.9% -85 bps
Total 100.0% 100.0% Source: PGIM Real Estate - Asset Management
10
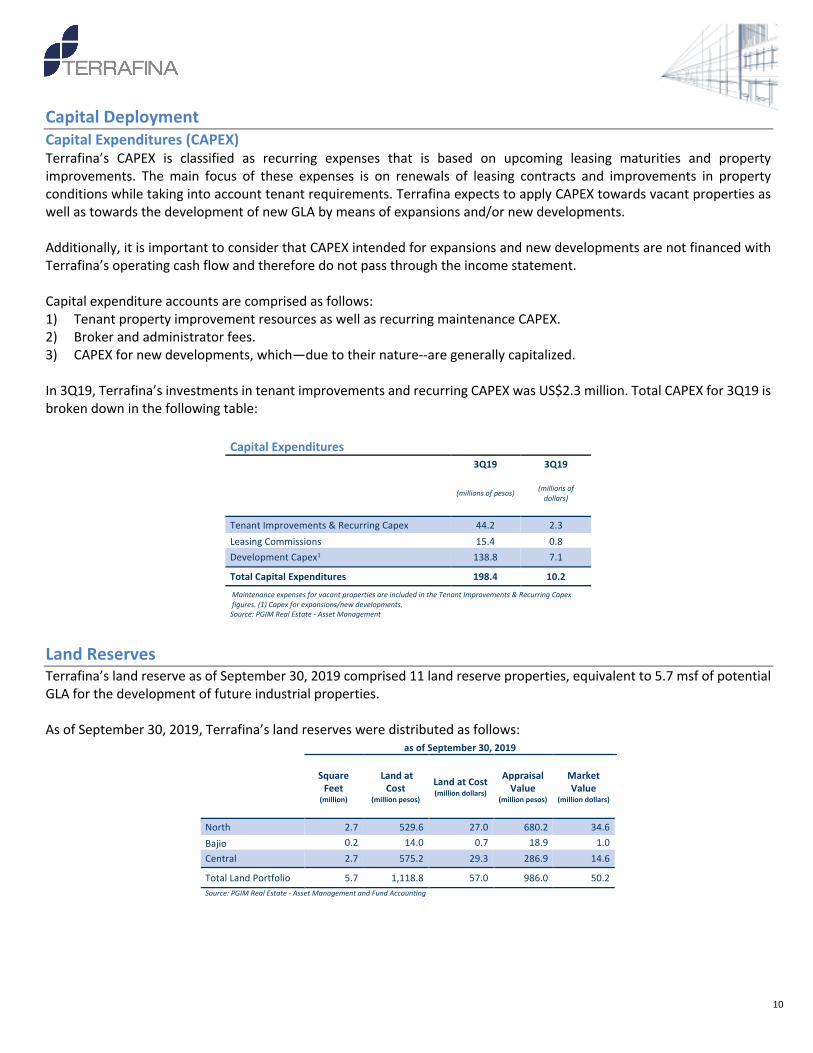
Capital Deployment Capital Expenditures (CAPEX) Terrafina’s CAPEX is classified as recurring expenses that is based on upcoming leasing maturities and property improvements. The main focus of these expenses is on renewals of leasing contracts and improvements in property conditions while taking into account tenant requirements. Terrafina expects to apply CAPEX towards vacant properties as well as towards the development of new GLA by means of expansions and/or new developments.
Additionally, it is important to consider that CAPEX intended for expansions and new developments are not financed with Terrafina’s operating cash flow and therefore do not pass through the income statement. Capital expenditure accounts are comprised as follows: 1) Tenant property improvement resources as well as recurring maintenance CAPEX. 2) Broker and administrator fees. 3) CAPEX for new developments, which—due to their nature--are generally capitalized. In 3Q19, Terrafina’s investments in tenant improvements and recurring CAPEX was US$2.3 million. Total CAPEX for 3Q19 is broken down in the following table:
Capital Expenditures 3Q19 3Q19
(millions of pesos) (millions of dollars)
Tenant Improvements & Recurring Capex 44.2 2.3 Leasing Commissions 15.4 0.8 Development Capex1 138.8 7.1
Total Capital Expenditures 198.4 10.2
Maintenance expenses for vacant properties are included in the Tenant Improvements & Recurring Capex figures. (1) Capex for expansions/new developments. Source: PGIM Real Estate - Asset Management
Land Reserves Terrafina’s land reserve as of September 30, 2019 comprised 11 land reserve properties, equivalent to 5.7 msf of potential GLA for the development of future industrial properties. As of September 30, 2019, Terrafina’s land reserves were distributed as follows:
as of September 30, 2019
Square Feet
(million)
Land at Cost
(million pesos)
Land at Cost (million dollars)
Appraisal Value
(million pesos)
Market Value
(million dollars)
North 2.7 529.6 27.0 680.2 34.6 Bajio 0.2 14.0 0.7 18.9 1.0 Central 2.7 575.2 29.3 286.9 14.6
Total Land Portfolio 5.7 1,118.8 57.0 986.0 50.2 Source: PGIM Real Estate - Asset Management and Fund Accounting

11
3Q19 Financial Performance Financial Results and Calculations Terrafina’s financial results are presented in Mexican pesos and U.S. dollars. Figures on the income statement for each period were converted to dollars using the average exchange rate for 3Q19 (Ps. 19.4256/dollar), while for the balance sheet, the exchange rate at the close of September 30, 2019 (Ps. 19.6363/dollar) was applied. Terrafina uses best accounting practices for measuring the FIBRA’s (REIT) performance results by providing relevant metrics to the financial community. Throughout the following financial performance section, additional calculations are available. It is important to note that these metrics must not be considered individually to evaluate Terrafina’s results. It is recommended to use them in combination with other International Financial Reporting Standards metrics to measure the Company’s performance. Terrafina presents in this earnings report additional metrics such as Net Operating Income (NOI), Earnings Before Interests, Taxes, Depreciation and Amortization (EBITDA), Funds from Operations (FFO), and Adjusted Funds from Operations (AFFO). Each breakdown calculation is available in this document.
In addition, Terrafina recommends reviewing the Appendices as a reference to different items of Terrafina’s financial
statement. This information is available in the last section of this document.
Past performance is not a guarantee or reliable indicator of future results.

12
Same-Store The following table shows Terrafina’s 3Q19 same-store highlights and consolidated information:
(as of September 30, 2019)
Same-Store1
3Q19 Consolidated2
3Q19 Number of Properties 286.0 289.0 Occupancy Rate 96.2% 96.3% Gross Leasable Area (GLA) (msf) 41.4 41.8 Avg. Leasing Rent / Square Foot (dollars) 5.17 5.18
Same-Store 3Q19
Consolidated
3Q19 Same-Store
3Q19 Consolidated
3Q19 (millions of pesos) (millions of dollars)
Rental Revenues 940.5 945.8 48.4 48.7 Net Operating Income 950.4 955.6 48.9 49.2 NOI Margin 94.3% 94.3% 94.3% 94.3% EBITDA 854.1 858.8 44.0 44.2 EBITDA Margin 84.7% 84.8% 84.7% 84.8% FFO 609.9 614.6 31.4 31.6 FFO Margin 60.5% 60.7% 60.5% 60.7% Adjusted Funds from Operations 471.3 551.0 27.8 28.3 AFFO Margin 53.2% 53.9% 53.2% 53.9%
(1) Same properties information evaluates the performance of the industrial properties without including acquisitions/new developments closed over the last twelve-months. (2) Includes acquisitions closed over the last twelve-months Source: PGIM Real Estate - Asset Management and Fund Accounting
Rental Revenues In 3Q19, Terrafina reported rental revenues of US$48.7 million, a 1.3% or US$0.6 million increase compared to 3Q18. Rental revenues do not include accrued revenues as these are a non-cash item. Other Operating Income In 3Q19, other operating income totaled US$3.7 million, a 25.1% or US$0.7 million increase compared to 3Q18. Other operating income mainly stems from tenant refunds from triple-net leases. Expenses reimbursable to Terrafina mainly included electricity, property taxes, insurance and maintenance.
Net revenues reached US$52.6 million in 3Q19, an increase of US$1.3 million, or 2.6% compared to 3Q18.
Revenues 3Q19 3Q18 Var. % 3Q19 3Q18 Var. %
(millions of pesos) (millions of dollars)
Rental Revenue 945.8 912.0 3.7% 48.7 48.0 1.3%
Accrued Income1 5.1 5.7 -10.5% 0.3 0.3 -8.4%
Other Operating Revenues 71.0 55.8 27.4% 3.7 2.9 25.1%
Reimbursable Expenses as Revenues2 57.3 48.5 18.1% 3.0 2.6 16.2%
Reimbursable Tenant Improvements 9.3 6.7 38.0% 0.5 0.4 34.8%
Other non-cash income 4.4 0.5 795.7% 0.2 0.0 765.3%
Net Revenue 1,022.0 973.5 5.0% 52.6 51.3 2.6% (1) Straight line rent adjustment; non-cash item. (2) Triple net leases expenses reimbursed to Terrafina from its tenants. Source: PGIM Real Estate - Fund Accounting

13
For additional information regarding the revenue breakdown used to calculate additional metrics presented in this earnings report, please refer to Appendix 1 in the last section of this document.
Real Estate Expenses In 3Q19, real estate expenses totaled US$8.6 million, an increase of 41.5% or US$2.5 million compared to 3Q18. It is important to differentiate between expenses that are directly related to the operation and those that are for the maintenance of the industrial portfolio; the latter are used in the NOI calculation.
The remainder of the accounts included in real estate expenses are considered non-recurring expenses and are used to calculate EBITDA and AFFO.
For additional information regarding the real estate expenses breakdown, please refer to Appendix 2 in the last section of this document.
Net Operating Income (NOI) In 3Q19, NOI totaled US$49.2 million, a 2.3% or US$1.1 million decrease compared with 3Q18. NOI margin was 94.3%, an increase of 28 basis points when compared to 94.0% in 3Q18. The following table displays the NOI calculation for 3Q19:
Net Operating Income 3Q19 3Q18 Var. % 3Q19 3Q18 Var. %
(millions of pesos unless otherwise stated) (millions of dollars unless otherwise stated)
Rental Revenues1 945.8 912.0 3.7% 48.7 48.0 1.3% Other Operating income2 67.8 59.5 14.0% 3.5 3.1 11.9%
Net Revenues for NOI Calculation 1,013.6 971.5 4.3% 52.2 51.2 2.0%
Repair and Maintenance -10.2 -8.1 26.2% -0.5 -0.4 23.4% Property Taxes -0.1 -0.1 46.1% 0.0 0.0 42.5% Property Management Fees -18.4 -17.4 5.3% -0.9 -0.9 2.8% Electricity -14.8 -21.7 -32.1% -0.8 -1.1 -34.4% Property Insurance -2.4 -2.6 -6.7% -0.1 -0.1 -8.8% Security -5.1 -4.4 15.5% -0.3 -0.2 12.7% Other Operational Expenses -7.2 -3.9 84.0% -0.4 -0.2 79.0%
Real Estate Operating Expenses for NOI Calculation -58.0 -58.1 -0.2% -3.0 -3.1 -2.9% Net Operating Income3 955.6 913.3 4.6% 49.2 48.1 2.3% NOI Margin 94.3% 94.0% 28 bps 94.3% 94.0% 28 bps (1)Excludes accrued income from straight line rent adjustments as it is a non-cash item. (2) Excludes tenant improvements reimbursements which are included in ' AFFO ' (3) The income calculation generated by theoperation of the property, independent of external factors such as financing and income taxes. NOI is the result of Net Revenues (includes rental income and triple net leases expenses reimbursements) minus Real Estate Operating Expenses (costs incurred during the operation and maintenance of the industrial portfolio). Source: PGIM Real Estate - Fund Accounting

14
Fees and Administrative Expenses (G&A)
G&A for 3Q19 totaled US$6.1 million, a 16.3% or US$0.9 million increase compared to 3Q18.
The following table breaks down total G&A for 3Q19: G&A
3Q19 3Q18 Var. % 3Q19 3Q18 Var. %
(millions of pesos unless otherwise stated) (millions of dollars unless otherwise stated)
External Advisor Fees1 -60.6 -56.0 8.3% -3.1 -2.9 5.1%
Professional and Consulting Services -11.3 -9.6 17.9% -0.6 -0.5 22.2%
Payroll, Admin. Fees and Other Expenses -47.2 -34.6 36.5% -2.4 -1.8 32.8%
Total G&A -119.2 -100.2 19.0% -6.1 -5.3 16.3% (1) PLA Administradora Industrial, S. de R.L. de C.V., is a Mexican affiliate of PGIM, and Advisor as per the Advisory Contract. Source: PGIM Real Estate - Fund Accounting
Earnings Before Interest, Taxes, Depreciation and Amortization (EBITDA) In 3Q19, EBITDA totaled US$44.2 million, an increase of U$S0.9 million, or 2.1%, compared to 3Q18. EBITDA margin for 3Q19 was 84.8%, a 11 basis point increase compared to 3Q18. The following shows the EBITDA calculation for 3Q19:
EBITDA 3Q19 3Q18 Var. % 3Q19 3Q18 Var. %
(millions of pesos unless otherwise stated) (millions of dollars unless otherwise stated)
Rental Revenues1 945.8 912.0 3.7% 48.7 48.0 1.3% Other Operating income2 67.8 59.5 14.0% 3.5 3.1 11.9% Real Estate Expenses for EBITDA Calculation -61.8 -62.5 -1.2% -3.2 -3.3 -3.8%
Real Estate Operating Expenses for NOI Calculation -58.0 -58.1 -0.2% -3.0 -3.1 -2.9% Advertising -0.8 -0.4 - 0.0 0.0 - Admin. Property Insurance Expenses -0.8 -0.8 6.9% 0.0 0.0 0.0% Other Admin. Real Estate Expenses -2.1 -3.2 -33.6% -0.1 -0.2 -35.5%
Fees and Admin. Expenses -93.1 -86.9 7.1% -4.8 -4.6 4.9% External Advisor Fees -60.6 -56.0 8.3% -3.1 -2.9 5.1% Legal, Admin. and Other Professional Fees -19.7 -19.7 -0.3% -1.0 -1.0 0.3% Trustee Fees -2.9 -1.0 184.2% -0.1 -0.1 177.9% Payroll -6.3 -6.3 0.5% -0.3 -0.3 -1.8% Other Expenses -3.6 -3.9 -8.5% -0.2 -0.2 -9.9%
EBITDA3 858.8 822.1 11.8% 44.2 43.3 2.1% EBITDA Margin 84.8% 84.6% 11 bps 84.8% 84.6% 11 bps (1) Excludes accrued income from straight line rent adjustments as it is a non-cash item. (2) Excludes tenant improvements reimbursements which is included in AFFO calculation. (3) Earnings before interest, taxes, depreciation and amortization. Source: PGIM Real Estate - Fund Accounting
For additional information regarding the commissions and administrative expenses breakdown used for the
calculation of EBITDA and AFFO, please refer to Appendix 3 located in the last section of this document.
15
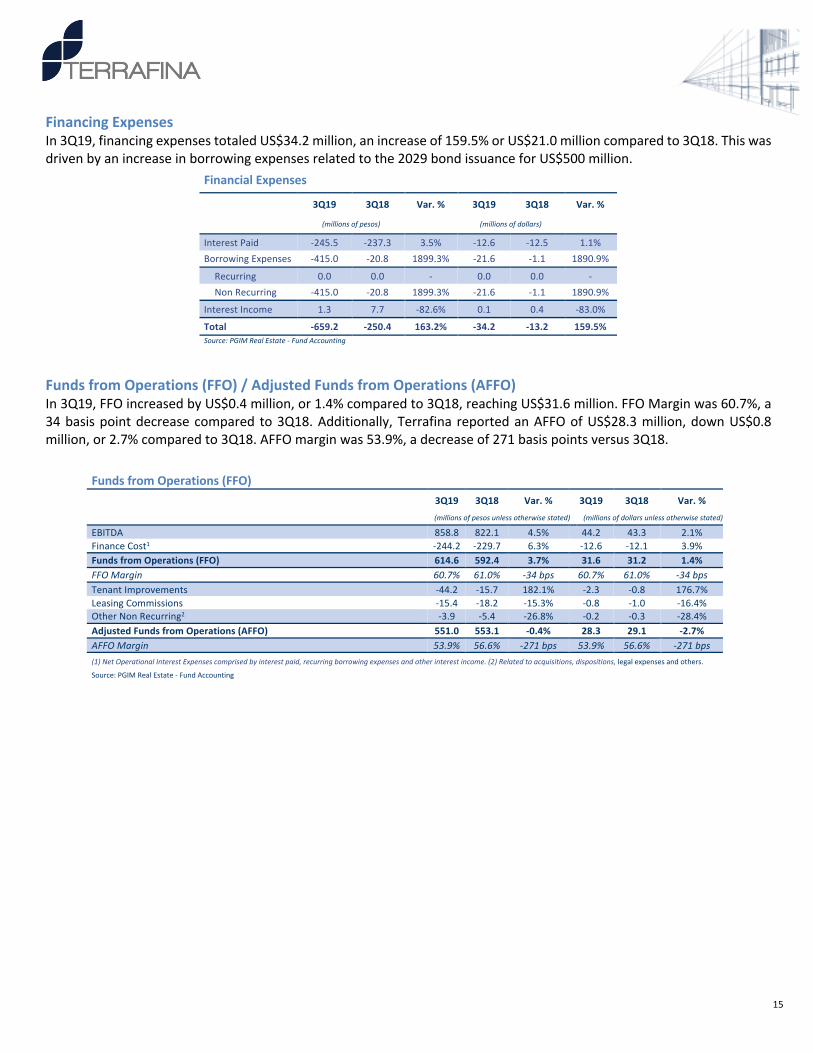
Financing Expenses In 3Q19, financing expenses totaled US$34.2 million, an increase of 159.5% or US$21.0 million compared to 3Q18. This was driven by an increase in borrowing expenses related to the 2029 bond issuance for US$500 million.
Financial Expenses 3Q19 3Q18 Var. % 3Q19 3Q18 Var. %
(millions of pesos) 0 (millions of dollars) 0
Interest Paid -245.5 -237.3 3.5% -12.6 -12.5 1.1% Borrowing Expenses -415.0 -20.8 1899.3% -21.6 -1.1 1890.9%
Recurring 0.0 0.0 - 0.0 0.0 - Non Recurring -415.0 -20.8 1899.3% -21.6 -1.1 1890.9%
Interest Income 1.3 7.7 -82.6% 0.1 0.4 -83.0%
Total -659.2 -250.4 163.2% -34.2 -13.2 159.5% Source: PGIM Real Estate - Fund Accounting
Funds from Operations (FFO) / Adjusted Funds from Operations (AFFO) In 3Q19, FFO increased by US$0.4 million, or 1.4% compared to 3Q18, reaching US$31.6 million. FFO Margin was 60.7%, a 34 basis point decrease compared to 3Q18. Additionally, Terrafina reported an AFFO of US$28.3 million, down US$0.8 million, or 2.7% compared to 3Q18. AFFO margin was 53.9%, a decrease of 271 basis points versus 3Q18.
Funds from Operations (FFO) 3Q19 3Q18 Var. % 3Q19 3Q18 Var. %
(millions of pesos unless otherwise stated) (millions of dollars unless otherwise stated)
EBITDA 858.8 822.1 4.5% 44.2 43.3 2.1% Finance Cost1 -244.2 -229.7 6.3% -12.6 -12.1 3.9% Funds from Operations (FFO) 614.6 592.4 3.7% 31.6 31.2 1.4% FFO Margin 60.7% 61.0% -34 bps 60.7% 61.0% -34 bps Tenant Improvements -44.2 -15.7 182.1% -2.3 -0.8 176.7% Leasing Commissions -15.4 -18.2 -15.3% -0.8 -1.0 -16.4% Other Non Recurring2 -3.9 -5.4 -26.8% -0.2 -0.3 -28.4% Adjusted Funds from Operations (AFFO) 551.0 553.1 -0.4% 28.3 29.1 -2.7% AFFO Margin 53.9% 56.6% -271 bps 53.9% 56.6% -271 bps (1) Net Operational Interest Expenses comprised by interest paid, recurring borrowing expenses and other interest income. (2) Related to acquisitions, dispositions, legal expenses and others.
Source: PGIM Real Estate - Fund Accounting
16
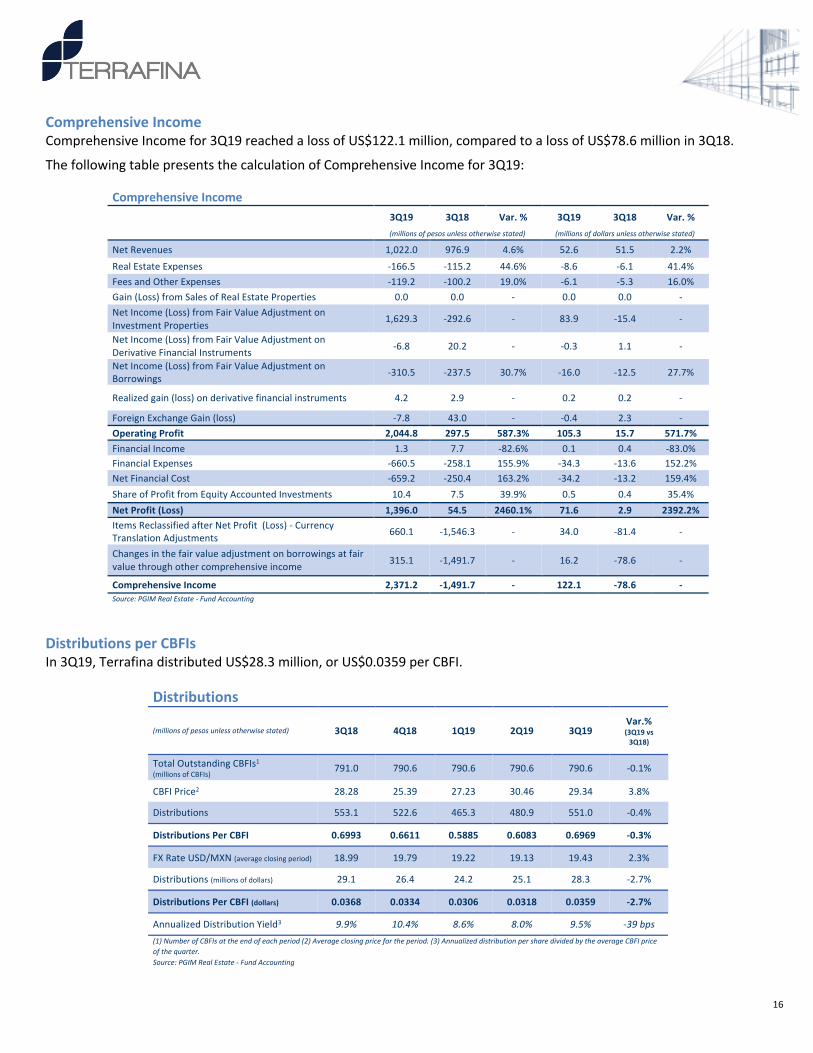
Comprehensive Income Comprehensive Income for 3Q19 reached a loss of US$122.1 million, compared to a loss of US$78.6 million in 3Q18.
The following table presents the calculation of Comprehensive Income for 3Q19:
Comprehensive Income 3Q19 3Q18 Var. % 3Q19 3Q18 Var. %
(millions of pesos unless otherwise stated) (millions of dollars unless otherwise stated)
Net Revenues 1,022.0 976.9 4.6% 52.6 51.5 2.2% Real Estate Expenses -166.5 -115.2 44.6% -8.6 -6.1 41.4% Fees and Other Expenses -119.2 -100.2 19.0% -6.1 -5.3 16.0% Gain (Loss) from Sales of Real Estate Properties 0.0 0.0 - 0.0 0.0 - Net Income (Loss) from Fair Value Adjustment on Investment Properties
1,629.3 -292.6 - 83.9 -15.4 -
Net Income (Loss) from Fair Value Adjustment on Derivative Financial Instruments -6.8 20.2 - -0.3 1.1 -
Net Income (Loss) from Fair Value Adjustment on Borrowings -310.5 -237.5 30.7% -16.0 -12.5 27.7%
Realized gain (loss) on derivative financial instruments 4.2 2.9 - 0.2 0.2 -
Foreign Exchange Gain (loss) -7.8 43.0 - -0.4 2.3 - Operating Profit 2,044.8 297.5 587.3% 105.3 15.7 571.7% Financial Income 1.3 7.7 -82.6% 0.1 0.4 -83.0% Financial Expenses -660.5 -258.1 155.9% -34.3 -13.6 152.2% Net Financial Cost -659.2 -250.4 163.2% -34.2 -13.2 159.4% Share of Profit from Equity Accounted Investments 10.4 7.5 39.9% 0.5 0.4 35.4% Net Profit (Loss) 1,396.0 54.5 2460.1% 71.6 2.9 2392.2% Items Reclassified after Net Profit (Loss) - Currency Translation Adjustments 660.1 -1,546.3 - 34.0 -81.4 -
Changes in the fair value adjustment on borrowings at fair value through other comprehensive income 315.1 -1,491.7 - 16.2 -78.6 -
Comprehensive Income 2,371.2 -1,491.7 - 122.1 -78.6 - Source: PGIM Real Estate - Fund Accounting
Distributions per CBFIs In 3Q19, Terrafina distributed US$28.3 million, or US$0.0359 per CBFI.
Distributions
(millions of pesos unless otherwise stated) 3Q18 4Q18 1Q19 2Q19 3Q19 Var.% (3Q19 vs
3Q18)
Total Outstanding CBFIs1 (millions of CBFIs) 791.0 790.6 790.6 790.6 790.6 -0.1%
CBFI Price2 28.28 25.39 27.23 30.46 29.34 3.8%
Distributions 553.1 522.6 465.3 480.9 551.0 -0.4%
Distributions Per CBFI 0.6993 0.6611 0.5885 0.6083 0.6969 -0.3%
FX Rate USD/MXN (average closing period) 18.99 19.79 19.22 19.13 19.43 2.3%
Distributions (millions of dollars) 29.1 26.4 24.2 25.1 28.3 -2.7%
Distributions Per CBFI (dollars) 0.0368 0.0334 0.0306 0.0318 0.0359 -2.7%
Annualized Distribution Yield3 9.9% 10.4% 8.6% 8.0% 9.5% -39 bps (1) Number of CBFIs at the end of each period (2) Average closing price for the period. (3) Annualized distribution per share divided by the average CBFI price of the quarter. Source: PGIM Real Estate - Fund Accounting

17
Debt As of September 30, 2019, Terrafina’s total debt reached US$1,042.6 million. The average cost of Terrafina’s long-term debt was 4.94%. All of Terrafina’s debt is denominated in U.S. dollars. Outstanding Debt
(as of September 30, 2019)
Currency Millions of pesos
Millions of dollars
Interest Rate Terms Maturity Extension
Option Derivatives
Long Term Debt
Citibank1 Dollars 1,539.6 78.4 Libor + 2.45% Interest Only Jan 2023 - US$150M cap5
Metlife Dollars 2,945.4 150.0 4.75% Interest Only Jan 2027 - -
Banamex2 Dollars 3,672.1 187.0 Libor + 2.45% Interest Only Oct 2022 - US$105M swap6
Senior Notes (2022)3 Dollars 1,872.0 95.3 5.25% Interest Only Nov 2022 - -
Senior Notes (2029)4 Dollars 10,149.3 516.9 4.962% Interest Only Jul 2029 - -
New York Life Dollars 293.8 15.0 5.19% Interest + Principal
Feb 2020 - -
Total Debt 20,472.3 1,042.6
Net Cash 1,274.2 64.9
Net Debt 19,198.1 977.7 (1)Unsecured syndicated revolving credit facility. (2) Unsecured syndicated term loan facility; interest only for the first three years. (3) Value at Cost: US$425 million / Ps.8,388 million. (4) Value at Cost: US$500 million / Ps.9,818 million (5)Interest rate Cap: 2.75%. (6) Interest rate Swap fixed rate: 1.768% Source: PGIM Real Estate - Fund Accounting and Transactions
The following tables show leverage and debt service coverage as of September 30, 2019 as well as Terrafina’s projections for the following six quarters:
Loan-to-Value (LTV) (as of September 30, 2019) (millions of pesos)
(millions of dollars)
Total Assets 50,219.8 2,557.5
Total Debt 20,472.3 1,042.6
Loan-to-Value (LTV)1 40.8% (1) Total Debt divided by Total Assets as defined by the National Securities and Banking Commission (CNBV)
Source: PGIM Real Estate - Fund Accounting and Capital Markets
25.5%
74.5%
Interest Rate Breakdown(as of September 30, 2019)
Variable Rate Fixed Rate

18
Debt Service Coverage Ratio (DSCR) period (millions of pesos) (millions of dollars)
Cash & Cash Equivalents September 30, 2019 1,274.2 64.9
Recoverable Taxes Σ next 6 quarters 103.7 5.3
EBIT1 after distributions Σ next 6 quarters 2,149.0 109.4
Available Credit Line September 30, 2019 4,376.9 222.9
period (millions of pesos) (millions of dollars)
Interest Payments Σ next 6 quarters 1,428.4 72.7
Principal Payments Σ next 6 quarters 361.7 18.4
Recurring CAPEX Σ next 6 quarters 242.9 12.4
Development Expenses Σ next 6 quarters 388.5 19.8
Debt Service Coverage Ratio (DSCR)2 3.3x
(1) Earnings Before Interest and Taxes (2) (Cash & Cash Equivalents + Recoverable Taxes + EBIT After Distributions + Available Credit Line) / (Interest Payments + Principal Payments + Recurring CAPEX + Development Expenses) Source: PGIM Real Estate - Fund Accounting and Capital Markets
Moreover, as of September 30, 2019, Terrafina was in full compliance with its debt covenants related to the US$425 million (November 2015) and US$500 million (July 2017) bond issuances as follows:
Unsecured Bond Covenants (as of September 30, 2019) Terrafina Bond Covenants
Loan-to-Value (LTV)1 40.8% ≤ 60%
Debt Service Coverage Ratio (DSCR)2 3.5x ≥ 1.5x
Secured Debt to Gross Assets Limitation 6.4% ≤ 40% Unencumbered Assets to Unsecured Debt Limitation
246% ≥ 150%
(1) Total Debt divided by Total Assets. (2) (Net Income/Loss + Interest on Debt + Unrealized Gain /Loss of fair value changes)/ (all interest and principal payments on Debt)
Source: PGIM Real Estate - Transactions
CBFI Buyback Activity In 3Q19, Terrafina maintained its CBFI buyback balance unchanged compared to the first quarter of 2019.
CBFIs Buyback Activity 3Q19
Total outstanding CBFIs at the beginning of the quarter 790,602,803
Buyback activity during the quarter -
Total outstanding CBFIs at the end of the quarter 790,602,803

19
Analyst Coverage The following is a list of banks and institutions that regularly publish research reports on Terrafina: - Barclays - Interacciones - BBVA Bancomer - Invex - Bradesco - Itaú BBA - BofA ML - JPMorgan - BTG Pactual - Monex - BX+ - Morgan Stanley - Citi Banamex - NAU Securities - Credit Suisse - Scotiabank - GBM - Santander - HSBC

20
About Terrafina Terrafina (BMV:TERRA13) is a Mexican real estate investment trust formed primarily to acquire, develop, lease and manage industrial real estate properties in Mexico. Terrafina’s portfolio consists of attractive, strategically located warehouses and other light manufacturing properties throughout the Central, Bajio and Northern regions of Mexico. It is internally managed by highly-qualified industry specialists and externally advised by PGIM Real Estate. Terrafina owns 300 real estate properties, including 289 developed industrial facilities with a collective GLA of approximately 41.8 million square feet and 11 land reserve parcels, designed to preserve the organic growth capability of the portfolio. Terrafina’s objective is to provide attractive risk-adjusted returns for the holders of its certificates through stable distributions and capital appreciations. Terrafina aims to achieve this objective through a successful performance of its industrial real estate and complementary properties, strategic acquisitions, access to a high level of institutional support, and to its management and corporate governance structure. For more information, please visit www.terrafina.mx About PGIM Real Estate PGIM, the global investment management business of Prudential Financial, Inc. (NYSE: PRU), is one of the largest real estate investment managers in the world, with more than $US173.5 billion1 in gross real estate assets under management and administration, as of 31 March 2019. Through its PGIM Real Estate and PGIM Real Estate Finance businesses, PGIM leverages a 140-year history of real estate lending on behalf of institutional and middle-market borrowers2, a 49-year legacy of investing in commercial real estate on behalf of institutional investors, and the deep local knowledge and expertise of professionals in 31 cities around the world. PGIM Real Estate, the real estate investment management business of PGIM, has been redefining the real estate investing landscape since 1970. Combining insights into macroeconomic trends and global real estate markets with excellence of execution and risk management, PGIM Real Estate’s tenured team offers to its global clients a broad range of real estate equity, debt, and securities investment strategies that span the risk-return spectrum and geographies. For more information, visit pgimrealestate.com. 1AUA equals $US33.7 billion. 2Includes legacy lending through PGIM’s parent company, Prudential Financial, Inc.
About Prudential Financial, Inc. Prudential Financial, Inc. (NYSE:PRU), a financial services leader with more than US$1.5 trillion of assets under management as of March 31, 2019, has operations in the United States, Asia, Europe, and Latin America. Prudential’s diverse and talented employees are committed to helping individual and institutional customers grow and protect their wealth through a variety of products and services, including life insurance, annuities, retirement-related services, mutual funds and investment management. In the U.S., Prudential’s iconic Rock symbol has stood for strength, stability, expertise and innovation for more than a century. For more information, please visit www.news.prudential.com Forward Looking Statements This document may include forward-looking statements that may imply risks and uncertainties. Terms such as "estimate", "project", "plan", "believe", "expect", "anticipate", "intend", and other similar expressions could be construed as previsions or estimates. Terrafina warns readers that declarations and estimates mentioned in this document, or realized by Terrafina’s management imply risks and uncertainties that could change in function of various factors that are out of Terrafina’s control. Future expectations reflect Terrafina’s judgment at the date of this document. Terrafina reserves the right or obligation to update the information contained in this document or derived from this document. Past or present performance is not an indicator to anticipate future performance.
21
Conference Call
Terrafina
(BMV: TERRA13) Cordially invites you to participate in its
ThirdQuarter 2019 Results
Friday, October 25, 2019 11:00 a.m. Eastern Time 10:00 a.m. Central Time
***
To access the call, please dial: from within the U.S. +1-877-407-8031
from outside the U.S. +1-201-689-8031 from Mexico (toll free) 01-800-522-0034
Audio Webcast Link: https://www.webcaster4.com/Webcast/Page/2133/31756
Conference Replay U.S. +1-877-481-4010
International (outside the US) +1-919-882-2331 Passcode: 53752

22
Appendix Appendix 1 – Revenues Terrafina’s revenues are mainly classified as rental revenues and other operating reimbursable revenues. Additionally, there are accounting revenues that must be registered according to IFRS; however, these are considered non-cash items and therefore are excluded in some calculations. Reimbursable tenant improvements are included in the tenant improvement expenses for the AFFO calculation.
Revenues
3Q19 3Q18 3Q19 3Q18
(million of pesos) (million of dollars)
NOI calculation Rental Revenue 945.8 912.0 48.7 48.0
Non Cash Accrued Income1 5.1 5.7 0.3 0.3
Other Operating Revenues 71.0 55.8 3.7 2.9
NOI calculation Reimbursable Expenses as Revenues2 57.3 48.5 3.0 2.6
AFFO calculation Reimbursable Tenant Improvements 9.3 6.7 0.5 0.4
Non Cash Other non-cash income 4.4 0.5 0.2 0.0
Net Revenue 1,022.0 973.5 52.6 51.3
NOI calculation Share of Profit from Equity Accounted Investments2 10.4 10.9 0.5 0.6
(1) Straight line rent adjustment. (2) Triple net leases expenses reimbursed to Terrafina from its tenants. (2) Profit from joint-venture developments.
Source: PGIM Real Estate - Fund Accounting
23
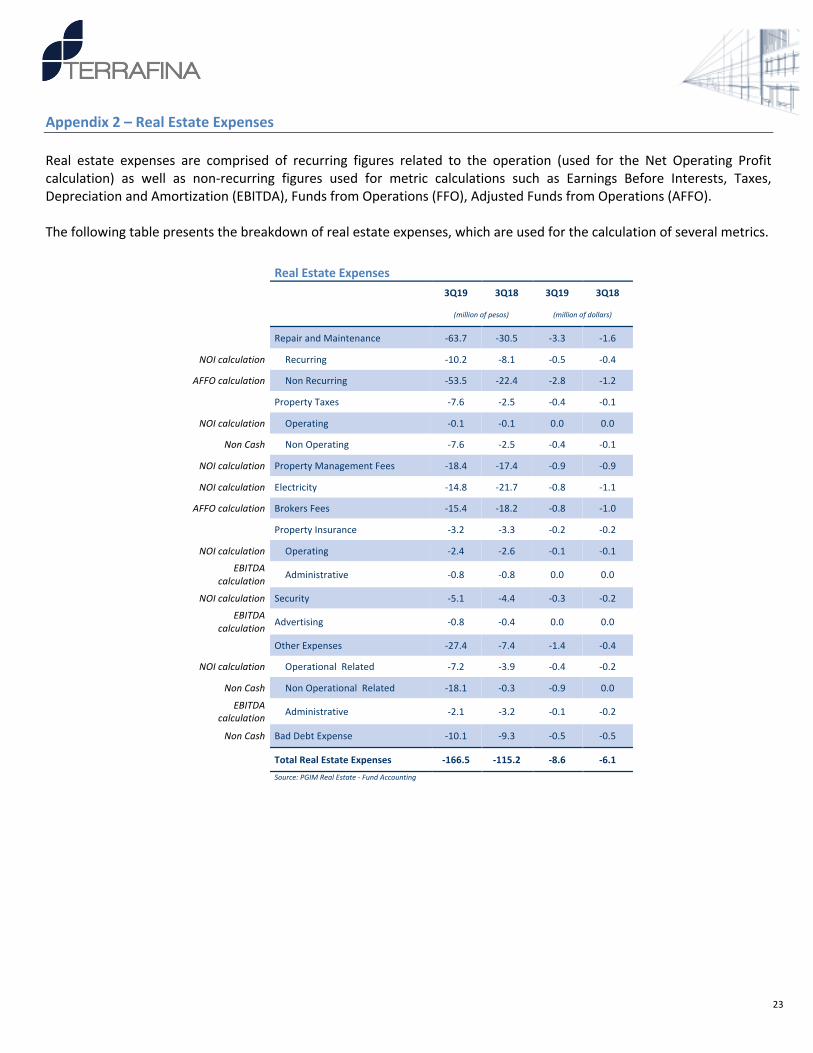
Appendix 2 – Real Estate Expenses Real estate expenses are comprised of recurring figures related to the operation (used for the Net Operating Profit calculation) as well as non-recurring figures used for metric calculations such as Earnings Before Interests, Taxes, Depreciation and Amortization (EBITDA), Funds from Operations (FFO), Adjusted Funds from Operations (AFFO). The following table presents the breakdown of real estate expenses, which are used for the calculation of several metrics.
Real Estate Expenses
3Q19 3Q18 3Q19 3Q18
(million of pesos) (million of dollars)
Repair and Maintenance -63.7 -30.5 -3.3 -1.6
NOI calculation Recurring -10.2 -8.1 -0.5 -0.4
AFFO calculation Non Recurring -53.5 -22.4 -2.8 -1.2
Property Taxes -7.6 -2.5 -0.4 -0.1
NOI calculation Operating -0.1 -0.1 0.0 0.0
Non Cash Non Operating -7.6 -2.5 -0.4 -0.1
NOI calculation Property Management Fees -18.4 -17.4 -0.9 -0.9
NOI calculation Electricity -14.8 -21.7 -0.8 -1.1
AFFO calculation Brokers Fees -15.4 -18.2 -0.8 -1.0
Property Insurance -3.2 -3.3 -0.2 -0.2
NOI calculation Operating -2.4 -2.6 -0.1 -0.1
EBITDA calculation Administrative -0.8 -0.8 0.0 0.0
NOI calculation Security -5.1 -4.4 -0.3 -0.2
EBITDA calculation Advertising -0.8 -0.4 0.0 0.0
Other Expenses -27.4 -7.4 -1.4 -0.4
NOI calculation Operational Related -7.2 -3.9 -0.4 -0.2
Non Cash Non Operational Related -18.1 -0.3 -0.9 0.0
EBITDA calculation Administrative -2.1 -3.2 -0.1 -0.2
Non Cash Bad Debt Expense -10.1 -9.3 -0.5 -0.5
Total Real Estate Expenses -166.5 -115.2 -8.6 -6.1
Source: PGIM Real Estate - Fund Accounting
24
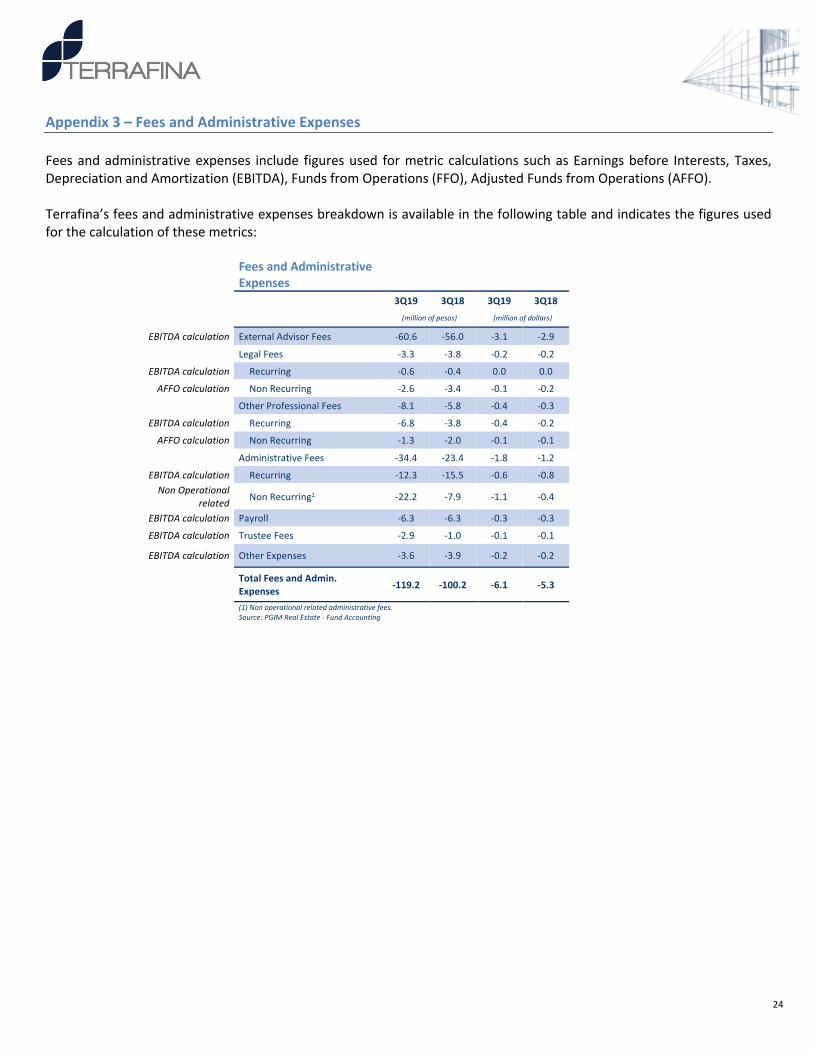
Appendix 3 – Fees and Administrative Expenses Fees and administrative expenses include figures used for metric calculations such as Earnings before Interests, Taxes, Depreciation and Amortization (EBITDA), Funds from Operations (FFO), Adjusted Funds from Operations (AFFO). Terrafina’s fees and administrative expenses breakdown is available in the following table and indicates the figures used for the calculation of these metrics:
Fees and Administrative Expenses
3Q19 3Q18 3Q19 3Q18
(million of pesos) (million of dollars)
EBITDA calculation External Advisor Fees -60.6 -56.0 -3.1 -2.9 Legal Fees -3.3 -3.8 -0.2 -0.2
EBITDA calculation Recurring -0.6 -0.4 0.0 0.0
AFFO calculation Non Recurring -2.6 -3.4 -0.1 -0.2 Other Professional Fees -8.1 -5.8 -0.4 -0.3
EBITDA calculation Recurring -6.8 -3.8 -0.4 -0.2
AFFO calculation Non Recurring -1.3 -2.0 -0.1 -0.1 Administrative Fees -34.4 -23.4 -1.8 -1.2
EBITDA calculation Recurring -12.3 -15.5 -0.6 -0.8 Non Operational
related Non Recurring1 -22.2 -7.9 -1.1 -0.4
EBITDA calculation Payroll -6.3 -6.3 -0.3 -0.3
EBITDA calculation Trustee Fees -2.9 -1.0 -0.1 -0.1
EBITDA calculation Other Expenses -3.6 -3.9 -0.2 -0.2
Total Fees and Admin. Expenses -119.2 -100.2 -6.1 -5.3
(1) Non operational related administrative fees. Source: PGIM Real Estate - Fund Accounting

25
Appendix 4 – Reconciliation
Reconciliation of Net Profit (Loss) to FFO, EBITDA and NOI 3Q19 3Q18 3Q19 3Q18 (millions of pesos) (millions of dollars)
Comprehensive Income (Loss) 2,371.5 -1,491.7 122.1 -78.6 Add (deduct) Currency Translation Adjustment:
Currency Translation Adjustment -660.1 1546.3 -34.0 81.4 Changes in the fair value adjustment on borrowings through other comprehensive income -315.1 - -16.2 -
Add (deduct) Cost of Financing Adjustment: 0.0 Non Recurring Borrowing Expenses 415.0 20.8 21.4 1.1
Add (deduct) Non-Cash Adjustment: 0.0 Foreign Exchange Adjustments 7.8 -43.0 0.4 -2.3 Realized gain (loss) on derivative financial instruments -4.2 -2.9 -0.2 -0.2 Fair Value Adjustment on Borrowings 310.5 237.5 16.0 12.5 Fair Value Adjustment on Derivative Financial Instruments 6.8 -20.2 0.4 -1.1 Fair Value Adjustment on Investment Properties -1629.3 292.6 -83.9 15.4 Gain (Loss) from Sales of Real Estate Properties 0.0 0.0 0.0 0.0
Add (deduct) Expenses Adjustment: Non Recurring Repair and Maintenance 29.9 22.4 1.5 1.2 Non Operating Property Taxes 7.6 2.5 0.4 0.1 Brokers Fees 38.7 18.2 2.0 1.0 Bad Debt Expense 10.1 9.3 0.5 0.5 Other Expenses Non Operational Related 18.1 0.3 0.9 0.0 Non Recurring Legal Fees 2.6 3.4 0.1 0.2 Non Recurring Other Professional Fees 1.3 2.0 0.1 0.1
Add (deduct) Revenues Adjustment: Accrued Income -5.1 -5.7 -0.3 -0.3 Other Non-Cash Income -4.4 -0.5 -0.2 0.0 Reimbursable Tenant Improvements -9.3 -6.7 -0.5 -0.4
Add (deduct) Non Operational Administrative Fees Non Operational Administrative Fees 22.2 7.9 1.1 0.4
FFO 614.7 592.4 31.6 31.2 Add (deduct) Cost of Financing Adjustment:
Interest Paid 245.5 237.3 12.6 12.5 Recurring Borrowing Expenses 0.0 0.0 0.0 0.0 Interest Income -1.3 -7.7 -0.1 -0.4
EBITDA 858.9 822.1 44.2 43.3 Add (deduct) Expenses Adjustment:
External Advisor Fees 60.6 56.0 3.1 2.9 Recurring Legal Fees 0.6 0.4 0.0 0.0 Recurring Other Professional Fees 6.8 3.8 0.3 0.2 Administrative Fees 12.3 15.5 0.6 0.8 Payroll 6.3 6.3 0.3 0.3 Trustee Fees 2.9 1.0 0.1 0.1 Other Expenses 3.6 3.9 0.2 0.2 Advertising 0.8 0.4 0.0 0.0 Administrative Property insurance 0.8 0.8 0.0 0.0 Other Administrative Expenses 2.1 3.2 0.1 0.2
NOI 955.7 913.3 49.2 48.1 Add (deduct) Expenses Adjustment:
Recurring Repair and Maintenance 10.2 8.1 0.5 0.4 Operating Property Taxes 0.1 0.1 0.0 0.0 Property Management Fees 18.4 17.4 0.9 0.9 Electricity 14.8 21.7 0.8 1.1 Operating Property Insurance 2.4 2.6 0.1 0.1 Security 5.1 4.4 0.3 0.2 Other Operational Expenses 7.2 3.9 0.4 0.2
Add (deduct) Revenues Adjustment: Other Non-Cash Income 4.4 0.5 0.2 0.0 Accrued Income 5.1 5.7 0.3 0.3 Reimbursable Tenant Improvements 9.3 6.7 0.5 0.4 Share of Profit from Equity Accounted Investments -10.4 -10.9 -0.5 -0.6
Net Revenue 1,022.1 973.5 52.6 51.3
26
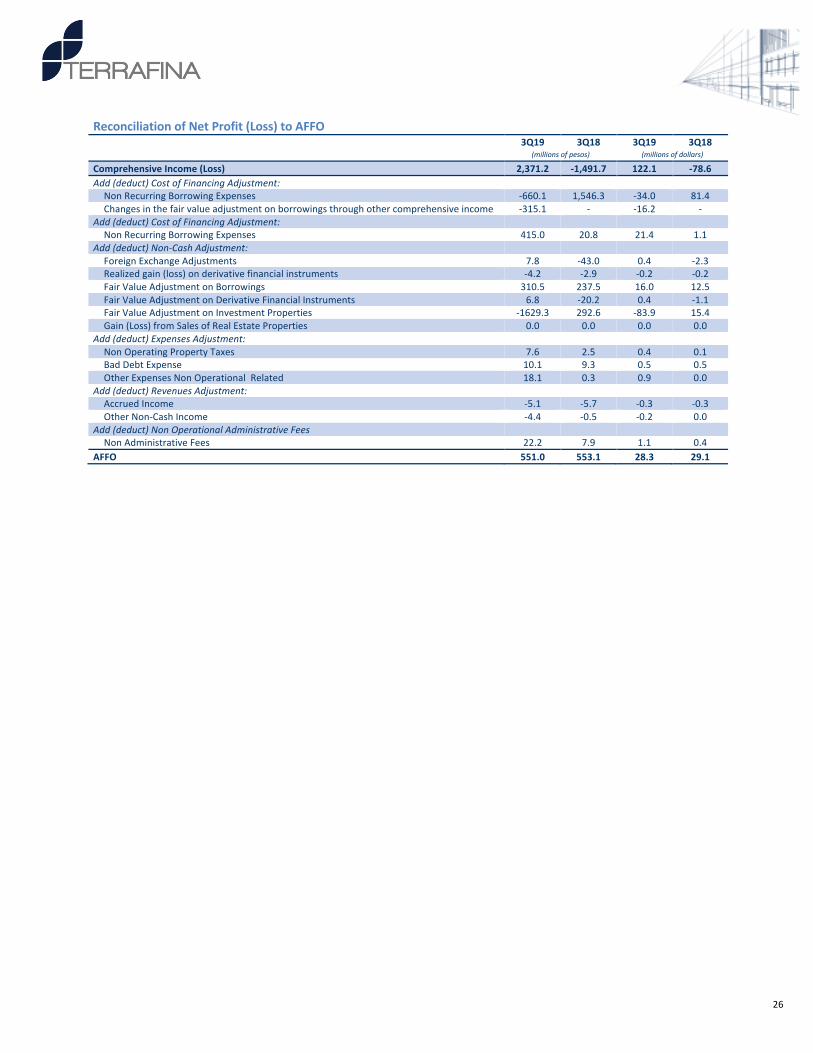
Reconciliation of Net Profit (Loss) to AFFO 3Q19 3Q18 3Q19 3Q18
(millions of pesos) (millions of dollars)
Comprehensive Income (Loss) 2,371.2 -1,491.7 122.1 -78.6 Add (deduct) Cost of Financing Adjustment:
Non Recurring Borrowing Expenses -660.1 1,546.3 -34.0 81.4 Changes in the fair value adjustment on borrowings through other comprehensive income -315.1 - -16.2 -
Add (deduct) Cost of Financing Adjustment: Non Recurring Borrowing Expenses 415.0 20.8 21.4 1.1
Add (deduct) Non-Cash Adjustment: Foreign Exchange Adjustments 7.8 -43.0 0.4 -2.3 Realized gain (loss) on derivative financial instruments -4.2 -2.9 -0.2 -0.2 Fair Value Adjustment on Borrowings 310.5 237.5 16.0 12.5 Fair Value Adjustment on Derivative Financial Instruments 6.8 -20.2 0.4 -1.1 Fair Value Adjustment on Investment Properties -1629.3 292.6 -83.9 15.4 Gain (Loss) from Sales of Real Estate Properties 0.0 0.0 0.0 0.0
Add (deduct) Expenses Adjustment: Non Operating Property Taxes 7.6 2.5 0.4 0.1 Bad Debt Expense 10.1 9.3 0.5 0.5 Other Expenses Non Operational Related 18.1 0.3 0.9 0.0
Add (deduct) Revenues Adjustment: Accrued Income -5.1 -5.7 -0.3 -0.3 Other Non-Cash Income -4.4 -0.5 -0.2 0.0
Add (deduct) Non Operational Administrative Fees Non Administrative Fees 22.2 7.9 1.1 0.4
AFFO 551.0 553.1 28.3 29.1

27
Appendix 5 - Cap Rate Calculation Terrafina subtracts cash and land reserves for the cap rate calculation. Implied cap rate and under NAV (Net Asset Value) calculation are shown in the following tables:
Implied Cap Rate
3Q19 Average Price (dollars)¹ 1.51
(x) CBFIs (million shares) 790.6
(=) Market Capitalization 1,194.2
(+) Total Liabilities 1,042.6
(-) Cash 64.9
(=) Enterprise Value 2,171.9
(-) Landbank 50.2
(=) Implied Operating Real Estate Value 2,121.7
Net Operating Income (NOI) 2019e 192.0
Implied Cap Rate 9.0%
Figures expressed in millions of dollars unless otherwise stated.
(1) Average share price of Ps.29.34; and average exchange rate of Ps. 19.43
Cap Rate Calculation with NAV
(+) Investment Properties (excluding landbank) 2,424.0
(+) Land 50.2
(+) Cash 64.9
(-) Total Liabilities 1,042.6
(=) NAV1 1,496.5
(/) CBFIs (million shares) 790.6
(=) NAV per CBFI (dollars) 1.9
CBFI Price (NAV calculation) 1.9
(x) CBFIs (million shares) 790.6
(=) Market Cap 1,496.5
(+) Total Debt and Liabilities 1,042.6
(-) Cash 64.9
(=) Enterprise Value 2,474.2
(-) Landbank 50.2
(=) Implied Operating Real Estate Value 2,424.0
Net Operating Income (NOI) 2019e 192.0
Implied Cap Rate 7.9%

28
Financial Statements
Income Statement 3Q19 3Q19
(thousands of pesos)
(thousands of dollars)
Rental revenues $950,962 $48,934
Other operating income 71,015 3,669
Real estate operating expenses -166,501 -8,579
Fees and other expenses -119,171 -6,121
Realized gain (loss) from disposal of investment properties
-
-
Net gain (loss) from fair value adjustment on investment properties
1,629,311 83,025
Net gain (loss) from fair value adjustment on borrowings
-310,451 -15,820
Net gain (loss) unrealized from fair value on derivative financial instruments
-6,751 -344
Realized gain (loss) on derivative financial instruments
4,195 220
Foreign exchange (loss) gain -7,828 -396
Operating profit 2,044,781 104,588
Finance income 1,334 70
Finance cost -660,522 -34,281
Finance cost - net -659,188 -34,211
Share of profit from equity accounted investments 10,434 532
Net Profit for the period 1,396,027 70,908
Translation gain (loss) from functional to reporting currency 660,077 -
Changes in the fair value adjustment on borrowings at fair value through other comprehensive income
315,093 -
Total Comprehensive income for the period 2,371,197 70,908
29
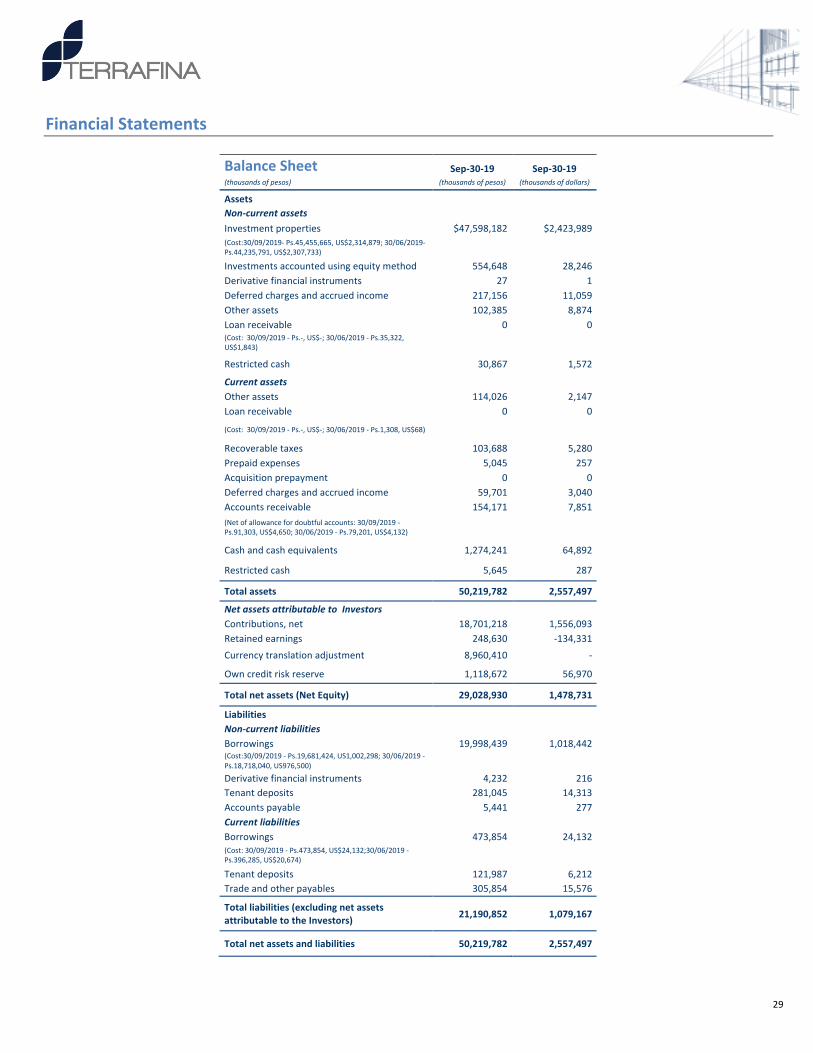
Financial Statements
Balance Sheet Sep-30-19 Sep-30-19 (thousands of pesos) (thousands of pesos) (thousands of dollars)
Assets Non-current assets Investment properties $47,598,182 $2,423,989 (Cost:30/09/2019- Ps.45,455,665, US$2,314,879; 30/06/2019- Ps.44,235,791, US$2,307,733)
Investments accounted using equity method 554,648 28,246 Derivative financial instruments 27 1 Deferred charges and accrued income 217,156 11,059 Other assets 102,385 8,874 Loan receivable 0 0 (Cost: 30/09/2019 - Ps.-, US$-; 30/06/2019 - Ps.35,322, US$1,843)
Restricted cash 30,867 1,572
Current assets Other assets 114,026 2,147 Loan receivable 0 0
(Cost: 30/09/2019 - Ps.-, US$-; 30/06/2019 - Ps.1,308, US$68) Recoverable taxes 103,688 5,280 Prepaid expenses 5,045 257 Acquisition prepayment 0 0 Deferred charges and accrued income 59,701 3,040 Accounts receivable 154,171 7,851 (Net of allowance for doubtful accounts: 30/09/2019 - Ps.91,303, US$4,650; 30/06/2019 - Ps.79,201, US$4,132)
Cash and cash equivalents 1,274,241 64,892
Restricted cash 5,645 287
Total assets 50,219,782 2,557,497
Net assets attributable to Investors Contributions, net 18,701,218 1,556,093 Retained earnings 248,630 -134,331 Currency translation adjustment 8,960,410 -
Own credit risk reserve 1,118,672 56,970
Total net assets (Net Equity) 29,028,930 1,478,731
Liabilities Non-current liabilities Borrowings 19,998,439 1,018,442 (Cost:30/09/2019 - Ps.19,681,424, US1,002,298; 30/06/2019 - Ps.18,718,040, US976,500)
Derivative financial instruments 4,232 216 Tenant deposits 281,045 14,313 Accounts payable 5,441 277 Current liabilities Borrowings 473,854 24,132 (Cost: 30/09/2019 - Ps.473,854, US$24,132;30/06/2019 - Ps.396,285, US$20,674)
Tenant deposits 121,987 6,212 Trade and other payables 305,854 15,576
Total liabilities (excluding net assets attributable to the Investors) 21,190,852 1,079,167
Total net assets and liabilities 50,219,782 2,557,497
30
Financial Statements
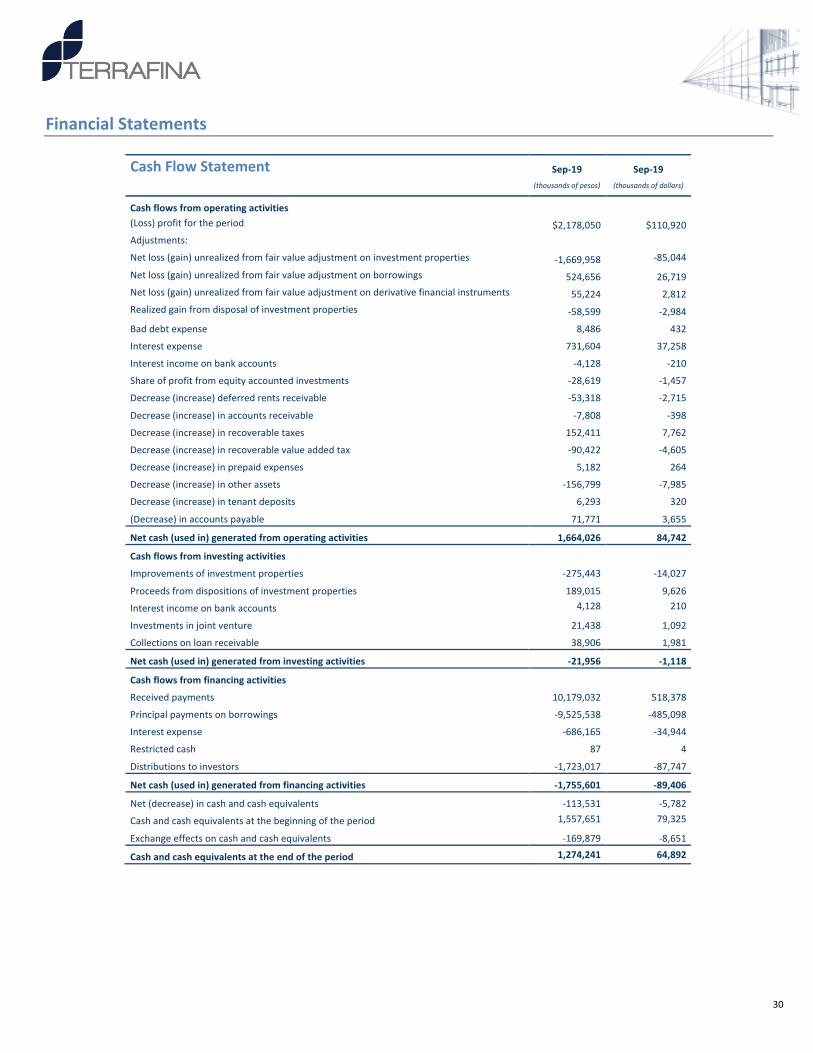
Cash Flow Statement Sep-19 Sep-19
(thousands of pesos) (thousands of dollars)
Cash flows from operating activities (Loss) profit for the period $2,178,050 $110,920 Adjustments: Net loss (gain) unrealized from fair value adjustment on investment properties -1,669,958 -85,044
Net loss (gain) unrealized from fair value adjustment on borrowings 524,656 26,719 Net loss (gain) unrealized from fair value adjustment on derivative financial instruments 55,224 2,812 Realized gain from disposal of investment properties -58,599 -2,984
Bad debt expense 8,486 432
Interest expense 731,604 37,258
Interest income on bank accounts -4,128 -210
Share of profit from equity accounted investments -28,619 -1,457
Decrease (increase) deferred rents receivable -53,318 -2,715
Decrease (increase) in accounts receivable -7,808 -398
Decrease (increase) in recoverable taxes 152,411 7,762
Decrease (increase) in recoverable value added tax -90,422 -4,605
Decrease (increase) in prepaid expenses 5,182 264
Decrease (increase) in other assets -156,799 -7,985
Decrease (increase) in tenant deposits 6,293 320
(Decrease) in accounts payable 71,771 3,655
Net cash (used in) generated from operating activities 1,664,026 84,742
Cash flows from investing activities Improvements of investment properties -275,443 -14,027
Proceeds from dispositions of investment properties 189,015 9,626
Interest income on bank accounts 4,128 210
Investments in joint venture 21,438 1,092
Collections on loan receivable 38,906 1,981
Net cash (used in) generated from investing activities -21,956 -1,118
Cash flows from financing activities Received payments 10,179,032 518,378
Principal payments on borrowings -9,525,538 -485,098
Interest expense -686,165 -34,944
Restricted cash 87 4
Distributions to investors -1,723,017 -87,747
Net cash (used in) generated from financing activities -1,755,601 -89,406
Net (decrease) in cash and cash equivalents -113,531 -5,782
Cash and cash equivalents at the beginning of the period 1,557,651 79,325
Exchange effects on cash and cash equivalents -169,879 -8,651
Cash and cash equivalents at the end of the period 1,274,241 64,892
31
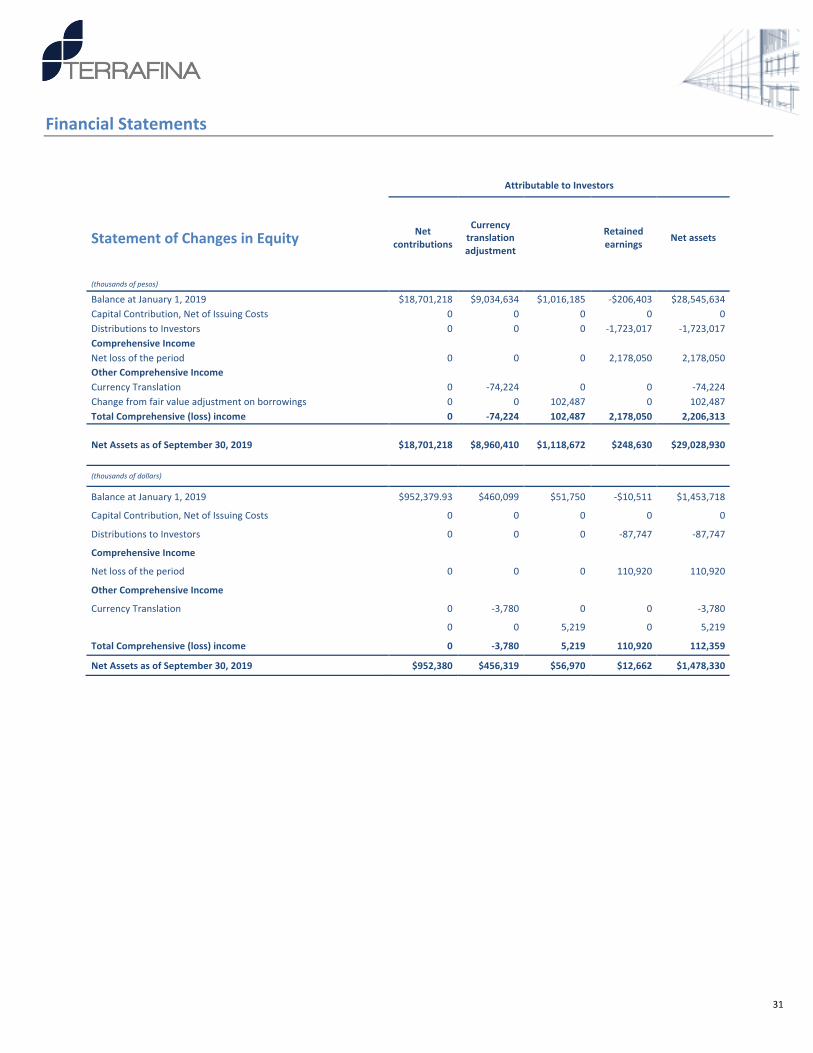
Financial Statements
Attributable to Investors
Statement of Changes in Equity Net contributions
Currency translation adjustment
Retained earnings
Net assets
(thousands of pesos) Balance at January 1, 2019 $18,701,218 $9,034,634 $1,016,185 -$206,403 $28,545,634 Capital Contribution, Net of Issuing Costs 0 0 0 0 0 Distributions to Investors 0 0 0 -1,723,017 -1,723,017 Comprehensive Income Net loss of the period 0 0 0 2,178,050 2,178,050 Other Comprehensive Income Currency Translation 0 -74,224 0 0 -74,224 Change from fair value adjustment on borrowings 0 0 102,487 0 102,487 Total Comprehensive (loss) income 0 -74,224 102,487 2,178,050 2,206,313
Net Assets as of September 30, 2019 $18,701,218 $8,960,410 $1,118,672 $248,630 $29,028,930
(thousands of dollars)
Balance at January 1, 2019 $952,379.93 $460,099 $51,750 -$10,511 $1,453,718
Capital Contribution, Net of Issuing Costs 0 0 0 0 0
Distributions to Investors 0 0 0 -87,747 -87,747
Comprehensive Income Net loss of the period 0 0 0 110,920 110,920
Other Comprehensive Income
Currency Translation 0 -3,780 0 0 -3,780 0 0 5,219 0 5,219
Total Comprehensive (loss) income 0 -3,780 5,219 110,920 112,359
Net Assets as of September 30, 2019 $952,380 $456,319 $56,970 $12,662 $1,478,330


