Third quarter 2018 Financial statements and review · Third quarter 2018 review Equinor third...
39
Third quarter 2018 Financial statements and review
Transcript of Third quarter 2018 Financial statements and review · Third quarter 2018 review Equinor third...
Third quarter 2018 Financial statements and review

Equinor third quarter 2018 2
Third quarter 2018 review
Equinor third quarter 2018 and first nine months results
Equinor reports adjusted earnings of USD 4.8 billion and USD 2.0 billion after tax in the third quarter of 2018. IFRS net operating income was USD 4.6 billion and the IFRS net income was USD 1.7 billion.
The third quarter was characterised by: • Strong results and cash flow from operations. Net debt ratio reduced to 25.7%
• Reduced organic capex guiding to around USD 10 billion, continued strong cost focus
• Value enhancing transactions to strengthen and sharpen the portfolio
“With solid operational performance and production efficiency, we delivered strong results and cash flow across all segments. We continued to strengthen our balance sheet and reduced our net debt ratio to 25.7 percent in the quarter,” says Eldar Sætre, President and CEO of Equinor ASA.
“We have achieved significant cost improvements in recent years, allowing us to capture more value from higher prices. We will continue with a strong cost focus to further strengthen our competitive position. As a result of capital discipline and efficient project execution, we are able to reduce our organic capex guiding for 2018 to around 10 billion dollars,” says Sætre.
“Project activity remains high, and we have submitted development plans for the next phases of the high value, low carbon Johan Sverdrup and Troll fields. In October we announced the acquisition of a 40% operated interest in the Rosebank field in the UK and the divestments of two non-core assets in Norway. We also continue to develop our portfolio within renewable energy. The Apodi solar project in Brazil is on track, and we delivered first electricity from the Arkona offshore wind project in Germany,” says Sætre.
Adjusted earnings [5] were USD 4.8 billion in the third quarter, up from USD 2.3 billion in the same period in 2017. Adjusted earnings after tax [5] were USD 2.0 billion in the third quarter, up from USD 0.8 billion in the same period last year. Higher prices for both liquids and gas, coupled with high production, contributed to the increase. Adjusted for new fields in production and portfolio changes, underlying operating costs and administrative expenses per barrel are up slightly compared to the same quarter last year, mainly due to increased turnarounds and preparation for start-up of new fields.
IFRS net operating income was USD 4.6 billion in the third quarter compared to USD 1.1 billion in the same period of 2017. IFRS net income was USD 1.7 billion, up from negative USD 0.5 billion in the third quarter of 2017.
Equinor delivered total equity production of 2,066 mboe per day in the third quarter, an increase of 1% [7] from 2,045 mboe per day in the same period in 2017. The increase was primarily due to start-up of new fields, portfolio changes and additional wells coming on stream, partially offset by high maintenance.
As of third quarter 2018, Equinor had completed 15 exploration wells with seven commercial discoveries. The appraisal of the Cape Vulture discovery confirmed the doubling of the remaining reserves at Norne, extending the life and value of the field. Adjusted exploration expenses [5] in the quarter were USD 239 million, down from USD 416 million in the same quarter of 2017, mainly due to a higher capitalisation rate and lower drilling activity.
Cash flows provided by operating activities before tax amounted to USD 20.4 billion in the first nine months of 2018 compared to USD 15.2 billion for the same period last year. Organic capital expenditure [5] was USD 7.2 billion for the first nine months of 2018. At the end of the quarter, net debt to capital employed [5] was reduced from 27.2% to 25.7%.
The board of directors has decided to maintain a dividend of USD 0.23 per share for the third quarter.
The twelve-month average Serious Incident Frequency (SIF) was 0.5 for the twelve months ending 30 September 2018, compared to 0.7 in the same period a year ago.

Equinor third quarter 2018 3
Third quarter 2018 review
Quarters Change First nine months Q3 2018 Q2 2018 Q3 2017 Q3 on Q3 (in USD million, unless stated otherwise) 2018 2017 Change
4,597 3,835 1,095 >100% Net operating income 13,392 8,588 56%
4,843 4,314 2,346 >100% Adjusted earnings [5] 13,571 8,682 56%
1,666 1,220 (478) N/A Net income 4,171 2,022 >100%
1,988 1,695 819 >100% Adjusted earnings after tax [5] 5,156 3,222 60%
2,066 2,028 2,045 1% Total equity liquids and gas production (mboe per day) [4] 2,091 2,062 1%
67.6 65.8 47.0 44% Group average liquids price (USD/bbl) [1] 64.6 46.8 38%
GROUP REVIEW
Third quarter 2018
Total equity liquids and gas production [4] was 2,066 mboe per day in the third quarter of 2018, up 1% compared to 2,045 mboe per day in the third quarter of 2017 mainly due to start-up of new fields, portfolio changes and additional wells coming on stream especially in the US onshore business. Expected natural decline and higher turnaround activity partially offset the increase. Total entitlement liquids and gas production [3] was slightly up 1% to 1,895 mboe per day in the third quarter of 2018 compared to 1,883 mboe per day in the third quarter of 2017. The increase was due to the same reasons as described above, partially offset by negative effects from production sharing agreements (PSA) [4] and US royalties [4] primarily due to higher prices in the third quarter of 2018. The effects from PSA and US royalties were 171 mboe per day in total in the third quarter of 2018 compared to 162 mboe per day in the third quarter of 2017.
Quarters Change Condensed income statement under IFRS First nine months
Q3 2018 Q2 2018 Q3 2017 Q3 on Q3 (unaudited, in USD million) 2018 2017 Change
19,136 18,135 13,609 41% Total revenues and other income 57,155 44,073 30%
(9,486) (9,415) (6,475) 46% Purchases [net of inventory variation] (28,695) (19,798) 45%
(2,493) (2,579) (2,216) 13% Operating and administrative expenses (7,586) (7,068) 7%
(2,321) (1,830) (3,096) (25%) Depreciation, amortisation and net impairment losses (6,519) (7,352) (11%)
(239) (475) (727) (67%) Exploration expenses (963) (1,266) (24%)
4,597 3,835 1,095 >100% Net operating income 13,392 8,588 56%
1,666 1,220 (478) N/A Net income 4,171 2,022 >100%
Net operating income was USD 4,597 million in the third quarter of 2018, compared to USD 1,095 million in the third quarter of 2017. The significant increase was primarily due to higher liquids and gas prices, increased gas volumes, and a net reversal of impairments compared to a net impairment charge in the same period in 2017. Reduced depreciation and exploration expenses added to the increase in net operating income. The increase was partially offset by changes in unrealised fair value of derivatives and inventory hedge contracts in addition to increased operating and administrative expenses.
In the third quarter of 2018, net operating income was negatively impacted by changes in unrealised fair value of derivatives and inventory hedge contracts of USD 450 million and positively affected by net reversal of impairments of USD 89 million.
In the third quarter of 2017, net operating income was negatively impacted by net impairment charges of USD 830 million mainly related to an unconventional onshore asset in North America, and changes in fair value of derivatives and inventory hedge contracts of USD 525 million.
For more information about net impairment reversals, see note 2 Segments to the Condensed interim financial statements. For adjustments to net operating income, see Use and reconciliation of non-GAAP financial measures in the Supplementary disclosures.

Equinor third quarter 2018 4
Third quarter 2018 review
Quarters Change Adjusted earnings First nine months Q3 2018 Q2 2018 Q3 2017 Q3 on Q3 (in USD million) 2018 2017 Change
19,481 18,688 14,092 38% Adjusted total revenues and other income 57,577 43,327 33%
(9,516) (9,327) (6,515) 46% Adjusted purchases [6] (28,703) (19,862) 45%
(2,471) (2,467) (2,238) 10% Adjusted operating and administrative expenses (7,468) (6,675) 12%
(2,410) (2,346) (2,577) (6%) Adjusted depreciation expenses (7,124) (7,266) (2%)
(239) (234) (416) (42%) Adjusted exploration expenses (712) (842) (15%)
4,843 4,314 2,346 >100% Adjusted earnings [5] 13,571 8,682 56%
1,988 1,695 819 >100% Adjusted earnings after tax [5] 5,156 3,222 60%
Adjusted operating and administrative expenses were USD 2,471 million in the third quarter of 2018, an increase of USD 233 million compared to the third quarter of 2017. The increase was mainly driven by acquired fields, increased royalties and production fees due to higher prices and volumes, and higher operation and maintenance activity. The NOK/USD exchange rate development partially offset the increase.
Adjusted depreciation expenses were USD 2,410 million in the third quarter of 2018, compared to USD 2,577 million in the third quarter of 2017. The 6% decrease was mainly related to higher reserves estimates, partially offset by increased production from new fields and additional wells coming on stream.
Adjusted exploration expenses were USD 239 million in the third quarter of 2018, a decrease of USD 177 million compared to the third quarter of 2017, mainly due to a higher capitalisation rate and lower drilling activity.
After total adjustments1 of net USD 247 million to net operating income and the above-mentioned factors, Adjusted earnings [5] were USD 4,843 million in the third quarter of 2018, up from USD 2,346 million in the third quarter of 2017.
Adjusted earnings after tax [5] were USD 1,988 million in the third quarter of 2018, which reflects an effective tax rate on adjusted earnings of 59.0%, compared to 65.1% in the third quarter of 2017. The decrease in effective tax rate was mainly due to increased adjusted earnings in the third quarter of 2018 in entities with lower than average tax rates, or in entities with unrecognised deferred tax assets.
Cash flows provided by operating activities increased by USD 2,104 million compared to the third quarter of 2017. The increase was mainly due to increased liquids and gas prices, partially offset by increased tax payments and a change in working capital.
Cash flows used in investing activities increased by USD 4,656 million compared to the third quarter of 2017. The increase was mainly due to increased financial investments and increased capital expenditures, partially offset by decreased payments related to derivatives.
Cash flows used in financing activities decreased by USD 208 million compared to the third quarter of 2017. The decrease was mainly due to repayment of finance debt in the third quarter of 2017 and a bond issue in the third quarter of 2018, partially offset by increased collateral payments related to derivatives and increased dividend paid.
Total cash flows decreased by USD 2,344 million compared to the third quarter of 2017.
Free cash flow [5] in the third quarter of 2018 was USD 1,637 million, an increase of USD 1,545 million compared to the third quarter of 2017. The increase was mainly due to higher liquids and gas prices, partially offset by increased capital expenditures, dividend paid and tax payments.
1 For adjustments to net operating income, see Use and reconciliation of non-GAAP financial measures in the Supplementary disclosures.
Equinor third quarter 2018 5
Third quarter 2018 review
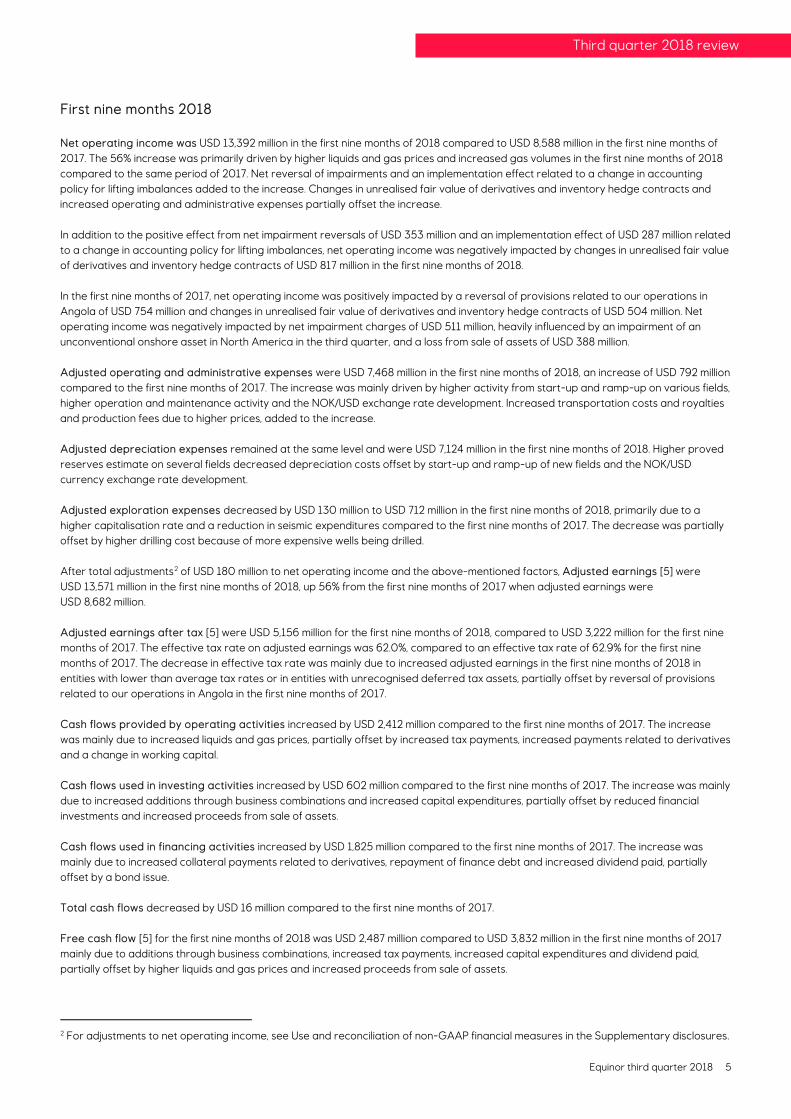
First nine months 2018 Net operating income was USD 13,392 million in the first nine months of 2018 compared to USD 8,588 million in the first nine months of 2017. The 56% increase was primarily driven by higher liquids and gas prices and increased gas volumes in the first nine months of 2018 compared to the same period of 2017. Net reversal of impairments and an implementation effect related to a change in accounting policy for lifting imbalances added to the increase. Changes in unrealised fair value of derivatives and inventory hedge contracts and increased operating and administrative expenses partially offset the increase.
In addition to the positive effect from net impairment reversals of USD 353 million and an implementation effect of USD 287 million related to a change in accounting policy for lifting imbalances, net operating income was negatively impacted by changes in unrealised fair value of derivatives and inventory hedge contracts of USD 817 million in the first nine months of 2018.
In the first nine months of 2017, net operating income was positively impacted by a reversal of provisions related to our operations in Angola of USD 754 million and changes in unrealised fair value of derivatives and inventory hedge contracts of USD 504 million. Net operating income was negatively impacted by net impairment charges of USD 511 million, heavily influenced by an impairment of an unconventional onshore asset in North America in the third quarter, and a loss from sale of assets of USD 388 million.
Adjusted operating and administrative expenses were USD 7,468 million in the first nine months of 2018, an increase of USD 792 million compared to the first nine months of 2017. The increase was mainly driven by higher activity from start-up and ramp-up on various fields, higher operation and maintenance activity and the NOK/USD exchange rate development. Increased transportation costs and royalties and production fees due to higher prices, added to the increase.
Adjusted depreciation expenses remained at the same level and were USD 7,124 million in the first nine months of 2018. Higher proved reserves estimate on several fields decreased depreciation costs offset by start-up and ramp-up of new fields and the NOK/USD currency exchange rate development.
Adjusted exploration expenses decreased by USD 130 million to USD 712 million in the first nine months of 2018, primarily due to a higher capitalisation rate and a reduction in seismic expenditures compared to the first nine months of 2017. The decrease was partially offset by higher drilling cost because of more expensive wells being drilled.
After total adjustments2 of USD 180 million to net operating income and the above-mentioned factors, Adjusted earnings [5] were USD 13,571 million in the first nine months of 2018, up 56% from the first nine months of 2017 when adjusted earnings were USD 8,682 million.
Adjusted earnings after tax [5] were USD 5,156 million for the first nine months of 2018, compared to USD 3,222 million for the first nine months of 2017. The effective tax rate on adjusted earnings was 62.0%, compared to an effective tax rate of 62.9% for the first nine months of 2017. The decrease in effective tax rate was mainly due to increased adjusted earnings in the first nine months of 2018 in entities with lower than average tax rates or in entities with unrecognised deferred tax assets, partially offset by reversal of provisions related to our operations in Angola in the first nine months of 2017.
Cash flows provided by operating activities increased by USD 2,412 million compared to the first nine months of 2017. The increase was mainly due to increased liquids and gas prices, partially offset by increased tax payments, increased payments related to derivatives and a change in working capital.
Cash flows used in investing activities increased by USD 602 million compared to the first nine months of 2017. The increase was mainly due to increased additions through business combinations and increased capital expenditures, partially offset by reduced financial investments and increased proceeds from sale of assets.
Cash flows used in financing activities increased by USD 1,825 million compared to the first nine months of 2017. The increase was mainly due to increased collateral payments related to derivatives, repayment of finance debt and increased dividend paid, partially offset by a bond issue.
Total cash flows decreased by USD 16 million compared to the first nine months of 2017.
Free cash flow [5] for the first nine months of 2018 was USD 2,487 million compared to USD 3,832 million in the first nine months of 2017 mainly due to additions through business combinations, increased tax payments, increased capital expenditures and dividend paid, partially offset by higher liquids and gas prices and increased proceeds from sale of assets.
2 For adjustments to net operating income, see Use and reconciliation of non-GAAP financial measures in the Supplementary disclosures.

Equinor third quarter 2018 6
Third quarter 2018 review
OUTLOOK • Organic capital expenditures [5] for 2018 are estimated at around USD 10 billion • Equinor intends to continue to mature its large portfolio of exploration assets and estimates a total exploration activity level of
around USD 1.5 billion for 2018, excluding signature bonuses • Equinor’s ambition is to keep the unit of production cost in the top quartile of its peer group • For the period 2017 – 2020, production growth [7] is expected to come from new projects resulting in around 3-4% CAGR
(Compound Annual Growth Rate) • Production [7] for 2018 is estimated to be 1-2% above the 2017 level • Scheduled maintenance activity is estimated to reduce quarterly production by approximately 10 mboe per day in the fourth
quarter of 2018. In total, maintenance is estimated to reduce equity production by around 35 mboe per day for the full year of 2018
These forward-looking statements reflect current views about future events and are, by their nature, subject to significant risks and uncertainties because they relate to events and depend on circumstances that will occur in the future. Deferral of production to create future value, gas off-take, timing of new capacity coming on stream, operational regularity, activity level in the US onshore, as well as uncertainty around the closing of the announced transactions represent the most significant risks related to the foregoing production guidance. For further information, see section Forward-Looking Statements.

Equinor third quarter 2018 7
Third quarter 2018 review
EXPLORATION & PRODUCTION NORWAY
Third quarter 2018 review Average daily production of liquids and gas reduced by 6% to 1,235 mboe per day in the third quarter of 2018, compared to 1,316 mboe per day in the third quarter of 2017. The decrease was mainly due to higher turnaround activity and expected natural decline, partially offset by positive contributions from new wells.
Net operating income was USD 3,393 million in the third quarter of 2018 compared to USD 2,060 million in the third quarter of 2017. The increase was mainly due to higher liquids prices and gas transfer prices. In the third quarter of 2017, net impairment reversal of USD 204 million positively impacted net operating income, partially offset by a reduction in the fair value of derivatives of USD 151 million. Adjusted operating and administrative expenses increased mainly due to preparation for operation, new fields on stream and transportation costs, partially offset by the NOK/USD exchange rate development. Adjusted depreciation expenses decreased mainly due to reduced field specific production and the NOK/USD exchange rate development. Adjusted exploration expenses slightly decreased.
Due to the above-mentioned factors, Adjusted earnings [5] were USD 3,393 million in the third quarter of 2018, increased by 68% from USD 2,015 million in the third quarter of 2017.
Quarters Change Adjusted earnings First nine months
Q3 2018 Q2 2018 Q3 2017 Q3 on Q3 (in USD million) 2018 2017 Change
5,465 5,157 4,219 30% Adjusted total revenues and other income 16,180 12,487 30%
(781) (842) (754) 4% Adjusted operating and administrative expenses (2,416) (2,117) 14%
(1,196) (1,210) (1,351) (11%) Adjusted depreciation expenses (3,702) (3,534) 5%
(94) (57) (98) (4%) Adjusted exploration expenses (247) (265) (7%)
3,393 3,050 2,015 68% Adjusted earnings [5] 9,815 6,571 49%
For comparable IFRS figures, see note 2 Segments to the Condensed interim financial statements. For adjustments to net operating income, see Use and reconciliation of non-GAAP financial measures in the Supplementary disclosures.
First nine months 2018
Net operating income for Exploration & Production Norway was USD 10,670 million in the first nine months of 2018 compared to USD 7,274 million in the first nine months of 2017. The increase was primarily driven by higher liquids prices and gas transfer price, partially offset by reduced volumes.
In the first nine months of 2018, net operating income was positively impacted by net impairment reversals of USD 597 million and the implementation effect of USD 216 million related to a change in accounting policy for lifting imbalances. In the first nine months of 2017, net impairments reversal of USD 637 million positively impacted net operating income.
Adjusted total revenues and other income increased by 30% compared to the first nine months of 2017, mainly due to increased liquids prices and gas transfer price partially offset by reduced volume. Adjusted operating and administrative expenses increased mainly due to the NOK/USD exchange rate development, transportation costs and new fields on stream. Adjusted depreciation expenses increased mainly due to new fields coming on stream and the NOK/USD exchange rate development, partially offset by changes in reserves. Adjusted exploration expenses decreased mainly due to lower purchase of seismic partially offset by higher expensed well cost.
After total adjustments of USD 855 million to net operating income and the above-mentioned factors, Adjusted earnings [5] were USD 9,815 million in the first nine months of 2018, up 49% from the first nine months of 2017 when adjusted earnings were USD 6,571 million.

Equinor third quarter 2018 8
Third quarter 2018 review
EXPLORATION & PRODUCTION INTERNATIONAL
Third quarter 2018 review Average equity production of liquids and gas increased by 14% to 831 mboe per day in the third quarter of 2018 compared to 729 mboe per day in the third quarter of 2017. The increase was primarily driven by new fields in Brazil and offshore North America, and new wells in the US onshore, partially offset by expected natural decline.
Average daily entitlement production of liquids and gas increased by 16% to 660 mboe per day in the third quarter of 2018 compared to 567 mboe per day in the third quarter of 2017. The increase was due to the same reasons as above, and partially offset by effects from production sharing agreements (PSA) [4] and US royalties [4] primarily due to higher prices in the third quarter of 2018. The effects from PSA and US royalties were 171 mboe per day in the third quarter of 2018 compared to 162 mboe per day in the third quarter of 2017.
Net operating income was USD 1,078 million in the third quarter of 2018 compared to negative USD 1,017 million in the third quarter of 2017. The positive development was caused by increased revenues due to higher realised liquids and gas prices combined with higher entitlement production. In addition, the third quarter 2017 results were impacted by net impairments of USD 1,034 million. Lower exploration expenses and net impairment reversal of USD 89 million in the third quarter of 2018 contributed to improve the result. The increase was partially offset by higher operating and administrative expenses. Adjusted operating and administrative expenses increased due to acquired fields, higher operation and maintenance activity, and increased royalties and transportation costs driven by volume growth and higher liquids prices. In addition, change effects in the third quarter of 2017 from future asset retirement costs added to the increase. Adjusted depreciation expenses decreased mainly due to higher reserves estimates. Adjusted exploration expenses decreased mainly due to lower drilling activity and higher capitalisation rate. After total adjustments of negative USD 85 million to net operating income and the above-mentioned factors, Adjusted earnings [5] were USD 994 million in the third quarter of 2018, up from negative USD 27 million in the third quarter of 2017.
Quarters Change Adjusted earnings First nine months Q3 2018 Q2 2018 Q3 2017 Q3 on Q3 (in USD million) 2018 2017 Change
3,055 2,936 2,003 52% Adjusted total revenues and other income 8,439 6,969 21%
(811) (701) (581) 39% Adjusted operating and administrative expenses (2,217) (1,829) 21%
(1,105) (1,028) (1,131) (2%) Adjusted depreciation expenses (3,096) (3,441) (10%)
(145) (178) (318) (54%) Adjusted exploration expenses (465) (577) (19%)
994 1,030 (27) N/A Adjusted earnings [5] 2,661 1,121 >100%
For comparable IFRS figures, see note 2 Segments to the Condensed interim financial statements. For adjustments to net operating income, see Use and reconciliation of non-GAAP financial measures in the Supplementary disclosures.
First nine months 2018 Net operating income for E&P International was USD 2,345 million in the first nine months of 2018, compared to negative USD 413 million in the first nine months of 2017. The increase was driven by higher liquids and gas prices, lower net impairments, reduced depreciation and exploration expenses, and higher entitlement production. A reversal of provisions related to operations in Angola of USD 754 million in the first nine months of 2017 added to the increase. Higher operating and administrative expenses also contributed to offset the increase. In the first nine months of 2018, net operating income was negatively impacted by net impairments of USD 399 million mainly related to North American assets. In the first nine months of 2017, net operating income was impacted by net impairments of USD 1,147 million and net loss from sale of assets of USD 386 million.
Adjusted operating and administrative expenses increased primarily due to higher operation and maintenance activity, and increased royalties and transportation costs driven by volume growth and higher liquids prices. Negative effects from future asset retirement costs added to the increase. Adjusted depreciation expenses decreased mainly due to higher reserve estimates. Adjusted exploration expenses decreased mainly due to a higher capitalisation rate and lower expensed exploration cost capitalised in previous years. After total adjustments of net USD 316 million to net operating income and the above-mentioned factors, Adjusted earnings [5] were USD 2,661 million in the first nine months of 2018, up from USD 1,121 million in the first nine months of 2017.

Equinor third quarter 2018 9
Third quarter 2018 review
MARKETING, MIDSTREAM & PROCESSING
Third quarter 2018 review Natural gas sales volumes amounted to 14.1 billion standard cubic meters (bcm) in the third quarter of 2018, up 0.1 bcm compared to third quarter of 2017. Of the total gas sales in third quarter of 2018, entitlement gas was 12.8 bcm, slightly up from the third quarter of 2017. The increase was related to US entitlement volumes, offset by a decrease in Norwegian continental shelf entitlement volumes.
Average invoiced European natural gas sales price [8] increased by 33% in the third quarter of 2018 compared to the third quarter of 2017 mainly due to higher crude prices, tight supply due to infrastructure maintenance, higher gas-to-power demand for the winter and strong demand for LNG. Average invoiced North American piped gas sales price [8] increased by 15% in the same period mainly due to higher sales area prices as the pipeline capacity increased.
Net operating income was USD 157 million in the third quarter of 2018 compared to USD 178 million in the third quarter of 2017. The decrease was mainly related to unrealised derivatives loss and periodisation of inventory hedging effect totalling negative USD 446 million in third quarter of 2018 compared to negative USD 352 million in the third quarter of 2017, in addition to lower processing margins in the third quarter of 2018. Lower operational storage effects in third quarter of 2018 of USD 38 million compared to USD 107 million in third quarter of 2017 added to the decrease. Gain from divestment of shares of USD 105 million and increased LNG result in the third quarter of 2018 partially offset the decrease.
Adjusted purchases [6] increased due to higher prices for both liquids products and gas. Adjusted operating and administrative expenses increased mainly due to increased transportation costs for liquids and gas. A new processing asset compared to third quarter of 2017 added to the increase. Adjusted depreciations expenses increased mainly due to the new processing asset.
After total adjustments of USD 324 million to net operating income, Adjusted earnings [5] were USD 481 million in the third quarter of 2018, compared to USD 423 million in the third quarter of 2017. The increase was mainly due to improved results from European gas and LNG sales. The increase was to a large extent offset by lower processing margins and lower liquids trading result.
Quarters Change Adjusted earnings First nine months Q3 2018 Q2 2018 Q3 2017 Q3 on Q3 (in USD million) 2018 2017 Change
19,058 18,193 13,816 38% Adjusted total revenues and other income 56,238 41,686 35%
(17,467) (16,767) (12,367) 41% Adjusted purchases [6] (51,619) (37,395) 38%
(1,018) (1,033) (950) 7% Adjusted operating and administrative expenses (3,109) (2,858) 9%
(92) (90) (75) 22% Adjusted depreciation expenses (273) (218) 25%
481 302 423 14% Adjusted earnings [5] 1,237 1,216 2%
For comparable IFRS figures, see note 2 Segments to the Condensed interim financial statements. For adjustments to net operating income, see Use and reconciliation of non-GAAP financial measures in the Supplementary disclosures.
First nine months 2018
Net operating income for MMP was USD 651 million in the first nine months of 2018 compared to USD 1,900 million in the first nine months of 2017. The decrease was mainly due to unrealised derivatives loss and periodisation of inventory hedging effect in the first nine months of 2018 totalling negative USD 869 million, compared to positive USD 641 million in the first nine months of 2017. The decrease was partially offset by improved LNG results and reversal of impairment charges of USD 155 million in the first nine months of 2018
Adjusted total revenues and other income as well as adjusted purchases increased, primarily driven by the increased prices for liquids products and for gas from the NCS. Adjusted operating and administrative expenses increased mainly due to increased transportation costs both related to gas globally and higher liquids volumes, in addition to higher operation and maintenance activity related to refineries. The development in NOK/USD exchange rate added to the increase. Adjusted depreciations expenses increased mainly due to a new processing asset.
After total adjustments of USD 587 million, Adjusted earnings [5] were USD 1,237 million in the first nine months of 2018, an increase of 2% from the first nine months of 2017 when adjusted earnings were USD 1,216 million. The increase was mainly due to improved results from European and US gas in addition to LNG sales. The increase was to a large extent offset by lower processing margins and lower liquids trading result.

Equinor third quarter 2018 10
Condensed interim financial statement and notes
CONDENSED INTERIM FINANCIAL STATEMENTS
Third quarter 2018
CONSOLIDATED STATEMENT OF INCOME
Quarters First nine months Full year Q3 2018 Q2 2018 Q3 2017 (unaudited, in USD million) 2018 2017 2017
18,989 18,069 13,531 Revenues 56,834 43,861 60,971
42 13 68 Net income/(loss) from equity accounted investments 156 191 188
105 54 11 Other income 166 20 27
19,136 18,135 13,609 Total revenues and other income 57,155 44,073 61,187
(9,486) (9,415) (6,475) Purchases [net of inventory variation] (28,695) (19,798) (28,212)
(2,306) (2,397) (2,028) Operating expenses (7,018) (6,493) (8,763)
(187) (182) (188) Selling, general and administrative expenses (568) (575) (738)
(2,321) (1,830) (3,096) Depreciation, amortisation and net impairment losses (6,519) (7,352) (8,644)
(239) (475) (727) Exploration expenses (963) (1,266) (1,059)
4,597 3,835 1,095 Net operating income/(loss) 13,392 8,588 13,771
(348) (317) (150) Net financial items (1,085) (312) (351)
4,249 3,518 944 Income/(loss) before tax 12,307 8,276 13,420
(2,583) (2,298) (1,422) Income tax (8,136) (6,254) (8,822)
1,666 1,220 (478) Net income/(loss) 4,171 2,022 4,598
1,665 1,219 (480) Attributable to equity holders of the company 4,169 2,015 4,590
0 1 3 Attributable to non-controlling interests 2 7 8
0.50 0.37 (0.15) Basic earnings per share (in USD) 1.25 0.62 1.40
0.50 0.37 (0.15) Diluted earnings per share (in USD) 1.25 0.62 1.40
3,329 3,330 3,279 Weighted average number of ordinary shares outstanding (in millions) 3,325 3,258 3,268
See note 9 Changes in accounting policies.

Equinor third quarter 2018 11
Condensed interim financial statement and notes
CONSOLIDATED STATEMENT OF COMPREHENSIVE INCOME
Quarters First nine months Full year Q3 2018 Q2 2018 Q3 2017 (unaudited, in USD million) 2018 2017 2017
1,666 1,220 (478) Net income/(loss) 4,171 2,022 4,598
54 194 (111) Actuarial gains/(losses) on defined benefit pension plans 22 (72) 172
(13) (48) 32 Income tax effect on income and expenses recognised in OCI1) (4) 24 (38)
41 146 (79) Items that will not be reclassified to the Consolidated statement of income 19 (49) 134
(43) (1,396) 1,275 Currency translation adjustments (220) 2,379 1,710
0 0 0 Net gains/(losses) from available for sale financial assets 64 (48) (64)
(5) (1) (4) Share of OCI from equity accounted investments (11) (13) (40)
(48) (1,398) 1,271 Items that may be subsequently reclassified to the Consolidated statement of income (167) 2,317 1,607
(6) (1,252) 1,191 Other comprehensive income/(loss) (148) 2,269 1,741
1,659 (31) 714 Total comprehensive income/(loss) 4,024 4,291 6,339
1,659 (33) 711 Attributable to the equity holders of the company 4,021 4,284 6,331
0 1 3 Attributable to non-controlling interests 2 7 8
1) Other comprehensive income (OCI).

Equinor third quarter 2018 12
Condensed interim financial statement and notes
CONSOLIDATED BALANCE SHEET
At 30 September At 30 June At 31 December At 30 September (unaudited, in USD million) 2018 2018 2017 2017
ASSETS
Property, plant and equipment 67,384 67,498 63,637 62,334
Intangible assets 9,880 9,798 8,621 8,999
Equity accounted investments 2,801 2,670 2,551 2,426
Deferred tax assets 2,688 2,655 2,441 2,341
Pension assets 1,158 1,177 1,306 957
Derivative financial instruments 1,003 1,112 1,603 1,931
Financial investments 2,609 2,679 2,841 2,946
Prepayments and financial receivables 1,281 1,328 912 893
Total non-current assets 88,804 88,918 83,911 82,827
Inventories 3,449 3,426 3,398 2,951
Trade and other receivables 10,000 9,566 9,425 7,218
Derivative financial instruments 249 366 159 202
Financial investments 8,623 6,024 8,448 11,581
Cash and cash equivalents 4,919 6,078 4,390 6,336
Total current assets 27,239 25,460 25,820 28,289
Assets classified as held for sale 0 0 1,369 0
Total assets 116,043 114,378 111,100 111,116
EQUITY AND LIABILITIES
Shareholders' equity 41,907 41,019 39,861 38,204
Non-controlling interests 23 25 24 28
Total equity 41,930 41,043 39,885 38,233
Finance debt 24,173 23,852 24,183 27,041
Deferred tax liabilities 8,341 8,393 7,654 7,979
Pension liabilities 3,997 3,984 3,904 3,725
Provisions 16,540 16,500 15,557 14,790
Derivative financial instruments 1,061 1,023 900 934
Total non-current liabilities 54,113 53,752 52,198 54,468
Trade, other payables and provisions 10,154 9,883 9,736 8,818
Current tax payable 6,189 5,519 4,057 4,352
Finance debt 1,823 2,611 4,091 4,214
Dividends payable 766 766 729 725
Derivative financial instruments 1,068 805 403 307
Total current liabilities 20,000 19,583 19,016 18,416
Total liabilities 74,113 73,335 71,213 72,884
Total equity and liabilities 116,043 114,378 111,100 111,116
Equinor third quarter 2018 13
Condensed interim financial statement and notes
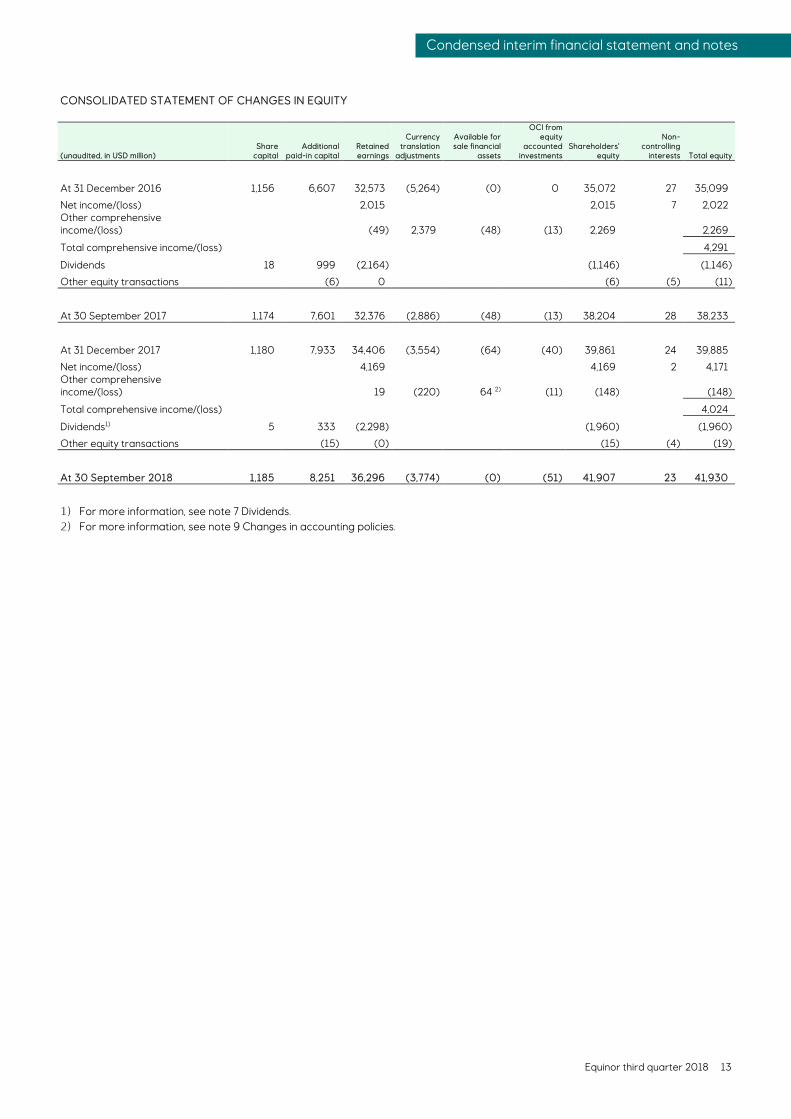
CONSOLIDATED STATEMENT OF CHANGES IN EQUITY
(unaudited, in USD million) Share
capital Additional
paid-in capital Retained earnings
Currency translation
adjustments
Available for sale financial
assets
OCI from equity
accounted investments
Shareholders' equity
Non-controlling
interests Total equity
At 31 December 2016 1,156 6,607 32,573 (5,264) (0) 0 35,072 27 35,099
Net income/(loss) 2,015 2,015 7 2,022 Other comprehensive income/(loss) (49) 2,379 (48) (13) 2,269 2,269
Total comprehensive income/(loss) 4,291
Dividends 18 999 (2,164) (1,146) (1,146)
Other equity transactions (6) 0 (6) (5) (11)
At 30 September 2017 1,174 7,601 32,376 (2,886) (48) (13) 38,204 28 38,233
At 31 December 2017 1,180 7,933 34,406 (3,554) (64) (40) 39,861 24 39,885
Net income/(loss) 4,169 4,169 2 4,171 Other comprehensive income/(loss) 19 (220) 64 2) (11) (148) (148)
Total comprehensive income/(loss) 4,024
Dividends1) 5 333 (2,298) (1,960) (1,960)
Other equity transactions (15) (0) (15) (4) (19)
At 30 September 2018 1,185 8,251 36,296 (3,774) (0) (51) 41,907 23 41,930
1) For more information, see note 7 Dividends. 2) For more information, see note 9 Changes in accounting policies.
Equinor third quarter 2018 14
Condensed interim financial statement and notes
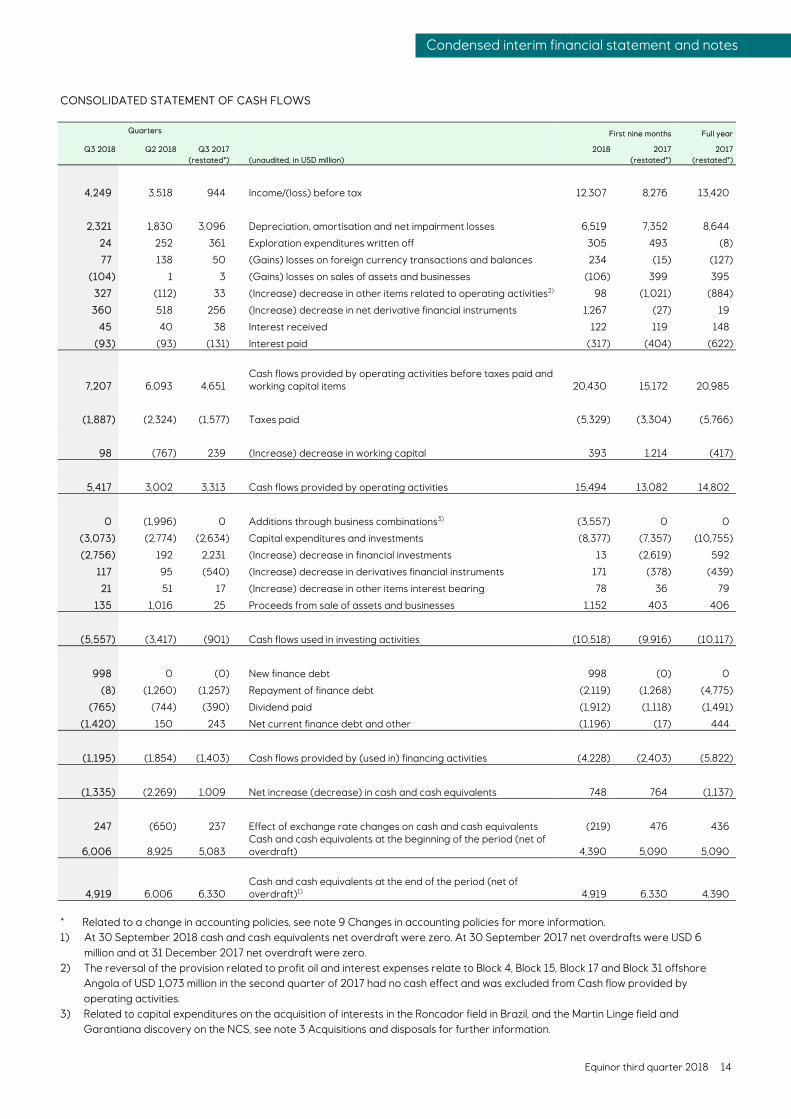
CONSOLIDATED STATEMENT OF CASH FLOWS
Quarters First nine months Full year
Q3 2018 Q2 2018 Q3 2017 2018 2017 2017 (restated*) (unaudited, in USD million) (restated*) (restated*)
4,249 3,518 944 Income/(loss) before tax 12,307 8,276 13,420
2,321 1,830 3,096 Depreciation, amortisation and net impairment losses 6,519 7,352 8,644
24 252 361 Exploration expenditures written off 305 493 (8)
77 138 50 (Gains) losses on foreign currency transactions and balances 234 (15) (127)
(104) 1 3 (Gains) losses on sales of assets and businesses (106) 399 395
327 (112) 33 (Increase) decrease in other items related to operating activities2) 98 (1,021) (884)
360 518 256 (Increase) decrease in net derivative financial instruments 1,267 (27) 19
45 40 38 Interest received 122 119 148
(93) (93) (131) Interest paid (317) (404) (622)
7,207 6,093 4,651 Cash flows provided by operating activities before taxes paid and working capital items 20,430 15,172 20,985
(1,887) (2,324) (1,577) Taxes paid (5,329) (3,304) (5,766)
98 (767) 239 (Increase) decrease in working capital 393 1,214 (417)
5,417 3,002 3,313 Cash flows provided by operating activities 15,494 13,082 14,802
0 (1,996) 0 Additions through business combinations3) (3,557) 0 0
(3,073) (2,774) (2,634) Capital expenditures and investments (8,377) (7,357) (10,755)
(2,756) 192 2,231 (Increase) decrease in financial investments 13 (2,619) 592
117 95 (540) (Increase) decrease in derivatives financial instruments 171 (378) (439)
21 51 17 (Increase) decrease in other items interest bearing 78 36 79
135 1,016 25 Proceeds from sale of assets and businesses 1,152 403 406
(5,557) (3,417) (901) Cash flows used in investing activities (10,518) (9,916) (10,117)
998 0 (0) New finance debt 998 (0) 0
(8) (1,260) (1,257) Repayment of finance debt (2,119) (1,268) (4,775)
(765) (744) (390) Dividend paid (1,912) (1,118) (1,491)
(1,420) 150 243 Net current finance debt and other (1,196) (17) 444
(1,195) (1,854) (1,403) Cash flows provided by (used in) financing activities (4,228) (2,403) (5,822)
(1,335) (2,269) 1,009 Net increase (decrease) in cash and cash equivalents 748 764 (1,137)
247 (650) 237 Effect of exchange rate changes on cash and cash equivalents (219) 476 436
6,006 8,925 5,083 Cash and cash equivalents at the beginning of the period (net of overdraft) 4,390 5,090 5,090
4,919 6,006 6,330 Cash and cash equivalents at the end of the period (net of overdraft)1) 4,919 6,330 4,390
* Related to a change in accounting policies, see note 9 Changes in accounting policies for more information. 1) At 30 September 2018 cash and cash equivalents net overdraft were zero. At 30 September 2017 net overdrafts were USD 6
million and at 31 December 2017 net overdraft were zero. 2) The reversal of the provision related to profit oil and interest expenses relate to Block 4, Block 15, Block 17 and Block 31 offshore
Angola of USD 1,073 million in the second quarter of 2017 had no cash effect and was excluded from Cash flow provided by operating activities.
3) Related to capital expenditures on the acquisition of interests in the Roncador field in Brazil, and the Martin Linge field and Garantiana discovery on the NCS, see note 3 Acquisitions and disposals for further information.

Equinor third quarter 2018 15
Condensed interim financial statement and notes
Notes to the Condensed interim financial statements
1 Organisation and basis of preparation General information and organisation Equinor ASA, originally Den Norske Stats Oljeselskap AS and subsequently Statoil ASA, was founded in 1972 and is incorporated and domiciled in Norway. The address of its registered office is Forusbeen 50, N-4035 Stavanger, Norway.
Statoil ASA changed its name to Equinor ASA following approval of the name change by the company’s annual general meeting on 15 May 2018.
The Equinor group’s (Equinor’s) business consists principally of the exploration, production, transportation, refining and marketing of petroleum and petroleum-derived products, and other forms of energy. Equinor ASA is listed on the Oslo Børs (Norway) and the New York Stock Exchange (USA).
All Equinor's oil and gas activities and net assets on the Norwegian continental shelf (NCS) are owned by Equinor Energy AS (previously named Statoil Petroleum AS), a 100% owned operating subsidiary of Equinor ASA. Equinor Energy AS is co-obligor or guarantor of certain debt obligations of Equinor ASA.
Equinor's Condensed interim financial statements for the third quarter of 2018 were authorised for issue by the board of directors on 24 October 2018.
Basis of preparation These Condensed interim financial statements are prepared in accordance with International Accounting Standard 34 Interim Financial Reporting as issued by the International Accounting Standards Board (IASB) and as adopted by the European Union (EU). The Condensed interim financial statements do not include all the information and disclosures required by International Financial Reporting Standards (IFRS) for a complete set of financial statements, and these Condensed interim financial statements should be read in conjunction with the Consolidated annual financial statements. IFRS as adopted by the EU differ in certain respects from IFRS as issued by the IASB, but the differences do not impact Equinor's financial statements for the periods presented. A description of the significant accounting policies applied in preparing these Condensed interim financial statements is included in Equinor`s Consolidated annual financial statements for 2017.
With effect from 1 January 2018, Equinor implemented IFRS 9 Financial Instruments and IFRS 15 Revenue from Contracts with Customers. As of the same date, Equinor voluntarily changed its policy for recognition of revenue from the production of oil and gas properties in which Equinor shares an interest with other companies, as well as its policy for presentation of certain elements related to derivatives, non-cash currency effects and working capital items in the statement of cash flows. Reference is made to note 9 Changes in accounting policies for further information about these policy changes.
There have been no other changes to significant accounting policies in the first nine months of 2018 compared to the Consolidated annual financial statements for 2017.
The Condensed interim financial statements reflect all adjustments which are, in the opinion of management, necessary for a fair statement of the financial position, results of operations and cash flows for the dates and interim periods presented. Interim period results are not necessarily indicative of results of operations or cash flows for an annual period. The subtotals and totals in some of the tables may not equal the sum of the amounts shown due to rounding.
The Condensed interim financial statements are unaudited.
IFRS 16 Leases IFRS 16, which will be implemented by Equinor on 1 January 2019, defines a lease as a contract that conveys the right to control the use of an identified asset for a period of time in exchange for consideration. In the financial statement of lessees, IFRS 16 requires recognition in the balance sheet for each contract that meets its definition of a lease as a right-of-use (RoU) asset and lease liability, while lease payments are to be reflected as interest expense and a reduction of lease liabilities.
Equinor has not yet determined the expected IFRS 16 implementation impact on assets, liabilities, and equity with sufficient certainty to disclose amounts at this stage in the process.

Equinor third quarter 2018 16
Condensed interim financial statement and notes
The main interpretation issues that Equinor faces related to the IFRS 16 implementation have been covered in note 2 Significant accounting policies in Equinor’s Consolidated annual financial statements for 2017. Equinor’s implementation work is progressing according to plan. By the end of the third quarter 2018, the following main policy choices have been made and form the basis for Equinor’s IFRS 16 implementation and application work: IFRS 16 transition choices: • IFRS 16 will be implemented retrospectively with the cumulative effect of initially recognising the standard as an adjustment to
retained earnings at the date of initial application, and without restatement of prior periods’ reported figures (“the modified retrospective method”).
• Contracts already classified either as leases under IAS 17 or as non-lease service arrangements will maintain their respective classifications upon the implementation of IFRS 16 (“grandfathering of contracts”).
• Leases with a less than 12 months’ remaining lease term at year-end 2018 will not be reflected as leases under IFRS 16. • RoU assets will for most contracts initially be reflected at an amount equal to the corresponding lease liability.
IFRS 16 application policy choices: • Short term leases (less than 12 months) and leases of low value assets will not be reflected in the balance sheet, but will be
expensed as incurred. • Non-lease components within lease contracts will be accounted for separately for all underlying classes of assets, and reflected in
the relevant expense category as incurred.
The most significant issue in Equinor’s application of IFRS 16 remains distinguishing between the joint operation (licenses) or the operator as the relevant lessee in upstream activity lease contracts, and consequently whether such contracts are to be reflected gross (100%) in the operator’s financial statements, or according to each joint operation partner’s proportionate share of the lease. This issue was addressed in the context of IFRS 11 Joint Arrangements in the September 2018 meeting of the IFRS Interpretations Committee. Equinor has not yet determined the consequences of this Interpretations Committee agenda item discussion in applying IFRS 16 to its relevant lease contracts. The conclusion Equinor reaches concerning the appropriate lessee for each joint operation-related lease contract will also impact sublease considerations, inclusive of evaluations of the appropriate accounting in the statement of income for amounts charged by the operator to joint operation partners. Use of estimates The preparation of financial statements in conformity with IFRS requires management to make judgments, estimates and assumptions that affect the application of policies and reported amounts of assets and liabilities, income and expenses. The estimates and associated assumptions are based on historical experience and various other factors that are believed to be reasonable under the circumstances, the results of which form the basis for making the judgments about carrying values of assets and liabilities that are not readily apparent from other sources. Actual results may differ from these estimates. The estimates and underlying assumptions are reviewed on an on-going basis, considering current and expected future market conditions. A change in an accounting estimate is recognised in the period in which the estimate is revised if the revision affects only that period, or in the period of the revision and future periods if the revision affects both current and future periods.
2 Segments Equinor’s operations are managed through the following business areas: Development & Production Norway (DPN), Development & Production International (DPI), Development & Production Brazil (DPB), Marketing, Midstream & Processing (MMP), New Energy Solutions (NES), Technology, Projects & Drilling (TPD), Exploration (EXP) and Global Strategy & Business Development (GSB). With effect from the third quarter 2018 DPB is a new business area and former Development & Production USA (DPUSA) is included in DPI. These changes have no effect on the reporting segments.
The reporting segments Exploration & Production Norway (E&P Norway) and MMP consist of the business areas DPN and MMP respectively. The business areas DPI and DPB are aggregated into the reporting segment Exploration & Production International (E&P International). The aggregation has its basis in similar economic characteristics, such as the assets’ long term and capital-intensive nature and exposure to volatile oil and gas commodity prices, the nature of products, service and production processes, the type and class of customers, the methods of distribution and regulatory environment. The business areas NES, GSB, TPD, EXP and corporate staffs and support functions are aggregated into the reporting segment “Other” due to the immateriality of these areas. The majority of costs within the business areas GSB, TPD and EXP are allocated to the E&P Norway, E&P International and MMP reporting segments.
The eliminations section includes the elimination of inter-segment sales and related unrealised profits, mainly from the sale of crude oil and products. Inter-segment revenues are based upon estimated market prices.

Equinor third quarter 2018 17
Condensed interim financial statement and notes
Segment data for the third quarter of 2018 and 2017 is presented below. The reported measure of segment profit is net operating income/(loss). Deferred tax assets, pension assets and non-current financial assets are not allocated to the segments. The line item additions to PP&E, intangibles and equity accounted investments excludes movements related to changes in asset retirement obligations.
Third quarter 2018
E&P Norway E&P
International MMP Other Eliminations Total (in USD million)
Revenues third party, other revenue and other income (130) 577 18,625 21 0 19,094
Revenues inter-segment 5,564 2,465 94 1 (8,124) 0
Net income/(loss) from equity accounted investments 32 8 (2) 4 0 42
Total revenues and other income 5,465 3,050 18,718 26 (8,124) 19,136
Purchases [net of inventory variation] (0) 11 (17,429) (0) 7,933 (9,486)
Operating, selling, general and administrative expenses (781) (822) (1,040) (33) 184 (2,493)
Depreciation, amortisation and net impairment losses (1,196) (1,016) (92) (17) (0) (2,321)
Exploration expenses (94) (145) 0 0 0 (239)
Net operating income/(loss) 3,393 1,078 157 (25) (7) 4,597
Additions to PP&E, intangibles and equity accounted investments 1,326 1,074 92 135 0 2,627

Equinor third quarter 2018 18
Condensed interim financial statement and notes
Third quarter 2017
E&P Norway E&P
International MMP Other Eliminations Total (in USD million)
Revenues third party, other revenue and other income (129) 213 13,440 17 0 13,542
Revenues inter-segment 4,141 1,810 11 0 (5,961) 0
Net income/(loss) from equity accounted investments 42 10 13 3 0 68
Total revenues and other income 4,054 2,033 13,464 20 (5,961) 13,609
Purchases [net of inventory variation] 1 (2) (12,260) (0) 5,787 (6,475)
Operating, selling, general and administrative expenses (747) (564) (950) (61) 108 (2,216)
Depreciation, amortisation and net impairment losses (1,148) (1,854) (75) (20) 0 (3,096)
Exploration expenses (98) (630) 0 0 0 (727)
Net operating income/(loss) 2,060 (1,017) 178 (60) (67) 1,095
Additions to PP&E, intangibles and equity accounted investments 1,099 871 73 162 0 2,204
First nine months 2018
E&P Norway E&P
International MMP Other Eliminations Total (in USD million)
Revenues third party, other revenue and other income 101 1,609 55,259 31 0 56,999
Revenues inter-segment 16,287 6,887 204 1 (23,380) 0
Net income/(loss) from equity accounted investments 51 26 11 69 0 156
Total revenues and other income 16,439 8,521 55,474 101 (23,380) 57,155
Purchases [net of inventory variation] 1 8 (51,479) (0) 22,776 (28,695)
Operating, selling, general and administrative expenses (2,417) (2,224) (3,226) (190) 472 (7,586)
Depreciation, amortisation and net impairment losses (3,098) (3,250) (118) (53) 0 (6,519)
Exploration expenses (254) (709) 0 0 0 (963)
Net operating income/(loss) 10,670 2,345 651 (142) (132) 13,392
Additions to PP&E, intangibles and equity accounted investments 5,505 6,263 257 316 0 12,340
Balance sheet information
Equity accounted investments 1,147 235 90 1,329 0 2,801
Non-current segment assets 32,593 38,901 5,425 346 0 77,264
Non-current assets, not allocated to segments 8,739
Total non-current assets 88,804

Equinor third quarter 2018 19
Condensed interim financial statement and notes
First nine months 2017
E&P Norway E&P
International MMP Other Eliminations Total (in USD million)
Revenues third party, other revenue and other income (55) 1,649 42,247 41 0 43,882
Revenues inter-segment 12,522 5,279 44 1 (17,846) 0
Net income/(loss) from equity accounted investments 142 17 36 (4) 0 191
Total revenues and other income 12,610 6,944 42,327 37 (17,846) 44,073
Purchases [net of inventory variation] 1 (7) (37,378) (0) 17,586 (19,798)
Operating, selling, general and administrative expenses (2,174) (2,184) (2,831) (184) 306 (7,068)
Depreciation, amortisation and net impairment losses (2,897) (4,164) (218) (73) 0 (7,352)
Exploration expenses (265) (1,002) 0 0 0 (1,266)
Net operating income/(loss) 7,274 (413) 1,900 (219) 46 8,588
Additions to PP&E, intangibles and equity accounted investments 3,706 2,823 217 320 0 7,067
Balance sheet information
Equity accounted investments 1,182 233 130 882 0 2,426
Non-current segment assets 31,159 35,067 4,731 376 0 71,333
Non-current assets, not allocated to segments 9,068
Total non-current assets 82,827
In the third quarter of 2018 Equinor recognised net impairment reversal of USD 89 million in the E&P International segment. The net impairment reversal was related to an impairment of USD 269 million and a reversal of USD 358 million in the North America conventional Gulf of Mexico area. The impairment was triggered by changes in reserves estimates and the reversal was triggered by various operational improvements. For information regarding implementation of IFRS 15 and change of accounting policy for recognition of revenue from the production of oil and gas properties in which Equinor shares an interest with other companies, see note 9 Changes in accounting policies. For information regarding acquisition of interests, see note 3 Acquisitions and disposals. Revenues by geographic areas When attributing the line item revenues third party, other revenue and other income to the country of the legal entity executing the sale for the first nine months of 2018, Norway constitutes 74% and the US constitutes 18% of such revenues.

Equinor third quarter 2018 20
Condensed interim financial statement and notes
Non-current assets by country
At 30
S t b At 30 June At 31 December At 30 September
(in USD million) 2018 2018 2017 2017
Norway 37,012 37,060 34,588 35,114
USA 19,420 19,087 19,267 17,606
Brazil 7,715 7,762 4,584 5,166
UK 4,543 4,430 4,222 4,028
Angola 2,111 2,374 2,888 2,956
Canada 1,606 1,592 1,715 1,701
Azerbaijan 1,452 1,458 1,472 1,283
Algeria 1,076 1,111 1,114 1,197
Other countries 5,130 5,093 4,958 4,707
Total non-current assets1) 80,065 79,967 74,809 73,759
1) Excluding deferred tax assets, pension assets, non-current financial assets and assets classified as held for sale. 3 Acquisitions and disposals Acquisition of 100% shares in Danske Commodities In the third quarter of 2018 Equinor has entered into an agreement to buy 100% of the shares in a Danish energy trading company Danske Commodities (DC) for a consideration of EUR 400 million, which will be adjusted for certain net cash and net working capital positions at closing. In addition, some smaller contingent payments depending on DC’s performance have been agreed. The closing of this transaction is subject to certain conditions, including European Commission approval. Closing is expected in the fourth quarter of 2018. Upon closing of the transaction, the assets and liabilities related to the acquired business will be reflected according to IFRS 3 Business Combinations. The transaction will be accounted for in the Marketing, Midstream & Processing (MMP) segment. Acquisition and divestment of operated interest in Carcara field in Brazil In the third quarter of 2018 Equinor and Barra Energia (“Barra”) signed an agreement to acquire Barra’s 10% interest in the BM-S-8 licence in Brazil’s Santos basin. Upon closing, Equinor intends to sell down 3.5% to ExxonMobil and 3% to Galp, so fully aligning interests across BM-S-8 and Carcará North. The total consideration for Barra’s 10% interest is USD 379 million, the same as for Equinor’s earlier transaction in BM-S-8 with Queiroz Galvão Exploração e Produção (QGEP) in July 2017. Closing is subject to customary conditions, including partner and government approval and is expected within a year. In the second quarter of 2018 Equinor completed the divestment of 39.5% of its 76% interest in BM-S-8, agreed in October 2017. 36.5% interest was divested to ExxonMobil and 3% to Galp for a total consideration of USD 1,493 million. The transaction is accounted for in the E&P International segment with no impact on the Consolidated statement of income. The cash proceeds from the sale were USD 1,016 million and the divested assets were previously presented as Assets classified as held for sale. Acquisition of interest in Roncador field in Brazil In the second quarter of 2018 Equinor closed an agreement with Petrobras to acquire a 25% interest in Roncador, an oil field in the Campos Basin in Brazil. Equinor paid Petrobras a cash consideration of USD 2,133 million, in addition to recognising a liability for contingent consideration of USD 392 million. The assets and liabilities related to the acquired portion of Roncador have been reflected in accordance with the principles of IFRS 3 Business Combinations. The acquisition resulted in an increase of Equinor’s property, plant and equipment of USD 2,327 million, intangible assets of USD 392 million and an increase in provisions of USD 586 million. At this stage, both the purchase price and the purchase price allocation are preliminary. The partners have joint control and Equinor will account for its interest on a pro-rata basis. The transaction has been accounted for in the E&P International segment. Acquisition of Cobalt’s North Platte interest in the Gulf of Mexico In the first quarter of 2018 Equinor’s co-bid with Total in the bankruptcy auction for Cobalt’s interest in the North Platte discovery was successful with an aggregate bid of USD 339 million. The transaction was closed in April 2018. Upon closing, Total as operator owns 60% of North Platte and Equinor owns the remaining 40%. The value of the acquired exploration assets has been recognised in the Exploration & Production International (E&P International) segment for an amount of USD 246 million as intangible assets. Additionally, the transaction includes a contingent consideration up to USD 20 million.

Equinor third quarter 2018 21
Condensed interim financial statement and notes
Acquisition of interests in Martin Linge field and Garantiana discovery In the first quarter of 2018 Equinor and Total closed an agreement to acquire Total’s equity stakes in the Martin Linge field (51%) and the Garantiana discovery (40%) on the NCS. Through this transaction Equinor increased the ownership share in the Martin Linge field from 19% to 70%. Equinor has paid Total a consideration of USD 1,541 million and has taken over the operatorships. The assets and liabilities related to the acquired portion of Martin Linge and Garantiana have been reflected in accordance with the principles of IFRS 3 Business Combinations. The acquisition resulted in an increase of Equinor’s property, plant and equipment of USD 1,418 million, intangible assets of USD 116 million, goodwill of USD 265 million, deferred tax liabilities of USD 265 million and other assets of USD 7 million. The partners have joint control and Equinor continues to account for its interest on a pro-rata basis using Equinor's new ownership share. The transaction has been accounted for in the Exploration and Production Norway (E&P Norway) segment.
4 Financial items
Quarters First nine months Full year
Q3 2018 Q2 2018 Q3 2017 (in USD million) 2018 2017 2017
(77) (138) (51) Gains (losses) on net foreign exchange (234) 14 126
97 155 109 Interest income and other financial items 245 375 487
(109) (55) 71 Gains (losses) on derivative financial instruments (329) (134) (61)
(259) (278) (278) Interest and other finance expenses (766) (567) (903)
(348) (317) (150) Net financial items (1,085) (312) (351)
The line item Interest income and other financial items includes expenses of USD 64 million in the first nine months of 2018 related to implementation of IFRS 9. See note 9 Changes in accounting policies. The line item Interest and other finance expenses includes an income of USD 319 million in the first nine months of 2017 and full year 2017 related to a release of a provision. See note 23 Other commitments, contingent liabilities and contingent assets in Equinor’s 2017 Annual Report and Form 20-F. Equinor has a US Commercial paper program available with a limit of USD 5 billion of which USD 199 million has been utilised as of 30 September 2018. In the third quarter of 2018 Equinor issued a USD 1 billion bond with 10 years maturity. The bond was issued in USD and is fully and unconditionally guaranteed by Equinor Energy AS.
5 Income taxes
Quarters First nine months Full year
Q3 2018 Q2 2018 Q3 2017 (in USD million) 2018 2017 2017
4,249 3,518 944 Income/(loss) before tax 12,307 8,276 13,420
(2,583) (2,298) (1,422) Income tax expense (8,136) (6,254) (8,822)
60.8% 65.3% >100% Effective tax rate 66.1% 75.6% 65.7%
The tax rate for the third quarter of 2018 and for the first nine months of 2018 was primarily influenced by positive operating income in countries with unrecognised deferred tax assets. This was partially offset by currency effects in entities that are taxable in other currencies than the functional currency. The tax rate for the first nine months of 2018 was also influenced by recognition of USD 350 million in previously unrecognised deferred tax assets reflected in the E&P International segment in the second quarter of 2018. The tax rate for the third quarter of 2017 and for the first nine months of 2017 was primarily influenced by losses including impairments recognised in countries with lower than average tax rates or unrecognised deferred tax assets. This was partially offset by low tax rate on income from the NCS shelf caused by higher effect of uplift deduction.
The tax rate for the first nine months of 2017 was also influenced by the agreement with the Angolan Ministry of Finance related to Equinor’s participation in several blocks offshore Angola.

Equinor third quarter 2018 22
Condensed interim financial statement and notes
6 Property, plant and equipment and intangible assets
(in USD million) Property, plant and
equipment Intangible
assets
Balance at 31 December 2017 63,637 8,621
Additions through business combinations 3,745 773
Additions 6,554 1,071
Transfers 115 (115)
Disposals and reclassifications (0) (130)
Expensed exploration expenditures and impairment losses - (305)
Depreciation, amortisation and net impairment losses (6,511) (8)
Effect of foreign currency translation adjustments (155) (28)
Balance at 30 September 2018 67,384 9,880 Equinor’s Block 2 Exploration License in Tanzania was formally due to expire in June 2018, but based on communication with the applicable Tanzanian authorities, continues to be in operation while the process related to the grant of a new exploration licence to the existing licensees for the block is ongoing. The Block 2 asset remains capitalised within Intangible assets in the E&P International segment as of 30 September 2018. Impairments/reversal of impairments For information on impairment losses and reversals per reporting segment see note 2 Segments. First nine months 2018 Property, plant
and equipment Intangible
assets Total (in USD million)
Producing and development assets (604) 237 (367)
Acquisition costs related to oil and gas prospects - 16 16
Total net impairment losses (reversals) recognised (604) 253 (351)
The impairment charges have been recognised in the Consolidated statement of income as depreciation, amortisation and net impairment losses and exploration expenses based on the impaired assets’ nature of property, plant and equipment and intangible assets, respectively. The recoverable amounts of the impairments and impairment reversals in the third quarter of 2018 were based on value in use. Value in use estimates and discounted cash flows used to determine the recoverable amount of assets tested for impairment are based on internal forecasts on costs, production profiles and commodity prices.

Equinor third quarter 2018 23
Condensed interim financial statement and notes
7 Dividends A dividend of USD 0.23 per share was approved for the first quarter of 2018 and paid in the third quarter of 2018. For the second quarter of 2018 a dividend of USD 0.23 will be paid around 30 November 2018. The Equinor share will trade ex-dividend on Oslo Børs (OSE) 21 November and on New York Stock Exchange (NYSE) 20 November 2018. Record date will be 22 November on OSE and 21 November for ADR holders on NYSE. On 24 October 2018, the board of directors resolved to declare a dividend for the third quarter of USD 0.23 per share. The Equinor share will trade ex-dividend 19 February 2019 on OSE and for ADR holders on NYSE. Record date will be 20 February 2019 on OSE and NYSE. Payment date will be around 28 February 2019.
First nine months Full year Dividends Q3 2018 2018 Q3 2017 2017
Dividends paid in cash (in USD million) 765 1,912 390 1,491
USD per share or ADS 0.2300 0.6801 0.2201 0.8804
NOK per share 1.9311 5.5275 1.7494 7.2615
Scrip dividends (in USD million) 0 338 339 1,357
Number of shares issued (in million) 0.0 15.5 18.8 78.1 Total dividends 765 2,250 729 2,848
8 Provisions, commitments, contingent liabilities and contingent assets In 2016, Equinor initiated arbitration to set aside an expert ruling affecting Equinor’s ownership percentage in the ongoing redetermination process for the Agbami field in Nigeria. In April 2018, the Arbitration panel ruled, dismissing Equinor’s claims, which however has no impact on Equinor’s accounting for the Agbami redetermination as the outcome of the expert ruling has been provided for. For further information see note 23 Other commitments, contingent liabilities and contingent assets in Equinor’s 2017 Annual Report and Form 20-F. On 28 February 2018, Equinor received a notice of deviation from Norwegian tax authorities related to an ongoing dispute regarding the level of Research & Development cost to be allocated to the offshore tax regime, increasing the maximum exposure in this matter to approximately USD 500 million. Equinor provided for its best estimate in the matter. The range of exposure related to long-term gas sales price reviews broadened in the second quarter of 2018. However, Equinor’s best estimate and the corresponding provision for contractual gas price disputes as of 30 September 2018 have not changed materially since year-end 2017. In March 2016 Equinor Energy AS, acting on behalf of the Troll field partners, terminated a long-term contract for the drilling rig COSL Innovator. The termination was disputed in court by the rig owner COSL Offshore Management AS (COSL). Equinor’s share of the total exposure, based on COSL’s original claim, has been estimated to be approximately USD 200 million excluding penalty interest. In May 2018, the court of first instance (Oslo District Court) ruled that while the contract could be cancelled according to the applicable clauses of the contract and with payment of the appropriate cancellation charge, the contract had not been validly terminated. In June 2018 both parties appealed the verdict to the court of appeal. Oslo District Court’s ruling is consequently not final. Equinor intends to defend its own and the Troll partners’ position, and considers it to be more likely than not that the final verdict will conclude that the termination of the rig contract was valid under its terms. No provision related to the dispute is included in Equinor’s accounts as of 30 September 2018.
During the normal course of its business Equinor is involved in legal and other proceedings, and several claims are unresolved and currently outstanding. The ultimate liability or asset, respectively, in respect of such litigation and claims cannot be determined now. Equinor has provided in its Condensed interim financial statements for probable liabilities related to litigation and claims based on the company's best judgement. Equinor does not expect that its financial position, results of operations or cash flows will be materially affected by the resolution of these legal proceedings.

Equinor third quarter 2018 24
Condensed interim financial statement and notes
9 Changes in accounting policies With effect from 1 January 2018, Equinor has implemented IFRS 9 Financial Instruments and IFRS 15 Revenue from Contracts with Customers. As of the same date, Equinor has voluntarily changed its policy for recognition of revenue from the production of oil and gas properties in which Equinor shares an interest with other companies, as well as its policy for presentation of certain elements related to derivatives, non-cash currency effects and working capital items in the statement of cash flows.
Information about each accounting policy change is available in the following. For certain tables as listed below, reference is however made to note 9 of Equinor’s first quarter 2018 Condensed interim financial statements;
• IFRS 9: Table showing the financial assets at 1 January 2018 by category, according to previous requirements and according to IFRS 9, with differences in carrying amounts noted.
• Change in Cash flow presentation – restatement of comparative periods: Tables showing originally reported and restated amounts for the full years 2017 and 2016, and for the four quarters of 2017.
IFRS 9 Financial Instruments IFRS 9 replaced IAS 39 Financial Instruments: Recognition and Measurement. IFRS 9 has been implemented retrospectively with the cumulative effect of initially applying the standard recognised at the date of initial application. The implementation impact of IFRS 9 is immaterial, and Equinor’s equity as at January 2018 have consequently not been adjusted upon adoption of the standard. In accordance with the IFRS 9’s transitional provisions, comparative figures have not been restated.
There are no changes related to classification of Equinor’s liabilities following the implementation of IFRS 9.
Portions of Equinor’s cash equivalents and current financial investments tied to liquidity management, which under IAS 39 are classified as held for trading and reflected at fair value through profit and loss, are under IFRS 9 to be measured at amortised cost, based on an evaluation of the contractual terms and the business model applied. The impact of the change is immaterial.
For certain financial assets currently classified as Available for sale (AFS), changes in fair value which under IAS 39 are reflected in OCI, are reflected in profit and loss under IFRS 9. As a result, fair value loss of USD 64 million that had been accumulated in the available-for-sale financial assets reserve were expensed in the statement of income as an implementation effect.
No significant changes were made for Equinor’s expected loss recognition process to satisfy IFRS 9’s financial asset impairment requirements. Credit risk related to financial assets measured at amortised cost is immaterial.
IFRS 15 Revenue from Contracts with Customers IFRS 15 covers the recognition of revenue in the financial statements and related disclosure, and has replaced existing revenue recognition guidance, including IAS 18 Revenue. Equinor has implemented IFRS 15 retrospectively, with the cumulative effect recognised at the date of initial application. The impact on Equinor’s equity was immaterial. As allowed by the standard, prior periods have not been restated. Total revenues and other income in the Consolidated statement of income has not been impacted materially by the implementation of IFRS 15.
IFRS 15 requires identification of the performance obligations for the transfer of goods and services in each contract with customers. Revenue is recognised upon satisfaction of the performance obligations for the amounts that reflect the consideration to which Equinor expects to be entitled in exchange for those goods and services. Under IFRS 15, revenue from the sale of crude oil, natural gas, petroleum products and other merchandise is recognised when a customer obtains control of those products, which normally is when title passes at point of delivery, based on the contractual terms of the agreements. Each such sale normally represents a single performance obligation. In the case of natural gas, sales are completed over time in line with the delivery of the actual physical quantities.
The accounting for Equinor’s sale of the SDFI’s natural gas and crude oil under IFRS 15 has not led to changes compared to the practice under IAS 18.
With effect from 1 January 2018, Equinor has presented ‘Revenue from contracts with customers’ and ‘Other revenue’ (USD 19.5 billion and USD (0.5) billion in the third quarter of 2018, and USD 57.8 billion and USD (1) billion for the first nine months of 2018) as a single caption, Revenues, in the Consolidated statement of income. The impact of commodity-based derivatives within Other revenue reduced Revenues with USD 0.5 billion in the third quarter of 2018, and with USD 1.6 billion in the first nine months of 2018. In addition to the impact of commodity-based derivatives connected with sales contracts or revenue-related risk management, ‘Other revenue’ mainly includes taxes paid in kind under certain production sharing agreements (PSAs) and adjustments for imbalances between oil and gas production and sales. These items represent a form of revenue, or are closely connected to revenue transactions. In addition, the impact of certain

Equinor third quarter 2018 25
Condensed interim financial statement and notes
commodity-based earn-out and contingent consideration agreements are now presented under 'Other income'. These elements were previously presented within Revenues.
Change in accounting for lifting imbalances Equinor voluntarily changed its policy for recognition of revenue from the production of oil and gas properties in which Equinor shares an interest with other companies. Previously Equinor recognised revenue on the basis of volumes lifted and sold to customers during the period (the sales method). Under the new method, Equinor recognises revenues according to Equinor’s ownership in producing fields, where the accounting for the imbalances is presented as Other revenue. This voluntary change in policy has been made because it better reflects Equinor’s operational performance, and at the time of the decision also increased comparability with the financial reporting of Equinor’s peers. The change in policy affects the timing of revenue recognition from oil and gas production; however, the pre-tax implementation impact of USD 287 million recognised in the first quarter of 2018 has been considered immaterial. Equinor’s equity as at 1 January 2018 has consequently not been adjusted upon the change in policy, and comparative figures have not been restated.
Change in Cash flow presentation – restatement of comparative periods Equinor has changed its presentation of certain elements related to derivatives, non-cash currency effects and working capital items in the Consolidated statement of cash flows. The presentation was changed to better reflect the cash impact of the different items within operating, investing and financing activities. The changes impact the classification of cash flow items within cash flows provided by operating activities and reclassification of cash flow elements relating to foreign exchange derivatives from operating activities to investing and financing activities.
Changes to classification of foreign currency derivatives Equinor applies foreign currency derivatives to hedge currency exposure related to financial investments and long-term debt in foreign currencies. Cash receipts and payments related to these derivatives have previously been classified as an operating cash flow together with cash flows from other derivative positions. To better align the cash receipt and payments from foreign currency derivatives with the cash flows related to the underlying hedged items, the cash receipts and payments from these derivatives have been reclassified from an operating cash flow to an investing or financing cash flow depending on the nature of the hedged item.
Changes to classification of non-cash currency effects Non-cash currency exchange gains and losses and currency translation effects previously presented as part of the individual line items within Cash flows provided by operating activities have been reclassified into the line item gain/loss on foreign currency transactions and balances. This to better distinguish changes in items relating to operating activities, i.e. decrease/increase in working capital, from the balance sheet impact of non-cash currency effects.
Changes to classification related to working capital items Certain items that previously have been presented as part of change in working capital have been reclassified to other items related to operating activities if the nature of the item is non-cash provisions.
10 Subsequent events On 1 October 2018 Equinor signed an agreement to acquire Chevron’s 40% operated interest in the Rosebank project, one of the largest undeveloped fields on the UK Continental Shelf. The other partners in the field are Suncor Energy (40%) and Siccar Point Energy (20%). The transaction is subject to customary conditions, including partner and authority approval, with completion targeted as soon as possible. Upon completion the transaction will be recognised in the E&P International segment.
On 15 October 2018 Equinor signed an agreement with Aker BP to sell its 77.8% operated interest in the King Lear discovery on the NCS shelf for a total consideration of USD 250 million. Closing of the transaction is subject to customary conditions, including partner and authority approval with completion targeted as soon as practically possible. Upon closing the transaction will be recognised in the E&P Norway segment. On 18 October 2018 Equinor signed an agreement with PGNiG to sell its non-operated interests in the Tommeliten discovery on the NCS for a total amount of USD 220 million. Closing of the transaction is subject to approval by PGNiG’s Supervisory Board and customary conditions, including partner and authority approval with completion targeted as soon as practically possible. This transaction follows Equinor’s sale of its operated interest in the King Lear discovery to Aker BP on 15 October. Upon closing the transaction will be recognised in the E&P Norway segment.

Equinor third quarter 2018 26
Supplementary
Supplementary disclosures OPERATIONAL DATA Quarters Change First nine months
Q3 2018 Q2 2018 Q3 2017 Q3 on Q3 Operational data 2018 2017 Change
Prices
75.3 74.5 52.1 45% Average Brent oil price (USD/bbl) 72.1 51.8 39%
69.1 67.4 48.3 43% E&P Norway average liquids price (USD/bbl) 65.8 47.9 37%
65.9 63.9 45.4 45% E&P International average liquids price (USD/bbl) 63.0 45.3 39%
67.6 65.8 47.0 44% Group average liquids price (USD/bbl) 64.6 46.8 38%
557.1 527.7 374.5 49% Group average liquids price (NOK/bbl) [1] 518.8 388.6 34%
5.48 5.18 4.17 31% Transfer price natural gas (USD/mmbtu) [9] 5.39 4.12 31%
6.99 6.52 5.24 33% Average invoiced gas prices - Europe (USD/mmbtu) [8] 6.82 5.28 29%
2.58 2.44 2.24 15% Average invoiced gas prices - North America (USD/mmbtu) [8] 2.82 2.80 1%
6.9 6.3 7.7 (10%) Refining reference margin (USD/bbl) [2] 5.7 6.6 (13%)
Entitlement production (mboe per day)
547 543 586 (7%) E&P Norway entitlement liquids production 563 596 (5%)
458 428 415 10% E&P International entitlement liquids production 427 422 1%
1,005 971 1,001 0% Group entitlement liquids production 990 1,018 (3%)
688 677 729 (6%) E&P Norway entitlement gas production 715 724 (1%)
202 203 152 33% E&P International entitlement gas production 208 166 25%
890 880 882 1% Group entitlement gas production 922 891 4%
1,895 1,851 1,883 1% Total entitlement liquids and gas production [3] 1,912 1,908 0%
Equity production (mboe per day)
547 543 586 (7%) E&P Norway equity liquids production 563 596 (5%)
586 562 545 7% E&P International equity liquids production 562 550 2%
1,133 1,105 1,132 0% Group equity liquids production 1,126 1,146 (2%)
688 677 729 (6%) E&P Norway equity gas production 715 724 (1%)
245 247 184 33% E&P International equity gas production 251 192 31%
933 924 913 2% Group equity gas production 965 916 5%
2,066 2,028 2,045 1% Total equity liquids and gas production [4] 2,091 2,062 1%
MMP sales volumes
204.1 211.5 197.0 4% Crude oil sales volumes (mmbl) 633.7 602.0 5%
12.8 12.4 12.7 1% Natural gas sales Equinor entitlement (bcm) 39.0 38.1 2%
1.3 1.1 1.2 5% Natural gas sales third-party volumes (bcm) 4.0 4.7 (13%)
EXCHANGE RATES
Quarters Change First nine months Q3 2018 Q2 2018 Q3 2017 Q3 on Q3 Exchange rates 2018 2017 Change
0.1214 0.1247 0.1256 (3%) NOK/USD average daily exchange rate 0.1245 0.1205 3%
0.1223 0.1226 0.1254 (3%) NOK/USD period-end exchange rate 0.1223 0.1254 (3%)
8.2366 8.0172 7.9613 3% USD/NOK average daily exchange rate 8.0341 8.2984 (3%)
8.1777 8.1588 7.9726 3% USD/NOK period-end exchange rate 8.1777 7.9726 3%
1.1628 1.1915 1.1742 (1%) EUR/USD average daily exchange rate 1.1934 1.1128 7%
1.1576 1.1658 1.1806 (2%) EUR/USD period-end exchange rate 1.1576 1.1806 (2%)

Equinor third quarter 2018 27
Supplementary
ADJUSTED EXPLORATION EXPENSES
Quarters Change Adjusted exploration expenses First nine months Q3 2018 Q2 2018 Q3 2017 Q3 on Q3 (in USD million) 2018 2017 Change
135 74 116 16% E&P Norway exploration expenditures (activity) 340 323 5%
182 195 277 (34%) E&P International exploration expenditures (activity) 570 569 0%
316 270 392 (19%) Group exploration expenditures (activity) 910 891 2%
24 10 49 (51%) Expensed, previously capitalised exploration expenditures 52 69 (24%)
(102) (47) (26) >100% Capitalised share of current period's exploration activity (251) (118) >100%
0 242 312 (100%) Impairment (reversal of impairment) 253 425 (40%)
239 475 727 (67%) Exploration expenses IFRS 963 1,266 (24%)
0 (241) (311) (100%) Items impacting (251) (425) (41%)
239 234 416 (42%) Adjusted exploration expenses 712 842 (15%)
For items impacting, see Reconciliation of net operating income to adjusted earnings in the Supplementary disclosures.
NET ADJUSTED FINANCIAL ITEMS 2018 Interest
income and other
financial items
Net foreign exchange
gains (losses)
Gains (losses)
derivative financial
instruments
Interest and other
finance expenses
Net before tax
Estimated tax effect Net after tax
Net adjusted financial items in the third quarter of 2018
(in USD million)
Financial items according to IFRS 97 (77) (109) (259) (348) 106 (242)
Foreign exchange (FX) impacts (incl. derivatives) (2) 77 - - 75 - -
Interest rate (IR) derivatives - - 109 - 109 - -
Fair value adjustment financial investment 16 - - - 16 - -
Adjusted financial items 111 0 0 (259) (148) 106 (42)
NET ADJUSTED FINANCIAL ITEMS 2017 Interest
income and other
financial items
Net foreign exchange
gains (losses)
Gains (losses)
derivative financial
instruments
Interest and other
finance expenses
Net before tax
Estimated tax effect Net after tax
Net adjusted financial items in the third quarter of 2017
(in USD million)
Adjusted financial items 102 0 0 (278) (176) (42) (218)

Equinor third quarter 2018 28
Supplementary
ADJUSTED EARNINGS AFTER TAX BY SEGMENT [5]
Third quarter
2018 2017
(in USD million) Adjusted earnings
Tax on adjusted earnings
Adjusted earnings after tax
Adjusted earnings
Tax on adjusted earnings
Adjusted earnings after tax
E&P Norway 3,393 (2,463) 930 2,015 (1,354) 662
E&P International 994 (219) 774 (27) (51) (78)
MMP 481 (178) 303 423 (150) 273
Other (25) 5 (19) (65) 27 (38)
Group 4,843 (2,856) 1,988 2,346 (1,527) 819
Effective tax rates on adjusted earnings 59.0% 65.1%
First nine months
2018 2017
(in USD million) Adjusted earnings
Tax on adjusted earnings
Adjusted earnings after tax
Adjusted earnings
Tax on adjusted earnings
Adjusted earnings after tax
E&P Norway 9,815 (7,103) 2,712 6,571 (4,588) 1,952 1)
E&P International 2,661 (710) 1,952 1,121 (394) 749 1)
MMP 1,237 (532) 705 1,216 (566) 656 1)
Other (142) (70) (213) (225) 87 (135)1)
Group 13,571 (8,416) 5,156 8,682 (5,460) 3,222
Effective tax rates on adjusted earnings 62.0% 62.9% 1) The figures from the first quarter 2017 do not include minor adjustments mainly related to net financial items allocated at business
level.
HEALTH, SAFETY AND THE ENVIRONMENT
Twelve months average per First nine
months First nine
months Q3 2018 Q3 2017 Health, safety and the environment 2018 2017
Injury/incident frequency
2.9 2.8 Total recordable injury frequency (TRIF) 3.0 2.9
0.5 0.7 Serious Incident Frequency (SIF) 0.5 0.6
Oil spills
244 181 Accidental oil spills (number of) 181 143
117 69 Accidental oil spills (cubic metres) 113 30
First nine
months Full year Climate 2018 2017
Upstream CO2 intensity (kg CO2/boe) 1) 9 9 1) For Equinor operated assets in E&P Norway and E&P International, the total amount of direct CO2 released to the atmosphere (kg),
divided by total hydrocarbon production (boe).

Equinor third quarter 2018 29
Supplementary
USE AND RECONCILIATION OF NON-GAAP FINANCIAL MEASURES Non-GAAP financial measures are defined as numerical measures that either exclude or include amounts that are not excluded or included in the comparable measures calculated and presented in accordance with GAAP (i.e. IFRS).
For more information on our use of non-GAAP financial measures, see section 5.2 Use and reconciliation of non-GAAP financial measures in Equinor's 2017 Annual Report and Form 20-F.
The following financial measures may be considered non-GAAP financial measures: • Adjusted earnings (including adjusted revenues and other income, adjusted purchases, adjusted operating expenses and selling,
general and administrative expenses, adjusted depreciation and adjusted exploration expenses) – for more information see below • Adjusted earnings after tax – for more information see below • Return on average capital employed after tax (ROACE) – this measure provides useful information for both the group and
investors about performance during the period under evaluation. Equinor uses ROACE to measure the return on capital employed, regardless of whether the financing is through equity or debt. The use of ROACE should not be viewed as an alternative to income before financial items, income taxes and minority interest, or to net income, which are measures calculated in accordance with GAAP or ratios based on these figures
• Net interest-bearing debt adjusted – for more information see section 5.2 Use and reconciliation of non-GAAP financial measures - Net debt to capital employed ratio and note 18 Finance debt in Equinor`s 2017 Annual Report and Form 20-F
• Net debt to capital employed ratio before adjustments and Net debt to capital employed ratio adjusted – for more information see section 5.2 Use and reconciliation of non-GAAP financial measures in Equinor’s 2017 Annual Report and Form 20-F
• Organic capital expenditures – capital expenditures excluding acquisitions, capital leases and other investments with significant different cash flow pattern. Capital expenditures are defined as additions to property, plant and equipment (including capitalised financial leases), capitalised exploration expenditures, intangible assets, long-term share investments and investments in equity accounted companies. See section 5.2 Use and reconciliation of non-GAAP financial measures in Equinor`s 2017 Annual Report and Form 20-F for more information on organic capital expenditures
• Free cash flow includes the following line items in the Consolidated statement of cash flows: Cash flows provided by operating activities before taxes paid and working capital items, taxes paid, additions through business combinations, capital expenditures and investments, (Increase) decrease in other items interest bearing, proceeds from sale of assets and businesses and dividend paid
Adjusted earnings are based on net operating income and adjusts for certain items affecting the income for the period in order to separate out effects that management considers may not be well correlated to Equinor’s underlying operational performance in the individual reporting period. Management considers adjusted earnings to be a supplemental measure to Equinor’s IFRS measures that provides an indication of Equinor’s underlying operational performance in the period and facilitates a better understanding of operational trends between the periods. Adjusted earnings adjusts for the following items: • Changes in fair value of derivatives: Certain gas contracts are, due to pricing or delivery conditions, deemed to contain
embedded derivatives, required to be carried at fair value. Certain transactions related to historical divestments include contingent consideration, are carried at fair value. The accounting impacts of changes in fair value of the aforementioned are excluded from adjusted earnings. In addition, adjustments are also made for changes in the unrealised fair value of derivatives related to some natural gas trading contracts. Due to the nature of these gas sales contracts, these are classified as financial derivatives to be measured at fair value at the balance sheet date. Unrealised gains and losses on these contracts reflect the value of the difference between current market gas prices and the actual prices to be realised under the gas sales contracts. Only realised gains and losses on these contracts are reflected in adjusted earnings. This presentation best reflects the underlying performance of the business as it replaces the effect of temporary timing differences associated with the re-measurements of the derivatives to fair value at the balance sheet date with actual realised gains and losses for the period
• Periodisation of inventory hedging effect: Commercial storage is hedged in the paper market and is accounted for using the lower of cost or market price. If market prices increase above cost price, the inventory will not reflect this increase in value. There will be a loss on the derivative hedging the inventory since the derivatives always reflect changes in the market price. An adjustment is made to reflect the unrealised market increase of the commercial storage. As a result, loss on derivatives is matched by a similar adjustment for the exposure being managed. If market prices decrease below cost price, the write-down of the inventory and the derivative effect in the IFRS income statement will offset each other and no adjustment is made
• Over/underlift: In the first quarter of 2018, Equinor changed the accounting policy for lifting imbalances, see note 9 Changes in accounting policies to the Condensed interim financial statements for further information. For historical periods over/underlift was accounted for using the sales method and therefore revenues were reflected in the period the product was sold rather than in the period it was produced. The over/underlift position depended on a number of factors related to our lifting programme and the way it corresponded to our entitlement share of production. The effect on income for the period was therefore adjusted, to show estimated revenues and associated costs based upon the production for the period to reflect operational performance and comparability with peers. In light of the change in accounting policy, following first quarter 2018, adjusted earnings will not include the over/underlift adjustment made in arriving at this figure in previous periods
Equinor third quarter 2018 30
Supplementary
• The operational storage is not hedged and is not part of the trading portfolio. Cost of goods sold is measured based on the FIFO (first-in, first-out) method, and includes realised gains or losses that arise due to changes in market prices. These gains or losses will fluctuate from one period to another and are not considered part of the underlying operations for the period
• Impairment and reversal of impairment are excluded from adjusted earnings since they affect the economics of an asset for the lifetime of that asset, not only the period in which it is impaired or the impairment is reversed. Impairment and reversal of impairment can impact both the exploration expenses and the depreciation, amortisation and impairment line items
• Gain or loss from sales of assets is eliminated from the measure since the gain or loss does not give an indication of future performance or periodic performance; such a gain or loss is related to the cumulative value creation from the time the asset is acquired until it is sold
• Internal unrealised profit on inventories: Volumes derived from equity oil inventory will vary depending on several factors and inventory strategies, i.e. level of crude oil in inventory, equity oil used in the refining process and level of in-transit cargoes. Internal profit related to volumes sold between entities within the group, and still in inventory at period end, is eliminated according to IFRS (write down to production cost). The proportion of realised versus unrealised gain will fluctuate from one period to another due to inventory strategies and consequently impact net operating income. Write-down to production cost is not assessed to be a part of the underlying operational performance, and elimination of internal profit related to equity volumes is excluded in adjusted earnings
• Other items of income and expense are adjusted when the impacts on income in the period are not reflective of Equinor’s underlying operational performance in the reporting period. Such items may be unusual or infrequent transactions but they may also include transactions that are significant which would not necessarily qualify as either unusual or infrequent. Other items can include transactions such as provisions related to reorganisation, early retirement, etc.
• Change in accounting policy are adjusted when the impacts on income in the period are unusual or infrequent, and not reflective of Equinor’s underlying operational performance in the reporting period
The measure adjusted earnings after tax excludes net financial items and the associated tax effects on net financial items. It is based on adjusted earnings less the tax effects on all elements included in adjusted earnings (or calculated tax on operating income and on each of the adjusting items using an estimated marginal tax rate). In addition, tax effect related to tax exposure items not related to the individual reporting period is excluded from adjusted earnings after tax. Management considers adjusted earnings after tax, which reflects a normalised tax charge associated with its operational performance excluding the impact of financing, to be a supplemental measure to Equinor’s net income. Certain net USD denominated financial positions are held by group companies that have a USD functional currency that is different from the currency in which the taxable income is measured. As currency exchange rates change between periods, the basis for measuring net financial items for IFRS will change disproportionally with taxable income which includes exchange gains and losses from translating the net USD denominated financial positions into the currency of the applicable tax return. Therefore, the effective tax rate may be significantly higher or lower than the statutory tax rate for any given period.
Management considers that adjusted earnings after tax provides a better indication of the taxes associated with underlying operational performance in the period (excluding financing), and therefore better facilitates a comparison between periods. However, the adjusted taxes included in adjusted earnings after tax should not be considered indicative of the amount of current or total tax expense (or taxes payable) for the period.
Adjusted earnings and adjusted earnings after tax should be considered additional measures rather than substitutes for net operating income and net income, which are the most directly comparable IFRS measures. There are material limitations associated with the use of adjusted earnings and adjusted earnings after tax compared with the IFRS measures since they do not include all the items of revenues/gains or expenses/losses of Equinor which are needed to evaluate its profitability on an overall basis. Adjusted earnings and adjusted earnings after tax are only intended to be indicative of the underlying developments in trends of our on-going operations for the production, manufacturing and marketing of our products and exclude pre-and post-tax impacts of net financial items. We reflect such underlying development in our operations by eliminating the effects of certain items that may not be directly associated with the period's operations or financing. However, for that reason, adjusted earnings and adjusted earnings after tax are not complete measures of profitability. The measures should therefore not be used in isolation.
Adjusted earnings equal the sum of net operating income less all applicable adjustments. Adjusted earnings after tax equals the sum of net operating income less income tax in business areas and adjustments to operating income taking the applicable marginal tax into consideration. See the tables in the following section for details.

Equinor third quarter 2018 31
Supplementary
Calculation of capital employed and net debt to capital employed ratio At 30 September At 30 June At 30 September At 31 December (in USD million) 2018 2018 2017 2017
Shareholders' equity 41,907 41,019 38,204 39,861
Non-controlling interests 23 25 28 24
Total equity A 41,930 41,043 38,233 39,885
Current finance debt 1,823 2,611 4,214 4,091
Non-current finance debt 24,173 23,852 27,041 24,183
Gross interest-bearing debt B 25,996 26,462 31,255 28,274
Cash and cash equivalents 4,919 6,078 6,336 4,390
Current financial investments 8,623 6,024 11,581 8,448
Cash and cash equivalents and financial investment C 13,541 12,102 17,918 12,837
Net interest-bearing debt before adjustments [10] B1 = B-C 12,455 14,360 13,337 15,437
Other interest-bearing elements 1) 1,313 1,150 931 1,014
Marketing instruction adjustment 2) (151) (155) (168) (164)
Net interest-bearing debt adjusted [5] B2 13,617 15,355 14,100 16,287
Normalisation for cash-build up before tax payment (50% of Tax Payment) 3) 866 - 600 -
Net interest-bearing debt adjusted [5] B3 14,483 15,355 14,700 16,287
Calculation of capital employed [5]
Capital employed before adjustments to net interest-bearing debt A+B1 54,385 55,403 51,570 55,322 Capital employed before normalisation for cash build up for tax payment A+B2 55,547 56,398 52,333 56,172
Capital employed adjusted A+B3 56,413 56,398 52,933 56,172
Calculated net debt to capital employed [5]
Net debt to capital employed before adjustments (B1)/(A+B1) 22.9% 25.9% 25.9% 27.9%
Net debt to capital employed before normalisation for tax payment (B2)/(A+B2) 24.5% 27.2% 26.9% 29.0%
Net debt to capital employed adjusted (B3)/(A+B3) 25.7% 27.2% 27.8% 29.0%
1) Cash and cash equivalents adjustments regarding collateral deposits classified as cash and cash equivalents in the Consolidated balance sheet but considered as non-cash in the non-GAAP calculations as well as financial investments in Equinor Insurance AS classified as current financial investments.
2) Adjustment to gross interest-bearing debt due to the Norwegian state`s financial interest (SDFI) part of the financial lease in the Snøhvit vessels which are included in Equinor’s Consolidated balance sheet.
3) Adjustment to net interest-bearing debt for cash build-up in the first quarter and the third quarter before tax payment on 1 April and 1 October. This is to exclude 50% of the cash build-up to have a more even allocation of tax payments between the four quarters and hence a more representative net interest-bearing debt.
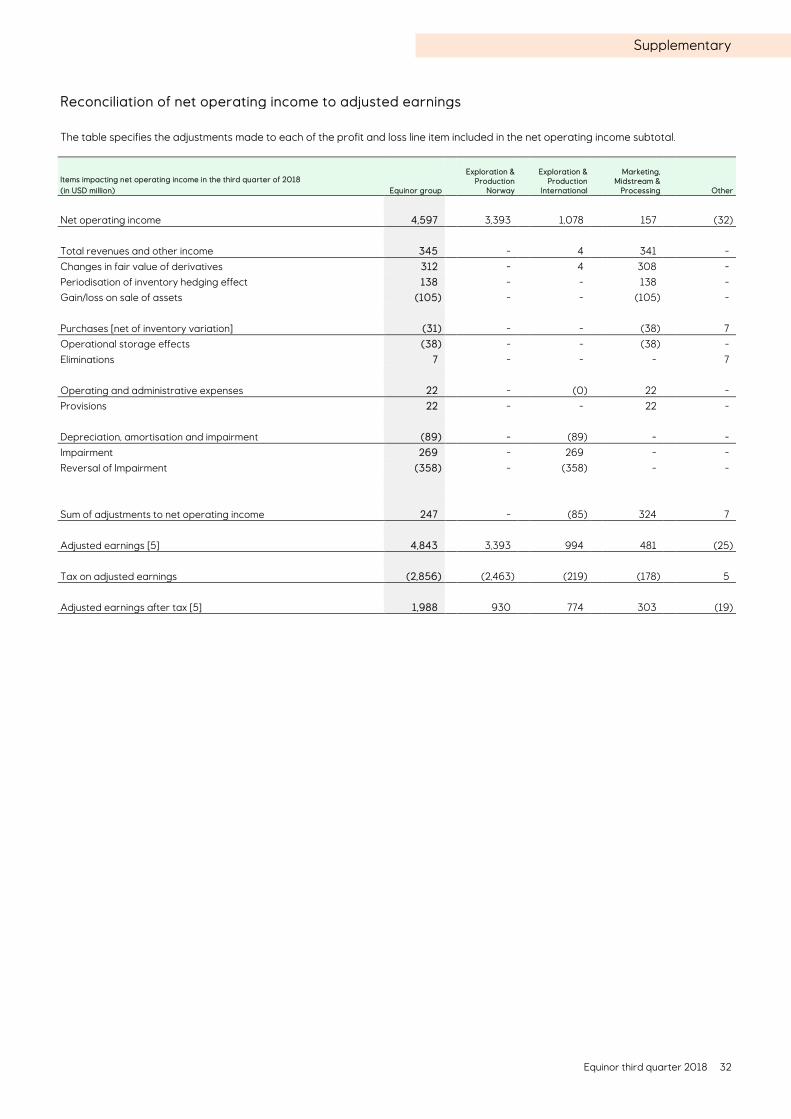
Equinor third quarter 2018 32
Supplementary
Reconciliation of net operating income to adjusted earnings The table specifies the adjustments made to each of the profit and loss line item included in the net operating income subtotal.
Items impacting net operating income in the third quarter of 2018
Equinor group
Exploration & Production
Norway
Exploration & Production
International
Marketing, Midstream &
Processing
Other (in USD million)
Net operating income 4,597 3,393 1,078 157 (32)
Total revenues and other income 345 - 4 341 -
Changes in fair value of derivatives 312 - 4 308 -
Periodisation of inventory hedging effect 138 - - 138 -
Gain/loss on sale of assets (105) - - (105) -
Purchases [net of inventory variation] (31) - - (38) 7
Operational storage effects (38) - - (38) -
Eliminations 7 - - - 7
Operating and administrative expenses 22 - (0) 22 -
Provisions 22 - - 22 -
Depreciation, amortisation and impairment (89) - (89) - -
Impairment 269 - 269 - -
Reversal of Impairment (358) - (358) - -
Sum of adjustments to net operating income 247 - (85) 324 7
Adjusted earnings [5] 4,843 3,393 994 481 (25)
Tax on adjusted earnings (2,856) (2,463) (219) (178) 5
Adjusted earnings after tax [5] 1,988 930 774 303 (19)

Equinor third quarter 2018 33
Supplementary
Items impacting net operating income in the third quarter of 2017 Equinor group
Exploration & Production
Norway
Exploration & Production
International
Marketing, Midstream &
Processing Other (in USD million)
Net operating income 1,095 2,060 (1,017) 178 (127)
Total revenues and other income 483 165 (29) 352 (5)
Changes in fair value of derivatives 338 151 22 165 -
Periodisation of inventory hedging effect 187 - - 187 -
Over-/underlift (35) 14 (49) - -
Gain/loss on sale of assets (8) - (2) - (5)
Purchases [net of inventory variation] (40) - - (107) 67
Operational storage effects (107) - - (107) -
Eliminations 67 - - - 67
Operating and administrative expenses (22) (7) (15) - -
Over-/underlift (22) (7) (15) - -
Depreciation, amortisation and impairment 520 (203) 723 - -
Impairment 912 189 723 - -
Reversal of Impairment (392) (392) - - -
Exploration expenses 311 - 311 - -
Impairment 311 - 311 - -
Sum of adjustments to net operating income 1,252 (45) 990 246 61
Adjusted earnings [5] 2,346 2,015 (27) 423 (65)
Tax on adjusted earnings (1,527) (1,354) (51) (150) 27
Adjusted earnings after tax [5] 819 662 (78) 273 (38)

Equinor third quarter 2018 34
Supplementary
Items impacting net operating income in the second quarter of 2018
Equinor group
Exploration & Production
Norway
Exploration & Production
International
Marketing, Midstream &
Processing
Other (in USD million)
Net operating income 3,835 3,692 561 (179) (239)
Total revenues and other income 553 (43) (11) 607 -
Changes in fair value of derivatives 514 (43) (11) 568 -
Periodisation of inventory hedging effect 40 - - 40 -
Purchases [net of inventory variation] 88 - - (82) 170
Operational storage effects (82) - - (82) -
Eliminations 170 - - - 170
Operating and administrative expenses 112 1 - 111 -
Other adjustments 1 1 - - -
Provisions 111 - - 111 -
Depreciation, amortisation and impairment (515) (604) 244 (155) -
Impairment 526 - 526 - -
Reversal of Impairment (1,041) (604) (282) (155) -
Exploration expenses 241 4 237 - -
Impairment 241 4 237 - -
Sum of adjustments to net operating income 479 (642) 469 481 170
Adjusted earnings [5] 4,314 3,050 1,030 302 (68)
Tax on adjusted earnings (2,619) (2,233) (278) (138) 30
Adjusted earnings after tax [5] 1,695 817 752 165 (38)

Equinor third quarter 2018 35
Supplementary
Items impacting net operating income in the first nine months of 2018 Equinor group
Exploration &
Production Norway
Exploration &
Production International
Marketing,
Midstream & Processing
Other (in USD million)
Net operating income 13,392 10,670 2,345 651 (275)
Total revenues and other income 423 (259) (82) 764 -
Changes in fair value of derivatives 806 (43) (9) 858 -
Periodisation of inventory hedging effect 11 - - 11 -
Change in accounting policy1) (287) (216) (71) - -
Gain/loss on sale of assets (107) - (2) (105) -
Purchases [net of inventory variation] (8) - - (140) 132
Operational storage effects (140) - - (140) -
Eliminations 132 - - - 132
Operating and administrative expenses 118 1 (1) 118 -
Other adjustments 1 1 - - -
Gain/loss on sale of assets (1) - (1) - -
Provisions 118 - - 118 -
Depreciation, amortisation and impairment (605) (604) 154 (155) -
Impairment 794 - 794 - -
Reversal of impairment (1,399) (604) (640) (155) -
Exploration expenses 251 7 244 - -
Impairment 251 7 244 - -
Sum of adjustments to net operating income 180 (855) 316 587 132
Adjusted earnings [5] 13,571 9,815 2,661 1,237 (142)
Tax on adjusted earnings (8,416) (7,103) (710) (532) (70)
Adjusted earnings after tax [5] 5,156 2,712 1,952 705 (213)
1) Change in accounting policy for lifting imbalances.

Equinor third quarter 2018 36
Supplementary
Items impacting net operating income in the first nine months of 2017 Equinor group
Exploration &
Production Norway
Exploration &
Production International
Marketing,
Midstream & Processing
Other (in USD million)
Net operating income 8,588 7,274 (413) 1,900 (173)
Total revenues and other income (746) (123) 24 (641) (6)
Changes in fair value of derivatives (342) 115 22 (479) -
Periodisation of inventory hedging effect (162) - - (162) -
Over-/underlift (234) (238) 4 - -
Gain/loss on sale of assets (9) - (2) - (6)
Purchases [net of inventory variation] (63) - - (17) (46)
Operational storage effects (17) - - (17) -
Eliminations (46) - - - (46)
Operating and administrative expenses 392 57 362 (27) -
Over-/underlift 26 57 (31) - -
Other adjustments 5 - 5 - -
Gain/loss on sale of assets 388 - 388 - -
Provisions (27) - - (27) -
Depreciation, amortisation and impairment 86 (637) 723 - -
Impairment 917 194 723 - -
Reversal of impairment (831) (831) - - -
Exploration expenses 425 - 425 - -
Impairment 424 - 424 - -
Sum of adjustments to net operating income 94 (703) 1,534 (685) (53)
Adjusted earnings [5] 8,682 6,571 1,121 1,216 (225)
Tax on adjusted earnings (5,460) (4,588) (394) (566) 87
Adjusted earnings after tax [5] 3,222 1,952 749 656 (135)

Equinor third quarter 2018 37
Supplementary
Adjusted earnings Marketing, Midstream & Processing (MMP) break down
Quarters Change Adjusted earnings break down First nine months Q3 2018 Q2 2018 Q3 2017 Q3 on Q3 (in USD million) 2018 2017 Change
247 157 46 >100% Natural Gas Europe 689 406 70%
(6) 8 4 N/A Natural Gas US 79 31 >100%
129 66 179 (28%) Liquids 202 318 (36%)
112 71 195 (43%) Other 267 461 (42%)
481 302 423 14% Adjusted earnings MMP 1,237 1,216 2%
Reconciliation of adjusted earnings after tax to net income
Quarters Reconciliation of adjusted earnings after tax to net income First nine months
Q3 2018 Q2 2018 Q3 2017 (in USD million) 2018 2017
4,597 3,835 1,095 Net operating income (NOI) A 13,392 8,588
2,689 2,572 1,323 Tax on NOI B 8,500 6,282
1,908 1,263 (228) NOI after tax C = A-B 4,892 2,306
247 479 1,252 Adjustments1) D 180 94
167 47 204 Tax on adjustments E (85) (822)
1,988 1,695 819 Adjusted earnings after tax [5] F = C+D-E 5,156 3,222
(348) (317) (150) Net financial items G (1,085) (312)
106 274 (99) Tax on net financial items H 364 28
1,666 1,220 (478) Net income I = C+G+H 4,171 2,022 1) Represents the total adjustments to net operating income made to arrive at adjusted earnings (i.e. adjusted purchases, adjusted
operating and administrative expenses, adjusted depreciation, amortisation and impairment expenses and adjusted exploration expenses, each of which are presented and reconciled to the relevant related IFRS figure for the periods presented in this report).

Equinor third quarter 2018 38
Supplementary
FORWARD-LOOKING STATEMENTS This report contains certain forward-looking statements that involve risks and uncertainties. In some cases, we use words such as "ambition", "continue", "could", "estimate", "expect", “believe”, "focus", "likely", "may", "outlook", "plan", "strategy", "will", "guidance" and similar expressions to identify forward-looking statements. All statements other than statements of historical fact, including, among others, statements regarding plans and expectations with respect to [Equinor’s returns, balance sheet and long-term underlying earnings growth; market outlook and future economic projections and assumptions; capital expenditure and exploration guidance for 2018 and beyond; production guidance through 2020; CAGR for the period 2017 – 2020; organic capital expenditure for 2018; Equinor’s intention to mature its portfolio; exploration and development activities, including estimates regarding exploration activity levels; ambition to keep unit of production cost in the top quartile of its peer group; equity production and expectations for 2018; planned maintenance activity and the effects thereof for 2018; accounting decisions and policy judgments, ability to put exploration wells into profitable production, and the impact thereof;] expected dividend payments and dividend subscription price; estimated provisions and liabilities, including the COSL Offshore Management AS litigation; implementation of IFRS 16, and the impact thereof; planned and announced acquisitions and divestments, including timing and impact thereof, including the acquisition of Danske Commodities, the acquisition of Barra Energia’s interest in the BM-S-8 licence, the acquisition of Chevron’s interest in the Rosebank project, the divestment of our operated interest in the King Lear discovery to Aker BP, and the divestment of our non-operated interest in the Tommeliten to PGNiG; and other pending acquisitions and divestments discussed in this report; and the projected impact or timing of administrative or governmental rules, standards, decisions or laws, including with respect to and future impact of legal proceedings are forward-looking statements.
You should not place undue reliance on these forward- looking statements. Our actual results could differ materially from those anticipated in the forward-looking statements for many reasons.
These forward-looking statements reflect current views about future events and are, by their nature, subject to significant risks and uncertainties because they relate to events and depend on circumstances that will occur in the future. There are a number of factors that could cause actual results and developments to differ materially from those expressed or implied by these forward-looking statements, including levels of industry product supply, demand and pricing; price and availability of alternative fuels; currency exchange rate and interest rate fluctuations; the political and economic policies of Norway and other oil-producing countries; EU developments; general economic conditions; political and social stability and economic growth in relevant areas of the world; global political events and actions, including war, political hostilities and terrorism; economic sanctions, security breaches; changes or uncertainty in or non-compliance with laws and governmental regulations; the timing of bringing new fields or wells on stream; an inability to exploit growth or investment opportunities; material differences from reserves estimates; unsuccessful drilling; an inability to find and develop reserves; ineffectiveness of crisis management systems; adverse changes in tax regimes; the development and use of new technology; geological or technical difficulties; operational problems; operator error; inadequate insurance coverage; the lack of necessary transportation infrastructure when a field is in a remote location and other transportation problems; the actions of competitors; the actions of field partners; the actions of governments (including the Norwegian state as majority shareholder); counterparty defaults; natural disasters and adverse weather conditions, climate change, and other changes to business conditions; an inability to attract and retain personnel; relevant governmental approvals; labour relations and industrial actions by workers and other factors discussed elsewhere in this report. Additional information, including information on factors that may affect Equinor’s business, is contained in Equinor’s Annual Report on Form 20-F for the year ended December 31, 2017, filed with the U.S. Securities and Exchange Commission (and section 2.11 Risk review – Risk factors thereof). Equinor’s 2017 Annual Report and Form 20-F is available at Equinor’s website www.equinor.com.
Although we believe that the expectations reflected in the forward-looking statements are reasonable, we cannot assure you that our future results, level of activity, performance or achievements will meet these expectations. Moreover, neither we nor any other person assumes responsibility for the accuracy and completeness of these forward-looking statements. Any forward-looking statement speaks only as of the date on which such statement is made, and, except as required by applicable law, we undertake no obligation to update any of these statements after the date of this report, whether to make them either conform to actual results or changes in our expectations or otherwise.

Equinor third quarter 2018 39
Supplementary
END NOTES
1. The Group's average liquids price is a volume-weighted average of the segment prices of crude oil, condensate and natural
gas liquids (NGL).
2. The refining reference margin is a typical average gross margin of our two refineries, Mongstad and Kalundborg. The
reference margin will differ from the actual margin, due to variations in type of crude and other feedstock, throughput, product
yields, freight cost, inventory, etc.
3. Liquids volumes include oil, condensate and NGL, exclusive of royalty oil.
4. Equity volumes represent produced volumes under a Production Sharing Agreement (PSA) that correspond to Equinor’s
ownership share in a field. Entitlement volumes, on the other hand, represent Equinor’s share of the volumes distributed to the
partners in the field, which are subject to deductions for, among other things, royalty and the host government's share of profit
oil. Under the terms of a PSA, the amount of profit oil deducted from equity volumes will normally increase with the cumulative
return on investment to the partners and/or production from the license. Consequently, the gap between entitlement and
equity volumes will likely increase in times of high liquids prices. The distinction between equity and entitlement is relevant to
most PSA regimes, whereas it is not applicable in most concessionary regimes such as those in Norway, the UK, the US, Canada
and Brazil.
5. These are non-GAAP figures. See section Use and reconciliation of non-GAAP financial measures in the report for more
details.
6. Transactions with the Norwegian State. The Norwegian State, represented by the Ministry of Petroleum and Energy (MPE), is
the majority shareholder of Equinor and it also holds major investments in other entities. This ownership structure means that
Equinor participates in transactions with many parties that are under a common ownership structure and therefore meet the
definition of a related party. Equinor purchases liquids and natural gas from the Norwegian State, represented by SDFI (the
State's Direct Financial Interest). In addition, Equinor sell the State's natural gas production in its own name, but for the
Norwegian State's account and risk as well as related expenditures refunded by the State. All transactions are considered
priced on an arms-length basis.
7. The production guidance reflects our estimates of proved reserves calculated in accordance with US Securities and Exchange
Commission (SEC) guidelines and additional production from other reserves not included in proved reserves estimates. The
growth percentage is based on historical production numbers, adjusted for portfolio measures.
8. The Group's average invoiced gas prices include volumes sold by the MMP segment.
9. The internal transfer price paid from MMP to E&P Norway.
10. Since different legal entities in the group lend to projects and others borrow from banks, project financing through external
bank or similar institutions will not be netted in the balance sheet and will over-report the debt stated in the balance sheet
compared to the underlying exposure in the Group. Similarly, certain net interest-bearing debt incurred from activities
pursuant to the Marketing Instruction of the Norwegian government are off-set against receivables on the SDFI. Some interest-
bearing elements are classified together with non-interest bearing elements, and are therefore included when calculating the
net interest-bearing debt.