Third Quarter 2012 Earnings Release - Union Pacific · Third Quarter 2012 Earnings Release October...
17
1 1 Third Quarter 2012 Earnings Release October 18, 2012 Jack Koraleski, CEO 2 2 2010 2011 2012 $1.56 $1.85 $2.19 All-Time Quarterly Record Third Quarter 2012 Results +18% Earnings Per Share Third Quarter Positives • All-Time Quarterly Records – Operating Revenue – Operating Income – Operating Ratio – Earnings – Customer Satisfaction • Safety • Franchise Diversity Challenges • Coal Volumes
Transcript of Third Quarter 2012 Earnings Release - Union Pacific · Third Quarter 2012 Earnings Release October...

1 1
Third Quarter 2012 Earnings Release October 18, 2012 Jack Koraleski, CEO
2 2
2010 2011 2012
$1.56
$1.85
$2.19 All-Time Quarterly Record
Third Quarter 2012 Results
+18%
Earnings Per Share Third Quarter Positives
• All-Time Quarterly Records – Operating Revenue – Operating Income – Operating Ratio – Earnings – Customer Satisfaction
• Safety • Franchise Diversity
Challenges • Coal Volumes

3 3
Third Quarter 2012 Marketing & Sales Review October 18, 2012 Eric Butler, Executive VP – Marketing & Sales
4 4
1Q 2Q 3Q 4Q 1Q 2Q 3Q 4Q 1Q 2Q 3Q
87 89
90 90 91
92 91
92 93 93 94
164 169
178 175
172 174
180 180
172 175
181
Customer Satisfaction
GOOD
2011 2010
Customer Satisfaction 7 Day Carloadings
92 = Full Year Record
All-Time Quarterly Record
2012

5 5
Chemicals
Automotive
Coal
Third Quarter Recap
Volume ARC Freight Revenue
Freight Revenue Performance (Year-Over-Year Change)
Volume Growth
Flat
+4% +4%
Revenue Mix
Agricultural 16% Autos
9% Chemicals
17%
Coal 21%
Industrial 17%
Intermodal 20% s
ve
Agricultural
TOTAL
-2%
+13%
-2%
-12%
+1%
Flat
+18%
Industrial Products
Intermodal
Sub Total (excl Coal) +3%
6 6
Agricultural Products Revenue $783M (-4%) Volume 218K (-2%) ARC $3,596 (-2%)
Quarterly Drivers • Weakness in Grain • Reduced Ethanol Production &
Local Feeding of DDGS • Growth in Food & Refrigerated
Grain Products
34%
Grain 39%
Food/ Refrigerated
27%
Volume Mix
*Volume in thousands of carloads
78.6 73.2
Grain Products*
2011 2012
-7%
75.4 69.9
Grain*
2011 2012
-7%
54.1 58.7
Food & Refrigerated* +9%
2011 2012
7 7
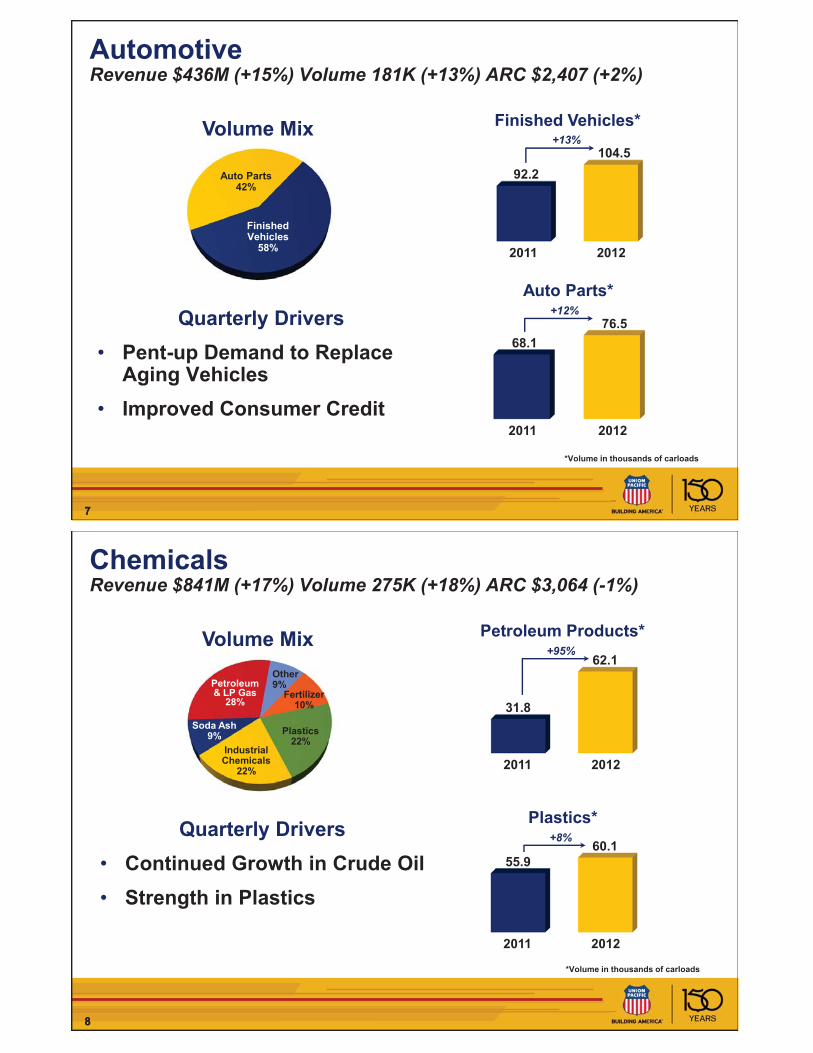
Automotive Revenue $436M (+15%) Volume 181K (+13%) ARC $2,407 (+2%)
Finished Vehicles
58%
Volume Mix
92.2 104.5
Finished Vehicles*
2011 2012
+13%
68.1 76.5
Auto Parts*
2011 2012
+12%
*Volume in thousands of carloads
Quarterly Drivers • Pent-up Demand to Replace
Aging Vehicles • Improved Consumer Credit
Auto Parts 42%
8 8
Chemicals Revenue $841M (+17%) Volume 275K (+18%) ARC $3,064 (-1%)
Quarterly Drivers • Continued Growth in Crude Oil • Strength in Plastics
Plastics 22%
Industrial Chemicals
22%
Petroleum & LP Gas
28%
Volume Mix
*Volume in thousands of carloads
Fertilizer 10%
Soda Ash 9%
Other 9%
31.8
62.1
Petroleum Products*
2011 2012
+95%
55.9 60.1
Plastics*
2011 2012
+8%

9 9
Coal Revenue $1,058M (-5%) Volume 501K (-12%) ARC $2,111 (+9%)
Quarterly Drivers • Low Natural Gas Prices and
High Coal Stockpiles • Global Demand for Western
Coal
Southern Powder River Basin
74%
Other 13%
51.5 44.7
Southern Powder River Basin*
2011 2012
*Tons in millions
8.2 8.4
Colorado/Utah*
2011 2012
-13%
27,000
31,000
35,000
39,000
43,000
47,000
Volume Impact (Weekly Carloadings)
1Q 4Q
2011 2012
2Q 3Q
+2%
10 10
Industrial Products Revenue $879M (+2%) Volume 299K (-2%) ARC $2,933 (+4%)
Quarterly Drivers • Energy Drilling Demand • Increased Construction Activity • Housing Start Growth • Steel & Scrap, Export Ore, and
Hazardous Waste Decline
Paper 10%
Gov’t/Waste 11%
Metals 19%
Volume Mix
Minerals/ Consumer
20%
Construction 31%
Lumber 9%
*Volume in thousands of carloads
63.5 67.3
Rock*
2011 2012
+6%
45.9 51.0
Non-Metallic Minerals*
2011 2012
+11%
50.2 44.9
Steel & Scrap* -11%
2011 2012

11 11
Intermodal Revenue $1,022M (+8%) Volume 857K (+1%) ARC $1,192 (+7%)
Quarterly Drivers • Slow Economic Recovery
Continues • Highway Conversions
International 55%
Domestic 45%
Volume Mix 465.2 469.9
International*
2011 2012
+1%
382.3 387.3
Domestic*
2011 2012
+1%
*Volume in thousands of units
12 12
Fourth Quarter 2012 Outlook Agricultural Products + Soybean exports, refrigerated & beer – Corn, ethanol & DDGS Autos + Pent up demand and new models Chemicals + Crude oil growth + Most other markets remain solid Coal + Export demand – Natural gas price and high stockpiles Industrial Products + Shale-related growth – Soft global steel market Intermodal + Domestic growth continues, muted
International peak

13 13
Third Quarter 2012 Operations Review October 18, 2012
Lance Fritz, Executive VP - Operations
14 14
2010 2011 2012
3.15 3.38 3.35
Operating Foundation, Safety Focus Third Quarter YTD
Rail Equipment (Reportable Rail Equipment
Incidents Per Million Train Miles)
Public (Crossing Accidents Per
Million Train Miles)
2010 2011 2012
2.18 2.04
2.34 Good Good
2010 2011 2012
1.36
1.15 1.04
Employee (Reportable Personal Injury
Incidents Per 200,000 Man-Hours)
Good +15%
All-Time Record
All-Time Record
-10%
-1%

15 15
2008 2009 2010 2011 2012
86 93 90 87 89
86 89
94 94 95
Network Performance Third Quarter
• Agility and Resiliency Demonstrated with Resources and Service Plan
• Volume Growth in Southern Region
• Increased Capital Projects Adding Capacity
• Positioned for Growth
Service Delivery* and IS&P Industry Spot & Pull %
Good
* Includes early deliveries
2008 2009 2010 2011 2012
23.7
27.4 25.7 24.6
26.1
Velocity (as Reported to the AAR)
+6%
** Ties All-Time Quarterly Record
Third Quarter Record
**
Good
All-Time Quarterly Record
16 16
158 158 170 172 176
158 158170 172 176
2008 2009 2010 2011 2012
83 85 86 88 87
2008 2009 2010 2011 2012
1,880 1,371
990 958 623
Network Productivity Third Quarter
Slow Order Miles Good
3rd Qtr Record
-35%
Intermodal Boxes
Manifest Cars
*
3rd Qtr Record
Train Size (Average Units per Train)
* All-time quarterly record
Nbr of Cars Switched
Y&L Employee Days
Cars Switched (per employee day)
+3%
+0%
+2%
Manifest Growth Impact (3Q 2012 vs. 3Q 2011)
2008 2009 2010 2011 2012
9.23
8.40 8.58 9.07
8.52
Car Utilization (Days)
Good
-6%
All-Time Quarterly Record
Good

17 17
5% 6%
Flat Flat
Agility and Resource Readiness Volume Growth
3Q12 vs. 3Q11 YTD12 vs. YTD11 South Total South Total
• Volumes in South Back to Pre-Recession Levels
• Resource Realignment & Network Routing
• Improving Network Fluidity & Performance
1%
-2%
-2%
10% South
North
West
TE&Y Active Workforce (YTD 2012 vs. YTD 2011)
Total
Active Locomotive Fleet (YTD 2012 vs. YTD 2011)
-1%
-1%
-8%
9% South
North
West
Total
18 18
2012 Operating Outlook
• Improved Safety Results
• Leverage Growth Opportunities in the South
• Remain Agile – Match Resources with Volume
• Continue Service and Productivity Gains
• Capital Effectiveness

19 19
Third Quarter 2012 Financial Review October 18, 2012
Rob Knight, CFO
20 20
Third Quarter Earnings Summary In Millions (except EPS)
Operating Revenues $5,343 $5,101 5 Operating Expenses 3,557 3,523 1 Operating Income 1,786 1,578 13 Other Income 28 17 65 Interest Expense (137) (142) (4) Income Taxes (635) (549) 16 Net Income $1,042 $904 15 Weighted Average Diluted Shares 475.2 488.1 (3)
Diluted EPS $2.19 $1.85 18
2012 2011 %

21 21
Freight Revenue Third Quarter (In Millions)
2011
Volume & Mix
Core Price
Fuel Surcharge
(Lag Impact)
2012
-1%
+5% $5,019
$4,836
+4%
-1% +1%
Fuel Surcharge (Improved Coverage)
22 22
Compensation & Benefits Expense Third Quarter 2012 $1,188M, Flat
$1,193 $1,188
2011
Compensation & Benefits (in Millions)
2012
Flat
45,507 46,205
2011
Workforce Levels (Quarterly Average)
2012
+1.5%
• Lower GTMs and Training Costs
• Solid Operations & Productivity Gains
• 2011 Drought-Related Costs • Labor Inflation Costs
• Increased Workforce Driven by Capital and PTC

23 23
Fuel Expense Third Quarter 2012 $880M, -4%
250,855 245,415
2011
Gross-Ton-Miles (in Millions)
2012
-2%
• Reduced Costs driven by Lower Volumes
• Coal Declines driving GTMs down 2%
$3.18
Average Fuel Price (Per Gallon Consumed)
2011 2012
Flat
Jul Aug Sep
$3.19
Jun May Jul Aug Sep Jun May
• Diesel Fuel Prices Flat Compared to 2011
• Rising Fuel Prices Created Negative Lag on Fuel Surcharge Recovery
24 24
$506 $542
Third Quarter 2012 Expense Review In Millions
2011
Purchased Services & Materials
2012
• Higher Subsidiary Contract Expenses
• Increased Locomotive and Freight Car Repair Costs
+7%
$408 $447 • Higher Depreciable Asset
Base from Growing Capital Spend
2011
Depreciation
2012
+10%

25 25
Third Quarter 2012 Expense Review (cont) In Millions
• Higher Short-Term Freight Car Rental Expense
• Lower Locomotive and Freight Car Lease Expenses
$293 $300
2011
Equipment & Other Rents
2012
+2%
• Lower Equipment & Freight Damage Expenses
• Lower Volume-Related Costs & Cost Control Measures
• Higher Property Tax Expense
$207 $200
2011
Other
2012
-3%
26 26
Operating Ratio Performance
2010 2011 2012
68.2 69.1
66.6
Third Quarter (Percent)
• All-Time Quarterly Best
• Solid Pricing
• Continued Focus on Productivity Initiatives
• Rising Fuel Prices & Negative Lag Impact on Surcharge Recovery
Operating Ratio Impact (0.5) pts EPS Impact of ($0.05)
-2.5 pts.
All-Time Quarterly Record
Fuel Price / Recovery Lag Impact

27 27
Cash from Ops
Investing Dividends
$4,334
($2,241)
($607)
$4,366
($2,866)
($860)
Strong Financial Position Nine Month Period Ending September 30 ($ In Millions)
• Solid Free Cash Flow Larger Capital Spend 42% Cash Dividend Increase
• Strong Cash from Ops Higher Cash Tax Payments from Prior Bonus Depreciation Programs
• Strong Balance Sheet Investment Grade Credit Rating
Free Cash Flow*
Total Debt* (Adjusted)
40.7% 40.2%
* See Union Pacific website under Investors for a reconciliation to GAAP. Adjusted Debt to Capital
12/31/2011 9/30/2012
$12,753 $13,130
2012 2011 2012 2011 2012 2011
28 28
Driving Strong Shareholder Value
• Repurchase Activity 3.1 Million Shares in 3Q 10.8 Million Shares YTD
• Cash Returned to Shareholders in Dividends and Share Repurchases up 27%
• 17.1 Million Shares Remaining in Current Authorization
Dividends & Share Repurchases ($ In Billions)
Quarterly Share Repurchases ($ In Millions)
1Q 2Q 3Q 4Q
$248
$360
$428 $381
$433 $415 $378
2012 2011 2012 2011 2012 2011 2011
2011 YTD 2012 YTD
$1.6 $2.1
Dividends Share Buybacks +27%
29 29
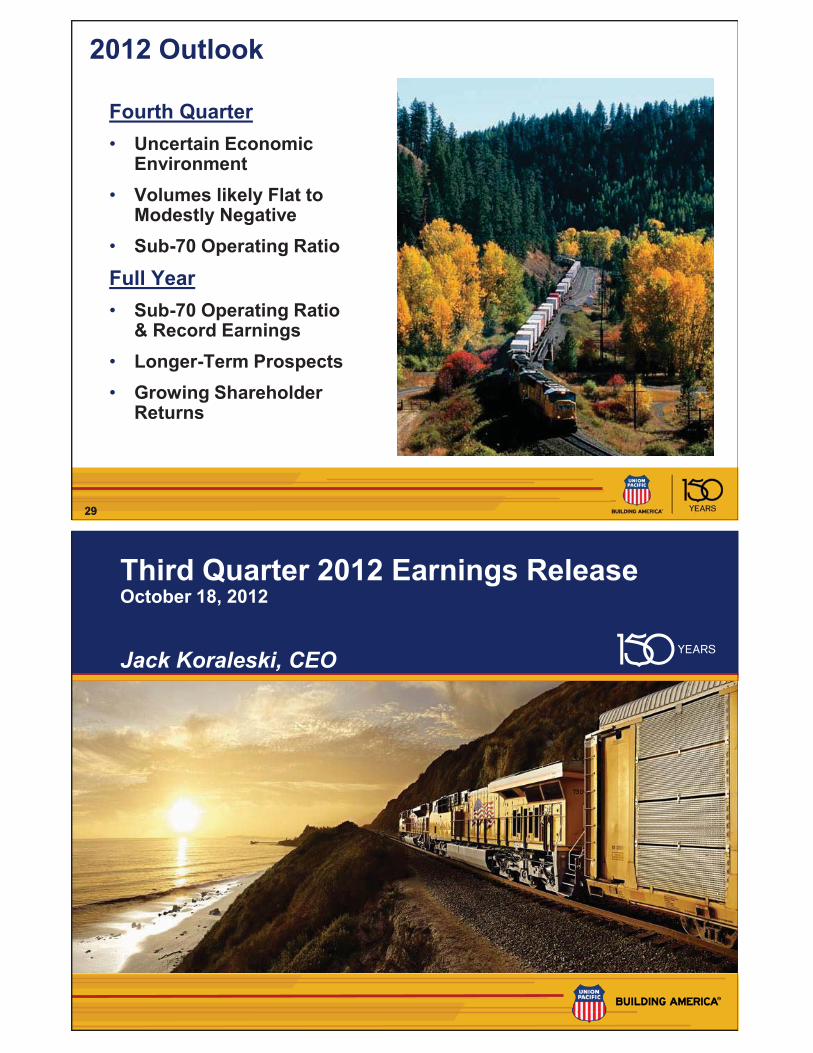
2012 Outlook
Fourth Quarter • Uncertain Economic
Environment • Volumes likely Flat to
Modestly Negative • Sub-70 Operating Ratio
Full Year • Sub-70 Operating Ratio
& Record Earnings • Longer-Term Prospects • Growing Shareholder
Returns
30 30
Third Quarter 2012 Earnings Release October 18, 2012 Jack Koraleski, CEO
31 31
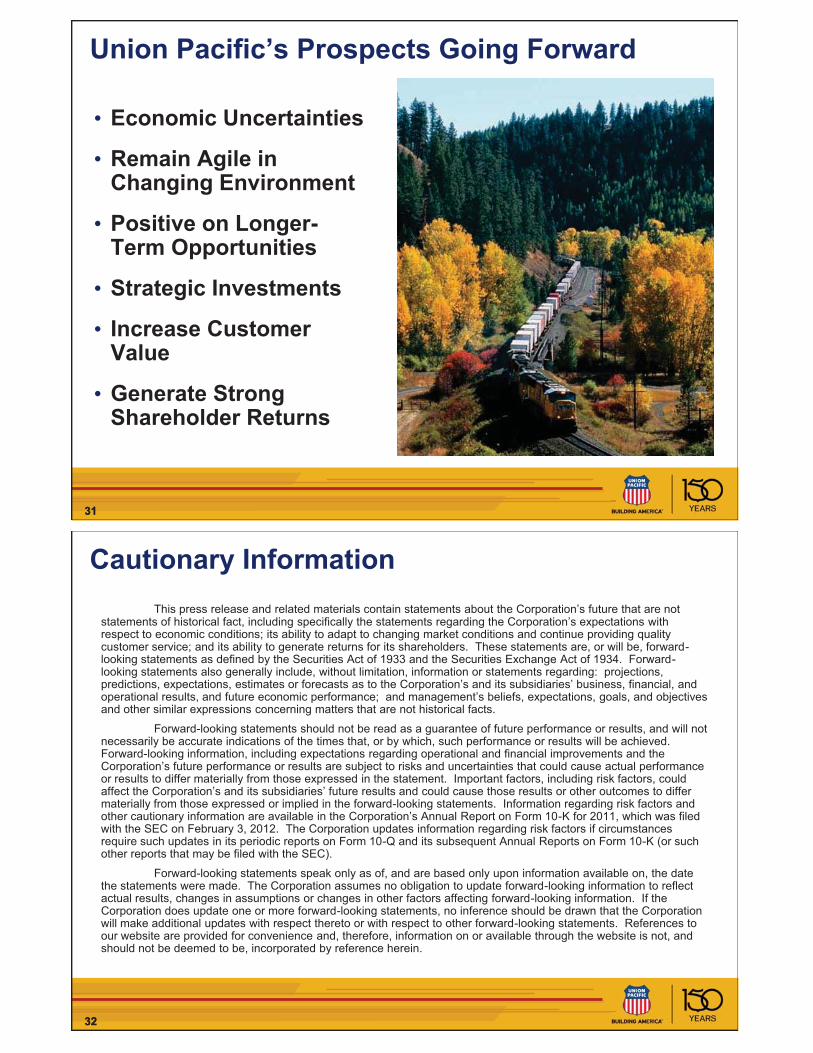
Union Pacific’s Prospects Going Forward
• Economic Uncertainties
• Remain Agile in Changing Environment
• Positive on Longer-Term Opportunities
• Strategic Investments
• Increase Customer Value
• Generate Strong Shareholder Returns
32 32
Cautionary Information This press release and related materials contain statements about the Corporation’s future that are not
statements of historical fact, including specifically the statements regarding the Corporation’s expectations with respect to economic conditions; its ability to adapt to changing market conditions and continue providing quality customer service; and its ability to generate returns for its shareholders. These statements are, or will be, forward-looking statements as defined by the Securities Act of 1933 and the Securities Exchange Act of 1934. Forward-looking statements also generally include, without limitation, information or statements regarding: projections, predictions, expectations, estimates or forecasts as to the Corporation’s and its subsidiaries’ business, financial, and operational results, and future economic performance; and management’s beliefs, expectations, goals, and objectives and other similar expressions concerning matters that are not historical facts.
Forward-looking statements should not be read as a guarantee of future performance or results, and will not necessarily be accurate indications of the times that, or by which, such performance or results will be achieved. Forward-looking information, including expectations regarding operational and financial improvements and the Corporation’s future performance or results are subject to risks and uncertainties that could cause actual performance or results to differ materially from those expressed in the statement. Important factors, including risk factors, could affect the Corporation’s and its subsidiaries’ future results and could cause those results or other outcomes to differ materially from those expressed or implied in the forward-looking statements. Information regarding risk factors and other cautionary information are available in the Corporation’s Annual Report on Form 10-K for 2011, which was filed with the SEC on February 3, 2012. The Corporation updates information regarding risk factors if circumstances require such updates in its periodic reports on Form 10-Q and its subsequent Annual Reports on Form 10-K (or such other reports that may be filed with the SEC).
Forward-looking statements speak only as of, and are based only upon information available on, the date the statements were made. The Corporation assumes no obligation to update forward-looking information to reflect actual results, changes in assumptions or changes in other factors affecting forward-looking information. If the Corporation does update one or more forward-looking statements, no inference should be drawn that the Corporation will make additional updates with respect thereto or with respect to other forward-looking statements. References to our website are provided for convenience and, therefore, information on or available through the website is not, and should not be deemed to be, incorporated by reference herein.

33 33
Third Quarter 2012 Earnings Release October 18, 2012 Question & Answer Session